Embed Size (px)
Citation preview
A STUDY OF LANDING FROM VERTICAL JUMP AMONGST BALLET DANCERS
BY
Fu Siu Ngor .•• •“ ““ '%t,
- - ' • ' . • � <. 巧\ ir— . , - - - . �� • -: ' " . - -、、 \
• •• . 、‘ \ � •. \ ,S . • . , -•
' . . V
Thesis submitted as partial requirement for the degree of master of philosophy
9
〜.,
June 1996
Division of Surgical Sciences Graduate School
Chinese University of Hong Kong
Ik '•' ‘.

' s • . : / ^
‘J\ 一
/ ^ ^ ^ ^ ^ ^
¥vLL^^ 1附]|) ^ ^ B = % ^ E M ^ y : ^ ^"^^^
ABSTRACT
ABSTRACT
The aims of this study are to identify postural factors related to the vertical
loading force during landing from vertical jumps and to examine the effects of "pull-
up" on landing kinetics. Seventeen female senior ballet students, aging from 18 to 25,
from the Hong Kong Academy for Performing Arts participated in the study. Each
subject performed ten trials of vertical jumps on a force-plate (AMTI, sampling at
500 Hz), and registered the vertical force from take-off to landing. The kinematics of
the movements were recorded by two video cameras and processed digitally by the
Motion Analysis System (PEAK 5) to obtain the instantaneous joint positions of the
trunk, hip, knee and ankle.
The results showed a typical single peak ground reaction force with time
curve, which indicated that the dancers landed on their toes. The "pull-up" jumps
have magnitude of normalized peak force ranged from 2.46 to 4.04 BW (^i= 2.83
BW). The landing phase ranged from 0.28 to 0.53s (n=0.41s). The peak load rate in
the passive shock absorption phase ranged from 79 to 311 BW/s (^i=194 BW/s). The
proportion of passive shock absorption ranged from 6 to 15.4 % (^i=9.5%). The time
from touch-down to peak force ranged from 75 to 136 ms (^i=lOOms). The mean and
standard deviation of maximum joint angular positions of the hip, knee and ankle
after touch-down were 36�士 4.5。,104° 士 l . T and 3 r ±.5.6�. The mean and standard
deviation of trunk inclination at touch-down was 6.T 土 3.0°respectively. Frequency
distribution plot of the normalized peak force was not normally distributed. Spearman
Rank Correlation was used to assess the relationship between the normalized peak
force withjoint positions. The results indicated that the positions of the knee and the
ankle joint were related to the peak force ( rs= 0.67, p<0.05; rs=-0.62, p<0.05
respectively).
I
ABSTRACT
A paired t-test was conducted to analysis the differences in kinetics and
kinematics between jumps with and without "pull-up". The normalized peak force
was significantly reduced by 14% and the landing phase was increased by 4% (
p<0.05) with "pull-up".
This study concludes that the loading force on landing from vertical jumps is
related to the postural factors. The knee and ankle joints are the two joints which can
influence the loading force. "Pull-up" can decrease the loading force, increase the
loading phase..
In order to achieve an adequate amount of knee flexion and ankle dorsiflexion
on landing, dancers are recommended to stretch their ankle to 30° of ankle
dorsiflexon with knee flexed. Eccentric strength of the quadriceps and the calf
muscles, and concentric control of the hamstrings are important to control landing
from a vertical jump.
II

ACKNOWLEDGMENTS
ACKNOWLEDGMENTS
I wish to express my deepest gratitude to Professor Kai Ming Chan, Professor
and Chairman of the Department of Orthopaedics and Traumatology, Chinese
University of Hong Kong, for his supervision, advice, and encouragement
throughout the study. Without his help, this study would not be materialize.
My deepest gratitude also goes to my co-supervisor, Professor Arthur F.T.
Mak of Jockey Club Rehabilitation Engineering Center, Hong Kong Polytechnic
University, for his supervision and lengthy discussions.
I must thank Professor J. Bravar, ex Dean ofLiberal Arts in the Hong Kong
Academy for Performing Arts for his encouragement at the initial planning of this
study.
My thanks also given to the following persons for their contribution in
different area :
Mr. Arran Leung, Assistant Professor, Jockey Club Rehabilitation Center,
Hong Kong Polytechnic University, for his invaluable discussions, generous helps in
instrumentation and support throughout the preparation of this thesis.
Dr. Kevin S.C. Kwong, Associate Professor, Department of Rehabilitation
Sciences,Hong Kong Polytechnic University, for his invaluable discussions and
advice.
Dr Qin Ling, Scientific Officer, Department of Orthopaedic and
Traumatology, Chinese University ofHong Kong, for his invaluable discussions.
III

ACKNOWLEGEMENTS
Mr. Eric Tam, Project coordinator, Jockey Club Rehabilitation Center, Hong
Kong Polytechnic University, and Mr. Philip Ng, technician, Department of
Rehabilitation Sciences, Hong Kong Polytechnic University, for their kind assistance,
and their support to the Human Locomotion Laboratory.
The dancers in the Hong Kong Academy for Performing Arts, for giving me
the idea and for their participation in this study.
IV
TABLE OF CONTENTS
TABLE OF CONTENTS
ABSTRACT I
ACKNOWLEDGMENTS ™
CONTENTS V
LIST OF FIGURES VH
LIST OF TABLES VHI
CHAPTER 1: BVTRODUCTION
1.1 Dance and jump 1 1.2 Research objectives 4 1.3 Research hypothesis 5 1.4 Definition of terms 7
CHAPTER 2 : DANCE INJURIES
2.1 Epidemiology of dance injuries 12 2.2 Etiology of dance injuries 19 2.3 Implication to this study 30
CHAPTER 3 : BIOMECHANICAL STUDIES ON LANDING FROM VERTICAL JUMPS
3 • 1 Biomechanics on landing from vertical jumps 31 3.2 Biomechanical studies on ballet jumps 46 3.3 Kinetics and kinematics studies onjumping sports --- 49 3.4 Implication to this study 57
V
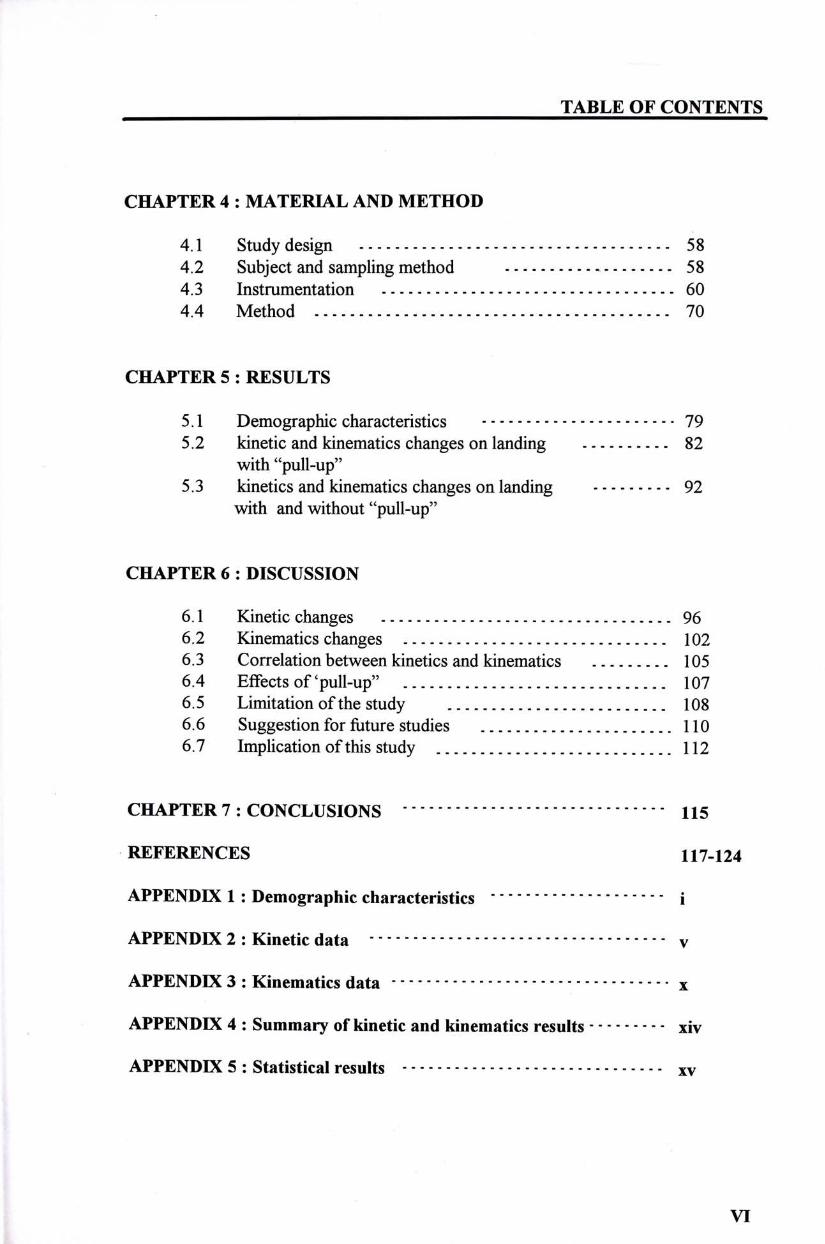
TABLE OF CONTENTS
CHAPTER 4 : MATEMAL AND METHOD
4.1 Study design 58 4.2 Subject and sampling method 58 4.3 Instrumentation 60 4.4 Method 70
CHAPTER 5 : RESULTS
5.1 Demographic characteristics 79 5.2 kinetic and kinematics changes on landing 82
with"pull-up" 5.3 kinetics and kinematics changes on landing 92
with and without "pull-up"
CHAPTER 6 : DISCUSSION
6.1 Kinetic changes 96 6.2 Kinematics changes 102 6.3 Correlation between kdnetics and kinematics 105 6.4 Effects of'pull-up" 107 6.5 Limitation of the study 108 6.6 Suggestion for future studies 110 6.7 Implication of this study 112
CHAPTER 7 : CONCLUSIONS 115
REFERENCES 117-124
APPENDK 1 : Demographic characteristics i
APPENDK 2 : Kinetic data v
APPENDK 3 : Kinematics data x
APPENDK 4 : Summary of kinetic and kinematics results xiv
APPENDK 5 : Statistical results xv
VI

LIST OF FIGURES
LIST OF FIGURES
Figure No Title Page No.
1 The five basic positions of the feet in classical ballets 9 2 Photograph of a dancer's hips and legs in first position demonstrating turn-out 9 3 The vertical ground reaction force on landing produced from a vertical jump 31 4 Joint position curves on landing from vertical jump 36 5a A typical vertical ground reaction force-time history with one force peak 39 5b A typical vertical ground reaction force-time history with two force peaks 39 6 The typical force curve divided into passive and active phase 41 7 Lower extremity joint moment-time history during landing 43 8 EMG in volts for Vastus Laterals (VL), Rectus Femoris (RF), Biceps Femoris 45
(BF), Tibiallis anterior (TA), Lateral gastrocnemius (GS) and Solus (SOL) 9 Diagram showing landing from a jump 47 10 Top-view of the two dimensional motion analysis system 60 11 Thecameraandthefloorlamp 61 12 Simplified block diagram of the two dimensional analysis system 62 13 The PEAK 5 system used for data collection and data reduction 63 14 The AMTI Force Platform 66 15 The scaling rod. 72
16a Spatial model for the lateral image 74 16b Spatial model for the postero-lateral image 74 17 Spatial model point connection summary 74 18 Professionalballettraininginyears 80 19 Dance experience of the tested subject (in years) 81 20 Age when subject started ballet training 81 21 A typical vertical force-time history curve on landing from vertical jump 83 22 Atypical normalized ground reaction force-time history on landing 83 23 Vertical force-time history of subject 6 84 24 Normalizedpeakforceonlanding 84
25a A typical profile of dynamic loading rate on landing 85 25b A atypjcal profile of dynamic load rate curve from subject 1 85 26 The landing phase and time to peak on landing 86 27 A stick diagram illustrating typical joint position on landing from a vertical 87 28 Maximum joint position of the lower extremity on landing from a vertical jump 88 29 Trunk inclination on touch-down from vertical jump 89 30 Relationship between maximum angular position of knee and normalized peak 90
force 31 Relationship between maximum angular position of ankle and normalized 91
peak force 32 Normalized peak force and landing phase on landing with and without "pull- 92
up" (PU=with "pull up", NPU= without "pull-up") 33 The time to normalized peak force with and without "pull-up" (PU=with "pull 94
up", NPU= without "pull-up") 34 The angular positions of the trunk, the knee and the ankle on landing with and 95
without "pull-up" (PU=with "pull up", NPU=without "pull up") 35 Pile in first position, tightness in the gastricnemius-solus complex limits 104
dorsiflexion and may affect the shock absorption capacity of the foot (adopted from Dance Medicine, Ryan & Stephens 1987
36 Diagram showing ankle position in two stretching technique 113
VII
LIST OF TABLES
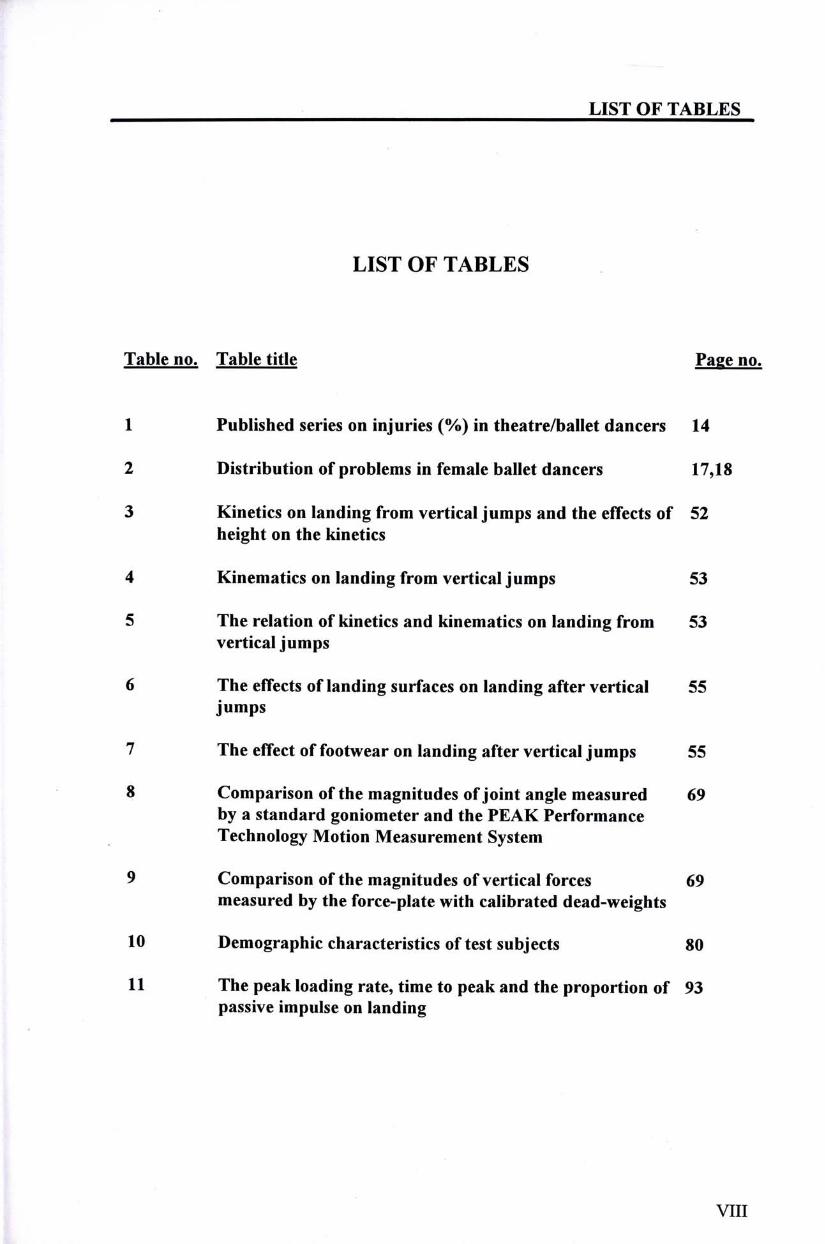
LIST OF TABLES
Table no. Table title Page no.
1 Published series on injuries (%) in theatre/ballet dancers 14
2 Distribution of problems in female ballet dancers 17,18
3 Kinetics on landing from vertical jumps and the effects of 52 height on the kinetics
4 Kinematics on landing from vertical jumps 53
5 The relation of kinetics and kinematics on landing from 53 verticaljumps
6 The effects of landing surfaces on landing after vertical 55 jumps
7 The effect of footwear on landing after vertical jumps 55
8 Comparison of the magnitudes of joint angle measured 69 by a standard goniometer and the PEAK Performance Technology Motion Measurement System
9 Comparison of the magnitudes of vertical forces 69 measured by the force-plate with calibrated dead-weights
10 Demographic characteristics of test subjects 80
11 The peak loading rate, time to peak and the proportion of 93 passive impulse on landing
VIII
CHAPTER 1 - EVTRODUCTION
CHAPTER 1 INTRODUCTION
I was intrigued by the softness and smoothness of ballet dancers' landing
after a jump. When I worked as a physiotherapist in the Hong Kong Academy for
Performing Arts, 70% of my patients were students from the dance school. They
walked in the clinic with recurrent overuse over their legs and backs. Some
mentioned "poor landing" as one of the cause of their injuries. Most of them believed
that "pull-up" was an essential technique for controlling the softness and smoothness
oftheirjumps.
The number of jumps that a ballet dancer had to perform aroused my interest
to carry out this study on jumping and landing. Nicholas et al.(1977) classified
jumping as one of the major movement in ballet training and performance. In a
technique class, the number of jumps that a ballet dancer had to perform was over
two hundred. Typically, a dancer would have two technique classes a day, and train
six days a week. This means that they would be performing around 3000 jumps a
week. If there is a technique that can decrease the amount of loading from a jump,
the cumulative effect would be grand.
1.1 DANCE AND JUMP
As early as 1975, Miller et al. expressed their concern with the repeated
jumping that dancers had to perform during their training. Since then Schafle (1990)
and Reid (1988) supported the view that ballet dancers sustained large load on their
musculoskeletal body on landing from jumps. They believed that a poor landing from
jumps may contribute to patellofemoral problems, meniscus injuries and stress
1
CHAPTER 1 - EVTRODUCTION
fractures, while sudden deceleration in landing may contribute to Achillis tendinities.
"Poor landing" had been identified as one of the major causes of overuse injuries on
the ballet dancers. However, what is "poor landing" ?
Plie (knee bend) was related to dance injuries by a number of author.
Clarkson et al (1984) suggested that to prevent dance injuries, a dancer has to be
trained to make optimum use of a demi-plie (small knee bend) following a jump.
Clippinger-Robertson (1988) recognized an inadequate plies as one of the poor
landing mechanic, and suggested that "working through the whole foot ” and the
depth of the plies are important for shock absorption.
Through personal communication, "pull-up" is another technique which
enhance a soft and controlled landing, "pull-up" is an activity for defying gravity
(Dowd 1984). Landing from vertical jumps applied forces and moments to the lower
extremity from gravity and causing a collapse of the extremities. The goal of "pull-
up" is to resist the collapse in such a way that the body's negative velocity is reduced
to zero in a smooth, controlled and soft manner. "Pull-up" involves a lengthening of
the spine with equal engagement of the erector spinae and the abdominal muscles
(Dowd 1984). This suggestion was supported by Micheli (1983). He named the
abdominal and paraspinal muscles as the muscles for the technical demand of "pull-
up", and related this activity to a better dance aesthetics and a safe position for the
back. However, the amount of work done change according to the nature of the
movement being performed. Rists (1992) mentioned that the interpretation of "pull-
up" differ from teacher to teacher, while students found that the instruction of "pull-
up" is poor and confusing. Nevertheless, dancers perform their "pull-up" before
initiation ofthejumps, and maintain it until they have stabilized on landing.
In spite of the great concerns on landing by ballet dancers, there are few
quantitative studies on forces on impact loading during jumping and landing on
2
CHAPTER 1 - EVTRODUCTION
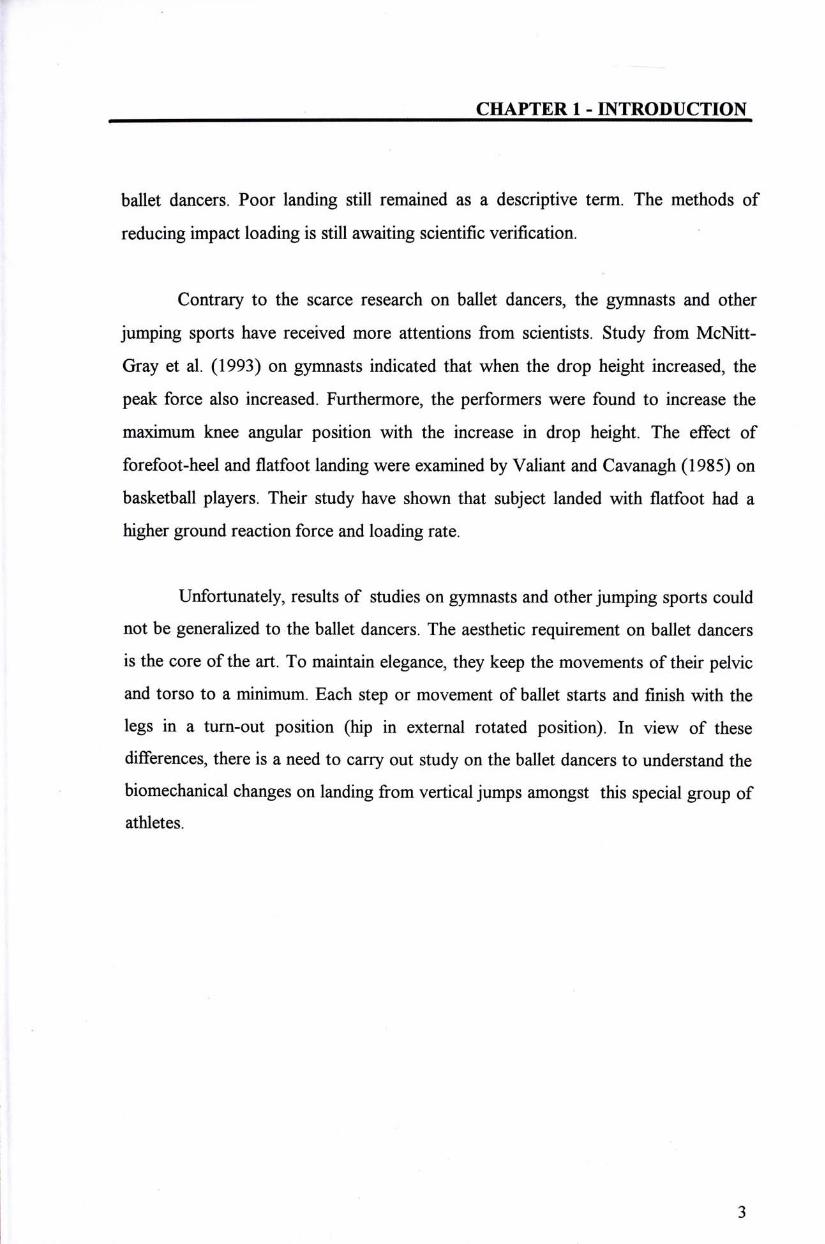
ballet dancers. Poor landing still remained as a descriptive term. The methods of
reducing impact loading is still awaiting scientific verification.
Contrary to the scarce research on ballet dancers, the gymnasts and other
jumping sports have received more attentions from scientists. Study from McNitt-
Gray et al. (1993) on gymnasts indicated that when the drop height increased, the
peak force also increased. Furthermore, the performers were found to increase the
maximum knee angular position with the increase in drop height. The effect of
forefoot-heel and fIatfoot landing were examined by Valiant and Cavanagh (1985) on
basketball players. Their study have shown that subject landed with flatfoot had a
higher ground reaction force and loading rate.
Unfortunately, results of studies on gymnasts and other jumping sports could
not be generalized to the ballet dancers. The aesthetic requirement on ballet dancers
is the core of the art. To maintain elegance, they keep the movements of their pelvic
and torso to a minimum. Each step or movement of ballet starts and finish with the
legs in a turn-out position (hip in external rotated position). In view of these
differences, there is a need to carry out study on the ballet dancers to understand the
biomechanical changes on landing from vertical jumps amongst this special group of
athletes.
3 j I
CHAPTER 1 - EVTRODUCTION
1.2 RESEARCH OBJECTWES
The main objectives of this study are to investigate the effects of postural
factors on the loading force and loading rate on landing from a vertical jump amongst
ballet dancers, and to verify the belief on the effects of "pull-up" on landing. The
specific aims are:
1. to determine the kinetics on landing from vertical jumps amongst ballet
dancers
2. to determine the posture of the lower extremity on landing from vertical
jumps amongst student ballet dancers
3. to determine the posture of the trunk on touch-down from vertical jumps
amongst student ballet dancers
4. to investigate the effect of postural factors on the kinetics on landing
amongst student ballet dancers
5. to compare the kinetics on landing with and without the technique of"pull-
up" by student ballet dancers
4

CHAPTER 1 - EVTRODUCTION
1.3 RESEARCH HYPOTHESIS
The hypotheses of this study are :
1. Null hypothesis :
The normalized peak force (NPF) on landing have no association
with the joint angular positions of the lower limb and the trunk.
Alternative hypothesis :
The normalized peak force (NPF) on landing have an association
with thejoint angular positions of the lower limb and the trunk.
2. Null hypothesis:
The peak loading rate (PLR) on landing have no association with the
joint angular positions of the lower limb joints and the trunk.
Alternative hypothesis :
The peak loading rate (PLR) on landing have an association with the
joint angular positions of the lower limb and the trunk
3 Null hypothesis
The mean with and without "pull-up"normalized peak force (NPF)
on landing are similar
5

CHAPTER 1 - EVTRODUCTION
Alternative hypothesis
The mean normalized peak force (NPF) on landing are difference
with and without performing the technique of"pull-up"
a =0.05 (two tailed)
6
CHAPTER 1 - EVTRODUCTION
1.4 DEFEVITION OF TERMS
1.4.1 RELATED TO DANCE
Allegro
A quick, lively musical tempo to which all springing and jumping movements, such as
jete, sautes, and turns in the air are performed.
Arabesque
The position of the body when supported on one leg whilst the other is fully extended
behind the dancer.
Changement
The dancer springs up from the 5th position, changes the position of the feet in the
air, and lands with the opposite foot in front.
Demi-pointe
The position of the foot when the dancer is poised on the ball of the foot.
Demi-plie
The knees are bent as far as possible while keeping the heels on the floor.
En-pointe
The position ofthe foot in a pointe shoe, in which the heel is raised, the ankle and the
midfoot are ftilly plantarflexed and the dancer stands balanced on top of their toes. Glessi A gliding movement of the legs that often precedes ajump from a demi-plie
7

CHAPTER 1 - EVTRODUCTION
Jete
A jump from one foot to the other in which the dancer brushes the working leg into
the air before landing upon it.
Passe
One leg is drawn up until the toes touch the back of the other knee.
Plie
A simple bending movement of the knees while bearing weight and maintaining
external rotation of the lower extremity.
Positions 1,2,3,4,5
These are shown in fig. 1,in all positions, the feet are turned out 180®
Relieve
A releve is a raising movement of the body that starts from a demiplie.
Saute
a small jump using both legs or only one leg for propulsion.
Tendus
A pointing of the foot on the ground either to the front or to the side or to the back.
Turn-out
The most fundamental physical attribute in classical ballet. Turn-out is the sum total
ofexternal rotation of the entire leg: hip and knee, tibia, ankle and foot. This position
is the one from which all ballistic movements start and finish ( Fig. 2).
8
CHAPTER 1 - EVTRODUCTION
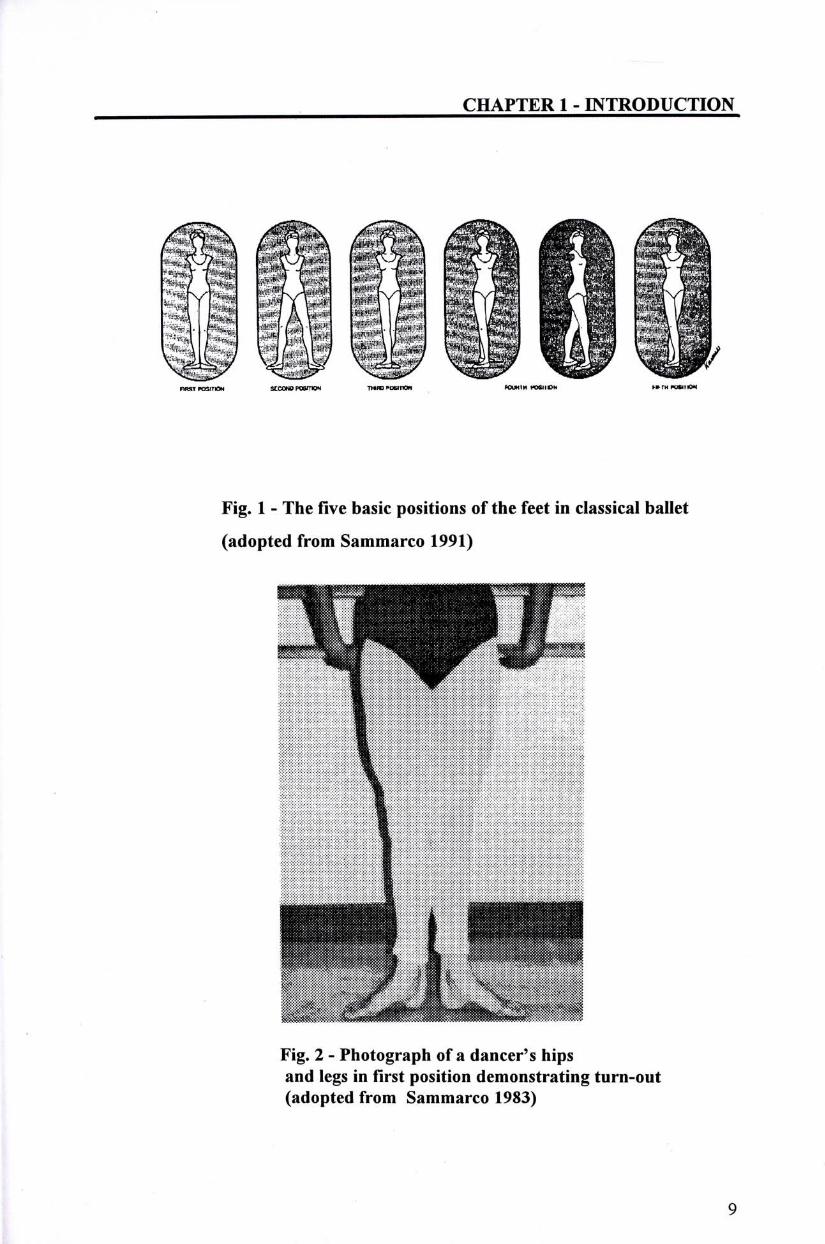
iiii0i rmsj poiiTiON sccONPPQSni9N j tm r»OBinOri KMHlH nD&jiON ni>mputniOH
Fig. 1 - The five basic positions of the feet in classical ballet
(adopted from Sammarco 1991)
88S6fifi ^ ffi ^ ^ BKffiMMBiMiMMiBi|Siij| ^ ^ ^ ^ ^ ^
I j — i T i K ^ j ^ i , i m p F ^ ^ ^ p s s s
V j •
^ ^ ^ ^ R _ ^ ^ ^ ^ * ^! ; # 、 響 、 - 、 仏 :
赢 ^ ^ ^ ^ ^ ^
Fig. 2 - Photograph of a dancer's hips and legs in first position demonstrating turn-out (adopted from Sammarco 1983)
9
CHAPTER 1 - EVTRODUCTION
1.4.2 RELATED TO BIOMECHANICS
Force
Force is the action of one body on another. It is the force applied on a body which
cause the body to move and / or deform.
Impact
Collision of two bodies. They deform to a certain extend because of the force
involved.
Impulse
Impulse is a vector quantity. It has the same line of action and direction as the
impulsive force. It can be determined by integrating force with respect to time which
will yield the area under the force versus time curve.
Landing phase
The duration from the moment of impact to the establishment of the body in a
stationary balanced position.
Loading rate
The time rate of increasing of force.
Kinematics
A branch of dynamics that deals with the geometry and time-dependent aspects of
motion without considering the forces causing the motion
Kinetics
Kinetics is the measurement of forces and moments that cause or against the motion. j
10
CHAPTER 1 - EVTRODUCTION
Kinetic energy
Energy is the capacity of a system to do work on another system. Kinetic energy is
the energy associated with motion
Moment
Quantitative measure of the rotational, bending or twisting action of a force applied
on a body.
Touch-down
The instant that the foot touch the floor after ajump.
11
CHAPTER 2 - DANCE EVJUMES
CHAPTER 2 DANCE INJURIES
2.1 EPn>EMIOLOGY OF DANCE EVJUMES
Classical ballet is an action orientated profession with grace. The physical
demands on this group of performers are among the hardest in athletic training. Their
maximal oxygen consumption is comparable to the elite female downhill ski racers
and championship class orienteerers (Mostardi et al. 1983). From the aesthetic point
of view, the dance movements need to be weightless, graceful and imagery. To
master these seemingly effortless movements,the dancers have to spend hours in
perfecting the technique. Majority of dance injuries are overuse injuries, and affect
the lower limb and the back, with tendinities and muscle sprains being the most
common. The mechanism of overuse injuries is related to repetitive loading forces
(Hardaker & Erickson 1984). Potential predisposing factors can be divided into
external and internal factors ( Kamenski & Fu 1994, Teitz 1983, Reid, 1988, SchafIe
1990).
2.1.1 EVJURY RATE
Studies indicated that 63% to 95% of students and professional dancers
suffered form dance related injuries, with up to 3.5 to 9.0 injuries per dancer. A study
of professional dancers from the Ballet West and advanced student ballet dancers
from the Ballet West Summer Program in 1982-1983 showed that about 90%
(35/39) of the professional dancers and 63% (52/83) of the students had had a dance
related injury at some time of their career (Ryan & Stephens 1987). Hamilton et al.
(1989) administered questionnaires on 29 soloists and principal ballet dancers from
two American companies, and found that about 80% of the female dancers had
overuse syndromes, and 30% had experienced stress fractures. The average amount
of time spent away from ballet due to disability was ten months. Another study was
12
CHAPTER 2 - DANCE EVJUMES
performed by Ramel and Moritz (1994) on one hundred and forty-seven professional
dancers belonging to three large companies in Sweden filling in a questionnaire about
their musculoskeletal problems. Their results suggested that about 95% of dancers
had suffered from musculoskeletal trouble some time during the proceeding 12
months. Quirk (1983),in his 15 years experience with the Australian Ballet, reported
an injury rate of about 3.5 injuries per dancer. In the United States of America,
Solomon et al (1992) carried out a survey on dance injury on two dance discipline
and a control group. The ballet group consisted of 19 professional ballet dancers
from the Boston Ballet Company. They reported an injury rate of 9.0 injuries per
subject.
2.1.2 EVJURY SITE
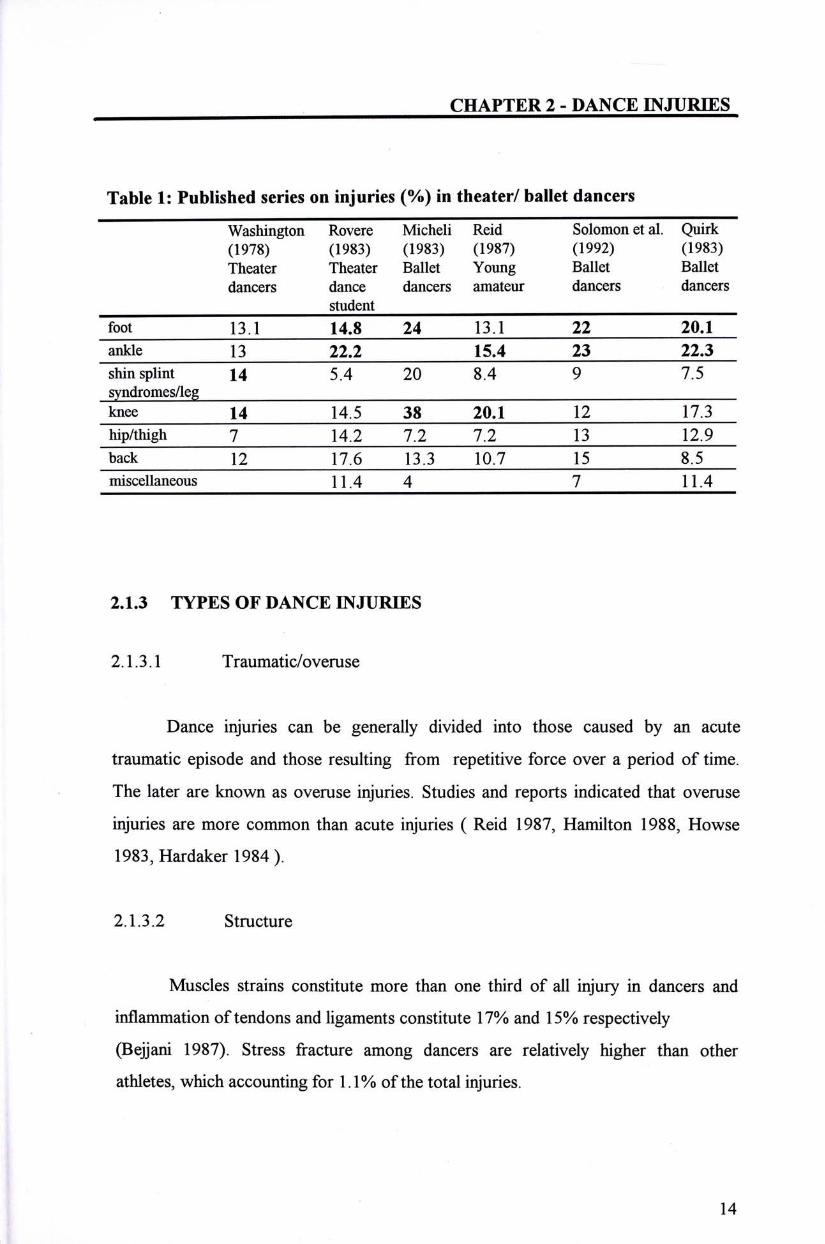
The lower extremities are the most common site of injuries in dancers,
involving more than 70% ofcases (Reid 1988, Solomon 1992, Wong et al.. 1995).
A survey from Washington (1978) on theater dancers indicated that the knee was the
most common injury site (14%). This was supported by Micheli (1983) from a review
of dance injuries statistics in the Sports Medicine Division in Boston Children
Hospital on ballet dancers. He reported that knee injuries accounted for 38% of all
injuries. Even though Reid (1987) reported a lower rate of 20.1%, he also supported
that knee was the joint that sustained the highest injury rates. His study involved a
survey and physical examination on seventy-five young and novice dancers between
10 to 18 years of age. However, studies from Roverse et al. (1983) and Solomon et
al. (1992) contradicted with the results of the above studies, and indicated that the
ankle and the foot were the most common site of injuries on ballet dancers. These
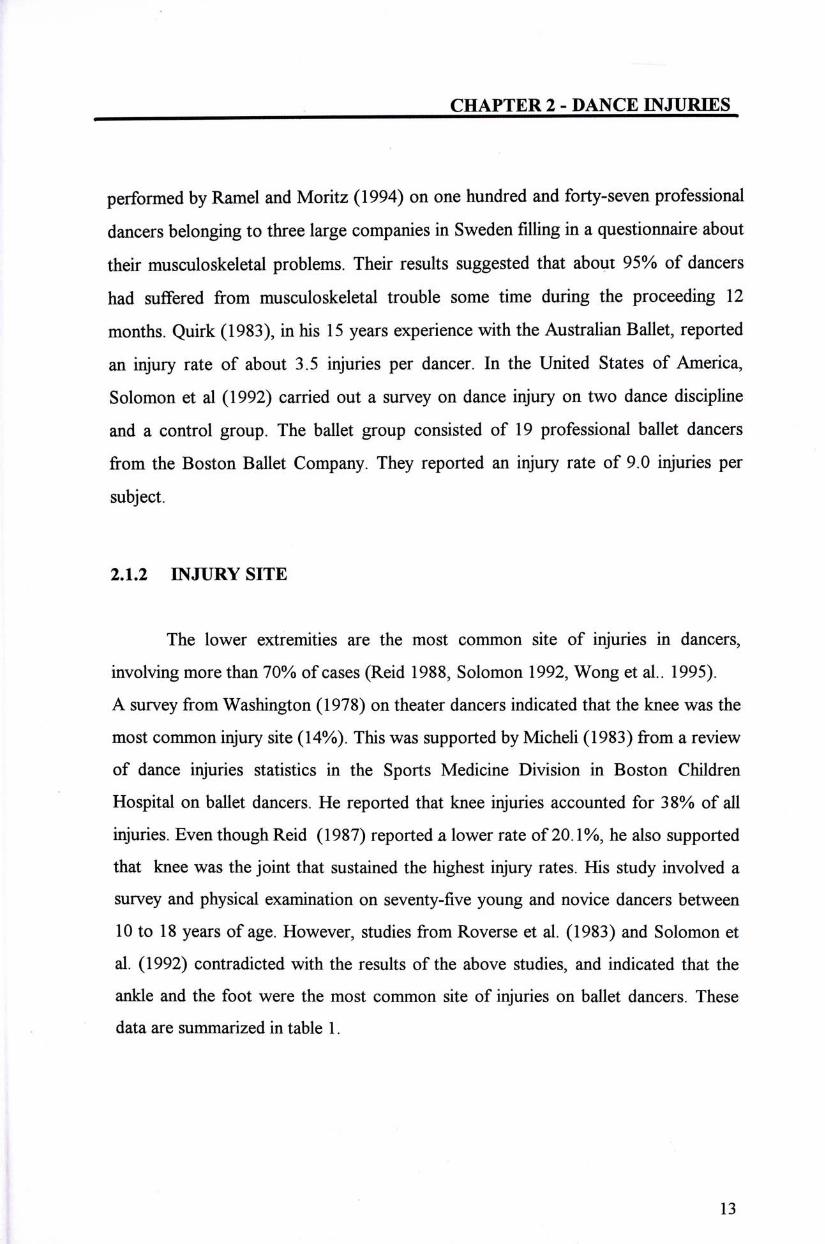
data are summarized in table 1.
13
CHAPTER 2 - DANCE EVJUMES
Table 1: Published series on injuries (%) in theater/ ballet dancers
Washington Rovere Micheli Reid Solomon et al. Quirk (1978) (1983) (1983) (1987) (1992) (1983) Theater Theater Ballet Young Ballet Ballet dancers dance dancers amateur dancers dancers
student foot 13.1 14.8 24 13.1 22 20.1 ankIe 13 22.2 15.4 23 22.3 shinsplint U 5A ^ M 9 T 5 syndromes/leg knee U 14.5 38 20.1 l_2 17.3
"hip/thigh 7 14.2 7.2 7.2 13 12.9 back 12 17.6 13.3 10.7 15 8.5 miscellaneous 11.4 4 7 11.4
2.1.3 TYPES OF DANCE INJURIES
2.1 • 3.1 Traumatic/overuse
Dance injuries can be generally divided into those caused by an acute
traumatic episode and those resulting from repetitive force over a period of time.
The later are known as overuse injuries. Studies and reports indicated that overuse
injuries are more common than acute injuries ( Reid 1987, Hamilton 1988, Howse
1983,Hardaker 1984).
2.1.3.2 Structure
Muscles strains constitute more than one third of all injury in dancers and
inflammation of tendons and ligaments constitute 17% and 15% respectively
(Bejjani 1987). Stress fracture among dancers are relatively higher than other
athletes, which accounting for 1.1% of the total injuries.
14
CHAPTER 2 - DANCE EVJUMES
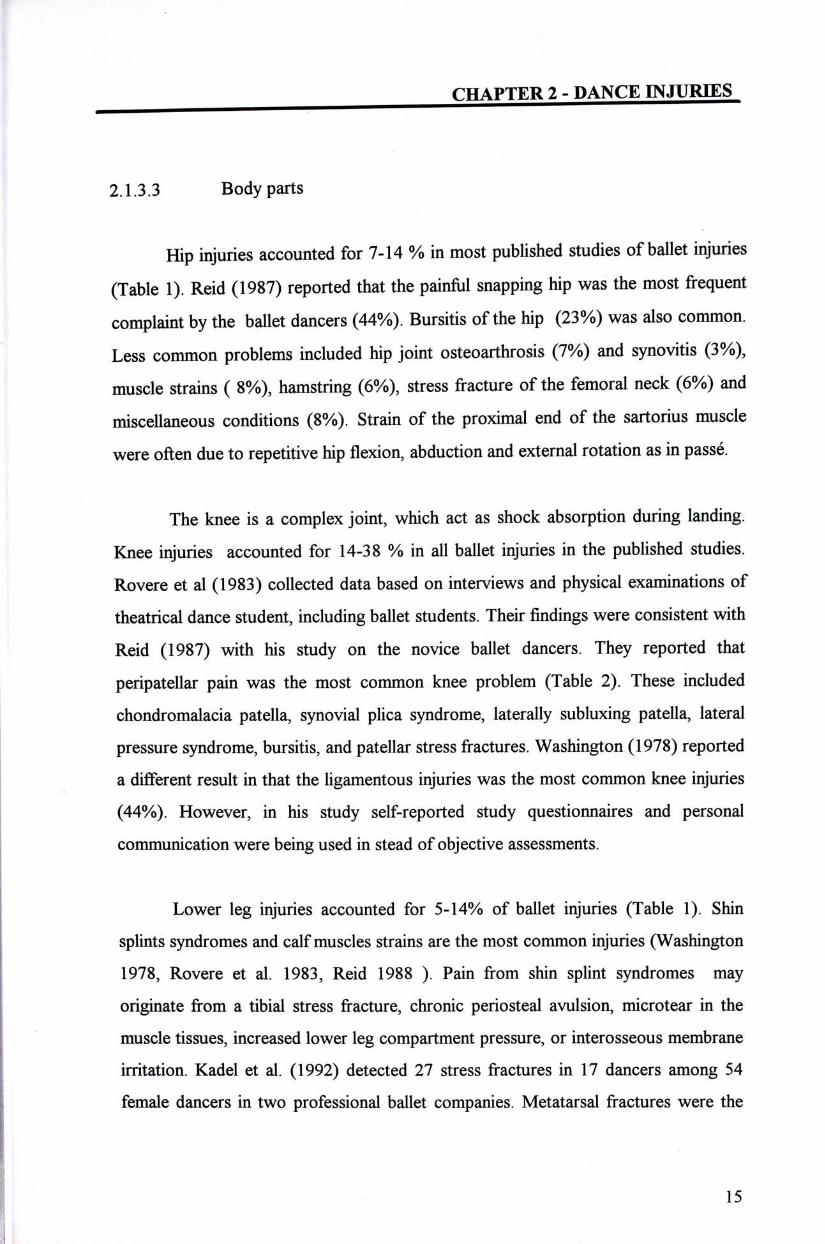
2.1.3.3 Body parts
Hip injuries accounted for 7-14 % in most published studies ofballet injuries
(Table 1). Reid (1987) reported that the painful snapping hip was the most frequent
complaint by the ballet dancers (44%). Bursitis of the hip (23%) was also common.
Less common problems included hip joint osteoarthrosis (7%) and synovitis (3%),
muscle strains ( 8%), hamstring (6%), stress fracture of the femoral neck (6%) and
miscellaneous conditions (8%). Strain of the proximal end of the sartorius muscle
were often due to repetitive hip flexion, abduction and external rotation as in passe.
The knee is a complex joint, which act as shock absorption during landing.
Knee injuries accounted for 14-38 % in all ballet injuries in the published studies.
Rovere et al (1983) collected data based on interviews and physical examinations of
theatrical dance student, including ballet students. Their findings were consistent with
Reid (1987) with his study on the novice ballet dancers. They reported that
peripatellar pain was the most common knee problem (Table 2). These included
chondromalacia patella, synovial plica syndrome, laterally subluxing patella, lateral
pressure syndrome, bursitis, and patellar stress fractures. Washington (1978) reported !
a different result in that the ligamentous injuries was the most common knee injuries
(44%). However, in his study self-reported study questionnaires and personal
communication were being used in stead of objective assessments.
Lower leg injuries accounted for 5-14% of ballet injuries (Table 1). Shin
splints syndromes and calf muscles strains are the most common injuries (Washington
1978,Rovere et al. 1983,Reid 1988 ). Pain from shin splint syndromes may
originate from a tibial stress fracture, chronic periosteal avulsion, microtear in the
muscle tissues, increased lower leg compartment pressure, or interosseous membrane
irritation. Kadel et al. (1992) detected 27 stress fractures in 17 dancers among 54
female dancers in two professional ballet companies. Metatarsal fractures were the
t
15 ':l
CHAPTER 2 - DANCE EVJUMES
most common (63%), followed by fractures o f the tibia (22%). The results agreed
with the study by Nussbaum et al. (1988) who used bone scanning to detect stress
fractures and stress reaction among 23 ballet dancers, who complained ofpain over
back and the lower extremities. They concluded that ballet dancers sustain significant
bone stress in their legs and feet. Stress fractures are seen most often in the feet, and
stress reaction is most prevalent in the tibia. Concerning with muscle strain, Ryan &
Stephens (1987) suggested that the posterior group of leg muscles, that is the foot
plantarflexors and invertors was usually involved in leg strains •
Ballet dancers use their ankle to propel their bodies into space and absorb
shock on landing from jumps. At the instant they leave the floor, they display the
extended line through their pointe feet. Ankle injuries constitute 15-23% of ballet
injuries ( Washington 1978, Ryan and Stephens 1987, Reid 1988). Acute inversion
sprain and Achilles tendinities are most common (Table 2). Damage to the flexor
hallucis longus and posterior impingement syndrome are common with ballet dancers.
(Ryan&Stephens 1987,Reid 1988, Sammarco 1982 ).
Since the 1800s, the ethereal quality demanded by choreographers oblige
ballerinas to dance on the tips of their toes for short period of time. This is thought to
be a causative factor for foot injuries. Tendinities, muscle spasm and muscle sprain
injuries are common. In 75 young ballerinas, Reid (1987) found that the majority of
injuries in the foot were strain at the medial longitudinal arch and pain in the region of
the first metatarsophalangeal joint. Tendinitis of the long flexor tendons of the big toe
is a syndrome that Kravitz et al. (1986) had seen only in dancers. Howse (1983)
claimed that hallux valgus is a serious condition in the dancers that is not uncommon
amongst them. Apart from muscle strain, the metatarsals of the dancer's feet are
subjected to three to four times the body weight. Although hypertrophic metatarsal
bones are seen in the roentgenogram of dancer's feet, in response to the stress placed
on them, Kadel et aL (1992) reported that stress fractures over the 2nd metatarsal
1 6
CHAPTER 2 - DANCE EVJUMES
bone accounted for 60% of stress fractures on dancers. Other pathologic foot
conditions include corns and callosities, plantar fasciitis,hammer toes, and claw toes.
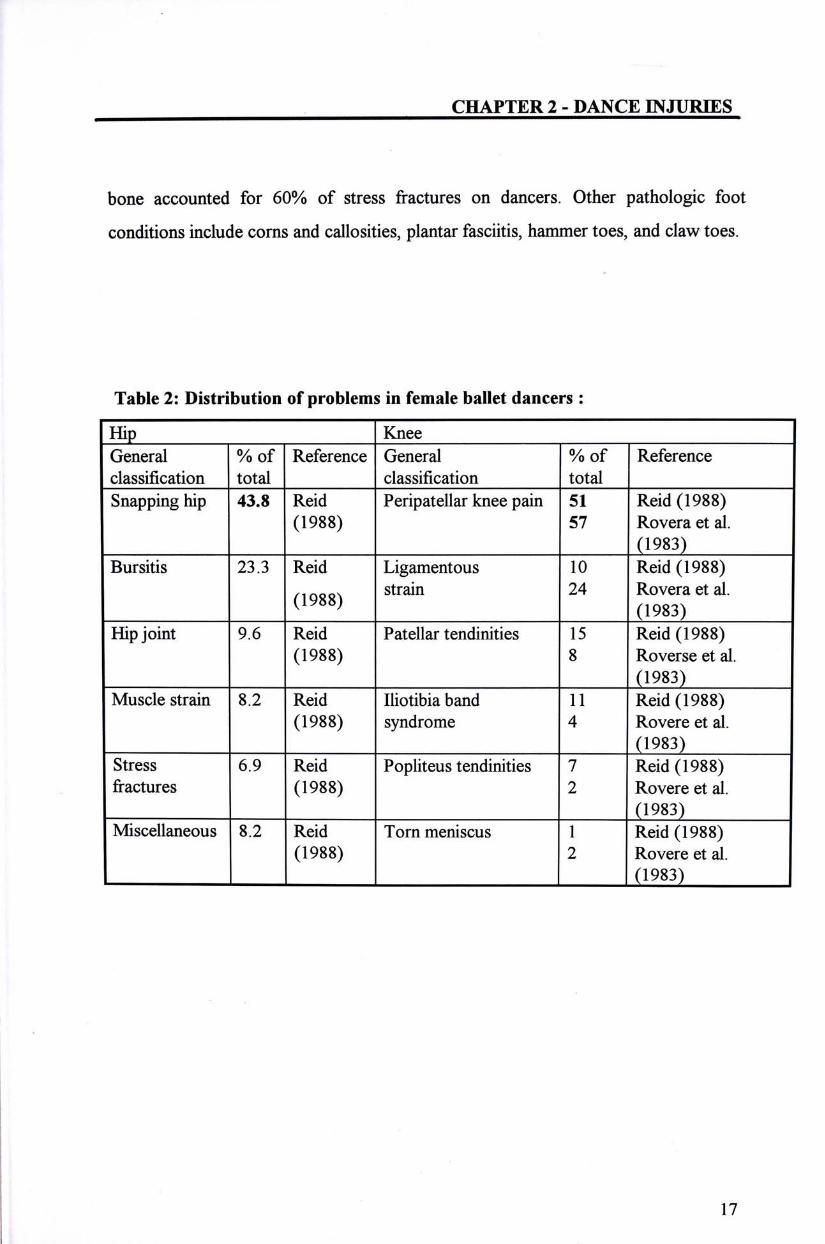
Table 2: Distribution of problems in female ballet dancers :
Hip Knee General % of Reference General % of Reference classification total classification total Snapping hip 43.8 Reid Peripatellar knee pain 51 Reid (1988)
(1988) 57 Roveraetal. (1983)
Bursitis ^ ~ " " R ^ Ligamentous Io Reid (1988) , � strain 24 Roveraetal. (1988) (1983)
Hipjoint ^ R ^ Patellar tendinities i l Reid (1988) (1988) 8 Roverse et al.
(1983) Muscle strain~"S2 R ^ Iliotibia band U Reid (1988)
(1988) syndrome 4 Rovereetal. (1983)
Stress 6.9 Reid Popliteus tendinities 7 Reid (1988) fractures (1988) 2 Rovereetal.
(1983) Miscellaneous 8.2 Reid Torn meniscus 1 Reid (1988)
(1988) 2 Rovereetal. (1983)
17
CHAPTER 2 - DANCE EVJUMES
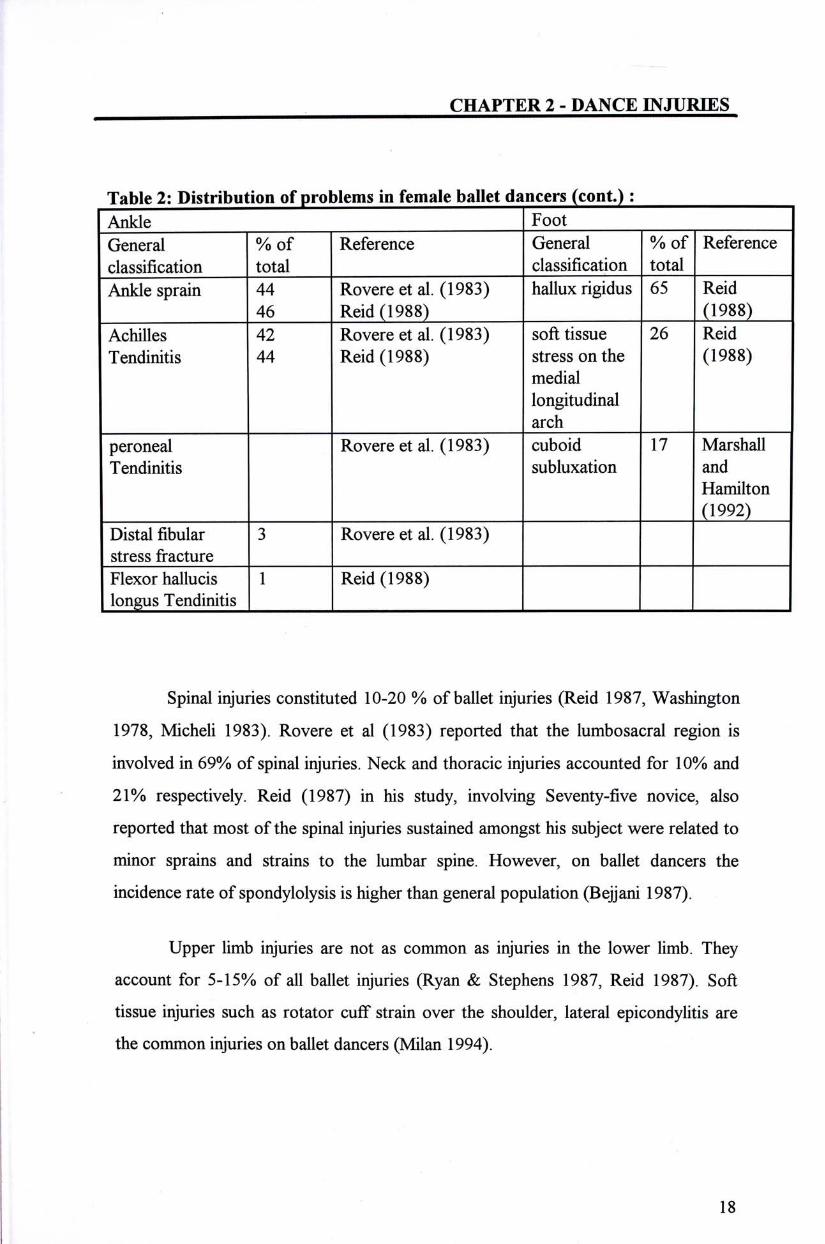
Table 2: Distribution of problems in female ballet dancers (cont.) : Ankle Foot General % of Reference General % of Reference classification total classification total Ankle sprain 44 Rovere et al. (1983) hallux rigidus 65 Reid
^ Reid(1988) (1988) Achilles 42 Rovere et al. (1983) soft tissue 26 Reid Tendinitis 44 Reid (1988) stress onthe (1988)
medial longitudinal arch
peroneal Rovere et al. (1983) cuboid 17 Marshall Tendinitis subluxation and
Hamilton (1992)
Distal fibular 3 Rovere et al. (1983) stress fracture Flexor hallucis 1 Reid (1988) longus Tendinitis
Spinal injuries constituted 10-20 % of ballet injuries (Reid 1987, Washington
1978, Micheli 1983). Rovere et al (1983) reported that the lumbosacral region is
involved in 69% of spinal injuries. Neck and thoracic injuries accounted for 10% and
21% respectively. Reid (1987) in his study, involving Seventy-five novice, also
reported that most of the spinal injuries sustained amongst his subject were related to
minor sprains and strains to the lumbar spine. However, on ballet dancers the
incidence rate of spondylolysis is higher than general population (Bejjani 1987).
Upper limb injuries are not as common as injuries in the lower limb. They
account for 5-15% ofall ballet injuries (Ryan & Stephens 1987, Reid 1987). Soft
tissue injuries such as rotator cuff strain over the shoulder, lateral epicondylitis are
the common injuries on ballet dancers (Milan 1994).
丨 1 8
CHAPTER 2 - DANCE EVJUMES
2.2 AETIOLOGY OF DANCE EVJURIES
Ballet dancers suffer from overuse injuries relating to repetitive loading of the
musculoskeletal system (Hardaker & Erickson 1984). The types of movements,
footwear, and environment can potentially produce different patterns of orthopaedic
problems (Washington 1978). Furthermore, training error is one of the risk factors
identified (Micheli 1983). Muscular imbalance, abnormal postures, and lack of
protection from ballet shoe contribute to the injury pattern of ballet dancers (Reid
1987).
Potential predisposing factors of dance injuries can be divided into external
and internal factors. A review of the factors that have been hypothesized or shown to
predispose a dancer to injuries is reported here.
2.2.1 EVTERNAL FACTORS CAUSEVG DANCE EVJURIES
2.2.1.1 Occupational requirements
Dance postures require dancers to place peculiar and particular demands upon
their spine and lower extremities at the extreme of joint range, a phenomenon not
often found in other athletes. Inaccuracies in technique are believed to produce
significant disability in dancers by putting abnormal stresses and strain on the weight
bearing joints.
The ballet dancer required to stand in the positions of en pointe (the foot at
180° to the tibia) or demipointe (weight bearing on the metatarsal head ). This place
the gastrocnemius and soleus muscles under forceful contraction, and leads to stress
1
19
CHAPTER 2 - DANCE INJUMES
on the Achilles tendon ( Fernandez-Palazzi et al 1990). Excessive stresses are also
placed on the first metatarsal phalangeal joint leading to hallux rigidus.
Anterior impingement at the ankle may develop as a result of the constant
stress placed on them at the extreme of joint range. The plies (semi-squat) produce
high forces on anterior aspect of the joint, and may eventually lead to bone spurs in
anterior aspect of the ankle. Posterior impingement, aggravated by an Os trigonum or
Steida's process (Reid 1988, Hamilton 1988, Hardaker 1985), can limit the ability to
go completely into full pointe or demi pointe positions and determine posterior ankle
pain.
Turn-out is a fundamental technique in ballet training. Stephens (1987)
mentioned that a correct turn-out should mainly involve the external rotation of the
hip joint (55°-70°), about 10° of external rotation at the knee, and tibial torsion (12。),
and abduction of the forefoot at the midtarsal joint. After the study on 29 principle
dancers and sololist on two professional dance company by physical examination,
Hamilton (1992) reported that 60% of this turnout is from the hip, and 40% from
below. Most commonly, a dancer may assume a turn-out by turning out the feet,
twisting the knee, or increasing their lumbar lordosis. However turning out from the
feet by gripping the floor causes the feet to roll in pronation which causes stress on
the flexor hallucis longus tendon, the soft tissue along the medial longitudinal arch
and the tibialis posterior tendon. Twisting the knee is achieved by standing in the
demiplie (semi-squat ) position,the dancers will firmly externally rotate the lower
extremity so that the feet are in line with the coronal axis. The lower extremity are
then extended while external rotation is maintained . This will place excessive stress
on the medial aspect of the knee, and increase the risk of medial collateral ligament
strain and patellofemoral dysfunction (Reid 1987,1988, Kleiger 1987, Hardaker
1985, Washington 1978). Increasing the lordosis of the back in order to allow the
hip to flex and thereby increase in the amount of turn-out is fairly common. However,
20
CHAPTER 2 - DANCE EVJUMES
this will put more stress on the back muscles and may add pressure on the lumbar
facetjoints, which may eventually leads stress fractures of the pars interarticularis and
spondylolysis and spondylolisthesis. (Reid 1987, 1988, Kleiger 198 7, Micheli 1983,
Sammarco 1983,Washington 1978, Schafle 1990).
2.2.1.2 Dance Movements
Jumping is one of the major movement in ballet training and performance
(Nicholas et al.l977), and produces the largest patellofemoral joint reaction force in
dance (Clippinger-Robertson et al.l984). Schafle(1990), Reid (1988), Miller et al.
(1975) concerned with the repeated jumping that dancers had to practice during their
training while wearing a very thin-soled shoe on hard unyielding floors, which may
induce large load on the musculoskeletal system.
Landing is a natural consequent of a jump. Loading on landing can exert 1.5
to 3 times the dancer's body weight on the landing foot (cited Miller et al. 1990),
Miller et al. also expressed their concern that fatigue and stresses may result from the
repeated landing of jumps during a 6 hour work day. Reid (1988) and Schafle (1990)
believed that a poor landing from jumps may contribute to patellofemoral problems,
meniscus injuries and stress fractures, while sudden deceleration in landing may
contribute to Achilles tendinities.
In 1987, Stephens claimed that a tight calf muscle reduces the shock-
absorption capacity of the foot during jumps. Clippinger-Robertson (1988)
recognized an inadequate plies as one of the poor landing mechanics, and suggested
that "working through the whole foot ” and the depth of the plies are important for
shock absorption. In the same year, Dozzi (1988) conducted a study to examine
biomechanical findings with the teachings of allegro work using ten ballet dancers.
21 I
CHAPTER 2 - DANCE EVJUMES
Her study indicated that most efficient shock absorption occurred in the normal and
non-heel contact conditions rather than the forced heel-contact.
Through informal personal communication, "Pull-up" is another technique
that is believed lead to a softer landing after ajump. "Pull-up" involves a lengthening
of the spine with equally engagement of the erector spinae and the abdominal muscles
(Dowd 1984). This suggestion was supported by Micheli (1983). He identified the
abdominal and paraspinal muscles as the muscles for the technical demand of "pull-
up" ,and related this to a better dance aesthetics and a safe position for the back.
However, the amount of work done change according to the nature of the movement
being performed. Rists mentioned that the interpretation of "pull-up" differ from
teacher to teacher, while students found that the instruction of "pull-up" is poor and
confusing. Nevertheless, they perform their "pull-up" before the initiation of jump,
and maintained it until they have stabilized on landing. The purpose of pulling up is
for defying gravity (Dowd 1984). Through this activity, the movements appear fluid,
controlled, and weightless.
To date, there is little quantitative studies on forces on impact loading
during jumping and landing on ballet dancers. Poor landing still remains as a
descriptive term. The methods of reducing impact loading is still awaiting for
scientific verification.
2.2.1.3 Anatomic variations
Anatomical variation may cause an abnormal stress on the normal structures
in an abnormal position.
Stephens (1987) associated cavus foot with a short Achilles tendon and
concomitant equinus condition, which can alter the alignment of the foot during
22
CHAPTER 2 - DANCE EVJUMES
pointe or demi-pointe. Study by Solomon et al. (1992) on foot morphology on 19
professional dancers of the Boston Ballet Company reported that the supinated
hindfoot was unusual in dancers, and may be a disadvantage to a professional career
in ballet. Moreover, the incidence of lower extremity injuries was similar in dancers
with either pronated or neutral hindfoot position.
Howse (1983) mentioned that a short first ray, in which the shortening may
be in the first metatarsal or in the hallux itself, poses great problems with stability.
Sickling will occur if the weight is carried too medial in an attempt to get the first
metatarsal head satisfactorily down to the ground and damage will follow. Stephens
(1987) recognized that the most dangerous foot type for the female dancer is the
Egyptian forefoot, in which the first metatarsal and digit are the longest. When
standing on pointe, this foot type exposes the first metatarsophalangeal joints to
unnecessary valgus stresses. Bunion deformities, fracture of the hallux, onycholysis,
or subungual hematomas may result.
Tibial torsion can affect the alignment of dancer's knee and ankle. Excessive
external tibial torsion (>20。)may lead to patellofemoral and foot disorder because of
the tracking problem with the patella, shear forces in the knee and the pronation force
on the feet. Internal tibial torsion (<10^) results in severe pronation of the foot, which
causes strain on the medial aspect of the foot and knee.
Individual difference in the knee includes genu recurvatum and increased Q-
angle. Genu recurvatum may cause the dancers to stand with their weight distributed
primarily over the heels, tilting the pelvis forward, producing hyperlodosis of lower
back. This pattern of malalignment may put more stress on the feet and back, and
may lead to tendinitis or tenosynovitis of the foot. An increase Q-angle of the knee
may cause an increase in friction on the patellofemoral joint.
23
CHAPTER 2 - DANCE EVJUMES
In the case of a dancer with a wide pelvis, the femoral angle will be decreased
and may be associated with a genu valgum. This malalignment may lead to
patellofemoral tracking problems, medial knee strain, and excessive pronation of the
foot. This excessive pronation of the foot may cause a variety of injuries, such as
plantar fasciitis, medial ankle tenosynovitis, Achilles tendinitis, and posterior medial
shin splints. Pronation may also cause medial rotation of the leg and put strain on the
medial aspect of the knee.
Normally, adults have about 12-14�of femoral anteversion. Stephens (1987)
recognized that a relative degree of femoral retroversion (< 10。)would facilitate the
external rotation of the lower extremity that a dancer desires for turn-out. For those
dancers who have limited external rotation, they may compensate for such limitation
with out-turning below the hip, and may cause an injury indirectly.
2.2.1.4 Muscle fatigue, weakness and lack of sufficient flexibility
A major cause of shock absorption failure is secondary to muscle fatigue.
Washington (1978) mentioned that, in a profession where quick reflexes and well
trained muscles to respond to those reflexes are indispensable, a fatigued poorly
responsive group of muscles can result in imbalances and uncoordinated movements.
These may produce musculoskeletal injuries, such as, poor landing or missteps and
will lead to overuse injuries or acute inversion sprain of the ankle.
The young dancers practice for 14.7 hours per week, with some practicing for
as long as 25 hours (Reid,1987 Wong et al.l995). In addition, they take relatively
little time off during the year. 60% of the dance student from Wong 's survey (1995)
indicated that fatigue is one of the causative factor for dance injuries. From
Washington's study (1978), the incidence of injuries seems to increase toward the
24
CHAPTER 2 - DANCE EVJUMES
end of a long class, after strenuous fatiguing rehearsals,or following a long series of
closely spaced performances.
In Kadel's study (1992) on stress fracture with 54 ballet dancers, the hours
of dance per day was a significant risk factor for stress fracture. Her study indicated
that dancer dancing more than 5 hours per day were significantly more likely to have
a stress fracture than those dancing less.
Another major cause of shock absorption failure is muscle weakness. The
quadriceps mechanism is responsible for shock absorption through eccentric
contractions. Weakness in this group of muscle may not meet the requirement of the
strenuous demand of a dancers e.g. landing from a jump�Kirkendall et al (1984)
conducted a study on the isokinetic characteristics on twenty-eight dancers. The
quadriceps and hamstrings were measured by a Cybex II isokinetic dynanometer at
45 0, 90 0, and 180° per second. Their data indicated that female ballet dancers are
lower in relative torque than other female athletes. In 1992, Hamilton et al carried
out a study to measure the characteristics of twenty-eight elite professional ballet
dancers. He reported that the female dancers only have similar knee strength
compared to the normal subjects.
Another cause of shock absorber failure is lack of sufficient flexibility. The
ballet dancers are believed to have good flexibility. However, dancers work
continually on selected repetitive motions had a predisposition for the development of
muscle imbalance.
Reid (1988) carried out a study to measure the flexibility on thirty senior
female ballet dancers and thirty non-dancers, and found that dancers have less range
hip adduction and internal rotation. The reduction in range of motion was greater in
25
CHAPTER 2 - DANCE EVJUMES
older ballet dancers. There was also an association between lateral hip and knee pain
and the reduction in hip adduction range..
Stephens (1987) mentioned that professional dancers may acquire a functional
equinus condition from years of extensive daily use of the calf muscles without a
proportional amount of calf stretching. This functional equinus alters the normal
biomechanics of the foot during the fundamental movement of plies, and predisposes
to injury. The study from Hamilton et al (1992) on the musculoskeletal characteristics
of twenty-eight principal dancers and sololists from two ballet companies indicated
that the elite ballet dancers have a 44% decrease in the range of dorsiflexion. In his
study, measurement of the ankle dorsiflexion was taken with a standard goniometers.
They also claimed that dancers with decreased in ankle dorsiflexion had higher
incidence rate of injuries.
2.2.1.5 Diet
Obsession with thinness is epidemic in dance�This often causes protein and
carbohydrate deficiency which affects the dancers' body to build, maintain and repair
tissue. The percentage ofbody fat for professional dancer varied from 13.5 to 16.5 %
as reported by Micheli et al (1984). However, 69% of the Ballet West advanced
students thought it was more healthy to be underweight and 70% of the Ballet West
dancers were dieting despite the fact that none of them were overweight (Stephens
1987).
Loosli et al (1987) reported that iron deficiency was found in 50% of the
adolescent dancer. When combined with dehydration, this may cause early fatigue,
poor performance and injuries. They also found that 60% of the professionals and
40% of the adolescent dancers were seriously deficient in calcium. This insufficient
calcium intake may contribute to the incidence of shin splint.
26
CHAPTER 2 - DANCE EVJUMES
The ultraleaness, along with the associated nutritional and physical demand,
contribute to delayed menarche and the development of menstrual irregularities.
Highly athletic women with absent or irregular menses have an almost three fold
increased risk of stress fractures, perhaps due to the negative effects of a reduction of
circulating E2 on bone density.
2.2.1.6 Personality
Most dancers have high motivation and goal oriented personalities.
Furthermore, they prefer to bear their pain in silence without consulting an physician
(Ryan & Stephens 1987). Wong et al. (1995) reported that the time lapse between
injuries and seeking of consultation was 2.6 days. This delay of seeking proper
medical consultation could cause overuse injuries to become chronic with periodic,
exacerbation (Sammarco 1983,Ryan & Stephens 1987, Reid 1988).
In summary, the internal factors causing dance injuries include the
occupational requirements, anatomical constraints, body conditioning, dietary and
personality. Although there are nothing we can do to correct anatomical variation,
one can prevent dance injuries with emphasis on correct techniques and satisfactory
conditioning. Furthermore, analysis of dance movements and the associated loading
could lead to better instruction and a possible means of reducing impact loading.
i 27
CHAPTER 2 - DANCE EVJUMES
2.2.2 EXTERNAL FACTORS CAUSING DANCE EVJUmES
Thin, non-cushioning classical ballet shoes, couple with the repeated jumping
are likely to contribute to stress fractures in the lower extremity on ballet dancers.
(Teitz,1983).
The dancer's footwear include slippers and pointe shoes. Both types of shoes
possess neither cushioning, shock absorbent material nor room for orthotics. This is
because the construction of the slippers and pointe shoes are primarily for style and
tradition (Hardaker & Erickson, 1984). The slippers are thin, flexible and tight fitting.
The pointe shoes which enable the dancers to stand en pointe are rigid at the toe and
inflexible in the shank.
The effect of ballet technique shoe on loading force was studied by Miller et
al. (1990). The study involved one male subject,performing step jete on a force-
plate and a pressure plate with standard technique shoe, bare-footed, and a
combination of 11 modified ballet technique shoes. No significant differences in peak
force were found with wearing the technique shoes and being barefooted.
Hard and nonresilient surfaces have been suggested to contribute to overuse
syndromes, acute ankle sprain, and stress fractures (Washington 1978,Reid 1987,
Ryan & Stephens 1987, Quirk 1983). The study by Wong et al. (1995), by self
administrated questionnaires on student dancers, indicated that 23.4% of the
collegiate students believed that dance floor was one of the causative factors for
injuries. Seal (1987) recommended that an ideal dance floor is one with shock
absorbing qualities, “ give" under impact, absorbing some energy but without
deforming permanently. Through informal personal communication, Washington
(1978) reported that with proper resilience of floor surface, there was a decrease of
28
CHAPTER 2 - DANCE EVJUMES
80 % in musculoskeletal injuries to theater dancers. However, in response to
Washington's study, Miller (1978) noticed that dancers may have to perform in
different theaters, some of which may not have the specially constructed dance floors
(particularly they are on tour). If the dancers are trained on soft floor, their bones
may not adapt to the harder floor that they have to perform on, which may leads to
fatigue mechanisms. In another paper, Miller et al. (1990) pointed out that most
smaller professional ballet companies, ballet school, and local theaters can not afford
these ideal floor.
In conclusion, the external factors for dance injuries are either not under
dancer's control, or are not effective enough to reduce loading. Even though the
reliability of the study using one subject is questionable, the wearing out ofthe ballet
shoe after one performance have clearly shown the shoe's inadequacy in giving
support. On the other hand, the effect of dance surface on dance injuries relied solely
on informal personal communication, and the stages for performance might not
consist of the specially constructed dance floor.
29
CHAPTER 2 - DANCE EVJUMES
2.3 EMPLICATION TO THIS STUDY
In ballet dancers, the injuries rate on professional and student dancers ranged
from 63% to 95%. 70% of these affects the lower extremity with the knee and the
ankle as the most common sites. Researches postulated that aetiological factors may
include landings from jumps. Jumping and landing is one of the major movement in
dance training and performance, which induce cyclic loading on their musculoskeletal
bodies. The injuries associated with "poor landing" include patello-femoral problems,
Achilli tendinitis, and stress fractures. The epidemiology studies on dance injuries
revealed that the first two are the most common injuries with ballet dancers. The
stress fractures on dancers are relatively higher than that ofother athletes
The technique that may affect the loading force from a jump are the depth of
plie and "pull-up". However, these are postulations and belief awaiting scientific
verification.
30
CHAPTER 3 - BIOMECHANICAL STUDffiS
CHAPTER 3 BIOMECHANICAL STUDIES ON LANDING FROM VERTICAL JUMPS
3.1 BIOMECHANICS ON LANDEVG FROM VERTICAL JUMP
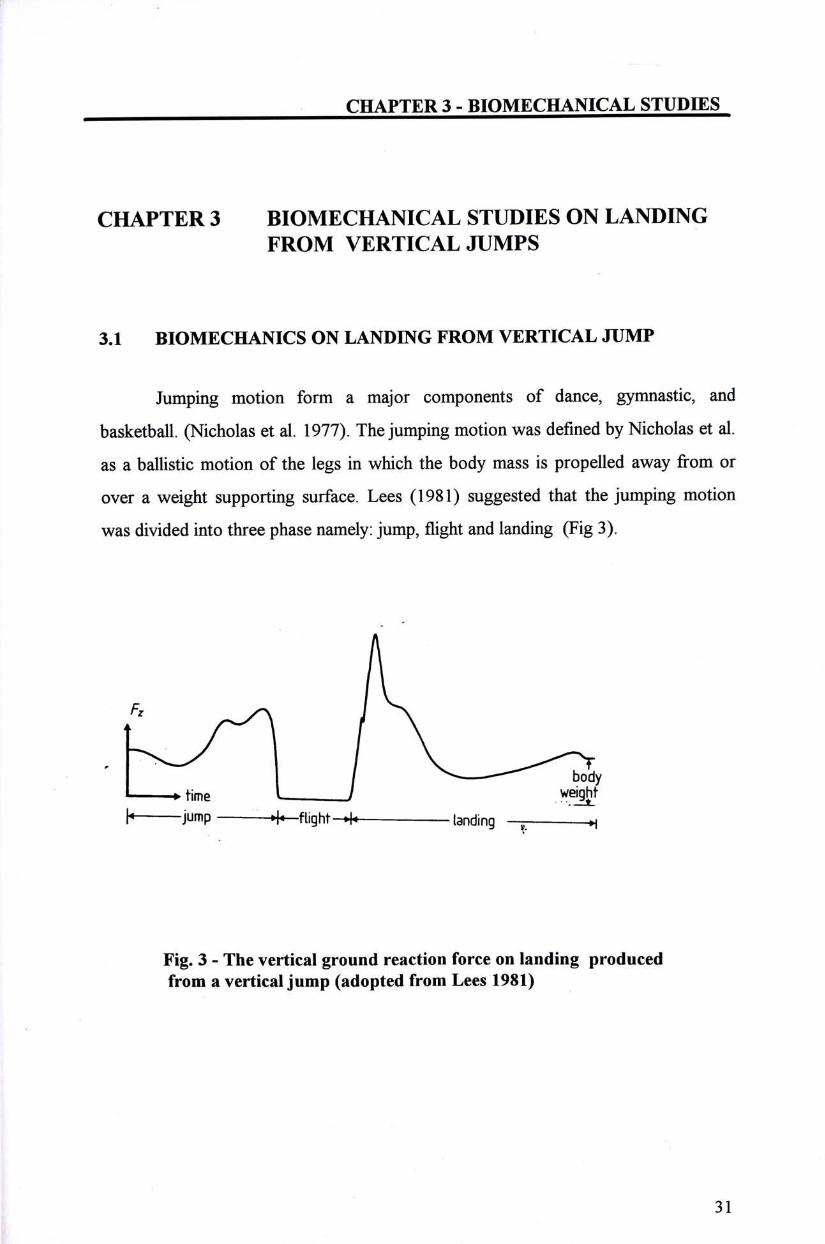
Jumping motion form a major components of dance, gymnastic, and
basketball. QS[icholas et al. 1977). Thejumping motion was defined by Nicholas et al.
as a ballistic motion of the legs in which the body mass is propelled away from or
over a weight supporting surface. Lees (1981) suggested that the jumping motion
was divided into three phase namely: jump, flight and landing (Fig 3).
, f ^ f v ^ / ^ body
•time 1 wei^t H j u m p — — - ^ f l i g h t ^ landing — H
Fig. 3 - The vertical ground reaction force on landing produced from a vertical jump (adopted from Lees 1981)
31
CHAPTER 3 - BIOMECHANICAL STUDffiS
Lees (1981) defined landing as the duration from the moment ofimpact to
the establishment of the body in a stationary balanced position. However, researches
use different methods to quantify the termination of the landing phase.
In both studies on gymnasts by McNitt-Gray (1989) and McNitt-Gray et al.
(1993),they defined landing phase as the time from initial contact to the time
required to bring the vertical velocity of the total body center of mass to zero, that is,
the total body center of mass is at its lowest position.
Devita and Skelly (1992) studied the effect of landing stiffness on joint
kinetics and energetic in the lower extremity using eight female subjects. They
defined the landing phase for the purpose of their study as the period from the initial
floor contact until maximum knee flexion is reached.
The joint motion of the lower limb and ground reaction forces in vertical
landing on ten subjects was studied by Ayalon et al. (1995).They studied the motion
from the ground contact until the force stabilizes at approximately 1 body weight.
In views of the different methods to quantify the termination of landing phase,
two groups of researches judging the termination of landing phase from the
kinematics, and one group used the kinetics. In this study, the termination of landing
phase is defined as when the impact force reduced to lBW, that is, the establishment
of the body in a stationary balanced position.
On landing, impact forces generated on the musculoskeletal body. McNair
and Marshall (1993) described the impact of human body on landing as an interaction
between two objects. The downward momentum during impact landing must be
reduced to zero and this change in momentum causes an impact force on the falling
body. The magnitude of the applied force followed Newton's second law;
32
CHAPTER 3 - BIOMECHANICAL STUDffiS
A mv = i F(t) dt. Here, the F is the force acting on the mass, t is the deceleration
time, and v is velocity of the mass at impact. The magnitude of the force acting on
the mass is commonly expressed as the ground reaction force (GRF), which is a
function of the impact velocity and is inversely proportional to the deceleration time.
DeVita and Skelly (1992) explained the phenomenon from another
prospective. While falling from a distance above the ground, a person's total energy
will change from potential energy to kinetic energy. The energy will be dissipated by
movements on the lower extremity. The movements is being done by the work of
lower extremity muscles.
3.1.1 KEVEMATICS ON LANDEVG FROM VERTICAL JUMP
Kinematics is the description of motion independently of the forces which
caused it ( Winter 1979). They include linear and angular displacements, angles,
velocities, and accelerations. The displacement data is taken from any anatomical
landmark, center of gravity of body segments, center of rotation of joints or key
anatomical prominence ( Winter 1979).
3.1.1.1 Measurement of kinematics
Nigg (1986) claimed that optical methods are most commonly used for the
quantification of kinematics in jumping activities. The various techniques used are
cine-photography, and videography (Winter 1979,Adrian & Cooper 1995, Nigg
1990,Scholz & Millford 1993). These methods involve the production of pictures
which contains the information of the location of a number of markers and time.
After the film from the cine-photography has been developed, the image can be
33

CHAPTER 3 - BIOMECHANICAL STUDffiS
projected on any wall, screen or other clear matter at varying sizes. The image on the
required landmarks are being traced and expressed in terms ofco-ordinates.
The conventional film have the advantage of having high resolution.
However, it does have the disadvantage of having large volume of information and
data ( Adrian & Cooper 1995). The video-based motion analysis system has been
developing at a fast pace in the last decade. The name given to each video-based
image is a field. The video-based system has the advantage of having instant replay
on a television and immediate transmission of the image onto a computer. Interfacing
the video-based motion analysis system with a personal computer an image is being
digitally "grabs" by the computer. Digitization of the image of the selected markers
can then be done either manually by an operator or automatically by the computer
(Scheirman & Cheetham 1990).
Markers system are classified into passive and active marker systems. The
passive marker system uses a certain number of cameras to track the position of
markers attached to anatomical landmarks. Infrared stroboscopic light or flush light is
projected onto the subject and reflection from the marker is detected to calculate the
location of the markers in space. The active marker system used camera(s) and has
active light emitting diode (LED) markers attached to anatomical landmarks. The
LED markers are pulsed sequentially from the controlling computer that can
automatically identify the markers (Winter 1979).
It is important to be able to still image and image-by-image advance and
reverse the videotape in the playback mode in selecting the appropriate image to
analysis or to digitize. There are 30 images per second or 60 images per second and
120 fields per second playback units. In the past, the video-based motion analysis has
the disadvantage of having low resolution of video tapes. Nevertheless, with the
34
CHAPTER 3 - BIOMECHANICAL STUDffiS
introduction of SVHS and Hi8 formats in camcorders, the quality of resolution has
improved (Adrian & Cooper 1995).
A shuttered camera is an invaluable tool to produce clear images. High speed
cameras with the capacities of 60 field per second or 120 field per second are
available to capture images for analyzing the jumping motion (Adrain & Cooper
1995).
Other measuring devices include, electronic goniometers and accelerometers .
The electronic goniometer can be attached to measure a joint angle. One arm of the
goniometer is attached to one limb segment and the other to the adjacent limb
segment. The axis of goniometer is aligned to the joint axis. The goniometer has the
advantage of providing immediate data for recording or conversion onto the
computer. Their disadvantage lie in the fact that motion can be encumbered by the
straps and cables, particularly, if a number of joints are being assessed O^inter 1979,
Adrian & Cooper 1995). An accelerometer is a device that measures acceleration. It
consists of a small, light weight force transducers that can measure the reaction force
associated with a given acceleration. The accelerometer can be attached to the body
segment on the skin surface or mounted onto the bone. Motion may be encumbered
if large number are being attached to different parts of the moving body. Another
concern is the shock induced on the transducer during the high impact on landing
OVinter 1979, Adrian & Cooper 1995).
3.1.1.2 kinematics on landing from vertical jumps
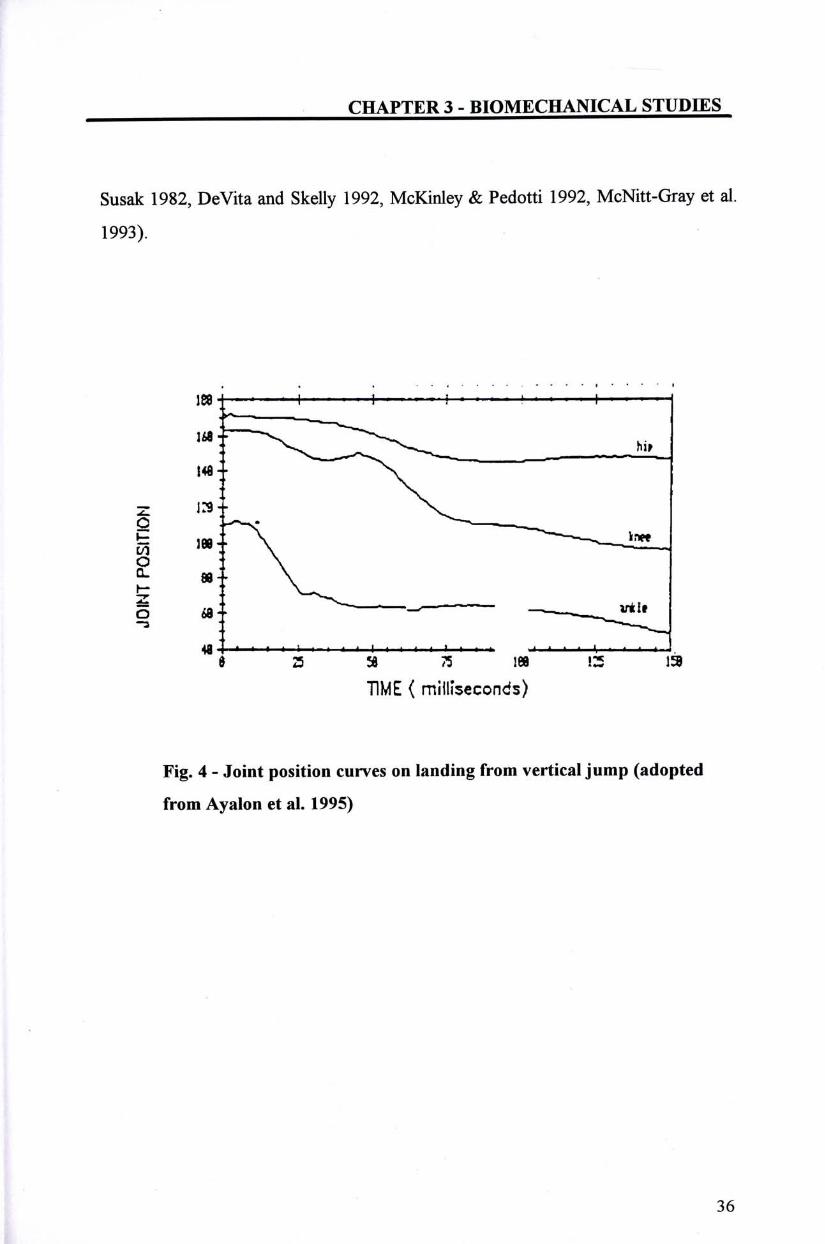
A typical curve of angular movement at the hip, knee and ankle joints from
vertical jump is illustrated in Fig.4. During the floor contact phase, controlled knee
flexion and ankle dorsiflexion, with flexion of trunk and hip joint occurred (Mizrahi &
35
CHAPTER 3 - BIOMECHANICAL STUDffiS
Susak 1982, DeVita and Skelly 1992,McKinley & Pedotti 1992, McNitt-Gray et al.
1993).
188+ 1 i 1 • I
'"^"^^^^C:::>^__-_>^ t4fly X^
Z 丨:9:- N s ^ 0 ^ - ^ " “ _ ^ 旨 � � r \ ^ ' ^ ^ ' ^ - - - ^ o \ • “ ‘ v ^ 0 68- ^ ^^‘ ^ ^
48 • • • _ • - “ ‘ ‘ ‘ «• • • • i . 25 » 75 丨80 丨2 13
TIME ( miilIseconds)
Fig. 4 - Joint position curves on landing from vertical jump (adopted
from Ayalon et al. 1995)
36
CHAPTER 3 - BIOMECHANICAL STUDffiS
In some studies the researches included the configuration of thejoints before
landing. In the study by Devita and Skelly (1992) on eight female athletes, they used
a force-plate and a 16 mm LoCam camera to assess the effect ofknee flexion on
landing from a platform of59 cm high. They reported that the subjects prepared
themselves in the decent phase by having an increased in the extensor moment over
the hip joint and the flexor moment over the knee joint. As a consequence, the trunk,
the hip and knee are slightly flexed immediately before floor contact (touch-down).
This observation is consistent with the study from McKinley and Pedotti (1992).
McKinley and Pedotti (1992) examined the motor strategies in landing from a
jump on four untrained subjects and four competitive volleyball player. They used
EMG, force-plate and an ELITE motion analysis system to examine the jumping
motion from a platform 43 cm in height. They also found that the limbs of the subjects
were already slightly flexed at landing due to the activities of the medial hamstring
group.
3.1.2 KEVETICS ON LANDEVG FROM VERTICAL JUMP
The kinetics of landing from vertical jumps is the measurement of forces and
moments (torque) that cause or against the motion. The main external forces and
moments on landing from vertical jumps are the vertical ground reaction force and
moment on touch down with the ground.
3.1.2.1 measurement of force
The analysis of the force system was significantly advanced by Amar with the
invention of "force-plate" (Cappello et al. 1995). The measuring system was
mechanical, spring deflection under load operation. The instrument measured vertical,
sideways and backward force components. Nowadays, the plates commonly used are
37
CHAPTER 3 - BIOMECHANICAL STUDffiS
based on either piezoelectric or strain gauge techniques (Adrian & Cooper 1995).
They work on the principle that the force applied causes a certain amount of strain in
the transducer. For the strain gauge type, a calibrated metal plate within the
transducer undergoes a change in its dimension. This mechanical change leads to a
change in resistances connected as a bridge circuit, resulting in a change in voltage
proportional to the applied force. Piezoelectric type of transducer consists of the
block of special crystalline material, for example, quartz. Deformation of the atomic
structure within the block of crystal by an applied force changes the electrical
characteristic of the block of material. The changes in electrical charge can then be
translated to a signal proportional to the force. In order to measure forces in two or
three directions, two or three force transducers are mounted at right angle to each
other OVinter 1979).
3.1.2.2 Kinetics on landing from vertical jumps
Researchers attempting to quantify the forces during various landing activities
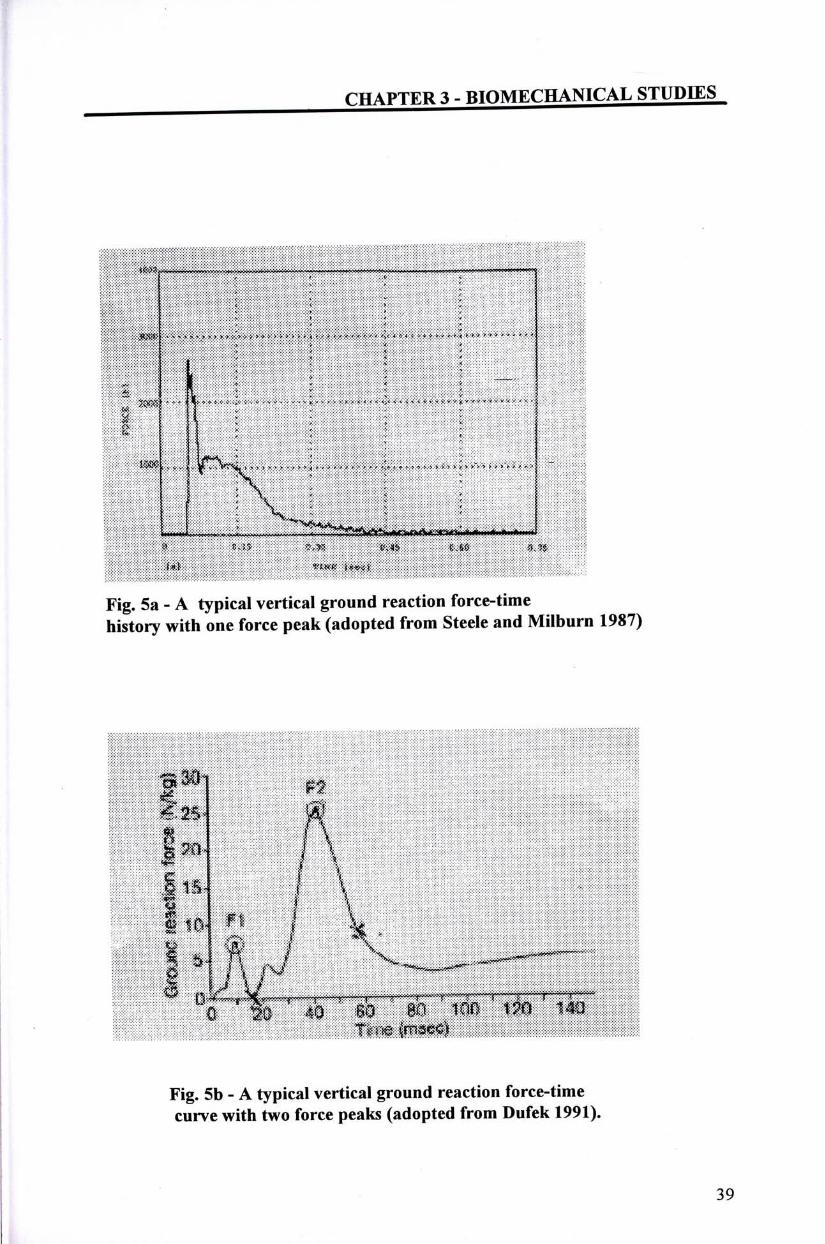
have identified two types of vertical ground reaction force-time histories (Fig.5a,b).
The first curve demonstrates a high force peak (unimodal) during the impact
absorption phase, and the second curve demonstrates two force peaks (bimodal). The
unimodal type of curve corresponding to flatfoot, toe only or heel only type of
landing and produce the peak force on touch down (Dufek & Bates 1991,Steele &
Milburn 1987). The bimodal pattern corresponding to the more common, forefoot-
heel type oflanding,and produce impact peak at both events.
38
CHAPTER 3 - BIOMECHANICAL STUDffiS
..•.:•:.:.:,:.:.:_j!@>>V»W»»»V>yiWM»NWW">WWWW»>»W>—yA*y<W<>y.»W»W"!.:» M’”W_W<O*XWgM._,,>MW*»’W»»WW»»W>»>»»».��”W9<,K,,i<!0.<;:-: : • • • • • •
_ ; n n n 耀.—��>�> > > .•�’ ‘ > > ‘ > ‘ ‘ ‘ ‘ ‘ < ‘. ‘ '> < ‘ *�…^ ‘ ‘ ‘ < > I
. I I i i ! -*V ^ ‘ �•* �’冬.令 >* ‘ 声、• > < s � » * • • ^ • • • • • > • >, < • • <« ’ � � � � 1 � V » V f A ‘ ‘ •* V t • V « • <r • • *
tdJ I"""J:._._ “.遍.丄 ?!!S!f!"^^»;< i»»>rMM<:-?i»?t<hri'_rtti____<<riiW• _t,• • • • if <> w. !?,於 t<><j> ^-.m ^K^4 Ui ^^'i.^a U^f-^i
Fig. 5a - A typical vertical ground reaction force-time history with one force peak (adopted from Steele and Milburn 1987)
J ^ 1 ^f ^¢"¾ *yvv:、. ^M< ^1
1 » I \ | 1 S ' I \ 蕃 糊 [ _ I \ ,
14f^pJ ^ v _ . . . ^ - -S , , j d j | ^ _ ^ ^ g _ ^ g ^ ^ T ^ ^ g ^ p ^ ^ ^ p ^
T$m ! _ #
Fig. 5b - A typical vertical ground reaction force-time curve with two force peaks (adopted from Dufek 1991).
39
CHAPTER 3 - BIOMECHANICAL STUDffiS
The magnitude of these impact forces could be attenuated in two phase
(Radin 1974) : passive and active shock absorption phase. In the passive mechanism,
shock attenuating is achieved by bone and soft tissues. The trabecular bone take a
major role in absorption the energy through local and minimal rupture. This rupture is
able to restore in living tissues, unless multiple overload occurs. During the passive
phase, the force can also be attenuated by muscular activities (Greenwood & Hopkins
1976,Lees 1981, McNair & Marshall 1993,Melville-Watt and Jones 1971). Mizrahi
and associate (1982) have hypothesized that this activity may be a presetting of the
lower extremity muscle tensions during the descent phase. The active mechanism
relies on lengthening of muscles under tension, accompanied byjoint motions. During
these motions, the energy is being dessipated by the eccentric action of the extensor
muscles of the lower limb. The muscles first absorb the impact and then release the
energy as mechanical energy causing flexion of the trunk and the lower extremity
(Devita & Skelly, 1992). The active mechanism is under the control of neuro-
muscular system and there is a measurable time for the system to react to external
stimulation. Nigg (1985) mentioned a time of 50ms as the time required for the active
absorption to start. Radin (1974) quoted a time of75ms.
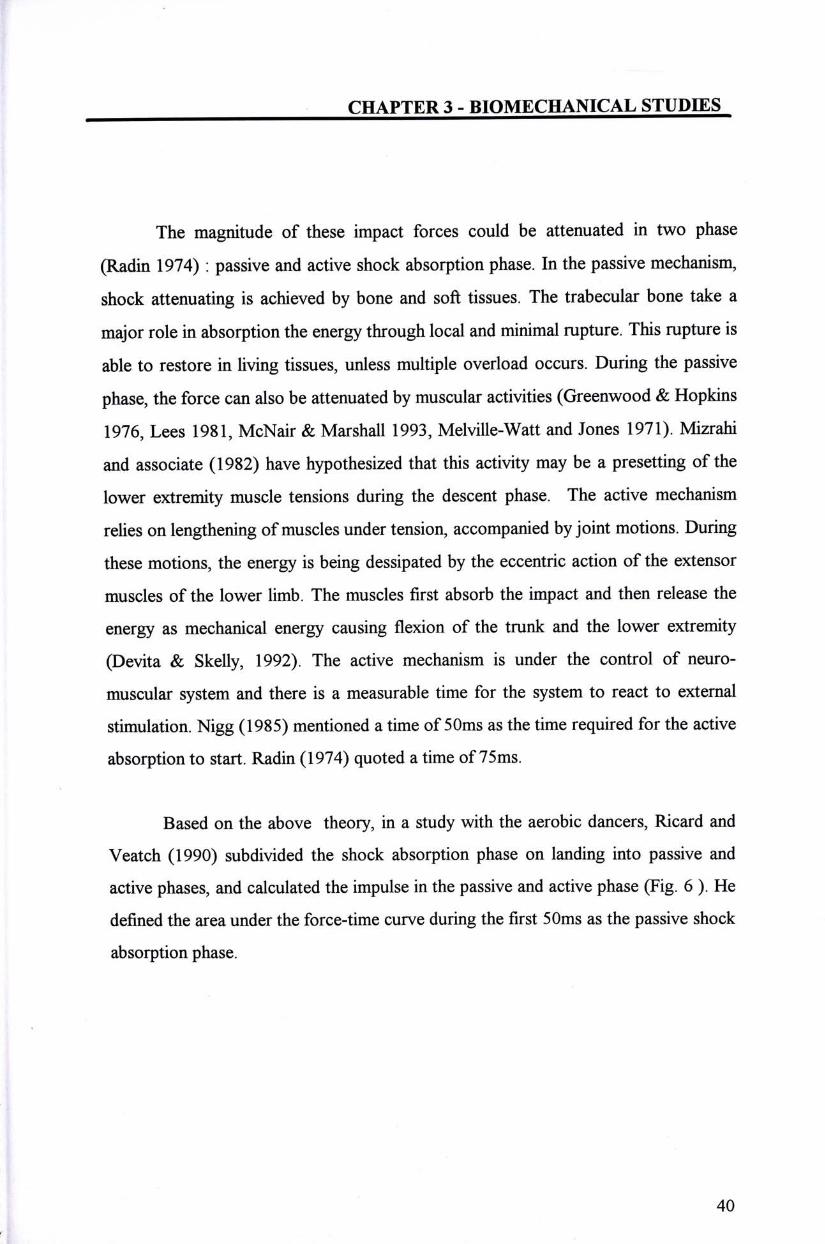
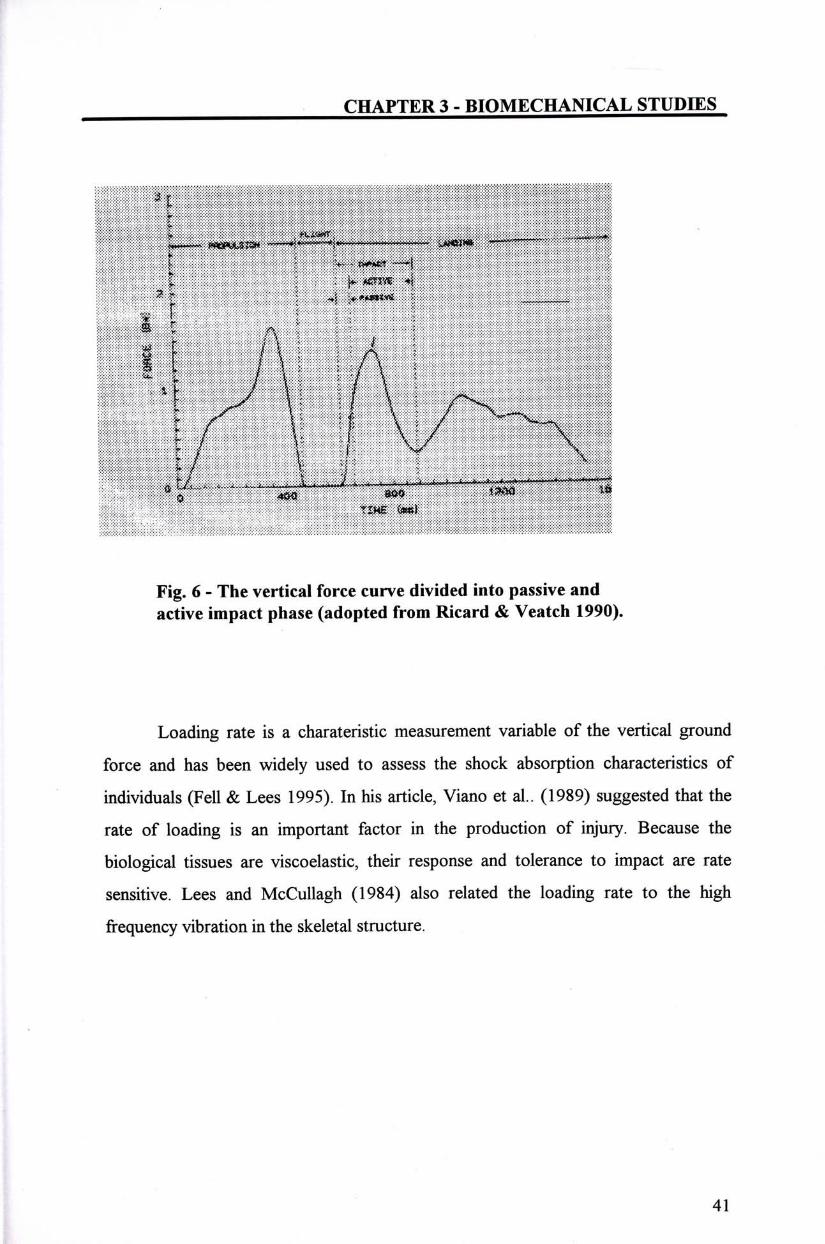
Based on the above theory, in a study with the aerobic dancers, Ricard and
Veatch (1990) subdivided the shock absorption phase on landing into passive and
active phases, and calculated the impulse in the passive and active phase (Fig. 6 ). He
defined the area under the force-time curve during the first 50ms as the passive shock
absorption phase.
40 f
CHAPTER 3 - BIOMECHANICAL STUDffiS
iM ^ ^ iM ^ ^ .
^ ^ ¢^¢^ “«.^^^ -^m — 一 … … “ 一 她 Wf9M-:^:-y///y:^^
\ V - n>^^ •叫 t :.卜鄉狭4
之 ^ 1 Vj 'i^*m*^
|_圖^^^
M A :魏广
\f J J ^ ^ ^ ft bL'….《•一丄“丄 r r k »1>_1丨.L ....*. ._•_,_•*•••“供>…<_,_•___....w™""'“™ » 办 43^ »»炒 ,— ®
T2HS Ktt)
Fig. 6 - The vertical force curve divided into passive and active impact phase (adopted from Ricard & Veatch 1990).
Loading rate is a charateristic measurement variable of the vertical ground
force and has been widely used to assess the shock absorption characteristics of
individuals (Fell & Lees 1995). In his article, Viano et al.. (1989) suggested that the
rate of loading is an important factor in the production of injury. Because the
biological tissues are viscoelastic, their response and tolerance to impact are rate
sensitive. Lees and McCullagh (1984) also related the loading rate to the high
frequency vibration in the skeletal structure.
41
CHAPTER 3 - BIOMECHANICAL STUDffiS
The loading rate can be calculated by dividing the change in the vertical force
from touch-down to the peak force by the time interval to provide an average loading
rate (Lees and McCullagh 1984). In order to overcome the "end effects", the
effective load rate was calculated by using the central portion of the impact slope.
However, difficulties arise when the event of interest is not linear. Fell and Lees
(1995) suggested that the using of dynamic loading rate can avoid the above
shortfall. The dynamic loading rate is defined as the continuous first differential ofthe
force curve. Apart from the peak load rate, this method produce a graphical profile of
the dynamic loading rate. Hence a more detailed picture of the shock absorption of
the whole landing phase can be assessed.
3.1.3 JOEVT KEVETICS AND ENERGETIC
Winter (1984) suggested that the joint moment of force, representing the net
rotatory effects of all forces on ajoint, to be the desired component to evaluate at the
joint. It enhance a better understanding on the mechanisms by which the acquired
kinetic energy is dissipated by muscular activities. Internal joint kinetic and energetic
on landing was studied by using the inverse dynamic analytical method. The joint
moments of force and muscles powers in the lower extremities are calculated from
the ground reaction force and arthropometric data of tested subjects. Devita & Skelly
(1992) examined the moments and powers during descent and floor contact phases.
Their results indicated that the impact phase was initiated by the knee extensor and
hip flexor moments. Initial work was performed by the eccentric work of the knee
extensors and the concentric work of hip flexor. The remainder of the impact phase
had extensor moments at eachjoint, all of them perform eccentrically and reduced the
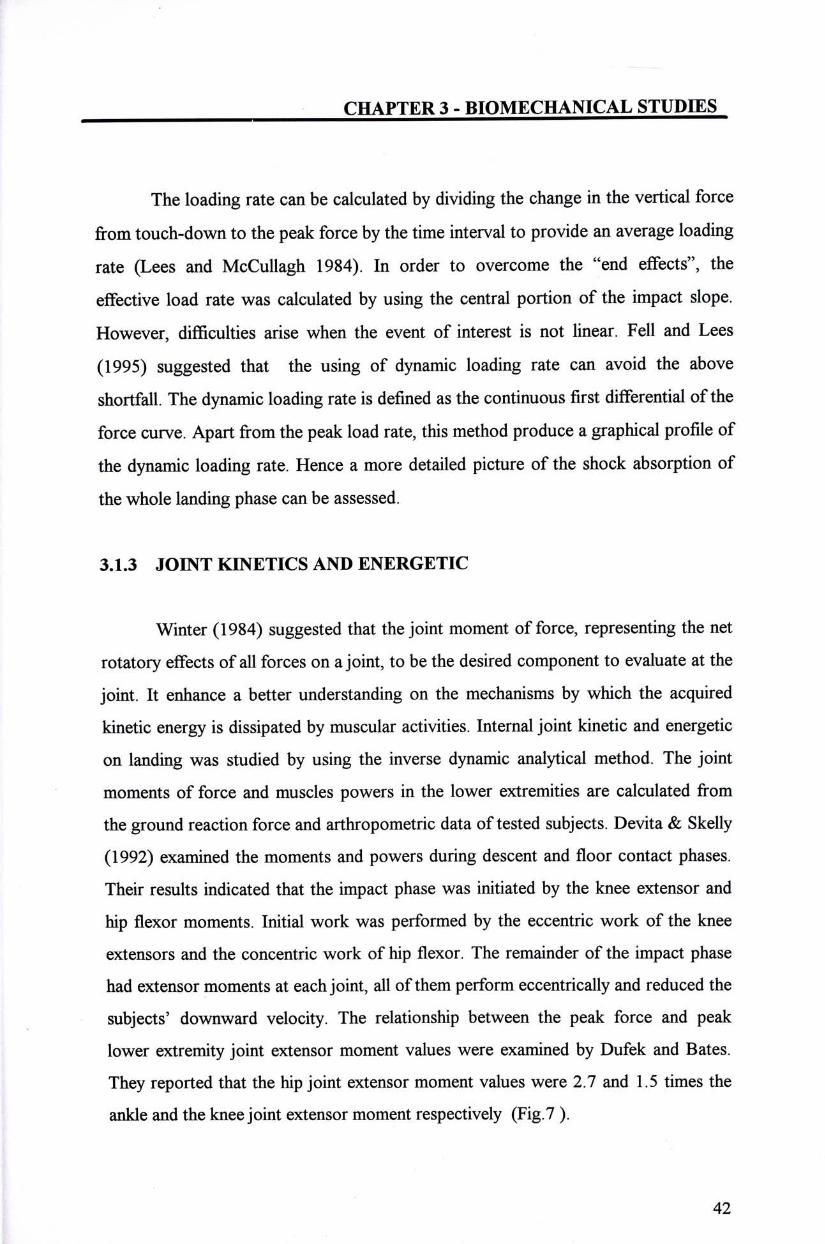
subjects' downward velocity. The relationship between the peak force and peak
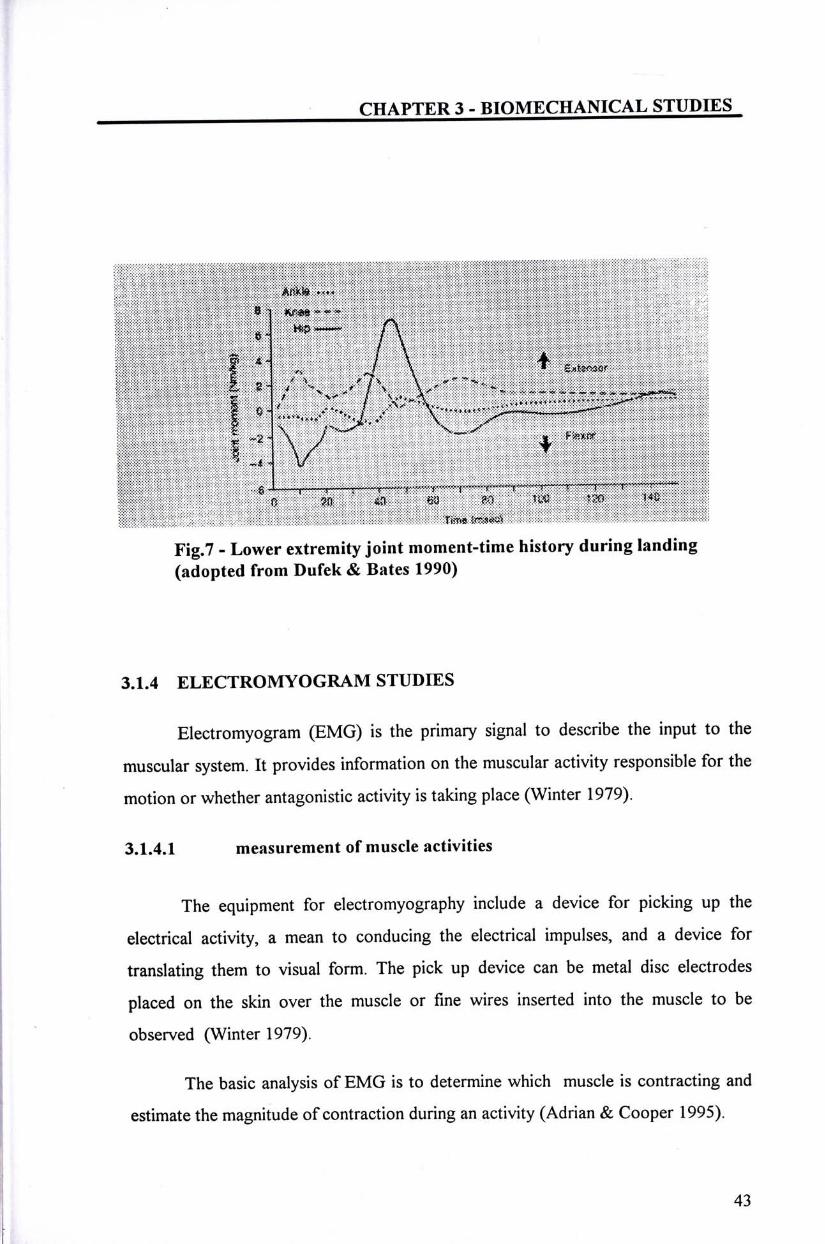
lower extremity joint extensor moment values were examined by Dufek and Bates.
They reported that the hip joint extensor moment values were 2.7 and 1.5 times the
ankle and the kneejoint extensor moment respectively (Fig.7 ).
42
CHAPTER 3 - BIOMECHANICAL STUDffiS
__画____||___1麵 8 ^¾¾: ¾^ -
势為_一 f \ \
f ^ .> J \ 令 紐 _ '
I ¢. / � � / 7 \ \ Z � � ' - � t : *" / ^ ^ ^ * i ^^. 1^ 、..一.—,办—<^^^.^jg,,i,^.9P'^ s / 、一 / k ' ^ A . ��+»<vM ><>+<> - ; ^ - ^ - - -I <…+…�"�Jy .义……二;^^^^一 I " 2 ’ \ 厂) � z , . F.x^ i . . V 令
轻 lrj_r,r.rLn ir_r rLTj-j-j-u- rfi -yinn 1 ‘ * y . Aj>jj •- . • ,, , • • •雾• • . • • “ •( •.- “ --.(…“ "•雾 ‘“ • -Vrf<"rfw"w%i.wAWyvyWAMWK
‘ 0 M � 4n m 船 n^i m ^¾ rj>r<s 5*,拟、
Fig.7 - Lower extremity joint moment-time history during landing (adopted from Dufek & Bates 1990)
3.1.4 ELECTROMYOGRAM STUDIES
Electromyogram (EMG) is the primary signal to describe the input to the
muscular system. It provides information on the muscular activity responsible for the
motion or whether antagonistic activity is taking place (Winter 1979).
3.1.4.1 measurement of muscle activities
The equipment for electromyography include a device for picking up the
electrical activity, a mean to conducing the electrical impulses, and a device for
translating them to visual form. The pick up device can be metal disc electrodes
placed on the skin over the muscle or fine wires inserted into the muscle to be
observed (Winter 1979).
The basic analysis of EMG is to determine which muscle is contracting and
estimate the magnitude of contraction during an activity (Adrian & Cooper 1995).
43
CHAPTER 3 - BIOMECHANICAL STUDffiS
Greenwood & Hopkins (1976) carried out a study to study the EMG activities in
lower limb muscles during an unexpected fall. Four subjects were suspended in a
parachute by a rope passing through freely running pulleys to a metal plate held by an
electromagnet. They were released from different height and landed on a landing
platform. E.M.G. activities were recorded using 8 mm silver-silver chloride surface
electrodes on the solus, tibialis anterior, hamstrings, and quadriceps femoris. They
found that if fall from sufficient height (50-120cm), the muscle activities of lower
limbs occurs before landing. Its timing is related to the timing of landing. They
suggested that this might be the activity concerned in the voluntary control of
landing.
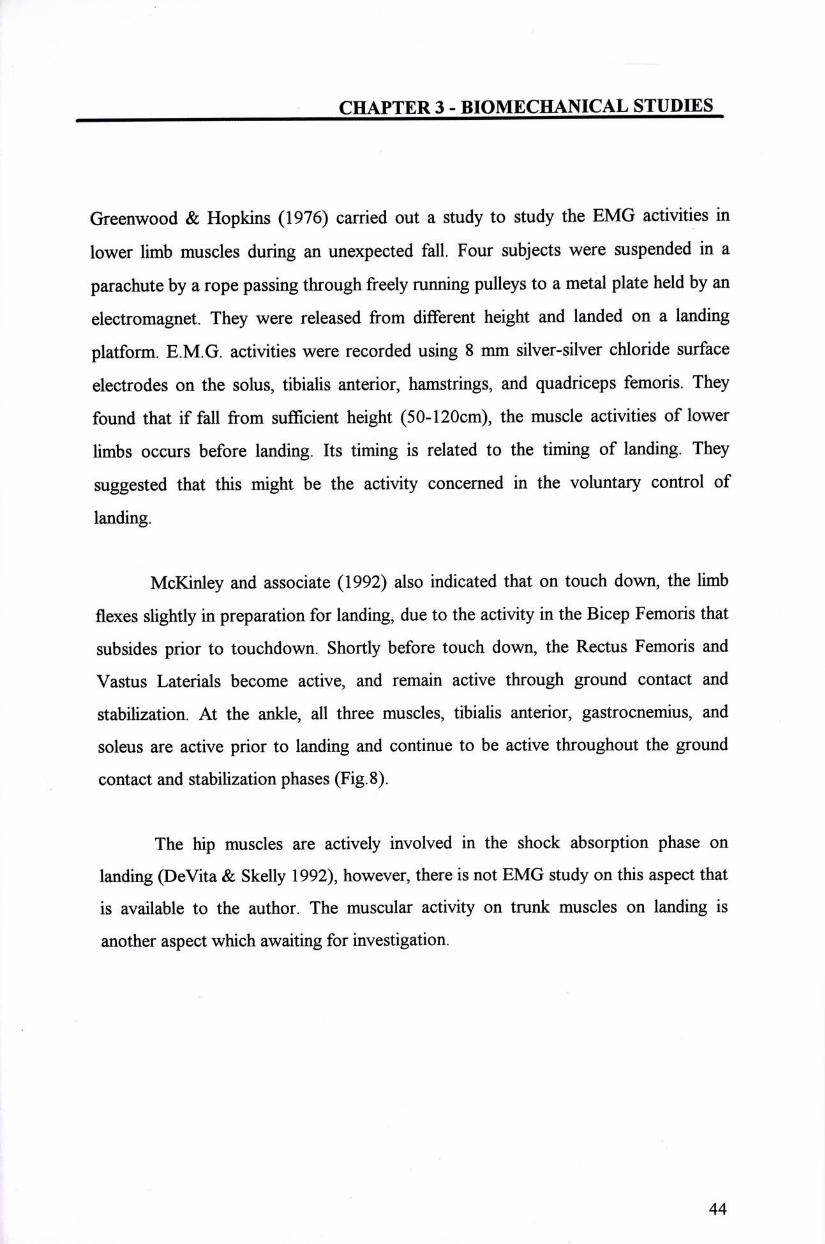
McKinley and associate (1992) also indicated that on touch down, the limb
flexes slightly in preparation for landing,due to the activity in the Bicep Femoris that
subsides prior to touchdown. Shortly before touch down, the Rectus Femoris and
Vastus Laterials become active, and remain active through ground contact and
stabilization. At the ankle, all three muscles, tibialis anterior,gastrocnemius, and
soleus are active prior to landing and continue to be active throughout the ground
contact and stabilization phases (Fig.8).
The hip muscles are actively involved in the shock absorption phase on
landing (DeVita & Skelly 1992), however, there is not EMG study on this aspect that
is available to the author. The muscular activity on trunk muscles on landing is
another aspect which awaiting for investigation.
44
CHAPTER 3 - BIOMECHANICAL STUDffiS
Take-off Touch-down
, ^jj)w_ .u^i^liiM.wAik...j>^.i ——
_i � . i i i ^ j L j ^ ^ ^ l i i i J l l l . i fci
• J . “ j y ) L . � “ - i M i i L ^ U • \
LiiikitA 参 uAu^ … . j f l t — � “ t^.“. • . …
E. “丄 ___jfe^k^^<AMjM^>*h__.~ *• _•_ 、二. ) o
Fig. 8 - EMG in volts for Vastus Lateralis (VL), Rectus Femoris (RF), Biceps Femoris (BF), Tibialis anterior (TA), Lateral gastrocnemius (GA) and Solus (SOL) (Adopted from McKiney & Pedotti 1992)
45
CHAPTER 3 - BIOMECHANICAL STUDffiS
3.2 BIOMECHANICAL STUDffiS ON BALLET JUMPS
Saute is a fundamental movement in ballet jumps. It is defined as a jump off
with both feet and landing with the feet in the same position (Wilson 1977). In ballet,
the first stage of landing from a jump (saute) involves placing toes and the ball of
the feet on the floor. Some dancers stop at this stage while others complete the jump
by placing the heel down. This is described as a toe-ball-heel style oflanding. In both
type oflandings,the jump is completed with the knee bend in demi-plie (Gans 1985).
Throughout the exercise, the leg is kept in a turn-out position with the back held
erect (Fig.9).
Turn-out is defined as a position with the lower extremity held in externally
rotated position.The heels are touching each other, with most of the movement
coming from the hip. Stephens (1988) suggested that the external rotation of the hip
joint accounted for 55-70 degree of turn-out. However, in the studies on the
musculoskeletal characteristics of the dancers, the amount of hip external rotation is
about 50 degree (Kravitz et al. 1986, Kirdendall et al 1984).
The back of the dancers are held in an erect position on landing. They keep
the movement of their torso and pelvic to a minimum.
46
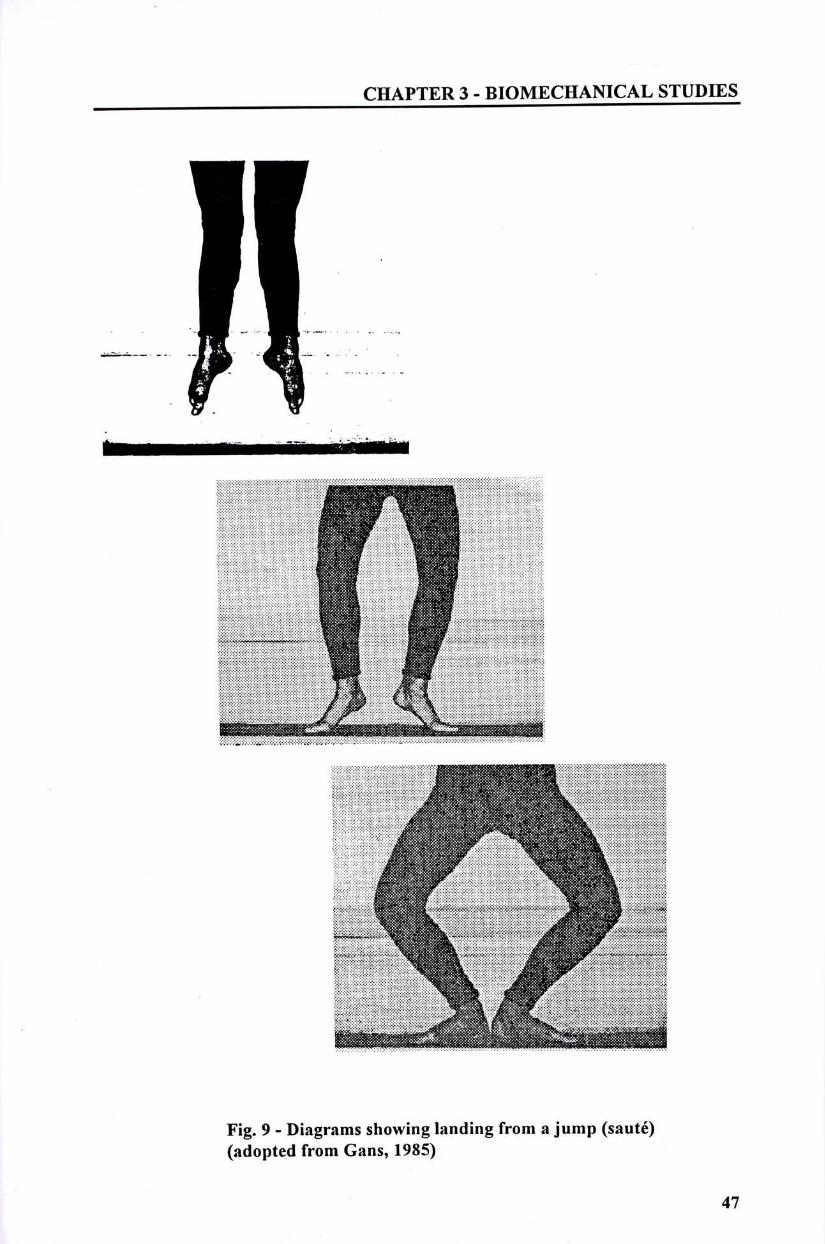
CHAPTER 3 - BIOMECHANICAL STUDffiS
T ^ •> ^^^H •• — •• ^^^ L ••»• ~«*»-' • , «•• s ..
ij-i.�.•_ V'sL. . .^^^w_^ — r , 1 _ m •••> W, » »«��» Vi «f» i < *W*VZ*.—V.:»-," g ftj P».-..>.....�....V.�.,..�...ggggg ggggy.V“-.V«��V.X ^ ^m ^ .
^ ^ g ^ jj gj j ;Say ! ^ [ gg ^ ^ | | jj gg jgjjggg g gggg ^
… J H L
. • , . : ft>^o<<<»t^’^<<<<<*x^^^^^^^^^^-.”?;>:.;L:.>:.r»:�:.5:.v:.:_:.:.:�:.:.>:,:.:.:.^^^^^^^^^^^^^pp?:>>>:�:,>>:��
- ' . n — ^ s ^ , ^ ^ ^ ^ ^ ^ ^ M i i
Fig. 9 - Diagrams showing landing from a jump (saute) (adopted from Gans, 1985)
4 7
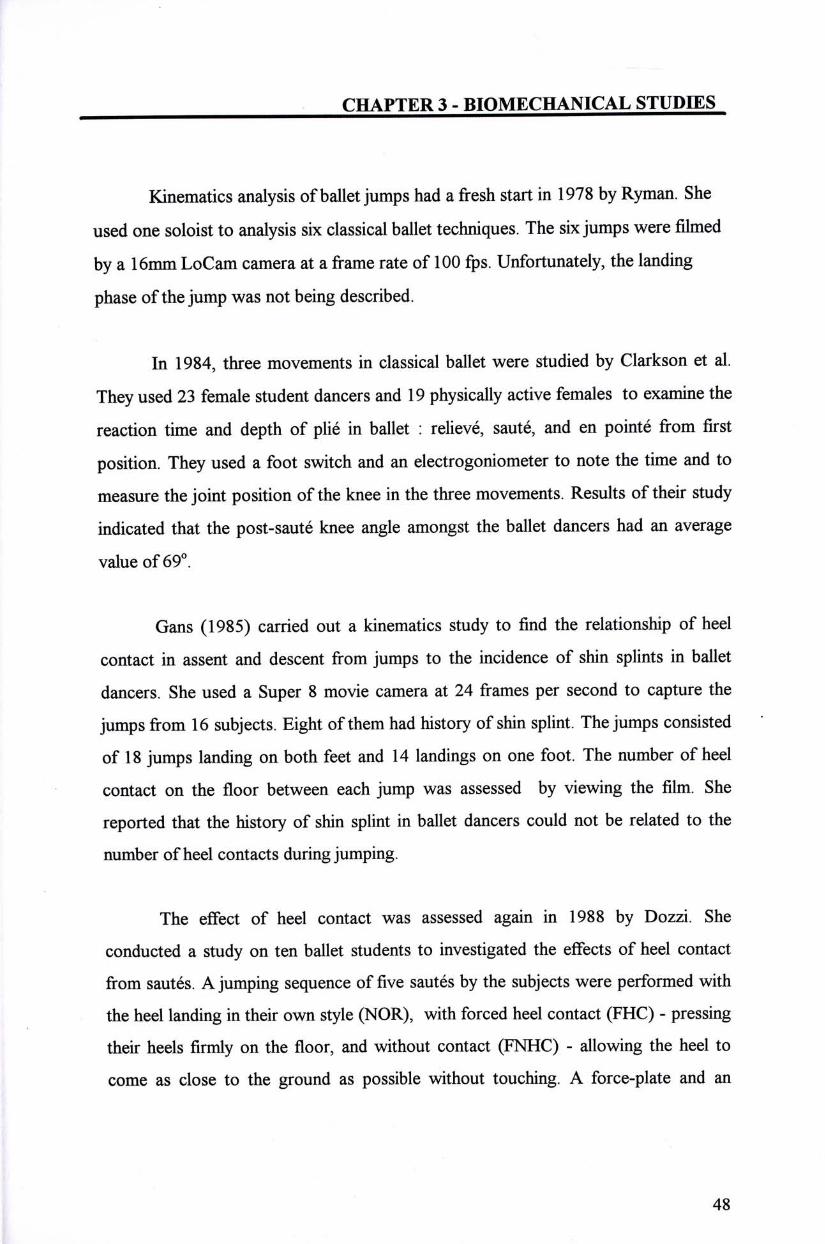
CHAPTER 3 - BIOMECHANICAL STUDffiS
Kinematics analysis ofballetjumps had a fresh start in 1978 by Ryman. She
used one soloist to analysis six classical ballet techniques. The six jumps were filmed
by a 16mm LoCam camera at a frame rate of 100 fps. Unfortunately, the landing
phase of the jump was not being described.
In 1984,three movements in classical ballet were studied by Clarkson et al.
They used 23 female student dancers and 19 physically active females to examine the
reaction time and depth of plie in ballet : relieve, saute, and en pointe from first
position. They used a foot switch and an electrogoniometer to note the time and to
measure the joint position of the knee in the three movements. Results oftheir study
indicated that the post-saute knee angle amongst the ballet dancers had an average
value of 69� .
Gans (1985) carried out a kinematics study to fmd the relationship of heel
contact in assent and descent from jumps to the incidence of shin splints in ballet
dancers. She used a Super 8 movie camera at 24 frames per second to capture the
jumps from 16 subjects. Eight of them had history of shin splint. The jumps consisted
of 18 jumps landing on both feet and 14 landings on one foot. The number of heel
contact on the floor between each jump was assessed by viewing the film. She
reported that the history of shin splint in ballet dancers could not be related to the
number ofheel contacts during jumping.
The effect of heel contact was assessed again in 1988 by Dozzi. She
conducted a study on ten ballet students to investigated the effects of heel contact
from sautes. A jumping sequence of five sautes by the subjects were performed with
the heel landing in their own style (NOR), with forced heel contact (FHC) - pressing
their heels firmly on the floor, and without contact (FNHC) - allowing the heel to
come as close to the ground as possible without touching. A force-plate and an
48
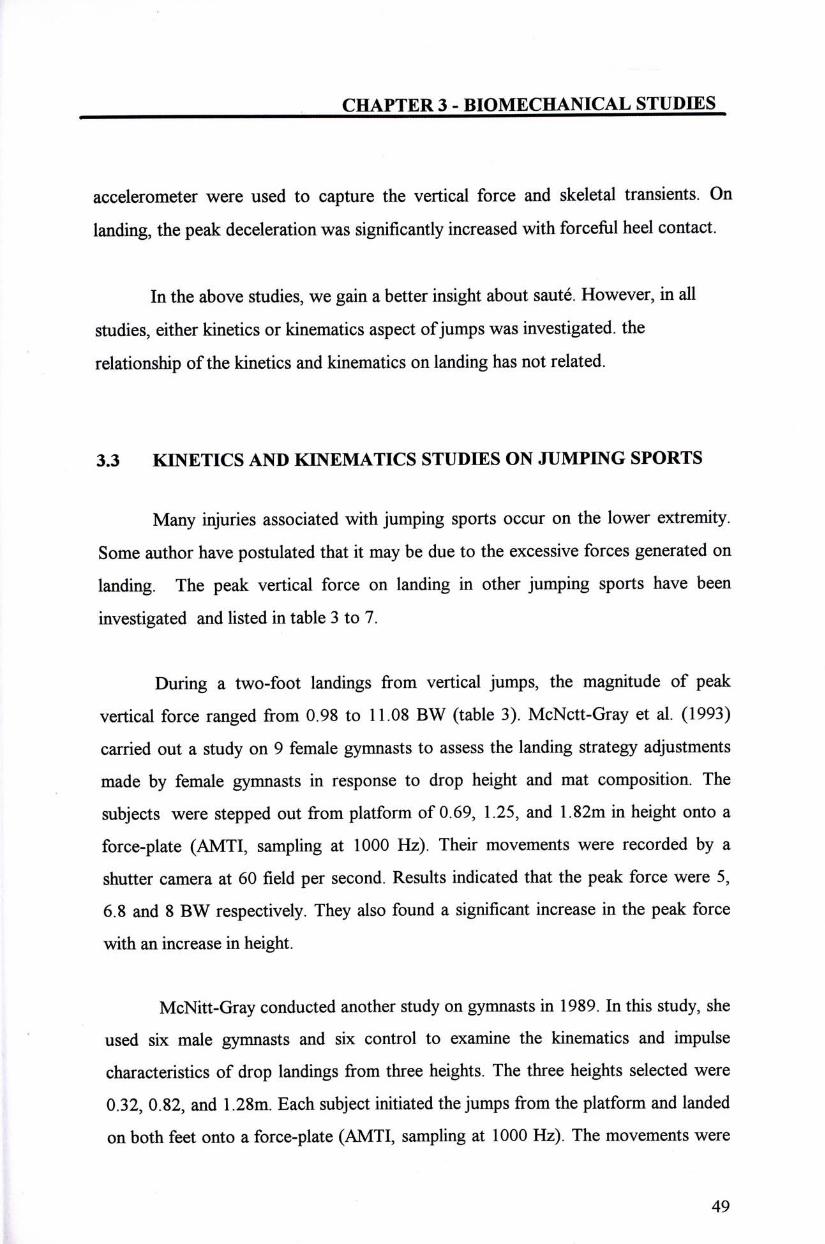
CHAPTER 3 - BIOMECHANICAL STUDffiS
accelerometer were used to capture the vertical force and skeletal transients. On
landing, the peak deceleration was significantly increased with forceful heel contact.
In the above studies, we gain a better insight about saute. However, in all
studies, either kinetics or kinematics aspect of jumps was investigated, the
relationship of the kinetics and kinematics on landing has not related.
3.3 KEVETICS AND KINEMATICS STUDffiS ON JUMPEVG SPORTS
Many injuries associated with jumping sports occur on the lower extremity.
Some author have postulated that it may be due to the excessive forces generated on
landing. The peak vertical force on landing in other jumping sports have been
investigated and listed in table 3 to 7.
During a two-foot landings from vertical jumps, the magnitude of peak
vertical force ranged from 0.98 to 11.08 BW (table 3). McNctt-Gray et al. (1993)
carried out a study on 9 female gymnasts to assess the landing strategy adjustments
made by female gymnasts in response to drop height and mat composition. The
subjects were stepped out from platform of 0.69, 1.25, and 1.82m in height onto a
force-plate (AMTI, sampling at 1000 Hz). Their movements were recorded by a
shutter camera at 60 field per second. Results indicated that the peak force were 5,
6.8 and 8 BW respectively. They also found a significant increase in the peak force
with an increase in height.
McNitt-Gray conducted another study on gymnasts in 1989. In this study, she
used six male gymnasts and six control to examine the kinematics and impulse
characteristics of drop landings from three heights. The three heights selected were
0.32, 0.82, and 1.28m. Each subject initiated the jumps from the platform and landed
on both feet onto a force-plate (AMTI, sampling at 1000 Hz). The movements were
49
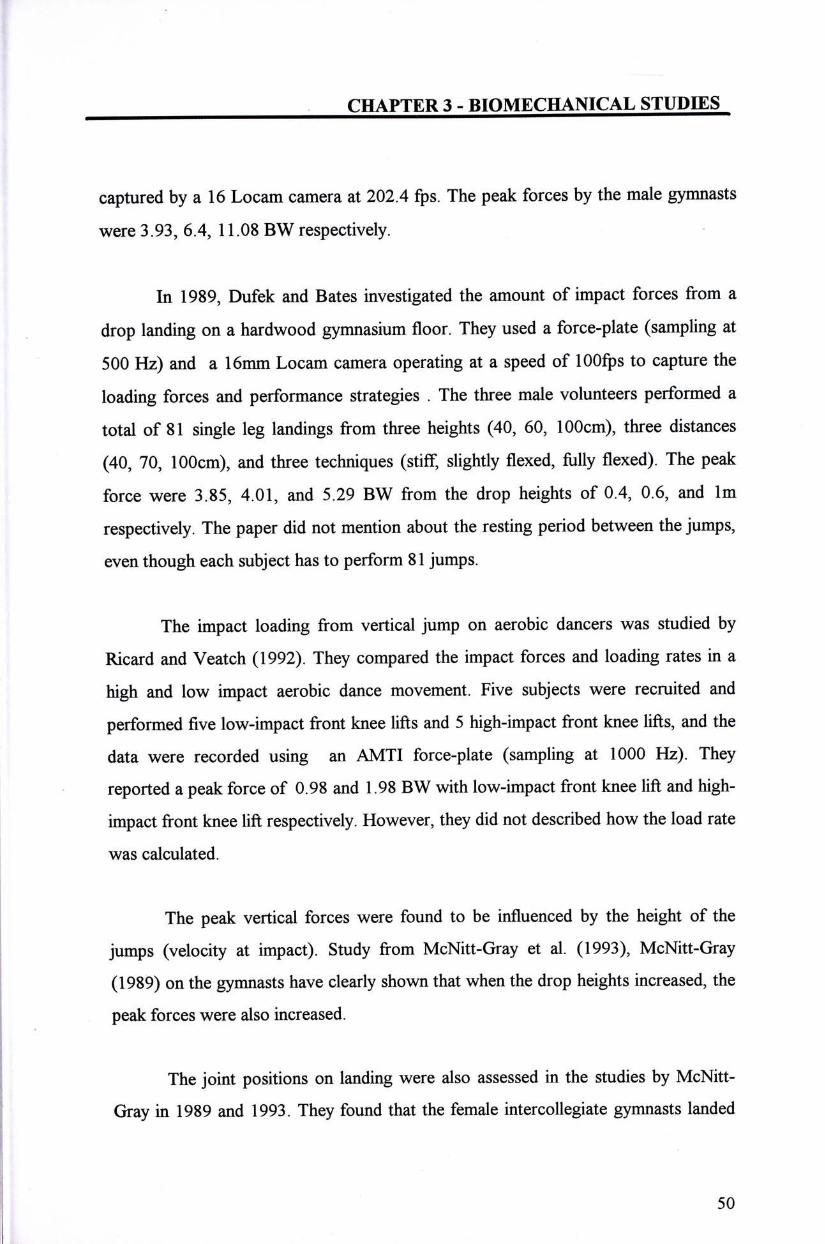
CHAPTER 3 - BIOMECHANICAL STUDffiS
captured by a 16 Locam camera at 202.4 fps. The peak forces by the male gymnasts
were 3.93,6.4,11.08 BW respectively.
In 1989,Dufek and Bates investigated the amount of impact forces from a
drop landing on a hardwood gymnasium floor. They used a force-plate (sampling at
500 Hz) and a 16mm Locam camera operating at a speed of lOOfps to capture the
loading forces and performance strategies . The three male volunteers performed a
total of 81 single leg landings from three heights (40,60,lOOcm), three distances
(40, 70, lOOcm), and three techniques (stiff, slightly flexed, fully flexed). The peak
force were 3.85, 4.01,and 5.29 BW from the drop heights of 0.4, 0.6, and lm
respectively. The paper did not mention about the resting period between the jumps,
even though each subject has to perform 81 jumps.
The impact loading from vertical jump on aerobic dancers was studied by
Ricard and Veatch (1992). They compared the impact forces and loading rates in a
high and low impact aerobic dance movement. Five subjects were recruited and
performed five low-impact front knee lifts and 5 high-impact front knee lifts, and the
data were recorded using an AMTI force-plate (sampling at 1000 Hz). They
reported a peak force of 0.98 and 1.98 BW with low-impact front knee lift and high-
impact front knee lift respectively. However, they did not described how the load rate
was calculated.
The peak vertical forces were found to be influenced by the height of the
jumps (velocity at impact). Study from McNitt-Gray et al. (1993), McNitt-Gray
(1989) on the gymnasts have clearly shown that when the drop heights increased, the
peak forces were also increased.
The joint positions on landing were also assessed in the studies by McNitt-
Gray in 1989 and 1993. They found that the female intercollegiate gymnasts landed
50
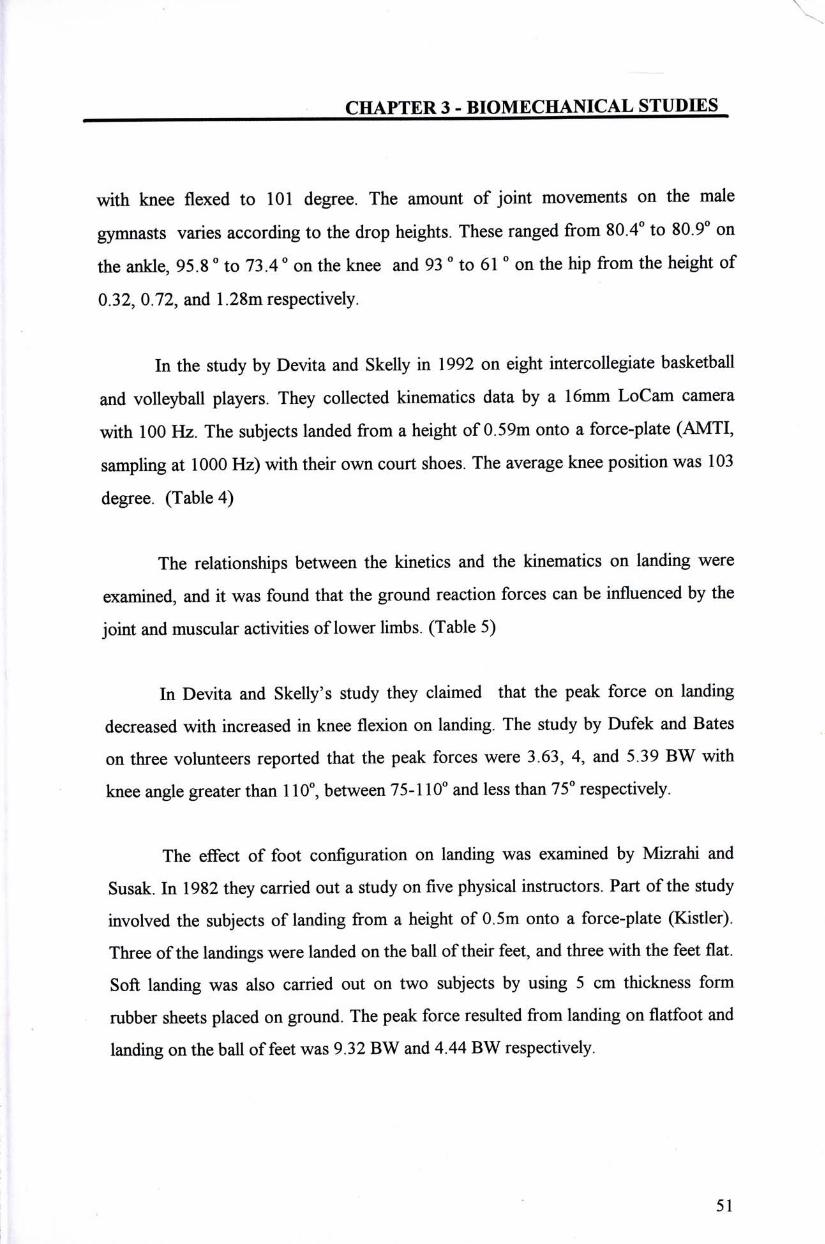
. \
\ �
CHAPTER 3 - BIOMECHANICAL STUDDES
with knee flexed to 101 degree. The amount of joint movements on the male
gymnasts varies according to the drop heights. These ranged from 8 0 . 4 � t o 8 0 . 9 � o n
the ankle, 95.8 ° to 7 3 . 4 � o n the knee and 93 ° to 61 ° on the hip from the height of
0.32,0.72,and 1.28m respectively.
In the study by Devita and Skelly in 1992 on eight intercollegiate basketball
and volleyball players. They collected kinematics data by a 16mm LoCam camera
with 100 Hz. The subjects landed from a height of 0.59m onto a force-plate (AMTI,
sampling at 1000 Hz) with their own court shoes. The average knee position was 103
degree. (Table 4)
The relationships between the kinetics and the kinematics on landing were
examined, and it was found that the ground reaction forces can be influenced by the
joint and muscular activities oflower limbs. (Table 5)
In Devita and Skelly,s study they claimed that the peak force on landing
decreased with increased in knee flexion on landing. The study by Dufek and Bates
on three volunteers reported that the peak forces were 3.63, 4, and 5.39 BW with
knee angle greater than 110°, between 75-110�and less than 75�respectively.
The effect of foot configuration on landing was examined by Mizrahi and
Susak. In 1982 they carried out a study on five physical instructors. Part of the study
involved the subjects of landing from a height of 0.5m onto a force-plate (Kistler).
Three of the landings were landed on the ball of their feet, and three with the feet flat.
Soft landing was also carried out on two subjects by using 5 cm thickness form
rubber sheets placed on ground. The peak force resulted from landing on flatfoot and
landing on the ball offeet was 9.32 BW and 4.44 BW respectively.
51
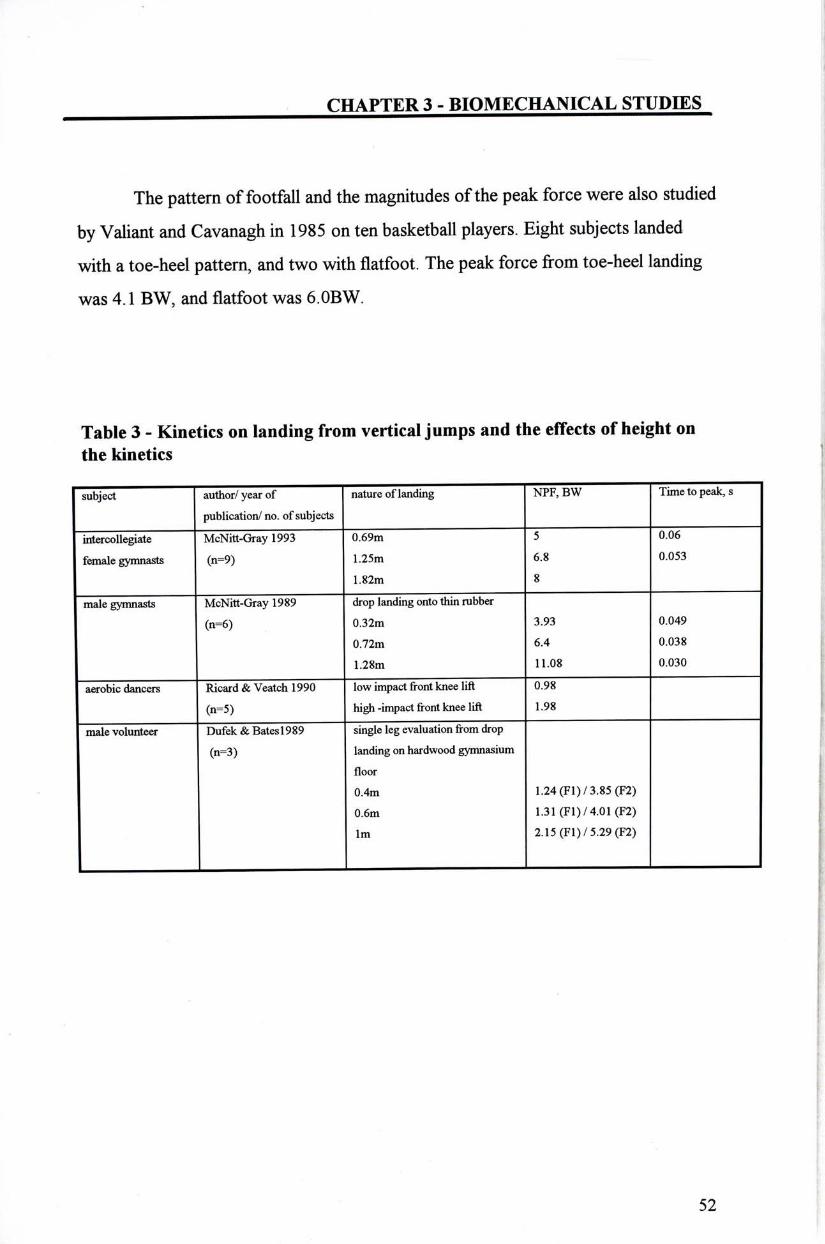
CHAPTER 3 - BIOMECHANICAL STUDffiS
The pattern offootfall and the magnitudes of the peak force were also studied
by Valiant and Cavanagh in 1985 on ten basketball players. Eight subjects landed
with a toe-heel pattern, and two with flatfoot. The peak force from toe-heel landing
was 4.1 BW, and flatfoot was 6.0BW.
Table 3 - Kinetics on landing from vertical jumps and the effects of height on the kinetics 1
subject author/yearof nature oflanding NPF,BW Time to peak, s
publicationy' no. of subjects
intercollegiate McNitt-Gray 1993 0.69m 5 0.06
female gymnasts (n=9) 1.25m 6.8 0.053
1.82m 8
male g y m n ^ McNitt-Gray 1989 drop landing onto thin rubber
(n=6) 0.32m 3.93 0.049
0.72m 6.4 0.038 '|>
1.28m 11.08 0.030
aerobic dancers Ricard & Veatch 1990 low impact front knee lift 0.98 [ (n=5) high -impact front knee lift 1.98 f
^^^ _ ____ ___^__ ^ ___,______^_ _^^__^^ _ _ !;• malevolunteer Dufek & Batesl989 single leg evaluation from drop !
(n=3) landing on hardwood gymnasium !•‘ I
floor
0.4m 1.24(Fl)/3.85(F2) ;
0.6m 1.31(Fl)/4.01(F2) |
lm 2.15(Fl)/5.29(F2) |:
52
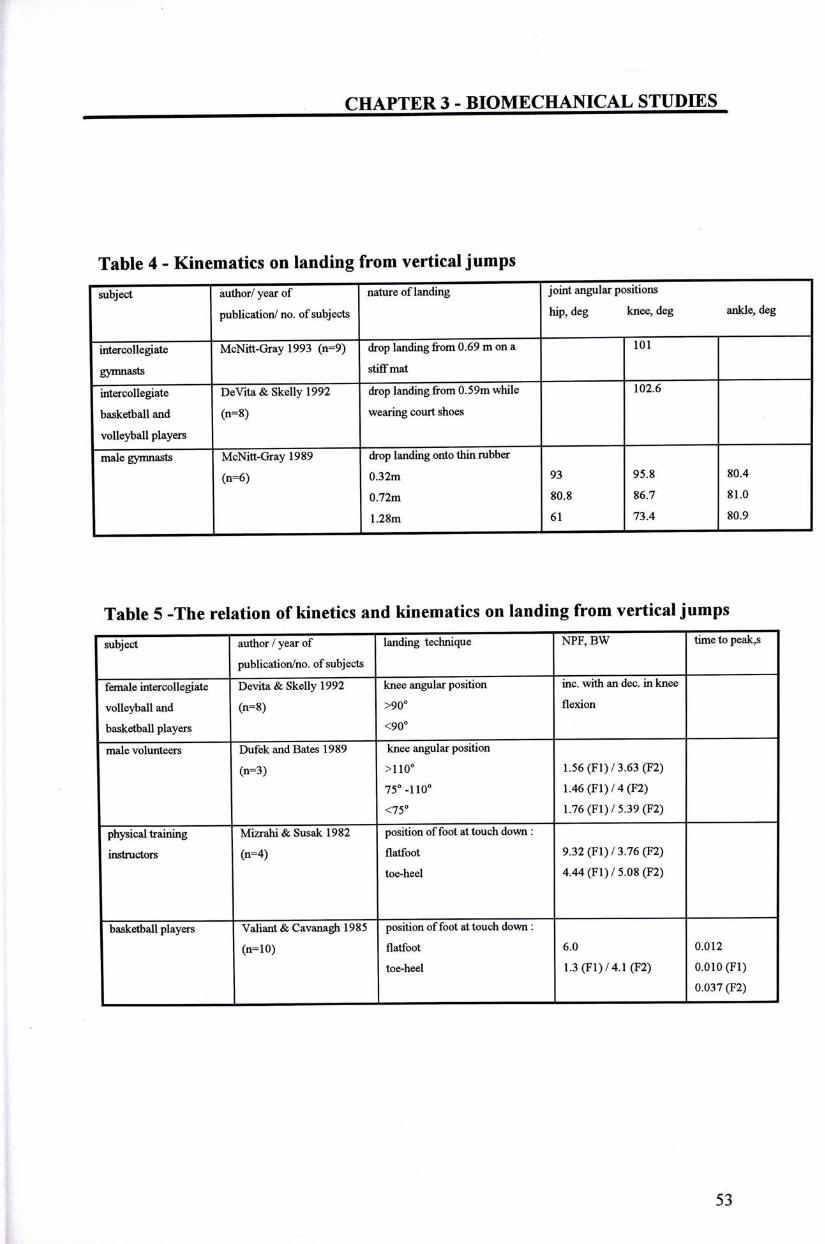
CHAPTER 3 - BIOMECHANICAL STUDffiS
Table 4 - Kinematics on landing from vertical jumps subject author/yearof nature oflanding joint angular positions
publication/no. ofsubjects hip,deg knee,deg ankk,deg
intercollegiate McNitt-Gray 1993 (n=9) drop landing from 0.69 m on a 101
gymnasts stifFmat
intercollegiate DeVita & Skelly 1992 drop landing from 0.59m while 102.6
basketball and (n=8) wearing court shoes
volleyball players
male g y m n ^ McNitt-Gray 1989 drop landing onto thin rubber
(n=6) 0.32m 93 95.8 80.4
0.72m 80.8 86.7 81.0
1.28m 61 73.4 80.9
Table 5 -The relation ofkinetics and kinematics on landing from verticaljumps subject author/yearof landing technique NPF, BW timetopeak,s
publicationMo. of subjects
female intercollegiate Devita & Skelly 1992 knee angular position inc. with an dec. in knee
volleyball and (n=8) >90� flexion
basketball players <90�
male volunteers Dufek and Bates 1989 knee angular position
(n=3) >110° 1.56 (Fl) /3.63 (F2)
75�-110° 1 .46(Fl) /4(F2)
<75� 1.76(Fl)/5.39(F2)
physicaltraining Mizrahi & Susak 1982 position of foot at touch down : instructors (n=4) flatfoot 9.32(Fl)/3.76(F2)
toe-heel 4.44(Fl)/5.08(F2)
basketball players Valiant & Cavanagh 1985 position of foot at touch down :
(n=10) flatfoot 6.0 0.012
toe-heel 1.3(Fl)/4.1 (F2) 0.010(F1)
0.037 (F2)
53
CHAPTER 3 - BIOMECHANICAL STUDffiS
The effects oflanding surface and footwear on the kinetice and kinematics are
more complex on landing from vertical jumps. Mizrahi and Susak (1982)
demonstrated that the forces on landing increased with an increase in the stiffness of
the mat on two physical instructors. Contrary to their findings, studies from McNitt-
Gray et al. (1993) and McKinley & Pedotti (1992) indicated that the trained
performers were able to maintain the peak forces when landing onto mat of different
stiffness. The similarity in peak force suggested that these athletes preferred to keep
the magnitude ofthe peak forces within a narrow range by changing the kinematics of
lower extrimities. Larger degrees of joint flexion on landing were observed on the
athleles over the knees and the ankles when landed on stiff mats (Table 6).
The effect of shod vs unshod situation has been successful in identifying its
effects on the ground reaction forces (Table 7). Steele and Milburn (1987) examined
the effects of 3 footwear conditions (Dunlop Super NB, Dunlop Jogaires, "ankle
safe" ankle support plus netball shoes) and barefoot on peak force. The average
maximum peak force reported for the bare-foot condition was 4.3BW across 15
subjects, which is 1.1 times greater than the average peak ground reaction force
across the 3 footwear conditions. The time to the peak force was significantly shorter
with barefoot than with the shoes. However, the peak force was not affect by the
different footwear conditions. McNair & Marshall (1993) postulated that the
performers might choose to alter their joint motions and muscle stiffness accordingly
so that the body can reacts to different shoe hardness with similar ground reaction
forces.
Contrary to this study were the studies from Kaelin et al. (1988) and StacofF
et al. (1987). Using a force-plate, Stacoff et al. captured the ground reaction force of
one player having two different types of shoes, and indicated that the peak force was
decreased by 30% with thicker sole shoe. Also using one volleyball player, Kaelin et
al. assessed the ground reaction force with the player wearing shoe and with
54
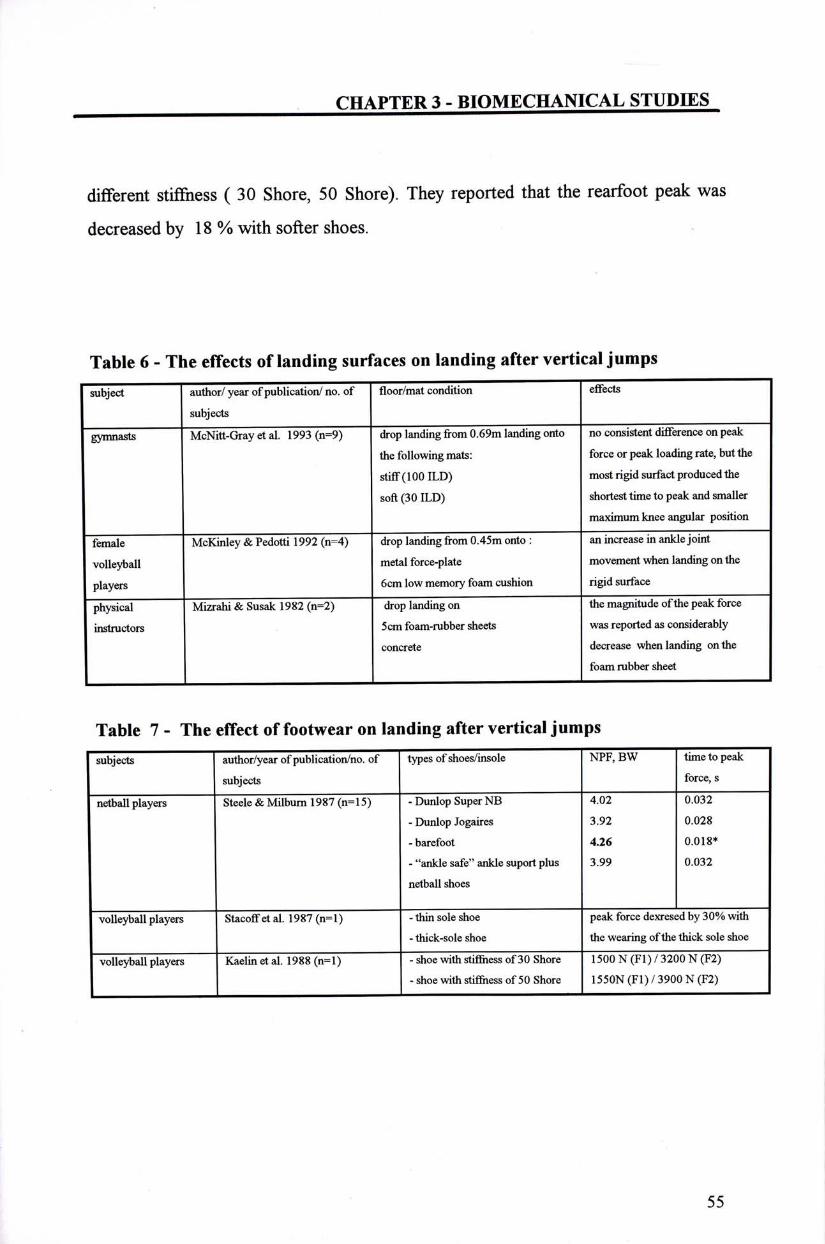
CHAPTER 3 - BIOMECHANICAL STUDffiS
different stiffness ( 30 Shore, 50 Shore). They reported that the rearfoot peak was
decreased by 18 % with softer shoes.
Table 6 - The effects oflanding surfaces on landing after vertical jumps subject author/ year of publication/ no. of floor/mat condition effects
subjects
gymnasts McNitt-Gray et al. 1993 (n=9) drop landing from 0.69m landing onto no consistent difference on peak the following mats: force or peak loading rate, but the
stiff (100 ILD) most rigid surfact produced the
soft (3 0 ILD) shortest time to peak and smaller
maximum knee angular position
female McKinley & Pedotti 1992 (n=4) drop landing from 0.45m onto : an increase in anklejoint
volleyball metal force-plate movement when landing on the
players 6cm low memory foam cushion rigid surface
physical Mizrahi & Susak 1982 (n=2) drop landing on the magnitude of the peak force
instructors 5cm foam-rubber sheets was reported as considerably concrete decrease when landing onthe
foam rubber sheet
Table 7 - The effect offootwear on landing after vertical jumps subjects author/year ofpublication/no. o f " " types of shoes/insole NPF, BW timetopeak
subjects force,s
netballplayers Steele & Milbum 1987 (n=15) -DuniopSuperNB 4.02 0.032
-Dunlop Jogaires 3.92 0.028
-barefoot 4.26 0.018*
-"ankle safe" ankle suport plus 3.99 0.032
netball shoes
volleyball players StacofFet al. 1987 (n=l) _thinsoleshoe peak force dexresed by 30% with
-thick-sole shoe the wearing of the thick sole shoe
volleyball players Kaelinetal. 1988 (n=l) - shoe with stiffiiess of30 Shore 1500N(F1)/3200N(F2) -shoe with stiffiiess of50 Shore 1550N (F1) / 3900 N (F2)
55
CHAPTER 3 - BIOMECHANICAL STUDffiS
In summary, the magnitude of the ground reaction on landing from vertical
jumps was found to be influenced by the landing techniques and thejumping height.
The effects oflanding surfaces and footwear might altered the landing kinematics on
landing. The landing techniques which affected the impact loading forces are body
configurations during and after touch-down.
The kinematics and kinetics results from the gymnastic and other jumping
sports cannot be generalized to the ballet dancers. The main reasons are the aesthetic
requirement on the dancers and their unique posture during the movement. The
dancers are required to keep their trunk erect and maintain the lower leg in a turn-out
position during execution of the movement. Similar to the ballet dancers, aesthetics
is a major pursue by the gymnasts during their activity. Both activities are replete
with landings. However, the gymnastics land from dismounting from apparatus and
the ballet dancers land from vertical jumps from the floor. The volleyball are games
demanding sudden and explosive changes in direction, and is a limited contact sport.
Landing after a block should be on both feet, flexion occurs in the hips, the knees,
and the ankles. Jumping for height is substantial for the basketball players. They can
use their upper extremity and their trunk to increase their jumping height, and there is
no restriction on the way they land. Furthermore, the basketball and the volleyball are
team sports, there is not control on the position of the players during the game.
Collision or stepping on other players are common in these sports.
56
CHAPTER 3 - BIOMECHANICAL STUDffiS
3.4 EMPLICATION TO THIS STUDY
From the reviews on jumping kinetics and kinematics on ballet, we gain a
better insight about saute. However, in all studies, either kinetics or kinematics aspect
ofjumps was investigated, the relationship of the kinetics and kinematics on landing
has not related. The unique aesthetic requirements and postures of the ballet dancers
on landing are different to otherjumping sports, the results of studies from gymnasts,
volleyball, basketball and netball players, cannot be generalized on the ballet dancers.
Hence, there is a need to carry out study on the ballet dancers to understand the
biomechanical changes on landing from vertical jumps amongst this special group of
athletes.
Video-based motion analysis will be used to capture the image of the
movement. The system is chosen because several joint motions will be analysed
simultaneously. This off-cable device will not affect the performance of the tested
movement.
The positions of the hip, the knee, the ankle and the trunk will be recorded.
The angular positions of the joints are calculated by PEAK Performance
Technologies Motion Measurement System (Peak Performance Technologies, Inc.
U.S.A).
A force-plate (Advanced Mechanical Technology, Inc. U.S.A ), sampling at
500 Hz, will be used to captured the kinetic datas. The system measures the vertical
ground reaction force (Newton). The landing phase will be defined as the time
interval from impact to when the body stabilize (lBW)
57
CHAPTER 4 - MATERIALS AND METHOD
CHAPTER 4 MATERIALS AND METHOD
4.1 STUDY DESIGN
It is a within subject repeated measured design
4.2 SUBJECT AND SAMPLEVG METHOD
Eighteen female ballet students aging from 18 to 25, from the Hong Kong
Academy for Performing Arts volunteered to serve as subjects. The Academy is the
only institute in Hong Kong providing full time ballet training�The subjects in this
study had received full time ballet training at the advanced level at the academy ( all
of them had two or more years of full-time training ). The selection of this group of
students was to ensure that they had a good control of ballet techniques. Female
students were chosen because this was the larger group for the chosen level.
Exclusion criteria were as follow:
1. History of trauma to their back or lower limb with residue pain at the time of
the test
2. Presence ofpain or discomfort which caused an absent from class for one
day prior to the test.
Subjects satisfying the selection criteria were included in the study. Two
subjects were excluded from the study. One subject had persistence pain
58

CHAPTER 4 - MATERIALS AND METHOD
over the metatarsaljoints ofher (L) foot; and one felt dizziness on the test
day. One student declined to participate.
59
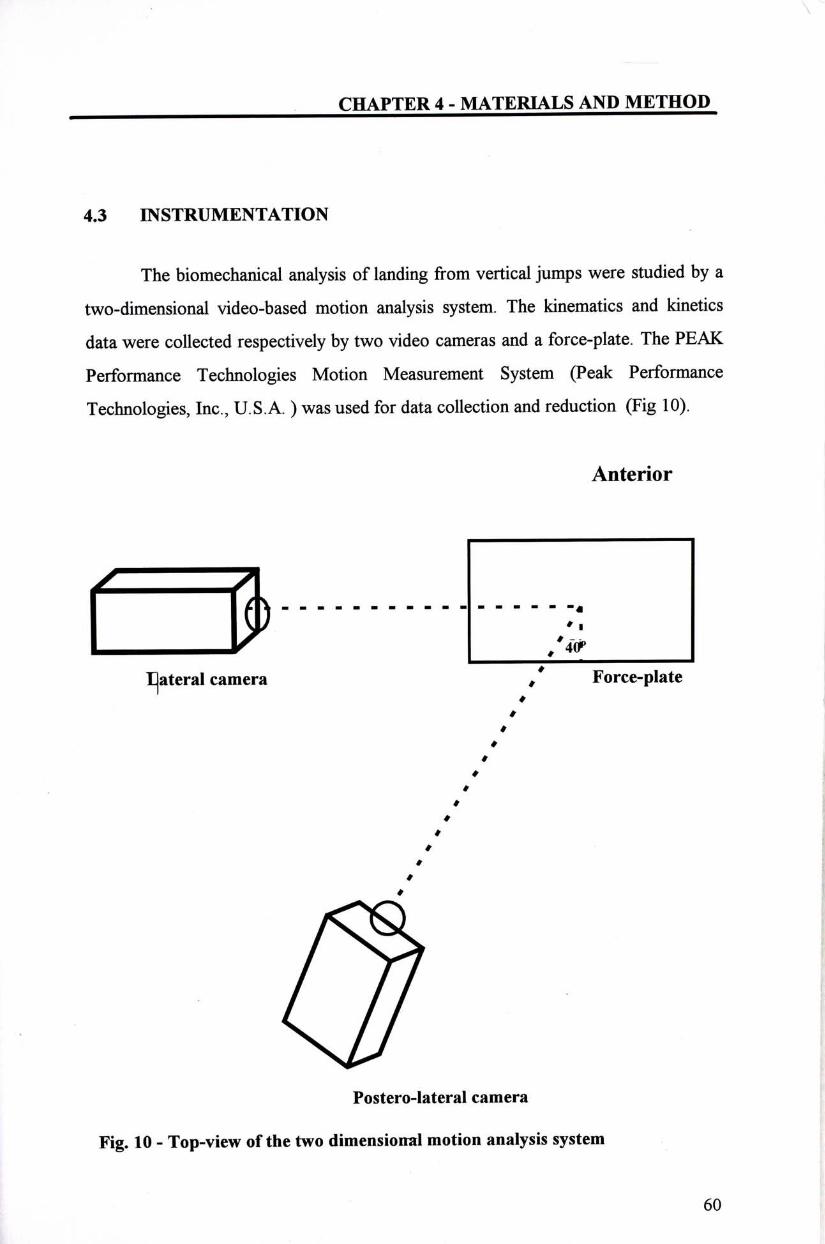
CHAPTER 4 - MATERIALS AND METHOD
4.3 EVSTRUMENTATION
The biomechanical analysis of landing from vertical jumps were studied by a
two-dimensional video-based motion analysis system. The kinematics and kinetics
data were collected respectively by two video cameras and a force-plate. The PEAK
Performance Technologies Motion Measurement System (Peak Performance
Technologies, Inc., U.S.A. ) was used for data collection and reduction (Fig 10).
!
Anterior
/ A f |P ;:
K / 4 c r L|ateral camera / Force-plate
# #
# •
# #
# #
a" Postero-lateral camera
Fig. 10 - Top-view of the two dimensional motion analysis system
60
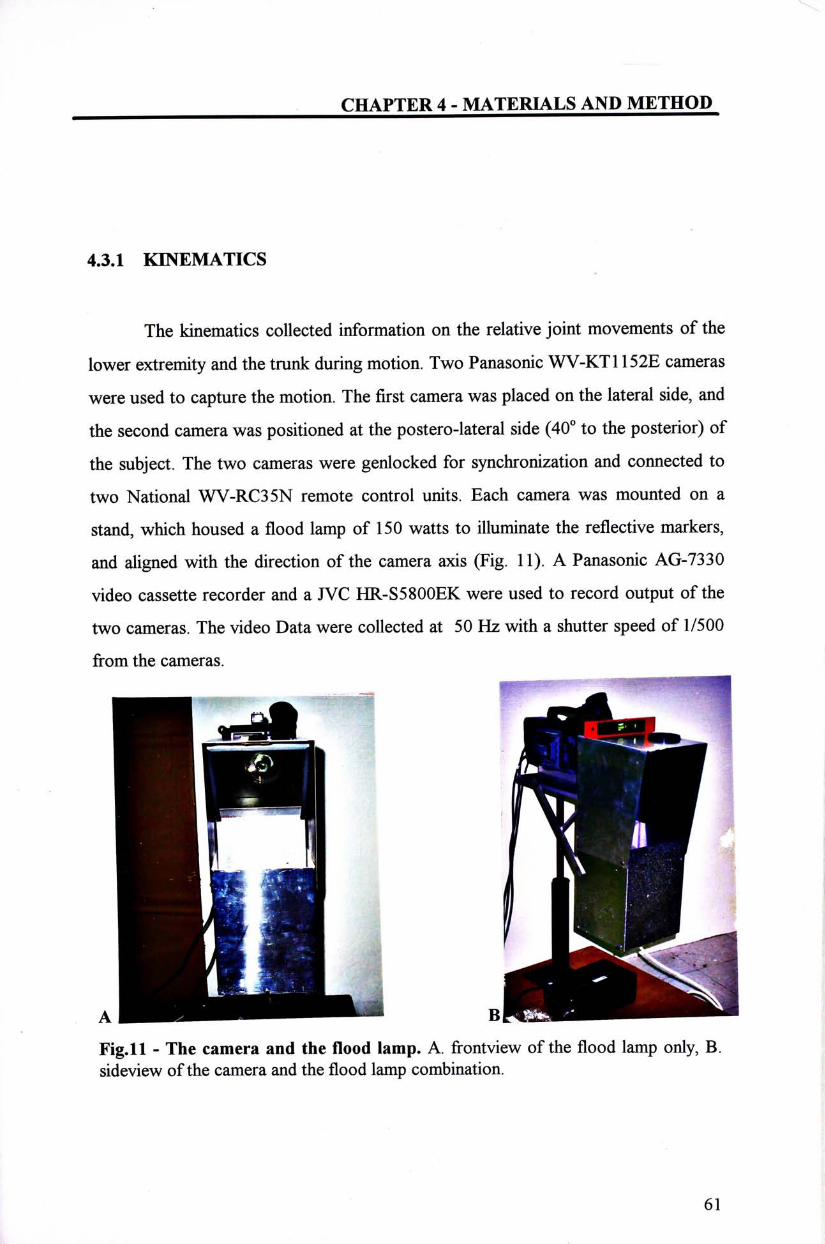
CHAPTER 4 - MATERIALS AND METHOD
4.3.1 KEVEMATICS
The kinematics collected information on the relative joint movements of the
lower extremity and the trunk during motion. Two Panasonic WV-KT1152E cameras
were used to capture the motion. The first camera was placed on the lateral side, and
the second camera was positioned at the postero-lateral side (40° to the posterior) of
the subject. The two cameras were genlocked for synchronization and connected to
two National WV-RC35N remote control units. Each camera was mounted on a
stand, which housed a flood lamp of 150 watts to illuminate the reflective markers,
and aligned with the direction of the camera axis (Fig. 11). A Panasonic AG-7330
video cassette recorder and a JVG HR-S5800EK were used to record output of the
two cameras. The video Data were collected at 50 Hz with a shutter speed of 1/500
from the cameras. ., .-.-….::-::.’年-、‘-/,-. . ...--m M • - .. - V
H ^ l J H b
M K Fig.ll - The camera and the flood lamp. A. frontview of the flood lamp only, B. sideview of the camera and the flood lamp combination.
6 1
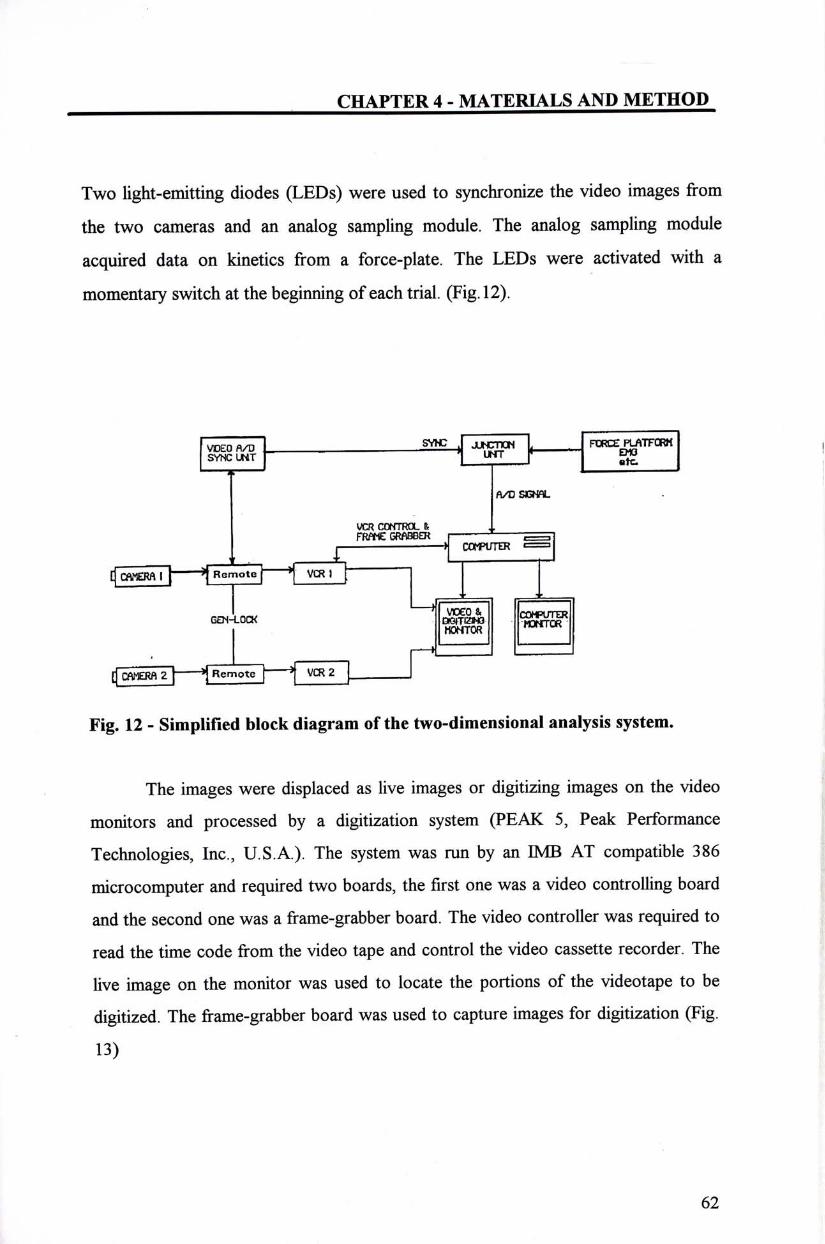
CHAPTER 4 - MATERIALS AND METHOD
Two light-emitting diodes (LEDs) were used to synchronize the video images from
the two cameras and an analog sampling module. The analog sampling module
acquired data on kinetics from a force-plate. The LEDs were activated with a
momentary switch at the beginning of each trial. (Fig.l2).
^ ^ q l T \——p^^^ I " Tp"" ^ ^ " " "•• ^ ^ "'•'•*"*'
fl/DSJGNflL
VCR COfTROL fc .. FW*CGRABBER :=H j~~— > COMFVTER = [CflMERft I ] fRernote * VCR \ :
• 咖 jK] 1 3 — »
I ^ ^ " [CfltCRfl 2] * Remote ^ VCR 2
Fig. 12 - Simplified block diagram of the two-dimensional analysis system.
The images were displaced as live images or digitizing images on the video
monitors and processed by a digitization system (PEAK 5, Peak Performance
Technologies, Inc., U.S.A.). The system was run by an JMB AT compatible 386
microcomputer and required two boards, the first one was a video controlling board
and the second one was a frame-grabber board. The video controller was required to
read the time code from the video tape and control the video cassette recorder. The
live image on the monitor was used to locate the portions of the videotape to be
digitized. The frame-grabber board was used to capture images for digitization (Fig.
13)
62

CHAPTER 4 - MATERIALS AND METHOD
T ^ j ^ ^ ^ L 1 u H ^ ^ ^ ^ ^ ^ ^ H B W * H b i f l ^ ^ 6 ^ ^ ^ ^ ^ ^ B S ^ ^ l ^ i n | • … ‘ - - . III1
K ^ ^ ^ ^ ^ m to^^^j^^^^9i
BSB I Fig. 13 - The PEAK 5 system used for data collection and data reduction
Passive reflective marker system was used to locate anatomical landmarks.
The markers were light-weight spherical of 1 cm in diameter and covered by 3M
reflective tapes. Markers were attached onto body landmarks by double adhesive
tapes. Light was projected from the direction of the cameras and illuminated the
markers (Photol).
63
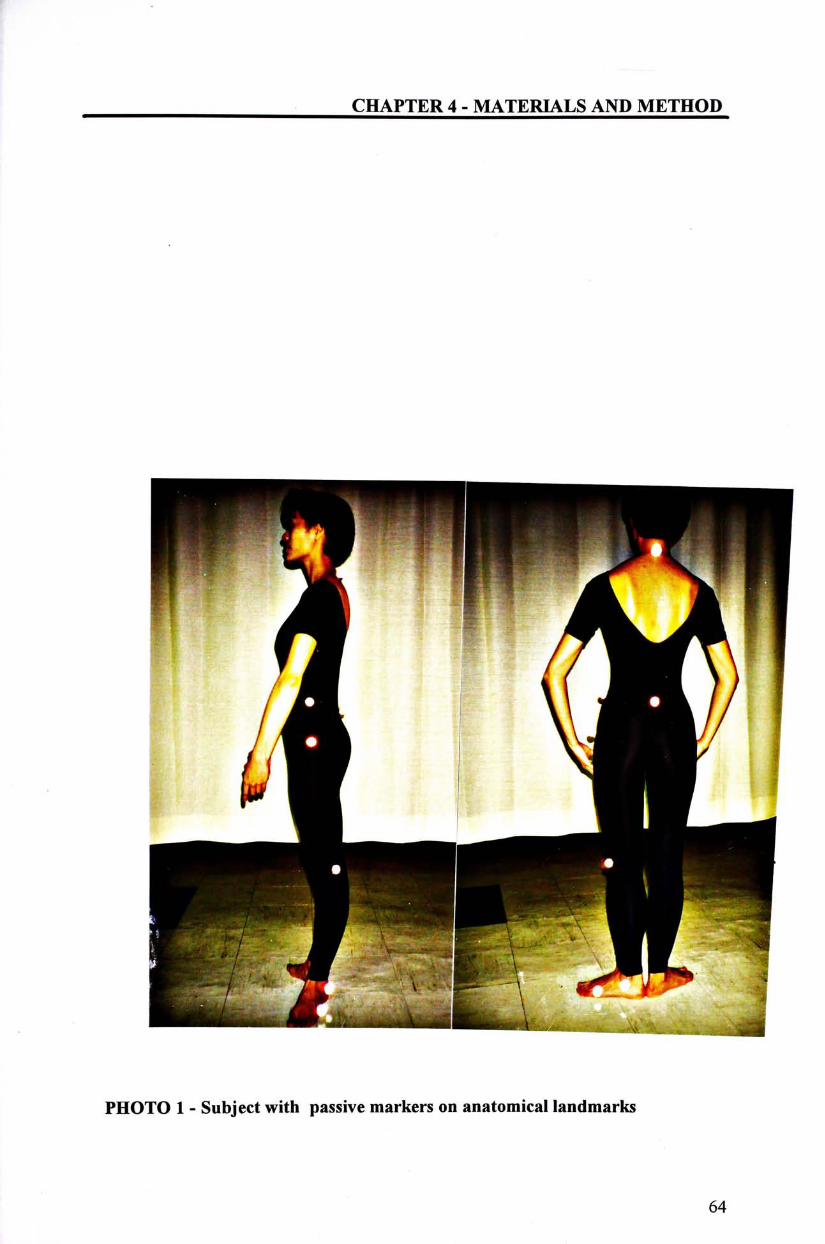
CHAPTER 4 - MATERIALS AND METHOD
H ^ ^ ^ V ^ ^ H H H H R H H f f ^ BB^S
PHOTO 1 - Subject with passive markers on anatomical landmarks
64
CHAPTER 4 - MATERIALS AND METHOD
The 2-D coordinates on the images could be located by digitization using one of the
following three methods. During manual acquisition a colored cursor was
superimposed over the video image. Its position was controlled by a hand-held
mouse. The process was repeated on each marker for each video field in the
movement sequence. With the semi-automatic method, the position of the markers
were predicted by their previous locations. The operator was able to fine-tune the
location if required. The automatic method was the fastest in capturing the data, and
processed better precision and accuracy than the manual digitization ( Scheirman &
Cheetham 1990). The subject was fitted with markers that contrast with the
background. The center of area of each marker was calculated automatically by the
computer and tracked for each video field in the movement sequence.
4.3.2 KEVETICS
The kinetics dealt with the forces exerted on the ground-foot interface on
landing by a force-plate. The force-plate used in this study was produced by
Advanced Mechanical Technology (AMTI), Inc. U.S.A.. The AMTI biomechanical
force-plate was embedded in the floor of the Human Locomotion Laboratory, the
Hong Kong Polytechnic University, with its surface leveled with the floor of the
laboratory.
The AMTI force-plate was a stiff, flat metallic plate, measured 0.46 m by
0.5 m (Fig. 14). The plate was supported at four corners by pylons consisted of strain-
gauge force transducers. The three dimensional forces applied on the pylons was
measured and amplified by a AMTI SGA strain gauge amplifier. The signals were
interfaced with a JBM AT compatible 386 microcomputer through a Data Translation
DT2801A analog to digital converter. This was a sixteen channel analog to digital
conversion board which collected data from the force-plate and converted it to a
digital format for the computer. The user can select sampling frequency, and
65
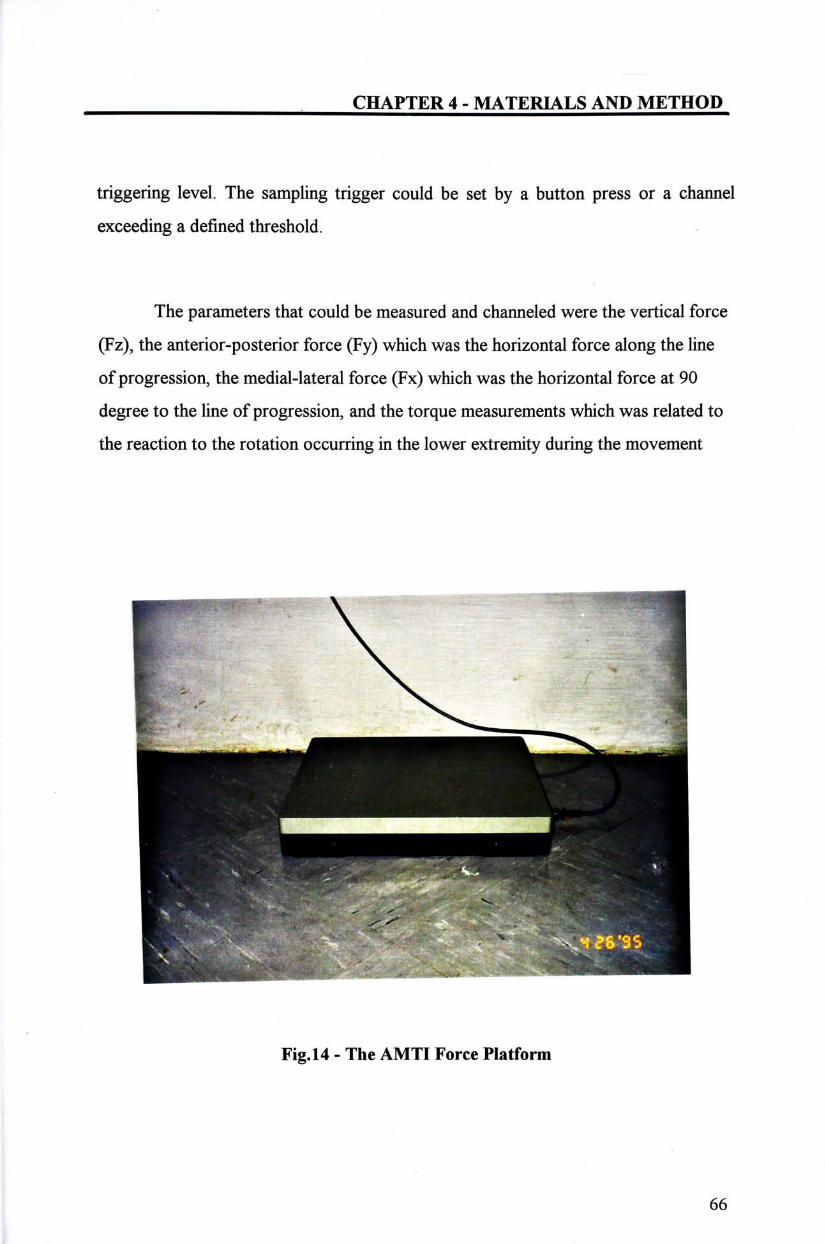
CHAPTER 4 - MATERIALS AND METHOD
triggering level. The sampling trigger could be set by a button press or a channel
exceeding a defined threshold.
The parameters that could be measured and channeled were the vertical force
(Fz), the anterior-posterior force (Fy) which was the horizontal force along the line
of progression, the medial-lateral force (Fx) which was the horizontal force at 90
degree to the line of progression, and the torque measurements which was related to
the reaction to the rotation occurring in the lower extremity during the movement
r V I i ^ ^ ^ ^ ^ ^ ^ ^ ^ ^ ^ l ^ ^ ^ ^ ^ ^ ^ ^ ^ ^ ^ ^ ^ ^ ^ ^ ^ ^ ^ ^ ^ j
^ ^ ^ ^ ^ ^ ^ ^ ^ ^ ^ H
醒-,丨_ Fig.l4 - The AMTI Force Platform
66
CHAPTER 4 - MATERIALS AND METHOD
4.3.3 ACCURACY OF EVSTRUMENTS
4.3.3.1. Accuracy of the PEAK Performance Technology Motion
Measurement System
The performance of the PEAK Performance Technology Motion
Measurement was found to be a reliable angular measuring tool. The system was
assessed in two dimensional static tests ( Scheirman & Cheetham 1990) and in three
dimensional dynamic angular tests ( Scholz & Millford 1993) by measuring its
precision and accuracy.
Scheirman and co-worker assessed the performance of the system by
ascertaining the system precision and system accuracy. They video-taped 16 markers
with 12 different lengths of distance between them. The distance between markers
ranged from 0.15 m to 0.5 m. The system precision was defined as the degree of
mutual agreement among repeated observation made under identical conditions. They
reported that the precision for manual digitization was 1 in 2411 and for automatic
digitization, 1 in 5280. The accuracy ( i.e. degree of agreement between individual
measurements and accepted reference values ) for manual digitization was found to
be 1 in 3267 and for automatic digitization, 1 in 4310.
Scholz and Millford assessed the system precision and accuracy by video-
taped pendular motion of a bar of 11.55 m long with 18 retroreflective markers. A
total of32 angles between the markers were assessed at three different orientation to
the cameras. ( parallel, rotated 30�right and left). The angles covered a range of3 to
132.6 degrees. Intraclass correlation coefficients (ICCs) were calculated between
trials within each orientation and across different orientations to determine system
precision, and between randomly selected trials and actual angles to determined
accuracy. The result indicated that the mean angles for each trial were extremely
67
CHAPTER 4 - MATERIALS AND METHOD
consistent from trial to trial (ICCs greater than 0.99). Deviation from the actual angle
averaged 0.0-0.8�across all orientations and angles.
However, a direct application of results from the two studies could not be
made to the present study. The present study was a two 2-D motion analysis using
the PEAK Technologies Motion Analysis System to analysis the angular displacement
of the joints over the lower extremity and the trunk. Furthermore, the lighting
situation, the types of camera used, the distances from the subject, and the field of
view would differ from these studies. A test to evaluate the system accuracy of the
instrument and to ascertain the position of the camera was carried out in a condition
that would be used in the actual study.
Passive reflexive markers were placed on four anatomical landmarks on a
subject: 1) the highest point on the iliac crest; 2) the greater trochanter of femur; 3)
the lateral joint line of the kneejoint; 4) the tip of lateral malleolus. The subject stood
on the force-plate, and positioned the lower extremity in her comfortable first
position. The joint angle of the hip and the knee were measured using a standard
goniometer in three positions ( full squat, half squat, up-right). The image of the
subject in these three position were video-taped with the camera set at postero-lateral
aspect (40° to the posterior) of the subject. The image was digitized and the joint
angle were calculated by the system. Three readings were taken in each position, and
the means were computed and compared. The accuracy was determined by
computing the root mean square error (RMSE) between the six measurements. It
exhibited an error of 2 °. Judging from this result, the system was accurate enough
with the camera set at the above position for this study. Results were tabulated in the
table 8.
68
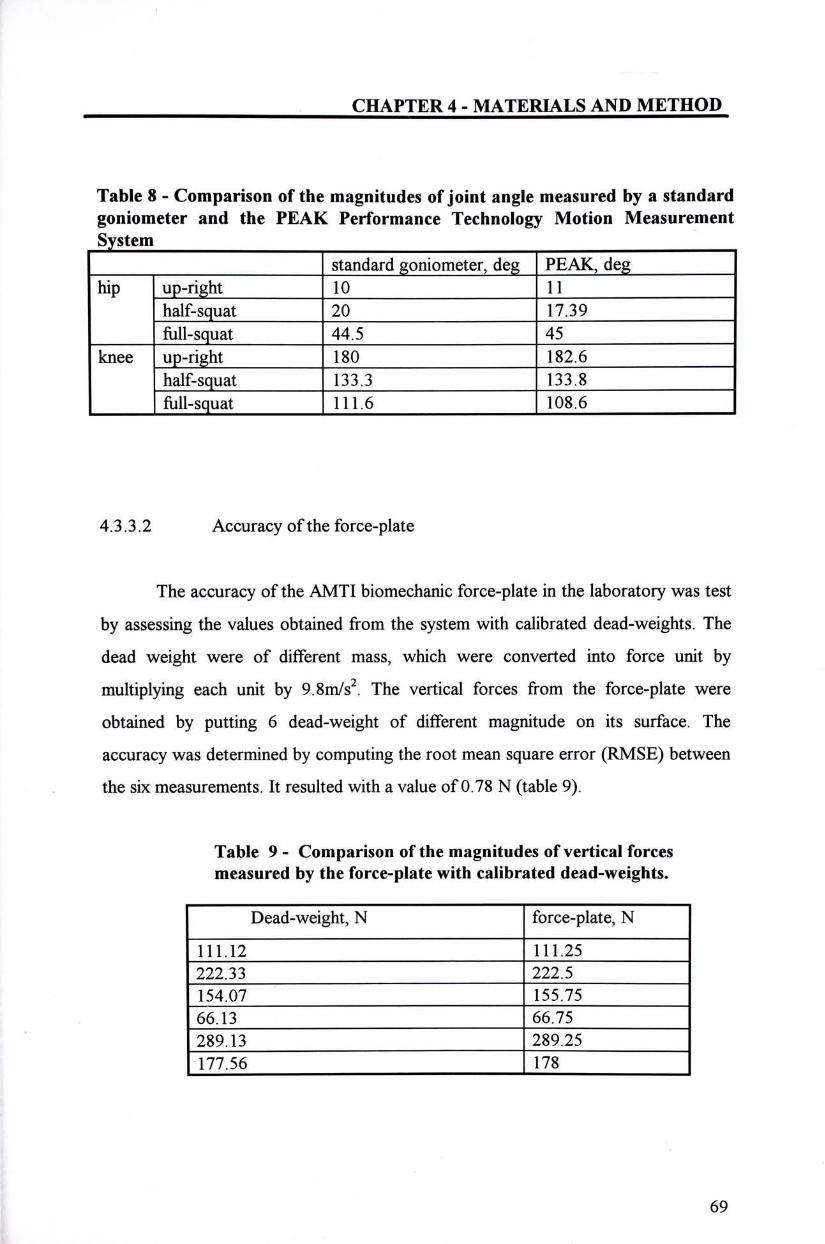
CHAPTER 4 - MATERIALS AND METHOD
Table 8 - Comparison of the magnitudes of joint angle measured by a standard goniometer and the PEAK Performance Technology Motion Measurement System
standard goniometer, deg PEAK, deg hip up-right ]^ H
half-squat 20 一 17.39 一
full-squat 44.5 — 45 — knee up-right 1 ^ 182.6
half-squat 133.3 一 133.8 一
full-squat 111.6 108.6 一
4.3.3 • 2 Accuracy of the force-plate
The accuracy of the AMTI biomechanic force-plate in the laboratory was test
by assessing the values obtained from the system with calibrated dead-weights. The
dead weight were of different mass, which were converted into force unit by
multiplying each unit by 9.8m/s^. The vertical forces from the force-plate were
obtained by putting 6 dead-weight of different magnitude on its surface. The
accuracy was determined by computing the root mean square error (RMSE) between
the six measurements. It resulted with a value of 0.78 N (table 9).
Table 9 - Comparison of the magnitudes of vertical forces measured by the force-plate with calibrated dead-weights.
Dead-weight, N force-plate, N
lTl . l2 111.25 —222.33 222.5 "l54.07 — 155.75 66.13 66.75 — 289.13 289.25 —
—177.56 178
69
CHAPTER 4 - MATEMALS AND METHOD ^ ^ ^ W H ^ ^ ^ ^ ^ ^ ^ ^ ^ ^ H ^ ^ ^ ^ ^ ^ ^ ^ ^ ^ ^ ^ ^ ^ ^ ^ ^ ^ ^ ^ ^ H ^ ^ ^ ^ ^ ^ ^ H I B ^ ^ ^ ^ ^ M ^ ^ ^ ^ ^ ^ H M ^ ^ ^ ^ ^ ^ ^ ^ ^ ^ ^ ^ H H ^ ^ ^ ^ H ^ ^ H ^ ^ M B ^ H a H H ^ ^ H i m ^ H I I I ^ M M
4.4 METHOD
4.4.1 STUDY PROCEDURE
The study was carried out in the Human Locomotion Laboratory in the Hong
Kong Polytechnic University. Explanation of the purpose and procedures of the
study was given to each subjects. Written informed consent to participate in the study
was obtained (Appendix I ).
The age (calculated with their year of birth shown in their identity card), the
height (vertical distance from the vertex of skull to ground without shod), the weight
( taken without shod by a bath-scale), and the amount of turn-out of the lower
extremity ( angle between lines drawn between the cleft of the 1st and 2nd toes to the
mid point of the heels ) were measured by an arthodial protractor and recorded.
Other details on the subject's dance experience and injury history were also
taken (Appendix II).
Sautes in the standard first position were selected since this is the fundamental
jumping skill in classical ballet. A set of warm-up exercises was practiced by each
subject for 10 minutes. The exercises were set by a physiotherapist who was a ballet
dancer (Appendix III).
A practice session consisting of sautes was performed on the force plate
prior to data collection. The subject was instructed to hold the arm in bra bras
position, both in the propulsion and landing phase, which served to minimize the
contribution of the upper limbs to the movement of the jumps. Prior to each jump,
the subject stood on the force plate in a comfortable first position (anatomical
position with lower extremities laterally rotated and heels together ). After a "jump"
70
CHAPTER 4 - MATERIALS AND METHOD
signal has been given verbally, the subject was required to take ten jumps. Each jump
aimed at achieving maximum height, landing on both feet on the force plate, and then
resuming the starting position at her own pace. In-between each jump, there was a
resting period of 30 seconds to minimize fatigue. To standardize the proprioceptive
input and shock absorption on the foot, the subject was required to perform the
jumps on barefoot. Five of the jumps were performed with the technique of"pull-up"
and five without. The method of performing "pull-up" was not standardized, because
the effects of "pull-up" from each individual is tested against her believe. The
sequence of the techniques of jumps were randomized by drawing cards, and the
subject was being informed before the “ jump" signal was given.
Self-reflective markers were placed on (1) the spinuous process of 7th
cervical vertebrae, (2) the spinuous process of the 2nd sacrum vertebrae
corresponding to the mid-point between the two posterior sacral iliac spine, (3) the
highest point on the iliac crest, (4) the greater trochanter of femur, (5) the lateral
joint line of the knee (6) the tip of lateral malleolus, and (7) the head of 5th
metatarsal ( Photo.l).
The movements were captured by two video cameras, one placed on the
lateral side, one was positioned on the posterio-lateral aspect (40°) to the subject.
Video taping was started five minutes before any real data collection started to allow
the audio time code to be synchronized with the video. A scaling rod was videotaped
before real data collection (Fig.l5). After which the position of the cameras and the
setting of the cameras were not allowed to changed.
71
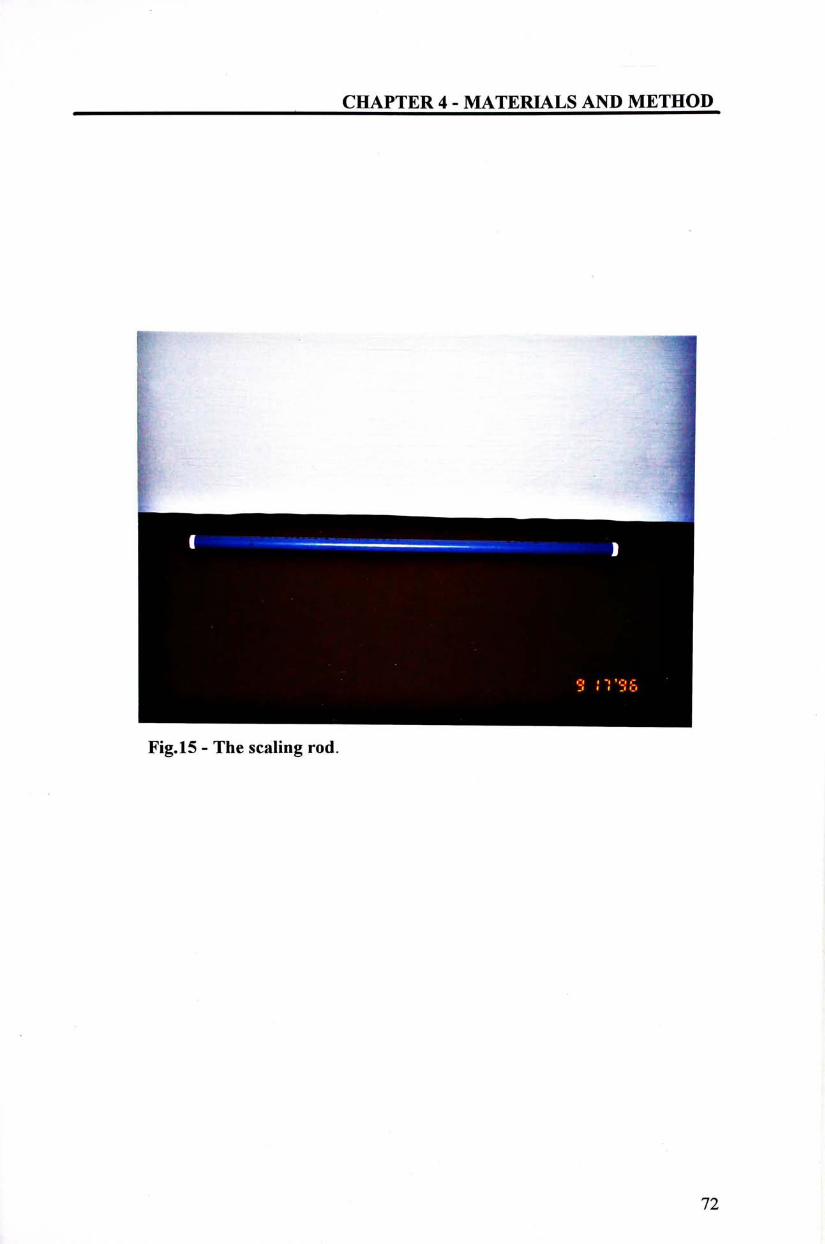
CHAPTER 4 - MATERIALS AND METHOD
f- 趣'i ,.
:: ^ i ^ f ‘ [
^ , 憑 為
V • :•
I^^H Fig.l5 - The scaling rod.
72

CHAPTER 4 - MATERIALS AND METHOD
4.4.2 DATA REDUCTION
4.4.2.1 Kinematics
Set up procedures for kinematics analysis
The video images was encoded and digitized by the Peak Performance
Motion Measurement System. During the encoding process, the Peak system
recorded a frame number on each video frame, allowing the Peak software to locate
the correct frame for analysis. Before digitization, a spatial model and a project set up
were completed. The spatial model contained information on the points per picture,
the label of each point, the manner that they were connected,and the order that they
were digitized. The spatial models of the lateral and the postero-lateral images are
shownin Fig.l6a, 16b and 17 .
A project file was set up to contain information specific to each video session.
Each file indicated the sampling rate, the camera used, the scale factor and thejoint
angles. The scale factor was obtained by videotaped a rod of 80 cm, and the ratio of
the actual length and the length in screen units was calculated.
73
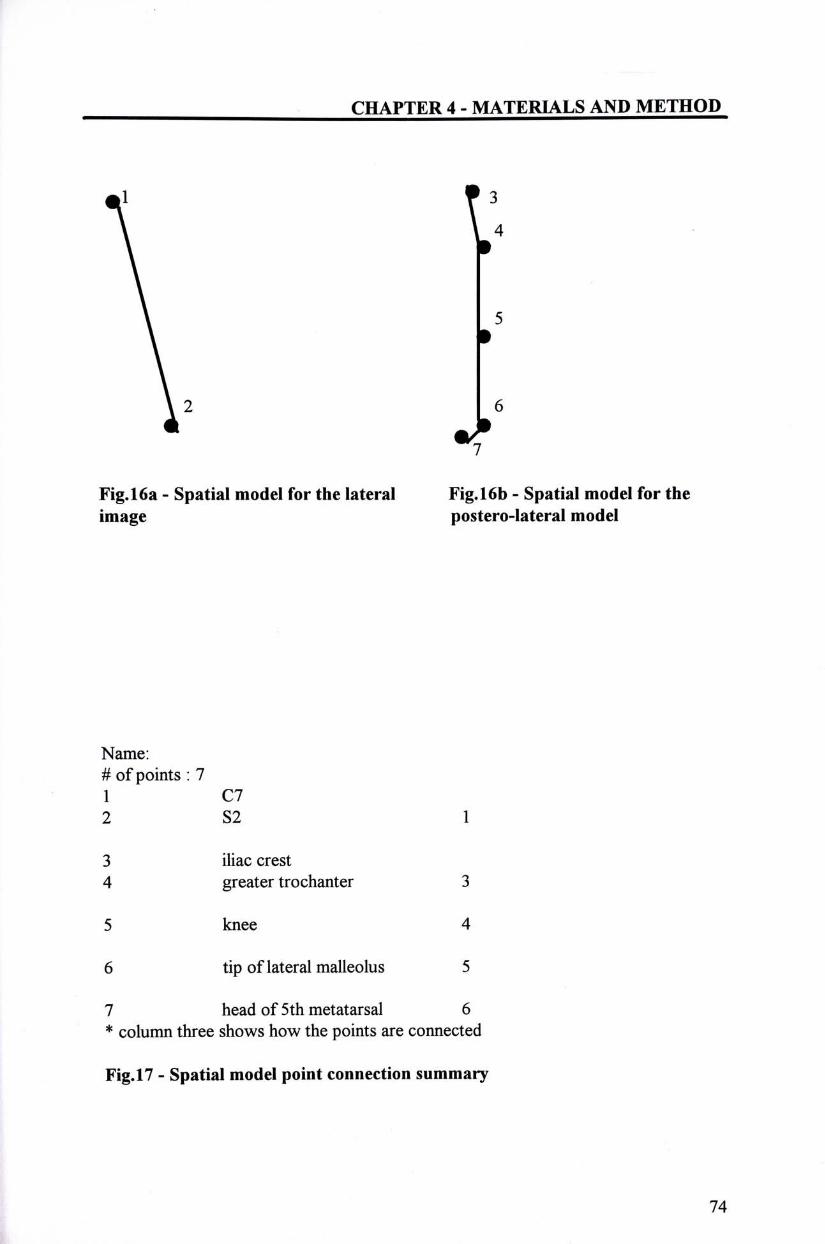
CHAPTER 4 - MATERIALS AND METHOD
\ I \ 2 6 • ^
Fig.l6a - Spatial model for the lateral Fig.l6b - Spatial model for the image postero-lateral model
Name: # of points : 7 1 C7 2 S2 1
3 iliac crest
4 greater trochanter 3
5 knee 4
6 tip oflateral malleolus 5
7 head of 5th metatarsal 6 * column three shows how the points are connected
Fig.l7 - Spatial model point connection summary
74

CHAPTER 4 - MATERIALS AND METHOD
Acquisition ofkinematics
The images of the movements were digitized frame by frame with the
automatic mode of digitization in the PEAK system. The program tracked the
location of the bright markers from the dark background, based on a number of set
criteria. These included the image pixel values, the marker size, and the size of search
windows. The centroids of each marker was computed using the average of the
marker's outline pixels. The horizontal (x) and the vertical (y) coordinates of the
markers were calculated.
Computation ofkinematics
The raw data points from digitization were scaled to metric unit and filtered
with a Butterworth digital filter. The conditioned data were then reduced to obtain
the scaled linear displacement of the markers and the angular displacement of the
joints.
75
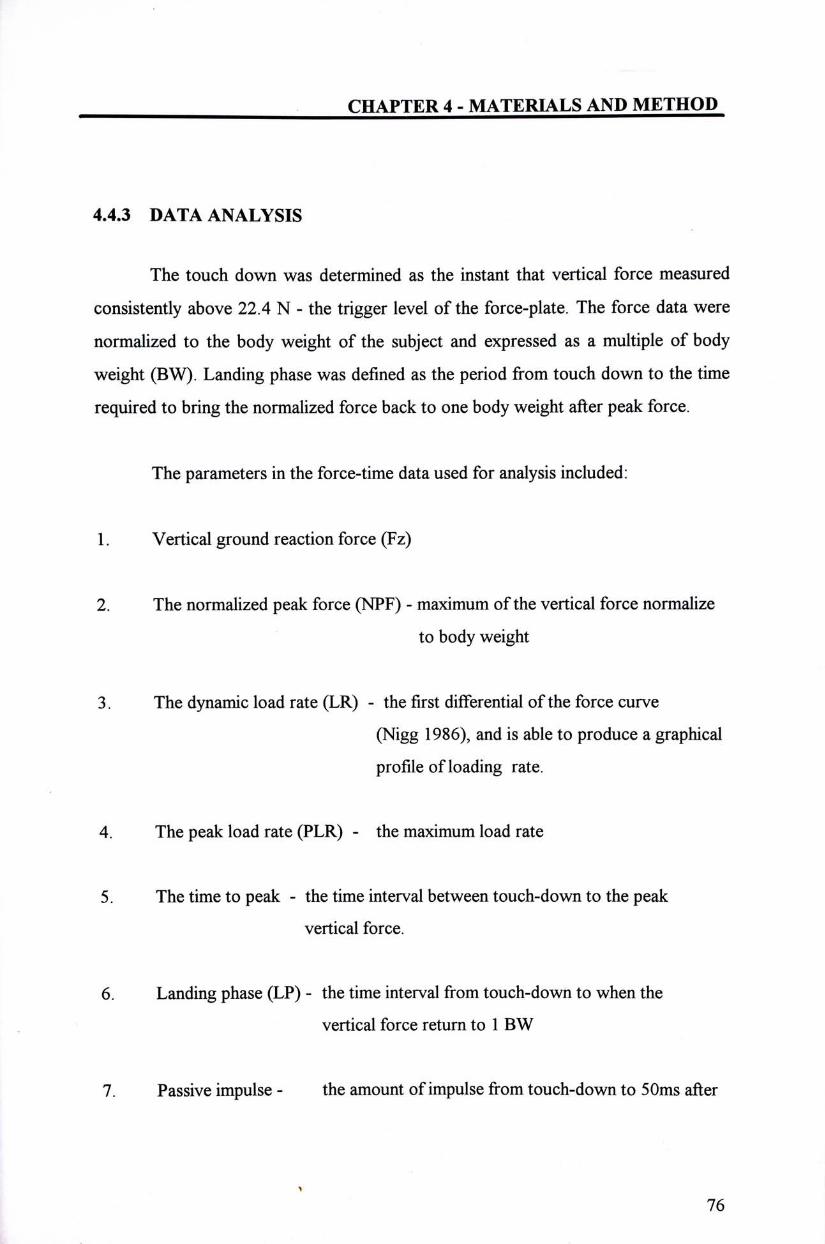
CHAPTER 4 - MATERIALS AND METHOD
4.4.3 DATA ANALYSIS
The touch down was determined as the instant that vertical force measured
consistently above 22.4 N - the trigger level of the force-plate. The force data were
normalized to the body weight of the subject and expressed as a multiple of body
weight (BW). Landing phase was defined as the period from touch down to the time
required to bring the normalized force back to one body weight after peak force.
The parameters in the force-time data used for analysis included:
1 • Vertical ground reaction force (Fz)
2. The normalized peak force (NPF) - maximum of the vertical force normalize
to body weight
3. The dynamic load rate (LR) - the first differential of the force curve
(Nigg 1986), and is able to produce a graphical
profile ofloading rate.
4. The peak load rate (PLR) - the maximum load rate
5. The time to peak - the time interval between touch-down to the peak
vertical force.
6. Landing phase (LP) - the time interval from touch-down to when the
vertical force return to 1 BW
7. Passive impulse _ the amount of impulse from touch-down to 50ms after
、 76
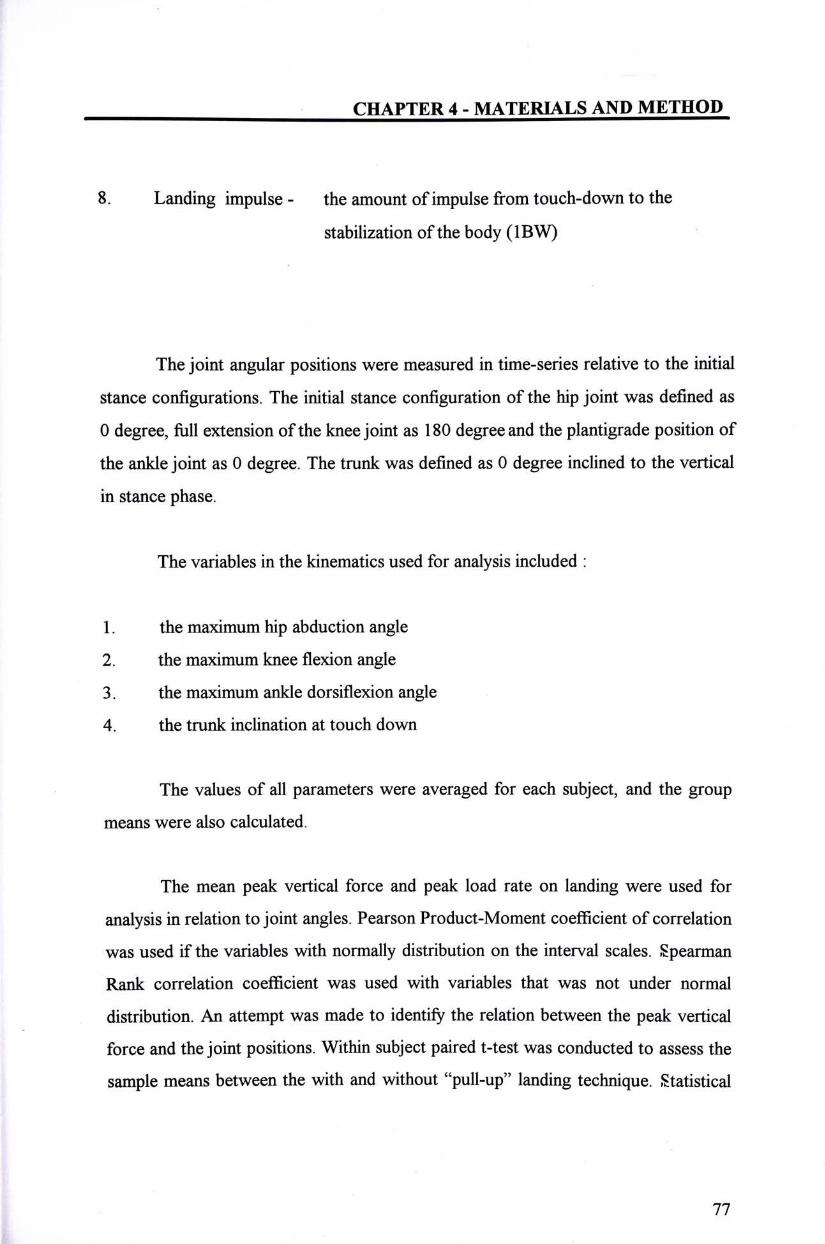
CHAPTER 4 - MATERIALS AND METHOD
8. Landing impulse - the amount of impulse from touch-down to the
stabilization of the body (lBW)
The joint angular positions were measured in time-series relative to the initial
stance configurations. The initial stance configuration of the hip joint was defined as
0 degree, full extension of the kneejoint as 180 degree and the plantigrade position of
the ankle joint as 0 degree. The trunk was defined as 0 degree inclined to the vertical
in stance phase.
The variables in the kinematics used for analysis included :
1. the maximum hip abduction angle
2. the maximum knee flexion angle
3. the maximum ankle dorsiflexion angle
4. the trunk inclination at touch down
The values of all parameters were averaged for each subject, and the group
means were also calculated.
The mean peak vertical force and peak load rate on landing were used for
analysis in relation to joint angles. Pearson Product-Moment coefficient of correlation
was used if the variables with normally distribution on the interval scales. Spearman
Rank correlation coefficient was used with variables that was not under normal
distribution. An attempt was made to identify the relation between the peak vertical
force and the joint positions. Within subject paired t-test was conducted to assess the
sample means between the with and without "pull-up" landing technique. Statistical
77

CHAPTER 4 - MATERIALS AND METHOD
significance was set at p<0.05. The Statistic Package for Social Studies Release 6.1
was used for statistic analysis.
78
CHAPTER 5 - RESULTS
CHAPTER 5 RESULTS
5.1 DEMOGRAPHIC CHARACTERISTICS
Eighteen female dancers from the Hong Kong Academy for Performing Arts
were included in this study. Data from seventeen subjects were analysed because
some of the data of one subject were missing due to data collection error.
Demographic characteristics of these dancers were summarized in Table 10.
The age of subjects ranged from 18 to 25 with a mean and standard deviation of21.3
土 1.99. The sample mean and standard deviation of body weight and height were
48 .8±4.52kg. and 1.6±0.04m.
Figure 18 presents the years of professional ballet training of the subjects in
the academy. Eight (47%) subjects had 2 years of full-time training. Five (24%) and 4
(29%) subjects got three and four years of training respectively. Majority of them
(48%) had ten or more years of dancing experience. Only 1 subject had experience in
ballet less than seven years (Fig.l9). About half (47%) of the subjects started learning
ballet after age 11 (Fig.20).
Table 10 also summarizes the amount of turn-out in the subjects. The amount
of turn-out on the (L) leg ranged from 65° to 80。,with a mean and standard deviation
of 72 ° 土5.4�. the (R) leg turn-out angle ranged from 65° to 80°,with a mean and
standard deviation of 74 ° 土 5.3�•
79
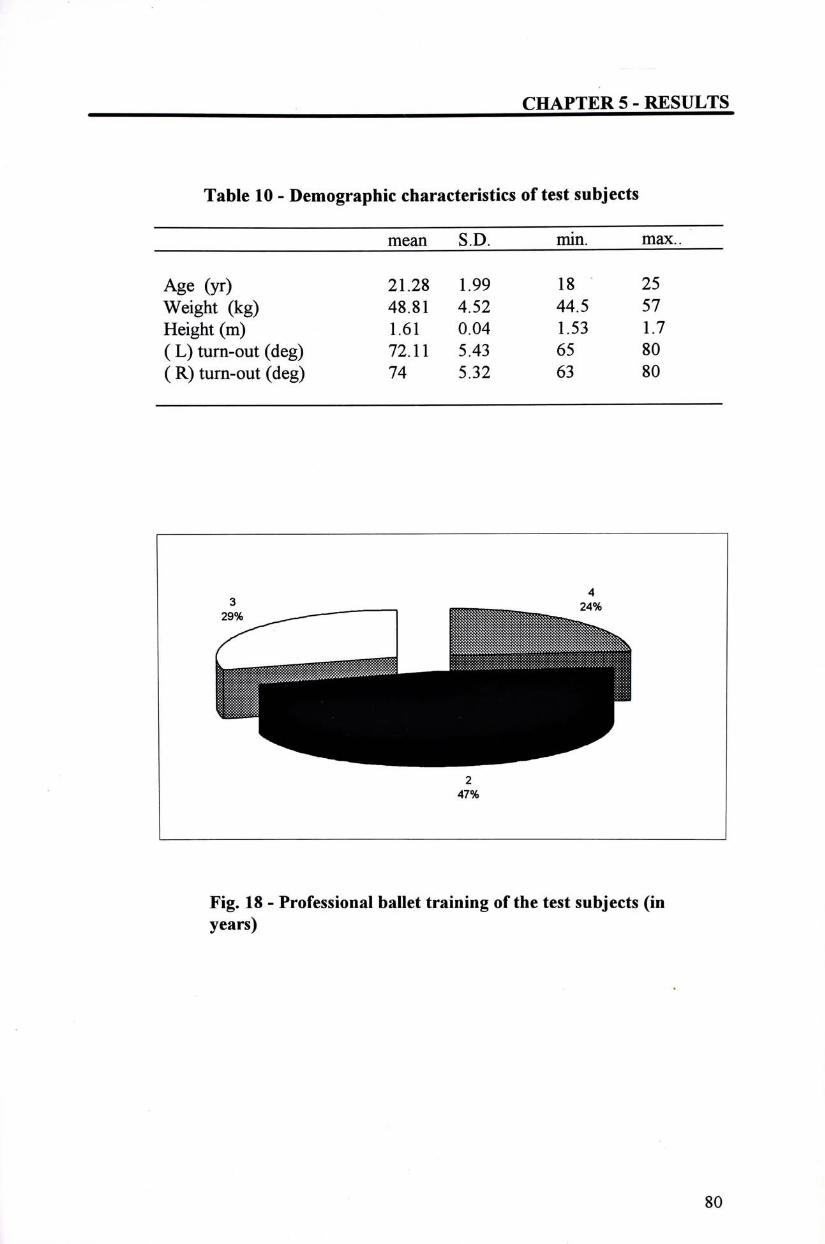
CHAPTER 5 - RESULTS
Table 10 - Demographic characteristics of test subjects
mean S.D. mi^ max..
Age (yr) 21.28 1.99 18 25 Weight (kg) 48.81 4.52 44.5 57 Height (m) 1.61 0.04 1.53 1.7 (L) turn-out (deg) 72.11 5.43 65 80 (R) turn-out (deg) 74 5.32 63 80
4
| ^ ^ ^ ^ ^ ^ ^ ^ j ® B s ^ 2 4 %
^ " ^ | 圖 圓 _ | _ | _ ^ ^ . mgrnssgasaMMM j^^^^B^^^^B^^^^^B ^ ^ ^ ^ ^ ^ ^ H ^ ^ ^ ^ ^ ^ ^ ^ ^ H :i: _ ^
^ ^ ^ ^ ^ ^
2 47%
Fig. 18 - Professional ballet training of the test subjects (in years)
80
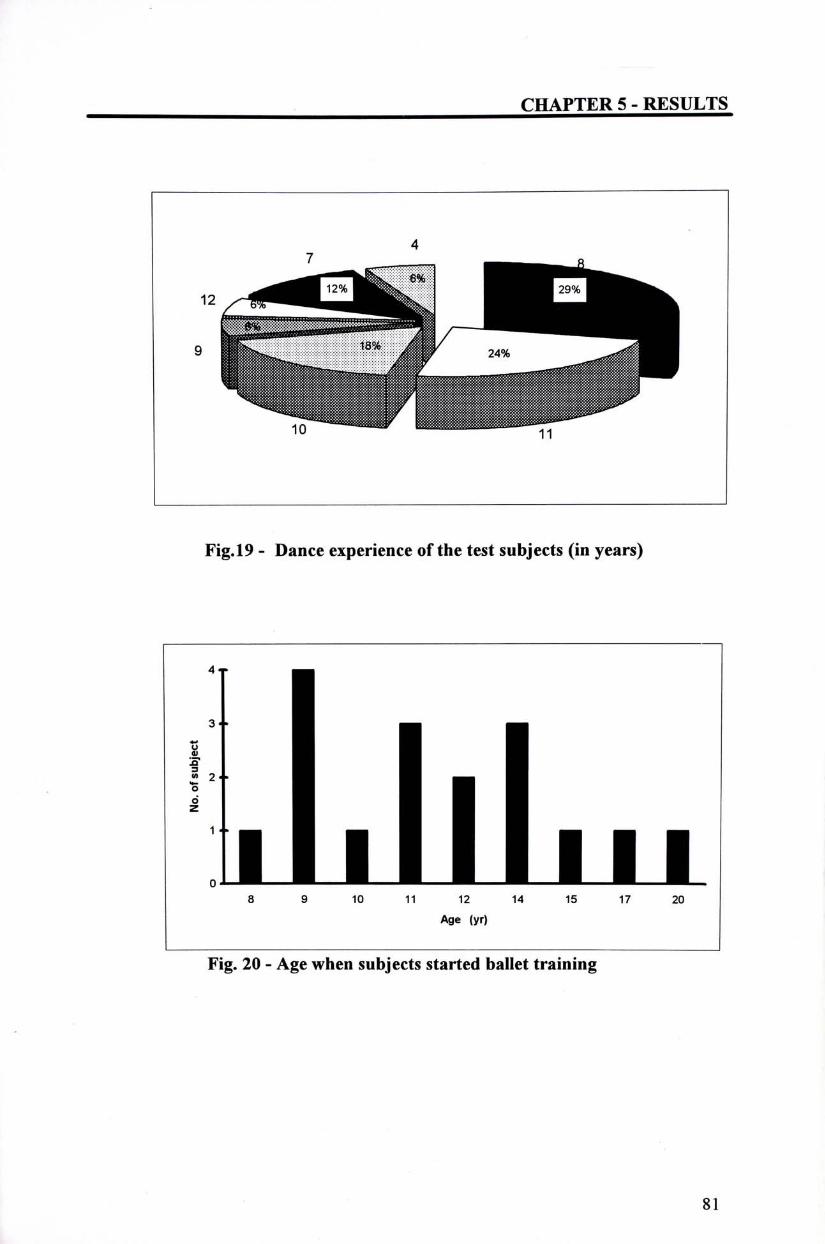
CHAPTER 5 - RESULTS
7 4
1 2 ^ ^ ^ | j j ^ ^ ^ ^ ^ ^ ^ ^ _=_s^^^^]S^^^!!^^ > — ^ ^ ^ ^ ^ ^ ^ ^ ^ ^ 1
9 | ^ ^ ^ ^ 1 & 4 ^ 24% ^ ^ ^ ^ ^ 1
^ ^ ^ ^ ^ m ^ ^ M i y * ^
Fig.l9 - Dance experience of the test subjects (in years)
• I • I I I • • • 8 9 10 11 12 14 15 17 20
Age (yr)
Fig. 20 - Age when subjects started ballet training
81
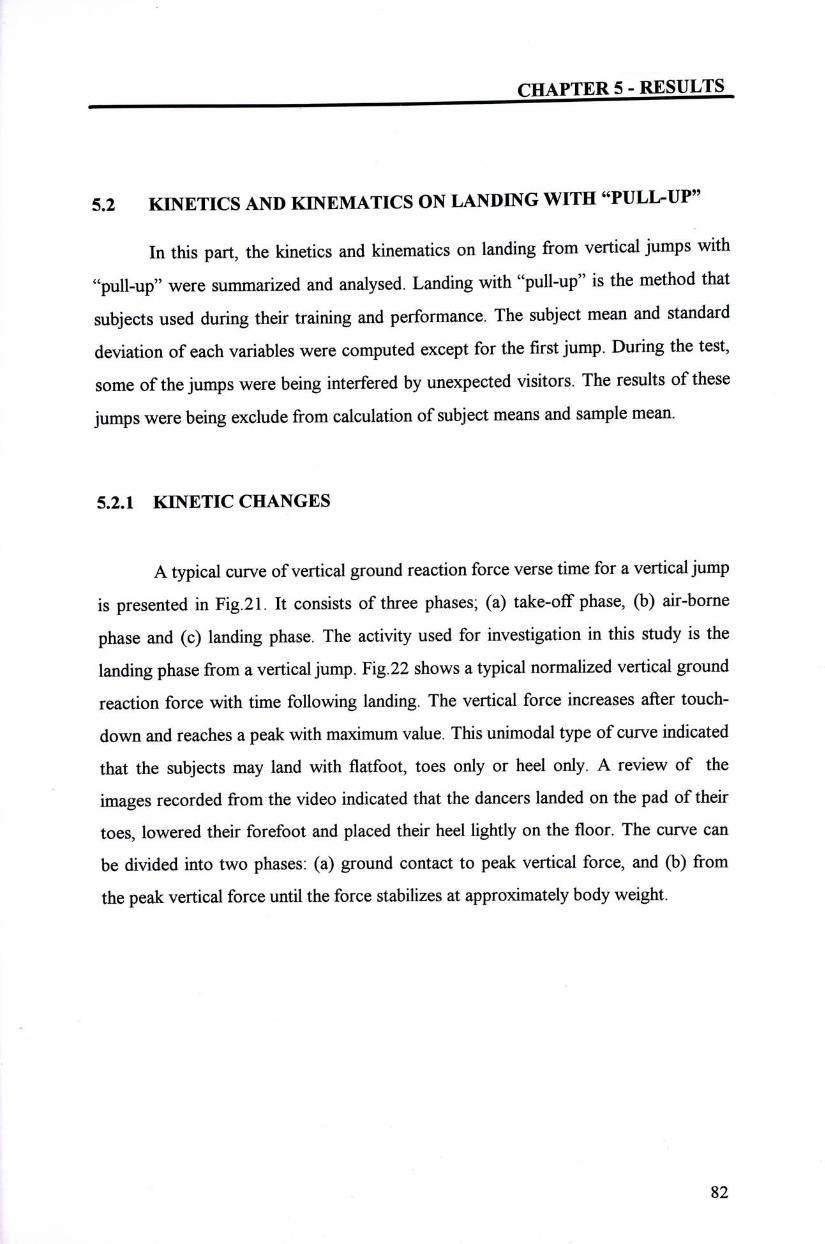
CHAPTER 5 - RESULTS
5.2 KEVETICS AND KEVEMATICS ON LANDEVG WITH "PULL-UP"
In this part, the kinetics and kinematics on landing from vertical jumps with
"pull-up" were summarized and analysed. Landing with "pull-up" is the method that
subjects used during their training and performance. The subject mean and standard
deviation ofeach variables were computed except for the firstjump. During the test,
some ofthejumps were being interfered by unexpected visitors. The results ofthese
jumps were being exclude from calculation of subject means and sample mean.
5.2.1 KEVETIC CHANGES
A typical curve ofvertical ground reaction force verse time for a verticaljump
is presented in Fig.21. It consists of three phases; (a) take-off phase, (b) air-borne
phase and (c) landing phase. The activity used for investigation in this study is the
landing phase from a verticaljump. Fig.22 shows a typical normalized vertical ground
reaction force with time following landing. The vertical force increases after touch-
down and reaches a peak with maximum value. This unimodal type of curve indicated
that the subjects may land with flatfoot, toes only or heel only. A review of the
images recorded from the video indicated that the dancers landed on the pad of their
toes, lowered their forefoot and placed their heel lightly on the floor. The curve can
be divided into two phases: (a) ground contact to peak vertical force, and (b) from
the peak vertical force until the force stabilizes at approximately body weight.
82
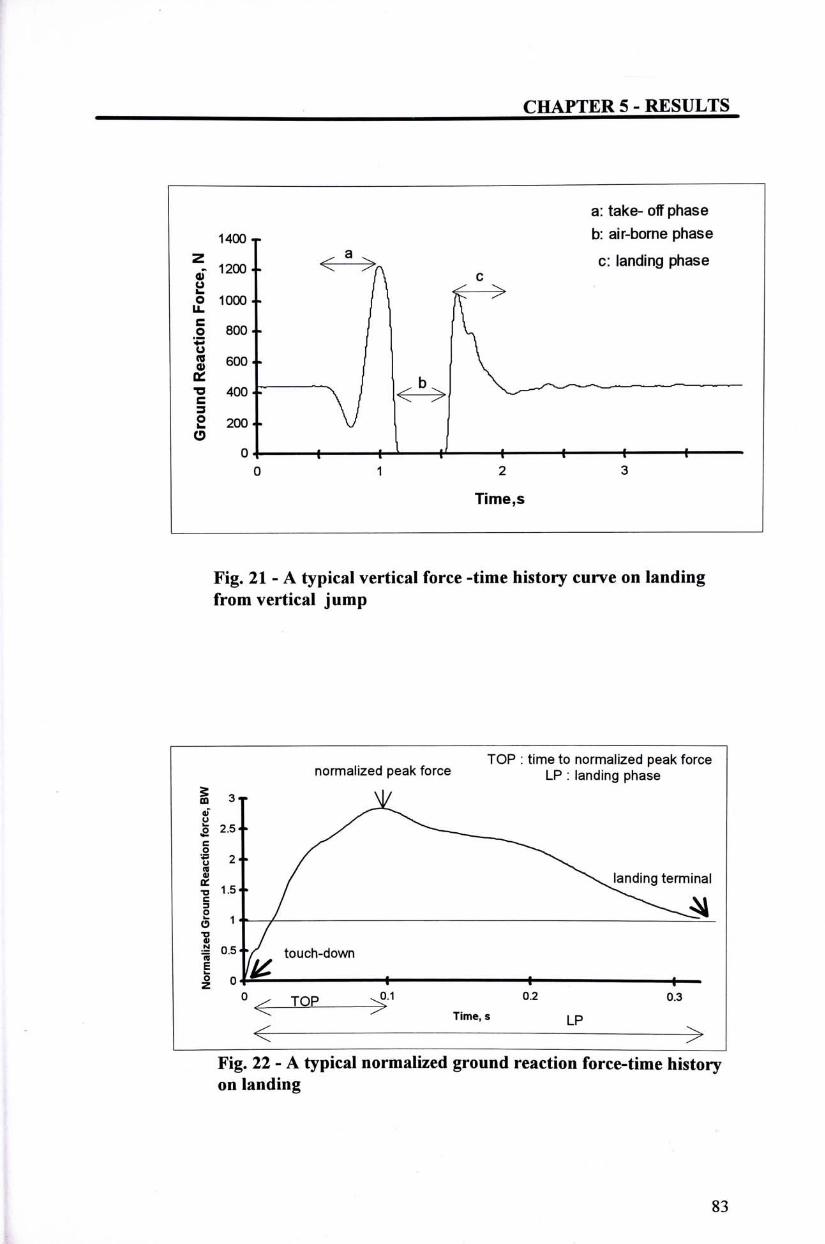
CHAPTER 5 - RESULTS
a: take- off phase 1400 b: air-borne phase
^ . 1200.. < a X c: landing phase S \ c
£ iooo.. I 入 f ~ ~ > I 800.. / � i 600.. 1 V
•g 400.: \ / < b > V. " "- ^ "—
E 2 0 0 . . V 0
o\ 1 H^ e { I 1 1 0 1 2 3
Time,s
Fig. 21 - A typical vertical force -time history curve on landing from vertical jump
TOP : time to normalized peak force normalized peak force LP : landing phase
1 3下 y
H ^^ ^ / ^ \ ^ l a n d i n g terminal •a 1-5" / ^ ^
r / ^ ^ = 0 . 5 • Y touch-down 1 1^ o 0 1 ^ I i •
0 z T O P ^ 1 0.2 0.3 ^ Tlme, s LP < >
Fig. 22 - A typical normalized ground reaction force-time history on landing
83
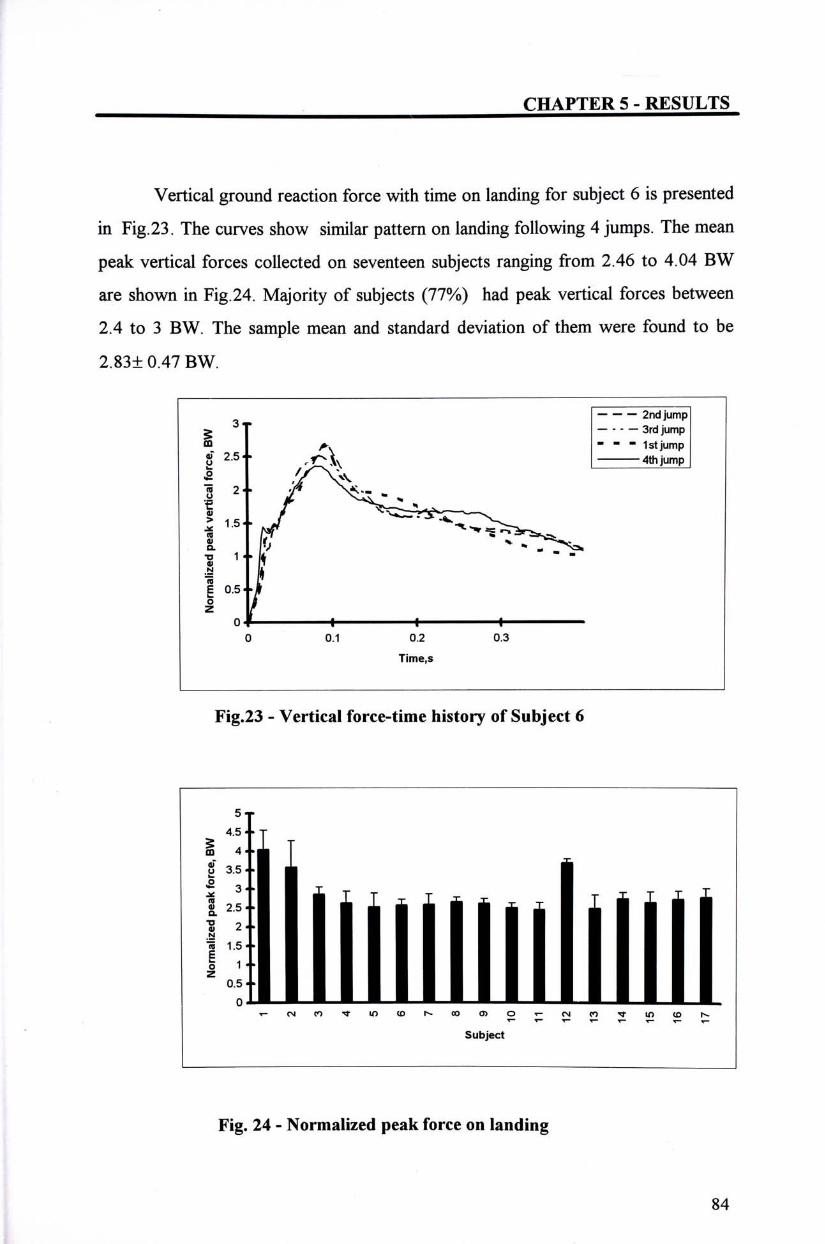
CHAPTER 5 - RESULTS
Vertical ground reaction force with time on landing for subject 6 is presented
in Fig.23. The curves show similar pattern on landing following 4 jumps. The mean
peak vertical forces collected on seventeen subjects ranging from 2.46 to 4.04 BW
are shown in Fig.24. Majority of subjects (77%) had peak vertical forces between
2.4 to 3 BW. The sample mean and standard deviation of them were found to be
2.83± 0.47 BW.
2nd jump ^ 3 . • — 3rd jump CQ Av 一 “ - 1stjump g 2 5 . . 『 广 、 4thjump
i : / " " " ^ ^ ^ ^ ^ ^ ^ <u f, V __ *"-^ Q. •乂 - _ J>3fc V 1«• i • -0) 1 I » 巨 0 . 5 " 厂
- / • . . o4 i i 1
0 0.1 0.2 0.3
Time,s
Fig.23 - Vertical force-time history of Subject 6
5j 4.5 • • T
illliiiiiiiliilll ^ CM « ^ in CD 卜 00 0> 0 1~ CM CO •*T U) CO h-
Subject
Fig. 24 - Normalized peak force on landing
84
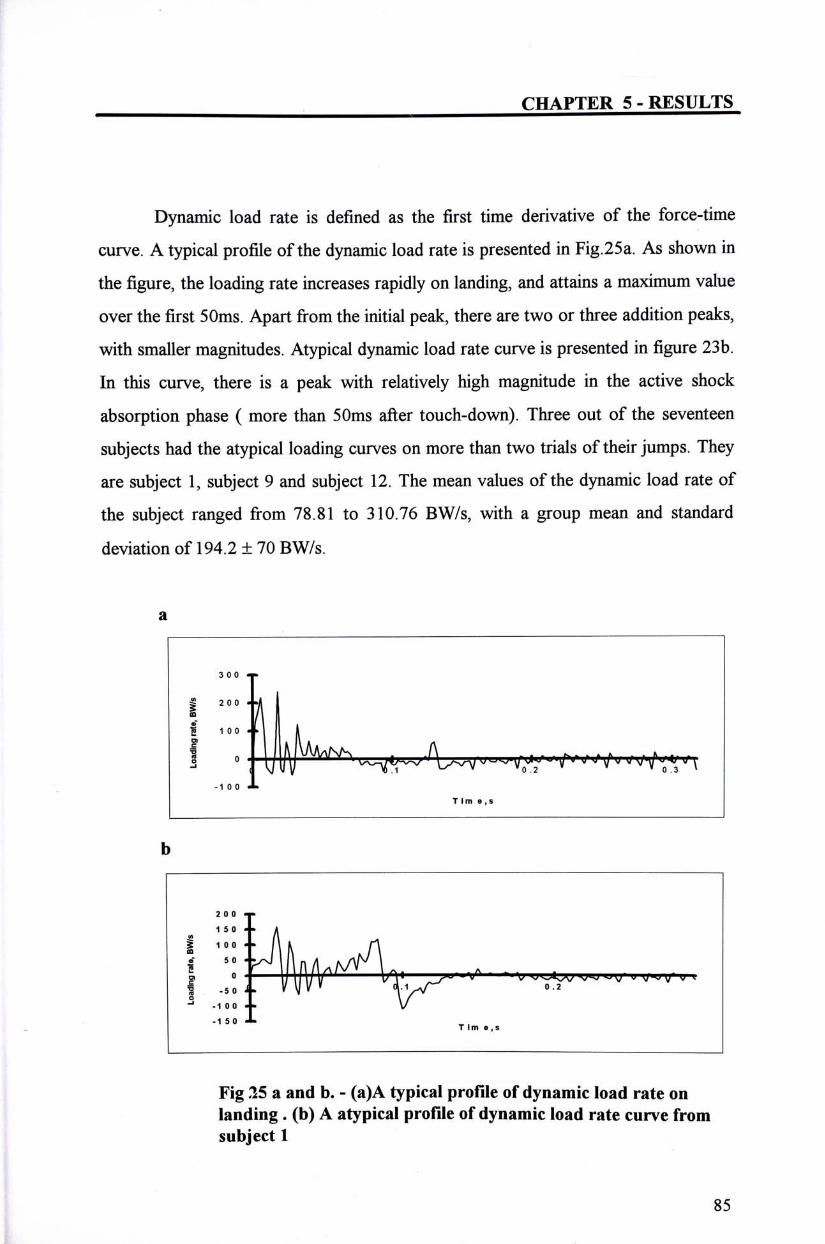
CHAPTER 5 - RESULTS
Dynamic load rate is defined as the first time derivative of the force-time
curve. A typical profile of the dynamic load rate is presented in Fig.25a. As shown in
the figure, the loading rate increases rapidly on landing, and attains a maximum value
over the first 50ms. Apart from the initial peak, there are two or three addition peaks,
with smaller magnitudes. Atypical dynamic load rate curve is presented in figure 23b.
In this curve, there is a peak with relatively high magnitude in the active shock
absorption phase ( more than 50ms after touch-down). Three out of the seventeen
subjects had the atypical loading curves on more than two trials of their jumps. They
are subject 1, subject 9 and subject 12. The mean values of the dynamic load rate of
the subject ranged from 78.81 to 310.76 BW/s, with a group mean and standard
deviation of 194.2 土 70 BW/s.
a
3 0 0 T I 2 0 0 • 'k % / •g 1 0 0 - • k I 0 : • ^ ^^NS, Uv - ^ I W' V> ^ U?\r。,_ ""\/ "'… … “ V/Y o' 3 “ \
-1 0 0 丄
T I m e , s
b
2 0 0 T 1 5 0 - ' ^ ^
I � ' — .Y�/V ^ ^ ^ ^ \>*V V""'V^ ‘ *'V V .AA/' V* ^ ' V [/mj [j' \j K I - 5 � “ V VV» \ / ^ �.2 ° -1 0 0 . • V/
-1 50 上 , .
T lm e , s
Fig 15 a and b. - (a)A typical profile of dynamic load rate on landing • (b) A atypical profile of dynamic load rate curve from subject 1
85
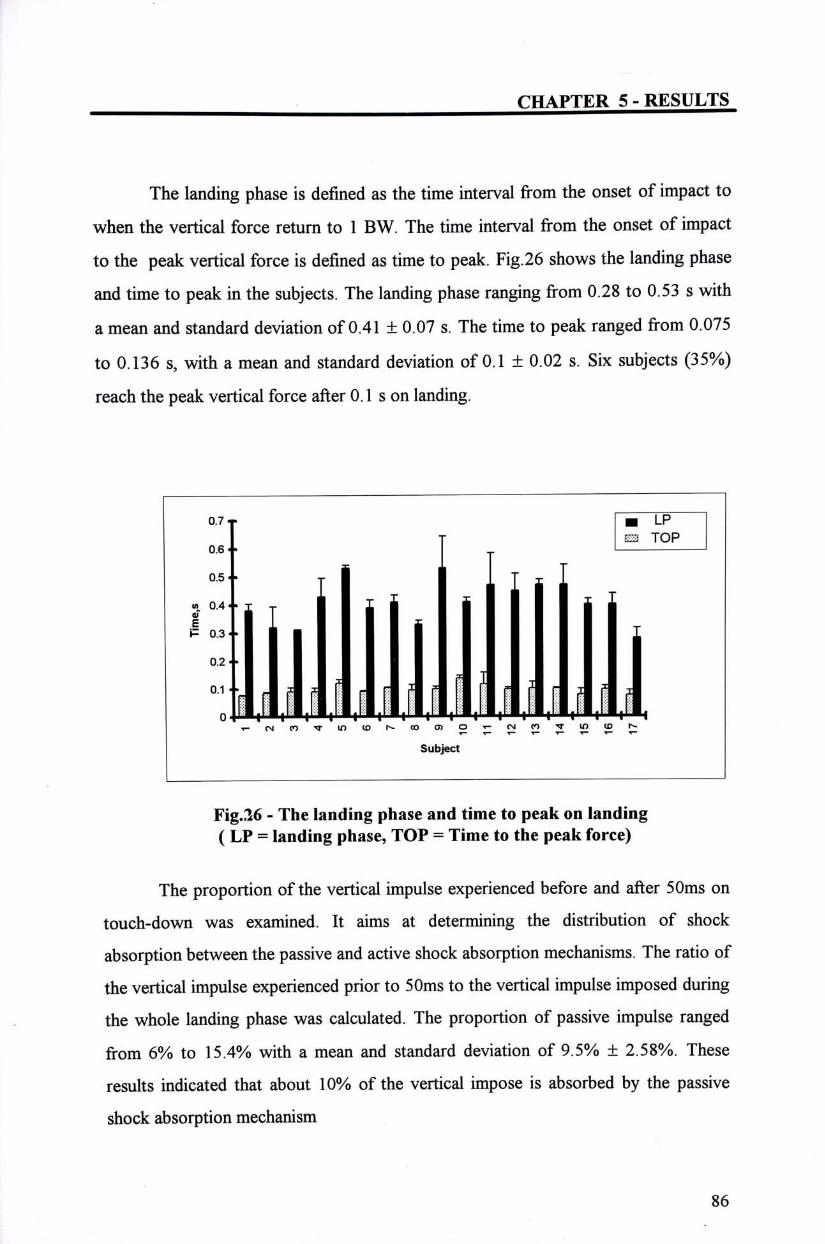
CHAPTER 5 - RESULTS
The landing phase is defined as the time interval from the onset of impact to
when the vertical force return to 1 BW. The time interval from the onset of impact
to the peak vertical force is defined as time to peak. Fig.26 shows the landing phase
and time to peak in the subjects. The landing phase ranging from 0.28 to 0.53 s with
a mean and standard deviation of0.41 土 0.07 s. The time to peak ranged from 0.075
to 0.136 s,with a mean and standard deviation of 0.1 土 0.02 s. Six subjects (35%)
reach the peak vertical force after 0.1 s on landing.
0.7* rs~~LP T m TOP
0 . 6 ‘ •
T 0.5" j T X « 為 II T
«0 0.4 ‘ • 工 T 0) E T P 0.3-0 . 2 "
? T � J I , 0.1 « • _ I g 1 F I I p _ I I I T 0 I I I 11:: I I I i I I I t i I t I I
•«" <M co ^ in <D r oo 0) o T- cNj co r u> <o t Subject
Fig.l6 - The landing phase and time to peak on landing (LP = landing phase, TOP = Time to the peak force)
The proportion of the vertical impulse experienced before and after 50ms on
touch-down was examined. It aims at determining the distribution of shock
absorption between the passive and active shock absorption mechanisms. The ratio of
the vertical impulse experienced prior to 50ms to the vertical impulse imposed during
the whole landing phase was calculated. The proportion of passive impulse ranged
from 6% to 15.4% with a mean and standard deviation of 9.5% 士 2.58o/o. These
results indicated that about 10% of the vertical impose is absorbed by the passive
shock absorption mechanism
86
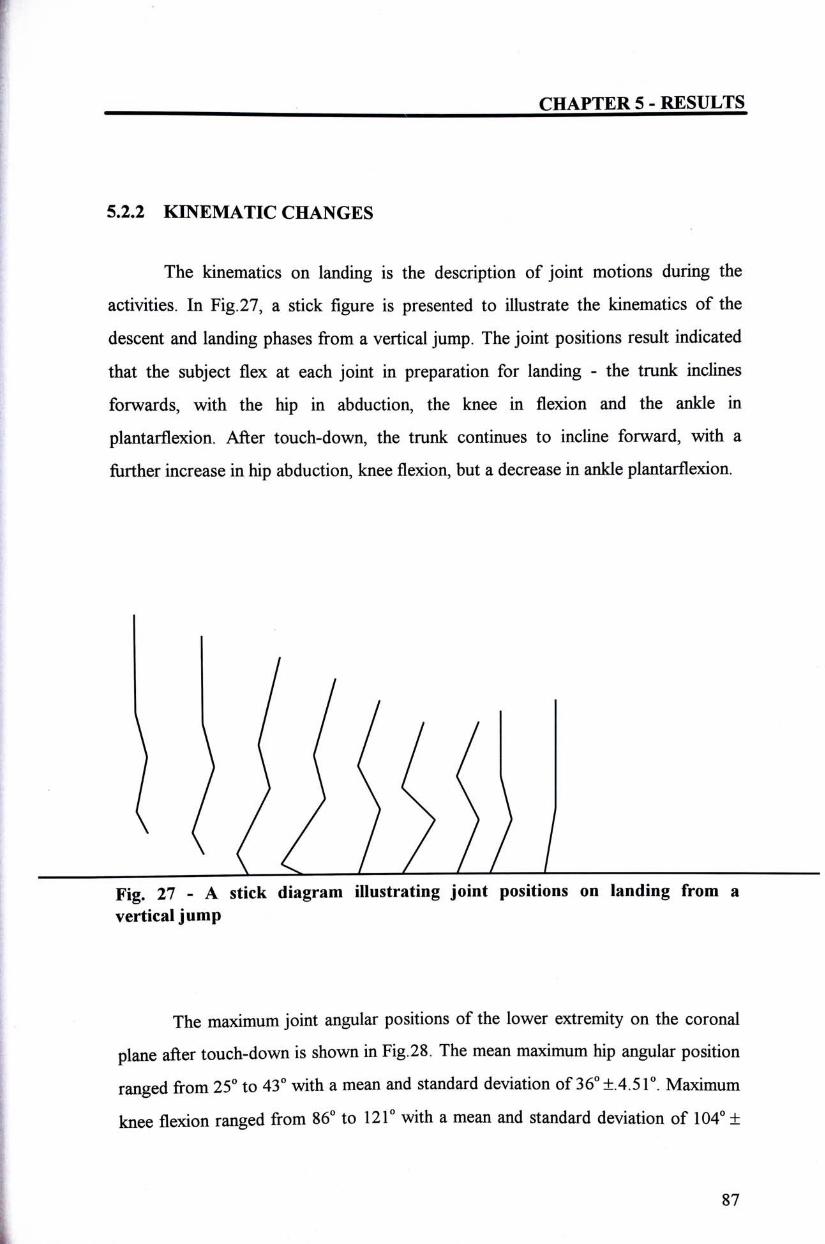
t' .
CHAPTER 5 - RESULTS
5.2.2 KBVEMATIC CHANGES
The kinematics on landing is the description of joint motions during the
activities. In Fig.27, a stick figure is presented to illustrate the kinematics of the
descent and landing phases from a vertical jump. The joint positions result indicated
that the subject flex at each joint in preparation for landing - the trunk inclines
forwards, with the hip in abduction, the knee in flexion and the ankle in
plantarfIexion. After touch-down, the trunk continues to incline forward, with a
further increase in hip abduction, knee flexion, but a decrease in ankle plantarfIexion.
i V M _ Fig. 27 - A stick diagram illustrating joint positions on landing from a verticaljump
The maximum joint angular positions of the lower extremity on the coronal
plane after touch-down is shown in Fig.28. The mean maximum hip angular position
ranged from 2 5 � t o 43�with a mean and standard deviation of 36° ±.4.51°. Maximum
knee flexion ranged from 86° to 12T with a mean and standard deviation of 104�土
87
1:
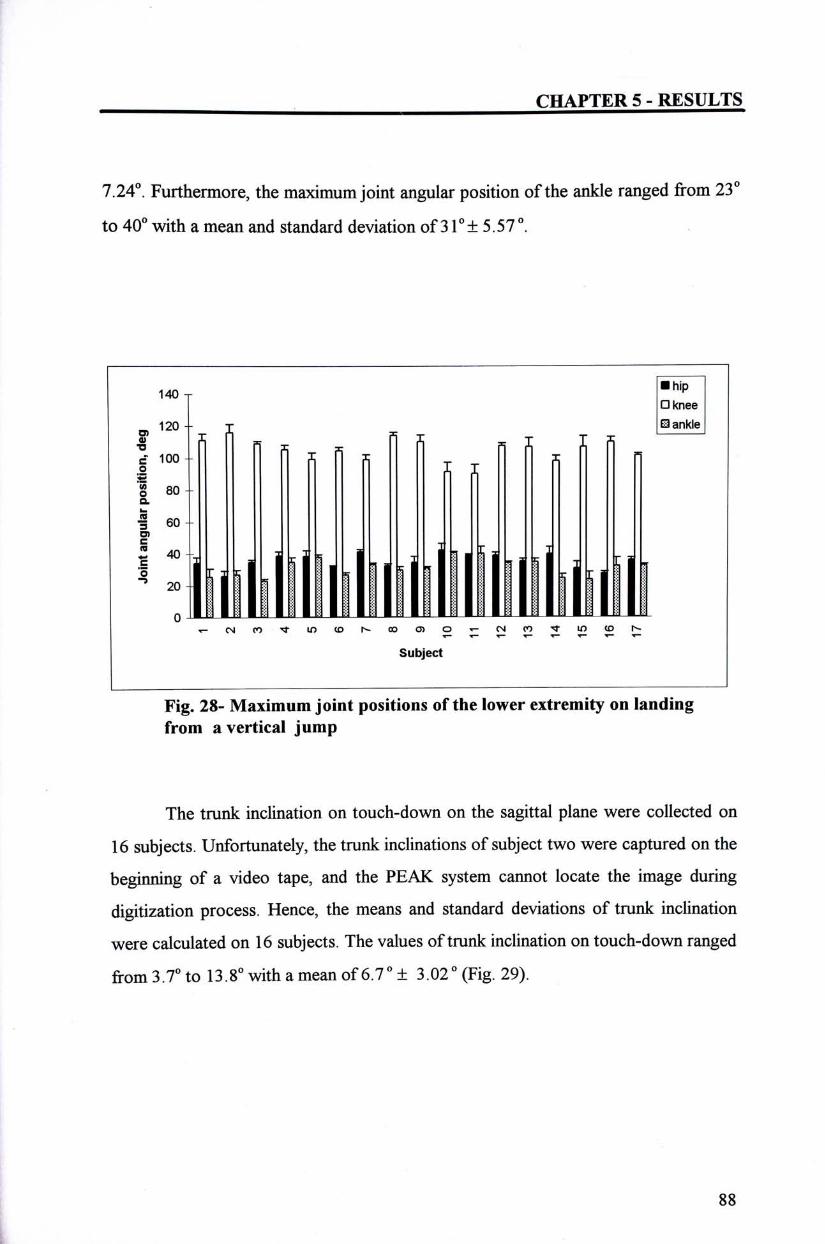
CHAPTER 5 - RESULTS
7.24°. Furthermore, the maximumjoint angular position of the ankle ranged from 23°
to 40�with a mean and standard deviation of 31 ° 士 5.57� .
140丁 | _ • ktiee
120 -- T ankle I fl n n ^ . n fi n 円 fi f\ " ^
i 1 0 0 n ^ n f \ I T f \ n ^ M 1 • | 80 -Q.
I 60-
p:MMMMiiMM T- Cvl CO 寸 U? CD 卜 00 0> 0 T- CM CO 寸 tf) tO 卜
Subject Fig. 28- Maximum joint positions of the lower extremity on landing from a vertical jump
The trunk inclination on touch-down on the sagittal plane were collected on
16 subjects. Unfortunately, the trunk inclinations of subject two were captured on the
beginning of a video tape, and the PEAK system cannot locate the image during
digitization process. Hence, the means and standard deviations of trunk inclination
were calculated on 16 subjects. The values of trunk inclination on touch-down ranged
from3.7" to 13.8°withameanof6.70± 3.02°(Fig. 29).
88
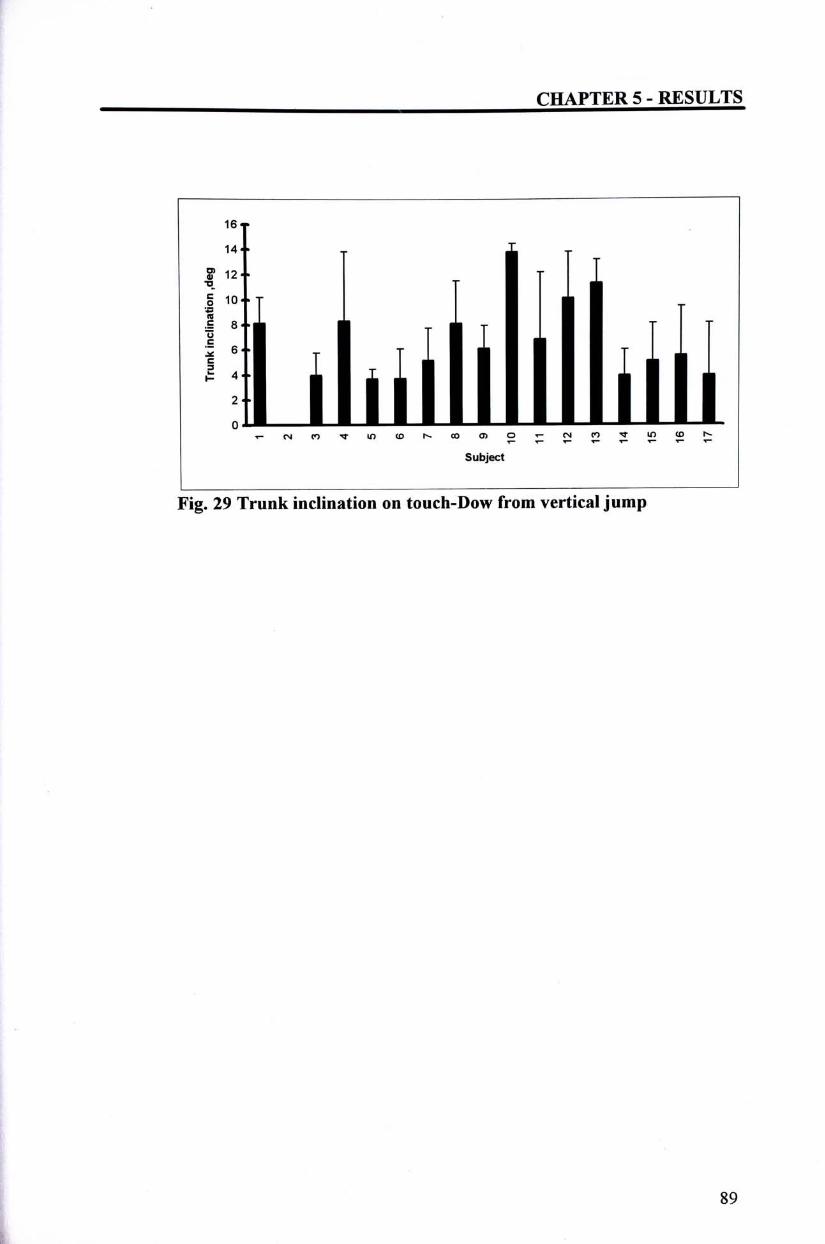
CHAPTER 5 - RESULTS
^6J 14«. j j
« 1 2 - T
T> T § 1 0 - T 丁
I . T
丨;1 ilimihlliiii T - C M C O ^ l T ) ( D h - 0 0 0 > 0 T " C N C O ^ | ^ ^ ^
Subject Fig. 29 Trunk inclination on touch-Dow from vertical jump
89
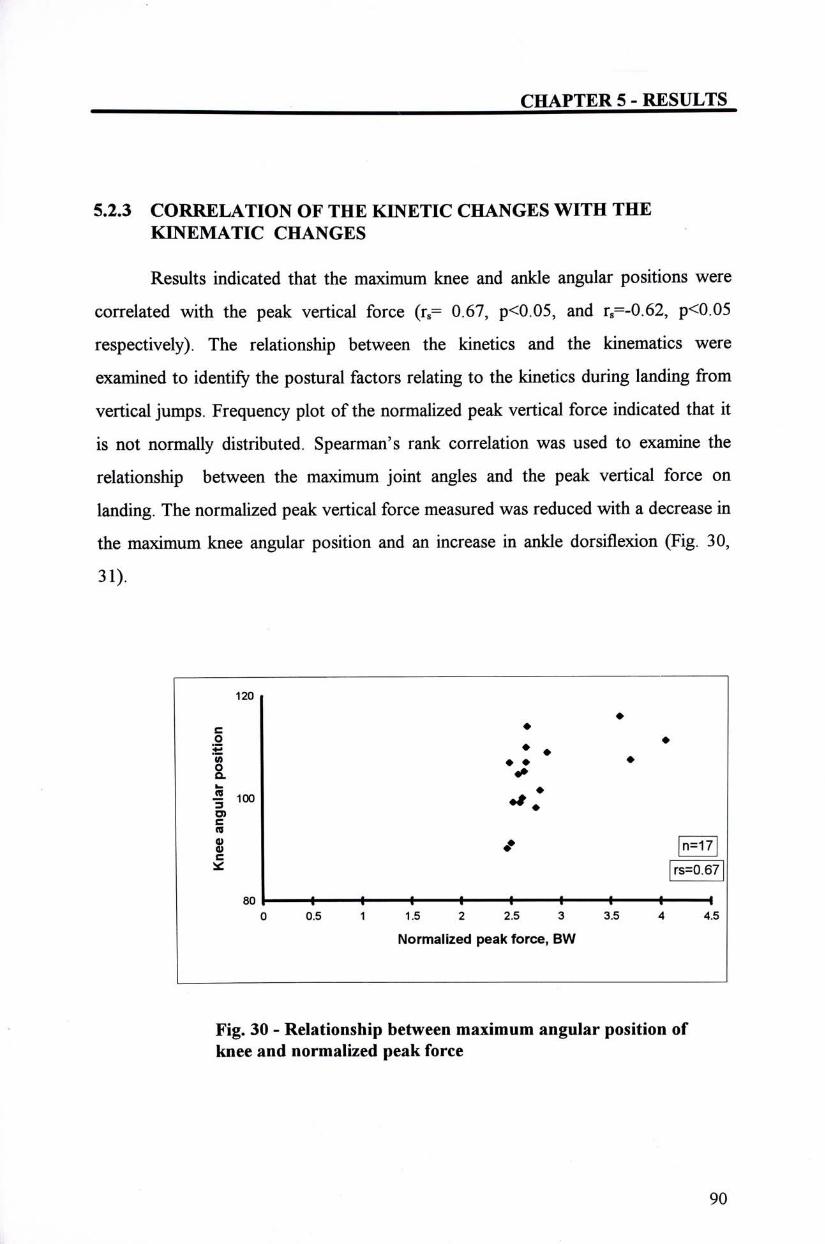
CHAPTER 5 - RESULTS
5.2.3 CORRELATION OF THE KEVETIC CHANGES WITH THE KmEMATIC CHANGES
Results indicated that the maximum knee and ankle angular positions were
correlated with the peak vertical force (r^= 0.67,p<0.05, and rs=-0.62, p<0.05
respectively). The relationship between the kinetics and the kinematics were
examined to identify the postural factors relating to the kinetics during landing from
vertical jumps. Frequency plot of the normalized peak vertical force indicated that it
is not normally distributed. Spearman's rank correlation was used to examine the
relationship between the maximum joint angles and the peak vertical force on
landing. The normalized peak vertical force measured was reduced with a decrease in
the maximum knee angular position and an increase in ankle dorsiflexion (Fig. 30,
31).
120
•
c • :l • • • 1 V • I 100 ^ • = _ • Ui c « S •• |n=17| ^ I rs=0.671
80 I I 1 i I i I t 1 0 0.5 1 1.5 2 2.5 3 3.5 4 4.5
Normalized peak force, BW
Fig. 30 - Relationship between maximum angular position of knee and normalized peak force
90
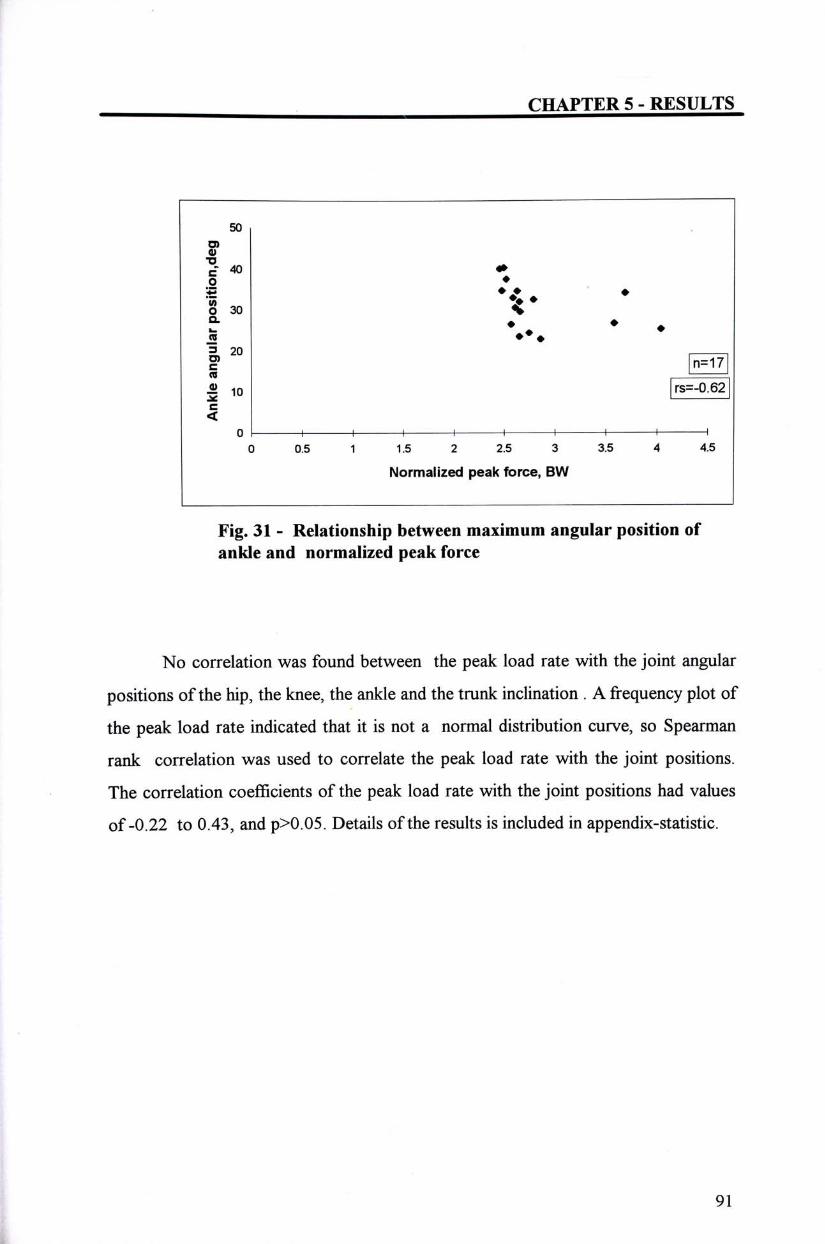
CHAPTER 5 - RESULTS
50 0) 0 1 ^ n 1 m " • ; • •
0 30 、
° - • • •
k . • 等 « • • • \ 20 ? n=17 « __ « 10 rs=-0.62 ^ c <
0 1 1 1 1 1 1 1 1 1 0 0.5 1 1.5 2 2.5 3 3.5 4 4.5
Normalized peak force, BW
Fig. 31 - Relationship between maximum angular position of ankle and normalized peak force
No correlation was found between the peak load rate with the joint angular
positions ofthe hip, the knee, the ankle and the trunk inclination . A frequency plot of
the peak load rate indicated that it is not a normal distribution curve, so Spearman
rank correlation was used to correlate the peak load rate with the joint positions.
The correlation coefficients of the peak load rate with the joint positions had values
of-0.22 to 0.43, and p>0.05. Details of the results is included in appendix-statistic.
91
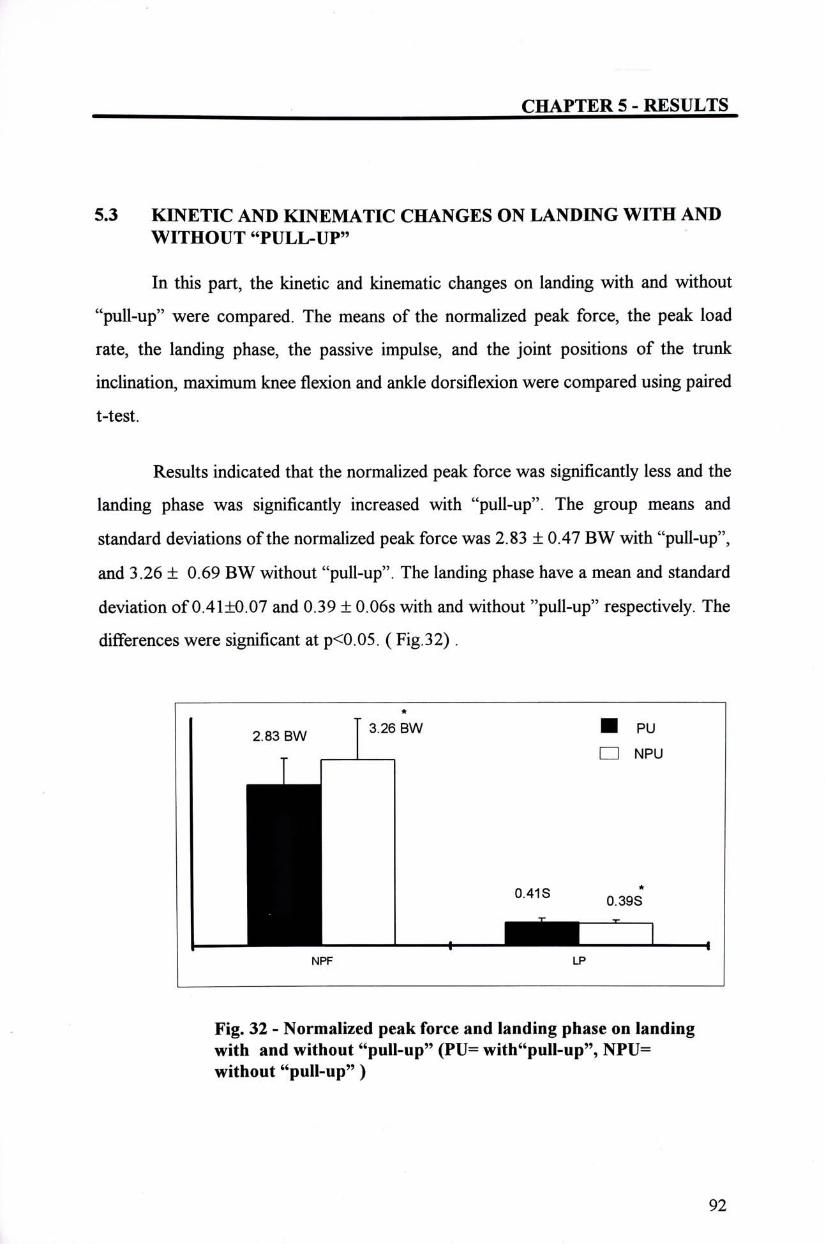
CHAPTER 5 - RESULTS
5.3 KEVETIC AND KINEMATIC CHANGES ON LANDEVG WITH AND WITHOUT "PULL-UP"
In this part, the kinetic and kinematic changes on landing with and without
"pull-up" were compared. The means of the normalized peak force, the peak load
rate, the landing phase, the passive impulse, and the joint positions of the trunk
inclination, maximum knee flexion and ankle dorsiflexion were compared using paired
t-test.
Results indicated that the normalized peak force was significantly less and the
landing phase was significantly increased with "pull-up". The group means and
standard deviations of the normalized peak force was 2.83 土 0.47 BW with "pull-up",
and 3.26 土 0.69 BW without "pull-up". The landing phase have a mean and standard
deviation of0.41±0.07 and 0.39 士 0.06s with and without "pull-up" respectively. The
differences were significant at p<0.05. ( Fig.32).
*
2.83 BW T 3-26 BW • PU ^_J___^ • NPU
I 0 . 4 1 S o.39S _ , • T I .
NPF LP
Fig. 32 - Normalized peak force and landing phase on landing with and without “pull-up,,(PU= with"pull-up", NPU= without "pull-up")
92
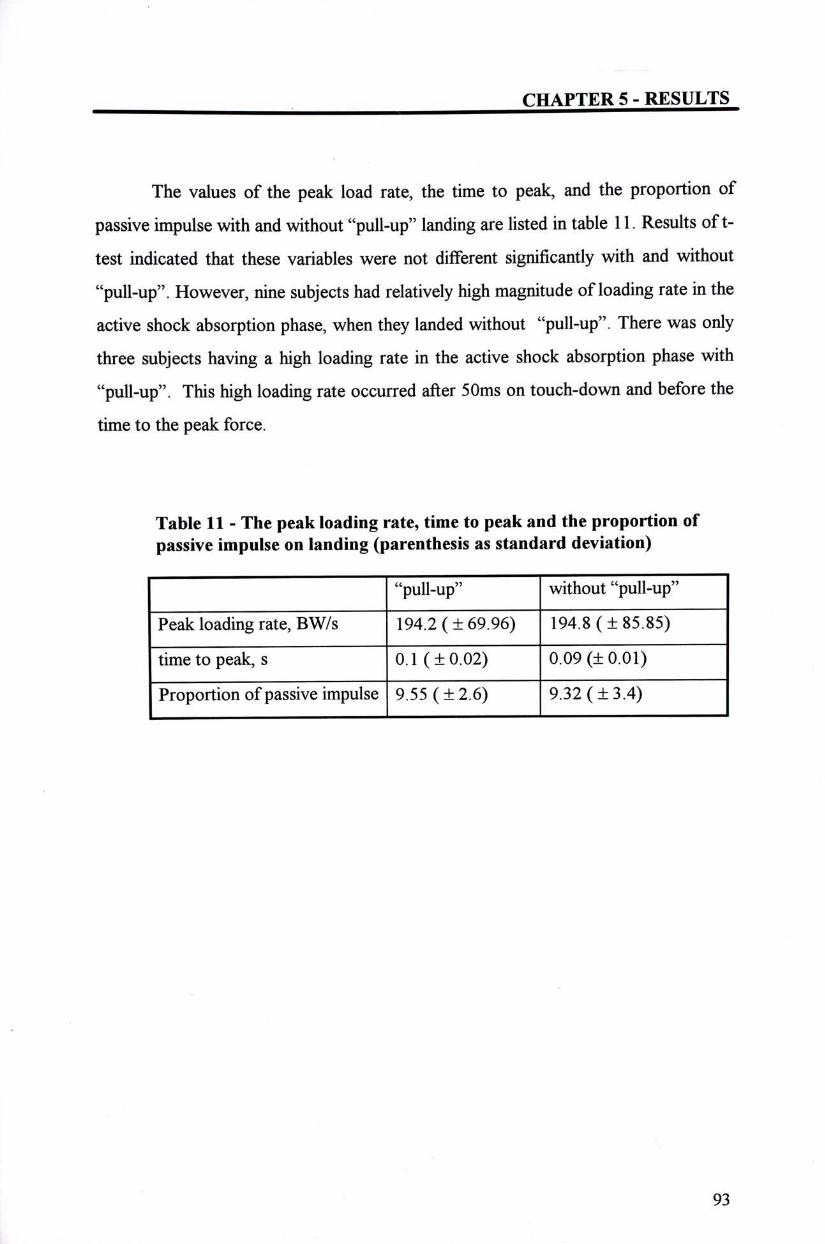
CHAPTER 5 - RESULTS
The values of the peak load rate, the time to peak, and the proportion of
passive impulse with and without "pull-up" landing are listed in table 11. Results o f t -
test indicated that these variables were not different significantly with and without
"pull-up". However, nine subjects had relatively high magnitude ofloading rate in the
active shock absorption phase, when they landed without "pull-up". There was only
three subjects having a high loading rate in the active shock absorption phase with
"pull-up". This high loading rate occurred after 50ms on touch-down and before the
time to the peak force.
Table 11 - The peak loading rate, time to peak and the proportion of passive impulse on landing (parenthesis as standard deviation)
"pull-up" without "pull-up"
Peak loading rate, BW/s 194.2(土69.96)~ 194.8(±85.85)
time to peak, s 0.1 (±0.02) 0.09 (±0.01)
Proportion ofpassive impulse 9.55 ( 士 2.6) 9.32 ( 士 3.4)
93
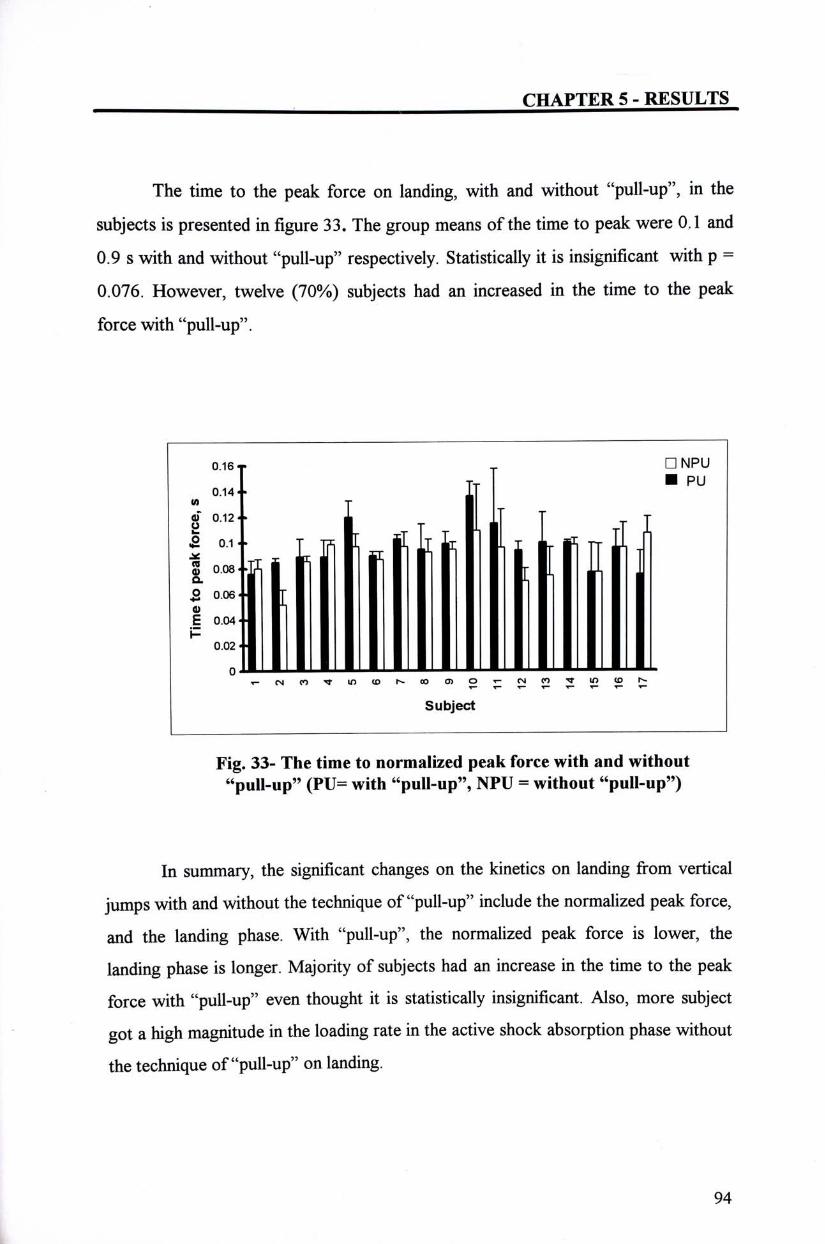
CHAPTER 5 - RESULTS
The time to the peak force on landing, with and without "pull-up", in the
subjects is presented in figure 33. The group means of the time to peak were 0,1 and
0.9 s with and without "pull-up" respectively. Statistically it is insignificant with p =
0.076. However, twelve (70%) subjects had an increased in the time to the peak
force with "pull-up".
0.16T T DNPU TT • PU
0 . 1 4 " , W T g 0.12«. I T T T T
£ 0.1 • • T ]?j [ T 1 i TT J \ V — x r n
S 0.08-pi I 1 r I L Q. K I o 0.06 ‘. r 0 I E 0.04 • >
0.02 « •
0 T~ r>j CO ^ in iD h- oo o> o - c>< co ^ m v> t
Subject
Fig. 33- The time to normalized peak force with and without "pull-up" (PU= with "pull-up", NPU = without "pull-up")
In summary, the significant changes on the kinetics on landing from vertical
jumps with and without the technique of"pull-up" include the normalized peak force,
and the landing phase. With "pull-up", the normalized peak force is lower, the
landing phase is longer. Majority of subjects had an increase in the time to the peak
force with "pull-up" even thought it is statistically insignificant. Also, more subject
got a high magnitude in the loading rate in the active shock absorption phase without
the technique of"pull-up" on landing.
94
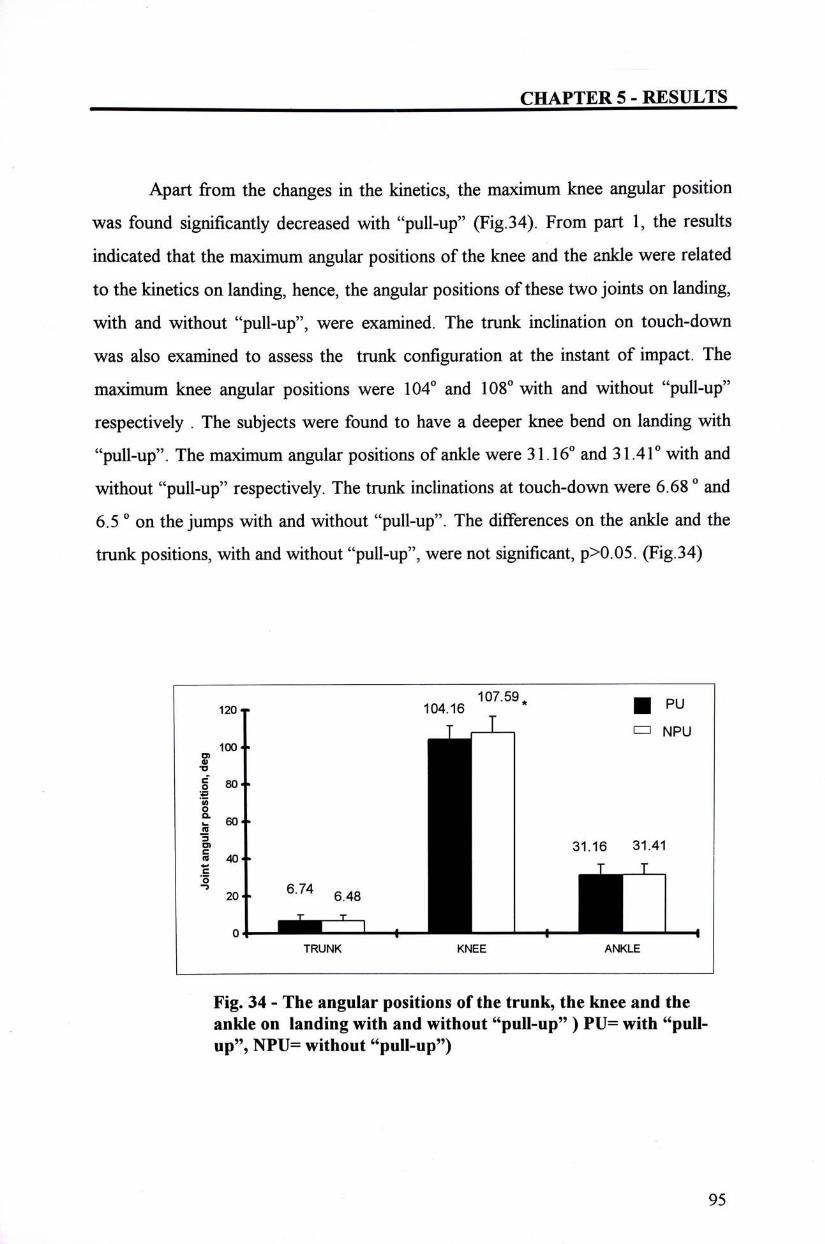
CHAPTER 5 - RESULTS
Apart from the changes in the kinetics, the maximum knee angular position
was found significantly decreased with "pull-up" (Fig.34). From part 1, the results
indicated that the maximum angular positions of the knee and the ankle were related
to the kinetics on landing, hence, the angular positions of these two joints on landing,
with and without "pull-up", were examined. The trunk inclination on touch-down
was also examined to assess the trunk configuration at the instant of impact. The
maximum knee angular positions were 104�and 108�with and without "pull-up"
respectively . The subjects were found to have a deeper knee bend on landing with
"pull-up". The maximum angular positions of ankle were 31.16�and 31.41�with and
without "pull-up" respectively. The trunk inclinations at touch-down were 6.68 ° and
6.5 o on the jumps with and without "pull-up". The differences on the ankle and the
trunk positions, with and without "pull-up", were not significant, p>0.05. (Fig.34)
107.59* • p,, l20j 104.16 • PU I ' 口 NPU
31.16 31.41 T T * ~ n
… • • • TRUNK KNEE ANKLE
Fig. 34 - The angular positions of the trunk, the knee and the ankle on landing with and without "pull-up" ) PU= with "pull-up", NPU= without "pull-up")
95
CHAPTER 6 - DISCUSSION
CHAPTER 6 DISCUSSION
6.1 KEVETIC CHANGES
Vertical force is a measure of the external loading on the musculoskeletal
system during an activity, and it is generally assumed that reducing the load will have
the effect of reducing the frequency of injuries. In part 1,the kinetic and kinematics
changes on landing with "pull-up" were examined. It was found that the peak vertical
forces ranged from 2.46 to 4.04 BW with a mean and standard deviation of 2.83 士
0.47 BW. These values are higher than the high impact aerobic dance movement as
reported by Ricard and Veatch (1990). In their study, the subject were jump from the
floor with an air-borne phase. When we compared this value with that of other
jumping sports, they were less than that of gymnasts, volleyball, and basketball
(Adrian & LaugWin 1983, McNitt-Gray et al. 1993, Valiant and Cavanage 1985).
Their loading forces during landing were 5, 3.7, and 4 BW respectively.
Jumping and landing activities form a major component of dance, gymnastic,
volleyball, and basketball (McNair & Marshall 1993, Dufek & Bates 1989,1991). In
all of the above studies, researches tried to conduct the studies in a similar condition
that the players were having during their activities. In the study on the gymnasts by
McNitt-Gray et aL , the subjects had drop landings on both feet from 3 different
heights which produced velocities that female gymnasts experienced when
dismounting from the balance beam and uneven parallel bars. Adrian and LaugWin
conducted the study on 15 volleyball players performing moving block, and landed on
both feet. The study on 10 basketball players was carried out by Valiant and
Cavanage during a simulated basketball rebound activity.
Epidemiology studies on ballet dancers indicated that 70% of the injuries are
sustained over the lower extremity (Reid 1978, Solomon et al. 1992, Wong et al.
96
CHAPTER 6 - DISCUSSION
1995). The knee and the ankle are the most common injury sites (Micheli 1983, Reid
1987,Roverse 1983, and Solomon et al. 1992). Patellofemoral joint problems,
meniscus injuries, stress fracture and Achilles tendinities are associated with the
sudden acceleration and deceleration on jumping and landings (Reid 1988,Schafle
1990). Sprained ankles are also common due to misstep on landings.
The National Collegiate Athletic Association (NCAA) reported that the injury
rates of women athletes in gymnastics, basketball and volleyball are among the top
five in collegiate sports from 1992 to 1993 (Ireland 1994). Many injuries associated
with these jumping sports occur in the lower extremity, and were associated with
landing from jumping ( McAuley et al. 1987, Rice et al. 1994, and Dufek and Bates
1992) . Gymnastic injury rate was the highest in collegiate sports. Gymnasts suffered
from trauma and overuse injuries, with overuse injuries on the knee being the most
common ( Weiss 1994, McNitt-Gray et al. 1993). The impact loading from dismount
landings is associated with the injuries sustained by the gymnasts ( McNitt-Gray et
aL 1993). Knee injuries accounted for 59% of the volleyball injuries (Rice &
Anderson 1994). It was associated with the jumping and twisting on landing
performed by the volleyball players. Inversion sprained ankle is also a common type
of volleyball injuries resulting from an inversion force being placed on the supinated
ankle during landing. Frank and Bassett (1994) indicated that the most common sites
of basketball injuries are the knee and the ankle. A survey carried out by Gray et al.
(1985) on the female basketball players reported that 58% of all injured players were
landing from a jump. The knee joint is the most common injury site (72%). One of
the mechanisms of knee injuries was associated with landing off balance. Another
common injury associated with landing is sprained ankle, which occurs when the
player's foot is accidentally placed on anther's foot while running or coming down
from a rebound.
97
CHAPTER 6 - DISCUSSION
The requirements and the injury patterns on gymnasts and ballet dancers are
similar. They are required to have repetitive landings with little support from
footwear. However, the gymnasts land from dismounting from apparatus, which
imposes more loading on their musculoskeletal system. Both volleyball and basketball
players suffer from traumatic injuries as well as overuse injuries. Basketball is a
contact sports, and injuries on landings are associated with off balance or false
landings. On volleyball players, overuse inflammation of the patellar tendon occurs
as a consequence of repetitive jumping and landing. Apart from this, the volleyball
players play on multiple surfaces, such as, sand, wood, synthetic floor, and concrete.
Overload might happen on playing surfaces with poor shock absorption property,
such as,concrete.
Sports injuries due to overload are the result of a force in a specific structure
of human body exceeding the critical limits, which can occur with a single force
exceeding the critical limit, or a number of cyclic loading causing a combined fatigue
effect (^igg 1985). Studies on the critical limits in a special structure on human
subjects are complex and difficult. On the other hand, the high incidence rate of
injuries on the lower extremity of the athletes on jumping sports leads to the
assumption that the loading on the athletes' body are too high.
On landing from vertical jumps, the vertical ground reaction force is absorbed
by passive and active shock absorption system. Muscles of the trunk and the lower
extremity are the active shock absorber and attenuate the impact force through a
lengthening of the muscle fibbers. This active impact force can have training effort to
increase the muscle strength of the muscles by tissue adaptation. Adaptive response
to repetitive loading can occur on the tissue if the loading exceed the frequency and
intensity necessary to maintain the tissue. Cell synthesis function exceed degradation,
and the matrix macromolecules may change to accommodate the increased load
98
CHAPTER 6 - DISCUSSION
(Buckwalter and Woo 1994) However, if the loading exceed the adaptive response,
injuries on the tissues may occur.
In the passive mechanism, shock attenuation relies on bone, cartilage and
collagenous tissues. The trabecular bone absorb the energy through local and gradual
minimal rupture which can be restored in the living bone (Radin 1974). However, if
multiple overloading occurs, collapse of the trabecular bone leads to fractures. In
dense fibrous tissues, such as tendon and ligaments, overload will lead to
degenerative changes. Degenerative changes in the tissues cause a disruption in the
collagen microfibrils and splitting of the collagen fibrils. As a result, there is a
reduction in the strength of the tissues. The weakened tissue may deform more
easily, and loading of this degenerative tissues may cause pain (Buckwalter and Woo
1994).
Results from this study indicated that about 90% of the impulse is absorbed
by the muscles during the active shock absorption phase. This can have training
effects on the muscles, if the intensity and frequency are within the critical limits of
the tissues. However, the high incidence of overuse injuries associated from landing
amongst the ballet dancers, indicates that shock absorption failure do occur.
Predisposing cause of shock absorption failure may due to muscle weakness.
The quadriceps and the calf mechanism are the major muscles responsible for
shock absorption on landing (McKinley & Pedotti 1992, Devita & Skelly 1992). The
hip extensors work eccentrically to control the hip flexion velocity in late descent
phase and continues working eccentrically in the landing phase. The hamstrings work
concentrically in late descent phase to assist the hip extensor and to preset the knee in
flexion on touch-down. Weakness in these muscles will affect the impact attenuation
mechanism.
99
CHAPTER 6 - DISCUSSION
On female ballet dancers, the strength of the ankle plantarfIexors and
dorsiflexors are 40% stronger than normal people (Hamilton et al. 1992). However,
the strength of the quadriceps on ballet dancers are comparable to normal people,
but less than that of the gymnasts and volleyball players (Hamilton et al. 1992,
Kirkendall 1984). In view of the repetitions of jumps that the dancers have to
perform, one would expect a stronger quadriceps from adaptive response. The
weakness in these muscles may reduce the power of shock absorption from this
group of muscles on landing. As a result, a greater proportion of the shock is
attenuated by other muscles, such as, the ankle plantarflexor and dorsiflexor. When
these tissues fail from overload, inflammation and degeneration will take place.
Furthermore, the passive shock absorption mechanism may have to take extra loading
when the active shock mechanism fail. Excessive loading on the passive shock
mechanism tissues, such as, bones and ligaments, lead to injuries. Studies have
indicated that stress fractures on metatarsals bones and tibia have a higher incidence
rate amongst ballet dancers.
Ballet dancers start and finish their vertical jumps with plie, which may alter
the muscle mechanics on the musculoskeletal system. The electromyelogram study
conducted by Clipperton-Roberson et al. (1984) indicated that the vastus mediali is
the major muscle in controlling a grand plie in a second position. Co-contraction of
the hamstrings and the adductors occur during the motion. Hence, the ballet dancers
may use the hip adductors in controlling landing in stead of the hip extensors. Study
from Hamilton et al. (1992) indicated that there is a strength deficit in the hip
adductors amongst the ballet dancers. If the hip adductors is one of the shock
absorber on landing, majority of the shock will fall onto the ankle and bones.
Apart from muscle weakness, shock absorption failure occurs when the
muscle fatigue. The young dancers practice for 14.7 to 25 hours a week (Reid,1987
100
CHAPTER 6 - DISCUSSION
Wong et aL1995). This long hour of practice may cause muscle fatigue, which affect
the co-ordination and reflex activities from the muscles.
On landing, all subjects processed a high magnitude in loading rate during the
passive shock absorption phase. The peak load rate is a measure of the rate of
loading on the musculoskeletal system. Results from this study indicated that the
peak loading rate ranged from 78 to 310 BW/s with a group mean of 194±70 BW/s.
This wide range indicated that dancers landed with great variability in their peak load
rate. Since this happened during the passive shock absorption phase, it could only be
attenuated by the pre-programmed muscular activities prior to landing (Lees 1981).
Mizrahi & Susak (1982),in line with StacofF et al. (1988),have hypothesed that this
activity may be a presetting of the lower extremity muscle tensions during the decent
phase. Electromyelogram studies have confirmed that gastrocnemius, solus, tibialis
anterior, vastus lateralis, rectus femoris and hamstrings are the muscles in tension in
preparation for landing (McKinley & Pedotti 1992, Dyhre-Poulsen et al. 1991).
These studies reported an increased in muscles tension in all the muscles under
investigations. The trunk muscles, such as, the psoas major may contribute to the
control of trunk tension on landing. However, the author does not process any
information of these.
6.2 KmEMATICS CHANGES
The trunk inclination on touch-down ranged from 3.4° to 13.8° with a mean
of 6.7 ° . This value is very close to that obtained from Clippinger-Robertson et al.
(1984). In their study, trunk inclination in plie in first position was assessed and found
to have a value of 6 °. The similar amount of trunk inclination in plie in static and
dynamic situation suggested that the ballet dancers have good control of their trunk
configuration. To achieve elegance, they are taught to maintain an erect posture on
101
CHAPTER 6 - DISCUSSION
landing, and allow minimum movement on their pelvic and trunk. Biomechanically,
this may increase their balance on landing. In order to maintain balance,the line of
gravity have to fall within the base of support, that is, the foot. On touch-down from
a jump, the dancers' feet are positioned with the toes pointing sideways, this reduce
the supporting surface in the anterio-posterior direction. The reduction in the A-P
direction in the base of support limit the amount of trunk inclination that the dancers
can have. On the other hand, the erect posture on the trunk will increase stresses
imposed on the spine.
Hip abduction took place on landing as the lower extremity was positioned in
an externally rotated position. The average amount of hip abduction was 36� .
Comparison of the maximum hip angle with other studies on ballet dancers was not
attempted because the data of earlier studies were not available to the author.
The dancers landed with maximum knee joint angle ranged from 8 8 � t o 120°
with a mean of 104°. This value is smaller than that obtained from Clarkson et al.
(1984). In their study the average knee angle was 107° on landing from a saute. When
this value was compared with that from other jumping sports, the value was of similar
magnitude. The mean maximum knee angular positions observed during drop
landings performed by female intercollegiate gymnasts from a height of 0.69 m was
1 0 1 � ( McNitt-Gray et al.,1993). The study on female intercollegiate basketball and
volleyball players demonstrated that the maximum knee angular position during
landings from a drop height of 0.59 m with stiff landing technique while wearing
court shoes were in the order of 103° (Devita & Skelly, 1992). Apparently, subjects
from different activities adopted a preferred landing strategy with the maximum knee
angular positioned from 100� to 110�. In order to absorb the energy processed on
landing, muscular strength must be adequate with respect to the distance through
which force is applied. In order to ensure a good control of landing, the muscle
strength of the knee between 90° to 180° should be assessed and appropriate
102
CHAPTER 6 - DISCUSSION
exercise program can be implemented if necessary. The exercises should include both
quadriceps and hamstrings muscles: the quadriceps have been identified as the
muscles for shock absorption and the hamstrings are active in the late descent phase
for knee flexion. The program should include concentric and eccentric exercises in
closed kinetic and open kinetic chain.
On landing, the maximum ankle angular position ranged from 2 3 � t o 40�with
a mean of 31� . The maximum ankle angular position on male gymnasts was about 10°
(McNitt-Gray 1989). Comparing these two figures, female dancers acquired a
greater dorsiflexion on the ankle joint on landing than the gymnasts. For those
dancers with limited ankle dorsiflexion, they might achieve dorsiflexion through
pronation on the subtalar joint. As a result, excessive stress will be placed on the
structures on the medial side of the ankle and the knee. The results from Hamilton et
al. (1992) indicated that ballet dancers show adaptive response on the strength of the
ankle muscles from training. However, they also have a decreased in the range of
ankle dorsiflexion by 44%, which may be due to the daily use of the ankle by the
dancers in an en pointe position without appropriate stretching. Achillis tendinitis is a
common injury amongst the ballet dancers which has been associated with a decrease
in the flexibility of the gastroneous-solus complex (Clancy 1982). In order to reduce
the incidence rate of Achillis tendinities, Bejjani (1987) and Fernandez-Palazzi et al.
(1990) suggested that the ballet dancers should stretch their ankle to 30 ° of
dorsiflexion with knee bent. Results of this study reinforce their suggestions. •
103
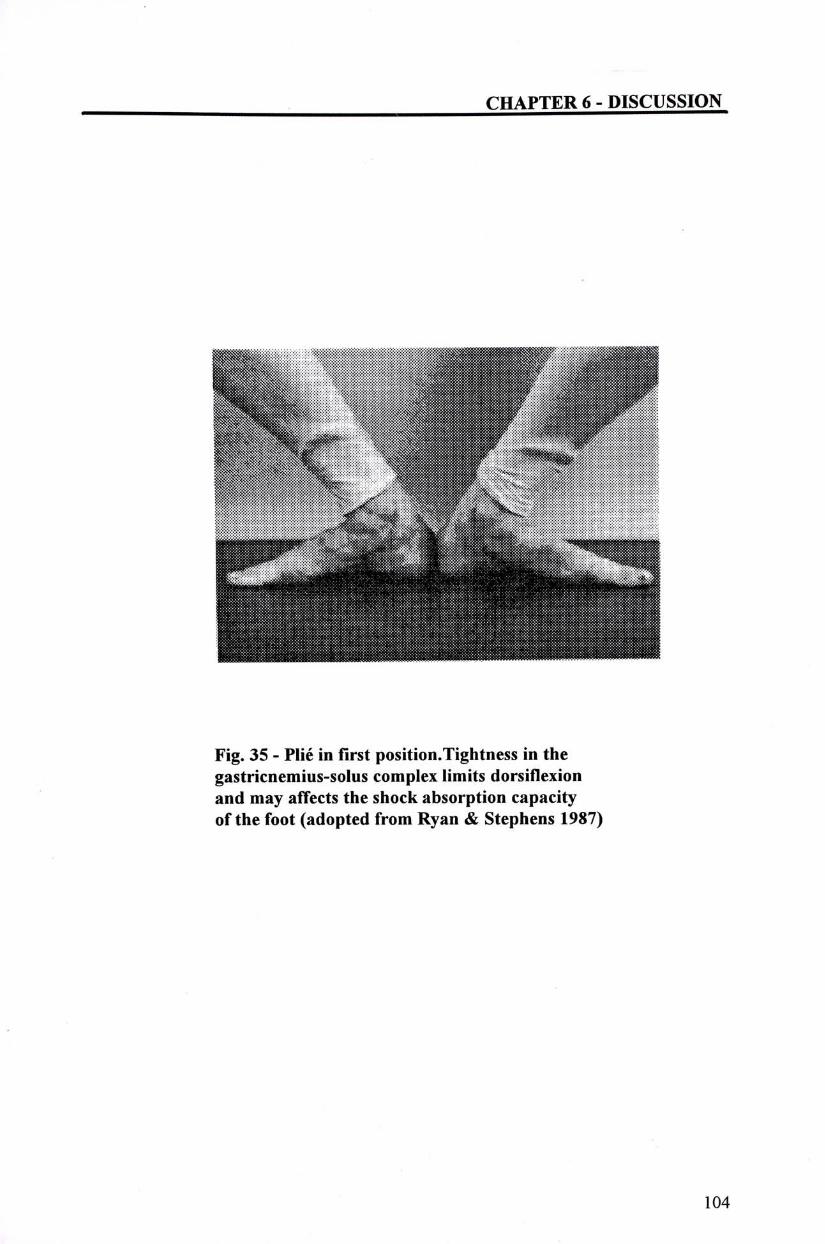
CHAPTER 6 - DISCUSSION
^ ^ H^^^^^^"^m
I ^ M H ^ ^ i ^ S
mKtm Fig. 35 - Plie in first position.Tightness in the gastricnemius-solus complex limits dorsiflexion and may affects the shock absorption capacity ofthe foot (adopted from Ryan & Stephens 1987)
104
CHAPTER 6 - DISCUSSION
6.3 CORRELATION BETWEEN KEVETICS AND KINEMATICS
This study clearly indicated that vertical loading could be reduced by
changing the landing posture if properly executed. The normalized peak force was
significantly lowered with a smaller maximum knee and ankle positions. The results
agreed with the findings on gymnasts (McNitt-Gray 1989), and on volleyball players
(StacofFet al. 1988). From a biomechanical point of view, the impact momentum has
to be reduced to zero after landing, following Newton's second law. The intensity of
the impact force depends on the velocity right before landing as well as the time of
deceleration. An increase in knee flexion and ankle dorsiflexion on landing would
increase the total time of deceleration, which in turn reduces the peak loading force.
This study supports dancers' belief that a deep plie could enhance a soft landing.
An increase in knee flexion and ankle dorsiflexion on landing requires a good
control of the knee and ankle muscles, as well as an adequate flexibility of the
gastrocnemius-soleus complex.
Good flexibility and strength are not enough for a controlled landing. Co-
ordination is also essential to control the movement. Study from Drhre-Poulsen et al.
(1991) indicated that on landing, the EMG in the solus muscles and in the anterior
tibial muscle are preactivated, and show alternating activities after touch-down. The
study from McKiney and Pedotti (1992) also found that the muscles of lower
extremity are preactivated. They detected alternating bursting between the anterior
tibialis and gastrocnemiu-solus muscles. These finding suggested that on landing co-
ordinating activities occur before and after landing. Co-ordination requires high
concentration. If the dancers are fatigued or not concentrating, the fine co-ordination
required on landing will be lost. Inversion ankle sprained might occur as a result of
missteps.
105
CHAPTER 6 - DISCUSSION
Unlike gymnasts or volleyball players, the ballet dancers cannot use
environmental factors to reduce the loading forces on landing. The construction of
the slippers and pointe shoes are primarily for style and tradition (Hardaker &
Erickso, 1984). Smaller professional ballet companies, ballet schools, and local
theaters cannot afford the special type of dance floor (Miller et al.l990). Hence
postural adjustment and pre-programmed muscular activities are the main techniques
to attenuate the loading forces on landing. From this study, the postural adjustment
that can reduce the loading force is having a deeper plie on landing. In order to
achieve a deep and controlled plie, supplementary conditioning exercises on
stretching exercises to the gastrocnemius-solus complex, and strengthening exercises
to the quadriceps and the hamstrings muscles are strongly recommended. Regular
check up on the flexibility of the calf muscles, quadriceps and hamstrings strength are
good guides to check the shock absorption mechanism of individual dancer. Beyond
strengthening and stretching of the muscles, emphasis should also be given to a co-
ordination training program.
The normalized peak force and peak load rate were measured in a condition
that the subjects were not fatigue. The magnitudes of these two variables might be
different when the subjects are tired, and their muscles are not able to function in a
coordinated manner. Furthermore, the activity under investigation is landing on both
feet from a simple vertical jump. Travelling jumps with landing on single leg may
induce more loading on dancers' body.
106
CHAPTER 6 - DISCUSSION
6.4 EFFECTS OF "PULL-UP"
Results from this study indicated that the mean normalized peak force was
significantly decreased and the loading phase was significantly increased with "pull-
up" .When we examined the pattern of peak load rate, the increase in incidence of a
second peak in the active shock absorption phase without pulling up indicated that
the normalized peak force was reached in a faster manner. These confirmed the
dancers' belief that pulling up could lead to a softer and controlled landing.
The curvatures of the spine is exaggerated by gravity,which can be controlled
by small muscular tensions of the back and lower extremity (Warwick & William
1973). Ballet dancers were taught to prepare landing by tightening the abdominal and
back muscles, that is, "pull-up". The pulling up of these muscles decrease the
curvatures of the spine and may bring the center of body mass towards the line of
gravity (the line of gravity is about a centimeter posterior to the sacral promontory).
We postulated that with "pull-up", the center of body mass is closer to the line of
gravity. This enable the dancers to balance on their toes, and gradually lower their
toes down onto the metatarsal heads. The controlled lowering down of the toes
creates a smooth increase in force towards the vertical peak force. Without "pull-up,
the centre of body mass is ftirther away from the line of gravity, the dancers have to
increase their base of support by a rapid lowering of their toes onto the metatarsal
heads. This decrease the landing phase, and increase the vertical peak force.
Furthermore, the uncontrolled collapse of the toes onto the metatarsal heads causes a
sudden increase in force, resulting with a second peak in the loading rate. This
sudden collapse of the toes may induce a sudden pull on the long flexors and the
plantar fascia of their feet.
《
107
CHAPTER 6 - DISCUSSION
6.5 LEMITATION OF THE STUDY
This study has successfully identified the effects of postural control on the
landing force and loading rate, as well as to verify the belief of "pull-up" amongst
dancers. However, there are limitations of the study.
The most important artifact is associated with the relative displacement
between markers and underlying surface. The markers were placed on the skin or
subject's leotard with double adhesive tape. Relative movement might happen,
especially during execution of movement, and change in the relative positions of
markers. Bone markers could reduce this artifact, however, it is invasive and
impossible when the study involves multiple joints. Plate markers could be used, but
would be cumbersome with straps, and would affect performance. Hence, skin
markers were used for this study.
Another disadvantage with the marker system is vibration of markers during
impact. This effect was reduced with the use of light weight markers. Furthermore,
the events of interest, that is, maximum joint angular positions of lower extremity
occur after the high impact at first contact. Vibration of the markers on the trunk was
usually less than those in the lower extremity
During videotaping, the camera axis should be perpendicular to the plane of
motion ofthe object being videotaped. The lower extremity was started and landed in
a turn-out position. The turn-out is achieved mainly by external rotation of the hip.
The average hip external rotation on ballet dancers was about 52° ( Hamilton et al.
1992,Kravitz et al. 1987). Hence the second camera, which capture the movement
images of the lower extremity was positioned at 40® to the mid-sagittal plane of the
subject. On dancers with greater or lesser hip external rotations, this might introduce
some error .
108
CHAPTER 6 - DISCUSSION
In this study, we recruited students with advanced ballet training. In Hong
Kong, there is only one Academy which provide full-time ballet training. There were
a total of twenty-one students at the time when this study was undertaken. After the
exclusion of students who were under the exclusive criterion, and who was not
willing to participate in this study, the study ended up with eighteen subjects. During
data collection, part of the data of one subject was missing, so the sample size ofthis
study is seventeen. This small sample size might lower the power in detecting
differences and association between the two variables. The chance of having a
statistical result is even lower if the differences between the two techniques are small.
Furthermore, the effects of "pull-up" amongst student dancers may be difference
from the professional dancers.
The beliefofthe effect of"pull-up" was assessed on the student dancers. This
study did not use any assessment tool to control the technique they executed. This
was used as an explorative study to test on dancer's belief on the techniques that they
were executed. Different dancers might execute “pull-up,,in a differ manner, and will
require a more detailed study to verify.
109
CHAPTER 6 - DISCUSSION
6.6 SUGGESTION FOR FUTURE STUDffiS
This study had identified some of the postural factors in relation to the
normalized peak force. Another aspect is the joint positions on touch-down. Flat-foot
and toe-heel landing has been studied on other jumping sports. The ballet dancers
were taught to land on toes, and lowered their heel on the landing surface. Ankle
plantiflexion on touch-down, the velocity at which the heel strikes the ground and its
relation with the normalized peak force can enhance a better understanding on the
requirement on the ankle joint, and its influencing effect on the kinetics. An
equipment with higher sampling rate, to study the velocity of ankle at the high
impact phase, is recommended.
The knee joint acts as a shock absorber during landing. The quadriceps is one
ofthe prime muscle that absorbs the shock through a controlled lengthening. Studies
have been carried out on the musculoskeletal characteristics on the professional and
elite dancers (Mostardi et al. 1983, Hamilton et al. 1992). However, their results
could not be generalized on young and novice dancers. Micheli (1983) reported
higher incidence of knee on these group of dancers. It is worthwhile to explore the
musculoskeletal characteristics of the novice and compare them with the elite
dancers. Advice and appropriate training could then be given to the young and talent
dancers. The relationship between the strength of the quadriceps and the kinetics
could also be investigated.
The effects of foot wear on landing have been studied on netball players and
male dancer ( Steele and Milburn 1987, Miller et al. 1990). No investigation on this
aspect has been carried out on the female dancers with their unique foot wear, that is,
pointe shoes. Even though the outlook of the pointe shoes have to maintain its
tradition and aesthetic purpose, manipulation on the material used and the sharp of
the arch support might change the amount of shock absorption property by the shoe.
110
CHAPTER 6 - DISCUSSION
The pre-programmed non-reflex muscle action has proved important in peak
force attenuation (Melville-Watt and Jones 1971, Greenword and Hopkins 1976,
Lees 1981). This study has quantitatively shown the motion of the trunk on touch-
down. It does not provide information on the muscular activities of the various
muscles of the trunk during the motion. EMG studies on the lower extremity on
landing have been carried out to quantify the amount of muscular activities prior to
landing on other athletes ( Dyhre-Poulsen et al. 1991, McKinley and Pedotti 1992).
The unique posture on landing by ballet dancers may require a different pattern of
muscle activity. Hence EMG studies on the trunk and lower extremity muscles during
landing from vertical jumps can be carried out on the dancers. Information from the
EMG studies can help to explain the kinetics and kinematics on the ballet dancers
during landing impact.
"Pull-up" is a technique which requires the co-contraction of the abdominal
and back muscles. The dancers believe that it could enhance a soft and controlled
landing. This study aims at testing this belief. Future investigations on the muscle
activities involving "pull-up" can improve the understanding of this technique. It is
only after we understand the technique that we are able to verbalize this in dance
wordings. The kinematics change on touch-down with "pull-up" should also be
investigated, so that dance teachers could visually identify students' landing
technique.
111
CHAPTER 6 - DISCUSSION
6.7 EVlPLICATIONS OF THIS STUDY
Results of this study indicate that the majority of the impact is absorbed by
the muscular system. The normalized peak force decreased with a greater knee
flexion and ankle dorsiflexion on landing . Quadriceps and calf muscles are the major
muscles responsible for controlling the movement. Weakness in these group of
muscles may lead to early fatigue. Fatigued muscles can result in imbalance and
uncoordinated movements. These may produce poor landing with high peak force
and load rate. Apart from the quadriceps and calf muscles, the hamstrings are also
important in controlling the movement on landing. In order to survive in this high
level of demanding sport, students dancers are recommended to undergo screening
test on these muscles, so that appropriate exercise program could be tailored to their
need. These could be done a few weeks before the starting of school term so that
enough time is allowed to train up the muscles.
A co-ordination training program is also essential. The lower extremity
muscles are activated before and after landing. The tibialis anterior and the
gastrocnemius-solus complex were found to have alternate burst of activities. These
suggested that the muscles of lower extremity work in a coordinated pattern at an
appropriate time to achieve a soft landing.
Peritendinitis, Achillis tendinitis and stress fractures are common amongst
ballet dancers, which may associated with landing from jumping. One of the factors
for Achillis tendinities is decrease in flexibility. The decrease in dorsiflexion will
decrease the loading phase. A decrease in loading phase leads to an increase in
loading force, which may overload the tendon. Unfortunately, dancers were found to
have less than normal ankle dorsiflexion. Through personal observation, it was found
that most dancers do adequate warm-ups, but not all of them include ankle stretching
in their program. Emphasis should be given from physicians, rehabilitation therapist,
and dance teachers to the dancers to stretch the gastrocnenius-solus complex.
112
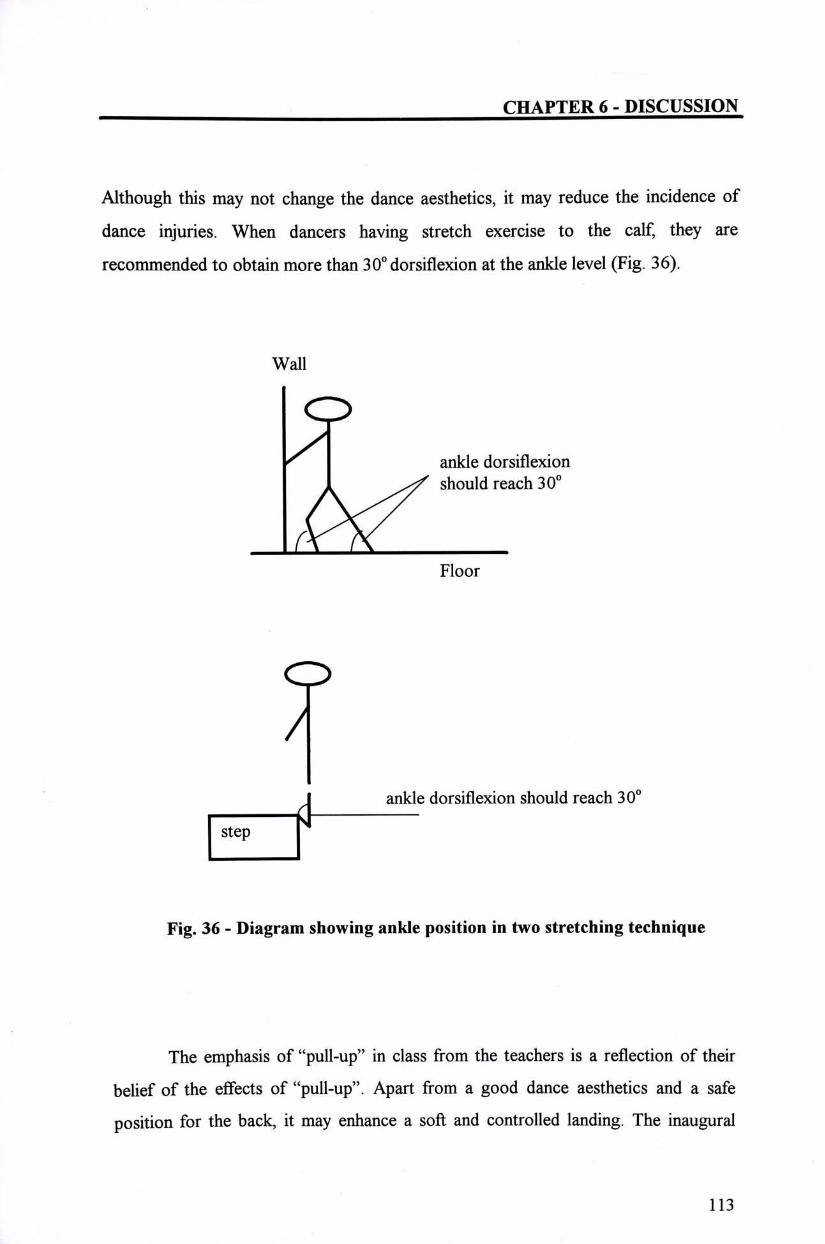
CHAPTER 6 - DISCUSSION
Although this may not change the dance aesthetics, it may reduce the incidence of
dance injuries. When dancers having stretch exercise to the calf, th^y are
recommended to obtain more than 30° dorsiflexion at the ankle level (Fig. 36).
Wall
0
^ ^ ankle dorsiflexion 人 ^ ^ should reach 30�
A ^ Floor
o
/
1 ankle dorsiflexion should reach 30® f^
step
Fig. 36 - Diagram showing ankle position in two stretching technique
The emphasis of "pull-up" in class from the teachers is a reflection of their
belief of the effects of "pull-up". Apart from a good dance aesthetics and a safe
position for the back, it may enhance a soft and controlled landing. The inaugural
113
CHAPTER 6 - DISCUSSION
results from this study may stimulate more studies on "pull-up". Furthermore, the
controlled lowering of the toes onto the metatarsal heads requires good muscle work
from the long flexors of the foot as well as the intrinsic muscles of the foot. Exercises
to the long flexor and the intrinsic foot muscles is recommended to ensure a
controlled landing.
114
CHAPTER 7 - CONCLUSIONS
CHAPTER 7 CONCLUSIONS
Seventeen advanced ballet students were selected from the Hong Kong
Academy for Performing Arts. These subjects performed ten vertical jumps on a
force-plate with and without the technique of "pull-up". The movements were
captured and analyzed by a 2-D motion analysis system. Conclusions from this study
are :
1. The mean normalized peak force on landing from vertical jumps is 2.83 BW,
which happens at a mean time of 100ms after landing.
2. 90% of the vertical impulse experienced on landing is being absorbed by the
active shock absorption mechanism�
3. The maximum average angular positions of the hip, the knee and the ankle on
landing are 36。,104。,and 31 ° respectively. The average trunk inclination on
landing is 6.8�.
4. The normalized peak force on landing is significantly related to the maximum
knee and ankle angular position. The lower the knee bend , the smaller the
loading.
5. No correlation is found between the normalized peak force and the trunk
inclination and hip angular position.
115
CHAPTER 7 - CONCLUSIONS
6. No correlation is found between the peak load rate and the joint positions of
the hip, the knee the ankle and the trunk inclination.
7. The normalized peak force is significantly reduced, and the landing phase is
significantly increased with the execution of"pull-up"
8. No significant difference is found in the peak loading rate with the execution
of"pull-up". However, less subjects have second peak loading rates in the
active shock absorption phase.
From this study, the postural factor is related to the loading force but not to
the loading rate. The knee and the ankle are the two joints which can affect the
loading force. A deeper knee bend (deeper plie) decrease the peak vertical force by
increasing the landing phase. In order to achieve a better control on landing, strength
ofthe quadriceps and hamstrings muscles, flexibility of the gastrocnemious-solus are
essential. Stretching exercises to the calf muscles with knee flex should reach 3 0 � o f
ankle dorsiflexion.
"Pull-up" is a technique that may reduce the loading force, increase the
loading phase and lower the loading rate in the active force absorption phase. The
mechanism may related to a better balance on the toes by moving the center of body
mass closer to the line of gravity.
116
REFERENCES
REFERENCES:
1. Adrian MJ, Laughlin CK. Magnitude of ground reaction while performing volleyball skills. In Matsui & Kobayashi,eds. Biomechanics VIII-B, Human Kinetics: Champaign, 1983: 903-914.
2. Adrian M & Cooper JM. Tools for assessment, improvement, and prediction of movement. In Adrian M & Cooper M, eds. Biomechnics of Human Movement, Brown and Benchmark publishers: Iowa, 1995:131-150.
3. Ayalon M, Ayalon A,Sira DB. Joint motion of the lower limb and ground reaction forces in vertical landing. In the book of abstracts of XV Congress of the International Society ofBiomechnics, 1995:78-79,
4. Bejjani FJ. Occupational biomechanics of athletes and dancers: a comparative approach. Clinics in Podiatric Medicine and Surgery 1987; 4(3) : 671-711.
5. Buckwalter & Woo. Effects of repetitive loading and motion on the musculoskeletal tissues. In DeLee JC & Drez D.,eds. Orthopaedic Sports Medicine: Principles and Practice, W.B. Saunders, 1994: 73-81.
6. Cappello A. One hundred years of measurement of human motion. In the proceeding o f X V Congress of the International Society ofBiomechnics,
7. Clancy WG. Tendinities and plantar fascitis in runners. In D'Ambrosia R, Drez D, eds. Prevention and treatment of running injuries. Thorofare, NJ: Claries B, Slack, 1982: 77-88.
8. Clarkson PM,Kennedy TE, Flanagan J. A study of three movements in classical ballet. Research Quarterly For Exercise and Sport 1984; 55 (2),
175-179.
9. Clippinger-Robertson. Principles of Dance Training, in Clarkson PM, Skrinar, eds : Science of Dance Training. Human Kinetics Books, Champaign: Illinois, 1988: 45-88.
10. Clippinger-Robertson KS, Hutton RS, & Miller DL. Mechanical and anatomical factors relating to the incidence and etiology of patellofemoral pain in dancers, in Shells eds: Proceedings of The International Symposium on the Scientific Aspects of Dance.Champaign, K>: Human Kinetic, 1986: 53-72.
117
REFERENCES
11. Devita P & Skelly WA. Effects of landing stiffness on joint kinetics and energetic in the lower extremity. Medicine and Science in Sports and Exercise 1992; 24: 108-115.
12. Dowd I . What it means to “pull-up,. Dance Magazine 1984; May: 142.
13. Dozzi PA . A Computer-assisted investigation into the effects of heel contact in ballet allegros. In Juith A eds. Dance Technology: Current applications and future trends. American Alliance for Health, 1988: 83-91.
14. Dufek JS & Bates BT. The evaluation and prediction of impact forces during landing. Medicine and Science in Sports and Sciences 1990; 22 (3): 370-377.
15. Dufek JS & Bates BT. Biomechanical factors associated with injury during landing injump sports. Sports Medicine 1991; 12 (5): 326-337.
16. Dyhre-Poulsen P, Simonsen EB, Voigt M. Dynamic control of muscle stiffness and H-reflex modulation during hopping and jumping in man. J.ofPhysiol. 1991;437:287-304.
17. Fell N & Lees A. The evaluation of vertical force load for locomotion studies. In the book of abstracts of XV Congress of the International Society ofBiomechnics, 1995: 260-261.
18. Fernandez-Palazza F, Rivas S,Mujica P. Achilles tendinities in ballet dancers. Clinical Orthop. 1990; 257: 257-261.
19. Frank H & Bassett III. Basketball. In Fu FH & Stone DA., eds. Sports Injuries: Mechanisms. Prevention.Treatment .Williams & wilkins: Baltimore, 1994: 209-222.
20. Gans A.The relationship ofheel contact in ascent and descent fromjumps to the incidence of shin splints in ballet dancers. Physical Therapy 1995; 1192-1196.
21. Gray J. Taunton JE, McKenzie DC, Clement DB, McConkey JP. et al. A survey of injuries to the anterior criciate ligaments of the knee in female basketball players. International Journal of Sports Medicine 1985; 6: 314-316.
22. Greenwood R & Hopkins A. Muscle responses during sudden falls in man. J. Physiol. 1976; 254: 507-518.
23. Hamilton WG. Hamilton LH, Marshall P, Molnar M. A profile of the musculoskeletal characteristics of elite professional ballet dancers. The American Journal ofSports Medicine 1992; 20(3): 267-273.
118
REFERENCES
24. Hamilton WG. Foot and ankle injuries in dancers. Clin Sports Med 1988; 7(1): 143-173.
25. Hamilton DL, Hamilton WG,Meltzer JD, Marshall P & Molnar M. Personality, stress, and injuries in professional ballet dancers. Am J Sports Med 1989; 17: 263-267.
26. Hardaker WT & Erickson L. The Pathogenesis ofDance Injury, in Shell CG, eds. The Dancer as Athlete. Champaign, JL, Human Kinetics, 1984: 11-29
27. Hardaker WT. Foot and ankle injuries in classical ballet dancers. Ortho Clin Nor thAml989; 20(4):621-627.
28. Howse J. Disorders o f t h e great toe in dancers. Clin Sports Med 1983; 2(3): 499-505.
29. Ireland ML. Special concerns of the female athletes. In Fu FH & Stone DA. eds. Sports Injuries: Mechanisms. Prevention. Treatment. Williams &Wilkins: Baltimore, 1994:153-187.
30. Kadel NJ, Teitz CC, Kronmal RA. Stress fractures in ballet dancers. The AmericanJournal ofSports Medicine 1992; 20 (4):445-449.
31. Kaelin X, Stacoff A, Denoth J, Stuessi E. Shock absorption during landing after a jump. In de Groot et al ., eds. Biomechanics XI-B. Free University Press: Amsterdam, 1988: 685-688.
32. Kamenski R & Fu FH. Dance and the arts. In Fu FH & Stone DA. eds. Sports Injuries: Mechanisms. Prevention. Treatment. Williams & Wilkins: Baltimore, 1994: 291-305.
33. Kleiger B. Foot and ankle injuries in dancers. In Ryan AJ & Stephens RE., eds. Dance Medicine. Pluribus Press, Inc., United State, 1987:115-134.
34. Kirkendall DT,Bergfeld JA,Calabrese L, Lombardo JA, Street G,Weiker GG. Isokinetic Characteristics of ballet dancers and the response to a season ofballet training. The Journal of Orthopaedic and Sports Physical Therapy 1984; 5(4): 207-211.
35. Kravitz SR, Huber S, Ruziskey JA, Murgia CJ. Biomechanical analysis of maximal pedal stress during ballet stance. Journal of the American Podiatric Medical Association 1986; 77(9): 484-489.
119
REFERENCES
36. Lees A. Methods of impact absorption when landing from a jump. Engineeringin Medicine 1981; 10: 207-211.
37. Lees A & McCullagh P. A preliminary investigation into the shock absorbency characteristics of footwear and foot inserts. J. Hum. Movt Stud. 1984 ; 10: 95-106.
38. Loosli AR, Benson J, Gillien DM. Nutrition and the dancer. In Ryan AJ Stephens RE.,eds. Dance Medicine. Pluribus Press, Inc., 1987:100-106.
39. McAuley E • Injuries in women's gymnastics. Am J. Sports Med 1987; 15(6) : 558-565.
40. McKinley P & Pedotti A. Motor strategies in landing from a jump. The role of skill in task execution. Experimental Brain Research 1992; 80 : 427-440.
41. McNair PJ & Marshall RN. Concepts related to impact forces at footstrike during jumping and running activities. NZ Journal of Physiotherapy 1993; 22-24.
42. McNitt-Gray JL. Kinematics and impulse characteristics of drop landing from three heights. International Journal of sports Biomechanics 1989; 7: 201-204.
43. McNitt-Gray JL, Yokoi T,& Millward C. Landing strategy adjustments made by female gymnasts in response to drop height and Mat composition. Journal of Applied Biomechanics 1993; 9: 173-190.
44. Melville-Jones G,Watt GD. Muscular control of landing from unexpected falls in man. Journal ofPhysio. 1971; 219: 729-737.
45. Micheli LJ. Back injuries in dancers. Clinics in Sports Medicine 1983; 2(3) : 473- 484.
46. Micheli LJ, Gillespie WH,Walaszek AA. A physiologic profiles of female professional ballerinas. Clin Sports Med. 1984;3: 199-209.
47. Milan KR. Injury in ballet: A review of relevant topics for the physical therapist. JOSPT. 1994; 19 (2): 121-129.
48. Miller EH, Schneider HJ, Bronson JL, McLain D. A new consideration in athletic injuries. Clinical Orthopaedics and Related Research 1975; 111: 181-191.
120
REFERENCES
49. Miller CD, Paulos LE, Parker RD, Fishell M .The ballet technique shoe: A preliminary study of eleven differently modified ballet technique shoes using force and pressure plates. Foot and Ankle 1990; 11(2): 97-100.
50. Mizrahi J & Susak Z Analysis of parameters affecting impact force attenuation during landing in human vertical free fall. Engineering in Medicine 1982; 11((3): 141-147.
51. Mostardi R, Porterfield JA, Greenberg B,Goldberg D, Lea M • Musculoskeletal and Cardiopulmonary Characteristics of the professional baler dancer. The Physician and Sportmedicine 1983; 11(12): 3-61.
52. Nicholas JA, Grossman RB, Hershman EB.The importance of a simplified classification of motion in sports in relation to performance. Orthopaedic Clinics ofNorth America 1977; 8 (3): 99-532.
53. Nigg BM. Biomechanical aspects of running. In Nigg BM, eds Biomechanics of running shoes. Champaign, D^,Human Kinetics, 1986: I-15.
54. Nigg BM. Biomechanics, load analysis and sports injuries in lower extremities. Sports Medicine 1985; 2: 367-379.
55. Nigg BM, Denoth J & Neukomm PA. Quantifying the load on the human body: Problems and some possible solutions. In Morecki A, Fidelus K,Kedzior K & Wit S, eds. Biomechanics VII-B, University Park Press: Baltimore, 1981:1041-1052.
56. Nussbaum AR, Treves ST, Micheli L. Bone stress lesions in ballet dancers: Scintigraphic Assessment. AJR AMJ Rotentgenol 1988; 150 (4): 851-855.
57. Quirk R • Ballet injuries: The Australian experience. Clin Sports Med. 1983; 2(3): 507- 514.
58. Radin EL. Nature of mechanical factors causing degeneration of joints in the hip. Proc. of 2nd open scientific meeting of the Hip Socity. C.V. Mosby,1974: 76-81.
59. Ramel E & Moritz U. Self-reported musculoskeletal pain and discomfort in professional ballet dancers in Sweden. Scand J Rehab Med 1994; 26: I I -16 .
60. Reid DC. Preventing injuries to the young ballet dancer. Physiotherapy Canada 1987; 39 (4): 231-236.
61. Reid DC. Prevention ofh ip and knee injuries in ballet dancers. Sports Medicine 1988; 6: 295-307.
121
REFERENCES
62. Reid DA, Burnham RS, Saboe LA, Kushner SF. Lower extremity flexibility patterns in classical ballet dancers and their correlation to lateral hip and knee injuries. The American Journal of Sports Medicine 1987; 15(4):347-352.
63. Ricard MD & Veatch S. Comparison of impact forces in high and low impact aerobic dance movements. International Journal of Sports Medicine 1990; 13(2): 130-140.
64. Rice EL & Anderson K . Volleyball. In Fu FH & Stone DA eds. Sports Injuries: Mechanisms. Prevention.Treatment. Williams & Wilkhis: Baltimore, 1994: 689-700.
65. Rist RA. Dance science - how have things changed since we were trained ? Part II. The Dancing Times 1992,Jan.: 349.
66. Roverse GD,Webb LX,Gristina AG,Vogel JM. Musculoskeletal injuries in theatrical dance. The American Journal of Sports Medicine 1983; 11(4): 195-198.
67. Ryan AJ & Stephens RE. The Epidemiology of Dance Injuries. In Ryan AJ & Stephens RE, eds. Dance Medicine.Pluribus Press, Inc.:United State 1987: 3-15.
68. Ryman SY. A kinematics analysis of selected grand allegro jumps. Dance Research Annual 1978; 9: 231-242.
69. Sammarco GJ. The dancer's hip. Clinics in Sports Medicine 1983; 2(3): 485-498.
70. Sammarco GJ. The foot and ankle in dance. In Jahss M, eds, Disorders of the foot and ankle. Philadephia W.B. Saunderers Company 1991: 2483-2513.
71. Schafle MD. The child dancer, medical considerations. Pediatric Clinics of North Ainerica 1990; 37 (5): 1211-1221.
72. Scheirman GL, Cheetham PJ. Motion measurement using the peak performance technologies system. SPIE. 1990; 1356: 63-70.
73. Scholz JP & Millford JP.Accuracy and precision of the PEAK performance technologies motion measurement system. Journal of Motor Behavior 1993; 25(1): 2-7.
74. Seal J. Dance Surfaces. In Ryan AJ & Stephens RE (ed.). Dance Medicine : Pluribus Press, Inc.: United State, 1987: 321-333.
122
REFERENCES
75. Solomon R & Micheli L. Concepts in the prevention of dance injuries: A survey and analysis. The 1984 Olympic Scientific Congress Proceedings. In Caroline G. Shell, eds. The Dancer as athlete, 1984: 201-212.
76. Solomon RL, Trepman E, Micheli LJ. Foot morphology and injury patterns in ballet and modern dancers. Kinesiology and Medicine for Dance 1992; 20-40.
77. StacofF A, Kaelin X, Stuessi E. Foot-movement, load and injury in volleyball. In Terands J & Gowitzke BA, eds. Biomechanics in sports III and IV. Academy Publisher, 1988: 258-262.
78. Stephens RE. The Etiology of Dance Injuries. In Ryan AJ & Stephens RE, eds, Dance Medicine. Pluribus Press, Inc.:United State, 1987:16-50.
79. Steele JR & Milburn PD. Ground reaction forces on landing in netball. Journal ofHuman Movement Studies 1987; 13: 399-410.
80. Tietz CC. Sports medicine concerns in dance and gymnastics. Clin Sports Med 1983; 2: 571-593.
81. Valiant GA, Cavanage PR. A study of landing from a jump, implication for the design of a basketball shoe. In Winter et al., eds. Biomechanic IX-B. Human Kinetics, Champaign, 1985: 117-122.
82. Viano DC, King AI, Melvin JW, Weber K. Injury biomechanics research :an essential element in the prevention of trauma. J. Biomechanics. 1989; 22(5): 403-417.
83. Warwick & William. Standing, walking and running. In Warwick R & William P (35th Ed.) Gray's Anatomy: Longman, 1973: 584-585.
84. Washington EL. Musculoskeletal Injuries in Theatrical Dancers: site, frequency, and severity. The Amercian Journal of Sports Medicine 1978; 6 (2): 75-98.
85. Weiss JR (1994).Gymnastics. In Fu FH & Stone DA. eds. Sports Injuries: Mechanisms. Prevention. Treatment. Williams & Wilkins Baltimore, 1994 : 383-395.
86. Wilson JBL. A dictionary of ballet. Adam & Charles Black: London, 1973.
87. Winter DC. Kinematics. In Winter DC, eds. Biomechanics of human movement .Wiley-Interscience, 1979: 9-46.
88. Winter DC. Kinematics and kinetic patterns in human gait: variability and compensating effects. Human Movement Science 1984; 3 : 51-76.
123
REFERENCES
89. Wong MWN, To WWK, & Chan KM. Relationship Between Pattern of Injuries and Discipline of Dancing among Collegiate Dancing Students. Paper presented in the Western Pacific Orthopaedic Association 1995 Congress.
124

APPENDK - 5
I
CONSENT FORM
I, , freely and voluntarily consent to participate in the study
entitled,
"A Kinetics and Kinematics Study of Sautes amongst Ballet Students,,
with understanding of the experiment's effects, objectives, and procedures.
I have been given the rights to ask and been answered any questions concerning the
procedures to be used during the study.
I will be fully responsible for my own safety and injury occurred during the
experiment.
Subject Signature :
Name (Block):
Witness :
Date:
i
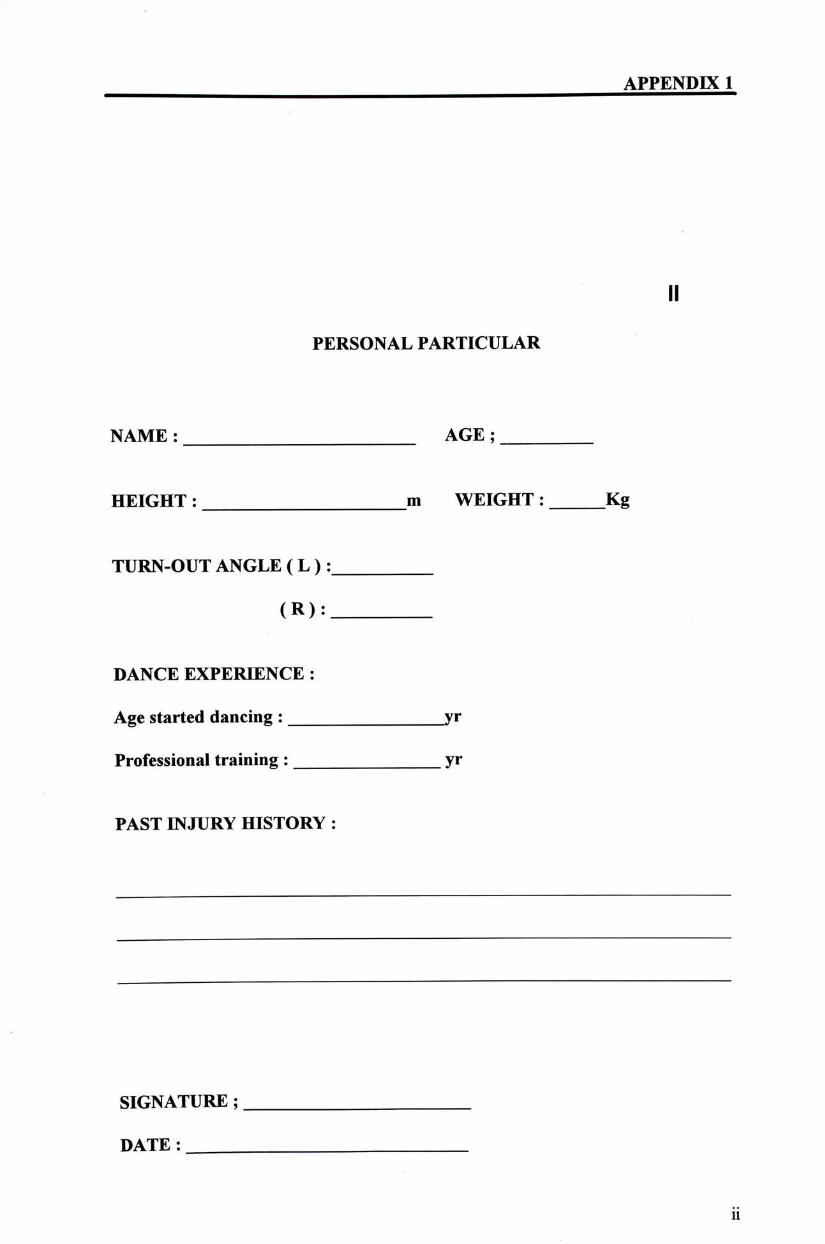
APPENDK - 5
II
PERSONAL PARTICULAR
NAME : AGE ;
HEIGHT : m WEIGHT : Kg
TURN-OUT ANGLE ( L ) :
( R ) :
DANCE EXPEMENCE :
Age started dancing : yr
Professional training : yr
PAST EVJURY HISTORY :
SIGNATURE ;
DATE :
ii
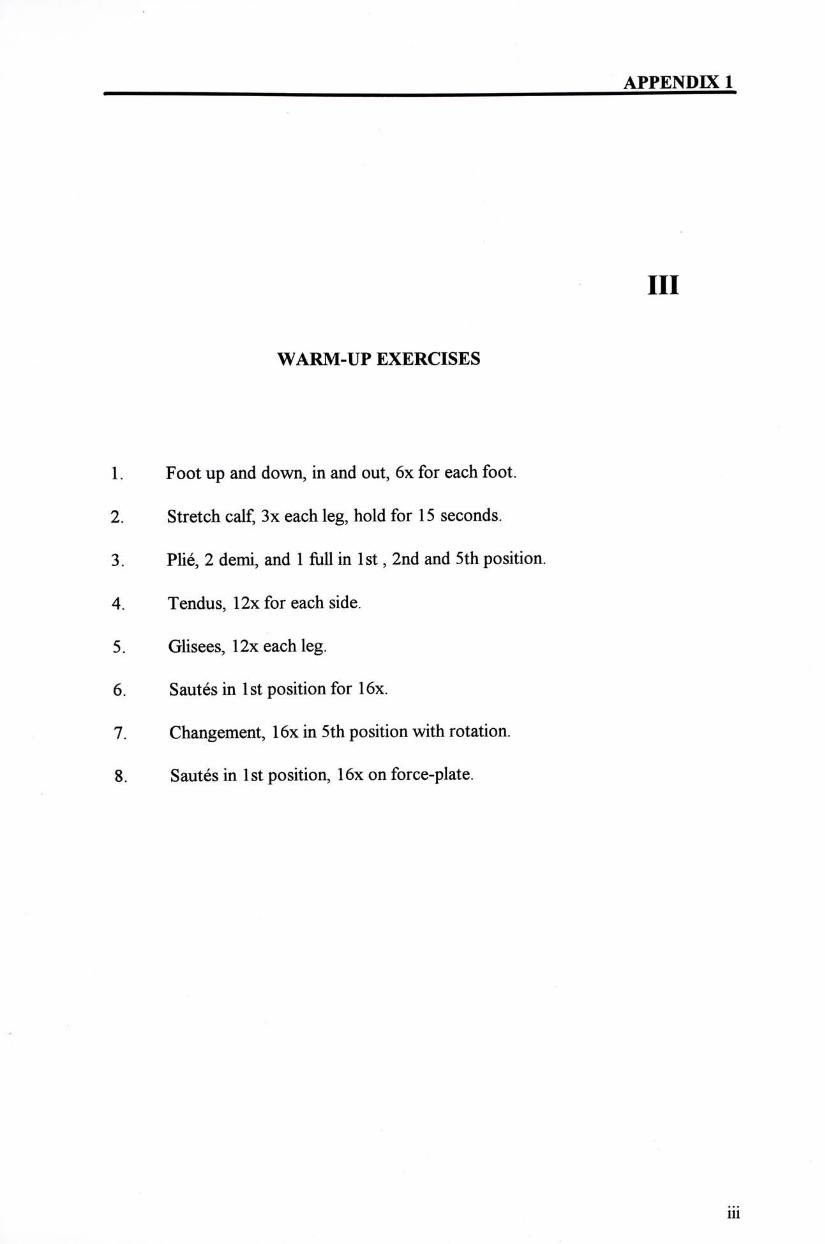
APPENDK - 5
III
WARM-UP EXERCISES
1. Foot up and down, in and out, 6x for each foot.
2. Stretch calf, 3x each leg, hold for 15 seconds.
3. Plie, 2 demi, and 1 full in 1st,2nd and 5th position.
4. Tendus, 12x for each side.
5. Glisees, 12x each leg.
6. Sautes in 1 st position for 16x.
7. Changement, 16x in 5th position with rotation.
8. Sautes in 1st position, 16x on force-plate.
iii
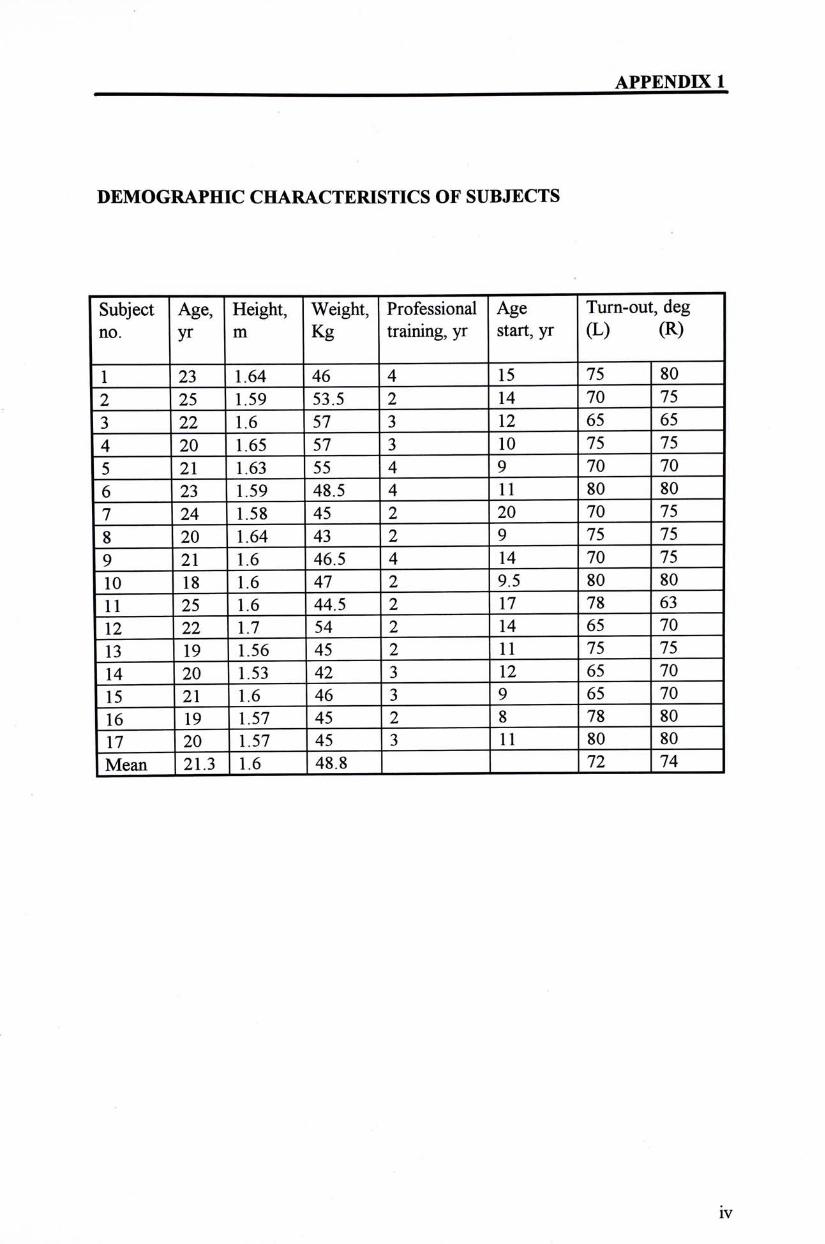
APPENDK - 5
DEMOGRAPHIC CHARACTERISTICS OF SUBJECTS
Subject Age, Height, Weight, Professional Age Turn-out, deg no. yr m Kg training, yr start, yr (L) (R)
"l ^ ~ 1.64 46 4 1? 75 80 2 ^ ~ 1.59 53.5 T 14 70 75 3 ~ ^ ~ 1.6 57 1 12 65 65 4 ~W 1.65 "57 3 1 ^ 75 — 75 5 2 1 — 1.63 55 T " 9 70 70 6 ^ ~ 1.59 48.5 T 11 80 80 7 ^ i ~ 1.58 45 2 20 70 75 8 ~W~ 1.64 43 ~2 9 75 75 9 " i I ~ " 1.6 46.5 4 T 4 70 75 10 l 8 ~ 1.6 47 T " 9.5 80 80 11 ^ ~ " 1.6 44.5 丁 17 ^ 63
12 ^ ~ 1.7 54 2 14 65 70 J j J 9 ~ ~ 1.56 45 2 11 75 75 J_4 ^ ~ 1.53 42 3 12 65 70 J j H ~ 1.6 46 3 9 65 70 16 l 9 ~ ~ 1.57 45 2 8 78 80 17 ^ ~ 1.57 45 3 11 80 80
"Mean 21.3 1.6 48.8 72 74
iv
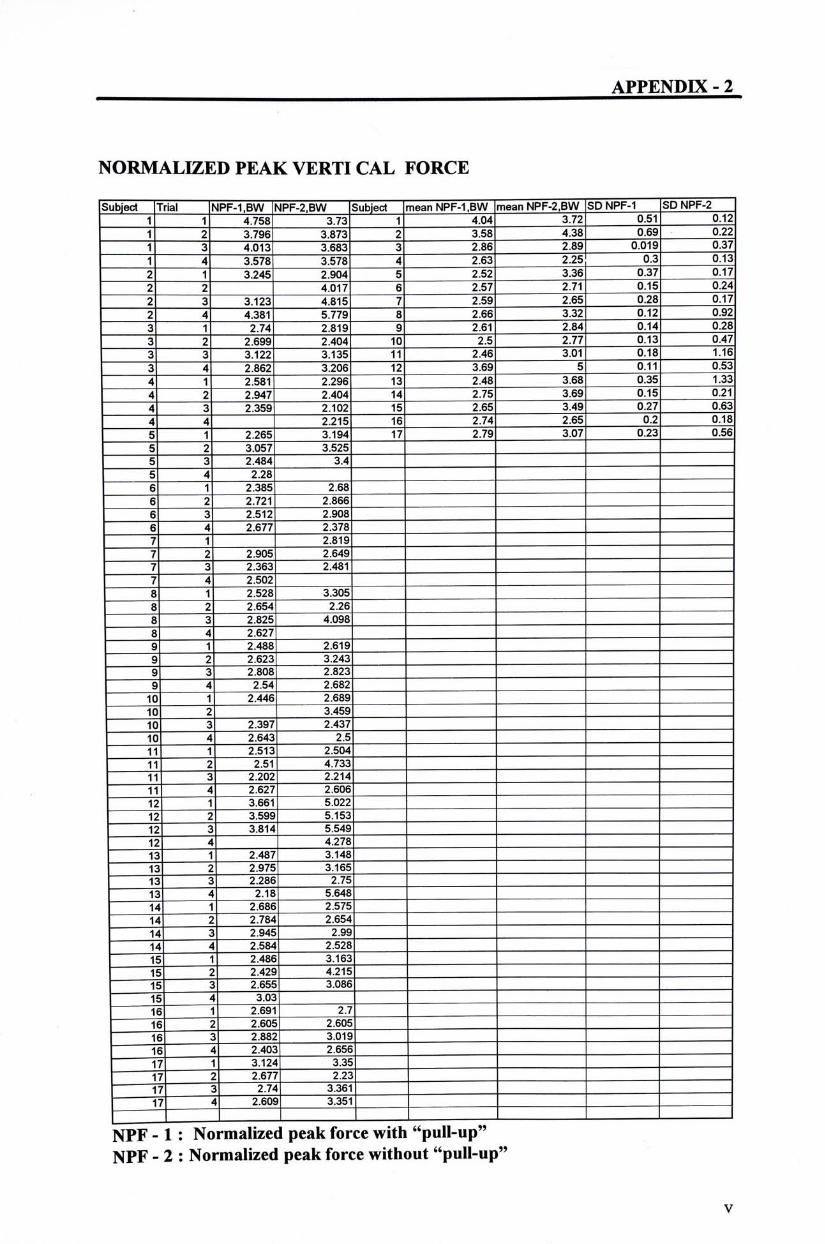
APPENDK - 2
NORMALKED PEAK VERTI CAL FORCE
Subject |Trial lNPF-1,BW |NPF-2,BW |Subject [meanNPF-1,BW [meanNPF-2,BW |SDNPF-1 |SDNPF-2 — 1 1 — 4.758 一 3.73 1 T 0 4 3.72 0 ^ 0J2 1 2 3 ^ ^ T ^ 1 “ ^ i 3 8 0.69 0.22 1 — 3 4.013 3.683 3 2.86 2 ^ 0.019 037 1 4 3 : ^ 3: ^ 4 2.63 2.25 0.3 0.13
2 — 1 3.245 2.904 5 2.52 3 ^ 0 ^ 0.17 2 2 4.017 6 2.57 一 2.71 ^ 0.24 2 3 3A^ 4:^ 7 2.59 2.65 0 ^ 0^ 2 — 4 4 ^ 5.779 8 2.66 3 ^ 0 ^ 0.92 3 — 1 ^ 2.819 9 2.61 — 2.84 O M 0.28 3 — 2 — 2.699 2.404 10 2.5 2.77 0J3 0-47 3 3 3.122 3.135— 11 2.46 3.01 0 ^ 116 3 — 4 2.862 3.206 12 3.69 一 5 0.11_ 0.53 4 — 1 2.581 2.296 13 2.48 ^ 0 ^ 1-33 4 _ 2 2.947 2.404 14 2.75 3.69 0.15 0.21 4 — 3 2.359 2.102 ^ 2.65 一 3.49 0 ^ 0.63 4 — 4 2.215 — 16 2.74 2.65 0 2 0.18 5 1 2.265 3.194 — 17 2.79 3.07 0.23 0.56 5 ~ 2 3.057 3.525 ~ 5 — 3 2.484 3 . 4 ~ 5 4 2.28 — 6 — 1 2.385 2.68 — 6 — 2 2.721 2.866— 6 3 2.512一 2.908 “ 6 4 2.677 2.378 — 7 — 1 2.819— 7 — 2 2.905 2.649 7 — 3 2.363 2.481 7 4 2.502 8 _ 1 2.528 — 3.305 — 8 — 2 2.654 2 .26— 8 _ 3 一 2.825 4.098 8 — 4 2.627 — 9 — 1 2.488 2.619 — 9 — 2 2.623 3.243 ~ 9 3 2.808 — 2.823 — 9 — 4 2.54 2.682
10 — 1 2.446 2.689 — 10— 2 3 .459— 1 0 _ 3 2.397 2.437 — 10— 4 2.643 2.5 — 11 — 1 2.513 2.504 — 11 — 2 2.51 4.733 — 11 3 2.202 2.214 — — 11 4 — 2.627 2.606 — — 12 1 3.661 5.022 — — 12 2 — 3.599 — 5.153 ~ — 12— 3 3.814 5.549 ~ ~ 12— 4 — — 4.278 13 1 2.487 3.148 “ — 13— 2 2.975 3.165 13 3 — 2.286 — 2.75 — — 13— 4 2.18 5.648 — “ 一 14 1 2.686 2.575 一
14— 2 2.784 2.654 — 14 3 — 2.945 — 2.99 — — 14— 4 2.584 2.528 — 15— 1 2.486 3.163 — 1 5 ~ 2 2.429 4.215 — 1 5 ~ 3 _ 2.655 — 3.086 1 5 _ 4 3.03 — — — 16 - 1 — 2.691 2.7 1 6 ~ 2 一 2.605 一 2.605 — — 16 3 — 2.882 — 3.019" ~ — 1 6 _ 4 2.403 2.656 — 1 7 ~ 1 3.124 3.35 —
“ “ ~ ~ ^ ~ ~ 2 2.677 2.23 — ~ " ~ ~ r f ~ 3 2.74 ^ ^
r7 4 ~ 2.609 — 3.351
NPF - 1 : Normalized peak force with "pull-up" NPF - 2 : Normalized peak force without "pull-up"
XV
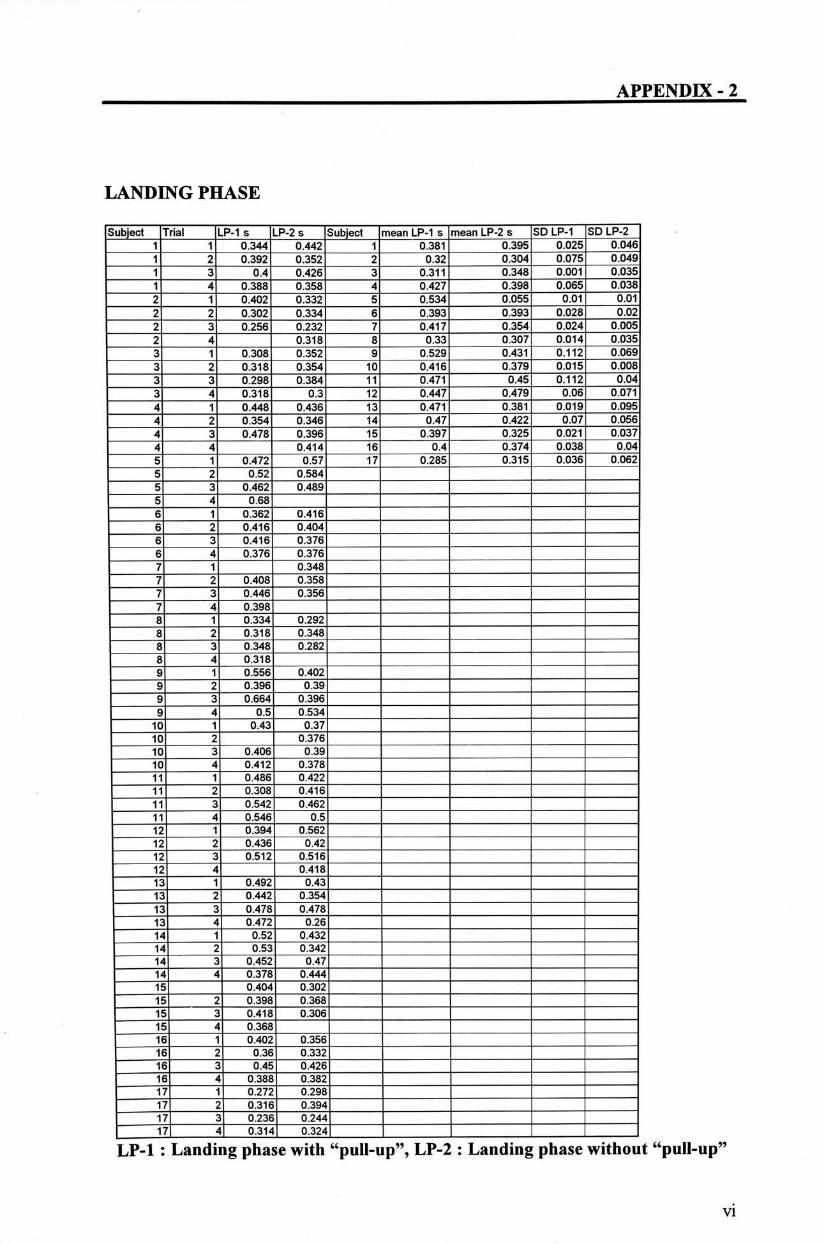
APPENDK - 5
LANDEVG PHASE
Subject |Trial |LP-1 s |LP-2 s |Subject |mean LP-1 s |mean LP-2 s |SD LP-1 |SD LP-2~ 1 ~ T 0.344 0.442 1 0.381 _ 0.39^ 0.025 0.046 1 2 0.392 0.352 ~2 0 " ^ 0.304 _ 0.075 0.049 1 ~ ^ 0.4 0.426 3— 0.311 “ 0.348 0.001 0.035
_ 1 4 0 3 M 0.358 4 0.427 0.398 0.065 0.038 2 ~ 0.40T 0.332 5 — 0.534 “ 0.055 0.01 0.01
_ 2 2 0.302 0 . ^ 6 0 . ^ 0.393 一 0.028 0.02 一 2 3 0.256 0 . ^ 7 0 ^ 0.354 一 0.024 0.005 — 2 4 0.3^8 ~8 0^33 0.307 ~ " 0.014 0.035 — 3 1 0.308 0.352 ~9 0 .顿 0.431 0.112 0.069
— 3 2 0.318 0.354 10 0 . ^ 0.379 0.015 0.008 3 3 Ol98 0 . 3 ^ 11 0.471 0.45 0.112 0.04 3 4 0.31"8 0.3 12— 0.447 “ 0.479 0.06 0.071 4 1 0448 0.436 i3 0.47? 0.381 — 0.019 0.095
— 4 2 0.354 O i j ^ 14 0.47 0.422 一 0.07 0.056 4 3 0.47^ 0.396 15 0.397 “ 0.32^ 0.021 0.037
一 4 4 0 .权 ^ 0.4 0.374 — 0.038 0.04 — 5 1 0472 0 ^ f7 0.285 0.315 0.036 0.062
5 2 O.sT 0.584 - — 5 3 0.462 0.489 ~ “ 5 4 0.68 — — 6 1 0 . 3 ^ 0.416 — “ — 6 2 0.416 0.404 —
一 6 3 0.41^ 0.376 ~ — 6 4 0.376 0.376 ‘ —
7 _ 1 — 0.348 _ 一 7 2 0.408 0.358 — “ — — 7 3 0.446 0.356 “ — — 7 4 0.398 - —
8 1 — 0.334 0.292 — 一 8 2 0.31"8 0.348 “ —
8 — 3 ^ ^ 0 .滋 — — 一 一 8 4 0.31T _ — 一
9 1 0.556 0.402 ~ — ~ 9 — 2 0 3 ^ 0.39 — — 9 3 0.664 0.396 — “ — — 9 4 OTS 0.534 — “ — 10 1 0.43 d37 — 10 2 0.376 ~ ~
10 3 0.406 0.39 — _ 10 — 4 0.412 0.378 一 11 1 0.486 0.422 — “ 11 ~ 2 0308 0 . ^ _ — — “
— 11 3 0.542 0.462 — — 11 — 4 0.546 0.5
12 — 1 0.394 0 .^ .— — — 12 2 0.4^ 0.42 - - — — 12 3 0.5^1 0.516 _ _ — 一 12 一 4 0 . ^ — — 13 T 0.4^ 0.43 — -一 13 2 0.442 0.354 “ — 13 3 0 . 4 ^ 0.478 “ “ — 13 4 0.472 0.26 “ —
14 T 0.¾ 0.432 — “ 14 2 O.M 0.342 一 “
一 14 — 3 0.452 047 — — 14 — 4 0378 0444 — — 15 — 0404 0 l02 — — 15 — 2 0.398 0 3 ^ — — “ 15 ~ " 3 0.418 o ! ^ —
15 4 0.3^ ‘ ~ _ — — 16 T 0 . 4 ^ 0.356 “ — “ 16— 2 0.36 0.332 — — 16 3 0.45 0.426 一 “
16 4 0.388 0.382 ~ “ — ~ 17 T 0.272 0.298 — — 17 2 0.3T6 0.394 — —
17— 3 0.236 0.244 “ “ 一 171 4| 0.314| 0.324| | LP-1 : Landing phase with "pull-up", LP-2 : Landing phase without "pull-up"
vi
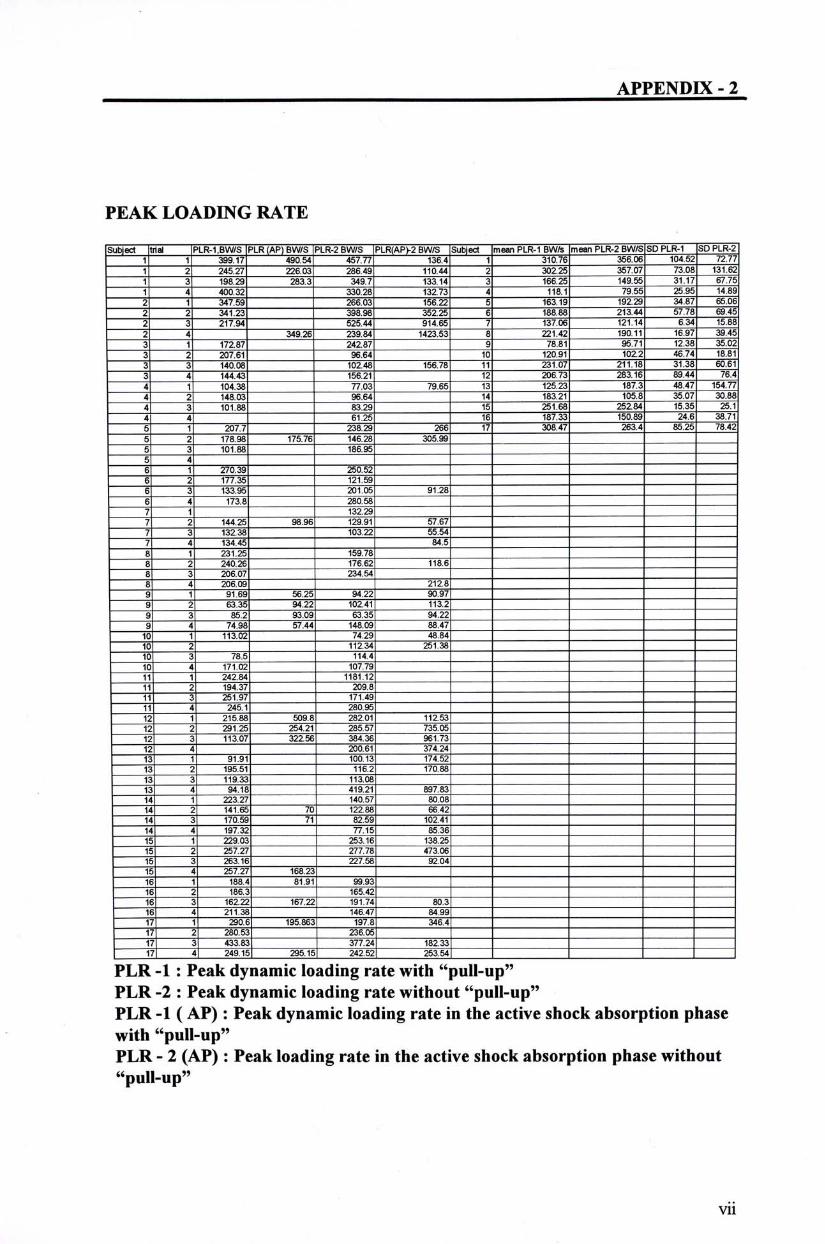
APPENDK - 5
PEAK LOADEVG RATE
Subject |trial |PLR-1,BW/S |PLR (AP) BW/S |PLR-2 BW/S |PLR(AP)-2 BW/S |Subject |mean PLR-1 BW/s |mean PLR-2 BW/S|SD PLR-1 [SD PLR-2 1 1 — 399.17 490.54 457.77 ] ^ 1 3 m 7 6 356.06 104.52 72.77 1 ~ 2 245.27 226.03 " 286.49 1 l " ^ 1 302.25 357.07 73.08 131.62 1 — 3 198.29 283.3 ~ 349.7 13Tl4 ~3 166.25 149.55 31.17 67.75 1 4 400.32 _ 330.28 1 3 ^ 7 118.1 79.55 25.95 14.89 2 1 — 347.59 — 266!M 156.22' 5 “ 16^11 192.29 “ 34.87 65.06 2 ~ 2 341.23 — 398.98 352.25 ~6 188.88 213.44 57.78 69.45 2 一 3 217.94 525.44 9 i T l 5 T 137.06 121.14 6.34 15.88 2 — 4 349.26 239.84 142li53 "8 221.42 190.11 16.97 39.45 3 1 172.87 _ 242.87 "9 78.81 95.71 12.38 35.02 3 — 2 207.61 _ 96.64 10 120.91 102.2 46.74 18.81 3 ~ 3 140.08 - 102.48 1 5 6 ^ 11 231.07 211.18 31.38 60.61 3 ~ 4 144.43 一 156.21 12 206.73 283.16 89.44 76.4 4 1 104.38 _ 77.03 7 ^ lT 125.23 187.3 48.47 154.77 4 2 148.03 96.64 lT 183.21 105.8 35.07 30.88 4 — 3 101.88 _ 83.29 i5 251.68 252.84 15.35 25.1 4| 4 61.25 16 187.33 150.89 24.6 38.71 5 T 207.7 238.29 1 6 ^ 17 308.47 263.4 85.25 78.42 5 — 2 178.98 175.76 146.28 305;^ 5 3 101.88 ―― 186.95 “ — 5 — 4 — “ 6 — 1 270.39 — 250.52 • ~ 6 ~ 2 177.35 121.59 “ ~ 6 3 133.95 201.05 91.28 ' — 6 4 ?73:8 280.58 “ 7 — 1 “ 132.29 7 _ 2 144.25 98.96 — 129.91 “ 5T67 7 3 132.38 — 103.22 “ 55.54 一 7 4 134.45 — - 84.5 — 8 ~ 1 231.25 — 159.78 “ 一 “ 8 — 2 240.26 _ 176.62 _ 1 丽 8 3 206.07 一 234.54 “ — 8 — 4 206.09 2 ^ — 9 1 91.69 56.25— 94.22 9097 “ 9 — 2 63.35 9 4 . 2 2 _ 102.41 “ 113.2 “ 9 3 85.2 93.09 — 63.35 — 94.22 9 ~ 4 74.98 57.44 148.09 — 88.47 一
1 0 ~ 1 113.02 ~ “ - 74.29 48.84 1 0 — 2 112.34 “ 251.38 “ 10 3 78.5 114.4 — 10 4 171.02 — 107.79 — “ 11 — 1 242.84 — 1181.12" — “ 11 2 194.37— “ 20a8 _ — 11 ~ 3 251.97 171.49 一 11 ~~ 4 245.1 — 280.95 “ “ 12 — 1 215.88 509.8 282.01 “ 11253 ~ 12 — 2 291.25 254.21 — 285.57 “ 735m 12 — 3 113.07 322.56 ~ 384.36 — 961"?^ “ _ 12 _ 4 _ 一 200.61 374.24 — 13~ 1 — 91.91 — 100.13 174^2 — 13~ 2 — 195.51 — “ 116.2 170.88 ~ 13 3 — 119.33 — 113.08 _ 一 13 4 94.18 _ 419.21 897:^ “ ~ 14 1 223.27 140.57 80.08 _ “ “ 14~ 2 ~ ~ 141.65 — 70 “ 122.88 66.42 — 14 3 170.59 ~ T i 82.59 102.41. “ “ “ 14 4 197.32 77.15 85.36 “ “ . 15_ 1 — 229.03 - 253.16 138.25 — “ 15_ 2 — 257.27 — “ 277.78 473.06 — “ 15 3 263.16 227.58 92.04 “ 15 “ 4 257.27 ~ ~ 168.23 ~ “ 16" 1 ~ " 188.4 — 81.91 “ 99.93 — 16 2 — 186.3 - 165.42 — “ 16" 3 ~ ~ 162.22 — 167.22 “ 191.74 80.3 — 16" 4 — 211.38 — “ 146.47 84:91 . 17 1 290.6 195.863 197.8 346.4 “ “ “ 17" 2 280.53 — “ 236.05 • 17 “ 3 ~ ~ 433.83 — “ 377.24 1 8 ^ — “ 17| 4| M9.1S| 295.1S| 242.52 | 253.54!
PLR -1 : Peak dynamic loading rate with "pull-up" PLR -2 : Peak dynamic loading rate without "pull-up" PLR -1 ( AP) : Peak dynamic loading rate in the active shock absorption phase with "pull-up" PLR - 2 (AP) : Peak loading rate in the active shock absorption phase without “pull-up,,
vii

APPENDK - 5
PROPORTION OF PASSIVE EVIPULSE
Subject |Trial |Pimp~1 |Pimp-2 [Subject |meanPimp-1 |meanPimp-2 |SDPimp~1 |SD Pimp-1 1 0.081 0.092 1 0.090 0.089 0.011 0.007
_ 1 2 0 .093 0.096 ~ 2 _ 0 . 1 2 0 _ 0 . 1 6 " 0.07 0.045 _ 1 ~ 3 一 0 .082 O . d ^ 3 0 . ^ 0.09 0 .004 0.015
1 4 0.105 ~ 0.079 _ 4 0.086 — 0.069 “ 0.01 “ 0.005 一 2 1 一 0.125 0.162 5 0.076 0.06 0.018 0.002
2 2 0.049 “ 0 . 1 1 0 " 6 一 0 . 0 8 7 — 0 . 0 9 " 0.007 “ 0.009 2 3 0.188 “ 0 . 2 1 9 " 7 _ 0.104 0.087 “ 0.005 0.005
— 2 4 — 0 . 1 5 8 _ 8 — 0 . 1 2 0 — 0.121 “ 0.015 0.009 — 3 1 0.111 0.096 ~ 9 0 . 0 4 7 — 0 . 0 5 _ 0.006 0.007 — 3 _ 2 _ 0.113 0.097 1万 0.076 0.076 0.009 0.006 — 3 — 3 一 0 .104 0.070 1~ 0.090 0.066 0.017 0.025 — 3 4 一 0.105 0.103 1^ 0 . 0 ^ 0.076 0.007 0.01 — 4 ~ 1 _ 0 . 0 ^ O . d ^ 13 0.082 0.102 0.009 0 .044 ~ ~ 4 2 0.097 ~ 0.072 ~ 14 一 0.061 — 0.045 “ 0.01 “ 0 027 — 4 ~ 3 0 . 0 ^ 0.073 1^ O . T ^ 0.14 0.01 0 .034 — 4 — 4 — O . d ^ 16 O.rfO 0.103 0.01 0.009 — 5 — 1 _ 0 . 0 ^ 0.058 17 0 . ^ 0.152 0 .024 0.028
5 ~ 2 0.078 0.062 — 5 — 3 一 0.089 0.062 5 — 4 0.050 ‘ “ 6 _ 1 0.094 0.102 ‘ —
— 6 2 0.078 “ 0.089 “ — — “ “ — 6 — 3 — 0.085 0.079 — 一
6 4 0.091 “ 0.091 “ 一 “ “ 7 — 1 “ 0.082 - “ 7 ~ 2 — 0.T00 0.092 — 7 - 3 0.而 0.丽 —
— 7 4 0 .110" — “ “ 8 1 0.114 0.115 “ -8 _ 2 0 . 1 ^ O.Tu —
— 8 3 — O . m 0 . i 3 3 _ 8 4 0.119 — _
9 - 1 — 0.041 0.058 — • 9 — 2 — O . d ^ 0 . 0 ^ — — 9 3 0.043 0.053 — “
9 4 0.052 “ 0.041 一 “ 10 — 1 0.071" 0.074 “ “ 10 2 0.071" _ “ 1 0 _ 3 — O . d ^ 0.函 一
_ 10 4 — 0.088 0.084 — — 11 T 0.092 “ 0.086 — — ‘ _ 11 ~ 2 — 0.116 0.0
11 3 0.080 0.073 “ — ‘ 11 4 0.079 0.075 “ — — _ “ 12 — 1 0.080 0.090 — - “
— 12 ~ ~ 2 0.094 “ 0.076 “ — — “ “ ~ 12 3 0.091 “ 0.074 “ — — “
12 4 “ 0.066 “ “ “ 13 — 1 0.077 “ 0.085 — — “ “
— 13 一 2 0.091 0.080 “ — _ “ 13 _ 3 0.086 “ 0.074 ~ — “ “ 1 3 ~ 4 0.072 O . W —
— 14 1 0.062 . 0 . 0 4 9 . — — _ “ 14 2 — 0.049 0.072 14 3 0.058 0.051 ‘ “ ‘ 1 4 ~ 4 0.072 0.007 _ “ 15 — 1 0.125 0.114 — ‘ 15 2 0 . i t 6 0.179 — 15 — 3 0.114" 0.128 — — -
“ 15 4 0.135 “ — — “ — 16 1 0 .118 ' 0.099 — “ “
1 6 — 2 0.111 0.116 — “ 1 6 — 3 0.097 0.101 -16 — 4 0.100 0.096 “ — “
“ 17 — 1 0.156" 0.120 “ “ “ 17 — 2 0.139 ‘ 0.099 ‘ — — “ “
17 3 0.187. 0.165 — — 17| 4 | O.i34| O. l i7 |
P-imp- 1 : Proportion of passive impuse with "pull-up", P-imp- 2 : Proportion of passive impulse without "pull-up"
viii

APPENDK - 5
TEME TO PEAK FORCE
SuRect |Trial |TOP-1s |TOP-2 s |Subject |mean TOP-1 s |mean TOP-2 s|SD TOP-1 |SD TOP-2 1 1 ‘ 0.09 — 0.076 1 0.076 0.08 0.001 0.007 1 — 2 0 ^ 0.074 2 0.0½ 0 ^ 0.003 0.012 T 3 0.068 0.08 3 一 0.089 0.086 0.014 “ 0.004 T 4 0.074 0.09 4 — 0.089 0.099 0.013" 0.003
2 1 0.088 0.044 5 — 0.12_ 0.097 0.013" 0.006 一 2 2 0.082 0.068 6 0.09 0.087 0.003 0 . ^ — 2 3 0.084 0.042 7 0.103 0.097 0.003 0.009 一 2 4 O.d^ 8 0.095 0.093 0.019 0 ^ _ 3 T 0.106 O.d^ 9 0.099 0.095 0.009 0."55 — 3 2 0074 0.092 10 o 7 i ^ 0.109 0.011 0 . ^ — 3 3 0.082 O . d ^ l T o7n5 0.096 0.042 0 0 3 ~ 3 4 0092 O.OM 12 0.097 0.07 0.006 6 ^
4 T 0.09 0.098 13一 0.1 “ 0.074 0.023 “ 0.022 — 4 2 0 7 ^ 0.094 14 0.1 0.098 0.002 0."55I
4 3 0.076 0.1 15— 0.077 “ 0.077 0.022 “ 0.022 ~~ 4 4 0.102 16 0.096 0.096 0.013 0 . ^
5 1 0.124 0.104 17 0.075 0.107 0.019" 0.013 — 5 2 0.108 0.092 — —
5一 3 — 0.106 0.095 — 5 4 o7T^ _ 一 一
6 - 1 — 0.088 0.084 一 6 2 0.09^ 0.096 — “ “ 6 — 3 0.088 0.082 6 4 0.094 0.086 “ _ 7 \ — 0.106 _ _ 7— 2 0.104 O.OM “ — — 7一 3 0.106 ^ - — 7 — 4 0.1 — 8 1 — 0.088 0.086 8 2 0.072 0.104 _ _ ‘
— 8 3 0.11^ 0.088 — “ “ 8— 4 0?iM — 9 T 0.106 0.096 — “ “
— 9 2 0.092 0.09 — ‘ “
9 — 3 — 0.09 0.09 — — — 9 4 0.108 0.102 — “ “
10— 1 0 ^ 0.112 — — 10 _ 2 — ^74
— 10 3 0.1石 0.092 “ “ 一 10 4 0.126 0.158 “ “
11 T 0.178 0.138 “ “
11 — 2 0.088 0.0^ 一 — — 11 — 3 0.098 0.086 — — — 11 4 0.096 0.092 “ “ — 12 — 1 0.094 0T07 — “ 12 — 2 0 3 ^ 0.056 — 12 一 3 0098 0.076 _ — — 12 — 4 0.078 — — — 13 T 0.086 0.072 — “ “
13 — 2 0.096 0.074 — — 一 13 3 0.134 0.0^ — 一 — 13 — 4 0.084 0 .廠 — 一 — 14 1 0.102 0.098 — “ “ — 14 — 2 0.1 O . W — — _ 14 3 0.098 0.094 — “
14 4 d T 0.098 — _ -一 15 — 1 0.07 0.09 — — — 15 2 0.06 0.064 — “ “ — 15 — 3 0 0 ^ 0076 — — — 15 4 0.11 一 ‘ -一 16 T 0Al6 0.106 — - “ 一 16 2 0.088 0.102 — ~ “
16 ~ 3 一 0.09 0.1 — “ 1 6— 4 0.09 0 _丽 — 一 一 1 7— 1 0.1 0.108 — 一
17 2 0.062 0.12 — “ 17— 3 0 ^ 0.0^ — —
一 17| 4| 0.07S| 0.106| —
TOP-l : Time to peak force with "pull-up", TOP-2 : Time to peak force without ‘‘pull-up,,
ix

APPENDK - 2
TRUNK mCLEVATION ON TOUCH-DOWN
Subject |Trial |Trunk-1,deg |Tmnk-2,deg [Subject |mean trunk-1,deg|mean Trunk-2,dedSD-Trunk-1 |SD-Tmnk-2 1 1 5.95 ^ 1 ^ 6.24 f ^ 1-07 1 — 2 10.04 6.68 2 7 一 1 3 — 8.4— 4.89' 3 — 3.38 3.28 1.74 4.34 T" ~4 ^2 ~6 ~A 8.33 5.57 5.53" 3.92 2 — 1 一 5 3.6— ^ 0 ^ ^ 2 ~ T — ~6 3.73 5.65_ 2.36_ 2.04 2 3 “ 7— 5.16 T 4 5 T ^ 2.28 2 — 4 8 8.12_ 6.面 3 瓦 0.86
— 3 1 3.25 1.45 ~~~ 9 6.1 5.8 1.84 3.08 3 2 1.38 9.83 10 13.8 9.15 0.67 4.67 3 3 3.27 ^ 11 6.76 8.65— 5.31 “ 7.67 3 4 5.63 "TS i I 10.12 7.96_ 3.68_ 3.01" 4 1 9.25 7.96 i3 11.2 12.5~ 1.86_ 2.39 4 — 2 13.34 1.75 14 3.96 ~6 2 M 1.59 4 ~ 3 2.4 9.8 15 5.1 ~ 5^6 3.M 2.19 4 ~ 4 — 2.76" 1 6— 5.运 2.5 3.89 3.56 5 1 4 ! ^ 5.83 i7 3.93 4.06_ 4.2" 1.04 5 — 2 4.21 8.78 一 — — 5 — 3 2.9 4.28 一
5 — 4 2.94 — 6 — 1 1.98 8.27 一 — — 6 2 3.97 5.27 — 6 — 3 6.98 3.3 — — 6 — 4 2 5.75 — — — 7 1 9.07 — ~ — 7 — 2 5.6 8.47 一 — 7 — 3 7.48 4.86 7 — 4 2.38 — — 8 — 1 12.25 7.88 8 — 2 7.81 6.29 8 — 3 4.07 6.5 — 8 — 4 — 8.33 — — — 9 — 1 3.43 8.6 9 ~ 2 6.6 1.46 — — 9 一 3 6.7 7.12 9 ~ 4 7.67 6.01 — —
10— 1 13.13 7.39 10— 2 4.1 — — 10— 3 14.47 9.94 10— 4 13.6 15.17 “ — 11 — 1 6.94 0.45 — —
~ ~ 11 2 1 ^ 6.58 — - “ “ 11 3 0.2 8.7 — —
— 11 4 ~6?7 1 " ^ — _ “ “ 12 1 8.48 10.04 — — 12 2 14.22 3.67 — — — 一
12 3 7.35 8.03 — — 1 2 _ 4 — 10.08 ~ -
— 13 1 lT04 15.02 — - -13— 2 12.52 10.17
— 13 3 9.25 14.1 — - “ ‘ 13 4 ^i95 10.81 一 ~ - “ 14 T" T ^ 6.25 — ~ “ ‘
— 14 — 2 1.49 4.9 — — 14 3 T T I 8.13 - -一 14 ^ 6.47 4.68 _
15 1 3.51 3.52 “ 15 — 2 9.58 — 5.4 — — 15 3 T ^ T ^ — _ “ — 15 4 U 7 _ _ — 16 1 T2A T ^ — _ _
16~ 2 8.89 — 2.35— — “ 一 16 3 T 9 7 " O I “ “ “
16 4 2.13 0.04 — “ 17— 1 8.95 4.36 17— 2 5.83 5.38 — “ 17 3 0.72 3.18
— 17丨 41 0.22丨 3.2S| _ Trunk-1 : Trunk inclination with "pull-up" on touch-down Trunk-2 : Trunk inclination without "pull-up" on touch-down
XV

APPENDK - 5
M A X m U M Hff ANGULAR POSITION
Hip, deg |Subject mean SD 33.5 1 34.36 “ 3.46 — —
3 ^ T 26.02 3.16 39.43 — 3 ^ 1.58 31.68 4 38.64 2.65 2 ^ 5 38.47 3.51 24.32 6 3YT5 0.32 24;09 7 41.09— 1.47
8 — 32.45 T U — 3 3 ! ^ 9 34.57 3.65 _ 3 6 ^ To 42.^9 4.2 “
^ 11 38.93 0.55 — 33:^ 12 38.95— 1.8
35.62— 13" ^ ^ 0 — 3 9 . 7 ~ l A 39.玩 4.31 _ — 4 0 . 5 9 ~ l 5 3 0 . ^ 4.14 _
16 27.5 1.29 — 4 ? ^ 17 35.89 1.5 — 41.12 34.25 — 36.93 一
^ — 32.09 — — 31.85~ 一 32.05 —
Wn — —
40.83 — — 42.68 ~ " 33.98 — 35.84 35.32— 29.34 — 37.79 35.84 — 35.32 29.34 — — 43.38 — —
37.52 — — 42.19—
39.3 38.14
39 39. 3 36.9 — ~
— 3 9 . 7 3 — _ 40^ — — 3 ^ 32.67 — 34.84 —
36.1 35.54 45.37 — 41.04— 37; — 33.97 — — 34: 一 —
25.91 — 29.04 — -27.3 8
一 26.22 — i7?rr - 一
— 2 9 . 2 8 — “ 34^ - — 37: - — 36.76 — — —
— 3 4 . 3 9 |
xi

APPENDK - 5
M A X m U M KNEE ANGULAR POSITION
Subject |Trial |Knee-1,deg~ Knee-2,deg Subject mean Knee-1,deg mean Knee-2,deg SD Knee-1 SD Knee-1 1 113.73 111.4 1 111.18 112.31 3.87 2TT
— 1 2 l l Z ^ 110.59 2 — 115.94 116.18 5.05 2.28 — 1 3 1W44 115.37 3 — 108.92" l l 9 ^ 3 1.37 3.范
T ~4 113.25 111T^ 4 105.24 110.84 " 2.81 0.93 — 2 T 110.94 115.86 5 ~ ~ 99.16 100.64 3.94 0.41 — 2 2 115.84 114.08 6 104.66 103.63 2.06 3.75
2 ~3 ^2^m 119T^ 1 99.14 100.75 3.01 6.88 — 2 4 115.35 8 113.97" 1 " ¼ ^ 1.9 4.92
3 ~ 109.46 1 2 4 ^ 9 100.07 104.86 4 2 9 — 1.64 3 ~ 2 109.3 一 116.72 10 9 ^ 91.64 5.94 0.67 3 ^ 1"^ 119.32 T T 90.16 86.78 5.75 2.27 3 ~ 4 106.93 ~ ~ 117.53 ~ 12 1 0 7 . ^ 112.06 1.79 0 7 4 1 106.4 11076 ~ ^ 106.92 106.35 “ 5.44 0.83
~ 4 2 107.3 109.79 14 98.15 110.29 3.12 3.97 4 3 102.04 ~ ~ 110.77 ~ 15" 1 0 7 . ^ 113.98 6.69 2.04
_ 4 4 112.05 16 — 109.88 115.49 3.05 5.75 “ 5 ~ 1 94.79 100.35 fZ 101.5 108.94 1.29 5.92
5 ~2 100l3 10d^93 — 5 3 104.11 100.5 5 4 97.75 6 — 1 101.96 — 111.1— 6 2 105.27 119.16 6 — 3 104.45 — 112.67 6 — 4 106.68 ~ ~ 111.58 ; 7 — 1 108.15— “ — 7 _ 2 100.87 99.54 7 — 3 100.88 — 94.55 7 — 4 95.66 8 1 115.96 116.02 8 2 112.9 119.1 8 3 111.87 — 109.47 ~ 8 4 115.14 9 — 1 96.03 103.46 9 2 100.09 — 103.41 9 — 3 98.15 106.41 9 ~ 4 106 104—
10~" 1 88.75 92.25 10— 2 90.76 10— 3 87.06 92.07 “ ~ 1 0 — 4 98.09 91.47 — 11 1 89.05 87.92 11 — 2 98.57 ^ 11 3 87.06 87 ~ — 11 4 85.97 85.41 “ — 12— 1 109.6 112.51 一 — 1 2 — 2 106.45 111.02 12 — 3 106.54 112.23 1 2 ~ 4 — — 112.39 —
— 13 1 107.35 105.87 — “ 1 3 _ 2 113.78 105.87 13 — 3 106 107.31 13 — 4 100.55 111.9 — — —
— 14 — 1 95.18 115.44 “ — “ 14 2 98.93 108.99 “
14 — 3 96.3 105.94 14— 4 1 0 2 . 1 9 " ~ 110.78
_ 15 T 100.71 111.66 — “ ~ 15 — 2 102.15 114.84 — “
15 — 3 114.62 115.45 1 5 — 4 110.61 1 6 ~ 1 109.56 122.25 — 16 — 2 113.59 116.49 — — — 16 — 3 110.23 108.26 — — — 16 — 4 106.15 114.96 1 7 — 1 101.61 111.43 — 1 7 _ 2 102.48 104.6 — — ~ 17— 3 99.65 116.13 — —
_ 17| 4| IO2.25| 103.611 _
Knee-1 : Maximum knee angular position with "pull-up" Knee-2 : Maximum knee angular position without "pull-up"
xii

APPENDK - 5
M A X m U M ANKLE ANGULAR POSITION
Subject Trial Ank-1,deg Ank-2,deg Subject mean Ank-1,deg mean Ank-2,deg SDAnk-1 sd ank-2 — 1 1 3 0 ^ 22.37' 1" 25.31 22.37 — 5.08 — 5.92 _ 1 2 25.92 16.64 2 26.73 29.08 ~ 2.91 — 1.14
1 3 W ^ 2 3 J 3 23.61 22.03 114 l"i5 — 1 4 26.41 29.03 4 34.75 35.78 ~ 2.76 — 2.71
2 ~ T 28.85 27.72 _ 5 37.63' 30.05 1.77" 6.68 2 ~ T 23.42 30.26 — 6 — 26.56" 29^38 1 5 ^ 1.25 2 3 2fm 29.74 7 33.05 31.94 — 0.87 — 1.65
— 2 4 28.59 8 29.67 29.68 ~ 2.09 — 6.87 3 1 2 3 ^ 23.38 9 30.68 32.89 一 1.03 — 2.96
— 3 2 24.52 22.35 10 40.41 40.84 0.89 — 0.66 3 ~ 3 22.28 21.78 11 — 40.14 4 4 ^ 4.22 4.72 3 ~ 34.65 20.62 12 — 34.25 3 ? ^ 0."6 1.06 4 1 3^64 37.38 13" 34.79 35.32 _ 2 — 7.52
— 4 2 36;^ 37.44 14 24.44 25.95 264 — 3.48 4 3 3S!M" 36.54 15" 23.36 28.26 “ 4.85 — 3.43
— 4 4 31.77" 16 32.09 32.33 “ 5.3 — 2.69 — 5 1 2 0 l 6 23.29 17_ 32.65 32.02 “ 0.62 — 3.17 — 5 2 3 ^ 37.06 — — — 5 3 36.49 2 ^ — — 5 4 3 8 W — - —
6 ~ T 24.4 28.42 “ ~ ~ — — 6 2 26.97 30"i" “ — — — 6 3 2 6 ^ 28.3 “ — — — 6 4 28.07 29.89 “ — —
7 - 1 30.04 — — 7 - 2 34.06 32.82 — — 7 _ 3 一 32.55 32.96 一 一 “ 7 — 4 32.54 — 8 - 1 — 27.28 25.53 — 一 “
— 8 2 30^ 2ST - 一 ~ 8 3 31.17 37.61 “ — — — 8 4 30.56 — “ — — — 9 1 30.46 37.24 “ — — 9 一 2 3 0 ^ 31.78 “ ~ — — 9 3 3 0 7 " 30.58 — —
9 ~ 4 ~ ~ 29.41 31.97 — ~ " “ 一 10 — 1 ^ 3 9 40.^8 — — 10 — 2 40. - —
10 3 — 40.84 41.19 — ~ ~ 10 - 4 41 — 41.59 “
— 11 — 1 4 4 ^ 48.79 - — — — 11 2 35.64 39.36 —
11 3 37.7 43.99 一 — 11 — 4 42.35 4 3 ^ “
12 一 1 — 33.6 31.86 — — 12 - 2 — 34.36 32.8 — ~ 12 一 3 — 34.78 32.69 — 12 4 3 0瓦 - — 13 一 1 3 4 ^ 3 ^
— 13 2 32.61 41.^ - — — 13 一 3 3 4 ^ 37.73 — —
13 — 4 37.43 26."^ 14 — 1 2 Z ^ 28."02 ~
— 14 2 27.07 25.55 ~ ~ ~ 14 3 2 ^ 21.2 - — — 14 — 4 26.23 29.0T"
15 _ 1 — 30.59 — 25.58 _ — 15 — 2 Z U ^ 24.68 “ — — 15 — 3 ^ 3 1 . ^ - — — — 15 — 4 21.52 一
“ 16 1 37.05 3 0 l 8 — — 16 — 2 ^ 35.74 — — — — 16 — 3 32.7 3 3 ^ “ 16 — 4 W52 30.07 — 一 17 — 1 33.35 293" “ ~ 17 — 2 32.86 30i85 _ — “ 17 — 3 31.86 3 1瓦 — 一 17| 4| 32.54 36.59|
Ank-1 : Maximum ankle angular position with "pull-up" Ank-2 : Maximum ankle angular position without "pull-up"
xiii
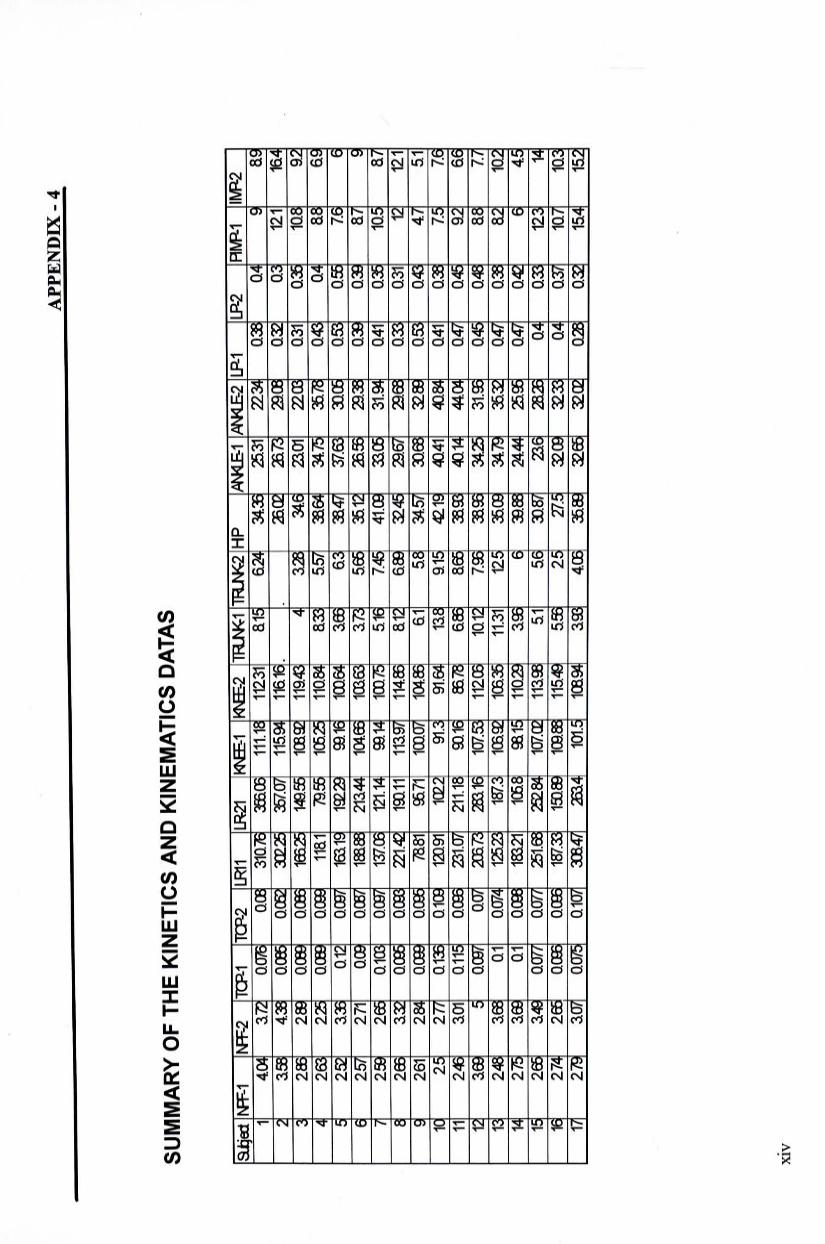
AP
PE
ND
K -
4
SUM
MAR
Y O
F TH
E KI
NET
ICS
AND
KIN
EMAT
ICS
DATA
S
atie
ct|N
FF-1
|N
FF-2
|T
CP-1
|T
CP-2
|lR
11
|lR21
|K
Tsg
-1|K
Ng-
2|m
JNK
1|7R
J^2|
HP
|A^-
1|/m
E-2
|LP
-1
|LP-
2 |PH
VP-1
|I
M^2
~ 1
^ a
g_
_Q
07
6_
__
Q0
6^
jQg
^^
^_
J11
j|
1123
1 ~
ai
5 6.
24
34.36
25
.31
2Z34
0
¾
Q4
9 ^
2~
~~
ag
~~
4^
_Q
0B
5 ~
~^
3Q25
36
7.07
~Tl5
^ 11
&16
. —
. "^
¾
^73
29
.06
Q2
02
2
^ Z
ZJ
ZH
^_
_g
gr
~^
O.OB6
16
6t25
149.5
6 10
a92
119.4
3 4
a28~
34
.6
23t0
1 2
20
6_
Q^
_0
^ m
^
4 2f
fi 22
5 0.0
69
0.09
9~~W
^ 79
.56
105.2
5 11
0.84
&33
~ 5.5
7 3S
64
34.75
36
.78
0^
M
^ ^
]^
^_
^g
—a
36
Q^
0.097
16
ai9^
i^2d
99
.16~
100.
64
366
63
~^
37.63
30
.06
0.53
0.56
7B
6 6
2^
271
Q09
Q0
67
^l^
2i
a44
im.6
6 10
a63
a7
3~
5.66
36.12
2S
i56
29¾
0.3
9 "
0¾
87
9 7
259
26
6~
~^
0.0
97
~^
^ 12
1.14
~^
100.7
5 5.1
6 7.4
5 41
.09~
""
^ 31
.¾
0.41
0.36
10.5
^
8 26
6 a3
2 ~Q
096
0.09
6^^
¾
190.1
1 1i
a97
114^
&
12—
6.
89
3Z45
29
.67
29^
0.33
~Q^
2 ^
—9
261
^ 0.0
99
0.0
96
~^
95.71
10
Q^
104.8
6—
6.1
5.8
34.57
~~
^ 3Z
89
Qffi
0.
43—
4.
7 5.1
V
25
277
0¾
0.1
09
12D.
91
1(£2
91
.3
91.64
ia
8~~
9.15
^1
9 40
.41
4084
0.4
1 0¾
75
7B
Y
24
6"
a01
0.li5
0.
096^
^W
21
1.18
" 90
.16
8&78
68
6 ^
3&96
40
.14
44.M
0.4
7 0¾
9.
2 66
^
ae9"
5 —
~^
0.07
20a7
3 28
316
10
7.53
1120
6 10
.12
7.96
3&96
~ 34
.25
31.96
0.4
5 0.4
8 8i
8—
7.7
~~
^3
248
~~^
0.1
0.074
12
523
18
7.3
^l0
^ 10
a36
11.31
12
5"
36.09
34
.79
36.32
0.
47
0.38
~
^ 10
.2
^ 27
5"
ad
0.1
0.096
18
a21
106.8
9&
15
110.2
9 a9
6 6
39.88
24
.44
25.95
0.4
7 0¾
6
45
~~
^ 26
5 ad
0.0
77
0.077
25
1.68
25Z
84"l
0^
1ia9
6 5.1
5.6
30
.87
^6
28t26
0.4
0.3
3—
123
14
16
274"
26
9 0.
0¾
0.096
1
^ 15
0.89—
109
.88
115.4
9 5.5
6 ^
27.5
—
3Z09
32
33
0.4
Q37
10
.7
"l0
3 —
1?!
27
^ a0
7|
QO7q
QI
O7|
30a4
7|
2S^4
10
1-
IOa9
^ a9
6|
4.0q
36
.8^
3Z66
| 32
0¾
Q2^
0.3
¾
i54|
1
^
xiv
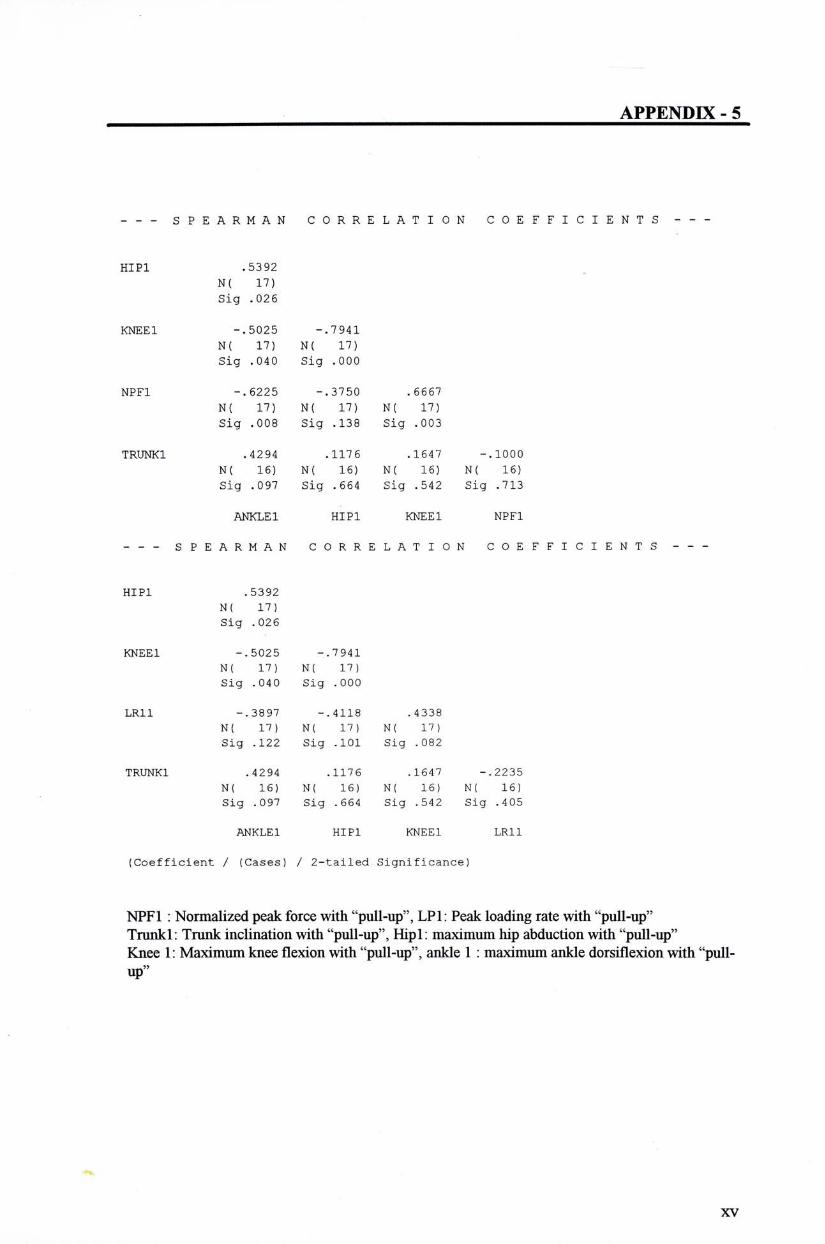
APPENDK - 2
S P E A R M A N C 〇 R R E L A T I 0 N C 0 E F F I C 工 E N T S
H I P 1 .5392
N( 17)
S i g .026
K N E E 1 - . 5 0 2 5 - . 7 9 4 1
N( 17) N( 17)
S i g .040 S i g .000
N P F 1 - . 6 2 2 5 - . 3 7 5 0 .6667
N( 17) N( 17) N( 17)
S i g .008 S i g .138 S i g .003
T R U N K 1 .4294 .1176 .1647 - . 1 0 0 0
N( 16) N( 16) N( 16) N( 16)
S i g .097 S i g .664 S i g .542 S i g .713
A N K L E 1 H I P 1 K N E E 1 N P F 1
- - - S P E A R M A N C 0 R R E L A T I 〇 N C 0 E F F I C 工 E N T S - - -
H I P 1 .5392
N( 17)
S i g .026
K N E E 1 - . 5 0 2 5 - . 7 9 4 1
N( 17) N( 17)
S i g .040 S i g .000
L R 1 1 - . 3 8 9 7 - . 4 1 1 8 .4338
N( 17) N( 17) N( 17)
S i g .122 S i g .101 S i g .082
T R U N K 1 .4294 .1176 .1647 - . 2 2 3 5
N( 16) N( 16) N( 16) N( 16)
S i g .097 S i g .664 S i g .542 S i g .405
A N K L E 1 H I P 1 K N E E 1 L R 1 1
( C o e f f i c i e n t / (Cases) / 2 - t a i l e d S i g n i f i c a n c e )
NPF1 : Normalized peak force with "pull-up", LP1: Peak loading rate with "pull-up" Trunkl: Trunk inclination with "pull-up", Hipl: maximum hip abduction with "pidl-up" Knee 1: Maximum knee flexion with "pull-up", ankle 1 : maximum ankle dorsiflexion with "pull-up,,
XV
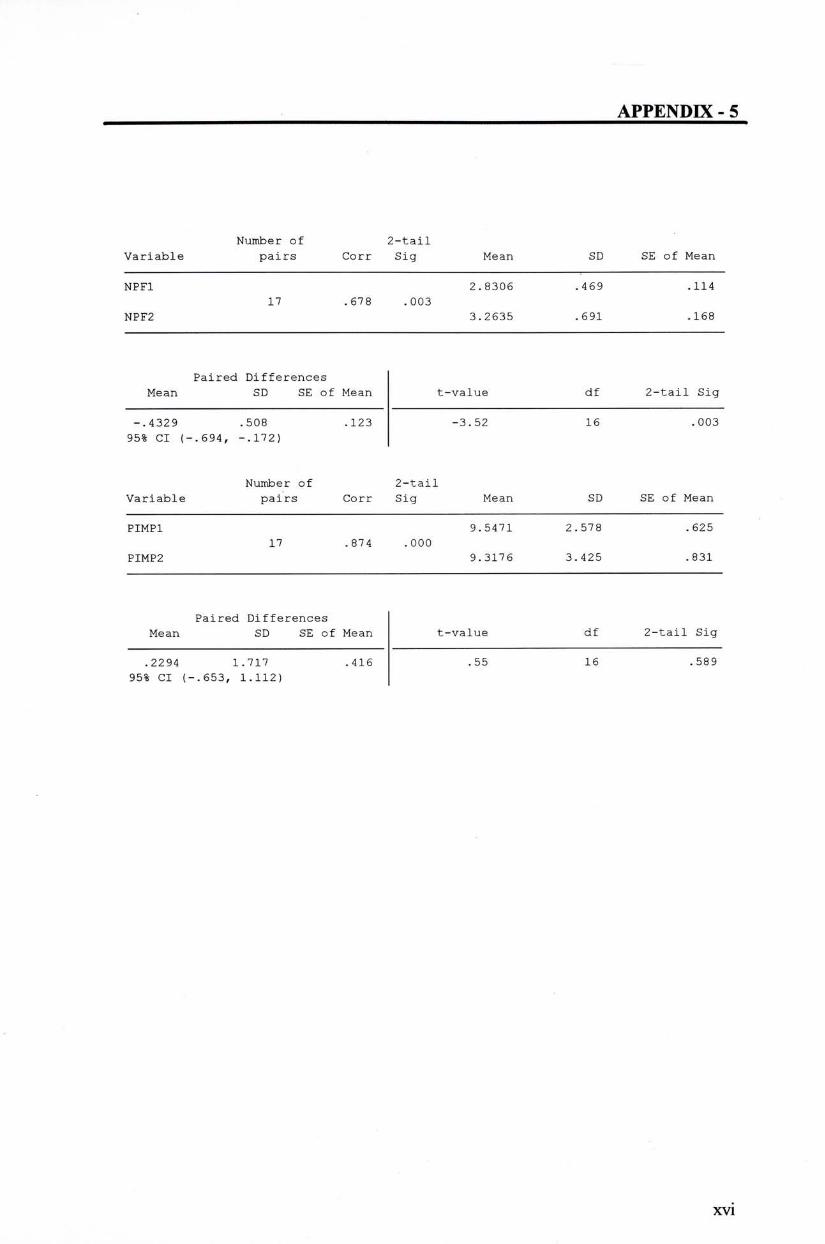
APPENDK - 5
N u m b e r of 2 - t a i l
V a r i a b l e p a i r s C o r r S i g M e a n S D SE of M e a n
N P F 1 2 . 8 3 0 6 .469 .114
17 .678 .003
N P F 2 3 . 2 6 3 5 。691 .168
P a i r e d D i f f e r e n c e s
M e a n S D SE of M e a n t - v a l u e d f 2 - t a i l S i g
- . 4 3 2 9 .508 .123 - 3 . 5 2 16 .003
95% CI ( - . 6 9 4 , - . 1 7 2 )
N u m b e r of 2 - t a i l
V a r i a b l e p a i r s C o r r S i g M e a n S D SE of M e a n
P I M P 1 9 . 5 4 7 1 2 . 5 7 8 .625
17 . 874 .000
P I M P 2 9 . 3 1 7 6 3 . 4 2 5 .831
P a i r e d D i f f e r e n c e s
M e a n S D SE of M e a n t - v a l u e d f 2 - t a i l S i g
.2294 1 . 7 1 7 . 416 .55 16 .589
95% CI ( - . 6 5 3 , 1 . 1 1 2 )
xvi
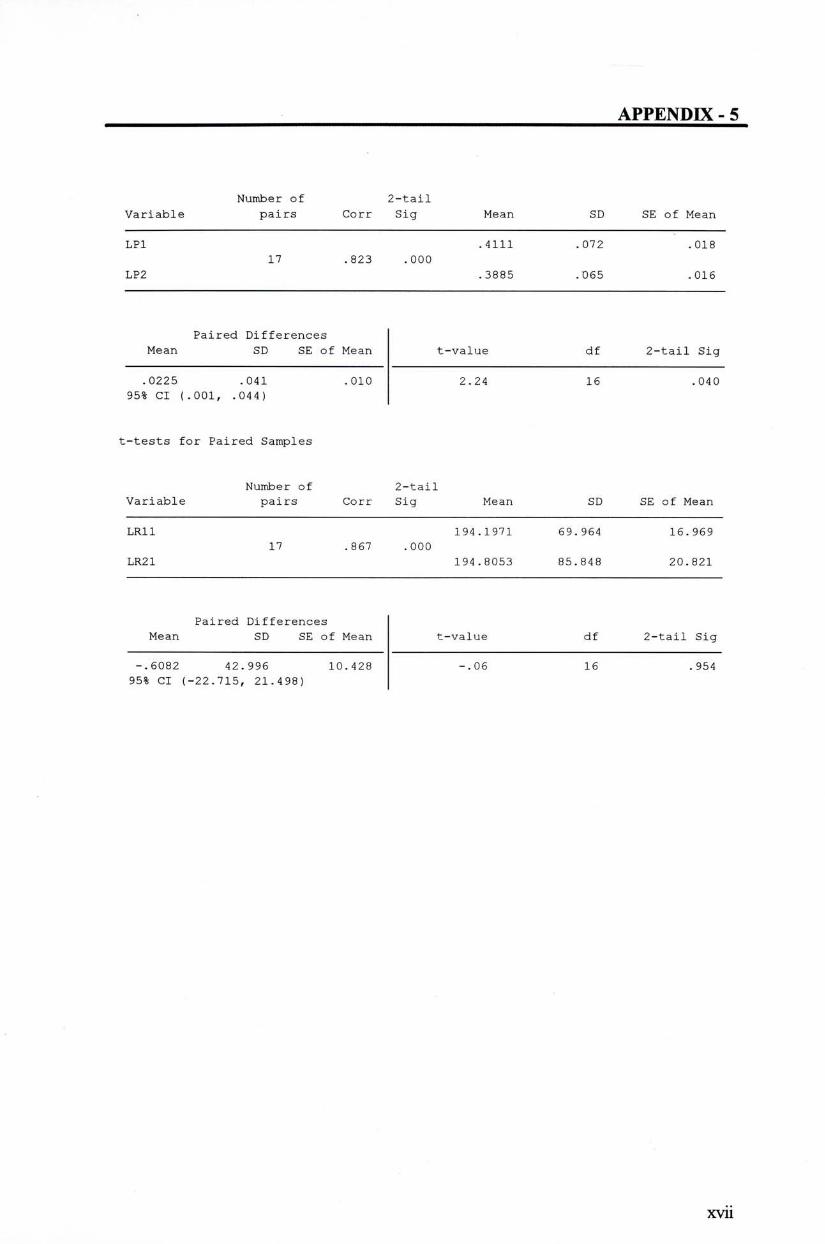
APPENDK - 5
N u m b e r of 2 - t a i l
V a r i a b l e p a i r s C o r r S i g M e a n S D SE of M e a n
L P 1 .4111 .072 .018
17 .823 .000
L P 2 .3885 .065 . 016
P a i r e d D i f f e r e n c e s
M e a n S D SE of M e a n t - v a l u e d f 2 - t a i l S i g
.0225 .041 .010 2.24 16 .040
95% C I ( . 0 0 1 , .044)
t - t e s t s f o r P a i r e d S a m p l e s
N u m b e r of 2 - t a i l
V a r i a b l e p a i r s C o r r S i g M e a n S D SE of M e a n
L R 1 1 1 9 4 . 1 9 7 1 6 9 . 9 6 4 1 6 . 9 6 9
17 .867 .000
L R 2 1 1 9 4 . 8 0 5 3 8 5 . 8 4 8 2 0 . 8 2 1
P a i r e d D i f f e r e n c e s
M e a n S D SE of M e a n t - v a l u e d f 2 - t a i l S i g
- . 6 0 8 2 4 2 . 9 9 6 1 0 . 4 2 8 - . 0 6 16 .954
95% CI ( - 2 2 . 7 1 5 , 2 1 . 4 9 8 )
xvii
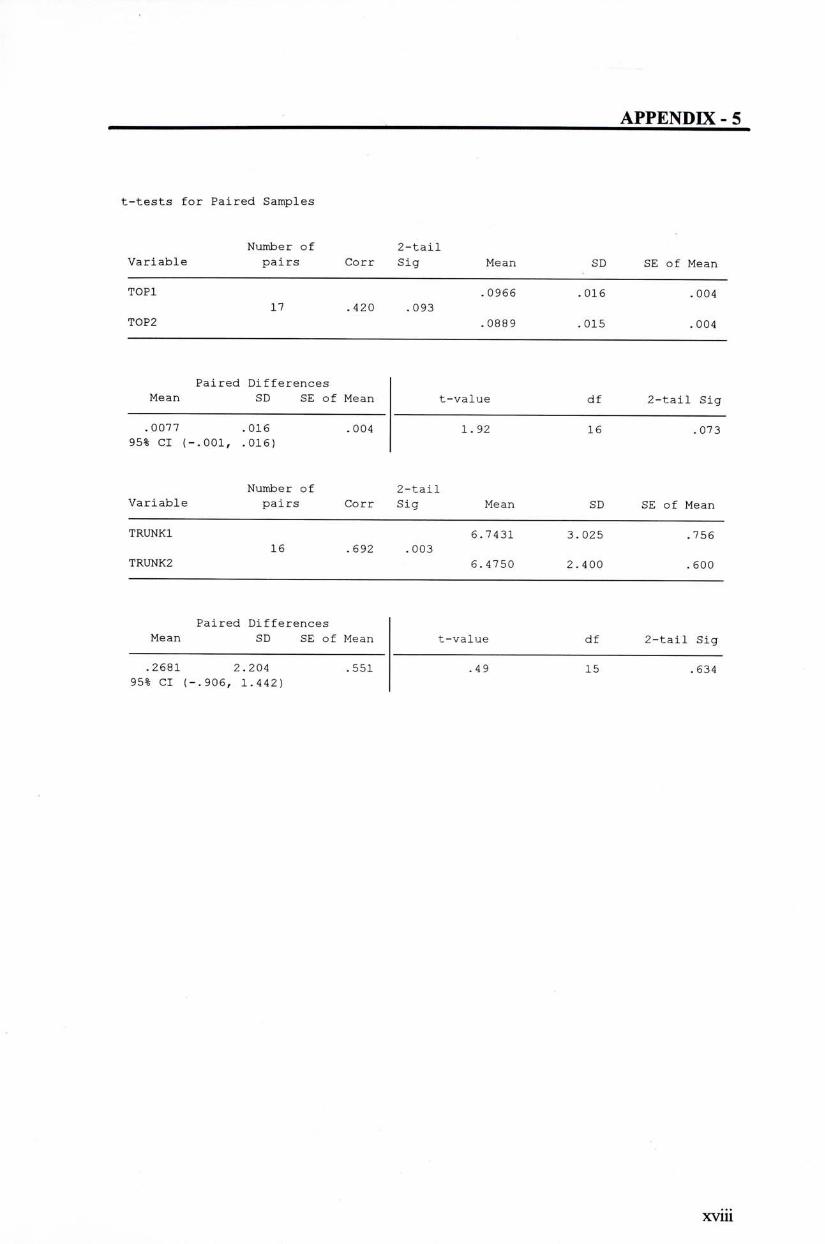
APPENDK - 5
t - t e s t s f o r P a i r e d S a m p l e s
N u m b e r of 2 - t a i l
V a r i a b l e p a i r s C o r r S i g M e a n S D SE of M e a n
T 0 P 1 .0966 .016 .004
17 .420 .093
T O P 2 .0889 . 015 , 004
P a i r e d D i f f e r e n c e s
M e a n SD SE of M e a n t - v a l u e d f 2 - t a i l S i g
.0077 .016 .004 1 . 9 2 16 .073
95% CI ( - . 0 0 1 , .016)
N u m b e r of 2 - t a i l
V a r i a b l e p a i r s C o r r S i g M e a n S D SE of M e a n
T R U N K 1 6 . 7 4 3 1 3 . 0 2 5 .756
16 .692 .003
T R U N K 2 6 . 4 7 5 0 2 . 4 0 0 .600
P a i r e d D i f f e r e n c e s
M e a n S D SE of M e a n t - v a l u e d f 2 - t a i l S i g
.2681 2 . 2 0 4 .551 .49 15 .634
95% CI ( - . 9 0 6 , 1 . 4 4 2 )
xviii
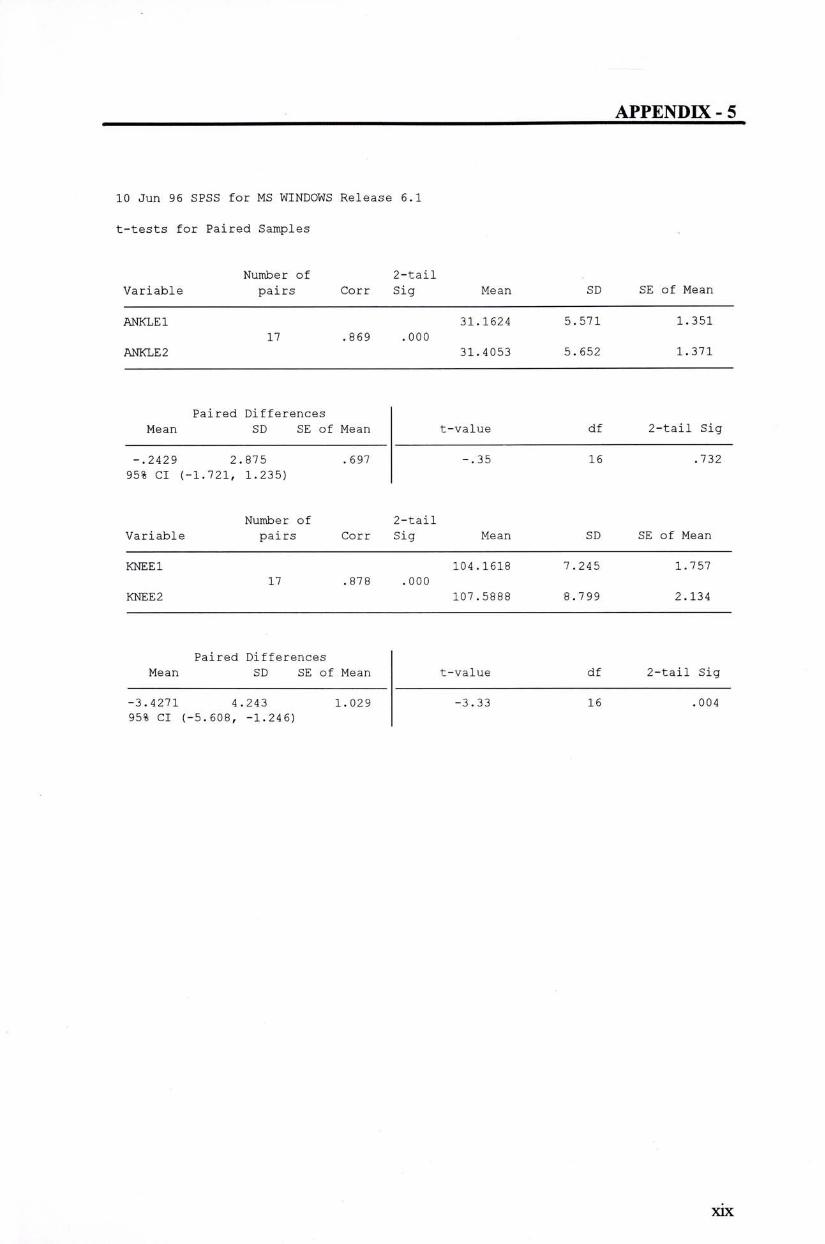
APPENDK - 5
10 J u n 96 S P S S for M S W I N D O W S R e l e a s e 6.1
t - t e s t s f o r P a i r e d S a m p l e s
N u m b e r of 2 - t a i l
V a r i a b l e p a i r s C o r r S i g M e a n S D SE of M e a n
A N K L E 1 3 1 . 1 6 2 4 5 . 5 7 1 1 . 3 5 1
17 .869 .000
A N K L E 2 3 1 . 4 0 5 3 5 . 6 5 2 1 . 3 7 1
P a i r e d D i f f e r e n c e s
M e a n S D SE of M e a n t - v a l u e d f 2 - t a i l S i g
- . 2 4 2 9 2 . 8 7 5 .697 - . 3 5 16 .732
95% C I ( _ 1 . 7 2 1 , 1 . 2 3 5 )
N u m b e r of 2 - t a i l
V a r i a b l e p a i r s C o r r S i g M e a n S D SE o f M e a n
K N E E 1 1 0 4 . 1 6 1 8 7 . 2 4 5 1。757
17 .878 .000
K N E E 2 1 0 7 . 5 8 8 8 8 . 7 9 9 2 . 1 3 4
P a i r e d D i f f e r e n c e s
M e a n S D SE of M e a n t - v a l u e df 2 - t a i l S i g
- 3 . 4 2 7 1 4 . 2 4 3 1 . 0 2 9 - 3 . 3 3 16 .004
95% CI ( _ 5 . 6 0 8 , - 1 . 2 4 6 )
xix

r: , •;•., .....:: .:•:.:..... -;. .. ., i . ."••..-.•..'•-. , •• V .、..。 . - ., . .._:- .-...:, - r ..., .... ‘. ,
w " " i . " • ‘ ' - - ; v " ' . v - ^ ' ' r ^ ^ - ' v - ' ' V ' ''''' ‘ - ' " ' ' ^ " ^ “ ‘ ^ - ^ ‘ “ , ' . ' . . 1 . .
• t
. ‘ \
«
…:•;…,•: . • '• .

C U H K L i b r a r i e s
____lll DD3511Sm


