Embed Size (px)
Citation preview

A STUDY OF CHIT FINANCE IN KERALAWITH SPECIAL EMPHASIS ON
KERALA STATE FINANCIAL ENTERPRISES Ltd.
Thesis submi tted to theCOCHINUNI VERSITYOF SCIENCEANDTECHNOLOGY
fo r the award of tile Degree of
DOCTOR OF PHILOSOPHYunder the Faculty of Social Sciences
By
SALLYAMMA J OB
Reg. No 1898
Cochin University of Science and TechnologyCochin - 22, Kerala
FEBRUARY - 2003

SCHOOL OF MANAGEMENT STUDIESCOCHIN UNIVERSITY OFSCIENCE AND TECHNOLOGYKOCHI - 682 022
CERTIFICATE
No: SMS .
Date.~.z7..,g.:-:;?,p..0.3
Certified that the thesis UA Stlldy of Chit Finance in Kerala
with Special Emphasis on Kerala State Finan,cial Enterprises Ltd." is
the record of bonafide research carried out by Smt. Sallyamma Job
under my guidance. The thesis is worth submitting for the Degree of
Doctor of Philosophy in social sciences.
Dr. James Manalel
KOCHI- 682 022, KERALA,INDIA ((): Office: 0484-555310. 542096, 550946Grams: Cusat, Kochi - 22, Telex: 885-5019, CU IN, Fax: 91-484-532495
e-mail: [email protected]

CONTENTS
Chapter Title Page No.
List of Tables
List of Figures
I INTRODUCTION 1
1I REVIEW OF LITERATURE 17
III EVOLUTION AND GROWTH OF CHIT FUNDS 38
IV KERALA STATE FINANCIAL ENTERPRISES Ltd.:
AN ASSESSMENT 91
V CHIT FINANCE IN KERALA: AN APPRAISAL 153
VI CHIT FINANCE - PROBLEMS, CHALLENGES
AND OPPORTuNITIES 198
VII FINDINGS AND SUGGESTIONS 231
APPENDICES 247
SELECT BIBLIOGRAPHY 272

LIST OF TABLES
Table No. Title Page No.
Table 1.1 Number and Sala ofRegistered Chits - Institution-wise 6
Table 3.1 Illustration ofan Auction cum Lot Chit 52
Table 3.2 Growth of Chits in the State of Travancore-Cochin
1930-31 to 1949-50 55
Table 3.3 Growth ofChits in KeraIa 1960-61 to 1969-70 57
Table 3.4 Growth of Chits in Kerala 1970-71 to 1979-80 58
Table 3.5 Growth of Chits in Kerala 1980-81 to 1989-90 59
Table 3.6 Growth of Chits in Kerala 1990-91 to 1999-00 60
Table 3.7 Decennial Growth Rates ofNo. and Annual
Turnover ofChits 61
Table 3.8 Number and Sala of Registered Chits
as on March 2000: Institution-wise 64
Table 3.9 Growth of Chits from 1981-82 to 1999-00:
Region-wise Analysis 65
Table 3.10 Number of Chits and Sa/a in Kerala 1999-00
Region-wise Analysis 66
Table 3.11 Number of Working Chits and Chit capital in
Kerala 2000-2001 66
Table 3.12 Growth in Total Deposits ofBanks in Kerala
vis-A-vis Chit Subscription 67
Table 3.13 Growth in Domestic Deposits ofBanks in Kerala
vis-A-vis Chit Subscription 69
Table 3.14 Financial Implications of an Auction cum Lot Chit 75
Table 3.15 Net Return From Chitty 77
Table 3.16 Net Return from Chitty: Net Present Value Approach 80
Table 3.17 Financial Implications of a Chit Based on
Loan at 15 per cent Interest 84

Table 4.1 Capital Structure ofKSFE 93
Table 4.2 Growth of Chit Business in KSFE from 1970-71 to 2000-01 101
Table 4.3 Decennial Growth in Chits and the Number of Subscribers 103
Table 4.4 Contribution of Chit Scheme to the Total Revenue of KSFE 105
Table 4.5 Decennial Contribution of KSFE Chits Business to
the Total Revenue 107
Table 4.6 Magnitude of Passbook Loan of KSFE 108
Table 4.7 Magnitude of Chitty Loan and New Chitty Loan of KSFE 109
Table 4.8 Magnitude of Hire-Purchase Schemes III
Table 4.9 Magnitude of House Finance Schemes 113
Table 4.10 Magnitude of F D Loan, Trade Loan and Gold Loan 115
Table 4.11 Magnitude of Fixed Deposit, Sugama and Bhadratha 119
Table 4.12 Market Share of KSFE in Chit Business 121
Table 4.13 Growth Trends of Business from 1990-91 to 1999-00 125
Table 4.14 Benefits to the Government 126
Table 4.15 Trends in Income and Expenditure ofKSFE 129
Table 4.16 Working Results at a Glance 131
Table 4.17 Return on Capital Employed 133
Table 4.18 Return on Net Worth 134
Table 4.19 Current Ratio 135
Table 4.20 Net-worth to Total Liabilities 136
Table 4.21 Funds Mobilised by KSFE and the Pattern of Deployment 137
Table 4.22 Particulars of KSFE employees 138
Table 4.23 StaffProductivity of KSFE-1990-2001 140
Table 4.24 Branch Productivity 141
Table 4.25 Distribution of Total Revenue among Schemes 143
Table 4.26 Analysis of the Default Position of KSFE Schemes 146
Table 4.27 Prized and Non-prized Default on Collectable Demand 147

Table 4.28 Trends in Revenue Recovery Debtors in KSFE 148
Table 4.29 Revenue Recovery Target and Collection for
the period 1995-96 - 2000-01 149
Table 5.1 Profile of Chit Subscribers in Kerala 154
Table 5.2 Distribution of Subscribers According to Age 155
Table 5.2A Age Composition and Preference for various Chit Institutions 155
Table 5.3 Education-wise Profile of Subscribers 156
Table 5.3A Education level and preference for various Chit Funds 156
Table5.4 Occupation-wise Profile of Subscribers 157
Table 5.4A Association between occupation and Chit Funds 157
Table 5.5 Income-wise Profile of Subscribers 158
Table 5.5A Association between Income and Preference for Chit Funds 158
Table 5.6 Subscribers' Association with Chit Funds 159
Table 5.6A Association with Chit Funds: No. of Years 159
Table 5.7 Association of Subscribers with Different Chit Funds 160
Table 5.8 Reasons for Preferring Chits 161
Table5.9 General Awareness on Chit Business 162
Table 5.10 Savings Behaviour of Chit Subscribers 163
Table 5.11 Investment Options and Order of Preference 164
Table 5.12 Motivational Factors for Joining Chits 165
Table 5.12A Motivational Factors for Joining Chits: Income-wise 165
Table 5.13 Purpose of Saving through Chit Funds 166
Table 5.14 Purpose ofBorrowing through Chit Funds 166
Table 5.15 Purpose of Saving: Occupation-wise Analysis 167
Table 5.16 Purpose ofBorrowing - Occupation Wise Analysis 168
Table 5.17 Opinion of Subscribers on the Return on Chits:
Occupation-wise 169
Table 5.17A Opinion of Subscribers on the Return on Chits:
Institution-wise 169

Table 5.17B Opinion of Subscribers on the Return on Chits
Income-wise 170
Table 5.18 Default: Institution-wise Analysis 171
Table 5.19 Opinion ofKSFE Employees on Reasons for Default 172
Table 5.19A Default: Occupation-wise Analysis 172
Table 5.19B Default: Income-wise Analysis 173
Table 5.20 Payment of Prize Money: Institution-wise Analysis 173
Table 5.21 Reasons for Delayed Payment of Prize Money 174
Table 5.22 Number of Visits to Get Prize Amount:
Institution-wise Analysis 175
Table 5.23 Preference in Obtaining the Prize Money 176
Table 5.23A Preference in Obtaining the Prize Money:
Income-wise Analysis 176
Table 5.24 Utilisation of Prize Money: Occupation-wise 177
Table 5.24A Utilisation of Prize Money: Income-wise Analysis 178
Table 5.25 Problems of Chity Loan - Institution-wise Analysis 179
Table 5.26 Other Problems Faced by Chit Subscribers:
Institution-wise 180
Table 5.27 Malpractices by Foremen 182
Table 5.28 Awareness on KSFE 184
Table 5.29 Popularity and attractiveness of KSFE Schemes
Among Subscribers 185
Table 5.30 Popularity of KSFE Schemes as Ranked by Employees 185
Table 5.31 Problems Faced by KSFE Schemes: subscribers' views 186
Table 5.32 Problems Faced by KSFE Schemes:
Opinion of Employees 188
Table 5.33 Subscribers' Assessment of KSFE Chits
with Co-operatives 190
Table 5.34 Subscribers' Assessment of KSFE Chits with Private 190

Table 5.35 Opinions ofEmployees on Competitors to KSFE 191
Table 5.36A Reasons to Prefer KSFE Chits 191
Table 5.36B Reasons to Prefer Co-operative Chits 192
Table 5.36C Reasons to Prefer Private Chits (Kerala Regd.) 192
Table 5.36D Reasons to Prefer Private Chits (Outside Kerala 192
Table 5.36E Reasons to Prefer Informal Chits 192
Table 5.37 Chit Funds Rating Analysis (1 to 12) 194
Table 6.1 Critical Success Factors for Strategic Business Units 215
A: Chitty 215
B: Hire-Purchase 215
C: Gold Loan 215
D: Trade Finance Loan 216
E: Housing Finance Loans 216
F: New Chitty Loans 216
G: Deposits 216
Table 6.2 Competitor Analysis 217
Table 6.3 Product Cell 219
Table 6.4 SWOT Analysis for KSFE 225
Table 6.5 SWOT and Strategy for KSFE 226

LIST OF FIGURES and CHARTS
Table No. Title Page No.
Figure 3.1 Growth Rate for 1960-61 to 1969-70 57
Figure 3.2 Growth Rate for 1970-71 to 1979-80 58
Figure 3.3 Growth Rate for 1980-81 to 1989-90 59
Figure 3.4 Growth Rate for 1990-91' to 1999-2000 60
Figure 3.5 Decennial Growth Rates of Number and Turnover of Chits 62
Figure 3.6 Trend Analysis of the Number of Chits Registered 63
Figure 3.7 Trend Analysis of Chit Turnover 63
Figure 4. 1 Decennial Rate of Chit Turnover in Kerala and KSFE 104
Figure 4. 2 Growth Rates of Total Revenue of KSFE and Contribution
of Chit to Total Revenue 106
Figure 4. 3 The Rate of Growth of Chit Turnover in Kerala
vis-a-vis KSFE 122
Figure 4.4 Market Share of KSFE 123
Figure 4.5 Benefits to the Government 127
Figure 4.6 Incomeand ExpenditureofKSFE from 1990-91 to 2000-01 130
Figure 4.7 Composition of Total Income and Expenditure of KSFE 132
Figure 6.1 Five Forces Model 210
Figure 6.2 BCG Growth-Share Matrix of KSFE 219
Figure 6.3 Default - Revenue Matrix 221
Chart 4.1 Organisational Chart of KSFE 95
Chart 4.2 Types of Loans by KSFE 110

CHAPTER ONE
INTRODUCTION
The strategic role of the financial system is to channel funds from
surplus units to deficit units. The financial system comprising the set of
institutions, markets and instruments facilitates capital formation and
accelerates the pace of economic development. The gap between gross
capital formation and gross domestic savings in India necessitates the need
for augmenting the growth rate of voluntary domestic savings. So, the
working of different financial intermediaries for mobilising savings from
various income categories will have to be widened and strengthened. It is in
this context that one has to appreciate the role of the Non-Banking Financial
Intermediaries in supplementing the functions of the Banking Institutions.
The Non-Banking Financial Intermediaries' ability to purvey
funds depends to a large extent on the resources they can mobilise.
Miscellaneous Non-Banking Companies or Chit Funds being a category of
Non-Banking Financial Intermediaries, contribute significantly to the value
of financial markets in India.
1.1 NON-BANKING FINANCIAL COMPANIES (NBFCs)
Non-Banking Financial Companies have emerged as an integral
part of the Indian financial system. NBFC is a generic term, which includes
a host of different types of institutions performing various types of financial
services. Sub-section (b) of section 45-1 of the Reserve Bank of India Act.
1934 defines a Non-Banking Financial Company as: (a) a financial
institution which is a company; (b) a non-banking institution which carries
on the business of accepting deposits under any scheme, arrangement or any
other manner or the business of lending in any manner and (c) any other
non-banking institution or class of institutions which the Reserve Bank may

,
notify in the official Gazette with the previous approval of the Central
Government.1 They are generally categorised into the following types on the
basis of their principal business.
• Equipment Leasing Company (ELC)
• Hire Purchase Company (HPC)
• Loan Company (LC)
• Investment Company (K')
• Mutual Benefit Financial Company or 'Nidhi' Company (MBFC)
• Housing Finance Company (HFC)
• Residuary Non-Banking Company (RNBC) and
• Miscellaneous Non-Banking Company (MNBC) ie., Chit Fund Company
1.2 MISCELLANEOUS NON-BANKING COMPANY
The principal business of MNBCs or Chit Fund Companies is
managing, conducting or supervising as a promoter, foreman, or agent of any
transaction or arrangement by which the company enters into an agreement
with a specified number of subscribers that everyone of them shall subscribe
a certain sum in instalments over a definite period and that each such
subscriber shall in his turn, as determined by lot or by auction or by tender
or in such manner as may be provided for in the arrangement, be entitled to
the prize amount.
Chit Funds are saving devices through pooling of money by a
group of persons by way of periodical instalments of fixed amount paid over
a fixed period of time under inter-se agreement that each member of the
group is entitled to the pooled amount, The scheme involves three functions
such as pooling together the scattered savings of a group of individuals,
lending out the collected savings to a member of the group and continuing
the process of collection and distribution of amounts for a certain period.
2

1.3 'CHIT' - AN AGREEMENT
The 'Chit' is an agreement by the subscribers with the foreman,
who conducts the Chit. The Kerala Chitties Act 2 defines the Chit agreement
as the document containing the Articles of agreement between the foreman
and the subscribers of the Chit. It contains provisions as to the number of
instalments, amount payable for each instalment, provision of interest for
default or late payment of instalments, manner of conducting the auction,
determining the bidder in the auction, mode of disbursement of discount,
limit if any on the discount, manner of disbursing the Chit amount, details of
security to be offered by the prized subscribers, etc.
Chit foreman has been described as the hub of the Chitty wheel. 3
It is the foreman, who links the savers and borrowers together for their
mutual benefits. The small savings which otherwise might find little
productive application have been mobilised and turned into tangible wealth
by his catalytic action. Thus the foreman acts as a social functionary. From
an individual foreman, with very limited resources and area of operations,
the proprietor of a Chit has grown into a company managed by a Board of
Directors or to a public sector Chit company, having abundant resources and
wider frontiers of business. These changes have had far reaching influence
in the sphere of Chit Finance in Kerala. This unique financial institution
facilitates savings and capital formation even among the poor in the society.
1.4 ORIGIN OF CHIT FUNDS
This indigenous financial institution had its origin in the State of
Kerala as Grain Chit or 'Dhannya Chit' ,centuries back. 'Chit' means a
written note on a small piece of paper. In Malayalam language, it is known
as 'Kuri'; a synonym of Chit. The 'Chit' or 'Kuri' is a derivative, the root
being the 'lot'.
The Chit Fund business is administered by the respective State
Governments through the offices of the Registrar of Chits. The Chit Fund
3

Companies are exempted from the requirement of registration under the RBI
Act. However, the deposit acceptance activities of these companies are
regulated under the Miscellaneous Non-Banking Companies (MNBCs)
Directions, and those relating to the advertisement for soliciting deposits are
governed by the Non-Banking Financial Companies and Miscellaneous Non
Banking Companies (Advertisement) Rules, 1977 framed by the Government
of India under section 58 A of the Companies Act, 1956.
1.5 CONCEPTS AND DEFINITIONS
"Chitty" means a transaction, whether called Chit or Kuri, by
which one or more persons, hereinafter called the "Foreman" or "Foremen",
enter into an agreement with a number of persons that every one of the
contracting parties shall subscribe a certain amount of money or quantity of
grain or other commodity by periodical instalments for a certain definite
period and that each in his turn, shall be entitled to the prize amount,
whether payable in cash, kind or any other article of value or in such other
manners that may be provided for in the agreement. 4
"Chitty amount" or 'sala' means the sum total of the
subscriptions payable by all the subscribers for any instalment without any
deduction for discount.
"Discount" means the amount of money or quantity of grain or
other commodity, which a prize winner has, under the terms of the •variola' ,
to forego for the payment of 'veethapalisa'; foreman's commission or such
other expenses as may be prescribed.
"Variola" means the document containing the articles of
agreement between the foreman and the subscribers relating to the Chit.
"Veethapalisa" means the share of a subscriber in the discount
available under the variola for rateable distribution among the subscribers at
each instalment of the Chit.
4

"Drawing" includes the mode of ascertaining the prize-winner at
any instalment of the Chit by lot or by auction or in such other manner as
may be provided for in the •variola' .
"Foreman" means the person who, under the variola, is
responsible for the conduct of the Chit and includes all persons taking his
place under section 35 of the Act.
"Subscriber" includes a person who holds a ticket or fraction of a
ticket and also a transferee by assignment in writing or by operation of law.
"Ticket" means the share of a subscriber in a Chit, which entitles
the holder thereof to the Chit amount at anyone instalment with or without
any deduction by way of discount.
"Prize amount" means the Chit amount whether payable in cash,
kind or in any other article of value, less the discount.
1.6 DIFFERENT CATEGORY OF CHIT FUNDS.
Chit Funds are of different categories, which come under the
broad heading, 'Chit Finance'. In Kerala they include the public sector Chit
Company (The Kerala State Financial Enterprises Ltd.), Co-operatives,
Private Chits and those in the informal sector.
1.7 KERALA STATE FINANCIAL ENTERPRISES LTD. (KSFE)
The KSFE, a fully owned Government Company was established in
the year 1969 as a discipline factor to private Chit Funds. The share of KSFE
in the total volume of Chit business registered in Kerala is 77 per cent as on
March 2000, though the number of Chits registered is only 37.5 per cent.
KSFE has been included in the few profit-making public companies in the
State with a profit of RS.793 Lakhs at the end of March 2000. There are over
11 Lakh subscribers in various schemes of KSFE. The number of Chits run by
KSFE amounts to 7,446 with a total capital (sala) of over Rs.952 Crore.
5
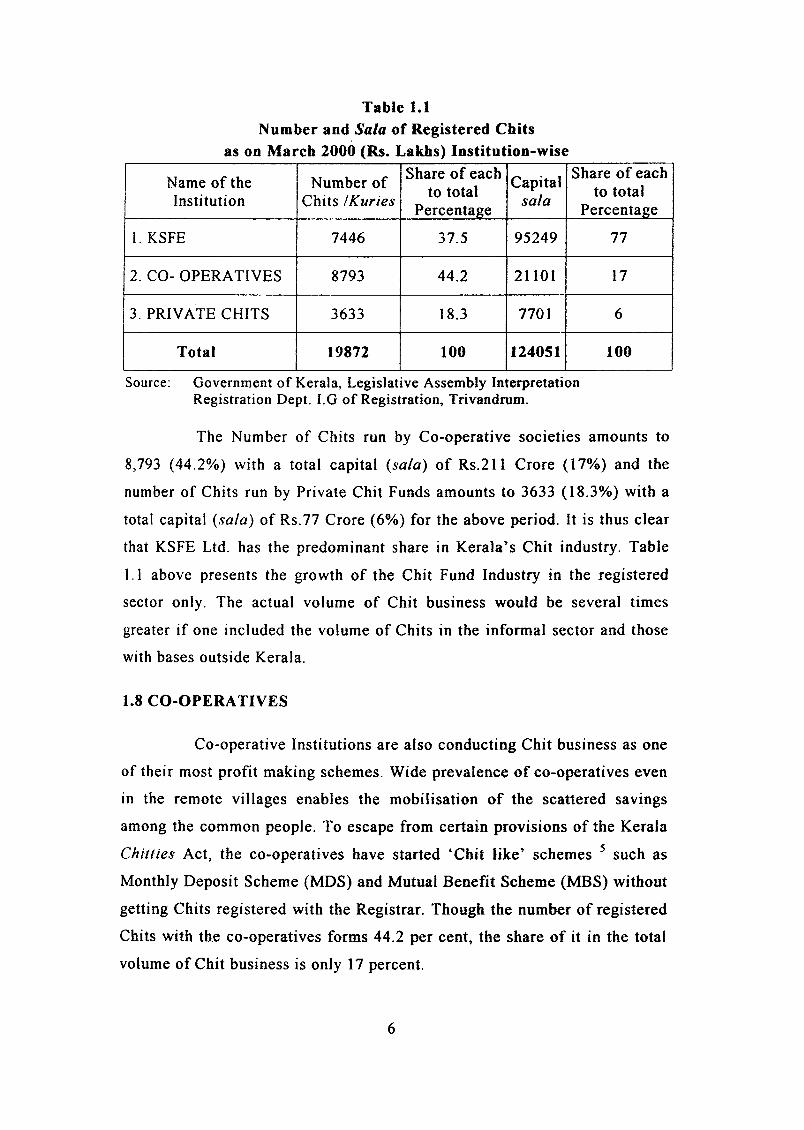
Table 1.1Number and Sa/a of Registered Chits
as on March 2000 (Rs. Lakbs) Institution-wise
Name of the Number ofShare of each Capital
Share of eachto total to total
Institution Chits /KuriesPercentage
salaPercentage
I. KSFE 7446 37.5 95249 77
2. CO- OPERATIVES 8793 44.2 21101 17
3. PRIVATE CHITS 3633 18.3 7701 6
Total 19872 100 124051 100
Source: Government of Kerala, Legislative Assembly InterpretationRegistration Dept. I.G of Registration, Trivandrum.
The Number of Chits run by Co-operative societies amounts to
8,793 (44.2%) with a total capital (sa/a) of Rs.211 Crore (17%) and the
number of Chits run by Private Chit Funds amounts to 3633 (18.3%) with a
total capital (sala) of RS.77 Crore (6%) for the above period. It is thus clear
that KSFE Ltd. has the predominant share in Kerala's Chit industry. Table
1.1 above presents the growth of the Chit Fund Industry in the registered
sector only. The actual volume of Chit business would be several times
greater if one included the volume of Chits in the informal sector and those
with bases outside Kerala.
1.8 CO-OPERATIVES
Co-operative Institutions are also conducting Chit business as one
of their most profit making schemes. Wide prevalence of co-operatives even
in the remote villages enables the mobilisation of the scattered savings
among the common people. To escape from certain provisions of the Kerala
Chillies Act, the co-operatives have started 'Chit like' schemes 5 such as
Monthly Deposit Scheme (MDS) and Mutual Benefit Scheme (MBS) without
getting Chits registered with the Registrar. Though the number of registered
Chits with the co-operatives forms 44.2 per cent, the share of it in the total
volume of Chit business is only 17 percent.
6

1.9 PRIVATE CHITS
Private Chit Funds have flourished in Kerala from time
immemorial. Though the share of private Chits forms 18.3 per cent in the
number of Chits registered, their share in the total volume of Chit business is
only 6 per cent. This is due to the reason that a considerable volume of Chit
business in the private sector are conducted without registration in the State
and therefore outside the purview of official records.
1.10 INFORMAL CHITS
Along with the formal Chit Fund sector, there exists a highly
heterogeneous and dynamic informal sector, with huge volume of business.
This includes Chits conducted by the associations of traders/merchants,
employees in the offices and those informal Chits in urban and rural
localities, churches, temples, educational institutions, small and medium
Chits in the neighbour-hood run by housewives, etc. In every nook and
corner of Kerala, one can find 'Chit collectors'" mobilising substantial
amounts of savings daily for which authentic data is not available. Though
the presence of informal Chit sector is significant, there have been numerous
cases of fraud, misappropriation, disappearance of foremen, etc., which
cause loss to the subscribers and damage the reputation of Chit Funds
Industry in the State.
1.11 STATEMENT OF THE PROBLEM
Our analysis of Table 1.1 had established the predominant
position of KSFE in Kerala's Chit industry. However, this statistics takes
into account only the data from registered Chits. But it is a well-known fact
that there is a much larger unregistered informal sector on which we have no
reliable data. The continued popularity of the non-registered sector even
after so many years of existence of KSFE and the implementation of Chilly
Acts is intriguing and calls for a detailed enquiry.
7

It has to be appreciated that the pre-eminent position of KSFE is
very good for the healthy growth of the entire industry. However, despite the
remarkable growth of KSFE, there are many forces in the environment,
which act as a threat to the organisation and to the Chit industry as a whole.
Chit business in Kerala flourished in the hands of private monopoly
till the implementation of the Kerala Chitties Act, 1975. The Act was brought
into force to introduce a unified procedure to regulate the Chit business in
Kerala and to protect the interests of the Chit subscribers. But the
implementation of the Act resulted in an exodus of foremen from Kerala to
other states for starting Chits, especially from bases in Jammu & Kashmir and
Haryana defeating the very purpose of the Act. At the same time, why the
foremen rushed out of the State has not been comprehensively accounted for.
The introduction of the Central Chit Funds Act, 1982 7 was
expected to take care of this exodus. However many States including Kerala
have not yet adopted the Central Chit Funds Act. Hence there is the need to
examine the limitations of the existing Chit legislation and the whole gamut
of it in the light of the experience gained so far.
Despite the growth of a wide range of savings avenues and the
widespread network of banks and other financial institutions, Chit scheme
still forms an important part in the asset portfolio of many households and
firms in Kerala. The promoters of Chits in the private sector appropriated for
themselves substantial amounts accruing out of their management and there
was also ample scope for exploitation of the subscribers. With a view to
ensure safety, security and better service to the Chit subscribers, the State
Government established, The Kerala State Financial Enterprises Ltd. (KSFE)
in 1969 for conducting Chit business and other financial transactions. The
objective of starting KSFE was to check the mushroom growth of private
Chit Funds by offering effective competition and thereby safeguarding the
interests of the Chit subscribers. The co-operative sector also has developed
into a stronghold of Chits. In addition, there is the conspicuous presence of
the informal Chit Fund sector. Though there are different avenues of savings
8

and different categories of Chit Funds mobilising the scattered savings of the
people, what motivates the subscribers in preferring Chits and also particular
types of Chit institutions has not been examined.
One of the most important objectives in setting up KSFE Ltd. as
already mentioned was that it would take up the leadership in Chit Funds
business as a whole and thereby safeguard the interests of subscribers by
offering effective competition. Hence it is also worth examining the
effectiveness of KSFE as the leading institution in this industry. There has
been criticism against the complicated formalities, inadequate customer
service and the high rate of interest charged on its loans. The high default
rate, the under utilisation and mismanagement of funds have been subjected
to lively discussion. Red-tapism and bureaucratic delays in the operation of
KSFE and its role as a competitor to other Chit Fund institutions have been
questioned by many, and so needs to be examined and evaluated. As part of
the current economic policies, KSFE might even face the threat of
disinvestment and if so has to forgo the privileges enjoyed by it as a
government company.
Hence, there is need for a study, which seeks to make an inter
institutional comparison between various categories of Chit Funds. It also
requires a detailed analysis of the challenges and opportunities of KSFE
from a strategic management angle.
1.12 SCOPE AND RELEVANCE
The present study entitled " A Study of Chit Finance in Kerala
with special emphasis on Kerala State Financial Enterprises Ltd. " hence
examines the socio-economic aspects of Chit schemes run by the private Chit
Funds, KSFE, co-operatives, and informal Chit Funds. The study is an
attempt to find the reasons for the growing popularity of Chit Funds as
savings cum borrowing avenues even in the presence of various other
avenues of savings and borrowings and also to understand how the Chit
subscribers utilise the funds. This study also examines the limitations of the
9

Chit Acts and suggests suitable recommendations. An analysis of the
working of Chit Funds helps us to suggest the necessary measures required
for improving the functioning of such institutions.
The study takes stock of the working of Chit Funds in general and
KSFE in particular, reviews the performance and estimates the cost and
return on Chits. The study covers the period from 1960 to 200 l. KSFE was
selected as the focal point of the study for the following reasons:
1. The Kerala State Financial Enterprises Ltd. is a unique experiment as the
only public sector Chit Fund Company in the whole of India, which is
fully owned by a state government.
2. KSFE is the dominant foreman in the Chit business in Kerala managing
about 77 per cent of the total Chit capital (sola).
3. The presence of KSFE is believed to check the unscrupulous operation of
private Chit business.
4. The KSFE is one of the few profit making public sector enterprises in the
State and also generates direct employment opportunities to more than
3000 persons.
The review of literature shows that there are only a few studies on
Chit Finance. The All India Rural Credit Survey District Monograph, Quilon
(Reserve Bank of India, 1958) 8 is one of the first attempts at a scientific
enquiry into the working of Chit Funds. But it surveyed the Chit Funds of a
very limited area only. The reports of the study groups appointed by RBI and
Government of India from time to time have explained their working in some
detail and made a few recommendations for the healthy growth of NBFCs
including Chit Funds. 9 Individual researchers like C P S Nayar (1973) 10 and
Radhakrishnan, S (1975) II have done pioneering works on Chit Finance, but
these studies are rather too old and hence may not reflect the present picture.
Although there are studies on Chit Finance, there is no specific
comprehensive study on the public sector Chit Fund Company (KSFE)
especially, in comparison with its competitors. In this context, an enquiry is apt
10

to be made on the socio-economic objectives and the performance of KSFE vis
a-vis the other Chit Fund companies in the financial sector of Kerala.
1.13 OBJECTIVES OF THE STUDY
The objectives of the study specifically are: -
I. To examine the trends and pattern of growth of Chit Funds in the formal
sector in Kerala.
2. To assess the performance of KSFE as the only public sector Chit Fund
Company in India.
3. To identify the determinants behind the preferences for joining Chit Funds.
4. To estimate the cost and return on Chit Funds.
5. To assess and compare the relative preferences of Chit subscribers
towards KSFE with that of other Chit Funds.
6. To identify the major problems of Chit Funds in Kerala in general and
KSFE in particular.
7. To make suitable suggestions for improving the working of KSFE and
Chit institutions in general.
1.14 SOURCES OF DATA AND METHODOLOGY
The study is based on data both from primary and secondary
sources. To study the trend, volume and growth of Chit business in the
formal sector, data have been collected from the Registration Department,
Government of Kerala and from Registrars' Offices at district level. To
assess the performance of KSFE Ltd, data have been collected from the
head-office and from its various branches selected randomly. Data were also
collected from Reports, Journals, Books, Reserve Bank of India Publications
and Government Publications.
To study the trend and volume of Chit business run by co
operative societies, data have been collected from the State administrative
office of co-operative societies at Trivandrum, and Joint-Registrar's offices
at the district level. An attempt was also made to collect data on Chit Fund
11

institutions registered outside Kerala especially from bases in Jammu and
Kashmir and Faridabad with the help of Chit Foremen Associations.
A survey among subscribers has been conducted to identify the
motivational factors behind joining Chits, reasons for preferring various
categories of Chit Funds, to analyse the fund utilisation pattern of Chit
subscribers, to trace their problems and to obtain suggestions for the better
performance of the institutions.
A survey among KSFE employees was conducted to get their
opinion on KSFE schemes, its problems and level of customer service.
Personal interview was conducted with a number of private Chit
foremen including those who are registered and with bases outside Kerala to
study their working, the rights and obligations, the legal aspects of their
registration, the problems faced by them and also to collect suggestions.
1.15 THE SAMPLING DESIGN
A sample of 400 Chit subscribers was selected from all the
traditional three regions 12 in Kerala, namely, Trivandrum, Ernakulam and
Calicut. The selection of these districts was also guided by the fact that these
are the three districts with the highest volume of Chit business. A fourth
district, viz. Trichur, also was selected due to the strong presence of private and
informal Chit Funds. It also coincides with the location of KSFE headquarters.
The sample subscribers were selected from all the four districts,
from among different categories of Chit Funds, namely, KSFE, co
operatives, private and informal, by taking into consideration their share in
the volume of Chit capital and also to represent rural and urban areas.
Accordingly 160 (40%) subscribers were taken from KSFE, 114 (28.5%)
from co-operatives, 86 (21.5 %) from private, and 40 (10%) from the
informal sector. Selection of sample subscribers was made at random from
the subscribers' list with the foremen, by giving representation to rural and
urban areas.
12

A sample of 165 KSFE employees was selected from the four
districts: Trivandrum-50, Ernakulam-45, Trichur-40 and Calicut-30, taking
into consideration the staff strength in the respective districts.
1.16 TOOLS OF ANALYSIS
Simple statistical tools such as averages, percentages and ratios
are used for the analysis of data.
To examine the trend in the number of Chits registered and in the
volume of Chit business, trend analysis by the method of least squares has
been used.
Scoring and Ranking Method has been used to identify the
determinants behind the preferences for joining Chit Funds.
To estimate the cost and return on Chits, Discounted Cash Flow
Method has been used.
To assess and compare the relative preferences of subscribers to
various categories of Chit Funds, Chit Funds Rating Analysis (Competitor
Rating Analysis) has been used. Ranking of parameters done by the
subscribers, vis-cl-vis its peers have been used to work out Chit Funds
Rating. Weights have been (different levels) given to these ranks to
rationalise them.
BCG Growth-Share Matrix, Default-Revenue Matrix and SWOT
Analysis have been used to identify the challenges and opportunities of
KSFE as a Chit Fund Company in comparison to its competitors. The present
study being exploratory in nature does not advance any hypothesis.
1.17 LIMITATIONS OF THE STUDY
The inability to estimate the volume of Chit business operated by
the private Chit Funds from bases outside Kerala poses difficulties.
13

Similarly there is paucity of reliable data on the huge volume of Chit
business in the informal sector.
The general reluctance of the people to reveal data on income and
savings made the task of collecting data somewhat difficult.
1.18 SCHEME OF THE STUDY
The study is presented in seven chapters. The introductory chapter
presents the statement of the problem, scope, objectives and the research
methodology adopted.
The second chapter reviews the available literature in the area and
highlights the theoretical backing.
Chapter Three gives an overview of the evolution, growth and
importance of Chit Funds with its unique features, the operational techniques
used by different Chit institutions and an estimation of the cost and return on
the Chit scheme.
Chapter Four presents the origm, development and performance
evaluation of KSFE in the State of Kerala.
The fifth chapter presents the motivational factors for joining
Chits, particular types of Chit Funds, an analysis of the problems of Chit
subscribers and a comparative assessment of various Chit Funds in Kerala.
Chapter Six analyses the challenges and opportunities of the Chit
Fund industry with special emphasis to KSFE.
The concluding chapter provides a summary of the findings,
makes suggestions and discusses policy implications.
14

Notes and References
1. Statutory Guide for Non-Banking Financial Companies: An Authorised
Publication of Reserve Bank of India. The Taxman Allied Services Pvt.
Ltd., (2000), pp.I-12.
2. The Kerala Chitties Act, 1975 (Act 23 of 1975). An Act to define,
amend and consolidate the law relating to Chitties in the State of Kerala,
Ganesh Publications, Kochi, (1995), p.I.
3. Nayar, C.P.S. Chit Finance: An Explorative Study on the Working of
Chit Funds, Vora and Co. Publishers Pvt. Ltd., Bombay, (1973), p.115.
4. The Kerala Chitties Act, 1975, op. cit., p.2.
5. The 'Chit-like' Schemes function exactly like the Chit scheme. They can
be conducted by co-operative society/bank without registration after
obtaining sanction for their bye-laws from the Joint Registrar of Co
operatives of the concerned circle, thereby escaping from the provisions
of the Kerala Chitties Act, 1975. Such schemes fall outside the purview
of official Chit records.
6. Agents or commission agents who collect Chit subscription regularly at
the door of the clients.
7. The Chit Funds Act, 1982. (Act No. 40 of 1982). An Act to provide for
the regulation of Chit Funds and for matters connected with it, Law
Publishers (India) Pvt. Ltd., (1998).
8. All India Rural Credit Survey, District Monograph, Quilon, Reserve
Bank of India Publication, Bombay, (1958).
9. For example: (i) The Report of the study group on Non-Banking
Financial Intermediaries: Banking Commission, Government of India,
(1972), had recommended the need for a uniform Chit Funds legislation
applicable to the whole country. The Commission also observed that it
would be desirable to provide in the legislation that only public limited
companies can run Chit Funds.
15

(ii) The Report of the study group on Non-Banking Companies under the
Chairmanship of James S Raj (1974) recommended for the enactment of
the central legislation for Chit Funds. The group also recommended that
the administration of the law should be left to the State government
concerned which in turn could seek the advice and assistance of the RBI
on policy matters. They recommended a ban on prize Chits! benefits !
saving schemes, as these were detrimental to general public interest.
(iii) The Report of the working group on financial companies, under the
Chairmanship of A C Shah (1992).
10. Nayar, C.P.S. op.cit.
11. Radhakrishnan, S. et al, Chit Funds and Finance Corporations, IFMR
Publications, Madras, (1975).
12. Traditionally Kerala consisted of three regions namely the princely
States of Travancore, Cochin and the region of Malabar. On November
1, 1956, these regions were merged to form the new State called Kerala.
16

CHAPTER TWO
REVIEW OF LITERATURE
This chapter attempts a review of the available literature related to
the topic. For an orderly discussion, the chapter has been divided into two
parts. The first part gives a theoretical and empirical background to the
study on Chit Funds and in Part II a review of various studies on Chit Funds
are given.
PART I
Capital is a crucial factor in the development of any economy.
Theoretical studies have categorically stated that savings and capital
formation can be enhanced with the development of the financial system.
The basic principle underlying Chit Finance is accumulation of savings
through mutuality. Hence it seems appropriate to discuss some of the
relevant theoretical issues on savings and capital formation.
Economists have developed several theories on Savings and
Investment. There are at least two broad views on the determinants of
national savings. One view stems from the classical and neo-classical
school, which stresses the rate of return or interest on savings, and the other
stems from Keynesians and modern economists, which stresses income. A
section-wise thematic analysis has been attempted here on the topic covering
savings, capital accumulation, financial intermediation and investment.
2.1 SAVINGS
According to Alfred Marshall I (1890) there are both economic
and non-economic factors influencing savings. Among the economic factors,
the key role is given to rate of interest.

Keynes 2 (1936) on the other hand stated that men are disposed, as
a rule and on the average, to increase their consumption as their income
increases, but not by as much as the increase in their income. In other words
a rising income will often be accompanied by increased saving, and a falling
income by decreased saving, on a greater scale at first than subsequently.
V.K.R. V Ra03 (1952) stated that the agrarian nature of the
economy makes for a supply curve that, at best, is much more inelastic than
that of an industrialised economy such as Keynes primarily had in mind.
Savings therefore fail to rise to equality with investment.
Duesenberry" (1949) in his Relative Income Hypothesis (RIH)
argued that the fraction of a family's income devoted to consumption and
hence savings depends on the level of its income relative to the income of
other families with which it identifies rather than on the absolute level of its
Income.
The Life Cycle Hypothesis (LCH) of Modigliani and
Brumberg' (1954) observed that the individual's consumption and hence
savings in any given time period does not depend to a significant degree on
his income during that period but depends on the present value of his
expected income or his wealth. LCH is based on the argument that the rate of
consumption in any given period is a facet of a plan, which extends over the
balance of the individual's life, while the income accruing within the same
period is but one element, which contributes to the shaping of such a plan.
According to Hla Myint," (1965) a country's rate of economic
growth depends not only on how much it can save, but also on how
productively it can invest this saving.
2.2 CAPITAL FORMATION
Classical economists with very few exceptions recognise the causal
nexus between saving, investment, technological progress and economic
development. They emphasise that profit induces investment, and the larger
18
the profits, the greater the capital accumulation. Adam Smith' (1776) for
instance, stressed the need for capital to increase the productive power of the
labourers. According to David Ricardo8(1817) economic growth is contingent
upon capital accumulation, and contended that whatever is saved is invested.
Mill's 9 (1848) fundamental propositions with regard to capital represent the
classical position on saving, investment and economic development. Mill's
first proposition is that industry is limited by capital. A second proposition is
that all capital was originally the result of saving.
Karl Marx 10 (1867) too gave primacy to accumulation in his
analysis of Capitalist Development. The magnitude of the capital accumulated
clearly depended on the absolute magnitude of the surplus value.
Irma Adelman 11 (1962) stated that the rate of capital accumulation
is regulated by two factors, namely, the ability to save and the will to save.
How large a fraction of their 'net income' they consume is determined by the
intensity of their motive for saving, the rate of profit. See also Meade 12
(1962) and Arthur Lewis'? (1970).
2.3 ROLE OF FINANCIAL INTERMEDIATION IN SAVINGS AND
CAPITAL FORMATION
There are a number of studies such as Gurley and Shaw 14(1967),
McKinnon1S(1971) and Patrick" (1983), which have clearly established that
savings and capital formation are enhanced with the development of
financial intermediation.
Warren F. Lee 17 (1968) arguedthat financial institutions can help
potential savers and borrowers by adjusting to their different behaviour, and
this process will increase the community'S investments and productivity and
will help even the poorest rural people to participate in effective credit and
savings mobilisation programmes.
Arnaldo Mauri 18 (1977) pointed out that savings mobilisation
requires a system of financial intermediaries and co-operatives at the grass
19

roots and that savers must have a wide choice of safe financial assets offering
attractive returns.
Bouman 19 (1977) in his paper "Indigenous Savings and Credit
Societies in the Developing World: A Message" revealed that organisations of
farmers who periodically contribute money in small sums and receive one
large amount at one time in rotation constitute an informal mechanism that
mobilises savings and in some cases supports productive investments.
According to him such Rotation of Savings and Credit Associations
(ROSCAs) have been highly successful due to their accessibility, simple
procedures, flexibility and adaptability to many purposes. The ROSCA
through its 'forced' savings mechanism is instrumental in resource
accumulation. Its role in productive agricultural investment might be larger
than hitherto assumed (See also Leonard TcRuindjo, 1999). The popularity of
ROSCAs among low and middle-income groups show that people like to save
even under trying conditions (See World Development Report, 1981).
Dale Adams 20 (1978) showed that substantial potential exists for
mobilising voluntary savings from rural households in developing countries.
Opportunities to save and incentives to save are key factors in developing this
potential. He argued that many low-income households in many countries do
not save because they do not have opportunities or incentives to entrust their
savings to financial institutions.
In "Finance Corporations: A study of unregulated banks", Nayar21
(1982) made an attempt to make a detailed study of the structure and
functions of the informal financial intermediaries. He has examined whether
they should be allowed to carry on the business of banking or not. The study
made a strong case for their continuance and remarked that these informal
financial intermediaries prospered largely due to their realistic attitudes
towards many of the problems facing the borrowers and savers. They served
both in rural and urban areas and their operations were flexible in adjusting
to the requirements and conditions of the clientele.
20

Alvin Prakash22 (1984) in his work "Private Financing Firms in
Kerala- A Study" showed that since the beginning of the 1980's there was
phenomenal growth in private financing institutions in Kerala. This study
based on a survey of these firms in Trichur town revealed that they have
emerged as powerful parallel banking system in the town posing a threat to
the normal banking system. The study concluded that there is need to regulate
the activities of such firms through appropriate regulatory measures. It also
showed that before imposing any regulatory measures, steps should be taken
to remove the existing credit restrictions and also to expand credit facilities
for business purpose.
Binu Daniet23 (2000) in his work "Urban Informal Credit Markets:
Structure, Dynamics and Intermediation" analysed the role and dynamics of
the informal credit institutions in mobilising savings and supplying credit to
different categories of people. the study is based on a survey of informal
credit institutions in Ernakulam District. The study revealed that Chit Funds
in the formal sector also conduct money-lending business unauthorised.
Ligeti Sander" (1984) in his paper "Rural Savings and
Agricultural Credit" revealed that both rural savings and agricultural credits
are influenced by the survival of financial dualism. The traditional rotating
savings and credit association has an ambiguous role in the developing
countries. He argued that savings can be induced if financial institutions
which, have no widespread rural network, establish rural offices. In small
villages, mobile offices can serve the purpose and the amount of collected
savings can be increased.
Boumarr" (1989) In his book "Small, Short and Unsecured:
Informal Rural Finance in India" discussed the performance of a number of
financial agents in semi-urban Sangli, a district in Maharashtra. Bouman's
main focus of interest was, however, the informal financial intermediaries or
agents such as moneylenders, pawnbrokers, milk venders and several types
of local self-help savings and credit associations that have increased
dramatically in numbers in recent years. Bouman argued that the informal
21

sector acted as a catalyst and assisted small-scale borrowers to participate in
the development boom in a formerly stagnant economic environment. The
study also indicated that there was no clear dividing line between formal and
informal financial markets, the two being closely intertwined. The Sangli
experience demonstrated that linkages seem to develop spontaneously
whenever and wherever people perceive such links as advantages.
"The Inherent Strength of Informal Financial Institutions" by
Nayar 26 (1989) describes four major types of informal finance in India and
identifies their strengths. It is argued that informal finance is often
conducted more efficiently than formal finance in terms of loan processing,
the ability to make small and short-term loans, and effective loan recovery.
Prabhu Ghate 27 (1992) in his work "Informal Finance: Some
Findings from Asia" examined the role of informal finance in most Asian
Countries. The form of informal finance that makes the greatest contribution
to additive savings (that is savings that would not have been mobilised
anyway by the formal sector in the absence of the informal) is mutual finance.
The study noted the possibility also of an indirect effect on savings through
the higher productivity of investment stemming from increased allocative
efficiency because of the higher volume of intermediation made possible by
the informal sector. The study was based on a research project that examined
informal finance in India, Bangladesh, Indonesia, Philippines and Thailand.
PART 11
In Part Il, a section-wise thematic analysis has been attempted on
the topic covering growth, working and legislation of Chit Funds, their role
and importance and the global scenario of Chit Funds.
2.4 GROWTH, WORKING AND LEGISLATION OF CHIT FUNDS
In one of the earliest references to the existence of Kuries, Sim
COX28 (1894) in his work "Primitive Civilization or Outlines of the History of
22
Ownership in Archaic Communities" has mentioned about the 'Dravidian Kuri
or Lottery' that is used for raising a sum of money for some special purpose.
A striking reference on the origin of Kuries is found in
Padmanabha Menon's 29 (1920), work on "History of Kerala". According to
him Kuries developed as a source of finance for the national assemblies that
prevailed in Malabar since the 8th century A.D.
Subbarama Aiyar 30 (1925) in his work "Economic Life in a
Malabar Village" has described the working of "Changati Kuri' where 'lot'
decides every month the person to whom the amount is to be paid and the
person who gets the sum is bound to entertain the members. It also traced
out the superiority of Chit Funds over co-operative credit societies. The Chit
Fund offered a fixed quantity of money at a flexible rate of interest - the rate
of interest (the discount) on the Chit amount changing according to the
demand for money. Thus it allowed freedom to its borrowers in fixing the
rate of interest on the loan.
ThomasP. J. 31 (1948) in his work "Our Economic Heritage" has
observed that Kuri is the indigenous form of banking in Malabar (Kerala).
William Logan 32 (1951) in his work "Malabar" has clearly
mentioned the presence of a flourishing Kuri or Lottery system existing in the
Society. He also described the operation of the Kuri system among friends
known as 'Changaathi Kuri '.
The Report of the Travancore-Cochin Banking Enquiry
Commission'? (1956) stated that most of the banks in the erstwhile
Travancore-Cochin state grew out of the womb of Chit or Kuri Funds that
have been operating in the State since ancient times.
The All India Rural Credit Survey 34 (1958) for the first time
attempted a scientific enquiry into the working of Chit Funds. This enquiry
appended to the Quilon District Monograph of the survey, analysed the
organisation of Chit Funds in some detail, though of a very limited
23

geographical area. The survey report presented the position of the foreman
as well as the subscriber. The report showed that the Chitty allowed a
reasonable rate of interest to the subscribers who joined for investment
purposes. The Survey mentioned the average duration of Chits as ranging
between 28 and 84 months. The report of the enquiry stated that to study the
working of a Chit Fund as a, banking institution, it was probably more
appropriate and logical to consider a fixed rate of interest on investment and
a different higher rate of interest on loans.
Krishnan V 3S (1959) in his work "Indigenous Banking in South
India" has dealt with indigenous savings institutions like Chit Funds and
Nidhis. The study presented the general features ofChit Funds, different kinds
of Chits and the malpractices existing in the system like delay in giving the
prize-money, lack of transparency in accounting and failure in the payment of
monthly subscription by the prized subscriber.
Sreedhara Menon" (1967) presented the position of the ChittylKuri
business in the state of Kerala and traced out the need for bringing
ChitttestKuries under social control. The necessity for a separate legislation
applicable to Chitties/Kuries throughout Kerala has also been emphasised in
the study.
Nayar 37 (1973) in his study "Chit Finance: An Exploratory Study
on the Working of Chit Funds" had tried to place the role of Chit Funds in
the proper financial perspective. The study emphasised the need to regulate
the activities of Chit Funds, but at the same time, perceived their role as
active mobilisers of savings of the community and as a useful complement to
other financial institutions. The work was an attempt to study all the known
types of Chit Funds, classifying, naming and defining them wherever
necessary. The study also attempted to examine the economic aspects of Chit
Funds on an empirical and analytical basis. The analysis covered all the
patterns of business of Chit Funds working throughout the country.
24

He also pointed out that the basic principle underlying a Chitty is
accumulation of savings. The unique feature of savings in a Chitty as against
the savings in other types of financial institutions such as commercial bank,
the post-office savings bank, etc., is that there is a sort of compulsion in
effecting savings. While examining the history of Chit Funds, Nayar has also
discussed different stages of their evolution.
Radhakrishnan 38 (1975) in his work "Chit Funds and Finance
Corporations" attempted to look at the working of Chit Funds primarily from
the angle of the subscribers. It examined critically the working of prize and
auction Chits. It also traced the growth of Chit Funds particularly in Tamil
Nadu. The study also brought out the abuses and malpractices in Chit Funds
and argued for stringent regulations and for their effective administration. The
study called for a ban on acceptance of deposits by unincorporated Chit Funds
and similar agencies. The study also opposed the entry of public sector and
commercial banks into the business of Chit Funds. It attempted to show that
Chit funds are neither a cheap source of credit nor an attractive medium of
saving. The study also included various methods of estimation of economic
gains and losses of the subscribers.
Radhakrishnan 39 (1979) In his work "Nidhis: An Indigenous
Financial Institution", made a study on a not so well known South Indian
financial intermediary. After describing the characteristics and the
functioning of "Nidhis" there has been a detailed discussion of their defects
and deficiencies and the directions in which they ought to be reformed,
through both self-regulation and government regulation. Based on this
comprehensive study on "Nidhis", the author came to the conclusion that
they have a distinct place in the financial system. Hence they must be helped
to keep their identity and must be brought under the RBI regulation.
Nayar 40 (1982) in his paper" Finance Corporations: An Informal
Financial Intermediary in India" attempted a comprehensive study of finance
corporations and similar indigenous financial institutions. The study tried to
examine their role and operations in rural and urban areas, to identify the
25

factors leading to their growth, and to examine the existing legal framework
of regulation and suggest changes if any. The study emphasised the need for
strengthening the self-regulatory measures of the corporations and also for
introducing some outside controlling measures to make up the deficiencies
in self-regulations.
A study conducted by Organisation for Economic Co-operation and
Development, Paris 41 (1987) had tried to analyse the break-up of the credit
from the Chit Funds. The study showed that about 41 per cent of the prize
amount from Chit Funds would go to the direct economic activity, 30 per cent
to the acquisition of assets, while only 14 per cent went for personal
consumptions for which the required assets could not be obtained from banks
orfinancial institutions.
"Economic Implications of the Central Chit Funds Act 1982: An
Appraisal" by Mohandas 42 (1988) attempted to evaluate the Central Chit
Funds Act 1982 as a regulatory measure for Chit business. The paper dealt
with the features of Chit Finance, conceptual issues involved in Chit Fund
regulation and also with the economic implications of the major provisions
of the Act. The study suggested a graduated ceiling on discount ranging from
thirty to fifty per cent for Chits of different duration. To eliminate
unnecessary competitive bidding, the study recommended restriction on open
bidding up to twenty five or thirty per cent of the Chit amount and allow
further bidding up to fifty or sixty per cent only on the production of cash
deposits above the initial limit. The study also analysed the economic gain to
the saver and cost of borrowing in terms of effective annual interest yield
and effective annual interest cost.
Manjeshwar Ananth Pai 43 in the Paper "Chit Funds-Some Aspects
of Tax Laws" (1995) argued that Chit Funds can be considered as mutual
benefit associations. Accordingly income derived from such association has
been exempted from income tax on the ground of mutuality. Since the basic
proposition in the context of taxation is that no one can make a profit out of
himself and this proposition still holds good when a number of individuals
26

join together and contribute to a common fund in pursuance of a scheme for
their mutual benefit having no dealings or relations with any outside body.
"Report of the Study Group to Enquire into the Problems Faced
by the Kerala State Financial Enterprises Ltd." 44 (1999) by The School of
Management Studies, Cochin University of Science and Technology, focused
its attention on the appropriate strategies for improving the Company's
performance after identifying its strength, weakness, opportunities and
threats. The study also included an analysis of the working of the company
and suggested strategies to overcome the inherent problems. An
enhancement of equity capital, promotion of Chit business, reduction of
default, improvement of the accounting system and computerisation were
some of the major recommendations of the study group.
"A Study on the Working, Achievements and Prospects of Kerala
State Financial Enterprises Ltd." 45 (1999) by Baburaj assessed the progress
in the working of KSFE Ltd. and examined how far the company has
succeeded in mobilizing the savings and efficiently utilizing it. The study
found out the performance of the company in terms of volume of business
achieved appeared good and the economic and social impact of various
schemes of the company have been positive and significant. The study also
presented some suggestions for the better performance of the company like
appropriate training programme to the employees, better accounting system,
autonomy in decision-making and operational flexibility.
"An Evaluation of Private Chits in Kerala" by Omana P V 46
(2000) attempted to evaluate various investment schemes with those of Chit
schemes and presented the causes and failures of certain Chit organizations.
The study revealed that the major causes for the failure of Chit companies
are the failure to disburse the prize amount due to default by subscribers,
poor financial position of the foreman, forgery in the number of members
and misappropriation of funds by the foreman or members. It showed that 52
per cent of the private Chit companies were charging foreman's commission
27

between 5 and 6 per cent and 36 per cent of Chit foremen were charging a
commission of 7 to 8 per cent.
Bala Subramania 47 (2002) in his article" The Thriving Chit Fund
Business in the South" stated that the latest amendments in the Central Chit
Fund Act will go a long way in making the ancient and India's own financial
institution of Chit industry more vibrant and a healthy business. The article
showed that Chit firms were having better cash flows now due to the
reduction in security deposit and higher discount limit on the prize money.
This will also bring high return to the subscribers by way of more dividends.
This article also cited the peculiar case in Kerala where the State
Government itself is a big operator in the field. It also showed that most of
the Chit Funds from Kerala are said to be operating out of Chandigarh,
Faridabad and Jammu and Kashmir.
2.5 ROLE AND IMPORTANCE OF CHITS
Srinivas and Higuchi 48 (1966) in their work "A Continuum of
Informality of Credit: What Can Informal Lenders Teach Us?" observed that
Chit Funds, credit societies and people's organizations, have been grouped
under the category 'Mutual Credit Suppliers' because the demand and supply
of credit is mutual - that there is a give and take process involved.
Participants typically support each other for credit needs in mutuality. The
money supplied or saved by some participants is lent and borrowed by some
other participants. Thus the benefits of the operation are mutual to all
participants and equally distributed. The central idea of mutual credit
suppliers is that they encourage savings from the participants.
"Report on the Survey of Household Savings and Investments in
Kerala 1977-78" by State Planning Board, Trivandrum, 49 (1981) showed that
a strikingly distinctive feature of household savings in Kerala has been the
popularity of the Chit Fund schemes in the state. The survey had brought out
that the Chit Funds accounted for the largest share of financial savings held
by households in the state. It was also found that in terms of the savings
28

pattern, Chit Funds seemed to be more popular with the rural households
(22.7 per cent of the financial savings of rural households as against the
corresponding percentage of only 13.4 per cent for the urban household).
Nayar, 50 (1984) in his work "A Study on Non-Banking Financial
Intermediaries" pointed out that Chit Funds have come to stay as a unique
non-banking financial intermediary in India especially in South India. He also
pointed out that the rationale of an Auction Chitty or Business Chitty is that
the borrowers and lenders meet to fix the rate of interest and since there is
more than one borrower competing for the same amount, a competitive rate of
interest is offered. Only the members enjoy the benefits of the scheme. The
study highlighted the fact that for the subscribers, the return on subscriptions
was not the only consideration. The possibility of getting a lump-sum on easy
terms at short notice was a great inducement. Hence, it is advisable to retain
these within the framework of non-banking financial intermediaries as
separate non-banking financial institutions controlled under Chit Funds Act
1982, by the state governments.
Nayar 51 (1986) in a subsequent paper" Can a Traditional Financial
Technology Co-exist with Modem Financial Technologies? The Indian
Experience" has tried to prove convincingly that Chit Funds not only co-exist
with the fast growing formal banking sector, but also form a significant
proportion of it.
The report of the study commissioned by the Asian
Development Bank52 (1989) lauded Chit Funds as the only system for both
saving and borrowing effected under mutual help with dignity, scoring over
other savings, credit and investment options being so flexible in operation.
Their strengths, weaknesses and potential therefore deserve serious study on
par with the rest of the more conspicuous denizens of the financial domain.
Itoop, M.L 53 (1990) in his work "Economic Significance of Chit
Funds in Kerala" tried to identify the factors leading to the growth of Chit
Funds in Kerala especially in the 1980's. He also examined its utility as a
29

saving instrument and supplier of easy credit and thus employment potential.
The findings of the research revealed that Kuries help, industry, agriculture
and even house construction. The only unproductive expenditure related to
the money spent on marriages and on durable consumer goods. The study
also found that the cost of credit is cheaper compared to the cost of credit
with reference to commercial banks and other financial institutions.
Jose KG 54 (1990) in his study" Rural Transformation in Kerala: A
Case Study with Reference to Three Panchayats" revealed that in all the three
Panchayats, (namely Thazhava, Pananchery and Muttil), 191 persons out of
228 (84 %) surveyed had savings in the form of Kuri. The Kuri amount when
obtained was generally utilized for house construction, purchase of land,
marriage, etc.
Joseph M A 55 (1992) in his study "Chit Schemes: Relevance and
Scope as SavingslInvestment Alternatives" evaluated various savings I
investment schemes available in comparison to the Chit schemes. It showed that
Chit schemes can be treated as the best investment alternative available. The
rate of return on Chit was calculated by dividing the annual dividend by the
annual net subscription. The study showed that the rate of return calculated for
a Chit was much more than the rate of return applicable to the various
investment alternatives.
It also presented the various characteristics of Chit schemes and
concluded that authorised Chit business was in the ruins due to the hard and
stringent provisions of the enactments and KSFE was far away from the
reach of the common people.
Baby Soosy 56 (1993) in her study "Savings/Investment and
Capital Formation in a Rural Setting: A study of Udayamperur" found out
that the most accepted form of saving for the respondent households was
Chitties (28.2%). Deposits with the Banks formed 18.64 per cent of the
savings, Provident Fund and LIC accounted for 7.76 per cent and 6.64 per
30

cent respectively. The study also showed that of the types of Chits, monthly
Chits seemed to be more popular.
Radhakrishnan 57 (1995) in his paper "Chit Fund: A Poor Man's
Credit Institution" argued that Chit Funds and Nidhis have not received the
attention they deserved in the scheme of reforms. The paper included certain
measures of reforms to enable Chit Funds to grow on sound and healthy
lines, including the introduction of credit rating for all incorporated Chit
Fund Companies.
Rajendran 58 (1997) in his work "Rural Credit Management"
attempted to provide a brief resume of the evolution of credit in Kerala, the
different practices and the institutions concerned, since the beginning of the
19th century. The role of Chitties, operation of Chit Funds and the magnitude
of the Chitties in terms of their number, extent and volume of operation up
to 1936 have been included in the study. The study pointed out that the vital
links between the pre-institutional and the institutional phases were provided
by ChitFunds which gradually emerged into banking institutions.
2.8GLOBAL SCENARIO
The Chit Fund business is a universal phenomenon now. In
Europe it is conducted in the name of 'Rotating Credit', in Philippines it is
referred to as 'Paluwagons'; in Korea it is named as 'Key' and in Sri Lanka it
is calledas "Chetus':
According to F.J.A Bouman, 59 (1977) not only does the credit
rotate, but the saving position rotates too and hence the term, Rotating
Savings and Credit Associations (ROSCAs). A member saves until he receives
the fund, after which he starts to repay the loan in instalments. The fund
received by members at intermediate points in the life of the cycle includes a
portion equal to the sum of their past contributions, their contributions to the
fund on the occasion of their turn to take the fund and a final portion which is
a loan to be repaid out of their future contributions. The Rotating Savings and
Credit Association (ROSCA) are formed from a core ofparticipants who agree
31

to regularly pay a certain amount of money to a fund. which in turn IS
distributed entirely or partially to each participant (Ardener, 1964) 60.
Leonard TcRuindjo 61 (1999) in his study "The Evolution of an
Informal Financial Institution: The Rotating Savings and Credit Associations in
Cameroon" showed that the "Rotating Savings and Credit Association"
(ROSCAs) mobilise resources. which would have been hoarded otherwise. The
study revealed that ROSCAs accelerated the speed of circulation of money. The
study also showed that the proliferation of these ROSCAs can be explained by
their easy adaptation to the economic and social transformation of each epoch
and bythe inability of the formal financial system to integrate the local realities
in its relationship with its customers.
World Development Report 62 (1989) has presented Rotating
Savings and Credit Association (ROSCA) as a popular form of informal
finance in a number of countries. which intermediate in the most basic way.
The money collected (the fund) is given in rotation to each member of the
group. The popularity of ROSCAs among low and middle-income groups
show that people like to save even under trying circumstances.
Indira Rajaraman 63 (1995) in her article "The Role of ROSCAs"
has tried to explain Rotating Savings and Credit Associations and their
similarities with Chit Funds in India. The Article showed that these
associations are functional in various parts of the world including highly
developed countries. Random ROSCAs are similar to Prize Chits in India.
while bidding ROSCAs are similar to our Auction Chits.
Conclusion
The review of the available literature shows that although there
are a few studies on Chit Finance and also on different aspects of financial
intermediaries, there has been no specific comprehensive study on Chit
Finance in Kerala with special emphasis on KSFE Ltd. The present study is
an attempt to fill this gap to a certain extent.
32

References
t. Marshall, Alfred. Principles of Economics, 3cd ed. Macmillan, New
York, (1895), pp. 313-16.
2. Keynes, John Meynard. The General Theory of Employment, Interest
and Money, Harcourt Brace and World, New York, (1965), pp. 31, 96,
97, 107-10.
3. Rao, V.K.R.V. "Investment, Income and the Multiplier in an Under
Developed Economy", The Indian Economic Review, February. (1952).
4. Duesenberry, James S. Income, Saving and the Theory of Consumer
Behaviour, Harvard University Press. Cambridge. (1949).
5. Modigliani, F and R Brumberg. "Utility Analysis and Consumption
Function: An Interpretation of Cross Section Data". Kurihara (ed.) Post..
Keynesian Economics, University Press. Rutgers, (1954). pp.383-436.
6. Myint, Hla. The Economics of the Developing Countries, Praeger
Publishers, New York. (1965), pp.15-16.
7. Smith, Adam. An Enquiry into the Nature and Causes of the Wealth of
Nations, Henry Frowds, London. (1904), p.326.
8. Ricardo, David. The Principles ofPolitical Economy and Taxation, Dent
and Sons, London, (1817), p.79.
9. Mill, John Stuart. Principles of Political Economy, Longman, Green &
Co, (1848), pp. 39- 45.
10. Marx, Karl. Capital, Chicago, Kerr & Co., (1906). pp.656-86.
t 1. Adelman, Irma. Theories ofEconomic Growth and Development, Oxford
University Press, London, (1962), p.53.
12. Meade, J.K A Neo-Classical Theory of Economic Growth, AlIen &
Unwin Ltd.• London, (1962), p.I.
13. Lewis, W Arthur. Theory of Economic Growth, Harper & Row, New
York, (1970), pp. 224 -25.
14. Gurley and Shaw. "Financial Structure and Economic Development",
Economic Development and Cultural Change. Vol.15. No. 3., (1967).
33

15. Mc Kinnon, R J. Money and Capital in Economic Development,
Washington Brooking Institution, (1971), p.117.
16. Patrick, H.T. "Financial Development and Economic Growth", (ed.)
Rural Financial Market in Developing Countries, The John Hopkins
University Press, London, (1983), p.50.
17. Warren, F. Lee. "The Role of Financial Intermediaries in the Activities ofRuraJ
Firms andHouseholds", The Ohio State University, USA, (1968).
18. Arnaldo, Mauri. "A Policy to Mobilise Rural Savings in Developing
Countries", Savings and Development, No.l., (1977), pp. 14-25.
19. Bouman, F.J.A. "Indigenous Savings and Credit Societies ID the
Developing World: A Message", Savings and Development, No. 4,
(1977).pp~ 181-214.
20. Dale, W. Adams. "Mobilising Household Savings through Rural
Financial Markets", Economic Development and Cultural Change,
Vo1.26, No.3, (1978), pp. 547-60.
21. Nayar,CPS. Finance Corporations: A Study of Unregulated Banks,
IFMR Publication, Madras, (1982)
22. Alvin, Prakash B. "PtivateFinancing Firms in Kerala: A Study",
Economic andPolitical Weekly, XIX, No.50, December -I5~ {I984).
23. Binu, Dominic."Urban Informal Credit Markets: Structure, Dynamics
and Intermediation", Ph; D Dissertation; Mahatma Gandhi University,
Kottayam,(2000).
24. Ligeti,Sandor. "Rural. Savings and Agricultural. Credit" Savings and
Development: Proceedings of a Colloquium, Paris, (1984); p;·S7.
25. Bouman, F.J.A. Small Short AndUnsecured: Informal Rural Finance in
India, .Oxford University Press, (1989).
26. Nayar, CPS. "The Inherent Strength of Informal Finaneial Institutions",
Ohio State University, The Agency for International Development, The
World Bank, Washington D:C., (1989).
27. Prabhu,Ghate. Informal Finance Some Findings From Asia, Asian
DevelopmentBank, Oxford University Press, (1992);ppA4-83.
34

28. Sim, Cox. Primitive Civilization or Outlines ofthe History ofOwnership
in Archaic Communities, Vol.l, Swan Sonnensichein and Co., London,
(1894).
29. PadmanabhaMenon, KP. History of Kerala, (ed.) Asian Educational
Services, New Delhi, Vol.l.(1982).
30. Subbarama, Aiyar S. Economic Life in a Malabar Village, The
Bangalere Printing and Publishing Co. Ltd., Bangalore, (1925). p.66.
31. Thomas, P.J. "Our Economic Heritage", Silver Jubilee Souvenir, Triehur
Dharmodayam Company, (1948), p.8.
32. Logan, WiHiam. The Malabar Manual, 1887,reprinted as Malabar by
the Government of Madras, Vol.I, (1951), p, 173.
33. Rep-Ortof the Travancore-Cochin.BankingEnquiry Commission,
Governmentof India, (1956), pp. 37-49.
34. All India Rural Credit Survey, District Monograph, Quilon, RBI,
Bombay, (1958), p. 97.
35. Krishnan, V. Indigenous Banking in South India, The Bombay State Co
operative Union, Bombay, (1959),ppI30-43.
36. Sreedharan Menon, K.A. Schemes for Starting Chitties Under State
Auspecies, Government of Kerala, (1967),p.16.
37. Nayar C.P.S. Chit Finance: An Explorative Study on the Working ofChit
Funds, Vora and Co.PublishersPvt.Ltd., Bombay, (1973).
38. Radhakrishnan, S. and others., Chit Funds and Finance Corporations,
IFMR Publications, Madras,
39. Radhakrishnan, S. Nidhis: An Indigenous Financial Institution, IFMR
Publications, Madras, (1979).
40. Nayar, C.P.S. "Finance Corporations: An Informal Financial
Intermediary in India", Savings and Development, No. L, (1982).
41. Report of the Study by Organisation for Economic Co-operation and
Development, Paris, (1987).
42. Mohandas, M. "Economic Implications of the Central CbitFunds Act,
1982: An Appraisa:I", Prajnan, Vol. xvn, No,I,NIBM. Pune, (1988).
35

43. Manjeshwar, Ananth Pai. "Chit Funds: Some Aspects of Tax 'Laws",
Paper presented at the Seminar on Economic Liberalisation and Chit
Funds, Delhi Chi! Funds Association, Chamber of Commerce and
Industry, New Delhi, April,(1995).
44. Report of the Study Group to Enquire into the Problems Faced by the
Kerala State Financial Enterprises Ltd., School of Management Studies,
CUSAT, (1999).
45. Baburaj, K.R. "A Study on the Working, Achievements and Prospects of
Kerala State Financial Enterprises Ltd.", Ph. D Dissertation, University
of Kerala, Trivandrum, (1999).
46. Omana, P.V. "An Evaluation of Private Chits in Kerala", M Phil
Dissertation, Cochin University of Science and Tcehnology, (2000). -
47. Bala, Subramania V. "The Thriving Chit Fund Business in the South",
The Economic Times, Mumbai, May, (2002),p.l1.
48. Srinivas and Higuchi."A Continuum of Informality ofCredit: What Can
Informal Lenders Teach Us?", Savings and Development, No: 2 :XX,
Finafrica, (1966).
49. Report on The Survey of Household Savings and Investments in Kerala
1977-78, State Planning Board, Trivandrum, February, (1981).
50. Nayar, C.P.S. "A study on Non- Banking Financial Intermediaries",
IFMR, RHJ Publication, (1984), Chapters 1 and 7, pp. 1-24, 177-81.
51. Nayar, C.P.S. "Can a Traditional Finance Technology Co-exist with
Modern Financial Technologies: The Indian Experience", Savings and
Development, Finafrica, Quarterly Review, No. I, (1986), pp. 31-58.
52. Report of the Study by Asian Development Bank, (1989).
53. Itoop, M.L. "Economic Significance of Chit Funds in Kerala", M Phil
Dissertation, Cochin University ofScience and Technology, Cochin, (1990).
54. Jose, K G. "Rural Transformation in Kerala: A Case Study with.
Reference to Three Panchayats", Ph. D Dissertation. Cochin University
of Science and Technology, Cochin, (1990).
36

55. Joseph, M.A. "Chit Schemes: Relevance and Scope as Savings/
Investment Alternatives", M Phil Dissertation Cochin University of
Science and Technology, Cochin, (1992).
56. Baby, Soosy. "Savings/Investment and Capital Formation in a Rural
Setting: A Study of Udayamperur", M Phil Dissertation, Cochin
University of Science and Technology, Cochin, (1993).
57. Radhakrishnan, S. "Chit Fund: A Poor Man's Credit Institution". Seminar
on Economic Liberalisation and Chit Fund, Delhi Chit Funds Association,
Chamber ofCommerce and Industry, New Delhi, April, (1995).
58. Rajendran, G.K. Rural Credit Market: Anmol Publication, New Delhi, (1997).
59. Bouman,F.J.A. "Indigenous Savings and Credit Societies in the
Developing World: A Message", Savings and Development, No. 4.,
(1977), pp. 181-214.
60. Ardener, S. "The Comparative Study of Rotating Credit Association",
Journal of the Royal Anthropological Institute, 94 (2), (1964).
61. Leonard, TcRuindjo. "The Evolution of An Informal Financial
Institution: The Rotating Savings and Credit Associations in Cameroon",
African Review ofMoney Finance and Banking, (1999).
62. World Development Report, " Issues in Informal Finance" Oxford
University Press. (1989)p.114.
63. Indira, Rajaraman. "The Role of ROSCAs", Seminar on Economic
Liberalisation and Chit Funds, Delhi Chit Funds Association. Chamber
ofCommerce and Industry, New Delhi, April, (1995).
37

CHAPTER THREE
EVOLUTION AND GROWTH OF CHIT FUNDS
After reviewing the available literature related to the topic, this
chapter traces in brief the origin of Chit Funds, different stages in its
evolution and different methods of Chitties or Kuries. It also presents the
unique features of Chits and the method of their operation. This chapter also
discusses the growth of Chit business in terms of the number of Chits
registered and the volume of Chit capital (sola) both before and after the
formation of the Kerala State and also makes an institution-wise and region
wise analysis of Chit business. A comparison of the growth of Chit Funds
with that of the domestic deposits as well as the total deposits with banks in
Kerala has been attempted. This chapter also gives a bird's eye view of the
legislative regulations on Chit Funds. As the last section of this chapter, an
estimate of the cost and return on Chit scheme .has been worked out by using
different methods including the discounted cash flow method.
3.1 THE ORIGIN OF CHIT
The word 'Chit', suggests the origin of Chit Funds. 'Chit' means a
written note on a small piece of paper. In the Malayalam language, it is known
as 'Kurr, which has been derived from 'Kurippu' (which means a piece of
writing or script). The 'Chitty' or 'Kuri'l is a derivative, the root being the
'lot'. The foreman writes the name of each subscriber on a small piece of
paper and folds it several times with the name inside for the purpose of
deciding the prize-winner. He calls it the 'Kuri' or 'Chit' or 'Narukku' and in
the transaction, one 'Narukku' also means one member.
The folded or rolled Chits or Kuries are put in a vessel containing
some rice. The rice and the Chits are mixed well and a person is called upon

to pick one Chit from the vessel. The Chit is opened, the name read out and
the member declared as prize-winner. At the next instalment, the prized Chit
is removed from the vessel and the proceedings repeated. The Chit or Kuri
thus plays a crucial role in the allotment of the prize amounts. Hence it is
likely that the scheme itself came to be known after this important device 2.
The literature relating to the historical references on Chits show
that the Chitty business flourished in Travancore, Cochin and the Malabar
areas 3 of the erstwhile state of Kerala and in the southern parts of the then
Madras Presidency. Gradually it spread to the other parts of India. It seems to
have developed in a peculiar way. An intelligent but needy man who has some
social standing approaches a few of his friends to help him start a scheme for
obtaining a certain measure of paddy or rice to meet some emergencies such
as his father's 'Sraadha' (death ceremony) or daughter's marriage. He
manages to get, say 9 of his neighbours, who agree to contribute 5
'ldangazhis' (an old unit for measuring grain in Kerala) of rice per month for
a period of ten months to him and get the total contributions back in a lump
by rotation. The original beneficiary also joins the group with the same rate of
contribution (Nayar CPS 1973)4.
In the first month he collects 50 'Idangazhis' of rice from the 10
members including him and takes it for his purpose. In the second month, he
collects the same quantity of rice and offers it to one of the remaining 9
members. Now, since every member equally deserves to receive the month's
collection in advance, he decides to pick a lot to determine the prize-winner.
He draws the lot and gives the entire quantity of rice to the winner. He repeats
the process every month till all members get back their total contribution. He
calls himself "Munnal' (Foreman), each of the members "Chittal'
(Subscriber), the total contribution as 'Sa/a' (Capital) and the scheme itself
'Chitty' or 'Kuri', Evidently the scheme is a co-operative venture for getting
credit through mutual help.
Logan S (1887) who was the then Collector of the Malabar district in
the erstwhile Madras Presidency writes: "Another curious custom has come
39

down from ancient times and is still flourishing ... Anyone desirous of raising a
considerable sum of money for some temporary purpose invites his friends to
join him in what is called a Kuri or lottery ... The organizer of the Kuri gets a
certain number of his friends to subscribe a certain amount of money or of rice
husked or un-husked as the case may be. The friends bring their contributions
to his house where they are hospitably entertained, and by lot, the person is
selected to whom similar contributions from all present including the organiser
of the Kuri, are to be made at a certain date then and there fixed. This
individual in turn hospitably entertains his friends when they come with their
contributions. A third person is then selected, and the same thing comes off at
his house. And so it goes on until everyone of the original members or his heir
has in turn reaped the benefits of the contributions of his friends".
Sim Cox 6 (1894) records: "The Dravidian Kuri or lottery is said to
have been handed down from very ancient times, and it is still commonly
resorted to by anyone desiring to raise a sum of money for some special
purpose, such as a daughter's marriage... A feast is always given by the
recipient of the lump-sum... U
The Madras Provincial Banking Enquiry Committee, 7 1930 throws
more light on the place of origin of Chits. The committee says, " A very old
method of raising money is to be found chiefly in the south and southwest
districts and to a large extent throughout the Presidency in the innumerable
Chits or Chit Funds or, as they are known in Malabar, Kuries. They are very
numerous in Travancore State and in the adjoining districts of Malabar and
Tinnevelly. There are many in Coimbatore and South Kanara though they are
not so universal as in Malabar and there are numbers in all Tamil districts but
the farther one goes from Travancore the fewer they become. These are
comparatively few in the Telgu districts".
According to the Report of the Kuri Committee 8 appointed by the
erstwhile Government of Cochin in 1939, "the institution of Kuries became
very popular and took deep root in the state", Le. the erstwhile Princely State
of Cochin, now part of the State of Kerala. It also revealed that the people
40

began to realise more and more the advantages derived from Kuries and as
years rolled on, the institution of Kuries served as the best medium of
financing the development of trade and agriculture. At a later stage when
banks and other joint stock enterprises came into existence, Kuries began to
becontrolled by such institutions.
The Rural Banking Enquiry Committee, 9 1950 mentions, "of the
institutions engaged in promoting savings and functioning as mutual loan
societies, a reference may also be made to the 'Nidhis' (Mutual Benefit Funds)
and Chit Funds. On an organised scale they exist mainly in South India".
All India Rural Credit Survey, 10 1958 also notes that the institution
of Chit Funds, which dates back to a period even prior to the organisation of
co-operative credit societies is a noteworthy feature of the rural credit system
in Kerala.
3.2 EVOLUTION AND SPREAD OF CHIT FUNDS
While examining the development in the evolution of Chit Funds,
one may come across different stages. In the first stage of its evolution, the
Chitty scheme was known as "Changaathi (Friend) Kuri' i.e., a Kuri among
friends for mutual help. The essence of the scheme was the distribution of
contributions made by a group of persons, over a period of time, among
themselves by rotation. The foreman received no remuneration and acted as a
passive honorary president 11.
The second stage in the evolution of Chit Funds was characterised
by the emergence of an active organiser, replacing the previous honorary
foreman. The aim of the new foreman was to raise resources for some
temporary purpose. The starting of 'Money Chitties' together with the
introduction of auction principle brought about far reaching impact on Chit
business in the country. As Nayar, CPS 12 (1973) reports, the pattern of
subscribers also underwent changes. Apart from agriculturists, traders and
merchants, salary earners also became subscribers to the Chit business. This
41

change in the occupational pattern of the clientele was a major turning point
in the evolution of Chits.
The third stage of development in the evolution of Chit Funds started
with the entry of a new class of institutional foremen in the form of partnership
firm, private limited company, co-operative society and joint stock bank in
which large numbers of members were enrolled who gradually displaced the
individual foreman. The Travancore-Cochin Banking Enquiry Commission lJ
(1956) stated: "Most of the banks in the erstwhile Travancore-Cochin State has
grown out of the womb of Chit and Kuri funds that have been operating in the
State from ancient times". Even the banks, which were not grown out of Chits
in the State, started conducting Chits with the object of attracting deposits.
Along with the normal banking activities, Kuries or Chitties formed a
substantial portion of their total business. It would be evident from the facts
that as many as 166 banks were conducting Kuries during the thirties.
With the advent of institutional foremen, Chit became a modern
business requiring entrepreneurial skill, financial investment and at the same
time yielding reasonable return to the promoters. The Chit developed into an
institution for savings and supply of credit. With this, Chit started spreading
tourban and metropolitan centres and the Chit capital became sizable enough
to suit businessmen or traders 14. So also many ills of unbridled expansion of
Chits started and caused misery and loss to the subscribers.
The fourth stage of development in the evolution of Chit Funds was
the entry of Government to the field. While presenting the position of Chitty
orKuri business in the State, Sreedhara Menon IS (1967) traced out the need
for bringing Chitties and Kuries under State control. Consequently Kerala
State Financial Enterprises Ltd. (KSFE) was established in 1969 as a fully
Government owned Company to provide an alternative to the private Chit
promoters so as to liberate the common man from the clutches of the
unscrupulous promoters in the field of Chit Fund business.
42

Another important development of Chit Fund Business in Kerala
from the late seventies was the flight of Chit foremen to other states for
starting Chits, though they virtually operated in Kerala. The flight of the
foremen was due to the existence of certain rigid provisions of the Kerala
Chitties Act, 1975 prevailing in the State. This resulted in a sharp decline in
the registration of Private Chits in the State causing loss of revenue to the
Government and also instances of malpractices by the foremen.
A significant development in the evolution of Chit Finance in
Kerala in the mid 1990's was the introduction of 'Chit-like' schemes as
Monthly Deposit Scheme (MDS), Monthly/Mutual Benefit Scheme (MBS),
Monthly Benefit Deposit Schemes (MBDS), etc. by the Co-operative
Societies, Primary Co-operative Banks and by the Urban Co-operative Banks.
The above schemes function exactly like the Chit scheme. The only difference
is in the usage of new terms instead of Chitty. The main advantage of such
schemes over the Chit scheme is the minimisation of the formalities and
procedures. They can be conducted by any society or bank after obtaining
sanction for their bye-laws from the Joint Registrar of Co-operatives of the
concerned circle. The number and volume of these 'Chit like schemes' are
large and are significant in mobilising savings even from the low income
groups of rural and urban localities. But no authentic information about them
is available with the Government of Kerala since they are outside the scope of
the Kerala Chitties Act, 1975.
The starting of Corporate Chits, which serve the needs of the
corporate sector, can be viewed as another important stage of development in
the evolution of Chit Funds. The Model Chit Corporation Ltd., Hyderabad
floated in August 1995 introduced for the first time in the country, the Rs.l
Crore Chit, which was named the 'Century Line Series' (Krishnamurthy 16
1997). In the changing scenario and in the context of increasing need for funds,
Chit Funds play a vital role in meeting the requirements of not only individuals,
but also serve as a useful source of finance to the corporate sector.
43

As cumulative effects of these factors, the Chit organisation has
spread by leaps and bounds not only in Kerala and southern states but also to
other regions of the country 17•. The Chit Fund business in India is estimated
at Rs.20,OOO Crore, taking only the organised sector operating under the Chit
Funds Act, 1982. The unorganised sector is guesstimated to be about 4 times
the sizeof organised sector. Tamil Nadu alone has about 6,000 registered Chit
operators, and Chits have been popular in the other two southern states
Andhra Pradesh and Karnataka too. However, it has not been so in the north,
except in Delhi, Gujarat, Maharastra and Haryana (Balasubramanian 18 2002).
InKerala, the number of working Chits in the formal sector alone is estimated
as 20,445 with an approximate annual turnover of Rs. 1,743 Crore at the end
of the year 2000-01 19. But if one consider the volume of Chit business
operated by foremen with bases outside Kerala, those in the informal sector,
and those conducted by the Co-operatives as MDS or MBS, the actual volume
ofChit business would be many times greater the official data given above.
3.3 DIFFERENT METHODS OF CHITTIES OR KURIES
As already mentioned, the Chit Funds system as it originated was
'Grain Chit' or 'Dhaanya Chit' where the Chit capital was a certain measure
of grain grown locally. The subscribers in such cases personally took the
periodical contributions to the house of the foreman who acted as a passive
honorary president and the prize was disbursed immediately after the drawing
of lot. The 'Grain Chit' or 'Dhaanya Chit' became popular among women.
Even without the knowledge of the men at home, many a housewife joined the
Chits and paid the contributions by sparing a fistful of rice from every day
meal. When the prize accrued, the prize-winner mostly sold the quantity of
rice either to the foreman himself or to others and got money instead and
finally invested it in gold ornaments or household utensils. Later on, a new
class of women promoters emerged and started weekly and monthly Chits,
extending for a short period, and introduced them to the neighbours of their
own rank (Nayar 20 1973).
44

3.3.1 Lot Chits or Simple Chits
Under Lot Chits or Simple Chits, a member is selected from among
the eligible members on the basis of lot. In this method, chance plays a crucial
role anda member who has interest in taking the prize amount at a particular
instalment may not get it. The member, who gets the prize amount in the
initial period of Chit, can earn interest on it for the remaining period of Chit
compared to one who gets it last. Because of these drawbacks, lot Chits
became unpopular and gave way to auction Chits or auction-cum-lot Chits.
As Chits proved profitable. more and more promoters came forward
and the number of Chits multiplied. especially among church congregations 21.
Kuri was introduced among Christians. and presumably. it might have spread
from Cranganoore to other Christian centres. In the central Travancore and
Trichur area. the Chit was initiated originally to help members ofthe church who
were in financial distress. Thus. in the villages around Trichur, several churches
started Kuries. It is the popularity as well as the experience with Pa//iKuries
(Church- managed Kuries) that inspired independent ventures in Chits.
3.3.2 Auction Chits or Business Chits
Under Auction Chits or Business Chits. the capital, less of
foreman' s commission. is kept open for bidding. The members present or by
proxy, offer discount on the amount and the one who offers the highest
discount (or accept the lowest prize amount) is declared the prize-winner. In
this auction system. it becomes possible for needy members to bid for an
amount depending upon the urgency of their need. Auction Chits are highly
beneficial to businessmen who need credit. By joining an Auction Chit of
their choice and paying subscription for one or two months, they can bid for a
fairly big sum. The difference between Chit capital and the bid amount is
distributed as dividend to the members - both prized and non-prized. Under
conditions of ceiling on bid. when more than one member offers the ceiling
rate, there would be a draw among such members to decide the prize-winner.
The Auction Chits are also known as Business Chits.
45

3.3.3 Tender Chits
Under this method, the members write their name and the discount
amount in the prescribed tender form, seal it and hand it over to foreman on the
day of tender. The tenders are opened in the presence ofmembers and the highest
offer of discount is accepted.
3.3.4 Auction-cum- Lot Chits
Many Chit Funds follow the method of mixing the advantages of
Lot Chits and Auction Chits in the same Chit. Such mixed varieties are of two
types. It may be a scheme where auction is held in the first instalment and
draw of lots held in the second instalment and again auction in the third and
draw in the fourth and so on. In the second type, there shall be draw and
auction at every instalment of the Chit, as one ticket (one fraction of the
capital) draws and the remaining tickets auction. The advantage in mixed Chit
is that if a member is unsuccessful at the draw, he can participate in the
bidding and take the prize amount. There are provisions for fractional
membership. Each member is given a number for inclusion in the draw and
auction. If a number representing fractional membership wins or succeeds at
bidding, the prize amount is distributed pro-rata.
The Kerala Chitties Act, 1975 and the Chit Funds Act, 1982 permit a
method of 'draw' i.e., the mode of ascertaining the prize-winner at any
instalment of the Chit by lot or auction or by tender or in such other manners as
may be provided in the' Variola' (Bye-laws). When the prize-winner is to be
determined by auction, and more than one person bids for the same amount, the
prize-winner shall be determined by lot among them. According to the Kerala
Chitties Act, 1975 the amount of discount 22 in a Chit shall not exceed 30 per
cent of the Chit amount. In Kerala, Chits run by the Kerala State Financial
Enterprises Ltd. (KSFE) and other Chit institutions provide proxy facilities.
Chit foremen in the informal sector follow different methods for
selecting the prize-winner in accordance with their business tactics and
46

imagination. Besides monthly Chits. there are daily Chits. weekly Chits. bi
monthly Chits and 'Pooval Kuries' 23 (Quarterly Chits) operating in Kerala,
mobilising substantial volumes of savings from different categories of people.
Even though Chit business in the informal sector is flourishing very well in
Kerala, no reliable data is available on the actual number of Chits and the
volume of business 24.
3.4 UNIQUE FEATURES OF CHIT FUNDS
Chit Funds, as indigenous financial institutions. have an
irreplaceable position even with the advancement of modem financial
institutions like Commercial Banks. Mutual Funds. Leasing. Hire Purchase. etc.
AChit Fund is a financial institution based on mutual trust and confidence. It is
primarily a 'Sahayanidhi' in which people join either to obtain easy credit or to
find an avenue for their savings. The membership is purely voluntary. limited
by number for a fixed period and with limited liability. Unlike other financial
institutions, Chit Funds are operated without any external resources. They
operate with the monthly or periodical subscription of the members. The basic
principle underlying a Chit Fund is accumulating savings and channelising
them for various purposes (Radhakrishan 2S 1975).
A unique feature of savings in a Chit Fund is that there is a sort of
compulsion in effecting savings. While savings in banks and other financial
institutions are made out of residual income. the subscriptions to Chit Funds
are unavoidable expenditure of the subscribers. Further. Chit Funds can do
much in mobilising and channelising savings not only by the rich but also by
those who lead a hand to mouth existence. Once the subscriber joins the Chit
scheme, the periodic contributions are compulsory. as the defaulters will be
deprived of the benefits of the Chit scheme like non-eligibility for bidding and
loss of dividends. This self-imposed compulsion and discipline on the part of
the subscribers to make regular savings cannot be ignored. especially in a
country like India where the ability as well as the willingness of the people to
save is low.
47

One of the important attractions of savings through a Chit Fund is
the facility of immediate realisation of future savings in a lump sum, which
induces manypeople to subscribe to Chit Funds. Thus, Chit Fund is more than
a savings bank to the savers and more than a lender to the borrowers
(Radhakrishnan 26 1975). While depositors in other financial institutions get
back only their total savings at any time, the savers in a Chit Fund can take
the future savings well in advance.
Savers benefit most from Chits. They get attractive deductions
from the actual amount payable as a result of the equitable distribution of the
auction discount among the subscribers. They can also try their luck in
auction along with others. If the Chit is prized in the first few instalments,
they can transfer it and reap good margin as profit or deposit it in the bank or
in the company itself. The interest there-from will be nearly sufficient to pay
the future instalments.
Chit offers many facilities to the borrowers. The prize amount is
equivalent to an unconditional loan and can be used for any purpose including
repayment of old debts, construction of houses, education of children,
marriage, etc. The prize amount can be repaid in easy instalments. Sometimes
a good portion of the future subscription instalment can be generated out of
the investment of the loan amount. No indignity or humiliation is involved in
the borrowing, since it is like an advance, which the subscriber will save over
the life of the Chit 27. Right for dividends even after taking the prize amount
and automatic clearing of loans at the end of the Chit period are the other
benefits enjoyed by the borrowers.
3.4.1 Self Determined Cost
Individual subscribers themselves decide the cost of borrowing in
the Chit scheme. The ceiling of 30 per cent in auction is the maximum limit at
which a subscriber could borrow. In fact what distinguishes a Chit Fund from
48

other financial institutions is that. it is the only financial institution, which
gives freedom to a borrower to fix the cost or rate of interest for credit. The
cost of funds is the difference between total subscriptions paid by a
subscriber. net of dividend and prize amount received. Since net subscription
is the same for all the subscribers of a group. the cost of funds differs from
member to member depending on the prize amount and the time of receipt.
This is a unique feature of the scheme, where all the members pay different
interest rates for borrowings. depending on the instalment of bids and so
receive different returns for savings. The borrowers and lenders meet to fix
the rate of interest and since there is more than one borrower competing for
the same amount, a competitive rate of interest is arrived at. Of course, this
competition is limited to the members and with a maximum ceiling.
3.4.2. Familiarity
People in the middle and low-income groups in rural and urban
areas of South India are somewhat familiar with the system and operation of
Chit Funds. even-though many may not know much about the way the banks
and other financial institutions function. It connects the borrowing class
directly with the lending class enabling them to save themselves from the
exploitative nature of moneylenders.
Besides. there are several thousands of unregistered Chit groups
with different durations and Chit amounts among friends, colleagues in
offices, residential colonies. self employed persons. traders, etc. These
'Community Chits' 28 have less formality and so have spread to other parts of
India (Radhakrishnan 1997).
3.4.3 Competitiveness and Diversity
The system of Chit Funds offers various schemes to suit the needs
ofdifferent income groups. In Kerala, one can find Chits of various types and
denominations both in the rural and urban areas. Different techniques have
49

been used by the Chit foremen to attract Chit subscribers by the method of
payment of prize money, discount allowed, gifts offered, etc.
3.4.4 Transparency and Accessibility
The pivot of the Chit Fund system is the auction to decide the
prized subscribers. Auction is conducted in the presence of the members or
their proxy, by open bidding. This provides an opportunity to each member to
bid for the Chit amount depending on the urgency of his needs within the
prescribed ceiling. Many join Chits because of the facility it provides to
borrow for their varied needs, without any queries on the end use of funds. In
fact this flexibility and simplicity are typical of all types of ROSCAs 29.
3.4.5 Similarity with Recurring Deposits
The monthly Chit subscription is in the nature of recurring deposits
ofbanks or post offices, though the only similarity is the recurring nature. In
a Chit Fund, the monthly instalment may not be uniform as in the bank. The
monthly instalments vary, because subscribers are required to pay the amount
net of dividend or discount that varies.
3.4.6 Chit Funds And The Principle of Option
Chit is an option instrument, which vests in the subscriber the right
to borrow against future Chit instalments to be paid by him. The option contract
gives the Chit holder the right to bid or to give up. He can exercise either put
option or eaU-option at his will. Put-option is exercised when the Chit holder
sells his right to auction the Chit amount at a discount to other subscribers. The
exercise of call-option enables the Chit holder to take the prize amount at a
discount, which he has to pay back through future instalments. It is borrowed
money on the unpaid value of the Chit. It has the characters of debt, on which
the interest has already been paid in advance in the form of the discount
50

allowed. Chits are convertible instruments with an option for a subscriber to
convert his savings instrument to a debt instrument (Varma 30 1997).
The interest rate (discount) would differ from one Chit holder to
another depending upon the intensity of demand for prize money. A Chit holder
in dire need of money would take away the Chit at a heavy discount, subject to
the ceiling fixed by the Acts, which is shared equally by all the Chit holders as
dividend. A Chit holder can exercise option by auction or lot or both.
To summarise, Chits or Kuries have the following distinctive
features like the element of mutual help, compulsion in effecting savings,
facilitate future savings in a lump sum, option to fix the cost or rate of interest
on credit, right to share discount, familiarity, simplicity, diversity and
convertibility with an option for a subscriber to convert his savings instrument
to a debt instrument.
3.5 ILLUSTRATION OF AN AUCTION CUM LOT CHIT
Table 3.1 shows the actual figures of a terminated Chit conducted
by KSFE. In this illustration, there are 50 members including the foreman who
agree to pay Rs.I000 each per month for 50 instalments. That means the
monthly Chit amount (sala) will be Rs.50,OOO. The foreman has been entitled
to 5 per cent of the Chit amount (Rs.2,500) as fixed commission at every
instalment. He is also entitled to the Chit amount, (Rs.50,OOO) at the very first
instalment, without auction and discount.
51

Table 3.1
Illustration of an Auction cum Lot Chit
Sala = Rs.50,000 (1000 x 50) Duration: 50 Months
No. of Months Subscription Total Loss onInstal. No. Prize Amount Discountremammg less discount Rs.6186 bidding
1 2 3 4 5 61 49 50000 1000 - -2 48 35000 750 250 150003 47 35000 750 250 150004 46 35000 750 250 150005 45 35000 750 250 150006 44 35000 750 250 150007 43 35000 750 250 150008 42 35000 750 250 150009 41 35000 750 250 1500010 40 35000 750 250 1500011 39 35000 750 250 1500012 38 35000 750 250 1500013 37 35000 750 250 1500014 36 35000 750 250 1500015 35 35000 750 250 1500016 34 35000 750 250 1500017 33 35000 750 250 1500018 32 35000 750 250 1500019 31 35000 750 250 1500020 30 35000 750 250 1500021 29 35000 750 250 1500022 28 35000 750 250 1500023 27 39850 847 153 1015024 26 41600 882 1I8 840025 25 39500 840 160 1050026 24 42000 890 1I0 8000
I 27 23 41500 880 120 8500I
28 22 45500 960 40 4500! 29 21 45900 968 32 4100I 30 20 45850 967 33 4150I 31 19 43900 928 72 6100
52

No. of Months SubscriptionTotal Loss on
Instal. No. Prize Amount Discountremaining less discount Rs.6186
bidding
1 2 3 4 5 6
32 18 46000 970 30 4000
33 17 46000 970 30 4000
34 16 46200 974 24 3800
35 15 46800 986 14 3200
36 14 47500 1000 - 2500
37 13 47500 1000 - 2500
38 12 47500 1000 - 2500
39 11 47500 1000 - 2500
40 10 47500 1000 - 2500
41 9 47500 1000 - 2500
42 8 47500 1000 - 2500
43 7 47500 1000 - 2500
44 6 47500 1000 - 2500
45 5 47500 1000 - 2500
46 4 47500 1000 - 2500
47 3 47500 1000 - 2500
48 2 47500 1000 - 2500
49 1 47500 1000 - 2500
50 0 47500 1000 - 2500
6186Source: Terminated Chit conducted by K.S.F.E. Chitty No. 5/97,Date of commencement 22-3 1997, Date of Termination 19-4-2001.
The maximum discount permissible has been fixed at 30 per cent.
which includes 5 per cent as foreman' s commission. If there are more bidders
atthe maximum discount rate. the prize-winner will be decided by draw oflot.
If not, the prize-winner will be decided by auction. The discount will be
distributed equally among all members as dividend. So. the members need to
remit the monthly instalment net of eligible dividend.
3.6 GROWTH TRENDS OF CHIT BUSINESS
The Chit Fund business' has achieved significant growth in terms of
its volume over the years. This section presents the growth of Chit business in
53

the formal (Registered) sector of the State, which includes data on the growth
of Chit business, both before and after the formation of Kerala State. It also
analyses the decennial growth in the number of Chits registered and their
capital (sala) for the period 1960-2001. The trend analysis of the number of
Chits registered, their capital as well as the share of various Chit institutions
in the total Chit business is also presented.
3.6.1 Growth of Chit Funds before the Formation of Kerala State
The Travancore Banking Enquiry Committee, 31 1930 which made
one of the earliest attempts to furnish consolidated data regarding the number
and capital of Chits working in Travancore, gave the total number of Chits
registered in the state during 1918-1922 as 2,982. The total capital of these
Chits amounted to Rs.75 Lakhs. At the end of 1928-29, the committee found
that there were 9,931 live Chits involving a total capital ofRs.236 Lakhs, the
average number of Chits registered annually in the 1920s being 1,300. Besides
the registered Chits, there were innumerable small Chits with capital below
Rs.IOO, which did not require registration. There were also Chits. which
distributed vessels. ornaments. furniture. etc. as prize, in lieu of money.
The Madras Provincial Banking Enquiry Committee Report stated
that, at the time of enquiry (1929-30) there were 387 Chits in the five districts
ofPollachi,Dharmapuram, Coimbatore, Gobichettipalayam and Thirupur. But
the district of Thinnevelli, situated very close to the state of Travancore,
surpassed all the other districts in the Presidency with an impressive number
of4,159 Chits. The report however did not include the number of small Chits
that flourished among the poor people.
The Chit Fund Enquiry conducted in connection with the All India
Rural Credit Survey (1958) showed the number and turnover of Chits
registered in the erstwhile State of Travancore-Cochin during 1930-31 to
1949·50. Table 3.2 given below shows the details.
54

Table 3.2
Growth of Chits in the State of Travancore -Cochin 1930-31 to 1949-50(Rs. Lakhs)
Number of Total capital of•Approximate AnnualWorking Chitties the Chitties
YearFunctioning
Turnover ofWorking Chits
No. Growth Rate Capital Growth Rate
1930-31 10289 - 258 3096 -1931-32 9254 -10.06 262 3144 1.55
1932-33 8418 -9.03 265 3180 1.15
1933-34 7667 -8.92 146 1752 -44.91
1934-35 6944 -9.43 125 1500 ~14.38
1935-36 6228 -10.31 86 1032 -31.20
1936-37 5684 -8.73 82 984 -4.65
1937-38 5447 -4.17 78.6 943.2 -4.15
1938-39 1813 -66.72 56.25 675 -28.44
1939-40 1449 -20.08 28.43 341.16 -49.46
1940-41 1122 -22.57 22.16 265.92 -22.05
1941-42 1048 -6.59 25.19 302.28 13.67
1942-43 1261 20.32 20.3 243.6 -19.41
1943-44 1708 35.45 27.71 332.52 36.50
1944-45 2379 39.29 38.95 467.4 40.56
1945-46 2775 16.65 47.25 567 21.31
1946-47 NA NA 82.53 990.36 74.67
1947-48 NA NA 86.33 1035.96 4.60
1948-49 3001 NA 64.44 773.28 -25.36
1949-50 2505 -16.53 NA NA NA.
• Approximate annual turnover equals total capital of working Chits at the end oftheyearmultiplied by 12.
Source: All India Rural CreditSurvey Report. 1958, p.118.
Table 3.2 shows that the number of Chitties functioning and its
turnover declined during the period 1930-31 to 1941-42. The survey report
showed that the reasons for the decline were the general economic recession
that prevailed in the State during that period and the effects of the World War
H. The entry of other financial institutions such as the co-operative banks, the
commercial banks, the post offices with their savings bank and the change in
the occupational pattern of the people were the other reasons for the decline
55

noticed during the period 32. But after the war, the growth rate of the number
ofChits functioning and its turnover showed an upward trend from 1942-43.
All India Rural Credit Survey Report, 1958 showed that by 1948-49, the
number of registered Chits functioning in the Travancore-Cochin State rose to
3001 and for the next 3 years the yearly registrations were of the order of 528,
1,465 and 1,742 respectively.
Thus, it is evident that a well-established Chit Funds system
existed in the State of Travancore-Cochin at the time of formation of the State
ofKerala in 1956.
3.6.2 Growth of Chit Funds after the Formation of Kerala State
After the formation of the Kerala state, the number of registered
Chits showed more or less a steady growth. The number of working Chits
increased from 3,888 at the end of the year 1957-58 to 4,101 in 1958-59.
However, the number of working Chits showed a decline to 1810 at the end of
the year 1959-60. The approximate annual turnover of working Chits in the
State for the period 1957-58, 1958-59, 1959-60 were Rs.2,056 Lakhs,
Rs.l,524 Lakhs, and Rs.l ,512 Lakhs respectively 33.
The growth of Chit business after 1960 has been analysed decade
wise from 1960-61 to 1999-2000. Decennial growth rates of number of Chits
registered and their annual turnover has also been presented in Table 3.3
given below.
56

Table 3.3
Growth of Chits in Kerala 1960-61 - 1969-70 (RI. Laths)
Number of working Chits Total capital Approximate annual
Year at the end of the year of Turnover of working Chits
No. Growth Rateworking
Capital Growth RateChits1960-61 2523 - 126 1512 -1961-62 3235 28.22 190 2280 50.791962-63 4182 29.27 184 2208 -3.161963-64 4098 -2.01 307 3684 66.851964-65 4203 2.56 366 4JJ2 19.221965-66 4498 7.02 472 5664 28.961966-67 4632 2.98 475 5700 0.641967-68 5257 13.49 531 6372 11.791968-69 6062 15.31 788 9456 48.401969-70 6181 1.96 528 6336 -32.99Average Annual
10.98 - - 21.17Growth RateSource: Nayar, C. P. S.Chit Finance, p. 165.
Table 3.3 gives the growth of Chits during the period 1960-61 to
1969-70. During the period, the Average Annual Growth Rates of the number
ofChits registered was 10.98 per cent and that of annual turnover was higher at
21.17 per cent. However Figure 3.1 depicts that the growth rate of the number
ofChits registered and the approximate annual turnover of Chits has shown a
fluctuating trend from 1960-61 to 1969-70.
Figure 3.1Growth Rate for 1960-61 to 1969-70
80
60
i 40
J:+---.-\rJ-,~-=-",~::::~~~.--~~-20
Year
-Number ofWorIOOg Chits -AmuaI Trmover of Chits
57

The growth of Chit Fund business in the state from 1970-71 to 1979
80 ispresented in Table 3.4 and Figure 3.2. They show an increasing trend in the
growth rate of the number of Chits in the first part of the period. But from 1975
onwards a declining trend is seen, except for the year 1978-79. The growth rate
ofthe annual turnover for the above period shows a decreasing trend with minor
fluctuations. This decline could be attributed to the effect ofthe implementation
ofthe KeralaChitties Act, 1975.
Table 3.4
Growth of Chits iD Kerala 197~71 to 1979-8O(Rs. Lakhs)
Working Chits atTotal
ApproximateYear the end of the Year annual turnover
No Growth ratecapital
Capital Growth rate1970-71 6371 653 78361971-72 6606 3.69 1106 13272 69.371972-73 6841 3.56 1559 18708 40.961973-74 7235 5.76 1398 16776 -10.331974-75 7784 7.59 1479 17748 5.791975-76 8706 11.84 1509 18117 2.081976-77 7818 -10.20 1265 15174 -16.241977-78 6930 -11.36 1020 12240 -19.341978-79 10032 44.76 967 11604 -5.201979-80 6747 -32.75 1453 17436 50.26
Annual Average 2.54 13.04Source: Administration Report, Registration Department, Government ofKerala, Trivandrum.
Figure 3.2
Growth Rate for 1970-71 to 1979-80
80
60
I 40
I~-l---:==;=~X::::;:;;~~~--,---I-~A---,-20
-40
Year
I-Number of Working Chits -Annual Trunover of Chits I
58

During the period 1980-81 to 1989-90, there was an average annual
growth rate of 9.89 per cent in the number of Chitties and 11 per cent growth in
annual turnover. Table 3.5 gives the details. Figure 3.3 shows that though both
the variables reflect a fluctuating trend for the period, there was a high degree
ofcorrelation between them.
Table 3.5
Source: Administration Report, Registration Dept. Government of Kerala
Growth of Chits in Kerala from 1980-81 to 1989-9O(Rs. Lakhs)Working Chits at
Total capital ofApproximate
Year the end of the year annual turnoverNo Growth rate
working ChitsCapital Growth rate
1980-81 7081 9.89 1782 21384
1981-82 7781 14.09 926 11112 -48.04
1982-83 8877 7.90 1161 13932 25.38
1983-84 9578 12.83 1742 20904 50.04
1984-85 10807 18.03 1638 19656 -5.97
1985-86 12756 15.28 2253 27030 37.52
1986-87 14705 5.69 2867 34404 27.28
1987-88 15541 1.28 3065 36780 6.91
1988-89 15740 -2.94 3234 38808 5.511989-90 15278 9.12 3247 38964 0.40
Annual Average 9.89 11.00.. .
Figure 3.3
Growth Rate for 1980-81 to 1989-90
8 9
60
40
S20
t 0 +-.l-'-=:.-\Jt.--,--~~~:----.
e -20C)
-40
-60
Year
-Nuimber of Working Chits
-Annual Turnover of Chits
59

Table 3.6 and Figure 3.4 show fluctuations in the growth rates of
the number of Chits registered and in the annual turnover of working Chits in
the State from1990-91 to 1999-2000. There was a significant decline in the
rate of growth in number of Chits, at only 4.28 per cent, though the annual
turnover showed an impressive 16.63 per cent growth.
Table 3.6
Growth of Chits in Kerala From 1990-91 tol999-00 (Ra.. Lakhs)
Working Chits atTotal capital of
ApproximateYear the end of the year annual Turnover
No Growth rateworking Chits
Capital Growth rate1990-91 14816 3260 391201991-92 14355 -3.11 3272 39264 0.371992-93 18583 29.45 4328 51936 32.271993-94 20660 11.18 4276 51312 -1.201994-95 22489 8.85 5012 60144 17.211995-96 21136 -6.02 6377 76524 27.231996-97 20859 -1.31 5783 69396 -9.311997-98 21744 4.24 7287 87444 26.011998-99 22770 4.72 10706 128472 46.921999-00 20617 -9.46 11799 141588 10.21Annual Average 4.28 16.63
Source: Registration Dept. 1.G of Registration, Tnvandrum.
Figure 3.4
Growth Rate for 1990-91 to 1999-2000
50
40
-10
-20
Year
I-Number of Wortting Chits -Annual Turnoverof Chits I
60

Table 3.7 in summary reveals that the decade (1960-70) witnessed
the highest growth rates in the number of Chits registered as well as in annual
turnover, when compared with the succeeding decades.
Table 3.7
Decennial Growth Rates of Number and Annual Turnover of Chits
No. Decade Growth Rate of No Growth Rate ofof Reaistered Chits Annual Turnover
I 1960-70 10.98 21.17
2 1970-80 2.60 14.10
3 1980-90 8.70 12.17
4 1990-2000 3.55 15.01
Pooled Data 6.42 15.49
Computed Data.
The decline in growth rates of both the variables for the succeeding
decades has been mainly due to the rigidity of the Kerala Chitties Act and the
resultant outflow of foremen to other states for conducting Chits. The starting
of 'Chit like schemes' by the Co-operatives by avoiding official registration
has been another reason for the decline in growth rates. The actual growth rate
would have been much higher if one takes into account the volume of Chits in
the informal sector.
According to the All Kerala Chitty Foremen Association. 34 as at
the beginning of year 2002, there are about 10.000 Chit companies operating
inthe State with bases outside Kerala especially from Faridabad and Jammu.
"the employment opportunities generated by these Companies is estimated to
be over 30,000. The duration of Chits ranges from 5 to 16 years. In Trichur
district alone, nearly 3,000 such Chit companies exist. Decennial growth rates
ofthe number and annual turnover of Chits has been shown in Figure.3.5.
61

Figure 3.5
Decennial Growth Rates of Number and Turnover of Chits
25
204D...ca 15a::.&:
i 10eC)
5
0
0 1 2 3 4 5
Decade
-+-Numberof Working Chits -Annual Turnover of Chits
3.6.3 Trend Analysis of the Growth of Chits
The trend analysis of the number of Chits registered and annual
turnover showssignificant increasing trend for the decades 1960-70 and 1980
90. But the decade 1970-80 shows only slight increasing trend for the above
two variables. A distinctly increasing or positive trend has been noticed for
Chit turnover for the decade 1990-2000. whereas only a slightly positive or
increasing trend was seen in the case of number of Chits as shown in Figures
3.6 and 3.7.
62

Figures 3.6
Trend Analysis of the Number of Chits Registered
25000
20000
*= 15000.c(J
'00 10000z
• • • • ..t.: • • • •
• • ...5000 •• • •.. • •
00 2 4 6 8 10 12
Ve.
1-+-1960-70 ---.-1970-80 1980-90 ---.-1990-2000 IFigure 3.7
Trend Analysis of Cbit Turnover
140000
120000
100000~
I 80000
E 60000~
40000
20000ii • • • • • • •""""" --c
0
0 2 4 6 8 10 12
v....
1-+-1960-70 -1970-80 1980-90 -.-1990-2000 IThe growth rate of the number of Chits registered has been less
than the growth rate of the turnover of the Chits from 1960-70 to 1990-2000.
But the impressive growth rate of annual turnover during 1990-2000 when
compared to the growth rate of number of Chits registered is the effect of the
63

large volume of Chit business started by KSFE from 1990 onwards with its
special privilege to start big sala Chitties.
3.7 INSTITUTION-WISE ANALYSIS OF CHIT BUSINESS
Though the number of Chits registered by Co-operatives is the
largest (44.2 per cent), the share of KSFE in terms of the total volume of Chit
business in the State is 77 per cent and that of the Co-operatives and Private
Chit funds are 17 per cent and 6 per cent respectively.
Table 3.8Number and Sala of Registered Chits
as on March 2000 (Rs, Lakhs) Institution-wise
Name of the Number of Share of each CapitalShare of each
to total to totalInstitution Chits /Kuries
Percentagesala Percentage
1. KSFE 7446 37.5 95249 77
2. CO- OPERATIVES 8793 44.2 21101 17
3. PRIVATE CHITS 3633 18.3 7701 6
Total 19872 100 124051 100
Source: - Government of Kerala, Legislative Assembly InterpretationRegistration Dept. I.O of Registration, Trivandrum.
The share of Co-operatives and private Chits appear to be
insignificant mainly due to the fact that a considerable volume of business of
the above two groups is conducted without formal registration. While Co
operatives are conducting Chits by obtaining permission from the Joint
Registrar of Co-operatives with less formality, private Chit Funds operate their
Chit business in Kerala with bases outside the State to escape from the rigid
rules of the Kerala Chitties Act, and so there is no authentic data on these.
3.8 REGION-WISE ANALYSIS OF CHIT BUSINESS.
The State of Kerala comprises of three regions namely southern,
central and northern on the basis of the erstwhile princely States of
Travancore, Cochin and Malabar. Tables 3.9 and 3.10 reveal that Southern
Kerala forms the beehive of Chit activity in Kerala, with the largest number of
Chits registered as well as the highest volume of Chits.
64

0\
V\
Tab
le3
.9
Realo
nw
be
An
.ly
sls
of
the
Gro
wth
of
Ch
its
InK
er.l
.fr
om
19
81
-81
to1
99
9-0
0(F
ln.l
)
S.K
C.K
N.K
To
tal
Yea
rN
o.S
ala
(Lak
hs)
No
.S
ala
(Lak
hs)
No.
Sal
a(L
akhs
)N
o.
Sal
a(L
akh
s)
%%
%%
%%
%%
1981
-82
3745
48.1
344
147
.62
3146
40.4
339
943
.09
890
11.4
486
9.29
7781
100
926
100
1982
-83
4098
46.1
658
850
.65
3736
42.0
944
037
.90
1043
11.7
513
311
,46
8877
100
1161
100
1983
-84
4539
27.2
578
137
,42
3989
23.9
580
038
.33
1050
6.30
161
7.71
1665
810
020
8710
0
1984
-85
5447
50.2
268
441
.76
4272
39.3
877
947
.56
1128
10,4
017
510
.68
1084
710
016
3810
0
1985
-86
5447
50.2
268
441
.76
4272
39.3
877
947
.56
1128
10,4
017
510
.68
1084
710
016
3810
0
1986
-87
6616
44.9
910
6337
.08
6377
43.3
710
8037
.67
1712
11.6
472
425
.25
1470
510
028
6710
0
1987
-88
7894
50.7
912
3740
.36
5891
37.9
412
1639
.67
1752
11.2
761
219
.97
1554
310
030
6510
0
1988
-89
7447
47.3
113
3941
.40
6331
40.2
212
5138
.68
1962
12,4
764
419
.91
1574
010
032
3410
0
1989
-90
7447
47.3
113
3941
.40
6331
40.2
212
5138
.68
1962
12,4
764
419
.91
1574
010
032
3410
0
1990
-91
7447
47.3
113
3941
.40
6331
40.2
212
5138
.68
1962
12.4
764
419
.91
1574
010
032
3410
0
1991
-92
5803
40.4
212
7538
.97
6595
45.9
415
1946
.42
1957
13.6
347
814
.61
1435
510
032
7210
0
1992
-93
9309
47.5
421
5249
.72
7035
35.9
216
6438
.45
2239
11.4
351
211
.83
1958
310
043
2810
0
1993
-94
1004
748
.63
2410
56.3
675
8536
.71
1080
25.2
630
2814
.66
786
18.3
820
660
100
4276
100
1994
-95
1129
750
.23
2834
56.5
978
8035
.04
1204
24.0
433
1214
.73
970
19.3
722
489
100
5008
100
1995
-96
1098
851
.99
3143
49.2
975
6235
.78
2435
38.1
825
8612
.24
799
12.5
321
136
100
6377
100
1996
-97
1076
551
.61
2636
45.5
876
5736
.71
2381
41.1
724
3711
.68
766
13.2
520
859
100
5783
100
1997
-98
1129
251
.93
3171
43.5
277
4535
.62
3081
42.2
827
0712
.45
1035
14.2
021
744
100
7287
100
1998
-99
1239
854
.45
4772
44.5
779
9935
.13
3774
35.2
523
7310
.42
2160
20.1
822
770
100
1070
610
0
1999
-00
1021
649
.55
5807
49.2
277
9737
.82
4140
35.0
926
0412
.63
1852
15.7
020
617
100
1179
910
0
Sou
rce:
Com
pute
dD
ata
from
Reg
istr
atio
nD
ept;
I.G
ofR
egis
trat
ion,
Tri
vand
rwn.

Table 3.10Number of Chits and Sala in Kerala 1999-00 Region-wise Analysis
Source: - GovernmentofKerala, Legislative Assembly Interpretation. RegistratIonDepartment. I.G ofRegistration, Trivandrurn.
No. RegionNumber of Percentage
Capital Sala PercentageChits (Rs. Lakhs)
1 Southern Kerala 10216 49.55 5807 49.212 Central Kerala 7797 37.82 4140 35.093 Northern Kerala 2604 12.63 1852 15.70
Total 20617 100 11799 100.
The dominance of Chit business in southern Kerala can be attributed to
the presence of large number of KSFE branches (42%) and also due to the
strong presence of the salaried class in that region (See also Table 3.11).
3.9 DISTRICT-WISE DATA ON CHITS
The district-wise data on Chits show clear dominance of Trivandrum
with respect to the number of Chits registered and also for Chit capital. The other
districts with high volume ofChit business are Quilon, Kottayam and Ernakulam.
Table 3.11
Number of Working Chits and Chit capital in Kerala 2000-2001
No. of working Total Capital at ApproximateSI. No. District Chits at the end the end of the annual turnover
of the vear vear (Rs. Lakhs) (Rs. Lakhs)1 Trivandrum 3805 3991 478922 Quilon 3762 2088 250563 Pathanamthitta 935 982 117844 Aleppy 1673 955 114605 Kottayam 3408 1727 207246 Iddikki 435 llO 1320
I 7 Ernakulam 2050 1074 128888 Trichur 954 942 113049 Palghat 583 544 652810 Malappuram 462 387 464411 Calicut 1046 803 9636
I 12 Cannanore 1072 588 7056! 13 Waynad 163 248 2976I 14 Kasaragod 97 84 1008! Total 20445 14523 174276Source: - Registration Department, LG of Registration, Trivandrum.
66

3.10 CHIT FUNDS VIS-A-VIS BANK DEPOSITS
The Report of the Travancore-Cochin Banking Enquiry
Commission 35 (1956) had pointed out the close association of Chit Funds and
banks in the State from ancient times. This section presents a comparison of
the annual turnover of Chits in the State vis-a- vis bank deposits.
Table 3.12 shows that Chit turnover as percentage of bank deposits,
which was impressive in the early 1970's have shown a decline thereafter. The
decline has been due to the massive expansion of bank branches and also
because Chit turnover includes only registered Chits. However, if we exclude
the NRI deposits from the total deposits of the banks, then Chit as percentage of
bank deposit seems higher and this is shown in Table 3.13.
Table 3.12Growth in Total Deposits of Banks in Kerala
vis-a-vis Chit Subscription (Rs, Lakhs)
Annual ChittyGrowth
Total bank GrowthChit as
Year Turnover . Rate deposits RatePercentage of
(Rs. Lakhs) (Rs. Lakhs) Bank deposit11972-73 18708 28400 65.87
1973-74 16776 -10.33 33900 19.37 49.49
i1974-75 17748 5.79 40700 20.06 43.61
:1975-76 18117 2.08 48500 19.16 37.35
i1976-77 15174 -16.24 67000 38.14 22.65
:1977-78 12240 -19.34 88900 32.69 13.77
\1978-79 11604 -5.20 111800 25.76 10.38! 1979-80 17436 50.26 128600 15.03 13.56
i1980-81 21384 22.64 156700 21.85 13.65i 1981-82 11112 -48.04 181500 15.83 6.12:1982-83 13932 25.38 214900 18.40 6.48! 1983-84 20904 50.04 263100 22.43 7.95! 1984-85 19656 -5.97 347900 32.23 5.65:1985·86 27030 37.52 360000 3.48 7.5111986-87 34404 27.28 415400 15.39 8.281987-88 36780 6.91 481100 15.82 7.64
, 1988-89 38808 5.51 566700 17.79 6.851989·90 38964 0.40 662000 16.82 5.891990-91 39120 0.40 785800 18.70 4.98
67

Annual ChittyGrowth
Total bank GrowthChit as
Year TurnoverRate
deposits RatePercentage of
(Rs. Lakhs) (Rs. Lakhs) Bank deposit1991-92 39264 0.37 967100 23.07 4.061992-93 51936 32.27 1211200 25.24 4.29
1993-94 51312 -1.20 1494100 23.36 3.431994-95 60144 17.21 1745800 16.85 3.45
1995-96 76524 27.23 2017100 15.54 3.791996-97 69396 -9.31 2335400 15.78 2.971997-98 87444 26.01 2755200 17.98 3.171998-99 128472 46.92 3153200 14.45 4.07
1999-00 141588 10.21 3861900 22.48 3.67Annual Average 10.33 20.14
Source: (1) Economic Review, Various years, Government of Kerala State PlanningBoard. Trivandrwn.
(2) Administration Report, Various Years, Registration Dept GovemmentofKerala.
A comparison of the annual turnover of Chits with domestic
deposits of banks 36 has also been attempted here. Table 3.13 below shows
that the subscription of Chits in Kerala as percentage of domestic deposits of
banks in the State formed only 6.69 per cent in the year 2000. The percentage
would have been higher ifone included the volume of Chits operating in the
informal sector and also those Chits with bases outside Kerala. Table 3.13
reveals that Chit subscription, as percentage of domestic deposits of banks
remains more or less stable between 5 to 7 per cent. But the average annual
growth rate of Chit turnover (16.64) in comparison to the average annual
growth rate of domestic deposits of banks (16.61) seems impressive.
68

Table 3.13
Growth in Domestic Deposits of Banks in Kerala
vis-A-vis Chit Subscription (Rs, Crore), 1 2 3 4 5 6
Amount ofAnnual Chit Subscription
Domestic Growth GrowthYear Deposits rate in
Turnoverrate in
as Percentage ofof Chitties Deposits
with Percentagein the State
Percentageof Banks
Banks:1991 5554 391.12 7.04
;1992 6632 19.41 392.64 0.39 5.92
~1993 7613 14.79 519.36 32.27 6.82
:1994 8926 17.25 513.12 -1.20 5.75
:1995 10572 18.44 601.44 17.21 5.69
1996 12068 14.15 765.24 27.23 6.34
,1997 13176 9.18 693.96 -9.31 5.27
:1998 14817 12.45 874.44 26.01 5.90i1999 18338 23.76 1284.72 46.92 7.01
2000 21172 15.45 1415.88 10.21 6.69
Annual Average 16.10 16~64
Source: 1Economic Review-2000 Government ofKerala, State Planning Board,Trivandrum.
2. Registration Department, I.G ofRegistration, Trivandrum.
3.11 CHIT FUNDS: LEGISLATIVE REGULATIONS
With a view to regulate the working of Chit Funds and providing
safety to all parties concerned, comprehensive Acts have been introduced in
Kerala from time to time. The purpose of legislation is not merely to protect
the subscribers but to safeguard the interests of the foremen too. The Chitties
Regulations III of 1094 (1918) was enacted for the first time in India in the
erstwhile princely State of Travancore, for regulating the working of Chitties.
Before the enactment of the Kerala Chitties Act, 1975, the following Statutes
regulated the Chit Fund business in the state:
• The Cochin Kuries Act VII of 1107 in the Cochin area (193 1-32)
• The Cochin Starting of Kuries (Restriction) Act XII of I 120 (1945)
• The Travancore Chitties Act, 1120 (1945).
69

The above Acts were very specific as to the rights, duties and
liabilities of the foreman to the subscribers and the obligations and privileges of
the prized and non-prized subscribers. They also prescribe punishment and fine
for contravening its provisions. Many of these provisions formed the basis of
the later Chit Acts in the country particularly the Kerala Chitties Act, 1975.
The above Acts were not applicable to the Malabar region and so
Chit agreements were drawn under the Indian Contract Act. The failure of some
Chit Funds in certain places of the region brought discredit to the system.
Hence there was a need for a comprehensive legislation for controlling the
working of Chit Funds. This necessitated the enactment of a uniform law
relating to Chits, applicable to the entire state. Accordingly the Kerala Chitties
Act, 1975 (an Act to define, amend and consolidate the law relating to Chitties
in the State of Kerala) came into force from 25th August 1975.
3.11.1 Kerala Chitties Act, 1975
The Kerala Chitties Act. 1975 was introduced to bring about a
uniform law relating to Chits. This Act incorporated many novel changes to
better safeguard the interests of the participants. According to the Act, no
Chitty shall be started and conducted unless the previous sanction of the
government or of such officer empowered by the government is obtained and
only after the Chitty being registered in accordance with the provisions of the
Act. The Kerala Chitties Act limits the total Chitty amount in the case of any
one Chitty conducted by a foreman to Rs.25,000 and further limits the right of
a foreman to conduct Chitties at a time of which the aggregate amount shall
not exceed 50 per cent of the net asset of the foreman. The Kerala Chitties
Amendment Act, 2002 has removed the maximum limit of Chit amount in the
case of a Chitty conducted by a foreman.
Sub-section 2 of Part 11, insists on the distribution of' Veethapalisa'
(share of discount) among both prized and non-prized subscribers. Discount is
limited to 30 per cent of the Chit amount. The Act insists that every foreman
shall, before the first draw of the Chit, execute a bond in favour of the other
70

subscribers. The foreman should deposit in an approved bank, an amount equal
to the Chit amount and transfer the amount so deposited in favour of the
Registrar as security. The Registrar shall after the termination of a Chit and
after satisfying himself that the claims of all the subscribers have been fully
satisfied, order the release of the security furnished.
The foreman shall be entitled to obtain his prize at the first
instalment as specified in the' Variola' without discount. Further he is entitled
to a commission not exceeding 5 per cent of the Chit amount. The Act
prevents all private foremen from conducting big Chits and includes
provisions for protecting the interests of the subscribers. The rights and duties
ofthe foreman as well as the subscribers, both prized and non-prized, are also
specified in the Act. The provisions of the Act specifically explain how
meeting of the general body of the subscribers will be held, the conditions for
the termination of Chitties, the inspection of documents by the Registrar or
inspecting officer, the winding up of Chitties, etc.
But in the wider context of examining in depth the activities of the
non-banking financial activities, including institutions conducting Chit Funds
or Kuries, the Banking Commission 37 (1972) had recommended inter alia,
that it is essential to have a uniform Chit Fund legislation applicable to the
whole country. The study group on NBCs 38 (1974) was unanimously of the
view that Central Chit Fund legislation would ensure uniformity in the
provisions applicable to Chit Fund institutions throughout the country. A
uniform Chit Fund legislation would also prevent such institutions from
taking advantage either of the absence of any law governing Chit Funds in any
State or exploit the benefit of any lacuna or relaxation in any State by
extending their activities in such States. Accordingly the Chit Funds Act,
1982 • an Act to provide for the regulation of Chit Funds and for matters
connected therewith - came into force, and is applicable to the whole of India.
3.11.2 The Chit Funds Act, 1982
The Chit Funds Act, 1982 39 is the Central Act applicable to the
whole of India, introduced to ensure uniformity in Chit business. It prevents
71

the Chit Fund institutions from taking advantages either in the absence of any
laws governing business in any state or exploiting the shortcomings in the
administration of the Act in certain states. A Central Act is preferable to
various State Acts because of the following reasons:
The basic characteristics of Chit Funds in the country are similar
and a uniform legislation can treat them all alike. Many Chit Funds have
branches in more than one state and independent Act in each state will, not
only create difficulties, but also pave the way for lopsided development of
Chits in various states. The mushroom growth of Chit Funds in many states,
where there are no legislative controls and also the failure of improperly
managed Chit Funds can be attributed to the absence of comprehensive
legislation. Absence of uniform legislation may result in the growth of Chit
Funds on unhealthy lines 40.
The Central Act gave full freedom to the state governments to
adopt the same in their respective states as and when they desire. However
many states including Kerala have not yet adopted the Central Chit Funds Act.
The Act, 1982 has fixed the limit of aggregate business that can be done by
the entities, as Rs.25,OOO in the case of an individual foreman, as Rs. One
Lakh for firms with four or more partners, and for a company or society, ten
times the net owned funds.
3.11.3 The Chit Funds Amendment Act, 2001
The Chit Funds (Amendment) Act, 2001 41 sought to amend the
original Act of 1982, following the Supreme Court judgment of 1993. It
enhanced the ceiling on discount to be foregone by a prized subscriber from
30 per cent to 40 per cent. The total Chit sala of an individual foreman has
been enhanced from Rs.25,000 to Rs. One Lakh. It also increased the ceiling
of aggregate Chit amount of the firm or other associations from RS.1 Lakh to
Rs.6 Lakhs. Besides, Section 20 of the 1982 Act has been amended to provide
the deposit in the name of the Registrar as an amount equal to 50 per cent of
72

the Chit amount in cash, in an approved bank and the balance 50 per cent of
the Chit amount in the form of bank guarantee.
3.11.4 The Kerala Chitties Amendment Act, 2002
As part of the reform measures in Chit business, Government of
Kerala announced certain amendments 42 in the Kerala Chitties Act, 1975.
Accordingly, in section 4, sub-section (1) (a) shall be inserted as - where a
Chit is registered outside the State and 20 percent or more of the subscribers
are persons normally residing in the State, the foreman of the Chit shall open
a branch in the state and obtain sanction and registration under the provisions
ofthis Act.
In Section 3, a new sub-section 7 shall be added that sanction shall
be deemed to have been issued after thirty days from the date of application if
no decision is taken up by the government or by such officer as may be
empowered by the government on this behalf.
Though the maximum limit of Chit amount in the case of anyone
Chitty conducted by a foreman is removed by this amendment, it is insisted
that, no foreman shall be entitled to conduct at a time Chits the aggregate
amount of which exceeds 50 per cent of the net assets of the foreman. The
main objective of the amendment has been to discourage the flight of Chit
foremen outside Kerala for starting Chits. The removal of the maximum limit
ofChit amount may be intended towards this objective.
3.12 COST AND RETURN ON CHITS
The Chit is a saving instrument with the option for conversion to a
debt instrument before it matures. One of the unique features of Chits is that
the subscribers need not pay a uniform rate of interest for their borrowings
nor receive a uniform rate of return on their savings. Another peculiarity of
Chit is that no member has to pay the entire Chit amount by way of the
periodical subscription and no member can receive the entire Chit amount as
prize money except the foreman.
73

The cost and return of a Chit subscriber is determined by a number
offactors such as duration of the Chit, the instalment at which prize money is
received, the discount offered by different members at the auction, the
foreman's commission, conditions on bidding like fixed or flexible ceiling,
the opportunity cost of the monthly subscriptions and the return a member
could have earned by investing his prize money elsewhere. In determining the
cost and return on Chits of different sola and duration, the prevailing rate of
interest has a very important role to play.
Different agencies and individual researchers have used different
methods to arrive at a satisfactory measure of cost and return on Chits 42. In
order to assess and analyse the cost and return to the subscribers, the
researcher has collected the actual profiles of few terminated Chits from
different Chit institutions and has used different methods for evaluation. It
must be added that each of the methods used to calculate the cost and return
on Chits has its own limitations.
3.12.1 Method 1
Finucial Implications of an Auction cum Lot Chit
In this method, a simple way of estimation has been used to
ascertain the gain and loss or return and cost on Chit to the subscriber. The
case of an actual terminated Chit of KSFE has been assessed here. In Table
3.14 we analysed the case of a Chit, where the number of subscribers was 50,
the capital contributed by the 50 members at the rate of Rs.l ,000 per month
was Rs.50,OOO, the foreman's commission at the rate of 5 per cent of capital
was Rs.2,500, and the net Chit amount after foreman's commission was
Rs.47,500. The discount offered at the monthly auction was distributed
equally among the subscribers. The potential compound interest earning on
prize amount at 10 percent has been shown in column 8 of Table 3.14.
74

Table 3.14
Financial Implications of an Auction cum Lot Chit
Sala = Rs.50,000 (1000 x 50) Duration: 50 Months
Loss I Actual gainNo. of Total Loss on gain Compound
Instal. Months Prize Monthly Discount bidding (Col 6 interest@I()OAI adjusted toSubscription theNo, for Amount lessdiscount Rs. (Sala- minus onpnze discountInterest 6186 Col.3) total of amount (7+8)
Col. 5)
1 2 3 4 5 6 7 8 9
I 49 50000 1000 - - +6186 23789 299752 48 35000 750 250 15000 -8814 16244 74303 47 35000 750 250 15000 -8814 15838 70244 46 35000 750 250 15000 -8814 15436 66225 45 35000 750 250 15000 -8814 15037 62236 44 3500,0 750 250 15000 -8814 14641 58277 43 35000 750 250 1500,0 -8814 14248 54348 42 35000 750 250 15000 -8814 13859 50459 41 35000 750 250 15000 -8814 13472 465810 40 35000 750 250 15000 -8814 13089 427511 39 35000 750 250 15000 -8814 12708 389412 38 35000 750 250 15000 -8814 12331 351713 37 35000 750 250 15000 -8814 11956 314214 36 35000 750 250 15000 -8814 11585 277115 35 35000 750 250 15000 -8814 11216 240216 34 35000 750 250 15000 -8814 10851 203717 33 35000 750 250 15000 -8814 10488 167418 32 35000 750 250 15000 .;.8814 10128 131419 31 35000 750 250 15000 -8814 9771 95720 30 35000 750 250 15000 -8814 9417 60321 29 35000 750 250 15000 -8814 9066 25222 28 35000 750 250 15000 -8814 8717 -9723 27 39850 847 153 10150 -3964 9531 556724 26 41600 882 118 8400 -2214 9542 732825 25 39500 840 160 10500 -4314 8676 436226 24 42000 890 1.10 8000 -1814 8820 700627 23 41500 880 120 8500 -2314 8318 600428 22 45500 960 40 4500 1686 8687 1037329 21 45900 968 32 4100 2086 8331 10417
75

Loss I Actual gainNo. of Total Losson gain Compound
Instal. Months Prize Monthly Discount bidding (Col6 interest @lOO/c adjusted toSubscription the
No. for Amount lessdiscount Rs. ($0/0- minus onpnze discountInterest 6186 Col. 3) total of amount (1+8)
Col. 5)
1 2 3 4 5 6 7 8 9
30 20 45850 967 33 4150 2036 7894 993031 19 43900 928 72 6100 86 7151 723732 18 46000 970 30 4000 2186 7070 925633 17 46000 970 30 4000 2186 6650 883634 16 46200 974 24 3800 2386 6260 864635 15 46800 986 14 3200 2986 5921 890736 14 47500 1000 - 2500 3686 5587 927337 13 47500 1000 - 2500 3686 5167 885338 12 47500 1000 - 2500 3686 4750 843639 11 47500 1000 - 2500 3686 4337 802340 10 47500 1000 - 2500 3686 3927 761341 9 47500 1000 - 2500 3686 3520 720642 8 47500 1000 - 2500 3686 3116 680243 7 47500 1000 - 2500 3686 2716 640244 6 47500 1000 - 2500 3686 2318 600445 5 47500 1000 - 2500 3686 1924 561046 4 47500 1000 - 2500 3686 1533 521947 3 47500 1000 - 2500 3686 1145 483148 2 47500 1000 - 2500 3686 761 4447
l49 1 47500 1000 - 2500 3686 379 4065i 50 0 47500 1000 - 2500 3686 0 3686,
43812 6186I
Source: Computed from a Terminated Chit conducted by K.S.F.E
As per this method practically every member has gained in the Chit
scheme. Actual gain is estimated as the sum of the compound interest earned on
prize amount and the difference between the loss on bidding and the total of the
discount accrued by him. Column 9 of the above Table shows the actual gain to
the subscribers. However, this method suffers from a serious drawback in that,
we have not taken into account the opportunity cost of monthly subscription and
the time value of money. In the following methods, these aspects are also taken
into account.
76

3.12.2 Method 2
Net Return Method
In this method, an attempt has been made to find out the net return
from Chitty by taking into account the opportunity cost of monthly
subscriptions. For this, compound value of monthly subscription including
interest (Total of column 4, Rs. 53814) as well as the compound value of prize
amount including interest (Column 6, and both at 10 %) has been estimated.
Finally by comparing the values in column 6 and the total of column 4, we get
relevant information on the net return of Chit (Column 7).
As per this method, other than the foreman, those who gain from
the Chit are those who bid the prize amount at the zs", 29th and 30th
instalments and all other subscribers seem to be borrowers. The above
estimation reveals that Chitty as a pure saving avenue seems less attractive.
Table 3.15
NET RETURN FROM CHl1TY
CompoundCompound Net return
Instalment No. of Monthly valueof Prizevalueof Co1.6 -
.No. months subscri- subscription amount prize ColA totalremaining ption amount@ 10010 @1O%(53814)
1 2 3 4 5 6 71 49 1000 1008 50000 75088 212742 48 750 1773 35000 52127 -16873 47 750 2544 35000 51697 -21174 46 750 3321 35000 51269 -25455 45 750 4105 35000 50846 -29686 44 750 4896 35000 50425 -33897 43 750 5693 35000 50009 -38058 42 750 6497 35000 49595 -42199 41 750 7307 35000 49186 -462810 40 750 8124 35000 48779 -503511 39 750 8948 35000 48376 -543812 38 750 9779 35000 47976 -583813 37 750 10617 35000 47580 -623414 36 750 11461 35000 47186 -6628
77

Instalment I No. ofCompound
CompoundNet return
Monthlyvalue of Prize
value ofCol.6 -
No I mo~t~ subscri-subscription amount
prizeCol.4 total
remammg ption@ 10010
amount (53814)@ 10010
1 2 3 4 5 6 715 35 750 12313 35000 46796 -701816 34 750 13172 35000 46410 -740417 33 750 14038 35000 46026 -778818 32 750 14911 35000 45646 -816819 31 750 15792 35000 45268 -8546
I 20 30 750 16680 35000 44894 -892021 29 750 17575 35000 44523 -929122 28 750 18478 35000 44155 -9659
, 23 27 847 19486 39850 49859 -3955[ 24 26 882 20537 41600 51618 -2196
25 25 840 21555 39500 48607 -520726 24 890 22632 42000 51256 -255827 23 880 23708 41500 50228 -3586
,28 22 960 24874 45500 54614 80029 21 968 26057 45900 54639 82530 20 967 27250 45850 54128 314
I 31 19 928 28412 43900 51398 -2416, 32 18 970 29627 46000 53411 -403,
I 33 17 970 30852 46000 52970 -844I 34 16 974 32091 46200 52760 -1054I 35 15 986 33353 46800 53004 -810
36 14 1000 34639 47500 53352 -46237 13 1000 35936 47500 52911 -90338 12 1000 37244 47500 52474 -134039 11 1000 38563 47500 52040 -177440 10 1000 39893 47500 51610 -220441 9 1000 41233 47500 51184 -263042 8 1000 42585 47500 50761 -305343 7 1000 43948 47500 50341 -347344 6 1000 45323 47500 49925 -388945 5 1000 46709 47500 49512 -430246 4 1000 48107 47500 49103 -471147 3 1000 49516 47500 48697 -511748 2 1000 50937 47500 48295 -551949 1 1000 52370 47500 47896 -591850 0 1000 53814 47500 47500 -6314
78

The net return from Chitty to various interest rates (5% to 18 %)
are shown in Appendix A. The table reveals that the lower the rate of interest
(say 5 per cent or 6 per cent), the late bidders of the prize money are the
gainers and the higher the rate of interest (say15 per cent or l S per cent), the
early bidders of the prize amount are the gainers of the Chit.
The net return from a private Chit (with bases outside) is shown in
Appendix B. In this case the non-prized subscribers alone are eligible for
fixed discount (ie., an incentive to the non-bidders) and hence the cost of Chit
(total of monthly subscription) is different for the prized and for the non
prized subscribers. As per this method, majority of the non-prized subscribers
gain (savers) from Chit, while all the prized subscribers seem to be borrowers.
The system of fixed discount offers sufficient incentives to the subscribers
who consider Chit as a saving avenue. It is in this context that Mohandas, M.,
(1988) suggested the introduction of a fixed discount or differential sharing of
the dividends, which alone can compensate the losses for the late bidders.
Private Chits in general (not registered in Kerala) and informal
Chits offer several mysterious schemes, which make the calculation of cost
and return difficult and meaningless. They provide fixed discount to the non
prized subscribers, bonus to the non-prized subscribers, gifts as incentives to
the prompt subscribers and charge 7.5 per cent to 10 per cent as foreman
commission. The ceiling on discount goes down to 40 per cent or even below
subject to terms and conditions
3.12.3 Method 3
Net PresentValue Approach
In this method, cost and return on Chitty is calculated by using Net
Present Value. The present value of outflow (ie. monthly subscription of Chit)
is shown in Col. 5 and the present value of inflow (prize amount) is shown in
CoI.6,. both calculated at 10 per cent interest. By comparing the present value
of inflows and outflows, we get the net present value of the Chit. (Col. 7).
Table 3.16 reveals that the subscribers who bid the prize amount at zs", 29th,
79

and 30th instalments are the gainers according to this approach. It may be seen
that the results are similar to the second method discussed earlier.
This method of estimation of cost and return using the present
value approach shows that the return from Chit is less attractive in the case
study examined.
Table 3.16
Net Return from Chitty: Net Present Value Approach
Present ValuePresent Value Net Present
No. ofofMonthly
ofPrize Value =PV otInstalment
MonthsMonthly
Prize AmounlSubscription
Amount(pV Inflow-PVNo.
RemainingSubscription (PVof
ofinflow) ofOutflowoutflow)
@1O% (Total 35538)cm 10%1 2 3 4 5 6 71. 49 1000 50000 1000 50000 144622. 48 750 35000 744 34711 -8273. 47 750 35000 738 34424 -1l144. 46 750 35000 732 34139 -1399
S. 45 750 35000 726 33857 -16816. 44 750 35000 720 33577 -19617. 43 750 35000 714 33300 -22388. 42 750 35000 708 33025 -25139. 41 750 35000 702 32752 -278610. 40 750 35000 696 32481 -305711. 39 750 35000 690 32213 -332512. 38 750 35000 685 31946 -359213. 37 750 ·35000 679 31682 -385614. 36 750 35000 673 31421 -411715. 35 750 35000 668 31161 -437716. 34 750 35000 662 30903 -463517. 33 750 35000 657 30648 -489018. 32 750 35000 651 30395 -514319. 31 750 35000 646 30144 -539420. 30 750 35000 641 29894 -564421. 29 750 35000 635 29647 -589122. 28 750 35000 630 29402 -613623. 27 847 39850 706 33200 -233824. 26 882 41600 729 34371 -116725. 25 840 39500 688 32367 -317126. 24 890 42000 723 34131 -140727. 23 880 41500 709 33446 -2092
80

iPresent Value
Present Value Net PresentNo. of
of MonthlyofPrize rvalue=PVoIInstalment Months
MonthlyPrizeAmoun
SubscriptionAmount(PV Inflow-PV
I No.Remaining
Subscription (PVofofinflow) ofOutflowI outflow)
I @1O%@1O% (Total 35538)
I 28. 22 960 45500 767 36366 82829. 21 968 45900 767 36383 84530. 20 967 45850 760 36043 50531. 19 928 43900 723 34225 -131332. 18 970 46000 750 35566 2831 17 970 46000 744 35272 -26634. 16 974 46200 741 35132 -406
35. 15 986 46800 744 35294 -24436. 14 1000 47500 748 35526 -1237. 13 1000 47500 742 35233 -30538. 12 1000 47500 736 34941 -59739. 11 1000 47500 730 34653 -88540. 10 1000 47500 724 34366 -117241. 9 1000 47500 718 34082 -145642. 8 1000 47500 712 33801 -173743. 7 1000 47500 706 33521 -201744. 6 1000 47500 700 33244 -229445. 5 1000 47500 694 32969 -256946. 4 1000 47500 688 32697 -284147. 3 1000 47500 683 32427 -311148. 2 1000 47500 677 32159 -337949. 1 1000 47500 671 31893 -364550. 0 1000 47500 666 31629 -3909
43812 35538
3.12.4 Method 4
Internal Rate of Return (I R R ) Method
The Internal Rate of Return is that discount rate at which the sum
of present value of operating net cash inflows is equal to the sum of the
present value of cash outflows. Thus IRR is the discount rate at which net
present value is zero. In the context of Chits, cash inflow is the prize amount
to each subscriber at one point of time, which, varies for different individuals,
and cash outflow is the monthly Chit subscriptions that are spread over the
entire Chit period. In the case of Chits, bidding at a particular instalment
81

implies that subscriber is obtaining a loan. If IRR for bidding the Chit at 2nd
instalment is 11.76 per cent, it implies that the bidder is obtaining a loan at
11.76 per cent. This is profitable when he has any alternative investment
opportunities yielding a return greater than 11.76 per cent
If IRR is less than the market rate, it is an indication that the
member is an investor and if IRR is greater than the market rate, it shows that
the subscriber is a borrower. Market rate here refers to the rate of interest
expected to obtain from alternative investment opportunities, at-least the
compound interest earnings from the prize amount as fixed deposit for the
remaining months of the Chit. In an example worked out and given in the
Appendix C, the rate at which the subscriber has discounted the future value
of the Chit amount varies from 4.02 per cent to 42.6 per cent, avoiding
approximate values. By considering a reinvestment opportunity at 10 per cent
per annum compound interest, we can locate the possible savers and
borrowers of the particular case study. In the case of the foreman, the IRR is
indeterminate, because he gets the prize amount (cash inflow) ofRs. 50,000 at
the first instalment itself by virtue of his right, whereas the cash outflow
(monthly subscription) totalling Rs. 43,812 is spread over 50 months. It is
obvious that the foreman is always a gainer and it is illogical to apply any
negative discount factor in this particular case.
Besides the foreman, the other prominent gainers are those who bid
from 320d to 50th instalments. Subscribers who bid at other instalments
resemble borrowers.
One of the limitations of this method is that the IRR for the bidders
ID certain instalments give only approximate extreme values. Another
limitation is the inherent assumption regarding the alternative investment
opportunities, at the IRR. Other researchers were also confronted by the same
limitations 43. The limitations of this approach in the calculation of cost and
return on Chit may give distorted results. In view of these limitations, we are
not making any further analysis or observations based on the IRR method.
82

3.12.5 Method 5
Financial Implications of a Chit Based on Loan at 15 per cent Interest
In this method, the prize amount receivable from Chit Funds could
be treated as a loan availed of for a period of 50 months (i.e., same as the total
duration of the Chit). The general lending rate of banks has been taken as 15
per cent per annum. The sum of the monthly subscription to Chit (actual cost
to the subscriber) equals Rs.43,812. If monthly Chit subscription could be
treated as the periodical repayment of the loan, the loan outstanding including
interest is shown in Col. 8. Here we assume the amount to be equal to the
prize amount received. In this present example, excluding the foreman, the
prize amount has remained at Rs.35,000 for the first 22 instalments, thereafter
it has varied for each of the subsequent months till 36th month where it has
gone upto Rs.47,500 and continued to remain the same amount till the end
(ie., 50th month). Hence loan amounts assumed will vary in the 23rd to 36th
months. Thus the loan outstanding at the end of the Chit period in the case of
a borrower-subscriber who takes a loan of Rs.35,000 in the second month
becomes RS.5209 (See, Table 3.17 last value of Co1.8). This is the balance of
the amount to be paid for the closure of the loan. But since he had already
started remitting money from the first month onwards, even though he takes
the loan after one month, he must be treated as a saver, like a recurring
deposit holder, till the time he gets the loan. Hence he is eligible for interest
on the amount remitted upto the period of availing the loan. In the case
mentioned above it is Rs. 7 (at 8% interest) on Rs.1000 for one month. So the
actual amount to be paid for the closure of the loan is Rs.5202. (Rs.5209
Rs.7) only. In the same way, the person who gets Rs. 35,000 after 22 months
will earn an interest of RS.1365. Hence the loss on the loan as compared to
Chit will be Rs.3844 (i.e., 5209-1365). The above estimate reveals that
subscribing to a Chit seems more attractive than availing of a loan at the
ruling interest rate 44.
83

To illustrate one more case:
The loss on Loan for the23rd month is calculated as follows:
Amount of loan = Rs. 39850
(i.e., the prize amount at the 23rd instalment)
Loan outstanding after the 50th month = Rs.14235
The interest earned on subscription till the 23rd month = Rs.1492
Therefore net loss on Loan = Rs. 12743
Table 3.17
Financial ImplicatioDs of a Chit Based OD Loan at 15 per ceDt IDterest
ilmt. No. ofMonthly Prize Loan Loan Iolen:st. Loan
Interest LossonI Months OUbnnding: No. Subscription Amount Amount OutstandingMcnthIy at 89.4 Loan!
..Iol..iuding Interest
! I 2 3 4 5 6 7 8 9 10
· I 49 -1000 50000 35000 34000 425 34425 7 5202
• 248 -750 35000 34425 33675 421 34096 18 5191
i 3 47 -750 35000 340% 33346 417 33763 35 5174: 4 46 -750 35000 33763 33013 413 33425 57 5152I 5 45 -750 35000 33425 32675 408 33084 84 512516 44 -750 35000 33084 32334 404 32738 116 5093, 7 43 -750 35000 32738 31988 400 32388 154 5055: 8 42 -750 35000 32388 31638 395 32033 1% 5013: 9 41 -750 35000 32033 31283 391 31674 244 4%5;10 40 -750 35000 31674 30924 387 31311 298 4911:11 39 -750 35000 31311 30561 382 30943 356 4853:12 38 -750 35000 30943 30193 377 30570 420 4789,13 37 -750 35000 30570 29820 373 30193 490 4719
14 36 -750 35000 30193 29443 368 29811 565 4644
• 15 35 -750 35000 29811 29061 363 29424 645 4564: 16 34 -750 35000 29424 28674 358 29033 731 4478il7 33 -750 35000 29033 28283 354 28636 823 4386
18 32 -750 35000 28636 27886 349 28235 920 428919 31 -750 35000 28235 27485 344 27829 1023 418620 30 -750 35000 27829 27079 338 27417 1131 407821 29 -750 35000 27417 26667 333 27000 1245 396422 28 -750 35000 27000 26250 328 26578 1365 384423 27 -847 39850 26578 25731 322 26053 1492 1274324 26 -882 41600 26053 25171 315 25486 1625 15867

!W1 No. ofMonthly Prize Loan Loan Interest
LoanInterest ~osson
Months OutstandingNo. Remaining Subscription Amount Amount Outstanding Monthly Including Interest
at 8% Loan
. 1 2 3 4 5 6 7 8 9 10
: 25 25 -840 39500 25486 24646 308 24954 1765 11819:26 24 -890 42000 24954 24064 301 24365 1911 16325
27 23 -880 41500 24365 23485 294 23778 2064 15242! 28 22 -960 45500 23778 22818 285 23103 2225 22525:29 21 -968 . 45900 23103 22135 277 22412 2393 23101I
i 30 20 -967 45850 22412 21445 268 21713 2569 2283231 19 -928 43900 21713 20785 260 21045 2753 19019
:32 18 -970 46000 21045 20075 251 20326 2943 22737! 33 17 -970 46000 20326 19356 242 19598 3142 22538i34 16 -974 46200 19598 18624 233 18857 3348 22332: 35 15 -986 46800 18857 17871 223 18094 3563 236061
36 14 -1000 47500 18094 17094 214 17308 3785 43715137 13 -1000 47500 17308 16308 204 16512 4016 43484!38 12 -1000 47500 16512 15512 194 15705 4255 43245139 11 -1000 47500 15705 14705 184 14889 4502 42998I
!40 10 -1000 47500 14889 13889 174 14063 4757 42743: 41 9 -1000 47500 14063 13063 163 13226 5021 42479:42 8 -1000 47500 13226 12226 153 12379 5293 42207' 43 7 -1000 47500 12379 11379 142 11521 5574 41926144 6 -1000 47500 11521 10521 132 10653 5863 41637145 5 -1000 47500 10653 9653 121 9773 6161 41339!46 4 -1000 47500 9773 8773 110 8883 6468 41032:47 3 -1000 47500 8883 7883 99 7982 6783 40717! 48 2 -1000 47500 7982 6982 87 7069 7107 40393:49 1 -1000 47500 7069 6069 76 6145 7440 40060!50 0 -1000 47500 6145 5145 64 5209 7781 39719
Summarising the analysis of the cost and return on Chit has
revealed that the economics of Chits lies in considering it as a savings-cum
borrowing avenue. Though Chit as a pure saving avenue seems to be less
attractive, as a pure borrowing avenue Chit seems to be cheaper as compared
to bank loans. In the case of many subscribers who consider Chit as a way of
forced savings, the gain on the Chit will be all the more higher. The real cost
and return on Chit depends on a number of factors like the prevailing rate of
interest, the instalment at which the prize money is obtained, the method of
discount followed, the 'sala' size and the duration of the Chit
85

Conclusion
Chit Funds as indigenous financial institutions had its origin in
Kerala centuries back. From its humble beginning as a "Changathi Kuri' for
mutual help, it has passed through different stages of growth. By leaps and
bounds it has spread, not only in Kerala and South India, but also to other
regions and countries. The unique features of the Chit scheme like the element
of mutual help, compulsion in effecting saving, contractual form of saving,
dual option for saving and borrowing and self-determined cost attract millions
to this traditional financial intermediary. Some of the rigid aspects of the
Kerala Chitties Act have resulted in an outflow of foremen to other States
nominally, but with subscribers almost exclusively from Kerala. It has also
resulted in the starting of 'Chit like' schemes, MDS and MBS by the Co
operatives. The conspicuous presence of Informal Chits is also very
significant in Kerala, though authentic data is not available.
Trend analysis of the number of Chits and its turnover shows
increasing trend throughout the period of analysis. Chit business in Kerala
clearly shows a bias in favour of the southern districts with respect to the number
ofChits as well as the volume of business. The role of KSFE in the sphere of
Chit Finance in Kerala is precariously significant. Though, Chit subscription, as
percentage of domestic deposits of banks remained more or less stable, the
average annual growth rate of Chit turnover in comparison to the average annual
growth rate of domestic deposits of banks is impressive. Chit Funds flourishing
in Kerala as a unique financial intermediary reveals its great scope and highlights
the need for popularising the system to other parts of the country.
86

Notes and References
1. There are regional variations In the use of the term 'Chit'. In the
Travancore area of the State of Kerala it is called 'Chitty': in the Cochin
and Malabar areas it is popularly called 'Kuri"; in the other parts of the
country it is called 'Chit' or 'Chit Fund'.
2. Nayar, CPS. Chit Finance: An Exploratory Study on the Working ofChit
Funds, Vora and Co. Publishers Pvt. Ltd., Bombay, (1973), p.3.
3. i) Travancore Banking Enquiry Committee Report, Government of
Travancore, Vol.!., (1930).
ii) The Madras Provincial Banking Enquiry Committee Report. Government of
India, Vol. 1., (1930) .
iii) Indian Central Banking Enquiry Committee, Part-I, Majority Report,
Government of India, Vol.I, (1931).
4. Nayar, CPS, op. cit., p.l
5. Logan, William. The Malabar Manual, (1887), reprinted as Malabar by
the Government of Madras in 1951, Vol.I, p. 173.
6. Cox, Sim. E. J, Primitive Civilizations or Outlines of the History of
Ownership in Archaic Communities, Swan Sonnenschein and Co.,
London, Vol.l, (1894), p.568.
7. The Madras Provincial Banking Enquiry Committee Report, Government
ofIndia, Vol.l, (1930).
8. Report of the Kuri Committee, Government of Cochin, (1939).
9. Report of the Rural Banking Enquiry Committee, Government of India,
(1950).
10. All India Rural Credit Survey, District Monograph, Quilon, RBI,
Bombay, (1958), p.9?
11. Logan, William. op. cit., p.l?3.
12. Nayar, C.P.S. op. cit., p. 5.
87

13. The Report of the Travancore-Cochin Banking Enquiry Commission, (1956).
14. Nayar, C.P.S. op. cit., p. 6.
15. Sreedhara Menon, K.A, "Schemes for Starting Chitties under State
Auspices", (1967), Special Officer, Kerala State, p.16.
16. See, Krishnamurthy, A. "Corporate Chits: A New Dimension", National
Workshop on Management of Chit Funds, Chennai, November 14, (1997).
Corporate Chits are savings and borrowing schemes for the Corporate
Sector. Model Chit Corporation Ltd., Hyderabad, had introduced the Rs.
50 Lakhs and RS.25 Lakhs Chit series, which were branded as 'Gold Line
Series' and 'Silver Line Series' respectively to assist small segments of
the Corporate Sector. This was in addition to the RS.l Crore 'Century
Line Series' of the Model Chit Corporation Ltd., Hyderabad.
17. Nayar, C.P.S. op. cit., p. 7.
18. Balasubramanian, V. " The Chit Fund Business is Thriving in the South:
Thanks to Stringent Norms", The Economic Times, lth May (2002), p.7.
19. Administration Report, Registration Department, Government of Kerala,
Trivandrum, (2000-01).
20. Nayar, C.P.S. op. cit., p. 4.
21. See, Thomas, P. J. "Our Economic Heritage", Silver Jubilee Souvenir,
Dharmodayam Company, Thrissur, (1948). According to him,
'Pall.Kuries' were Kuries managed by the church priests as a way to help
the financialJy weak parishioners. The Chitties were conducted on
Sundays and the members were the folJowers of the church only. Our
survey results show that nowadays, not only churches but also temples
conduct Kuries regularly as a business and the membership is open to all.
22. Section 7, Subsection 4 of Kerala Chitties Act, 1975.
23. 'Pooval' Kuri is a long term Chit extending upto 20 years with
subscriptions made in three or four instalments a year (generally) which is
88

related with the harvesting periods. The name 'Pooval ' is derived from
the Malayalam word 'Poo' or 'Poovu', which means crop.
24. A study on Non-Banking Financial Intermediaries, prepared by IFMR,
RBI Publication, (1984).
25. Radhakrishnan, S. Chit Funds and Finance Corporations, IFMR
Publications, Madras, (1975), p.7.
26. Radhakrishnan, S. Ibid, p.7.
27. A study on Non-Banking Financial Intermediaries, prepared by IFMR,
RBI Publication, (1984), p.3. See Report of the Study by Asian Development
Bank (1989), which describes Chit Funds as the only system for both savings and
borrowings effected under mutual help with dignity.
28. InCommunity Chits, all the subscribers are known to each other and have
small duration and relatively small Chit amount. See, Radhakrishnan, S.
"Chit Funds vis-a-vis other NBFCs", National Workshop on Management
of Chit Funds, Chennai, November (1997).
29. Leonard, TcRuindjo. "The Evolution of an Informal Financial Institution:
The Rotating Savings and Credit Associations in Cameroon", African
Review ofMoney, Finance and Banking, (1999), pp.14-15.
30. Varma J.C, Non-Banking Financial Companies, Second Edition, Chapter
XV, (1997), p. 491.
31. Travancore Banking Enquiry Committee Report, Government of
Travancore, Vol.l, (1930).
32. Nayar, C.P.S. op. cit., p.161.
33. Nayar, C.P.S. op. cit., p.165.
34. All Kerala Private Chit Foreman Association, News Bulletin, Trichur,
VoU, No.I, 12th April (2002), p.I.
35. The Report of the Travancore-Cochin Banking Enquiry Commission, (1956).
36. The Domestic Deposits of banks means Total Deposits of banks minus
NRI Deposits.
89

37. The Report of the Study Group on Non-Banking Financial Intermediaries,
Banking Commission, Government of India, (1912).
38. Study Group on Non-Banking Companies under the Chairmanship of
James S Raj, (1914). The group recommended uniform central legislation
for Chit Funds applicable to all states.
39. The Chit Funds Act, 1982. (Act No. 40 of 1982). An Act to provide for the
regulation of Chit Funds and for matters connected with it, Law Publishers
(India) Pvt. Ltd., (1998).
40. lames S Raj, op. cit.
41. The Chit Funds (Amendment) Act 2001, 16th May (2001), Government of
India.
42. The Kerala Chitties (Amendment) Act 2002, 1st April (2002), Government
of Kerala.
43. Radhakrishnan, S. Chit Funds and Finance Corporations ed., IFMR
(1975).
44. Further, it can be shown that borrowing by way of Chit is cheaper even at
lower levels (in this case, till 12%.per annum). However, at lower levels
than 12%, in this case, Chit is not uniformly cheaper for all subscribers.
(For subscribers who get the prize-money from 10th to 22nd instalments,
Chitty is costlier than a bank loan at 11 per cent)
90

CHAPTER FOUR
KERALA STATE FINANCIAL ENTERPRISES LTD. (KSFE)
AN ASSESSMENT
After presenting the evolution and growth of Chit Funds, this
chapter discusses the origin and development of Kerala State Financial
Enterprises Ltd. (KSFE). It presents the trend and dimensions of mobilisation
of financial resources and also of various loans and advances provided by
KSFE. This Chapter also makes a performance evaluation of the Company in
terms of selected parameters.
4.1 NEED FOR PUBLIC SECTOR CHIT FUND
Chit business in Kerala was under private monopoly till 1969. The
business of 'Chit' had been exposed to a wide variety of malpractices from its
very inception. There existed ample scope for exploitation of the needy people
by unscrupulous promoters for their own selfish interest. Lack of Government
control offered many opportunities for new entrants in this lucrative field of
business. The Government wanted to introduce some restrictions on the
unbridled growth of such Chit institutions with a view to safeguarding the
interests of the subscribers and to channelise the savings for productive
purposes I. Another justification for State control was the need to avoid the
concentration of wealth and power among a few. Besides, if the State
participated in Chit business directly, the profit generated would flow back to
the public in the form of utility services.
4.2 ORIGIN OF KSFE
In 1967, The Government of Kerala took a policy decision to the
effect that Chitties should be conducted under state auspices as a means for

the collection of small savings. The then Finance Minister, in his budget
speech for the financial year 1967-68 made the following announcement on
the floor of the Kerala Assembly. "I view this decision as a bold step forward
along the path towards socialism, aimed at bringing banks and other financial
institutions under social control" 2.
As the follow-up, the Government of Kerala, appointed a Special
Officer in the year 1967, to look into the feasibility and desirability of starting
Chit Funds in the public sector and also to prepare a comprehensive scheme
for starting Chits under government control 3. One of the objectives of starting
Chit Funds in the public sector was to control the mushroom growth of private
Chit Funds and to restrain their growth by offering effective competition.
The Special Officer, who presented his Report on 7th October 1967,
recommended strongly the entry of the Government into the field of Chits.
Though the recommendation was for conducting Chit as an adjunct of the
Registration Department, the Government took a different view and decided to
bring within its purview and control, not only Chitties or Kuries, but also
certain other financial transactions for which socialisation was felt necessary.
Accordingly the Government decided to organise a public sector undertaking
with the name "The Kerala State Financial Enterprises Ltd." (KSFE) for the
purpose of conducting Chits, hire purchase and insurance business under
Government control. This apart, the Government of Kerala had a progressive
vision for generating non-revenue income through such public sector ventures.
Thus, KSFE Ltd. was incorporated as a Government Company on 6th
November 1969 with its Head Office at Trichur with the objective of serving
as adiscipline factor to private Chit Funds". The first Board of Directors was
constituted as per G.O. (Rt.) 4876/69/Fin dated 26th November 1969.
KSFE comes under the group of Miscellaneous Non-Banking
Financial Intermediaries. KSFE has the unique status of being the only public
sector undertaking in India, which runs Chits and also one of the few profit
making companies owned by the Government of Kerala.
92

4.3 CAPITAL STRUCTURE OF KSFE
The KSFE Ltd. is fully owned by the Government of Kerala. The
Company, which started in a humble manner with a paid up capital of Rs. 2
Lakhs in 1969, has now grown to Rs.300 Lakhs with a capital structure of
3,00,000 shares of Rs.l 00/- each fully subscribed by the State Government.
The other main resources on which the Company finances its
various schemes are:
1. Loans from the Government of Kerala
2. Deposits from the public and
3. Funds ploughed back from profit.
Table 4.1 gives the capital structure of KSFE during the period
1990-91 to 2000-01. There has been a significant infusion of capital in 1995
96. It may also be seen that reserves and surplus had a great jump during
1997-98 and 2000-01. However Table 4.1 also clearly shows that the
percentage of net worth to total funds has been continuously declining, due to
the increase in the rate of total borrowings and the low capital base of the
Company. The year 2000-01 shows marked improvement in the ratio due to
the large increase in the volume of reserves and surplus.
Table 4.1
Capital Structure of KSFE (Rs, Lakhs)
Reserves Net TotalPercentage of
YearEquity
and WorthGrowth
BorrowedGrowth NW to Total
CapitalSurplus (NW)
RateFunds
Rate BorrowedFunds
,1990-91 100 184.67 284.67 -- 7420 -- 3.8
,1991-92 125 193.74 318.74 11.97 8906 20.03 3.6
,1992-93 125 199.67 324.67 1.86 10391 16.67 3.1
1993-94 125 205.1 330.1 1.67 10590 1.92 3.1
1994-95 150 233.42 383.42 16.15 10561 -0.27 3.6
93

,1995-96 300 245.75 545.75 42.34 15374 45.57 3.6
1996-97 300 296.43 596.43 9.29 26887 74.89 2.2
1997-98 300 407 707 18.54 43945 63.44 1.6
:1998-99 300 426 726 2.69 64818 47.50 1.1
1999-00 300 458 758 4.41 75362 16.27 1
2000-01 300 1203 1503 98.3 88150 16.96 1.7
Source: Annual Reports, KSFE
4.4 MANAGEMENT OF THE COMPANY
The management of the Company has been vested in the Board of
Directors constituted by the Governor from time to time. The number of
Directors shall not be less than two and shall not be more than fifteen. The
Governor may from time to time appoint two Directors, other than the
Managing Director as Chairman and Vice-Chairman of the Board and determine
the period for which either of them will hold his respective office. The Board of
Directors as on November 2002 includes the Chairman, Managing Director and
three other Directors holding the office as Additional Secretary (Taxes), Joint
Secretary (Finance) and Inspector General of Registration.
4.5 ORGANISATION
The organisational set up is a three-tier system from its very
inception. with the Head Office as the top controlling and coordinating body,
the Regions constituting the intermediary level, coordinating and controlling
all the activities of the various branches under them and the branches at the
base level as profit generating centres.
Chart 4.1 gives the organisational structure ofKSFE Ltd.
94

Ch
.M4
.1O
rg.n
&z.U
on
.'C
h.M
ofKS"~E
Ltd
MD
=M
an
ag
ing
Dir
ecto
rF
M=
Fin
ance
Man
ag
er
BM
=B
usi
nes
sM
anag
erI
BO
AR
D
CH
AIR
MA
N
VIC
EC
HA
IRM
AN
Plan
ning
Cel
lM
.D.•
F.M
.•&
B.M
.
100
VI
Fina
nce
Man
ager
Reg
iona
lMan
ager
Secr
etar
y
Bus
ines
sM
anag
er
Acc
ount
s(C
entr
al)
Acc
ount
s(B
ranc
hes)
Fixe
dD
epos
it
Uni
ts
Chi
tH
ireP
urch
ase
Leg
alO
ther
Bus
ines
s

Atthe Head Office, the activities are grouped on functional as well
as product basis under the control and supervision of the Managing Director.
The product departments are:
I. Chitty Department and 2. Hire Purchase Department
The functional departments are: -
• Accounts Department
• Administrative Department
• Secretarial Department
• Legal Department and
• Internal Audit Department
4.6 OBJECTIVES OF KSFE Ltd.
The major objectives pursued by the Company on its incorporation are: -
• To start, conduct, promote, operate, manage and carry on the business of
Chitties in India and elsewhere.
• To promote, undertake, organise, conduct, manage and carry on the
business of general and miscellaneous insurance of any kind in India or
elsewhere.
• To start, promote, conduct, operate, carry on and manage the business of
dealers, agents and traders under the hire purchase system of articles,
vehicles, machinery, materials, goods and tools of all capital goods and
consumer goods and property of all nature and description for personal,
domestic, office, commercial, industrial and community use and
consumption as a business of the Company or as agents of the
government, state or central or any body or organisation, there-under or
ofany other Company.
• To start, promote, conduct, operate and carry on the business for
providing financial assistance for the construction of new buildings and
96

for repairs, renewals, alterations, additions or modifications of existing
buildings and for self-employment schemes.
• To provide financial assistance to the hirers or others for the purpose of
running and maintaining articles, equipment and other items acquired
under Hire Purchase system of the Company.
• To advance money on the security of gold or other valuable securities.
4.6.1 Ancillary Objectives
• To subscribe for, acquire, hold, sell and otherwise deal in shares, stocks,
debentures or assets of any Company or society for securing the interests
of this Company and to invest the funds in government bonds and
securities.
• To enter into any partnership or arrangement for joint working in any
trading, commercial or financial business, firm or persons carrying on or
engaged in any manufacture or business within the objectives of the
Company or similar thereto.
• To establish, maintain, or become a member of training institutions,
financial and commercial associations and conferences, workshops and
schemes so as to benefit the Company directly or indirectly.
4.6.2 Other Objectives
• To carry on any other business that is similar to the business of the
Company or any business connected with or incidental or allied to the
business of the Company.
• To carry on the business of dealers, importers and exporters of all
merchantable goods and to carry on and execute all kinds of financial
trading and other operations.
• Toact as agent for the Government of Kerala or any other authorities and
to transact and to undertake and transact, trust or agency business of
every kind and of any description.
97

It is observed that some of the objectives of the Company like
conducting Chits outside Kerala and promoting the business of general
insurance of any kind in India or elsewhere are not yet fulfilled.
4.7 SCHEMES OF THE COMPANY
Beginning with Chits, the Company has over the years introduced
several attractive schemes to cater to the needs of different classes of people.
It mainly mobilises savings by instruments like Chits and deposit schemes and
channelises them to acquire house and household durables, motor vehicles,
equipment for self-employment and provides finance for augmenting working
capital needs of small traders.
The main schemes of the Company as of now are:
I. Chit scheme
2. Passbook loan
3. New Chitty loan
4. Hire purchase scheme
5. Hire purchase (House modernisation scheme)
6. Employment oriented hire purchase scheme
7. Gold loan scheme
8. Trade financing scheme
9. Fixed deposit scheme
10. Sugama deposit scheme
11. New fixed deposit loan scheme
12. New housing finance scheme
13. Reliable customer loan
4.7.1 ChitScheme
The purpose of the Chit scheme has been to provide an avenue of
savings for people who aspire to save for the future by setting apart a portion
98
of their monthly income. 'Chitty' or Chit is a unique scheme where the saving
aspect and the advance aspects are blended together.
Salient Features of KSFE Chits4.7.1.1
The core business of the Company has been Chit scheme ever since
its formation. The Company takes 5 per cent of the Chit amount as foreman's
commission from each member. The Chit scheme has been contributing a
substantial portion of the total revenue of the Company (See Table 4.4).R
330c-. 07 £SI.? ~{.\L
• Any Indian citizen, who has attained maturity, can subscribe to KSFE
Chits.
• The due date for the payment of prize money is the 45th day after the
auction, but with effect from 13-8- 2001 it has been changed by KSFE to
the 30th day after auction.
• Advance payment of prize money (instant pnze money) as a loan IS
available at the prevailing rate of interest.
• New Chitty Loan 5 (NCL) has been introduced to bridge the gap between
the real need of the subscriber and the uncertain point of time in future
when the ticket gets prized.
• Passbook loan scheme has been introduced from 1975 onwards to provide
quick loan to non-prized subscribers to meet the urgent needs on the
security of paid up subscription in their Chits.
• Monetary range of KSFE Chits extends up to Rs.l 0 Lakhs with monthly
subscription of Rs 25,000 each. The duration ranges from 40 months to
100 months. Branches with the approval of the Head Office can~~•.:'~.~'-)...
Chits different from the above patterns. I'IJll'Y! '"{! I 1
!:l • ,
0.1.2 Privileges Enjoyed by KSFE \~ ~ ;~. lj .. '
The Government of Kerala has been pleased to exempt KSF~f,a...
the operations of the following provisions of the Kerala Chitties Act, 1975:
99

I. Section 3(1): Exemption from obtaining prior sanction from the Registrar for
starting a Chitty
2. Section 3(5): Exemption from the limitations of minimum asset or net
worth of the foreman
3. Section l1(1)(a): Exemption from the requirements of time at which or
the place where the Chitty is to be conducted (vide G.O Rt. 401/78 TD
dated 9th June 1978).
4. Section 17(1): Exemption from deposit of unpaid prize amount ID an
approved bank
5. Section 24(3): Exemption from deposit of arrears in an approved bank, of
subscription realised from substituted subscriber
6. Section 25(2): Exemption from depositing the amount due to the
defaulting subscriber in an approved bank. if he fails to furnish
acknowledgement in writing for the amount due to him.
7. Section 29(4): Exemption from depositing the consolidated payments of
future subscription realised in an approved bank from defaulted prized
subscriber.
8. Section 42: Exemption from producing the documents before inspecting
authority at his office.
9. Over and above all these, the Company enjoys exemption from stamp
duty.
4.7.1.3 Growth of Chit Business
The total business of KSFE includes annual Chit turnover, total
advances of all types and total deposits mobilised by the Company. Chit
scheme being the core business of KSFE, the review of the growth trend of
the Chit scheme and its contribution to the total revenue of the Company from
the very beginning (1970-71 to 2000-01) have been presented in this section.
New Chitty loans and Passbook loans have also been included for review. This
section also presents the number of Chit subscribers, the decennial growth
rates of Chits and their contribution to the total revenue.
100

Table 4.2 given below presents the growth of annual turnover of
Chits and the increase in the number of Chit subscribers over the period 1970
to 2001. The Table reveals that there has been an increase of about 12.9 times
in the annual Chit turnover showing an increase from Rs.I07.40 Crore in
1990-91 to Rs. 1,385.24 Crore in 2000-01.
Table 4.2
Growth of Chit Business in KSFE from 1970-71 to 2000-01
Aggregate Annual Chitty Growth GrowthSala of all
turnover rate of No. of rate ofYear Branches (Sala x 12) Chitty subscribers no. of
Together(Rs.Lakhs) (Rs. Lakhs) turnover subscribers
1970-71 10 120 -- -- --1971-72 31 372 210.00 -- --1972-73 48 576 54.84 75000 --1973-74 58 696 20.83 79000 5.33
1974-75 70 840 20.69 83000 5.06
1975-76 83 996 18.57 96000 15.66
1976-77 91 1092 9.64 92000 -4.17
1977-78 103 1236 13.19 98013 6.54
1978-79 116 1392 12.62 101073 3.12
1979-80 139 1668 19.83 106945 5.81
1980-81 155 1860 11.51 107255 0.29
1981-82 184 2208 18.71 112355 4.76
1982-83 219 2628 19.02 121430 8.08
1983-84 264 3168 20.55 130790 7.71
1984-85 308 3696 16.67 135930 3.93
1985-86 341 4092 10.71 138990 2.25
1986-87 385 4620 12.90 148100 6.55
1987-88 470 5640 22.08 156020 5.35
1988-89 581 6972 23.62 174325 11.73
1989-90 736 8832 26.68 192685 10.53
1990-91 895 10740 21.60 212185 10.12
101

AggregateAnnual Chitty Growth Growth
Sala of allYear Branches
turnover rate of No. of rate of
Together(Sala x 12) Chitty subscribers no. of
(Rs.Lakhs)(Rs. Lakhs) turnover subscribers
,1991-92 1088 13056 21.56 227030 7.00
1992-93 1362 16344 25.18 246595 8.62
1993-94 1860 22320 36.56 268415 8.85
:1994-95 2489 29868 33.82 295060 9.93,
,1995-96 3266 39192 31.22 323947 9.79
1996-97 4254 51048 30.25 357350 10.31
1997-98 5951 71412 39.89 414585 16.02
1998-99 7421 89052 24.70 493041 18.92
1999-00 9569 114828 28.94 598449 21.38
i 2000-01 11544 138524 20.64 700000 16.97I
: Average Annual Growth Rate (AAG) 29.23 8.44Source: Annual Reports, KSFE
Table 4.2 also reveals that over the period from 1970 to 200 I there
has been a robust average annual growth rate of 29.23 per cent in the annual
Chit turnover 6 showing an increase from Rs.1.2 Crore to Rs.l,385.24 Crore.
The number of subscribers shows an increase of about 9.3 times from 75,000 in
1972-73 to 7 Lakhs by 2000-01. Thus the progress of the Company's Chit
business continued to be satisfactory from the very year of starting the first
Chitty on 15-6-1970. There were more than 7 Lakh subscribers in the Chits that
are being conducted from the various branches of the Company with an
aggregate monthly sala of more than Rs.1l5.44 Crore as of 2000-01. The
average annual growth rate of Chit turnover for the period of analysis (29.23%)
is also seen to be higher than the average annual growth rate of the number of
subscribers (8.44 %). A comparison of the decennial growth rate of the volume
of Chit turnover of KSFE with that of the Chit industry in Kerala along with a
graphical representation has been attempted in the following section.
102

4.7.1.4 Decennial Growth in the Volume of KSFE Chits
The growth rate in the volume of Chit turnover in KSFE shows
fluctuation from1970-80 to 1990-00. The decade 1970-80 witnessed the highest
growth rate. After a fall in it during 1980-90 period, the decade 1990-2000
again shows an increasing tendency mainly due to the diversification of the
schemes. The outflow of the Chit foremen to other States to escape from certain
provisions of the Kerala Chitties Act, 1975 also resulted in the sluggish growth
of the Chit business in Keralaespecially in the 1980's. Despite this, it is
pertinent to note that in the volume of Chit turnover in Kerala, the highest
growth rate (15.01 %) has been recorded during the decade 1990-2000 (See
Table 4.3). This perhaps is also a reflection of the success of KSFE in winning
the confidence of subscribers and also vindicates its efforts at diversification.
The high growth rate for the Chit industry as a whole during 1990-2000 period
is mainly due to the faster growth rate in the KSFE Chits.
A comparison of the growth rate of the volume of Chit turnover in
Kerala with that ofKSFE is presented in Table 4.3. It reveals higher growth rates
for KSFE across all periods as compared to the industry (See also Fig. 4.1).
Table 4.3
Decennial Growth Rate in the Volume of Chits
Growth Rate of Volume Growth Rate of VolumeNo. Decade of Chit Turnover in Kerala of Chit Turnover in KSFEI 1970-80 14.10 42.25
2 1980-90 12.17 20.43
3 1990-00 15.01 28.58
Source: Computed from Annual Reports, KSFE.
103

Figure 4.1
Decennial Growth Rate of Chit Turnover in Kerala and KSFE
'"<,<,
<, -------<, -----.....
~~
~ ....
45
40..tuo~30~
~ 25u'020!~ 15
i 10
C' 5
o1970-80 1980-90 1990-2000
Decade
I~GIUWth rate of Chit Turncmtr in KeraIa _Growth rate of Volume of Cht Twnover in KSFE I
4.7.1.5 Contribution of Chit Scheme to the Total Revenue of KSFE
The contribution of Chit schemes to the total revenue includes
foreman's commission (5 per cent of Chit salay, interest on Chit loans,
interest on statutory tickets 7 of the Company and the profit on substituted
tickets. Table 4.4 presents the actual growth in the total revenue ofKSFE, and
the contribution of Chit schemes to total revenue over the period from 1970
71 to 2000-01. It also reveals the percentage growth in total revenue and the
percentage share of Chit in the total revenue of KSFE
104

Table 4.4
Contribution of Chit Scheme to the Total Revenue of KSFE (Rs, Lakhs)
TotalShare of Percentage Share
Growth Chit GrowthYear Revenue Rate to total Rate
of Chitto total revenueI revenue
: 1970-71 8 .- 2 -- 25
j 1971-72 15 87.50 11 450.00 73
i 1972-73 31 106.67 23 109.09 74
i 1973-74 44 41.94 31 34.78 70
i 1974-75 52 18.18 35 12.90 67
i 1975-76 68 30.77 45 28.57 66
: 1976-77 80 17.65 50 11.11 63
I 1977-78 91 13.75 57 14.00 63I 1978-79 105 15.38 64 12.28 61,I 1979-80 120 14.29 72 12.50 60I
I 1980-81 140 16.67 84 16.67 60I
: 1981-82 158 12.86 90 7.14 57
I 1982-83 198 25.32 118 31.11 60
! 1983-84 236 19.19 138 16.95 58
1984-85 279 18.22 165 19.57 59
I 1985-86 274 -1.79 148 -10.30 54
1986-87 386 40.88 212 43.24 55
I 1987-88 453 17.36 260 22.64 57
I 1988-89 570 25.83 316 21.54 55
: 1989-90 754 32.28 404 27.85 54I 1990-91 1022 35.54 496 22.77 49
! 1991-92 1321 29.26 612 23.39 45I 1992-93 1857 40.58 792 29.41 45I 1993-94 2509 35.11 1209 52.65 48I
: 1994-95 3504 39.66 1887 56.08 54
1995-96 4679 33.53 2743 45.36 59
i 1996-97 6588 40.80 3681 34.20 56~ 1997-98 9876 49.91 6082 65.23 61
1998-99 13810 39.83 8513 39.97 62
, 1999-00 17006 23.14 10583 24.32 62• 2000-01 20491 20.49 12181 15.09 60
Average Annual 31.36 43.00Source: Computed from Annual Reports, KSFE
105

It is seen that the major share of the total revenue of KSFE has
been contributed by the Chit scheme from its very inception and forms 60 per
cent as of 2000-01. Table 4.4 also reveals that the rate of growth of total
revenue of KSFE is directly linked to the rate of growth of the contribution of
Chit to total revenue. The average annual growth rate of the share of Chit to
total revenue of KSFE was 43 per cent. which is higher than the average
annual growth rate (31.4) of total revenue of the Company. Thus it clearly
substantiates the tremendous growth potential of its core business.
Figure 4.2
Growth Rates of Total Revenue of KSFE and contribution of Chit to
Total Revenue
2IOlIO~---------------------------.
ZOOOO+-------------------------+-fSi: 1SOOO.t:.o~ 100110e•.t:.: Cl: soooi":! 0c ... &"t •~ ":' ":' ":'• ~
N ~
a:: ... ...j
...~
~CD ... :, • ... • ... =; • • CD ...":' If If If er er Gp
i• CD a N~ : : I N Z I I... ... • CD
Yea'I-TGta'R8venue -ShareofChilIDTaIaI ....... 1
Figure 4.2 clearly shows that the total revenue of KSFE is highly
linked to the contribution of the Chit scheme to total revenue.
4.7.1.6 Decennial Contribution of Chit Business to the Total Revenue
The growth rate of total revenue and the growth rate in the
contribution of Chit to the total revenue over the decades from 1970-80 to
1990-00 are shown in Table 4.5.
106

Table 4.5
Decennial Contribution of KSFE Chits to the Total Revenue
I Growth Rate ofGrowth Rate in the
i No. Decade Contribution of Chit to theI Total Revenue Total RevenueI
1 1970-80 38.46 76.14i
2 1980-90 20.68 19.64
3 1990-00 36.74 39.34
Source: Computed from Annual Reports, KSFE.
During the decade 1970-80, the growth rate in contribution of Chit
to the total revenue has been impressive (76.14%). This may be due to less
diversification of schemes. After a fall in the contribution during 1980-90, the
contribution again has increased to 39.34 per cent during 1999-00.
Though the advance aspect has been built into the Chitty scheme, the
element of luck existing in it, forces a subscriber to wait for some time to avail
himself of the benefit of getting the ticket prized. The Chit scheme also provides
additional facilities like eligibility for availing of passbook loan and new Chitty
loan. Chitty loan also known as passbook loan has been introduced to help the
subscribers to meet their immediate need before getting the ticket prized. The
KSFE has two such schemes, viz., Passbook loan and New Chitty loan.
4.7.1.7 Passbook Loan (Chitty Loan)
The purpose of passbook loan (original Chitty loan) is to provide
quick loanfacility to non-prized subscribers to meet their urgent needs, on the
security of paid up subscriptions in the Chits. Chit subscribers who have made
up-to-date remittance in unencumbered Chits are eligible for passbook loan.
The passbook of the subscriber is the security for this advance and the ceiling
Qfwhich is based on the amount paid up in the respective Chitty. The rate of
lnterest charged on such loans has been at 15 per cent (monthly compounding)
lSon 11·12·2002.
107

Table 4.6Magnitude of Passbook Loan of KSFE (Rs, Lakhs)
!Loan
Index of Index ofI Growth Growth of No. of Growth Growth ofI Year Outsta-i Rate Loan Accounts Rate No. ofi ding Outstanding AccountsI 1990·91 .04 - - - - -I 1991-92 18 - - - - -;1992-93 33 - - - - -! 1993-94 134 - 100 765 - 100i 1995-95 144 7.5 107 1365 78.4 178
1995-96 213 48.0 159 1616 18.4 2111996-97 340 59.6 254 1940 20.0 2541997-98 526 54.7 393 2600 34.0 3401998-99 620 17.9 463 3014 15.9 3941999-00 714 15.2 533 3547 17.7 4642000-01 1564 119.0 1167 6685 88.5 874
Note: The base year for the index has been taken as 1993-94 mainly due to the negligible loanamount prior to that period.Source: Annual Reports, KSFE.
Table 4.6 reveals that there has been an increase of about 11.67
times in total passbook loan advances outstanding showing an increase from
Rs.134 Lakhs in 1993-94 to Rs.l,564 Lakhs in2000-01. It also shows that
there has been an increase of about 8.7 times in the number of accounts of
passbook loan during the above period. The annual growth rate of loan
amount and the number of accounts are seen to be higher during 2000-01 ( 119
percent, and 88.5 per cent respectively) when compared to the previous years.
This has been due to the comparatively low growth rate of New Chitty loan
with the stringent eligibility norms. (See Table 4.7) But despite the growth
rate in loans outstanding and number of accounts, the contribution of the
passbook loan to the total revenue of the Company also seems negligible and
forms only 0.71 per cent as on 2000-01 (See Table 4.25).
4.7.1.8 New Chitty Loan
During the year 1993-94, the Company launched a new scheme
(New Chitty Loan) of finance up to 50 per cent of Chitty sola to non-prized
108

subscribers. This new scheme was introduced without terminating the original
Chitty loan (Passbook Loan) and hence the name New Chitty Loan. The
subscribers of Chits become eligible for availing themselves of NCL
immediately on the conduct of the first auction. The loan, amount may also be
restricted depending on the duration of Chit. The subscriber can avail himself
ofNeL on all his tickets in a Chit, subject to a maximum of 10 per cent of the
total tickets in the Chit.
Table 4.7 reveals that there has been an increase of about 17.6
times in New Chitty loan advances outstanding showing an increase from
Rs.l,979 Lakhs in 1993-94 to Rs.34,875 Lakhs in 2000-01. It also shows a 9.9
times increase in the number of accounts of NCL for the period mentioned
above. The growth rate of NCL from 1999-00 has not been impressive mainly
due to the introduction of the stringent eligibility norms on account of its high
default rate.
Table 4.7Magnitude of New Chitty Loan of KSFE (Rs. Lakhs)
Index of Growth Index ofLoan Growth rate Growth of No. of rate GrowthYear
Outstanding of Loan Loan Accounts of No. ofOutstanding
Outstanding Accounts1993·94 1979 - 100 7566 - 1001994·95 4119 108.1 208 13791 82.3 1821995·96 5957 44.6 301 18146 31.6 2401996·97 9329 56.6 471 23957 32.0 3171997-98 23374 150.1 1181 48178 101.1 6371998·99 32429 38.7 1639 68370 41.9 9041999-00 31453 -3.0 1589 72901 6.6 964~OOO·Ol 34875 10.9 1762 74855 2.7 989~urce: Annual Reports, KSFE.
There is an impressive growth in the volume of New Chitty Loan.
~IS has been substantiated by the contributions of the scheme (27.15%) to
.~ total revenue of the Company (See Table 4.25)
109

4.7.2 Types Of Loans By KSFE
KSFE with its multifarious objectives has come out with various
types of loans to suit different groups. An attempt has been made to evaluate
the channelisation of funds. Chart 4.2 describes various types of loans
available from KSFE.
Chart 4.2
TYPES OF LOANS BY KSFE
I I I I INew
Passbook Trade HireLoan on
GoldReliable
Chitty Fixed CustomerLOin Loan Loan Purchase Deposit Loan Loan
IEmployment
General HousingH.P Finance
Oriented H.P Schemes
4.7.2.1 Hire Purchase (HP)
Hire Purchase is a system by which something becomes the
property of the person after a number of agreed payments called 'hire-rent'
have been made. With the object of providing advance facilities for
acquisition of consumer durables, the Company offers hire purchase facilities
for owning motor vehicles and home appliances such as television,
refrigerator, two-wheeler, furniture, etc. at varying rates of interest and on
myrepayment plans. The KSFE started the pilot project of its Hire Purchase
scheme from the Head Office in December 1970. The pilot project having
proved a success, KSFE extended the HP Scheme to the branches with the
inclusion of low value domestic utility articles like radio, fan, sewing
machine, etc. For reviving the HP scheme, KSFE has entered into a financial
ne-up with the market leaders of white goods and two wheelers at 14 per cent
l!lterest, (diminishing) with effect from 11-12-2002. The financial tie-up has
)e(n made with the KSFE and the manufacturer. Special feature of the tie-up
!theme is that the Company is entering into contracts with the authorised
110

dealers through the manufacturers for ensuring the genuineness of the
transaction and preventing the misuse of the Company's application forms
entrusted to the dealers. Under this arrangement the dealers have been
empowered to canvass customers, issue application forms, collect the
completed forms back along with surety papers, registration fee, scrutiny fee,
etc., for submitting the same to the nearest branch office of the Company.
Performance details of the scheme are given in Table 4.8.
4.7.2.2 Employment Oriented Hire Purchase Scheme (EPOHPS)
During the year 1987-88 the Company introduced a new Hire
Purchase Scheme in partial fulfilment of its social objective, for generating
employment opportunities to the jobless youth in the State. The scheme
known as the Employment Oriented Hire Purchase Scheme (EPOHPS)
envisaged supplying of tools and equipments under HP Scheme, which has a
thrust in the creation of employment opportunities at a lower rate of interest
(9 per cent flat). Table 4.8 gives the magnitude of Hire Purchase Loan
(General) and the Employment Oriented Hire Purchase Loan during the last 11
years period from 1990-91 to 2000-01.
Table 4.8
Magnitude of Hire Purchase Schemes (Rs, Lakhs)
H P Loan Outstanding EPOHPS Total HP AdvancesYear - (General)
Amount Growth Index ofAmount
Growth IndexAmount
Growth Index ofRate zrowth Rate ofzrowth Rate growth
1990-91 1963 - 100 269 - 100 2232 - 1001991-92 2583 32 132 300 12 112 2883 29 1291992-93 2976 15 152 265 -12 99 3251 13 1461993-94 3451 16 176 195 -26 72 3646 12 1631994-95 3366 -2 171 119 -39 44 3485 -4 1561995-96 3904 16 199 84 -29 31 3988 14 1791996-97 "5052 29 257 69 -18 26 5121 28 2291997-98 5657 12 288 56 -19 21 5713 12 2561998-99 6212 10 316 - - - 6212 9 2781999-00 5325 -14 271 - - - 5325 -14 2392000-01 6615 24 337 - - - 6615 24 296Average Annual 13.8 -18.7 12.3
Source: Annual Reports, KSFE.
111

The above Table depicts an increase of more than 3 times in HP
advances showing an increase from Rs.2,232 Lakhs in 1990-91 to Rs. 6,615
Lakhs in 2000-01. Hire Purchase (General) constitutes a higher share in total
HP advances. The share of H P (General) in the total HP advances was 88 per
cent in 1990-91 and that of EPOHPS was only 12 per cent. The share of
EPOHPS shows a declining trend and formed only 0.98 per cent of the total
HP advances in 1997-98 and thereafter the scheme was terminated due to its
less acceptability. The contribution of the HP schemes to the total revenue of
the Company forms only 4.96 per cent as on 2000-01(See Table 4.25). But the
average annual growth rate shows an impressive increase (24 per cent) in
2000-01, when compared to the previous years.
4.7.2.3 House Finance Schemes
The Company introduced the 'House Modernisation Scheme'
(HMS) under hire purchase financing in the year 1978. This scheme was
intended to provide financial assistance to the middle and low-income groups
for construction involving extension and modifications. KSFE has been
operating two separate schemes under housing, one for extension,
modernisation, etc. styled as house modernisation scheme, and the other for
new constructions, named as New Housing Finance Scheme (NHFS). The
purpose of NHFS introduced in November 1995 is for the purchase of
residential plots and residential houses and for the construction of residential
houses. In 1999, the HMS was merged with New Housing Finance Scheme.
The rate of interest charged was 13.5 per cent (yearly diminishing) for loans
upto Rs.5 Lakhs and 14 per cent for loans above RS.5 Lakhs and upto Rs.I0
Lakhs as on 1l:-12-2002. Table 4.9 shows the magnitude of house finance
scheme of the Company.
112

Table 4.9
Magnitude of House Finance Schemes (Rs. Lakhs)
Year Housing Growth RateIndex
Finance Scheme of Growth
1992-93 190 - 100
1993-94 218 15 115
1994-95 446 105 235
1995-96 853 91 449
1996-97 3452 305 1817
1997-98 3930 14 2068
1998-99 4343 11 2286
1999-00 4129 -5 2173
2000-01 4350 5 2289
AAG 67.63Source: Annual Reports, KSFE
There has been an increase of about 22.9 times in HFS advances
outstanding showing an increase from Rs. ]90 Lakhs in ]992-93 to Rs.4,350
Lakhs in2000-01. The annual growth rate of HFS after 1996-97 seems to be less
impressive. The contribution of the House Finance Schemes forms only 3.3 per
cent to the total revenue of the Company as on 2000-01 (See Table 4.25).
4.7.2.4 Trade Financing Scheme (TFS)
During the year 1992-93, the Company launched a new scheme
called Trade Financing Scheme (TFS) to finance small and medium size
business group including stamp vendors, lottery agents and the like for
supplementing their working capital requirements. The loanee should have been
engaged in a business, the annual sales turnover of which does not exceed
Rs.50 Lakhs. Advance has been restricted to 75 per cent of the working capital
gap. The loan amount has been limited to Rs.10 Lakhs for traders and
businessmen, Rs.1 Lakh for vendors and Rs.lO,OOO for lottery agents. The rate
of interest has been 8.5 per cent (flat) irrespective of the quantum ofloan.
113

However. the contribution of the scheme to the total revenue of the
Company is only 1.1 per cent as on 2000-01 (See Table 4.25). Though its
contribution is negligible. the continuation of the scheme may help to fulfil
the social objective of KSFE. The Table 4.10 gives the magnitude of Trade
Financing Loan.
4.7.2.5 Gold Loan Scheme
This scheme has been intended to provide short-term loan facility
to people who are urgently in need of money. on the security of gold. Gold
loan business. which started during 1989-90 gathered momentum in 1990-91.
Maximum loan amount in this scheme has been limited to Rs.l Lakh per
individual and the period of loan is 12 months maximum. The Table 4.10
gives the magnitude of the gold loan scheme. The contribution of the scheme
to the total revenue of the Company forms only 0.69 per cent as on 2001. (See
Table 4.25)
4.7.2.6 Loan on Fixed Deposits
The 'scheme of loan on Fixed Deposit is intended to provide quick
loan facility to depositors on the basis of their fixed deposits. 75 per cent of the
F.D amount free of any liability can be availed of as loan. This scheme. started
during 1989-90 picked up speed considerably in 1990-91. During the year
1995.96. another new scheme called New Fixed Deposit Loan Scheme was
started to provide short-term loans to government employees. employees of
KSFE and employees of other institutions approved by the Company. The loan
limit is Rs.50.000 or ten times the net salary of the applicant. The interest
chargeable on FD loan is 2 per cent above the rate applicable to the FD on
which such loan is granted. The magnitude of F D Loan. Trade Loan and Gold
Loan are shown in Table 4.10.
114

Table 4.10
Magnitude of F D Loan, Trade Loan and Gold Loan (Rs, Lakhs)
F.D Loan Outstanding T.F.S Loan Outstandina Gold Loan OutstandingIndex
Growth Index of Growth of Growth Index ofYear Amount Rate growth Amount Rate IJU'Owth Amount Rate growth
1990-91 10 - 100 - - - 79 - 100
1991-92 26 160 260 - - - 125 58 158
1992-93 36 38 360 54 - 100 129 3 163
1993-94 85 136 850 III 106 206 144 12 182
1994-95 150 76 1500 303 173 561 212 47 268
1995-96 773 415 7730 819 170 1517 392 85 496
1996-97 1734 124 17340 1616 97 2993 502 28 635
1997-98 3232 86 32320 1791 II 3317 587 17 743
1998-99 6923 114 69230 1839 3 3406 537 -9 680
1999-00 5770 -17 57700 1765 -4 3269 548 2 694
2000-01 4860 -16 48600 1512 -14 2800 2017 268 2553
AAG Il2 68 51Source: Annual Reports, KSFE.
Table 4.10 reveals that there has been an increase of about 486
times in total Fixed Deposit Loan and New Fixed Deposit Loan scheme
showing an increase from Rs.lO Lakhs in 1990-91 to Rs.4860 Lakhs in 2000
01. But the loan outstanding shows a fall in 2000-01 to Rs.4860 from Rs.5770
in 1999-2000 and the annual growth rate becomes negative. The contribution
ofthe scheme to the total revenue of the Company forms 4.2 per cent as on
2001 (See Table 4.25).
Table 4.10 also shows that there was an increase of about 28 times
in Trade Finance Loan, showing an increase from Rs.54 Lakhs in 1992-93 to
Rs. 1,512 Lakhs in 2000-01. The Trade loan outstanding as on 1999-00 and
2000-01 shows a decline as compared with the previous year.
With regard to Gold loan the Table shows that there was an
increase of 25.53 times in total gold loan showing an increase from Rs.79
Lakhs in 1990-91 to Rs.2,017 Lakhs in 2000-01. The scheme showed
tremendous growth in 2000-01 when compared to the earlier years. This has
115

been due to the decline in rate of interest (12 per cent as on 11-12-2002),
system of charging interest on diminishing and quarterly compounding basis
and the interest being calculated only for the exact number of days in pledge.
4.7.2.7 Reliable Customer Loan (RCL)
This is the name for the New Fixed Deposit Loan Scheme started
during the year 1999-2000. The maximum amount of loan is Rs.25,OOO. All
the customers of KSFE, with a good track record, for one year or more are
eligible for the RCL provided they are not defaulters at the time of applying
for the loan. The minimum and maximum period of the loan is 12 months and
48 months respectively. Interest rate is 11 per cent on yearly diminishing
basis. The loan outstanding as on 31-3-2001 stood at Rs. 4,557 Lakhs as
against Rs. 5,770 Lakhs in 31- 3 2000.
4.7.3 Deposit Schemes
The Company is primarily in the business of mobilising savings. Its
efforts have mostly been directed at the households sector and its main
instruments have been conducting of Chits and financing purchases of
household durables through hire purchase schemes. Greater efforts for
mobilisation of savings are necessary to consolidate the gains of the economic
momentum evident in the economy. KSFE raises deposits from public by way
of term deposits, Sugama deposits and deposit of money in trust, in order to
meet its working capital requirement and for hire purchase financing. As
KSFE cannot raise public deposits in excess of the limit prescribed in the
Companies Act, 8 Government guarantee is taken, whenever deposits are to be
raised in excess of the prescribed limit. The growth in Fixed Deposit, Sugama
and Bhadratha schemes have been analysed in this section for the period
1990-91 to 2000-01.
4.7.3.1 Fixed Deposit Scheme
The Government has authorised KSFE as a financial intermediary
10 mobilise as term deposits from the public with Government guarantee for
116

repayment of principal and interest. At present, KSFE accepts fixed deposits
for periods ranging from 1 to 5 years. The rate of interest offered for the
scheme is 8 per cent as on 11-12-2002, with monthly payment of interest.
Fixed Deposit generated from the prize money ofChits and offered as security
towards the future liability of Chits, carry an interest of 8.5 per cent. Loan
facility on F.D has been provided to the depositors, which is equal to 75 per
cent of the deposit. There was an increase of about 37.6 times in total fixed
deposits from public showing an increase from Rs.2,080 Lakhs in 1990-91 to
Rs. 78,230 Lakhs in 2000-01 (See Table 4.11). The comparative higher return
and the higher average annual growth rate make the performance of the
scheme satisfactory for the period under review.
4.7.3.2 Sugama Deposit Scheme
The scheme aims at providing a deposit facility, similar in many
ways to Savings Bank Accounts in banks, but without the Cheque facility. The
scheme envisages periodical remittance of any amount and withdrawal from
the account maintained with the Company. The scheme helps the customers in
the following manner: -
1. The customers can give standing instructions to the Company to transfer
the monthly instalments from the Sugama account towards Chitty, HP,
HMS, etc. on due dates.
2. Interest on Fixed Deposit can be transferred to this account as and when it
becomes due.
3. Any person known to the Company may open an account. Withdrawals
from the account shall be made with the forms or slips supplied by the
Company. Depositors will be provided with 6 per cent interest on the
minimum balance maintained as on 11-12-2002. The Sugama Deposit
Scheme registered an increase of about 21.70 times, from Rs. 457 Lakhs
in 1990-91 to Rs. 9,918 Lakhs in 2000-01 (See Table 4.11). The high
annual average growth of the Sugama deposit scheme and also its better
117

return in comparison with similar deposit schemes of banks make its
performance satisfactory for the period under review.
4.7.3.3 Bhadratha Social Security Scheme
Bhadratha was a social security scheme of the Government of
Kerala operated by KSFE with effect from 1-11-1977. The agency-charges
payable to KSFE was fixed at 5 per cent. The scheme was launched with the
dual purpose of mobilising savings from the public on a very large scale and
providing benefits to the subscribers of the scheme in the form of pension,
lump-sum amount or both.
The Bhadratha social security scheme implemented through KSFE
as per Government Order No. 108177 TD dated 28th September 1977 became
virtually defunct. The government of Kerala, therefore decided to revive the
scheme in order to make it more attractive to the depositors vide GO (MS)
No.24/88/TD dated 2nd Marchl988. The revised scheme also was operated by
the Company as agent of the Government of Kerala on a commission basis.
Deposits were accepted in lump-sum amount of Rs.l 00 and its multiples for a
period of 60 months. The scheme provided facility for premature closure also
after a periodof 3 years from the date of deposit. The deposits got doubled over
a period of 5 years. However the Company discontinued the collection of
deposits under the Bhadratha social security scheme with effect from 1-4-1994
due to the change in the policy decision of the Government of Kerala to wind
up the scheme. The Bhadratha Deposit Scheme showed declining trend from
Rs.4,883 Lakhs in 1990-91 to Rs. 3,341 Lakhs in 1993~94. The account shows
anet credit balance of Rs.l1 ,45, 143 pending reconciliation.
Table 4.11 also reveals a very high average annual growth rate in
the deposits mobilised by KSFE with Fixed Deposit and Sugama at 44 percent.
This rate, it may be noted, is much higher than the average annual growth rate
of the total deposits (19%) by the banks.
118

- -100
Tab
le4
.11
Mag
nit
ud
eo
fF
ixed
Dep
osi
t,S
ug
am
aan
dB
ha
dra
tha
(Rs.
Lak
bs)
Tot
alo
fF.
D
Yea
rF
ixed
Dep
osi
tSu
gam
aD
epo
sit
Bha
drat
haT
ota
lo
fF.
DT
otal
Ban
kan
dSu
gam
aas
(FD
)(S
D)
Sch
eme
(BS
)an
dSu
gam
aD
epo
sit
(TB
D)
per
cen
tag
eo
fB
ank
Dep
osi
tI
23
45
67
FOG
RIG
RSO
GR
IGR
BS
GR
IGR
To
tal
GR
IGR
TB
OG
RIG
RP
erce
nta
ge
1990
-91
2080
-lO
O45
7-
lOO
4883
-lO
O25
37-
lOO
7858
00-
lOO
0.32
1991
-92
3131
5115
171
957
157
5056
410
438
5052
152
9671
0023
123
0.40
1992
-93
4478
4321
570
7-2
155
5208
310
751
8535
204
1211
200
2515
40.
4319
93-9
461
4637
295
1103
5624
133
41-3
668
7249
4028
614
9410
023
190
0.49
1994
-95
9253
5144
513
0819
286
--
-10
561
4641
617
4580
017
222
0.60
1995
-96
1380
949
664
1565
2034
2-
--
1537
446
606
2017
100
1625
70.
7619
96-9
724
842
8011
9420
4531
447
--
-26
887
7510
6023
3540
016
297
1.15
1997
-98
4028
362
1937
3643
7879
7-
--
4392
663
1731
2755
200
1835
11.
5919
98-9
959
639
4828
6756
3155
1232
--
-65
270
4925
7331
5320
014
401
2.07
1999
-00
6713
313
3228
8667
5418
96-
--
7580
016
2988
3861
900
2249
11.
9620
00-0
178
230
1737
6199
1814
2170
--
-88
148
1634
74-
--
-A
AG
4419
So
urc
e1:
An
nu
alR
epo
rts,
KS
FE
.G
R=
Gro
wth
Rat
eI
GR
=In
dex
Gro
wth
Rat
e
So
urc
e2:
Eco
no
mic
Rev
iew
,va
riou
sY
ears
,G
ov
ern
men
to
fK
eral
a,S
tate
Pla
nn
ing
Bo
ard
,T
riva
ndru
m.

4.8 PERFORMANCE EVALUATION OF KSFE
Performance is a multi-dimensional concept. The best indication
that a firm enjoys a competitive advantage would be high performance across
anumber of different performance parameters over a number of years.
The performance of KSFE has been analysed on the basis of the
following parameters:
I. Market Share of KSFE Chit in the formal Chit business in Kerala.
2. Growth in the volume of business over the years.
3. Benefits to the Government of Kerala - the owner of the Company.
4. Profitability and Financial performance
5. Market outreach, productivity per employee and per branch and scheme
wise performance.
6. Recovery performance.
4.8.1 MARKET SHARE
Market share is an important performance measure; especially in
industries in which important advantages can be derived from large size i.e.
economies of scale, and market control. Table 4.12 clearly shows the
dominance of KSFE in Chit business in the formal sector in Kerala.
120

Table 4.12
Market Share of KSFE in Chit Business in Kerala (Rs, Lakhs)
Aggregate Chit Aggregate Market Share of KSFE
Year Turnover and Chit Turnover and Chits in the TotalGrowth Rate in Growth Rate Chit Business in
Kerala in KSFE Kerala. PercentageGrowth Growth
Turnover Rate Turnover Rate1970-71 7836 - 120 - 1.51971-72 13272 69.37 372 210.00 2.81972-73 18708 40.96 576 54.84 3.11973-74 16776 10.33 696 20.83 4.11974-75 17748 5.79 840 20.69 4.71975-76 18117 2.08 996 18.57 5.51976-77 15174 16.24 1092 9.64 7.21977-78 12240 19.34 1236 13.19 10.11978-79 11604 -5.20 1392 12.62 11.91979-80 17436 50.26 1668 19.83 9.61980-81 21384 22.64 1860 11.51 8.71981-82 11112 48.04 2208 18.71 19.91982-83 13932 25.38 2628 19.02 18.91983-84 20940 50.30 3168 20.55 15.11984-85 19656 -6.13 3696 16.67 18.81985-86 27030 37.52 4092 10.71 15.11986-87 34404 27.28 4620 12.90 13.41987-88 36780 6.91 5640 22.08 15.31988-89 38808 5.51 6972 23.62 17.91989-90 38964 0.40 8832 26.68 22.71990-91 39120 0.40 10740 21.60 27.5
! 1991-92 39264 0.37 13056 21.56 33.31992-93 51936 32.27 16344 25.18 31.51993-94 51312 -1.20 22320 36.56 43.5
: 1994-95 60144 17.21 29868 33.82 49.7\1995-96 76524 27.23 39192 31.22 51.2
1996-97 69396 -9.31 51048 30.25 73.6: 1997-98 87444 26.01 71412 39.89 81.7! 1998-99 128472 46.92 89052 24.70 69.3•1999-00 141588 10.21 114828 28.94 81.1: 2000-01 174276 23.09 138524 20.64 79.4:AAG 13.74 29.23Source: Annual Reports, KSFE
121

The market share of KSFE in its infancy remained insignificant up
to 1975-76, and this can be considered as a period of dominance of Private
Chit Funds. But from 1976-77 onwards the share of KSFE Chits shows a
continuously increasing growth rate. The market share of KSFE Chits in the
total Chit turnover in Kerala has made impressive progress from 1993-94 and
from 1995-96 onwards it has been more than 50 per cent and in more recent
years it is nearly 80 per cent. The introduction of the New Chitty Loan
especially enhanced the volume of business and acted as a stimulus to the Chit
business of the Company since 1993-94. It must be pointed out that the above
figures take into account only the turnover from the registered sector (formal).
Hence the huge volume of business prevailing in the private sector and
informal sector indicates the necessity and great potential for further
expansion of KSFE Chits. Figure 4.3 shows the rate of growth of Chit
Turnover in Kerala and in KSFE.
Figure 4.3
The Rate of Growth of Chit Turnover in Kerala vis a vis KSFE
250
200
150ID:
i 100
e50
0j:: CO) liD r-- (I) C; C') liD r--
~.... ....... ...
~... aD
~.., e:p
~0 N . . . N.... aD 0~
aD i-50 ... ... ... r-- r-- aD aD aD aD 8(I)- v.. N
I-Growth raIIeclChit Turnover in K'" -GIvwIh raIIeclChit TUIIIO¥W in KSFE I
The rate of growth of Chit turnover in the Chit Fund industry in the
State shows fluctuations when compared to that of KSFE. It also reveals
higher growth rate for KSFE in the nineties.
122

Figure 4.4 shows the market share of KSFE Chits in the total Chit
business in Kerala.
Figure 4.4
Market Sha re of KSFE
180000
160000
140000
• 120000~0
ooEסס10~ 80000~
60000o40000
20000
01970-71 198Q.ll1 1990-91
Year
• Chit Turnover in Kerala
• Mar1c.et Shareof KSFE in the Chit Turnover in Kerala
Figure 4.4 reveals that the market share of KSFE Chits in the total
Cbit business in Kerala increased from 1.5 per cent in 1970-7) to 8.7 per cent
in 1980-81, to 27.5 per cent in 1990-91 and to 79.4 per cent in 2000-01. Thus
it shows impressive growth of the market share of KSFE Chits in the total
Chit business in the State.
4.8.2 GROWTH IN THE VOLUME OF BUSINESS
Total business includes annual Chilly turnover and outstanding of
other schemes. Table 4.13 shows that, there has been 13.8 times increase in
the growth of bus iness of KSPE showing an increase from Rs.204.80 Crore in
1990-91 to Rs.2.831. 05 Crore in 2000-01. The annual Chilly turnover
constituted the major component in the total business of KSFE. which varied
fromRs.107.39 Crore in 1990-91 to Rs.l ,385 .24 Crore in 2000-0 1 and ranged
from43 per cent to 61 per cent during the per iod.
123

Table 4.13 also reveals that there has been 24.3 times increase in the
total advances by KSFE showing an increase from Rs.23.21 Crore in 1990-91 to
Rs.564.3 Crore in 2000-01. It also shows that the growth of deposits increased
from Rs.74.2 Crore in 1990-91 to 881.5 Crore in 2000-01. The share of Chits in
the total business of the Company formed 48.9 per cent, the share of advances
19.9 per cent and that of deposit came to 31.12 per cent in 2000-01. The credit
deposit ratio of KSFE was the highest (at 89.3 per cent) in the year 1997-98 but
recorded a decline thereafter and formed only 64 per cent as on 2000-01.
The growth in overall business of the Company has been the
highest in the year 1997-98 (55.17 per cent growth over the previous year)
and thereafter the annual growth declined due to the slow growth rates of
advances, deposits and Chit turnover. The decline also has been partly due to
the general economic recession in the state.
124

--IV VI
Tab
le4
.13
Gro
wth
Tre
nd
so
fB
usi
ness
fro
m1
99
0-9
1to
20
00
-01
(Rs,
Lak
hs)
SI19
90-
1991
-19
92-
1993
-19
94-
1995
-19
96-
1997
-98
1998
-99
1999
-00
2000
-01
AA
OIt
ems
9192
9394
9S96
97no
.
1A
nnua
lC
hitt
ytu
rnov
er10
739
1305
116
350
2231
929
867
3919
451
043
7140
789
057
1148
2513
8525
(Sa
lax
12)
(100
)(1
22)
(152
)(2
08)
(278
)(3
65)
(475
)(6
65)
(829
)(1
069)
(129
0)
Gro
wth
Rat
e21
.53
25.2
836
.51
33.8
231
.23
30.2
339
.90
24.7
228
.93
20.6
29.2
8·
Tot
alad
vanc
e(l
oans
of
all
2321
3035
3460
5961
8270
1269
721
688
3922
855
282
5473
656
430
2ty
pes)
(100
)(1
31)
(149
)(2
57)
(356
)(5
47)
(934
)«
16
90
)(2
382)
(235
8)(2
431)
Gro
wth
Rat
e30
.76
14.0
053
.53
70.8
140
.92
-0.9
940
.40
·72
.28
38.7
480
.87
3.09
3T
otal
depo
sits
(FD
+Su
gam
a74
2089
0610
391
1059
010
561
1537
426
887
4394
464
818
7536
288
150
+ot
her
depo
sits
)(1
00)
(120
)(1
40)
(143
)(1
42)
(207
)(3
62)
(592
)(8
74)
(101
6)(1
188)
Gro
wth
Rat
e20
.03
16.6
71.
9274
.89
63.4
447
.50
30.3
0·
-0.2
745
.57
16.2
716
.97
4T
otal
busi
ness
(1+
2+3)
2048
024
992
3020
138
870
4869
867
266
9961
815
4580
2091
5624
4923
2831
05(1
00)
(122
)(1
47)
(190
)(2
38)
(328
)(4
86)
(754
)(1
021)
(119
6)(1
382)
Gro
wth
Rat
e22
.03
20.8
428
.70
25.2
838
.13
48.1
055
.17
35.3
117
.10
15.5
930
.63
-5
Rel
ativ
eS
hare
of
Chi
tto
52.4
52.2
54.1
57.4
61.3
51.3
51.2
46.2
42.6
46.9
48.9
Tot
alB
usin
ess
6C
.DR
atio
31.3
34.1
33.3
56.3
78.3
82.6
80.7
89.3
85.3
72.6
64
Sou
rce:
Ann
ual
Rep
orts
of
KSF
Efo
rv
ano
us
year
s.F
igur
esin
pare
nthe
sis
show
the
inde
xo
fgr
owth

4.8J BenefitsTo The Government
The direct benefits from KSFE to the owner, ie the Government of
Kerala, are in the form of service charges, guarantee commission and
registration and filing fees. In the case of direct benefits to the Government,
an increase of 21.1 times over the above period (1990-91 to 2000-01) is
noteworthy. The indirect benefits to the Government are in the form of Chitty
security deposit with the Treasury and Savings Bank Account and other
deposits with the Treasury. It shows a 23.9 times increase in the benefits from
Rs.I,225 Lakhs in 1990-91 to Rs.29,258 Lakhs in 2000-01. Table 4.14 also
reveals that there has been 23.7 times increase in the total benefits accruing to
the Government of Kerala from Rs.l,319 Lakhs in 1990-91 to Rs.31,249
Lakhs in 2000-01. Besides, the Board of Directors has announced a Dividend
of20 per cent for the year 2000-2001.
Table 4.14Benefits to the Government (Rs, Lakhs)
~90- 91- 92- 93- 94- 95- 96- 97- 98- 99- 2000-
~irect
!Benefits91 92 93 94 95 96 97 98 99 00 01
11. Service Charges 49 91 119 152 196 236 302 389 493 588 803
~. Guarantee26 38 52 72 106 154 269 439 651 758 884I Commission
~. Registration and19 25 32 45 58 91 130 207 212 283 304Filing Fee
~. Total (A) 94 154 203 269 360 481 701 1035 1355 1629 1991
~direct BenefitsI
!1. Chitty Security1187 1464 1797 2344 3083 4058 5397 7608 9482 11856 14743
! Deposit
~. Savings Bank38 25 66 86 235 144 159 117 279 796 826: Account
p. Other deposits102 1150 7528 13689: with treasury - - - - - - -
I~018C~. Total (B) 1225 1489 1863 2430 3318 4202 5556 7827 10911 29258
~OTAL(A+B) 1319 1643 2066 2699 3678 4683 6257 8868 1226t~1809 31249
Source: Annual Reports, KSFE
126

Figure 4.5
_ to the government (As. La_I
35000
30000
.. 25000&:...~e 20000
=.. 15000l:..III
10000
5000
0~ '" '" "3. on <0 e-, <X> '" 0 ~
'" '" 'l' '" '" '" '" ~ :i: ~:ll,
'" et; ob 3l,
~ '" ...'" '" '" '" '" '" '" '"Year
I .bliNd s..Iib .....-The Figure 4.5 reveals that both the direct and indirect benefits
offered by the Company to the Government is continuously increasing for the
period under revi ew. But the increase in the indirect benefit is much greater
when compared to the increase in direct benefit generated by the Company.
4.U Profitability
The trends in income and expenditure of the Company, working
results and its profitabil ity are shown in the following Tables 4.15 and 4.16
respectively. The pursuit of profitability has been seen as a means of
stimulating managerial and techni cal effi ciency. Further the net contribution
that KSFE make s to the Government depends. ent irely on its surplus. The
127

annual growth rate of income, expenditure and hence profit show fluctuations
for the period 1990-91 to 2000-01.
As shown in Table 4.15, the major sources of income of the
Company in the order of its contribution from 1995 to 2001 are interest
receipts, foreman's commission and finance charges. But the major sources of
income of the Company from 1990 to 1995 were foreman's commission
followed by interest receipts and finance charges. The other sources of income
are the profit from trading accounts, profit on sale of assets, agricultural
income, rent and 'other income'. The 'other income' ofthe Company includes
dividend income on statutory tickets, profit on substituted tickets, writing and
scrutiny fee, discount from suppliers and miscellaneous income.
The major items of expenditure of KSFE in order of its magnitude
are interest and finance charges, salary expenses, administration and other
expenses. The above trend in the pattern of expenditure has been shown from
1995 to 2001. But for the period from 1990 to 1994, the major item of
expenditure was on salary, followed by interest and finance charges and
administration and other expenses.
128

..... ~
---
......-
-----
---
---
----
....,...--
-.._-
----
__
__
__
__
__
__
__
__
..._
_•
__
__
a_
_
ITE
MS
I1
99
0·9
11
99
1-9
21
99
2-9
3I
19
93
-94
11
99
4-9
5I
19
95
-96
T1
99
6-9
71
19
97
·98
I1
99
8-9
91
19
99
-00
12
00
0-0
11.
Inco
me
For
eman
'sC
omm
issi
on46
9.4
573.
171
5.1
946.
212
77.6
1677
.821
78.3
3060
.439
45.8
4835
.654
10.3
(45
.9)
(41.
8)(3
8.S
)(3
7.4)
(36.
5)(3
5.9)
(33.
0)(3
1.0)
(28.
6)(2
8.4)
(26.
4)
Fin
ance
Cha
rges
223.
833
2.6
475.
657
3.9
678.
668
3.8
837.
483
4.4
973.
510
43.5
1017
.1(2
1.9)
(24.
3)(2
5.6)
(22.
7)(1
9.4)
(14.
6)(1
2.7)
(8.4
)(7
.0)
(6.1
)(4
.9)
Inte
rest
Rec
eipt
s21
3.3
320.
847
1.02
747.
212
59.9
1950
.331
24.1
5419
.082
56.8
1044
2.6
1278
9.8
(20.
9)(2
3.4)
(25.
4)(2
9.5)
(36)
(41.
7)(4
7.4)
(54.
9)(5
9.8)
(61.
4)(6
2.4)
Pro
fit
from
trad
ing
Acc
ount
s1.
713
.915
.514
.80
9.6
8.9
1.17
-(.
124
)(.
75)
(.61
)(.
42)
£.21
>U
34
)L
OI1
).
·.
Pro
fit
onsa
leo
fas
sets
0.02
70.
032
0.43
0.05
80.
051
0.05
10.
190.
514.
5(,
0026
)(.
002)
(.02
3)(,
002)
(.00
14)
COO
1>(,
0000
6)(0
05
)(0
33
)-
-A
gric
ultu
ral
inco
me
0.03
50.
039
0.05
70.
0023
0.02
50.
033
0.02
80.
040.
005
(,00
34)
(,00
3)(,
003
)(,
0000
9)(,
0007
>(,
0007
)(,
0004
)C
OO
04)
.(,0
0004
)-
.
Ren
t4.
44.
55.
25.
45.
44.
64.
74.
43.
7(,
43)
(.33
)(,
28)
(.21
)(.
15)
(,09
)(,
07)
(.04
)(,
03)
·-
Oth
erIn
com
e11
1.5
138.
117
5.9
242.
426
7.6
353.
044
0.9
556.
562
6.4
684.
712
73.9
00
.9)
00
.1)
(9.5
)(9
.6)
(7.6
)(7
.5)
(6.7
)(5
.6)
(4.5
)(4
)(6
.2)
To
tal
Inco
me
lA)
1022
1371
1857
2531
3504
4679
6595
9876
1381
017
006
2049
112.
Ex
oen
dit
ure
Sta
ffE
xpen
ses
490.
260
6.2
835.
399
6.4
1261
.914
88.9
1903
.125
60.9
3198
.645
51.3
4808
.7(5
2.1)
(46.
2)(4
6.2)
(41.
1)(3
9.5)
(35.
0)0
1.0
)(2
6.9)
(23.
9)(2
8.1)
(26.
5)
Adm
inis
trat
ive
and
othe
rex
pens
es15
2.04
230.
730
3.9
380.
647
5.3
598.
377
3.02
1037
.313
00.7
1579
.817
16.7
(l6
.2)
(l7
.6)
(l6
.8)
(l5
.7)
(14.
9)(1
4.1)
(12.
6)(1
0.9)
(9.7
)(9
.7)
(9.5
)
Pro
mot
iona
lex
pens
es20
.834
.836
.861
.966
.997
.812
5.9
215.
919
3.1
303.
144
3.9
(2.2
)(2
.6)
(2.0
)(2
.6)
(2.1
>(2
.3)
(2.n
(2.3
)0
.4)
(I.9
)(2
.4)
Inte
rest
and
Fin
ance
Cha
rges
268.
643
1.4
579.
487
6.7
1216
.716
98.9
3037
.252
32.8
8232
.792
16.3
9647
.4(2
8.5)
(32.
8)(3
2.0)
(36.
2)(3
8.0)
(40)
(49.
5)(5
5.0)
(61.
4)(5
6.9)
(53.
1)
Dep
reci
atio
n9.
210
.212
.817
.336
.840
.843
.863
.975
.759
.685
.3(,
98)
(.93
)(.
71)
(.71
)(1
.2)
(,96
)l.
71)
(,67
)(.
56)
(.37
)(.
47)
Los
son
sale
of
asse
ts0.
0007
0.00
60.
017
0.00
050.
036
0.32
(.00
007)
(.00
05)
.(.
0007
)-
(.00
001)
-(.
0003
)(.
002)
·-
Pro
visi
ons
for
bad
and
doub
tful
debt
s40
.090
.014
0.0
330.
025
0.0
400.
040
0.0
500.
014
50.0
--
(2.2
)(3
.7)
(4.4
)(7
.8)
(4.1
)4.
2(3
)(3
.1)
(8)
rIo
tal
Eso
end
itu
re(8
)94
013
1318
0824
2331
9842
5561
3395
1013
400
1621
318
153
Pro
fit
(or
thev
ear
lA-B
)82
5849
108
306
424
462
365
409
793
2338
Sour
ce:
Ann
ualR
epor
ts,K
SFE
Figu
res
inpa
rent
hesi
ssh
owpe
rcen
tage
ofe
ach
cate
gory
toth
eto
tal.

Figure 4..6
Income and Expenditure of KSFE from 1991 to 2001
25000 ...-------------------------,
i 20000+------------------~~A.
1! 15000 +------------------::.,p.:.....-----Ii'a! 10000+------------...,.~---___If5OOO~-~~-___I
o1990- 1991- 1992- 1913- 1994- 1995- 1996- 1997- 1-. 1991- 2000
fl U U M " M ~ • • • ~
YearI-+-TobIIlnc:ome ---ToIaI ExpendibRe TaIBlI Profit I
Table 4.16 above shows fluctuations on profit. This has been
mainly due to unscientific provision for doubtful debts and inability to make
an appropriate provision for taxation due to delay in the finalisation and
auditing of accounts which has been leading to fines and penalties. Income
Tax and interest tax assessments are completed only up to assessment year
1998-99 as on 11-10-2002. The expense ratio shows that only a small margin
has been left after meeting the expenses (See Item 6 of Table 4.16). However,
the position has improved in the year 2000-01.
The percentage of expense on staff to total income has been falling
continuously from 1990-91 to 2000-0 I except for the year 1999-00. The
percentage of administrative expenses to total revenue also has shown a
declining trend, both of which can be considered as good indication (See Item
8 of Table 4.16).
The percentage of interest and finance charges to the total income
shows an increasing trend over the years except in 1999-00. Since the equity
capital is low compared to the borrowed capital, the major portionof total revenue
hasto be paid as interest and finance charges (See Item10of Table 4.16).
130

.... w -
Tab
le4
.16
Wo
rkin
gR
esu
lts
at
aG
lan
ce
(Rs.
Lak
hs)
ITE
MS
1990
-91
1991
-92
1992
-93
1993
-94
1994
-95
1995
-96
1996
-97
1997
-98
1998
-99
99-0
0~000-01
AA
G
1.T
otal
Inco
me
1022
1371
1857
2531
3504
4679
6595
9876
1381
017
006
2049
1
Gro
wth
Rat
e-
34.1
535
.45
36.3
038
.44
33.5
340
.95
49.7
539
.83
23.1
420
.49
35.2
0
Inde
x10
013
418
224
834
345
864
596
613
5116
6420
05
2.T
otal
Exp
endi
ture
940
1313
1808
2423
3198
4255
6133
9510
1340
016
213
1815
3
Gro
wth
Rat
e-
39.6
837
.70
34.0
2.
31.9
933
.05
44.1
455
.06
40.9
020
.99
11.9
734
.9S
,In
dex
100
140
192
258
340
453
652
1012
1426
1725
1931
3.P
rofi
tB
efor
eT
ax82
5849
108
306
424
462
365
409
793
2338
Gro
wth
Rat
e-
-29.
3-1
5.5
120.
418
3.38
.68.
9-2
0.9
12.0
193
.919
4.83
58.5
9
4.P
rovi
sion
for
Tax
atio
n38
·30
4610
220
541
535
525
431
768
815
27
5.P
rofi
tA
fter
Tax
4428
35
101
910
7II
I92
105
811
6.T
otal
Exp
ense
sto
91.9
895
.77
97.3
95.7
391
.290
.94
92.9
96.5
9795
.388
.6T
otal
Rev
enue
(Per
cent
age)
7.S
taff
Exp
ense
sto
Tot
alR
even
ue47
.97
44.2
244
.939
.36
36.0
31.8
228
.825
.823
.15
26.1
23.5
(Per
cent
age)
8.A
dmin
istr
ativ
eE
xpen
ses
toT
R14
.88
16.8
316
.315
.04
13.5
12.8
11.7
9.63
9.31
9.28
8.4
(Per
cent
age)
9.S
taff
Exp
ense
san
dA
dmin
istr
ativ
e62
.961
.161
.254
.449
.544
.640
.535
.432
.535
.431
.9E
xpen
ses
toT
R(P
erce
ntag
e)10
.Int
eres
tan
dF
inan
ceC
harg
es26
.28
31.4
631
.234
.64
34.7
36.3
146
.052
.659
.77
54.2
47.1
toT
otal
Rev
enue
(Per
cent
age)
Sou
rce:
Ann
ual
Rep
orts
,K
SFE

Figure 4.7
Composition of Total Income and Expenditure of KSFE for March 2001.
...,
Total Intome of KSFE for the yureaded March 2001
11FOfeman'tl Commission • Ftnaoce ChargesCInterest C OtherIncome
Total~ of KSFE for the ydr
eadedManh 2001
. irMrestInd rlW'lCe Qwge&.............DAmEtrative and Other EJpen$es
DProInoNIlII E:JpenRs
.88<1 Dd:lIs WrIDen off
.PrO'IIiIion fore.d end DoI.tItfIJ 0ebCs
.0epnK:iIICi0n
The major share of the income of KSFE as on March 200 I is in the
form of interest income (62.4 %) and as foreman' s commission (26.6 %)_
Tbese two items constituted 89 per cent of the total income of KSFE. The
finance charges (6.4 %) and 'other income ' (4.96 %) are the other components
cfthe total income of KSFE.
The major items of expenditure of the Company as on March 2001
are interest and finance charges (53. )%) on Fixed Deposits and Suguma,
Guarantee Commission, Staff expenses (26.5%), Administration expenses
(9.6%), Provision for bad and doubtful debts (7.98%), Promotional expenses
(1. 4%), Depreciation expenses (0.47%) and bad debt written off (0.05%).
132

4.8.5 Financial Performance Ratio
Financial performance ratios can analyse the financial health and
prosperity of the Company. It can also offer important clues about the
strategies that firms are pursuing, and so it can be an important tool for
analysing the strategies of competitors 9.
4.8.5.1 Return on Capital Employed
Capital employed represents the mean of the opening and closing
balance of the paid up capital, reserves and surplus and borrowing. Operating profit
represents profit after taxation. Table 4.17 shows the return on capital employed
Table 4.17
Return on Capital Employed (Rs, Lakhs)
I Year Capital Employed Operating Profit RatioII 1990-91 2006 44.02 2.2I
!1991-92 2919 27.82 .95
I 1992-93 4075 2.94 .07I
1993-94 5569 5.43 .09
1994-95 7906 101.05 1.28
1995-96 11816 9.30 .08
1996-97 19708 106.63 .54
1997-98 32877 111.35 .34
1998-99 50183 91.75 .18
1999-00 63505 105.43 .17
2000- 01 72745 811.04 1.1
Source: Computed from Annual Reports, KSFE.
The return on capital employed has been extremely low. In many
years it is even less than one per cent.
133

4.8.5.2 Return on Net Worth
Table 4.18 below shows the Return on net worth.
Table 4.18
Return on net worth (Rs, Lakhs)
I Year Net Worth· Operating Profit Ratio
1990-91 285 44.02 15.4
! 1991-92 319 27.82 8.7I
I 1992-93 325 2.94 .90I
i
! 1993-94 330 5.43 1.65
I 1994-95 383 101.05 26.4I
II 1995-96 545 9.30 1.71II
! 1996-97 596 106.63 17.9
i 1997-98 707 111.35 15.7i,i 1998-99 726 91.74 12.6:I
I 1999-00 758 105.4 13.9
2000-01 1503 811.04 53.9
• Net worth represents the paid up capital and reserves and surplusSource: Annual Reports, KSFE
The return on net worth reaches the highest level of 53.9 in 2000
01 due to large increase in the net income in that year. The ratio shows a
fluctuating trend over the period from 1990-91 to 2000-0 I, in some years it
has dropped to even less than one per cent. This is mainly because of
fluctuations in operating profit.
4.8.5.3 Current Ratio
Current ratio enables to view the liquidity position and the
Company's ability to meet current obligations.
134

Table 4.19
Current Ratio
Current AssetsCurrent
Year Liabilities Ratio(Rs. Lakhs)
(Rs. Lakhs)
1990-91 12261.90 9887.76 1.24
1991-92 15124.71 11809.73 1.28
1992-93 19142.71 14536.18 1.31
1993-94 25639.59 19423.60 1.32
1994-95 35038.02 25883.37 1.35
1995-96 47190.12 33246.84 1.41
1996-97 67784.34 42894.60 1.58
1997-98 100940.74 60724.64 1.66
1998-99 139405.74 80131.20 1.73
1999-2000 169370.94 102984.39 1.64
2000-2001 214051.21 136088.72 1.57
Source: Annual Reports, KSFE
A study of the current assets and current liabilities shows that
current ratio of KSFE has been satisfactory over the years.
4.8.5.4 Net Worth to Total Liabilities
Table 4.20 shows that there has been steady increase in the
liabilities of the Company which has made the ratio of net worth to total
liabilities precariously low. Since the total liabilities of the Company are
increasing, it necessitates an enhancement of net worth of the Company.
135

Table 4.20
Net-worth to Total Liabilities (Rs, Lakhs)
Year Total Liabilities" Net-worth Percentage
1990-91 12089.96 285 2.36
1991-92 14949.78 319 2.13
1992-93 19013.76 325 1.71
1993-94 25515.31 330 1.29
1994-95 34936.98 383 1.10
1995-96 46925.78 545 1.16
1996-97 67504.61 596 0.88
1997-98 100564.68 707 0.70
1998-99 139223.94 726 0.52
1999-00 169417.04 758 0.45
2000-01 214388 1503 0.70
• Total Liabilities includepaid up capital. reservesand surplus, borrowings (unsecured loanand fixed deposit from publicguaranteed by Government of'Kerala), trade loansandother current liabilities
Source: Annual Reports. KSFE
4.8.5.5 FUNDS MANAGEMENT
Funds raised by KSFE include annual Chit turnover and total deposits
mobilised. Table 4.21 shows that the volume of total funds mobilised
increased continuously from 1990-91 to 2000-01. Table 4.21 also indicates
that during the period 2000-01. KSFE has deployed 81.6 per cent of the funds
raised by it. The major items of uses of funds are the amount recoverable from
prized subscribers and the total advances made by the Company. Funds
deployed represents the percentage uses of funds to the total funds mobilised.
The funds management has generally been improving over the years. It rose
steadily from 55.2 per cent in 1990-91 to nearly 82 per cent in 2000-01.
136

-w ...,J
Tab
le4.
21
Fun
dsM
obil
ised
byK
SFE
and
the
Pat
tern
of
Dep
loym
ent
(Rs.
Lak
hs)
AA
GY
ear
1990
-91
1991
-92
1992
-93
1993
-94
1994
-95
1995
-96
1996
-97
1997
-98
1998
-99
1999
-00
2000
-01
Tot
alF
unds
Mob
ilis
ed18
159
2195
726
741
3290
240
428
5456
877
930
1153
5115
3875
1901
8722
6675
Gro
wth
Rat
e-
20.9
221
:79
23.0
422
.87
34.9
842
.81
48.0
233
.40
23.6
019
.19
29.0
6
Tot
alF
unds
Dep
loye
d10
021
1317
215
961
4546
830
391
4156
759
560
9432
612
7880
1532
8818
4953
Gro
wth
Rat
e-
31.4
421
.17
184.
87-3
3.16
36.7
743
.29
58.3
735
.57
19.8
720
.66
41.8
9
Fun
dsD
eplo
yed
as55
.260
59.7
138.
275
.17
76.1
776
.42
81.7
783
.11
80.6
281
.6pe
rcen
tage
of
Fun
dsM
obil
ised
Sou
rce:
Com
pute
dfr
omA
nnua
lR
epor
ts,
KSF
E

4.8.6.1 Staff Productivity
The KSFE as a Miscellaneous Non-Banking Finance Company has
to attach great importance to the area of human resource development. In fact,
the quality of its human resources is the biggest asset for any service industry.
Hence human resource development and management require utmost
importance. The KSFE has a staff-strength of3,159 as on 2001. The Company
has an established mechanism for imparting training and development for its
employees. Table 4.22 gives the position of employees in KSFE for the period
1990·2001.
Table 4.22
Particulars of KSFE EmployeesI Number of Subordinate Part- Total Staff:YEAR AssistantsI Officers Staff Time Strength
11990 280 (22.3) 717 (57.2) 161 (12.8) 95 (7.7) 1253 (100)
; 1991 306(21.7) 842(59.6) 159(11.3) 105(7.4) 1412 (100)
; 1992 340(21.9) 944(60.7) 154(9.9) 116(7.5) 1554 (100)
. 1993 382(23.4) 966(59.1) 153(9.4) 133(8.1 ) 1634 (100)I
,
1994 435(26.6) 901(55.2) 151(9.3) 146(8.9) 1633 (100)
, 1995 491 (26.5) 872 (47.0) 334 (18.0) 158 (8.5) 1855 (100),I
I 1996 524(25.9) 952(47.1) 379(18.8) 166(8.2) 2021 (100)
i 1997 NA NA NA NA 2105 (100)I
I 1998 651(24.6) 1401(53) 415(15.7) 177(6.7) 2644 (100)I
: 1999 737(23.9) 1741(56.5) 400(13) 204(6.6) 3082 (100)
i 2000 892 (28) 1820(57.3) 252 (7.9) 215 (6.8) 3179 (100),
I 2001 886(28.1 ) 1807(57.2) 251(7.94) 215(6.81) 3159(100)
Source: Annual Reports, KSFE
Figures in parenthesis show the percentage of each category of
employees to the total staff strength.
138

More than 57 per cent of the employees are in the category of
Assistants. Manpower planning and consequent improvement in their
efficiency deserve special attention for quality service and speedy operation
ofthe Company. While there has been increase in officers' category, there has
been decline in the number of subordinate staff and also part-time employees.
This can be viewed as a good sign for a service sector industry.
The performance of the employees has been evaluated on the basis of
their productivity. The productivity has been calculated by taking into account the
total business and the total staff expenses. The average business per employee as
well as average business per Rupee of staff expense shows an increasing trend
from 1990-91 to 2000-01. At the same time the average staff expenses per
employee has also been mounting. The details are given in Table 4.23.
It is also seen from Table 4.23 that though the index of staff
expenses shows an increasing trend for the above-mentioned period, the index
ofstaff productivity has not been impressive for the period. The increase in
the index of staff productivity in 2000-01 can be considered as a good sign to
the Company.
139

.... ~
Ta
ble
4.2
3
Sta
ffP
rod
uct
ivit
yo
fK
SF
E-1
99
0-2
00
1
Par
amet
ers
1990
-91
1991
-92
1992
-93
1993
-94
1994
-95
1995
-96
1996
-97
1997
-98
1998
-99
1999
-200
020
00-0
1
1.T
otal
No.
of
Em
ploy
ees
1412
1554
1634
1633
1855
2021
2105
2644
3120
3179
3159
2.T
otal
No.
of
Bra
nche
s10
612
013
715
015
917
318
019
820
320
422
5
3.A
vera
geN
o.o
fE
mpl
oyee
spe
r13
.313
11.9
10.9
11.7
11.7
11.7
13.4
15.4
14.1
214
.04
bran
ch
4.T
otal
Sta
ffE
xpen
ses
(Lak
hs)
490
606
835
996
1262
1489
1903
2496
3501
4551
4808
5.A
vera
geS
taff
Exp
ense
s.3
5.3
9.5
1.6
1.6
8.7
4.9
0.9
41.
121.
431.
52'R
ow
4di
vide
dby
Row
1)
6.T
otal
Bus
ines
s(L
akhs
)20
480
2499
230
201
3887
048
698
6726
699
618
1545
8020
9150
2449
2328
3105
7.A
vera
geB
usin
ess
per
empl
oyee
14.5
16.1
18.5
23.8
26.3
33.3
47.3
58.5
6777
.04
89.6
(Row
6di
vide
dby
Row
1)
8.A
vera
geB
usin
ess
per
Re.
of
staf
fex
pens
e•
41.4
41.3
36.3
39.0
38.7
45.0
52.6
62.2
59.8
53.9
58.9
(Ro
w7
divi
ded
byR
ow5)
9.In
dex
of
Sta
ffP
rodu
ctiv
ity
**10
099
.587
.794
.293
.510
8.7
127.
115
0.2
144.
413
0.2
142.
3-
10.I
ndex
of
Sta
ffE
xpen
ses
**.
100
111.
414
5.7
174.
319
4.3
211.
425
7.1
268.
632
040
8.5
434.
3
• •• •••
Ave
rage
busi
ness
per
Re.
of
staf
fex
pens
ere
pres
ents
the
rati
oo
fav
erag
ebu
sine
sspe
rem
ploy
ee(R
ow7)
and
the
aver
age
staf
fex
pens
epe
rem
ploy
ee(R
ow5)
ie.
Row
7di
vide
dby
Row
5.
Inde
xo
fst
aff
prod
ucti
vity
has
been
calc
ulat
edfr
omR
ow8
ie.,
aver
age
busi
ness
per
Re.
of
staf
fex
pens
e.
Inde
xo
fst
aff
expe
nses
has
been
calc
ulat
edfr
omR
ow5
ie.,
aver
age
staf
fex
pens
e.

4.8.6.2 Branch Productivity
Net income per branch and total business per branch emerges as the
principal variables for branch productivity. Table 4.24 below gives the level
of branch productivity and the business per branch. The branch productivity
(ie., income per branch) has shown impressive growth over the years. But in
more recent years, the rate of growth seems to have fallen. So also the
business per branch shows a similar growth trend.
Table 4.24
Branch Productivity
i Total Income Number ofI Year
and Growth Branches and Branch Total Business BusinessRate
Growth RateProductivity (Rs. Lakhs) per Branch
i (Rs..Lakhs)
I Total Growth Number Growth Branch Growth Total GrowthBusiness
GrowthI Income rate of rate Productivity rate Business rate
per rateBranches Branch
11990-91 1022 - 106 - 10 - 20480 . 193.2 -[1991-92 1371 34.1 120 13.2 11 10.0 24992 22.0 208.3 7.8I
1992-93 1857 35.4 137 14.2 14 27.3 30201 20.8 224.8 8.0
1993-94 2531 36.3 150 9.5 17 21.4 38870 28.7 259.1 15.3
1994-95 3504 38.4 159 6.0 22 29.4 48698 25.3 306.3 18.2
11995-96 4679 33.5 173 8.8 27 22.7 67266 38.1 388.8 27.0,
1996-97 6595 40.9 180 4.0 36 33.3 99618 48.1 553.4 42.3
1997-98 9876 49.7 198 10.0 50 38.9 154580 55.2 780.7 41.1
i1998-99 13810 39.8 203 2.5 68 36.0 209156 35.3 1030.3 32.0
11999-00 17006 23.1 204 0.5 83 22.1 244923 17.1 1200.6 16.5
12000-0 I 20491 20.5 225 10.3 91.1 9.8 283105 15.6 1258.2 4.8
I AAG 35.2 7.9 25.1 30.6 21.3
Source: Annual Reports of KSFE for vanous years.
Though the magnitude of business per branch has been improving,
its annual growth rate shows a declining trend after 1997-98.
141

4.8.6.3 Distribution of Total Revenue Among Schemes
The total revenue of KSFE includes contribution from Chits and
allied products, income from loan schemes, interest income from other
sources and income from other sources. Table 4.25 gives the break-up of the
contribution of various schemes.
Table 4.25 shows that the main contributor to the revenue has been
Chit and allied schemes. It has ranged from 49.4 per cent in 1990-91 to 62.2
per cent in 1999-2000 and 59.46 per cent in 2000-01. This noticeable
contribution of Chit and allied products has been partly due to the increase in
the contribution of NCL to the total revenue. While the contribution of Chitty
and interest income (especially interest from defaults) shows an increasing
trend, the contribution of loan schemes to the total revenue of the Company
declined for the period mentioned above. The biggest drop in the contribution
to the total revenue is shown by HP scheme for the period under review from
22.3 per cent in 1990-91 to 4.96 per cent in 2000-01. The contribution ofloan
schemes, other than Chitty loan is not significant and forms only 14.4 per cent
as of 2000-01, and that of income from interest is 25.14 per cent as of 2000
01. The contribution from schemes like House Finance Loan, Trade Loan,
Fixed Deposit Loan and even Gold Loan are nominal. The table also shows a
drop in the revenue from other sources from 7.07 per cent to 1.1 per cent.
142

-~ w
Tab
le4
.25
Dis
trib
uti
on
of
To
tal
Rev
enu
eam
on
gS
chem
es(R
s.L
ak
hs)
1990
-91
1993
-94
1996
-97
1999
-200
020
00-0
1N
oP
rod
uct
/Sch
eme
Am
ount
Per
cen
-P
erce
n-A
mou
ntP
erce
n-
Per
cen-
Per
cen-
taR
eA
mou
ntta
aeta
ge
Am
ount
taR
eA
mou
ntta
ge
1C
hitt
y&
All
ied
Pro
du
cts
AC
hitt
y4
96
49.4
1056
42
.09
2433
36.9
353
4431
.42
6473
31
.6
BC
hitt
yL
oan
-18
.72
57.8
711
1.6
514
5.7
1
CN
CL
-.
355.
5411
9118
.151
2930
.16
5564
27.1
5
TO
TA
L49
649
.412
0948
.236
815
5.9
1058
462
.212
182
59
.46
2O
ther
Pro
du
cts
AH
P22
422
.357
422
.88
837
12.7
010
446.
1410
714
.96
BG
old
Lo
an7
.70
311.
2469
1.05
99.5
814
2.6
9
CF
DL
1.0
99
.36
57.8
712
0.7
112
7.6
1
DT
L-
11.4
415
72.
3825
71.
5122
61.
1
EH
FL
-20
.80
701.
0660
.35
61.3
0
FN
HF
L-
-20
23.
0749
42.
9060
63
.0
GN
FD
L-
-15
52.
3575
84.
4673
63
.59
HR
CL
--
--
--
--
30.1
5
TO
TA
L23
22
3.1
064
525
.715
4723
.528
3216
.729
6914
.40
3In
tere
stfr
omo
ther
So
urc
es
AD
epo
sit
127
12.7
304
12.1
262
29.
4418
0810
.63
3021
14..
7
BD
efau
lt77
7.7
21
08.
3753
08.
0415
959.
3821
0210
.3
CO
ther
s1
.10
9.3
622
.33
12.0
729
.14
TO
TA
L20
520
.452
320
.811
7417
.834
1520
.10
5152
25.1
44
Inco
me
from
oth
erS
ourc
es71
7.07
132
5.26
186
2.8
176
1.03
211
1.1
5T
ota
lR
even
ue
1004
100
2509
100
6588
100
1700
710
020
514
100
So
urc
e:C
om
pu
ted
from
the
Off
ice
Fil
es,
Hea
d-O
ffic
e,K
SF
E.

4.8.7 Market Outreach
The parameters selected for measuring the Company's outreach are
the number of branches, number of rural branches, type of financial services
offered, the number of subscribers served, total value of loans extended and
the total value of deposits mobilised.
Starting with 3 branches in 1970, KSFE has gradually spread its
business throughout the state of Kerala with its 225 branches as on 31-3-200 l.
But the number of branches in the rural areas has been limited which highlights
the necessity and scope for opening new branches in those areas. Data shows
that a newly opened branch is likely to attain break-even level once it floats
Chit business of Rs.12 Lakhs along with other schemes. The Company's past
experience reveals that any branch with fairly good potential can attain a Chitty
sala ofRs.12 Lakhs within two years of commencement of the branch 10.
Starting with Chit scheme, KSFE has been undertaking
diversification of schemes all through its period of growth. There has been a
12.9 times increase in the volume of Chit business, (from 1990-91 to 2000-01)
which has been the main financial service offered by it (See Table 4.2). The
share of KSFE in the total Chit business in the state has been 79.4 per cent.
The number of Chit subscribers associated with the Company exceeds 7
Lakhs. Besides, the Company offers 12 other schemes to the public so that
they can meet their various financial needs in one institution.
The value of deposits mobilised and the loan extended is also
an indicator of the outreach of the Company. The value of deposits mobilised
through Fixed Deposit and Sugama has increased from Rs.7,420 Lakhs in
1990-91 to Rs. 88,150 Lakhs in 2000-01. The loan extended shows an increase
from Rs. 2,321 Lakhs in 1990-91 to Rs.56,430 Lakhs in 2000-01 and can be
considered as an index of market outreach. The type of financial services
offered by the Company has been meant to cater to the requirements of
different income as well as occupation categories.
144

4.8.8.1 Default Rate And Revenue Recovery.
Default is common in Chits and other loan schemes and it is
possible to keep it to the minimum through sustained efforts. The interest
charged on default is a source of revenue to the Chit Fund Company 11. But
the fact that the default rate is high on all schemes of KSFE must be a matter
ofgreat concern. As depicted in Table 4.26, the 20 per cent default in New
Chitty Loan as on 31-3-2000 reveals a serious problem to the Company. At the
same time, the decline in the default rate for the above scheme as on 31-3
2001 (17 %) is a positive sign. This has been due to the changes in eligibility
norms for availing of NCL, which made the norms more stringent to avoid
misuse of the scheme. Non-prized subscribers of the Chit are eligible for NCL
upto 50 per cent of the sa/a, provided they had remitted 10 per cent of the
instalments promptly.
The default rate of HP scheme fluctuates over the period under
review and forms 16 per cent in 1999-2000, but shows a decline to 10 per cent
in 2000-01. The fall in the default rate of New Housing Finance Scheme to 6
per cent in 2000-01 when compared to the previous years is a matter of relief.
The default rate for other schemes like TFL, HMS and NFDL has shown an
increasing trend for the period from 1996 to 2001. Though the default rate is
increasing, the small magnitude of loans except Chit loan may not pose
serious threat to the Company. Table 4.26 gives the details:
145

- ~
Tab
le4
.26
An
aly
sis
of
the
Def
ault
Po
siti
on
of
KS
FE
Sch
emes
(Rs,
Lak
hs)
SI.
Nom
encl
atur
e3
1/0
3/9
6P
er3
1/0
3/9
7P
er3
1/0
3/9
8P
er31
1031
99P
er31
103/
00P
er3
1/0
3/0
1P
erN
o.A
mou
ntA
mou
ntA
mou
ntA
mou
ntA
mou
nt32
66ce
n42
54ce
n59
50ce
n74
21ce
n95
69ce
n11
538
cen
IC
hitt
ySa
lata
geta
geta
geta
geta
geta
ge
a.C
hitt
yD
efau
lt37
011
.368
316
.190
015
.113
3918
.023
4824
.521
6018
.7
11O
ther
Sch
emes
a.H
P45
912
528
1167
213
674
1185
316
673
10
b.T
rade
Loa
n34
415
39
269
1338
918
399
2337
726
c.H
MS
226
486
9411
103
1013
815
154
21
d.N
FDL
--
754
265
938
06
551
1063
419
e.N
HFS
--
171
164
528
77
316
827
26
III
New
Chi
tty
Loa
n
a.N
PA
·of
NeL
450
884
39
1491
651
871
1668
1420
5419
17
•N
PA
of
NC
L:
NC
Lad
vanc
esre
lati
ngto
defa
ult
of
resp
ecti
veC
hitt
yov
ersi
xm
onth
s.
Sour
ce:H
ead
Off
ice,
KSF
E

Table 4.27
Prized and Non- Prized Default on Collectable
Demand as on 31-3- 2002 (Rs. Lakhs)
Prized Chitty Non Prized Chitty
CollectableDefault
Non Collectable DefaultDemand Demand
3500.43 26247.13216263.98 (1.62) 592069.00 (4.43)
Source: Head Office, KSFEFigures in parenthesis show the percentage
Table 4.27, which gives the latest position of default reveals that
the default of prized Chit on collectable demand 12 (1.62%) is manageable and
not a serious problem to the Company.
Mounting default over-dues, besides reducing the profitability of the
Company, has also increased the transaction cost for effecting recovery. The
'Revenue Recovery Debtors' (defaulters on whom the Revenue Recovery
procedures have been initiated) in KSFE had been steadily increasing from 1992
93 to 2000-01. There has been 14.6 times increase in the Revenue Recovery
Debtors in KSFE from Rs. 244 Lakhs in 1992-93 to Rs. 3,576 Lakhs in 2000-01.
This is an indication of the high default rate of various schemes and the weak
revenue recovery performance of the Company. See, Table 4.28 for details.
147

Table 4.28
Trends in Revenue Recovery Debtors in KSFE (Rs, Lakhs)
Revenue Growth Revenue Percentage ofYear Recovery Rate Recovery RR Debtors to
Debtors Collection Total BusinessI
1992-93 244 .80I - -1993-94 387 58.6 - .99
1994-95 546 41.1 - 1.1
1995-96 782 43.2 234(30) 1.2
1996-97 993 27.0 352(35) .99
1997-98 1628 63.9 579(36) 1.1
1998-99 2519 54.7 835(33) 1.2
1999-2000 2768 9.9 1271(46) 1.1
2000-01 3576 29.2 2003(56) 1.3
AAG 41.0Source: Annual Reports. KSFE. Figures m parenthesis show the percentageof
Revenue Recovery Collection to the revenue recovery debtors in Lakhs.
Table 4.28 shows that the percentage of revenue recovery
collection to the revenue recovery debtors has been increasing from 30 per
cent during 1995-96 to 56 per cent during 2000-01 and can be considered as a
positive sign. The provision for revenue recovery debts has been made on the
basis ofRBI norms for Non Performing Assets (NPA). However. provision for
NPA ofNCL 13 is made on ad hoc basis. Provision for NPA on other debts has
not been made. as the same has not been identified by the Company and this
may cause delay in effecting revenue recovery processes.
4.8.8.2 Recovery Performance of the Company.
The data from the Revenue Recovery Department show that the
collection ofdefault amount is far below the targets fixed by the Company. Analysis
ofthe achievements ofall the nine Special Deputy Tahsildars (SDT) working in the
Revenue Recovery Department has been presented in Table 4.29.
148

Table 4.29
Revenue Recovery Target and Collection for 1995-96 to 2000-01 (RS. Lakhs)
Year Target Collection
1995-96 -- 234.3
1996-97 --- 352.0I 1997-98 720 578.5 (80.4)
1998-99 900 835.3 (92.8)
1999-2000 1500 1270.5 (84.7); 2000-01 2766.7 2002.8(72.4),
Source: Head Office, KSFEFigures in parenthesis show the percentage
Table 4.29 reveals that the total revenue recovery achievement for
2000-01 (72.4%) was not satisfactory when compared with that of the
previous years. Even though revenue recovery proceedings are initiated, in
certain cases the Company has not been able to take it to the logical end due
to legal and political interventions (This is based on our discussion with
Managers of the Company). This is also one of the reasons for mounting over
dues. In fact, what is more important is the fact that the revenue recovery
achievement is actually coming down.
To sum up, the presence of KSFE as the Public Sector Chit Company
serves as an alternative, and as a check to the stupendous growth of private Chits
and informal Chits. Inadequate capital base of the Company is a matter of
concern. The market share of KSFE in the Chit business shows its clear
dominance in Kerala. In general, the rate of growth of KSFE Chits is higher than
the rate of growth of the Chit industry in the State. The privileges enjoyed by
KSFE as a Government Company and the exemptions from various provisions of
the Kerala Chitties Act demands still higher rates of growth. Direct and indirect
benefits of KSFE to the Government of Kerala are creditworthy. Though the
Company has diversified its schemes, the contribution of its various loan
schemes except Chitty loan scheme has not been attractive. The deposit schemes
like Sugama and Fixed Deposit are also attractive.
149

The business performance of the Company highlights the need for
achieving still higher growth rate in future. Although the Company has been
making profits throughout the period, the profitability ratio shows fluctuations
and the expense ratio shows that only a small margin is left after meeting the
expenses. The default record is high and revenue recovery performance is not
satisfactory. The outreach of the Company's services to the rural masses
seems not satisfactory as shown by the lesser proportion of rural branchs. The
analysis of the performance of KSFE on the basis of various parameters
reveals its viability and areas of its success and failures. Some of the
objectives of the Company at the time of its incorporation are yet to be
achieved. The continued presence of the informal and unregistered Chit Fund
sector pinpoints the need for more dynamic growth for KSFE and wider
market outreach.
150

Notes and References
1. See, Manuel of Procedure, Kerala State Financial Enterprises Ltd.,
Government of Kerala, Vol.l, (1991).
2. The Third Kerala Legislative Assembly headed by E.M.S
Namboodhiripad, (1967-1970). Mr. P.K Kunju was the Finance Minister
of the State at that period.
3. See, Sreedharan Menon, K.A. Schemes for Starting Chitties under State
Auspices, Kerala State, (1967), P. 16.
4. As per Certificate of Incorporation, No: 2249 of 1969 as KSFE Ltd.
5. Chilly loan scheme was in operation from the very beginning of the
Company. The Company introduced new Chitty Loan (NCL) to the non
prized Chit subscriber in 1993. The scheme includes many noval features
like advancing 50 per cent of the loan amount immediately after first
auction of the Chit.
6. Since all Chits under study are monthly Chitties, in each month there will
be a turnover equal to the capital of all Chitties. Annual turnover is
calculated by multiplying the monthly Chit sala by 12.
7. According to the Chit Act, Foreman by law is a holder of a ticket ( one
number) in each class of Chit conducted by him. This membership by the
foreman in a Chit is called Statutory Ticket.
8. Restriction on acceptance of public deposits by 'Non-Banking Companies
(Acceptance of Deposits through Commercial Paper) Directions, (1989).
In terms of Miscellaneous Non-Banking Companies RBI Directions,
Companies can accept deposits upto 25 per cent and 15 per cent of the
Net Owned Fund from public and shareholders respectively for a period
of 6 months to 36 months. But KSFE can accept deposits on the guarantee
of the Government.
9. Bourgeois L.J, Irene, M. Duhaime and Stimpert, J.L. Strategic
Management: A Management Perspective, second edition, The Dryden
Press, Harcourt Brace College Publishers, (1999).
151

10. The monthly income and expenditure of a branch with Chit sala of Rs. 12
Lakhs is estimated and shown by the Company as Rs. 85,166, and as
Rs.75,000 respectively. Hence profit of the branch equals Rs.85, 166 - Rs.
75,000 = Rs.l 0, 166.
11. Economic Implications of the Central Chit Funds Act 1982: An Appraisal, M.
Mohandas, Prajnan, Vol.XVII, No.!, (1988).
12. Collectable Chit Amount is calculated by considering only the number of
instalments and Chit subscription that is already paid. For example, in the case of
a prized Chitty of One Lakh with 100 subscribers and monthly subscription of
Rs.I000, the collectable Chit amount after the lOth instalment for a subscriber is
equal to 1000 x 10 = 10000. So the total collectable Chit amount equals Rs.I 0000
x 100 = Rs. 10,00,000
13. As regards NPA of NCL is concerned, the Company thought that the accounts of
those loanees who are upto date in remittance of Chit instalments, cannot be
considered as NPA, though they may be defaulting the interest payment, as there
is asset building in such cases. However, Company had made ad hoc provision of
Rs. 818 Lakhs NPA-NCL during 1999-2000.
152

CHAPTER FIVE
CHIT FINANCE IN KERALA: AN APPRAISAL
In the previous chapter we have made a detailed discussion and
assessment of Kerala State Financial Enterprises Ltd. Based on our sample
survey, this chapter presents the profile of Chit subscribers in Kerala, their
awareness on Chits in general and particularly on KSFE. It presents the
motivational factors for joining Chits and the pattern of utilisation of prize
money. This chapter also analyses the problems of Chit subscribers and makes
acomparative assessment of different types of Chit institutions by using Chit
Funds Rating Analysis. It also includes the opinions of KSFE employees on
various issues.
5.1.1 Profile of Chit Subscribers in Kerala
Primary data collected from a sample of 400 subscribers from
various Chit Funds provide a profile of Chit subscribers in the financial sector
ofKerala. The respondents were classified into various categories on the basis
of Chit institutions, age, sex, marital status, place of residence. geographical
area, education status. profession and income. Table 5.1 gives the profile of
Chit subscribers in Kerala.
153

Table 5.1Profile of Chit Subscribers in Kerala
~: No. Profile ofFrequency Percentage
CumulativeSubscribers Percentage
I. Institution-wise
KSFE 160 40 40Co-operatives 114 28.5 68.5Private 86 21.5 90
I Informal 40 10 100Total 400 100 100,Sex..
I Male 284 71 71Female 116 29 100Total 400 100 100
J. Martial Status-
Married 364 91 91Unmarried 36 9 100
ITotal 400 100 100.. i Place of Residence
!Panchayat 216 54 54Municipality 87 21.8 75.8
i Corporation 97 24.2 100!Total 400 100 100-
:.;ucc: Survey Data
Table 5.1 shows that men (71 %) outnumber women in subscribing
t(hll Funds, 91 per cent are married and 54 per cent reside in sub-urban or
'n! areas. Considering the focus of the study, 40 per cent of the subscribers
lilt been selected from KSFE.
~l': Alt-Wise Profile of Subscribers
Subscribers in the age group of 35-55 formed 65.5 per cent of
I,.,<h,36.5 per cent belonged to the age group of 35-45. It clearly shows that
taa:l1ly of the subscribers belonged to the middle age group or the income
n~g age group of 35 to 55 years. Table 5.2 shows the distribution of
~1bersaccording to age.
154

Table 5.2
Distribution of Subscribers According to Age
Age Ernakulam Trichur Trivandrum Calicut TotalGroup
Below 25 3 (1.5) 1 (1.7) 4 (4) - 8(2)
25-35 40 (20) 12 (20) 24 (24) 15 (37.5) 91(22.7)
35-45 82 (41) 21 (35) 27 (27) 16 (40) 146(36.5)
45-55 54 (27) 20 (34) 33 (33) 9 (22.5) 116(29)
55-65 16 (8) 5 (8.3) 8 (8) - 29(7.3)
Above 65 5 (2.5) 1 (1.7) 4 (4) - 10(2.5)
TOTAL 200 (100) 60 (lOO) 100 (lOO) 40 (100) 400( 100)Source: Survey DataFigures in brackets represent percentage to total of the respective column.
Table 5.2 also shows that the percentage of younger subscribers
belonging to the age group of 25-35 was comparatively higher (37.5 %) in the
district of Calicut. Chi-square test for the association between age and the
preference for various Chit Funds revealed no clear association between them.
This is shown in Table 5.2A.
Ch" Id P tiT bl 52A A Ca e • ~2e omposltlOn an re erence or various It nstltutlonsAge KSFE Co-operative Private Informal Total
BELOW 25 5 3 0 0 8
25-35 38 29 18 6 91
35-45 63 36 32 15 146
~5-55 43 34 23 16 116
55-65 9 8 10 2 29
ABOVE 65 2 4 3 1 10
Total 160 114 86 40 400
2 2.%0 = 10.255, df= 9, %0.OS,9= 16.919, Independent
5.1.3 Education-wise Profile of Subscribers
The educational status of Chit subscribers has been analysed in
Table 5.3. The Table shows that 46.3 per cent of the subscribers are graduates
and above and are thus highly educated. Only 12 per cent of the subscribers
155

are below SSLC. Thus, it is clear that the majority of the Chit subscribers are
well educated.
Table 5.3Education-wise Profile of Subscribers
Education Emakulam Trichur Trivandrum Calicut Total
Below SSLC 27 (13.5) 5 (8.3) 11(11) 5(12.5) 48 (12)
SSLC 52 (26.0) 24 (40.0) 31(31 ) 9(22.5) 116 (29)
Pre-degree 21 (10.5) 10 (16.7) 14 (14) 6( 15.0) 51 (12.7)
Graduate 54 (27.0) 13(21.7) 30(30) 8(20.0) 105 (26.3)
Post-Graduate 40 (20.0) 7 (11.7) 7 (7) 11(27.5) 65 (16.3)
Professional 6 (3.0) 1 (1.7) 7 (7) 1(2.5) 15 (3.7)
Total 200(100) 60 (100) 100(100) 40(100) 400 (100)
Source: Survey Data Figures ID brackets represent percentage
Table 5.3A
Education level and Preference for various Chit Funds
EducationInstitutions
KSFE Co-operatives Private Informal Total
Below SSLC 13 12 17 6 48
SSLC 50 32 23 11 116
Pre-Degree 19 15 10 7 51
Graduate 43 30 22 10 105
Post graduate 27 22 12 4 65
Professional 8 3 2 2 15
Total 160 114 86 40 400Source: Survey Data
Z~ = 120.94, d.f= 12, Z~oSJ2=21.026, Dependent
Chi-square test for the association between education and the
preference for various Chit Funds revealed clear association between them.
The Subscribers of KSFE and Co-operatives have higher educational
Qualification than those of Private and Informal Chit Funds. This implies that
subscribers with higher educational qualification prefer the registered Chit
Funds due to safety aspects when compared to the attractions and incentives
offered by the private and informal Chit Funds.
156

5.1.4 Occupation-wise Profile of Subscribers
Of the subscribers, 54.5 per cent belonged to the salaried class, and
20.8 per cent belonged to the business class, while agriculturists formed only less
than 10 per cent of the total subscribers. Thus it shows that by profession, more
subscribers are from the salaried class. Chit business warrants regular and prompt
monthly remittances and so it is highly convenient for regular income groups. It
also reveals the declining association of farmers with Chits, despite their strong
presence in the early stages of its growth (See Chapter 3, Sections 3.2 and 3.3).
At the same time the Table also reveals the larger presence of agriculturists
(32.5%) in the district of Calicut when compared to other districts. This has been
shown in Table 5.4
Table5.4
Occupation-wise Profile of Subscribers
Occupation Ernakulam Trichur Trivandrum Calicut Total
Agriculture 12 (6) 7 (11.7) 6 (6.0) 13 (32.5) 38(9.5)
Business 37 (18.5) 25 (41.7) 15 (15) 6 (15) 83(20.7)
Salaried class 119 (59.5) 25 (41.7) 53 (53) 21 (52.5) 218(54.5)
Others 32 (16) 3 (5.0) 26 (26) 0(0) 61(15.3)
Total 200 (lOO) 60 (100) 100(100) 40(100) 400(100)
Source: Survey DataFigures in brackets represent percentage
Table 5.4A Association between Occupation and Chit Funds
InstitutionsOccupation Co-
KSFEoperatives
Private Informal Total
IAgriculture 19 12 4 3 38
~usiness 26 12 31 14 83
Salaried Class 92 77 34 15 218
pthers 23 13 17 8 61
~otal 160 114 86 40 400Source: Survey Data
xi = 36.696, d.f= 9, X:'os.9 =16.919, Dependent
157

Chi-square test for the association between occupation and the
preference for various Chit Funds revealed clear association between them.
The study shows that, salaried group and agriculturists preferred KSFE and
Co-operative Chits, whereas 54.2 per cent of business group preferred Private
and Informal Chits.
5.1.5 Income-wise Profile of Subscribers
The subscribers are classified into six groups in terms of their
household monthly income as shown in Table 5.5. Income-wise classification
shows that 79 per cent belonged to the income groups below Rs. I 5,000.
Table 5.5
Income-wise Profile of Subscribers
Income (Rs) Ernakulam Trichur Trivandrum Calicut Total i
Up to 5000 44 (22) 12(20) 28(28) 8(20) 92 (23)
5001-10000 60 (30) 15(25) 53(53) 21(52.5) 149 (37.3)
10001-15000 39(19.5) 15(25) 13(13) 8(20) 75 (18.7) I
15001-25000 45 (22.5) 11(18.3) 5(5) 3(7.5) 64 (16) I
25001-35000 9 (4.5) 3(5) 0(0) 0(0) 12 (3)
35001 & above 3 (1.5) 4(6.7) 1(1) 0(0) 8 (2) !Total 200(100) 60(100) 100(100) 40(100) 400 (100)
,
Source: Survey DataFigures in brackets represent percentage
TableS. SA
Association between Income and Preference for Chit Funds
Monthly Family Income KSFE Co-operatives Private Informal Total
Upto5000 39 28 17 8 92
5001-10000 63 40 31 15 149
10001-15000 28 20 22 5 75
15001-25000 22 20 12 10 64
25001-35000 4 4 3 1 12
Above 35000 4 2 1 1 8
Source: Survey Data
zi = 6.707, d.f= 9, Z:'os.'1 =16.919, Independent
158

Chi-square test for the association between income and the
preference for various Chit Funds found no clear association between them.
Thus it shows that the low income as well as the middle-income group
constitutes the major subscribers of Chit schemes in various Chit Funds.
5.1.6 Subscribers' Association with Chit Funds
Table 5.6 reveals that 280 subscribers (70%) have more than 5
years of association with Chit Funds. Longer years of association with Chit
Funds have been seen in the districts of Ernakulam and Trichur. It also gives
an indication that Chit subscribers continue their association with Chit Funds
even after the termination of a particular Chit. When one Chit terminates most
of them subscribe to a newly starting Chit.
Table 5.6
Subscribers' Association with Chit Funds
Association withErnakulam Trichur Trivandrum Calicut Total
Chit Funds< I year 6(3) 3(5) 0(0) 0(0) 9(2.25)
1-3 years 21(10.5) 6(10) 14(14) 5(12.5) 46(11.5)
3-5 years 20(10) 11(18.3) 22(22) 12(30) 65(16.25)
5-10 years 35(17.5) 10(16.7) 34(34) 13(32.5) 92(23.0)
Above 10 years 118(59) 30(50) 30(30) 10(25) 188(47.0)
Total 200(100) 60(100) 100(100) 40(100) 400(100)Source: Survey Data Figures in brackets represent percentage
Table 5.6.A
Association with Chit Funds: No. of Years
~ < 1 Year 1 - 3 3-5 5 -10 Above 10 TotalInstitution
KSFE6 26 27 34 67 160
(3.8) (l6.3) (l6.9) (21.3) (41.9) (lOO)
Co-operatives2 6 19 27 60 114
(1.8) (5.3) (16.7) (23.7) (52.6) (100)
Private 07 13 23 43 86
(8.1) (15. I) (26.7) (50.0) (lOO)
lnfonnal1 7 6 8 18 40
(2.5) (l7.5) (15.0) (20.0) (45.0) (lOO)
Total9 46 65 92 188 400
(2.3) (l1.5) 06.3) (23.0) (47.0) (lOO)Source: Survey Data FIgures in brackets represent percentage
Z; = 14.345, d.f=9, Z;.o5.9=16.919,lndependent
159

From Table 5.6A, it is clear that there is no clear association of
subscribers between various Chit Funds and the number of years of relationship.
Subscribers of various Chit Funds have longer years (more than 5 years) of
relationship.
5.1.7 Association of Subscribers with Different Types of Chit Funds
Different types of Chit institutions exist in Kerala. They are private
Chit Funds, co-operative Chits and the public sector Chit Funds existing side
by side and competing with each other along with the large multitude of
informal Chit Funds. Most of the subscribers have simultaneous association
with more than one Chit institution. Table 5.7 shows that the 400 subscribers
interviewed from different Chit institutions have subscriptions in more than
one Chit institution. 264 subscribers (66%) ie; (35+39+ 19 = 93) from KSFE,
(35+ 11+2 = 48) from Co-operative, (2J +24+9 = 54) from Private and
(21+22+26 = 69) from Informal have simultaneous subscription in different
types of Chit Funds.
Table 5.7
Association of Subscribers with Different Chit Funds
KSFE Co-operative Private Informal
KSFE 160 35 39 19
Co-operative 35 114 II 2
Private 21 24 86 9
Informal 21 22 26 40Source: Survey Data
This clearly indicates the strong preference of subscribers to the
Chit scheme despite the type of Chit institution. Besides, each type of Chit
Fund has its own unique methods of attracting subscribers to their schemes.
This simultaneous association with more than one Chit institution enables one
to make a comparative assessment of various Chit institutions.
160
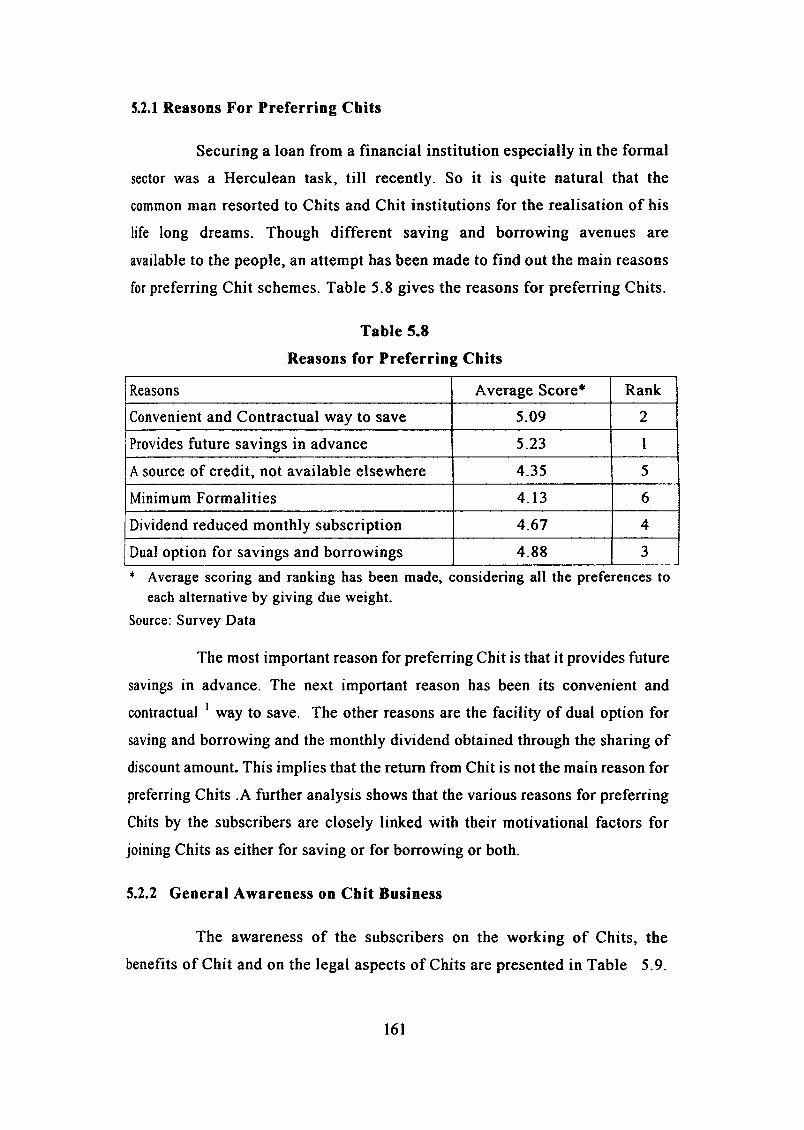
5.2.1 Reasons For Preferring Chits
Securing a loan from a financial institution especially in the formal
sector was a Herculean task, till recently. So it is quite natural that the
common man resorted to Chits and Chit institutions for the realisation of his
life long dreams. Though different saving and borrowing avenues are
available to the people, an attempt has been made to find out the main reasons
for preferring Chit schemes. Table 5.8 gives the reasons for preferring Chits.
Table 5.8
Reasons for Preferring Chits
Reasons Average Score" Rank
Convenient and Contractual way to save 5.09 2
Provides future savings in advance 5.23 1
Asource of credit, not available elsewhere 4.35 5
Minimum Formalities 4.13 6
Dividend reduced monthly subscription 4.67 4
Dual option for savings and borrowings 4.88 3
* Average scoring and ranking has been made, considering all the preferences toeach alternative by giving due weight.
Source: Survey Data
The most important reason for preferring Chit is that it provides future
savings in advance. The next important reason has been its convenient and
contractual I way to save. The other reasons are the facility of dual option for
saving and borrowing and the monthly dividend obtained through the sharing of
discount amount. This implies that the return from Chit is not the main reason for
preferring Chits .A further analysis shows that the various reasons for preferring
Chits by the subscribers are closely linked with their motivational factors for
joining Chits as either for saving or for borrowing or both.
5.2.2 General Awareness on Chit Business
The awareness of the subscribers on the working of Chits, the
benefits of Chit and on the legal aspects of Chits are presented in Table 5.9.
161

Though a clear majonty, 89.25 per cent (48.75 + 40.50) of the Chit
subscribers are aware of the working of Chit business, only less than 25 per
cent (4 + 20.5) are aware of the legal aspects of Chits. 51.5 per cent have not
even heard of the Kerala Chitties Act. Monthly Deposit Scheme (MDS) or
Mutual Benefit Scheme (MBS) run by Co-operatives. which is equivalent to
the Chit scheme in every respect, seems not so popular among the people. 46
per cent of the subscribers (46 % = 18.50+27.50) are either not aware or know
very little about them. Thus it implies that though majority of the subscribers
have long years of association with Chit funds. their awareness on the legal
aspects of Chits and on MDS/MBS have not been adequate.
Table 5.9
General Awareness on Chit Business
Awareness on Very To Some Very Not TotalWell Extent Little Aware
Working of Chit 195 162 38 5 400Business (48.75) (40.50) (9.50) (1.25) (100)
MDS/MBS of Co- 84 132 74 110 400operatives (21.00) (33.00) (18.50) (27.50) (lOO)
Benefits 184 169 32 15 400On Chit (46.00) (42.25) (8.00) (3.75) (100)
Kerala 16 82 96 206 400Chitties Act (4.00) (20.50) (24.00) (51.50) (lOO)Source: Survey Data Figures in brackets represent percentage
5.2.3 Household Savings Behaviour
Mobilisation of voluntary personal savings even m rural areas
permits increased capital accumulation and helps develop the spirit of
enterprise. Savers must have a wide choice of safe financial assets offering
attractive returns. Contractual savings arrangements play a vital role in
mobilising savings from different income categories.
162

Table 5.10
Savings Behaviour of Chit Subscribers
Avenues of Savings Order of Preference
1 Banks 6
2 Provident Fund 3
3 Chits 1
4 Co-operatives 7
5 Post-Office 4
6 National Savings Certificate 8
7 Bonds, Shares 9
8 Insurance 2
9 lndira Vikas Patra 10
10 Gold/Jewellery 5Source: Survey Data
The household savings behaviour of subscribers shows that the
mam avenues of savings of Chit subscribers follow the order of Chit,
Insurance, Provident Fund, Post Office Savings, Gold and Deposits in Bank
and Co-operatives. The subscribers' choice of saving avenues such as Indira
Vikas Patra, Bonds, Shares and National Saving Certificates seem less
significant. The savings behaviour of the Chit subscribers indicates their
preferences towards less risky savings avenues.
5.2.4 Investment Options and Order of Preference
The survey data revealed that the investment preferences of Chit
subscribers are in the order of, bank deposits followed by Post-office savings,
Chitty, Investment in National Saving Certificates, Bonds and Shares. The
subscribers' preference of investment in land or building and in gold seemed
to be less significant. Table 5.11 also shows that Chit as an investment option
received third preference (Rank 3) from the Chit subscribers.
163

Table 5.11
Investment Options and Order of Preference
Investment Options Average Score Rank
Keeping cash in Bank 5.71 1
Keeping cash in Post office 5.35 2
Investment in Chit 5.29 3
Investment in NSC 5.00 4
Investment in Bonds and Shares 4.85 5
Investment in land and building 4.81 6
Gold 4.78 7
Source: Survey Data
It substantiates that the Chit subscribers in general prefer those
investment avenues where the risk is less.
5.2.5 Motivational Factors for Joining Chits
The basic principle underlying a Chit IS the accumulation of
savings, very often, for a predetermined objective/goal. The Chit helps not
only to pool the savings of those who have the capacity to save, but also
encourages even the poor to spare something out of their meager income.
Table 5.12 reveals that majority of the subscribers (60.2%) join Chits for both
saving and borrowing. Subscribers who bid the Chit and take the prize money
are borrowers for the remaining period of the Chit. Similarly, those who are
not taking the prize amount before the termination of the Chit are savers. The
decisive factor which decides a subscriber to be a saver or a borrower is the
rate of discount.
Table 5.12 also shows that 29 per cent of the subscribers join Chits
for the saving purpose alone and 10.8 per cent solely for borrowing. It also
reveals that majority of subscribers consider a Chit both as saving as well as a
borrowing instrument.
164

Table 5.12Motivational Factors for Joining Chits
Occupation To Save To Borrow Both Total
Agriculture8 4 26 38
(21.1) (10.5) (68.4) (100)
Business16 16 51 83
(19.3) (19.3) (61.4) (lOO)
Salaried class68 16 134 218
(31.2) (1.3) (61.5) (100)
Others24 1 30 61
(39.3) (11.5) (49.2) (100)
Total116 43 241 400(29) (10.8) (60.2) (lOO)
Source: Survey Data FIgures ID brackets represent percentage
Z~ = 15.885, d.f= 6, Z~.05,6 =12.59, Dependent
Chi-square test for the association between motivational factors for
joining Chits and occupation of the subscribers reveals association between
them. It also shows that comparatively professionals and the salaried group
join Chits more as a saving avenue, whereas the business group joins Chits
more as a borrowing avenue.
Chi-square test for the association between motivational factors for
joining Chits and income of the subscribers reveals no clear association
between them. The subscribers from all income categories consider Chit both
as a saving and a borrowing instrument. It shows that the motivational factors
for joining Chit is neither pure saving nor pure borrowing.
Table S.12AMotivational Factors for Joining Chits: Income-wise
Income To Save To Borrow Both TotalUp to 5000 25 10 51 925001-10000 42 14 93 14910001-15000 22 10 43 1515001-25000 18 1 39 6425001-35000 6 1 5 12Above 35000 3 1 4 8
Total 116 43 241 400Source: Survey Data
z~ = 1.551, d.f= 6, Z;'05,6 =12.59, Independent
165

5.2.6 Purpose of Saving through Chit Funds
Chit Funds as traditional financial intermediaries mobilise the
scattered savings, which the subscribers can use for various purposes. Table
5.13 below shows the various purposes of saving through Chit Funds.
Table 5.13
Purpose of Saving through Chit Funds
Purpose Average Score RankTo buy or build a house 5.36 1Business/Industry 5.32 2Marriage 5.23 3Savings for old age 4.65 4Consumer durables/vehicles 4.47 5Source: Survey Data
Table 5.13 shows that the prime purpose of the savings through
Chits appear to be to buy or build a house, followed by business/industry, and
to meet marriage expenses. The other targets for the Chitty are savings for old
age and for buying consumer durables, vehicles, for the education of children,
for the payment of old debt and for meeting agricultural expenses. Thus we can
generalise by saying that the main purpose of such savings has been for
productive/asset creation.
5.2.7 Purpose of Borrowing through Chit Funds
Chit subscribers can avail of their future savings as borrowed funds
at a discount for meeting their various requirements. Table 5.14 shows the
purpose of borrowing through Chit Funds.
Table 5.14
Purpose of Borrowing through Chit Funds
Purpose Average Score Rank
Business/Industry 5.12 1
To payoff old debts 5.07 2
To meet marriage expenses 4.77 3To buy or build a house 4.75 4
Education of Children 4.39 5Source: Survey Data
166

Table 5.14 shows that the purpose of borrowing through Chits have
been given the preferences in the order of business/industry, to payoff
burdensome old debts, for marriage purposes and to buy or build a house. The
motives behind joining Chits as a borrowing avenue for the education of the
children, for agricultural purposes and for taking Chitty loan have been given
less importance. But in this case, there is some difference in the motives.
Those who look at Chits as source of borrowings, except in the case of
industry/business, are found to use it for meeting urgent debt obligations or
for household expenditures like marriage expenses or children's education.
Hence, it is comparatively less productive/asset creating.
Table 5.15
Purpose of Saving: Occupation-wise Analysis
Schemes Agriculture Business SalariedOthers Total
classSchemes No. % No. % No. % No. % No. %
I. BusinesslIndustry I 2.6 40 48.2 I 0.4 2 3.3 44 11.002. Buying Consumer 3 7.9 3 3.6 II 5 3 4.9 20 5.00
Durables etc3. To Buy or Build 8 21.1 17 20.5 85 39 19 31.2 129 32.25
House4. Education ofChildren 3 7.9 0 0 19 8.7 6 9.8 28 7.00
5. Savings for Old Age 3 7.9 2 2.4 17 7.8 5 8.2 27 6.75
6. Marriage 8 21.1 10 12 45 20.6 18 29.5 81 20.25
7. To Take Chitty Loan 0 0 I 1.2 2 0.9 0 0 3 0.75
8. Agricultural Purposes 6 15.7 0 0 0 0 0 0 6 1.50
9. To pay-offOld Debts 3 7.9 3 3.6 8 3.7 5 8.2 19 4.75
IO.Others 3 7.9 7 8.5 30 13.9 3 4.9 43 10.75
Total 38 100 83 100 218 100 61 100 400 100.00Source: Survey Data
The purpose of saving through Chit seems different to vanous
occupation categories of subscribers. The agriculturists, the salaried group and
professionals consider the major purposes of saving through Chit as for buying
or building a house and for meeting marriage expenses. But the businessmen
view the purpose of saving through Chit for investment or business activity.
167

The details of Chit as a saving avenue to different occupation categories are
given in Table 5.15
Table 5.16
Purpose of Borrowing: Occupation-wise Analysis
Agriculture Business SalariedOthers Total
Schemes classNo No
NoNo No
1) BusinesslIndustry 0(0)17
0(0) 0(0)17
(60.7) (14.66)2) Buying Conswner Durables 7 (41.2) 0(0) 5 (9.4)
3 15etc (16.6) (12.93)
3) To Buyor Build House 1 (5.9) 1 (3.6) 16 (30.2) 1(5.6)19
(16.38)
4) Education ofChildren 1 (5.9) 1 (3.6) 3 (5.7)2 7 (6.03)(11.1)
5) Savings for Old Age 1 (5.9) 2 (7.1) 2 (3.8) 1 (5.6) 6 (5.17)
6) Marriage 3 (17.6) 0(0) 7 (13.2)3 13
(16.6) (11.21)
7) ToTakeChitty Loan 0(0) 0(0) 0(0) 1 (5.6) 1 (0.86)
8) Agricultural Purposes 1 (5.9) 0(0) 4 (7.5) 1 (5.6) 6 (5.17)
9) Topay-offOld Debts 3 (17.6) 7 (25) 15 (28.3)4 29 (25)
(22.2)
10) Others 0(0) 0(0) 1 (1.9)2 3 (2.59)(11.1)
Total 17 (100) 28 (100) 53 (100)18 116
(lOO) (100)Source: Survey Data
Figures in brackets represent percentage
The purpose of borrowing through Chit also seems different to
various occupation categories of subscribers. The agriculturists view Chit as a
borrowing avenue for buying consumer durables (41.2%). for meeting marriage
expenses (17.6%) and for paying off burdensome old debts (17.6%). The
purposes of borrowing through Chit for the salaried class are for buying or
building a house (30.2%). for the payment of old debts (28.3%) and for meeting
marriage expenses (13.2%). But the business group prefers the prize amount to
be obtained at the first few instalments for the investment in business (60. 7%)
and for the repayment of old debts (25%). The details of Chit as a borrowing
avenue to different occupation categories are given in Table 5.16
168

5.2.8 Opinion on the Return on Chits
Return on Chits represents the gains accrued by the subscribers in
joining the Chits. The return varies from subscriber to subscriber and is
influenced by factors like the duration of the Chit, the instalment at which
prize money is received, the rate of discount, etc. (See Chapter 3, Section 12).
Table 5.17 shows the opinion of subscribers on the return on Chits.
TableS.17
Opinion of Subscribers on the Return on Chits: Occupation-wise
OccupationSatisfied Not Satisfied Total
No. Percentage No. Percentage No. Percentage
Agriculture 25 73.5 9 26.5 34 100
Business 46 68.7 21 31.3 67 100
Salaried class 164 81.2 38 18.8 202 100
Others 46 85.2 9 14.8 54 100
Total 281 78.7 76 21.3 357 100
Source: Survey Data
The survey results show that majority of the subscribers (78.7%) are satisfied
with the returnderived from the savings in Chits.
Table S.17A
Opinion of Subscribers on the Return on Chits: Institution-wise
Satisfied Not Satisfied TotalInstitution
No. Percentage No. Percentage No. Percentage
KSFE 105 74.5 36 25.5 141 100
Co-operative 90 86.5 14 13.5 104 100
Private 56 75.7 18 24.3 74 100
Informal 30 78.9 8 21.1 38 100
Total 281 78.7 76 21.3 357 100
Source: Survey Data
Table 5.17A shows that subscribers from various Chit institutions
also are satisfied with the return from Chits.
169

Table 5.17B
Opinion of Subscribers on the Return on Chits: Income-wise
Income Satisfied Not Satisfied Total
No. Percentage No. Percentage No. PercentageUp to 5000 67 81.7 15 18.3 82 100
5001-10000 113 83.7 22 16.3 135 1001001-15000 50 76.9 15 23.1 65 10015001-25000 39 68.4 18 31.6 57 10025001-35000 8 72.7 3 27.3 11 10035001 & above 4 57.1 3 42.9 7 100Total 281 78.7 76 21.3 357 100
Source: Survey Data
An income-wise analysis on the return on Chit as shown in 5.17B
also reveals that subscribers of different income categories are generaJly
satisfied with the gain from the scheme. But it must be pointed out that most
of the subscribers express their opinion on returns without making actual
calculations. This indicates that there are a number of other attractions besides
the return, for preferring Chits (See Table 5.8).
5.3.1 ProblemsFaced By Chit Subscribers
The subscribers face problems from the individual to institutional
foremen without much exception. Many factors contribute to the existence of
such state of affairs.
5.3.2 Default
Observations on various Chit institutions indicate the existence of
mounting default in Chits. Mounting default rate in Chits would affect
adversely the smooth operation of Chit Funds. One of the important areas
where attention has to be focused is the reduction in default. The opinions of
the subscribers as well as the employees have been analysed in detail on the
various reasons for default. Of the 400 subscribers interviewed, 218
subscribers have been defaulters of Chit for at least on one instalment during
their association with Chits. Table 5.18 shows that among the defaulters,
170

majority (85.6 %) is in KSFE. 36.8 per cent in co-operatives. 32.5 per cent in
Private Chits and 27.5 per cent in informal Chit Funds.
Table 5.18
Default: Institution-wise Analysis
Institution No. of Subscribers No. of Defaulters Percentage
KSFE 160 137 85.6
Co-operatives 144 42 36.8
Private 86 28 32.5
Informal 40 11 27.5
Total 400 218 54.5
Source: Survey Data
The important reasons of default cited by the defaulters themselves
in the order of importance are: unexpected fall in income. rise in family
expenditure. unexpected change in business and low penal rate of interest. The
lower default rate in the case of informal and private Chits in comparison with
KSFE Chits is of significance. This is explained by their business tactics of
offering gifts to the prompt subscribers. strict follow up and because of the
personal relationship with the subscribers.
The default rate in KSFE is relatively high. The reasons highlighted
by the KSFE employees for higher default rate in KSFE Chits have been the
failure in timely reminders and follow up (61.2%). Another important reason
has been the low penal rate of interest on defaults (27.9%). This has been
shown in Table 5.19. The default interest on KSFE Chits has been 9 per cent
on non-prized default and 12 per cent on prized default on the subscription
amount.

Table 5.19
Opinion of KSFE Employees on Reasons for Default
No. Reasons for Default Frequency PercentageCum.
Percentage
1 Low penal interest 46 27.9 27.9
2 No timely follow up 101 61.2 89.1
3 No loss of membership 2 1.2 90.3
4 Others 16 9.7 100
Total 165 100 100Source: Survey Data
Absence of strict follow-up measures and lack of personal contact
ofthe Company have been viewed as the major reasons for the large volume
ofdefault.
Table 5.19A
Default: Occupation-wise Analysis
~ Agriculture BusinessSalaried Others
TotalInstitution Class
KSFE 18 42 58 19 137(13.1) (30.7) (42.3) (13.9) (100)
Co-Operatives8 7 22 5 42
(19.0) (16.7) (52.4) (11.9) (100)
Private2 14 6 6 28
(7.2) (50) . (21.4) (21.4) (100)
Informal 2 5 3 1 11(18.2) (45.5) (27.2) (9.1) (100)
Total 30 68 89 31 218(100)
Source: Survey DataFigures in brackets represent percentage
Table 5.19A reveals that the major defaulters of KSFE and Co
operatives are the salaried group. whereas the business group forms the main
defaulters of Private and Informal Chit Funds.
172

Table 5.19B
Default: Income-wise Analysis
Income(Rs.) No. of Subscribers No. of Defaulters Percentage
Up to 5000 92 88 95.7
5001-10000 149 65 43.6
10001-15000 75 33 44
15001-25000 64 27 42.2
25001-35000 12 3 25
Above 35000 8 2 25
Total 400 218 54.5Source: Survey Data
Table 5.19B reveals that default rate is very high in the case of
low-income category of subscribers as compared to middle income and high
income groups.
5.3.3 Problems in Prompt Payment of Prize Money
In the formal sector, Co-operatives (90%) stand first in prompt
payment of prize amount on due date, followed by Private Chits (87%). The
Table 5.20 clearly shows that only 48 per cent of the subscribers in KSFE get
the prize amount on due date.
Table 5.20
Payment of Prize Money: Institution-wise Analysis
Institution On Due Date Delayed Total(Percentage) (Percentage)KSFE 48 52 100Co- operatives 90 10 100Private (Kerala) 87 13 100Private (Outside Kerala) 66 34 100Informal 91 9 100Source: Survey Data
This has to be an eye-opener and the Company must meticulously
analyse the reasons for the delayed payment of prize amount. Whereas 66 per
cent of the subscribers in the Private Chits (Outside Kerala) get the prize
173

amount on due date and 92 per cent in the informal Chits, the State sponsored
KSFE falls far behind. The delay in payment of prize money is therefore
viewed as one of the major difficulties ofKSFE Chits.
5.3.4 Reasons for Delayed Payment of Prize Money
The due date for the payment of prized Chit is fixed as 45th day after
bidding. But certain Co-operatives and the KSFE now follow the practice of
disbursing the prize money on 30th day after bidding. The delayed payment of
prize money by the Chit Funds is a common phenomenon. Table 5.21 shows the
major reasons for the delayed payment of prize money by various Chit funds.
Table 5.21R f, Did P t fP· Measens or e aye aymen 0 rlZe oney
Co-Private Private
Reasons KSFEoperatives
(Kerala (Out InformalRgd.) side)
1. Failure to find 45(41.6) 6(66.7) 8(38.1) 1(12.5)I
Guarantors/Security -
2. NegligencelDelayTactics of the 16(14.8) 2(22.2) 3(100) 11(52.4) 6(75)Company
3. Formalities of the 47(43.6) 1(1l.1) 2(9.5) 1(12.5)Company -Total 108(100) 9(100) 3(100) 21(100) 8(100)
Source: Survey DataFigures in brackets represent percentage
In KSFE, the major reasons for the delayed payment of prize
money are the complicated formalities of the company and also the failure to
find guarantors. The failure to find guarantors and negligence of the company
form the major problems of co-operatives. The delay tactics using lame
excuses of the company forms the major problem for the delay in both private
and in informal Chits.
5.3.5 Number of Visits to Get Prize Amount
Table 5.22 shows that after bidding the prize money, the Co
operatives provide the prize amount by the first visit of the subscriber in 43.6
174

per cent of the cases and another 53.8 per cent obtain the prize amount within
amaximum of three visits. While 86.7 per cent obtain the prize amount within
a maximum of three visits in the private Chits, only 34.4 per cent in KSFE
obtain the prize amount in three visits.
Table 5.22
Number of Visits to Get Prize Amount: Institution-wise Analysis
KSFE Co- Przivate Private Informaloperatives (Kerala) (Out side)
No. of visits Percentage Percentage Percentage Percentage Percentage
l. Only Once 2.6 43.6 46.7 20.9 82.4
2. 2-3 Times 31.8 53.8 40 46.5 15.6
3. 3-4 Times 40.3 1.3 6.7 23.3 24. More than 25.3 1.3 6.7 9.3
4 times -Total 100 100 100 100 100
Source: Survey Data
The payment system in the informal Chit sector is even better when
compared to the private Chits since 82.4 per cent obtain it on the single visit.
The door payment of the prize amount itself is an attraction in the informal
sector. Thus it is very clear that the payment system in KSFE is least efficient
when compared to its competitors and it is mainly due to the complicated
formalities and security norms. The best in this regard are the informal Chits,
followed by private Chits (with Kerala registration).
5.3.6 Preference in Obtaining the Prize Money
The gain in joining Chits is not equal for all subscribers. The gain
varies from subscriber to subscriber mainly depending on the instalment at which
he secures the prize amount. In general, the subscribers who take the prize
amount at the earlier instalments are likely to gain more by investing the prize
amount in other avenues assuming that they are able to invest at a rate higher
than the cost of the funds (See our discussion in Chapter 3.12). Those who are
not immediately in need of money could accumulate their savings profitably.
175

Table 5.23
TotalOthersAgriculture Business
First few Instalments
Total
No Special Preference
Last few Instalments
Source: Survey Data
Figures in brackets represent percentage
The majority of the subscribers (66.5%) prefer to get the prize
amount within the first few instalments. The important reasons have been the
twin advantages of depositing or investing the prize amount in more attractive
schemes and an opportunity to meet emergencies, time value of money and
meeting other immediate needs. Only 16.8 per cent prefer the prize amount in
the last few instalments. Those who prefer to get the maximum amount even
in the last few instalments join the Chits with a saving motive. Occupation
wise there was no significant difference in their preferences.
Table 5.23A
Preference in Obtaining the Prize Money: Income-wise Analysis
PerformanceIn the first few In the last few No Special
TotalInstalment Instalment Preference
Monthly Income No. Percentage No. Percentage No. Percentage No. Percentage
Up to 5000 58 63.0 18 19.6 16 17.4 92 100
5001 to 10000 105 70.5 21 14.1 23 15.4 149 100
10001 to 15000 51 68.0 13 17.3 11 14.7 75 100
15001 to 25000 40 62.5 12 18.8 12 18.8 64 100
25001 to 35000 5 41.7 3 25.0 4 33.3 12 100
Above 35000 7 87.5 0 0 1 12.5 8 100
Total 266 66.50 67 16.75 67 16.75 400 100
Source: Survey Data
Table 5.23A reveals that subscribers of all income categories
prefer to get the prize amount in the first few instalments.
176

5.3.7 Utilisation of Prize Money
An enquiry into the utilisation of prize money last received by the
subscribers (Table 5.24) revealed that 53.6 per cent ofthe subscribers used the
prize amount for productive purposes like depositing the prize amount with
the Chit institution itself or Banks, used for debt repayment, agricultural
purposes or business purposes and for purchase of vehicles for commercial
purpose. This is quite similar to the observation and findings and arrived at by
Nayar, CPS (1973), Radhakrishnan, S (1975) and Mohandas, M (1988).
An occupation-wise enquiry into the details of the utilisation of the
prize money last received by the subscribers revealed that 73.4 per cent of the
agriculturists and 83.1 per cent of the businessmen used the prize amount for
productive purposes. But, 57.4 per cent of the salaried class utilised the prize
amount for non-productive purposes like expenditure on marriage, purchase of
vehicles and household articles and on other miscellaneous expenses. 64.8 per
cent of other occupation category including professionals also utilised the
prize amount for non-productive purposes. Table 5.24 reveals occupation-wise
difference in the utilization of the prize money last received.
Table 5.24
Utilisation of Prize Money: Oceupation-wise
~on Agriculture Business Salary Others TotalPurposel. Deposited with the Chit
8 (23.5) 14 (16.9) 38 8 (4.8) 68 (18.5)institution (19.3)
2. Deposited with the bank 8 (23.5) 3 (3.6) 12 (6.1) 3 (5.5) 26 (7.1)
3. Debt repayment 5 (14.7) 13 (15.7) 32 6(11.1) 56 (15.2)(16.2)
4. Marriage Pwpose 4 (11.8) 4 (4.8) 23 5 (9.3) 36 (9.8)(11.7)
5. Agricultural Pwpose 1 (2.9) 0(-) 0(-) 1 (1.9) 2 (.54)
6. Business 2 (5.9) 39 (46.9) o(-) 1 (1.9) 42 (11.4)7. Purchase ofvehicles, assets,
3 (8.9) 2 (2.4) 34 12(51 (13.9)consumption (17.3) 22.2)
8. Vehicles for commercial1 (2.9) o (-) 2 (I) 0(-) 3 (.82)
l>UI1>Ose
9. Others 2 (5.9) 8 (9.7) 56 18 84(22.8)(28.4) (33.3)
Total 34 (100) 83 (100) 19754 (100) 368
(lOO) (lOO)Source: Survey Data FIgures ID brackets represent percentage
177

Table 5.24A Utilisation of Prize Money: Income-wise Analysis
~Upto 5001- 10001- 15001- 25001- Above ;
Purpose 5000 10000 15000 25000 35000 35001Total
1. Depositedwith the
15(18.1) 27 (20.6) 11(15.5) 12 (19) 0(-) 3(37.5) 68I
Chit i
institution2. Deposited
,:
with the 7 (8.4) 9 (6.9) 4 (5.6) 4 (6.3) 2 (16.7) 0(-) 26 !bank
3. Debt11(13.3) 26 (19.8) 10(14.1) 6 (9.5) 1 (8.3) 2 (25) 56
repayment4. Marriage
15(18.1) 14 (10.7) 4 (5.6) 2 (3.2) 1 (8.3) 0(-) 36PurposeS. Agricultural
I (1.2) I (0.76) 0(-) 0(-) 0(-) 0(-) 2Purpose !
6. Business 5 (6) 12 (9.2) 15(21.1) 7(11.1) 2 (16.7) 1(12.5) 42
7. Purchase ofvehicles, 5 (6) 17 (13) 13(18.4) 12 (19) 3 (25) 1(12.5) 51 ,assets, ;
consumption !
8. Vehicles forcommercial 1 (1.2) 0(-) 0(-) 2 (3.2) 0(-) 0(-) 3purpose
9. Others 2(27.7) 25(19.1) 14(19.7) 18(28.7) 3 (25) 1(12.5) 84 I,
Total 83(100) 131(100) 71(100) 63(100) 12(100) 8(100) 368
Source: Survey Data
Income wise analyses of the utilisation of the prize money showed
that only 48.2 per cent of the subscribers with lower income (upto 5000)
utilised the amount for productive purposes like depositing the prize amount
with the Chit institution itself or Banks, used for debt repayment, agricultural
purposes or business purposes and for purchase of vehicles for commercial
purpose. At the same time 75 per cent of the subscribers with higher income
(above 35,000) utilised the prize amount for productive purposes.
5.3.8 Chitty Loan
Majority of the subscribers (72.3%) felt that Chits in general may
not provide funds at the hour of need. The element of luck plays a significant
178

role especially in the early instalments of bidding. Hence Chitty loan facility
has been introduced by certain foremen, especially KSFE, to bridge the gap
between the real need of the subscribers till their tickets get prized. Many co
operatives are also providing Chit loans on security of the paid up
subscription of the customers. The survey results show that 113 subscribers
(28.3%) availed themselves of the Chitty loan facility. However the
subscribers face a number of problems in availing of the Chitty loans. Table
5.25 analyses the problems faced by the Chitty loanees.
Table 5.25
Problems of Chitty Loan: Institution-wise Analysis
Problems KSFE Co-operatives Private Informal
I. Delay in sanctioning 28 14 8 10(57.1) (46.7) (36.4) (82.3)
2.Security problem 8 5 6 -(16.4) (16.7) (27.3) -
3. High rate of interest 13 10 6 2(26.5) (33.3) (27.3) (16.7)
4. Poor service of staff - 1 2 -- (3.3) (9) -
Total49 30 22 12
(100) (100) (lOO) (100)
Source: Survey DataFigures in brackets represent percentage
Enquiry into the problems faced by the Chitty loanees of various
Chit institutions reveals delay in sanction, high rate of interest and difficulty
in giving guarantee/security are the major issues in all the Chit institutions
analysed. Despite these problems, an overwhelming majority of the
respondents (90.62%) considered the Chitty loan scheme to be useful. 9.38 per
cent found it a burden due to the high rate of interest.
5.3.9 Other Problems Faced By Chit Subscribers: Institution-wise Analysis
The other main problems highlighted by the Chit subscribers
themselves from different Chit Funds have been shown in the Table 5.26.
179

Table 5.26
Other Problems Faced by Chit Subscribers: Institution-wise
~. ce- PrivatePrivate !outside Informal ~: ~-_ Institutions KSFE
operatives (Kerala)11
I. ........,KeralaIOptIons ..._~
A.S· Rank A.S Rank A.S Rank A.S Rank A.S Rank'I ,
!1. Complicated5.62 1 - - - - - - - -, Formalities
'I2. Security/Guarantee 5.53 2 5.49 I - - - - - - II
3. Fixed discount 5.44 3 4.50 4 - - - - - - I4. Indifferent attitude
5.33 4IiI ofStaff - - - - - - - -
5. Cheque payment5.03 5 - - - - - - - -
\ofprize money
6. Only to members - - 5.21 2 - - - - - -7. Small sala - - 4.80 3 5.10 2 - - 4.64 38. Flexible discount - - - - - - 3.83 3 - -9. Delay tactics of - - - - 3.83 5 3.77 4 - -the foreman.IO.Chances of
5.39 ) 5.46 1 5.18 2Exploitation - - - -
~II.Cheating - - - - 4.75 4 5.46 1 5.18 212.No transparency - - - - 4.79 3 4.77 2 4.57 4I3.No Registration - - - - - - - - 5.42 114.No GiftJ Offer - - 4.10 5 - - - - - -• AS is the Average Score. By considering all the preferences to each alternative,
average scoring and ranking has been made.Source: Survey Data
Major prohlems experienced hy the suhscribers with KSFE Chits, in
the order of ranking, have been complicated formalities, security/guarantee
problems, fixed ceiling on discount, indifferent attitude of the staff, Cheque
Payment of the prize money and long queue for payment of cash.
Difficulties faced with Co-operative Chits have heen the insistence
on security/guarantee from the members themselves, Chit schemes being open
only to the members, small sa/a, fixed ceiling on discount and the ahsence of
gifts or offers.
180

Major problems with Private Chits (Kerala Registered), in its order
have been instances of exploitation, small sola, less transparency and
openness, cheating and delay tactics in disbursing the prize money.
Problems of Private Chits based outside Kerala, in its order, have
been given as instances of exploitation, cheating, less transparency and
openness, flexible discount and delay tactics in paying the prize money.
Issues cited as problems with Informal Chits, in the order, have
been absence of registration, exploitation, cheating, small sola and less
transparency and openness.
To summarise, the complicated formalities and difficulty in giving
security/guarantee are the distinct problems faced by the subscribers in the
registered Chit Funds, whereas safety aspect and lack of transparency and
openness are the difficulties in the private and informal Chit Funds.
5.3.10 Malpractices by Foremen
The Chit Fund industry has been exposed to a wide range of
malpractices that cause problems to the subscribers. In recent years there has
been an unprecedented growth of Chit Funds in many parts of the country.
There have been several instances of failure of Chit Funds also due to the
malpractices. The data from District Crime Record Bureau, Ernakulam Rural
District limit shows that 48 cases of cheating were filed against Private Chit
and Finance companies during the period 1990-2001. Among these, 38 cases
were filed in 1997 pertaining to the malpractices of just 2 particular Private
Chit Companies 2. After collecting substantial amounts of money, the
promoter or foreman either mismanages the funds and cause the Chits to
collapse or disappears from the scene altogether. This affects the trust and
confidence of the people on Chit Finance.
A survey by the All Kerala 'Blade Companies' Abolition Front
revealed that the amount looted by Private Finance Companies (known as
Blade Companies) and some of the unregistered Chit Companies from seven
181

districts for a period of four years (1995-99) have been to the tune of Rs.160
Crore. More than 2,00,910 depositors from the districts of Cananore,
Kasaragod, Calicut, Waynad, Emakulam, Idukki and Trivandrum became
victims. The inability of the State Government to introduce suitable
amendments to the existing Kerala Chitties Act and Kerala Money Lending
Act are the reasons cited for the occurrences of such tragedies 3.
Our survey showed that 51 subscribers (12.8%) were subjected to
some form of cheating. The details are given in Table 5.27.
Table 5.27
Malpractices by Foremen
Occupation. .I tit ti Agnculture Businessns 1 u Ions
4) Others
Total
Source: Survey DataFigures in brackets represent percentage
SalariedClass
Others Total
Table 5.27 shows that of the 51 victims, 35 subscribers (68.6%)
were with informal Chit Funds and 10 subscribers (19.6%) with Private Chits
with bases outside Kerala. The majority of the victims (52.9%) reported the
matter to the Police, 15.7 per cent reported to the Registrar and 31.4 per cent
have suffered in silence. Only 15.7 per cent of the victims got back the money
in full, whereas 84.3 per cent lost a part of or all of the money in such cases.
This indicates that the main reason for the malpractices in Chit business has
been the operation of unregistered and informal Chit Funds. The victims are
more among the agriculturists and least in business class and salaried.
182

5.4 ASSESSMENT OF CHIT FUNDS WITH SPECIAL REFERENCE TO KSFE
Chit Funds, which originated in Kerala in ancient times, has grown
gradually to be a decisive factor in the financial sphere of the State. Since the
emphasis of the study is on KSFE, this section attempts to make an
assessment of Chit Funds with special reference to KSFE. A comparative
assessment of various Chit Funds has been made by considering their
important success and failure factors, reasons for preferring various Chit
Funds and by using Chit Funds Rating Analysis.
Assessment of KSFE:
KSFE is the only public sector Chit Fund existing in the whole of
India. It is the dominant Chit foreman among the registered Chit institutions
in the State. This section presents an analysis of the awareness on KSFE
schemes, popularity and attractiveness ofKSFE schemes, opinions of both the
subscribers and Employees on the quality of KSFE schemes and a comparative
assessment of KSFE Chits with the Chit schemes of its competitors.
5.4.1 Awareness on KSFE
Table 5.28 analyses the awareness of subscribers on varIOUS
schemes of KSFE, their awareness regarding the special privileges enjoyed by
the Company, as a Government owned Chit Fund.
Table 5.28 shows that 71.25 per cent (36.25 + 35) of the
subscribers are aware of the Chitty loan scheme, which is a scheme peculiar to
KSFE, to help the needy non-prized subscribers. But unfortunately, majority
(61.3%) of the subscribers have very little or absolutely no idea of the stamp
duty exemption availed of by KSFE. Only 53 per cent of the subscribers are
aware of the inter-branch remittance facility of Chits. 43 per cent of the
subscribers have little or no awareness on the fixed ceiling on discount to
KSFE Chits. The awareness on the saving schemes of KSFE like Sugama
Deposit (67.5%) and Fixed Deposit (66.5%) has not been satisfactory, and so
183

needs more publicity. The loan schemes of KSFE like Hire Purchase (61%)
and Gold Loan (57.3%) though known to them. also need wide publicity.
Table 5.28
Awareness on KSFE
Awareness on KSFE Very Well To Some Very LittleNot Total
Extent Aware
I Chilly Loan145 140 48 67 400
(36.25) (35.00) (12.00) (l6.75) (100)2 Stamp Duty 64 90 63 183 400
Exemption ( 16.00) (22.50) (15.75) (45.75) (lOO)3 Inter Branch 149 63 50 137 400
Remittance (37.25) (15.75) (12.50) (34.25) (100)4 Fixed Ceiling on 181 47 42 130 400
Discount (45.25) (11.75) (10.50) (32.50) (100)
5 Sugama Deposit152 118 46 84 400
(38.00) (29.50) (11.50) (21.00) (100)
6 Fixed Deposit132 134 54 80 400
(33.00) (33.50) (13.50) (20.00) (100)7 Hire-Purchase 70 174 70 86 400
Scheme (17.50) (43.50) (17.50) (21.50) (100)
8 Gold Loan76 153 10 101 400
(19.00) (38.25) (17.50) (25.25) (100)Source: Survey DataFigures in brackets represent percentage
5.4.2 Popularity and Attractiveness
Though KSFE has been established as a Chit institution. as part of
diversification. it has introduced a number of other schemes to cater to the
needs of different categories of people. Table 5.29 shows that. an
overwhelming majority (73.13 %) of the subscribers views Chitty as the most
attractive scheme of KSFE. Sugama deposit (5.63 %) and fixed deposit (1.25
%) are the other attractive schemes mentioned in the order of importance.
Occupation-wise analysis also shows similar trends. The attractiveness of
Chits was the highest for the business class and least for the Agriculturist. For
the farmers. Sugama appeared to be more attractive as compared to other
occupation categories. Our survey among the KSFE employees also showed
similar picture.
184

Table 5.29
Popularity and attractiveness of KSFE Schemes among Subscribers
Schemes Agriculture Business Salaried Class Others Total
Chit Schemes12 21 67 17 117
(63.16) (80.77) (72.83) (73.91 ) (73.13)
Fixed Deposit - - 1 1 2(0.00) (0.00) {1.09} (4.35) {1.25} ,
Hire purchase - - 1 - I(0.00) (0.00) (1.09) (O.OO) {0.63}
House Loan - - - 1 1(0.00) (0.00) (0.00) (4.35) {0.63}
Sugama3 1 4 1 9
(15.79) (3.85) (4.35) (4.35) (5.63)
No Opinion4 4 19 3 30
{21.05} (l5.38) (20.65) (13.04) (18.75)
Total19 26 92 23 160
(lOO) (lOO) (100) (100) (lOO)Source: Survey Data
Figures in brackets represent percentage
Table 5.30
Popularity of KSFE Schemes as Ranked by Employees
No Schemes Rank
1 Chitty 1
2 Chitty loan 2
3 Fixed deposit 3
4 Sugama 4
5 Hire purchase 5
6 Gold loan 6
7 House loan 7Source:Survey Results.
Majority of the employees also consider Chitty as the most popular
and profitable scheme of the company (Rank 1). followed by Chitty loan
(Rank 2). The other schemes of the Company in the order of popularity are
Fixed Deposit, Sugama, Hire Purchase. Gold Loan and House Loan. Though
KSFE has diversified its operations. some of the schemes are not attractive.
The poor contribution of these schemes to the total revenue of the Company
substantiates this fact. (See Chapter 4. Table 4.25) Sugama Deposit Scheme,
185

similar to the Savings Bank Account is a very competitive product and so it
warrants appropriate strategies for popularisation.
5.4.3 Quality of KSFE Schemes
Opinions expressed by the subscribers as well as the employees 011
the main drawbacks of different schemes are of vital importance. We have
already seen that Chit scheme is the core business of KSFE. Yet 83.4 per cent
of the subscribers consider complicated formalities (53.4%) and unscientific
security norms (30%) as distinct problems of the KSFE Chit Scheme, followed
by fixed ceiling on discount, long queue for cash remittance, the issue of
Account Payee Cheque for the prize money and the indifferent attitude of the
Staff: The details are shown in Table 5.28 . Responses of 253 subscribers who
have direct association with KSFEare depicted in Table 5.31.
Table 5.31
Problems Faced by KSFE Schemes: Subscribers' views........ Chilly
No.-~hemes Hire House Fixed Sugama Gold Chit Scheme
Problems ' ......... Purchase Loan Deposit Deposit Loan Loan'"........
1 Not attractive 123(48.9) 139(55) - - - - -2 Security norms . - - - - 20 (7.9) 76(30.0)
3High Rate of
83(32.7) 101(40) - - 123(48.9) 203{80.2) -interest
4Procedural
26 (10.2) 13 (5) 16(6.4) 30 (11.9)Delay. - .
5Complicated - - - - - - 135(53.4)Formalities
6Account Payee - - 182(71.8) - - - 8(3.2)Cheque
7FixedCeiling - - . - - - 16(6.3)onDiscount
8Lackof Public
21(8.2) 13(5) 131{51.6) 83{32.7)Awareness - -
9Long queue at - - 26(10.3) 65(25.8) - - 14{5.5)cashcounterIndifferent
10 Attitude of the - - - - - - 4{1.6)Staff
11No problem at - - 16(6.4) 57(22.6) 16(6.4)all - -
Total 253 (100) 253(100) 253(100) 253 (lOO) 253 (lOO) 253 (lOO) 253{l00)
Source: Survey Data. FIgures to Parenthesis show percentage.
186

Specifically, on the problems of KSFE Chits the subscribers and
the employees have similar views. The details on the opinion expressed by the
employees on the problems of Chit scheme are given in Table 5.32.
5.4.4 Drawbacks of the Loan Schemes of KSFE
a) Hire purchase scheme: The Hire Purchase scheme was considered as
unattractive to 48.9 per cent of the subscribers and 32.7 per cent considered high
rate of interest as another major difficulty of the scheme. 10.2 per cent considered
procedural delay as yet another problem.
b) House loan scheme: House loan scheme ofKSFE has been observed unattractive
(55%) when compared with similar schemes of other institutions mainly due to
the high rate of interest.
c) Cbit loan scheme: The main problems of the KSFE Chit loan scheme are the
high rate of interest (80.2%)and procedural delay (11.9%).
Thus the customers of KSFE in general categorically state that the
rate of interest charged by the institution on its various schemes has been
rather high. The two schemes, viz, Hire Purchase and House Loan are
considered not at all attractive by the respondents. The employees themselves
observed that the House Loan Scheme of KSFE is not attractive especially
when compared with similar schemes of banks and other financial institutions.
Besides, they also felt that the rate of interest is high on its various schemes
(See Table 5.32).
5.4.5 Drawbacks of the Deposit Schemes of KSFE
The paying back of Fixed Deposit at maturity by Account Payee
Cheque (71.8%) has been observed as the main inconvenience of the Fixed
Deposit scheme. (See, Table 5.31). The other problems of the Fixed Deposit
scheme are the procedural delay and lack of public awareness. The problems
highlighted on the Sugama deposit scheme have been lack of public awareness
(51.6%) and procedural delay (25.8%).
187

5.4.6 Opinion of Employees on Problems Faced with Respect to KSFE Schemes
Table 5.32 gives the scheme-wise analysis of the problems pointed
out by the employees of KSFE.
Table 5.32
Problems Faced by KSFE Schemes: Opinion of Employees.
Chitty Hire Chit Gold SugamaFixed
No.~s House DepositProblems Scheme Purchase Loan Loan Loan Deposit
1 Procedural Delay57 17 24 4 2 3 1
(34.5) (10.3) (14.5) (2.4) (1.2) (1.8) (.60)Unscientific Security 35 3 2 1 -
2Norms (21.2) (l.8) ( 1.2) - (.60) -Indifferent Attitude of 2 5 2 -3 the Staff (1.2) (3.0) (1.2) - - -
4Long queue at cash 17 7 1 4 7counter (l0.4) (4.2) (.60) (2.4) (4.2)
High Rate of Interest17 27 62 19 -5 - (l0.4) (l6.4) (37.6) ! (l1.5) -
6Absence of Company 14 ITie up - (8.5) - - - - (.60)
7 Account Payee Cheque13 2 1 25
(7.9) - - (1.2) (.60) - (l5.2)Absence of Competitive
1 1 1 315
8 Rate of Interest for - (.60) (.60) (.60) - (1.8)(9.1)
Deposits.
9Lack of Public 1 13 4 12 43 57 19Awareness (.60) (7.9) (2.4) (7.3) ,(26.1) (34.6) (11.5)Not Attractive when
19 26 4 7 53
9 compared with other - (11. 5) (15.8) (2.4) (4.2) (3.0)(1.8)
Institution
10Not Responded/No 38 69 79 76 91 93 94Problem (23) (41.8) (47.9) 1(46.1) (55.2) (56.4) (57)
Total165 165 165 165 165 165 165
(lOO) (lOO) (lOO) (lOO) (lOO) (lOO) (lOO)
Source: Survey Data.Figures in Parenthesis show percentage.
Though 23 per cent of the employees find no serious problem with
KSFE Chits, 55.7 per cent consider procedural delay and unscientific security
norms as the distinct problems of the Chit scheme. The other important
problems of the Chit scheme are long queue for cash remittance, cheque
payment of prize amount and indifferent attitude of the staff.
As far as the House Loan Scheme, and Hire purchase scheme of
KSFE is concerned, the employees themselves observe them as not attractive,
188

especially when compared with the similar schemes of banks and other
financial institutions. Besides they feel that the rate of interest is very high.
The distinct problems of KSFE gold loan scheme have been its lack of public
awareness and high rate of interest. The majority of the employees view the
major problem of the KSFE Chitty loan scheme as the high rate of interest.
At the same time, 57 per cent of the KSFE employees find the
Fixed Deposit scheme of the Company as free from grave problems. But 15.2
per cent consider the Cheque payment of money at maturity as a problem.
Another 11.5 per cent view lack of public awareness as a matter of great
concern. The Sugama Deposit scheme though attractive, lacks public
awareness (34.6%). Another practical difficulty has been the long queue at the
counter for remittances and withdrawals, since all schemes are operated at a
single window counter. This reveals that Deposit schemes of KSFE, though
attractive suffer from certain operational difficulties.
Summarising the main problems faced by the various schemes of
KSFE, it is seen that Hire Purchase and House Loan are the less attractive
schemes of the Company. Schemes with high interest cost are Chitty Loan,
Hire Purchase, House Loan and Gold Loan. Schemes with complicated
security norms are Chitty and Chitty Loan. Procedural delay is a major
problem faced by all schemes of KSFE. Sugama, Fixed Deposit and Gold
Loan are the schemes considered comparatively problem free.
5.4.7 Competitors To KSFE
There are different types of institutions offering Chits to the public
and there exists intense competition among them. Since this study is with
special emphasis on KSFE, an enquiry has been made on the main competitors
to KSFE. (The opinions of both subscribers as well as the employees of KSFE
have been used for this purpose.) The Chit subscribers were asked to make a
comparative assessment of KSFE Chits with co-operative Chits and also with
private Chits.
189

Table 5.33
Subscribers' Assessment of KSFE Chits with Co-operatives
Options Frequency Percentage i
KSFE is better 168 (42.00) I
I
Co-operatives are better 164 (41.00)
Both are similar/same 66 (16.50)
Both are bad 2 (0.50)
Total 400 (100)
Source: Survey Data
The comparative assessment of KSFE with co-operative Chits
reveals that 168 subscribers (42%) consider KSFE as better and 164 (41%)
consider co-operative Chits as better. Only 16.5 per cent have equal
preference for both KSFE and Co-operatives. What is worse is that KSFE does
not appear to have any mileage over co-operatives over the Chit business.
Thus it clearly reveals that the main competitor of KSFE Chits has been the
Chit schemes of the Co-operatives.
Table 5.34
Subscribers' Assessment of KSFE Chits with Private
Options Frequency Percentage
KSFE is better 273 68.25
Private is better 83 20.75
Both are similar/same 39 9.75
Both are bad 5 1.25
Total 400 100
Source: Survey Data
The opinion of subscribers on KSFE Chits and Private Chits reveals
aclear preference (68.25%) for KSFE. Only 20.75 per cent consider Private
Chits as better.
190

Opinion of employees on competitors to KSFE Chits also agrees
with that of subscribers. 48.5 per cent of the employees consider co-operative
societies or banks, which conduct conventional Chits together with 'Chit like
schemes' of MDS or MBS as the strongest competitor to KSFE. Private Chit
institutions are (41.8%) also a threat to the Company.
Table 5.35
CfEo ..'pmlon 0 mptoyees on ompentors 0
No. Institutions Frequency Percentage
1 Cooperatives 80 48.5
2 Private chits 69 41.8
3 Informalchits 16 9.7
Total 165 100Source: Survey Data.
5.5.1 Assessment Of Chit Funds
Each type of Chit Fund has its own special features, which makes it
different from other Chit Funds. An attempt has been made to assess the
reasons for preferring a particular type of Chit by the subscribers. Based on
the experience and awareness of the subscribers on various Chit Funds, the
response of all the 400 subscribers have been analysed for an assessment of
Chit Funds. The important success and failure factors of different Chit Funds
have been analysed through the preferences revealed by the subscribers. This
section ends with a Chit Funds rating analysis.
Table 5.36: Assessment of Chit Funds
5.36A. Reasons to Prefer KSFE Chits
Reasons Average Score Rank1. SafetyAspect 5.92 1
2. Big Sala 4.89 2
3. Better Service (facilities) 4.63 34. Transparency and openness 4.58 4
5. Prompt Payment 4.38 56. Low Foreman Commission 3.86 6
191

5.36 B. Reasons to Prefer Co-operative Chits
Reasons Average Score Rank
1. Better Service 4.70 1
2. Salary deduction/Door/Daily collection 4.61 2
3. Prompt Payment 4.55 3
4. Payment before 45th day 4.36 4
5. Mutual Help 4.30 5
6. Less malpractices 4.21 6
5.36 C. Reasons to Prefer Private Chits (Kerala Registered)
Reasons Average Score Rank
1. Prompt Payment 5.04 1
2. Better Service 5.03 2
3. Cash Payment 4.72 3
4. Gifts/ Offers 4.48 4
5. Fixed Discount 3.33 5
5.36 D. Reasons to Prefer Private Chits (Outside Kerala)
Reasons Average Score Rank
1. Better Service 5.14 1
2. Personal contact 5.Il 2
3. Flexible Discount 5.09 3
4. Pooval / Quarterly/Half Yearly Chits etc. 4.81 4
5. Need Based 4.68 5
5.36 E. Reasons to Prefer Informal Chits
Reasons Average Score Rank
1. Personal contact 5.48 1
2. Need Based 5.06 2
3. Daily Collection 5.03 3
4. Door Collection 4.90 4
5. Quick Payment 4.89 5Source: Computed from Survey Data
Despite various critical failure factors like complicated formalities
and security norms, (See Section 5.3.9 and Table 5.26) the reasons for
preferring KSFE Chits in the order of ranking have been shown as safety
192

aspect, big sala Chits, better service, transparency and openness in auction
(Table 5.36A).
Table 5.36B shows the crucial success factors of co-operative Chits
as its better service including prompt payment and easy remittance of
subscriptionby salary deductions or daily collection. The major failure factors
of co-operative Chits are its subscription facility to members only and its
small size of the Chit sala (capital).
Table 5.36C shows the crucial success factors of private Chit with
registration in Kerala as its prompt and convenient payment of prize money
and better service. But the critical failure factors like instances of exploitation
and the small size of Chit capital make it a less attractive Chit Fund.
The distinct merits of private Chit Funds based outside Kerala, in
Jammu, Faridabad, etc., are their better service and personal relations with the
subscribers. The flexible discount system makes their Chits need based (Table
5.36D). But the chances of exploitation, cheating and lack of transparency are
the critical failure factors of these Chit Funds.
Table 5.36E shows that personal contact with subscribers, the
systems of flexible discounts making the Chits need-based and easy remittance
facilities are the main advantages of informal Chits. Since these Chit Funds
have no registration, chances of exploitation and cheating are high.
5.5.2 CHIT FUNDS RATING ANALYSIS
The Chit Funds Rating Analysis has been done on the basis of the
order of preferences revealed by the subscribers on the important success and
failure factors of different Chit Funds. The analysis attempts to capture, in
one number, an overall assessment of a Chit Fund's standing on the basis of
the subscribers' preferences vis-a-vis their peers. Weights (points) have been
assigned to these ranks (different levels) in reverse order to rationalise them.
To work out the Rating Analysis, ranking of parameters made by
the subscribers has been used. Scores (points) have been given to these ranks
193

to rationalise them. Subscribers' preference as rank one scores 12 points
(100%), as rank two scores 9 points (75%), rank three scores 6 points (50%)
and rank four scores 3 points (25%). When two or more Chit Funds received
identical ranks, they have been given the benefit of the same rank. This has
been shown in Table 5.37.
Table 5.37
Chit Funds Rating Analysis (Ho 12)
SI. Critical Success KSFE's Co-Op's PrivatePrivate
(Outside InformalNo Factors Standing Standing (Kerala) Rgd.)l. Safety/Security 12 9 3 - -2. Better Service 3 12 9 12 6
3. Prompt Payment 3 6 12 3 3
4. Personal Contact 3 6 6 9 12
5. Big Sa/a 9 - - 6 -
6.Salary Deduction/ - 9 6 6 6Door Collection
7. Flexible Discount - - - 6 9
8. Transparency 12 6 3 3 -9. Payment Before
9 3 - - 645th Day
10. Chit Loan 9 3 - - -11 Gift/Offer 3 - 3 6 3
12. Cash Payment - 6 6 3 6
Total 63 60 48 54 SI
Computed from Survey Data
The Chit Funds Rating Analysis (Table 5.37) shows that KSFE
Chits stand with maximum success factors of 63 points, closely followed by
Co-operatives with 60 points. This also reveals an unfavourable trend to
private Chits with Kerala registration (48) and for informal Chit Funds (51).
The Chit Funds Rating Analysis reveals that the critical success factors of
KSFE are its safety/security aspect and transparency in business, whereas
better service forms the critical success factor of co-operatives. The private
Chits with registration in Kerala are preferred for their prompt payment
whereas better service forms the critical success factor of private Chits with
194

bases outside Kerala. The main reason for preferring informal Chits is the
personal contact and good relations by the foreman with the subscribers.
The narrow difference in the overall rating between various Chit
institutions point to the fact that each of them has a niche market and
specialities which continue to help them to survive despite the tough
competition that exists.
Conclusion
The profile of Chit subscribers in Kerala shows the dominance of
the middle-aged group and middle-income group as the subscribers. It also
reveals the association of the educated class, the salaried and agriculturists,
with registered Chit Funds like KSFE and Co-operatives.
The analysis reveals that the main reasons for joining Chits are
their potential to provide future savings in advance, convenient and
contractual form of savings and dual option for saving and borrowing. Most of
the Chit subscribers have simultaneous Chit subscription in more than one
Chit institution and long periods of association with Chit Funds. This
indicates the popularity of Chit Funds.
Each type of Chit institution has its own success factors capable of
attracting subscribers. Similarly the critical failure factors of Chit Funds pose
difficulties to the subscribers. The most important reason for preferring KSFE
Chits has been its safety aspect while for the competitors, their better service.
The complicated formalities, difficulty in providing required security and the
indifferent attitude of the staff are the major failure factors ofKSFE. Security
norms, small size of the Chit sala and the limitation that the scheme is open to
members only are the problems of Co-operative Chits. Exploitation, safety
concerns and instances of cheating are the reasons for not preferring private
and informal Chits despite their personal touch and prompt services. The fact
that malpractices occur mainly from informal and unregistered Chit Funds
necessitates the strict enforcement of the Chitty Acts. A thorough perusal of
195

the utilisation pattern of prize money shows that, the majority uses the amount
for productive purposes.
The comparative assessment of peer Chit Funds based on the
preferences of the subscribers on different aspects shows a trend distinctively
in favour of KSFE followed by Co-operatives. It also points to the existence
of tough competition in the Chit Funds arena, requiring suitable responses
from the major players.
196

Notes and References
1. Chit is a contract or agreement between the Foreman and the Subscribers
for mobilising the savings of the group and lent out the same to one of
the members on the basis of the contract agreed upon.
2. Data regarding the malpractices of private Chit companies for the period 1990
2000 was collected by District Crime Record Bureau, Emakulam Rural District
Limit, 2001.
3. Quoted in the Malayalam Daily Newspaper, The 'Mathrubhoomi ',
Cochin, 13th March 2000, p.9.
197

CHAPTER SIX
CHIT FINANCE
Problems, Challenges and Opportunities
An elaborate analysis and appraisal of Chit Finance in Kerala has
been made in the previous chapter. This chapter which consists of four parts
presents the major problems, challenges and opportunities of Chit Finance in
general and of KSFE in particular. The first part deals with the problems of
Chit Finance in general. An attempt has also been made in this section to
review the regulatory aspects of Chit Finance by comparing the State and
Central Chit Acts. The problems of KSFE have been presented in Part H. Part
HI gives an industry analysis of Chit Funds by using the Five Forces Model,
and part IV attempts a competitive analysis of the Industry using BCG
Growth-Share Matrix and SWOT Analysis.
PART I
6.1 PROBLEMS AND CHALLENGES IN CHIT FINANCE
The problems in the realm of Chit Finance are partly due to the
nature of the business and partly due to certain provisions in the Chit Acts. In
the first section of this part we highlight the major problems in Chit Finance.
The problems that arise out of the weaknesses in the prevailing Chitty
legislation in the State, is brought out by comparing with the relevant
provisions in the Central Chit Funds Act. The problems that arise due to the
malpractices by the foremen are also analysed in this part. The review of the
Chit Acts and the data from both primary and secondary sources form the
basis for the analysis of this section.

6.1.1 Lapses in the Kerala Chitties Act, 1975
No law is valid and suitable for all times; it needs amendment from
time to time. The Kerala Chitties Act has not been amended till Ist April 2002
during the last 27 years. Our survey has revealed that the important lapses in
the Act that cause problems are small sa/a of the Chitty, fixed ceiling on
discount, cumbersome registration formalities for starting Chits, procedural
delay, difficulty in finding substitutes if subscribers discontinue and the need
for making payment from their-own pocket if subscribers have defaulted.
6.1.2 Small Chit sa« (Capital)
Section 3(5) of the Kerala Chitties Act provides that the Chit
amount in the case of anyone Chit conducted by a foreman shall not exceed
Rs.25,OOO. This has been the case for the last 27 years till the 2002
amendment. In the absence of the revision of this limit, the tendency has been
to float unregistered Chits or to start Chits with "outside" registration. The
growth of this type of Chit Funds without furnishing securities creates many
problems and deprives the State Government of its revenue. But this handicap
of limit to Chit amount is not applicable in the case of KSFE.
U.3 Ceiling on Discount
To discourage unhealthy bidding, Section 7(4) of the Kerala
Chitties Act insists on the ceiling of 30 per cent discount of the Chit amount.
But the urgent need for funds by two or more subscribers may result in one of
them getting the prize amount and others may be disappointed and often
forced to seek high-cost alternative. It may be pointed out that this provision
in the Kerala Chitties Act is more restrictive when compared to the provisions
in the Central Act, where the ceiling on discount is fixed at 40 per cent,
Ideally, the forces of demand and supply should play their role in determining
the discount subject to a limit. Hence there could be higher rate of discount at
least for Chits of longer duration.
199

6.1.4 Security to be Furnished by the Foremen
Section 15(1) of the Kerala Chitties Act insists that the foremen
should deposit in an approved bank an amount equal to the Chit amount or
invest in Government securities of the face value of not less than one and a half
times the Chit amount as security and transfer them in favour of the Registrar,
This provision also seems restrictive and impairs the liquidity of the foreman.
6.1.5 Flight of Foremen to other States
The volume of Chit business of the private Chit Funds shows a
decline from mid 1970's and forms only 6 per cent as on 10-3-2000 2. This is
not due to a real fall in their business, but because of the fact that they fall
outside the official record. Majority of the private Chit foremen operate their
business with bases outside Kerala but with the subscribers solely from the
State. This causes loss of revenue to the State by way of registration fees.
Moreover such Chit institutions are not obliged to keep security with the
Registrar, which may be one of the reasons for malpractices seen in the field
of Chit business. All the Chit foremen interviewed have highlighted the
restrictive nature of the Kerala Chitties Act as the main reason for the large
outflow of foremen to other states. This outflow of foremen to other states
solely for the purpose of avoiding registration in Kerala is certainly a very
dangerous trend.
6.1.6 Large Informal Sector
To a large extent, 'self-help groups' ID villages and even urban
centres conduct Chit business. An analysis of the reasons for the Chit failures
would reveal that most of them were unregistered Chit Funds. The
unorganised sector is guesstimated to be about four times the organised
sector', The growth of such a large unorganised sector without any State
control, apart from causing loss of revenue to the state, causes difficulties to
the subscribers. And as some fail, the 'cheat fund' stigma is affecting the
whole Chit business.
200

6.1.7 Informal Chits by Registered Firms
Many registered Chit Funds have been running unregistered Chits
on the strength of their reputation. The main motive behind this practice is to
save the registration fees and the security to be kept by the foremen. At the
time of inspection. they produce only the accounts of authorised Chits. Failure
to file the documents required by law with the Chitty Registrar in time,
irregularities in settling the accounts of defaulted subscribers, delay in
remitting un-disbursed prize amounts in the approved banks, non production
of balance sheets and Chit records, or absence of audit are some of the
frequently noticed defaults in the course of inspection of the accounts of Chit
foreman by the departmental authorities 4. The growth of the large number of
informal Chit Funds and the instances of Chit failures resulting in heavy
losses to the subscribers are the net results.
6.1.8 Defaults and Failures
Lack of disciplined and organised growth of Chit Funds end with
defaults and failures. The operation of Chit Funds by individuals and
institutions without financial soundness causes Chit failure and misery to the
subscribers.
6.1.9 Default and Arrears by the Subscribers
Delayed payments and defaults especially by prized subscribers can
choke the cash flow of the foreman. Economic recession and the consequent
impact on the level of income of subscribers have affected Chit business
unfavourably.
6.1.10 Absence of Regulatory Authority
Absence of any Regulatory Authority to serve as an effective
enforcer of standards and as a problem solver also creates difficult problems
to Chit business.
201

Many of the lapses mentioned above, it is clear, can be linked to the
provisions in the Kerala Chitties Act. It can also be seen that the private Chit
foremen who have tried to escape from the restrictions of the Act have indulged
in certain unfair practices creating difficulties to the subscribers and loss to the
State's exchequer, besides bringing bad reputation to the entire industry.
6.2 UNFAIR PRACTICES BY FOREMEN
The present environment in Chit business provides ample scope for
exploitation of the needy by unscrupulous foremen. The malpractices in the
sphere of Chits often go unnoticed, as their effects diffuse across several people
over a long period. The victims (subscribers) being spread over a wide area
either suffer their losses or are forced to be satisfied by realising only a portion
of the due amount. Our study has revealed that enrolment of bogus subscribers,
drawing of prizes in the name of bogus subscribers, delaying the disbursement
of prize amount and similar malpractices exist in Chit bnsiness''. One of the
provisions, which gives room for manipulation by the foremen, is the
substitution of subscribers. The substitution procedure enables the foremen to
start a Chit with less than the required number with a few bogus subscribers.
6.2.1 Chit Funds and Money Spinning Activities
Many private foremen neither stop with one Chit nor wait for
successful termination of the Chit, for the launch of new Chits. The money
collected as subscription for the successive series of Chits, could be rolled to
their-own advantage even for money lending business. They often fail to keep
regular accounts 6.
6.2.2 Disappearance of Foremen
The occasional Chit failures because of irregularities,
misappropriation or massive default and the consequent disappearance of Chit
foremen cause socio-economic repercussions. The non-prized subscribers are
the ultimate victims and organised action on their part for redemption is
almost impossible/non-effective 7.
202

6.2.3 Delay in the Disbursement of Prize Amount
Financial prudence demands that the foreman should ensure prompt
payment to subscribers even when some members do not pay the subscriptions
promptly. But unfortunately, one ot' the toremost malprsotioes has been
centered on the disbursement of the prize amount. The disbursement of prize
amount m.a"j be de\a"jed dehberatel"j b"j ado-pting dilatory tactics in the
verif\\~ation am\ acce-ptance o~ tne ~ec\lt\t"j ~\lm\~ned. b'J fue ~\lb~ct\bet~.
Persons with inadequate means also start Chit Funds. Their intention might be
to spin some quick money. But their operations have damaged the reputation
of Chit Funds (See Chapter 5, Section 5.3.10).
6.2.4 Mixing Chit Business with other Businesses
The Acts on Chits insist that no company carrying on Chit business
shall conduct any other business. But studies have shown that Chit Funds
which have obtained licenses also run money lending business unauthorised 8.
The majority of the foremen interviewed by the researcher have listed the
main reasons for the failure of certain Chit companies as their entry into other
fields of business like gold loan and money-lending and even risk- prone areas
like the film industry.
6.3 COMPARISON OF CHIT ACTS
In the earlier part of this section we have already made some
comparative references to the Kerala Chitties Act, 1975 and the Central Chit
Funds Act, 1982. In this section we propose to make a more detailed
examination as to what extent some of the problems of Chit business in Kerala
are due to the lapses/inadequacies of Kerala Chitties Act, even with the
amendments made in April 2002 9. This section also brings out the superiority
of the Central Act over the Kerala Chitties Act.
A comparative study of the Kerala Chitties Act, 1975 and the
Central Chit Funds Act, 1982 shows a number of similarities and differences
in its provisions.
203

Whereas the Kerala Chitties Act, 1975 extends to the whole of the
state of Kerala (repealing the Travancore Chitties Act 1120, the Cochin
Kuries Act VII of 1107 and the Cochin Starting of Kuries [Restriction] Act,
XII of 1120), the Chit Funds Act, 1982 extends to the whole of India except
the state of Jammu and Kashmir, repealing the various Acts in the States
including the Kerala Chitties Act, 1975.
Many provisions of the Acts on Definitions of Chits, Chit Amount,
Discount, 'Drawing', Foreman, Registrar, Subscriber, Ticket etc., are the
same in both Kerala Chitties Act and in the Central Act. However, a number
of provisions of the Chit Funds Act, 1982 seem less restrictive and more
appealing (both to the subscribers and foremen) than the Kerala Chitties Act
for the disciplined and healthy growth of the Chit Fund industry.
Section 4 (1) of the Chit Funds Act, 1982 which states that no Chit
shall be commenced or conducted without obtaining the previous sanction of
the State Government within whose jurisdiction the Chit is to be commenced or
conducted or of such officer as may be empowered by that Government on this
behalf and unless the Chit is registered in that State in accordance with the
provisions of this Act may be sufficient to prevent the outflow of foremen to
other States for registration. However this section has not been included in the
Kerala Chitties Act, resulting in a large outflow of foremen to outside State. It
is with the objective to prevent this flight of foremen that, The Kerala Chitties
Amendment Act 2002 inserted a sub-section after subsection 1 in section 4. The
new subsection "(1) (a) insists that where a Chito/ is registered outside the State
and twenty percent or more of the subscribers are persons normally residing in
the State, the foreman of the Chitty shall open a branch in the State and obtain
sanction and registration under the provisions of this Act." The impact of this
new subsection is yet to be assessed, as it is too early.
The adaptability of the Chit Funds Act, 1982 over the Kerala
Chitties Act, 1975 is also evident with respect to the provision on the rate of
discount. Section 6 (3) of the Chit Funds Act, 1982 which stated that, the
amount of discount in a Chitty shall not exceed 30 per cent of the Chit amount
204

ias been amended in 2001 to enhance the ceiling on discount to be foregone
~ a prized subscriber to 40 per cent. The same provision in the Kerala
Chitties Act, Section 7 (4) still insists that the amount of discount in a Chit
shall not exceed 30 per cent of the Chit amount (See, our discussion in 6.\.3.).
Provision on keeping Minimum Capital (Section 8(1», creation of a
reserve fund out of the balance of profit (Section 8 (3», prohibition of
transacting business other than Chit business by a Company (Section12 (1»
and restriction on the utilization of fund collected in respect of such business
(Section 14) are present only in the Central Chit Funds Act. The above
provisions will be highly useful for the disciplined growth of the Chit Fund
industry and to safeguard the interests of the subscriber and the foreman. But
Ibis section is not included in the Kerala Chitties Act, resulting in default,
diversion of funds and instances of failure of Chit Funds.
Section 13 (1, 2a, 2b and 3) of the Central Chit Funds Act explains
the provision on aggregate amount of Chit. The Chit Funds (Amendment) Act
2001 has amended the original Act of 1982 in order to enhance the aggregate
ceiling amount commenced or conducted by a foreman other than a firm or
association of other individuals or a company or co-operative society from
Rs.25,OOO to Rs. 1 Lakh. It also increased the ceiling on aggregate Chit
amount conducted by a firm or association from Rs. 1 Lakh to 6 Lakhs. In all
other cases, it has been raised from a ceiling ofRs.25,OOO with respect to each
partner or individual to Rs. One Lakh. The above mentioned Section 13 of
Chit Fund Act, 1982 seems better and more acceptable both to the foremen
and the subscribers than Section 3 (5) of the Kerala Chitties Act or even the
amended Kerala Chitties Act 2002, which has removed the ceiling on Chit
amount altogether. This removal might have dangerous repercussions
especially in the case of a Chit failure where the subscribers lose huge
amounts. So it is better to have a ceiling on the aggregate Chit amount that the
private Chit foreman can conduct as in the case of the Central Act 10.
Section 14(1) of the Central Act on the utilization of funds insists
that no foreman shall utilize the funds collected in respect of such business,
205

except for carrying on Chit business. or for giving loans and advances to non
prized subscribers on the security of subscriptions paid by them or investing
in trustee securities or making deposits with approved banks mentioned in the
Chit agreement. This provision can protect the Chit Funds from any failure
and provide security to the subscribers. But unfortunately this provision too
has not been included in the Kerala Chillies Act.
Section 19 of the Central Chit Funds Act on restrictions in opening
of new place of business provides that no person carrying out the business of
Chit Fund shall open its business in a new place without the prior permission
and approval of the Registrar within whose territorial jurisdiction his place of
business or principal place of business is situated. Before consenting. the
Registrar shall consult the Registrar of the State in whose jurisdiction the new
place of business is proposed to be opened. This provision may be sufficient
for the healthy growth of Chit business in the State. The inclusion of this
provision in the Kerala Chitties Act will prevent the present practice of
starting Chits with bases outside Kerala to a great extent.
The provision on security to be kept by foreman is more restrictive
mthe Kerala Chillies Act than in the Chit Funds Act. 1982. Section 20 of the
Central Act has been amended to provide that the deposit in the name of the
Registrar shall be an amount equal to 50 per cent of the Chit amount in cash
kept in an approved bank and the balance 50 per cent of the Chit amount in
the form of bank guarantee. But the Kerala Chitties Act (Section 15) requires
that every foreman shall deposit in an approved bank an amount equal to the
Chit amount or invest in Government securities with the face value of not less
than one and a half times the Chit amount.
Section 73 of the Central Act explaining the advisory role of RBI
and Section 87 providing power to the State Government to exempt any
person or class of persons or any Chit or class of Chit from all or any of the
provisions of this Act are the other novel provisions of the Central Act.
Section 70A in the Kerala Chillies Act explaining the power of the
Government to exempt any Company owned by the Government or Co-
206

operative society from all or any of the provisions of the Act is similar to
Section 87 of the Central Chit Funds Act. But Section 73 of the Central Act
explaining the advisory role of RBI is not included in the Kerala Chitties Act.
Many of the provisions of the Central Chit Act, which seem better
for the phenomenal growth of the Chit Fund industry. are not included in the
Kerala Chitties Act. The Kerala Chitties Act is still restrictive even with the
amendment of the Act in April 2002. At the same time, the Central Chit Funds
Act is more subscriber as well as foreman friendly. In fact. our discussions with
the foremen revealed that majority of them are in favour of the implementation
of statutory regulations for the orderly conduct of Chit business. However, they
were more in favour of the implementation of the Central Chit Funds Act in
Kerala because of its less restrictive and distinct features of prudential
regulations as compared to the Kerala Chitties Act, 1975.
PART II
6.4 PROBLEMS AND CHALLENGES OF KSFE AS A CHIT FUND COMPANY
KSFE is a profit making State-owned Chit Fund Company and also
the leader of the Chit Fund business in the formal sector. In this part. an
attempt has been made to analyse the major problems and challenges faced by
the Company. Both primary and secondary data and the discussions with the
icp officials of KSFE apart from our discussions in Chapter IV have been
used for this analysis.
I. As seen in Chapter IV, the capital base of the Company is not adequate.
KSFE with an annual business turnover of Rs.2,830 Crore as of 2000
2001 operates with a mere Rs.3 Crore equity capital and with a net worth
ofRs.7.5 Crore. The percentage of net worth to the total borrowed funds
has been continuously declining due to an increase in the volume of the
latter. (See, Chapter 4. Table 4.1).
2. Poor customer service in terms of procedural delay, cumbersome security
norms, problems in long queue for cash payment. delayed payment of'
prize money, insistence on cheque payment, absence of daily and door
207

collection, etc., adversely affect the image of the Company and its
reputation, despite its safety aspect as a government Company. (See,
Chapter 5, Table 5.26)
3. Absence of computerisation creates operational difficulties.
Computerisation can offer better service at greater speed. Computerised
accounting, inter branch information facility through networking and
better control system at the Head Office are yet to be realised.
4. Training facility to the staff has been desperately inadequate. Many
employees are not aware of the recent changes taking place in the
financial sector. The majority of the KSFE employees (60.6%) considers
the present training facilities as inadequate and considers it a matter of
urgency. Lack of clarity on their part on the norms and terms of the
various schemes causes loss of time and inconvenience to the customers.
5. The indifferent attitude of the staff towards the customers affects the
efficient working of KSFE. The Chit subscribers have clearly revealed the
indifferent attitude of certain staff as an important reason for not
preferring KSFE Chits. (See Chapter 5, Table 5.26)
6. Discussions with officials of KSFE reveal that strong labour unions and
the sense of job security seem to have adversely affected the efficient
functioning of KSFE. The introduction of new schemes like daily door
collection of Chits and even computerisation has been delayed due to
their interference.
7. The problem of default is a serious matter affecting the smooth operation
of the Company and is an index of its administrative inefficiency. In the
case of New Chitty Loan the level of non- performing assets is 17 per
cent. This is despite the fact that there has been 11.3 times increase in the
volume of revenue recovery of debtors, from Rs.244 Lakhs in 1992-93 to
Rs.2,768 Lakhs in 1999-00 (See Chapter 4, Table 4.26 and 4.28).
8. KSFE has concentrated its operation in urban and semi-urban centres. Thus
a very large proportion of the credit requirements of the rural areas are still
in the hands of the moneylenders and informal Chit Funds. A more realistic
208

way of looking at the strengths of KSFE is to enquire whether all the
sections of the rural population have been freed from the clutches of the
moneylenders and informal Chit Funds. With more branches or extension
counters in rural areas, KSFE can fulfill this social objective.
9. The Company has still not been able to implement one of the important
objectives to be pursued by it on its incorporation, namely, the business
of general and miscellaneous insurance of any kind. This is especially so,
in the light of the emerging economic environment with the opening up of
insurance sector, with commercial and even co-operative banks jumping
in or planning to do so.
10. Though the Company has made diversification of schemes, many loan
schemes are not attractive or popular and thus contribute only very little
to the total revenue of the Company. (See, Chapter 4, Table 4.25)
11. KSFE, being a government Company, has been subject to political
interference at different levels, which causes delay in implementing its
decisions. The hierarchical structure 11 of administration also causes delay in
decision-making and affects speedy implementation. Political interference
and pressure are common in transfer cases, in delaying the Revenue
Recovery and so can affect the smooth functioning of the branches.
12. Nominated Board of Directors, who have also other responsibilities in
their own departments, may not be able to utilise their full potential for
exploring the challenges and opportunities of KSFE. (See Chapter 4,
Section 4) This probably is an important reason for the lack of dynamism
and innovativeness in the Company.
PART III
6.5 INDUSTRY ANALYSIS
The Structure-Conduct-Performance 12 (S C P) framework suggests
that a firm's conduct and performance are largely determined by industry
structure. Strategy scholars have developed powerful models of environmental
'Threats and Opportunities' for describing industry conditions under which a
209

firm may be able to obtain competitive advantage. The most influential model
on environmental threats has been Michael Porter's Competitive Strategy. His
'Five Forces' 13 (Threats) in an industry as (1) threat of entry (2) threat of
rivalry (3) threat of substitutes (4) threat of suppliers and (5) threat of buyers
is quite relevant here. Figure 6.1 describes this model.
Figure 6.1 Five Forces Model
Barriers to EIltrY NewEntnmts
IndustryCOOlpetitors
IBlqen
Bargaining Power ......- ...,of Buyers I
I
Bargaining Powerof Suppliers .....ISuppliers :I------~
Puwer ofSuppliersIntensity
ofRivalry POKW ofBu.ven
Substitutes
A vaUabiJity ofSub6tiJu1es
Source: Michael E. Porter, "Competitive Strategy", New York, FreePress, (1980), p.4.
The operation of Chit Funds in India has been regulated by the Chit
Funds Act 1982, which was amended in 200 I. Sixteen State Governments and
6Union Territories have adopted the Central Act and the RBI is pursuing with
the other State Governments for early formulation of rules under the Central
210

Act. In Kerala, the Central Chit Funds Act is yet to be implemented and the
Chit business activities are regulated by the Kerala Chitties Act, 1975.
6.5.1 Threat of Entry
The Threat of entry into the Chit Fund Industry is high. KSFE with
its exemptions and protections enjoyed as a Government Company has been
diversifying its schemes to reap economies of scale and maintain its
leadership. But the entry of co-operatives with "Chit like schemes', Private
and Informal Chit Funds with minimum administrative costs raises serious
threats. KSFE with its 228 branch-network caters to the needs of various
income categories by offering Chits of different sala and duration. But KSFE,
as a Government Company possesses some of. the demerits of a Government
undertaking like procedural delay, unscientific security norms, lack of
customer care and service, high administrative cost and lack ofmodernisation.
The new entrants into the industry are taking advantage of the vulnerability of
KSFE by focusing on these points. Therefore, KSFE should focus on creating
entry barriers by providing better service and highlighting the safety aspect in
the areas where competitors perform better.
To overcome the difficult provisions of the Kerala Chitties Act, the
Private Companies have been starting Chits by opening branches nominally in
Jammu and Faridabad and performing the real business in Kerala. If some
provision can be introduced to plug this loophole in the Act, it may create
entry barriers. In fact, the Kerala Chitties Amendment Act, 2002 has been
introduced for preventing such unhealthy practices (See Section 6.3). So
KSFE could take the initiative to monitor the implementation of the Act.
The Private and Informal Chit Funds in the state offer attractive
gifts or incentives to the subscribers, for which the actual expenses are not
met from the revenue of the firm 14. Customer Awareness Campaigns could be
conducted by KSFE to reveal the real cost and return to the subscribers of
such Chit Funds, with a view to providing entry barriers.
211

6.5.2 Threat of Rivalry
The level of rivalry in the Chit business registered in Kerala has
not been very high. KSFE has a share of 80 per cent in the volume of Chit
business in the state. But if we consider the volume of Chit business in the
informal sector 15 and those Chit Funds based outside Kerala, the level of
rivalry is high. KSFE can focus on reducing the threat of rivalry by taking the
initiative for plugging the loophole in the Act and thus control the growth of
such informal Chit Funds with no regulation or outside registrations' At the
same time KSFE should enhance its competitive edge vis-a-vis other Chit
institutions by simplification of the complicated formalities and procedures.
providing better facility and attention to the customers, introducing
daily/weekly door collection of Chit subscription and by minimising the
administrative cost of the Company. This is all the more important in the light
of our finding from the Rating Analysis of the Chit Funds industry which
showed that the differences in the rating given for various Chit institutions are
not so broad as to be complacent.
6.5.3 Customers
The subscribers of Chit Funds are from vanous walks of life
including businessmen, traders, teachers, Government servants, professionals,
other fixed income groups, farmers. registered organisations and so on. The
secondary data shows an increase in the number of Chit subscribers and in the
volume of business. The data collected shows an increase in the demand for
KSFE Chits and a decrease in the number and business of private Chit Funds
registered in Kerala. (See Chapter 3. Table 3.8) With more than 7 Lakh
subscribers and an annual turnover of Rs.l :385 Crore, KSFE has been serving
the needy through its network of branches as of 2000-01.
Compared to other Chit Funds KSFE has been catering to the needs
of customers by offering Chits of different sala and of different durations.
The Chit loan facility, which is unique to KSFE, could satisfy the urgent
credit needs of non-prized subscribers. The diversification of various deposit
212

schemes and loan schemes enables the Company to attract more customers. By
offering better service through simplification of procedures and security
norms, more convenient ways of remittance of subscription through cheques,
through the sugama account, inter-branch remittance, etc. and easy payment
of prize money, the Company could attract more subscribers. For attracting
more customers, KSFE has to improve the quality of its service by speedy
sanction of loans, simplification of security norms, offering competitive rate
of interest and introducing innovative schemes.
6.5.4 Substitutes
There are some close substitutes to the Chit scheme. Monthly
Deposit Scheme and Mutual Benefit Scheme of co-operative banks and
societies are nothing but the Chit schemes in different names. This change in
nomenclature is for the purpose of escaping from the strict compliance with the
Chitties Act. Recurring deposits of banks and post-offices have some similarity
with the Chit scheme. Private Chit Companies also operate as finance
companies and offer incentives/bonus/gifts, etc. to its customers and pause
competition to KSFE. Though, not close substitutes, the financial sector has
opened a wide multitude of new saving and investment avenues including tax
saving instruments in the fields of mutual funds, insurance, and stock market,
Our analysis on the economics of Chits have also pointed out that in the present
environment of falling interest rates, Chitty as a medium of pure savings is in
danger of losing its charm. To face the threat of substitutes the Company should
think of innovations and introduce diversification of schemes. The important
features of Chit schemes like dual option for saving and borrowing, providing
future savings in advance, ability to fix the cost of borrowing, monthly
dividends reducing the subscriptions, the aspect of forced savings, etc. make it
a unique saving-cum-credit scheme. The above features of the scheme if fully
exploited should enable the Chit Funds to increase the customer network.
213
6.5.5 Threat of Suppliers
For a Miscellaneous Non-Banking Company, the suppliers are
suppliers of finance. Since they have a lot of other investment avenues, their
bargaining power is generally high. The switching cost is almost zero. The
deposits mobilised under Government guarantee, loans from the Government
and reserves and surpluses are the major sources of finance to the Company.
In order to make KSFE more acceptable, its customer service should he
improved. The loan schemes or deposit schemes offered by various financial
institutions including banks at attractive terms and conditions, and the
continuing general fall in the cost of funds (rate of interest) pause tough
competition to the Chit Fund Industry.
6.5.6 Performance
In the light of the 'Five Forces' analysis of the Chit Fund industry,
itseems that the level of threat in this industry is not very high still the level
of performance is rather high. The popularity of Chit schemes among the
people in Kerala itself is an added advantage, Practically every household in
Kerala has been associating with some Chit institution or the other.
PART IV
6.6 COMPETITIVE ANALYSIS
Since the present study is on Chit Finance with special emphasis on
KSFE, it is apt to attempt a competitor analysis for KSFE 16. BCG Growth
Share Matrix and SWOT analysis have been used in this part for the purpose
of analysing the challenges and opportunities of KSFE vis-a-vis its
competitors17 .
Business strategies focus on improving the competitive position of a
Company's or business unit's product or services within the specific industry or
market segment that the Company serves. The business strategy asks how the
Company or its units should compete in each industry. For the purpose of
formulation of strategies for each Strategic Business Unit ]8 (S B U), relevant
214

Critical Success Factors (C S Fs) have been identified and Company's position
as Strong, Weak or Average of these factors are also assessed as shown below:
Table 6.1 Critical Success Factors for Strategic Badness Units
A: Chitty
Critical Success FactorsCompany's position
If
Strong Weak Average 11
I. Market Share of Chit in the Formal Sector ./ 1il
2. Share in the volume of Business of the Company ./ ]
I1
J. Profitability ./ l\t Safety and security ./ 'I
I
5. Innovation for attracting customers ./ II
6. Simple security norms ./ ili7.Recovery positions ./ I!
8. General quality of service ./ il~
B: Hire-Purchaser
Company's position 1
Critical Success FactorsStrong Weak Average
1. Share in the volume of Business of the Company ./I
2Profitability ./r.
J. Innovation for attracting customers ./
t Recovery performance ./
5. Simple security norms ./ 11
6. General Quality of Service ./r!
7. Interest rate charged ./
cGold Loan
Critical Success FactorsCompany's position
!
Strong Weak Average
I. Share in the volume of Business of the Company ./ \2Profitability ./ 1J. Innovation for attracting customers ./
,II'1I
t Recovery performance ./I
II5. Simple security norms ./I
6. General Quality of Service ./11
7. Interest rate charged ./ ,i
215

D: Trade Finance Loan
Critical Success FactorsCompany's position
Strong Weak Average
I. Share in the volume of Business of the Company ./ I2Profitability ,/
3. Innovation for attracting customers ,/
4. Recovery performance ,/,!
5. Simple security norms ./
6. General Quality of Service ,/
7. Interest rate charged ./
E: Housing Finance Loans
Critical Success FactorsCompany's position
Strong Weak AverageI. Share in the volume of Business of the Company ,/
2Profitability ,/
3. Innovation for attracting customers ,/
4. Recovery performance ,/
5. Simple security norms ./
6. General Quality of Service ./
7. Interest rate charged ,/
F: New Chitty Loans
Critical Success FactorsCompany's position
Strong Weak Average1. Share in the volume of Business of the Company ,/
2Profitability ,/
3. Innovation for attracting customers ./
4. Recovery performance ./
5. Simple security norms ,/
6. General Quality of Service ,/
7. Interest rate charged ,/
G: Deposits
Critical Success FactorsCompany's position
Strong Weak Average1. Share in the volume of Business of the Company ,/
2 Profitability ./
3.Safety and Security ./
4. General Quality of Service ./
5. Interest rate charged ,/
216

Amore concise Competitor Analysis of KSFE is given in Table 6.2 below:
Table 6.2
Competitor Analysis
~'FE's Competitor' CompdilonsImpol1ance of Affordability
CriIical Succeas Posilion Posilion Ability Recommended
IFactors Rating RatingImprovemeot in and Speed
Rating AcIion(1-10) (1·10)
RJding (L,M,H) (L,M,H) (LMID
1. Safety and10 5008 L L M Hold i
Security
2. Interest I Consider theFinance 8 4t09 M H H competitor's ratecharges on loans
3. Interest Iliquidity on 8 5t07 L L M Holddeposits
4. Simplicity in theS 6t09 H M H
Simplificationloan procedure e&1leIlt.ial
5. Effective ITo be improved ~practical 6 6009 H M H
security norms ~
6. General qualityTo beImproved 11
6 6t09 H M H by training and 1ofservice
• I
creatmg Iawareness .
7. Innovative I
schemes to 6 6t09 H M H To be improvedattractcustomers
There is furth«8. Branchnetwork 7 5 M M L scope for
expan.cQon
9. Niche Marketing 3 6008 H H M Select and adopt
Poor10. Efficiency of
S 7t09 H H H perfonnanee,Recovery Urgent action. .
11. Customer5 7009 M M H To beimproved
orientation
12. Social10 Sto8 L L M Holdobligation
13. Modernisation S 6008 L M HUrgent Action
Needed.
Source: Based on Report of the Study Group to Enquire into The Problems Faced by The
KSFE Ltd., School of Management Studies, Cochin University of Science and Technology,1999 with necessary modificationsand additions.
L=Low M= Medium
217
H= High

To summarise, the competitor analysis for the Chit Fund Industry
points to the following actions to be taken by KSFE for modernisation, branch
networking, introduction of innovative schemes, effective and practical
security norms, better quality of service and efficiency in recovery.
6.7 PORTFOLIO ANALYSIS
One of the most popular aids to developing corporate strategy in a
multi business corporation is portfolio analysis. In portfolio analysis, top
management views its product lines and business units as a series of
investments from which it expects a profitable return, The product
lineslbusiness units form a portfolio of investment that top management must
constantly juggle to ensure the best return on the corporation's invested money.
One of the most popular approaches is the BCG Growth- Share Matrix 19.
6.7.1 BCG Growth-Share Matrix
The Boston Consulting Group (BCG) Model, popularly known as
the BCG Matrix and Growth Share Matrix, is based on two variables, viz. ~ the
rate of growth of the product market and the market share held by the firm
relative to its competitors 20.
The vertical axis of the matrix measures the annual growth rate of
the market and the horizontal axis shows the relative market share of the firm.
Each of these dimensions is divided into two categories of high and low,
making up a matrix of four cells. These four cells are the 'high growth - low
market share cell' described as question mark, 'high growth - high market
share cell' called stars, 'low growth - high market share cell' called ea.sh
cows and 'low growth -low market share cell' described as dogs 21.
Figure 6.2 gives the BCG-Growth Share Matrix of KSFE and
describes the various stars, question marks, cash cows and dogs.
218

Figure 6.2 BCG Growth-Share Matrix of KSFE
JusinessGrowth~ale 10
0STARS QUESTION MARKS
@ 000
CASH COWS DOGS
0olOx
High+-1.5x Ix
Relative Market Share
.1 xLow-+
Note:- A =Chitty B =Hire Purchase C = Gold Loan T = Trade Loan
E= New Chitty Loan F = New House Finance Scheme.
Source: Based on B. Hed.ley"Strategyand BusinessPortfolio". Long Range Planning
(1997), p.12
Table 6.3 gives a better description of the four product cells of
KSFE.
Table 6.3
Product Cell
CellGrowth Market
Schemes Symbols StrategyRate Share
QuestionHigh Low
HP. Gold Loan.B. C. F. Build
Marks House Loan.
Stars High High NCL E Hold
Cash Cows Low High Chitty A Harvest
Dogs Low Low TFS T Disinvest
219

6.7.2 The Strategy
The BCG Matrix reveals that the contribution of Trade Finance
Scheme to the total revenue of the Company as well as to the volume of
business is negligible, and so not profitable (See Chapter 4, Table 4.25). But,
Trade Finance Scheme can be retained due to its social obligation as
supplementing the working capital requirements of small and medium traders
and businessmen. Chitty and its allied scheme Chitty loan are the profitable
and attractive schemes of KSFE. The appropriate strategy for them is to
'harvest' and hold respectively. The other loan schemes of the Company like
hire purchase, gold loan, and house finance scheme necessitate urgent
corrective and innovative measures to build them. Yet it needs to be realised
that housing finance has become a cash cow for most of the financial
institutionslbanks.
6.7.3 Default- Revenue Matrix
Default-Revenue Matrix has been framed to analyse the current
position of various schemes and to identify the strategic business units of the
Company. An analysis of the Default-Revenue Matrix given in Figure 6.3
reveals that Chitty ranks first in the share of total revenue (31.42 %) during
1999-00 (See Chapter 4, Table 4.25), but it has a higher rate (20 %) of
default. However, if we consider the default of collectable Chit amount 22 then
the default rate is negligible (1.6%) (See Chapter 4, Table 4.27).
But in N C L, which is an allied product of Chitty and is
contributing 30.16 per cent to the total revenue during 1999-00, the rate of
default is very high at 20 per cent of the loan amount, (See Chapter 4, Tables
4.25 and 4.26). This is certainly a matter of serious concern to the Company
and requires urgent corrective action.
220

Figure 6.3
Default - Revenue Matrix
High
00
LowLow Share in Total Revenue High
A= Chitty, B = HP, C = Gold Loan, D = TFS, E = NCL, F = HFS
From the point of view of revenue, the contribution of loan
schemes like Trade Finance Scheme (1.52%), Hire Purchase (6.14%), Gold
Loan (.58%), Fixed Deposit Loan (1.51 %), House Finance Scheme (3.25%),
New Fixed Deposit Loan (4.46%) are not attractive (See Chapter 4, Table
4.26). At the same time, the very high default rates of TFS (26%), HP (10%)
HFS (26 %) and NFDL (19%) are matters of concern to the Company. As far
as the gold loan is concerned, even though the share of revenue at present is
negligible, the loss due to default is almost nil. Therefore gold loan scheme
should be promoted. It also reveals the necessity for making the other loan
schemes of the Company attractive to the public. The rate of default of NCL
as already mentioned is very high. Since it is a fund-based product, the impact
of mounting default will be severe.
On the basis of the current position of various schemes of KSFE
as shown in the matrix above, we can project their future positions assuming
no change in strategy.
• Chitty is the strategic business scheme of the Company.
• N C L as an allied product of Chit is the next best strategic business unit.
But the mounting default rate poses threat to the growth of the scheme.
221

• The high default-low revenue share S B Us like hire purchase, house
loan, trade finance loan and new fixed deposit loan need a closer scrutiny
for corrective action.
• HP, Gold Loan, New fixed deposit loan and Deposit Schemes supporting
and supplementing the strategic Chit scheme requires future growth and
strengthening.
• The present position of T F S, T H F S is not satisfactory and need further
redesigning and fine-tuning for making them viable.
6.8 SWOT ANALYSIS AND STRATEGY FORMULATION FOR KSFE
Strategic management involves an analysis of the organisational
factors including the strengths and weaknesses of the organisation, and
environmental factors including threats and opportunities in the business
environment. The business environment presents two main challenges to the
enterprise, viz. the challenge to combat the environmental threats and to
exploit the business opportunities. There are many forces in the environment..
which influence the working of KSFE. These forces are classified under four
groups: social, technological, economic, and political/legal,
6.8.1 Social Environment
Social Environment is likely to create some opportunities because
of the government ownership of the Company. Since it is the only
Miscellaneous Non-Banking Company in the government sector with
transparency and openness, customers definitely have more faith and
confidence in the Company.
6.8.2 Technological Environment
Technological environment is expected to create some sort of threat
to KSFE in the near future. Absence of computerised accounting, network of
branches and automation of the branches cause inconveniences to the
customers and may affect efficient customer service. The minimisation of cost
222

along with business maximisation techniques is to be implemented in the
Company for its future opportunities and competitiveness.
6.8.3 Economic Environment
With the introduction of the new economic policy, which includes
Liberalisation, Privatisation and Globalisation, the government is keeping away
from many sectors and activities. The policy of the government now seems to
be to act as a facilitator rather than as a provider of service as done earlier.
Such a shift in the approach may lead to disinvestment of the Company even if
it is the only one of its kind in the government sector in India. If such a
situation arises, the Company has to forgo all the privileges enjoyed as a
government Company. Such a change, if it happens may create some
opportunities also. The lack of autonomy, the procedural delay, complicated
formalities and other usual governmental hindrances may disappear. At the
same time, the economic recession existing in the state and the lack of job
security in the service sector may act as a threat to the Company.
6.8.4 Legal Environment
At present many aspects of the legal environment are favourable to
the Company. The Company has been exempted from some of the provisions
of the Kerala Chittes Act, like Chitty sala limit, stamp duty exemption, etc.
But there are also some limitations in the organisation structure, which keep
KSFE subject to political and bureaucratic interferences. Though the
amendment of the Kerala Chitties Act, 2002 deprives the Company of its
monopoly of conducting big Chits, it infuses competitive spirit to face the
challenges and threats from competitors 23.
6.8.5 SWOT Analysis
While Strengths are positrve aspects internal to the entity,
Weaknesses are negative aspects internal to the entity. On the other hand,
Opportunities are positive aspects external to the entity and Threats are
negative aspects external to the entity. Strengths, Weaknesses, Opportunities
223

and Threats of KSFE as a Chit Fund Company have been analysed mainly on
the basis of the survey conducted among the Chit subscribers and among the
employees. Discussions with the officials of KSFE have also been used for the
analysis. The analysis is presented in Tables 6.4 and 6.5 given below.
Table 6.4 presents the vanous Strengths, Weaknesses,
Opportunities and Threats of KSFE and Table 6.5 looks at Strengths and
Weaknesses against their corresponding Opportunities and Threats. Table 6.5
explains how strengths of KSFE can be utilised to exploit the opportunities
and overcome the threats. Besides, it also explains how to minimise
weaknesses of the Company by exploiting its opportunities by overcoming the
elements of threats to KSFE. Table 6.5 also presents the appropriate strategy
in the light of these Strengths, Weaknesses, Opportunities and Threats.
224

Table 6.4 SWOT Analysis for KSFE
Strengths1. Safety and Security due to State
ownership2. Social Commitment3. Network of Branches
4. Inter-branch remittance facility
5. Big Sala (Chit amount)
6. Loan Against Chitty
7. Various Schemes other than Chits
8. Transparency and openness
9. Large subscriber base10.Chits of different sala and duration11.Prompt Payment
12.Revenue to the State13.Company Tie-up of HP scheme
14.Professionally qualified personnel as
top officials of the Company15. Generation of Employment
Opportunities
1. ProtectionlExemption from Kerala
Chitties Act2. Salary Deduction Provision
3. Diversification in Financial services
4. Malpractices/Exploitation in Private
and in Informal Chits
5. PrevalenceofUnscrupulousChit Foremen
and 'Blade Companies' in ruralareas.6. FaIling rate of interest in deposit
schemes7. Lower returns/ Illiquidity in real
estate business8. Fluctuations in the stock/share markets
9. Sluggish Mutual Funds
225
Weaknesses1. Complicated Formalities and
Procedural Delay2. Security I Guarantee Problems3. Poor customer care
4. Indifferent Attitude of the Staff
5. Long Queue for Cash Remittance6. High Rate of Interest for Loans7. Cheque Payment of cash8. Lack of Need Based Service
9. Absence of Door/Daily Chit10. Less Incentives/Gifts to Attract
the Subscribers
11. Thirty per cent fixed Discount onthe Initial Instalments
12. Delay in decision making
13. High administrative cost.
14. High default rate15. Less computerisation and
modernisation.
Threats
1. Need based service by competitors.
2. Flexible discount in some other
Chit Funds
3. Prompt and quick payment by
competitors.4. Attractive Gift/offer schemes from
competitors
5. Facility for door and dailycollection by competitors
6. New schemes like monthly
deposit/monthly benefit schemes
by co-operatives.7. Lower administrative cost tor
competitors8. Genera) Economic Recession
9. Risk of Privatisation

KS
FE
~...._...
_..-
----
--
------
Str
en
gth
IW
eak
ness
(SW
)O
pp
ort
un
ity
/Th
reat(O
T)
Str
ate
gy
1.G
over
nmen
tOw
ners
hip
-Sa
fety
Exp
and
the
volu
me
of
Chi
tB
usin
ess
byst
arti
ngda
ily/w
eekl
yC
hit
and
Sec
urit
y,T
rans
pare
ncy
and
Rap
idgr
owth
ofK
SFE
.co
llec
tion
toat
trac
tbu
sine
ssgr
oups
,st
art
corp
orat
eC
hits
for
com
pani
es
Ope
nnes
san
dE
xem
ptio
nfr
omw
ithbi
gsa
lao
f25
Lak
hsan
d50
Lak
hs,
take
initi
ativ
efo
rth
est
rict
Chi
ttie
sA
cten
forc
emen
to
fth
eA
men
ded
Ker
ala
Chi
ttie
sA
ctto
prev
ent
oper
atio
no
f"o
utsi
de"
Stat
ere
gist
rati
on.
2.L
ess
mod
erni
sati
onan
dM
ore
effi
cien
tand
spee
dy
com
pute
risa
tion
.cu
stom
erse
rvic
eby
Intr
oduc
eco
mpu
teri
sati
onan
din
terl
ink
bran
ches
.co
mpe
tito
rs
3.N
etw
ork
ofb
ranc
hes
and
inte
rL
arge
subs
crib
erba
se,
Bra
nch
expa
nsio
nes
peci
ally
inru
ral
area
s,ex
tens
ion
coun
ters
orm
icro
easi
erre
mit
tanc
ean
dso
cial
bran
chre
mit
tanc
efa
cilit
yco
mm
itm
ent
bran
ches
ofK
SFE
.
4.C
ompl
icat
edfo
rmal
ities
and
Bet
ter
and
spee
dyse
rvic
eS
impl
ific
atio
no
fse
curi
tyno
rms,
com
pute
risa
tion
and
bette
rtr
aini
ngpr
oced
ural
dela
yfr
omth
eco
mne
tito
rs,
faci
litie
sfo
rex
pert
serv
ice.
S.N
ewC
hitt
yL
oan
Sch
eme
Scop
efo
rdi
vers
ifie
dan
dP
rom
ote
grow
thin
the
volu
me
ofN
ewC
hitt
yL
oan
with
min
imum
defa
ult
inno
vati
vesc
hem
esan
dco
mpe
titi
vera
teo
fint
eres
t.T
imel
yfo
llow
-up
and
6.H
igh
defa
ult
rate
dipl
omat
icm
easu
res
from
Ope
nD
efau
ltC
ells
inbr
anch
esfo
rst
rict
and
timel
yfo
llow
up.
com
peti
tors
.
7.D
iver
sifi
cati
ono
fsc
hem
esot
her
Incr
easi
ngco
mpe
titi
onbu
tR
edes
ign
sche
mes
espe
cial
lyH
ouse
Loa
nsc
hem
ean
dH
ire
Pur
chas
eth
anC
hit
sche
mes
scop
efo
rpr
ovid
ing
asc
hem
eto
mak
eth
emco
mpe
titi
ve.
fina
ncia
lm
arke
t.8.
Lac
ko
fnee
dba
sed
serv
ice,
long
Qui
ckse
rvic
e,do
or/d
aily
queu
eat
the
cash
coun
ter,
cheq
ueIn
trod
uce
dail
y/do
orco
llec
tion
thro
ugh
agen
ts,
repl
ace
cheq
uepa
ymen
tpa
ymen
tan
dab
senc
eo
fdai
lyco
llec
tion
and
also
paym
ent
with
cash
upto
One
Lak
h,ad
diti
onal
cash
coun
ter
and
even
ing
coun
ter.
coll
ecti
on.
from
com
peti
tors
.
9.H
igh
adm
inis
trat
ive
cost
Low
erad
min
istr
ativ
eco
stL
ower
the
adm
inis
trat
ion
cost
thro
ugh
scie
ntif
icm
etho
ds,
bran
ches
info
rco
mpe
tito
rsow
nbu
ildin
gto
avoi
dof
fice
rent
and
goin
gfo
rco
mpu
teri
sati
on.
N N '"

Summing up our discussion in this chapter, we have seen that the Chit business
is facing several difficulties and problems that may prevent the smooth growth of the
industIy. A comparison of the Central Chit Funds Act with the Kerala Chitties Act has
shown clear superiority of the Central Act and can be considered as both subscriber as
well as foreman-friendly. The Chit Fund Industry Analysis has revealed the level of
threat as not very high and the level of performance as quite satisfactory at present.
BCG Growth-Share Matrix and the Default-Revenue Matrix reveal that Chit is the
strategic business unit of KSFE followed by the Chit loan scheme. All other loan
schemes of the Company need redesigning and fine-tuning. KSFE needs correction in
its complicated formalities, procedural delay. high default rate and degree of
modernisation. The SWOT Analysis torKSFE has highlighted the need tor the better
perfonnance ofthe Company.
227

Notes and References
1. According to the All Kerala Chitty Foremen Association, there are about
10,000 Chit companies operating in the State with bases 'outside' Kerala
especially from Faridabad and Jammu, All Kerala Private Chit Foreman
Association, News Bulletin, Trichur, Vol.I, No.I, 12th April (2002), p.l.
2. Government of Kerala, Legislative Interpretation, Registration
Department, 1.0 of Registration, Trivandrum, (2000).
3. See, Senthil Kumar, K P. "Chitty Chitty Bang Bang". The Economic
Times. Cochin, 12th August (2002), p. 6.
4. Based on discussion with the officials at the Registrar's office.
5. Based on discussions with Chit foremen and subscribers by the
researcher. See also our discussion in Chapter 5 (Section 5.3.8) on
malpractices by foremen.
6. See, Binu, Daniel. 'Urban Informal Credit Markets: Structure, Dynamics
and Intermediation'. Ph D Thesis. Mahathma Gandhi University,
Kottayam, (2000).
7. See, Section 5.3.8 in Chapter 5 for more details.
8. Binu, Daniel.op cit.
9. The Amendment of the Kerala Chitties Act on April 2002, Subsection (1)
(a) The Kerala Finance Bill, 2002 - Amendment of Act 23 of 1975 - In the
Kerala Chitties Act, 1975 (23 of 1975), Illt April (2002).
10. See, Manalel, James and Sallyamma, J. "Chit Chit Bang Bang", The
Economic Times, Special Report, Cochin, 17th June (2002), pp.3-4.
11. The organisational set up is a three-tier system with the Head Office as
the top controlling and coordinating body, the Regions constituting the
intermediary level and the Branches at the base as profit generating
centres.
228

12. Bourgeois, L J, Irene. M. D, and Stimpert, J L. Strategic Management: A
Managerial Perspective, 2nd edition, The Dryden Press, (1999), p. 88.
13. Porter, Michael. Competitive Strategy -Techniques for Analysing
Industries and Competition, The Free Press, New York (1980), pA
14. The foreman's commission in the case of many private Chits has been
fixed as 7 percent or even 10 per cent as against 5 per cent fixed by the
Kerala Chitties Act. A portion of it is used for giving incentives like gold
coins, consumer durables and even vehicles to prompt subscribers. Non
prized subscribers have been given a fixed discount in addition to auction
discount. Another such gimmick is <incentives with termination payment'
where prompt subscribers who opt to take the Chit payment only on the
termination of the respective group are entitled to a lucrative special
incentive of 2.5 per cent of the Chit amount. (See, the Report of the Study
Group to Enquire into The Problems Faced by The KSFE Ltd., School of
Management Studies,Cochin University of Science and Technology. 1999).
15. No authentic official data is available on the volwne of Chit business in the
informal sector. But guesstimated to be about 10,000 Chit companies
operating in Kerala without registration in the State. Chitty News, Bulletin
ofAll Kerala Chit Fonnen's Association, Vol.l, No.l, 12th April (2002).
16. Porter. Michael, Competitive Advantage The Free Press. New York.
(1985), ppl-12.
17. For this section, we have drawn heavily from the Report of the Study Group to
enquire into The Problems Faced by The KSFE Ltd. School of Management
Studies, CochinUniversity of Scienceand Technology, (1999).
18. Strategic Business Units (S B Us) are the schemes like Chitty, Chitty
Loan, Hire Purchase, Gold Loan, Trade Finance Scheme. New Housing
Finance Scheme and New Fixed Deposit Loan.
19. See, David, Hunger and Thomas, L Wheelen. Strategic Management,
Sixth edition, Addison, Wesley, (1999). p. 147.
229

20. Bruce D. Henderson, The experience Curve - Reviewed. IV. The Growth
Share Matrix of the Product Portfolio, Boston Consulting Group, Boston,
(1973).
21. Hedley, B. Strategy and Business Portfolio: Long Range Planning,
(1977), February, p.12.
22. Collectable Chit Amount is calculated by considering only the number of
instalments and Chit subscription that is already paid. For example, in the
case of a prized Chitty of One Lakh with 100 subscribers and monthly
subscription of Rs.l ,000 each, the collectable Chit amount after the lOth
instalment for a subscriber is equal to 1,000 x 10 = 10,000. So the total
collectable Chit amount equals Rs.l 0,000 x 100 =Rs. 10,00,000 .
23. The main competitors of KSFE are co-operatives, private Chits and
informal Chits.
230

CHAPTER SEVEN
FINDINGS AND SUGGESTIONS
Chit Funds being a category of Non-Banking Companies, contribute
to the value of financial markets in India. The present study examines
motivational factors for preferring Chits and also particular types of Chit
institutions. This study entitled "A Study of Chit Finance in Kerala with
Special Emphasis on KSFE Ltd. " takes stock of the working of Chit Funds in
general and KSFE in particular, makes a close examination of the regulatory
framework of the Chit Funds in the State, reviews the performance of KSFE
and attempts a comparative assessment of various Chit Funds. This concluding
chapter attempts to present the important findings and suggestions of the study.
7.1 TREND AND PATTERN OF GROWTH OF CHIT FUNDS
There are evidences to show that a well-established Chit Fund
system existed in the erstwhile State of Travancore-Cochin before the
formation of the Kerala State. Our analysis on the trend and pattern of growth
of Chit Funds shows fluctuating trends in the number and volume of Chits
registered in Kerala during the period 1960-2000. The decade (1960-70)
witnessed the highest growth rate (21.17 %) in annual turnover. The falling
growth rates in the succeeding decades have been mainly due to the rigidity of
the Kerala Chitties Act, 1975. It has resulted in an exodus of foremen to other
states for starting Chits. This decline is also due to the introduction of 'Chit
like' schemes known as Monthly Deposit Scheme (MDS) and Mutual Benefit
Scheme (MBS) by the Co-operatives. At the same time, Trend Analysis of the
annual turnover of Chit for the decade 1990-2000 shows a distinctly

increasing trend in comparison to the early decades. This has been largely due
to the strong presence of KSFE in the realm Chit Finance during the nineties.
Institution-wise, though Co-operatives have the largest number of
registered Chits (44.2%), KSFE has a clear edge and dominance in the Chit
Funds sector with 77 per cent share in the total Chit business. Region-wise,
Southern Kerala followed by Central Kerala dominates in the number of Chits
registered as well as in the volume of Chit capital. KSFE is the most dominant
Chit institution in all the three Regions in Kerala. District-wise analysis of the
number of Chits registered and volume of Chit capital shows that Trivandrum
ranks first followed by Quilon, Kottayam and Emakulam.
Though Chit subscription as percentage of domestic deposits of
banks in the State remained more or less stable between 5 to 7 per cent, the
average annual growth rate of Chit turnover (16.64 %) in comparison with the
average annual growth rate of domestic deposits of banks (16.10 %) seems
impressive for the period from 1991 to 2000. The total number of working
Chits in the officially registered sector at the end of the year 2000-01 was
20,445 with an approximate annual turnover of Rs.l,74,276 Lakhs. If we
include the volume of Chit business with bases outside Kerala, MDS/MBS of
Co-operatives and the informal sector, the actual volume of Chit business in
Kerala would be far higher.
7.2 MOTIVATIONAL FACTORS FOR JOINING CHITS
Our survey among Chit subscribers revealed that the important
reasons for preferring Chits, in its order, are providing future savings in
advance, easy and convenient way to save, facility of dual option for saving
and borrowing and the monthly dividend obtained through the sharing of
discount. Majority of the subscribers (60.2 per cent) joined Chits for both
savings and borrowings. Saving through Chits has been preferred, to buy or
build a house followed by investment in industry and trade, to meet marriage
expenses and saving for old age. Borrowing through Chits has been preferred
232

for business or industry purpose, to pay-off old debts, to meet marriage
expenses and to buy or build a house.
Chit subscribers' main avenues of savings follow the order of Chit,
Life Insurance, Provident Fund, Post Office schemes and gold. The fact that
the sample subscribers divert major portion of their household savings
through the Chit schemes of different institutions shows the wide popularity
and high level of satisfaction. It was also found that many subscribers have
simultaneous Chit operations in different types of Chit institutions. This
clearly indicates the trend among subscribers to join the Chit scheme
regardless of the type of Chit institutions. It also reveals the fact that each
type of Chit Fund has its own unique methods of attracting subscribers to their
schemes. 46 per cent of the subscribers had more than 10 years of association
with Chit Funds. The finding that Chit subscribers continue their association
with Chit Funds even after the termination of a particular Chit reflects their
loyalty to the avenue of Chit Funds.
Majority of the subscribers are aware of the working of Chit Funds
in general and KSFE in particular, though only a minority is aware of the
legal aspects of the Chit business and the Chitties Act. 'Chit-like' schemes,
though named as Monthly Deposit Scheme (MDS) or Mutual Benefit Scheme
(MBS) of Co-operatives seem to be equally popular as the KSFE Chits among
the people.
7.3 COST AND RETURN ON CHITS
Our examination of the cost and returns on Chits has revealed that
the economics of Chits lie in viewing them as savings-cum-borrowing
instruments. The financial return and cost of Chits depend on the prevailing
rate of interest, instalment at which prize money is obtained, the method of
discount followed, the "sala' size and the duration of the Chit. Subject to
these, it was found that, as a pure savings avenue, the rate of return on Chits
is not attractive for most of the subscribers when we consider the opportunity
cost of the subscription money. And if we look at Chits as a pure borrowing
233

avenue, it is cheaper as compared to bank loans. However, if we look at the
Chit subscribers as savers-cum-borrowers, as indeed they should be, it makes
sense to join Chits. The actual return or gain/loss they make from Chits will
depend, as mentioned earlier, on the prevailing interest rates, how early they
get the prize money, the method of discount followed etc.
There is also another dimension to this question, i.e., for many
subscribers Chitty is a forced saving. For such persons these funds would not
have been saved otherwise and hence there is practically no opportunity cost
involved. In such cases, the gain on the Chits will be all the more higher and
can be estimated as the sum of the compound interest that could be earned on
prize amount and the difference between the loss on bidding and the total of
discount accrued to the subscriber.
7.4 REASONS FOR PREFERRING DIFFERENT CHIT FUNDS.
We have tried to analyse this question by studying the critical
success factors of each of the different types of Chit Institutions.
The important success factors of KSFE Chits, in order of priority,
have been the safety and security aspect, big sola Chits, transparency and
openness in auction. The critical success factors of Co-operative Chits are
their better service including prompt payment and easy way of remittance.
The reasons for preferring Private Chits registered in Kerala are their prompt
and convenient payment of prize money and better service. The distinct merits
of Private Chit Funds based outside Kerala are better services, personal
relations with the subscribers and the flexible discount system. The main
advantages of Informal Chit Funds are the personal contact with the
subscribers, system of flexible discount and easy remittance facilities.
Our Chit Funds Rating Analysis based on the preferences of the
subscribers on different aspects shows a trend distinctly in favour of KSFE
followed by Co-operatives indicating the preference of the subscribers for
safety and security. It also points to the existence of tough competition in the
234

Chit Fund arena where each type of Chit Fund has a niche market and
specialities requiring suitable responses from the major players. The critical
success factors for various Chit institutions point to the immense scope for the
future growth of KSFE, provided it improves the customer services, and
quality of services.
7.5 PREFERENCE IN OBTAINING THE PRIZE MONEY AND ITS
UTILISATION.
The majority of the subscribers (66.5 per cent) prefer to get the
prize money in the first few instalments. The logic behind this is that those
subscribers who obtain the prize amount at earlier instalments are likely to
gain more due to the twin advantages of depositing or investing it in more
attractive avenues and also an opportunity to meet emergencies.
Majority of the subscribers used the prize amount for productive
purposes. But further analysis showed that, the utilisation of prize money for
non-productive purposes was more in the case of low-income group and
salaried classes. The finding that majority of the subscribers utilise the prize
amount for productive purposes leads to the conclusion that the growth of the
Chit Fund Industry can help the pace of capital accumulation and hence
economic development.
7.6 PROBLEMS OF CHIT SUBSCRIBERS
Problems of chit subscribers were found to differ from institution to institution.
The major problems faced by the subscribers of KSFE in its order of priority were
stringent security conditions, procedural delay and long queue for the remittance of
cash. Though majority found the New Chitty Loan scheme useful, the high rate of
interest makes it burdensome. The major problems in the Co-operative Chits in its
order of priority were small capital limit, security problem and that the schemes were
open to the members only. The safety aspect was the most important problem of
Private Chits followed by instances of exploitation and small Chit sa/a. The same is
applicable to Private Chits with outside registration and with Informal Chit Funds. Of
235

the subscribers subjected to some form of cheating, the majority were customers of the
infonnal sector.
7.7 GENERAL PROBLEMS IN THE FIELD OF CHIT FINANCE
The lapses in the Kerala Chitties Act such as fixed ceiling on
discount, security to be kept by the foremen, cumbersome registration
formalities and procedural delay are the important problems in Chit Finance
Industry. The share of the private foremen and Co-operatives in the total
volume of Chit business seems less due to the rigidity in the Act. Our
comparative study of the Kerala Chitties Act and The Central Chit Funds Act
indicates the superiority of the Central Act. The flight of foremen and the
'Chit like' schemes have resulted in loss of revenue to the State. Many of
these problems could have been avoided if, the Central Chit Funds Act, 1982
with its amendments had been implemented in the State.
Difficulty in finding substitutes and the absence of revenue
recovery provision are problems especially in the private Chit sector. The
entry of certain Chit Funds into other risky fields of business has resulted in
the failure of certain Chits. The other prominent problems are loss of
reputation to Chit business due to the malpractices of certain foremen, growth
of private Chits without State control and registration, the high levels of
default and arrears, delayed receipts and non-receipt of subscription, absence
of protection by insurance coverage, etc.
An analysis of the above problems of Chit Finance leads to the
striking conclusion that The Kerala Chitties Act, 1975 has failed to protect the
interests of both the subscriber and foreman. It calls for remedial action by
either the strict enforcement of the amended Kerala Chitties Act, 2002 or the
implementation of the Central Chit fund.s hct.
The 'Five Forces Analysis' on Chit Fund business shows that the
level of threat in this industry is not very high and still that the level of
performance is rather high.
236

7.8 PERFORMANCE OF KSFE
The market share of KSFE Chits has shown remarkable growth
from 1992-93 (31.5%) to 79.4 per cent as in 2000-01. The total business of
KSFE has shown an increase by 13.8 times from Rs. 20,480 Lakhs in 1990-91
to Rs.2,83,105 Lakhs in 2000-01. There has been an increase of 23.7 times in
total benefits (including both direct benefits as service charges, guarantee
commission, registration and filing fee and indirect benefits as Chitty security
deposit, savings bank account, and other deposits with treasury) to the
Government of Kerala showing an increase from Rs.1 ,319 Lakhs in 1990-91
to Rs.31,249 Lakhs in 2000-01. Total Revenue of KSFE has increased 16.6
times during the period 1990-91(1,022 Lakhs) to 2000-01 (20,491 Lakhs).
Chit and allied products contribute 60 per cent of the total revenue
of the Company. The growth rate in the volume of Chit turnover shows
fluctuation from 1970-80 to 1990-2000. The decade 1970-80 witnessed the
highest growth rate. After a small decline in 1980-90, the decade 1990-2000
shows an increasing tendency for the growth rate of Chit turnover. This has
been the result of the diversification of schemes of KSFE, particularly Chit
schemes in the 1990's. Total funds mobilised (Chit turnover and total deposit)
show an increase of 12.5 times, from Rs.18,159 Lakhs in 1990-91 to
Rs.2,26,675 in 2000-01.
Parameters used tor measunng the Company's performance and
outreach, like the value of the core business (Chitty), the number of subscribers
served, the volume of total advance, deposits mobilised, nwnber of branches
and diversification of schemes, register impressive figures for the period 1990
91 to 2000-2001. But the limited number of branches in the rural area stands in
the way of fulfilling the social objective during the same period. The total staff
strength (direct employment) has increased by 2.5 times from 1,253 in 1990 to
3,179 in 2000.The level of branch productivity and average business per
employee have been improving continuously from 1990-91 onwards. Though
the Index of staff expenses showed an increasing trend for the period mentioned
above, the Index ofstaffproductivity has not been impressive.
237

At the same time the default rate for all schemes, particularly for
New Chitty loan scheme has been very high mainly due to the absence of
timely follow up measures. The Revenue Recovery debtors in KSFE have
been steadily increasing (11.3 times) from 1992-93 onwards. The BCG
Growth-Share Matrix and Default-Revenue Matrix show that Chit and Chit
loan schemes are the strategic business units of the Company. All other loan
schemes like Trade Loan, Gold Loan, House Finance and Hire Purchase of the
Company require redesign and fine-tuning.
An assessment of KSFE as a Government owned Chit Company
generates the conclusion that its performance is satisfactory and can attain
still higher heights of success. Some of the objectives of KSFE at the time of
its incorporation like the social commitment to liberate the rural masses from
the clutches of the unscrupulous Chit foreman, controlling the growth of the
informal financiers and introduction of insurance business are yet to be
realised. The scarcity of rural branches, the dearth of innovative schemes,
diversification of existing schemes, lack of public awareness on the special
privileges enjoyed by KSFE, insufficient customer care and comparatively
poor quality in the delivery of services pose threats to the reputation of the
Company. The SWOT Analysis for KSFE has highlighted the need for better
performance of the Company.
KSFE operates with a mere Rs. 3 Crore equity capital and with a net
worth of Rs.7.5 Crore, which is inadequate. Hierarchical structure of
administration causes delay in decision-making and affects the speedy operation.
Insufficient customer service and delay in the payment of prize
money tarnishes the image and reputation of the Company, despite its safety
aspect. Absence of computerisation creates operational difficulties. The Chit
subscribers have clearly revealed the indifferent attitude of certain staff as an
important reason for not preferring KSFE Chits. Lack of training facilities for
the staff and lack of awareness on changes in the norms and terms of the
various schemes cause loss of time and inconvenience to the customers. The

introduction of new schemes has been delayed due to the interference of
strong labour unions.
Our analysis of this section leads to the conclusion that many of the
problems of KSFE stem from the common characteristics of a public sector
undertaking. SWOT analysis of KSFE shows that KSFE as the only public
sector Chit Fund Company in India can attain fast future growth by discarding
its complicated formalities and procedural delay which causes discomfort to
the customers. The competitor analysis for the Chit Fund industry points out
the various actions to be taken by KSFE for modernisation.
7.9 SUGGESTIONS FOR THE BETTER PERFORMANCE OF CHIT
FINANCE.
I. Our analysis had revealed that a number of problems faced by the Chit
Funds business are due to lacunae in the legal framework existing in the
state. Many of this we have seen could be avoided by the enforcement of
the Central Chit Funds Act, 1982. Alternatively, the following
amendments may be brought about in the Kerala Chitties Act to provide
for the following provisions.
A) Section 3(\) of the Kerala Chitues Act on sanction and registration
of Chits should be amended in line with Section 4(1) of the Central
Chit Funds Act on prohibition of Chits not sanctioned or registered
under the Act.
B) Section 3(5) on aggregate Chit amount should be amended as
Section 13(1) of the Central Act with its amendment of 2001 on the
enhancement of the aggregate Chit amount.
C) Section 7(4) on the amount of discount ID a Chitty should be
amended in line with Section 6(3) of the amended Central Act on the
enhancement of ceiling on discount to be foregone by a subscriber.
D) Section 15(1) on the security to be given by the foreman should be
amended as Section 20 of the amended Central Act on less
restrictive provision on security to be kept by the foreman.
239

2. Credit Rating of Chit Companies by independent, professional agencies
can boost subscriber confidence and encourage savings through Chits.
Credit Rating provides the potential subscriber to differentiate between
the various Chit Funds in operation, thereby preventing the mushroom
growth of Chit Fund Companies. Credit Rating must be made compulsory
for those Chit companies, which accept deposits from the public.
3. Chit companies rated with the highest safety could be permitted to
conduct 'Corporate Chits' with a ceiling on Chit Sa/a. The Minimum paid
up capital for such Chit companies should be enhanced.
4. There are Chit companies that follow Chit Fund Regulations to the last
word. But there are Chits operating in the State with bases outside (eg.
Jammu, Faridabad) and a number of other unregistered Chits who do not
have to follow any of these regulations leading to various types of
malpractices, besides affecting the State revenue. It is also anti
competitive as it fails to provide a level playing field for all Chit Funds.
Hence, the Chit regulations must be strictly enforced on all players if they
are to be allowed to operate in the State. In this context. the new
amendment introduced in the Kerala Chitties Act on lilt April 2002 will be
highly useful provided it is strictly enforced on all.
5. The setting up of a State Chit Fund Regulatory Authority will serve as an
enforcer of standards. as a problem solver and a reviewer and evaluator
for helping Chit Fund companies.
6. Effective system of disposal of disputes through the establishment of a
grievance cell or even resorting to Securitisation Act can help in
controlling the recovery position of Chit Funds and the resultant loss to
the subscribers.
7. The Government should control the growth of unscrupulous fly-by- night
Chit companies by introducing suitable legal measures. Implementation of
the Central Chit Funds Act or suitable amendment in the Kerala Chitties
Act can prevent the growth of such companies.
240

8. Co-operatives' Chit scheme may be opened to all rather than only to the
members, along with the introduction of the Chitty loan scheme of the
type offered by KSFE at reduced interest rate.
9. Insurance schemes could be introduced to protect the interests of
subscribers and foremen. Insurance provides scope for both 'Credit
Guarantee' to the foreman in the case of prized Chits and deposit
(subscription) insurance to the non-prized subscribers. As private
insurance companies have become a reality, Insurance Coverage Schemes
for Chit Fund business could be easily introduced.
\0. Provision should be made for the enrolment of NRls as Chit subscribers.
11. An All Kerala Federation of Chit Funds free of political bias for the
common cause of the Chit business is desirable.
12. In view of the need for a level playing field, discrimination between a
Government Chit Fund Company and other Chit Funds existing in the
State should be reduced and ultimately avoided.
7,10 SUGGESTIONS ON KSFE
I. In the emerging competitive scenario, KSFE should be innovative and
introduce attractive newer schemes and packages, modify and redesign
existing schemes and diversify whereever suitable opportunities exist.
t Promotion and diversification of Chit scheme, which is the strategic business and
main contributor to the revenue of the Company is to be introduced. BCG Growth
Share Matrix and the Default Revenue Matrixhad shown that Chitty and its allied
New Chitty loan scheme are the strategic business units and themain contributors
to the revenue of the Company. So, the appropriate strategies recommended for
Chitty is to 'harvest' and for New Chitty Loan is to 'hold'. But the high rate of
default in New Chitty Loan requires urgent corrective action. The high default
low revenue share strategic business units like hire purchase, house loan, trade
finance loan, New Fixed Deposit Loan and Gold Loan need a closer scrutiny and
redesigning to make them viable. Hence the appropriate strategy recommended
for isto 'build' by making them attractive to the public.
241

3. The critical success factors analysed for Chitty and New Chitty Loan in terms of
their market share in the industry, share in the volume of business of the
Company, profitability and safety aspect calls for appropriate strategies to
diversify them. The Competitor Analysis and the SWOT Analysis for KSFE
point to the urgent actions to be taken by the Companyfor modernisation, branch
net-working, introduction of innovative schemes, effective and practical security
norms, betterqualityof Customerservice and to minimise the default rate.
4. Simplification of security norms and formalities should be implemented
without affecting the safety of the Company. This will minimise the
inconveniences caused to the customers. Opening-up of enquiry counters
at the branch and the supply of detailed printed leaflets or brochures in
the Malayalam language regarding the security procedures are essential.
5. Salary certificates offered by the employees of reputed private firms and
the guarantee provided by the businessmen with PAN card can be
accepted at par with State employees salary certificates. If the security
provided by the customer or Chit subscriber is sufficient for future
liability, other sureties need not be insisted on.
6. More rural branches are needed for fulfilling the social commitment of
the Company. Evening and morning branches or counters, more cash
counters in the branches on busy days to avoid long queue, cash
collection up to 4 'Oclock, and separate counters for payments and
remittances will provide better service to the customers. Provision of
sufficient facilities in the branches tor seating, drinking water, revenue
stamp, payment of prize money within 30 days etc. will enhance the
customer/subscriber satisfaction.
7. Introduction of salary deduction provision to suit the salaried class and
the diversification of Chit schemes like Vehicle Chits, Marriage Chits,
Education Chits, House Loan Chits, Land Chits, Consumer Durable Chits,
Chit Schemes suited for students etc, could be introduced.
8. Door collection and daily collection of Chits from traders and
businessmen through agents should be introduced. At the same time
242

advances to the above group and daily repayment prOVISIon through
agents could be easily implemented. Long duration and high value Chits
must be started. KSFE has every potential and so must think of
conducting Corporate Chits. Cash Payment of prize money up to Rs. 1
Lakh must be allowed.
9. Chitty loan scheme should be made more subscriber-friendly by reducing
the rate of interest. In the light of the social commitment of the Company,
Chit loan scheme at concession rates of interest should be considered for
low-income subscribers and women and for self-employment
programmes.
10. Diversification into new attractive products like insurance schemes or
distribution of insurance schemes, acting as agent to the Government, tie
up with premier institutions on House Loan schemes and entry into other
non-fund based services should be seriously considered by the Company.
11. Computerisation helps better customer service and can result in business
promotion/efficient working of the Company. Proper care and attention
could be offered to the customers due to the less burdensome work of the
staff because of computerisation. An enquiry section operating with an
updated computer can give guidance and quickly clarify the genuine
doubts of the customers. Door collection and daily collection of Chits on
agency basis could be made possible and easy, by computerisation. Salary
deduction of Chit subscription through the Sugama scheme and collection
of cash upto 4'0 clock would become realities with the computerisation
of branches. Computerisation will enable KSFE for its easy default
processing, facilitate prompt and strict follow up measures and also help
inter-branch remittance facility. Computerised Head Office with
information on branches. schemes, employees, etc. and inter-linking with
branches will facilitate the efficient working of the Company.
12. Human Resource Development programmes for the staff will enhance
efficiency and enable speedy and better service. It will also help in
maintaining good customer relations. Information on the changing norms
243

and rules of various schemes and computer literacy programmes can be
provided as part of scientific training. Participation in the Training
Programme should be made compulsory and must be an essential
requirement for promotion. A proper system of recruitment and training
will enhance the quality of the personnel. For this purpose, the head
office must very seriously think of starting a Staff Training College. It
can offer training programmes to the staff of other Chit institutions as
well. This can go a long way in bringing about the badly needed
professionalism in the industry.
13. Along with its rural branch expansion programme, KSFE must extend its
services and operations to other states in India and plan for starting even
overseas branches.
14. KSFE needs to be protected against high politicisation so that the
Company can implement the decisions without delay. Incorporation of
professional and financial experts into the Board of Directors of KSFE, is
also desirable.
IS. A Default section should be opened in every branch for timely and strict
follow-up. Measures like incentives, concessions, discounts or even
persuasion should be adopted to reduce default rate and the quantum of
Non Performing Asset.
16. The Company should increase its paid up capital. The government itself
can contribute more capital to the Company. A portion of the profit or its
reserve should be converted into equity capital. The Company can think
of offering certain percentage of the total capital to the public through
private placement or even public issue. The shares of the Company should
be offered to the employees also.
17. The staff representation in the decision-making bodies should be
considered. A member of the staff elected by the employees should be
given representation even on the Board of Directors. Quality Circles
system could be introduced in the Company.
244

18. KSFE should arrange public awareness campaigns and customer
awareness programmes. Information Bureaus can be opened in important
regions and places. Customer meets could be arranged occasionally.
Complaint Book or Suggestion Box should be provided at every branch.
19. A Research and Development wing may be opened at the head-office for
the evaluation, planning and promotion of business. Every scheme should
be evaluated periodically and corrections, if any, introduced immediately.
Conclusion
Chit Funds contribute to the value of financial markets in India
particularly in Kerala. Chit Finance with its unique features is of great
significance especially as a saving cum borrowing avenue. Though Chit as
pure saving and horrowing avenues seem less restrictive, people from all
walks of life prefer the scheme due to its facility of getting future savings in
advance, convenient and contractual way to save and the facility of dual
option for saving and borrowing. Chit as an indigenous financial instrument
is complementary to modern financial techniques of savings and borrowings.
The element of mutual help and co-operation inherent in Chits makes it
distinct from other similar savings schemes. It is no wonder, therefore that
Chit Funds have survived the test of time and have become an important part
of the culture and traditions of the people of Kerala and South India.
Different types of Chits operating in the state have their own
success factors and failure factors. The instances of exploitation, cheating and
malpractices in the Chit Fund industry particularly in the informal Chit sector
warrant prudential regulation and strict enforcement of the Chit Act in the
State. This highlights the need for the growth and better performance of
registered Chit Funds as a check to the informal sector.
Though KSFE is the dominant foreman in the Chit business In
Kerala, its weaknesses result in the non-attainment of certain objectives.
Driven by the growing trend of privatisation, KSFE needs to be innovative
and competitive. It is also necessary that KSFE continue its leadership role by
245
being more effective m being the harbinger of more efficiency>
professionalism and good governance in the Chit Fund Industry. Though the
performance of the Chit Fund industry is satisfactory, several difficulties and
problems prevent its healthy growth. Limitations in the regulatory measures
have resulted in the outflow of Chit foremen from the state and also failed to
control the growth of informal Chit Funds. The implementation of the Central
Act or suitable amendment of the Kerala Chitties Act and its strict
enforcement is needed for the healthy growth of the Chit business in the State.
The growth and development of Chit business by protecting the interests of
both the subscribers and the foremen will therefore be most beneficial for any
growing economy.
246

SELECT BIBLIOGRAPHY
Adams and Singh. "Voluntary Rural Savings Capacities in Taiwan: 1960-70".,
American Journal ofAgriculture, Vol.58, No.3, Aug.(1976).pp. 578-81.
Adelman, Irma. Theories of Economic Growth and Development., Oxford
University Press, London, (1962)., p. 53.
Ardener, S. "The Comparative Study of Rotating Credit Association".,
Journal of the Royal Anthropological Institute 94 (2), (1964).
Arnaldo, Mauri. "A policy to mobilise Rural Savings in Developing
Countries"., Savings and Development, No. I (1977), pp. 14-25.
Baburaj, K.R. "A Study on the Working, Achievements and Prospects of
Kerala State Financial Enterprises Ltd.".; Ph. D Dissertation, University
of Kerala, Trivandrum, (1999).
Baby Soosy. "Savings/Investment and Capital Formation in a Rural Setting
A study of Udayamperur", M.Phil., Dissertation Cochin University of
Science and Technology, Cochin, (1993).
Bala, Subramania V. "The Thriving Chit Fund Business in the South" The
Economic Times, Mumbai, May (2002).
Bhende, M J, " Credit Markets in Rural South India"., Economic and Political
Weekly 21, No. 3 I, September (1986).
Binu, Daniel. 'Urban Informal Credit Markets: Structure, Dynamics and
Intermediation', Ph D Dissertation, Mahathma Gandhi University,
Kottayam, (2000).
Bourgeois L.J, Irene.M. Duhaime, Stimpert J.L., Strategic Management-A
Management Perspective, second edition, The Dryden Press - Harcourt
Brace College Publishers.
Bottomley, Anthony. " Interest Rate Determination in Underdeveloped Rural
Areas"., American journal of Agricultural Economics, Vo1.57, No.2,
May (1975), pp. 279-91.
272

Bouman, F.J.A. " Indigenous Savings and Credit Societies in the Developing
World - A Message".; Savings and Development, Vol. No. 4, (1977). pp.
181-214.
---,. Small Short And Unsecured: Informal Rural Finance in India, Oxford
University Press, Oxford, New York, (1989).
, "The ROSCA: Financial Technology of Informal Savings and Credit
Institutions in Developing Countries", Savings and Development 3, No.4.
Carroll and Weil. "Saving and Growth: Implications for Causality" World
Bank Report, (1993).
Cherunilam, Francis. Strategic Management; A Book on Business
Policy/Corporate planning, Himalaya Publishing House, Mumbai,
(1998).
Cox, Sim. E. J, Primitive Civilizations or Outlines of the History of
Ownership in Archaic Communities, Swan Sonnenschein and Co.;
London, Vol. I, (1894), p. 568.
Dale, W. Adams. "Do Rural Financial Savings Matter'?" Dale W. Adams
Savings and Development: Proceedings of a Colloquium, Paris, (1984).
---, "Mobilising Household Savings through Rural Financial Markets".
Economic Development and Cultural Change, Vo1.26, No.3, April
(1978), pp. 547-60.
David, Hunger and Thomas, L Wheelen., Strategic Management, Sixth
edition, Addison, Wesley, (1999), p. 147.
Duesenberry, S. Jarnes., Income, Saving and the Theory of Consumer
Behaviour, Harvard University Press, Cambridge,(1949).
Friedman, Milton., A Theory of the Consumption Function, Princeton
University Press, (1957).
Ghatak, Subrata., Rural Money Markets in India, Macmillan Press, New
Delhi, (1975).
273
Gurley and Shaw. Money in a Theory of Finance, Washington, D.C:.
Brookings Institute, (1960).
---, "Financial Structure and Economic Development", Economic Development
and Cultural Change, Vol.l5, No. 3, April (1967).
Harries, Barbara. "Money and Commodities: Their Interaction in a Rural Indian
Setting" Workshop on Rural Financial Markets and Institutions, England,
Harcourt, Brace and Co., New York, (1979) pp.31, 96. 97, 107-10.
Howse, C.J. "Agricultural Development without Credit" Agricultural
Administration Vol. 1, (1974), pp. 259-62.
Indira, Rajaraman. "The Role of ROSCAS" - Seminar on Economic
Liberalisation and Chit Funds, Delhi Chit Funds Association, Chamber
of Commerce and Industry, New Delhi. April (1995).
Hoop. M.L.. "Economic significance of Chit Funds in Kerala"., M Phil,
Dissertation, Cochin University of Science and Technology, Cochin, (1990).
Jean, Yves Gourvez. "Intermediation and Traditional Circuits: Conditions for
Mobilizing Financial Savings", Savings and Development Proceedings of
a Colloquium, Paris, (1984).
Jose K G "Rural Transformation in Kerala - A Case Study with Reference to
Three Panchayats"., Ph.D., Dissertation, Cochin University of Science
and Technology, Cochin, (1990).
Joseph M.A "Chit Schemes: Relevance and Scope as SavingslInvestment
Alternatives", M.Phi!., Dissertation, Cochin University of Science and
Technology, Cochin, (1992).
Karam, Singh. "Structure of Interest Rates of Consumption. Loans in an Indian
Village". Asian Economic Review Vol. 10, No. 4. August (1968), pp. 71-75.
Karkal, G. L., Unorganised Money Market in India. Lalvani Publishing
House, Bombay, (1967).
Keynes, John Meynard. The General Theory of Employment. Interest and
Money., Harcourt Brace and World, New York, (1936). pp.3l, 96, 97,
107-10.
274

Kim, Dong Hi and Adams., " Savings Deposits and Agricultural co-operatives
in Korea", Savings Deposits and Credit Activities in South Korean
Agricultural Co-operatives, (1977).
Krishnamurthy, A "Corporate Chits - A New Dimension" National Workshop
on Management ofChit Funds, Chennai, November 14, (1997).
Krishnan, V., Indigenous Banking in South India, The Bombay State Co
operative Union, Bombay, (1959).
Leonard, TcRuindjo. "The Evolution of An Informal Financial Institution: The
Rotating Savings and Credit Associations in Cameroon", African Review
ofMoney Finance and Banking, (1999).
Lewis, W Arthur., The Economics ofUnder development: Theory ofEconomic
Growth, Harper Row, New York, (1970), pp. 224 - 25.
Logan, William. The Malabar Manual, 1887 Reprinted as Malabar by the
Government of Madras in (1951), Vol.l, p. 173.
Malthus, Thomas Robert (1820) Principles of Political Economy. London,
(1936), p. 101
Manjeshwar, Ananth Pai. "Chit Funds - Some Aspects of Tax Laws", Seminar on
Economic Liberalisation and Chit Funds, Delhi Chit Funds Association,
Chamber of Commerce and Industry, New Delhi, April (1995).
Marshall, Alfred. Principles of Economics (1890), 3rd ed. Macmillan, New
York, (1895), pp. 313-316.
Marx, Karl. Capital, (1867) Chicago, Kerr & Co., 1906, pp. 656-686.
Me Kinnon, R J. Money and Capital in Economic Development, Washington
Brooking Institution, (1971), p. 117.
Meade, J.E. A Neo-Classical Theory of Economic Growth, Allen & Unwin
Ltd., London, (1962), p. 1.
Mill, John Stuart., Principles of Political Economy, Longman, Green & Co,
(1848), pp. 39- 45.
275

Modigliani, F and Brumberg, R. "Utility Analysis and consumption function:
An interpretation of Cross Section Data", ed. Kurihara, Post Keynesian,
University Press, Rutgers, (1954), pp. 383-436.
Mohandas, M. " Economic Implications of the Central Chit Funds Act, 1982:
An Appraisal", Prajnan, Vol. XVII, No. I, NIBM, Pune, (1988).
Myint, Hla. The Economics of the Developing Countries, Praeger Publishers,
New York, (1965), pp. 15-16.
Nayar C.P.S. Chit Finance - An Explorative Study on the Working of Chit
Funds, VORA and Co. Publishers Pvt. Ltd., Bombay, (1973).
, "A study on Non- Banking Financial Intermediaries", IFMR (RBI
Publication), Chapter I and 7, (1984).
, "Finance Corporations: An Informal Financial Intermediary m India",
Savings and Development, Vol.I, (1982).
---, "Can a Traditional Finance Technology co-exist with Modern Financial
Technologies - the Indian Experience", Savings ami Development Fin,
Africa Quarterly Review, No. 1, (1986), pp. 31-58.
---, Finance Corporations - A study ofunregulated Banks, IFMR Publication,
Madras, (1982).
"The Inherent Strength of Informal Financial Institutions", Ohio State
University, The Agency for International Development, The World Bank,
Washington D.C., (1989).
Omana, P.V., "An Evaluation of Private Chits in Kerala"., M. Phil, Dissertation,
Cochin University of Science and Technology, Cochin, (2000).
Padmanabha Menon, K P. History of Kerala, Vol.I, (1920).
Panikar, P. G. K. Rural Household Savings And Investment: A Study ofsome
Selected Villages, Centre for Development Studies, Trivandrum, (1992).
Patrick, H.T. "Financial Development and Economic Growth", ed., Rural
Financial Market in Developing Countries, London, The John Hopkins
University Press, (1983), p. 50.
276

Paul, Wachtel. "Observations on Saving by Individuals in Developing
Countries", New York University, Savings and Development,
Proceedings of a Colloquium in Paris, (1984).
Pischke, Von J. D. "Towards an Operational Approach to Savings for Rural
Developers", Savings and Development, Vol. 2, No. 1, (1978)., pp. 43
55, 313-16.
Porter, Michael, E. Competitive Strategy; Techniques for Analysing Industries
and Competitors, Free Press, New York, (1980).
---,. Competitive Advantage: Creating and Sustaining Superior Performance,
Free Press, New York, (1985).
Prabhu, Ghate. " Informal Credit Markets in Asian Developing Countries".,
Asian Development Review, 6, No. I, (1988).
---, Informal Finance Some Findings From Asia, Asian Development Bank,
Oxford University Press, (1992).
Prakash, Alvin B. "Private Financing Finns in Kerala - A Study", Economic
and Political Weekly - XIX, No.50, December 15, (1984).
Radhakrishnan, S. "Chit Fund - A Poor Man's Credit Institution", Seminar on
Economic Liberalisation and Chit Funds, Delhi Chit Funds Association,
Chamber of Commerce and Industry, New Delhi, April (1995).
, Chit Funds and Finance Corporations, IFMR Publications, Madras,
(1975), p.7.
---, Nidhis - An IndigenousFinancialInstitution, IFMR Publications,Madras, (1979).
---, " Management of Chit Funds" National Workshop on Chit Funds, IFMR.
Madras, (1997).
Rajendran, G.K., Rural CreditMarket, Anmol Publication, New Delhi, (1997).
Rangarajan, C. Indian Economy; "Essays on Money and Finance", Rural
India, The role of Credit, (1996), p 196.
Rao, V.K.R. V. "Investment, Income and the Multiplier in an Under Developed
Economy"., The Indian Economic Review, February, (1952).
277

Renuka, Pillai. "Gender influence on Consumption Pattern: A Study of the Impact
of Women's Income on Household Consumption", Ph.D., Dissertation,
Cochin University of Science and Technology, Cochin, (1999).
Ricardo, David. The Principles ofPolitical Economy and Taxation, Dent and
Sons, London, (1817), p. 79.
Sandor, Ligeti. "Rural Savings and Agricultural Credit"., Savings and
Development Proceedings of a Colloquium, Paris, (1984).
Seema, Saggar. "Financial Performance of Leasing Companies during the
Quinquenium Ending 1989-90", Reserve Bank of India, Occasional
Papers, Vol.l6, No.3, September (1995).
Smith, Adam. An Enquiry into the Nature and Causes of the Wealth ofNations.,
(1776) Henry Frowds, London, (1904), p. 326.
Sreedharan Menon, K.A. Schemes for Starting Chitties under State Auspecies,
Kerala State, 1967, p. 16.
Srinivas and Higuchi "A Continuum of Informality of Credit: What Can
Informal Lenders Teach Us?", Savings and Development, No.2 XX
Finafrica, 1966.
Subbarama, Aiyar S. Economic Life in a Malabar Village, The Bangalore
Printing and Publishing Co. Ltd., Bangalore, (1925), p. 66.
Sundaram, K. and V. N. Pandit, "Informal Credit Markets, Black Money and
Monetary Policy: Some Analytical and Empirical Issues." Economic and
Political Weekly 18, No. 16, (1984).
Tara, S Nair. "Meeting the Credit Needs of the Micro Enterprise Sector:
Issues in Focus", The Indian Journal ofLabour Economics, Vol. 41, No.
3, July-September (1996).
Thomas, P.J. "Our Economic Heritage", Silver Jubilee Souvenir, Thrichur,
Dharmodayam Company, (1948), p. 8.
Varma J.C, Non - Banking Financial Companies, Second Edition, Chapter
XV, (1997), p. 491.
278

Veerashekharappa. Institutional Finance for Rural Development., Rawat
Publications, (1997).
Virginia, Delancey. «Women at the Cameron Development Corporation: How
Their Money Works", Rural Africana, No.2, (1978), pp. 9-33.
Vogel, Robert C. and Burkett P. «Deposit Mobilisation in Developing
Countries: The Importance of Reciprocity in Lending", The Journal of
Developing Areas, 20(2), (1986).
Warren, F. Lee. « The Role of Financial Intermediaries in the Activities of
Rural Firms and Households", The Ohio State University, USA, (1968).
Wicksell, Knut. Lectures on Political Economy., (1901), Vol. 1, Macmillan,
New York, (1935).
Youngjohns, B.J. "Co-operatives and Credit: A Re- examination", Overseas
DevelopmentInstitute, London, (1980).
279

REPORTS
Administration Report., Registration Department, Government of Kerala,
Various Years.
All India Rural Credit Survey., District Monograph, Quilon, RBI, Bombay,
1958, p. 97.
All Kerala Private Chit Foreman Association, News Bulletin., Trissur, Vol.
No.l, 12-42002.
Annual Reports, KSFE, Various Years.
Economic Review, Various Years, State Planning Board, Trivandrum,
Government of Kerala.
Hand Book of Schemes, Kerala State Financial Enterprises Ltd., Various Issues.
Manuel of Procedure., Vol. 1, Kerala State Financial Enterprises Ltd.,
Government of Kerala, 1991.
Memorandum of Association and Articles of Association., KSFE.
Report of the Kuri Committee, Government of Cochin., 1939.
Reportof the Rural BankingEnquiIyCommittee, Government of India, 1950,p. 16.
Report of the Study Group on Indigenous Bankers., Banking Commission,
Bombay, Government of India, 1971.
Report of the Study by Asian Development Bank on Urban Informal Credit
Markets in India, Prepared by the National Institute of Public Finance
and Policy, New Delhi, 1989.
Report of the Study by Organisation for Economic Co-operation and
Development., Paris, 1987.
Report of the Study Group to Enquire into the Problems Faced by the Kerala
State Financial Enterprises Ltd., School of Management Studies, Cochin
University of Science and Technology, Cochin, 1999.
Report of the Travancore-Cochin Banking Enquiry Commission, Government
of India, 1956, pp.37-49
2&0

Report on The Survey of Household Savings and Investments in Kerala 1977
78, State Planning Board Trivandrum, February 1981.
Saving Across the World - Puzzles and Policies World Bank Discussion,
Paper No. 354, 1997.
Savings and Development., Vol.l, 1982.
Statutory Guide for Non-Banking Financial Companies- An Authorised
Publication of Reserve Bank of India, The Taxman Allied Services P.
(Ltd.), July 2000.
The Central Chit Funds Act, 1982 and The Amendment, 200 I
The Kerala Chitties Act, 1975
The Kerala Chitties Act, 1975 and Amendment Act, April 2002
The Madras Provincial Banking Enquiry CommitteeReport., Vol-I, 1930,para.. 79.
The RBI Bulletin, Various Issues.
The Travancore Banking Enquiry Committee Report, The Government of
Travancore, 1930, Vol. 1, para. 229
Travancore Banking Enquiry Committee Report., Government of Travancore,
Vol.l, 1930.
World Bank Discussion Paper., No. 358, "China's Non-Bank Financial
Institutions - Trust and Investment Companies", 1997.
World Development Report (1989), " Issues in Informal Finance", Oxford
University Press, p. 114.
The Economic Times, 8th February (1987).
The 'Mathrubhoomi"., Cochin, 13th March (2000), p.9.
.' ....J>
281


