Embed Size (px)
Citation preview


ii
Royal Commission into Institutional Responses to
Child Sexual Abuse
A statistical analysis of sentencing for child
sexual abuse in institutional contexts
Karen Gelb
Consultant Criminologist
March 2016

iii
The Royal Commission into Institutional Responses to Child Sexual Abuse
commissioned and funded this research project. The following researcher carried out
the research and prepared the report:
Karen Gelb, PhD
Disclaimer
The views and findings expressed in this report are those of the author and do not
necessarily reflect those of the Royal Commission.
Copyright information
Gelb, K, 2016, A statistical analysis of sentencing for child sexual abuse in institutional
contexts, Royal Commission into Institutional Responses to Child Sexual Abuse,
Sydney.
ISBN 978-1-925289-44-2
© Commonwealth of Australia 2016
All material presented in this publication is provided under a Creative Commons
Attribution 3.0 Australia licence (www.creativecommons.org/licenses). For the
avoidance of doubt, this means this licence only applies to material as set out in this
document.
The details of the relevant licence conditions are available on the Creative Commons
website as is the full legal code for the CC BY 3.0 AU licence
(www.creativecommons.org/licenses).
Published date
March 2016

iv
Preface
On Friday, 11 January 2013, the Governor-General appointed a six-member Royal
Commission to inquire into how institutions with a responsibility for children have
managed and responded to allegations and instances of child sexual abuse.
The Royal Commission is tasked with investigating where systems have failed to
protect children, and making recommendations on how to improve laws, policies and
practices to prevent and better respond to child sexual abuse in institutions.
The Royal Commission has developed a comprehensive research program to support
its work and to inform its findings and recommendations. The program focuses on eight
themes:
1. Why does child sexual abuse occur in institutions?
2. How can child sexual abuse in institutions be prevented?
3. How can child sexual abuse be better identified?
4. How should institutions respond when child sexual abuse has occurred?
5. How should government and statutory authorities respond?
6. What are the treatment and support needs of victims/survivors and their
families?
7. What is the history of particular institutions of interest?
8. How do we ensure the Royal Commission has a positive impact?
This research report falls within theme five.
The research program means the Royal Commission can:
obtain relevant background information
fill key evidence gaps
explore what is known and what works
develop recommendations that are informed by evidence, can be implemented
and respond to contemporary issues.
For more on this program visit www.childabuseroyalcommission.gov.au/research.

v
Executive summary .................................................................................................. viii
Introduction .......................................................................................................... viii
The scope of this report ....................................................................................... viii
Key findings ............................................................................................................. ix
Sentencing outcome ............................................................................................ ix
Delay ..................................................................................................................... ix
Victim and offender characteristics .................................................................. ix
Offending characteristics .................................................................................... x
Multivariate analysis: penalty type .................................................................... x
Multivariate analysis: total effective sentence length ....................................... x
Multivariate analysis: delay ............................................................................... xi
Directions for future research................................................................................ xi
Chapter 1: Introduction .............................................................................................. 1
Background .............................................................................................................. 1
The institutional CSA sentencing study ............................................................. 1
Aim of the research .................................................................................................. 1
Scope of the research ............................................................................................... 2
Key issues for analysis ......................................................................................... 2
Structure of the report............................................................................................. 3
Chapter 2: Methodology.............................................................................................. 4
Overview ................................................................................................................... 4
Preparatory analysis ................................................................................................ 4
Quantitative analysis ............................................................................................... 4
Qualitative analysis .................................................................................................. 5
Methodological limitations ...................................................................................... 5
Chapter 3: Findings ..................................................................................................... 6
Overview ................................................................................................................... 6
Measures ................................................................................................................... 6
Dependent variable: sentencing outcome .......................................................... 6
Penalty type ........................................................................................................ 6 Total effective sentence length .......................................................................... 7
Dependent variable: delay ................................................................................... 8
Independent variables ......................................................................................... 9
Victim and offender characteristics ................................................................. 10
Victim gender................................................................................................... 11 Victim age ........................................................................................................ 11 Offender prior record ....................................................................................... 12 Multiple victims ............................................................................................... 13

vi
Offending characteristics (categorical variables) ........................................... 16
Institution type ................................................................................................. 18 Offence type ..................................................................................................... 19 Offending duration ........................................................................................... 20 Grooming ......................................................................................................... 21 Institutional response ....................................................................................... 22 Plea type ........................................................................................................... 24 Sentence period ................................................................................................ 24
Offending characteristics (continuous variables) ........................................... 25
Multivariate relationships ..................................................................................... 26
Sentencing outcome: penalty type .................................................................... 26
Summary of multivariate relationships with penalty ....................................... 29 Sentencing outcome: total effective sentence length ....................................... 30
Summary of multivariate relationships with total effective sentence length ... 32 Delay .................................................................................................................... 32
Summary of multivariate relationships with delay .......................................... 34 Chapter 4: Discussion ................................................................................................ 35
Overview ................................................................................................................. 35
Victim and offender characteristics ..................................................................... 35
Age and gender ................................................................................................... 35
Relationship of offender to victim .................................................................... 36
Offenders with multiple victims ....................................................................... 36
The Royal Commission’s profile of victim and offender characteristics ...... 37
Offence characteristics .......................................................................................... 38
The nature of the offence: offence type ............................................................ 38
The nature of the offence: offending duration ................................................ 38
The nature of the offence: grooming ................................................................ 39
The nature of the offence: the number of offences ......................................... 39
Institutional responses to offending ................................................................. 40
Have sentencing practices changed? .................................................................... 40
Directions for future research............................................................................... 41
Appendix A: Glossary................................................................................................ 43
Appendix B: References ............................................................................................ 45
Reports ................................................................................................................ 45
Cases cited........................................................................................................... 45
Appendix C: Technical details of measures............................................................. 47
Data collected ......................................................................................................... 47
Data preparation: recoding of variables .............................................................. 47
Dependent variable: sentencing outcome – penalty type ............................... 47
Dependent variable: sentencing outcome – total effective sentence length .. 48

vii
Dependent variable: delay ................................................................................. 49
Independent variable: victim gender ............................................................... 50
Independent variable: victim age ..................................................................... 50
Independent variable: prior record ................................................................. 50
Independent variable: multiple victims ........................................................... 51
Independent variable: institution type/offender occupation/victim–offender
relationship ......................................................................................................... 51
Independent variable: offence type .................................................................. 53
Independent variable: offending duration....................................................... 53
Independent variable: grooming ...................................................................... 53
Independent variable: institutional response .................................................. 54
Independent variable: plea type ....................................................................... 55
Independent variable: number of offences ...................................................... 55
Independent variable: non-parole period ........................................................ 57
Appendix D: Results of bivariate analyses .............................................................. 58
Bivariate relationships ........................................................................................... 58
Sentencing outcome: penalty type .................................................................... 58
Grooming ......................................................................................................... 58 Multiple victims ............................................................................................... 59 Offence type ..................................................................................................... 59 Number of offences.......................................................................................... 59 Institutional response ....................................................................................... 60 Plea type ........................................................................................................... 60 Sentence period ................................................................................................ 60 Summary of bivariate relationships with penalty type .................................... 61
Sentencing outcome: total effective sentence length ....................................... 61
Summary of bivariate relationships with total effective sentence length ........ 64 Delay .................................................................................................................... 64
Summary of bivariate relationships with delay ............................................... 68

viii
Executive summary
Introduction
This report forms part of the Royal Commission’s inquiry into child sexual abuse
(CSA) in institutional contexts.
As part of its broader work on institutional CSA, the Royal Commission released a
report that examined issues around sentencing for these offences.1 That report included
an examination of sentencing data for institutional CSA cases.
This report extends and expands on that sentencing study to include cases from
jurisdictions other than New South Wales, and to undertake a more detailed and
nuanced examination of the interactions among the factors measured.
In particular, this analysis provides a closer understanding of the interactions among
the factors collected in the Royal Commission’s database to build a more nuanced
picture of the nature of, and responses to, institutional CSA.
The cases in this analysis represent the tip of the iceberg of institutional CSA cases –
those cases where the offending was reported, charges were laid, offenders were
convicted and sentencing remarks were made available to the Royal Commission.
Many victims of institutional CSA do not report their experiences to the police. Even
if the offending is reported, police do not always bring charges if the accused is
deceased or if the evidence is insufficient to support a prosecution. These victims do
not have the opportunity to be heard in court.
While the analysis in this report does not necessarily reflect all cases of institutional
CSA, its value lies in providing a detailed statistical view of those cases for which data
are available.
The scope of this report
This report examines 283 sentenced cases of institutional CSA. The main issues
included in the analysis focus on understanding the role of various factors in sentencing
outcomes and the time between the offence and the sentence (that is, the length of the
delay between the offence and the sentence).
The key issues for analysis included:
Is there a relationship between the age of the victim at the time of the offence
and the sentence outcome, and/or the age of the victim and the delay between
the offence and the sentence?
Is there a relationship between the gender of the victim and the sentence
outcome, and/or the gender of the victim and the delay between the offence and
the sentence?
1 Freiberg, A, Donnelly, H and Gelb, K, 2015, Sentencing for Child Sexual Abuse in Institutional Contexts,
Royal Commission into Institutional Responses to Child Sexual Abuse, Sydney.

ix
Is there a relationship between the victim–offender relationship and the
sentence outcome, and/or this relationship and the delay between the offence
and the sentence?
Is there a relationship between the institution’s response to the offending and
the sentence outcome, and/or the response and the delay between the offence
and the sentence?
Is there a relationship between the nature of the offence (such as the presence
of grooming, the precise offence, and the number of incidents) and the sentence
outcome, and/or the nature of the offence and the delay between the offence and
the sentence?
Is there a relationship between the delay between the offence and the sentence,
and sentencing outcomes?
What are the characteristics of people who offend against multiple victims?
Does their offending behaviour change over time? Is there escalation in the
seriousness of their offending?
While this kind of statistical analysis of sentencing outcomes aids in identifying
interesting trends and relationships in the data, the sentence imposed in a particular case
is a product of its unique characteristics. Inevitably, in every case some factors that
affect the sentence imposed cannot be fully understood through statistical analysis
alone, be it quantitative or qualitative. Even so, this approach makes a valuable
contribution by broadening our understanding of CSA in institutional contexts.
Key findings
Sentencing outcome
The most common sentence imposed on offenders in this database was imprisonment
(74 per cent), although 15 per cent received a wholly suspended sentence and 9 per cent
were sentenced to some form of community order. The average prison term was four
and a half years, while the median was three years. The longest term was 21 years.
Delay
The average length of delay between the first known offence in a matter and the
sentence was 25 years. The longest delay was 58 years.
Victim and offender characteristics
Two-thirds of the cases in this database involved male victims only, while the most
common age group of victims was between 12 and 16 (44 per cent).
In just over half of the cases, the offender did not have any prior record, although in
9 per cent of cases the offender had previously committed a sexual offence against a
child, and in a further 15 per cent the offender had previously been in custody for a
child sexual offence.
In 58 per cent of cases, the offender had committed CSA offences against more than
one victim. Cases with multiple victims were more likely to occur in religious
institutions and were more likely to involve penetrative offences and grooming
behaviours. More than half of these cases did not appear to involve escalation from a

x
non-penetrative to a penetrative offence, although half of the cases did involve some
degree of variation in the types of offences committed.
This profile of victim and offender characteristics differs from the profile the Royal
Commission found in its statistical overview of almost 2,800 CSA victims.2 The
Commission’s analysis found that the average age of abuse was 10 for males and nine
for females – younger than the average of 12 for cases in this database. It also found
that just under half of the reported abuse occurred in out-of-home (foster) care. This is
very different from the cases in this analysis, where only 2 per cent occurred in foster
care, with more than half taking place in schools or boys’ homes.
The different profiles seen in the two analyses are likely due to potential, unmeasured
differences in the samples. The cases in this analysis are only those that were detected,
investigated, prosecuted and sentenced. But the sample of cases in the Commission’s
analysis would have included both cases where a report had been made to police, as
well as those in which the victim had not previously disclosed the offending.
Offending characteristics
The offending in this database was most likely to have occurred in a religious or
non-religious school (both 27 per cent) or a church (23 per cent). Almost two-thirds of
the schools and churches in which the offending took place were Catholic.
More than half (53 per cent) of the cases involved indecent assaults, although one-third
involved a penetrative offence. Almost half (48 per cent) of the offending lasted less
than five years, although 7 per cent took place over 20 years or more. Some form of
grooming occurred in almost one-third of cases.
In 43 per cent of cases, the institution took no action, although in 39 per cent of cases
the offender was dismissed. The offender pleaded guilty in 71 per cent of cases.
The average number of offences per case in this database was 8.5, although the
maximum was 67 offences. There was an average of 20 years between the last known
offence across all cases for an offender, and the year in which the most recent sentence
was imposed. Of the 187 cases with a non-parole period, the average non-parole period
was just over three years.
Multivariate analysis: penalty type
When examining the predictors of penalty type, the presence of grooming and a higher
number of offences predicted that a custodial sentence was more likely to be imposed,
regardless of the offender’s plea, when the case was sentenced and whether there were
multiple victims. Conversely, a case involving an indecent assault was less likely to
lead to a custodial sentence than one involving penetration.
Multivariate analysis: total effective sentence length
The strongest predictor of total effective sentence (TES) length was the number of
offences: the more offences, the longer the total effective sentence. Cases involving
2 The Hon. Justice Peter McClellan, 2015, Opening Address: Australian and New Zealand Association for
the Treatment of Sexual Abuse 7th Biennial International Research, Theory & Practice Conference,
Melbourne. Available at www.childabuseroyalcommission.gov.au/media-centre/speeches/anzatsa-7th-biennial-conference.

xi
more serious offence types were also more likely to include a longer total effective
sentence, as were cases involving less time between an offender’s last known offence
and the year in which the most recent sentence was imposed. The victim’s age, the
presence of grooming, whether multiple victims were involved and the duration of
offending did not affect the total effective sentence length.
Multivariate analysis: delay
The two strongest predictors of the delay between the offence and the sentence were
the period in which the offender was sentenced and the victim’s gender: the delay
between the first offence and the sentence was likely to be greater in more recent cases
and in cases with male victims. Cases that involved offending over a longer time were
also more likely to have a greater delay. Offending that took place at a church or
religious school predicted a longer delay, although offending that occurred in the
context of Scouts Australia or a sports club predicted a shorter delay. Finally, cases
involving offenders who had multiple victims also involved a greater delay between the
first offence and the sentence. The offence type and the number of offences did not
affect the delay.
The finding that the victim’s gender had a statistically significant effect, even when
taking into account various offence characteristics, is particularly important for
understanding the effect of institutional CSA on male victims, for whom the delay was
far greater. Something about male victims’ experience of institutional CSA is clearly
different from that of females leading to extensive delays in the offending coming to
light and being successfully prosecuted. Further analysis of the differential impact of
institutional CSA on male and female victims would assist in developing our
understanding.
The delay between the first offence and the sentence was longer in the context of
religious institutions, even in the multivariate analysis. Faith-based organisations seem
to take the heaviest toll on victims in terms of the time taken to reveal the offending
and seek formal action against the offender. Cases occurring in these organisations also
possibly impose the heaviest burden on law enforcement in terms of the time required
to investigate the offending. The longer delay in such cases was possibly due to the
powerful combination of religious authority and the closed nature of the institutions.
This analysis can only suggest that something about the nature of such institutions
differs from other organisations; further analysis into the specific characteristics that
lead to greater delay is warranted.
Directions for future research
The data analysed in this study represent a tiny proportion of all cases of institutional
CSA; the data only relate to those cases in which the offending was reported to police,
charges were laid, a conviction was secured and sentencing remarks were made
available. As court databases do not flag sexual abuse cases as institutional, the research
has relied on manual searches by the Royal Commission to identify those cases that
appear to involve institutional CSA. The lack of regularly collected data in court
databases is a big impediment to understanding CSA in institutional contexts.
Despite the limitations inherent in data collection for this study, for the first time the
research has shown the importance of understanding the nuanced relationships among
the various offence, victim and offender characteristics; the delay between the offence

xii
and the sentence; and sentencing outcomes. However, the analyses have not been able
to delve into these differences to understand why they exist. To do so would require
additional qualitative research – possibly of the sort that cannot be conducted using
sentencing remarks, but that needs to be undertaken using personal interviews with the
victims. Doing so might provide an understanding of the differential impact of
institutional CSA on male and female victims. It might also identify the specific
characteristics of faith-based institutions that underlie the findings of this analysis.
Given that so few cases of CSA in general – let alone institutional CSA – ever reach
the courts, further research should also examine the relationship between confidence in
the justice system and the willingness of victims of CSA to report abuse. Without a
better understanding of victim perceptions of the justice system, it is difficult to target
reforms where they are most required.

1
Chapter 1: Introduction
Background
This report forms one part of the Royal Commission’s larger inquiry into child sexual
abuse (CSA) in institutional contexts.
As part of its broader work, in July 2015 the Royal Commission released a report by
Arie Freiberg, Hugh Donnelly and Karen Gelb on a range of issues around sentencing
for CSA in institutional contexts.3 The report included an examination of key
characteristics and sentencing outcomes of cases involving institutional CSA.
This report extends and expands on that original sentencing study to include cases from
jurisdictions other than New South Wales and to undertake a more detailed and nuanced
examination of the interactions among the factors measured.
The institutional CSA sentencing study
Freiberg, Donnelly and Gelb’s (2015) analysis examined the ways in which common
law principles and statutes are applied to sentencing of CSA in an institutional context.
As the most detailed information was available for cases sentenced in New South
Wales, the analysis focused on the 84 cases from that state.
By reading sentencing remarks and accessing other sources, data were collected on a
number of sentencing variables and related factors. Broadly, these factors included:
the context of the offending
the nature of the offence
the characteristics of the victim and the offender
the sentencing patterns.
As this initial analysis was designed to present a descriptive overview of sentencing of
CSA in an institutional context, its depth of detail was limited. Thus, there was
substantial scope for a more detailed analysis of the rich data available.
Aim of the research
To this end, further analysis was undertaken on an expanded and extended database.
This analysis provides a closer understanding of the interactions among the factors
collected in the database to build a more nuanced picture of the nature of, and responses
to, institutional CSA.
The analysis focuses on understanding interactions that may influence both sentencing
outcomes and the delay involved in sentencing these CSA offences.4
3 Freiberg, A, Donnelly, H and Gelb, K, 2015, Sentencing for Child Sexual Abuse in Institutional Contexts,
Royal Commission into Institutional Responses to Child Sexual Abuse, Sydney.
4 The data do not identify the cause of the delay, such that the analysis cannot distinguish between delay caused by a delay in reporting the offending and one caused by a delay in processing the case.

2
The cases in this analysis represent the tip of the iceberg of institutional CSA cases:
those cases where the offending was reported, charges were laid, offenders were
convicted and sentencing remarks were made available to the Royal Commission.
Many victims of institutional CSA do not report their experiences to the police. Even
if the offending is reported, police do not always bring charges if the accused is
deceased or if there is insufficient evidence to support a prosecution. These victims do
not have the opportunity to be heard in court.
While the analysis in this report does not necessarily reflect all cases of institutional
CSA, its value lies in providing a detailed statistical view of those cases for which data
are available. It adds to our understanding of the complexities of institutional CSA and
illuminates the impact of the various factors on both sentencing outcomes and delay
between the offending and the sentence.
Scope of the research
Since the completion of the original research, the Royal Commission has identified
several hundred additional cases of institutional CSA. Sentencing remarks or transcripts
were requested from the relevant jurisdictions for all of these matters. Given the
difficulties associated with locating documentation for long-ago cases, it was not
expected that remarks would be available for all of these matters.
With the new cases added to the original sentencing database, there were ultimately
283 cases with sufficient information to include in the analysis. Many cases (140) that
had provisionally been identified as CSA were excluded as they were not institutional
or did not involve child victims.
The analysis presented in this report involves the 283 cases in the database: the original
84 sentenced in New South Wales from the Freiberg, Donnelly and Gelb (2015) study,
plus another 199 from other jurisdictions.5
Key issues for analysis
Numerous key issues were identified in consultation with the Royal Commission; the
main priority was understanding the role of various factors in sentencing outcomes and
in the time between the offence and the sentence (that is, the delay between the offence
and the sentence).
The key issues for analysis include:
Is there a relationship between the victim’s age at the time of the offence and
the sentence outcome, and/or the victim’s age and the delay between the offence
and the sentence?
Is there a relationship between the gender of the victim and the sentence
outcome, and/or the gender of the victim and the delay between the offence and
the sentence?
5 Most of these cases (170) were originally found and coded by staff from the Judicial Commission of NSW,
under the guidance of Hugh Donnelly, as part of their initial work developing the database. A further 113
were identified and coded as part of this second phase of research. Additionally, of the 140 excluded cases,
102 were excluded in the initial phase of the work, while an additional 38 were excluded as part of this
second phase of research. The author wishes to acknowledge Mr Donnelly for his assistance in expanding the original database for this report.

3
Is there a relationship between the victim–offender relationship and the
sentence outcome, and/or this relationship and the delay between the offence
and the sentence?
Is there a relationship between the institution’s response to the offending and
the sentence outcome, and/or this response and the delay between the offence
and the sentence?
Is there a relationship between the nature of the offence (such as the presence
of grooming, the precise offence and the number of incidents) and the sentence
outcome, and/or the nature of the offence and the delay between the offence and
the sentence?
Is there a relationship between the delay between the offence and the sentence,
and the sentencing outcome?
What are the characteristics of people who offend against multiple victims?
Does their offending behaviour change over time? Does their offending escalate
in seriousness?
Structure of the report
Chapter 2 of this report provides a brief overview of the research methodology. Chapter
3 presents the detailed findings of the analyses, and Chapter 4 returns to the aims of the
study to discuss the findings more broadly.
4
Chapter 2: Methodology
Overview
This report presents the findings of the quantitative and qualitative analysis.
The quantitative element focused on understanding the factors that predict sentencing
outcomes and the delay between the offence and the sentence, to provide a statistical
understanding of the relationships among multiple relevant factors. The qualitative
element targeted the issue of multiple offending in an attempt to gather richer, more
nuanced information about the nature of this sub-group of institutional CSA offenders.
Preparatory analysis
Prior to beginning the study, the data were cleaned and prepared for analysis. Data were
checked to ensure that only valid responses were entered and that responses were coded
to appropriate levels of aggregation to allow analysis.6
Given that the focus was on understanding the nature of the interactions among the
various factors, two primary dependent variables were identified: sentencing outcome
and delay. That is, the analysis focused on understanding how various factors influence
both the sentencing outcome and the delay between the offence and the sentence.
Quantitative analysis
The quantitative analysis followed a three-stage approach that allowed for increasing
complexity in examining the relationships among the factors:
1. Descriptive analyses were undertaken to examine the distribution of each factor
(variable) and to understand the nature of the data. This first step provides a
basic understanding of the characteristics of victims, offenders and offences,
considering each variable in isolation.
2. Bivariate analyses were undertaken to identify associations between each of
the variables and the main variables of interest: sentencing outcomes and the
delay between the offence and the sentence. The precise type of statistical
procedure used varied according to the nature of the variables involved, and
included t-tests,7 Pearson correlations,
8 analysis of variance (ANOVA)
9 and
6 The recoding and aggregation process was undertaken in close consultation with the Royal Commission, to
ensure that the Commission’s key areas of interest could be examined.
7 T-tests identify the strength of the association between a continuous variable and a categorical variable with
two groups, by comparing the mean (average) scores on the continuous variable for each group of the categorical variable.
8 Pearson correlations identify the strength of association between two normally distributed continuous variables.
9 ANOVA identifies the strength of association between a continuous variable and a categorical variable with
more than two groups, by comparing the mean (average) scores on the continuous variable for each group
of the categorical variable. Essentially, it is an extension of the t-test method for variables with more than two groups.

5
chi-squares.10
This second step allows a better understanding of the data by
considering the relationships between pairs of variables. Statistically
significant variables from the bivariate analyses were subsequently included in
the multivariate analyses that followed.
3. Multivariate analyses were undertaken to identify causal relationships among
all the variables. The multivariate analyses used either linear or logistic
regression to identify those variables that predict sentencing outcomes and the
delay between the offence and the sentence.11
This final step in the analysis
offers the best understanding of the data, as it considers the relationship among
all the variables at once. Multivariate analysis provides an examination of the
relationship between a predictor (independent) variable and the outcome of
interest (dependent variable) while taking account of all the other variables
included in the analysis. These multivariate analyses are the main focus of this
report.
Each analysis is discussed in more detail in Chapter 3.
Qualitative analysis
A qualitative approach examined the nature of offending by people with multiple
victims, and the responses of the institutions where the offending occurred. This
approach was adopted to provide richer detail than is available through a purely
statistical analysis.
Methodological limitations
The analysis is limited by the availability of the data. Many of the 283 cases were
decades old, thus limiting the available information about the characteristics of the
victim, the offender and even the offences committed. As such, some of the variables
have a lot of missing information and should be treated with caution.
There is no national database of institutional CSA cases. The database created for the
Royal Commission is not a definitive source of all cases of institutional CSA. Rather,
it is a non-representative sample of all institutional CSA cases, involving only those
cases where a jurisdiction was able to provide sentencing remarks, or where some
information was available in media articles or other websites.12
Even so, the data do
assist in understanding CSA in institutional contexts.
10 Chi-square tests identify the strength of association between two categorical variables.
11 The different forms of regression are used for different types of dependent variable: linear regression is
used when the dependent variable is a continuous variable, while logistic regression is used for a dichotomous (two-group categorical) dependent variable.
12 For further information on data collection for the original sentencing database, see Freiberg, A, Donnelly, H
and Gelb, K, 2015, Sentencing for Child Sexual Abuse in Institutional Contexts, Royal Commission into Institutional Responses to Child Sexual Abuse, Sydney, pp 126–29.

6
Chapter 3: Findings
Overview
This chapter presents the key findings from the descriptive and multivariate statistical
analyses, as well as the qualitative analyses. Detailed technical information on the
construction of the measures may be found in Appendix C. Detailed results from the
bivariate analyses may be found in Appendix D.13
Measures14
Dependent variable: sentencing outcome
The first dependent variable in this analysis is sentencing outcome. This variable was
operationalised as two separate measures: penalty type and total effective sentence
(TES) length.
Penalty type
Penalty type is a categorical variable with five sentence groups:
1. Fine or bond
2. Community order or probation
3. Wholly suspended sentence
4. Custody (including prison, partially suspended sentence and periodic detention)
5. Other sentence type.
13 As the main purpose of the bivariate analyses was to identify statistically significant variables for inclusion
in the multivariate analyses, the detailed results of the bivariate analyses are not discussed in the body of the report. Instead, they are presented in Appendix D.
14 The distributions presented in the first part of this chapter are the original distributions of each variable.
However, most of the variables in this study needed to be recoded in some way. The recoded versions of the variables – used in the subsequent bivariate and multivariate analyses – are described in Appendix C.
The most common sentence imposed on offenders in this database was imprisonment
(74 per cent), although 15 per cent received a wholly suspended sentence and 9 per
cent were sentenced to some form of community order. The average prison term was
four and a half years, while the median was three years. The longest term was 21
years.

7
Table 1 presents the distribution of penalty type across the 283 cases in the database.
Table 1: Distribution of penalty type
Penalty type Frequency Per cent Valid per cent
Fine/bond 19 6.7 6.8 Community order/probation 6 2.1 2.1 Wholly suspended 43 15.2 15.3 Custody 208 73.5 74.0 Other 1 0.4 0.4 Unknown 4 1.4 1.4 Total 281 99.3 100 Missing 2 0.7
This same information is represented graphically in Figure 1.
Figure 1: Distribution of penalty type
By far the most common outcome for these cases was some form of immediate custody,
with 74 per cent of cases resulting in custody and only a tiny proportion receiving some
form of sentence to be served in the community.15
About one in six cases (15.3 per cent)
received a wholly suspended sentence.
Total effective sentence length
The length of the total effective sentence is a continuous variable, measured in number
of months.16
The mean length of sentence was 53.8 months, or four and a half years,
while the median was 36 months, or three years.17
Sentence length ranged from three
15 Distributions are discussed in terms of the valid per cent, representing the proportion of cases for
which data are available (that is, missing cases are excluded from the denominator in the calculation of valid per cent).
16 In a small number of cases the initial sentence imposed was appealed. Where the appeal was upheld, the sentencing outcome data reflect the final sentence rather than the original one.
17 The mean provides a simple average, while the median is the 50th percentile, or the data point below which
half the cases fall. The median is not sensitive to extremely high or low values, so it provides a better measure of the midpoint of the data.
Penalty type (%)
Fine/bond
Communityorder/probation
Wholly suspended
Custody
Other
Unknown

8
months to 252 months (21 years).18
The 75th percentile (the number below which 75 per
cent of cases fall) was 72 months (six years), while the 25th percentile was 18 months.19
Dependent variable: delay
The second of the dependent variables was delay, operationalised as the number of
years between the first known offence in the case and the year of sentence.20
Delay is measured as a continuous variable for the bivariate and multivariate analyses,
although it is presented as a categorical measure for ease of interpretation in this
descriptive analysis.
The mean time elapsed between the first known offence in the case and the sentence
was 24.6 years, while the median was 26 years. The length of delay ranges from 0 years
(offence and sentence in the same year) to 58 years, although three-quarters of the cases
had a delay at or below 35 years. This means the database involved a large number of
historical offences – those for which a sentence was imposed many years or even
decades later. This delay presents particular difficulties for judges when trying to
formulate a sentence, as it requires consideration of the sentencing principles in effect
at the time of offending. This issue is further discussed in Chapter 4.
The categorical version of delay is presented in Table 2.
Table 2: Distribution of delay (categorical)
Delay Frequency Valid per cent
Less than 5 years 30 10.6 5 to less than 10 years 13 4.6 10 to less than 20 years 25 8.8 20 years or more 149 49.5 Unknown 75 26.5 Total 283 100
18 The total effective sentence variable was significantly skewed – see Appendix C for detail on how this was
managed for subsequent analyses.
19 One of the factors that might influence sentence length is the court jurisdiction for sentencing. In this
database, 94 per cent of all cases were sentenced in each state’s higher courts, with only 17 cases sentenced
in a lower court. With this lack of variability, court jurisdiction was not included in further analyses.
20 The start date of the offending was taken as the year only, as victims in many of the cases were not able to provide the court with a precise date on which the offending commenced (or indeed, concluded).
The average length of delay between the first known offence in a matter and the
sentence was 25 years. The longest delay in a matter was 58 years.

9
This same information is represented graphically in Figure 2.
Figure 2: Distribution of delay
Table 2 and Figure 2 show that the most common delay from the first offence to the
sentence in a given case is 20 years or more, with half of all cases (49.5 per cent) having
this extended delay. It should be noted, however, that a large amount of data are missing
in this variable: in 75 cases the delay was unknown. This is due to the lack of specific
information available in many of the sentencing remarks or transcripts of court
proceedings, such that there is no mention of when the offending took place.
Independent variables
The sentencing database of 283 cases primarily includes people sentenced once only.
These people may have offended against a single victim, or they may have multiple
victims but were sentenced in a single proceeding. However, 37 people were sentenced
multiple times – with separate proceedings that each resulted in a conviction – and are
included in the database more than once.21
The descriptive data on the independent
variables thus include some repetition.
21 There is a difference between being sentenced for offending against multiple victims and being sentenced
on multiple occasions. While an offender may be sentenced at the one time for offending against multiple
victims, the fact that an offender was sentenced on multiple occasions means there were separate
proceedings that each resulted in a conviction. Of the 37 people in the database who were sentenced on
more than one occasion, all but one were sentenced on two occasions, with one person (Gerald Francis Ridsdale) sentenced on four separate occasions.
Delay from first offence (%)
Less than 5 years
5 to less than 10 years
10 to less than 20 years
20 years or more
Unknown

10
Victim and offender characteristics
Table 3 summarises the victim and offender characteristics (of the categorical variables
only) in the 283 cases of institutional CSA in this database. Each of these variables is
subsequently presented in the bivariate analyses.
Table 3: Victim and offender characteristics (categorical variables)
Characteristics: victims and offenders Frequency Valid per cent
Victim gender Female 70 24.9
Male 190 67.6 Both male and female 11 3.9 Unknown 10 3.6
Victim age
Under 10 38 13.5 10 to under 12 35 12.4 12 to under 16 124 43.8 16 to under 18 17 6.0 Unknown 69 24.4
Offender prior record22
None 145 51.6
22 Prior record was particularly difficult to ascertain from the sentencing remarks or transcripts of
proceedings. In several cases, the judge was required to ignore other offending for the purposes of
sentencing if that offending took place subsequently to the offending for which the person was being
sentenced. For example, a defendant may have offended in 1955 and been sentenced in 1985. He may also
have offended in 1953 but have been sentenced for that crime in 1990. When sentencing in 1990, the judge
would have sentenced the defendant as a first-time offender, despite knowing that he had actually been
sentenced for additional crimes, as the additional offending occurred after the offending for which the
defendant was being sentenced. In such instances, the person was categorised as having a prior record in order to understand more fully the characteristics of institutional sexual abuse offenders.
Two-thirds of the cases in this database involved male victims only, and the most
common age of victims was 12 to 16 (44 per cent).
In just over half of the cases, the offender did not have any prior record, although in
9 per cent of cases the offender had previously committed a sexual offence against a
child and in a further 15 per cent the offender had previously spent time in custody for
a child sexual offence.
In 58 per cent of cases the offender had committed CSA offences against more than one
victim. Cases with multiple victims were more likely to occur in religious institutions,
and were more likely to involve penetrative offences and grooming behaviours. More
than half of these cases did not appear to involve escalation from a non-penetrative to a
penetrative offence, although half of the cases did involve some degree of variation in
the types of offences committed.

11
Yes – non-sexual offence 9 3.2
Yes – sexual offence against adult 1 0.4 Yes – sexual offence against child 26 9.3 Yes – sexual offence against adult (with custody) 1 0.4 Yes – sexual offence against child (with custody) 41 14.6 Unknown 58 20.6
Multiple victims
No 99 35.0 Yes 165 58.3
Unknown 19 6.7
Victim gender
Table 3 shows that two-thirds (67.6 per cent) of the victims of institutional abuse in this
database were male, while a quarter (24.9 per cent) were female. Only a small
proportion of cases (3.9 per cent) involved victims of both genders. This is likely a
reflection of the high representation (over half) within the database of single-sex boys’
schools and churches (almost one-quarter), where victims were often boys in formal
roles within church proceedings (such as altar boys). This same information is
represented graphically in Figure 3.
Figure 3: Distribution of victim gender
Victim age
Similarly, the victims’ ages may reflect the nature of the institution: the most common
age of victims was 12 to under 16 (43.8 per cent). Alarmingly, the second most common
age group was under 10, with 13.5 per cent of victims in this category. When
considering primary school children together (all those aged under 12), one-quarter of
Victim gender (%)
Female
Male
Both male and female
Unknown

12
the victims in this database (25.9 per cent) were in those most vulnerable years.
However, with one-quarter of the cases lacking information on the victim’s age, it is
difficult to make definitive statements about victims’ ages.23
This same information is represented graphically in Figure 4.
Figure 4: Distribution of victim age
Offender prior record
In one-fifth (20.6 per cent) of cases, it is unclear whether the offender had a prior record.
However, it is clear that just over half (51.6 per cent) had not previously been convicted
of any offences. Only two people had previous convictions for a sexual offence against
an adult, either with or without a custodial sentence being imposed. Among those with
prior offending, the most common type (14.6 per cent) was a previous sexual offence
against a child for which a custodial sentence had been imposed.
23 If there is no systematic relationship between victims’ ages and whether the data are missing, these missing
ages may be distributed proportionately across the categories. However, it is possible that there is some
systematic bias in the distribution of missing data. For example, it may be that cases with very young victims are disproportionately likely to be missing these data.
Victim age (%)
Under 10
10 to under 12
12 to under 16
16 to under 18
Unknown

13
This same information is represented graphically in Figure 5.
Figure 5: Distribution of offender prior record
Multiple victims
More than half (58.3 per cent) of the cases in the database involved offending against
more than one victim.24
As these offenders are particularly interesting to the Royal
Commission, a separate analysis was undertaken to understand more about the
characteristics of the offenders and the offences.
In order to ascertain whether differences existed between those cases involving multiple
victims and those involving a single victim, an initial analysis compared the
distributions of all the independent variables across the two groups.25
The multiple-
victim cases were slightly more likely to have male victims (72 per cent compared with
65.7 per cent of single-victim cases). Multiple-victim cases had slightly younger
victims, with a mean age of 11.44 years and a median of 12 years, compared with a
mean of 12.16 and a median of 13 years for single-victim cases.
Examining differences in offending characteristics (seen for the overall sample in Table
4 below), cases involving multiple victims had a somewhat different profile in terms of
institutional context. They were more likely to occur in religious schools (30.5 per cent
compared with 21.2 per cent for single-victim cases) and less likely to occur in non-
religious schools (23.8 per cent compared with 33.3 per cent for single-victim cases).
Multiple-victim cases were also more likely to occur in the church context (25 per cent
compared with 18.2 per cent for single-victim cases). This predominance of religious
institutions among multiple-victim cases meant that these cases were less likely than
single-victim cases to have occurred in healthcare facilities (1.2 per cent versus 5.1 per
cent); in Scouts or sports clubs (14.6 per cent versus 17.2 per cent); and in out-of-home
care (1.2 per cent versus 3 per cent). There is clearly a pattern among cases with
24 An offender is considered to have offended against more than one victim regardless of whether he is
sentenced in a single matter or across multiple matters.
25 The bivariate relationship between multiple-victim status and each of the outcome/dependent variables is discussed below.
Offender prior record (%)
None
Yes – non-sexual offence
Yes – sexual offence against adult
Yes – sexual offence against child
Yes – sexual offence against adult (with custody)
Yes – sexual offence against child (with custody)
Unknown

14
multiple victims of offending, primarily against young males, within institutions
steeped in religious authority.
As with cases involving single victims, those with multiple victims most commonly
involve charges of indecent assault; slightly more than 53 per cent of both types of case
were in this offence category. However, the cases differed in the proportion involving
penetrative offences: 38.2 per cent of multiple-victim cases involved penetration
compared with 30.6 per cent of single-victim cases. Offending in multiple-victim cases
lasted longer, with a mean duration of 8.94 years and a median of five years, compared
with a mean of 2.65 years and a median of one year for single-victim cases. Finally,
multiple-victim cases were more likely to involve grooming (71.1 per cent versus 59.2
per cent), with more frequent provision of alcohol, drugs and/or pornography (52.8 per
cent versus 38.3 per cent). Multiple-victim cases thus tended towards more serious
offending over a longer duration. Such cases were also more likely to involve planning,
as evidenced by the prevalence of grooming. Despite the greater harm and culpability
involved in multiple-victim cases, offenders were slightly less likely to plead guilty
(69.3 per cent compared with 74.7 per cent of offenders in single-victim cases).
One of the most important questions about people who offend against multiple victims
is whether their behaviour escalates over time, becoming more serious. A qualitative
analysis of sentencing remarks attempted to shed some light on this issue.
Given that some of the remarks did not detail the precise nature of the offending and
many did not provide a chronological discussion of the offending, it was very difficult
to determine accurately whether escalation had occurred. Even so, an attempt was made
to identify those cases with clear evidence of escalation or lack of escalation.
Offending was classified as having escalated only if the judge used that term to describe
the behaviour, or if there was clear evidence of offending moving from non-penetrative
to penetrative. Based on current legal approaches to ‘penetration’, behaviour was
classified as penetrative if it involved anal, vaginal or oral penetration of any kind,
including penile and digital. Cases were classified as escalating if there had been a shift
to penetrative offending against multiple victims in one case, or if the shift to
penetration occurred across multiple cases.26
More than half of the 165 cases (55.5 per cent, or 91 cases) did not appear to involve
escalation from a non-penetrative to a penetrative offence. Only 12.8 per cent (21 cases)
appeared to involve escalating offending, and the remainder were unclear. Some cases
escalated directly to penetration, for example, shifting from masturbation to fellatio.27
Other paths to escalation followed a more convoluted route, with many victims over
many years, shifting from fondling and masturbation to naked simulated intercourse,
fellatio or cunnilingus, and digital penetration.28
26 In a large proportion of cases (31.7 per cent) it was not possible to tell if there had been escalation. The data
for this measure should thus be treated with caution.
27 For example, the escalating offending committed in B, DR occurred in 1961 (masturbation) and 1962
(masturbation plus fellatio). In Ferguson, offending in November (masturbation) had escalated quickly by December (fellatio).
28 For example, the offending in AB involved multiple victims in a single case. The offending took many
forms over the years. The first victim (1976) and the second victim (1977) were both subjected to fondling
and masturbation. By the third victim, naked simulated intercourse was involved. The fourth was also a
victim of masturbation, while the fifth and sixth were subjected to indecent touching. The seventh victim
(1979) was involved in mutual masturbation with other boys present and in 1983 was forced to fellate the
offender. In 1985, another victim was involved in mutual masturbation. In 1986, three female victims were

15
Cases were also examined to determine if there was variety in the specific types of
offending, regardless of whether there was also escalation. ‘Variety’ was deemed to be
present if the nature of the offending changed over time (either escalating or
de-escalating). If all the offending behaviour was of the same type, these cases were
deemed not to have variety of offending.
More than one-quarter of the cases (28.1 per cent) had insufficient information on the
nature of the offending behaviour to be able to assess whether there was variety. In just
under one-quarter (22.6 per cent), offending did not appear to vary. In some cases, the
consistent offending was non-penetrative. For example, in Firman, the offender had
previously been sentenced for possessing child pornography, with the more recent
sentence being for taking an indecent photograph. In Stewart, the offending involved
fondling two male victims, while both Rolleston and Richards involved masturbation
of multiple victims over many years. In other cases, the consistent offending involved
penetration. For example, in L, the offender was a cult leader who had acquired 10
‘spiritual wives’ with whom he had fathered 63 children. In Tee, there were two male
victims of fellatio, Egan involved three female victims of rape over 26 years, and Ellis
involved four victims of anal intercourse with violence or threats of violence.
More commonly, however (in 49.4 per cent of cases), the offending varied to some
degree. The two most common combinations of offending (with six cases each) were
masturbation plus fellatio, and masturbation plus fondling. The next most common
combinations (with five cases each) were masturbation plus penetration, and fondling
plus penetration. The greatest variety of offending behaviour was seen in one case
(Mentink), which involved kissing, masturbation, fellatio and intercourse with one
victim, and fondling of a second victim.29
Across the 81 cases with a variety of offending, many different combinations of
offending behaviour were seen. Thus, it is apparent that among offenders with multiple
victims, there is frequently a variety of offending behaviour taking place; specialisation
in specific behaviours appeared to be less common. While the large proportion of cases
with unknown data for this measure means the results must be treated with caution, the
data do indicate that offending variety is common among these offenders.
digitally penetrated at the offender’s desk, in front of the class. One of these victims was also forced to
masturbate the offender and he committed cunnilingus on her. In this case, there is both an escalation of
offending and a wide variety of specific types of offending.
29 Wilfred Jan Reiner Mentink, a Queensland teacher, was sentenced for maintaining an unlawful sexual relationship with one victim, and for indecent dealing or treatment with the other.

16
Offending characteristics (categorical variables)
Table 4 summarises the offending characteristics (of the categorical variables only) in
the 283 cases of institutional CSA in this database.
Table 4: Offending characteristics (categorical variables)
Characteristics: offending Frequency Valid per cent
State30
ACT 1 0.4 NSW 109 38.5 NT 0 0 Qld 54 19.1 SA 40 14.1 Tas 8 2.8
Vic 56 19.8 WA 15 5.3
Institution type31
School/boys’ home – religious 76 27.0 School/boys’ home – other 77 27.3 Church 65 23.0 Healthcare facility 8 2.8 Scouts/sports club/YMCA 41 14.5 Out-of-home care 6 2.1 Other 7 2.5
Unknown 2 0.7
30 Note that the state in which the offender was sentenced is not included in subsequent analyses and is
included here simply to identify the jurisdiction in which the case was sentenced. The data do not necessarily reflect the prevalence of institutional CSA in each jurisdiction.
31 In instances where more than one organisation is involved (for example, where the offender was both a
priest and a Scout master), the data are coded for the religious role (that is, under ‘church’ rather than under ‘Scouts’).
The offending in this database was most likely to occur in a religious or non-religious
school (27 per cent each) or a church (23 per cent). Almost two-thirds of the schools
and churches in which the offending took place were Catholic.
More than half (53 per cent) of the cases involved indecent assaults, although
one-third involved a penetrative offence. Almost half (48 per cent) of the offending
lasted less than five years, although 7 per cent took place over 20 years of more. Some
form of grooming occurred in almost one-third of cases.
In 43 per cent of cases, the institution took no action, but in 39 per cent of cases the
offender was dismissed. The offender pleaded guilty in 71 per cent of cases.

17
Offence type32
Sexual assault/penetration 94 33.5 Persistent abuse 13 4.6 Indecent assault 148 52.7 Indecent act 12 4.3 Child pornography 4 1.4 Other sexual offences 0 0 Unknown 10 3.6
Offending duration33
Less than 5 years 137 48.4 5 to less than 10 years 25 8.8
10 to less than 20 years 39 13.8 20 years or more 21 7.4 Unknown 61 21.6
Grooming34
No 46 16.3 Yes – friendship with family 19 6.7 Yes – discussions of sexuality 3 1.1 Yes – providing alcohol/pornography/other 58 20.6 Yes – unspecified 7 2.5
Unknown 149 52.8
Institutional response35
No action taken 30 42.9
Offender moved within institution 10 14.3 Mediation/meeting between offender and victim
3 4.3
Offender dismissed 27 38.6
32 The classification of offence type depends entirely on the offence(s) for which the offender was sentenced.
As the definition and scope of offences have changed over time, each category does not necessarily
represent behaviours that would be similarly classified today. For example, decades ago an ‘indecent assault’ may have included penetration, whereas today penetrative offences are classified separately.
33 This variable measures all known offending, even if it spans multiple sentence dates. It is therefore a measure of all known (via sentencing remarks) offending associated with each person.
34 This is grooming conduct, not grooming offences. As there is a substantial amount of missing data, this
variable should be treated with caution. In addition, this was a difficult variable to code as there was much
overlap in the categories, with offenders exhibiting multiple forms of grooming behaviour.
35 Information on the institution’s response was only available for 70 cases. This measure should thus be seen as indicative only and should be treated with caution in statistical analyses.

18
Plea type36
Guilty 199 71.1 Not guilty 68 24.3 Other (unfit to stand trial) 2 0.7 Unknown 11 3.9
Sentence period37
1971–99 82 29.6 2000–09 101 36.5 2010–15 94 33.9
Institution type
Table 4 shows that the most common type of institution in which CSA occurred in these
data was a school or boys’ home (54.3 per cent), almost evenly split between religious
(27 per cent) and other types (27.3 per cent) of schools. The next most common
institutional types were the church (23 per cent) and clubs such as sporting clubs or
Scouts (14.5 per cent). A small number of cases involved a healthcare facility, such as
a psychiatric hospital (2.8 per cent), and even fewer involved out-of-home care (six
cases, or 2.1 per cent). This information is presented in graphical form in Figure 6.
Figure 6: Distribution of institution type
36 As offenders may plead differently to different charges, this variable measures the plea to the principal
offence (defined as the offence that attracted the longest sentence).
37 The Royal Commission expressed interest in whether the relationships among the variables had changed
over time, with a focus on the most recent five years or so. In order to measure sentencing changes over
time with a variable that had good variation but still sufficient numbers in each category, the variable
‘sentencing period’ was created. This variable is used in subsequent analyses to identify whether the period
in which the sentence was imposed (last five years, recent past, or prior to many of the sex offence reforms seen in the last 15 years) has any relationship with the dependent variables.
Institution type (%)
School/boys' home – religious
School/boys' home – other
Church
Healthcare facility
Scouts/sports club/YMCA
Out-of-home care
Other
Unknown

19
Given that these data lie at the heart of the Royal Commission’s work, additional
research was undertaken to identify the types of schools and churches in the database.
Of the 153 schools represented, information was found for 109.38
Of those, more than
half (55 schools, or 51 per cent) were Catholic non-boarding schools. Fifteen schools
(14 per cent) were Catholic boarding schools and 15 were government schools. The
final large category was independent Anglican boarding schools, with 14 (13 per cent)
found in the database. The remaining school types included only one or two cases
each.39
Clearly, the majority of schools represented in this database were Catholic
schools (70 schools, or 65 per cent).
Information was available for 60 of the 65 churches in the database.40
Similar to the
data on school types, the majority of churches in the database were Catholic
(40 churches, or 61.5 per cent). A further 14 churches (21.5 per cent) were Anglican.
The remaining church types included only one or two cases each.41
Offence type
When examining the offence type, the changing definitions of offences must be borne
in mind. These data represent the offences for which people were sentenced; they do
not necessarily conform to definitions of the offences in use today.
The largest category of offence type was indecent assault, which was the principal
offence in 52.7 per cent of cases. The second most common offence category was
penetrative offences of all kinds, with one-third of all cases (33.5 per cent) falling into
this group.
Persistent sexual abuse (also known as maintaining a sexual relationship with a child)
was found in 4.6 per cent of cases (13 cases)42
and an indecent act was seen in
4.3 per cent of cases (12 cases). Child pornography offences as principal offences were
rare in this database, with only four matters (1.4 per cent).
Figure 7 presents this information graphically.
38 Information on schools was sourced using Google. Typically, school websites identify the nature of the
school, which could then be coded. If the school’s name was absent, no information could be added.
39 These remaining schools were as follows: two independent Anglican non-boarding; two independent
Uniting non-boarding; two independent non-denominational; one independent Presbyterian boarding; one
independent Presbyterian non-boarding; one independent Uniting boarding; one independent Presbyterian and Uniting boarding; and one independent Jewish non-boarding.
40 Information on churches was sourced using Google. Typically, the Google search would identify the nature of the church, which could then be coded.
41 These remaining churches were as follows: two Jehovah’s Witnesses; two Pentecostal; and one each of
Lutheran and Uniting.
42 The offence of persistent sexual abuse, or maintaining a sexual relationship with a child, was first legislated in Queensland in a 1989 amendment to the Criminal Code 1899 (Qld) s 229B.

20
Figure 7: Distribution of offence type
As the Royal Commission is particularly interested in cases involving persistent abuse,
a separate qualitative examination of their characteristics was conducted. Of the 13
cases involving persistent abuse, 10 involved schools (six were Catholic schools), two
occurred in the context of Scouts Australia and one involved a children’s choir. All
offenders were sentenced between 1993 and 2014, and all but one received a prison
term (one defendant was deemed unfit to stand trial). Head sentences ranged from two
years to 12 years, and both offenders sentenced in the 1990s received a nine-year term.
Sentences in the most recent period (since 2010) ranged from two years to 10 years.
The longest head sentence (12 years) was imposed in 2005 for a case involving 62
offences committed by a primary school teacher who was on bail for unrelated offences
at the time of his offending, and who groomed his victims by providing them with
alcohol and marijuana. Four of the cases involved female victims, two of whom were
aged 15 and were mentally unstable. In these two cases, the offender (a teacher)
befriended the young girl, offering support and friendship prior to the offending. Seven
of the cases involved offenders who had abused more than one victim and six of the
cases involved grooming, such as providing alcohol, cigarettes and pornographic
material (in three cases), and generally befriending the victim in order to commit the
crime (in a further three cases).
Offending duration
In almost half (48.4 per cent) of the cases, the offending took place over less than five
years. However, more extended offending was not uncommon: 39 cases (13.8 per cent)
involved offending over 10 to 20 years, while 21 cases (7.4 per cent) involved offending
over decades – 20 years or more. As with victim age, however, for a substantial amount
of data the offending duration is unknown (21.6 per cent). Figure 8 presents this
information graphically.
Offence type (%)
Sexualassault/penetration
Persistent abuse
Indecent assault
Indecent act
Child pornography
Unknown

21
Figure 8: Distribution of offending duration
Grooming
Missing data is also a problem with grooming behaviour – more than half (52.8 per
cent) of all cases do not mention grooming. This does not mean that grooming did not
occur; rather, it was not mentioned in sentencing remarks or transcripts of
proceedings.43
In cases where grooming was mentioned, it was most likely in the form
of the offender befriending the victim and providing alcohol, pornography, money,
treats or other gifts prior to the offending commencing. When the judge mentions
grooming, it is not always called ‘grooming’ and may simply be stated as part of the
facts of the case. This makes it unclear whether grooming is seen as an aggravating
circumstance or if it in any way changes judicial perceptions of a case. Figure 9 presents
this information graphically.
Figure 9: Distribution of grooming behaviour
43 Grooming is a concept that has been recognised by the courts only quite recently, both in Australia and
internationally.
Offending duration (%)
Less than 5 years
5 to less than 10 years
10 to less than 20 years
20 years or more
Unknown
Grooming (%)
No
Yes – friendship with family
Yes – discussions of sexuality
Yes – providing alcohol/pornography
Yes – unspecified
Unknown

22
Institutional response
Only 70 of the 283 cases had information about the institutional response to the
offending. In 30 of these 70 cases (42.9 per cent), no action was taken – the child’s
report was not believed or was ignored. The following judicial remarks illustrate this:
Instead of vindicating the children’s rights and taking steps to redress the
wrongs done, and instead of getting the children the assistance that may have
gone some way to containing the damage done, the school did nothing.44
On his recollection Father Fleming told him that some things happen, that men
get urges, and that it did not mean anything I am also satisfied that he realised
that even if a boy was to complain to another of the priests or brothers at Boys’
Town there was a fair chance that nothing would come of it.45
In five cases, not only was no action taken against the offender, but the victim was also
punished. For example:
I also accept that following the initial sexual assaults she complained to one of
the younger nuns that the offender had touched her and this was referred to a
senior nun. She was not believed and I accept was called a liar in front of others
and was disciplined by being forced to drink castor oil This is not a case,
however, in which there was no complaint at all made by the child complainant
of sexual assault until more than 50 years after the event. In fact I accept she
did complain to those whose care she was in at the time, but she was not believed
and was not protected. It is unfortunate in the extreme that her complaint was
not taken seriously, and that she was not believed by those to whose care she
was entrusted, because it might have meant that the other complainants in this
trial were spared the sexual attention of the offender.46
The School, St Pius X [in Newcastle, NSW], was described by nearly all of the
complainants in this and in the previous proceedings as a brutal school where
the offender’s predilection for sexually abusing young boys was well known,
where punishment was meted out mercilessly, and where any complaint about
the offender was ignored at best, and brutally punished on other occasions
The apparently protected status of the offender throughout his offending is a
matter so obvious it cannot be ignored … It is now clear that the offender not
only targeted these vulnerable children continuously, but organised himself,
either with or without the assistance of his work colleagues, to ensure that he
was placed in positions where the abuse could continue unhindered, and
complaints would be punished, fobbed off or ignored. Frequent transfers
enabled him to commence with a new group of victims who knew nothing of
his prior reputation … The combined sets of facts lead to an inescapable
conclusion of the active or tacit collusion by at least 2 other church officers,
during the years of offending behaviour. These officers must have known of
this offender’s behaviour and did nothing. There is sufficient evidence in both
sets of facts to conclude complicity in the offending behaviour by these other
church officers which supports a finding of organised criminal activity. I am
44 MJD p 2 per Woodburne DCJ.
45 Evans at [21] and [59] per Hulme J.
46 Egan pp 4–5 per Tupman DCJ.

23
aware that such a conclusion requires a finding beyond reasonable doubt … It
defies belief that his abuse of children was not only widely known but ignored
or condoned by those in authority, at least at the school.47
In addition to these five cases, in one case the victim who reported the matter within
the religious order was told to read from the Bible, while in another case he was told to
confess.
A further 10 offenders (14.3 per cent) were purposefully moved to a different location
within the institution. Judges appeared to recognise and acknowledge the complicity of
the institutions in allowing offenders to change location and carry on their offending,
with no intervention at all:
The Catholic Church cannot escape criticism in view of its lack of action
on complaints being made as to your conduct, the constant moving of you from
parish to parish providing you with more opportunity for your predatory
conduct and its failure to show adequate compassion for a number of your
victims.48
Of these 10 cases, three offenders were put on alert, given a safety plan or moved so
they would no longer have contact with children. In two cases, the offender was ordered
to have counselling.
In three cases (4.3 per cent), some form of restorative process appears to have been
attempted. In two, the victim met with the church for mediation, while in a third the
offender met with the victim and the school principal.
In 27 cases (38.6 per cent), the offender was dismissed from the institution; in five of
these cases, the police or other relevant authority, such as the Education Department,
was notified, and in five cases the offender left that particular institution but joined
another institution. Thus, not all the institutions covered up or ignored the offending.
In one case involving the Anglican Church, the offender’s licence to be a priest was
revoked and every bishop and archbishop in Australia was notified about the offender.
He was also placed on the church’s national register of sex offenders.49
This case,
however, was very recent (sentencing was in 2014); institutional responses to CSA are
likely to have changed substantially in recent years after being placed under significant
scrutiny.
In another case involving a school, the institution also reacted promptly:
In the days subsequent to the offence it does appear that you acted appropriately
and responsibly by informing your superiors and having the issues addressed,
and that led very quickly to your removal from the school, and it did lead to the
needs of the victim and his family being addressed.50
Figure 10 is a graphical representation of the information on institutional response.
47 Denham at [20]–[23] and [29] per Syme DCJ.
48 Ridsdale (2014) at [35] per Rozenes CJ, citing Ridsdale (2006) at [29] per White J.
49 Dowel at [25] per Gaynor J.
50 Veness p 2 per Bradley DCJ.

24
Figure 10: Distribution of institutional response
Plea type
In most cases in this database (71.1 per cent), the defendant pleaded guilty. Typically,
the court took this plea in mitigation, somewhat ameliorating the severity of the
sentence. Figure 11 presents this information graphically.
Figure 11: Distribution of plea type
Sentence period
While the cases cover many decades (from 1971 to 2015), the rate at which cases have
been sentenced seems to have increased over time, from fewer than three per year from
the 1970s to the 1990s (82 cases, or 29.6 per cent), to 10 per year from 2000 to 2009
(101 cases, or 36.5 per cent), to 17 per year in the most recent five or six years (94
cases, or 33.9 per cent).
Institutional response (%)
No action taken
Offender moved withininstitution
Mediation/meetingbetween offender andvictim
Offender dismissed
Plea type (%)
Guilty
Not guilty
Other (unfit to standtrial)
Unknown

25
Offending characteristics (continuous variables)
Table 5 summarises the measures of offending characteristics (of the continuous
variables) in the 283 cases of institutional CSA in this database.
Table 5: Offending characteristics (continuous variables)
Characteristics: offending Value
Number of offences51
Mean 8.5 Median 5.0 Mode 1.0 Minimum 1.0 Maximum 67.0 25th percentile 3.0 75th percentile 11.0
Time between last offence and
sentence (years)52
Mean 19.0 Median 20.0 Mode 2.0 Minimum 0 Maximum 51.0 25th percentile 9.0 75th percentile 27.0
Non-parole period (months)53
Mean 37.3 Median 24.0 Mode 24.0
Minimum 3.0 Maximum 180.0 25th percentile 10.0
51 The ‘number of offences’ variable was significantly skewed – see Appendix C for detail on how this was
managed for subsequent analyses.
52 This variable measures the number of years between the last known offence across all cases for an offender, and the year in which the most recent sentence was imposed.
53 In 208 cases, a custodial term was imposed. Not all of these would have included a non-parole period. For
example, cases with sentences of less than two years may not have had a non-parole period. The data on non-parole periods are available for 187 cases.
The average number of offences per case in this database was 8.5, although the
maximum was 67 offences. An average of 20 years passed between the last known
offence across all cases for an offender, and the year in which the most recent sentence
was imposed. Of the 187 cases in which a non-parole period was imposed, the average
non-parole period was just over three years.

26
75th percentile 54.0
Table 5 shows the substantial variation among cases of institutional CSA. For example,
the number of offences for which defendants were sentenced ranges from one to 67,
although the mean was 8.5 and the median was five. Similarly, the number of years
between the last known offence and the date of sentence varied dramatically, up to 51
years, although the mean number of years between the two dates was 19 years and the
median was 20 years.54
Although a non-parole period was not included as a dependent variable,55
it is included
in this descriptive analysis for completeness. For those cases where a non-parole period
was imposed, its duration ranged from three months to 15 years, with a mean of 37.3
months and a median of two years.
Multivariate relationships
The bivariate analyses (see Appendix D) identified the variables that had a statistically
significant relationship with the dependent variables. These variables were then
included in a multivariate analysis to assess the relationship of each independent
variable with the dependent variable, while taking into account the effects of the other
variables. That is, while bivariate analyses examine one relationship at a time,
multivariate regression analyses allow for examination of the independent effect of
each variable while the effects of the other variables are held constant.
Sentencing outcome: penalty type
As multivariate analysis places greater statistical demands on a variable than does
bivariate analysis, the ‘penalty type’ variable, with three categories, was first recoded
to address its uneven distribution. The two categories created were custody (unchanged
from the previous version) and non-custody (combining community sentences and
wholly suspended sentences).56
54 The number of years between the last offence and the sentence differs from the measure of delay, as this
measure counts from the last known offence across all the person’s known cases, whereas the duration
measure counts from the first known offence in that particular case.
55 The non-parole period was not included for two reasons: not all custodial sentences will have a non-parole
period, such that a lot of data would be missing (data are missing for 96 people, or one-third of the
database); and the timing of an offender’s release from prison is typically not at a judge’s discretion. Parole
boards usually (although not always) decide when a prisoner is to be released. Given that this process may
vary across jurisdictions, it is more accurate to measure sentencing outcomes by the total effective sentence rather than by the non-parole period.
56 Details on the recoded variable may be found in Appendix C.
When examining all the predictors of penalty type together, the presence of grooming
and a higher number of offences predicted that a custodial term was more likely to be
imposed – regardless of the offender’s plea, the period in which the case was
sentenced and whether multiple victims were involved. Conversely, a case involving
an indecent assault was less likely to attract a custodial sentence than one involving a
penetrative offence.

27
In its new form as a dichotomous variable, penalty type (custody) required a logistic
regression to assess the multivariate effects.57
Using only the significant results from the bivariate analysis,58
the six variables59
included in the model as predictors for penalty type (custody)60
were:
grooming
multiple victims
type of offence
number of offences
plea type
sentence period.
Table 6 shows the statistically significant results of the logistic regression analysis
undertaken to quantify the likelihood of a custodial penalty being imposed for each
predictor, holding the other predictors constant.
Table 6: Logistic regression against penalty type (custody)
95 per cent confidence
interval
Predictor Regression coefficient Significance Odds ratio Lower Upper
Grooming 2.227 0.009 9.269 1.764 48.711 Number of offences (median) 2.674 0.032 14.502 1.265 166.309 Offence – indecent assault -2.352 0.045 0.095 0.009 0.954
The model successfully accounted for 57.4 per cent of the variance in penalty outcome
(Nagelkerke R-squared = 0.574) and fit the data well (with a non-significant Hosmer-
Lemeshow61
test: χ²(7, 115) = 4.105, p = 0.768). Overall, the model correctly predicted
91.3 per cent of the observations, although it was far more successful at predicting
57 Logistic regression is a special form of multiple regression that is used for dichotomous dependent
variables. While the aim of the analysis is the same as that of linear regression – to examine each
relationship while taking account of all the others in the equation – its results are interpreted somewhat
differently, in terms of an odds ratio.
58 In order to avoid over-fitting the model – putting in so many independent variables that the results become
meaningless – only those variables that were already shown to have a relationship with the dependent variable at the bivariate level were included in the multivariate analysis.
59 Given the lack of robustness of the ‘institutional response’ variable, it was not included in the multivariate analysis stage of the research.
60 The contrast used for the logistic regression was a simple contrast with the first category as the reference
category. As most of the independent variables in the equation were dichotomous no/yes measures, using
the first category as the reference means that the odds ratio represents the presence of the factor, compared
with its absence. For example, the presence of grooming increases the likelihood of a custodial term by
9.3 times, compared to the absence of grooming. ‘Number of offences’ was a dichotomous variable of below the median/above the median. The first category for offence type was a penetrative offence.
61 The Hosmer-Lemeshow test assesses the relationship between expected values and observed values for
each group of the dependent variable (custody and non-custody). A non-significant value for the test indicates that the model is a good fit to the data.

28
membership in the custody group (96.9 per cent correctly predicted) than the non-
custody group (58.8 per cent correctly predicted). It is possible that the differential
success of the model in predicting group membership is due to the smaller number of
cases in the non-custody group (17 cases) compared with the custody group (98 cases).62
Of the six predictors, only three were statistically significant: the number of offences
in the case, whether grooming was involved, and the offence type. A case was more
likely to involve a custodial sentence if there were more offences than the median and
if grooming was involved. Conversely, a case involving an indecent assault was less
likely to involve a custodial sentence than one involving a penetrative offence.
Cases with more offences than the median were 14.5 times more likely to include a
custodial term than those with fewer offences than the median (odds ratio = 14.502, p =
0.032). Cases that involved grooming were 9.3 times more likely to include a custodial
term than those without grooming (odds ratio = 9.269, p = 0.009). Finally, the only
offence type to reach statistical significance in this regression was in cases involving
an indecent assault, which were 90 per cent less likely to result in a custodial term
compared with those involving a penetrative offence (odds ratio = 0.095, p = 0.045).
When examining all the predictors of penalty type together, the presence of grooming
and a higher number of offences predicted that a custodial term was more likely, even
after taking into account the other variables (that is, regardless of the offender’s
plea, the period in which the case was sentenced and whether multiple victims
were involved).
Judges are likely to perceive cases with more offences than the median as particularly
deserving of a custodial sentence. The data do not allow the identification of a reason
for this, but it’s possible that it is seen as reflecting a particularly high level of
culpability. Nor do sentencing remarks shed light on this matter. A case with a single
offence may involve objectively more serious offending than one with many, depending
on the nature of the offence(s), and judicial remarks for cases in this database do not
generally refer to the number of offences.
In contrast, grooming behaviour is more readily linked with a custodial penalty.
Sentencing remarks in cases involving grooming often include comments about the
insidious nature of the grooming, the planning involved, the level of deception, and the
manipulation of the victim and their family by befriending them and winning their trust.
Several examples of the comments made by judges include the following:
Even when particular offences appeared to be spontaneous, they were in reality
a result of his long-term grooming activity and cultivation of complicit adults.
This allowed him to offend whenever and wherever he chose, sometimes
apparently spontaneously.63
[Y]ou had befriended their family – because they were fatherless and had,
by befriending the family, placed yourself into a position that allowed you
an opportunity to offend against the two boys in question … The Crown case
was that, under the pretext of providing a father figure to A and B, the appellant
inveigled his way into their family life while engaging in surreptitious sexual
62 The logistic regression analysis only captured 115 of the 283 cases, or 40.6 per cent.
63 Denham at [19] per Syme J.

29
activity.64
You cultivated your relationships with both boys and you did so in insidious
ways: supplying cannabis to them, smoking it with them, and teaching them
how to hide the evidence of their cannabis use. You shared dirty jokes with
them, invited them to your home where they met your wife, and you and your
wife’s friends. In these ways, they were admitted to your adult world and were
made to feel privileged, grown up. Once had [sic] the boys softened up, you
seduced them.65
The evidence, which I accept, that the attention given by the accused to the
complainant made her feel special indicates that the accused was grooming the
complainant: this made her less likely to complain about the conduct.66
You wormed your way into the confidence of these boys and their families, so
that you were able to prey upon these boys and gratify your perverted lust.67
Regardless of whether the behaviour is charged as a grooming offence or is called
grooming specifically, judges clearly perceive this type of behaviour as warranting a
more severe penalty due particularly, it seems, to the extreme breach of trust typically
seen in cases where grooming is involved. While it was rare for a judge to identify
explicitly the behaviour as ‘aggravating’, sentencing remarks made clear that grooming
behaviour was considered an aggravating factor.
Finally, as the last of the variables to predict the penalty while also taking into account
the other variables, cases involving an indecent assault were less likely to result in a
custodial term than those involving a penetrative offence. Although the definition and
application of ‘indecent assault’ has varied over time, in this database it appears to have
been used largely for non-penetrative offences. It is thus not surprising that these
offences predict a lower likelihood of a custodial term. What is surprising, however, is
the lack of a statistically significant relationship for indecent act offences, given that
they would typically be considered even less serious. It is likely that the lack of effect
for indecent act is due to the small number of cases in this database (only 12 cases, or
4.3 per cent) – there are too few cases for any effect to be found. The same issue pertains
to both persistent abuse (13 cases) and child pornography (only four cases). Thus, the
impact of this variable in the equation should be considered with some degree of
caution.
Summary of multivariate relationships with penalty
To summarise, the likelihood of receiving a custodial term was predicted by three
variables:
The number of offences: cases with more offences were more likely to receive
a custodial term.
The presence of grooming: cases involving grooming were more likely to
receive a custodial term.
64 GRK p 3 per Ryrie J; KP at [9] per Holmes J.
65 Bonython-Wright at [89] per Kourakis CJ, citing Boylan J.
66 Derrick at [60] per Lovell J.
67 Batty p 1 per Howse J.

30
The type of offence: compared with penetrative offences, cases with a principal
offence of indecent assault were less likely to receive a custodial term.
Sentencing outcome: total effective sentence length
As total effective sentence length is a continuous variable, a linear regression was
undertaken to assess the multivariate effects.68
Using only the significant results from the bivariate analysis, the seven variables
included in the model for total effective sentence length were:
number of offences
victim age
time between last offence and sentence
grooming
multiple victims
duration of offending
type of offence.
To examine the relative effect of each, a stepwise method of regression was undertaken.
This method allows each variable to be entered into the equation one at a time, starting
with the variable with the strongest relationship with total effective sentence length.
The final model includes only those variables that have a significant relationship with
total effective sentence length; the non-significant variables are excluded.
68 Prior to finalising the regression, tests were undertaken to ensure that the data did not violate the
assumptions required for linear regression. The normal probability plot of standardised residuals for the
dependent variable indicated a relatively normal distribution of error terms, while the scatterplot indicated
very good homoscedasticity, or constant variance of errors in the dependent variable. The Variance
Inflation Factor was acceptable for all variables (less than five), showing that multicollinearity was not a problem.
The strongest predictor of total effective sentence length was the number of offences:
the more offences, the longer the total effective sentence. Cases involving more
serious offence types were also more likely to include a longer total effective sentence,
as were cases in which there was less time between an offender’s last known offence
and the year in which the most recent sentence was imposed. The victim’s age, the
presence of grooming, multiple victims or offending duration had no effect on the
total effective sentence length.

31
Table 7 shows the results from the final model of the linear regression.
Table 7: Linear regression of total effective sentence (final model)
Unstandardised
coefficients Standardised coefficients
Predictor B Standard
error Beta t Significance
Variables in model Number of offences 0.446 0.059 0.505 7.583 0.000 Offence type -0.135 0.024 -0.370 -5.542 0.000 Time between last offence and sentence -0.004 0.002 -0.136 -2.132 0.035
Excluded variables(a) Victim age -0.042 -0.598 0.551 Grooming 0.051 0.738 0.462 Multiple victims 0.081 1.161 0.248 Offending duration -0.069 -1.084 0.280
(a) Beta for excluded variables is the standardised regression weight if that variable had been included in the model by itself at the next stage.
The first variable included in the model was the (log-transformed) number of offences.
This variable alone predicted 37.8 per cent of the variance in total effective sentence
(adjusted R-squared = 0.378). The second variable to enter the model was offence type,
which added a further 13.1 per cent to the explained variance, while the third and final
variable, time between last offence and sentence, added a further 1.8 per cent to the
explained variance. Overall, the model with the three statistically significant variables
predicted 52.1 per cent of the variance in total effective sentence length (adjusted R-
squared = 0.521, F(3,118) = 43.777, p = 0.000).
Only three predictors attained statistical significance in the final model, when holding
constant the effects of the other predictors. The strongest predictor was the number of
offences: the more offences, the longer the total effective sentence (Beta = 0.505,
t = 7.583, p = 0.000). Cases involving more serious offence types were also more likely
to include a longer total effective sentence (Beta = -0.370, t = -5.542, p = 0.000).
Finally, cases with less time between an offender’s last known offence and the year in
which the most recent sentence was imposed were more likely to include a longer total
effective sentence (Beta = -0.136, t = -2.132, p = 0.035).
Once again, the number of offences and the offence type significantly predicted the
sentencing outcome – this time the length of the total effective sentence. This regression
also showed the small but significant effect of the time between the last known offence
and the most recent sentence, with less time between the two predicting a longer prison
term.
The other variables initially included in the regression equation – victim age, presence
of grooming, multiple victims and offending duration – were excluded from the final
model as they did not reach statistical significance.

32
It is particularly interesting that grooming – after significantly predicting the likelihood
of a custodial penalty – did not significantly predict the length of the prison term. It
thus appears that grooming is particularly pertinent to the decision to incarcerate but
not immediately predictive of the duration of that incarceration, when considering other
variables.
Summary of multivariate relationships with total effective sentence length
To summarise, the three variables that predicted the length of the total effective
sentence were:
The number of offences: more offences led to a longer total effective sentence.
The type of offence: more serious offences led to longer total effective
sentences.
The time between the last known offence and the sentence: the less time
between an offender’s last known offence and the most recent sentence, the
longer the total effective sentence.
Delay
As delay is also a continuous variable, a linear regression was once again undertaken
to assess the multivariate effects.69
Using only the significant results from the bivariate analysis, the six variables included
in the model for delay were:
number of offences
victim gender
multiple victims
institution/occupation/relationship
offending duration
sentence period.
To examine the relative effect of each, a stepwise method of regression was undertaken.
As the bivariate analyses showed that the overall categorical
institution/occupation/relationship variable was significantly associated with delay –
69 Prior to finalising the regression, tests were undertaken to ensure that the data did not violate the
assumptions required for linear regression. Again, the normal probability plot of standardised residuals for
the dependent variable indicated a normal distribution of error terms, while the scatterplot indicated fairly
good homoscedasticity, or constant variance of errors in the dependent variable. The Variance Inflation Factor was acceptable for all variables (less than five), showing that multicollinearity was not a problem.
The two strongest predictors of delay were the period when sentencing took place and the
victim’s gender. A greater delay was more likely between the first offence and sentencing
in more recent periods and in cases with male victims. Cases involving offending over a
longer period were also more likely to have a greater delay. Offending that took place at
a church or religious school also predicted a longer delay, although offending that
occurred in the context of Scouts or a sports club predicted a shorter delay. Finally, cases
involving offenders with multiple victims led to a greater delay between the first offence
and sentencing. The offence type and the number of offences had no effect on delay.

33
and that three of the five individual, dichotomous versions of that variable were
significantly associated with delay – the regression used the dichotomous dummy
variables rather than the overall categorical one.
Table 8 shows the results from the final model of the linear regression.
Table 8: Linear regression of delay (final model)
Unstandardised
coefficients Standardised coefficients
Predictor B Standard
error Beta t Significance
Variables in model Sentence period 7.795 1.019 0.444 7.652 0.000 Victim gender 8.238 1.873 0.262 4.397 0.000
Offending duration 1.147 0.260 0.257 4.416 0.000 Scouts/sports club (dummy variable) -5.020 2.466 -0.127 -2.036 0.043 Multiple victims 4.460 1.662 0.155 2.684 0.008 Church (dummy variable) 6.777 2.144 0.204 3.160 0.002 Religious school (dummy variable) 5.672 2.106 0.180 2.693 0.008
Excluded variables(a)
Offence type 0.022 0.387 0.699 Number of offences 0.017 0.279 0.781
(a) Beta for excluded variables is the standardised regression weight if that variable had been included in the model by itself at the next stage.
The first variable included in the model was the sentence period. This variable predicted
12.5 per cent of the variance in delay (adjusted R-squared = 0.125). The second variable
was victim gender, which added a further 11.1 per cent to the explained variance. The
third variable was offending duration, adding a further 5.6 per cent to the variance. The
fourth variable was the Scouts/sports club dummy variable, adding 5 per cent to the
explained variance. The fifth variable was whether multiple victims were involved,
adding a small but significant 3.1 per cent to the explained variance. The final two
variables to enter the equation were two of the dummy institution variables: church
(adding 1.5 per cent) and religious school (adding 2.3 per cent). Overall, the model with
the seven statistically significant variables predicted 39.3 per cent of the variance in
delay (adjusted R-squared = 0.393, F(7,193) = 18.863, p = 0.000).
Of the seven predictors that attained statistical significance in the final model, the
strongest two predictors were the sentence period and the victim’s gender: there was
more likely to be greater delay between the first offence and the sentence date in more
recent periods (Beta = 0.444, t = 7.652, p = 0.000), and for cases where the victims
were males (Beta = 0.262, t = 4.397, p = 0.000). As found in the bivariate analysis, the
effects of these two variables are clearly very strong, maintaining their impact even
when the other variables are included in the multivariate model.

34
Cases involving offending over a longer period were also more likely to experience
greater delays (Beta = 0.257, t = 4.416, p = 0.000). Offending taking place at a church
predicted longer delays (Beta = 0.204, t = 3.160, p = 0.002), as did offending in a
religious school (Beta = 0.180, t = 2.693, p = 0.008). Offending that occurred in the
context of Scouts or a sports club, however, predicted shorter delays (Beta = -0.127, t =
-2.036, p = 0.043). Finally, cases involving offenders who had multiple victims led to
a greater delay between the first offence and the sentence date (Beta = 0.155, t = 2.684,
p = 0.008).
The other variables initially included in the regression equation – offence type and
number of offences – were excluded from the final model as they did not reach
statistical significance. Thus, it appears that factors external to the offending itself were
important in predicting the delay between the first offence and the sentence date –
factors such as the characteristics of the victim (that is gender) and the institutional
context in which the offending occurred.
Summary of multivariate relationships with delay
To summarise, the variables that predicted the delay between the first offence and the
sentence date were:
The sentence period: cases with more recent sentences had a longer delay
between the offence and the sentence.
The victim’s gender: having a male victim predicted a longer delay between the
offence and the sentence.
The duration of the offending: cases with longer offending periods had a longer
delay between the offence and the sentence
Offending in a Scouts or sports club context: cases involving CSA at Scouts or
a sports club had a shorter delay between the offence and the sentence.
Offending in a church context: cases involving CSA in a church context had a
longer delay between the offence and the sentence.
Offending in a religious school context: cases involving CSA at a religious
school had a longer delay between the offence and the sentence.
The presence of multiple victims: cases in which the offender had abused
multiple victims had a longer delay between the offence and the sentence.

35
Chapter 4: Discussion
Overview
This chapter returns to the original aims of the study to summarise its findings.
This analysis provides a closer understanding of the interactions among the factors
collected in the CSA sentencing database, to build a more nuanced picture of the nature
of, and responses to, institutional CSA.
This discussion is presented in two sections: the first on victim and offender
characteristics, and the second on offence characteristics. The results from both the
bivariate and the multivariate analyses are summarised. However, those from the
multivariate analyses should be considered to be more robust as they present
information on the independent relationship between each predictor and the outcome,
while taking into account the other variables included.
Victim and offender characteristics
The analyses aimed to identify whether there were differences in sentence outcome and
delay based on the age and gender of the victim, as well as the relationship between the
offender and the victim. The analysis also sought to understand more closely the nature
of offending among those cases involving more than one victim.
Age and gender
The majority of victims in this database were male, with a mean age of 12 and a median
age of 13. Bivariate analyses showed that there was no significant difference in the type
of penalty imposed based on either of these variables, although there was a significant
relationship between victim age and total effective sentence length, with a longer
sentence imposed in cases involving younger victims. There was no bivariate
relationship between age and the delay between the offence and the sentence, although
a difference was found for victim gender, with cases involving male victims having a
greater delay than those involving female victims.
When all the significant variables were included in the multivariate analysis for total
effective sentence length, victim age was no longer statistically significant. That is, the
characteristics of the offence – the number of offences, the type of offence, and the time
between the last known offence and the sentence – were more important than the
characteristics of the victim (such as age). In terms of the length of the total effective
sentence, offence characteristics – rather than victim or offender characteristics – play
the more important role.
Considering the effect of all the significant variables on the delay between the offence
and the sentence, the multivariate analysis shows that the victim’s gender continued to
have a statistically significant impact, even when taking into account offence
characteristics such as offending duration, the presence of multiple victims and the
institution in which the offending occurred. This is important in understanding the
nature of the impact of institutional CSA – particularly on male victims, for whom the

36
delay was far greater. Clearly something different about the experience of institutional
CSA for male victims leads to extensive delays in the offending coming to light and
being successfully prosecuted. This is an important issue, and one that the current
analysis cannot help clarify. Further analysis of the differential impact of institutional
CSA on male and female victims would assist in developing our understanding.
Relationship of offender to victim
With just over half of the cases occurring within a school or boys’ home, the offenders
were most commonly teachers and the victims were most commonly pupils. Just under
one-quarter of cases occurred in a church context, where the offender was a religious
authority figure (typically a priest) and the victim was a parishioner or a child who had
a role in the church, such as an altar boy. The vast majority of both schools and churches
were Catholic.
Bivariate analysis found no relationship between the variable measuring
institution/occupation/relationship and the type of penalty imposed or the total effective
sentence length. That is, the context of the offending – or the relationship between the
victim and the offender – did not have any significant relationship with sentence
outcomes.
There was, however, a significant relationship with the delay between the offence and
the sentence among cases involving religious schools and churches, and those occurring
in Scouts or sports clubs. Specifically, those cases occurring in a religious school had a
far longer delay than those not occurring in a religious school, possibly due to the
particularly powerful combination of religious and school authority and the closed
nature of the institutions. Similarly, those cases occurring in a church were also
associated with a longer delay, while those cases involving Scouts or sports clubs were
associated with a shorter delay.
The impact of the institutional context was felt even in the multivariate analysis when
all significant variables were included, with all three types of institution – religious
schools, churches, and Scouts or sports clubs – showing a significant effect on the
length of the delay between the offence and the sentence. In particular, faith-based
organisations seem to take the heaviest toll on victims in terms of the time taken to
reveal the offending and seek formal action against the offender. Cases occurring in
these organisations also possibly impose the heaviest burden on law enforcement in
terms of the time required to investigate the offending. Again, this analysis can only
suggest that something about the nature of such institutions differs from other
organisations. Further analysis into the specific characteristics that lead to greater delay
is warranted.
Offenders with multiple victims
The analysis showed that more than half of all cases involved multiple victims. In those
cases involving more than one victim, the vast majority of offenders were sentenced to
a custodial term. For offenders with a single victim, a smaller proportion was sentenced
to prison. Cases involving more than one victim also resulted in longer total effective
sentences. Such cases were also associated with longer delays between the offence and
the sentence. The presence of repeat offending was therefore an important factor in
judicial decisions, possibly speaking to greater offender culpability, a higher risk of
reoffending or perhaps poorer prospects of rehabilitation.

37
However, once the presence of multiple victims was entered into a multivariate
equation with the other statistically significant variables, its effect mostly disappeared.
There was no statistically significant effect of multiple victims on penalty type or total
effective sentence length, taking into account the other variables. Thus, sentence
outcomes in this database were not influenced by the presence of multiple victims.
In contrast, this variable did have a significant impact on the delay between the offence
and the sentence. Even considering the other victim and offence characteristics in the
model, the presence of multiple victims had an independent effect, over and above the
effects of the other variables. While this variable did not add a large amount to the
explanation of variance in the model (only 3.1 per cent), the fact that it remained
statistically significant suggests that cases with multiple victims differ in some respects
with regard to delay between the offence and the sentence.
Although a significant amount of data was missing on offending among people with
multiple victims, the qualitative analysis shed some light on the nature of this offending.
Offenders who had abused multiple victims were more likely to have committed their
offending in the context of religious authority – either a school or a church. The
offending tended to be more serious and of longer duration, with a higher proportion of
penetrative offences and a longer median offending duration than cases involving single
victims.
Only a small proportion of cases with multiple victims involved escalation from
non-penetrative to penetrative offending. However, half of these cases involved a
variety of offending behaviours, with apparently little specialisation. This finding is
consistent with evidence of diversity in types of offending among sex offenders
more generally.70
The Royal Commission’s profile of victim and offender characteristics
This profile of victim and offender characteristics differs from the profile found by the
Royal Commission in its statistical overview of almost 2,800 sex abuse victims.71
The
Commission’s own analysis found that the average age of abuse was 10 for males and
nine for females – younger than the average of 12 for cases in this database.
The Commission’s profile also found that just under half of the reported abuse occurred
in out-of-home care, such as orphanages, children’s homes and foster care. This is very
different from the cases in this analysis, where only 2 per cent occurred in out-of-home
(foster) care, and more than half took place in schools or boys’ homes (most involving
the former rather than the latter).
About 60 per cent of institutions where abuse occurred were faith-based organisations
and 23 per cent were run by the government. This finding is similar to the
current analyses, which showed that half of the offending took place in faith-based
institutions.
Half of the abuse in the Commission’s profile involved penetration, compared with one-
third in this analysis. This may be an undercount, however, as it is possible that some
70 See, for example, Gelb, K, 2007, Recidivism of Sex Offenders, Sentencing Advisory Council, Melbourne.
71 The Hon. Justice Peter McClellan, 2015, Opening Address: Australian and New Zealand Association for
the Treatment of Sexual Abuse 7th Biennial International Research, Theory & Practice Conference,
Melbourne. Available at www.childabuseroyalcommission.gov.au/media-centre/speeches/anzatsa-7th-biennial-conference.

38
penetrative offences – particularly those that occurred many decades ago – were
charged as offences other than penetration, such as indecent assault.
Finally, while the Commission found that on average the abuse spanned 2.8 years, this
analysis showed an average of more than six years.
The different profiles seen in the two analyses are likely due to potential, unmeasured
differences in the samples. The cases in this analysis are only those that have been
detected, investigated, prosecuted and sentenced. The sample of cases in the
Commission’s analysis, on the other hand, would have included cases where a report
had been made to police, as well as those in which the victim had not previously
disclosed the offending. The Commission’s profile likely presents a more accurate
picture of all types of institutional CSA, whereas this analysis is confined to those types
of institutional CSA that resulted in a sentence imposed by a court.
Offence characteristics
The analyses aimed to identify whether there were differences in sentence outcome and
in delay based on the nature of the offence and on the institutional response to
the offending.
The nature of the offence: offence type
More than half of all cases had a principal offence of indecent assault, and a further
one-third involved penetrative offences.
There was a strong bivariate relationship between the type of offence and the penalty
type: penetrative offences were more likely to receive a custodial term than
non-penetrative offences, likely reflecting a view that penetrative offences are more
harmful than non-penetrative ones. Similarly, penetrative offences were also more
likely to receive a longer total effective sentence, reflecting legislative gradations in
maximum penalties. However, there was no difference across offence types in the delay
between the offence and the sentence. Thus, offence type was significantly associated
with sentence outcomes only.
The type of offence retained its statistical significance in the multivariate analyses.
Specifically, cases involving indecent assault were far less likely to involve a custodial
sentence than cases involving a penetrative offence, while cases involving more serious
offence types were also more likely to receive a longer total effective sentence. Thus,
the type of offence predicted both sentence outcomes – the decision to imprison and
the length of the prison term. This is not surprising, given the clear legislative guidance
provided to sentencing judges in each jurisdiction, stipulating the maximum penalties
for different types of offence.
The nature of the offence: offending duration
In almost half of all cases, the offending lasted less than five years, although a small
proportion involved offending over many decades. There was no significant
relationship between offence duration and penalty type, although cases with a shorter
offending duration were associated with a significantly shorter total effective sentence
length.

39
Offending duration was also significantly associated with delay between the offence
and the sentence date, such that cases with a short duration (less than five years) had a
significantly shorter delay than those that occurred over longer periods.
This variable did not retain its statistical significance in the first multivariate analysis,
where the independent effects of the other variables meant that offending duration did
not predict total effective sentence length. It did, however, retain its predictive power
regarding delay between the offence and the sentence date, being the third strongest
predictor: cases involving offending over a longer duration predicted a longer delay in
sentencing.
The nature of the offence: grooming
Although the lack of information on grooming means that this variable must be treated
with caution, it appears that about one-third of cases involved some form of grooming.
This variable correlated significantly with penalty type: cases involving grooming were
more likely to receive custodial penalties than cases with no grooming, possibly
reflecting greater perceived culpability on the part of the offender. The bivariate
analysis also showed differences in the total effective sentence, with longer terms
imposed in cases that involved grooming. However, there were no differences in delay
between the offence and the sentence date based on whether grooming was involved.
The presence of grooming retained its statistical significance in the multivariate
analyses. Specifically, cases involving grooming were far more likely to involve a
custodial sentence than cases with no grooming. This is clearly an important
determinant in the decision to imprison. In contrast, grooming was not statistically
significant in predicting the total effective sentence length; while grooming was a
significant determinant in the decision about whether to imprison the offender, it did
not affect the length of the term imposed.
The nature of the offence: the number of offences
The average number of offences per case was 8.5, although this ranged from a single
offence to 67 offences.
There was a strong bivariate relationship between the number of offences and the
penalty type: cases with more than the median number of offences were far more likely
to attract a custodial term. This difference may reflect a view of offender culpability as
well as harm caused, with both increasing as the number of offences grows.
Similarly, there was a strong bivariate relationship between the number of offences and
the total effective sentence: a longer sentence was imposed in cases with more offences.
While there was a statistically significant relationship between the number of offences
and the delay between the offence and the sentence date, it was not as strong as the
relationship with sentence outcomes.
These findings are not surprising; the number of offences in a case is a direct reflection
of the culpability of the offender and (arguably) the harm caused to victims, both of
which play a direct part in determining the sentence.
The number of offences retained its statistical significance in the first two multivariate
analyses. Specifically, cases with more offences than the median were far more likely
to involve a custodial sentence than cases that involved fewer offences than the median.

40
This variable was the strongest predictor in the equation, highlighting its important role
in determining whether custody is imposed, even when taking into account other
offence characteristics.
The number of offences was also the strongest predictor of the length of the total
effective sentence, predicting a large amount of variance in the outcome, although it
was no longer a significant predictor of the delay between the offence and the sentence
date.
As with offence type, the number of offences predicted the sentence outcome – the
decision to imprison and the length of the prison term. The importance of this variable
likely reflects its role in identifying the harm caused by the offending as well as the
culpability of the offender.
It is interesting that neither offence type nor the number of offences significantly
predicted the delay between the offence and the sentence date, once other variables
were taken into account in the multivariate analyses. As legally defined categories, they
had a significant impact on sentencing decisions, but they did not predict how much
time elapsed between the offence and the sentence date. Instead, contextual
characteristics – victim gender, whether multiple victims were involved and the type of
institution in which the offending occurred – became more important in predicting
delays.
Institutional responses to offending
As with grooming, the lack of information about institutional responses means that this
variable should also be treated with caution. Nonetheless, of those cases where
information is available, it appears that the most common response was to take no
action. Some institutions dismissed the offender, while others simply moved the
offender elsewhere within the organisation.
There was a significant bivariate relationship between institutional responses to the
offending and the type of penalty imposed: cases in which the offender had not been
dismissed were more likely to attract a custodial term. However, the institutional
response had no effect on the total effective sentence length, or the delay between the
offence and the sentence.
Have sentencing practices changed?
The period in which a case was sentenced had a significant impact on the type of penalty
imposed. The proportion of cases receiving a custodial term increased across the
periods examined, with a particularly noticeable increase in the custody rate from cases
sentenced before 1999 to those sentenced in later years. Changes in both our
understanding of the harms caused by CSA and in the legislative responses to CSA are
thus reflected in a dramatic shift in sentencing patterns, particularly since 2000.
In contrast, there was no relationship between the period in which the person was
sentenced and the length of the total effective sentence. This shows that changes over
time have been manifested in the decision to incarcerate, rather than in the length of the
incarceration.
The only significant difference in delay between the offence and the sentence date was
in those cases sentenced prior to 1999 compared with those sentenced in each of the

41
two later periods – 2000–09 and 2010–15. Those sentenced in the first period had a
significantly shorter delay between the offence and the sentence date. It is possible that
the delay between the offence and the sentence date has increased in recent years due
to an increasing workload in the courts, but it is also possible that with greater
community support for reporting and seeking justice for historical CSA offences,
people who were victims of abuse many decades ago are more likely than ever before
to come forward and report the offending. The relationship between confidence in the
justice system and willingness to report abuse among victims of CSA remains
unknown.
Sentence period had no effect on penalty type in the multivariate analysis, meaning that
once other variables were taken into account, the effect of this variable disappeared.
This is interesting because it shows that regardless of when the case was sentenced, the
characteristics of the case itself had the largest effect on the type of penalty imposed.
The effect of the sentence period on the delay between the first offence and the sentence
date remained significant in the multivariate analysis.
Directions for future research
The data analysed in this study represent only a tiny proportion of all cases of
institutional CSA: the study only examined those cases in which the offending was
reported to police, charges were laid, a conviction was secured and sentencing remarks
were made available. As court databases do not flag sexual abuse cases as institutional,
the research relied on the Royal Commission’s manual searches to identify those cases
that appear to be institutional CSA. Many of the several hundred cases were not, in fact,
institutional CSA; instead, they involved adult victims or took place outside
institutional contexts. As such, this research has only been able to examine those cases
the Royal Commission identified, and those for which each jurisdiction could find
documentation. The lack of regularly collected data in court databases is a significant
impediment to understanding CSA in institutional contexts.
Despite the limitations inherent in collecting data for this study, the research has, for
the first time, shown the importance of understanding the nuanced relationships among
the various offence, victim and offender characteristics; delays between the offence and
the sentence date; and sentencing outcomes. But this research is only a first step. If
courts improve their data collection, making more reliable data available, additional
research should be undertaken on a larger sample of cases. Not only would this allow
for more robust analysis, but it would also highlight any jurisdictional differences in
institutional CSA and how it is handled in the courts.
These statistical analyses have identified significant relationships between the various
characteristics and sentence outcomes and delays between the offence and the sentence
date. However, the analyses have not been able to delve into these differences to
understand why they exist. To do so would require additional qualitative research –
possibly of the sort that cannot be conducted using sentencing remarks, but that needs
to be undertaken by interviewing victims. Doing so might provide an understanding of
the differential impact of institutional CSA on male and female victims, and might
identify those specific characteristics of faith-based institutions that underlie the
findings of this analysis.

42
Given that so few cases of CSA in general – let alone institutional CSA – ever reach
the courts, further research should also examine the relationship between confidence in
the justice system and willingness among victims of CSA to report abuse. Without a
better understanding of victims’ perceptions of the justice system as a whole, it is
difficult to target reforms where they are most required.

43
Appendix A: Glossary
ANOVA (analysis of variance) A statistical technique used to test the degree to
which two or more groups differ, by analysing
differences among their means
Bivariate analysis A statistical technique that measures the association
between a variable and an outcome
Categorical variable A variable that consists of categories or groups,
such as gender (male, female, other)
Chi-square analysis A statistical test used to compare expected data with
observed data; used for categorical data
Continuous variable A variable that consists of a continuous count, such
as age
Dependent variable The outcome measure of interest
Independent variable A variable that predicts the outcome measure of
interest
Linear regression A statistical technique that measures the
independent influence of multiple predictors on a
continuous outcome measure
Logistic regression A statistical technique that measures the
independent influence of multiple predictors on a
binary outcome measure
Mean The average of a set of numbers
Median The number below which half the values in a set of
numbers lie; also known as the series midpoint
Multivariate analysis A statistical technique that measures the
independent effects on an outcome of multiple
variables at one time
Pearson correlation The Pearson product-moment correlation is a
measure of the strength of the linear relationship
between two continuous variables
Principal offence The proven offence that received the most severe
sentence in a case
Statistical significance The likelihood that a statistical relationship between
two variables has not occurred by chance
(conventionally measured by whether the
probability that the relationship occurred by chance
is less than 5 per cent)
Total effective sentence In a case involving a single charge, the sentence
imposed for that charge. In a case involving
multiple charges, the final, overall sentence

44
imposed, following orders of cumulation or
concurrency for each charge in the case
T-test A statistical technique that compares two groups’
means to assess whether any difference is likely to
reflect a real difference in the population from
which the groups were sampled
Variable A factor that is a measurable characteristic of a
sample

45
Appendix B: References
Reports
Freiberg, A, Donnelly, H and Gelb, K, 2015, Sentencing for Child Sexual Abuse in
Institutional Contexts, Royal Commission into Institutional Responses to Child Sexual
Abuse, Sydney.
Gelb, K, 2007, Recidivism of Sex Offenders, Sentencing Advisory Council, Melbourne.
The Hon. Justice Peter McClellan, 2015, Opening Address: Australian and New
Zealand Association for the Treatment of Sexual Abuse 7th Biennial International
Research, Theory & Practice Conference, Melbourne. Available at
www.childabuseroyalcommission.gov.au/media-centre/speeches/anzatsa-7th-biennial-
conference.
Cases cited
R v B, DR [2007] SADC 56 (7 May 2007); R v B, DR unreported, District Court of
South Australia, Rice DCJ, 18 September 2009.
The Queen v Dennis James Batty, unreported, County Court of Victoria, Howse DCJ,
7 November 1994.
R v Bonython-Wright [2013] SASCFC 87 (22 August 2013).
R v Denham [2015] NSWDC 21 (22, 25 August, 20 November 2014, 23 January
2015).
R v Derrick [2010] SADC 31 (18 March 2010).
DPP v Dowel [2014] VCC 637 (16 April 2014).
R v MJD, unreported, District Court of New South Wales, Woodburne DCJ, 21 June
2013.
R v Egan, unreported, District Court of New South Wales, Tupman DCJ, 20
December 2013.
R v Ellis [2010] SASC 118 (27 April 2010).
R v Paul Raymond Evans [2008] NSWDC 280 (3 October 2008).
R v Gregory Ferguson, unreported, Supreme Court of Tasmania, Crawford DCJ, 15
May 2007.
R v Firman, unreported, District Court of Queensland, Clare DCJ, 2 September 2010.

46
The Queen v GRK, unreported, District Court of Queensland, Ryrie DCJ, 2005; R v
KP; ex parte A-G (Qld) [2006] QCA 301 (22 August 2006).
R v L, unreported, District Court of New South Wales, Woods DCJ, 27 May 2004.
R v Mentink, unreported, District Court of Queensland, Wylie DCJ, 24 September
1993.
R v Richards, unreported, District Court of New South Wales, Zahra DCJ, 27
November 2014.
DPP v Gerald Francis Ridsdale [2014] VCC 285 (8 April 2014).
R v Rolleston, unreported, District Court of NSW, Flannery DCJ, 9 November 2012.
R v AB [No 2] [2000] NSWCCA 467 (6 December 2000).
R v Barry John Tee, unreported, Adelaide District Court, David DCJ, 23 December
1999.
DPP v Dennis Michael Stewart [2013] VCC 64 (11 February 2013).
R v Veness, unreported, District Court of Queensland, Bradley DCJ, 26 July 2001.
DPP v Russell Walker, unreported, County Court of Victoria, Hampel J, 12
November 2013.

47
Appendix C: Technical details of measures
This appendix provides detailed technical information on the construction of the
measures.
Data collected
Available information on a range of factors was collected for each case. This included:
type of institution; offender’s age; court level; sentence date; principal offence; offence
date (the first date in the case of multiple offences); plea; penalty imposed; number of
offences; head sentence and non-parole period for the principal offence; overall head
sentence and non-parole period (where applicable); offending period; offender’s
occupation; victim’s/victims’ relationship to the offender; whether grooming occurred;
whether the offence was an isolated incident; victim’s/victims’ age; offender’s prior
record; and finally, the institution’s response to offending (if any).
Data preparation: recoding of variables
A number of the variables needed to be recoded after the initial frequency analysis, due
either to issues with distribution, or to optimise the value of the analyses for the Royal
Commission. This section presents information on the variables that were recoded and
their new distributions.
Dependent variable: sentencing outcome – penalty type
Penalty type originally comprised separate categories for fine/bond and community
order/probation, as well as a category for ‘other’ sentences. Due to the original
distribution, this variable was initially recoded to differentiate between the primary
sentences of interest: community order, wholly suspended sentence and custody.
‘Other’ and ‘unknown’ were recoded as missing.
Table C1 shows the distribution of the recoded penalty type variable.
Table C1: Distribution of penalty type (recoded)
Penalty type Frequency Per cent Valid per cent
Community 25 8.8 9.1
Wholly suspended 43 15.2 15.6
Custody 208 73.5 75.4
Total 276 97.5 100
Missing 7 2.5
This version of the variable was used for the bivariate analyses.
For the multivariate analyses, another version of penalty was needed. As there were
only 25 community sentences and 43 wholly suspended sentences – compared with 208
custodial sentences – penalty type was recoded into a variable reflecting whether the
penalty was custodial or non-custodial (community or wholly suspended sentence). The
resulting frequencies of the variable are seen in Table C2.

48
Table C2: Distribution of penalty type (custody)
Penalty type Frequency Per cent Valid per cent
Community 68 24 24.6
Custody 208 73.5 75.4
Total 276 97.5 100
Missing 7 2.5
Dependent variable: sentencing outcome – total effective sentence length
The histogram in Figure C1 shows that the ‘total effective sentence’ variable was
positively skewed (Skewness = 1.697; SE Skewness = 0.149).72
To include this variable
in the bivariate and multivariate analyses, total effective sentence was log-transformed
(using a log10 transformation). The resulting distribution was normally distributed, as
seen in Figure C2 (Skewness = -0.81; SE Skewness = 0.149).
Figure C1: Distribution of values on total effective sentence length (original scale)
72 While it is possible to check distribution visually, it is ascertained more precisely by using the values for
skewness: if the value for skewness is more than double its standard error, the distribution is not normally
distributed. This is not the only way to identify whether the distribution is normally distributed (for
example, some have suggested that a skewness value of less than |2| and a kurtosis value of less than |9| are
acceptable as representing a normal distribution), but it does provide a useful complement to visual identification only.

49
Figure C2: Distribution of values on total effective sentence length (transformed
scale)
Dependent variable: delay
Figure C3 shows the distribution for the number of years between the offence and the
sentence date. As delay was normally distributed (Skewness = 0.103; SE Skewness =
0.179), no transformation was necessary.
Figure C3: Distribution of values on delay

50
Independent variable: victim gender
The ‘unknown’ and ‘both’ categories were recoded to ‘system missing’. For the
subsequent analyses, only male and female were included in this variable.
Table C3 presents the recoded distribution of victim gender, showing that almost three-
quarters of all cases with a known victim gender involved male victims.
Table C3: Distribution of victim gender (recoded)
Victim gender Frequency Per cent Valid per cent
Female 70 24.7 26.9
Male 190 67.1 73.1
Total 260 91.9 100
Missing 23 8.1
Independent variable: victim age
Both the categorical and the continuous versions of victim age were tested in the
analyses. For the continuous version of victim age, the mean age was 12.2 years and
the median age was 13 years. Victims ranged in age from under one year to 17 years.
Three-quarters of victims fell below the age of 14, and one-quarter were under 12.
In four cases, the age wasn’t stated but the victim’s school year was given. An average
age has been assigned for the year level. For example, Year 5 is classified as age 11,
while Year 10 is classified as age 16.
Independent variable: prior record
In the initial recoding, the ‘unknown’ category was recoded to ‘system missing’. The
two people with prior offences against adults were also recoded as ‘missing’ for the
subsequent analyses. Given that almost two-thirds of the cases with available data
involved people with no prior offences, this variable was split into two dichotomous
variables:
prior offence/no prior offence
sexual offence with custody/sexual offence without custody.
‘Sexual offence’ included all types of sexual offences, including child pornography
offences.
Tables C4 and C5 present the distributions of these two variables.
Table C4: Distribution of prior record
Priors Frequency Per cent Valid per cent
No 145 51.2 65.6
Yes 76 26.9 34.4
Total 221 78.1 100
Missing 62 21.9
Of the 76 people with a prior sexual offence, information on offenders who had been
sentenced to a prison term was available for only 67 people. Table C5 shows that of
these 67 people, six in 10 had previously served a custodial term for a sexual offence.

51
Table C5: Distribution of prior sexual offence
Prior sexual offences Frequency Per cent Valid per cent
No custody 26 9.2 38.8
With custody 41 14.5 61.2
Total 67 23.7 100
Missing 216 76.3
There are cases in which the accused had relevant priors but the judge sentenced as if
he did not (according to the judges’ remarks). These cases are coded as having prior
offences, so as to capture the characteristics of the offender rather than the sentencing
behaviour of the court.
Independent variable: multiple victims
The ‘unknown’ category for this variable was recoded to ‘system missing’. Table C6
presents the distribution of the recoded variable.
Table C6: Distribution of multiple victims (recoded)
Multiple victims Frequency Per cent Valid per cent
No 99 35.0 37.5
Yes 165 58.3 62.5
Total 264 93.3 100
Missing 19 6.7
‘Multiple victims’ means offenders who were sentenced on one occasion for offending
against more than one victim, or offenders who had previously been proven guilty of
institutional CSA against another victim.
Almost two-thirds of cases in this database involved offenders with multiple victims.
Independent variable: institution type/offender occupation/victim–
offender relationship
These three variables all use the same data for each person. For example, if the
institution is a church, then the offender occupation is a church-related one (priest or
other religious authority) and the victim–offender relationship is classified as involving
a parishioner or other church-based relationship.
The recoding applied to institution type, so it also applied to the other two variables.
The ‘unknown’ category was recoded into ‘system missing’ for all three variables.
Given the small number of cases involving a healthcare facility (eight) and ‘other’
(seven), these were combined into a single ‘other’ category. While out-of-home care
also had only a small number of cases (six), this is an important policy area for the
Royal Commission, so it is left separate in the initial analyses.

52
Table C7 presents the distribution of the recoded institution variable.
Table C7: Distribution of institution type (recoded)
Institution type Frequency Per cent Valid per cent
School/boys’ home – religious 76 26.9 27.1
School/boys’ home – other 77 27.2 27.5
Church 65 23.0 23.2
Scouts/sports club/YMCA 41 14.5 14.6
Out-of-home care 6 2.1 2.1
Other 15 5.3 5.4
Total 280 98.9 100
Missing 3 1.1
The majority of institutions in the database are schools, accounting for more than half
of all institutions. Schools were evenly divided between religious and other types.
Schools were identified as ‘religious’ if:
the offender’s occupation in the school is recorded as a religious role (such as a
priest or brother)
the school is specifically called a Catholic school or a Christian college
the school belongs to a particular religious order, such as the Marists or the
Christian Brothers.
If the name is simply, for example, St Agnes Primary School, and the offender is
classified as a teacher, this was not classified as a religious school.
The type of school was not always clear, so this fine distinction should be regarded as
indicative. This classification has been undertaken somewhat conservatively, given that
the role of the various churches in each school is unknown.
In instances involving more than one organisation (for example, where the offender
was both a priest and a Scoutmaster), the data were coded for the religious role (that is,
under the ‘church’ category rather than under ‘Scouts’).
The corresponding classifications for offender occupation were:
1. teacher or principal – religious
2. teacher or principal – other
3. priest or religious authority
4. scout leader or sport coach
5. out-of-home carer
6. healthcare (including psychiatric) provider, plus other occupations.
The corresponding classifications for victim-offender relationship were:
1. pupil or boarder – religious
2. pupil or boarder – other
3. parishioner
4. Scout or sports team member
5. foster child
6. patient, plus other relationships.

53
As these variables were each identical, only one (institution) was used in all the
analyses, representing the context in which the offending occurred.
In addition, the regression analyses were undertaken using two separate forms of the
institution variable: the recoded categorical form above, plus a version that created a
series of dummy variables for the different categories. Given the importance of
understanding the precise context for institutional CSA cases, this allowed a closer
examination of the role of each institution type on the dependent variables.
Independent variable: offence type
The classifications for this variable include the following offences:
1. Sexual assault or penetration includes all penetrative offences such as buggery,
sodomy, unnatural offence, carnal knowledge and aggravated sexual assault.
2. Persistent abuse includes maintaining a sexual relationship.
3. Indecent assault includes molestation, indecent dealing, indecent treatment and
aggravated indecent assault.
4. Act of indecency includes aggravated act of indecency, gross indecency,
incitement to act and cause to act.
5. Child pornography includes procuring or grooming for pornography and other
sexual offences.
6. Other sexual offences.
7. Unknown.
The ‘unknown’ offences were recoded to ‘system missing’.
Independent variable: offending duration
This variable measures all known offending, even if it spans multiple sentence dates. It
is therefore a measure of all known offending associated with each person.
The average duration of offending is 6.4 years, while the median (50th percentile) is
two years. The offending duration ranges from less than one year (a single incident is
the shortest) to 37 years, although the 75th percentile is 10 years. The modal duration
(the most common) is two years, with 50 cases (22.5 per cent of valid cases).
This is not a precise measure of offending duration, as the information in some cases is
somewhat vague. To counteract this lack of specificity in offending duration, the
categorical version of the measure was used in bivariate and multivariate analyses.
Independent variable: grooming
This variable measures grooming conduct, not grooming offences.
The variable was recoded into two separate variables. In the first, the ‘unknown’ and
‘yes – unspecified’ categories were recoded into ‘system missing’. The high proportion
of missing data means that this variable should be treated with some caution (52.8 per
cent of values were unknown). This recoding resulted in a nominal variable that still
differentiated among different types of grooming. Table C8 presents the distribution of
this variable.

54
Table C8: Distribution of nominal grooming (recoded)
Grooming Frequency Per cent Valid per cent
No 46 16.3 36.5
Yes – friend with family 19 6.7 15.1
Yes – sexual discussions 3 1.1 2.4
Yes – provided alcohol/pornography 58 20.5 46.0
Total 126 44.5 100
Missing 157 55.5
The second variable was a dichotomous yes/no variable. Table C9 presents the
distribution for this variable.
Table C9: Distribution of dichotomous grooming (recoded)
Grooming yes/no Frequency Per cent Valid per cent
No 46 16.3 34.6
Yes 87 30.7 65.4
Total 133 47.0 100
Missing 150 53.0
It was not possible to identify whether grooming was considered an aggravating factor
in sentencing. If grooming behaviour was present, the judge did not always explicitly
identify it as grooming, and it was not clear if the behaviour was formally seen as an
aggravating circumstance. Certainly, this behaviour was mentioned in the facts of the
case, but there was little comment about whether it made the offending worse or in any
way changed the judge’s perceptions of the case.
Independent variable: institutional response
Given the very small number of cases with information on institutional response (70),
in order to include this variable in further analyses, it was dichotomised based on
whether the offender was dismissed. The distribution of the recoded variable is
presented in Table C10.
Table C10: Distribution of institutional response (recoded)
Institutional response Frequency Per cent Valid per cent
Not dismissed 40 14.1 57.1 Dismissed 30 10.6 42.9 Total 70 24.7 100
Missing 213 75.3
In three cases, the matter was reported to police but it was unclear whether the offender
was dismissed. For these cases, the offender is counted as being dismissed, bringing
the dismissed total from 27 cases to 30.

55
Independent variable: plea type
For this variable, both the ‘unknown’ offences and the ‘other’ offences (such as being
unfit to stand trial) were recoded as ‘system missing’. Table C11 presents the
distribution of the recoded variable.
Table C11: Distribution of plea type (recoded)
Plea type Frequency Per cent Valid per cent
Guilty 199 70.3 74.5
Not guilty 68 24.0 25.5
Total 267 94.3 100
Missing 16 5.7
If an offender pleaded differently to different charges, this variable measured the plea
to the principal offence.
Table C11 shows that a guilty plea was entered in three-quarters of cases in this
database.
Independent variable: number of offences
This variable measures the overall number of offences, including the principal offence
and others charged at the same time.
The mean number of offences in this database is 8.5, while the median is five. The
number of offences ranges from one to 67, although the 75th percentile is 11.
The histogram in Figure C4 shows that the number of offences variable was positively
skewed (Skewness = 2.992; SE Skewness = 0.149). To include this variable in the
bivariate and multivariate analyses, the number of offences was log-transformed (using
a log10 transformation). The resulting distribution was normally distributed, as seen in
Figure C5 (Skewness = 0.071; SE Skewness = 0.149).

56
Figure C4: Distribution of values on number of offences (original scale)
Figure C5: Distribution of values on number of offences (transformed scale)
In addition to log transformation, the number of offences was dichotomised based on
the median, with one group including those cases at the median or below, and the other
group including those cases with the number of offences above the median. This version
of the variable was used in the bivariate analysis to aid interpretation.

57
Independent variable: non-parole period
For those sentences that include a non-parole period, the average is 37.3 months, and
the median is 24 months, ranging from three months to 180 months (15 years). The
75th percentile is 54 months (four and a half years).

58
Appendix D: Results of bivariate analyses
This appendix provides the detailed results of the bivariate analyses that examined the
strength of the relationships between each independent variable and the dependent
variable (sentence outcome, and delay between the offence and the sentence date).
Bivariate relationships
Using the recoded versions of the variables, analysis began by examining the strength
of the bivariate associations between each of the independent variables and each
dependent variable. Analyses involved a variety of approaches appropriate to the nature
of the variables included.73
Bivariate analysis presents information on the strength of the association between two
variables. It does not imply that one variable caused the other.
Sentencing outcome: penalty type
As penalty type is a categorical variable, chi-square analyses were undertaken to
identify the strength of the relationship with each of those independent variables that
are categorical as well.
No significant difference in penalty type was found based on the victim’s gender or age
group, whether the offender had a prior history of offending, the
institution/occupation/relationship variable,74
the delay between the offence and the
sentence date (the categorical version), the duration of the offending (the categorical
version), or the delay between the offence and the sentence date.
Statistically significant differences were found, however, for several of the other
variables, including whether grooming was involved, whether the offender had abused
multiple victims, the type of offence, the number of offences involved in the case, the
plea type and the period in which the offender was sentenced. These are discussed
below.
Grooming
In cases involving grooming (as the dichotomous variable), more than nine out of 10
offenders received a custodial sentence (93 per cent), while 5.8 per cent received a
wholly suspended sentence and 1.2 per cent received a community sentence. In cases
with no apparent grooming involved, a far smaller proportion (58.1 per cent) were
sentenced to custody, one-quarter (23.3 per cent) received a suspended term and
18.6 per cent a community sentence. The difference in penalty outcome was statistically
significant (χ²(2, 129) = 24.286, p = 0.000).
73 When both variables are continuous, a Pearson’s product-moment correlation is used. When one is
continuous and one dichotomous, a t-test is used to compare means (although a point-biserial correlation –
a special case of Pearson’s product-moment correlation – may also be used). When both variables are
categorical, a chi-square is used. Analysis of variance is used to compare means of a continuous variable with a multi-category one.
74 Given the importance of the institution/occupation/relationship variable, a series of dummy variables was
created for each of the main categories. That is, a dummy variable (no/yes) was created for school –
religious, school – other, church, Scouts and other. This allowed each of the relationships to be separately
examined at each stage of the analysis. In the bivariate analysis with penalty type, none of these dummy variables was statistically significant.

59
As grooming may indicate a level of planning involved in the offending, it is likely that
the higher proportion of custodial terms reflects an offender’s greater culpability. In
addition, the kind of grooming that involves providing alcohol, drugs or pornography
to a child adds another dimension to the harm caused.
Multiple victims
Where the offender had more than one victim, most offenders were sentenced to a
custodial term (85.7 per cent), while 11.2 per cent received a wholly suspended
sentence and 3.1 per cent received a community sentence. For offenders with a single
victim, a smaller proportion (62.6 per cent) was sentenced to custody, 21.2 per cent
received a suspended term and 16.2 per cent received a community sentence. The
difference in penalty outcome was statistically significant (χ²(2, 260) = 21.299, p =
0.000).
The presence of multiple victims may indicate greater offender culpability in terms of
the offending affecting more people’s lives, but also possibly as an indication of the
offender’s lack of remorse. It may also be relevant to assessing the risk of reoffending
and prospects of rehabilitation.
Offence type75
In cases involving a penetrative offence as the principal offence, 90.3 per cent of
offenders received a custodial sentence, while 7.5 per cent received a wholly suspended
sentence and 2.2 per cent received a community sentence. All cases of persistent abuse
received a custodial term. In cases involving an indecent assault, 65.5 per cent were
sentenced to custody, 20 per cent received a suspended term and 14.5 per cent were
given a community sentence. For those with an indecent act as the principal offence,
63.6 per cent received a custodial term, 27.3 per cent received a suspended term and
9.1 per cent were given a community sentence. The difference in penalty outcome
across these offence types was statistically significant (χ²(6, 261) = 25.096, p = 0.000).
The differential custodial outcomes for the various offence types may reflect a view
that penetrative offences are more serious than non-penetrative ones. As community
and judicial understanding of the lasting harm CSA causes has increased over the years,
charging and sentencing practices are likely to have changed based on the precise nature
of the offending.
Number of offences76
In cases where the number of offences fell at or below the median, almost two-thirds
of offenders were sentenced to a custodial term (65.2 per cent), while 22.2 per cent
received a wholly suspended sentence and 12.6 per cent were given a community
sentence. Sentencing outcomes were very different in cases where the number of
offences sat above the median. For these, 91.3 per cent were sentenced to custody, 6.3
per cent received a suspended term and only 2.4 per cent were given a community
sentence. The difference in penalty outcome across the number of offences was
75 As so few cases had a principal offence of child pornography (four), this offence type was removed for
these analyses.
76 For ease of interpretation, rather than using the log-transformed version of this variable, the number of
offences was dichotomised based on the median offences (five). The new variable included a group at or
below the median and a group above the median. This allows the relationship between the number of offences and the penalty outcome to be identified more readily and interpreted more clearly.

60
statistically significant (χ²(2, 262) = 26.160, p = 0.000). There is clearly a very strong
bivariate association between the number of offences (high versus low) and the penalty
type.
This possibly reflects a view of both offender culpability and harm caused, with both
increasing as the number of offences increases.
Institutional response
In cases where the offender was dismissed from his position, 75 per cent received a
custodial term and 25 per cent received a wholly suspended sentence. In those cases
where the offender was not dismissed, 90 per cent received a custodial term, 5 per cent
received a wholly suspended sentence and 5 per cent were given a community term.
The difference in penalty outcome across institutional responses was statistically
significant (χ²(2, 68) = 6.820, p = 0.033). The very small number of cases in this test
means that this result should be interpreted with caution.
It is possible that, in cases where the offender has lost their livelihood (and possibly
reputation) due to dismissal, judges consider the consequences of the dismissal to
represent some level of punishment already imposed, and thus reduce the severity of
their sentences somewhat. However, as one judge noted, a lack of institutional response
is not relevant to the sentence at hand: it “is not something that adds to the seriousness
of your offending or bears on the sentence to be imposed upon you”.77
Plea type
In cases where a guilty plea was entered, almost three-quarters of offenders were
sentenced to a custodial term (73 per cent), while 17.9 per cent received a wholly
suspended sentence and 9.2 per cent received a community sentence. For those pleading
not guilty, 89.6 per cent were sentenced to custody, 4.5 per cent received a suspended
term and 6 per cent were given a community sentence. The difference in penalty
outcome across plea types was statistically significant (χ²(2, 263) = 8.584, p = 0.014).
Differences in penalty type based on plea are not surprising, given that a guilty plea
must be taken into account at sentencing. A guilty plea saves the victim(s) from having
to take the stand, saves the state the cost of prosecuting the case and saves the court the
resources required to hear a trial.
Sentence period
The sentence period significantly influenced the sentence imposed. Of those sentenced
prior to 1999, 65.4 per cent received a custodial term, while 9.9 per cent had a wholly
suspended sentence and 24.7 per cent received a community sentence. This pattern
changed considerably over the years. Of those sentenced in 2000–09, 79 per cent
received a custodial term, 19 per cent were given a suspended term and only 2 per cent
received a community sentence – an enormous difference from the one-quarter of all
cases receiving a community sentence in earlier decades. Of cases that were sentenced
in 2010–15, 80.2 per cent received a custodial term, 16.5 per cent were given a
suspended term and 3.3 per cent were given a community term. The difference in
penalty outcome across sentence periods was statistically significant (χ²(4, 272) =
77 Walker at [24] per Hampel J.

61
34.268, p = 0.000). This shows a dramatic shift in sentencing patterns, particularly
since 2000.
Community understanding of the impacts of CSA has increased over time, as robust
scientific and social research has proven the lasting effects of childhood trauma. In
previous decades, the community and judges at times dismissed the seriousness of CSA
offences, but more recently these offences have been treated far more seriously.
Extensive practical and legislative reform has also led to evolving sentencing practices.
Summary of bivariate relationships with penalty type
To summarise, the following variables had a statistically significant bivariate
relationship with penalty type:
Whether grooming behaviour was involved: cases in which grooming had taken
place were associated with a custodial penalty.
Whether the offender had abused multiple victims: cases in which more than
one victim had been abused were associated with a custodial penalty.
Type of offence involved: cases in which penetration had taken place or where
the abuse was deemed persistent were associated with a custodial penalty.
Number of offences involved in the case: cases involving more individual
offences were associated with a custodial penalty.
Institutional response: cases in which the offender had not been dismissed from
his position were associated with a custodial penalty.
Plea type: cases in which the offender pleaded not guilty were associated with
a custodial penalty.
Period in which the offender was sentenced: cases sentenced since 2000 were
associated with a custodial penalty.
Six of these seven variables were subsequently entered in the multivariate analysis.
Institutional response was not included due to the high proportion of missing data and
thus its lack of robustness as a measure.
Sentencing outcome: total effective sentence length
As total effective sentence length is a continuous variable, analyses to identify the
strength of bivariate relationships involved Pearson’s correlations (for continuous
independent variables), t-tests (for dichotomous independent variables) or analysis of
variance (for multi-category independent variables). For the bivariate analyses, the log-
transformed version of the total effective sentence variable was used.
Table D1 presents the Pearson’s correlation coefficients for the continuous independent
variables to measure their association with (the log-transformed) total effective
sentence length.

62
Table D1: Relationship between continuous variables
and total effective sentence length
Measure Correlation with logTES
Delay -0.067
Number of offences (log)78
0.619**
Time between last offence and sentence -0.184**
Victim age -0.253**
** = relationship is statistically significant at the p < 0.01 level
The strongest relationship was found for the (log-transformed) number of offences,
with a longer total effective sentence being strongly associated with more offences in
the case (r = 0.619), possibly reflecting a greater harm and greater culpability of the
offender. A longer total effective sentence was also imposed in cases with a younger
victim (r = -0.253)79
and in cases where the most recent offending was closer in time to
the sentence date (r = -0.184).80
There was no relationship detected between delay (the time from the first offending in
the case to the sentence date) and the total effective sentence length.
Turning to dichotomous independent variables, t-tests showed that there were no
significant differences in means between most of the dichotomous independent
variables and total effective sentence length. That is, there was no difference in sentence
length based on the victim’s gender, the offender’s prior history of offending, the
institution/occupation/relationship variable,81
the institutional response or the plea type.
However, significant differences in (the log-transformed) total effective sentence
length were found for the dichotomous grooming variable (no/yes)82
and for the
variable measuring whether the offender had multiple victims. Cases that involved
78 Other forms of this variable were also tested to determine if the relationship was sustained regardless of the
variable form. The bivariate relationship was still significant for the original form of the variable
(r = 0.501**) and for the dichotomous form (above and below the median) in the t-test. That is, the t-test
showed there was no difference in (the log-transformed) total effective sentence length between those with
a low number of offences (M = 1.40, SD = 0.31) and those with a high number of offences (M = 1.78,
SD = 0.34); t (1,253) = -9.50, p = 0.000).
79 Analysis of variance showed that the categorical victim age variable was also significantly related to
total effective sentence length: F(3,202) = 4.562, p = 0.004. Those with victims aged under 10 had
significantly longer sentences than those with victims aged 12 to under 16 (p = 0.006) and those aged
16 to 18 (p = 0.016). There was no difference in total effective sentence length between those with victims aged under 10 and those with victims aged 10 to under 12.
80 This measure – last offence from sentence – is similar to the delay measure but counts from the last known
offence across all cases, rather than from the first known offence in the particular case. While the two measures are highly correlated (r = 0.644**), they are subtly different due to their different starting points.
81 The institution/occupation/relationship variable was tested in various forms. For the t-tests, the dummy variable form was used, with the five dichotomous variables. None of the tests was statistically significant.
82 Analysis of variance showed that the multi-category grooming variable was also significantly related to
total effective sentence length: F(3,116) = 5.724, p = 0.001. Given the ambiguity in the multi-category version of the variable, however, the dichotomous version was used in subsequent analyses.

63
grooming had longer total effective sentences (M = 1.73, SD = 0.35) than those without
(M = 1.47, SD = 0.34); (t(1,122) = -3.85, p = 0.000).83
Cases involving offenders with
more than one victim also resulted in longer total effective sentences (M = 1.67,
SD = 0.32) than those without (M = 1.43, SD = 0.40); (t(1,253) = -5.10, p = 0.000).84
Once again, both these differences are likely to reflect underlying perceptions of the
harm caused and the offender’s culpability.
Finally, analysis of variance was used to compare the mean total effective sentence
length for the multi-category variables. No significant difference was found for
sentence period, such that there was no relationship between the period in which the
person was sentenced and the length of the total effective sentence.85
There was also no
significant relationship between total effective sentence length and the multi-category
form of the institution/occupation/relationship variable.
There were significant differences for the duration of offending and the offence type.
For the duration of offending, the analysis showed statistically significant differences
in group means (F (3,208) = 7.050, p = 0.000). In order to identify precisely which
groups differed, post-hoc tests were included to confirm where the differences
occurred.86
The tests showed significant differences in total effective sentence length
between those cases with a short offending duration (less than five years; M = 1.52, SD
= 0.33) and those with a long (10 to 20 years; M = 1.79, SD = 0.41) or very long (20
years or more; M = 1.75, SD = 0.47) duration. For both comparisons, cases with a short
offending duration were associated with a significantly shorter total effective sentence
length (p = 0.000 for the 10- to 20-year comparison group and p = 0.036 for the 20
years or more comparison group). There was no significant difference in total effective
sentence length between cases with short duration and those of middle (five- to 10-
year) duration.
Analysis of differences in total effective sentence length by offence type showed
statistically significant differences in group means (F (4,258) = 26.706, p = 0.000).
Post-hoc tests found significant differences on total effective sentence length between
those cases with a penetrative offence (with a longer average total effective sentence;
M = 1.83, SD = 0.31) and those with an indecent assault (M = 1.44, SD = 0.33), an
indecent act (M = 1.25, SD = 0.31) or a child pornography offence (M = 1.24,
SD = 0.04), which all had a shorter average total effective sentence length.
Relationships between total effective sentence and each of offending duration and
offence type are likely to reflect differences in harm and culpability, and are not
unexpected.
83 Levene’s test for equality of variances was not significant, such that equal variances were assumed.
84 Levene’s test for equality of variances was not significant, such that equal variances were assumed.
85 Although the relationship between total effective sentence length and sentence period was not significant, it
is interesting to consider sentencing practices in each period, given that differential practices were seen for
penalty type. Prior to 1999, the mean total effective sentence length was 49.58 months, and the median was
36 months. In the decade beginning 2000, the mean total effective sentence length was 55.56 months, and
the median was 37 months. Finally, in the period since 2010, the mean total effective sentence length was
55.76 months, and the median was 36 months. Thus, there has been little change in sentencing practice
since 2000, although when compared with the period prior to 1999, the average total effective sentence
length has increased substantially. Interestingly, the median value has not, suggesting that it is possibly at
the highest end of sentence length that the changes are most pronounced (that more people are receiving
very long sentences), as these outlying values will pull up the mean.
86 Tukey’s honestly significant difference (HSD) test was performed as Levene’s statistic showed that the data met the assumption of homogeneity of variances.

64
Summary of bivariate relationships with total effective sentence length
To summarise, the following variables had a statistically significant bivariate
relationship with (the log-transformed) total effective sentence length:
The number of offences: cases that involved more offences were associated with
a longer total effective sentence.
The age of the victim: cases that involved younger victims were associated with
a longer total effective sentence.
The time between the last known offence for a person and their sentence date:
cases that involved more recent offending were associated with a longer total
effective sentence.
Whether grooming was involved: cases that involved grooming were associated
with a longer total effective sentence.
Whether the offender had multiple victims: cases that involved more than one
victim were associated with a longer total effective sentence.
The duration of the offending: cases that involved a longer duration of offending
were associated with a longer total effective sentence.
The offence type: cases that involved penetrative offences were associated with
a longer total effective sentence.
Each of these seven variables was subsequently entered in the multivariate analysis.
Delay
Delay between the offence and the sentence may be caused by a delay in reporting, a
delay in the investigation or prosecution process, or some other factor. The data do not
allow the drawing of such a distinction, and as such no assumptions are made about the
causes of delay between the offence and the sentence date in the cases examined.
As delay is a continuous variable, analyses to identify the strength of bivariate
relationships once again involved either Pearson’s correlations, t-tests or analysis of
variance.
Table D2 presents the Pearson’s correlation coefficients for the continuous independent
variables to measure their association with delay.
Table D2: Relationship between continuous variables and delay
Measure Correlation with delay
logTES -0.63
Number of offences (log) 0.147*
Time between last offence and sentence 0.807**
Victim age -0.023 ** = relationship is statistically significant at the p < 0.01 level
* = relationship is statistically significant at the p < 0.05 level
The strongest relationship was found for the time between the last offence and the
sentence date (r = 0.807**). Given the overly strong relationship between these two,
and as this measure is very similar to the delay measure itself, this variable was not
subsequently included in multivariate analyses.

65
Excluding the time between last offence and sentence date, the only other statistically
significant relationship with delay was for the (log-transformed) number of offences:
there was a greater delay for cases with more offences (r = 0.147*). It is possible that
the level of harm caused by multiple offences is such that the victim is no longer able
to report the offending for many years. Indeed, in numerous sentencing remarks judges
noted that the nature of the offending – often involving multiple incidents over time –
caused the victim to become withdrawn and fearful, and distrustful of the institution to
the point where the offending was not reported. However, it is also possible that the
criminal justice process itself is more complex in cases involving multiple offences,
such that more time is required for police investigation and preparation for prosecution.
This too may lead to greater delay between the offence and the sentence date.
There was no relationship detected between total effective sentence length and delay,
or victim age and delay.
The lack of a relationship between total effective sentence and delay is perhaps not
surprising. The passage of time between the offence and the sentence date in historical
CSA cases presents particular difficulties for sentencing judges. In most of the
sentencing remarks in such cases, judges expressed the difficulties of imposing an
appropriate sentence in a case where substantial time had passed and the offender –
possibly aged and infirm at the time of sentence – had lived a law-abiding life since the
time of the offending. In many of these cases, the judge remarked that the offender had
clearly been fully rehabilitated, as they had not reoffended. Thus, the sentencing
principle of specific deterrence would not necessarily apply. However, judges still felt
the need to send a clear message to the community that this behaviour would not be
tolerated. In such cases, the sentencing principles of general deterrence and
denunciation remained relevant, as did the need for appropriate punishment. It was clear
from the sentencing remarks that judges find the sentencing of historical CSA cases
extremely difficult and experience tremendous tension between sentencing for a very
serious crime and the presentation of a typically aged offender before them. The
relationship between delay and total effective sentence length is therefore not
straightforward, and is not statistically significant in this database.
The lack of relationship between victim age and delay may be because, as all these
victims are children, nothing is inherent in the age differences that would lead to a
statistically significant difference in delay across the various ages.
Turning to dichotomous independent variables, t-tests showed no significant
differences in means between many of the dichotomous independent variables and
delay. That is, there was no difference in delay based on whether grooming
was involved, the offender’s prior history of offending, institutional response and
plea type.
There were significant differences in delay depending on victim gender and for the
variable measuring whether there were multiple victims. Those cases in which the
victim was male were associated with far longer delays (M = 26.83, SD = 13.538) than
those in which the victim was female (M = 17.64, SD = 13.825); t(1,192) =
-4.167, p = 0.000).87
It is possible that male victims, as victims of homosexual abuse,88
faced an additional trauma and were thus more reluctant to report their abuse, perhaps
87 Levene’s test for equality of variances was not significant, such that equal variances were assumed.
88 Only four of the cases involved a female offender.
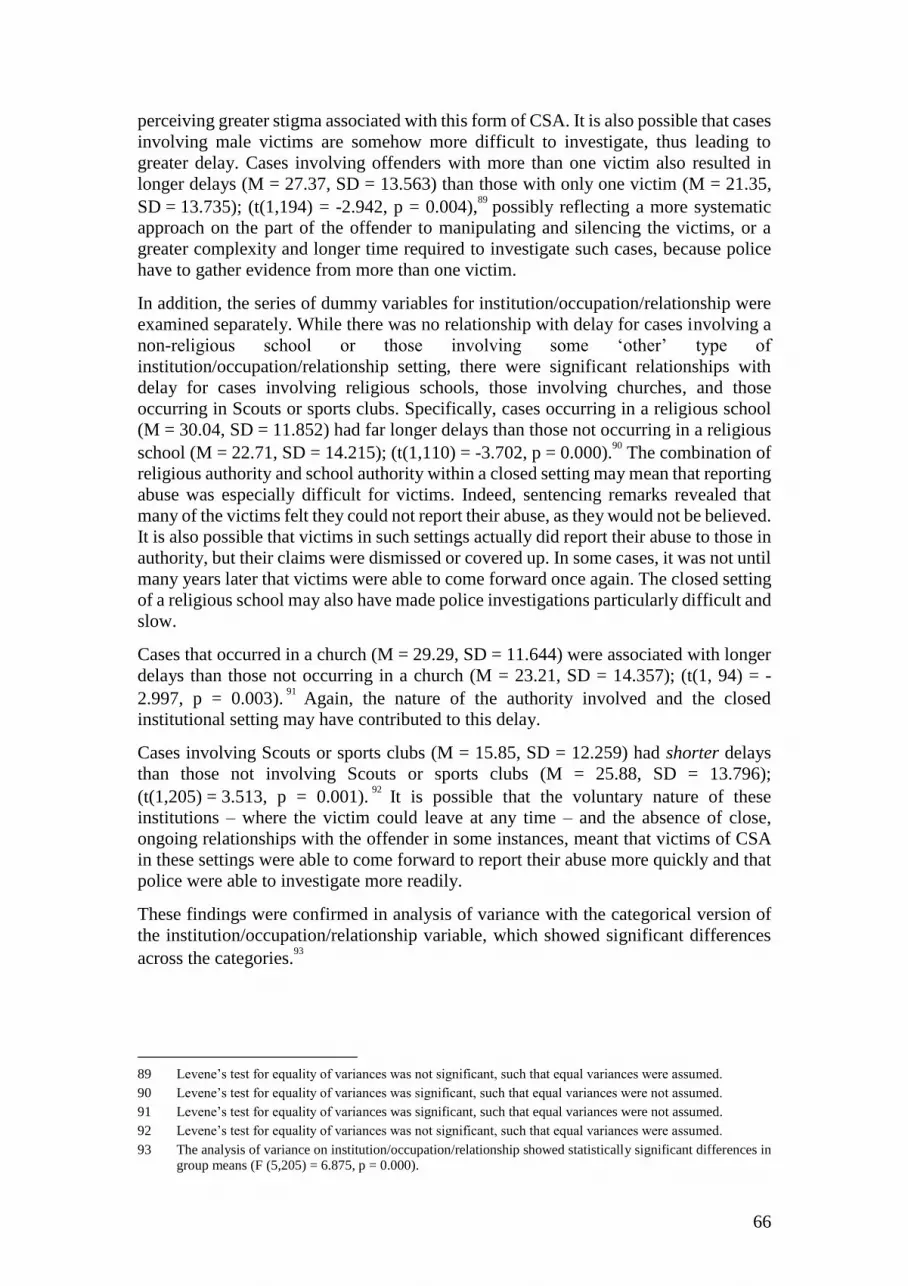
66
perceiving greater stigma associated with this form of CSA. It is also possible that cases
involving male victims are somehow more difficult to investigate, thus leading to
greater delay. Cases involving offenders with more than one victim also resulted in
longer delays (M = 27.37, SD = 13.563) than those with only one victim (M = 21.35,
SD = 13.735); (t(1,194) = -2.942, p = 0.004),89
possibly reflecting a more systematic
approach on the part of the offender to manipulating and silencing the victims, or a
greater complexity and longer time required to investigate such cases, because police
have to gather evidence from more than one victim.
In addition, the series of dummy variables for institution/occupation/relationship were
examined separately. While there was no relationship with delay for cases involving a
non-religious school or those involving some ‘other’ type of
institution/occupation/relationship setting, there were significant relationships with
delay for cases involving religious schools, those involving churches, and those
occurring in Scouts or sports clubs. Specifically, cases occurring in a religious school
(M = 30.04, SD = 11.852) had far longer delays than those not occurring in a religious
school (M = 22.71, SD = 14.215); (t(1,110) = -3.702, p = 0.000).90
The combination of
religious authority and school authority within a closed setting may mean that reporting
abuse was especially difficult for victims. Indeed, sentencing remarks revealed that
many of the victims felt they could not report their abuse, as they would not be believed.
It is also possible that victims in such settings actually did report their abuse to those in
authority, but their claims were dismissed or covered up. In some cases, it was not until
many years later that victims were able to come forward once again. The closed setting
of a religious school may also have made police investigations particularly difficult and
slow.
Cases that occurred in a church (M = 29.29, SD = 11.644) were associated with longer
delays than those not occurring in a church (M = 23.21, SD = 14.357); (t(1, 94) = -
2.997, p = 0.003).91
Again, the nature of the authority involved and the closed
institutional setting may have contributed to this delay.
Cases involving Scouts or sports clubs (M = 15.85, SD = 12.259) had shorter delays
than those not involving Scouts or sports clubs (M = 25.88, SD = 13.796);
(t(1,205) = 3.513, p = 0.001).92
It is possible that the voluntary nature of these
institutions – where the victim could leave at any time – and the absence of close,
ongoing relationships with the offender in some instances, meant that victims of CSA
in these settings were able to come forward to report their abuse more quickly and that
police were able to investigate more readily.
These findings were confirmed in analysis of variance with the categorical version of
the institution/occupation/relationship variable, which showed significant differences
across the categories.93
89 Levene’s test for equality of variances was not significant, such that equal variances were assumed.
90 Levene’s test for equality of variances was significant, such that equal variances were not assumed.
91 Levene’s test for equality of variances was significant, such that equal variances were not assumed.
92 Levene’s test for equality of variances was not significant, such that equal variances were assumed.
93 The analysis of variance on institution/occupation/relationship showed statistically significant differences in group means (F (5,205) = 6.875, p = 0.000).

67
Finally, analysis of variance was used to compare the mean delay for the multi-category
variables. Significant differences were found for all the categorical variables examined,
except for offence type.94
Analysis of differences in delay by institution type showed statistically significant
differences in group means (F (5,205) = 6.875, p = 0.000). Post-hoc tests95
found
significant differences in delays between those cases taking place in a religious school
and those taking place in either a non-religious school or a Scouts or sports club setting.
Cases where the abuse took place in a religious school had a significantly longer delay
between the offence and the sentence date (M = 30.04, SD = 11.85) than those taking
place in a non-religious school (M = 21.92, SD = 15.54) or in Scouts (M = 15.85, SD
= 12.26). In addition, offences occurring at a church (M = 29.29, SD = 11.64) also had
a significantly longer delay than those occurring in the Scouts context.
Analysis of differences in delay by offending duration also showed statistically
significant differences in group means (F (4,206) = 8.808, p = 0.000). Post-hoc tests96
found significant differences in delays between those cases where the offending lasted
less than five years and all other categories. Cases with this short duration of offending
had a significantly shorter delays between the offence and the sentence date (M = 20.86,
SD = 14.19) than those taking place over five to 10 years (M = 28.55, SD = 10.54),
those lasting 10 to 20 years (M = 31.06, SD = 10.82) and those with a duration of
20 years or more (M = 36.53, SD = 10.07). None of the other comparisons
was significant.
Analysis of differences in delay by sentence period showed statistically significant
differences in group means (F (2,206) = 17.525, p = 0.000). Post-hoc tests97
found
significant differences in delays between those cases sentenced prior to 1999 and those
sentenced in each of the two later periods, with those in the first period having a
significantly shorter delay between the offence and the sentence date (M = 15.23,
SD = 12.76) than those sentenced in the other two periods (M = 25.92, SD = 12.720 for
2000 to 2009 and M = 29.09, SD = 13.90 for 2010 to 2015). There is no difference in
delay between cases sentenced from 2000 to 2009 and those sentenced in the period
since.
One might expect that more recent cases would have a shorter delay, as changing
community attitudes mean that people are less reluctant to report abuse and seek to hold
an offender to account. Recent justice system reforms (such as changes to the ways in
which victims may give evidence) and redoubled police efforts in this area aim to
encourage the bringing of older cases to court. However, the increasing workload of
the courts may have worked against this trend, such that the delay between offending
and sentence is greater in more recent times, due to cases taking longer to move through
the courts. While it is not possible to test this directly with these data, it is clear that
courts in some jurisdictions, such as Victoria, have acknowledged the impact of slow
94 The offence type variable was recoded to remove two cases of child pornography for this analysis.
95 Dunnett’s C test was performed as Levene’s statistic showed that the data did not meet the assumption of homogeneity of variances.
96 Dunnett’s C test was performed as Levene’s statistic showed that the data did not meet the assumption of
homogeneity of variances.
97 Tukey’s honestly significant difference (HSD) test was performed as Levene’s statistic showed that the data met the assumption of homogeneity of variances.

68
movement through the system by introducing specialist sex offence lists to prioritise
these offences.
Summary of bivariate relationships with delay
To summarise, the following variables had a statistically significant bivariate
relationship with the delay between first offence and sentence date:
Number of offences: cases that involved more offences were associated with
longer delay between the first offence and the sentence date.
Gender of the victim: cases that involved a male victim were associated with
longer delay between the first offence and the sentence date.
Whether the offender had multiple victims: cases involving more than one
victim were associated with longer delay between the first offence and
the sentence date.
The institution/occupation/relationship: cases that occurred in a religious school
or a church were associated with longer delay between the first offence and the
sentence date, while those that took place in a Scouts or sports club were
associated with shorter delay.
The duration of the offending: cases in which the offending lasted less than five
years were associated with shorter delay between the first offence
and the sentence date.
The period in which the offender was sentenced: cases sentenced since 2000
were associated with longer delay between the first offence and the sentence
date.
Each of these variables was subsequently entered in the multivariate analysis.

69