Embed Size (px)
Citation preview
A large signal dynamic circuit model of a H2/O2 PEM fuel cell:
description, parameter identification and exploitation
G. Fontes, C. Turpin, S. Astier
Laboratoire Plasma et Conversion d’Energie
CNRS (UMR 5213), INPT, UPS
Université de Toulouse, FRANCE
ABSTRACT
The authors propose a large signal and dynamic circuit model for a PEM fuel cell which
includes the different main phenomena: activation, electrochemical double layer, gas diffusion
through the gas diffusion layer and the active layer, ohmic losses. Be careful: this is not an
impedance model! This model will be used to study the interactions between fuel cells and power
converters which are connected, and especially the fuel cell behaviour facing the perturbations
created by the power converter.
1 INTRODUCTION
In order to control the electric power delivered by fuels cells, power converters (or static converters)
are inserted between them and the users. Therefore, progress in fuel cell research activities did not
only lead to increase power density of fuel cells but also to a variety of power converters especially
designed to be connected with fuel cells [3, 4]. Thus, fuel cell models are necessary to study the
coupling between the fuel cell and its power converter. Such models, like the circuit models, could
also be useful for developing and optimizing fuel cell power converters [5].
This paper presents a novel large signal and dynamic circuit model based on a physical and energy
description of the different phenomena: the heart of the energy conversion process is considered and
then the associated losses, which are modelled by their consequences in the electrical field. This model
results from a more generic approach [6]. In order to identify the model parameters, the authors
propose to implement a novel large signal and dynamic characterisation. This measurement principle
and its pertinence have already been illustrated in [9].
First, the model will be built step by step. Secondly, a parameter extraction method will be proposed
through experiments performed with a commercial PEMFC stack. At last, this model will be used to
study the interactions between fuel cells and power converters which are connected, and especially the
fuel cell behaviour facing the perturbations created by the power converter.
2 ASSUMPTIONS
The main assumptions are as follows:
(i) The gases used for the chemical reaction are pure O2 and pure H2.
(ii) Uniform gas concentration in the supply channels and no pressure losses.
(iii) The diffusion phenomena are only considered at the cathode, where they are supposed to be the
most important.
(iv) In the activation layer, the catalyst is supposed to be concentrated at the interface
electrode/electrolyte. So, it is assumed that the gases diffuse through this layer and are only consumed
at this interface.
(v) No parasitic reaction.
(vi) No ageing.
(vii) The whole stack is modelled by a single and equivalent cell. It allows a very simple
implementation, because the equivalent cell model is obtained with an arithmetic average of the stack
voltage. As this approach gives good results, it would prove that it takes into account the phenomena
couplings (thermal, chemical and electrical) between the different cells.
(viii) The following state parameters (T, P, hydration) are known and considered as constant in our
experimental tests.
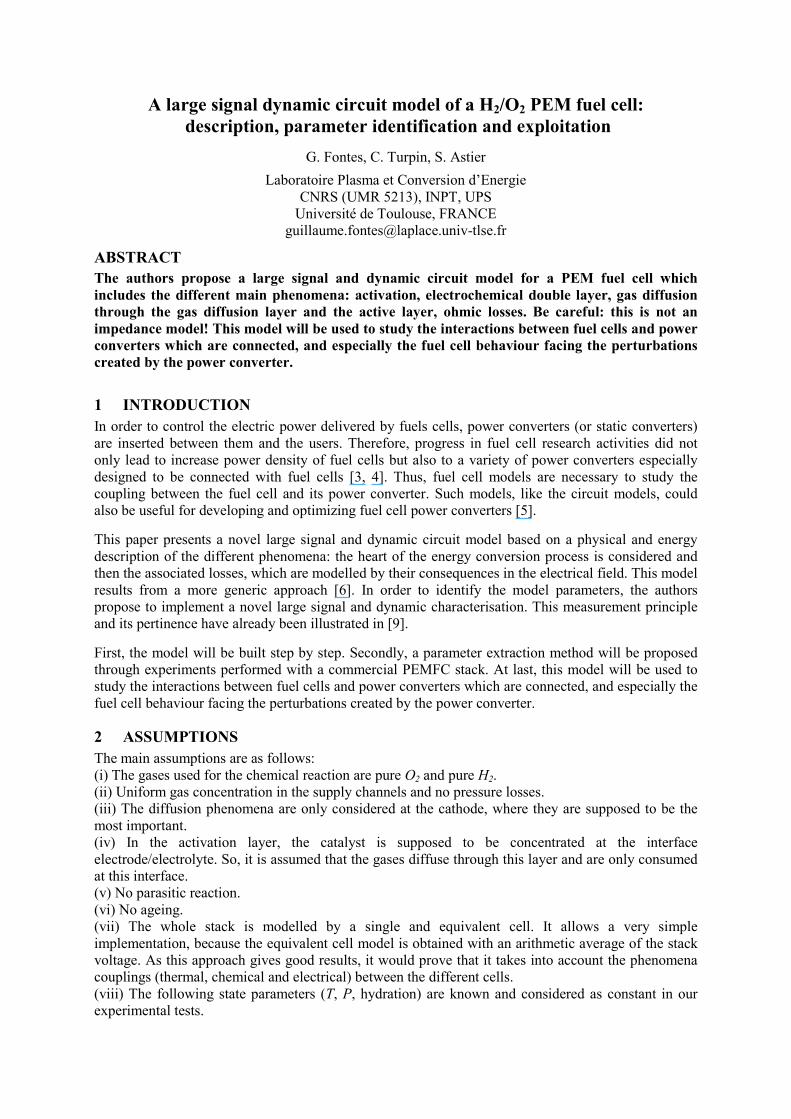
3 CONSIDERED PHENOMENA
The fuel cell is considered from a macroscopic point of view. The considered phenomena are
presented in Figure 1.
Figure 1: Considered phenomena in the circuit model of a PEM fuel cell
4 FUEL CELL MODELLING
4.1 Theoretical potential
The theoretical thermodynamic potential Eth, which represents the chemical energy conversion into
electrical energy, is given by the Nernst's law (1); it is a function of the temperature T and the gas
partial pressures PH2, PO2.:
( )22
ln0
OHth PPnF
RTEE += (1)
Where E0 is the standard potential defined at a reference pressure of 1 bar, T is the fuel cell
temperature [K], R is the perfect gas constant (8.314 J.K-1
.mol-1
), F is the Faraday constant (96485
C.mol-1
), n is the exchanged mole number (n=2).
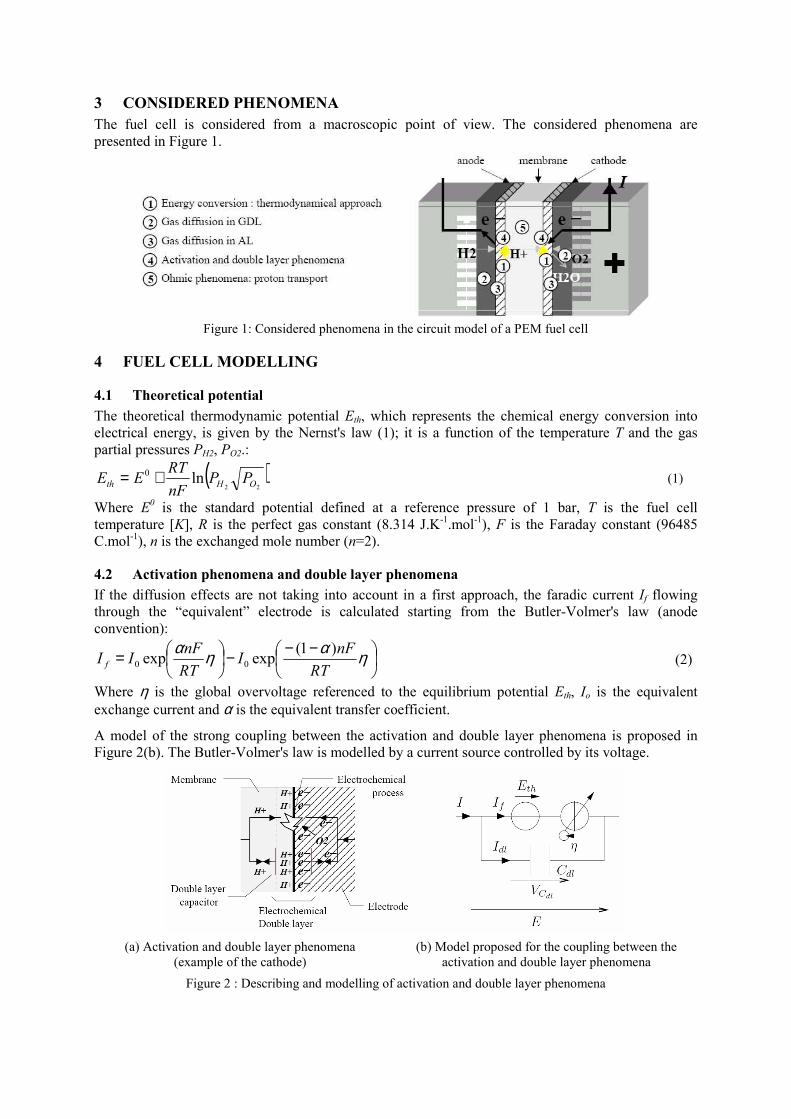
4.2 Activation phenomena and double layer phenomena
If the diffusion effects are not taking into account in a first approach, the faradic current If flowing
through the “equivalent” electrode is calculated starting from the Butler-Volmer's law (anode
convention):
−−−
= ηαηαRT
nFI
RT
nFII f
)1(expexp 00 (2)
Where η is the global overvoltage referenced to the equilibrium potential Eth, Io is the equivalent
exchange current and α is the equivalent transfer coefficient.
A model of the strong coupling between the activation and double layer phenomena is proposed in
Figure 2(b). The Butler-Volmer's law is modelled by a current source controlled by its voltage.
(a) Activation and double layer phenomena
(example of the cathode)
(b) Model proposed for the coupling between the
activation and double layer phenomena
Figure 2 : Describing and modelling of activation and double layer phenomena
4.3 Gas diffusion
As already evocated, the cathodic diffusion losses are much more important than the anodic ones.
After exiting the channels, the gas goes through a porous layer, called diffusion layer, and then
through the activation layer, where it reaches the reaction sites (Figure 3(a)). First, the authors
calculate the diffusion losses in steady state. Secondly, they propose a large signal and dynamic model
of the diffusion losses.
4.3.1 Steady state modelling
The authors propose to separate the diffusion phenomena for each layer: diffusion layer and active
layer. The diffusion overvoltages have the following formulas:
−=
GDLGDL
diffGDLI
I
nF
RT
lim
1lnβ
η (3)
−=
GDLGDL
diffGDLI
I
nF
RT
lim
1lnβ
η (4)
Where βAL and βGDL are empirical coefficients [2], IlimAL and IlimGDL are respectively the diffusion limit
currents for the active layer and the diffusion layer. The limit currents are given by:
I
GDL
GDL CAnFD
IGDL δ
=lim (5)
( )GDLAL
IICAnFD
I I
AL
ALlimlim /1−=
δ (6)
Where A is the cell area [m2], δGDL and δAL are respectively the diffusion layer thickness and the
activation layer thickness [m], DGDL and DAL are respectively the gas diffusion coefficients in the
diffusion layer and in the activation layer [m2.s
-1], and CI is the initial concentration in the channel
[mol.m-3
].
Let us underline that both layers are strongly linked via IlimAL. Moreover the diffusion limit current for
the active layer is strongly linked to the operation point.
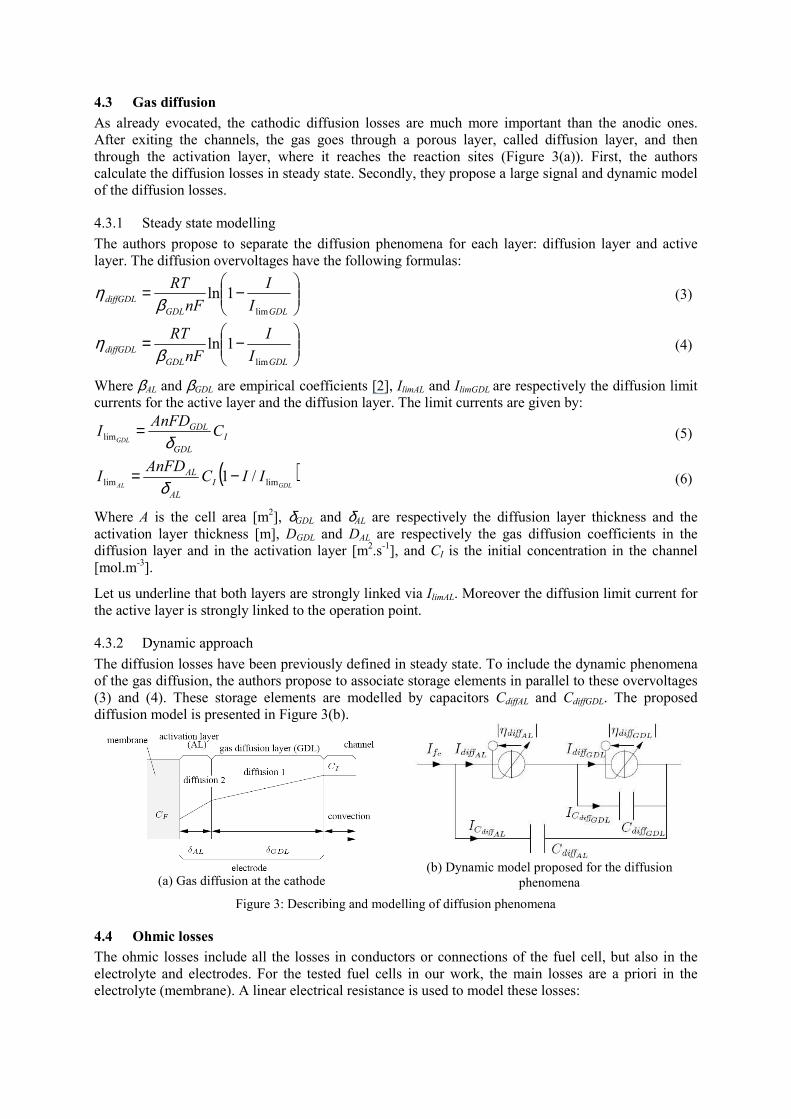
4.3.2 Dynamic approach
The diffusion losses have been previously defined in steady state. To include the dynamic phenomena
of the gas diffusion, the authors propose to associate storage elements in parallel to these overvoltages
(3) and (4). These storage elements are modelled by capacitors CdiffAL and CdiffGDL. The proposed
diffusion model is presented in Figure 3(b).
(a) Gas diffusion at the cathode
(b) Dynamic model proposed for the diffusion
phenomena
Figure 3: Describing and modelling of diffusion phenomena
4.4 Ohmic losses
The ohmic losses include all the losses in conductors or connections of the fuel cell, but also in the
electrolyte and electrodes. For the tested fuel cells in our work, the main losses are a priori in the
electrolyte (membrane). A linear electrical resistance is used to model these losses:
A
lR
σ= (7)
Where l is the membrane thickness [cm], A is the cell area [cm²], σ is the conductivity of the
electrolyte or membrane material [S.cm-1
].
The membrane of our fuel cell is in Nafion whose proton conductivity is given by an empirical
formula [8]:
( )
−−=T
m
1
303
11267exp00326,0005139,0 λσ (8)
Where mλ is the hydration level (a value of 7 corresponds to a membrane quite dry, 14 to a well -
hydrated membrane, and 22 to a drowned one).
4.5 Synthesis
The complete proposed model is a large signal dynamic model. It is presented in Figure 4.
Figure 4: Large signal dynamic circuit model of a H2/O2 PEM fuel cell (combined electrodes)
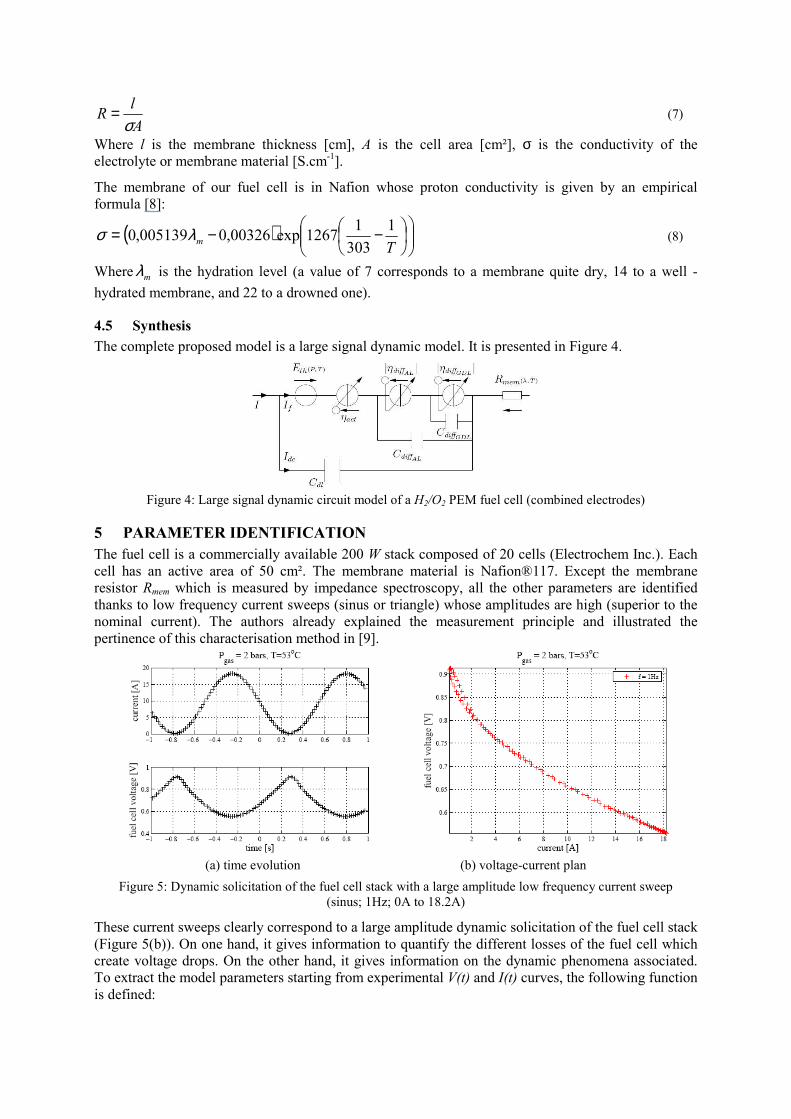
5 PARAMETER IDENTIFICATION
The fuel cell is a commercially available 200 W stack composed of 20 cells (Electrochem Inc.). Each
cell has an active area of 50 cm². The membrane material is Nafion®117. Except the membrane
resistor Rmem which is measured by impedance spectroscopy, all the other parameters are identified
thanks to low frequency current sweeps (sinus or triangle) whose amplitudes are high (superior to the
nominal current). The authors already explained the measurement principle and illustrated the
pertinence of this characterisation method in [9].
(a) time evolution (b) voltage-current plan
Figure 5: Dynamic solicitation of the fuel cell stack with a large amplitude low frequency current sweep
(sinus; 1Hz; 0A to 18.2A)
These current sweeps clearly correspond to a large amplitude dynamic solicitation of the fuel cell stack
(Figure 5(b)). On one hand, it gives information to quantify the different losses of the fuel cell which
create voltage drops. On the other hand, it gives information on the dynamic phenomena associated.
To extract the model parameters starting from experimental V(t) and I(t) curves, the following function
is defined:
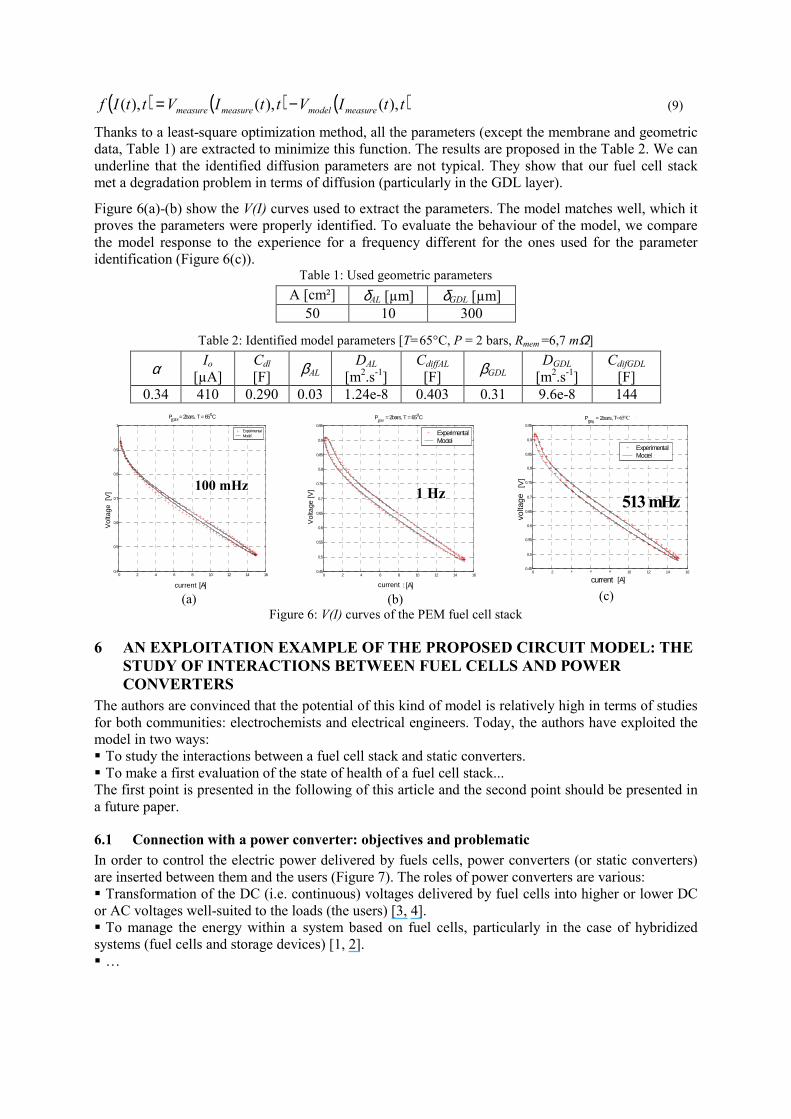
( ) ( ) ( )ttIVttIVttIf measuremodelmeasuremeasure ),(),(),( −= (9)
Thanks to a least-square optimization method, all the parameters (except the membrane and geometric
data, Table 1) are extracted to minimize this function. The results are proposed in the Table 2. We can
underline that the identified diffusion parameters are not typical. They show that our fuel cell stack
met a degradation problem in terms of diffusion (particularly in the GDL layer).
Figure 6(a)-(b) show the V(I) curves used to extract the parameters. The model matches well, which it
proves the parameters were properly identified. To evaluate the behaviour of the model, we compare
the model response to the experience for a frequency different for the ones used for the parameter
identification (Figure 6(c)). Table 1: Used geometric parameters
A [cm²] δAL [µm] δGDL [µm]
50 10 300
Table 2: Identified model parameters [T=65°C, P = 2 bars, Rmem =6,7 mΩ]
α Io
[µA]
Cdl
[F] βAL
DAL
[m2.s
-1]
CdiffAL
[F] βGDL
DGDL
[m2.s
-1]
CdifGDL
[F]
0.34 410 0.290 0.03 1.24e-8 0.403 0.31 9.6e-8 144
0 2 4 6 8 10 12 14 160.4
0.5
0.6
0.7
0.8
0.9
1
courant [A]
tens
ion
[V]
Pgaz = 2bars, T = 65oC
ExpérimentalModèle
100 mHz
current
Vol
tage
[V
]
gas
(a)
0 2 4 6 8 10 12 14 160.45
0.5
0.55
0.6
0.65
0.7
0.75
0.8
0.85
0.9
0.95
courant [A]
tens
ion
[V]
Pgaz = 2bars, T = 65oC
ExpérimentalModèle
1 Hz
current
Vol
tage
[V]
gas
(b)
0 2 4 6 8 10 12 14 160.45
0.5
0.55
0.6
0.65
0.7
0.75
0.8
0.85
0.9
0.95
courant [A]
tens
ion
[V]
Pgaz = 2bars, f=513mHz
ExpérimentalModèle
513 mHz
current
volta
ge
sT=65°C
(c)
Figure 6: V(I) curves of the PEM fuel cell stack
6 AN EXPLOITATION EXAMPLE OF THE PROPOSED CIRCUIT MODEL: THE
STUDY OF INTERACTIONS BETWEEN FUEL CELLS AND POWER
CONVERTERS
The authors are convinced that the potential of this kind of model is relatively high in terms of studies
for both communities: electrochemists and electrical engineers. Today, the authors have exploited the
model in two ways:
To study the interactions between a fuel cell stack and static converters.
To make a first evaluation of the state of health of a fuel cell stack...
The first point is presented in the following of this article and the second point should be presented in
a future paper.
6.1 Connection with a power converter: objectives and problematic
In order to control the electric power delivered by fuels cells, power converters (or static converters)
are inserted between them and the users (Figure 7). The roles of power converters are various:
Transformation of the DC (i.e. continuous) voltages delivered by fuel cells into higher or lower DC
or AC voltages well-suited to the loads (the users) [3, 4].
To manage the energy within a system based on fuel cells, particularly in the case of hybridized
systems (fuel cells and storage devices) [1, 2].
…

Figure 7: Connexion of a fuel cell stack with a power converter (DC: Direct or Continuous, AC: Alternative)
By principle, power converters create different frequency perturbations lower or stronger according to
the family. The consequences are that fuel cells connected to power converters have to deliver currents
not perfectly continuous. Figure 8 shows typical currents imposed by classical power converters to
fuel cells. The numerical values are given to present some magnitude orders, but can naturally vary.
(a) DC-DC converter: buck chopper
(b) DC-DC converter: boost chopper
(c) DC-AC converter example: single phase inverter
Figure 8: Typical currents imposed by power converters connected to fuel cells
Filtering components (capacitors and/or inductors) are generally added between the fuel cells and the
power converters in order to smooth the currents that the fuel cells have to deliver (Figure 7). Yet,
these filtering components are generally heavy, bulky and expensive. It is thus interesting to seek
minimizing them. Thus, a first step is to study the coupling of classical power converters and fuel cells
without the input filtering components. The scientific goals are:
First, to understand the interactions between fuel cells and static converters, i.e. the fuel cell
behaviour(s) against the frequency perturbations generated by power converters.
Secondly, to evaluate the impact of these frequency perturbations on the ageing of fuel cells.
In the following, authors chose to describe only their studies led on classical DC-DC converters: the
buck converter and the boost converters.
6.2 Connection with a buck chopper
The fuel cell has been directly connected with a buck chopper which creates high frequency current
harmonics (Figure 8(a)). This connection does not create any problem during the experimental tests.
The membrane could sustain a high frequency current. The operating conditions were a temperature
T=53°C and a gas pressure P=2 bars.
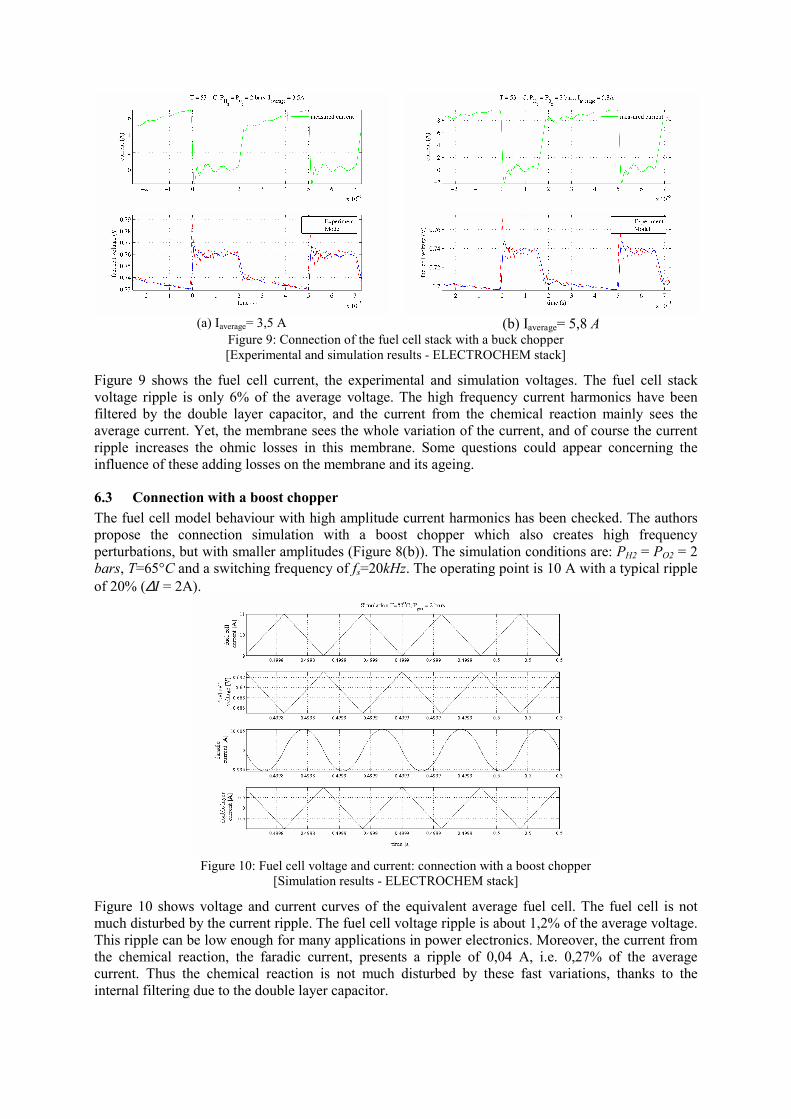
(a) Iaverage= 3,5 A
(b) Iaverage= 5,8 A
Figure 9: Connection of the fuel cell stack with a buck chopper
[Experimental and simulation results - ELECTROCHEM stack]
Figure 9 shows the fuel cell current, the experimental and simulation voltages. The fuel cell stack
voltage ripple is only 6% of the average voltage. The high frequency current harmonics have been
filtered by the double layer capacitor, and the current from the chemical reaction mainly sees the
average current. Yet, the membrane sees the whole variation of the current, and of course the current
ripple increases the ohmic losses in this membrane. Some questions could appear concerning the
influence of these adding losses on the membrane and its ageing.
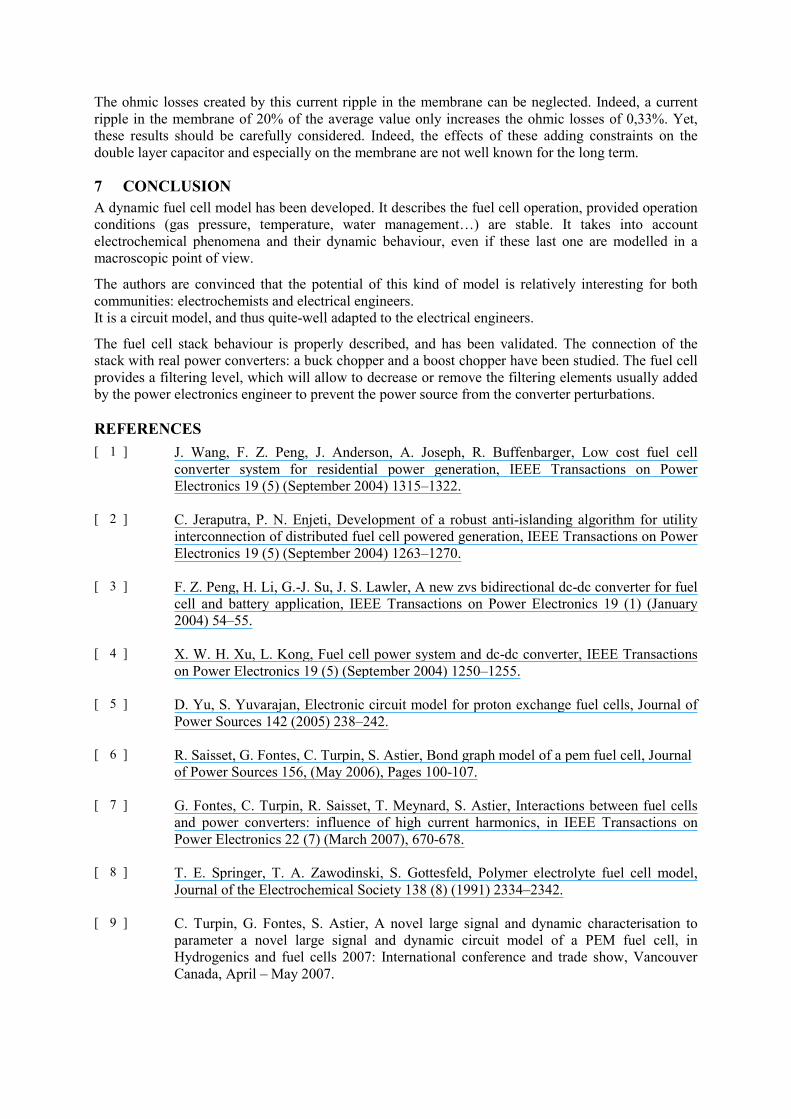
6.3 Connection with a boost chopper
The fuel cell model behaviour with high amplitude current harmonics has been checked. The authors
propose the connection simulation with a boost chopper which also creates high frequency
perturbations, but with smaller amplitudes (Figure 8(b)). The simulation conditions are: PH2 = PO2 = 2
bars, T=65°C and a switching frequency of fs=20kHz. The operating point is 10 A with a typical ripple
of 20% (∆I = 2A).
Figure 10: Fuel cell voltage and current: connection with a boost chopper
[Simulation results - ELECTROCHEM stack]
Figure 10 shows voltage and current curves of the equivalent average fuel cell. The fuel cell is not
much disturbed by the current ripple. The fuel cell voltage ripple is about 1,2% of the average voltage.
This ripple can be low enough for many applications in power electronics. Moreover, the current from
the chemical reaction, the faradic current, presents a ripple of 0,04 A, i.e. 0,27% of the average
current. Thus the chemical reaction is not much disturbed by these fast variations, thanks to the
internal filtering due to the double layer capacitor.
The ohmic losses created by this current ripple in the membrane can be neglected. Indeed, a current
ripple in the membrane of 20% of the average value only increases the ohmic losses of 0,33%. Yet,
these results should be carefully considered. Indeed, the effects of these adding constraints on the
double layer capacitor and especially on the membrane are not well known for the long term.
7 CONCLUSION
A dynamic fuel cell model has been developed. It describes the fuel cell operation, provided operation
conditions (gas pressure, temperature, water management…) are stable. It takes into account
electrochemical phenomena and their dynamic behaviour, even if these last one are modelled in a
macroscopic point of view.
The authors are convinced that the potential of this kind of model is relatively interesting for both
communities: electrochemists and electrical engineers.
It is a circuit model, and thus quite-well adapted to the electrical engineers.
The fuel cell stack behaviour is properly described, and has been validated. The connection of the
stack with real power converters: a buck chopper and a boost chopper have been studied. The fuel cell
provides a filtering level, which will allow to decrease or remove the filtering elements usually added
by the power electronics engineer to prevent the power source from the converter perturbations.
REFERENCES
[ 1 ]
J. Wang, F. Z. Peng, J. Anderson, A. Joseph, R. Buffenbarger, Low cost fuel cell
converter system for residential power generation, IEEE Transactions on Power
Electronics 19 (5) (September 2004) 1315–1322.
[ 2 ]
C. Jeraputra, P. N. Enjeti, Development of a robust anti-islanding algorithm for utility
interconnection of distributed fuel cell powered generation, IEEE Transactions on Power
Electronics 19 (5) (September 2004) 1263–1270.
[ 3 ]
F. Z. Peng, H. Li, G.-J. Su, J. S. Lawler, A new zvs bidirectional dc-dc converter for fuel
cell and battery application, IEEE Transactions on Power Electronics 19 (1) (January
2004) 54–55.
[ 4 ]
X. W. H. Xu, L. Kong, Fuel cell power system and dc-dc converter, IEEE Transactions
on Power Electronics 19 (5) (September 2004) 1250–1255.
[ 5 ]
D. Yu, S. Yuvarajan, Electronic circuit model for proton exchange fuel cells, Journal of
Power Sources 142 (2005) 238–242.
[ 6 ]
R. Saisset, G. Fontes, C. Turpin, S. Astier, Bond graph model of a pem fuel cell, Journal
of Power Sources 156, (May 2006), Pages 100-107.
[ 7 ]
G. Fontes, C. Turpin, R. Saisset, T. Meynard, S. Astier, Interactions between fuel cells
and power converters: influence of high current harmonics, in IEEE Transactions on
Power Electronics 22 (7) (March 2007), 670-678.
[ 8 ]
T. E. Springer, T. A. Zawodinski, S. Gottesfeld, Polymer electrolyte fuel cell model,
Journal of the Electrochemical Society 138 (8) (1991) 2334–2342.
[ 9 ]
C. Turpin, G. Fontes, S. Astier, A novel large signal and dynamic characterisation to
parameter a novel large signal and dynamic circuit model of a PEM fuel cell, in
Hydrogenics and fuel cells 2007: International conference and trade show, Vancouver
Canada, April – May 2007.


