Embed Size (px)
Citation preview
E L S E V I E R Journal of Membrane Science 99 (1995) 31-42
journal of MEMBRANE
SCIENCE
A helical baffle for cross-flow microfiltration
B.B. Gupta *, J.A. Howell, D. Wu, R.W. Field School of Chemical Engineering, University of Bath, Bath BA2 7AY, U.K.
Received 31 May 1994; accepted in revised form 19 September 1994
Abstract
The use of a helical-shape baffle in a mineral (Carbosep) membrane provided an increase of more than 50% in permeate flux compared with that obtained without a baffle at the same hydraulic dissipated power. Two types of solutions were used: bakers yeast (5% dry weight) and dodecane- water emulsion (0.1%, w/w). The effect of the number of helices with respect to baffle length shows that the permeate volume increases with increasing number of helices but to a lesser degree when the number of helices is more than 4 per 25-mm baffle length. Also, when the baffle's maximum diameter was reduced by about 40% a small variation in permeate flux values was observed. More interesting results were obtained with experiments at very low transmem- brane pressures (0.1-0.2 bar) when the permeate flux remained almost constant even from the begining of the experiment, indicating that progressive fouling was practically absent. Flow visualization was made with a video camera (VHS) and showed that the flow was rotational around the baffle axis and that the rotational velocity increased the mixing and migration of the rejected particles from the membrane surface. The manufacturing and installation of this type of baffle was found to be easy, and the cleaning time required for membrane regeneration was found to be shorter than after unbaffled steady flow experiments; so it was possible to recover the initial membrane permeability.
Keywords: Membrane fouling; Helical baffle; Microfiltration; Yeast cell suspension; Dodecane-water emulsion; Power consumption
1. Introduction
In almost all cross-flow ultrafiltration and microfil- tration processes the permeate flux declines with filtra- tion time because of concentration polarisation and progressive fouling by the rejected particles. The degree to which these processes affect the permeate flux depends mainly on the particulate size with respect to pore size, particle charge, channel dimensions and membrane characteristics [1,2]. Several hydrody- namic approaches are in use or in development for controlling these flux-limiting phenomena [ 3 ]. In addi- tion pre-treatment of feed stream, back-washing and
* Corresponding author. URA CNRS 858, University of Com- pi~gne, 60206, France
0376-7388/95/$09.50 © 1995 Elsevier Science B.V. All rights reserved SSDI0376-7388(94)00241-X
different cleaning methods are also used [4 -6 ] . Enhanced permeate fluxes of the order of 2 or more have been obtained by applying hydrodynamic meth- ods, such as the superimposition of pressure and flow pulsations for creating unsteady flow [ 7-9 ] and the use of rotating membranes for creating instabilities or sec- ondary flows [ 10,11 ]. However the use of these tech- niques in commercial filtration units is still limited, because of their inherent complexity, high energy con- sumption and possibly vibration problems. Another reported technique is based on the use of inserts [ 12] or corrugated membranes [ 13 ] for creating instabilities in the flow field; unfortunately their use is also limited to medical use because of a high increase in pressure drop ( A p ) and difficulties in preparing the filtration unit on a larger scale. The combined use of inserts and
32 B.B. Gupta et al. / Journal of Membrane Science 99 (1995) 31-42
pulsating flow [ 14,15] provided even higher permeate fluxes of the order of 2.5 and more but its application is limited because of the high cost and perhaps also because of vibration problems.
Different shapes of static turbulence promoters such as static rods [ 16], spiral wire [ 17], metal grills [ 18], disc and doughnut shape inserts [ 19], kenics proprie- tary static mixers [20] and recently reported cone shape inserts [ 21 ] have been used during ultrafiltration and microfiltration with different fluids and with or without superimposing pulsating flow. Peri and Dunk- ley [ 16] varied the flow conditions in tubular cellu- lose-acetate reverse osmosis membranes by inserting turbulence promoters made from rods with intermit- tently spaced rings cemented to them. Using cottage cheese whey as feed they found that when feed con- tained macrosolutes, increasing the flow velocity or use of turbulence promoters increased the retention of lac- tose and potassium.
Thomas [ 18] used uniformly spaced detached pro- moters (square cross-section rings) and produced sig- nificant increases in the overall heat transfer coefficient with significantly smaller increases in pumping power than would have been required by simply increasing the velocity. Comparison of pumping power and the tube length, with and without detached turbulence pro- moters, showed that the tube length could be markedly reduced by using detached turbulence promoters with only moderate increase in pumping power. Poyen et al. [ 17 ] used expanded metal foils (these metal grills were obtained by punching a metal sheet) as promoters in the ultrafiltration of a calcium alkylsulfonate in a solu- tion of oil in heptane with an IRIS 3038 membrane from Rhone-Poulenc. The results indicate that the mass transfer coefficients are favourably influenced (increased by up to 2.7 times) and the overall cost of the permeate is reduced significantly by the use of the turbulence promoter. A relatively low velocity of 50 cm/s makes it possible to obtain the same permeate flux as obtained at a velocity of 3 m/s in the absence of the promoter.
Finnigan and Howell [ 14] used a tubular membrane system and fitted geometrical inserts of doughnut and disc shape to create a periodically grooved channel. Membrane performance for these systems alone and in combination with pulsed flow was investigated, and the results were compared with a conventional system operating under the same conditions of cross-flow
velocity and transmembrane pressure. The filtration performance of an ultrafiltration membrane in tubular form with a 10-25 g/l solution of the purified 95% whey protein Bipro was improved by a factor of about 2.5 by the incorporation of these baffles. Further improvement was noticed when pulsed flow was used and was most marked at the lowest flow-rates. Pitera and Middleman [20] obtained a significant improve- ment in the pure water flux through tubular desalination membranes with kenics static mixers as turbulence pro- moter; even for a Reynolds number as low as 100, the salt concentration at the membrane surface was reduced by 33% with a corresponding improvement in the qual- ity of the permeate. Recently Mavrov et al. [ 21 ] used periodically repeating cone-shaped inserts in a tubular cellulose-acetate ultrafiltration membrane with an inner diameter of 12.5 mm for the ultrafiltration of a 3% model solution of dextran. With the introduction of inserts the value of the exponent n of the relation " J - Re n'', n increases from 0.14 (empty tube) to 0.3 (cylin- drical insert) and to 0.63 (cone-shape insert).
The creation of instabilities was found to be more effective when the turbulence promoters were placed centrally as compared with their placement near the membrane surface [22]. Recent work [23] simulating oscillating flow within porous tubes containing wall or central baffles has shown that the wall shear-rate, vortex strength and pressure drop profiles are unaffected by flux through the wall even when the flux is an order of magnitude greater than that normally found in micro- filtration systems. The work confirmed that centrally placed baffles are superior, the wall shear-rates being significantly greater than those achieved with wall baf- fles. In most cases the experimental results with baffles have been obtained for hyperfiltration or ultrafiltration using polymeric membranes, and in the case of tubular membranes the inner diameters were more than 10 mm.
In general, whenever an insert is placed inside the flow field it increases the average flow velocity and the wall shear-rate near the membrane surface. Also, for certain geometries, if the inlet flow is sufficiently high, secondary flow or instabilities are produced which fur- ther enhances the mixing and migration of particles from the membrane surface. In ideal conditions when- ever a baffled membrane is used we should verify that it causes no damage to the membrane, creates no stag- nation regions, can be easily made and installed and that its costs are justified in terms of extra energy con-

B.B. Gupta et al. / Journal of Membrane Science 99 (1995) 31--42 33
sumed. In this work we present a new type of baffle which is helical in shape and which can be easily made by winding a metal or plastic wire onto a rod. Alter- natively, a moulded version could be produced. The corresponding diameter of the rod and the wire could be selected according to the membrane inner diameter with an appropriate clearance between the baffle and the membrane inner surface. Several microfiltration experiments have been conducted using a mineral membrane, a yeast cell solution and an oil-water emul- sion. No additional equipment such as a pulsating pump or back-wash pump was used. Higher permeate fluxes were obtained at very low transmembrane pressures and almost without fouling. Photographs were taken and a video recording was made in order to examine the flow field inside the membrane.
2. Experimental
A laboratory-scale filtration set-up was arranged, which consisted of a feed reservoir (2 1) thermostated at 30°C, a feed pump, a filtration unit and measuring equipment (pressure transducers, flow meter, elec- tronic balance). A mineral membrane (Carbosep, France) of 6 mm inner diameter and 20 cm long with a membrane surface area of 37.7 cm 2 was used. This membrane was made up of a fine layer of zirconium oxide (with 0.14-/xm pores) on a carbon porous sup- port. Helical baffles (Fig. 1) of different number of turns ( 1, 2, 4, 6) per 25-mm baffle length were made by winding a steel wire ( 1 mm diameter) on a steel rod of 3.1 or 2.3 mm diameter. These baffles were centrally supported inside the membrane by the help of cross- shaped supports placed in the housing of the module, and it was established that no additional pressure drop was created by the presence of the supports.
Fresh bakers yeast was obtained from British Fer- mentation as a compressed cake of approximately 300 g/kg dry weight. The yeast was diluted down to 5% dry weight for use with a solution of 10 mM phosphate
I I I
Fig. 1. Helical baffles of different shapes.
buffer and 1 g/1 bacteriological peptone. The pH values of the suspensions for all runs were within the 6.5-6.7 range. The viability of the yeast cells was microscopi- cally determined by the uptake of methylene blue dye, and no significant change of the viability of the cell was found before and after a run. The density of a 5% dry weight yeast cell suspension was 1012 kg/m 3 and the viscosity of the suspension was 0.00184 Pa s at 30°C. Another suspension which contained 1000 ppm of dodecane was made in distilled water by mixing at high shear in a blender for 6 min. The emulsion of 1% (w/w) was stable during the experiments.
Many experimental results were obtained with two fluids and using different shapes of membrane config- urations, such as a membrane with a helical baffle (HB), a membrane with a rod baffle (RB) and a membrane without baffle (NB). Also, in order to com- pare the performance of the HB mode with the NB and RB modes some experiments were carried out at the same hydraulic dissipated power, defined as P = Ap Q where Q represents the feed flow-rate and ziP the pres- sure drop along the membrane tube. Other experiments were conducted at a very low transmembrane pressure (0.1 or 0.2 bar) by using a back-pressure from the permeate side. The transmembrane pressure (TMP) was calculated as: TMP= (Pi + P o ) / 2 - P f , where Pi is the inlet pressure, Po the outlet pressure and Pf the permeate side pressure.
Flow visualization has been carried out under the same conditions of flow and pressures as used in dif- ferent filtration experiments to determine the flow pat- terns in the NB, RB and HB modes. The particles and the apparatus were of the same type as given by Fin- nigan [ 19]. A dilute suspension of fine Hostalen 415 GUR polyethylene particles (2.5 g/l) in distilled water at room temperature was used as tracer and a few drops of dish-washing liquid were added initially to wet the particles. These particles are highly reflecting and almost neutrally buoyant. A test section in transparent acrylic plexiglass of identical geometry as that of the membrane was made so that the same baffles could be used for flow visualization. The outer surface of the plexiglass was made rectangular in order to minimise refraction from the curved tube surfaces.
A video film (3M E30 professional HG), a light source and a colour video camera (Sony 537) were used to record the flow field on a video cassette in the presence of a baffle and without a baffle in the flow
34 B.B. Gupta et al. / Journal of Membrane Science 99 (1995) 31~12
M a i n T y p e s o f F l o w
- pe r ime te r c o m p o n e n t
- helical c o m p o n e n t
" reverse flow
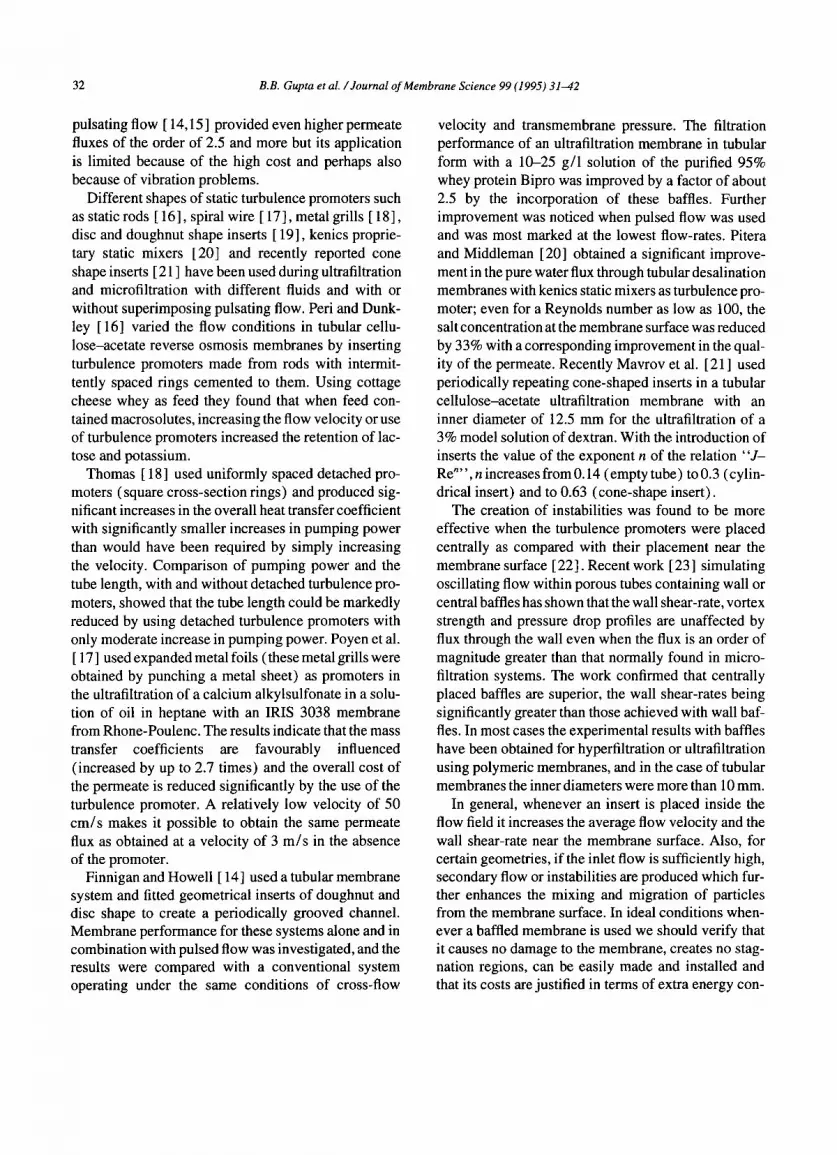
Fig. 2. Flow pattern in the presence of a helical baffle.
channel. Fig. 2 illustrates the results, which are dis- cussed later.
permeate volume from a 2-h experiment for the RB mode was practically the same in both cases. However, in the presence of the helical baffle there was a major rotational component and the particle deposition rate on the membrane surface was decreased. The permeate volume, compared with NB mode, was 90% more at 0.14 W and 57% more at 0.55 W (Table 1).
At the same TMP and same hydraulic power dissi- pated, the permeate fluxes in the RB mode were smaller than those in the NB mode (see Table 1 experiments 1, 2, 4 and 5). The resistance calculations in Table 2 show that the irreversible fouling ratios were very sim- ilar for the same TMP for the RB and NB modes (com- pare experiment 1 with 2 and experiment 4 with 5). However, the reversible fouling ratios were different and were greater for the RB mode. This is probably due
3. Results
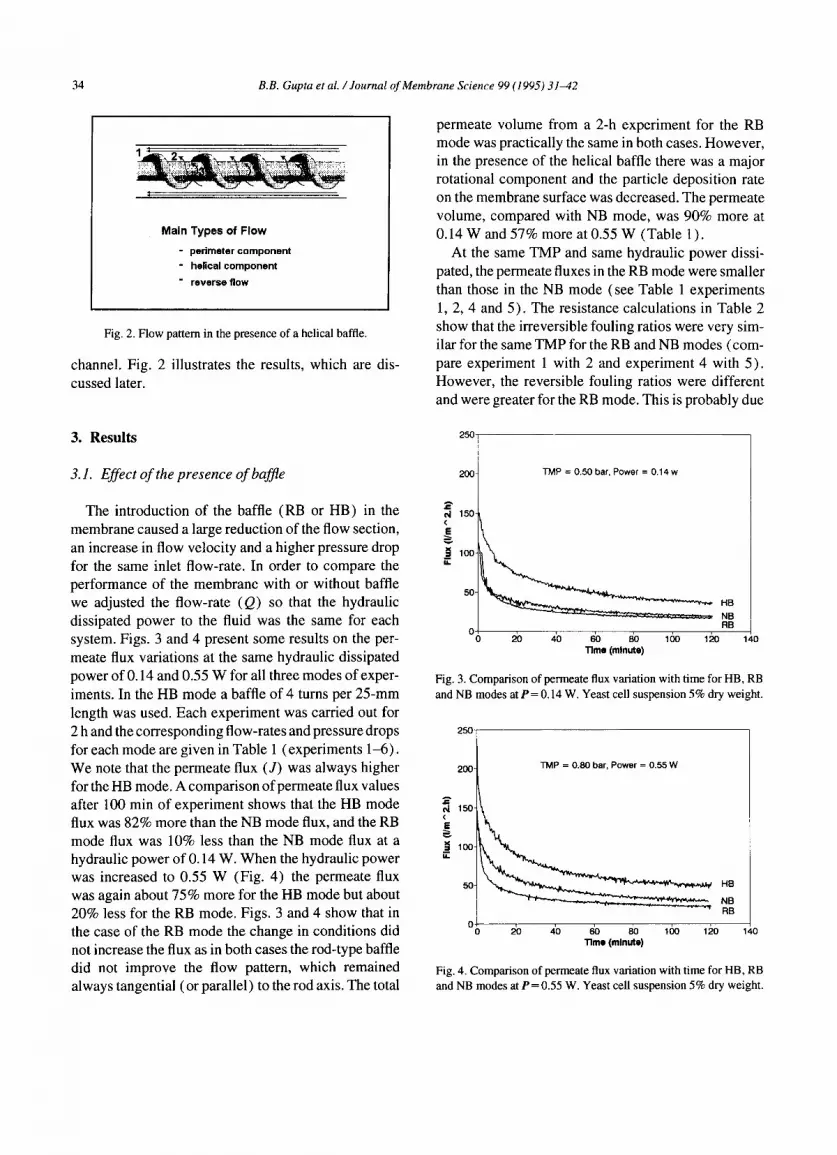
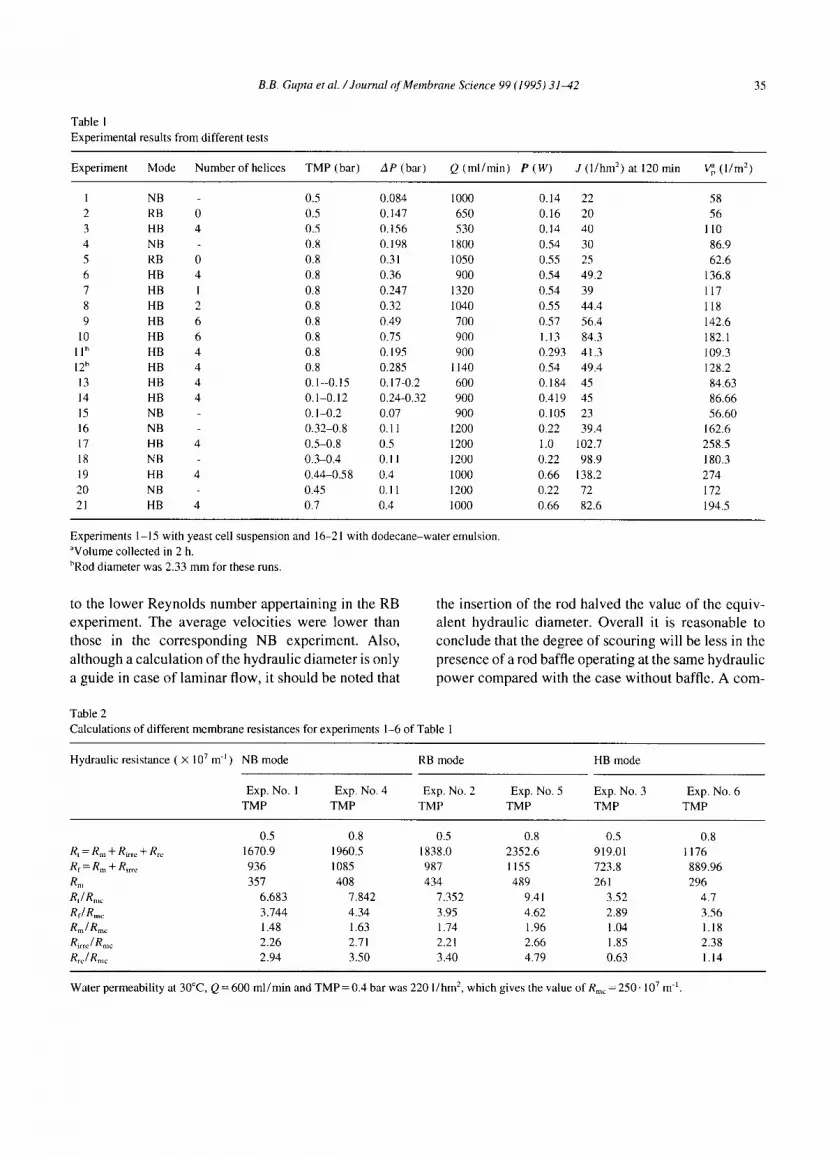
3.1. Effect of the presence of baffle
The introduction of the baffle (RB or HB) in the membrane caused a large reduction of the flow section, an increase in flow velocity and a higher pressure drop for the same inlet flow-rate. In order to compare the performance of the membrane with or without baffle we adjusted the flow-rate (Q) so that the hydraulic dissipated power to the fluid was the same for each system. Figs. 3 and 4 present some results on the per- meate flux variations at the same hydraulic dissipated power of 0.14 and 0.55 W for all three modes of exper- iments. In the HB mode a baffle of 4 turns per 25-mm length was used. Each experiment was carried out for 2 h and the corresponding flow-rates and pressure drops for each mode are given in Table 1 (experiments 1-6). We note that the permeate flux (J) was always higher for the HB mode. A comparison of permeate flux values after 100 min of experiment shows that the HB mode flux was 82% more than the NB mode flux, and the RB mode flux was 10% less than the NB mode flux at a hydraulic power of 0.14 W. When the hydraulic power was increased to 0.55 W (Fig. 4) the permeate flux was again about 75% more for the HB mode but about 20% less for the RB mode. Figs. 3 and 4 show that in the case of the RB mode the change in conditions did not increase the flux as in both cases the rod-type baffle did not improve the flow pattern, which remained always tangential ( or parallel) to the rod axis. The total
25o [
<
E
°1 150
100
50
TMP = 0.50 bar, Power = 0 .14w
HB
NB RB
20 40 60 80 100 120 140 Time (minute)
Fig. 3. Comparison of permeate flux variation with time for HB, RB and NB modes at P = 0.14 W. Yeast cell suspension 5% dry weight.
25O
TMP = 0.80 bar, Power = 0.55 W
,N 150- <
E
tO0-
50- HB
NB • "" RB
~:~ 4'0 60 80 160 120 140 Time (minute)
Fig. 4. Comparison of permeate flux variation with time for HB, RB and NB modes at P = 0.55 W. Yeast cell suspension 5% dry weight.
B.B. Gupta et al. / Journal of Membrane Science 99 (1995) 31-42 35
Table 1 Experimental results from different tests
Experiment Mode Number of helices TMP (bar) Ap (bar) Q (ml/min) P (W) J ( I /hm 2) at 120 rain V~, ( l /m 2)
1 NB 0.5 0.084 1000 0.14 22 58 2 RB 0 0.5 0.147 650 0.16 20 56 3 HB 4 0.5 0.156 530 0.14 40 110 4 NB 0.8 0.198 1800 0.54 30 86.9 5 RB 0 0.8 0.31 1050 0.55 25 62.6 6 HB 4 0.8 0.36 900 0.54 49.2 136.8 7 HB 1 0.8 0.247 1320 0.54 39 117 8 HB 2 0.8 0.32 1040 0.55 44.4 118 9 HB 6 0.8 0.49 700 0.57 56.4 142.6
l0 HB 6 0.8 0.75 900 1.13 84.3 182.1 11 h HB 4 0.8 0.195 900 0.293 41.3 109.3 12 b HB 4 0.8 0.285 1140 0.54 49.4 128.2 13 HB 4 0.1--0.15 0.17-0.2 600 0.184 45 84.63 14 HB 4 0.1-0.12 0.24-0.32 900 0.419 45 86.66 15 NB 0. I-0.2 0.07 900 0.105 23 56.60 16 NB 0.32-0.8 0.11 1200 0.22 39.4 162.6 17 HB 4 0.5-0.8 0.5 1200 1.0 102.7 258.5 18 NB 0.3-0.4 0.11 1200 0.22 98.9 180.3 19 HB 4 0.44-0.58 0.4 1000 0.66 138.2 274 20 NB 0.45 0.11 1200 0.22 72 172 21 HB 4 0.7 0.4 1000 0.66 82.6 194.5
Experiments l - 15 with yeast cell suspension and 16-21 with dodecane-water emulsion. "Volume collected in 2 h. bRod diameter was 2.33 mm for these runs.
to t he l o w e r R e y n o l d s n u m b e r a p p e r t a i n i n g in the R B
e x p e r i m e n t . T h e a v e r a g e v e l o c i t i e s w e r e l o w e r t h a n
t h o s e in t he c o r r e s p o n d i n g N B e x p e r i m e n t . A l s o ,
a l t h o u g h a c a l c u l a t i o n o f t h e h y d r a u l i c d i a m e t e r is o n l y
a g u i d e in c a s e o f l a m i n a r f low, it s h o u l d be n o t e d t ha t
the i n s e r t i o n o f the rod h a l v e d t he v a l u e o f t he e q u i v -
a l e n t h y d r a u l i c d i a m e t e r . O v e r a l l it is r e a s o n a b l e to
c o n c l u d e t ha t the d e g r e e o f s c o u r i n g wi l l be l e s s in t he
p r e s e n c e o f a rod ba f f l e o p e r a t i n g at t h e s a m e h y d r a u l i c
p o w e r c o m p a r e d w i t h t he c a s e w i t h o u t ba f f l e . A c o m -
Table 2 Calculations of different membrane resistances for experiments 1-6 of Table 1
Hydraulic resistance ( × 107 m -~ ) NB mode RB mode HB mode
Exp. No. 1 Exp. No. 4 Exp. No. 2 Exp. No. 5 Exp. No. 3 Exp. No. 6 TMP TMP TMP TMP TMP TMP
0.5 0.8 0.5 0.8 0.5 0.8 R, = Rm + R~rr~ + Rr,~ 1670.9 1960.5 1838.0 2352.6 919.01 1176 R~.= Rm + R ~ 936 1085 987 1155 723.8 889.96 Rm 357 408 434 489 261 296 R,/Rm~ 6.683 7.842 7.352 9.41 3.52 4.7 Rf/Rm,. 3.744 4.34 3.95 4.62 2.89 3.56 Rm/Rmc 1.48 1.63 1.74 1.96 1.04 1.18 Ri~re/Rmc 2.26 2.71 2.21 2.66 1.85 2.38 R~JRmc 2.94 3.50 3.40 4.79 0.63 I. 14
Water permeability at 30°C, Q = 600 ml/min and TMP = 0.4 bar was 220 1/hm 2, which gives the value of Rmc = 250" l07 m -~.
36 B.B. Gupta et al. / Journal of Membrane Science 99 (1995) 31-42
parison at similar volumetric throughput but different power dissipation levels is also interesting. Experi- ments 1 (NB) and 5 (RB) were made at similar feed flow-rates, and the addition of the baffle increased the pressure drop and power dissipation about four-fold, but the increase in permeate flux was about 15%. The reason is probably linked to a decrease in Reynolds number from 1900 (for NB) to 1350 (for RB).
The insertion of a helical baffle changed the flow field. For the same power dissipation this flow field was found to be most effective in increasing permeate flux. This is discussed in detail below but can be seen imme- diately by comparing experiments 4, 5 and 6.
3.2. Effect of number of helices
200
l 180] TMP = 0.8 bar, Power = 0.55W
t ~, 160
=;"°
NB 0 (RB) 1 2 4 6 Number of hell lceo per 25 mm of baffle
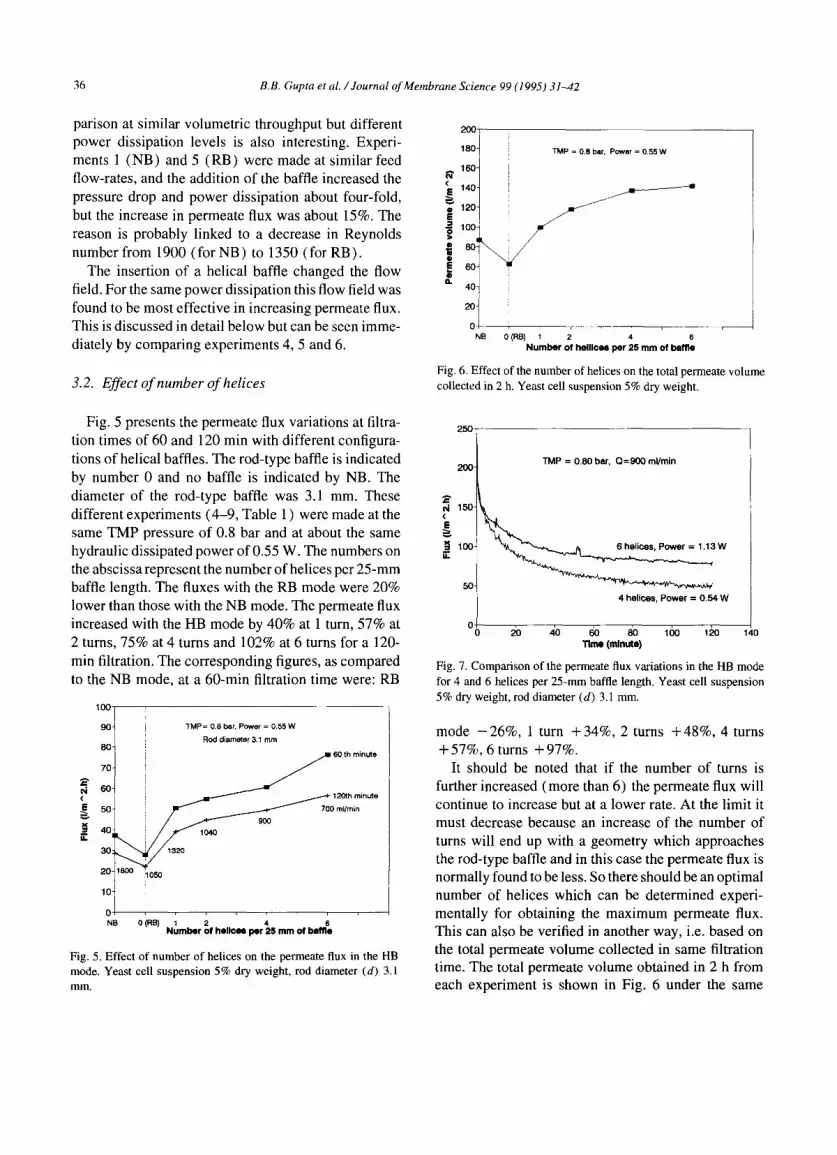
Fig. 6. Effect of the number of helices on the total permeate volume collected in 2 h. Yeast cell suspension 5% dry weight.
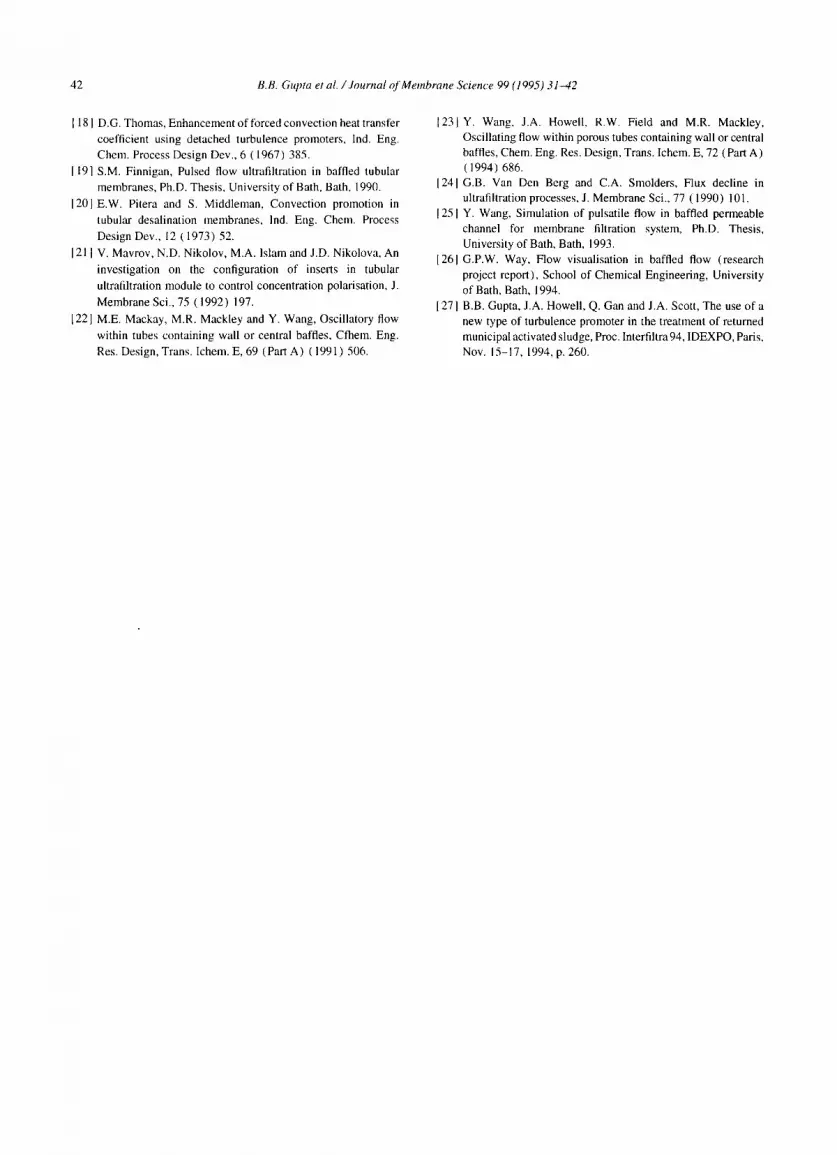
Fig. 5 presents the permeate flux variations at filtra- tion times of 60 and 120 min with different configura- tions of helical baffles. The rod-type baffle is indicated by number 0 and no baffle is indicated by NB. The diameter of the rod-type baffle was 3.1 mm. These different experiments (4-9, Table 1 ) were made at the same TMP pressure of 0.8 bar and at about the same hydraulic dissipated power of 0.55 W. The numbers on the abscissa represent the number of helices per 25-mm baffle length. The fluxes with the RB mode were 20% lower than those with the NB mode. The permeate flux increased with the HB mode by 40% at 1 turn, 57% at 2 turns, 75% at 4 turns and 102% at 6 turns for a 120- min filtration. The corresponding figures, as compared to the NB mode, at a 60-rain filtration time were: RB
100
A 4=
( E
9 0 - TMP= 0.8 bar, Power = 0.55W Rod diameter 3.1 mrn
80- ~ i ~ 6O th minute
, o -
' o l i ° ~ , , , NS 0 (98) 1 2 4 6
Number of helle, e e per 2 5 m m of baffle
Fig. 5. Effect of number of helices on the permeate flux in the HB mode. Yeast cell suspension 5% dry weight, rod diameter (d) 3.1 mm.
2OO TMP = 0.80 bar, Q=900 rnl/min
A 4= 150-
(
100-
50.
3 W
4 helices, Power = 0.54 W
'o ~ .,~ ~ 80 16o 1~ 14o Time (minute)
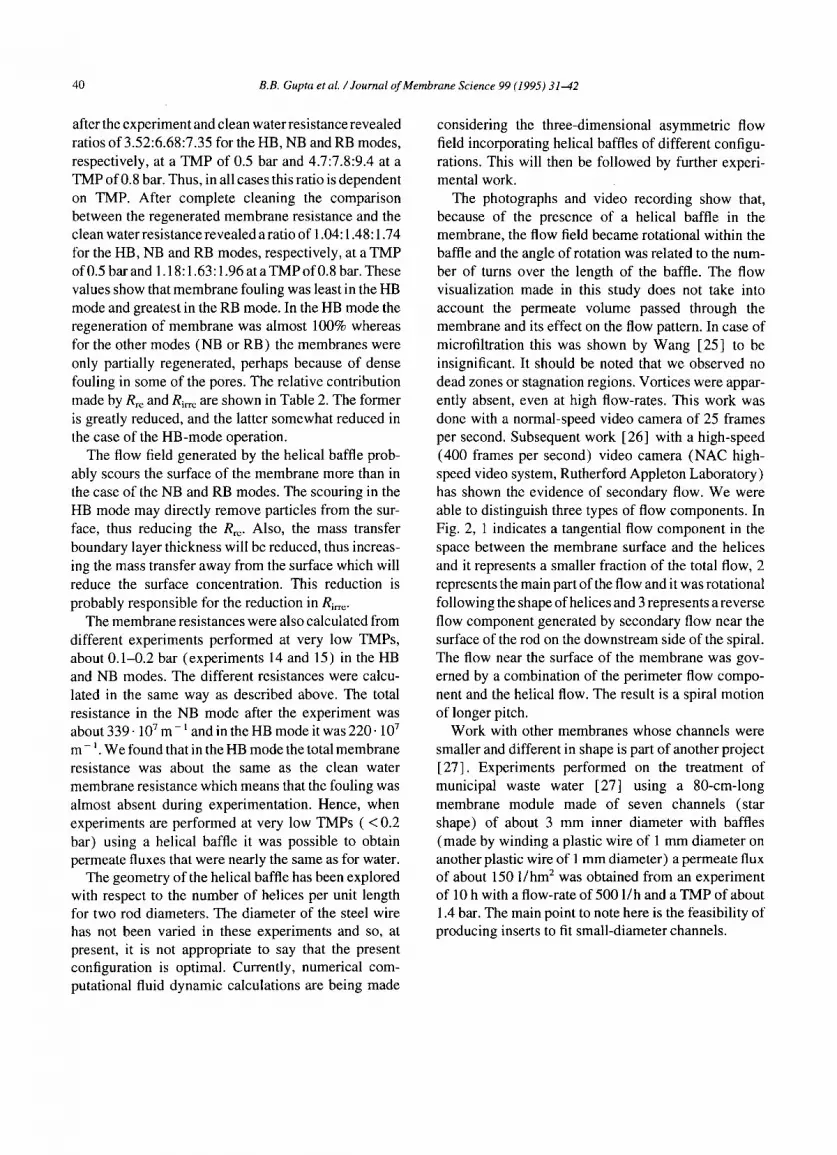
Fig. 7. Comparison of the permeate flux variations in the HB mode for 4 and 6 helices per 25-mm baffle length. Yeast cell suspension 5% dry weight, rod diameter (d) 3.1 mm.
mode -26%, 1 turn + 34%, 2 turns +48%, 4 turns + 57%, 6 turns + 97%.
It should be noted that if the number of turns is further increased (more than 6) the permeate flux will continue to increase but at a lower rate. At the limit it must decrease because an increase of the number of turns will end up with a geometry which approaches the rod-type baffle and in this case the permeate flux is normally found to be less. So there should be an optimal number of helices which can be determined experi- mentally for obtaining the maximum permeate flux. This can also be verified in another way, i.e. based on the total permeate volume collected in same filtration time. The total permeate volume obtained in 2 h from each experiment is shown in Fig. 6 under the same

B.B. Gupta et al. / Journal of Membrane Science 99 (1995) 31~12 37
TMP and hydraulic dissipated power conditions. It was observed that the permeate volume increased slowly when the number of turns was more than 4. Hence, from these experiments we concluded that a helical baffle made up of 4 turns per 25-mm length was opti- mum. When we compared the permeate flux at the same flow-rate and same TMP for 4 and 6 turns (in the HB mode, experiments 6 and 10, Table 1), as shown in Fig. 7, it was found that the permeate flux increased by 60-70%, i.e. from 50 to 841/hm 2 at a 120-min filtration time, but in this case the hydraulic dissipated power also increased by more than 100%. If we look again, in detail, at experiments 4, 5 and 9 with the NB, RB and HB modes (Table 1 ) performed at the same TMP and same hydraulic dissipated power, we can see that the permeate volume obtained varied from 87 1/m 2 (NB mode) to 63 l /m 2 (RB mode) and to 143 1/m 2 (HB mode of 6 turns): about 64% increase in total permeate volume at the same hydraulic dissipated power com- pared to the NB mode. For this initial period of 2 h the average energy dissipation rates per unit permeate vol- ume were 3.2, 4.6 and 2.1 kW h / m 3, respectively.
3.3. Effect of rod diameter
Fig. 8 presents the permeate flux measurements with two baffles of 4 turns per 25-mm rod length on a rod diameter of 2.3 and 3.1 mm (experiments 6, 11 and 12, Table 1). We obtained nearly the same filtration per- formance as with a 3.1-mm diameter rod on the basis of the same power consumption of 0.54 W and same
250
A ~ 150~
50-
TMP = 0.8 bar
- - d = 3.1 mm, Q = 9 0 0 mi/min, Power = 0.54 W
- - d = 2.3 mm, Q=1140 ml/min, Power = 0.54 W
• d = 2.3 mm, Q = 9 0 0 ml/min, Power = 0.29 W
0 20 40 60 80 100 120 140 "l'lrl~ (minCe)
Fig. 8. Compar i son o f the permeate flux variat ions in the HB mode
for rod diameters of 3.1 and 2.3 mm. Yeast cell suspension 5% dry
weight.
TMP of 0.8 bar. The 120-min fluxes were about 50 1/ hm 2 for both the 2.3- and 3.1-mm-diameter rod but the flow-rate for the former was 1140 ml/min and 900 ml/ min for the latter. In the same figure the permeate flux values at 900 ml/min with a 2.3-mm rod are also shown. This time the steady-state flux was 42.2 l /hm 2 but this flux was obtained at a much lower hydraulic power (P = 0.29 W). The energy dissipation rates at 120 min were 2.09 and 2.23 kW h / m 3 for the 3.1- and 2.3-mm rods, respectively, at the same hydraulic dis- sipated power of 0.54 W. Therefore, when a helical baffle is used, the diameter of its rod was also found to be an important parameter. The gap between the wind- ing wire and the membrane wall varied along the axial direction periodically from 0.45 to 1.45 mm for the rod of 3.1 mm and from 0.85 to 1.85 mm for the 2.3-ram rod. It seems that a gap of about 1 mm between the membrane inner surface and the baffle height is appro- priate for good filtration performance using this type of baffle. The optimal size will depend on the relative importance of capital and operating costs.
3.4. Constant-permeate flux experiments
Some experiments were conducted at very low TMP by applying a back-pressure from the permeate side and using a baffle of 4 turns. The permeate flux was fixed initially at about 40 1/hm 2 and the variations in TMP were recorded for two flow-rates: 600 and 900 ml/min (experiments 13 and 14). As shown in Fig. 9a, for a flow-rate of 600 ml/min, the TMP was adjusted regularly and varied between 0.1 and 0.15 bar, whereas, when the flow-rate was increased to 900 ml/ min, the same permeate flux was obtained with less TMP adjustments (variation between 0.1 and 0.12 bar, Fig. 9b). In another experiment, we fixed the TMP in the beginning of the experiment, say at about 0.16 bar, and the variations in permeate flux were recorded. We observed (Fig. 9c) that the permeate flux decreased from 70 to about 45 1/hm 2 in 75 min of experiment and then it was stable.
When a similar experiment was made in the NB mode (Fig. 10, experiment 15) we found that it was difficult to control the constant permeate flux; the flux decreased from 50 to about 25 1/hm 2 in 2 h even when the TMP was continuously regulated from initially 0.1 bar to 0.2 bar at the 120th min. The permeate flux was found to be 100% more with baffle than without baffle

38 B.B. Gupta et al. / Journal of Membrane Science 99 (1995) 31~12
140 0.2
A J¢
<
E
120
100
80
60
40
20
(a) Q=600 m[/min, 4 helices, d = 3.1 mm
20
-0.18
-0.16
-0.14
-0.12
-0.1 ~ 1
-0.08 I,..,
-0.06
-0.04
~0.02
40 60 8]0 100 120 14 ° Time (minute)
140 , 0.2
A .1= oJ < E
=" E
:(b)
120-
100-
80-
60-
404
20
O~
Q= 900 ml/min, 4 helices, d = 3.1 mm
J
0.18
0.16
0.14
0.12 ~
0.1 ~ L
0.08
0.06
0.04
0.02
0 2'0 4'0 60 8'0 160 1'20 140
Tlme (minute)
0.3 14o (c)
120-
100-
N ~ I
20-
Q=900 ml/min, 4 helices, d = 3.1 mm -0.25
-0.2
-0.15 ~" a.
-0.1
-0.05
0 5O 100 150 20O 250 3O0 Time (minute)
Fig. 9. (a) TMP variations with time for constant-permeate flux experiments at a flow-rate of 600 ml/min. Yeast cell suspension 5% dry weight. (b) TMP variations with time for constant-permeate flux experiments at a flow-rate of 900 ml/min. Yeast cell suspension 5% dry weight. (c) Variations in permeate flux at constant TMP fixed in the beginning at a flow-rate of 900 ml/min. Yeast cell suspension
5% dry weight.
and also at a lower TMP in the case of a baffled membrane which was obtained by applying a pressure from the permeate side. These results are also con- firmed by the membrane resistance values calculated for each experiment and are given in Table 2 (will be discussed later).
3.5. Dodecane-water emulsion
The permeate flux values obtained from the 1000- ppm dodecane emulsion are shown in Fig. 11 at a flow- rate of 1200 ml /min and at different TMPs in the HB and NB modes (experiments 16 and 17, Table 1). It was found that the HB-mode fluxes were always higher than those of the NB mode at the same TMP. For example, at 0.8 bar the permeate flux was at least 50%
140-
120-
100-
40
20
0
Q=900 ml/min, no baffle
20 40 60 80 100 1;~0 140 Time (minute)
-0.25
0.2
0.15 ~
0.1
0.05
Fig. 10. TMP and permeate flux variations with time at a flow-rate of 900 ml/min in the NB mode. Yeast cell suspension 5% dry weight.
250 Q = 1200 ml/min
| - - 4 helices, d = 3.1 mm, Power = 1.0 W
2 0 0 ~ . ~ bar
15o~ ~o.s2b.r ~ J
o.~ ha L ~,~.32 b~ 50-
- - NB, Power = 0.22 W 0 o ~ 4o ~ e;o loo 12o 1~
Time (minute)
Fig. 11. Permeate flux variations at different TMPs in the NB and
HB modes for a dodecane emulsion.

B.B. Gupta et al. / Journal of Membrane Science 99 (1995) 31-42 3 9
-0.45
A ei 150. < i E i
I(XP
50
OI 0
250
(a) Q=1200 ml/min, NB
20 40 60 80 100 Time (minute)
/ ~,~-~-~ ~ -0.4
-0.35
I -0.3 ~"
-0.25 ¢b
- 0 2
0.15
0.1 TMP:O.45 bar
0.05
120 1,~0 I,~0 180 200
0.6
2OO
A 150 ̧
<
,oo 50
TMP=0.70 bar
0.5
0.4
0.3 v ¢k
0.2
, D.1
Q = 1000 ml/min, 4 helices, d = 3.1 mm
0 20 4'0 6'0 8[) 100 120 1~.0 160 180 2000 Time (minute)
Fig. 12. (a) Permeate flux measurements at constant TMP and con- stant flux fixed in the beginning of the NB mode for a dodecane emulsion. (b) Permeate flux measurements at constant TMP and constant flux fixed in the beginning of the HB mode for a dodecane emulsion.
more in the HB mode than in the NB mode. Two exper- iments were performed in the NB mode and two in the HB mode for obtaining a constant permeate flux at almost the same flow-rate and TMP. In the NB mode, when we regulated the TMP progressively in order to obtain a constant permeate flux, say at about 90 l / hm 2 (Fig. 12a), we found that the TMP varied from 0.3 to 0.4 bar (experiment 18) whereas, when the same type of experiment was repeated in the HB mode and the flux was maintained constant at a higher value, say at 1401/hm 2 (Fig. 12b), the TMP needed to be gradually adjusted between 0.44 and 0.58 bar (experiment 19) confirming that in the HB mode the permeate flux was about 50% more than that obtained in the NB mode at the optimum TMP. It was found that, when a higher TMP was applied at the beginning of the experiment, the permeate flux decreased continuously with time because of overfouling for both the NB and HB modes
(experiments 20 and 21 ). In the NB mode the permeate flux decreased from 130 to 72 l /hm 2 for a constant TMP of 0.45 bar (Fig. 12a) and in the HB mode the decrease was from 190 to 84 i / hm 2 for a constant TMP of 0.7 bar (Fig. 12b). Thus, in order to avoid over- fouling and to maintain a constant permeate flux it was necessary to increase the TMP gradually from a very low value to a suitable higher value and this could be done by applying a back-pressure from the permeate side to control the overall flux at a constant value. For the HB mode, the operation could be carried out at a higher TMP than for the NB mode without serious flux decline occurring.
4. Discussion
The water permeabili ty of a clean membrane was initially determined at a flow-rate of 600 ml /min (30°C) and at various TMPs. The clean membrane r e s i s t a n c e Rme (membrane resistance before use) was found to be about 250. | 0 7 m - l at a TMP of 0.4 bar. In order to calculate different resistances we used an equation of the form [ 24] : J = T M P /
[tx(Rm+Rirre+Rre)] where /x is the viscosity of the s o l u t i o n , R m is the membrane resistance (obtained after cleaning), Ri~c is the resistance due to irreversible foul- ing like pore plugging and Rre is the resistance due to reversible fouling and concentration polarisation. For each experiment, when the experiment was over, we used the last permeate flux and TMP values to calculate
the total resistance R t ( R t = R m -t-Ri=e + Rr~). The filtra- tion unit was then rinsed by distilled water at 30°C five times ( 15 min for each rinsing) and the water perme- ability at 600 ml /min and at 0.4 bar TMP was meas- ured; this permeate flux provided the irreversible resistance value because of fouling, RI
(Rf = R m q- Nitre ) . The membrane was then cleaned with an Ultrasil 10 (2 g / l ) solution at 50°C for 30 min. The filtration unit was again rinsed with distilled water for five times ( 15 min each time) and the water permea- bility was measured at 600 ml /min and 0.4 bar. This time permeate flux provided the membrane resistance Rm. In Table 2 are listed all the different resistances from the first six experiments of Table 1. The different resistances were also compared with the initial clean membrane resistance Rmc; their values are given in Table 2. The comparison between the total resistance
40 B.B. Gupta et al. / Journal of Membrane Science 99 (1995) 31-42
after the experiment and clean water resistance revealed ratios of 3.52:6.68:7.35 for the HB, NB and RB modes, respectively, at a TMP of 0.5 bar and 4.7:7.8:9.4 at a TMP of 0.8 bar. Thus, in all cases this ratio is dependent on TMP. After complete cleaning the comparison between the regenerated membrane resistance and the clean water resistance revealed a ratio of 1.04:1.48:1.74 for the HB, NB and RB modes, respectively, at a TMP of 0.5 bar and 1.18:1.63:1.96 at a TMP of 0.8 bar. These values show that membrane fouling was least in the HB mode and greatest in the RB mode. In the HB mode the regeneration of membrane was almost 100% whereas for the other modes (NB or RB) the membranes were only partially regenerated, perhaps because of dense fouling in some of the pores. The relative contribution made by Rre and Rirre are shown in Table 2. The former is greatly reduced, and the latter somewhat reduced in the case of the HB-mode operation.
The flow field generated by the helical baffle prob- ably scours the surface of the membrane more than in the case of the NB and RB modes. The scouring in the HB mode may directly remove particles from the sur- face, thus reducing the Rre. Also, the mass transfer boundary layer thickness will be reduced, thus increas- ing the mass transfer away from the surface which will reduce the surface concentration. This reduction is probably responsible for the reduction in Ri,e.
The membrane resistances were also calculated from different experiments performed at very low TMPs, about 0.1-0.2 bar (experiments 14 and 15) in the HB and NB modes. The different resistances were calcu- lated in the same way as described above. The total resistance in the NB mode after the experiment was about 339.10 7 m - 1 and in the HB mode it was 220.10 7
m - ~. We found that in the HB mode the total membrane resistance was about the same as the clean water membrane resistance which means that the fouling was almost absent during experimentation. Hence, when experiments are performed at very low TMPs ( < 0.2 bar) using a helical baffle it was possible to obtain permeate fluxes that were nearly the same as for water.
The geometry of the helical baffle has been explored with respect to the number of helices per unit length for two rod diameters. The diameter of the steel wire has not been varied in these experiments and so, at present, it is not appropriate to say that the present configuration is optimal. Currently, numerical com- putational fluid dynamic calculations are being made
considering the three-dimensional asymmetric flow field incorporating helical baffles of different configu- rations. This will then be followed by further experi- mental work.
The photographs and video recording show that, because of the presence of a helical baffle in the membrane, the flow field became rotational within the baffle and the angle of rotation was related to the num- ber of turns over the length of the baffle. The flow visualization made in this study does not take into account the permeate volume passed through the membrane and its effect on the flow pattern. In case of microfiltration this was shown by Wang [25] to be insignificant. It should be noted that we observed no dead zones or stagnation regions. Vortices were appar- ently absent, even at high flow-rates. This work was done with a normal-speed video camera of 25 frames per second. Subsequent work [26] with a high-speed (400 frames per second) video camera (NAC high- speed video system, Rutherford Appleton Laboratory) has shown the evidence of secondary flow. We were able to distinguish three types of flow components. In Fig. 2, 1 indicates a tangential flow component in the space between the membrane surface and the helices and it represents a smaller fraction of the total flow, 2 represents the main part of the flow and it was rotational following the shape of helices and 3 represents a reverse flow component generated by secondary flow near the surface of the rod on the downstream side of the spiral. The flow near the surface of the membrane was gov- erned by a combination of the perimeter flow compo- nent and the helical flow. The result is a spiral motion of longer pitch.
Work with other membranes whose channels were smaller and different in shape is part of another project [27]. Experiments performed on the treatment of municipal waste water [27] using a 80-cm-long membrane module made of seven channels (star shape) of about 3 mm inner diameter with baffles (made by winding a plastic wire of 1 mm diameter on another plastic wire of 1 mm diameter) a permeate flux of about 150 l/hm 2 was obtained from an experiment of 10 h with a flow-rate of 500 l/h and a TMP of about 1.4 bar. The main point to note here is the feasibility of producing inserts to fit small-diameter channels.

B.B. Gupta et al. / Journal of Membrane Science 99 (1995) 31-42 41
5. Conclusions References
The helically baffled cross-flow microfiltration was found to be simple and effective. The manufacture of this baffle in metal or plastic is easy. Enhancement in permeate flux of more than 50% can be easily obtained at the same hydraulic dissipated power and without any additional equipment such as pulsating pump or any back-washing system. The experiments at very low TMPs of the order of 0.1-0.2 bar can provide a constant permeate flux even from the beginning of the filtration. Also, with the use of baffles it was possible to recover the initial membrane permeability without any diffi- culty.
List of symbols
d diameter of the rod of helical baffle (mm) J permeate flux (1/hm 2) P hydraulic dissipated power (W) Q feed flow-rate (ml/min) HB membrane with helical baffle NB membrane without baffle RB membrane with rod baffle P~ inlet pressure (bar) Pf permeate side pressure (bar) Po outlet pressure (bar) Rf membrane resistance because of fouling (m 1) R m membrane resistance after cleaning (m- l) Rt total membrane resistance ( m- l ) Rmc membrane resistance before use (m 1) Rr~ membrane resistance due to reversible fouling
(m-') Ri~e membrane resistance due to irreversible fouling
(m l) Vp permeate volume (1/m 2) TMP transmembrane pressure (bar) Ap pressure drop (bar) /z viscosity of the solution (Pa s)
Acknowledgements
The authors acknowledge with gratitude the support of the Science and Engineering Research Council (UK) Research Grants GR/J22956 and GR/J22887
[ 1 ] A.G. Fane. C.J.D. Fell and A. Suki, The effect ofpH and ionic environment on the ultrafiltration of protein solutions with retentive membranes, J. Membrane Sci., 16 (1983) 195.
[21 E. Mattiasson, The role of macromolecular adsorption in fouling of ultrafiltration membranes, J. Membrane Sci., 16 (1983) 23.
[3] H.B. Winzeler and G. Belfort, Enhanced performance for pressure-driven membrane process: the argument for fluid instabilities, J. Membrane Sci., 80 (1993) 35.
[4] G. Crozes. C. Anselme and J. Mallevialle, Effect of adsorption of organic matter on fouling of ultrafiltration membrane, J. Membrane Sci., 84 (1993) 61.
[5] R. Ben Amar, B.B. Gupta and M.Y. Jaffrin, Apple juice clarification using mineral membranes: Fouling control by backwashing and pulsatile flow, J. Food Sci., 55 (1990) 1620.
[61 G. G6san, G. Daufin, U. Merin, J.P. Labbe and A. Qu~merais, Fouling during constant flux crossflow microfiltration of pretreated whey. Influence of transmembrane pressure gradient, J. Membrane Sci., 80 (1993) 131.
171 B.B. Gupta, P. Blanpain and M.Y. Jaffrin, Permeate flux enhancement by pressure and flow pulsations in microfiltration with mineral membranes, J. Membrane Sci., 70 (1992) 257.
[8] T.J. Kennedy, R.L. Merson and B.J. McCoy, Improving permeation flux by pulsed reverse osmosis, Chem. Eng. Res. Des., 67 (1989) 278.
[9] C.D. Bertram, M.R. Hoogland, H. Li, R.A. Odell and A.G. Fane, Flux enhancement in crossflow microfiltration using a collapsible-tube pulsation generator, J. Membrane Sci., 84 (1993) 279.
[ 10] K.H. Kroner and V. Nissinen, Dynamic filtration of microbial suspensions using an axially rotating filter, J. Membrane Sci., 36 (1988) 85.
[ 111 T. Murase, E. lritani, P. Chidphong, K. Kano, K. Atsumi and M. Shirato, High-speed microfiltration using a rotating cylindrical ceramic membrane, Int. Chem. Eng., 31 (1991) 370.
[121 D.G. Thomas, Forced convection mass transfer in hyperfiltration at high fluxes, Ind. Eng. Chem. Fundam., 12 (1973) 396.
[13] J.W. Stairemand and B.J. Bellhouse, Mass transfer in a pulsating turbulent flow with deposition into furrowed walls, Int. J. Heat Mass Transfer, 27 (1985) 1405.
[ 141 S.M. Finnigan and J.A. Howell, The effect of pulsatile flow on ultrafiltration fluxes in a baffled tubular membrane system, Chem. Eng. Res. Des., 67 (1989) 278.
[ 15] M.R. Mackley, G.M. Tweddle and I.D. Wyatt, Experimental heat transfer measurements for pulsatile flow in baffled tubes, Chem. Eng. Sci., 45 (1990) 1237.
[ 16] C. Peri and W.L. Dunkley, Reverse osmosis of conage cheese whey, Influence of flow conditions, J. Food Sci., 36 (1971) 395.
[ 17] S. Poyen, F. Quemeneur and B. Bariou, Improvement of the flux of permeate in ultrafiltration by turbulence promoters, Int. Chem. Eng., 27 (1987) 441.
42 B.B. Gupta et al. / Journal of Membrane Science 99 (1995) 31-42
[ 18 ] D.G. Thomas, Enhancement of forced convection heat transfer coefficient using detached turbulence promoters, Ind. Eng. Chem. Process Design Dev., 6 (1967) 385.
[ 19] S.M. Finnigan, Pulsed flow ultrafiltration in baffled tubular membranes, Ph.D. Thesis, University of Bath, Bath, 1990.
[20] E.W. Pitera and S. Middleman, Convection promotion in tubular desalination membranes, Ind. Eng. Chem. Process Design Dev., 12 (1973) 52.
121 ] V. Mavrov, N.D. Nikolov, M.A. Islam and J.D. Nikolova, An investigation on the configuration of inserts in tubular
ultrafiltration module to control concentration polarisation, J.
Membrane Sci., 75 (1992) 197.
[22] M.E. Mackay, M.R. Mackley and Y. Wang, Oscillatory flow within tubes containing wall or central baffles, Cfhem. Eng. Res. Design, Trans. Ichem. E, 69 ( Part A) ( 1991 ) 506.
[231 Y. Wang, J.A. Howell, R.W. Field and M.R. Mackley, Oscillating flow within porous tubes containing wall or central baffles, Chem. Eng. Res. Design, Trans. Ichem. E, 72 (Part A) (1994) 686.
[241 G.B. Van Den Berg and C.A. Smolders, Flux decline in ultrafiltration processes, J. Membrane Sci., 77 (1990) 101.
[ 251 Y. Wang, Simulation of pulsatile flow in baffled permeable channel for membrane filtration system, Ph.D. Thesis, University of Bath, Bath, 1993.
[26] G.P.W. Way, Flow visualisation in baffled flow (research project report), School of Chemical Engineering, University of Bath, Bath, 1994.
[ 27 ] B.B. Gupta, J.A. Howell, Q. Gan and J.A. Scott, The use of a new type of turbulence promoter in the treatment of returned municipal activated sludge, Proc. Interfiltra 94, IDEXPO, Paris, Nov. 15-17, 1994, p. 260.


