Embed Size (px)
Citation preview
Refinery wastewater treatment by microfiltration and ultrafiltration membranes
Noreddine Ghaffour1,*, Jean Luc Negrel2, Rahim Jassim3 & Tahar Khir3
1 Middle East Desalination Research Center (MEDRC)
PO Box 21, Al-Khuwair, PC. 133, Muscat, Sultanate of Oman Tel. +968 695 351; Fax +968 697107; Email [email protected]
2 Université de Montpellier, Science et Technologie, Département de Génie des Procédés Place Eugène Bataillon, 34090 Montpellier, France
3 Jeddah College of Technology, Mechanical Engineering Department PO Box 42204, 21541 Jeddah, KSA
ABSTRACT The oil refineries produce wastewater containing oil and suspended solids (SS) with different concentrations. These effluents are in the flow-rate range between 500 and 1000 m3/h and treated by conventional processes. But the effluents obtained with these processes contain high concentrations of oil and SS than the International standards. Membrane processes such as microfiltration (MF) or ultrafiltration (UF) can be used to reduce these concentrations to accepted levels and this study focuses on optimizing the operating parameters of UF for treating these effluents. The tubular inorganic composite Carbosep membrane was selected for these studies among the tested membranes since it acts as a total barrier for the oil and gives highest water flux. A systematic study of the influence of the different operational parameters, in particular the cross-flow velocity in the membrane tube, the concentration of the retentate and the feed temperature was studied using a mixed suspension (MS) containing oil and biological solids sampled from an activated sludge plant. The importance of the feed water temperature was emphasized since it effects the droplet size distribution. The major limiting process conditions for fouling are determined and results are explained by the mean droplet size distribution. Aggregation processes of oil on the bacterial flocks were observed leading to larger particles with an optimal oil/SS ratio. It was found that the flux performances strongly depend on temperature with lower temperatures being preferable due to formation of large particles due to agglomeration leading to higher flux. Experimental data were fitted to a model of cake deposition with retroflux which take into account the different particle deposition phenomena in both transient and steady state fluxes. Keywords: Ultrafiltration; Barrier Membranes; Modeling; Mixed suspension, Water treatment 1. INTRODUCTION The oil refinery wastewater containing oil and SS is generally treated by conventional processes used by the refineries. The compositions of these effluents are as follows (Tab. 1): Table 1 Conventional processes used in the companies Process Composition Decantation 250 ppm oil and 110 ppm SS Flocculation and decantation 40 ppm oil and 25 ppm SS Biological treatment followed by flotation 20 ppm oil and 30 ppm SS

However, the new International standards require less than 5 ppm oil and less than 10 ppm SS in the effluent. Many membrane processes like MF or UF are able to achieve such standards, which is not possible by classical treatments. Nevertheless, the development of membrane processes for industrial wastewater treatment is hampered by the relatively low flux performances due to concentration polarization and fouling. Although there have been several studies of the membrane separation of oil/solvent in water emulsions, there is a lack of understanding of the basic phenomena which determine flux performance and oil rejection in these systems to an extent which could impede engineering developments. Many companies have initiated R&D program to enhance basic understanding of processes limitations. The cross-flow filtration has become a more attractive process in recent years owing to the advent of inorganic membranes [3]. Membrane technology covers a broad spectrum of pore sizes and materials. Membrane processes include MF, UF, nanofiltration (NF) and reverse osmosis (RO). MF and UF are in use on industrial scale to treat wastewaters, to concentrate milk and wine, in juice processing for clarification or in the concentration of latex particles. MF is particularly useful for the elimination of SS, bacteria, turbidity and microorganisms. UF is used to remove macromolecules, colloidal materials, viruses and constituents that have a larger molecular weight of greater than 10 000 Daltons. Since emulsion droplets are usually more than ten times the size of an average pore in a UF membrane, UF have been used for the removal of emulsions of oil from the effluents [11]. Several works have been reported using UF to treat oil emulsion wastewaters [11,12], but to the author knowledge, none has covered for suspensions containing oil and SS mixtures [7]. The first step towards the design of an efficient and economical treatment is selection of an appropriate membrane. From operational point of view, inorganic membranes are more suitable than organic one [6]. Therefore a tubular Carbosep membrane was selected for this study after it has proved to be a total barrier for the oil contained in a synthetic emulsion made with Arabic crude oil while giving the highest filtrate flux. A systematic study was conducted to study the influence of the different operational parameters on the transient and steady state flux using this membrane at different temperatures. The study focused on the parameters which limit the mass transfer when oil is the sole solute [13]. This work mainly concentrated on mixed suspensions containing oil and suspended solids simultaneously. 2. MATERIAL AND METHODS 2.1. Experimental unit The experimental unit, provided by the manufacturer Tech-Sep, is a 40 cm long and 6 mm diameter tubular Carbosep membrane operating in a closed loop, having provisions to recirculate the permeate and the retentate or both (Fig. 1). To maintain the homogeneity of the feed solution, the unstable emulsion was continuously stirred and thermoregulated in a storage tank. If the droplets are deposited on the tank walls or on the liquid surface, the emulsion was recirculated in the tank by a centrifugal pump. The duration of each experiment ranged between 70 and 80 minutes.

Centrifugal pump Pressure Manometers regulator Membrane module Flow-meter Permeate Feed Pump Thermo- regulation Feed Pretreatment Valves reservoir Valve Magnetic stirrer Fig. 1. Experimental unit. 2.2. Suspensions The suspensions are made with Arabic crude oil and the SS are collected from a settler of activated sludge plant. The oil and/or the solids are diluted to the required level with the settler supernatant. The suspension is continuously stirred and thermoregulated in a storage tank at a concentration corresponding to the required retentate concentration. The industrial effluent has a concentration ratio of SS/oil about 1,5 i.e. 20 ppm oil and 30 ppm SS from biological treatment followed by flotation. 2.3. Analysis Number of particles and the particle size distribution are determined by Malvern Mastersizer/E laser granulometer. Filtration flow-rate is determined by measuring the time required to collect a given filtrate volume. Dissolved organic carbon concentration is obtained after filtration through a 40 µm membrane and measurement with a TOC-meter 5000 Shimadzu. The analysis of the collected permeate is carried out with an oil content infrared analyzer OCMA-220 Horiba and with High Pressure Liquid Chromatography. 2.4. Membrane regeneration After each run, the membranes were regenerated by the following procedure:
- 30 min static washing with a 3% sodium hydroxide solution - Tap water static washing - 30 min static washing with a 3% in volume nitric acid solution - Tap water static washing
The initial water flux (tap water) of the membrane should be obtained after each regeneration to calculate the membrane resistance Rm.

3. RESULTS AND DISCUSSION 3.1. Membrane selection Two inorganic membranes were tested. MF membrane of 0.14 µm rated mean pore diameter and UF membrane of 300 000 Daltons cut-off, which corresponds to a pore size of 0.02 µm. At low concentration, no oil were detected in the permeate during the whole filtration run for the two tested membranes, oil is therefore fully rejected. This could be explained by the relatively high surface tension of the oil droplets that induces forces higher than the forces due to the applied pressure. However, for high concentration and high pressure; C>30% and ∆P>3 bars; the permeate contains around 100 ppm oil for the MF membrane but an absolutely limpid permeate was obtained without any traces of oil until the membrane became fully blocked for the UF membrane. Both membranes were a total barrier for the suspended solids. A typical decrease of the permeate flux was observed during the UF and MF operation before reaching a steady state after 70 minutes as shown in Fig. 2. The highest flux of about 200 l/h.m2 is obtained by the UF membrane. In the subsequent experiments, the UF membrane which gave maximum permeation flux and is a total barrier for oil was used.
0
100
200
300
400
500
600
5 10 15 20 25 30 35 40 45 50 55 60 65 70
Time (min)
Perm
eate
flux
(l/h
.m2)
MF membrane
UF membrane
Fig. 2. Permeation flux against time, 2 g/l, 25 oC, 2 bars, 1.2 m/s. 3.2. Influence of operating parameters on steady state flux 3.2.1. Temperature The presence of biological solids in oil emulsion increases the mean size of the particles as shown in figure 3a. At 35 oC, the mean size of oil droplets alone in suspension is 2 µm whereas the biological solids alone have a mean size of 60 µm and is independent of the temperature; in the mixed suspension, the mean size becomes 80 µm (Tab. 2). Microscopic observations showed that there is an agglomeration of oil droplets on the biological particles, which tend to flocculate, leading to clusters whose size is itself independent of temperature.
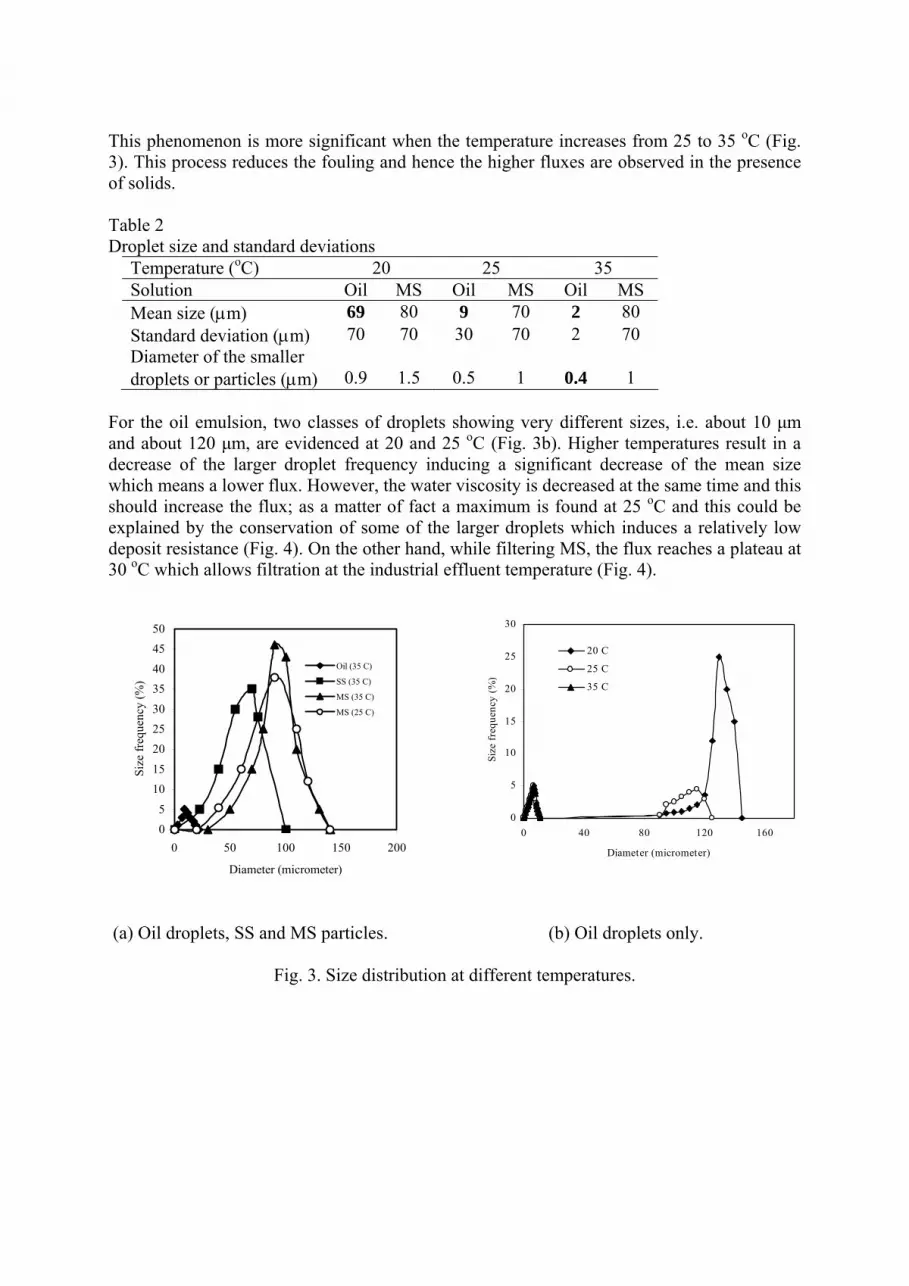
This phenomenon is more significant when the temperature increases from 25 to 35 oC (Fig. 3). This process reduces the fouling and hence the higher fluxes are observed in the presence of solids. Table 2 Droplet size and standard deviations
Temperature (oC) 20 25 35 Solution Oil MS Oil MS Oil MS Mean size (µm) 69 80 9 70 2 80 Standard deviation (µm) 70 70 30 70 2 70 Diameter of the smaller droplets or particles (µm)
0.9
1.5
0.5
1
0.4
1
For the oil emulsion, two classes of droplets showing very different sizes, i.e. about 10 µm and about 120 µm, are evidenced at 20 and 25 oC (Fig. 3b). Higher temperatures result in a decrease of the larger droplet frequency inducing a significant decrease of the mean size which means a lower flux. However, the water viscosity is decreased at the same time and this should increase the flux; as a matter of fact a maximum is found at 25 oC and this could be explained by the conservation of some of the larger droplets which induces a relatively low deposit resistance (Fig. 4). On the other hand, while filtering MS, the flux reaches a plateau at 30 oC which allows filtration at the industrial effluent temperature (Fig. 4).
05
1015
202530
3540
4550
0 50 100 150 200
Diameter (micrometer)
Size
freq
uenc
y (%
)
Oil (35 C)
SS (35 C)
MS (35 C)
MS (25 C)
0
5
10
15
20
25
30
0 40 80 120 160
Diameter (micrometer)
Size
freq
uenc
y (%
)
20 C
25 C
35 C
(a) Oil droplets, SS and MS particles . (b) Oil droplets only.
Fig. 3. Size distribution at different temperatures.
50
100
150
200
250
10 20 30 40 50
Temperature (C)
Stea
dy st
ate
flux
(l/h.
m2)
Oil
MS
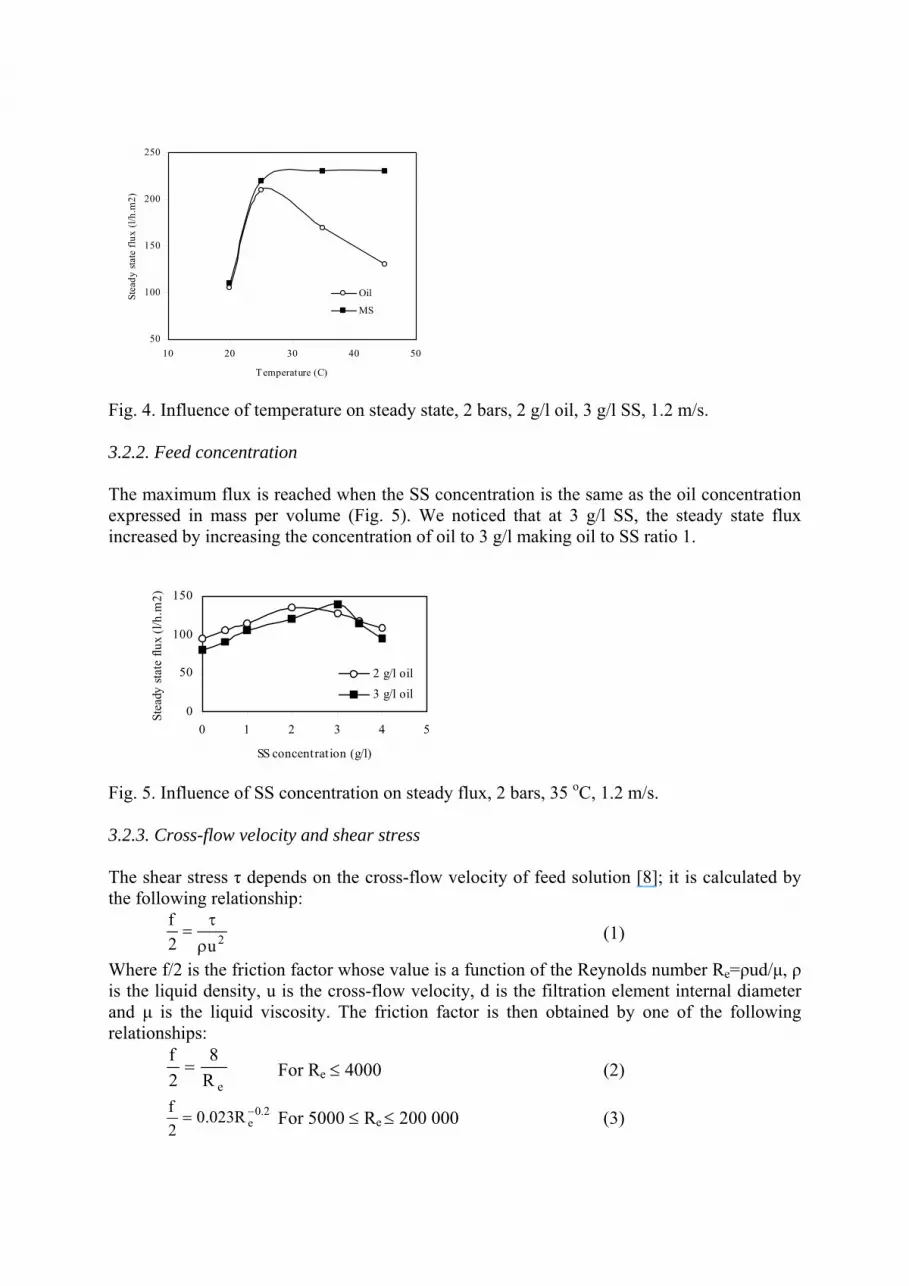
Fig. 4. Influence of temperature on steady state, 2 bars, 2 g/l oil, 3 g/l SS, 1.2 m/s. 3.2.2. Feed concentration The maximum flux is reached when the SS concentration is the same as the oil concentration expressed in mass per volume (Fig. 5). We noticed that at 3 g/l SS, the steady state flux increased by increasing the concentration of oil to 3 g/l making oil to SS ratio 1.
0
50
100
150
0 1 2 3 4 5
SS concentration (g/l)
Stea
dy st
ate
flux
(l/h.
m2)
2 g/l oil3 g/l oil
Fig. 5. Influence of SS concentration on steady flux, 2 bars, 35 oC, 1.2 m/s. 3.2.3. Cross-flow velocity and shear stress The shear stress τ depends on the cross-flow velocity of feed solution [8]; it is calculated by the following relationship:
2u2f
ρτ
= (1)
Where f/2 is the friction factor whose value is a function of the Reynolds number Re=ρud/µ, ρ is the liquid density, u is the cross-flow velocity, d is the filtration element internal diameter and µ is the liquid viscosity. The friction factor is then obtained by one of the following relationships:
eR8
2f= For Re ≤ 4000 (2)
2.0eR023.0
2f −= For 5000 ≤ Re ≤ 200 000 (3)

The experimental data plotted in figure 6 for the steady state flux versus shear stress shows that a plateau is reached at shear stress of 5 Pascal irrespective of biological solids concentration. The flux with oil only is less than that of MS feed. There is therefore some irreversibility of the oil deposit, which cannot be transported towards the bulk flow of liquid by hydrodynamic effects. This phenomenon can be overcome with oleo-phobic membranes. As shown in figure 7, the steady state flux increases when the cross-flow velocity is increased and reaches a plateau at about 2.2 m/s corresponding to a Reynolds number of 12.103, which is a turbulent regime.
0
50
100
150
200
0 5 10 15 20 25
Shear stress (pascal)
Stea
dy st
ate
flux
(l/h.
m2)
Oil MS
Fig. 6. Steady state flux against shear stress.
0
20
40
60
80
100
120
0 0.5 1 1.5 2 2.5 3 3.5 4 4.5
Cross-flow velocity (m/s)
Stea
dy st
ate
flux
(l/h.
m2)
1 Bar1.5 bars2 bars
Fig. 7. Steady state flux against cross-flow velocity.
3.2.4. Driving pressure Interestingly same value of plateau of steady state flux against transmembrane pressure was found for oil and SS alone. But with the mixture of SS and oil, this value increases in spite of the increasing of the concentration (Fig. 8). This can be explained by the fact that the droplets agglomerate on the biological particles, which tend to flocculate increasing thus the particle sizes and giving higher fluxes. The steady state flux value for the oil filtration is higher than the SS with the same concentration. This strange observation can be explained that the coalescence phenomenon on the membrane surface is more significant than the particle flocculation.
0
50
100
150
200
250
0 1 2 3
Pressure (bar)
Stea
dy st
ate
flux
(l/h.
m2)
4
Oil
SS
MS
Fig. 8. Steady sate flux against transmembrane pressure, 1.2 m/s, 35 oC.
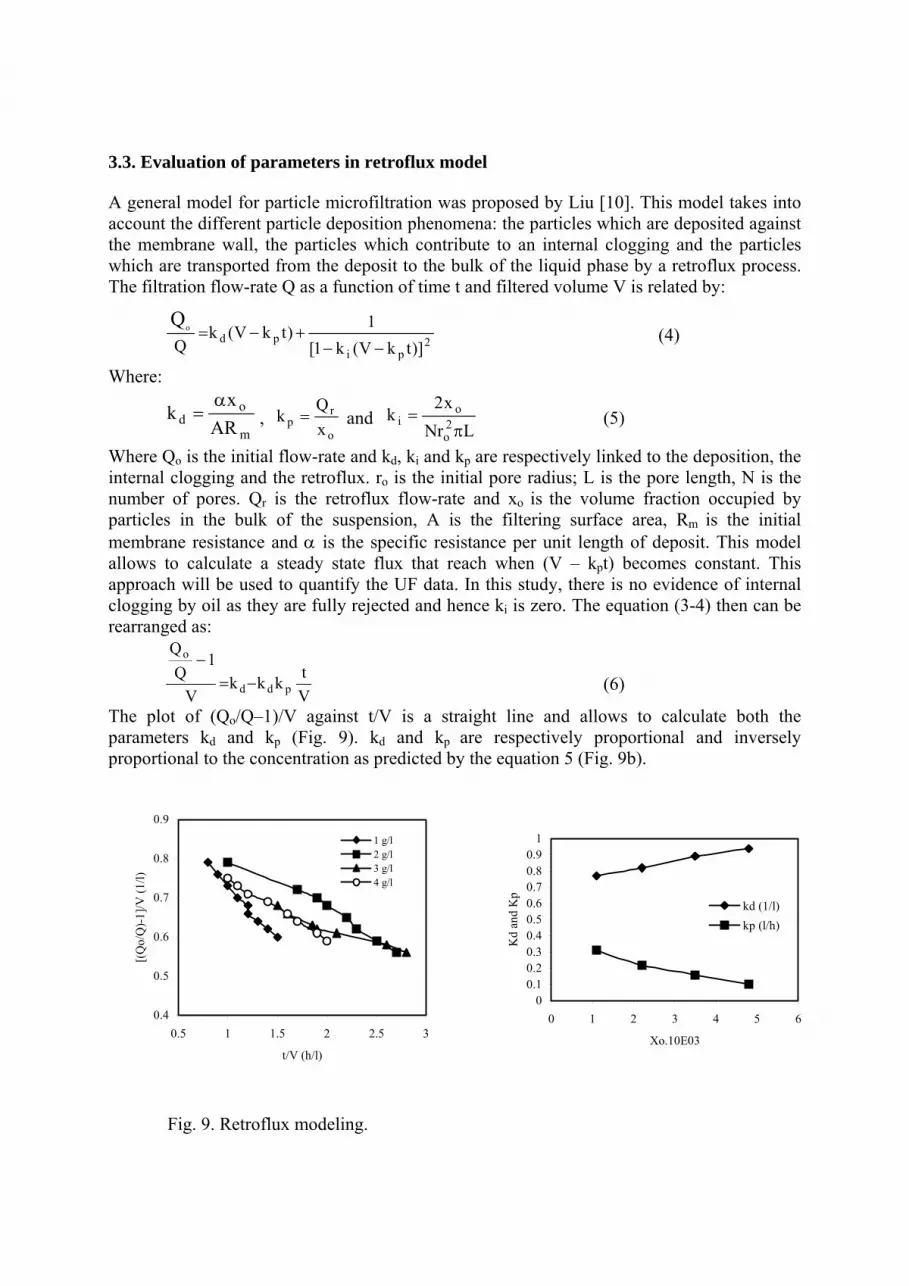
3.3. Evaluation of parameters in retroflux model A general model for particle microfiltration was proposed by Liu [10]. This model takes into account the different particle deposition phenomena: the particles which are deposited against the membrane wall, the particles which contribute to an internal clogging and the particles which are transported from the deposit to the bulk of the liquid phase by a retroflux process. The filtration flow-rate Q as a function of time t and filtered volume V is related by:
2pi
pd)]tkV(k1[
1)tkV(kQQo
−−+−= (4)
Where:
m
od AR
xk
α= ,
o
rp x
Qk = and
LNrx2
k 2o
oi
π= (5)
Where Qo is the initial flow-rate and kd, ki and kp are respectively linked to the deposition, the internal clogging and the retroflux. ro is the initial pore radius; L is the pore length, N is the number of pores. Qr is the retroflux flow-rate and xo is the volume fraction occupied by particles in the bulk of the suspension, A is the filtering surface area, Rm is the initial membrane resistance and α is the specific resistance per unit length of deposit. This model allows to calculate a steady state flux that reach when (V – kpt) becomes constant. This approach will be used to quantify the UF data. In this study, there is no evidence of internal clogging by oil as they are fully rejected and hence ki is zero. The equation (3-4) then can be rearranged as:
Vtkkk
V
1Q
Q
pdd
o
−=−
(6)
The plot of (Qo/Q–1)/V against t/V is a straight line and allows to calculate both the parameters kd and kp (Fig. 9). kd and kp are respectively proportional and inversely proportional to the concentration as predicted by the equation 5 (Fig. 9b).
0.4
0.5
0.6
0.7
0.8
0.9
0.5 1 1.5 2 2.5 3
t/V (h/l)
[(Q
o/Q
)-1]
/V (1
/l)
1 g/l2 g/l3 g/l4 g/l
Fig. 9. Retroflux modeling.
00.10.20.30.40.50.60.70.80.9
1
0 1 2 3 4 5 6
Xo.10E03
Kd
and
Kp
kd (1/l)kp (l/h)

The retroflux flow-rate Qr of oil emulsion remains steady between 20 and 45 oC, due to the droplet coalescence process on the membrane surface while a lower viscosity increases the retroflux in the case of MS (Fig. 10). Retroflux flow-rate is independent of pressure for oil emulsion but decreases when the pressure increases for MS. This can be linked with an increase of the particle volume fraction which can be transported from the deposit to the bulk of the liquid phase (Fig. 11). On the other hand, the retroflux flow-rate is a decreasing function of the cross-flow velocity (Fig. 12). This apparently surprising result can be due to the irreversible deposit of a particle layer and the incompressibility of increasing the flux by increase of the shear stress (Fig. 6).
0
1
2
3
4
5
20 25 35 45
Temperature (C)
Retro
flux
flow
-rat
e.10
E03
(l/h)
Oil
MS
Fig. 10. Retroflux flow-rate Vs temperature.
0
0.5
1
1.5
2
2.5
3
3.5
4
1 1.5 2 2.5
Pressure (bar)
Retro
flux
flow
-rat
e.10
E03
(l/h)
Oil
MS
Fig. 11. Retroflux flow-rate Vs pressure.
0
0.5
1
1.5
2
2.5
3
3.5
4
0.7 0.9 1.2
Cross-flow velocity (m/s)
Retro
flux
flow
-rat
e.10
E03
(l/h)
Oil
MS
Fig. 12. Retroflux flow-rate Vs cross-flow velocity. 4. CONCLUSIONS
1. UF membrane produces permeate free of oil and SS under any operational conditions. 2. The oil droplets agglomerate on the biological solids maximizing the flux when a
stoichiometric ratio is reached. 3. For any feed concentration the maximum flux is obtained when the oil/SS ration is
equal 1.

4. The flux curves can be modeled by a deposition process associated with a retroflux towards the bulk of the liquid phase.
5. The transient and steady sate fluxes are satisfactorily quantified. 6. For the same concentrations, the steady state flux of oil is higher than the SS one
although the particle sizes are larger than the droplets one. The droplets coalescence phenomenon is more significant than the particles flocculation.
REFERENCES [1] Aimar P. and Sanchez V., 1986, “A novel approach to transfer limiting phenomena
during ultrafiltration of macromolecules”, Ind. Eng. Chem. Fundam., 25, 789 [2] Anderson G.K., Saw C.B.and Le M.S. 1987, “oil/water separation with surface modified
membranes”, Environ Tech. Lett., 8, 75 [3] Assadi M., White D.A., 1992, “A model for determining the steady state flux of
inorganic microfiltration membranes”, Chem. Eng. J., 48, 11-16 [4] Audinos R., 1988, “Les bases théoriques de l’ultrafiltration, Techniques Séparatives par
Membranes”, ph. D. thesis, Toulouse, France [5] Chudacek M.W., Fane A.G., 1984, “The dynamics of polarization in unstirred and
stirred ultrafiltration”, J. Membrane Sci., 21, 145-160 [6] Elmaleh S. and Ghaffor N., 1996, “Upgrading oil refinery effluents by cross-flow
ultrafiltration”, Wat. Sci. Tech., vol. 34, N.9, 231-238 [7] Elmaleh S. and Ghaffor N., 1996, “Cross-flow ultrafiltration of hydrocarbons and
biological solid mixed suspensions”, Journal of Membrane Science 118, 111-120 [8] Gupta B.B., Field R.W., Howell J.A., Wu D., 1994, “Helically baffled cross-flow
microfiltration”, Engineering of Membrane Processes II, Il Ciocco, Italy [9] Le Goff P., 1979, Energétique Industrielle, Volume 1, Technique & documentation,
Paris, France [10] Liu Ming Gang, 1992, “Etude de la texture des Membranes et de leur Interaction avec
des Suspensions au cours d’une filtration dynamique”, ph. D. Thesis, Compiène, France [11] Marianne N., 1991, “Ultrafiltration of O/W emulsions stabilized by limiting amounts of
tall oil”, Colloids and Surfaces, 57, 99-114 [12] Michal B. and Krystyna K., 1992, “The use of ultrafiltration membranes made of
various polymers in the treatment of oil-emulsion wastewaters”, Waste Management, Vol. 12, 75-84
[13] VillarroelI Lopez R., Elmaleh S., Ghaffour N., 1994, “Cross-flow ultrafiltration of hydrocarbon emulsions”, Engineering of Membrane Processes II, Il ciocco, Italy
[14] Wiley D.E., Fell C.J.D. and Fane A.G., 1985, “Optimization of membrane module design for brackish water desalination, Desalination, 52, 249
[15] Yiantsios S.G. and Karabelas A.J., “Colloidal fouling of desalination membranes and fouling indices”, IDA World Congress on Water Desalination and Reuse, Manama, Bahrain, 2002