Embed Size (px)
Citation preview
BioMed CentralBMC Bioinformatics
ss
Open AcceResearch articleA generic algorithm for layout of biological networksFalk Schreiber*1,2, Tim Dwyer3, Kim Marriott4 and Michael Wybrow4Address: 1Leibniz-Institute of Plant Genetics and Crop Plant Research (IPK), Corrensstrasse 3, D-06466 Gatersleben, Germany, 2Institute of Computer Science, Martin Luther University Halle-Wittenberg, Von-Seckendorff-Platz 1, D-06120 Halle, Germany, 3Microsoft Research, Seattle, USA and 4Clayton School of Information Technology, Monash University, Vic 3800, Australia
Email: Falk Schreiber* - [email protected]; Tim Dwyer - [email protected]; Kim Marriott - [email protected]; Michael Wybrow - [email protected]
* Corresponding author
AbstractBackground: Biological networks are widely used to represent processes in biological systemsand to capture interactions and dependencies between biological entities. Their size andcomplexity is steadily increasing due to the ongoing growth of knowledge in the life sciences. Toaid understanding of biological networks several algorithms for laying out and graphicallyrepresenting networks and network analysis results have been developed. However, currentalgorithms are specialized to particular layout styles and therefore different algorithms are requiredfor each kind of network and/or style of layout. This increases implementation effort and meansthat new algorithms must be developed for new layout styles. Furthermore, additional effort isnecessary to compose different layout conventions in the same diagram. Also the user cannotusually customize the placement of nodes to tailor the layout to their particular need or task andthere is little support for interactive network exploration.
Results: We present a novel algorithm to visualize different biological networks and networkanalysis results in meaningful ways depending on network types and analysis outcome. Our methodis based on constrained graph layout and we demonstrate how it can handle the drawingconventions used in biological networks.
Conclusion: The presented algorithm offers the ability to produce many of the fundamentalpopular drawing styles while allowing the exibility of constraints to further tailor these layouts.
BackgroundNetworks play a central role in biological investigation oforganisms. They are used to represent processes in biolog-ical systems and to capture interactions and dependenciesbetween biological entities such as genes, transcripts, pro-teins and metabolites. One large application area for net-work-centered analysis and visualization is SystemsBiology, an increasingly important research field whichaims at a comprehensive understanding and remodelingof the processes in living beings [1,2]. Due to the steady
growth of knowledge in the life sciences such networks areincreasingly large and complex. To tackle this complexityand help in analyzing and interpreting the complicatedweb of interactions meaningful visualizations of biologi-cal networks are crucial.
Methods for automatic network visualization have gainedincreased attention from the research community overrecent years and various layout algorithms have beendeveloped, e. g. [3-11]. Often standard layout methods
Published: 12 November 2009
BMC Bioinformatics 2009, 10:375 doi:10.1186/1471-2105-10-375
Received: 22 March 2009Accepted: 12 November 2009
This article is available from: http://www.biomedcentral.com/1471-2105/10/375
© 2009 Schreiber et al; licensee BioMed Central Ltd. This is an Open Access article distributed under the terms of the Creative Commons Attribution License (http://creativecommons.org/licenses/by/2.0), which permits unrestricted use, distribution, and reproduction in any medium, provided the original work is properly cited.
Page 1 of 12(page number not for citation purposes)

BMC Bioinformatics 2009, 10:375 http://www.biomedcentral.com/1471-2105/10/375
such as force directed [12,13], layered [14,15] and circular[16] approaches are used to draw these networks. How-ever, the direct use of standard layout methods is some-what unsatisfactory since biological networks often havespecialized layout requirements reflecting the drawingconventions historically used in manually laid out dia-grams (which have been developed to better emphasizerelevant biological relationships and concepts). This hasled to the development of network- and application-spe-cific layout algorithms, for example, for signal transduc-tion maps [17,18], protein interaction networks [3,6],metabolic pathways [4,10,19] and protein-domain inter-action networks [20]. Advanced solutions combine differ-ent layout styles (such as linear, circular and branchinglayouts) for sub-networks or use specific layouts styles forparticular network parts such as cycles [7,10,21].
However, current approaches for the automatic visualiza-tion of biological networks have four major drawbacksresulting from the specialized nature of these algorithms:
1. Different kinds of biological networks (e. g. proteininteraction or metabolic networks) have different lay-out conventions and this requires the implementationand sometimes development of specialized layoutalgorithms for each convention.
2. It is not easy to combine networks with differentlayout conventions in the one drawing since the lay-out algorithms use quite different approaches and socannot be easily combined.
3. The user cannot tailor the standard layout algo-rithms for their particular need or task by e. g. empha-sizing the pathways of interest by making themstraight.
4. The algorithms do not sufficiently support interac-tive network exploration. Usually with these algo-rithms small modifications in the network structureand re-layout of the network results in very differentpictures. However, such sudden and large changesdestroy the user's mental map (i. e. the user's under-standing of the network based on the previous view)and therefore hinder interactive understanding of thenetwork.
Here we present a new algorithm for layout of biologicalnetworks that overcomes these limitations. It is based ona powerful new graph drawing technique, constrainedgraph layout [22]. Like force-directed layout [12,13] con-strained graph layout works by minimizing an objectivefunction that measures the quality of the layout. Howeverit extends force-directed layout by allowing minimizationof the objective to be done subject to placement con-
straints on the objects in the network. This is achieved byusing mathematically rigorous optimization techniquesbased on gradient projection [23]. Efficient implementa-tion is made possible by restricting the placement con-straints to be separation constraints of the form u + g ≤ (=)v, enforcing a minimum (or precise) gap g between thepositions u and v of pairs of objects in either the x or ydimensions of the drawing.
A significant contribution of this paper is to show thatseparation constraints, despite their apparent simplicityand their limitation to act on a single dimension can infact be used to encode the wide variety of specialized lay-out requirements arising in biological networks. Examplesof such requirements are placement of nodes below othernodes in directed graphs, drawing cycles on a rectangle,alignment of nodes, non-overlap of nodes, orthogonalordering between nodes, containment of nodes in clus-ters, standard layout of motifs and containment in a page.A key technique is to generate separation constraints thatapproximate complex non-linear constraints such as non-overlap and to update this approximation dynamically asthe final layout is computed. Furthermore, these separa-tion constraints can be automatically derived from the vis-ualization requirements, network analysis results andinteractive network changes. With this algorithm it is pos-sible to obtain layout results which are close to the resultsof different existing layout algorithms.
The presented approach provides a generic, universalalgorithm for layout of biological networks:
1. It greatly simplifies the implementation of layoutmethods for life sciences, systems and synthetic biol-ogy tools, which have previously had to utilize verydifferent layout algorithms for different types of bio-logical networks (or different layout requirements).
2. It allows the use of different layout styles for differ-ent parts of one large network.
3. It allows the user to customize the layout by addingseparation constraints.
4. It lends itself to mental-map-preserving dynamiclayout in interactive systems, thereby supporting inter-active exploration of large and complex networks.
This paper is structured as follows: in the Methods sectionwe introduce some terminology, detail the constrainedgraph layout method, present the kinds of placement con-straints that are needed to fulfill layout requirements ofdifferent biological networks and discuss how they can beautomatically generated and then implemented in termsof the separation constraints supported by the layout
Page 2 of 12(page number not for citation purposes)
BMC Bioinformatics 2009, 10:375 http://www.biomedcentral.com/1471-2105/10/375
method. The Results section provides examples of the lay-out method for a number of different kinds of networksand shows its advantages over current layout methods.Finally, the Conclusion contains the discussion and somesuggestions for future work.
MethodsLayout FrameworkThe layout problemA network (or graph) G = (V, E) contains a finite set ofnodes V and a finite set of edges E ⊆ {(u, v) | u, v ∈ V}.Biological networks can contain undirected and/ordirected interactions. Therefore we consider undirected,directed and mixed graphs, and an edge may be undi-rected or directed. A layout L of a network G assigns coor-dinates to the nodes and a path to each edge. A partiallayout P = (x, y) of a network G consists of just an assign-ment of node positions, where (xu, yu) is the position ofnode u. While we focus on 2D layout our method can beeasily extended to 3D layout.
The basic approach in constrained graph layout (likeforce-directed layout) for finding aesthetically pleasingdrawings of graphs is to define a cost function F(P) over thepositions of the nodes P and then to minimize this costfunction by adjusting the positions. One commonly usedcost function in force-directed layout is the stress function[24]:
where . This tries to place each pair of nodes u,
v their ideal distance apart duv which is proportional to the
length of the shortest path between the nodes). It meas-ures the sum of squared differences between the idealspacing for each pair of nodes and their Euclidean dis-tance in the layout. While this is the cost function we haveused, we wish to emphasize that our technique is genericin the choice of cost function.
The main difference between force-directed layout andconstrained graph layout is that in constrained graph lay-out the layout algorithm is required to satisfy placementconstraints on the nodes, such as non-overlap of the nodesor node alignment. We say that a layout is feasible if it sat-isfies the placement constraints.
The layout problem is to find a layout L for a graph G thatis feasible and which is locally optimal in the sense thatmoving the nodes slightly either leads to infeasibility orincreases the cost function.
Layout methodThe basic layout method has three main steps (as shownin Figure 1):
1. Find a feasible partial layout Pfeas satisfying all place-ment constraints.
2. Starting from Pfeas perform gradient projection tofind a locally optimal partial layout Popt.
3. Extend Popt to a full layout L by computing paths foredges.
Step 1 (find-feasible-position, see Figure 2) starts with aninitial position (x, y) for the nodes found by a force-directed layout method since this gives a reasonable"default" position for the nodes that reflects the basicgraph structure. This position is then iteratively updatedwith a greedy heuristic, so as to satisfy more and more ofthe placement constraints.
Here G is the graph, C is the set of constraints and Cx andCy are sets of separation constraints (for the x and y dimen-sion, resp.) that enforce the placement constraintsenforced so far. The function approximate(c, (x, y)) returnspairs of sets of separation constraints ci and their respec-tive dimension dimi that will enforce satisfaction of theviolated constraint c. Each ci implies the placement con-straint and the first ci that can be added while maintainingfeasibility is chosen. In the case that all ci lead to infeasi-bility none is added and the constraint c is effectivelyignored.
The function project returns positions for nodes which sat-isfy the separation constraints and which are as close aspossible to the current position. Projection is performedon a single dimension at a time. This is possible since theseparation constraints for each dimension are independ-ent. More precisely, project(d, C) returns x = minxΣv∈V (xv -dv)2 subject to C. This is done using the algorithm from[25].
Step 2 (improve, see Figure 3) takes an initial position P =(x, y) for the nodes, a set of placement constraints C and acost function F. It works by alternately adjusting horizon-tal and vertical positions of all nodes to incrementallyreduce the cost function. Again this is possible because theseparation constraints in each dimension are independ-ent. This makes the computation of the new positionsconsiderably simpler than if both dimensions had to beconsidered together. The high-level algorithm is given inFigure 3.
The adjustment step in each dimension is performed bygradient-projection-x and gradient-projection-y. We only con-
w d x y x yuv uv u u v v
u v V
( ||( , ),( , ) ||)−< ∈∑ 2
(1)
wuvduv
= 12
Page 3 of 12(page number not for citation purposes)

BMC Bioinformatics 2009, 10:375 http://www.biomedcentral.com/1471-2105/10/375
sider gradient-projection-x since the two routines areentirely symmetric. The routine gradient-projection-xdecreases the cost function F by moving nodes horizon-tally in the direction of steepest descent from the currentnode position (xcur, ycur). Computation of the step sizedepends on the cost function. However we have had suc-cess by simply using a quadratic approximation based onthe second order Taylor series expansion of F around xand choosing the value of the step size that minimizes thisapproximation.
Of course the desired horizontal position for the nodes isnot guaranteed to satisfy the placement constraints. Toremedy this the algorithm generates a set of horizontalseparation constraints Cx from the placement constraintsC that safely approximate the placement constraints in thesense that Cx(x) ⇒ C(x, ycur) and xcur satisfies Cx. The newhorizontal position x is obtained by calling project to pro-jecting the desired position d on to Cx.
Layout steps: Our layout method involves taking an (a) initial layout, (b) Finding a feasible layout that satisfies all the place-ment constraints, and performing gradient projection to pro-duce (c) a final optimized layoutFigure 1Layout steps: Our layout method involves taking an (a) initial layout, (b) Finding a feasible layout that sat-isfies all the placement constraints, and performing gradient projection to produce (c) a final optimized layout. This gene regulatory network has two bi-fan motifs drawn similarly and one path emphasized via constraints.
Procedure find-feasible-position (C - set of constraints, G - graph); see text for detailsFigure 2Procedure find-feasible-position (C - set of constraints, G - graph); see text for details.
procedure find-feasible-position(𝐶,𝐺)(𝑥, 𝑦) ← initial-layout(𝐺)𝐶𝑥, 𝐶𝑦 ← ∅for each constraint 𝑐 ∈ 𝐶 in order of priority/violation do
[(𝑐1, 𝑑𝑖𝑚1), ..., (𝑐𝑚, 𝑑𝑖𝑚𝑚)] ← approximate(𝑐, (𝑥, 𝑦))for 𝑖 ← 1, ..,𝑚 do
if 𝑑𝑖𝑚𝑖 = 𝑥 and satisfiable(𝐶𝑥 ∪ 𝑐𝑖) then𝐶𝑥 ← 𝐶𝑥 ∪ 𝑐𝑖𝑥 ← project(𝑥,𝐶𝑥)break
else if 𝑑𝑖𝑚𝑖 = 𝑦 and satisfiable(𝐶𝑦 ∪ 𝑐𝑖) then𝐶𝑦 ← 𝐶𝑦 ∪ 𝑐𝑖𝑦 ← project(𝑦, 𝐶𝑦)break
end for
end for
return (𝑥, 𝑦)
Procedure improve ((x, y) - initial position for the nodes, F - cost function, C - set of constraints); see text for detailsFigure 3Procedure improve ((x, y) - initial position for the nodes, F - cost function, C - set of constraints); see text for details.
procedure improve((𝑥, 𝑦), 𝐹, 𝐶)repeat
(𝑥𝑐𝑢𝑟, 𝑦𝑐𝑢𝑟) ← (𝑥, 𝑦)𝑥 ← gradient-projection-x((𝑥, 𝑦), 𝐹, 𝐶)𝑦 ← gradient-projection-y((𝑥, 𝑦), 𝐹, 𝐶)
until ∣𝐹 (𝑥𝑐𝑢𝑟, 𝑦𝑐𝑢𝑟)− 𝐹 (𝑥, 𝑦)∣ is sufficiently smallreturn (𝑥, 𝑦)
Page 4 of 12(page number not for citation purposes)

BMC Bioinformatics 2009, 10:375 http://www.biomedcentral.com/1471-2105/10/375
In Step 3 edges can be drawn using straight-lines or anyother desired style such as poly-line routings [26,27]. Wenote that the edge-routing library libavoid whichimplements the method described in [27] has beenextended to handle clusters and finds routes for edges thatdo not unnecessarily pass through clusters. It can also per-form "nudging" on the final routes to separate paths withshared sub-routes.
Placement ConstraintsIn this section we show that our approach of dynamicallygenerating separation constraints is very powerful and
supports the kinds of placement constraints arising in bio-logical networks. We then discuss which placement con-straints are used for different layouts and how theseconstraints can be derived from biological (network)information.
Figure 4 gives a general idea of how constraints can beused to arrange network elements. For example, parts ofreactions such as enzymes and co-reactants should beclose together and are clustered into non-overlappingreaction groups, where all nodes are aligned within thegroup. The nodes are arranged such that the reactions flow
A metabolic pathway arranged with standard drawing conventions emphasized using various constraintsFigure 4A metabolic pathway arranged with standard drawing conventions emphasized using various constraints. Met-abolic pathways show chemical reactions occurring within a cell.
Page 5 of 12(page number not for citation purposes)

BMC Bioinformatics 2009, 10:375 http://www.biomedcentral.com/1471-2105/10/375
in a particular direction as much as possible. Note thatthese high-level constraints are internally represented bysets of separation constraints.
The following placement constraints are major examplesof high-level constraints which can be solved by our algo-rithm.
Pathway emphasisOften some paths within a network are of special interest.These can be emphasized by using separation constraintsto horizontally or vertically align the nodes in the path-way (as shown in Figure 1). For example, in a metabolicnetwork the path with the highest flux may be determinedby computational (e. g. Flux Balance Analysis [28]) orexperimental methods and then automatically high-lighted in this manner.
Directed edgesOften networks contain directed edges, and edge directionis used to encode flow of information or material. Direc-tion of edges can be emphasized by constraints requiringthat the start node of the edge is above (or to the left of)its end node. See Figures 4 and 5(a) for examples. Theinformation about edge direction can be derived from adirected network by first removing cycles in the networkusing a decycling algorithm [29] and than using the direc-tion of the edges in the acyclic directed network as con-straints.
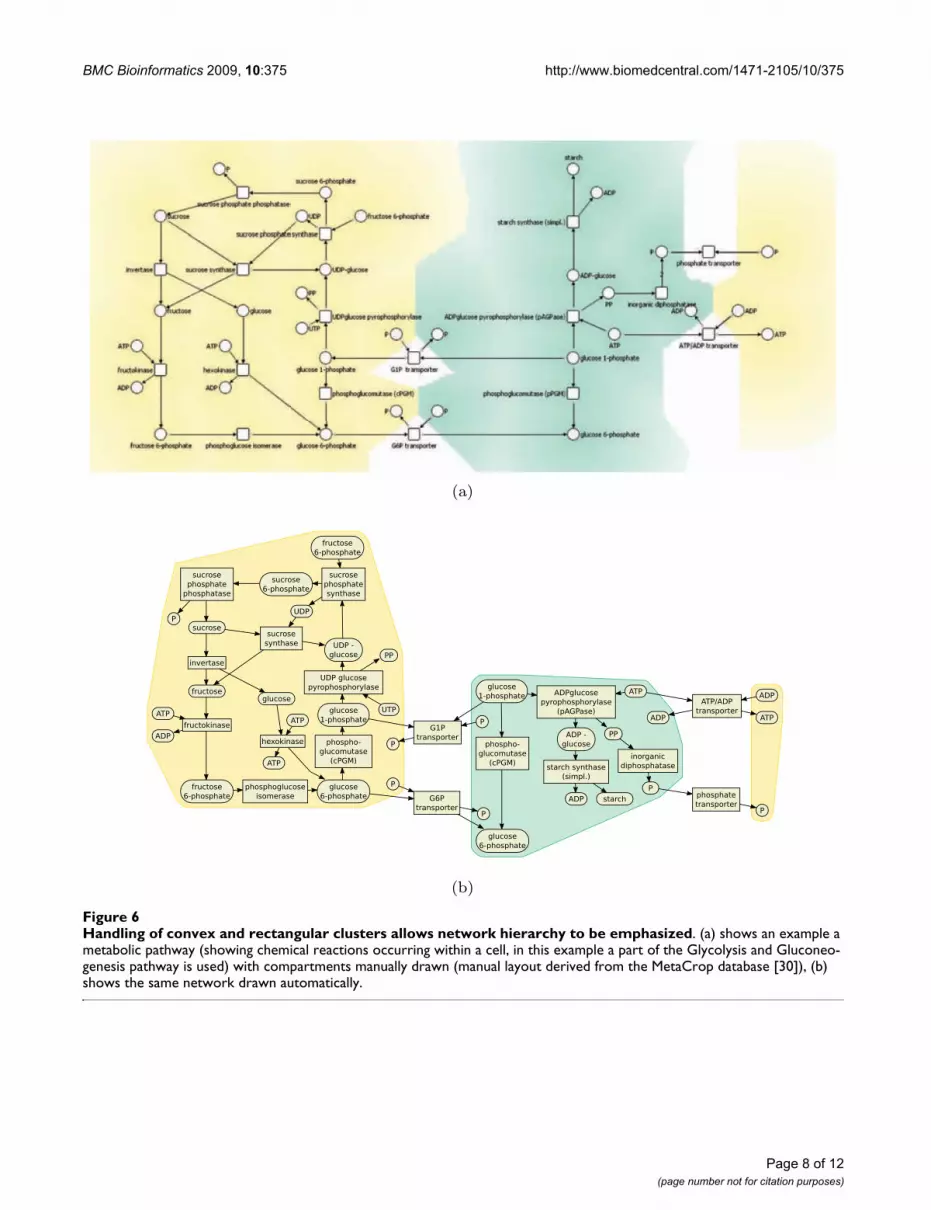
CyclesCycles occur, for example, in metabolic networks (e. g.TCA cycle, urea cycle) and are usually specially arranged toemphasize the cyclic processes. Cycles can be emphasizedin a number of different ways. The first way is to introducea dummy node in the center of the cycle and attach astrongly weighted dummy edge from the center node toeach node in the cycle. This will have the effect of arrang-ing the nodes in the cycle around a circle. The second wayis to arrange the nodes on the perimeter of a rectangle (asin Figure 6(b)). To do so we introduce new variables xl, xr,yb, yt corresponding to the four sides of the rectangle. Theplacement constraint that node v lies on the rectangle isapproximated by one of four conjunctions of separationconstraints one for each side of the rectangle. For instance,yv = yb ∧ xl ≤ xv ∧ xv ≤ xr constrains node v to be on the bot-tom of such a rectangle. Such constraints can be derivedby cycle detection algorithms such as [21] or by additionalinformation about cycles in pathway databases (e. g. inMetaCrop [30] and BioPath [31]).
Emphasizing network motifsDifferent occurrences of a network motif should be drawnin the same way. Equality separation constraints can beused to force all occurrences of a particular motif to be
drawn in exactly the same way, see Figure 5(a) for anexample. Different occurrences of a network motif can becomputed with motif-detection algorithms such as[32,33], the equality constraints are than derived from agiven or pre-computed layout of this motif and trans-ferred to all occurrences of the motif.
Clusters and compartmentsOften biological networks contain node clusters. Contain-ment within a rectangular region is simple to model usingseparation constraints. By introducing a rectangle forcompartments or clusters in the graph we can group nodestogether. It is then natural to modify the cost function sothat it tries to reduce the width and height of this rectangleto size proportional to the number of nodes in the com-partment. The cluster boundary is obtained by either tak-ing the convex hull of the nodes in the cluster or thebounding rectangle. An example is shown in Figure 6.Such clustering (and therefore the cluster constraint) maybe specified by biological information such as cellularcompartments or be computed by clustering algorithms[34].
Non-overlap of nodes and compartmentsA common problem with general purpose layout enginesis that nodes are treated as points and so, if nodes are largeas is the case in many biological networks, they may over-lap. Non-overlap of nodes is readily handled in ourapproach by approximating the placement constraint thatnodes u and v do not overlap by the disjunction of fourseparation constraints: u left of v, u above v, v left of u or vabove u. Similarly non-overlap of compartments can behandled. For efficiency generation of separation con-straints to enforce non-overlap in single dimension isdone using the scan-line algorithm given in [35] whichgenerates a linear number of constraints.
Orthogonal ordering of nodes and layout stabilityPreserving the relative horizontal and vertical ordering ofnodes as a layout changes can help preserve the usersmental map of the layout. Layout stability is also aided byadding terms to the cost function to penalize movementof nodes from their position in the previous layout. Thenecessary constraints for layout stability can be automati-cally determined from an existing layout by using the cur-rent positions of nodes and adding separation constraintsto preserve the horizontal (left-right) and vertical (top-bottom) relationships in the network.
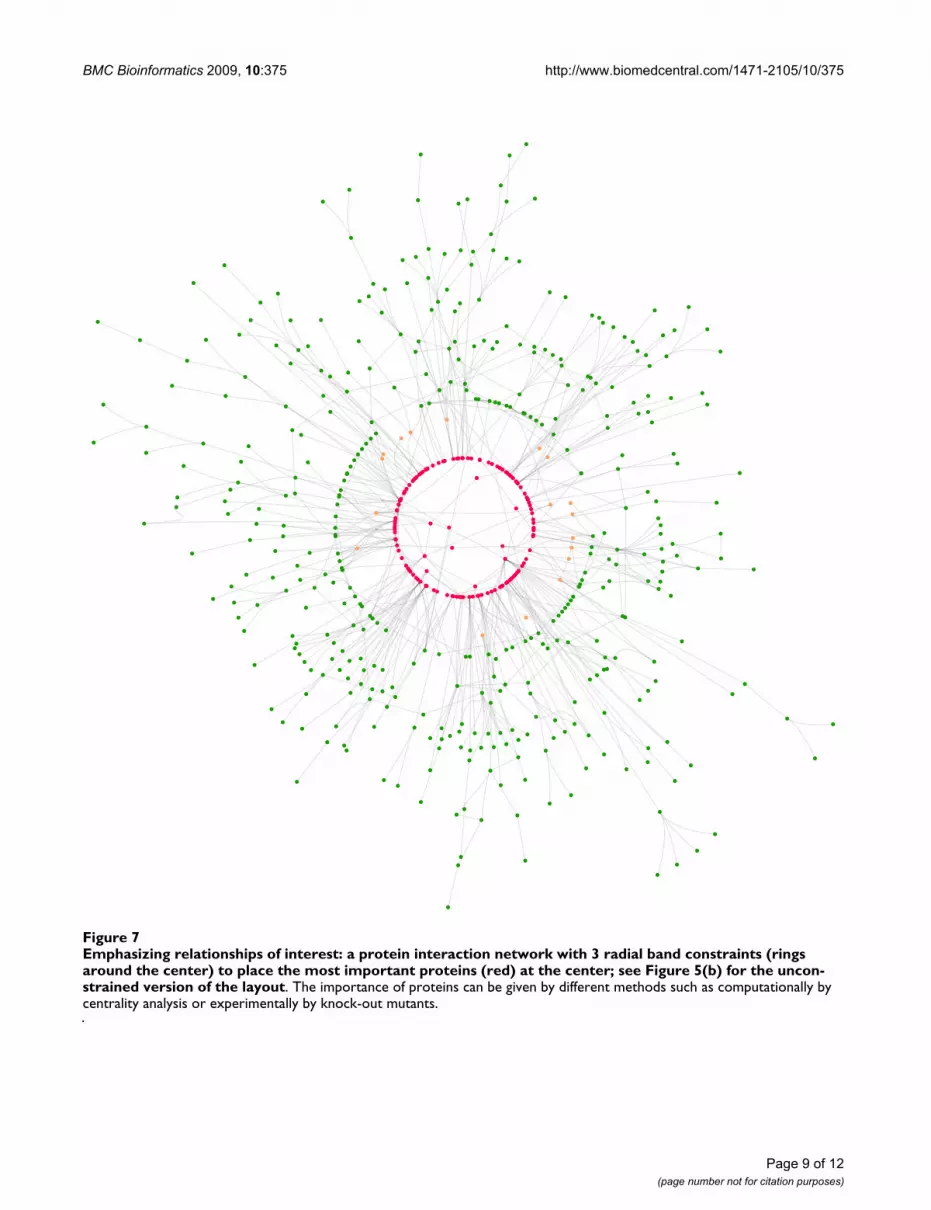
Radial layoutsRadial layouts can be used to emphasize the importanceof nodes, which could be placed in the center of the dia-gram, see Figure 7. At first glance it seems that radial lay-outs cannot be generated with our algorithm. However,instead of constraints on Cartesian co-ordinates we can
Page 6 of 12(page number not for citation purposes)

BMC Bioinformatics 2009, 10:375 http://www.biomedcentral.com/1471-2105/10/375
Page 7 of 12(page number not for citation purposes)
The presented method provides a generic approach to network visualizationFigure 5The presented method provides a generic approach to network visualization. It produces the drawings above which previously had to be produced using two totally different algorithms: (a) is a drawing of a gene regulatory network (showing the indirect interaction of genes through their RNA and protein expression products) using a Sugiyama layered layout style (note the two bi-fan motifs highlighted and drawn similarly), (b) is a protein interaction network (showing the interaction of proteins in a cell) using a force-directed layout style (Figure 7 shows the affect of adding constraints to this layout).
BMC Bioinformatics 2009, 10:375 http://www.biomedcentral.com/1471-2105/10/375
Page 8 of 12(page number not for citation purposes)
Handling of convex and rectangular clusters allows network hierarchy to be emphasizedFigure 6Handling of convex and rectangular clusters allows network hierarchy to be emphasized. (a) shows an example a metabolic pathway (showing chemical reactions occurring within a cell, in this example a part of the Glycolysis and Gluconeo-genesis pathway is used) with compartments manually drawn (manual layout derived from the MetaCrop database [30]), (b) shows the same network drawn automatically.
(a)
(b)
BMC Bioinformatics 2009, 10:375 http://www.biomedcentral.com/1471-2105/10/375
Page 9 of 12(page number not for citation purposes)
Emphasizing relationships of interest: a protein interaction network with 3 radial band constraints (rings around the center) to place the most important proteins (red) at the center; see Figure 5(b) for the unconstrained version of the layoutFigure 7Emphasizing relationships of interest: a protein interaction network with 3 radial band constraints (rings around the center) to place the most important proteins (red) at the center; see Figure 5(b) for the uncon-strained version of the layout. The importance of proteins can be given by different methods such as computationally by centrality analysis or experimentally by knock-out mutants.

BMC Bioinformatics 2009, 10:375 http://www.biomedcentral.com/1471-2105/10/375
allow constraints over polar co-ordinates (or at least radii)and the layout algorithm works basically unchanged. Inthis case separation constraints separate nodes by distancefrom the origin. Ordering or ranking of nodes and there-fore the separation constraints can be, for example, givenby experimental data or computed with network centrali-ties [36].
Results and DiscussionNetwork-specific layoutsSeveral types of biological networks exist such as gene reg-ulatory, protein interaction and metabolic networks.These networks describe different aspects of biologicalprocesses and typically utilize quite different layouts so asto better highlight relevant information. Gene regulatoryand signal transduction networks, for example, describethe cellular control of the protein synthesis during tran-scription as well as the communication within a cell tocoordinate responses to external or internal changes. Typ-ical visualization requirements are to show the temporalorder of events and the representation of different cellularcompartments (e. g. cytosol, mitochondrium, nucleus).Some methods for the visualization of these networks aredescribed in [17,18]. Typical visualizations of protein-interaction networks emphasize the connectedness orclustering of proteins. Methods for their visualization are,for example, presented in [3,6]. The visualization of met-abolic networks should typically emphasize the temporalorder of reactions and distinguish several elements of areaction: reactants (often divided into main- and co-reac-tants), products (main and co-products) and enzymes.Typical methods for the visualization of metabolic path-ways are described in [4,7,10].
All these different drawing styles can be achieved with ouralgorithm. It provides a generic approach to network vis-ualization, subsumes force-directed approaches [12,13],Sugiyama style layered layout [14], circular and grid draw-ings [9,16]. It has produced the drawings in Figure 5 and6(b) which previously had to be produced using totallydifferent algorithms. For example, in Figure 5(a) the visu-alization of a gene regulatory network which shows regu-latory events from top to bottom is presented. The layoutstyle is similar to layered layouts such as in the graphicalinterface of the TransPath database [37]. Figure 5(b)shows a protein interaction network in a force-directedlike drawing style which is typical for graphical represen-tations of such networks. It nicely presents the overallstructure of the network and emphasizes highly con-nected or clustered proteins. Figure 6(b) shows a meta-bolic pathway in a mixture of Sugiyama style layered andgrid layout. Typically, such pathway visualizations shouldemphasize the temporal order of reactions, distinguishseveral elements of a reaction and obey compartments.Again, the presented layout method supports these con-
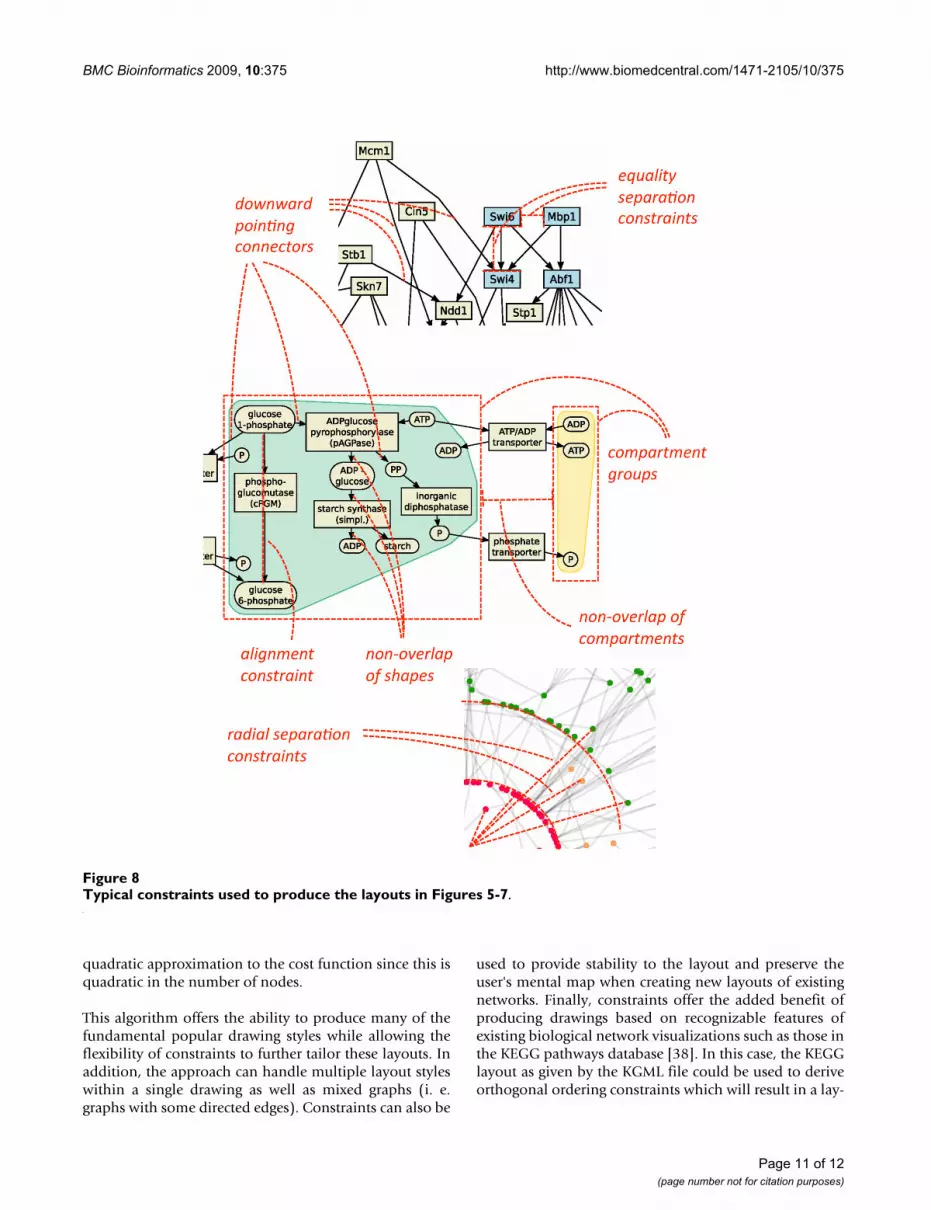
straints and gives layouts similar to those obtained withestablished methods for the visualization of metabolicnetworks. Figure 8 shows typical constraints used to pro-duce these layouts.
Consideration of hierarchical information and network analysis resultsThe layout approach is not only able to visualize differentbiological networks in their typical style. It is more pow-erful than most existing layout algorithms and in particu-lar able to handle convex and rectangular clustersallowing network hierarchy or additional information tobe emphasized. As an example the diagram in Figure 6(b)is an automatic drawing of a metabolic pathway withcompartments which previously had to be drawn byhand, such as in Figure 6(a).
The method also allows the user to customize the layoutto emphasize relationships of interest, for example, toexplore network analysis results such as network centralityanalysis, network motif investigation and network cluster-ing. For example, Figure 7 shows a protein interaction net-work arranged using the constrained stress majorizationmethod with 3 radial band constraints such that the mostimportant proteins (red) are at the center and less impor-tant ones (green) are at the outer border. The uncon-strained version of the layout is shown in Figure 5(b).Additionally, Figure 5(a) shows a layered drawing of agene regulatory network with two bi-fan motifs high-lighted and automatically drawn similarly.
ConclusionWe present a new method for producing high-quality vis-ualizations of a wide range of biological networks withdifferent layout requirements. Our approach is based onconstrained graph layout and allows constraints to beused to capture drawing conventions found in biologicalliterature as well as user-specified drawing requirements.In addition, most of the constraints can be automaticallyderived from the network structure, biological informa-tion or network analysis methods.
The generalization of different layout algorithms is desir-able, but it comes at the price that a more generalapproach may lose the efficiency of specialized algo-rithms. A prototype implementation of our algorithmdemonstrates that these methods are fast enough for usein interactive applications for networks with several hun-dred nodes and can lay out larger networks with a fewthousand nodes in about one minute. The key to the effi-ciency of the proposed method is that projection on toseparation constraints can be done efficiently using spe-cialized algorithms [25]. We find that the main cost is infinding the optimal layout from the initial feasible layoutand that the dominating cost in this is computing the
Page 10 of 12(page number not for citation purposes)
BMC Bioinformatics 2009, 10:375 http://www.biomedcentral.com/1471-2105/10/375
quadratic approximation to the cost function since this isquadratic in the number of nodes.
This algorithm offers the ability to produce many of thefundamental popular drawing styles while allowing theflexibility of constraints to further tailor these layouts. Inaddition, the approach can handle multiple layout styleswithin a single drawing as well as mixed graphs (i. e.graphs with some directed edges). Constraints can also be
used to provide stability to the layout and preserve theuser's mental map when creating new layouts of existingnetworks. Finally, constraints offer the added benefit ofproducing drawings based on recognizable features ofexisting biological network visualizations such as those inthe KEGG pathways database [38]. In this case, the KEGGlayout as given by the KGML file could be used to deriveorthogonal ordering constraints which will result in a lay-
Typical constraints used to produce the layouts in Figures 5-7Figure 8Typical constraints used to produce the layouts in Figures 5-7.
Page 11 of 12(page number not for citation purposes)

BMC Bioinformatics 2009, 10:375 http://www.biomedcentral.com/1471-2105/10/375
out of nodes similar to the relativ placement in the KEGGdiagram.
Our paper focuses on molecular biological networks suchas gene regulatory, protein interaction and metabolic net-works. However, the presented method is very general andcould also be adapted to other biological networks such asphylogenetic networks and food webs.
Authors' contributionsTD, KM and FS designed the study; TD, KM and MWdeveloped the constraint layout algorithm; TD and FSdeveloped the constraint sets; TD and MW implementedthe layout algorithm; FS evaluated the results. All authorswrote and approved the final manuscript.
References1. Ehrenberg M, Elf J, Aurell E, Sandberg R, Tegnér J: Systems Biology
Is Taking Off. Genome Research 2003, 13:2377-2380.2. Kitano H: Systems Biology: A Brief Overview. Science 2002,
295(5560):1662-1664.3. Basalaj W, Eilbeck K: Straight-line drawings of protein interac-
tions. In Proc. International Symposium on Graph Drawing (GD'99),LNCS Volume 1731. Edited by: Kratochvil J. Stirin Castle: Springer;1999:259-266.
4. Becker MY, Rojas I: A graph layout algorithm for drawing met-abolic pathways. Bioinformatics 2001, 17(5):461-467.
5. Genc B, Dogrusöoz U: A Constrained, Force-Directed LayoutAlgorithm for Biological Pathways. In Proc. International Sympo-sium on Graph Drawing (GD'03), LNCS Volume 2912. Edited by: LiottaG. Perugia: Springer; 2003:314-319.
6. Han K, Ju BH: A fast layout algorithm for protein interactionnetworks. Bioinformatics 2003, 19(15):1882-1888.
7. Karp PD, Paley SM: Automated Drawing of Metabolic Path-ways. Proc. International Conference on Bioinformatics and GenomeResearch 1994:225-238.
8. Kojima K, Nagasaki M, Jeong E, Kato M, Miyano S: An efficient gridlayout algorithm for biological networks utilizing variousbiological attributes. BMC Bioinformatics 2007, 8:76.
9. Li W, Kurata H: A grid layout algorithm for automatic drawingof biochemical networks. Bioinformatics 2005, 21(9):2036-2042.
10. Schreiber F: High Quality Visualization of Biochemical Path-ways in BioPath. In Silico Biology 2002, 2(2):59-73.
11. Sirava M, Schäfer T, Eiglsperger M, Kaufmann M, Kohlbacher O, Born-berg-Bauer E, Lenhof HP: BioMiner -modeling, analyzing, andvisualizing biochemical pathways and networks. Bioinformatics2002, 18(Suppl 2):S219-S230.
12. Eades P: A Heuristic for Graph Drawing. Congressus Numeran-tium 1984, 42:149-160.
13. Fruchterman T, Reingold E: Graph Drawing by Force-directedPlacement. Software - Practice and Experience 1991,21(11):1129-1164.
14. Sugiyama K, Tagawa S, Toda M: Methods for Visual Understand-ing of Hierarchical System Structures. IEEE Transactions on Sys-tems, Man and Cybernetics 1981, SMC-11(2):109-125.
15. Eades P, Sugiyama K: How to Draw a Directed Graph. Journal ofInformation Processing 1990, 13(4):424-437.
16. Six JM, Tollis IG: A Framework for Circular Drawings of Net-works. In Proc. International Symposium on Graph Drawing (GD'99),LNCS Volume 1731. Edited by: Kratochvil J. Stirin Castle: Springer;1999:107-116.
17. Genc B, Dogrusöz U: A Layout Algorithm for Signaling Path-ways. Information Sciences 2006, 176:135-149.
18. Kolpakov FA, Ananko EA, Kolesov GB, Kolchanov NA: GeneNet: agene network database and its automated visualization. Bio-informatics 1998, 14(6):529-537.
19. Karp PD, Paley SM, Romero P: The Pathway Tools software. Bio-informatics 2002, 18:S225-S232.
20. Emig D, Cline MS, Klein K, Kunert A, Mutzel P, Lengauer T, AlbrechtM: Integrative Visual Analysis of the Effects of Alternative
Splicing on Protein Domain Interaction Networks. Journal ofIntegrative Bioinformatics 2008, 5(2):101.
21. Wegner K, Kummer U: A new dynamical layout algorithm forcomplex biochemical reaction networks. BMC Bioinformatics2005, 6:212.
22. Dwyer T, Koren Y, Marriott K: IPSep-CoLa: An IncrementalProcedure for Separation Constraint Layout of Graphs. IEEETransactions on Visualization and Computer Graphics 2006,12(5):821-828.
23. Bertsekas DP: Nonlinear Programming Nashua: Athena Scientific; 1999. 24. Kamada T, Kawai S: An Algorithm for Drawing General Undi-
rected Graphs. Information Processing Letters 1989, 31:7-15.25. Dwyer T, Marriott K: Constrained stress majorization using
diagonally scaled gradient projection. In Proc. International Sym-posium on Graph Drawing (GD'07), LNCS Volume 4875. Edited by: HongSH, Nishizeki T, Quan W. Sydney: Springer; 2008:219-230.
26. Dobkin DP, Gansner ER, Koutsofios E, North SC: Implementing aGeneral-Purpose Edge Router. In Proc. International Symposium onGraph Drawing (GD'97), LNCS Volume 1353. Edited by: Di Battista G.Rome: Springer; 1997:262-271.
27. Wybrow M, Marriott K, Stuckey PJ: Incremental ConnectorRouting. In Proc. International Symposium on Graph Drawing (GD'05),LNCS Volume 3843. Edited by: Healy P, Nikolov NS. Limerick:Springer; 2006:446-457.
28. Varma A, Palsson BO: Review: Metabolic flux balancing: Basicconcepts, scientific and practical use. Bio/Technology 1994,12(10):994-998.
29. Eades P, Lin X, Smyth WF: A Fast and Effective Heuristic for theFeedback Arc Set Problem. Information Processing Letters 1993,47(6):319-323.
30. Grafahrend-Belau E, Weise S, Koschützki D, Scholz U, Junker BH,Schreiber F: MetaCrop - A detailed database of crop plantmetabolism. Nucleic Acids Research 2008, 36:D954-D958.
31. Forster M, Pick A, Raitner M, Schreiber F, Brandenburg FJ: The sys-tem architecture of the BioPath system. In Silico Biology 2002,2(3):415-426.
32. Milo R, Shen-Orr S, Itzkovitz S, Kashtan N, Chklovskii D, Alon U:Network Motifs: Simple Building Blocks of Complex Net-works. Science 2002, 298(5594):824-827.
33. Schreiber F, Schwöbbermeyer H: Frequency Concepts and Pat-tern Detection for the Analysis of Motifs in Networks. Trans-actions on Computational Systems Biology 2005, 3(LNBI 3737):89-104.
34. Balasundaram B, Butenko S: Network Clustering. In Analysis of Bio-logical Networks, Wiley Series on Bioinformatics, Computational Tech-niques and Engineering Edited by: Junker BH, Schreiber F. Hoboken(New Jersey): Wiley; 2008:113-138.
35. Dwyer T, Marriott K, Stuckey P: Fast node overlap removal. InIn Proc. International Symposium on Graph Drawing (GD'05), LNCS Vol-ume 3843. Edited by: Healy P, Nikolov NS. Limerick: Springer;2006:153-164.
36. Koschützki D: Network Centralities. In Analysis of Biological Net-works, Wiley Series on Bioinformatics, Computational Techniques and Engi-neering Edited by: Junker BH, Schreiber F. Hoboken (New Jersey):Wiley; 2008:65-84.
37. Krull M, Voss N, Choi C, Pistor S, Potapov A, Wingender E: TRANS-PATH: an integrated database on signal transduction and atool for array analysis. Nucleic Acids Research 2003, 31:97-100.
38. Kanehisa M, Goto S, Kawashima S, Nakaya A: The KEGG data-bases at GenomeNet. Nucleic Acids Research 2002, 30:42-46.
Page 12 of 12(page number not for citation purposes)


