Embed Size (px)
Citation preview
RESEARCH Open Access
A cross-sectional investigation of regionalpatterns of diet and cardio-metabolic risk in IndiaCarrie R Daniel1*, Dorairaj Prabhakaran2, Kavita Kapur3, Barry I Graubard1, Niveditha Devasenapathy2,Lakshmy Ramakrishnan4, Preethi S George5, Hemali Shetty6, Leah M Ferrucci1, Susan Yurgalevitch7,Nilanjan Chatterjee1, KS Reddy4, Tanuja Rastogi8, Prakash C Gupta 6, Aleyamma Mathew5, Rashmi Sinha1
Abstract
Background: The role of diet in India’s rapidly progressing chronic disease epidemic is unclear; moreover, diet mayvary considerably across North-South regions.
Methods: The India Health Study was a multicenter study of men and women aged 35-69, who provided diet,lifestyle, and medical histories, as well as blood pressure, fasting blood, urine, and anthropometric measurements.In each region (Delhi, n = 824; Mumbai, n = 743; Trivandrum, n = 2,247), we identified two dietary patterns withfactor analysis. In multiple logistic regression models adjusted for age, gender, education, income, marital status,religion, physical activity, tobacco, alcohol, and total energy intake, we investigated associations between regionaldietary patterns and abdominal adiposity, hypertension, diabetes, and dyslipidemia.
Results: Across the regions, more than 80% of the participants met the criteria for abdominal adiposity and 10 to28% of participants were considered diabetic. In Delhi, the “fruit and dairy” dietary pattern was positively associatedwith abdominal adiposity [highest versus lowest tertile, multivariate-adjusted OR and 95% CI: 2.32 (1.03-5.23);Ptrend = 0.008] and hypertension [2.20 (1.47-3.31); Ptrend < 0.0001]. In Trivandrum, the “pulses and rice” pattern wasinversely related to diabetes [0.70 (0.51-0.95); Ptrend = 0.03] and the “snacks and sweets” pattern was positivelyassociated with abdominal adiposity [2.05 (1.34-3.14); Ptrend = 0.03]. In Mumbai, the “fruit and vegetable” patternwas inversely associated with hypertension [0.63 (0.40-0.99); Ptrend = 0.05] and the “snack and meat” patternappeared to be positively associated with abdominal adiposity.
Conclusions: Cardio-metabolic risk factors were highly prevalent in this population. Across all regions, we foundlittle evidence of a Westernized diet; however, dietary patterns characterized by animal products, fried snacks, orsweets appeared to be positively associated with abdominal adiposity. Conversely, more traditional diets in theSouthern regions were inversely related to diabetes and hypertension. Continued investigation of diet, as well asother environmental and biological factors, will be needed to better understand the risk profile in this populationand potential means of prevention.
BackgroundThe Indian population has the highest prevalence of dia-betes worldwide [1] and exhibits high-risk metabolicprofiles at younger ages and lower body mass index(BMI) than their Western counterparts [2,3]. Althoughgenetic susceptibility is likely to play a role in chronicdisease etiology, the strong evidence for diet and other
environmental factors [4-7] suggest that such an epi-demic may be preventable.Diets across India have not been widely investigated,
yet many believe that India may be in the midst of a“nutrition transition,” [8-10] where changes in dietparallel an expanding industrial economy and a rapidlyprogressing epidemic of obesity and chronic, non-communicable disease. In this emerging at-risk popula-tion, the suspected access to and adoption of a lesshealthy diet and lifestyle, and/or deviance from tradi-tional and potentially protective behaviors [9,11,12], may
* Correspondence: [email protected] of Cancer Epidemiology and Genetics, National Cancer Institute,(6120 Executive Blvd), Rockville, MD, (20852), USAFull list of author information is available at the end of the article
Daniel et al. Nutrition Journal 2011, 10:12http://www.nutritionj.com/content/10/1/12
© 2011 Daniel et al; licensee BioMed Central Ltd. This is an Open Access article distributed under the terms of the Creative CommonsAttribution License (http://creativecommons.org/licenses/by/2.0), which permits unrestricted use, distribution, and reproduction inany medium, provided the original work is properly cited.
be linked to anthropometric factors and biological mar-kers of chronic disease risk [3,13]. However, few haveclosely examined the role of diet in these patterns andrelationships across a large, diverse, Indian population.Large cohort studies in the U.S. and Europe have used
dietary patterns analyses to bring to light common eat-ing behaviors and their relationships with risk of cardio-vascular disease and cancer [14,15]; however, no suchstudies exist in India. Furthermore, diet is expected tovary considerably within India across North-Southregions [10,13,16] and with the exception of nationalfood surveys [9,17], few comprehensive and up-to-dateassessments of regional Indian diets are currently avail-able [11,12,18].Utilizing detailed diet histories collected in a cohort
feasibility study conducted across three diverse regionsof India, our objective was to aggregate foods in toregional dietary patterns and to investigate associationswith cardio-metabolic risk factors, such as abdominaladiposity, hypertension, diabetes, and dyslipidemia. Aslittle is known regarding regional differences, we usedan exploratory approach, factor analysis, to empiricallyidentify dietary patterns reflecting actual eating beha-viors within each of the study regions [19,20].
MethodsStudy ParticipantsThe India Health Study (IHS; Figure 1) was a multicen-ter pilot study designed to investigate the feasibility ofestablishing a diet and cancer cohort in India. The study
was conducted between December 2006 and July 2008in participating centers distributed across three regionsof India: Delhi in the north (All India Institute of Medi-cal Sciences and Centre for Chronic Disease Control),Mumbai in the west (Healis-Sekhsaria Institute for Pub-lic Health), and Trivandrum in the south (Regional Can-cer Center). Centers were selected in areas withestablished cancer registries [21] and to capture a rangeof different economic, ethnic, and urbanization patterns[11]. Human ethics committees from each study center,the Special Studies Institutional Review Board of theU.S. National Cancer Institute, as well as the IndianHealth Ministry Screening Committee (part of theIndian Council of Medical Research reporting to theGovernment of India) reviewed and approved the study.Households within the centers’ coverage areas were
identified using census data in Delhi, the voter’s regis-tration list in Trivandrum, and an existing cohort [22]database of participants and their neighbours in Mum-bai. The IHS households were selected at random fromcensus enumeration blocks in 2 wards in the Hauz Khassubdivision of the South District in Delhi; polling sta-tions in 6 urban and 49 rural wards from the Nedumangadu and Thiruvanthapuram taluks (subdivisions)in Trivandrum; and from 3 representative areas (Parel,Naigaum, Sewri) of Ward F-South in Mumbai [22]. Inthe largest study region, Trivandrum, households weresampled by religion (Hindu/Muslim/Christian) andurban-rural residence strata to maximize the variabilityin diet and lifestyle across the IHS. Household eligibility
Recruitment and participation:
Individuals within households 1,184 3,380 1,791
Eligible to participate 1,143 (96%) 2,702 (80%) 826 (46%)
Signed informed consent¥ 942 (82%) 2,431 (90%) 804 (97%)
Completion ¥:
Questionnaires 864 (92%) 2,431 (100%) 804 (100%)
Anthropometric exam and BP 740 (79%) 1,728 (71%) 804 (100%)
Fasting blood and urine 739 (78%) 1,847 (76%) − −
Delhi Trivandrum Mumbai
Medical History§ Anthropometry measured Blood pressure (BP) taken Fasting blood taken† First morning void collected†
Diet History, Demographic, Lifestyle questionnaires§
VISIT 1 (at the participant’s home)
VISIT 2 (at the participant’s home or mobile camp)
Individual eligibility screener§
Household eligibility*
Figure 1 India Health Study (IHS): Design, visit flow, and participation rates. *Participant’s household selection was stratified by religion, aswell as urban-rural status in Trivandrum only. Both Delhi and Mumbai centers are considered to be entirely urban. Religious groups are notevenly distributed throughout the country; therefore, higher concentrations of Muslim and Christian households were recruited from Trivandrum.§All questionnaires were administered by trained field staff via interview. †In Mumbai, no biological samples were collected and all informationwas collected in the first visit. ¥Denominator for completion rates.
Daniel et al. Nutrition Journal 2011, 10:12http://www.nutritionj.com/content/10/1/12
Page 2 of 13
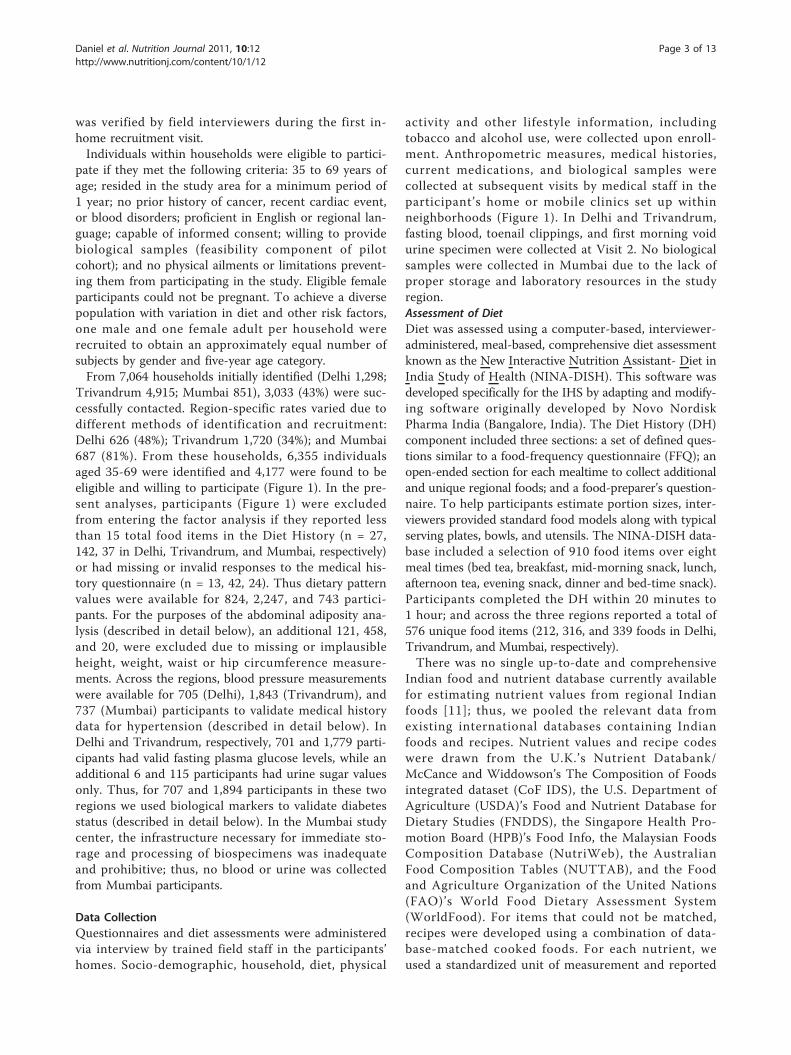
was verified by field interviewers during the first in-home recruitment visit.Individuals within households were eligible to partici-
pate if they met the following criteria: 35 to 69 years ofage; resided in the study area for a minimum period of1 year; no prior history of cancer, recent cardiac event,or blood disorders; proficient in English or regional lan-guage; capable of informed consent; willing to providebiological samples (feasibility component of pilotcohort); and no physical ailments or limitations prevent-ing them from participating in the study. Eligible femaleparticipants could not be pregnant. To achieve a diversepopulation with variation in diet and other risk factors,one male and one female adult per household wererecruited to obtain an approximately equal number ofsubjects by gender and five-year age category.From 7,064 households initially identified (Delhi 1,298;
Trivandrum 4,915; Mumbai 851), 3,033 (43%) were suc-cessfully contacted. Region-specific rates varied due todifferent methods of identification and recruitment:Delhi 626 (48%); Trivandrum 1,720 (34%); and Mumbai687 (81%). From these households, 6,355 individualsaged 35-69 were identified and 4,177 were found to beeligible and willing to participate (Figure 1). In the pre-sent analyses, participants (Figure 1) were excludedfrom entering the factor analysis if they reported lessthan 15 total food items in the Diet History (n = 27,142, 37 in Delhi, Trivandrum, and Mumbai, respectively)or had missing or invalid responses to the medical his-tory questionnaire (n = 13, 42, 24). Thus dietary patternvalues were available for 824, 2,247, and 743 partici-pants. For the purposes of the abdominal adiposity ana-lysis (described in detail below), an additional 121, 458,and 20, were excluded due to missing or implausibleheight, weight, waist or hip circumference measure-ments. Across the regions, blood pressure measurementswere available for 705 (Delhi), 1,843 (Trivandrum), and737 (Mumbai) participants to validate medical historydata for hypertension (described in detail below). InDelhi and Trivandrum, respectively, 701 and 1,779 parti-cipants had valid fasting plasma glucose levels, while anadditional 6 and 115 participants had urine sugar valuesonly. Thus, for 707 and 1,894 participants in these tworegions we used biological markers to validate diabetesstatus (described in detail below). In the Mumbai studycenter, the infrastructure necessary for immediate sto-rage and processing of biospecimens was inadequateand prohibitive; thus, no blood or urine was collectedfrom Mumbai participants.
Data CollectionQuestionnaires and diet assessments were administeredvia interview by trained field staff in the participants’homes. Socio-demographic, household, diet, physical
activity and other lifestyle information, includingtobacco and alcohol use, were collected upon enroll-ment. Anthropometric measures, medical histories,current medications, and biological samples werecollected at subsequent visits by medical staff in theparticipant ’s home or mobile clinics set up withinneighborhoods (Figure 1). In Delhi and Trivandrum,fasting blood, toenail clippings, and first morning voidurine specimen were collected at Visit 2. No biologicalsamples were collected in Mumbai due to the lack ofproper storage and laboratory resources in the studyregion.Assessment of DietDiet was assessed using a computer-based, interviewer-administered, meal-based, comprehensive diet assessmentknown as the New Interactive Nutrition Assistant- Diet inIndia Study of Health (NINA-DISH). This software wasdeveloped specifically for the IHS by adapting and modify-ing software originally developed by Novo NordiskPharma India (Bangalore, India). The Diet History (DH)component included three sections: a set of defined ques-tions similar to a food-frequency questionnaire (FFQ); anopen-ended section for each mealtime to collect additionaland unique regional foods; and a food-preparer’s question-naire. To help participants estimate portion sizes, inter-viewers provided standard food models along with typicalserving plates, bowls, and utensils. The NINA-DISH data-base included a selection of 910 food items over eightmeal times (bed tea, breakfast, mid-morning snack, lunch,afternoon tea, evening snack, dinner and bed-time snack).Participants completed the DH within 20 minutes to1 hour; and across the three regions reported a total of576 unique food items (212, 316, and 339 foods in Delhi,Trivandrum, and Mumbai, respectively).There was no single up-to-date and comprehensive
Indian food and nutrient database currently availablefor estimating nutrient values from regional Indianfoods [11]; thus, we pooled the relevant data fromexisting international databases containing Indianfoods and recipes. Nutrient values and recipe codeswere drawn from the U.K. ’s Nutrient Databank/McCance and Widdowson’s The Composition of Foodsintegrated dataset (CoF IDS), the U.S. Department ofAgriculture (USDA)’s Food and Nutrient Database forDietary Studies (FNDDS), the Singapore Health Pro-motion Board (HPB)’s Food Info, the Malaysian FoodsComposition Database (NutriWeb), the AustralianFood Composition Tables (NUTTAB), and the Foodand Agriculture Organization of the United Nations(FAO) ’s World Food Dietary Assessment System(WorldFood). For items that could not be matched,recipes were developed using a combination of data-base-matched cooked foods. For each nutrient, weused a standardized unit of measurement and reported
Daniel et al. Nutrition Journal 2011, 10:12http://www.nutritionj.com/content/10/1/12
Page 3 of 13
values per 100 grams of edible portion of food product[23,24].Blood Pressure, Anthropometry, and Physical ActivityAt the time of the anthropometry exam, systolic anddiastolic blood pressure levels were taken by a studynurse using a portable calibrated digital monitor forthe upper arm. Using a portable calibrated digital scale(Breuer), stadiometer (Seca 214), and no-stretch mea-suring tape (Gulick), weight, height, waist circumfer-ence, hip circumference, and thigh circumference weretaken in duplicate (or triplicate if the first two werenot within agreement) and then averaged. Body massindex (BMI) was calculated as weight (kg)/height (m)2
and categories were based on World Health Organiza-tion cut-points with special consideration of Asianpopulations [25]. Abdominal adiposity was estimatedwith the waist circumference to hip circumferenceratio (WHR) [26].All study participants completed the validated short-
form of the International Physical Activity Question-naire [IPAQ; [27,28]]. We estimated total physicalactivity as the weighted sum of walking, moderate, andvigorous activity in metabolic equivalents of task(MET)-hours per week from recreation, occupation,household work, and transportation-related activity [29].Biospecimen collection and processingIn Delhi and Trivandrum, a first morning urine sample(100 mL) and fasting blood sample (15 mL) were col-lected and immediately transported (within threehours) to the respective center’s clinical laboratories incoolers for routine processing and analysis using aBeckman Autoanalyzer (Beckman, Fullerton, CA). Fast-ing glucose levels were determined with the glucoseoxidase/peroxidase method [30] (Delhi: GOD-PAP;Randox Laboratories Ltd., Antrim, UK; Trivandrum:GOD-POD; Autospan; Span Diagnostics Ltd., Surat,India). In Delhi, lipid profiles were also analyzed usingthe following methods: (TC) by cholesterol oxidase/p-aminophenazone (CHOD-PAP; Randox LaboratoriesLtd., Antrim, UK) method, triglyceride by glycerolpho-sphatase oxidase-peroxidase aminophenazone (GPO-PAP; Randox Laboratories Ltd., Antrim, UK) methodand HDL cholesterol by precipitation method usingphosphotungstate/magnesium-precipitation of apolipo-protein B containing lipoproteins followed by estima-tion of cholesterol in supernatant by enzymaticmethod. LDL cholesterol was estimated using theFriedwald formula [31].Prevalent abdominal adiposity, diabetes, hypertension, anddyslipidemiaFor the purposes of this analysis, sex-specific cut-pointsfor South Asian [25,26] populations were used to defineabdominal adiposity by a WHR greater than or equal to0.90 in males or 0.80 in females.
Diabetes status was defined by a combination of self-reported medical history, medication use, and fastingplasma glucose levels. Any participants who reported apositive medical history with valid medication use/treat-ment for high blood sugar were considered diabetescases; and thus, represented 47% of the total diabetescases in Delhi and Trivandrum, and 89% of the totalcases in Mumbai. Note that in Mumbai, no biospeci-mens were collected and only self-reported medicalhistory was available to define diabetes status. Of theDelhi and Trivandrum participants who did not report atreatment and/or positive medical history for diabetes,case-status was defined by a fasting plasma glucose levelgreater than or equal to 126 mg/dl [32]. Fifty-two per-cent of the total diabetes cases in Delhi and 48% of thecases in Trivandrum were captured by high fastingblood levels; and thus, represented participants whowere likely unaware of their diabetic status. Above-normal urine sugar (>15 mg/dl or >0%) was also used todefine diabetes status in 1% of the total cases in Delhiand 4% of the total cases in Trivandrum when fastingblood was unavailable. Among non-cases in Delhi andTrivandrum, 91% and 94% were confirmed “normal” byblood levels (<126 mg/dl) or urine, while the remaining9% and 6% were included as a non-case based on a self-reported negative medical history only. In Delhi andTrivandrum, a variable was similarly created to compareparticipants with and without pre-diabetes or impairedfasting glucose (≥100 mg/dl versus <100 mg/dl [32,33]).Hypertensive status was similarly defined in all regions
by medical history, medication use, and blood pressurelevels. A participant was considered hypertensive if theyindicated a positive medical history with valid treatmentfor high blood pressure; otherwise, hypertension wasclassified based on blood pressure levels measured inthe study (SBP ≥ 140 mmHg or DBP ≥ 90 mmHg). Lessthan 2% of hypertension cases were based on a positiveself-report only. In Delhi, Trivandrum, and Mumbai,respectively, 13%, 8%, and 2% of non-cases were basedonly on a negative self-reported history.Blood cholesterol levels were analyzed for Delhi parti-
cipants only and dyslipidemia was defined by one ormore of the following: HDL cholesterol levels less than40 mg/dl in males or 50 mg/dl in females, TG levelsabove 200 mg/dl, total cholesterol to HDL ratio greaterthan or equal to 5 [34].
Statistical AnalysisWe derived dietary patterns for each region separatelyusing factor or principal component analysis (PCA) [20].Prior to analysis, individual food items collected in thestructured DH and in the open-ended section were aggre-gated in to 130 common “reference groups” by a trainednutritionist familiar with regional food items, recipes, and
Daniel et al. Nutrition Journal 2011, 10:12http://www.nutritionj.com/content/10/1/12
Page 4 of 13
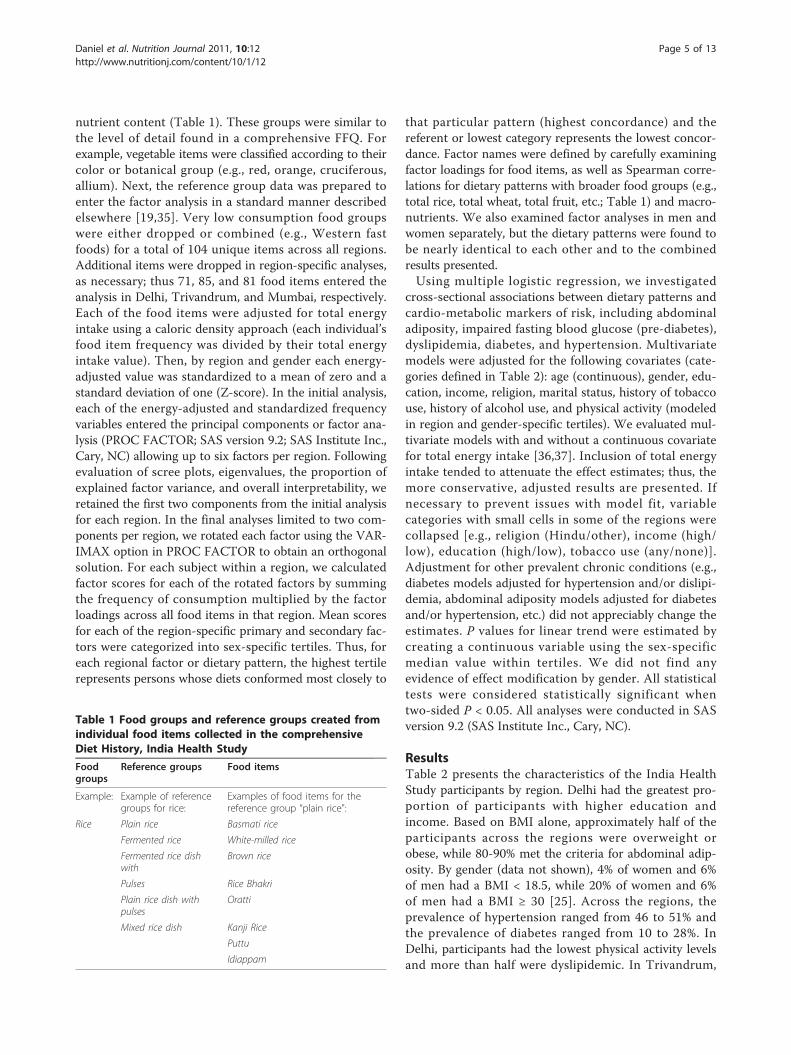
nutrient content (Table 1). These groups were similar tothe level of detail found in a comprehensive FFQ. Forexample, vegetable items were classified according to theircolor or botanical group (e.g., red, orange, cruciferous,allium). Next, the reference group data was prepared toenter the factor analysis in a standard manner describedelsewhere [19,35]. Very low consumption food groupswere either dropped or combined (e.g., Western fastfoods) for a total of 104 unique items across all regions.Additional items were dropped in region-specific analyses,as necessary; thus 71, 85, and 81 food items entered theanalysis in Delhi, Trivandrum, and Mumbai, respectively.Each of the food items were adjusted for total energyintake using a caloric density approach (each individual’sfood item frequency was divided by their total energyintake value). Then, by region and gender each energy-adjusted value was standardized to a mean of zero and astandard deviation of one (Z-score). In the initial analysis,each of the energy-adjusted and standardized frequencyvariables entered the principal components or factor ana-lysis (PROC FACTOR; SAS version 9.2; SAS Institute Inc.,Cary, NC) allowing up to six factors per region. Followingevaluation of scree plots, eigenvalues, the proportion ofexplained factor variance, and overall interpretability, weretained the first two components from the initial analysisfor each region. In the final analyses limited to two com-ponents per region, we rotated each factor using the VAR-IMAX option in PROC FACTOR to obtain an orthogonalsolution. For each subject within a region, we calculatedfactor scores for each of the rotated factors by summingthe frequency of consumption multiplied by the factorloadings across all food items in that region. Mean scoresfor each of the region-specific primary and secondary fac-tors were categorized into sex-specific tertiles. Thus, foreach regional factor or dietary pattern, the highest tertilerepresents persons whose diets conformed most closely to
that particular pattern (highest concordance) and thereferent or lowest category represents the lowest concor-dance. Factor names were defined by carefully examiningfactor loadings for food items, as well as Spearman corre-lations for dietary patterns with broader food groups (e.g.,total rice, total wheat, total fruit, etc.; Table 1) and macro-nutrients. We also examined factor analyses in men andwomen separately, but the dietary patterns were found tobe nearly identical to each other and to the combinedresults presented.Using multiple logistic regression, we investigated
cross-sectional associations between dietary patterns andcardio-metabolic markers of risk, including abdominaladiposity, impaired fasting blood glucose (pre-diabetes),dyslipidemia, diabetes, and hypertension. Multivariatemodels were adjusted for the following covariates (cate-gories defined in Table 2): age (continuous), gender, edu-cation, income, religion, marital status, history of tobaccouse, history of alcohol use, and physical activity (modeledin region and gender-specific tertiles). We evaluated mul-tivariate models with and without a continuous covariatefor total energy intake [36,37]. Inclusion of total energyintake tended to attenuate the effect estimates; thus, themore conservative, adjusted results are presented. Ifnecessary to prevent issues with model fit, variablecategories with small cells in some of the regions werecollapsed [e.g., religion (Hindu/other), income (high/low), education (high/low), tobacco use (any/none)].Adjustment for other prevalent chronic conditions (e.g.,diabetes models adjusted for hypertension and/or dislipi-demia, abdominal adiposity models adjusted for diabetesand/or hypertension, etc.) did not appreciably change theestimates. P values for linear trend were estimated bycreating a continuous variable using the sex-specificmedian value within tertiles. We did not find anyevidence of effect modification by gender. All statisticaltests were considered statistically significant whentwo-sided P < 0.05. All analyses were conducted in SASversion 9.2 (SAS Institute Inc., Cary, NC).
ResultsTable 2 presents the characteristics of the India HealthStudy participants by region. Delhi had the greatest pro-portion of participants with higher education andincome. Based on BMI alone, approximately half of theparticipants across the regions were overweight orobese, while 80-90% met the criteria for abdominal adip-osity. By gender (data not shown), 4% of women and 6%of men had a BMI < 18.5, while 20% of women and 6%of men had a BMI ≥ 30 [25]. Across the regions, theprevalence of hypertension ranged from 46 to 51% andthe prevalence of diabetes ranged from 10 to 28%. InDelhi, participants had the lowest physical activity levelsand more than half were dyslipidemic. In Trivandrum,
Table 1 Food groups and reference groups created fromindividual food items collected in the comprehensiveDiet History, India Health Study
Foodgroups
Reference groups Food items
Example: Example of referencegroups for rice:
Examples of food items for thereference group “plain rice":
Rice Plain rice Basmati rice
Fermented rice White-milled rice
Fermented rice dishwith
Brown rice
Pulses Rice Bhakri
Plain rice dish withpulses
Oratti
Mixed rice dish Kanji Rice
Puttu
Idiappam
Daniel et al. Nutrition Journal 2011, 10:12http://www.nutritionj.com/content/10/1/12
Page 5 of 13
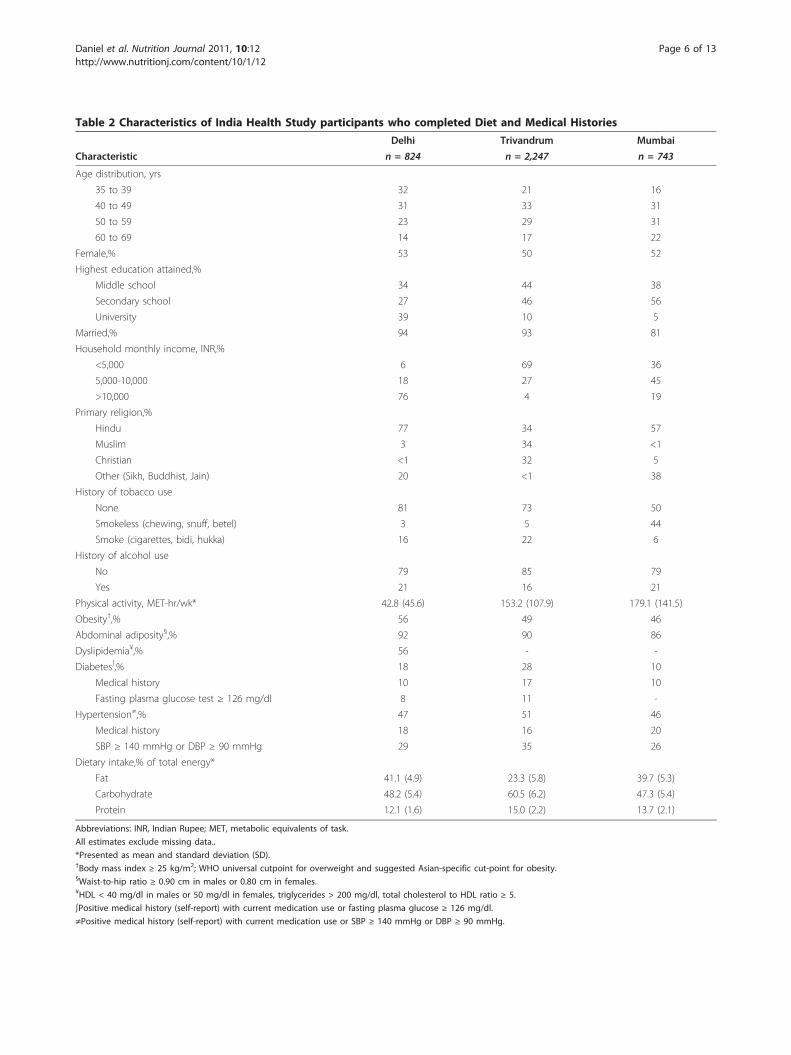
Table 2 Characteristics of India Health Study participants who completed Diet and Medical Histories
Delhi Trivandrum Mumbai
Characteristic n = 824 n = 2,247 n = 743
Age distribution, yrs
35 to 39 32 21 16
40 to 49 31 33 31
50 to 59 23 29 31
60 to 69 14 17 22
Female,% 53 50 52
Highest education attained,%
Middle school 34 44 38
Secondary school 27 46 56
University 39 10 5
Married,% 94 93 81
Household monthly income, INR,%
<5,000 6 69 36
5,000-10,000 18 27 45
>10,000 76 4 19
Primary religion,%
Hindu 77 34 57
Muslim 3 34 <1
Christian <1 32 5
Other (Sikh, Buddhist, Jain) 20 <1 38
History of tobacco use
None 81 73 50
Smokeless (chewing, snuff, betel) 3 5 44
Smoke (cigarettes, bidi, hukka) 16 22 6
History of alcohol use
No 79 85 79
Yes 21 16 21
Physical activity, MET-hr/wk* 42.8 (45.6) 153.2 (107.9) 179.1 (141.5)
Obesity†,% 56 49 46
Abdominal adiposity§,% 92 90 86
Dyslipidemia¥,% 56 - -
Diabetes∫,% 18 28 10
Medical history 10 17 10
Fasting plasma glucose test ≥ 126 mg/dl 8 11 -
Hypertension≠,% 47 51 46
Medical history 18 16 20
SBP ≥ 140 mmHg or DBP ≥ 90 mmHg 29 35 26
Dietary intake,% of total energy*
Fat 41.1 (4.9) 23.3 (5.8) 39.7 (5.3)
Carbohydrate 48.2 (5.4) 60.5 (6.2) 47.3 (5.4)
Protein 12.1 (1.6) 15.0 (2.2) 13.7 (2.1)
Abbreviations: INR, Indian Rupee; MET, metabolic equivalents of task.
All estimates exclude missing data..
*Presented as mean and standard deviation (SD).†Body mass index ≥ 25 kg/m2; WHO universal cutpoint for overweight and suggested Asian-specific cut-point for obesity.§Waist-to-hip ratio ≥ 0.90 cm in males or 0.80 cm in females.¥HDL < 40 mg/dl in males or 50 mg/dl in females, triglycerides > 200 mg/dl, total cholesterol to HDL ratio ≥ 5.
∫Positive medical history (self-report) with current medication use or fasting plasma glucose ≥ 126 mg/dl.
≠Positive medical history (self-report) with current medication use or SBP ≥ 140 mmHg or DBP ≥ 90 mmHg.
Daniel et al. Nutrition Journal 2011, 10:12http://www.nutritionj.com/content/10/1/12
Page 6 of 13
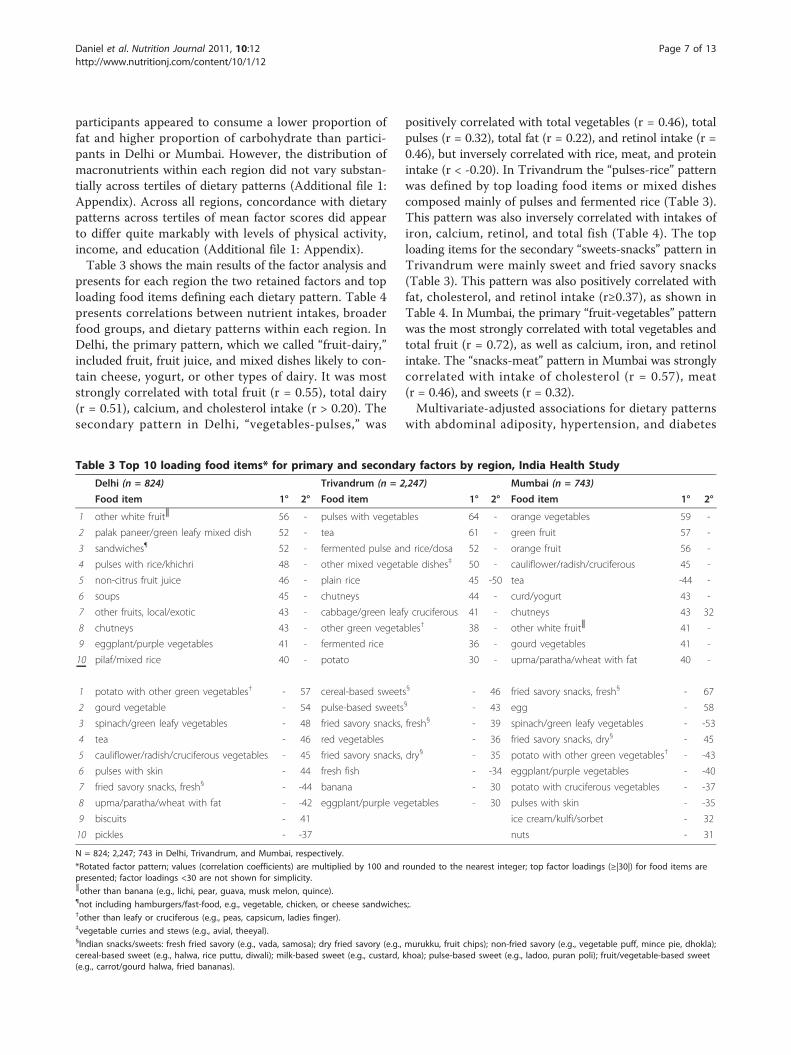
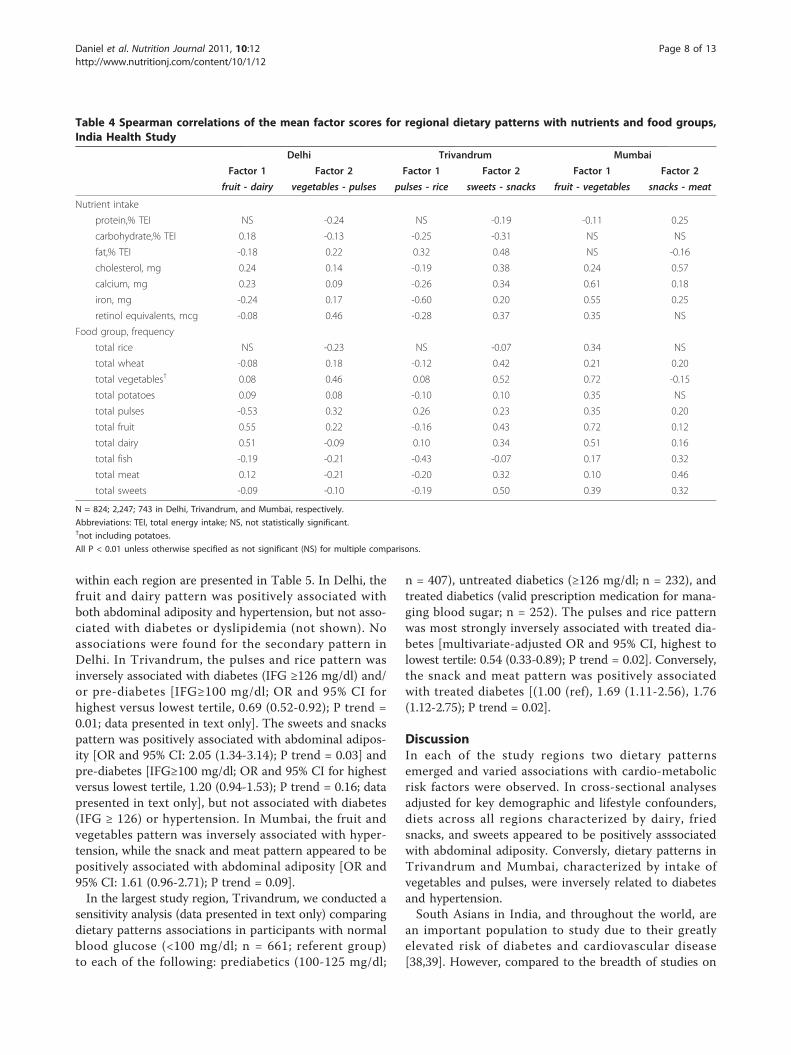
participants appeared to consume a lower proportion offat and higher proportion of carbohydrate than partici-pants in Delhi or Mumbai. However, the distribution ofmacronutrients within each region did not vary substan-tially across tertiles of dietary patterns (Additional file 1:Appendix). Across all regions, concordance with dietarypatterns across tertiles of mean factor scores did appearto differ quite markably with levels of physical activity,income, and education (Additional file 1: Appendix).Table 3 shows the main results of the factor analysis and
presents for each region the two retained factors and toploading food items defining each dietary pattern. Table 4presents correlations between nutrient intakes, broaderfood groups, and dietary patterns within each region. InDelhi, the primary pattern, which we called “fruit-dairy,”included fruit, fruit juice, and mixed dishes likely to con-tain cheese, yogurt, or other types of dairy. It was moststrongly correlated with total fruit (r = 0.55), total dairy(r = 0.51), calcium, and cholesterol intake (r > 0.20). Thesecondary pattern in Delhi, “vegetables-pulses,” was
positively correlated with total vegetables (r = 0.46), totalpulses (r = 0.32), total fat (r = 0.22), and retinol intake (r =0.46), but inversely correlated with rice, meat, and proteinintake (r < -0.20). In Trivandrum the “pulses-rice” patternwas defined by top loading food items or mixed dishescomposed mainly of pulses and fermented rice (Table 3).This pattern was also inversely correlated with intakes ofiron, calcium, retinol, and total fish (Table 4). The toploading items for the secondary “sweets-snacks” pattern inTrivandrum were mainly sweet and fried savory snacks(Table 3). This pattern was also positively correlated withfat, cholesterol, and retinol intake (r≥0.37), as shown inTable 4. In Mumbai, the primary “fruit-vegetables” patternwas the most strongly correlated with total vegetables andtotal fruit (r = 0.72), as well as calcium, iron, and retinolintake. The “snacks-meat” pattern in Mumbai was stronglycorrelated with intake of cholesterol (r = 0.57), meat(r = 0.46), and sweets (r = 0.32).Multivariate-adjusted associations for dietary patterns
with abdominal adiposity, hypertension, and diabetes
Table 3 Top 10 loading food items* for primary and secondary factors by region, India Health Study
Delhi (n = 824) Trivandrum (n = 2,247) Mumbai (n = 743)
Food item 1° 2° Food item 1° 2° Food item 1° 2°
1 other white fruit║ 56 - pulses with vegetables 64 - orange vegetables 59 -
2 palak paneer/green leafy mixed dish 52 - tea 61 - green fruit 57 -
3 sandwiches¶ 52 - fermented pulse and rice/dosa 52 - orange fruit 56 -
4 pulses with rice/khichri 48 - other mixed vegetable dishes‡ 50 - cauliflower/radish/cruciferous 45 -
5 non-citrus fruit juice 46 - plain rice 45 -50 tea -44 -
6 soups 45 - chutneys 44 - curd/yogurt 43 -
7 other fruits, local/exotic 43 - cabbage/green leafy cruciferous 41 - chutneys 43 32
8 chutneys 43 - other green vegetables† 38 - other white fruit║ 41 -
9 eggplant/purple vegetables 41 - fermented rice 36 - gourd vegetables 41 -
10 pilaf/mixed rice 40 - potato 30 - upma/paratha/wheat with fat 40 -
1 potato with other green vegetables† - 57 cereal-based sweets§ - 46 fried savory snacks, fresh§ - 67
2 gourd vegetable - 54 pulse-based sweets§ - 43 egg - 58
3 spinach/green leafy vegetables - 48 fried savory snacks, fresh§ - 39 spinach/green leafy vegetables - -53
4 tea - 46 red vegetables - 36 fried savory snacks, dry§ - 45
5 cauliflower/radish/cruciferous vegetables - 45 fried savory snacks, dry§ - 35 potato with other green vegetables† - -43
6 pulses with skin - 44 fresh fish - -34 eggplant/purple vegetables - -40
7 fried savory snacks, fresh§ - -44 banana - 30 potato with cruciferous vegetables - -37
8 upma/paratha/wheat with fat - -42 eggplant/purple vegetables - 30 pulses with skin - -35
9 biscuits - 41 ice cream/kulfi/sorbet - 32
10 pickles - -37 nuts - 31
N = 824; 2,247; 743 in Delhi, Trivandrum, and Mumbai, respectively.
*Rotated factor pattern; values (correlation coefficients) are multiplied by 100 and rounded to the nearest integer; top factor loadings (≥|30|) for food items arepresented; factor loadings <30 are not shown for simplicity.║other than banana (e.g., lichi, pear, guava, musk melon, quince).¶not including hamburgers/fast-food, e.g., vegetable, chicken, or cheese sandwiches;.†other than leafy or cruciferous (e.g., peas, capsicum, ladies finger).‡vegetable curries and stews (e.g., avial, theeyal).§Indian snacks/sweets: fresh fried savory (e.g., vada, samosa); dry fried savory (e.g., murukku, fruit chips); non-fried savory (e.g., vegetable puff, mince pie, dhokla);cereal-based sweet (e.g., halwa, rice puttu, diwali); milk-based sweet (e.g., custard, khoa); pulse-based sweet (e.g., ladoo, puran poli); fruit/vegetable-based sweet(e.g., carrot/gourd halwa, fried bananas).
Daniel et al. Nutrition Journal 2011, 10:12http://www.nutritionj.com/content/10/1/12
Page 7 of 13
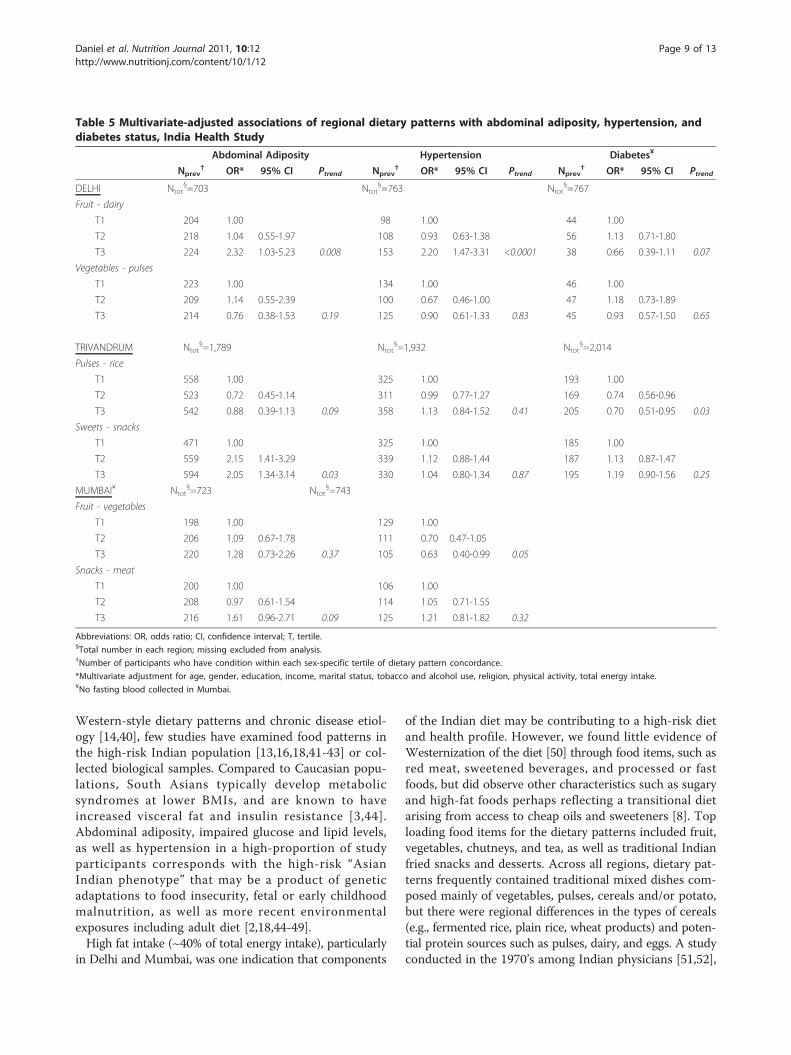
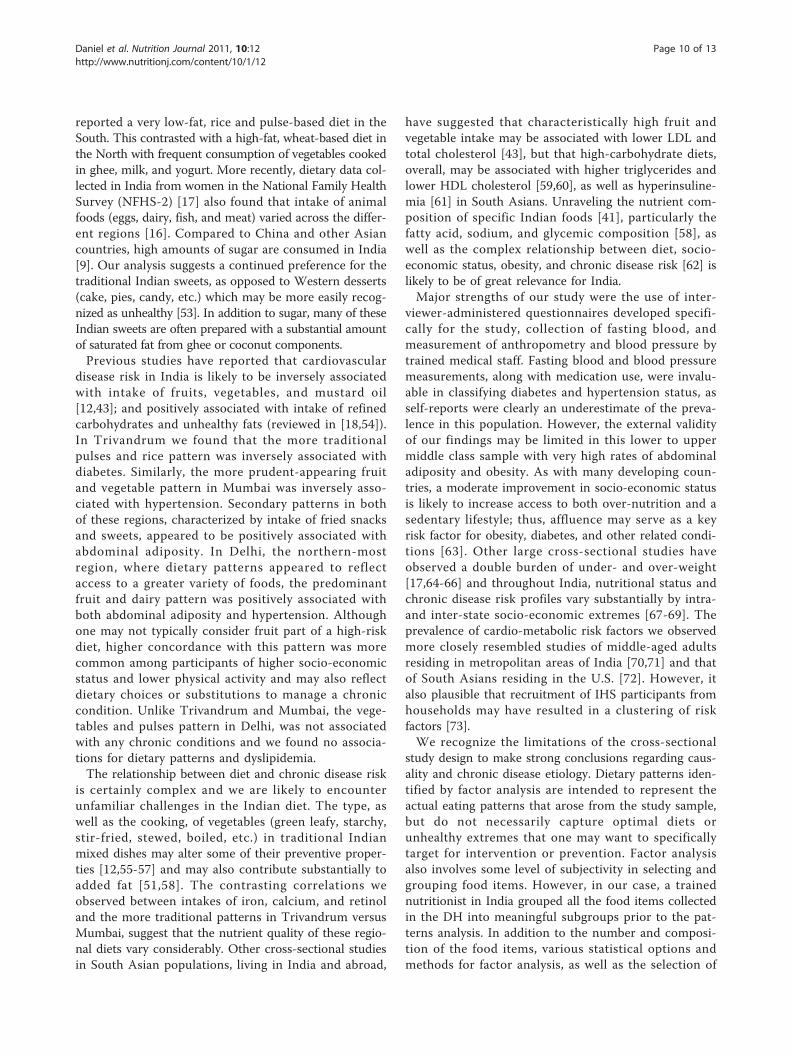
within each region are presented in Table 5. In Delhi, thefruit and dairy pattern was positively associated withboth abdominal adiposity and hypertension, but not asso-ciated with diabetes or dyslipidemia (not shown). Noassociations were found for the secondary pattern inDelhi. In Trivandrum, the pulses and rice pattern wasinversely associated with diabetes (IFG ≥126 mg/dl) and/or pre-diabetes [IFG≥100 mg/dl; OR and 95% CI forhighest versus lowest tertile, 0.69 (0.52-0.92); P trend =0.01; data presented in text only]. The sweets and snackspattern was positively associated with abdominal adipos-ity [OR and 95% CI: 2.05 (1.34-3.14); P trend = 0.03] andpre-diabetes [IFG≥100 mg/dl; OR and 95% CI for highestversus lowest tertile, 1.20 (0.94-1.53); P trend = 0.16; datapresented in text only], but not associated with diabetes(IFG ≥ 126) or hypertension. In Mumbai, the fruit andvegetables pattern was inversely associated with hyper-tension, while the snack and meat pattern appeared to bepositively associated with abdominal adiposity [OR and95% CI: 1.61 (0.96-2.71); P trend = 0.09].In the largest study region, Trivandrum, we conducted a
sensitivity analysis (data presented in text only) comparingdietary patterns associations in participants with normalblood glucose (<100 mg/dl; n = 661; referent group)to each of the following: prediabetics (100-125 mg/dl;
n = 407), untreated diabetics (≥126 mg/dl; n = 232), andtreated diabetics (valid prescription medication for mana-ging blood sugar; n = 252). The pulses and rice patternwas most strongly inversely associated with treated dia-betes [multivariate-adjusted OR and 95% CI, highest tolowest tertile: 0.54 (0.33-0.89); P trend = 0.02]. Conversely,the snack and meat pattern was positively associatedwith treated diabetes [(1.00 (ref), 1.69 (1.11-2.56), 1.76(1.12-2.75); P trend = 0.02].
DiscussionIn each of the study regions two dietary patternsemerged and varied associations with cardio-metabolicrisk factors were observed. In cross-sectional analysesadjusted for key demographic and lifestyle confounders,diets across all regions characterized by dairy, friedsnacks, and sweets appeared to be positively asssociatedwith abdominal adiposity. Conversly, dietary patterns inTrivandrum and Mumbai, characterized by intake ofvegetables and pulses, were inversely related to diabetesand hypertension.South Asians in India, and throughout the world, are
an important population to study due to their greatlyelevated risk of diabetes and cardiovascular disease[38,39]. However, compared to the breadth of studies on
Table 4 Spearman correlations of the mean factor scores for regional dietary patterns with nutrients and food groups,India Health Study
Delhi Trivandrum Mumbai
Factor 1 Factor 2 Factor 1 Factor 2 Factor 1 Factor 2
fruit - dairy vegetables - pulses pulses - rice sweets - snacks fruit - vegetables snacks - meat
Nutrient intake
protein,% TEI NS -0.24 NS -0.19 -0.11 0.25
carbohydrate,% TEI 0.18 -0.13 -0.25 -0.31 NS NS
fat,% TEI -0.18 0.22 0.32 0.48 NS -0.16
cholesterol, mg 0.24 0.14 -0.19 0.38 0.24 0.57
calcium, mg 0.23 0.09 -0.26 0.34 0.61 0.18
iron, mg -0.24 0.17 -0.60 0.20 0.55 0.25
retinol equivalents, mcg -0.08 0.46 -0.28 0.37 0.35 NS
Food group, frequency
total rice NS -0.23 NS -0.07 0.34 NS
total wheat -0.08 0.18 -0.12 0.42 0.21 0.20
total vegetables† 0.08 0.46 0.08 0.52 0.72 -0.15
total potatoes 0.09 0.08 -0.10 0.10 0.35 NS
total pulses -0.53 0.32 0.26 0.23 0.35 0.20
total fruit 0.55 0.22 -0.16 0.43 0.72 0.12
total dairy 0.51 -0.09 0.10 0.34 0.51 0.16
total fish -0.19 -0.21 -0.43 -0.07 0.17 0.32
total meat 0.12 -0.21 -0.20 0.32 0.10 0.46
total sweets -0.09 -0.10 -0.19 0.50 0.39 0.32
N = 824; 2,247; 743 in Delhi, Trivandrum, and Mumbai, respectively.
Abbreviations: TEI, total energy intake; NS, not statistically significant.†not including potatoes.
All P < 0.01 unless otherwise specified as not significant (NS) for multiple comparisons.
Daniel et al. Nutrition Journal 2011, 10:12http://www.nutritionj.com/content/10/1/12
Page 8 of 13
Western-style dietary patterns and chronic disease etiol-ogy [14,40], few studies have examined food patterns inthe high-risk Indian population [13,16,18,41-43] or col-lected biological samples. Compared to Caucasian popu-lations, South Asians typically develop metabolicsyndromes at lower BMIs, and are known to haveincreased visceral fat and insulin resistance [3,44].Abdominal adiposity, impaired glucose and lipid levels,as well as hypertension in a high-proportion of studyparticipants corresponds with the high-risk “AsianIndian phenotype” that may be a product of geneticadaptations to food insecurity, fetal or early childhoodmalnutrition, as well as more recent environmentalexposures including adult diet [2,18,44-49].High fat intake (~40% of total energy intake), particularly
in Delhi and Mumbai, was one indication that components
of the Indian diet may be contributing to a high-risk dietand health profile. However, we found little evidence ofWesternization of the diet [50] through food items, such asred meat, sweetened beverages, and processed or fastfoods, but did observe other characteristics such as sugaryand high-fat foods perhaps reflecting a transitional dietarising from access to cheap oils and sweeteners [8]. Toploading food items for the dietary patterns included fruit,vegetables, chutneys, and tea, as well as traditional Indianfried snacks and desserts. Across all regions, dietary pat-terns frequently contained traditional mixed dishes com-posed mainly of vegetables, pulses, cereals and/or potato,but there were regional differences in the types of cereals(e.g., fermented rice, plain rice, wheat products) and poten-tial protein sources such as pulses, dairy, and eggs. A studyconducted in the 1970’s among Indian physicians [51,52],
Table 5 Multivariate-adjusted associations of regional dietary patterns with abdominal adiposity, hypertension, anddiabetes status, India Health Study
Abdominal Adiposity Hypertension Diabetes¥
Nprev† OR* 95% CI Ptrend Nprev
† OR* 95% CI Ptrend Nprev† OR* 95% CI Ptrend
DELHI Ntot§=703 Ntot
§=763 Ntot§=767
Fruit - dairy
T1 204 1.00 98 1.00 44 1.00
T2 218 1.04 0.55-1.97 108 0.93 0.63-1.38 56 1.13 0.71-1.80
T3 224 2.32 1.03-5.23 0.008 153 2.20 1.47-3.31 <0.0001 38 0.66 0.39-1.11 0.07
Vegetables - pulses
T1 223 1.00 134 1.00 46 1.00
T2 209 1.14 0.55-2.39 100 0.67 0.46-1.00 47 1.18 0.73-1.89
T3 214 0.76 0.38-1.53 0.19 125 0.90 0.61-1.33 0.83 45 0.93 0.57-1.50 0.65
TRIVANDRUM Ntot§=1,789 Ntot
§=1,932 Ntot§=2,014
Pulses - rice
T1 558 1.00 325 1.00 193 1.00
T2 523 0.72 0.45-1.14 311 0.99 0.77-1.27 169 0.74 0.56-0.96
T3 542 0.88 0.39-1.13 0.09 358 1.13 0.84-1.52 0.41 205 0.70 0.51-0.95 0.03
Sweets - snacks
T1 471 1.00 325 1.00 185 1.00
T2 559 2.15 1.41-3.29 339 1.12 0.88-1.44 187 1.13 0.87-1.47
T3 594 2.05 1.34-3.14 0.03 330 1.04 0.80-1.34 0.87 195 1.19 0.90-1.56 0.25
MUMBAI¥ Ntot§=723 Ntot
§=743
Fruit - vegetables
T1 198 1.00 129 1.00
T2 206 1.09 0.67-1.78 111 0.70 0.47-1.05
T3 220 1.28 0.73-2.26 0.37 105 0.63 0.40-0.99 0.05
Snacks - meat
T1 200 1.00 106 1.00
T2 208 0.97 0.61-1.54 114 1.05 0.71-1.55
T3 216 1.61 0.96-2.71 0.09 125 1.21 0.81-1.82 0.32
Abbreviations: OR, odds ratio; CI, confidence interval; T, tertile.§Total number in each region; missing excluded from analysis.†Number of participants who have condition within each sex-specific tertile of dietary pattern concordance.
*Multivariate adjustment for age, gender, education, income, marital status, tobacco and alcohol use, religion, physical activity, total energy intake.¥No fasting blood collected in Mumbai.
Daniel et al. Nutrition Journal 2011, 10:12http://www.nutritionj.com/content/10/1/12
Page 9 of 13
reported a very low-fat, rice and pulse-based diet in theSouth. This contrasted with a high-fat, wheat-based diet inthe North with frequent consumption of vegetables cookedin ghee, milk, and yogurt. More recently, dietary data col-lected in India from women in the National Family HealthSurvey (NFHS-2) [17] also found that intake of animalfoods (eggs, dairy, fish, and meat) varied across the differ-ent regions [16]. Compared to China and other Asiancountries, high amounts of sugar are consumed in India[9]. Our analysis suggests a continued preference for thetraditional Indian sweets, as opposed to Western desserts(cake, pies, candy, etc.) which may be more easily recog-nized as unhealthy [53]. In addition to sugar, many of theseIndian sweets are often prepared with a substantial amountof saturated fat from ghee or coconut components.Previous studies have reported that cardiovascular
disease risk in India is likely to be inversely associatedwith intake of fruits, vegetables, and mustard oil[12,43]; and positively associated with intake of refinedcarbohydrates and unhealthy fats (reviewed in [18,54]).In Trivandrum we found that the more traditionalpulses and rice pattern was inversely associated withdiabetes. Similarly, the more prudent-appearing fruitand vegetable pattern in Mumbai was inversely asso-ciated with hypertension. Secondary patterns in bothof these regions, characterized by intake of fried snacksand sweets, appeared to be positively associated withabdominal adiposity. In Delhi, the northern-mostregion, where dietary patterns appeared to reflectaccess to a greater variety of foods, the predominantfruit and dairy pattern was positively associated withboth abdominal adiposity and hypertension. Althoughone may not typically consider fruit part of a high-riskdiet, higher concordance with this pattern was morecommon among participants of higher socio-economicstatus and lower physical activity and may also reflectdietary choices or substitutions to manage a chroniccondition. Unlike Trivandrum and Mumbai, the vege-tables and pulses pattern in Delhi, was not associatedwith any chronic conditions and we found no associa-tions for dietary patterns and dyslipidemia.The relationship between diet and chronic disease risk
is certainly complex and we are likely to encounterunfamiliar challenges in the Indian diet. The type, aswell as the cooking, of vegetables (green leafy, starchy,stir-fried, stewed, boiled, etc.) in traditional Indianmixed dishes may alter some of their preventive proper-ties [12,55-57] and may also contribute substantially toadded fat [51,58]. The contrasting correlations weobserved between intakes of iron, calcium, and retinoland the more traditional patterns in Trivandrum versusMumbai, suggest that the nutrient quality of these regio-nal diets vary considerably. Other cross-sectional studiesin South Asian populations, living in India and abroad,
have suggested that characteristically high fruit andvegetable intake may be associated with lower LDL andtotal cholesterol [43], but that high-carbohydrate diets,overall, may be associated with higher triglycerides andlower HDL cholesterol [59,60], as well as hyperinsuline-mia [61] in South Asians. Unraveling the nutrient com-position of specific Indian foods [41], particularly thefatty acid, sodium, and glycemic composition [58], aswell as the complex relationship between diet, socio-economic status, obesity, and chronic disease risk [62] islikely to be of great relevance for India.Major strengths of our study were the use of inter-
viewer-administered questionnaires developed specifi-cally for the study, collection of fasting blood, andmeasurement of anthropometry and blood pressure bytrained medical staff. Fasting blood and blood pressuremeasurements, along with medication use, were invalu-able in classifying diabetes and hypertension status, asself-reports were clearly an underestimate of the preva-lence in this population. However, the external validityof our findings may be limited in this lower to uppermiddle class sample with very high rates of abdominaladiposity and obesity. As with many developing coun-tries, a moderate improvement in socio-economic statusis likely to increase access to both over-nutrition and asedentary lifestyle; thus, affluence may serve as a keyrisk factor for obesity, diabetes, and other related condi-tions [63]. Other large cross-sectional studies haveobserved a double burden of under- and over-weight[17,64-66] and throughout India, nutritional status andchronic disease risk profiles vary substantially by intra-and inter-state socio-economic extremes [67-69]. Theprevalence of cardio-metabolic risk factors we observedmore closely resembled studies of middle-aged adultsresiding in metropolitan areas of India [70,71] and thatof South Asians residing in the U.S. [72]. However, italso plausible that recruitment of IHS participants fromhouseholds may have resulted in a clustering of riskfactors [73].We recognize the limitations of the cross-sectional
study design to make strong conclusions regarding caus-ality and chronic disease etiology. Dietary patterns iden-tified by factor analysis are intended to represent theactual eating patterns that arose from the study sample,but do not necessarily capture optimal diets orunhealthy extremes that one may want to specificallytarget for intervention or prevention. Factor analysisalso involves some level of subjectivity in selecting andgrouping food items. However, in our case, a trainednutritionist in India grouped all the food items collectedin the DH into meaningful subgroups prior to the pat-terns analysis. In addition to the number and composi-tion of the food items, various statistical options andmethods for factor analysis, as well as the selection of
Daniel et al. Nutrition Journal 2011, 10:12http://www.nutritionj.com/content/10/1/12
Page 10 of 13
the number of factors to retain in the final analysis, mayalso affect the overall explained factor variance [74].Although we used standard methods and a priorigrouped food items, the detailed DH and large numberof food items collected [75] may have limited variationexplained by the dietary patterns (8-12% within eachregion), as well as overall interpretability. Although ourvariance estimates exceeded those from analyses in simi-larly underserved populations [76], some larger U.S.cohort studies achieved total explained variance levels ashigh as 20 to 30% [35,77]. Dietary patterns analysis con-ducted in some Western cohorts may also have bene-fitted from a larger sample size, as well as a morecohesive population with regard to ethnicity, education,and economic access to a variety of foods to meet nutri-tional needs and preferences.
ConclusionsParticipants in all three regions primarily consumed fooditems that did not appear largely “unhealthy” by Westernstandards. More traditional dietary patterns in the south-ern regions, characterized by intake of vegetables andpulses, were inversely associated with the prevalence ofdiabetes and hypertension. However, overall anthropo-metric and biological measurements spanning across themajority of the study population characterized high-risklevels not usually seen in studies within the U.S. and Eur-ope. Compelling associations between regional Indiandiets and highly prevalent cardio-metabolic risk factors,such as abdominal adiposity and hypertension, suggestthat many of the unique regional components of Indiandiets, such as high-fat dairy, sweets and fried snacks, maybe characterizing a high-risk diet. Continued investiga-tion of diet, evaluating both quality and quantity, as wellas other environmental and biological factors, will beneeded to better understand the risk profile in this popu-lation and potential means of prevention.
Additional material
Additional file 1: Appendix. Distribution of participant characteristicsacross extreme tertiles of regional dietary patterns, India Health Study
AbbreviationsBMI: body mass index; CI: confidence interval; DH: diet history; FFQ: FoodFrequency Questionnaire; IHS: India Health Study; HDL: high densitylipoprotein; IFG: impaired fasting glucose; LDL: low density lipoprotein;MET: metabolic equivalents of task; OR: odds ratio; TC: total cholesterol;TG: triglycerides; WHR: waist-to-hip ratio.
Acknowledgements and FundingsThis research was supported by the Intramural Research Program of the NIH,National Cancer Institute. We are indebted to the participants of the IHS aswell as Sriram Hariharan, Puneet Chadda, Mary McAdams, Eric Berger, andSujata Dixit-Joshi.
Author details1Division of Cancer Epidemiology and Genetics, National Cancer Institute,(6120 Executive Blvd), Rockville, MD, (20852), USA. 2Centre for ChronicDisease Control, (C1/52, Safdarjung Development Area), New Delhi, (110016), India. 3Steno Diabetes Center, (Niels Steensens vej 8), Gentofte, (DK2820), Denmark. 4Department of Cardiac Biochemistry, All India Institute ofMedical Sciences, (Ansari Nagar), New Delhi, (110029), India. 5RegionalCancer Center, (Medical College Campus), Trivandrum, Kerala (695011), India.6Healis Sekhsaria Institute for Public Health, (Thane, Sector 11, CBD Belapur),Navi Mumbai, (400 614), India. 7Westat, (1600 Research Blvd), Rockville, MD,(20850), USA. 8UN World Food Programme, (Via Cesare Giulio Viola, 68),Rome, (00148), Italy.
Authors’ contributionsThe authors’ responsibilities were as follows–CRD conducted the statisticalanalysis, interpretation of results, and drafting of the manuscript; DP, BIG,LMF, and RS contributed to the interpretation of results and drafting of themanuscript; KK served as the study nutritionist and with RS developed thediet assessment; BIG provided statistical and methodological support; NDand PSG recruited study participants and acquired data; LR conductedlaboratory analysis; HS and AM provided site-specific dietary assessmentsupport; YS provided data management and study coordination; RS, DP, AM,PCG, NC, TR, KR conceived of the study, and participated in its design andcoordination. All authors read and approved the final manuscript.
Competing interestsThe authors declare that they have no competing interests.
Received: 9 September 2010 Accepted: 28 January 2011Published: 28 January 2011
References1. Wild S, Roglic G, Green A, Sicree R, King H: Global Prevalence of Diabetes.
Diabetes Care 2004, 27(5):1047-1053.2. Mohan V, Deepa R: Adipocytokines and the expanding ‘Asian Indian
Phenotype’. J Assoc Physicians India 2006, 54:685-686.3. Enas EA, Mohan V, Deepa M, Farooq S, Pazhoor S, Chennikkara H: The
metabolic syndrome and dyslipidemia among Asian Indians: apopulation with high rates of diabetes and premature coronary arterydisease. J Cardiometab Syndr 2007, 2(4):267-275.
4. Lichtenstein AH, Appel LJ, Brands M, Carnethon M, Daniels S, Franch HA,Franklin B, Kris-Etherton P, Harris WS, Howard B, et al: Diet and LifestyleRecommendations Revision 2006: A Scientific Statement From the AmericanHeart Association Nutrition Committee. Circulation 2006, 114(1):82-96.
5. Schulze MB, Hu FB: Primary prevention of diabetes: what can be doneand how much can be prevented? Annu Rev Public Health 2005,26:445-467.
6. Stampfer MJ, Hu FB, Manson JE, Rimm EB, Willett WC: Primary preventionof coronary heart disease in women through diet and lifestyle. N Engl JMed 2000, 343(1):16-22.
7. Rastogi T, Devesa S, Mangtani P, Mathew A, Cooper N, Kao R, Sinha R:Cancer incidence rates among South Asians in four geographic regions:India, Singapore, UK and US. Int J Epidemiol 2008, 37(1):147-160.
8. Caballero B, Popkin BM, (eds.): The Nutrition Transition: Diet and Diseasein the Developing World. Elsevier Science Academic Press; 2002.
9. Popkin BM, Horton S, Kim S, Mahal A, Shuigao J: Trends in Diet, NutritionalStatus, and Diet-related Noncommunicable Diseases in China and India:The Economic Costs of the Nutrition Transition. Nutrition Reviews 2001,59(12):379-390.
10. Shetty PS: Nutrition transition in India. Public Health Nutrition 2002,5(1a):175-182.
11. Rastogi T, Hildesheim A, Sinha R: Opportunities for cancer epidemiologyin developing countries. Nat Rev Cancer 2004, 4(11):909-917.
12. Rastogi T, Reddy KS, Vaz M, Spiegelman D, Prabhakaran D, Willett WC,Stampfer MJ, Ascherio A: Diet and risk of ischemic heart disease in India.Am J Clin Nutr 2004, 79(4):582-592.
13. Yadav K, Krishnan A: Changing patterns of diet, physical activity andobesity among urban, rural and slum populations in north India. ObesRev 2008, 9(5):400-408.
14. Heidemann C, Schulze MB, Franco OH, van Dam RM, Mantzoros CS, Hu FB:Dietary Patterns and Risk of Mortality From Cardiovascular Disease,
Daniel et al. Nutrition Journal 2011, 10:12http://www.nutritionj.com/content/10/1/12
Page 11 of 13
Cancer, and All Causes in a Prospective Cohort of Women. Circulation2008, 118(3):230-237.
15. Mente A, de Koning L, Shannon HS, Anand SS: A Systematic Review of theEvidence Supporting a Causal Link Between Dietary Factors andCoronary Heart Disease. Arch Intern Med 2009, 169(7):659-669.
16. Padmadas SS, Dias JG, Willekens FJ: Disentangling women’s responses oncomplex dietary intake patterns from an Indian cross-sectional survey: alatent class analysis. Public Health Nutrition 2006, 9(02):204-211.
17. International Institute for Population Sciences: National Family HealthSurvey (NFHS-2), 1998-1999. Mumbai, India and Washington, DC, USA; 2000.
18. Misra A, Khurana L, Isharwal S, Bhardwaj S: South Asian diets and insulinresistance. Br J Nutr 2009, 101(4):465-473.
19. Newby PK, Tucker KL: Empirically derived eating patterns using factor orcluster analysis: a review. Nutr Rev 2004, 62(5):177-203.
20. Hu FB: Dietary pattern analysis: a new direction in nutritionalepidemiology. Curr Opin Lipidol 2002, 13(1):3-9.
21. National Cancer Registry Program: Consolidated Report of Population-Based Cancer Registries 2001-2004. Bangalore: Indian Council of MedicalResearch; 2006.
22. Gupta PC, Mehta HC: Cohort study of all-cause mortality among tobaccousers in Mumbai, India. Bull World Health Organ 2000, 78(7):877-883.
23. Zakaria I, Sabry L, Rizek R: Food composition tables for the near east. Foodand Agricultural Organization of the United Nations and the US Departmentof Agriculture cooperative project 1982, 275.
24. Subar AF, Midthune D, Kulldorff M, Brown CC, Thompson FE, Kipnis V,Schatzkin A: Evaluation of alternative approaches to assign nutrientvalues to food groups in food frequency questionnaires. Am J Epidemiol2000, 152(3):279-286.
25. World Health Organization: Expert Consultation: Appropriate body-massindex for Asian populations and its implications for policy andintervention strategies. The Lancet 2004, 363(9403):157-163.
26. Lear SA, James PT, Ko GT, Kumanyika S: Appropriateness of waistcircumference and waist-to-hip ratio cutoffs for different ethnic groups.Eur J Clin Nutr 2010, 64(1):42-61.
27. Macfarlane DJ, Lee CC, Ho EY, Chan KL, Chan DT: Reliability and validity of theChinese version of IPAQ (short, last 7 days). J Sci Med Sport 2007, 10(1):45-51.
28. Craig CL, Marshall AL, Sjostrom M, Bauman AE, Booth ML, Ainsworth BE,Pratt M, Ekelund U, Yngve A, Sallis JF, et al: International physical activityquestionnaire: 12-country reliability and validity. Med Sci Sports Exerc2003, 35(8):1381-1395.
29. Ainsworth BE, Haskell WL, Whitt MC, Irwin ML, Swartz AM, Strath SJ,O’Brien WL, Bassett DR Jr, Schmitz KH, Emplaincourt PO, et al:Compendium of physical activities: an update of activity codes and METintensities. Med Sci Sports Exerc 2000, 32(9 Suppl):S498-504.
30. Lott JA, Turner K: Evaluation of Trinder’s Glucose Oxidase Method forMeasuring Glucose in Serum and Urine. Clin Chem 1975,21(12):1754-1760.
31. Friedewald WT, Levy RI, Fredrickson DS: Estimation of the Concentrationof Low-Density Lipoprotein Cholesterol in Plasma, Without Use of thePreparative Ultracentrifuge. Clin Chem 1972, 18(6):499-502.
32. American Diabetes Association: Diagnosis and Classification of DiabetesMellitus. Diabetes Care 2006, 29(suppl 1):s43-s48.
33. The Expert Committee on the Diagnosis and Classification of DiabetesMellitus: Follow-up Report on the Diagnosis of Diabetes Mellitus. DiabetesCare 2003, 26(11):3160-3167.
34. National Heart Lung and Blood Institute: Third Report of the NationalCholesterol Education Program (NCEP) Expert Panel on Detection,Evaluation, and Treatment of High Blood Cholesterol in Adults (AdultTreatment Panel III) Final Report. Circulation 2002, 106(25):3143.
35. Flood A, Rastogi T, Wirfalt E, Mitrou PN, Reedy J, Subar AF, Kipnis V,Mouw T, Hollenbeck AR, Leitzmann M, et al: Dietary patterns as identifiedby factor analysis and colorectal cancer among middle-aged Americans.Am J Clin Nutr 2008, 88(1):176-184.
36. Willett W: Nutritional Epidemiology. Oxford: Oxford University Press;,Second 1998.
37. Northstone K, Ness AR, Emmett PM, Rogers IS: Adjusting for energy intakein dietary pattern investigations using principal components analysis.Eur J Clin Nutr 2008, 62(7):931-938.
38. Oza-Frank R, Ali MK, Vaccarino V, Narayan KM: Asian Americans: diabetesprevalence across U.S. and World Health Organization weightclassifications. Diabetes Care 2009, 32(9):1644-1646.
39. Stephenson R, Argeseanu S, Oza-Frank R, Hutcheson M, Narayan KM:Cardiometabolic risk among the foreign-born population in the UnitedStates: new pathways for innovative research and health policy. Ethn Dis2008, 18(3):277.
40. van Dam RM, Rimm EB, Willett WC, Stampfer MJ, Hu FB: Dietary patternsand risk for type 2 diabetes mellitus in U.S. men. Ann Intern Med 2002,136(3):201-209.
41. Rao PV: Dietary patterns and glucose intolerance among rural Indianpopulations. J Indian Med Assoc 2002, 100(3):137-140.
42. Radhika G, Sathya RM, Ganesan A, Saroja R, Vijayalakshmi P, Sudha V,Mohan V: Dietary profile of urban adult population in South India in thecontext of chronic disease epidemiology (CURES ? 68). Public HealthNutrition 2010, First View:1-8.
43. Radhika G, Sudha V, Mohan Sathya R, Ganesan A, Mohan V: Association offruit and vegetable intake with cardiovascular risk factors in urban southIndians. British Journal of Nutrition 2008, 99(02):398-405.
44. Misra A, Misra R: Asian indians and insulin resistance syndrome: globalperspective. Metab Syndr Relat Disord 2003, 1(4):277-283.
45. Lakshmy R, Fall CHD, Sachdev HS, Osmond C, Prabhakaran D, Biswas SD,Tandon N, Ramji S, Reddy KS, Barker DJP, et al: Childhood body massindex and adult pro-inflammatory and pro-thrombotic risk factors:data from the New Delhi birth cohort. Int J Epidemiol 2010, July 26[Epub].
46. Raji A, Seely EW, Arky RA, Simonson DC: Body fat distribution and insulinresistance in healthy Asian Indians and Caucasians. J Clin EndocrinolMetab 2001, 86(11):5366-5371.
47. Luthra K, Bharghav B, Chabbra S, Das N, Misra A, Agarwal DP, Pandey RM,Srivastava LM: Apolipoprotein E polymorphism in Northern Indianpatients with coronary heart disease: phenotype distribution andrelation to serum lipids and lipoproteins. Mol Cell Biochem 2002,232(1-2):97-102.
48. Yajnik CS: The lifecycle effects of nutrition and body size on adultadiposity, diabetes and cardiovascular disease. Obesity Reviews 2002,3(3):217-224.
49. Mente A, Razak F, Blankenberg S, Vuksan V, Davis AD, Miller R, Teo K,Gerstein H, Sharma AM, Yusuf S, et al: Ethnic Variation in Adiponectin andLeptin Levels and Their Association With Adiposity and InsulinResistance. Diabetes Care 2010, 33(7):1629-1634.
50. Cordain L, Eaton SB, Sebastian A, Mann N, Lindeberg S, Watkins BA,O’Keefe JH, Brand-Miller J: Origins and evolution of the Western diet:health implications for the 21st century. Am J Clin Nutr 2005,81(2):341-354.
51. Malhotra S: Diabetes mellitus in Indian male railway doctors from southand north of India and in migrants with special reference to causation.J Assoc Physicians India 1973, 21:661-670.
52. Malhotra SL: Geographical aspects of acute myocardial infarction in Indiawith special reference to patterns of diet and eating. Br Heart J 1967,29(3):337-344.
53. Lawton J, Ahmad N, Hanna L, Douglas M, Bains H, Hallowell N: ~We shouldchange ourselves, but we can’t: accounts of food and eating practicesamongst British Pakistanis and Indians with type 2 diabetes. Ethnicity &Health 2008, 13(4):305-319.
54. Mohan V, Radhika G, Vijayalakshmi P, Sudha V: Can the diabetes/cardiovascular disease epidemic in India be explained, at least in part,by excess refined grain (rice) intake? Indian J Med Res 2010,131(March):369-372.
55. Jiménez-Monreal AM, García-Diz L, Martínez-Tomé M, Mariscal M,Murcia MA: Influence of Cooking Methods on Antioxidant Activity ofVegetables. Journal of Food Science 2009, 74(3):H97-H103.
56. Khanum F, Siddalinga Swamy M, Sudarshana Krishna KR, Santhanam K,Viswanathan KR: Dietary fiber content of commonly fresh and cookedvegetables consumed in India. Plant Foods Hum Nutr 2000, 55(3):207-218.
57. Gupta S, Bains K: Traditional cooked vegetable dishes as importantsources of ascorbic acid and beta-carotene in the diets of Indian urbanand rural families. Food Nutr Bull 2006, 27(4):306-310.
58. Shi Z, Hu X, Yuan B, Hu G, Pan X, Dai Y, Byles JE, Holmboe-Ottesen G:Vegetable-rich food pattern is related to obesity in China. Int J Obes2008, 32(6):975-984.
59. Merchant AT, Anand SS, Kelemen LE, Vuksan V, Jacobs R, Davis B, Teo K,Yusuf S, SHARE ft, Investigators SHARE-AP: Carbohydrate intake and HDLin a multiethnic population. Am J Clin Nutr 2007, 85(1):225-230.
Daniel et al. Nutrition Journal 2011, 10:12http://www.nutritionj.com/content/10/1/12
Page 12 of 13
60. Park SH, Lee KS, Park HY: Dietary carbohydrate intake is associated withcardiovascular disease risk in Korean: Analysis of the third KoreaNational Health and Nutrition Examination Survey (KNHANES III).International Journal of Cardiology 2010, 139(3):234-240.
61. Sevak L, McKeigue P, Marmot M: Relationship of hyperinsulinemia todietary intake in south Asian and European men. Am J Clin Nutr 1994,59(5):1069-1074.
62. Martikainen P, Brunner E, Marmot M: Socioeconomic differences in dietarypatterns among middle-aged men and women. Soc Sci Med 2003,56(7):1397-1410.
63. Mohan V, Mathur P, Deepa R, Deepa M, Shukla DK, Menon GR, Anand K,Desai NG, Joshi PP, Mahanta J, et al: Urban rural differences in prevalenceof self-reported diabetes in India–the WHO-ICMR Indian NCD risk factorsurveillance. Diabetes Res Clin Pract 2008, 80(1):159-168.
64. Reddy KS, Prabhakaran D, Chaturvedi V, Jeemon P, Thankappan KR,Ramakrishnan L, Mohan BV, Pandav CS, Ahmed FU, Joshi PP, et al: Methodsfor establishing a surveillance system for cardiovascular diseases inIndian industrial populations. Bull World Health Organ 2006, 84(6):461-469.
65. Griffiths PL, Bentley ME: The nutrition transition is underway in India.J Nutr 2001, 131(10):2692-2700.
66. Wang Y, Chen HJ, Shaikh S, Mathur P: Is obesity becoming a public healthproblem in India? Examine the shift from under- to overnutritionproblems over time. Obes Rev 2009, 10(4):456-474.
67. Subramanian SV, Kawachi I, Smith GD: Income inequality and the doubleburden of under- and overnutrition in India. J Epidemiol CommunityHealth 2007, 61(9):802-809.
68. Kinra S, Bowen LJ, Lyngdoh T, Prabhakaran D, Reddy KS, Ramakrishnan L,Gupta R, Bharathi AV, Vaz M, Kurpad AV, et al: Sociodemographicpatterning of non-communicable disease risk factors in rural India: across sectional study. BMJ 2010, 341.
69. Reddy KS, Prabhakaran D, Jeemon P, Thankappan KR, Joshi P, Chaturvedi V,Ramakrishnan L, Ahmed F: Educational status and cardiovascular riskprofile in Indians. Proc Natl Acad Sci USA 2007, 104(41):16263-16268.
70. Singh RB, Pella D, Mechirova V, Kartikey K, Demeester F, Tomar RS,Beegom R, Mehta AS, Gupta SB, De Amit K, et al: Prevalence of obesity,physical inactivity and undernutrition, a triple burden of diseases duringtransition in a developing economy. The Five City Study Group. ActaCardiol 2007, 62(2):119-127.
71. Wang Y, Chen HJ, Shaikh S, Mathur P: Is obesity becoming a public healthproblem in India? Examine the shift from under- to overnutritionproblems over time. Obesity Reviews 2009, 10(4):456-474.
72. Wang ET, de Koning L, Kanaya AM: Higher Protein Intake Is Associatedwith Diabetes Risk in South Asian Indians: The Metabolic Syndrome andAtherosclerosis in South Asians Living in America (MASALA) Study. J AmColl Nutr 2010, 29(2):130-135.
73. Mohan V, Shanthirani CS, Deepa R: Glucose intolerance (diabetes and IGT)in a selected South Indian population with special reference to familyhistory, obesity and lifestyle factors–the Chennai Urban PopulationStudy (CUPS 14). J Assoc Physicians India 2003, 51:771-777.
74. Martinez ME, Marshall JR, Sechrest L: Invited commentary: Factor analysisand the search for objectivity. Am J Epidemiol 1998, 148(1):17-19.
75. Iqbal R, Ajayan K, Bharathi AV, Zhang X, Islam S, Soman CR, Merchant AT:Refinement and validation of an FFQ developed to estimate macro- andmicronutrient intakes in a south Indian population. Public Health Nutrition2009, 12(01):12-18.
76. Hamer M, Mishra GD: Dietary patterns and cardiovascular risk markers inthe UK Low Income Diet and Nutrition Survey. Nutr Metab Cardiovasc Dis2010, 20(7):491-497.
77. Hu FB, Rimm E, Smith-Warner SA, Feskanich D, Stampfer MJ, Ascherio A,Sampson L, Willett WC: Reproducibility and validity of dietary patternsassessed with a food-frequency questionnaire. Am J Clin Nutr 1999,69(2):243-249.
doi:10.1186/1475-2891-10-12Cite this article as: Daniel et al.: A cross-sectional investigation ofregional patterns of diet and cardio-metabolic risk in India. NutritionJournal 2011 10:12.
Submit your next manuscript to BioMed Centraland take full advantage of:
• Convenient online submission
• Thorough peer review
• No space constraints or color figure charges
• Immediate publication on acceptance
• Inclusion in PubMed, CAS, Scopus and Google Scholar
• Research which is freely available for redistribution
Submit your manuscript at www.biomedcentral.com/submit
Daniel et al. Nutrition Journal 2011, 10:12http://www.nutritionj.com/content/10/1/12
Page 13 of 13


