Embed Size (px)
Citation preview

313ROZOWSKI & CASTILLO. Biol Res 37, 2004, 313-319Biol Res 37: 313-319, 2004 BRIs the Chilean Diet a Mediterranean-type Diet?
JAIME ROZOWSKI and ÓSCAR CASTILLO
Department of Nutrition and Diabetes, Faculty of Medicine, Pontifical Catholic University of Chile, Santiago,Chile
ABSTRACT
Food intake in Chile has changed markedly in the last decades, showing an increase in fat consumption andpresently a small fruit and vegetables intake. A parallel is made between the Chilean and Mediterranean diet(mainly the one from Spain, Italy, and Greece), both currently and from 50 years ago. The main differencesand similarities are based on food availability. Although Chilean diet seems to be approaching the traditionalMediterranean diet of the 60’s, there is concern about changes that are moving away from Chilean traditionaldiet and towards a western one. A new food pyramid for Chile is proposed based on the traditionalMediterranean-type diet.
Corresponding author: Jaime Rozowski. Departamento de Nutrición, Diabetes y Metabolismo, Facultad de Medicina,Pontificia Universidad Católica. Santiago, Chile. Phone: 56 2 354 3859. Fax: 56 2 633 8298. E-mail: [email protected]
Received: December 15, 2003. Accepted: January 7, 2004.
INTRODUCTION
The last decades have witnessed a radicalchange in the way we feed ourselves. Theaccess to food and its availability havemarkedly increased in this period of timeand the establishment of large food outletshas made purchasing items very simple.This is true not only for the well-to-do butalso for the poor population in manydeveloping countries.
This pattern of change has also beenpresent in Chile. In the last 5 decadesmalnutrition has practically disappeared,and infant mortality rate has decreased from120/1000 live births to less than 7/1000 livebirths nowadays (1). Unfortunately, in thesame period of time we have seen adramatic increase in the prevalence ofobesity, currently at levels comparable tothose of developed countries (2).Nevertheless, health indicators, in general,have improved markedly in the country (1).
Recently the World Health Organizationdeveloped an indicator called HALE(Healthy Life Expectancy at Birth), whichalso takes into consideration the appearanceof disease during the life of an individual(3). Table I shows the HALE indicator for
some selected countries. The ChileanHALE is one of the highest in SouthAmerica, and is very similar to the one inthe US. Although in Chile, HALE is stilllower than in European Mediterraneancountries, this measurement suggests thatthe Chilean environment is more favorablethan that of other countries in SouthAmerica. Obviously diet plays an importantrole here, but there are other aspects worthestablishing. Chilean health expendituresper capita (US$ 654) are lower than in themajority of the more developed countries inSouth America, with the exception of Cuba(US$ 303) and Costa Rica (US$ 450), andsubstantially lower than in the US and inthe Mediterranean countries mentionedpreviously (4). The country also has arelatively low number of physicians /100,000 inhabitants (140) compared to 530in Cuba, 279 in the US, 303 in France, 424in Spain, 554 in Italy, and 392 in Greece(3).
So what is so special about the Chileanenvironment that makes it favorable to thehealth of its population? Although there aremany factors influencing the outcome, wewill concentrate on the Chilean diet and itscomparison with the one from

ROZOWSKI & CASTILLO. Biol Res 37, 2004, 313-319314
Mediterranean countries, since their diethas been widely recognized as a healthyone (5-15).
One of the problems that we encounterin analyzing the Chilean diet is the lack ofnational nutrition surveys. The first wasdone in 1960 (16) and the second (and lastone) was performed in 1974 (17).Therefore, we have no idea of thecomposition of the Chilean diet at anational level. The information we do havecomes from studies in relatively smallsamples obtained mainly from the largecities or that are non-representative. Forthis reason, we decided to analyze the
TABLE I
Healthy life expectancy at birth (HALE) in selected countries.
Country HALE(years)
Italy 71.2Greece 71.0France 70.7Spain 70.6USA 67.2Cuba 65.9Chile 65.5Costa Rica 65.3Argentina 63.9
Source: Reference 3
information provided by FAO in terms ofavailability of food (18). Although werecognize that this may be different fromwhat is actually consumed by theindividual, it is the only data currentlyavailable that can be used to compare dietsin different countries.
COMPARISON OF THE CHILEAN AND
MEDITERRANEAN DIET
Table II shows the percentage of totalcalories contributed by different foods tothe diet of Chile and Spain in the period
TABLE II
Calories availability contributed by food items in Spain and Chile as percentage of totalcalories.
Chile 1993-95 Spain 1993-95% Calories % Calories
Cereals 41 23Tubers 3.8 4.8Sugar 16 8.8Legumes 1 2,7Fruits and vegetables 6 7.2Vegateble oil 9 19.5Red meet 7.6 9.6Poultry 3 2.5Fish 2 2.3Dairy products 6.2 7.9Others 4.4 11.7
Source: Reference 18

315ROZOWSKI & CASTILLO. Biol Res 37, 2004, 313-319
between 1993-1995. As we can see,Chileans consume a much higher proportionof cereals (mainly bread) and sugar thanSpaniards. We also consume less tubers,legumes, fruits and vegetables, vegetableoil, and dairy products.
In order to expand this analysis wecompared food availability in grams/day inChile, Italy, Greece, and Spain, using theSpanish data as the unit (Fig 1). Asobserved in Figure 1, we do consume morecereals than Spain but less than Italy orGreece. Our meat consumption (whichincludes chicken, a main staple in Chileandiet) is lower than in the threeMediterranean countries. The same happensfor dairy products, fruits and vegetables,vegetable oil , and legumes. Potatoconsumption in Chile is lower than in Spainand Greece but higher than in Italy. Weconsume more eggs than the Mediterraneancountries and substantially less fish thanSpain and Greece and more than Italy.
This information indicates that Chileshows a varied pattern of food availabilitycompared to Mediterranean countries.
Nevertheless, several reports have shownthat the diet of Mediterranean countries hasundergone changes with time (19, 20). Wetherefore decided to study, again usingFAO data, which changes have taken placewith time in the availability of food from1961 to 1999 in Chile, Spain and Italy (18).
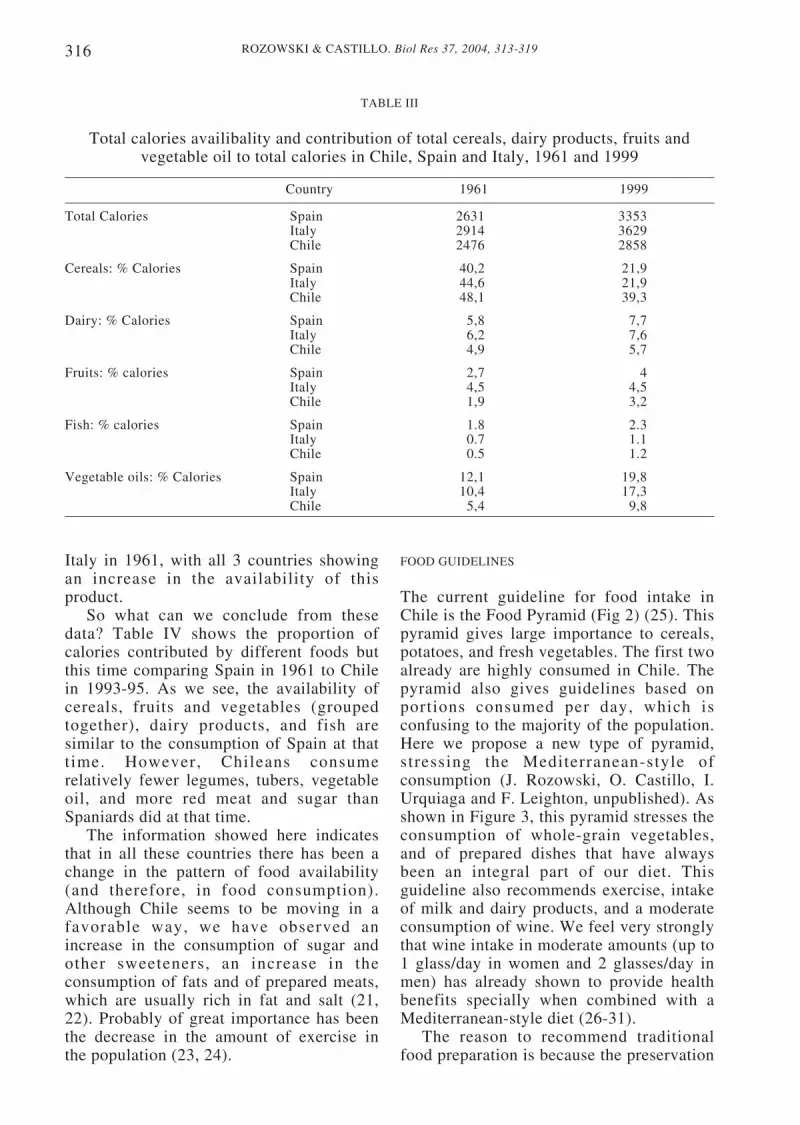
Table III shows the changes in totalcalories in the three countries. In all ofthem there has been an increase inavailability, although the increase has beenslower in Chile. What is interesting to pointout is that calorie availability in Chile isnow at the level of availability in Spainaround 1970, and we are approaching theavailability of Italy in 1961. A similarpattern was observed for the contribution ofcereals, dairy products, and fruits to totalcalories (Table III). Contribution ofvegetables to total calories has decreased inSpain and Chile and increased in Italy,while fish availability has increased in allof them (data not shown). Nevertheless,fish consumption in Italy and Chile is muchlower than in Spain. In terms of availabilityof vegetable oil, Chile is now at the level of
Figure 1. Relative consumption of foods in Spain (unit), Chile, Italy, and Greece, 1999. Source:Reference 18.
3
2,5
2
1,5
1
0,5
0
Italy
Greece
Chile
Spain
Cerea
lsM
eat
Fish
Milk
Fruits
Veget
ables
Potato
sEggs
Veget
able
s oil
Legum
es
Sugar
ROZOWSKI & CASTILLO. Biol Res 37, 2004, 313-319316
Italy in 1961, with all 3 countries showingan increase in the availability of thisproduct.
So what can we conclude from thesedata? Table IV shows the proportion ofcalories contributed by different foods butthis time comparing Spain in 1961 to Chilein 1993-95. As we see, the availability ofcereals, fruits and vegetables (groupedtogether), dairy products, and fish aresimilar to the consumption of Spain at thattime. However, Chileans consumerelatively fewer legumes, tubers, vegetableoil, and more red meat and sugar thanSpaniards did at that time.
The information showed here indicatesthat in all these countries there has been achange in the pattern of food availability(and therefore, in food consumption).Although Chile seems to be moving in afavorable way, we have observed anincrease in the consumption of sugar andother sweeteners, an increase in theconsumption of fats and of prepared meats,which are usually rich in fat and salt (21,22). Probably of great importance has beenthe decrease in the amount of exercise inthe population (23, 24).
TABLE III
Total calories availibality and contribution of total cereals, dairy products, fruits andvegetable oil to total calories in Chile, Spain and Italy, 1961 and 1999
Country 1961 1999
Total Calories Spain 2631 3353Italy 2914 3629Chile 2476 2858
Cereals: % Calories Spain 40,2 21,9Italy 44,6 21,9Chile 48,1 39,3
Dairy: % Calories Spain 5,8 7,7Italy 6,2 7,6Chile 4,9 5,7
Fruits: % calories Spain 2,7 4Italy 4,5 4,5Chile 1,9 3,2
Fish: % calories Spain 1.8 2.3Italy 0.7 1.1Chile 0.5 1.2
Vegetable oils: % Calories Spain 12,1 19,8Italy 10,4 17,3Chile 5,4 9,8
FOOD GUIDELINES
The current guideline for food intake inChile is the Food Pyramid (Fig 2) (25). Thispyramid gives large importance to cereals,potatoes, and fresh vegetables. The first twoalready are highly consumed in Chile. Thepyramid also gives guidelines based onportions consumed per day, which isconfusing to the majority of the population.Here we propose a new type of pyramid,stressing the Mediterranean-style ofconsumption (J. Rozowski, O. Castillo, I.Urquiaga and F. Leighton, unpublished). Asshown in Figure 3, this pyramid stresses theconsumption of whole-grain vegetables,and of prepared dishes that have alwaysbeen an integral part of our diet. Thisguideline also recommends exercise, intakeof milk and dairy products, and a moderateconsumption of wine. We feel very stronglythat wine intake in moderate amounts (up to1 glass/day in women and 2 glasses/day inmen) has already shown to provide healthbenefits specially when combined with aMediterranean-style diet (26-31).
The reason to recommend traditionalfood preparation is because the preservation

317ROZOWSKI & CASTILLO. Biol Res 37, 2004, 313-319
TABLE IV
Calories availability contributed by food items in Spain and Chile as a percentage of totalcalories.
Spain 1961 Chile 1993-95% Calories % Calories
Cereals 40.2 41Tubers 9 3.8Sugar 7.6 16Legumes 3.4 1Fruits and Vegetables 6.7 6Vegetable oil 12.1 9Red meet 3 7.6Poultry 0.3 3Fish 1.8 2Dairy products 5.8 6.2Others 10.1 4.4
Source: Reference 18
Figure 2. Chilean food pyramid. Source: Reference 22.
V nivel
IV nivel
III nivel
II nivel
I nivel
VERDURAS
AZUCAR
ACEITE,GRASAS YSEMILLAS
PESCADOS,CARNES,HUEVOS YLEGUMBRESSECAS
FRUTAS
CEREALES,PAPAS YLEGUMBRESFRESCAS

ROZOWSKI & CASTILLO. Biol Res 37, 2004, 313-319318
Figure 3. Proposed Mediterranean food pyramid for Chile. Source: J Rozowski, O Castillo, IUrquiaga, F. Leighton, unpublished.
of traditional Chilean dishes like porotoscon riendas (beans and spaghetti), pastel dechoclo (a combination of corn and groundmeat), empanadas (ground meat and onionsturnover), mariscal (a combination of fishand seafood), all Mediterranean-styledishes, will maintain a pattern of eatingconducive to less incidences ofcardiovascular disease and other chronicafflictions.
ACKNOWLEDGEMENTS
This work was partially supported by theprogram “Molecular Basis of Chronic
Diseases.” The authors would like to thankthe expert help of Ms. Marisol Caceres inthe preparation of this manuscript.
REFERENCES
1. MINISTRY OF HEALTH, Chile. www.minsal.claccessed 5 December 2003.
2. ROZOWSKI J, ARTEAGA A. (1997) El problema dela obesidad y sus alarmantes características en Chile.Rev Med Chile 125: 217-224.
3. WORLD HEALTH ORGANIZATION. http:/ /www3.who.int/whosis/hale. accessed 11 November2003
4. PAN AMERICAN HEALTH ORGANIZATION (2002)Health in the Americas. Washington, PAHO. Volume Iand II.
PIRAMIDE DELA DIETA MEDITERRANEA EN CHILE
OCASIONAL
SEMANAL
DIARIO
CONSUMOMODERADODE VINO
AGUA
Simposio International Dietas Mediterráneas26 y 27 de octubre 2001, Universidad Católica de Chile
COMIDARAPIDA
CARNES ROJAS
QUEQUE HELADO
GALLETAS DULCES
HUEVOS
AVES SIN PIEL
PESCADOS YMARISCOS
LEGUMBRES
ACEITES VEGETALESACEITUNAS
MANI
NUECES
LECHE DESCREMADA
YOGHURT
QUESO
QUESILLO
FRUTAS VERDURAS
ARROZ
PASTA
PAPAS
CEREAL DESAYUNO
PAN

319ROZOWSKI & CASTILLO. Biol Res 37, 2004, 313-319
5. TRICHOPOULOU A, LAGIOU P (1997) Healthytraditional Mediterranean diet: An expression ofculture, history and lifestyle. Nutr Rev 55 (11): 383-388
6. HELSING E (1995) Traditional diets and diseasepatterns of the Mediterranean, Circa 1960. Am J ClinNutr 61 (Suppl): 1329S-1337S
7. SERRA-MAJEM LL, RIBAS L, TRESSERRAS R,NGO J, SALLERAS LL (1995) How could changes indiet explain changes in coronary heart diseasemortality in Spain? The Spanish paradox. Am J ClinNutr 61 (Suppl): 1351S-1359S
8. RENAUD S, DE LORGERIL M, DELAYE J,GUIDOLLET J, JACQUARD F, MAMELLE N,MARTIN J, MONJAUD I, SALEN P, TOUBOL P (1995)Cretan Mediterranean diet for prevention of coronaryheart disease. Am J Clin Nutr 61 (Suppl): 1360S-1367S
9. TAVANI A, LA VECCHIA C (1995) Fruit and vegetableconsumption and cancer risk in a Mediterraneanpopulation. Am J Clin Nutr 61 (Suppl): 1374S-1377S
10. KUSHI L, LENART E, WILLET W (1995) Healthimplications of Mediterranean diets in light ofcontemporary knowledge. 1. Plants foods and dairyproducts. Am J Clin Nutr 61 (Suppl): 1407S-1415S
11. KUSHI L, LENART E, WILLET W (1995) Healthimplications of Mediterranean diets in light ofcontemporary knowledge. 2. Meat, wine, fats and oil.Am J Clin Nutr 61 (Suppl): 1416S-1427S
12. MISIOLI F, GALLI C (1998) The effect of minorconstituents of olive oil on cardiovascular disease:New findings. Nutr Rev 56 (5): 142-147
13. TABAK C, FESKENS EJM, HEEDERICK D,KROMHOUT D, MENOTTI A, BLACKBURN H W(1998) Fruit and fish consumption: a possible explanationfor population differences in COPD mortality (the sevencountries study). Eur J Clin Nutr 52: 819-825
14. HERTOG M, KROMHOUT D, ARAVANIS C,BLACKBURN H, BUZINA R, FIDANZA F (1995)Flavonoid intake and long-term risk of coronary heartdisease and cancer in the Seven Countries Study. ArchInt Med 155: 381-386
15. MEZZANO D, LEIGHTON F, MARTÍNEZ C,MARSHALL G, CUEVAS A, CASTILLO O, PANESO, MUÑOZ B, PÉREZ DD, MIZÓN C, ROZOWSKI J,SAN MARTÍN A, PEREIRA J. (2001) Complementaryeffects of Mediterranean diet and moderate red wineintake on haemostatic cardiovascular risk factors. Eur JClin Nutr 55: 444-451.
16. ICNND. Nutrition Survey, Chile, March – June 1960.A report by the Interdepartmental Committee ofNutrition for National Defence. Washington, DC, 1961
17. MINISTRY OF HEALTH, CHILE (1976) Encuestacontinuada sobre el estado nutricional de la poblaciónchilena (ECEN). Julio 1974 – Junio 1975. Santiago deChile.
18. FOOD AND AGRICULTURAL ORGANIZATION(2001) FAO’s Statistical Data Bases. Country FoodBalance Sheets, 1964-1996. <http://apps.fao.org/page/
collections?subset=agriculture>. Accessed 10 October2003.
19. SIMOPOULOS AP, SIDOSSIS LS (2000) What is sospecial about the traditional diet of Greece. InSIMOPOULOS AP, VISIOLI FN (eds) MediterraneanDiets. World Rev Nutr Diet vol 87: Basel, Karger pp:24-42.
20. SIMOPOULOS AP (2004) Omega-3 Fatty Acids andAntioxidants in Edible Wild Plants. Biol Res 37: 263-277
21. ALBALA C, VIO F, KAIN J, UAUY R (2001)Nutrition transition in Latin America: The case ofChile. Nut Rev 59: 170-176.
22. VALENZUELA A, SANHUEZA J; NIETO S. (2003)Cholesterol oxidation: Health hazard and the role ofantioxidants in prevention. Biol Res 36: 291-302
23. JADUE L, VEGA J, ESCOBAR MC, DELGADO I,GARRIDO C, LASTRA P, ESPEJO F, PERUGA A(1999) Factores de riesgo para las enfermedades notransmisibles: Metodología y resultados de base delprograma CARMEN (Conjunto de Acciones para laReducción Multifactorial de las Enfermedades noTransmisibles). Rev Med Chile 127: 1004-1013.
24. BURNEIKO RC, DINIZ YS, FAINE LA, GALHARDICM, PADOVANI CR, NOVELLI ELB, CICOGNAAC. (2004) Impact of the training program on lipidprofile and cardiac health. Biol Res 37: 53-59
25. CASTILLO C, UAUY R, ATALAH E (1997) Guías deAlimentación para la población chilena: Santiago,Ministerio de Salud. pp. 129-149.
26. BERGER K, AJANI UA, KASE CS, GAZIANNO JM,BURING JE, GLYNN RJ, HANNEKENS CH (1999)Light-to-moderate wine consumption and the risk ofstroke among US male physicians. New Engl J Med341: 1557-1564.
27. WANNAMETTHEE SG, SHARPER AG (1999) Typeof alcoholic drink and risk of major coronary heartdisease events and all-cause mortality. Am J PublicHealth 89: 685-690.
28. DE LORGERIL M, SALEN P (1999) Wine ethanol,platelets, and Mediterranean diets. Lancet 353: 1067.
29. DE LORGERIL M, MARTIN JL, MONJAUD I,DELAYE J, MAMELLE N (1999) Mediterranean diets,traditional risk factors, and the traditional risk factors,and the rate of cardiovascular complications aftermyocardial infarction: final report of the Lyon HeartStudy. Circulation 99: 779-785
30. NAIR MP, KANDASWAMI C, MAHAJAN S, NAIRHN, CHAWDA R, SHANAHAN T, SCHWARTZ SA:(2002) Grape seed extract proanthocyanidinsdownregulate HIV- 1 entry coreceptors, CCR2b, CCR3and CCR5 gene expression by normal peripheral bloodmononuclear cells. Biol Res 35: 421-431
31. ROMANQUE P, URIBE-ECHEVARRÍA S,MATAMALA R, FLORES JM, URIBE M, VIDELALA. (2003) Influence of grape seed bioflavonoids onischemia-reperfusion liver injury in rats. XLVIReunión Anual de la Sociedad de Biología de Chile.Biol Res 36: R-35


