Embed Size (px)
Citation preview
Journal of Complex Networks (2021) 00, 1–16doi: 10.1093/comnet/cnab003
A complex networks approach to ranking professional Snooker players
Joseph D. O’Brien†
and James P. Gleeson
MACSI, Department of Mathematics and Statistics, University of Limerick, Limerick V94 T9PX, Ireland†Corresponding author. Email: [email protected]
Edited by: Ernesto Estrada
[Received on 15 October 2020; editorial decision on 15 December 2020; accepted on 14 January 2021]
A detailed analysis of matches played in the sport of Snooker during the period 1968–2020 is used tocalculate a directed and weighted dominance network based upon the corresponding results. We considera ranking procedure based upon the well-studied PageRank algorithm that incorporates details of not onlythe number of wins a player has had over their career but also the quality of opponent faced in these wins.Through this study, we find that John Higgins is the highest performing Snooker player of all time withRonnie O’Sullivan appearing in second place. We demonstrate how this approach can be applied acrossa variety of temporal periods in each of which we may identify the strongest player in the correspondingera. This procedure is then compared with more classical ranking schemes. Furthermore, a visualizationtool known as the rank-clock is introduced to the sport which allows for immediate analysis of the careertrajectory of individual competitors. These results further demonstrate the use of network science in thequantification of success within the field of sport.
Keywords: network analysis; PageRank; sports; science of success.
1. Introduction
Each day competitive contests between similar entities occur in the hope of one proving dominant over theother. These contests have been shown to be wide-ranging with examples including animals combatingin order to prove their strength [1, 2], online content producers aiming to create a popular post [3–5]or the quantification of the scientific quality underlying a researcher’s output [6–9]. In most of thesescenarios, it proves difficult to ultimately determine the stronger of two such competitors for a numberof reasons, most evidently the lack of explicit quantitative data describing the corresponding result fromeach contest. One noticeable exemption to this predicament is in the case of competitive sports where,on the contrary, there exists an abundance of data available from extended periods of time describing theresults of contests. This source of empirical data has resulted in an entire domain of study in applyingthe theoretical concepts of complex systems to the field of sport [10–12].
The application of these tools has resulted in a greater understanding of the dynamics underlying anumber of sporting contests including soccer [13, 14], baseball [15, 16], basketball [17–19] and morerecently even virtual sporting contests based upon actual sports [20, 21]. An area that has receivedmuch focus and which is most relevant to the present work is the application of network science [22] inidentifying important sporting competitors in both team and individual sports. This has led to analysisin a range of sports including team-based games such as soccer where the identification of importantplayers within a team’s structure has been considered [23, 24] and cricket, where rankings of both teamsand the most influential player in specialty roles including captains, bowlers and batsmen have beenconsidered [25, 26]. Analysis has also been conducted into individual-based sports, again with the aim of
© The Author(s) 2021. Published by Oxford University Press. This is an Open Access article distributed under the termsof the Creative Commons Attribution License (http://creativecommons.org/licenses/by/4.0/), which permits unrestricted reuse,
distribution, and reproduction in any medium, provided the original work is properly cited.
Dow
nloaded from https://academ
ic.oup.com/com
net/article/8/6/cnab003/6161497 by guest on 23 June 2022
2 J. D. O’BRIEN AND J. P. GLEESON
providing a ranking of players within a given sport. For example, the competitors within both professionaltennis [27] and boxers, at an individual weight level [28] and a pound-for-pound level [29], have beenextensively studied. Lastly, rankings at a country level based upon their success across the spectrum ofOlympic Games sports have also been considered [30].
In this article, we focus on the application of network science to the sport of Snooker—a cue-basedgame with its origins in the late 19th century from the military bases of British officers based in India.The game is played on a cloth-covered rectangular table which has six pockets located at the four cornersand two along the middle of the longer sides. The players strike the cue ball (which is white) with theircue such that it strikes another of the 21 coloured balls which is then ideally pocketed, that is, it falls intoone of the pockets. The order in which the different coloured balls must be pocketed is pre-determinedand a player is awarded different points depending on the colour of ball pocketed. For each set of balls(known as a frame), one player has the first shot and continues to play until they fail to pocket a ball,at which point their competitor then has their own attempt. The number of points scored by a player ina single visit to the table is known as a break. The player who has the most points after all balls havebeen pocketed (or the other player concedes) is the winner of the frame. A Snooker match itself generalconsists of an odd number of frames such that the players compete until it is impossible for the other towin, that is, the winner reaches a majority of frames.
The popularization of Snooker came in conjunction with the advent of colour television where thesport demonstrated the potential applicability of this new technology for entertainment purposes [31].From the 1970s onwards Snooker’s popularity grew among residents of the UK and Ireland, culminatingin the 1985 World Championship—the final of which obtained a viewership of 18.5 million, a record atthe time for any broadcast shown after midnight in the UK. The sport continued to increase in popularityover the 1990s with there being a significant increase in the number of professional players. It was,however, dealt a blow in 2002 with the introduction of government legislation, finalized in 2005, whichresulted in the banning of sponsorship from the tobacco companies who were major benefactors of thesport. There has been a revitalization in the sport over the past decade however with a reorganizationof the governing body World Snooker [32] and a resulting increase in both the number of competitivetournaments alongside the corresponding prize-money on offer for the players. One notable consequenceof this change is the way in which the official rankings of the players is determined. Specifically, therehas been a change from the points-based system which was the method of choice from 1968 to 2013towards a system based upon the player’s total prize-winnings in monetary terms. The question arises asto whether this approach more accurately captures the actual ranking of a player’s performances over theseason in terms of who is capable of beating whom and if, alternatively, a more accurate approach exists.
Motivated by this question, in this article, we consider a dataset of competitive Snooker matches takenover a period of over 50 years (1968–2020) with the aim of firstly constructing a networked representationof the contests between each player. This is obtained by representing all the matches between two playersas a weighted connection, which we show to have similar features to apparently unrelated complexsystems [22]. Using this conceptual network, we proceed to make use of a ranking algorithm similar inspirit to the PageRank algorithm [33] from which we can quantify the quality of players over multipledifferent temporal periods within our dataset. Importantly, this algorithm is based purely on the networktopology itself and does not incorporate any external factors such as points or prize-winnings. Thebenefit offered by this approach is that, through the aforementioned dominance network, the quality ofcompetition faced in each game is incorporated when determining a player’s rank rather than simply thefinal result itself. As such, the algorithm places higher levels of importance in victory against other playerswho are perceived as successful and, notably, similar approaches have proven effective when applied toother sports resulting in numerous new insights to the competitive structure of said contests [25–29].
Dow
nloaded from https://academ
ic.oup.com/com
net/article/8/6/cnab003/6161497 by guest on 23 June 2022
COMPLEX NETWORKS APPROACH TO RANKING SNOOKER PLAYERS 3
Through this ranking system, we proceed to highlight a number of interesting properties underlying thesport including an increased level of competition among players over the previous 30 years. We alsodemonstrate that while prior to its revitalization Snooker was failing to capture the dominance-rankingof players in the sport through its points-based ranking scheme, the subsequent change in the rankingsystem to a prize-money basis is also inaccurate. We investigate the quality of different ranking schemesin comparison to the PageRank approach using similarity metrics and also introduce a graphical toolknown as a rank-clock [34] to the sport of Snooker which allows one to interpret how a player’s rank haschanged over the course of their career. Finally, we conclude with a discussion on the work and how itoffers the potential for a new form of the ranking scheme within the sport of Snooker.
2. Methods
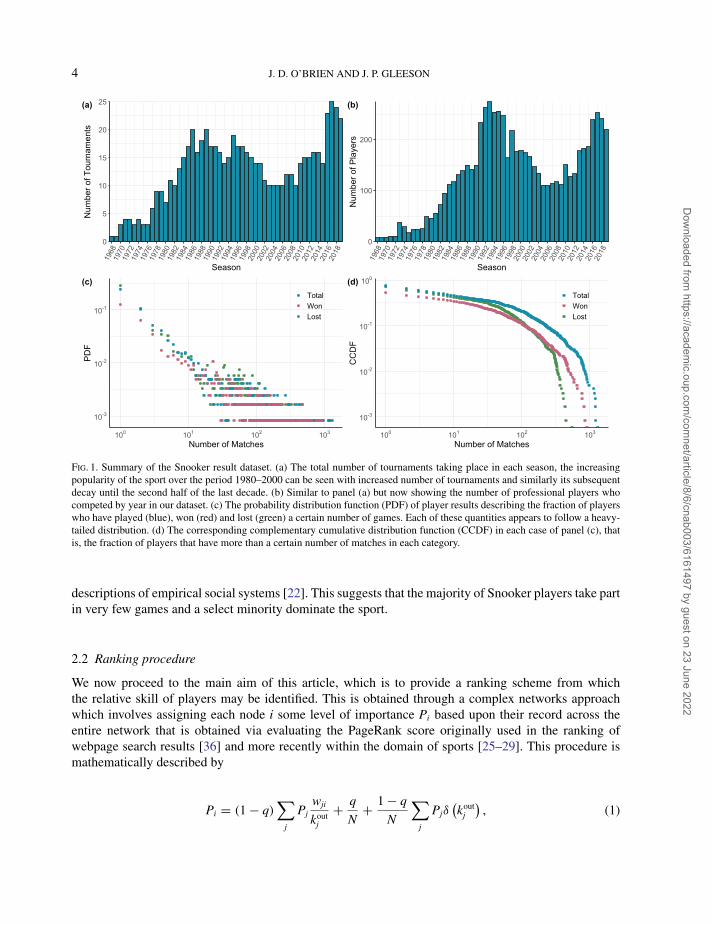
The data used in the analysis to follow are obtained from the cuetracker website [35] which is an onlinedatabase containing information of professional Snooker tournaments from 1908 onwards. This amountsto providing the records of 18324 players from a range of skill levels. In this article, we focus only onthose matches which were of a competitive professional nature and took place between the years of 1968and 2020, a period of over 50 years. More specifically, in terms of the quality of match considered, wefocus on those games that fall under the categories League, Invitational and Ranking events which arethose that the majority of professional players compete in. With these considerations, the dataset usedamounts to 657 tournaments featuring 1221 unique players competing in 47710 matches. Importantly,each season is split over 2 years such that the season which begins in one calendar year concludes duringthe following calendar year. As such we reference seasons by the year in which they begun, that is, the2018–2019 season is referred to as the 2018 season in the analysis below. Furthermore, for validation andcomparative purposes in the forthcoming analysis, the official rankings of Snooker players from WorldSnooker (the governing body of the sport) were also obtained [32] from the period 1975–2020. The top twopanels of Fig. 1 demonstrate the temporal behaviour behind both the number of players and tournamentsin each season of our dataset. We see the increase in popularity of Snooker and corresponding financialsustainability for more players arising during the period 1980–2000 prior to the subsequent decrease inprofessionals and tournament in the decade to follow. In the concluding 10 years of the dataset, howeverwe observe an increase in both the number of tournaments alongside the players who compete in themas a possible consequence of the professional game’s restructuring.
2.1 Network generation
In order to create a networked representation of the competition between pairs of Snooker players, weconsider each match in our dataset as an edge of weight one and construct a dominance relationshipbetween the two players appearing in said match. Thus each time that player i defeats player j, anedge from j to i is drawn. The construction described above results in a directed, weighted networkwith entries wji indicating the number of times that player j has lost to player i. This definition provesinsightful for analysis as statistics governing the players may immediately be obtained. For example, theout-strength of node j, kout
j = ∑i wji describes the number of times that player j has lost and similarly their
in-strength kinj = ∑
i wij gives their total number of wins, while the total number of matches in which theypartook is simply the sum of these two metrics. The probability distributions of these quantities (alongsidethe corresponding complementary cumulative distribution function) are shown in the bottom panels ofFig. 1 where clear heavy-tailed distributions are observed, which is a common feature among networked
Dow
nloaded from https://academ
ic.oup.com/com
net/article/8/6/cnab003/6161497 by guest on 23 June 2022
4 J. D. O’BRIEN AND J. P. GLEESON
0
5
10
15
20
2519
6819
7019
7219
7419
7619
7819
8019
8219
8419
8619
8819
9019
9219
9419
9619
9820
0020
0220
0420
0620
0820
1020
1220
1420
1620
18
Season
Num
ber o
f Tou
rnam
ents
(a)
0
100
200
1968
1970
1972
1974
1976
1978
1980
1982
1984
1986
1988
1990
1992
1994
1996
1998
2000
2002
2004
2006
2008
2010
2012
2014
2016
2018
Season
Num
ber o
f Pla
yers
(b)
10-3
10-2
10-1
100 101 102 103
Number of Matches
TotalWonLost
(c)
10-3
10-2
10-1
100
100 101 102 103
Number of Matches
CC
DF
TotalWonLost
(d)
Fig. 1. Summary of the Snooker result dataset. (a) The total number of tournaments taking place in each season, the increasingpopularity of the sport over the period 1980–2000 can be seen with increased number of tournaments and similarly its subsequentdecay until the second half of the last decade. (b) Similar to panel (a) but now showing the number of professional players whocompeted by year in our dataset. (c) The probability distribution function (PDF) of player results describing the fraction of playerswho have played (blue), won (red) and lost (green) a certain number of games. Each of these quantities appears to follow a heavy-tailed distribution. (d) The corresponding complementary cumulative distribution function (CCDF) in each case of panel (c), thatis, the fraction of players that have more than a certain number of matches in each category.
descriptions of empirical social systems [22]. This suggests that the majority of Snooker players take partin very few games and a select minority dominate the sport.
2.2 Ranking procedure
We now proceed to the main aim of this article, which is to provide a ranking scheme from whichthe relative skill of players may be identified. This is obtained through a complex networks approachwhich involves assigning each node i some level of importance Pi based upon their record across theentire network that is obtained via evaluating the PageRank score originally used in the ranking ofwebpage search results [36] and more recently within the domain of sports [25–29]. This procedure ismathematically described by
Pi = (1 − q)∑
j
Pjwji
koutj
+ q
N+ 1 − q
N
∑
j
Pjδ(kout
j
), (1)
Dow
nloaded from https://academ
ic.oup.com/com
net/article/8/6/cnab003/6161497 by guest on 23 June 2022
COMPLEX NETWORKS APPROACH TO RANKING SNOOKER PLAYERS 5
which, importantly, depends on the level of importance associated with all other nodes in the network andas such is a coupled set of equations. Indeed, the first term within these equations describes the transfer ofimportance to player i from all other players j proportional to the number of games in which they defeatedplayer j, wji, relative to the total number of times the player lost, or their out-strength kout
j . The value ofq ∈ [0, 1] is a parameter (referred to as a damping factor in some literature e.g., [8]), which controlsthe level of emphasis placed upon each term in the algorithm and has generally been set to 0.15 in theliterature, which we follow here. The second term describes the uniform redistribution of importance toall players proportional to the damping factor, this allows the system to award some importance to nodesindependent of their results. Finally, the last term contains a Kronecker delta, where δ(·) is equal to onewhen its argument is zero and is otherwise zero, in order to give a correction in the case where nodeswith no outdegree exist that would otherwise act as sinks in the diffusion process considered here. Fromthe perspective of the sporting example studied here such nodes would represent undefeated players,none of which actually occur within the dataset. Therefore, while we show the final term in Eq. (1) forconsistency with the existing literature, it can be neglected in the analysis to follow.
The main disadvantage of this approach is that, in general, an analytical solution to this problemproves elusive and as such we revert to numerical solutions, as in [26, 27], by initially assigning eachnode an importance reciprocal to the network’s size and iterating until convergence to a certain level ofprecision. After the system of equations has reached its steady state in this diffusive-like process, weproceed to rank the nodes by their corresponding importance scores.
3. Results
3.1 All-time rankings
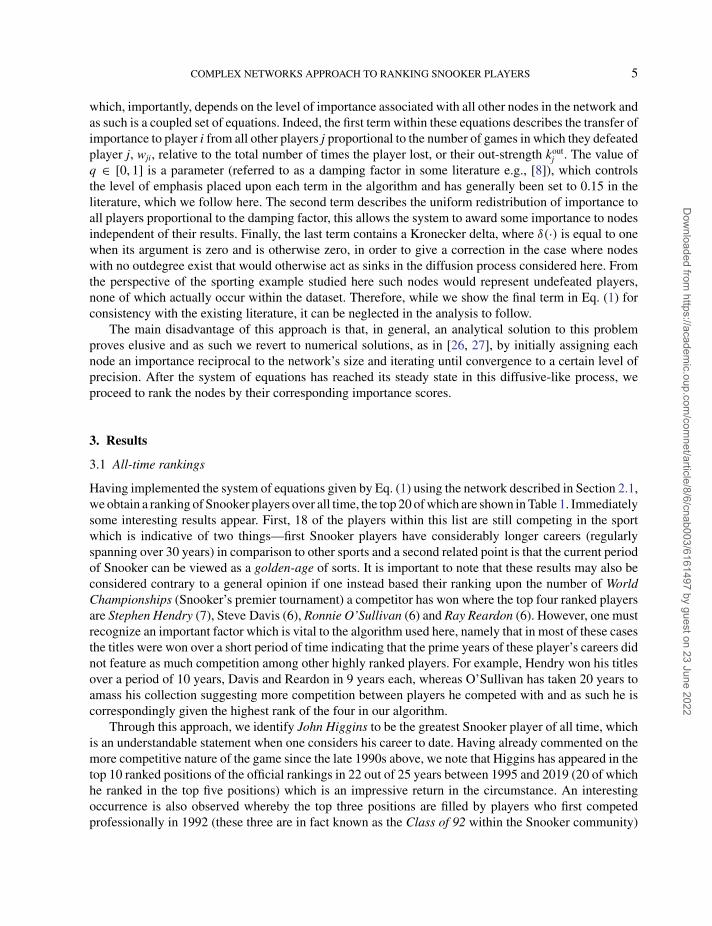
Having implemented the system of equations given by Eq. (1) using the network described in Section 2.1,we obtain a ranking of Snooker players over all time, the top 20 of which are shown in Table 1. Immediatelysome interesting results appear. First, 18 of the players within this list are still competing in the sportwhich is indicative of two things—first Snooker players have considerably longer careers (regularlyspanning over 30 years) in comparison to other sports and a second related point is that the current periodof Snooker can be viewed as a golden-age of sorts. It is important to note that these results may also beconsidered contrary to a general opinion if one instead based their ranking upon the number of WorldChampionships (Snooker’s premier tournament) a competitor has won where the top four ranked playersare Stephen Hendry (7), Steve Davis (6), Ronnie O’Sullivan (6) and Ray Reardon (6). However, one mustrecognize an important factor which is vital to the algorithm used here, namely that in most of these casesthe titles were won over a short period of time indicating that the prime years of these player’s careers didnot feature as much competition among other highly ranked players. For example, Hendry won his titlesover a period of 10 years, Davis and Reardon in 9 years each, whereas O’Sullivan has taken 20 years toamass his collection suggesting more competition between players he competed with and as such he iscorrespondingly given the highest rank of the four in our algorithm.
Through this approach, we identify John Higgins to be the greatest Snooker player of all time, whichis an understandable statement when one considers his career to date. Having already commented on themore competitive nature of the game since the late 1990s above, we note that Higgins has appeared in thetop 10 ranked positions of the official rankings in 22 out of 25 years between 1995 and 2019 (20 of whichhe ranked in the top five positions) which is an impressive return in the circumstance. An interestingoccurrence is also observed whereby the top three positions are filled by players who first competedprofessionally in 1992 (these three are in fact known as the Class of 92 within the Snooker community)
Dow
nloaded from https://academ
ic.oup.com/com
net/article/8/6/cnab003/6161497 by guest on 23 June 2022
6 J. D. O’BRIEN AND J. P. GLEESON
Table 1 The top 20 players in Snooker’s history.
Rank Player PageRank score In strength Nationality Start End
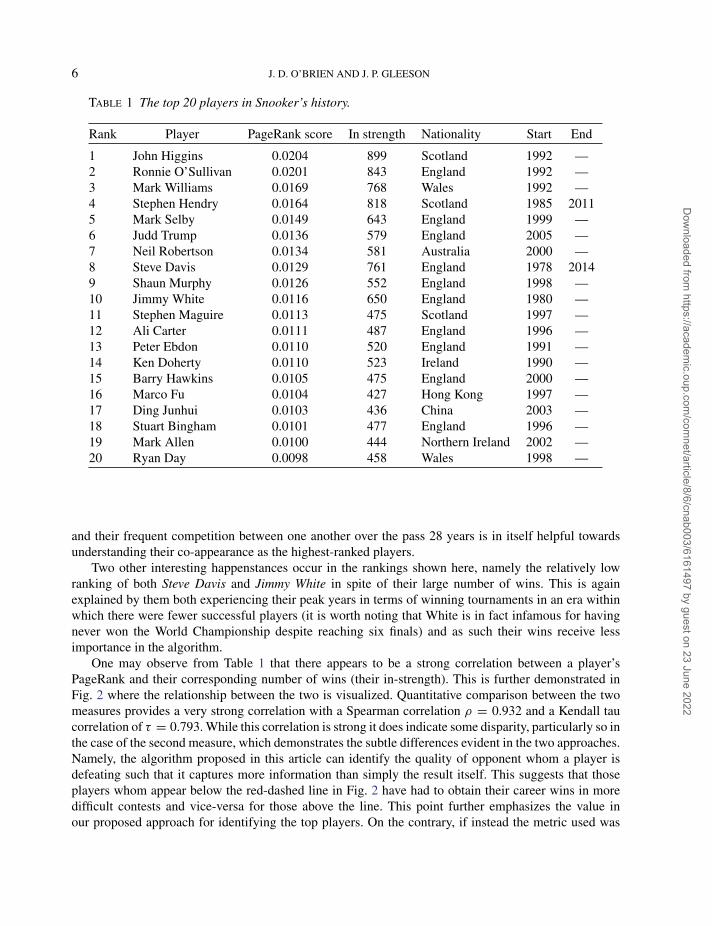
1 John Higgins 0.0204 899 Scotland 1992 —2 Ronnie O’Sullivan 0.0201 843 England 1992 —3 Mark Williams 0.0169 768 Wales 1992 —4 Stephen Hendry 0.0164 818 Scotland 1985 20115 Mark Selby 0.0149 643 England 1999 —6 Judd Trump 0.0136 579 England 2005 —7 Neil Robertson 0.0134 581 Australia 2000 —8 Steve Davis 0.0129 761 England 1978 20149 Shaun Murphy 0.0126 552 England 1998 —10 Jimmy White 0.0116 650 England 1980 —11 Stephen Maguire 0.0113 475 Scotland 1997 —12 Ali Carter 0.0111 487 England 1996 —13 Peter Ebdon 0.0110 520 England 1991 —14 Ken Doherty 0.0110 523 Ireland 1990 —15 Barry Hawkins 0.0105 475 England 2000 —16 Marco Fu 0.0104 427 Hong Kong 1997 —17 Ding Junhui 0.0103 436 China 2003 —18 Stuart Bingham 0.0101 477 England 1996 —19 Mark Allen 0.0100 444 Northern Ireland 2002 —20 Ryan Day 0.0098 458 Wales 1998 —
and their frequent competition between one another over the pass 28 years is in itself helpful towardsunderstanding their co-appearance as the highest-ranked players.
Two other interesting happenstances occur in the rankings shown here, namely the relatively lowranking of both Steve Davis and Jimmy White in spite of their large number of wins. This is againexplained by them both experiencing their peak years in terms of winning tournaments in an era withinwhich there were fewer successful players (it is worth noting that White is in fact infamous for havingnever won the World Championship despite reaching six finals) and as such their wins receive lessimportance in the algorithm.
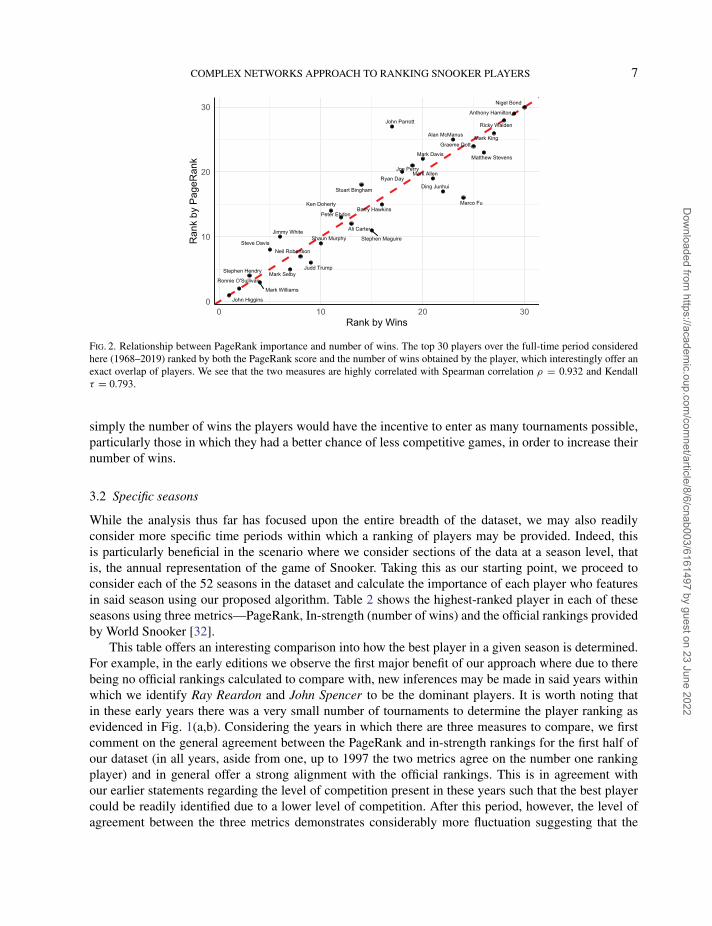
One may observe from Table 1 that there appears to be a strong correlation between a player’sPageRank and their corresponding number of wins (their in-strength). This is further demonstrated inFig. 2 where the relationship between the two is visualized. Quantitative comparison between the twomeasures provides a very strong correlation with a Spearman correlation ρ = 0.932 and a Kendall taucorrelation of τ = 0.793. While this correlation is strong it does indicate some disparity, particularly so inthe case of the second measure, which demonstrates the subtle differences evident in the two approaches.Namely, the algorithm proposed in this article can identify the quality of opponent whom a player isdefeating such that it captures more information than simply the result itself. This suggests that thoseplayers whom appear below the red-dashed line in Fig. 2 have had to obtain their career wins in moredifficult contests and vice-versa for those above the line. This point further emphasizes the value inour proposed approach for identifying the top players. On the contrary, if instead the metric used was
Dow
nloaded from https://academ
ic.oup.com/com
net/article/8/6/cnab003/6161497 by guest on 23 June 2022
COMPLEX NETWORKS APPROACH TO RANKING SNOOKER PLAYERS 7
John Higgins
Ronnie O'Sullivan
Mark Williams
Stephen Hendry Mark SelbyJudd Trump
Neil RobertsonSteve Davis
Shaun MurphyJimmy White
Stephen Maguire
Ali Carter
Peter Ebdon
Ken DohertyBarry Hawkins
Marco Fu
Ding JunhuiStuart Bingham
Mark AllenRyan Day
Joe Perry
Mark Davis Matthew Stevens
Graeme Dott
Alan McManus Mark King
John Parrott Ricky Walden
Anthony Hamilton
Nigel Bond
0
10
20
30
0 10 20 30Rank by Wins
Ran
k by
Pag
eRan
k
Fig. 2. Relationship between PageRank importance and number of wins. The top 30 players over the full-time period consideredhere (1968–2019) ranked by both the PageRank score and the number of wins obtained by the player, which interestingly offer anexact overlap of players. We see that the two measures are highly correlated with Spearman correlation ρ = 0.932 and Kendallτ = 0.793.
simply the number of wins the players would have the incentive to enter as many tournaments possible,particularly those in which they had a better chance of less competitive games, in order to increase theirnumber of wins.
3.2 Specific seasons
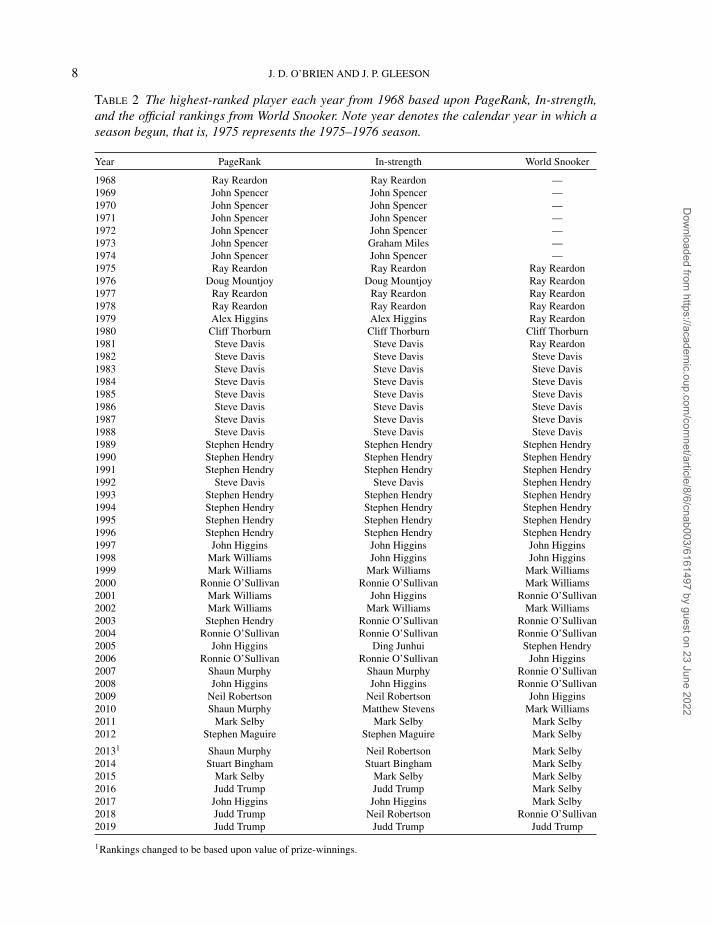
While the analysis thus far has focused upon the entire breadth of the dataset, we may also readilyconsider more specific time periods within which a ranking of players may be provided. Indeed, thisis particularly beneficial in the scenario where we consider sections of the data at a season level, thatis, the annual representation of the game of Snooker. Taking this as our starting point, we proceed toconsider each of the 52 seasons in the dataset and calculate the importance of each player who featuresin said season using our proposed algorithm. Table 2 shows the highest-ranked player in each of theseseasons using three metrics—PageRank, In-strength (number of wins) and the official rankings providedby World Snooker [32].
This table offers an interesting comparison into how the best player in a given season is determined.For example, in the early editions we observe the first major benefit of our approach where due to therebeing no official rankings calculated to compare with, new inferences may be made in said years withinwhich we identify Ray Reardon and John Spencer to be the dominant players. It is worth noting thatin these early years there was a very small number of tournaments to determine the player ranking asevidenced in Fig. 1(a,b). Considering the years in which there are three measures to compare, we firstcomment on the general agreement between the PageRank and in-strength rankings for the first half ofour dataset (in all years, aside from one, up to 1997 the two metrics agree on the number one rankingplayer) and in general offer a strong alignment with the official rankings. This is in agreement withour earlier statements regarding the level of competition present in these years such that the best playercould be readily identified due to a lower level of competition. After this period, however, the level ofagreement between the three metrics demonstrates considerably more fluctuation suggesting that the
Dow
nloaded from https://academ
ic.oup.com/com
net/article/8/6/cnab003/6161497 by guest on 23 June 2022
8 J. D. O’BRIEN AND J. P. GLEESON
Table 2 The highest-ranked player each year from 1968 based upon PageRank, In-strength,and the official rankings from World Snooker. Note year denotes the calendar year in which aseason begun, that is, 1975 represents the 1975–1976 season.
Year PageRank In-strength World Snooker
1968 Ray Reardon Ray Reardon —1969 John Spencer John Spencer —1970 John Spencer John Spencer —1971 John Spencer John Spencer —1972 John Spencer John Spencer —1973 John Spencer Graham Miles —1974 John Spencer John Spencer —1975 Ray Reardon Ray Reardon Ray Reardon1976 Doug Mountjoy Doug Mountjoy Ray Reardon1977 Ray Reardon Ray Reardon Ray Reardon1978 Ray Reardon Ray Reardon Ray Reardon1979 Alex Higgins Alex Higgins Ray Reardon1980 Cliff Thorburn Cliff Thorburn Cliff Thorburn1981 Steve Davis Steve Davis Ray Reardon1982 Steve Davis Steve Davis Steve Davis1983 Steve Davis Steve Davis Steve Davis1984 Steve Davis Steve Davis Steve Davis1985 Steve Davis Steve Davis Steve Davis1986 Steve Davis Steve Davis Steve Davis1987 Steve Davis Steve Davis Steve Davis1988 Steve Davis Steve Davis Steve Davis1989 Stephen Hendry Stephen Hendry Stephen Hendry1990 Stephen Hendry Stephen Hendry Stephen Hendry1991 Stephen Hendry Stephen Hendry Stephen Hendry1992 Steve Davis Steve Davis Stephen Hendry1993 Stephen Hendry Stephen Hendry Stephen Hendry1994 Stephen Hendry Stephen Hendry Stephen Hendry1995 Stephen Hendry Stephen Hendry Stephen Hendry1996 Stephen Hendry Stephen Hendry Stephen Hendry1997 John Higgins John Higgins John Higgins1998 Mark Williams John Higgins John Higgins1999 Mark Williams Mark Williams Mark Williams2000 Ronnie O’Sullivan Ronnie O’Sullivan Mark Williams2001 Mark Williams John Higgins Ronnie O’Sullivan2002 Mark Williams Mark Williams Mark Williams2003 Stephen Hendry Ronnie O’Sullivan Ronnie O’Sullivan2004 Ronnie O’Sullivan Ronnie O’Sullivan Ronnie O’Sullivan2005 John Higgins Ding Junhui Stephen Hendry2006 Ronnie O’Sullivan Ronnie O’Sullivan John Higgins2007 Shaun Murphy Shaun Murphy Ronnie O’Sullivan2008 John Higgins John Higgins Ronnie O’Sullivan2009 Neil Robertson Neil Robertson John Higgins2010 Shaun Murphy Matthew Stevens Mark Williams2011 Mark Selby Mark Selby Mark Selby2012 Stephen Maguire Stephen Maguire Mark Selby
20131 Shaun Murphy Neil Robertson Mark Selby2014 Stuart Bingham Stuart Bingham Mark Selby2015 Mark Selby Mark Selby Mark Selby2016 Judd Trump Judd Trump Mark Selby2017 John Higgins John Higgins Mark Selby2018 Judd Trump Neil Robertson Ronnie O’Sullivan2019 Judd Trump Judd Trump Judd Trump
1Rankings changed to be based upon value of prize-winnings.
Dow
nloaded from https://academ
ic.oup.com/com
net/article/8/6/cnab003/6161497 by guest on 23 June 2022
COMPLEX NETWORKS APPROACH TO RANKING SNOOKER PLAYERS 9
0
5 105
1 106
1.5 106
2x
x
x
x
106
2009
2010
2011
2012
2013
2014
2015
2016
2017
2018
2019
Season
Priz
e Fu
nd (G
BP)
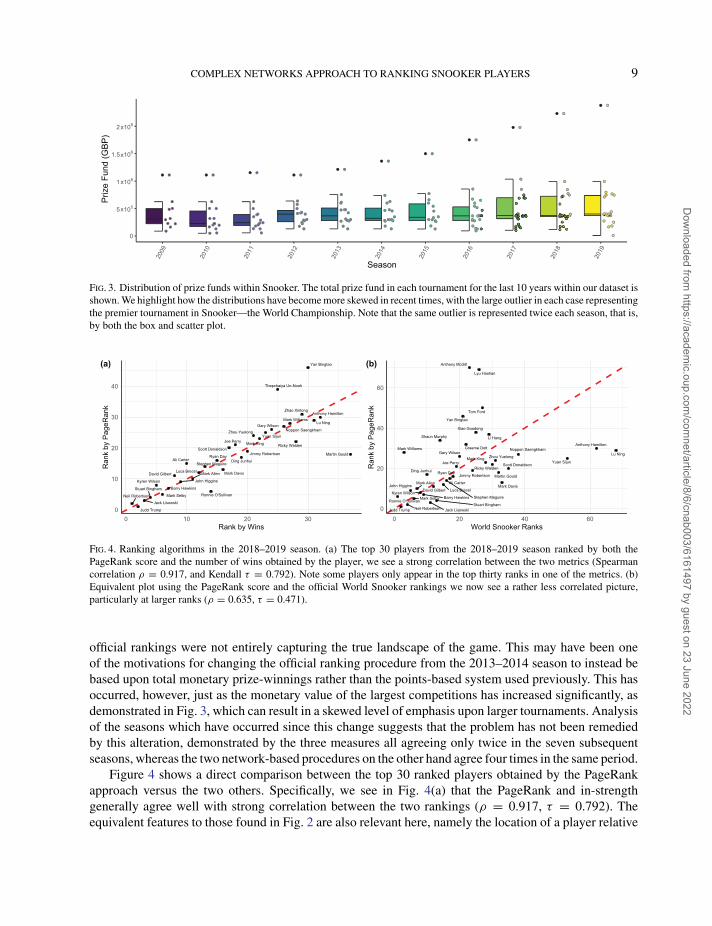
Fig. 3. Distribution of prize funds within Snooker. The total prize fund in each tournament for the last 10 years within our dataset isshown. We highlight how the distributions have become more skewed in recent times, with the large outlier in each case representingthe premier tournament in Snooker—the World Championship. Note that the same outlier is represented twice each season, that is,by both the box and scatter plot.
Judd Trump
Neil RobertsonJack Lisowski
Stuart Bingham
Mark Selby Ronnie O'SullivanBarry Hawkins
Kyren Wilson John Higgins
Mark AllenDavid GilbertLuca Brecel Mark Davis
Stephen MaguireAli Carter
Ryan DayDing Junhui
Martin GouldJimmy RobertsonScott Donaldson
Joe PerryRicky WaldenMark King
Zhou YuelongYuan Sijun
Gary WilsonNoppon Saengkham
Mark WilliamsLu Ning
Anthony HamiltonZhao Xintong
Thepchaiya Un-Nooh
Yan Bingtao
0
10
20
30
40
0 10 20 30Rank by Wins
Ran
k by
Pag
eRan
k
(a)
Judd Trump Neil Robertson Jack LisowskiStuart Bingham
Mark SelbyRonnie O'Sullivan
Barry HawkinsKyren Wilson
John HigginsMark Allen
David Gilbert Luca BrecelMark Davis
Stephen Maguire
Ali Carter
Ryan DayDing JunhuiMartin GouldJimmy Robertson
Scott DonaldsonJoe PerryRicky Walden
Mark King Zhou YuelongYuan Sijun
Gary WilsonNoppon SaengkhamMark Williams
Lu Ning
Anthony HamiltonGraeme Dott
Shaun Murphy Li Hang
Xiao Guodong
Yan Bingtao
Tom Ford
Lyu Haotian
Anthony McGill
0
20
40
60
0 20 40 60World Snooker Ranks
Ran
k by
Pag
eRan
k(b)
Fig. 4. Ranking algorithms in the 2018–2019 season. (a) The top 30 players from the 2018–2019 season ranked by both thePageRank score and the number of wins obtained by the player, we see a strong correlation between the two metrics (Spearmancorrelation ρ = 0.917, and Kendall τ = 0.792). Note some players only appear in the top thirty ranks in one of the metrics. (b)Equivalent plot using the PageRank score and the official World Snooker rankings we now see a rather less correlated picture,particularly at larger ranks (ρ = 0.635, τ = 0.471).
official rankings were not entirely capturing the true landscape of the game. This may have been oneof the motivations for changing the official ranking procedure from the 2013–2014 season to instead bebased upon total monetary prize-winnings rather than the points-based system used previously. This hasoccurred, however, just as the monetary value of the largest competitions has increased significantly, asdemonstrated in Fig. 3, which can result in a skewed level of emphasis upon larger tournaments. Analysisof the seasons which have occurred since this change suggests that the problem has not been remediedby this alteration, demonstrated by the three measures all agreeing only twice in the seven subsequentseasons, whereas the two network-based procedures on the other hand agree four times in the same period.
Figure 4 shows a direct comparison between the top 30 ranked players obtained by the PageRankapproach versus the two others. Specifically, we see in Fig. 4(a) that the PageRank and in-strengthgenerally agree well with strong correlation between the two rankings (ρ = 0.917, τ = 0.792). Theequivalent features to those found in Fig. 2 are also relevant here, namely the location of a player relative
Dow
nloaded from https://academ
ic.oup.com/com
net/article/8/6/cnab003/6161497 by guest on 23 June 2022
10 J. D. O’BRIEN AND J. P. GLEESON
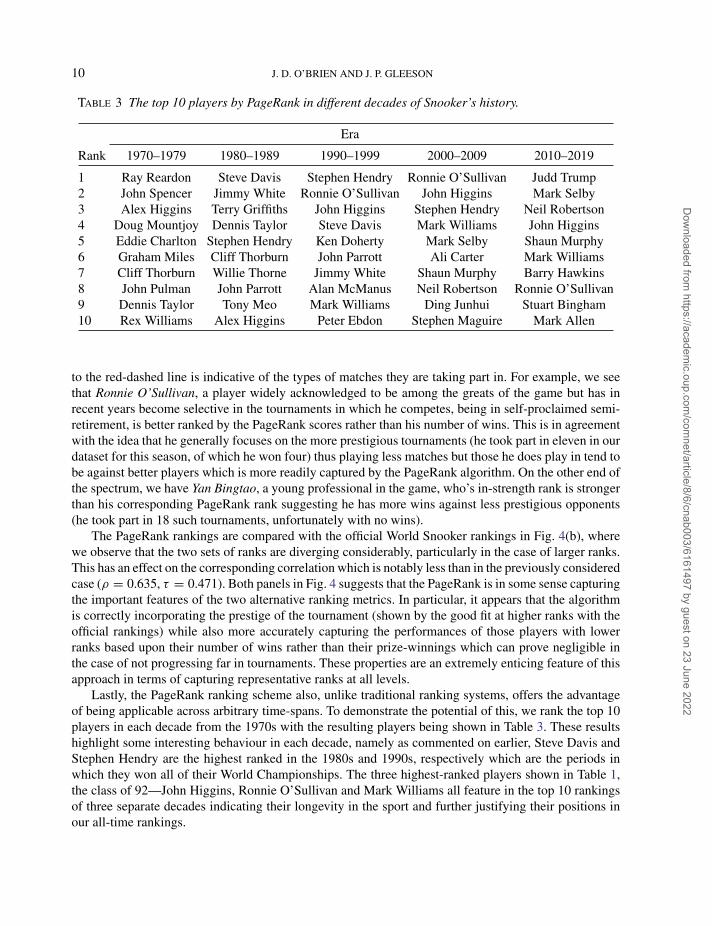
Table 3 The top 10 players by PageRank in different decades of Snooker’s history.
Era
Rank 1970–1979 1980–1989 1990–1999 2000–2009 2010–2019
1 Ray Reardon Steve Davis Stephen Hendry Ronnie O’Sullivan Judd Trump2 John Spencer Jimmy White Ronnie O’Sullivan John Higgins Mark Selby3 Alex Higgins Terry Griffiths John Higgins Stephen Hendry Neil Robertson4 Doug Mountjoy Dennis Taylor Steve Davis Mark Williams John Higgins5 Eddie Charlton Stephen Hendry Ken Doherty Mark Selby Shaun Murphy6 Graham Miles Cliff Thorburn John Parrott Ali Carter Mark Williams7 Cliff Thorburn Willie Thorne Jimmy White Shaun Murphy Barry Hawkins8 John Pulman John Parrott Alan McManus Neil Robertson Ronnie O’Sullivan9 Dennis Taylor Tony Meo Mark Williams Ding Junhui Stuart Bingham10 Rex Williams Alex Higgins Peter Ebdon Stephen Maguire Mark Allen
to the red-dashed line is indicative of the types of matches they are taking part in. For example, we seethat Ronnie O’Sullivan, a player widely acknowledged to be among the greats of the game but has inrecent years become selective in the tournaments in which he competes, being in self-proclaimed semi-retirement, is better ranked by the PageRank scores rather than his number of wins. This is in agreementwith the idea that he generally focuses on the more prestigious tournaments (he took part in eleven in ourdataset for this season, of which he won four) thus playing less matches but those he does play in tend tobe against better players which is more readily captured by the PageRank algorithm. On the other end ofthe spectrum, we have Yan Bingtao, a young professional in the game, who’s in-strength rank is strongerthan his corresponding PageRank rank suggesting he has more wins against less prestigious opponents(he took part in 18 such tournaments, unfortunately with no wins).
The PageRank rankings are compared with the official World Snooker rankings in Fig. 4(b), wherewe observe that the two sets of ranks are diverging considerably, particularly in the case of larger ranks.This has an effect on the corresponding correlation which is notably less than in the previously consideredcase (ρ = 0.635, τ = 0.471). Both panels in Fig. 4 suggests that the PageRank is in some sense capturingthe important features of the two alternative ranking metrics. In particular, it appears that the algorithmis correctly incorporating the prestige of the tournament (shown by the good fit at higher ranks with theofficial rankings) while also more accurately capturing the performances of those players with lowerranks based upon their number of wins rather than their prize-winnings which can prove negligible inthe case of not progressing far in tournaments. These properties are an extremely enticing feature of thisapproach in terms of capturing representative ranks at all levels.
Lastly, the PageRank ranking scheme also, unlike traditional ranking systems, offers the advantageof being applicable across arbitrary time-spans. To demonstrate the potential of this, we rank the top 10players in each decade from the 1970s with the resulting players being shown in Table 3. These resultshighlight some interesting behaviour in each decade, namely as commented on earlier, Steve Davis andStephen Hendry are the highest ranked in the 1980s and 1990s, respectively which are the periods inwhich they won all of their World Championships. The three highest-ranked players shown in Table 1,the class of 92—John Higgins, Ronnie O’Sullivan and Mark Williams all feature in the top 10 rankingsof three separate decades indicating their longevity in the sport and further justifying their positions inour all-time rankings.
Dow
nloaded from https://academ
ic.oup.com/com
net/article/8/6/cnab003/6161497 by guest on 23 June 2022
COMPLEX NETWORKS APPROACH TO RANKING SNOOKER PLAYERS 11
0.4
0.6
0.8
1.0
2
3
4
5
1990
1992
1994
1996
1998
2000
2002
2004
2006
2008
2010
2012
2014
2016
2018
2020
Jacc
ard
Sim
ilarit
y(a)
0.4
0.6
0.8
1.0
5
6
7
8
9
10
1990
1992
1994
1996
1998
2000
2002
2004
2006
2008
2010
2012
2014
2016
2018
2020
Num
ber of Players
(b)
0.5
0.6
0.7
0.8
0.9
17
20
23
1990
1992
1994
1996
1998
2000
2002
2004
2006
2008
2010
2012
2014
2016
2018
2020
Season
Jacc
ard
Sim
ilarit
y
(c)
0.5
0.6
0.7
0.8
0.9
35
40
45
1990
1992
1994
1996
1998
2000
2002
2004
2006
2008
2010
2012
2014
2016
2018
2020
Season
Num
ber of Players
In-strengthWorld Snooker
(d)
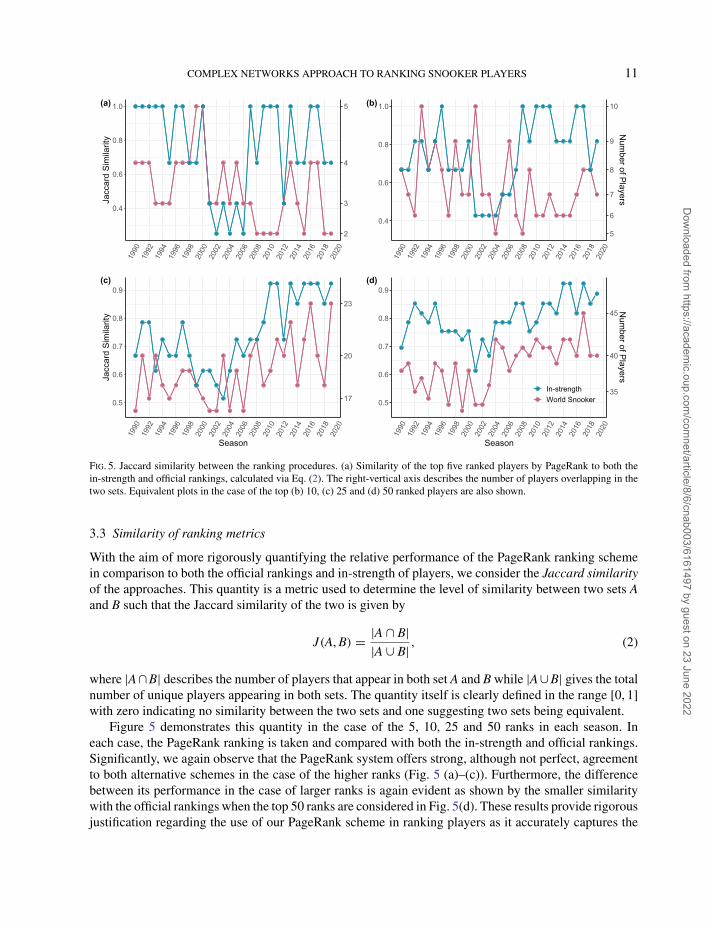
Fig. 5. Jaccard similarity between the ranking procedures. (a) Similarity of the top five ranked players by PageRank to both thein-strength and official rankings, calculated via Eq. (2). The right-vertical axis describes the number of players overlapping in thetwo sets. Equivalent plots in the case of the top (b) 10, (c) 25 and (d) 50 ranked players are also shown.
3.3 Similarity of ranking metrics
With the aim of more rigorously quantifying the relative performance of the PageRank ranking schemein comparison to both the official rankings and in-strength of players, we consider the Jaccard similarityof the approaches. This quantity is a metric used to determine the level of similarity between two sets Aand B such that the Jaccard similarity of the two is given by
J(A, B) = |A ∩ B||A ∪ B| , (2)
where |A∩B| describes the number of players that appear in both set A and B while |A∪B| gives the totalnumber of unique players appearing in both sets. The quantity itself is clearly defined in the range [0, 1]with zero indicating no similarity between the two sets and one suggesting two sets being equivalent.
Figure 5 demonstrates this quantity in the case of the 5, 10, 25 and 50 ranks in each season. Ineach case, the PageRank ranking is taken and compared with both the in-strength and official rankings.Significantly, we again observe that the PageRank system offers strong, although not perfect, agreementto both alternative schemes in the case of the higher ranks (Fig. 5 (a)–(c)). Furthermore, the differencebetween its performance in the case of larger ranks is again evident as shown by the smaller similaritywith the official rankings when the top 50 ranks are considered in Fig. 5(d). These results provide rigorousjustification regarding the use of our PageRank scheme in ranking players as it accurately captures the
Dow
nloaded from https://academ
ic.oup.com/com
net/article/8/6/cnab003/6161497 by guest on 23 June 2022
12 J. D. O’BRIEN AND J. P. GLEESON
better ranks in both alternative metrics while also more fairly representing those players with lower ranksthrough their total number of winning matches alongside the quality of opponent faced in comparison tothe use of their prize-money winnings solely.
3.4 Rank-clocks
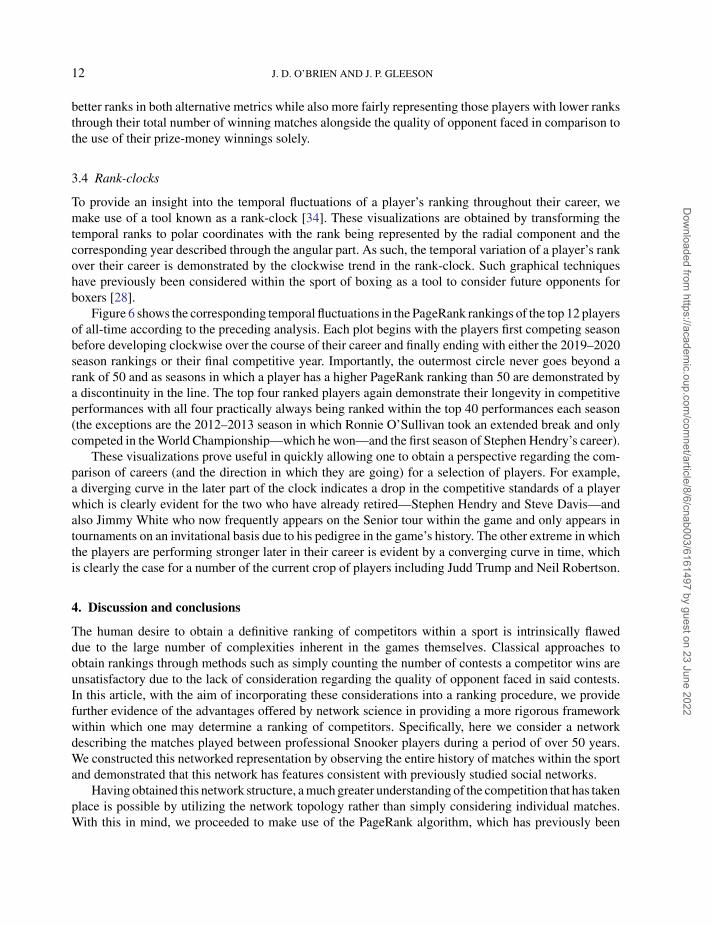
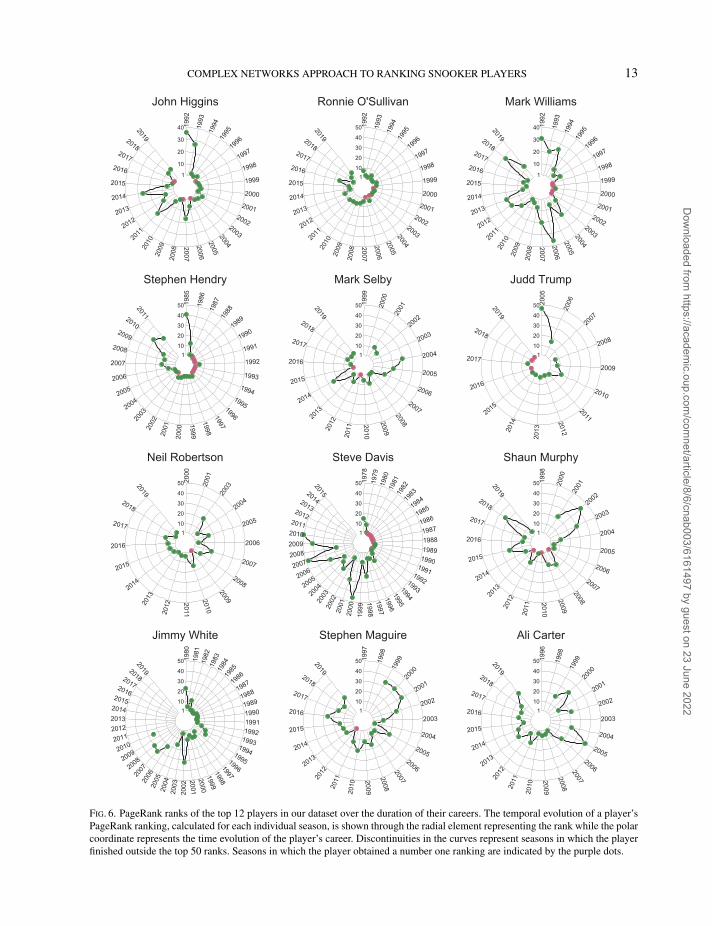
To provide an insight into the temporal fluctuations of a player’s ranking throughout their career, wemake use of a tool known as a rank-clock [34]. These visualizations are obtained by transforming thetemporal ranks to polar coordinates with the rank being represented by the radial component and thecorresponding year described through the angular part. As such, the temporal variation of a player’s rankover their career is demonstrated by the clockwise trend in the rank-clock. Such graphical techniqueshave previously been considered within the sport of boxing as a tool to consider future opponents forboxers [28].
Figure 6 shows the corresponding temporal fluctuations in the PageRank rankings of the top 12 playersof all-time according to the preceding analysis. Each plot begins with the players first competing seasonbefore developing clockwise over the course of their career and finally ending with either the 2019–2020season rankings or their final competitive year. Importantly, the outermost circle never goes beyond arank of 50 and as seasons in which a player has a higher PageRank ranking than 50 are demonstrated bya discontinuity in the line. The top four ranked players again demonstrate their longevity in competitiveperformances with all four practically always being ranked within the top 40 performances each season(the exceptions are the 2012–2013 season in which Ronnie O’Sullivan took an extended break and onlycompeted in the World Championship—which he won—and the first season of Stephen Hendry’s career).
These visualizations prove useful in quickly allowing one to obtain a perspective regarding the com-parison of careers (and the direction in which they are going) for a selection of players. For example,a diverging curve in the later part of the clock indicates a drop in the competitive standards of a playerwhich is clearly evident for the two who have already retired—Stephen Hendry and Steve Davis—andalso Jimmy White who now frequently appears on the Senior tour within the game and only appears intournaments on an invitational basis due to his pedigree in the game’s history. The other extreme in whichthe players are performing stronger later in their career is evident by a converging curve in time, whichis clearly the case for a number of the current crop of players including Judd Trump and Neil Robertson.
4. Discussion and conclusions
The human desire to obtain a definitive ranking of competitors within a sport is intrinsically flaweddue to the large number of complexities inherent in the games themselves. Classical approaches toobtain rankings through methods such as simply counting the number of contests a competitor wins areunsatisfactory due to the lack of consideration regarding the quality of opponent faced in said contests.In this article, with the aim of incorporating these considerations into a ranking procedure, we providefurther evidence of the advantages offered by network science in providing a more rigorous frameworkwithin which one may determine a ranking of competitors. Specifically, here we consider a networkdescribing the matches played between professional Snooker players during a period of over 50 years.We constructed this networked representation by observing the entire history of matches within the sportand demonstrated that this network has features consistent with previously studied social networks.
Having obtained this network structure, a much greater understanding of the competition that has takenplace is possible by utilizing the network topology rather than simply considering individual matches.With this in mind, we proceeded to make use of the PageRank algorithm, which has previously been
Dow
nloaded from https://academ
ic.oup.com/com
net/article/8/6/cnab003/6161497 by guest on 23 June 2022
COMPLEX NETWORKS APPROACH TO RANKING SNOOKER PLAYERS 13
1
10
20
30
40
2991 19
93
19
94
199
5
199
6
1997
1998
1999
2000 2001 2002 2003
2004
2005
2006
2007 2008
200
9
20
10
201
1 2
012 2013 2014
2015
2016
2017
2018
2019
John Higgins
110
20
30
40
50
2991 19
93
19
94
199
5
199
6
1997
1998
1999
2000 2001 2002 2003
2004
2005
2006 700
2
2008
200
9
20
10
201
1 2
012 2013 2014
2015
2016
2017
2018
2019
Ronnie O'Sullivan
1
10
20
30
40
2991 19
93
19
94
199
5
199
6
1997
1998
1999
2000 2001 2002 2003
2004
2005
2006 700
2
2008
200
9
20
10
201
1 2
012 2013 2014
2015
2016
2017
2018
2019
Mark Williams
110
20
30
40
50
5891 19
86
19
87
198
8
1989
1990
1991
1992
1993 1994 1995
1996
1997
1998
1999 2000
200
1
20
02
200
3
2004 2005
2006
2007
2008
2009
2010
2011
Stephen Hendry
110
20
30
40
50
9991 20
00
20
01
2002
2003
2004
2005
2006 2007
2008
2009
2010 2011
20
12
201
3 2014
2015
2016
2017
2018
2019
Mark Selby
110
20
30
40
50
5002
20
06
200
7
2008
2009
2010
2011
2012 2013
20
14 2
015
2016
2017
2018
2019
Judd Trump
110
20
30
40
50
0002 20
01
200
3
2004
2005
2006
2007 2008 2009
2010
2011 201
2
20
13 2
014 2015
2016
2017
2018
2019
Neil Robertson
110
20
30
40
50
8791 19
79
19
80
19
81
198
2
198
3
1984
1985
1986
1987
1988 1989
1990 1991 1992 1993
1994
1995
1996
1997
1998 1999
2000
200
1
20
02
200
3
200
4
2005 2006 2007
2008 2009 2010
2011
2012
2013
2014
2015
Steve Davis
110
20
30
40
50
8991 20
00
20
01
2002
2003
2004
2005
2006 2007
2008
2009
2010 2011
20
12
201
3 2014
2015
2016
2017
2018
2019
Shaun Murphy
110
20
30
40
50
0891 19
81
19
82
19
83
19
84
198
5
1986
1987
1988
1989
1990 1991 1992 1993 1994 1995
1996
1997
1998
1999
2000
2001 2002
20
03
200
4
20
05
20
06
200
7
2008 2
009 2010 2011 2012 2013 2014
2015
2016
2017
2018
2019
Jimmy White
110
20
30
40
50
7991 19
98
19
99
200
0
2001
2002
2003
2004 2005 2006
2007
2008
2009 2010
20
11
201
2 2
013 2014
2015
2016
2017
2018
2019
Stephen Maguire
110
20
30
40
50
6991 19
98
19
99
200
0
2001
2002
2003
2004 2005 2006
2007
2008
2009 2010
20
11
201
2 2
013 2014
2015
2016
2017
2018
2019
Ali Carter
Fig. 6. PageRank ranks of the top 12 players in our dataset over the duration of their careers. The temporal evolution of a player’sPageRank ranking, calculated for each individual season, is shown through the radial element representing the rank while the polarcoordinate represents the time evolution of the player’s career. Discontinuities in the curves represent seasons in which the playerfinished outside the top 50 ranks. Seasons in which the player obtained a number one ranking are indicated by the purple dots.
Dow
nloaded from https://academ
ic.oup.com/com
net/article/8/6/cnab003/6161497 by guest on 23 June 2022
14 J. D. O’BRIEN AND J. P. GLEESON
shown to be effective in such scenarios for a number of sports [25–29], with the aim of obtaining amore efficient ranking system. The advantage of this approach is that it directly considers not only thenumber of contests a competitor wins but also directly incorporates the quality of opponent whom theyare defeating and as such more accurately describe the performance of individual athletes. We show thatthis procedure is readily applicable to any temporal period one has data for thus allowing statementsregarding the ranking at arbitrary points in time within the sport. Another important factor regardingour approach is that it requires no external consideration such as the points-based and monetary-basedsystems historically used in the official rankings. It is worth highlighting that this approach does havesome limitations particularly in the sense that those players who are at a later stage of their career havean increased likelihood of higher rank due to appearing in more matches. We note, however, that thiscontribution makes sense as the ranking is obtained not based upon a player’s skill, which can be viewedas a subjective measure, but rather via their results. Another important consideration which offers thepotential for exciting research, albeit beyond the scope of the current article, is the incorporation of atemporal element within such approaches. We have made some effort towards this analysis in the presentwork by considering the players’ ranks across multiple time periods while future work may considerdirectly integrating such factors within the model itself. Furthermore in the present article, we providea quantification for the level of similarity between two different ranking schemes through the Jaccardsimilarity which provides validation of the benefits our approach offers in capturing the ranks of playersfrom various skill levels. A visualization tool in the form of the rank-clock is also introduced whichoffers a novel approach with which policy-makers within the sport of Snooker may quantify the successof competitors over the temporal period of their careers.
Data availability
All data and code used in this article is available at [37] and https://github.com/obrienjoey/snooker_rankings.
Acknowledgements
Helpful discussions with Edward Gunning are gratefully acknowledged.
Funding
Science Foundation Ireland (16/IA/4470, 16/RC/3918, 12/RC/2289P2 and 18/CRT/6049 to J.D.O.B. andJ.P.G).
References
1. Chase, I. D., Tovey, C., Spangler-Martin, D. & Manfredonia, M. (2002) Individual differences versus socialdynamics in the formation of animal dominance hierarchies. Proc. Natl. Acad. Sci. USA, 99, 5744–5749.
2. Ellis, S., Franks, D. W., Nattrass, S., Cant, M. A., Weiss, M. N., Giles, D., Balcomb, K. C., & Croft, D. P.
(2017) Mortality risk and social network position in resident killer whales: sex differences and the importanceof resource abundance. Proc. R. Soc. B, 284, 20171313.
3. Weng, L., Flammini, A., Vespignani, A. & Menczer, F. (2012) Competition among memes in a world withlimited attention. Sci. Rep., 2, 048701.
4. Gleeson, J. P., Ward, J. A., O’Sullivan, K. P. & Lee, W. T. (2014) Competition-induced criticality in a modelof meme popularity. Phys. Rev. Lett., 112, 048701.
5. Lorenz-Spreen, P., Mørch Mønsted, B., Hovel, P. & Lehmann, S. (2019) Accelerating dynamics of collectiveattention. Nat. Commun., 10, 1759.
Dow
nloaded from https://academ
ic.oup.com/com
net/article/8/6/cnab003/6161497 by guest on 23 June 2022
COMPLEX NETWORKS APPROACH TO RANKING SNOOKER PLAYERS 15
6. Lehmann, S., Jackson, A. D. & Lautrup, B. E. (2006) Measures for measures. Nature, 444, 1003–1004.7. Radicchi, F., Fortunato, S. & Castellano, C. (2008) Universality of citation distributions: toward an objective
measure of scientific impact. Proc. Natl. Acad. Sci. USA, 105, 17268–17272.8. Radicchi, F., Fortunato, S., Markines, B. & Vespignani, A. (2009) Diffusion of scientific credits and the
ranking of scientists. Phys. Rev. E, 80, 056103.9. Sinatra, R., Wang, D., Deville, P., Song, C. & Laszlo Barabasi, A. (2016) Quantifying the evolution of
individual scientific impact. Science, 354.10. Passos, P., Davids, K., Araujo, D., Paz, N., Minguens, J. & Mendes, J. (2011) Networks as a novel tool for
studying team ball sports as complex social systems. J. Sci. Med. Sport, 14, 170–176.11. Davids, K., Hristovski, R.,Araujo, D., Balague Serre, N., Button, C. & Passos, P. (2013) Complex Systems
in Sport. 2nd edn. New York: Routledge.12. Wasche, H., Dickson, G., Woll, A. & Brandes, U. (2017) Social network analysis in sport research: an
emerging paradigm. Eur. J. Sport Soc., 14, 138–165.13. Grund, T. U. (2012) Network structure and team performance: the case of English Premier League soccer
teams. Soc. Netw., 34, 682–690.14. Buldu, J. M., Busquets, J., Echegoyen, I. & Seirullo, F. (2019) Defining a historic football team: using
network science to analyze Guardiola’s F.C. Barcelona. Sci. Rep., 9, 1–14.15. Petersen, A. M., Jung, W. S. & Eugene Stanley, H. (2008) On the distribution of career longevity and the
evolution of home-run prowess in professional baseball. EPL (Europhys. Lett.), 83, 50010.16. Saavedra, S., Powers, S., McCotter, T., Porter, M. A. & Mucha, P. J. (2010) Mutually-antagonistic
interactions in baseball networks. Physica A, 389, 1131–1141.17. Gabel, A. & Redner, S. (2012) Random walk picture of basketball scoring. J. Quant. Anal. Sports, 8.18. Clauset, A., Kogan, M. & Redner, S. (2015) Safe leads and lead changes in competitive team sports. Phys.
Rev. E, 91, 062815.19. Ribeiro, H. V., Mukherjee, S. & Zeng, X. H. T. (2016) The advantage of playing home in NBA: microscopic,
team-specific and evolving features. PLoS One, 11, e0152440.20. Getty, D., Li, H., Yano, M., Gao, C. & Hosoi, A. E. (2018) Luck and the law: quantifying chance in fantasy
sports and other contests. SIAM Rev., 60, 869–887.21. O’Brien, J. D., Gleeson, J. P. & O’Sullivan, D. J. P. (2020) Identification of skill in an online game: the case
of Fantasy Premier League. PLoS ONE, 16, e0246698.22. Newman, M. (2010) Networks: An Introduction. Oxford, UK: Oxford University Press.23. Onody, R. N. & de Castro, P. A. (2004) Complex network study of brazilian soccer players. Phys. Rev. E, 70,
037103.24. Duch, J., Waitzman, J. S. & Nunes Amaral, L. A. (2010) Quantifying the performance of individual players
in a team activity. PLoS One, 5, e10937.25. Mukherjee, S. (2012) Identifying the greatest team and captain - a complex network approach to cricket
matches. Physica A, 391, 6066–6076.26. Mukherjee, S. (2014) Quantifying individual performance in Cricket - a network analysis of batsmen and
bowlers. Physica A, 393, 624–637.27. Radicchi, F. (2011) Who is the best player ever? A complex network analysis of the history of professional
tennis. PLoS One, 6, e17249.28. Tennant, A. G., Ahmad, N. & Derrible, S. (2017) Complexity analysis in the sport of boxing. J. Complex
Netw., 5, 953–963.29. Tennant, A. G., Smith, C. M. L. & J. E. Chen C. (2020) Who was the greatest of all-time? A historical analysis
by a complex network of professional boxing. J. Complex Netw., 8, cnaa009.30. Calzada-Infante, L. & Lozano, S. (2016) Analysing Olympic Games through dominance networks. Physica
A, 462, 1215–1230.31. Bury, M. (1986) The social significance of snooker: sports-games in the age of television. Theory Cult. Soc.,
3, 49–62.32. World Snooker. (https://wst.tv/ last accessed 9 February 2020).
Dow
nloaded from https://academ
ic.oup.com/com
net/article/8/6/cnab003/6161497 by guest on 23 June 2022
16 J. D. O’BRIEN AND J. P. GLEESON
33. Gleich, D. F. (2015) PageRank beyond the web. SIAM Rev., 57, 321–363.34. Batty, M. (2006) Rank clocks. Nature, 444, 592—-596.35. Cuetracker website. (https://cuetracker.net/ last accessed 9 February 2020).36. Page, L. & Brin, S. (1998) The anatomy of a large-scale hypertextual Web search engine. Comput. Netw., 30,
107–117.37. O’Brien, J. D. (2021) Snooker datasets. (figshare. Dataset. https://doi.org/10.6084/m9.figshare.13604480.v1
last accessed 9 February 2020).
Dow
nloaded from https://academ
ic.oup.com/com
net/article/8/6/cnab003/6161497 by guest on 23 June 2022


