Embed Size (px)
Citation preview
W.S.A. Saunders, GNS Science, PO Box 30368, Lower Hutt 5040, New Zealand K. de Bruin, CICERO, PO Box 1129, N-0318, Oslo, Norway N. Ruiz Rivera, Institute of Geography, UNAM, Mexico City, Mexico H.C. Lee, National Science and Technology Center for Disaster Reduction, New Taipei City, Taiwan
BIBLIOGRAPHIC REFERENCE
Saunders, W.S.A.; de Bruin, K.; Ruiz Rivera, N.; Lee, H.C. 2015. A comparative study of natural hazard policy in Taiwan, Mexico, New Zealand and Norway, GNS Science Report 2015/005. 94 p.
© Institute of Geological and Nuclear Sciences Limited, 2015
ISSN 1177-2425 (Print) ISSN 2350-3424 (Online) ISBN 978-0-478-19909-3
CONTENTS
ABSTRACT .......................................................................................................................... V
KEYWORDS ......................................................................................................................... V
ABBREVIATIONS ................................................................................................................ VI
1.0 INTRODUCTION ........................................................................................................ 1
1.1 THE RISK INTERPRETATION AND ACTION FELLOWS SEMINAR ............................... 1 1.2 A COMPARATIVE STUDY OF NATURAL HAZARD POLICIES ..................................... 1 1.3 A MULTI-STAGE STUDY ..................................................................................... 2 1.4 PROJECT OBJECTIVE AND GOALS ....................................................................... 3 1.5 RESEARCH QUESTIONS ..................................................................................... 4 1.6 SIGNIFICANCE OF PROJECT ................................................................................ 4
1.6.1 Hyogo Framework for Action 2005-2015 ........................................................... 4 1.6.2 Risk Interpretation and Action ............................................................................ 5 1.6.3 Theoretical Basis ................................................................................................ 5
2.0 A COMPARISON OF HAZARDSCAPES IN CASE STUDY COUNTRIES ................. 7
2.1 CASE STUDIES SELECTED FOR EACH COUNTRY .................................................. 7 2.1.1 New Zealand ...................................................................................................... 8 2.1.2 Norway .............................................................................................................10 2.1.3 Taiwan ..............................................................................................................12 2.1.4 Mexico ..............................................................................................................14
2.2 PLANNING CONTEXTS ...................................................................................... 16
3.0 ANALYSIS OF PLAN CONTENTS ........................................................................... 17
3.1 ANALYTICAL TECHNIQUES ................................................................................ 18 3.2 ANALYTICAL CONSTRUCTS ............................................................................... 18 3.3 VALIDITY ......................................................................................................... 19 3.4 DEVELOPMENT OF PLAN EVALUATION CRITERIA / PROTOCOLS ........................... 20 3.5 CODING OF PLANS ........................................................................................... 20
3.5.1 Taiwan ..............................................................................................................22 3.5.2 Mexico ..............................................................................................................22 3.5.3 New Zealand ....................................................................................................24 3.5.4 Norway .............................................................................................................25
4.0 CASE STUDY FINDINGS ......................................................................................... 27
4.1 TAIWAN .......................................................................................................... 27 4.1.1 Sustainability and Resilience ............................................................................27 4.1.2 Risk Reduction .................................................................................................28 4.1.3 Multi-scale implementation ...............................................................................29
4.2 MEXICO .......................................................................................................... 31 4.2.1 Sustainability and resilience .............................................................................31 4.2.2 Multi-scale implementation ...............................................................................31 4.2.3 Risk reduction ...................................................................................................33
GNS Science Report 2015/005 i
4.3 NEW ZEALAND ................................................................................................ 34 4.3.1 Sustainability and Resilience ............................................................................34 4.3.2 Risk reduction ...................................................................................................34 4.3.3 Implementation .................................................................................................35 4.3.4 Multi-scale implementation ...............................................................................35
4.4 NORWAY ......................................................................................................... 36 4.4.1 Sustainability and Resilience ............................................................................36 4.4.2 Vulnerability ......................................................................................................36 4.4.3 Risk reduction ...................................................................................................36 4.4.4 Implementation .................................................................................................37 4.4.5 Multi-scale implementation ...............................................................................38
5.0 CROSS COMPARISON ............................................................................................ 39
5.1 SUSTAINABILITY AND RESILIENCE ..................................................................... 39 5.2 RISK REDUCTION ............................................................................................. 40 5.3 MULTI-SCALE IMPLEMENTATION ....................................................................... 42
5.3.1 Implementation .................................................................................................42 5.3.2 Comparison ......................................................................................................43 5.3.3 Multi-scale processes .......................................................................................43 5.3.4 Comparison ......................................................................................................45
5.4 RELATED ISSUES ............................................................................................. 46 5.4.1 Climate change.................................................................................................46 5.4.2 Vulnerability ......................................................................................................46
6.0 SUMMARY AND CONCLUSION .............................................................................. 49
7.0 ACKNOWLEDGEMENTS ......................................................................................... 53
8.0 REFERENCES ......................................................................................................... 55
ii GNS Science Report 2015/005
FIGURES
Figure 1.1 Theoretical framework linking mandate, organisational capability, plans and context .................. 3 Figure 2.1 Location of Auckland, Wellington and Christchurch in New Zealand. ........................................... 8 Figure 2.2 Location of Bergen, Otta and Lillestrøm, Norway. ...................................................................... 10 Figure 2.3 Location of New Taipei City, Taichung and Kaohsiung Cities, Taiwan. ...................................... 12 Figure 2.4 Location of Acapulco, Xalapa and Comitan, Mexico. ................................................................. 14 Figure 3.1 Comparing similar phenomena inferred from different texts ....................................................... 17
TABLES
Table 2.1 Summary of hazardscapes between case study countries. .......................................................... 7 Table 2.2 Summary of population, primary hazards and land use for the New Zealand selected
cities. ............................................................................................................................................ 9 Table 2.3 Summary of population, primary hazards and land use for the Norway selected cities. ............. 11 Table 2.4 Populations, primary hazards and land use of selected cities. ................................................... 13 Table 2.5 Populations, primary hazards and land use of selected cities. ................................................... 15 Table 2.6 Summary of planning contexts. .................................................................................................. 16 Table 3.1 Taiwan documents analysed. ..................................................................................................... 22 Table 3.2 Mexico documents analysed. ..................................................................................................... 23 Table 3.3 New Zealand documents analysed. ........................................................................................... 24 Table 3.4 Norway documents analysed. .................................................................................................... 26
GNS Science Report 2015/005 iii
APPENDICES
A1.0 OVERVIEW OF HAZARDSCAPES .......................................................................... 61
A1.1 NEW ZEALAND ................................................................................................ 61 A1.2 NORWAY ......................................................................................................... 63 A1.3 MEXICO .......................................................................................................... 65 A1.4 TAIWAN .......................................................................................................... 66
A2.0 CONTEXT OF CASE STUDIES SELECTED IN EACH COUNTRY .......................... 67
A2.1 TAIWAN .......................................................................................................... 67 A2.2 MEXICO .......................................................................................................... 68 A2.3 NEW ZEALAND ................................................................................................ 70 A2.4 NORWAY ......................................................................................................... 71
A3.0 PLANNING CONTEXTS ........................................................................................... 73
A3.1 TAIWAN .......................................................................................................... 73 A3.2 MEXICO .......................................................................................................... 74 A3.3 NEW ZEALAND ................................................................................................ 76
A3.3.1 Definitions of Natural Hazards ......................................................................... 77 A3.3.2 Integrated Roles and Responsibilities ............................................................. 78
A3.4 NEW ZEALAND COASTAL POLICY STATEMENT ................................................... 79 A3.5 NORWAY ......................................................................................................... 82
A3.5.1 Norway Key Legislation ................................................................................... 83 A3.5.2 Local, Regional, National Level – Disaster Risk Reduction ............................ 85 A3.5.3 Local, Regional, National Level – Land use planning ..................................... 86 A3.5.4 Risk and Vulnerability Assessments ............................................................... 86 A3.5.5 Climate Change ............................................................................................... 86
A4.0 CODING PROTOCOL .............................................................................................. 87
APPENDIX FIGURES
Figure A1.1 The New Zealand geological setting (adapted from Glavovic, et al., 2010, p. 680). ................... 62 Figure A3.1 Legislative roles and responsibilities for hazard management in New Zealand.......................... 80
APPENDIX TABLES
Table A3.1 Terminology used in the legislation to define natural hazards. ................................................... 75 Table A3.2 Purposes of key legislation for the management of natural hazards (emphasis added). ............ 76 Table A3.3 Legislative definitions of natural hazards. ................................................................................... 77 Table A3.4 Summary of ways in which statutes contribute to the management of natural hazards. ............ 81 Table A3.5 Purposes of key legislation for the management of natural hazards (own translation). .............. 83
iv GNS Science Report 2015/005
ABSTRACT
One aspect of any process for managing natural hazards relates to how disaster risk reduction policies are designed and implemented in different countries. The objective of this project is to improve understanding of policies at multiple government levels for natural hazard risk reduction in four countries and how they are implemented, as a key dimension of risk interpretation and action at the political level.
An international comparison has been undertaken between New Zealand, Mexico, Norway, and Taiwan. While these countries represent a collaboration formed at the 2013 The Risk Interpretation and Action Fellows Seminar in New Zealand, they are also susceptible to similar natural hazards, in particular floods, landslides, earthquakes, and climate change; and represent countries within the geographical locations of Australasia, Latin America, Europe, and Asia, with a diversity of political systems and institutional strengths and weaknesses.
The methodology is a comparative design based on content analysis of published emergency plans and land use plans at the national, regional, and local levels. The research provides evidence-based outputs that support the Hyogo Framework for Action 2005-2015, Priority 1 (to ensure that disaster risk reduction is a national and a local priority, with a strong institutional basis for implementation) and the ‘Risk Interpretation and Action’ framework of Eiser (2012). Four themes form the basis of the content analysis of plans: sustainability and resilience, risk reduction, integration, and multi-scale implementation.
The cross-comparisons provide the following observations. The case studies show that there is no standard imperative to include sustainability and resilience into legislation that can then filter down to local level plans. At the national level, none of the four countries specify the term ‘risk reduction’ in their national level land use planning; however, at city level reference is made to risk reduction and risk mitigation. Except for New Zealand, no clear linkage of natural hazard provisions is observed between the national, regional and local level plans analysed for Mexico, Norway and Taiwan. However, when considering the linkage of provisions within plans it is observed that all four countries vary with regard to the quality of the conceptual content and risk reduction strategies, with New Zealand in the best position and Mexico in the worst.
KEYWORDS
Natural Hazard Policy; Land use; Civil Protection; Content analysis; Comparative study; Taiwan; Mexico; New Zealand; Norway
GNS Science Report 2015/005 v
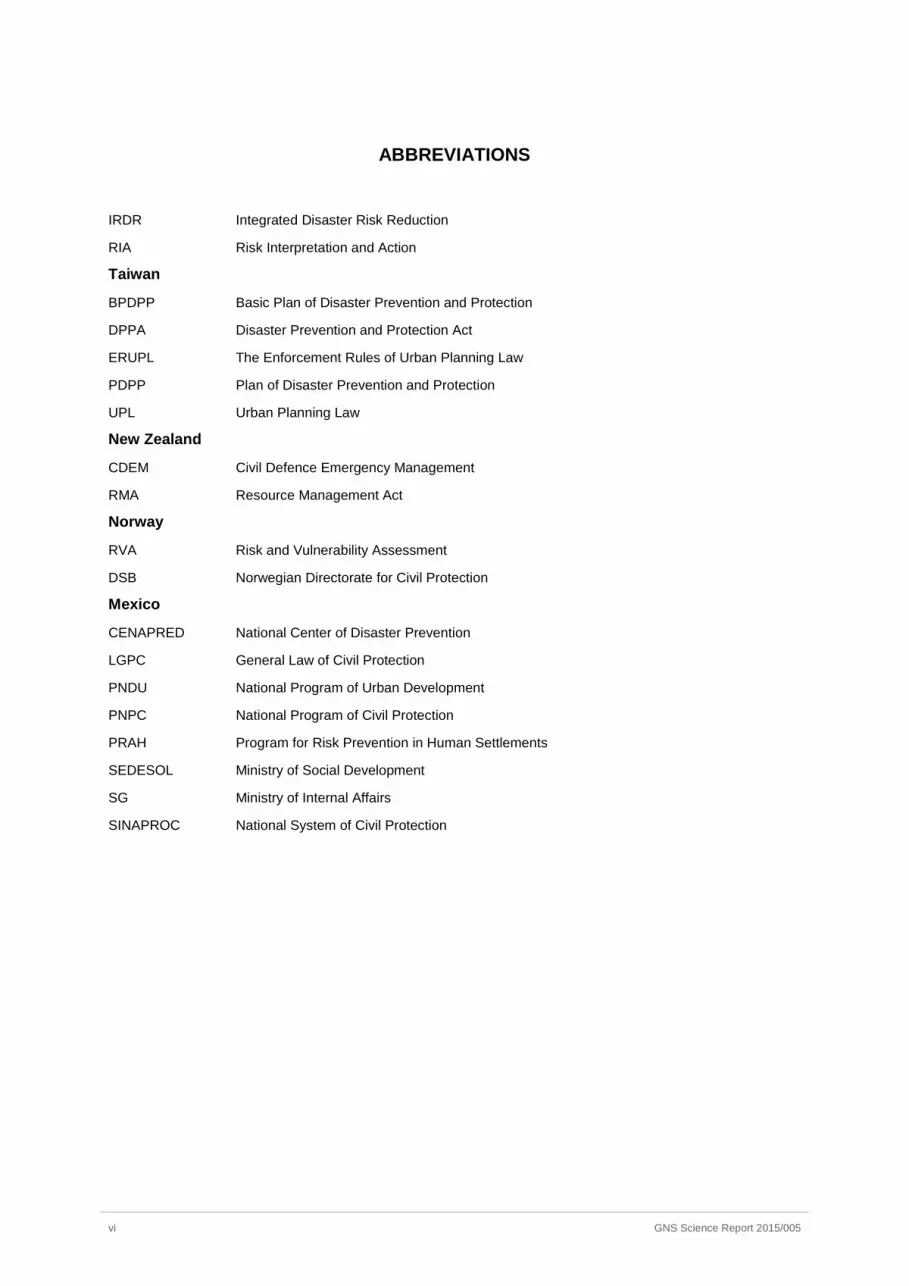
ABBREVIATIONS
IRDR Integrated Disaster Risk Reduction
RIA Risk Interpretation and Action
Taiwan
BPDPP Basic Plan of Disaster Prevention and Protection
DPPA Disaster Prevention and Protection Act
ERUPL The Enforcement Rules of Urban Planning Law
PDPP Plan of Disaster Prevention and Protection
UPL Urban Planning Law
New Zealand
CDEM Civil Defence Emergency Management
RMA Resource Management Act
Norway
RVA Risk and Vulnerability Assessment
DSB Norwegian Directorate for Civil Protection
Mexico
CENAPRED National Center of Disaster Prevention
LGPC General Law of Civil Protection
PNDU National Program of Urban Development
PNPC National Program of Civil Protection
PRAH Program for Risk Prevention in Human Settlements
SEDESOL Ministry of Social Development
SG Ministry of Internal Affairs
SINAPROC National System of Civil Protection
vi GNS Science Report 2015/005
1.0 INTRODUCTION
1.1 THE RISK INTERPRETATION AND ACTION FELLOWS SEMINAR
In December 2013, 25 talented early-career scientists from 12 countries came to New Zealand to develop new, interdisciplinary perspectives on the ways in which people interpret risks, and how they respond based on these interpretations. The Risk Interpretation and Action Fellows Seminar programme included a seven-day seminar, where the early career scientists joined a number of senior scientists to explore a recently published ‘Risk Interpretation and Action’ (RIA) framework for response to natural hazards proposed by Eiser et al. (2012; http://bit.ly/116mM6k). That study investigated how people’s interpretations of risks and decision-making are shaped by their own experience, personal feelings and values, cultural beliefs and interpersonal and societal dynamics. The seminar focused on risk interpretation and action and how it can be integrated across scientific disciplines and cultural contexts.
The week-long seminar involved lively discussions regarding risk interpretation and action, risk communication, risk reduction, climate change, learning from past experiences, uncertainty, resettlements and natural hazard preparedness, response and recovery. The nature of cross- and inter-disciplinary research was also discussed at great length, with the issues of building effective working relationships and how to obtain successful outcomes when working across the different social, natural science, and cultural contexts – as well as many different time zones. By the end of the week, the fellows formed a series of working groups to continue working on the research themes identified during the seminar, in order to contribute to the revision and development of the ‘Risk Interpretation and Action’ framework.
One of these themes was multi-scale policy implementation for natural hazard risk reduction, and forms the basis of this proposal. This proposal transfers approaches from an existing project underway in New Zealand (refer Saunders and Ruske, 2014) into an international setting. An international comparison was undertaken between New Zealand, Mexico, Norway, and Taiwan. While these countries represent the collaboration formed at The Risk Interpretation and Action Fellows Seminar, they are also susceptible to similar natural hazards, in particular floods, landslides, earthquakes, and climate change; and represent countries within the diverse geographical locations of Australasia, Latin America, Europe, and Asia, with a diversity of political systems and institutional strengths and weaknesses. This research project (particularly the methodology) is consistent with recent research in the United States on natural hazard policies, focused on the adoption of federal and state land use policies in local hazard mitigation plans (Berke et al., 2014; Berke & Godschalk, 2009). As such, comparisons may be able to be made with findings from the United States.
1.2 A COMPARATIVE STUDY OF NATURAL HAZARD POLICIES
The focus of the project is a comparative analysis of natural hazard policies, which will compare, contrast and assess the natural hazard policy implementation among New Zealand, Mexico, Norway, and Taiwan. For cross comparison between countries, we have limited the scope of our study to several hazards they have in common, e.g., floods, landslides, and active faults. Figure 1.1 shows the theoretical framework, adapted from a similar project undertaken by Berke et al. (1999). The theoretical framework links mandates for natural hazard risk reduction, organisational capability, plans and context. In our
GNS Science Report 2015/005 1

proposed research, we are also looking at the international mandates for natural hazard risk reduction, and whether these are provided for in national, regional and local plans.
The objective of the project is to improve the understanding of multi-scale implementation of policies for natural hazard risk reduction in four countries, as a key dimension of social action. To the best of our knowledge, we have compared policies from the administrative and political fields that relate to the varied components of natural hazard-related risk reduction policies developed in each country. Many of these policies are defined under different terms in each country, such as Civil Protection (Norway, Mexico), Disaster Prevention and Protection (Taiwan) and Civil Defence Emergency Management (New Zealand). We compared these policies based on a robust methodology (see Section 3), as well as the knowledge and understanding of researchers from each specific country. This analysis also includes land use plans, which also come under different names in each country (Urban Planning in Taiwan; Urban Municipal Development Plans in Mexico; City Plans in New Zealand; and Land Use Plans in Norway).
The project is planned in two stages; this study is part of Stage 1, to undertake a content analysis of natural hazard-related risk policies, including local land use plans and local emergency management systems. The project team are seeking funding for technical and student support to conduct the research and to allow them to meet and work on the project in the context of the IRDR Conference “Integrated Disaster Risk Science: A Tool for Sustainability”, which took place in Beijing, China, from 7th to the 9th of June, 2014. A future Stage 2 project will consider regional and local capability and capacity within authorities who manage land use and emergency management policies for natural hazards.
This research provides evidence-based outputs that support Priority 1 of the Hyogo Framework for Action 2005-2015 (UNISDR, 2007) – to ensure that disaster risk reduction is a national and a local priority, with a strong institutional basis for implementation. Our project contributes to the ‘Risk Interpretation and Action’ framework by providing an empirical study of risk interpretation through policy to implementation; it is based within applied socio-legal studies with a geographical perspective, and uses robust methods of content analysis.
1.3 A MULTI-STAGE STUDY
Our project entails two stages. In Stage 1 of the project, the research focuses on the analysis of mandates; we may be able to do some initial comparative reflective discourse based on the results of this first stage. This research will then form the basis for further analysis/questioning in the second stage (future) stage of the project, which will include an assessment of organisational capability and capacity.
Ericksen et al. (2003) undertook a content analysis of land use plans in New Zealand and presented a theoretical framework for explaining variation in the quality of these plans. Figure 1.1 shows an adapted version of this simplified for the international context, and comparisons that will be made in this project. Similar to the Ericksen et al. (2003) study, Figure 1.1 shows how the national mandate, and government agencies that help implement it, influence the capability of councils to plan.
2 GNS Science Report 2015/005
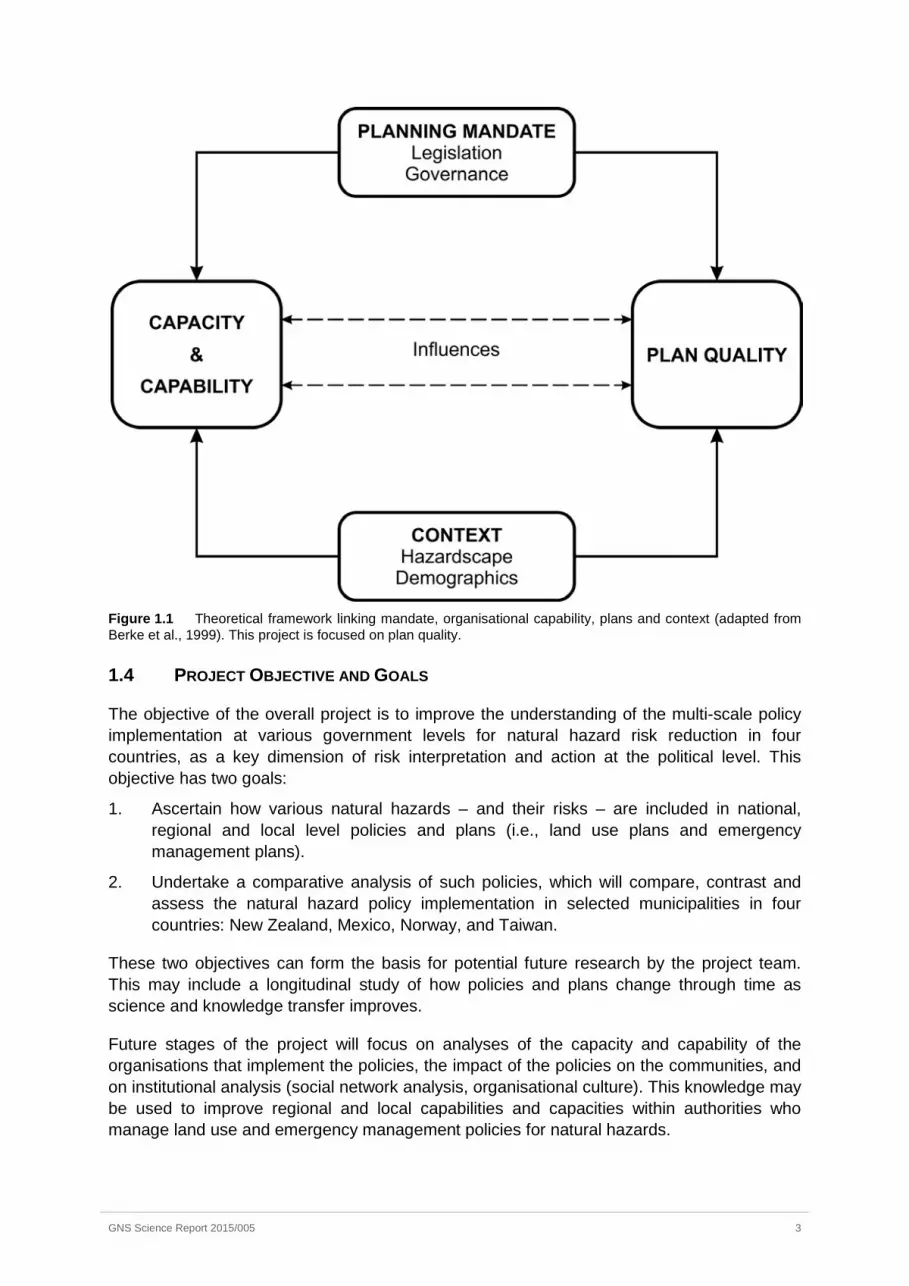
Figure 1.1 Theoretical framework linking mandate, organisational capability, plans and context (adapted from Berke et al., 1999). This project is focused on plan quality.
1.4 PROJECT OBJECTIVE AND GOALS
The objective of the overall project is to improve the understanding of the multi-scale policy implementation at various government levels for natural hazard risk reduction in four countries, as a key dimension of risk interpretation and action at the political level. This objective has two goals:
1. Ascertain how various natural hazards – and their risks – are included in national, regional and local level policies and plans (i.e., land use plans and emergency management plans).
2. Undertake a comparative analysis of such policies, which will compare, contrast and assess the natural hazard policy implementation in selected municipalities in four countries: New Zealand, Mexico, Norway, and Taiwan.
These two objectives can form the basis for potential future research by the project team. This may include a longitudinal study of how policies and plans change through time as science and knowledge transfer improves.
Future stages of the project will focus on analyses of the capacity and capability of the organisations that implement the policies, the impact of the policies on the communities, and on institutional analysis (social network analysis, organisational culture). This knowledge may be used to improve regional and local capabilities and capacities within authorities who manage land use and emergency management policies for natural hazards.
GNS Science Report 2015/005 3
1.5 RESEARCH QUESTIONS
Our research questions for this study (Stage 1 of the project) are:
1. How is policy implemented at the local level?
2. Is there a consistent approach to how hazard policies are mandated and implemented between national, regional and local level plans?
3. What can be learned from how other countries are implementing natural hazard policies?
To assist in answering these questions, four themes form the basis of the content analysis of plans: sustainability and resilience, risk reduction, integration, and multi-scale implementation. These themes are consistent with the Hyogo Framework for Action, as discussed below.
1.6 SIGNIFICANCE OF PROJECT
This research is directly relevant to three key frameworks, as outlined below.
1.6.1 Hyogo Framework for Action 2005-2015
Priority 1 of the Framework (UNISDR, 2013) is to ensure that disaster risk reduction is both a national and a local priority, with a strong institutional basis for implementation. As stated by the UNIRDR (2007, p. 6), “Countries that develop policy, legislative and institutional frameworks for disaster risk reduction and that are able to develop and track progress through specific and measurable indicators have greater capacity to manage risks and to achieve widespread consensus for, engagement in and compliance with disaster risk reduction measures across all sectors of society”.
A key activity of this priority is to integrate risk reduction (the underpinning assessment aim of this project), as appropriate, into development policies and planning at all levels of government. As such, in this study we assess the legislation to support disaster risk reduction, including regulations and mechanisms that encourage compliance and that promote incentives for undertaking risk reduction and mitigation activities (as outlined in the Framework’s Key Activity 1(c), p6). Prevention and reduction of disaster risk are an international legal obligation and constitute a safeguard for the enjoyment of human rights (UNIRDR, 2013).
This project will directly address the multiple scales at which policy making take place and the challenges that different levels of government face in implementing them. The comparative perspective contributes to an understanding of the diversity of regulatory environments in which Priority 1 of the Hyogo Framework of Action must be put into practice.
4 GNS Science Report 2015/005

1.6.2 Risk Interpretation and Action
This research supports the Eiser et al. (2012) ‘Risk Interpretation and Action’ (RIA) framework by providing an empirical study of risk interpretation via land use planning and disaster management policies, i.e., assessing how risk and other natural hazard terminology and concepts are transferred into a policy setting. This is important because risk reduction policies need to reducerisks, rather than increase them. The first step to ensure these positive outcomes is to evaluate the content of the policies. Only then can one monitor and review their implementation to assess if the policies are achieving their objective. Evaluations such as those proposed enable us to review the effectiveness of existing policy, and to guide future policy. If policies are not evaluated, a valuable opportunity is missed to learn how we can improve them (Berke & Godschalk, 2009).
1.6.3 Theoretical Basis
Our theoretical approach is derived mainly from legal geography. In socio-legal studies, disasters and catastrophes recently have been gaining attention, since they imply critical conditions that break the established social order (Nitrato, 2013: 221).
Firstly, theorists have addressed the spatial consequences of formal regulatory instruments (laws, rules, programmes); then they surveyed the spatial ideologies underlying their formulation (e.g., environmental conservation, economic freedom, social justice, property) and how the categories contained within the legal framework naturalized social and political inequalities (Blomley, 2002; Sivak, 2013). Finally, in recent years a few studies have focused on two main fields. Several have addressed how these ideological components have different effects on the type of policy that is implemented. They might include definitions of contentious or blurred concepts such as ‘resilience’, ‘public good’ or even ‘vulnerability’, or even the type of institutional capacities and regulatory environments that are generated around those principles (e.g., levels of decentralisation, public participation or law enforcement) (Sterett, 2013). On the other hand, there is an emerging field of empirical studies about policy implementation, particularly interactions in decision making, law enforcement and social action (e.g., Osofsky, 2013). This background supports our enquiry into the nature of emergency management systems and risk reduction policies.
We believe that the use of those conceptual approaches in this project complements the ‘Risk Interpretation and Action’ framework, particularly focusing on the structural dimension of social action, by exploring how the different state agents create and implement multi-scale disaster risk reduction policies in different countries.
GNS Science Report 2015/005 5

This page is intentionally left blank.
2.0 A COMPARISON OF HAZARDSCAPES IN CASE STUDY COUNTRIES
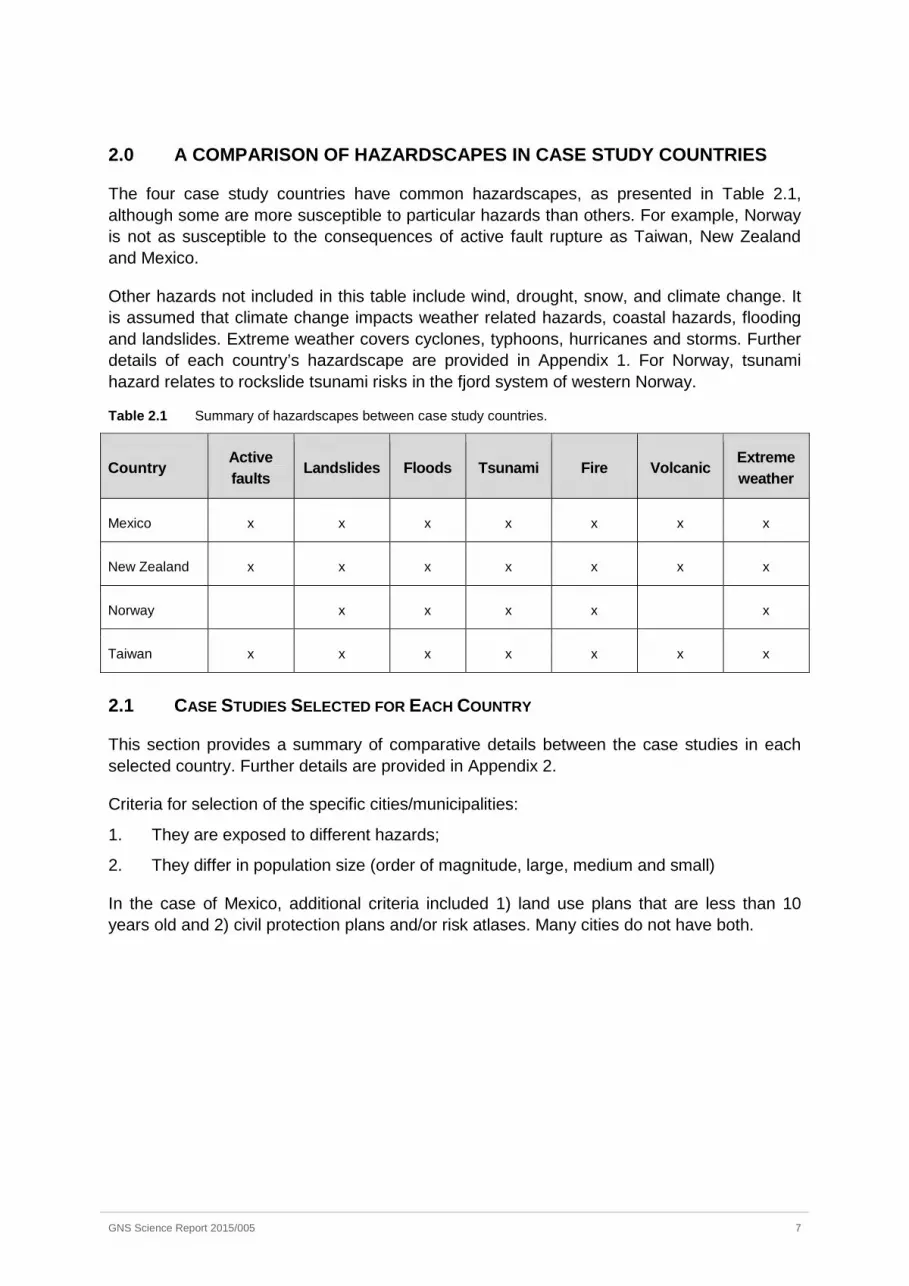
The four case study countries have common hazardscapes, as presented in Table 2.1, although some are more susceptible to particular hazards than others. For example, Norway is not as susceptible to the consequences of active fault rupture as Taiwan, New Zealand and Mexico.
Other hazards not included in this table include wind, drought, snow, and climate change. It is assumed that climate change impacts weather related hazards, coastal hazards, flooding and landslides. Extreme weather covers cyclones, typhoons, hurricanes and storms. Further details of each country’s hazardscape are provided in Appendix 1. For Norway, tsunami hazard relates to rockslide tsunami risks in the fjord system of western Norway.
Table 2.1 Summary of hazardscapes between case study countries.
Country Active faults
Landslides Floods Tsunami Fire Volcanic Extreme weather
Mexico x x x x x x x
New Zealand x x x x x x x
Norway x x x x x
Taiwan x x x x x x x
2.1 CASE STUDIES SELECTED FOR EACH COUNTRY
This section provides a summary of comparative details between the case studies in each selected country. Further details are provided in Appendix 2.
Criteria for selection of the specific cities/municipalities:
1. They are exposed to different hazards;
2. They differ in population size (order of magnitude, large, medium and small)
In the case of Mexico, additional criteria included 1) land use plans that are less than 10 years old and 2) civil protection plans and/or risk atlases. Many cities do not have both.
GNS Science Report 2015/005 7
2.1.1 New Zealand
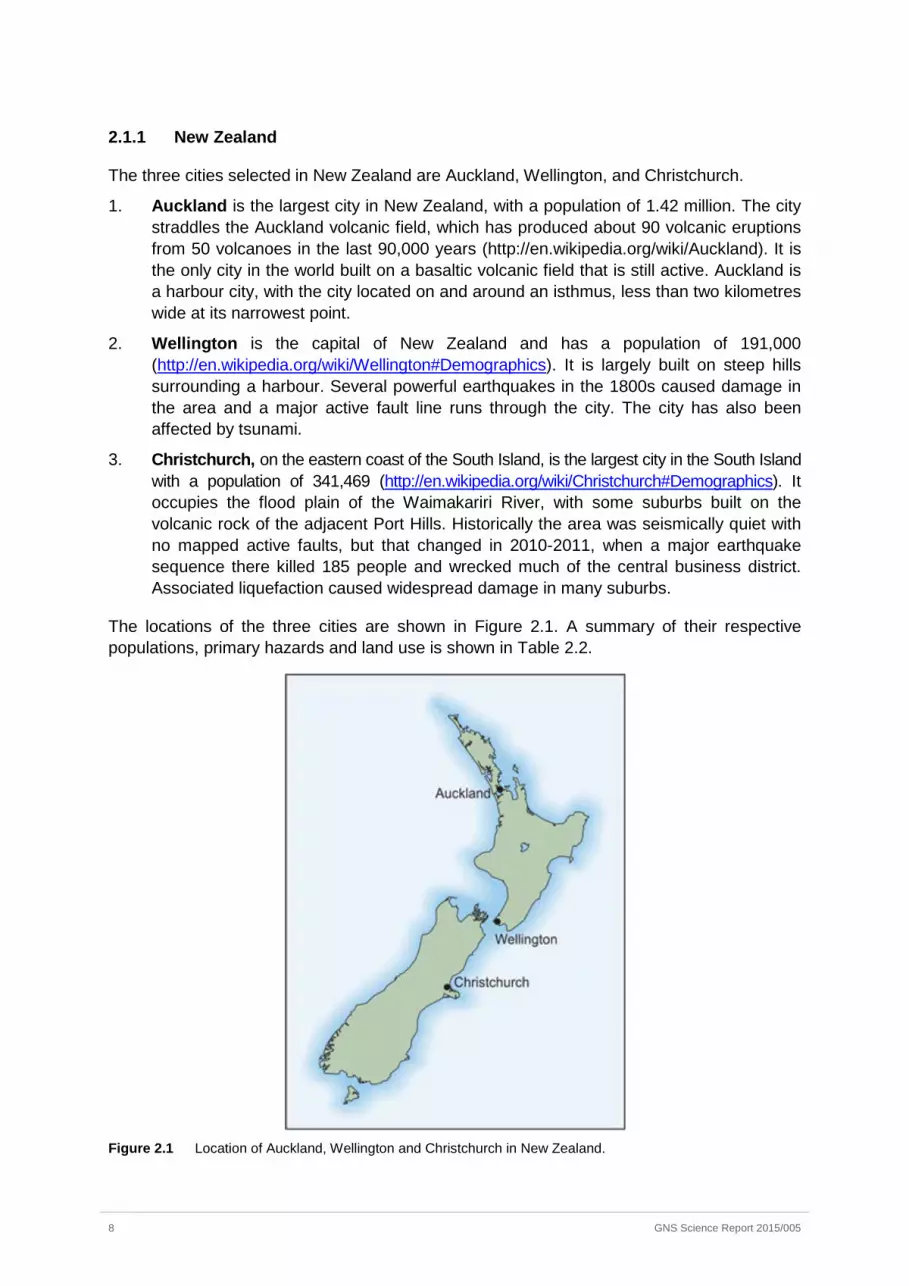
The three cities selected in New Zealand are Auckland, Wellington, and Christchurch.
1. Auckland is the largest city in New Zealand, with a population of 1.42 million. The city straddles the Auckland volcanic field, which has produced about 90 volcanic eruptions from 50 volcanoes in the last 90,000 years (http://en.wikipedia.org/wiki/Auckland). It is the only city in the world built on a basaltic volcanic field that is still active. Auckland is a harbour city, with the city located on and around an isthmus, less than two kilometres wide at its narrowest point.
2. Wellington is the capital of New Zealand and has a population of 191,000 (http://en.wikipedia.org/wiki/Wellington#Demographics). It is largely built on steep hills surrounding a harbour. Several powerful earthquakes in the 1800s caused damage in the area and a major active fault line runs through the city. The city has also been affected by tsunami.
3. Christchurch, on the eastern coast of the South Island, is the largest city in the South Island with a population of 341,469 (http://en.wikipedia.org/wiki/Christchurch#Demographics). It occupies the flood plain of the Waimakariri River, with some suburbs built on the volcanic rock of the adjacent Port Hills. Historically the area was seismically quiet with no mapped active faults, but that changed in 2010-2011, when a major earthquake sequence there killed 185 people and wrecked much of the central business district. Associated liquefaction caused widespread damage in many suburbs.
The locations of the three cities are shown in Figure 2.1. A summary of their respective populations, primary hazards and land use is shown in Table 2.2.
Figure 2.1 Location of Auckland, Wellington and Christchurch in New Zealand.
8 GNS Science Report 2015/005
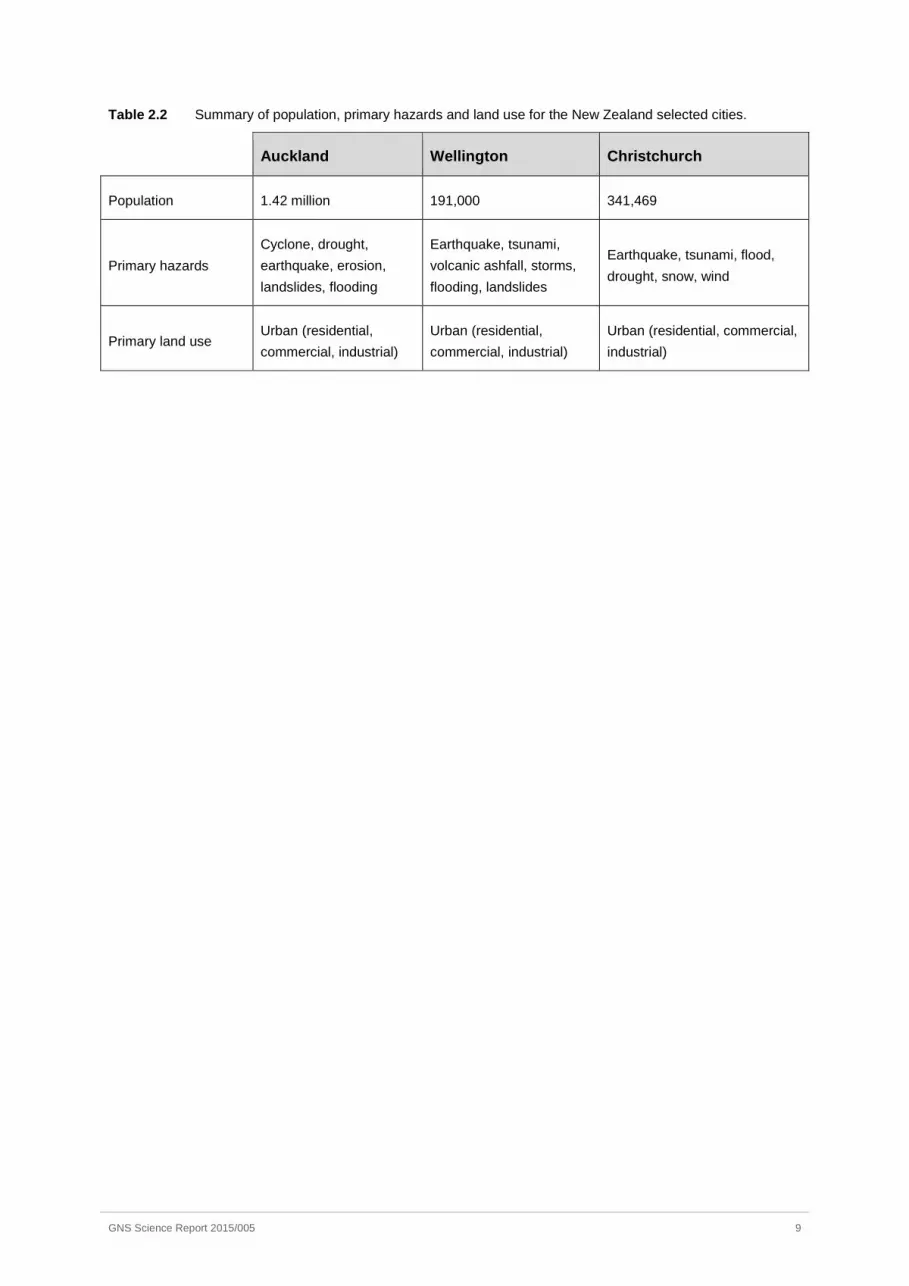
Table 2.2 Summary of population, primary hazards and land use for the New Zealand selected cities.
Auckland Wellington Christchurch
Population 1.42 million 191,000 341,469
Primary hazards Cyclone, drought, earthquake, erosion, landslides, flooding
Earthquake, tsunami, volcanic ashfall, storms, flooding, landslides
Earthquake, tsunami, flood, drought, snow, wind
Primary land use Urban (residential, commercial, industrial)
Urban (residential, commercial, industrial)
Urban (residential, commercial, industrial)
GNS Science Report 2015/005 9
2.1.2 Norway
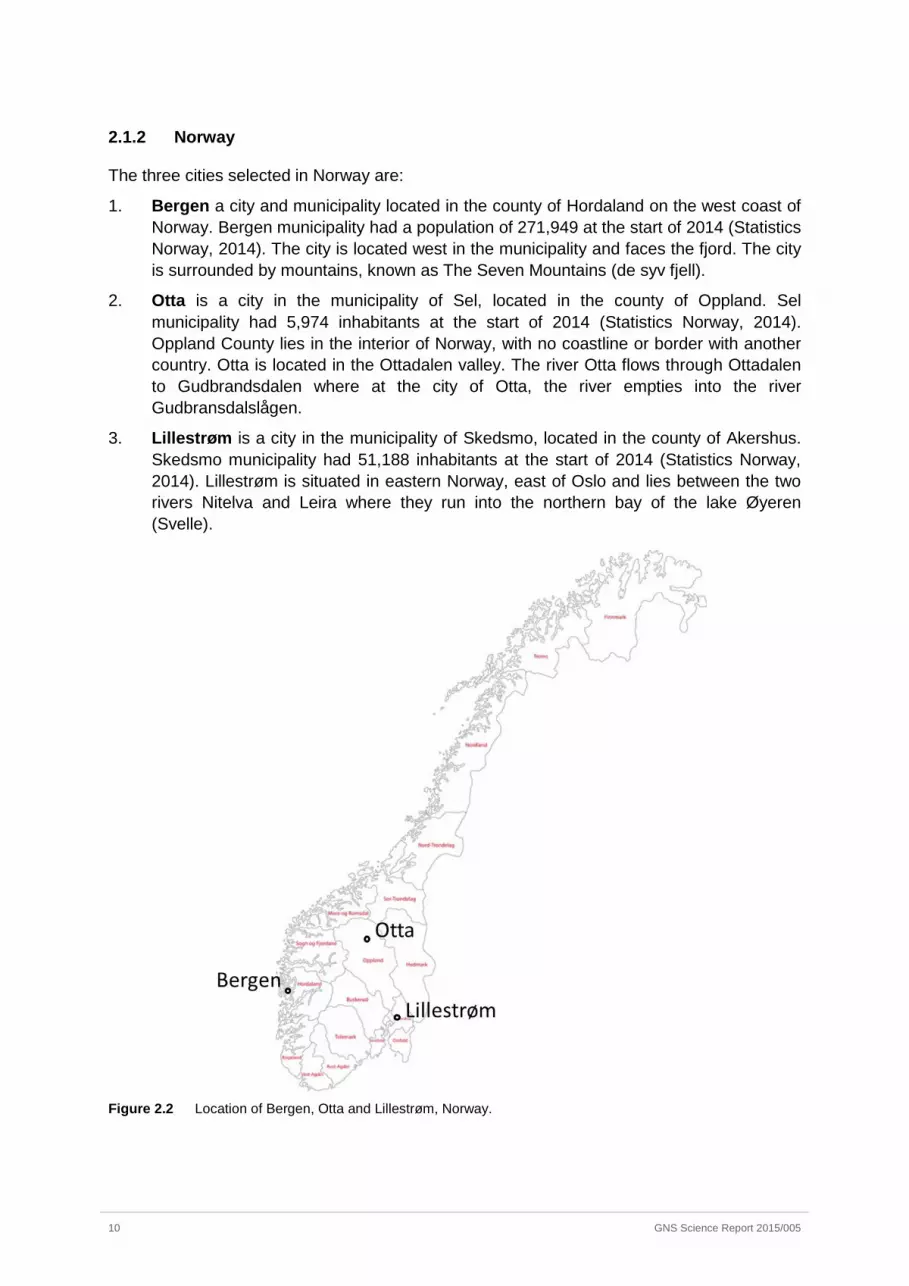
The three cities selected in Norway are:
1. Bergen a city and municipality located in the county of Hordaland on the west coast of Norway. Bergen municipality had a population of 271,949 at the start of 2014 (Statistics Norway, 2014). The city is located west in the municipality and faces the fjord. The city is surrounded by mountains, known as The Seven Mountains (de syv fjell).
2. Otta is a city in the municipality of Sel, located in the county of Oppland. Sel municipality had 5,974 inhabitants at the start of 2014 (Statistics Norway, 2014). Oppland County lies in the interior of Norway, with no coastline or border with another country. Otta is located in the Ottadalen valley. The river Otta flows through Ottadalen to Gudbrandsdalen where at the city of Otta, the river empties into the river Gudbransdalslågen.
3. Lillestrøm is a city in the municipality of Skedsmo, located in the county of Akershus. Skedsmo municipality had 51,188 inhabitants at the start of 2014 (Statistics Norway, 2014). Lillestrøm is situated in eastern Norway, east of Oslo and lies between the two rivers Nitelva and Leira where they run into the northern bay of the lake Øyeren (Svelle).
Figure 2.2 Location of Bergen, Otta and Lillestrøm, Norway.
10 GNS Science Report 2015/005
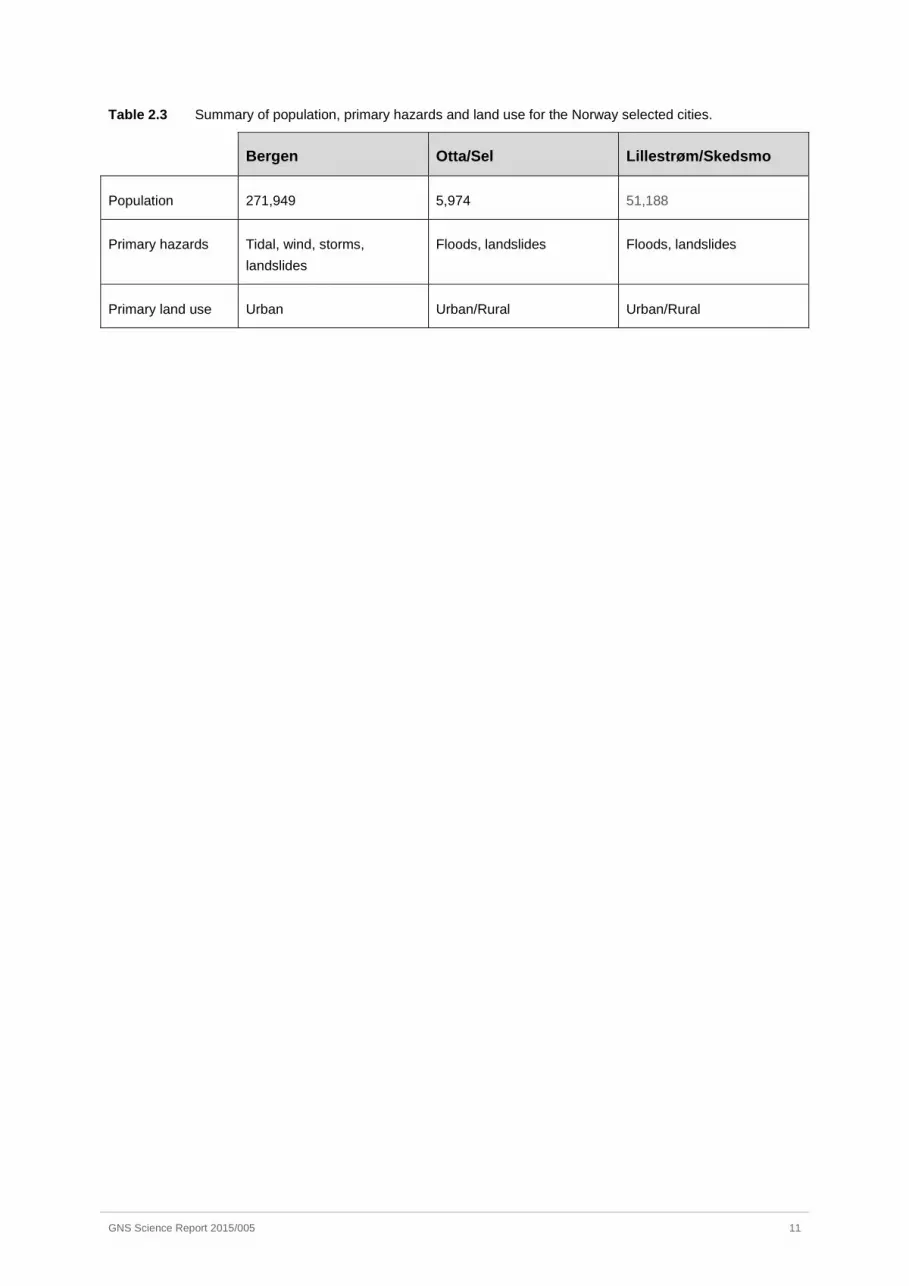
Table 2.3 Summary of population, primary hazards and land use for the Norway selected cities.
Bergen Otta/Sel Lillestrøm/Skedsmo
Population 271,949 5,974 51,188
Primary hazards Tidal, wind, storms, landslides
Floods, landslides Floods, landslides
Primary land use Urban Urban/Rural Urban/Rural
GNS Science Report 2015/005 11
2.1.3 Taiwan
The three cities selected for Taiwan are:
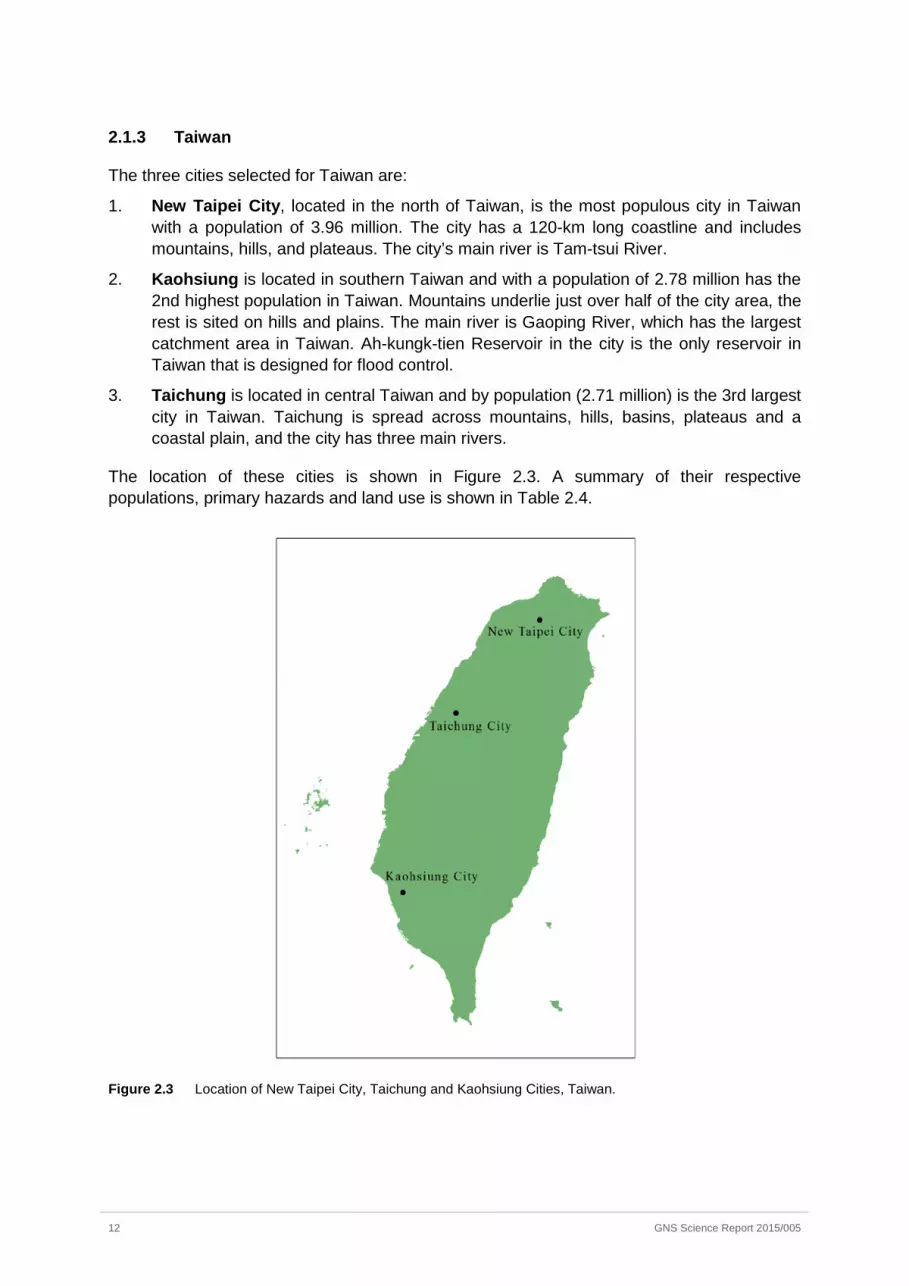
1. New Taipei City, located in the north of Taiwan, is the most populous city in Taiwan with a population of 3.96 million. The city has a 120-km long coastline and includes mountains, hills, and plateaus. The city’s main river is Tam-tsui River.
2. Kaohsiung is located in southern Taiwan and with a population of 2.78 million has the 2nd highest population in Taiwan. Mountains underlie just over half of the city area, the rest is sited on hills and plains. The main river is Gaoping River, which has the largest catchment area in Taiwan. Ah-kungk-tien Reservoir in the city is the only reservoir in Taiwan that is designed for flood control.
3. Taichung is located in central Taiwan and by population (2.71 million) is the 3rd largest city in Taiwan. Taichung is spread across mountains, hills, basins, plateaus and a coastal plain, and the city has three main rivers.
The location of these cities is shown in Figure 2.3. A summary of their respective populations, primary hazards and land use is shown in Table 2.4.
Figure 2.3 Location of New Taipei City, Taichung and Kaohsiung Cities, Taiwan.
12 GNS Science Report 2015/005

Table 2.4 Populations, primary hazards and land use of selected cities.
New Taipei City Kaohsiung City Taichung City
Population 3.96 million 2.78 million 2.71 million
Primary hazards Earthquakes, storms, floods, landslides
Earthquakes, storms, floods, landslides
Earthquakes, storms, floods, landslides
Primary land use Urban (residential, commercial)
Urban/Rural (residential, commercial, industrial)
Urban/Rural (residential, agriculture, mountains)
GNS Science Report 2015/005 13

2.1.4 Mexico
The three cities selected for Mexico are:
1. Acapulco is a port city with a population of 863,431 (National Population Census, 2010) located on Mexico’s southern Pacific coast; for many years it has been one of the country’s main tourist destinations. The city is situated on mountains surrounding a bay, and is underlain by steep slopes with unconsolidated soil. The city is commonly exposed to summer tropical storms, which often cause landslides and floods. Also, the city is located in the subduction zone between the Cocos and North American tectonic plates, which also exposes the area to significant seismic activity; there are also multiple records of tsunami events.
2. Xalapa with a population of 668,584 (National Population Census 2010) is located in the transition zone between the Sierra Madre Oriental mountain range and the coastal plain of the Gulf of Mexico. The urban area is located in a seismic zone, on a platform shaped by volcanic activity. Many urban sectors occupy slopes steeper than 25%, which makes them unsuitable for the urban development and they are highly prone to landslides. The city’s lower areas are seasonally flooded, even though the exposure of the city to tropical storms is not particularly intense.
3. Comitán is located in the south-east region of Mexico, in the province of Chiapas. It is an active commercial city, but according to the National Council for the Evaluation of Social Development Policy, about 66% of the population of 97,537 (National Population Census 2010) live in poverty. The city is located on plains surrounded by forested mountains, so the predominant hazards are landslides and river floods in the urban area.
The location of these cities is shown in Figure 2.4. A summary of their respective populations, primary hazards and land use is shown in Table 2.5.
Figure 2.4 Location of Acapulco, Xalapa and Comitan, Mexico.
14 GNS Science Report 2015/005
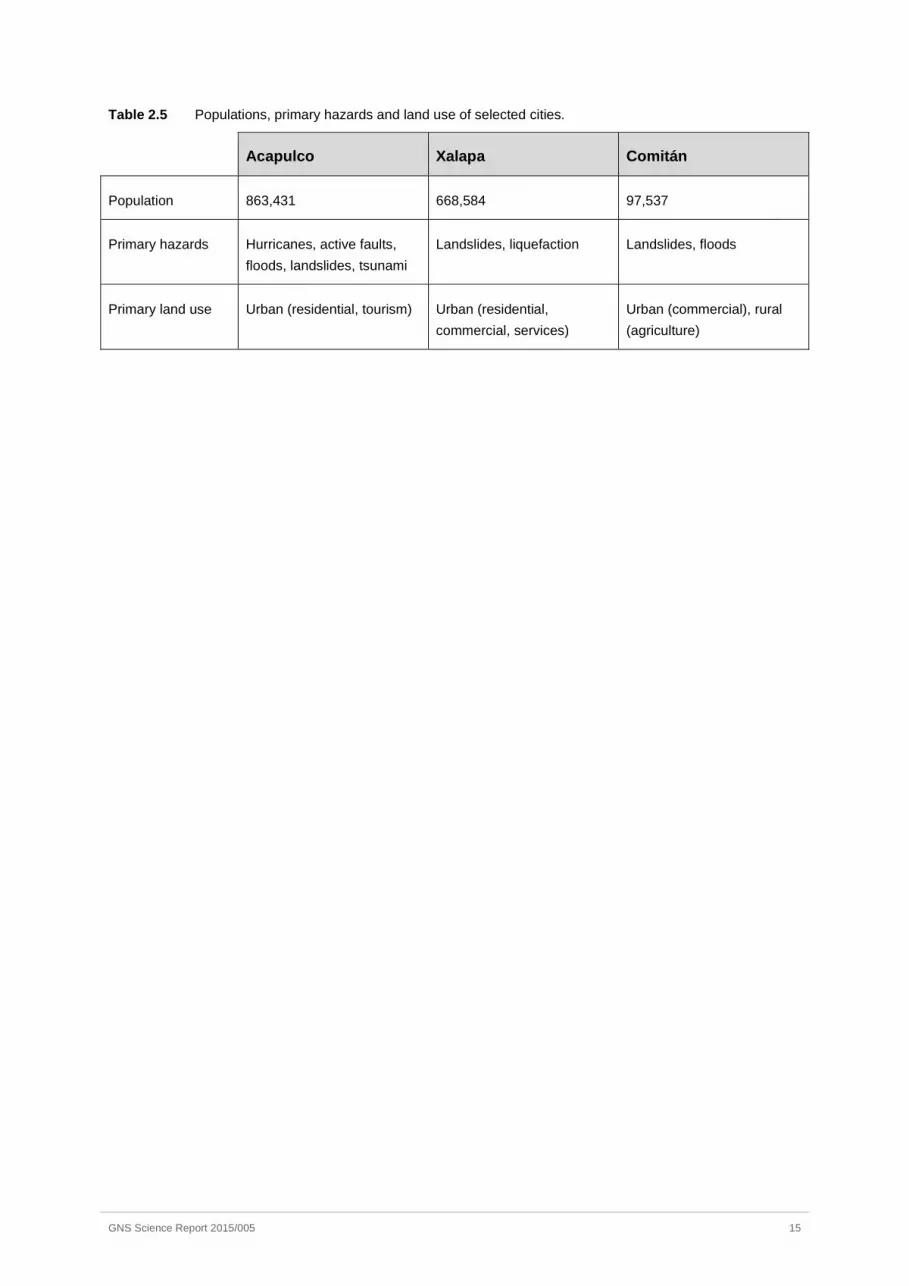
Table 2.5 Populations, primary hazards and land use of selected cities.
Acapulco Xalapa Comitán
Population 863,431 668,584 97,537
Primary hazards Hurricanes, active faults, floods, landslides, tsunami
Landslides, liquefaction Landslides, floods
Primary land use Urban (residential, tourism) Urban (residential, commercial, services)
Urban (commercial), rural (agriculture)
GNS Science Report 2015/005 15
2.2 PLANNING CONTEXTS
Appendix 3 provides a detailed overview of the planning frameworks in Taiwan, Mexico, New Zealand and Norway. An understanding of each of the planning environments within the case study nations is crucial to understanding the results and subsequent comparisons in Section 5.
The following table provides a brief summary of the legislative planning context for each country.
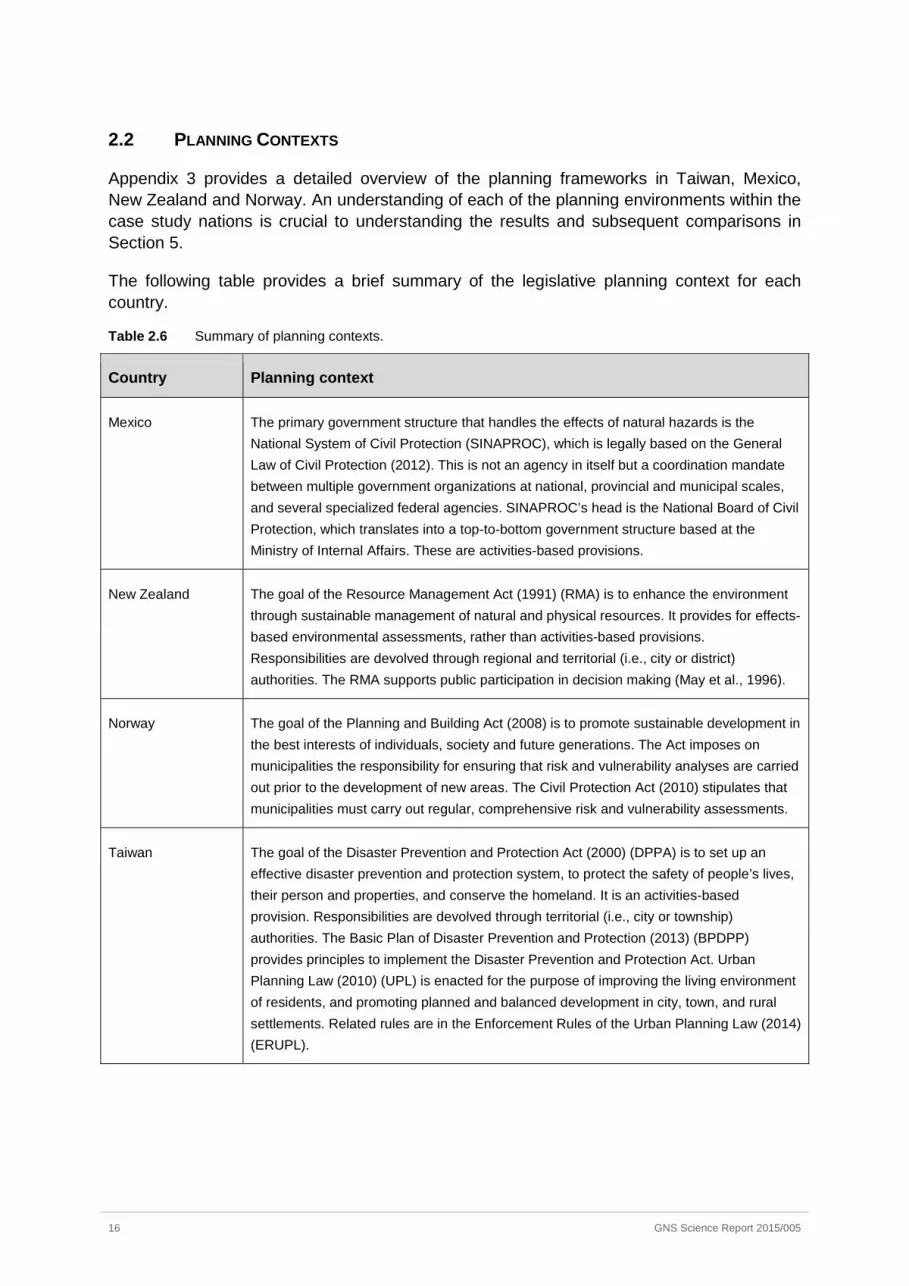
Table 2.6 Summary of planning contexts.
Country Planning context
Mexico The primary government structure that handles the effects of natural hazards is the National System of Civil Protection (SINAPROC), which is legally based on the General Law of Civil Protection (2012). This is not an agency in itself but a coordination mandate between multiple government organizations at national, provincial and municipal scales, and several specialized federal agencies. SINAPROC’s head is the National Board of Civil Protection, which translates into a top-to-bottom government structure based at the Ministry of Internal Affairs. These are activities-based provisions.
New Zealand The goal of the Resource Management Act (1991) (RMA) is to enhance the environment through sustainable management of natural and physical resources. It provides for effects-based environmental assessments, rather than activities-based provisions. Responsibilities are devolved through regional and territorial (i.e., city or district) authorities. The RMA supports public participation in decision making (May et al., 1996).
Norway The goal of the Planning and Building Act (2008) is to promote sustainable development in the best interests of individuals, society and future generations. The Act imposes on municipalities the responsibility for ensuring that risk and vulnerability analyses are carried out prior to the development of new areas. The Civil Protection Act (2010) stipulates that municipalities must carry out regular, comprehensive risk and vulnerability assessments.
Taiwan The goal of the Disaster Prevention and Protection Act (2000) (DPPA) is to set up an effective disaster prevention and protection system, to protect the safety of people’s lives, their person and properties, and conserve the homeland. It is an activities-based provision. Responsibilities are devolved through territorial (i.e., city or township) authorities. The Basic Plan of Disaster Prevention and Protection (2013) (BPDPP) provides principles to implement the Disaster Prevention and Protection Act. Urban Planning Law (2010) (UPL) is enacted for the purpose of improving the living environment of residents, and promoting planned and balanced development in city, town, and rural settlements. Related rules are in the Enforcement Rules of the Urban Planning Law (2014) (ERUPL).
16 GNS Science Report 2015/005
3.0 ANALYSIS OF PLAN CONTENTS
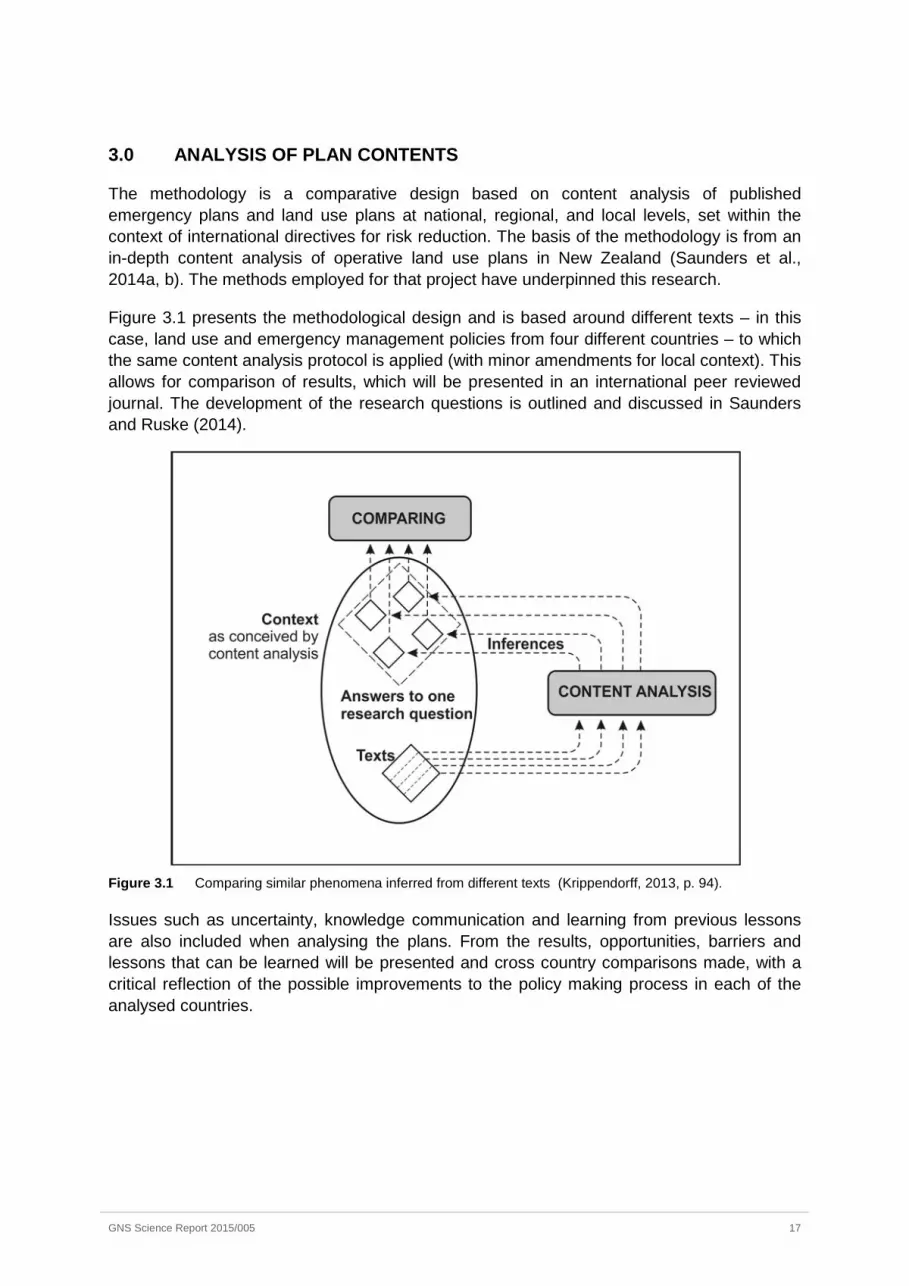
The methodology is a comparative design based on content analysis of published emergency plans and land use plans at national, regional, and local levels, set within the context of international directives for risk reduction. The basis of the methodology is from an in-depth content analysis of operative land use plans in New Zealand (Saunders et al., 2014a, b). The methods employed for that project have underpinned this research.
Figure 3.1 presents the methodological design and is based around different texts – in this case, land use and emergency management policies from four different countries – to which the same content analysis protocol is applied (with minor amendments for local context). This allows for comparison of results, which will be presented in an international peer reviewed journal. The development of the research questions is outlined and discussed in Saunders and Ruske (2014).
Figure 3.1 Comparing similar phenomena inferred from different texts (Krippendorff, 2013, p. 94).
Issues such as uncertainty, knowledge communication and learning from previous lessons are also included when analysing the plans. From the results, opportunities, barriers and lessons that can be learned will be presented and cross country comparisons made, with a critical reflection of the possible improvements to the policy making process in each of the analysed countries.
GNS Science Report 2015/005 17
3.1 ANALYTICAL TECHNIQUES
This report involves two types of analysis, often in combination:
1. Primarily descriptive, where the frequency of certain elements are counted and compared with other elements (Sarantakos, 1998), e.g., to give percentages; and
2. To a lesser extent, contingency, a semantic communication analysis to make inferences from the text (Sarantakos, 1998), e.g., specific policy wording.
To undertake the analysis, the following techniques were employed:
• Summarising the inferences from the three types of plans assessed, so that they are easily understood and interpreted; and
• Assessing patterns and relationships within findings, based on the questions asked (Krippendorff, 2013).
For these techniques, counts and cross tabulation of the data using Excel were the primary methods used.
For each case study, 127 questions were asked of the plans. Counting is a common technique to reduce high volume data into something more manageable, yet still comprehensible. Counting is justified only when the resulting frequency means something, can somehow be related to what a body of text means in the chosen context, or leads to answering a research question (Krippendorff, 2013). In this project, counting is justified as the results are comparative and answer specific questions.
3.2 ANALYTICAL CONSTRUCTS
A key part of analysis is the role of analytical constructs. According to Krippendorff (2013, p. 170):
An analytical construct accounts for what the content analyst knows, suspects, or assumes about the context of the text, and it operationalises that presumption procedurally in order to produce inferences from that text.
An analytical construct can also be described as a collection of ‘if-then’ statements that define at least one path from the available data and/or text to the answers sought (Krippendorff, 2013). If reliably executed, analytical constructs warrant the intended inferences, in that they guide the analyst along a logical path. However, such inferences must be backed by knowledge of the context of the analysed texts, to assure the analyst that the path leads to valid conclusions (Krippendorff, 2013).
Analytical constructs for this project rely on sources of certainty for the analytical procedures, including:
• Expert knowledge and experience with a context (i.e., land use planning for natural hazards), to argue for structural correspondences between the construct and the context. In this case, the authors of this report have levels of expert knowledge, from 3 to 10 years in natural hazard planning; and
• Embodied practices, from a context (i.e., land use planning for natural hazards), to argue for the representative nature of the inferences obtained from these practices.
18 GNS Science Report 2015/005

As highlighted above, context is important to inferences. Therefore, in the analysis presented, themes have a contextual explanation as to why the theme is important and/or relevant. Once texts have been recorded and analytical constructs applied, analytical techniques are employed to represent results.
3.3 VALIDITY
Validation provides the justification for accepting results as ‘true’. For this project the following three types of validity are acknowledged (Krippendorff, 2013):
1. Face validity – findings are accepted based on their ‘face value’; because they make sense and are believable.
2. Social validity – findings are accepted on account of their contribution to the public discussion of important social concerns.
3. Empirical validity – the degree to which available evidence and established theory support various stages of the research process and its results.
Of these three, empirical validity is considered the primary focus, to ensure that the results are robust and transparent; only then can the results have face and social validity for councils and policy makers. The initial data gathering was undertaken using robust methods outlined in Saunders and Ruske (2014).
For New Zealand and Taiwan, the project involved assessing ALL operative plans, therefore there is a 100% inference accuracy (e.g., if only 30% of plans were assessed, inferences made to the remaining 70% of plans could be inaccurate). The confidence levels are therefore high, particularly with the robust methodology that was used. For Norway and Mexico, it was not possible it assess every plan in the country. However, as we are not making national inferences for this part of the project, the validity rating is not assessed to have an impact on the findings or discussion for the comparative analysis between countries.
Bias, Limitations and Opportunities
The following points are acknowledged with regard to author bias, limitations of analysis, and opportunities for future analysis.
• The authors of this report have pre-determined knowledge of the subject area. This could be a benefit, but could also lead to bias in interpretation of data. To ensure this knowledge has not biased any results or discussion, references have been used to justify positions, and evidence was based on the data discussed.
• As this analysis is descriptive in nature, statistical analysis has not been undertaken. However, there is an opportunity for further analysis to be undertaken.
• The analysis of the implementation of hazard policies has been based only on data within this study. There is an opportunity for further research to generate more conclusive or statistically significant inferences about factors influencing effective implementation processes.
GNS Science Report 2015/005 19
3.4 DEVELOPMENT OF PLAN EVALUATION CRITERIA / PROTOCOLS
Berke and Godschalk (2009) provide a brief review of criteria for evaluating plans. They believe that two concepts should be included in plan quality evaluation:
4. Internal plan quality – this includes the content and format of key components of the plan (e.g., issues and vision statement, fact base, goal and policy framework; implementation, monitoring) needed to guide land use in the future; and
5. External plan quality – this includes the relevance of the scope and coverage to stakeholder values and the local situation to maximize its use and the influence of the plan.
This research has primarily focused on internal plan quality, with analysis of key components of the plan that match those by Berke and Godschalk (2009), and built on by Saunders and Roche (2014).
When developing the questions, a review of other studies was undertaken, to see what opportunities existed to utilise existing protocols (e.g., Beban, Coomer, & McBride, 2012; Becker & Johnston, 2000; Berke et al., 2012; Ericksen et al., 2003; IBHS, 2001) This also allows a future opportunity to do comparative studies (e.g., United States hazard mitigation plan quality versus New Zealand natural hazard provision quality in plans).
As a result, and reflecting the principles outlined in Berke et al. (2012), the following categories (as shown in the coding protocol in Appendix 4) were included in the content analysis protocol and coding:
Demographic details Vision Rules Implementation support Anticipated environmental outcomes Integration Plan monitoring Coordination Resources Policies Fact base Mapping Other methods Risk-based approach Objectives Hazard monitoring
To achieve the outcomes of this project, within time and resource constraints, the analysis within this report is limited to three areas: 1) risk reduction; 2) integration, and 3) multi-scale implementation. Opportunities will be taken to further this analysis in the future.
3.5 CODING OF PLANS
Krippendorff (2013, p. 128) states, “Recording is a highly repetitive analytical task that requires strenuous attention to details. Not everyone is capable of maintaining consistency under these conditions”. As such, consistency is a key attribute of coding.
A content analysis project in New Zealand (Saunders & Ruske, 2014; Saunders, Beban & Coomer, 2014, Saunders, Grace & Beban, 2014) formed the basis of this international comparative study. In the Saunders project, a common scoring system was used, where 1 = Yes, 2 = No, and where required a 3 and 4 were included (refer to the protocol in Appendix 4 for full scoring system. To ensure reliable data is generated, it is recommended that analysis should be undertaken by two or more coders, who code independently of each other. Rules are developed by the coding team to ensure all coders interpret the items as consistently as
20 GNS Science Report 2015/005
possible (Berke & Godschalk, 2009). A percentage agreement score is then given, with a score between 70–97% deemed acceptable (Berke et al., 2012). To ensure a higher score, pre-testing the protocol is recommended, to improve the reliability of the instructions and score (Berke & Godschalk, 2009). However, reliability scores do not answer the concern that percentage agreement becomes more difficult to achieve as the number of coding categories increases (Berke & Godschalk, 2009). In our research, there were a total of 127 questions.
Apart from within the initial testing stage of the original protocol (Saunders & Ruske, 2014), double coding was not undertaken, primarily due to resourcing and cost. However, in order to have a consistent and reliable approach to coding, the following actions were followed in the original Saunders and Ruske (2014) project:
• Testing of the protocol was undertaken by three test coders, all coding the same four plans.
• An analysis of discrepancies was undertaken, and the protocol questions amended and further instructions provided.
• One person coded all operative 99 plans, in order to achieve a consistent approach to the coding. This negated the need for individual reliability scores among coders.
• Only those plans that were operative were coded, as draft and proposed plans are subject to change before becoming operative.
• Plans were accessed online. Where plans were incomplete or not online, contact was made with the council to gain access.
• The coding of New Zealand plans was undertaken from November 2013 to January 2014; Mexico’s plans were coded between August and October 2014; Norwegian plans were coded between June and September 2014; Taiwan’s plans were coded in April 2014.
• After four days of coding the New Zealand plans, a meeting was held with the coder to discuss any questions, seek clarification of issues, and discuss any changes required.
• Four coded plans were randomly re-coded by a second coder, throughout the duration of the coding process. Discrepancies were less than 30%, below that which is considered to be an issue (Berke, et al., 2012).
• The primary coder re-coded the first two regional policy statements, two territorial authority plans and two Civil Defence Emergency Management (CDEM) plans at the end of the coding process to ensure that consistency was maintained throughout, i.e., from the plans assessed at the start of the process to those at the end. Discrepancies ranged from 6–15.6%, which is below the 30% criterion outlined in Berke et al. (2012), and therefore acceptable. No further re-coding was deemed to be required.
GNS Science Report 2015/005 21
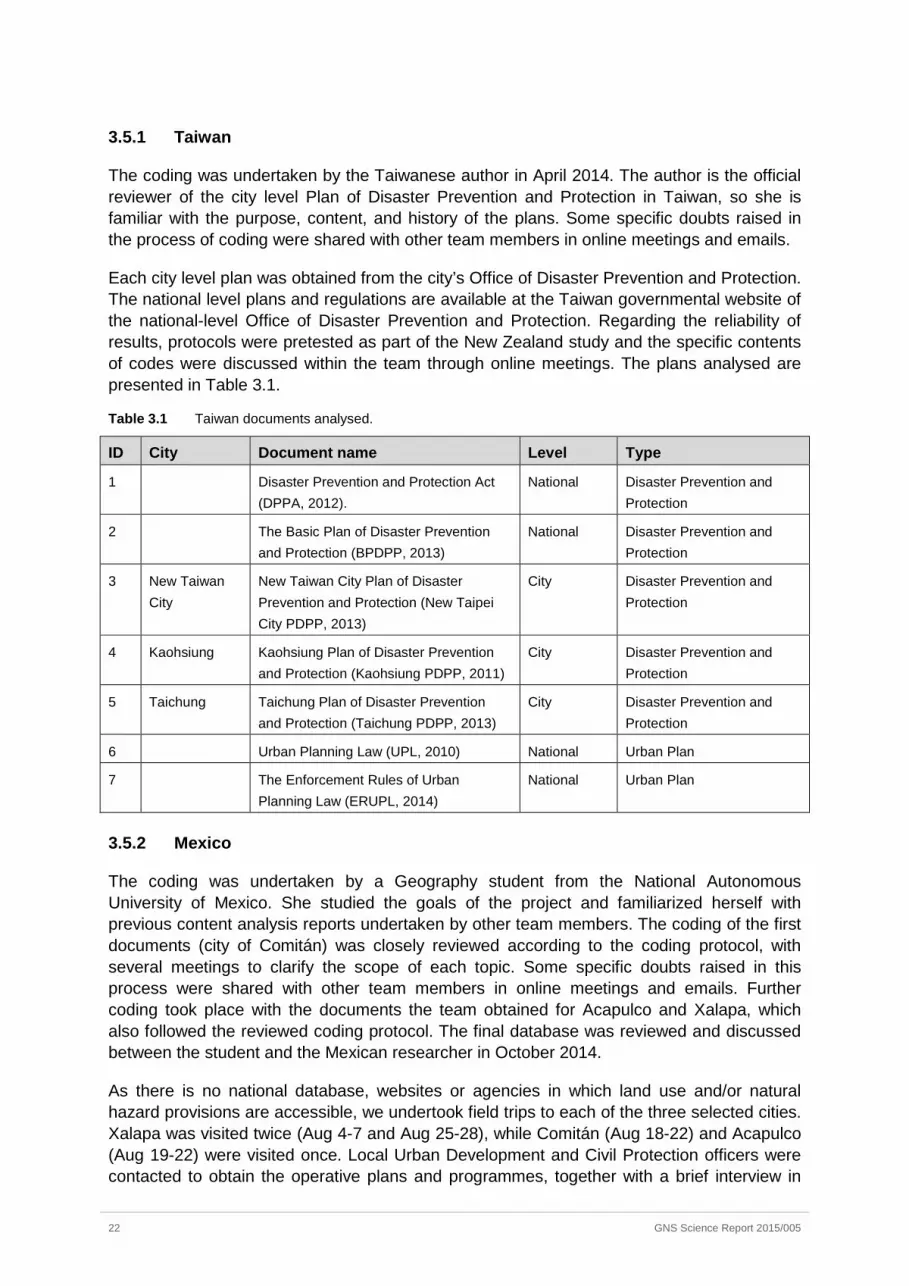
3.5.1 Taiwan
The coding was undertaken by the Taiwanese author in April 2014. The author is the official reviewer of the city level Plan of Disaster Prevention and Protection in Taiwan, so she is familiar with the purpose, content, and history of the plans. Some specific doubts raised in the process of coding were shared with other team members in online meetings and emails.
Each city level plan was obtained from the city’s Office of Disaster Prevention and Protection. The national level plans and regulations are available at the Taiwan governmental website of the national-level Office of Disaster Prevention and Protection. Regarding the reliability of results, protocols were pretested as part of the New Zealand study and the specific contents of codes were discussed within the team through online meetings. The plans analysed are presented in Table 3.1.
Table 3.1 Taiwan documents analysed.
ID City Document name Level Type
1 Disaster Prevention and Protection Act (DPPA, 2012).
National Disaster Prevention and Protection
2 The Basic Plan of Disaster Prevention and Protection (BPDPP, 2013)
National Disaster Prevention and Protection
3 New Taiwan City
New Taiwan City Plan of Disaster Prevention and Protection (New Taipei City PDPP, 2013)
City Disaster Prevention and Protection
4 Kaohsiung Kaohsiung Plan of Disaster Prevention and Protection (Kaohsiung PDPP, 2011)
City Disaster Prevention and Protection
5 Taichung Taichung Plan of Disaster Prevention and Protection (Taichung PDPP, 2013)
City Disaster Prevention and Protection
6 Urban Planning Law (UPL, 2010) National Urban Plan
7 The Enforcement Rules of Urban Planning Law (ERUPL, 2014)
National Urban Plan
3.5.2 Mexico
The coding was undertaken by a Geography student from the National Autonomous University of Mexico. She studied the goals of the project and familiarized herself with previous content analysis reports undertaken by other team members. The coding of the first documents (city of Comitán) was closely reviewed according to the coding protocol, with several meetings to clarify the scope of each topic. Some specific doubts raised in this process were shared with other team members in online meetings and emails. Further coding took place with the documents the team obtained for Acapulco and Xalapa, which also followed the reviewed coding protocol. The final database was reviewed and discussed between the student and the Mexican researcher in October 2014.
As there is no national database, websites or agencies in which land use and/or natural hazard provisions are accessible, we undertook field trips to each of the three selected cities. Xalapa was visited twice (Aug 4-7 and Aug 25-28), while Comitán (Aug 18-22) and Acapulco (Aug 19-22) were visited once. Local Urban Development and Civil Protection officers were contacted to obtain the operative plans and programmes, together with a brief interview in
22 GNS Science Report 2015/005
order to understand the local implementation context. The visit to Acapulco was undertaken by a senior independent researcher and not by the research assistant, given the problems of violence in that city. Electronic and physical copies of all documents are available (in Spanish).
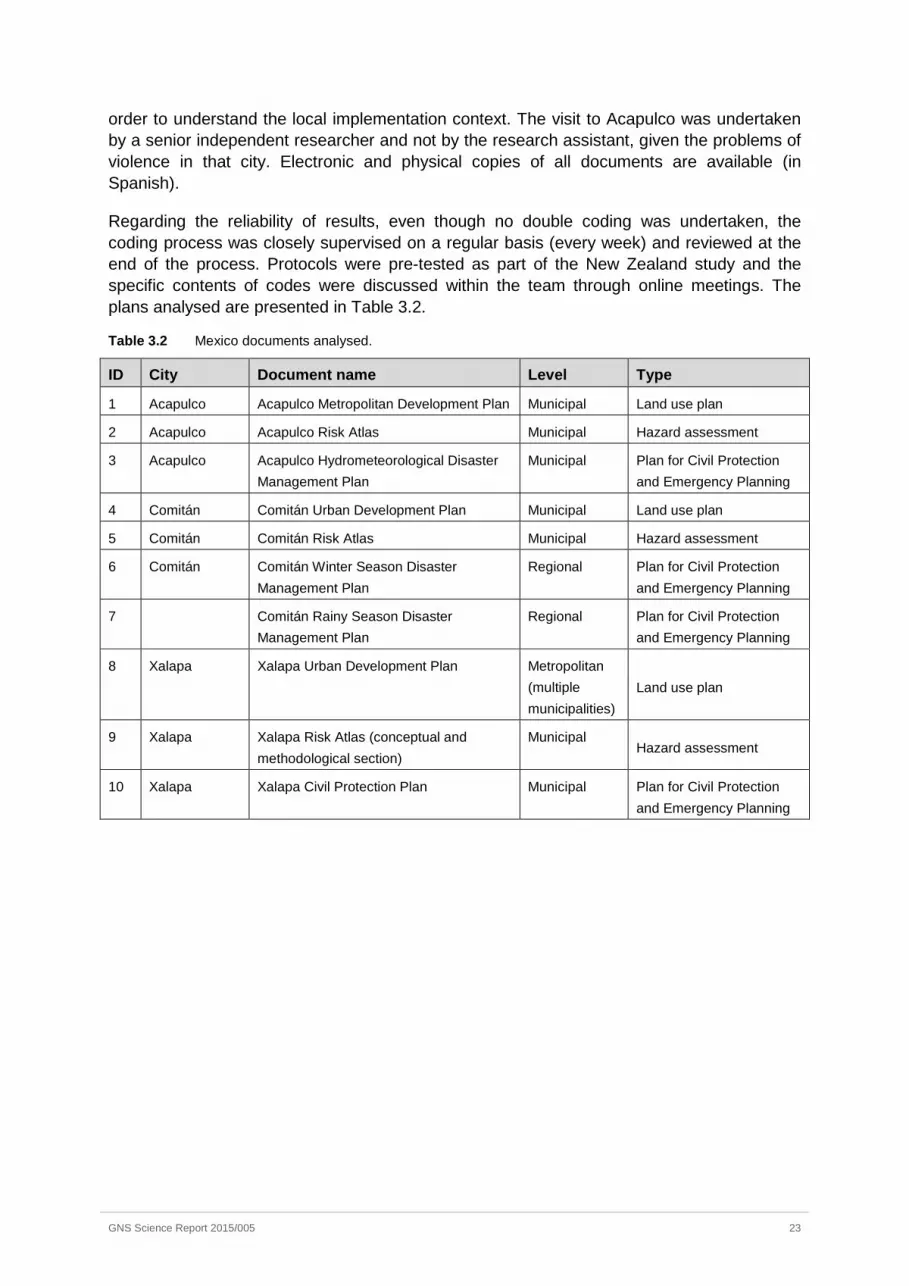
Regarding the reliability of results, even though no double coding was undertaken, the coding process was closely supervised on a regular basis (every week) and reviewed at the end of the process. Protocols were pre-tested as part of the New Zealand study and the specific contents of codes were discussed within the team through online meetings. The plans analysed are presented in Table 3.2.
Table 3.2 Mexico documents analysed.
ID City Document name Level Type
1 Acapulco Acapulco Metropolitan Development Plan Municipal Land use plan
2 Acapulco Acapulco Risk Atlas Municipal Hazard assessment
3 Acapulco Acapulco Hydrometeorological Disaster Management Plan
Municipal Plan for Civil Protection and Emergency Planning
4 Comitán Comitán Urban Development Plan Municipal Land use plan
5 Comitán Comitán Risk Atlas Municipal Hazard assessment
6 Comitán Comitán Winter Season Disaster Management Plan
Regional Plan for Civil Protection and Emergency Planning
7 Comitán Rainy Season Disaster Management Plan
Regional Plan for Civil Protection and Emergency Planning
8 Xalapa Xalapa Urban Development Plan Metropolitan (multiple municipalities)
Land use plan
9 Xalapa Xalapa Risk Atlas (conceptual and methodological section)
Municipal Hazard assessment
10 Xalapa Xalapa Civil Protection Plan Municipal Plan for Civil Protection and Emergency Planning
GNS Science Report 2015/005 23
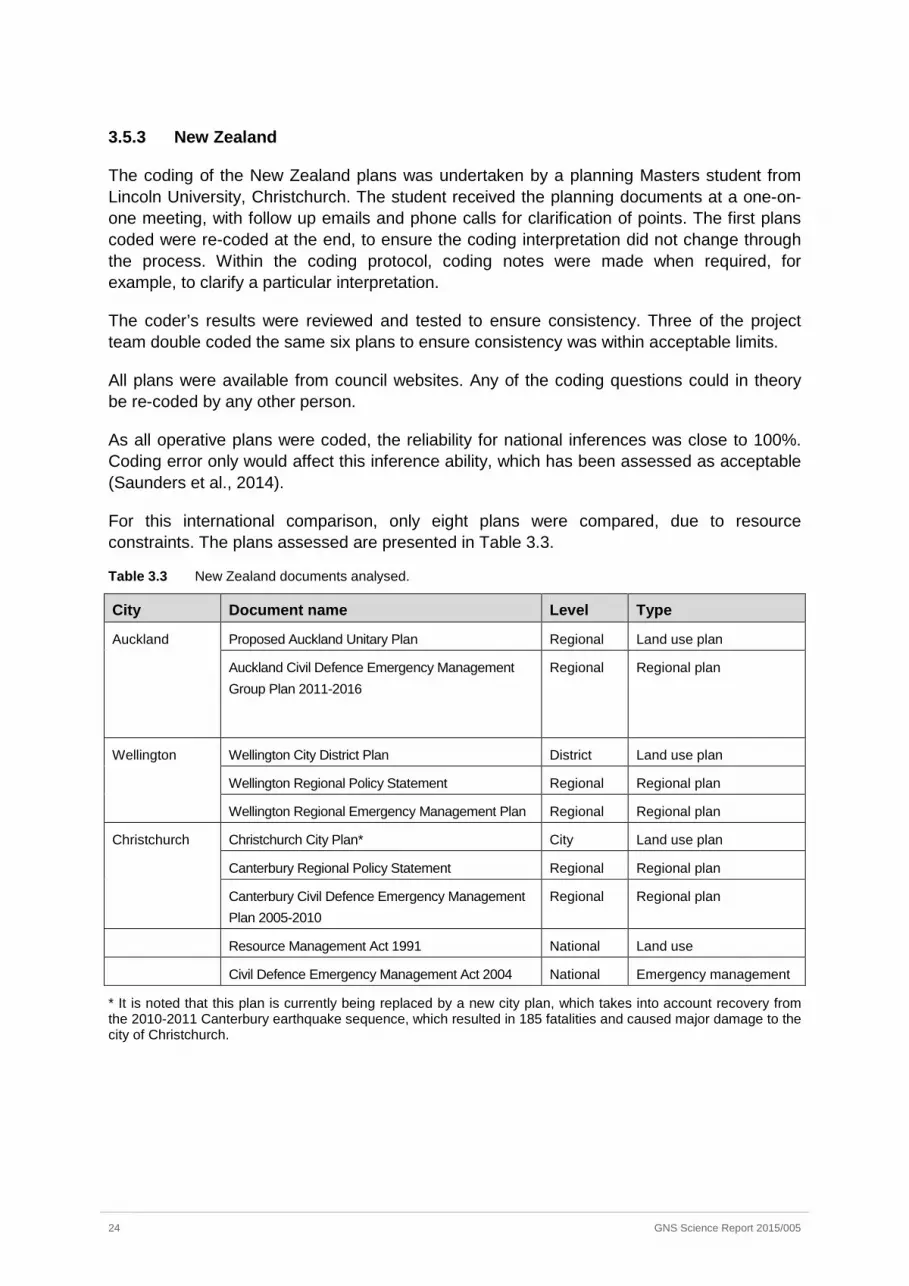
3.5.3 New Zealand
The coding of the New Zealand plans was undertaken by a planning Masters student from Lincoln University, Christchurch. The student received the planning documents at a one-on-one meeting, with follow up emails and phone calls for clarification of points. The first plans coded were re-coded at the end, to ensure the coding interpretation did not change through the process. Within the coding protocol, coding notes were made when required, for example, to clarify a particular interpretation.
The coder’s results were reviewed and tested to ensure consistency. Three of the project team double coded the same six plans to ensure consistency was within acceptable limits.
All plans were available from council websites. Any of the coding questions could in theory be re-coded by any other person.
As all operative plans were coded, the reliability for national inferences was close to 100%. Coding error only would affect this inference ability, which has been assessed as acceptable (Saunders et al., 2014).
For this international comparison, only eight plans were compared, due to resource constraints. The plans assessed are presented in Table 3.3.
Table 3.3 New Zealand documents analysed.
City Document name Level Type
Auckland Proposed Auckland Unitary Plan Regional Land use plan
Auckland Civil Defence Emergency Management Group Plan 2011-2016
Regional Regional plan
Wellington Wellington City District Plan District Land use plan
Wellington Regional Policy Statement Regional Regional plan
Wellington Regional Emergency Management Plan Regional Regional plan
Christchurch Christchurch City Plan* City Land use plan
Canterbury Regional Policy Statement Regional Regional plan
Canterbury Civil Defence Emergency Management Plan 2005-2010
Regional Regional plan
Resource Management Act 1991 National Land use
Civil Defence Emergency Management Act 2004 National Emergency management
* It is noted that this plan is currently being replaced by a new city plan, which takes into account recovery from the 2010-2011 Canterbury earthquake sequence, which resulted in 185 fatalities and caused major damage to the city of Christchurch.
24 GNS Science Report 2015/005
3.5.4 Norway
For Norway, the plans were collected and coded between June and September 2014. The coding was done by a research assistant and the author. One plan was pre-tested by both in order to gain familiarity with the use of the protocol and verify the obtained results.
The research assistant started the coding, but due to sickness was not able to code all the documents. The author finalized the coding; this provided some language challenges as the plans are in Norwegian (both Nynorsk and Bokmal) and the author is not a native speaker. The plans were first translated to English and then coded. This translation may have resulted in some misinterpretations of the plans. The coding done in this project for Norway is thus based solely on the author’s interpretation of the content of the documents.
Coding was done for two types of plans: land use plans and emergency management plans (often stated as the Risk and Vulnerability Assessment linked to Civil Protection and Emergency Planning). The plans were obtained via an internet search, on the webpages of either the Flykeskommune (County Council) or Kommune (Municipality).
For Norway, the analysis focuses on two levels, the regional and local level, which are called ‘county’ and ‘kommune’ level. The two selected cities Otta and Lillestrøm are part of the kommunes (municipalities) Sel and Skedsmo. As there are no plans at city level we have only collected and coded the plans for the kommunes. For the city of Bergen plans are available for the city/kommune level.
For the regional documents, it is noted that some plans have been drafted by the Fylkeskommune, which is a democratic elected regional body and/or Fylkesmannen, the County Governor, who is the state authority at the regional level, who checks that plans are implemented at the regional and local level.
In the plans, ‘climate change’ is often stated to be part of the ‘Climate and Energy Plan’ (Klima og Energy Plan). This ‘Climate and Energy Plan’ focuses mainly on climate mitigation; however it is possible to include climate change adaptation, but it is not a requirement at the moment.
Furthermore, the land use plans often refer to underlying ‘sub-plans’; for example, the Climate and Energy Plans. This implies that some questions which currently have been answered with a ‘no’ in terms of the general document, maybe become a ‘yes’ if the sub-plans were also considered.
The analysis did not included proposed strategies, so the results represent the hazard provisions as of the summer of 2014 and results may change, as and when new proposed plans become operative.
Protocols were pre-tested as part of the New Zealand study and the specific contents of codes were discussed within in the team through online meetings. The plans analysed are presented in Table 3.4.
GNS Science Report 2015/005 25

Table 3.4 Norway documents analysed.
ID City Document name Level Type
1 Bergen Hordaland fylkeskommune (2011) Regional Planstrategi for Hordaland 2012-2016. Bergen.
County (Fylke) Planning strategy
2 Bergen Fylkesmannen i Hordaland (2009) FylkesROS Hordaland 2009. Risk and Vulnerability analysis for Hordaland County.
County (Fylke) Plan for Civil Protection and Emergency Planning
3 Lillestrøm / Skedsmo
Akershus fylkeskommune (2013) Regional Planstrategi for Akershus 2013-2016
County (Fylke) Planning strategy
4 Lillestrøm / Skedsmo
Fylkes ROS Oslo og Akershus(*) County (Fylke) Plan for Civil Protection and Emergency Planning
5 Otta / Sel Oppland fylkeskommune (2012) Mulighetenes Oppland Regional planstrategi 2012-2016
County (Fylke) Planning strategy
6 Otta / Sel Fylkesmannen i Oppland og Oppland fylkeskommune (2014) Regional plan for samfunnssikkerhet og beredskap 2014-2017. Risiko- og sårbarhetsanalyse for Oppland fylke
County (Fylke) Plan for Civil Protection and Emergency Planning
7 Bergen Bergen kommune (2012). Kommunal planstrategi 2012
Municipality (Kommune)
Planning strategy
8 Lillestrøm / Skedsmo
Skedsmo kommune (2014) Kommuneplan 2015-2026 Planbeskrivelse
Municipality (Kommune)
Planning strategy
9 Otta / Sel Sel Kommune (2012) Kommunal planstrategi for Sel Kommune 2012-2015
Municipality (Kommune)
Planning strategy
10 Otta / Sel Sel Kommune_Risiko og sårbarhetsanalyse Municipality (Kommune)
Plan for Civil Protection and Emergency Planning
(*) Fylkes ROS Oslo og Akershus was not traceable for coding.
26 GNS Science Report 2015/005
4.0 CASE STUDY FINDINGS
Four themes form the basis of the content analysis of plans: sustainability and resilience, risk reduction, integration, and multi-scale implementation. The findings for the cases are specified below for each country.
4.1 TAIWAN
4.1.1 Sustainability and Resilience
(1) Disaster Management
(1.1) National Level
The terms sustainability and resilience are not mentioned in the national-level Disaster Prevention and Protection Act (DPPA, 2012).1 Yet the idea of prevention and protection, as mentioned in the name of the Act, does refer to “measures including mitigation and preparedness before disaster, response actions during disaster, and recovery after disaster.” The ideas of mitigation, preparedness, response, and recovery are all important to the concept of resilience.
The Basic Plan of Disaster Prevention and Protection (BPDPP, 2013) provides principles for implementing the Disaster Prevention and Protection Act and does mention the idea of sustainability. The Basic Plan regards sustainability as the purpose of the Act. The Plan also associates sustainability with climate change, which it regards as a major challenge to Taiwan. In the Plan, sustainability is linked to the National Development Council’s “Adaptation Strategy to Climate Change in Taiwan” (2012).2 This document notes that land use, adaptation strategies for the coastal areas, and disaster management are three important fields that need to be addressed in order to combat climate change. Yet when looking at specific strategies of sustainability, the Plan mentions only transportation engineering aspects, including avoiding building roads in the mountains and carrying out analyses of potential hazard zones, as well as having disaster management plans in place before setting up a transportation engineering project.
The fact that the BPDPP, but not the Disaster Prevention and Protection Act itself, includes the idea of sustainability is because the new version of the BPDPP was written after the Act, and there is a large difference between the old and new versions. Although by including the idea of sustainability BPDPP looks advanced, local governments encounter difficulties in following the Basic Plan proposed in the BPDPP when they try to write their local Plans of Disaster Prevention and Protection (PDPP). The idea of sustainability and the associated idea of climate change are too abstract to the local governments. As mentioned, the Basic Plan refers only to transportation engineering when discussing sustainability strategies, which is very narrow. To have the local governments follow the Basic Plan when writing their PDPP, the Basic Plan has to offer detailed guidance about how to propose strategies of sustainability.
1 http://law.moj.gov.tw/Eng/LawClass/LawAll.aspx?PCode=D0120014 2 http://www.ndc.gov.tw/encontent/m1.aspx?sNo=0018108#.VIRXkjGUckE
GNS Science Report 2015/005 27

(1.2) Local Level
Not surprisingly, similar to the national level plans, all three local PDPPs analysed do not include the term resilience. Yet disaster mitigation, preparedness, response, and recovery are basic elements included in the local plans, as the framework of the local plan follows the ideas proposed in the Disaster Prevention and Protection Act.
(2) Urban Planning – National Level
Interesting enough, similar to the Disaster Prevention and Protection Act, neither sustainability nor resilience is mentioned in the national-level Urban Planning Law (UPL, 2010).3 The terms mitigation, preparedness, response, and recovery are not include in Urban Planning Law either. However, the Urban Planning Law does mention that when measures need to be taken to prevent disasters, “the concerned special municipality or county/city government, or township, town or county city office shall take immediate action according to the circumstances and make changes to urban plans that have been announced and implemented.”
The Enforcement Rules of the Urban Planning Law (ERUPL, 2014) only regulate building reconstruction in the context of disaster management. The regulations are twofold: (1) Buildings not fit for land use control and zoning purposes cannot be rebuilt if they were destroyed by a disaster. (2) Otherwise, the buildings can be rebuilt.
4.1.2 Risk Reduction
(1) Disaster Management
(1.1) National Level
In the Disaster Prevention and Protection Act, the words “Disaster Occurrence Reduction or Expansion Prevention” rather than “Risk Reduction” are used. The major difference is that the Disaster Prevention and Protection Act talks mainly about disaster occurrence rather than risk. The related work items included in the Act are:
7. Investigation of disaster potentials, hazardous degree, … 10. Planning and promotion of disaster insurance; 11. Disaster prevention and protection supports for the disadvantaged minority;
Number 7 talks about risk analysis, which is the first step if aiming at risk reduction. Yet no clear following strategies are suggested that link to Number 7. For instance, Number 10, on disaster insurance, is an important strategy for risk management, especially for risk in which chances are low but severity is high. Yet there is no connection between Number 7 and Number 10.
An often-used definition of risk is that risk equals the overlap of hazards and vulnerabilities. Number 11 is aimed at disadvantaged minorities, which is also a focus of issues on vulnerabilities. Yet again, there is no link between Number 7 and Number 11.
3 http://law.moj.gov.tw/Eng/LawClass/LawAll.aspx?PCode=D0070001
28 GNS Science Report 2015/005
As for the BPDPP, the Basic Plan calls for improvements in risk assessment, observation, monitoring, and prediction methods and collection of associated data. It also especially promotes the establishment of a financial allocation system to meet the challenge of catastrophes, and it encourages risk awareness by businesses. It also emphasizes risk assessment (including prediction of potential loss) of critical infrastructure and assessment of adaptive capability of high risk areas. According to the Plan, disaster risk in Taiwan is associated with urbanization (especially concentration of population, lifelines, transportation systems, and properties which tend to have cascading disasters), climate change (which may lead to sea level rise and extreme rainfall), and the possibilities of having big earthquakes.
(1.2) Local Level
The idea of risk is not mentioned in the local PDPPs of any of the three cities. Yet following the Disaster Prevention and Protection Act, these local PDPPs do mention the idea of disaster reduction. All three local PDPPs indicate that setting up scenarios (magnitudes) and producing hazard potential maps are important for disaster reduction. These two tasks are, in fact, for understanding hazard risk. All three PDPPs also mention some issues the local government should heed when aiming for disaster reduction. These issues can be related to the idea of vulnerability, even though vulnerability is not a term used in these local PDPPs.
(2) Urban Planning-National Level
Risk reduction is not a term used in either the Urban Planning Law or its Enforcement Rules. But Urban Planning Law does include a related idea in its Article 27:
When one of the following situations occurs, the concerned special municipality or county/city government, or township, town or county city office shall take immediate action according to the circumstances and make changes to urban plans that have been announced and implemented:
1) When there is damage as a result of war, earthquakes, floods, typhoons, fires, or other critical incidents;
2) When measures need to be taken to prevent disasters;
[other points are not related to hazard and are omitted here]
4.1.3 Multi-scale implementation
(1) Disaster management: between national and local levels
Ideally, BPDPP plays the middleman between the Disaster Prevention and Protection Act and local PDPPs, which means that the BPDPP follows the ideas in the Act and provides local PDPP with basic principles. However, the newest version of BPDPP written in 2013 includes advanced ideas such as climate change, financial allocation for catastrophe, and sustainability, which are too abstract for the local governments. Therefore, interestingly, the gap between the Disaster Prevention and Protection Act and local PDPPs is much smaller than that between BPDPP and local PDPPs. In other words, the ideas of the Act are rather better implemented at the local level than the new ideas proposed in the PDPP are.
GNS Science Report 2015/005 29

In the local PDPPs for both Kaohsiung and Taichung, every strategy direction proposed is associated to the responsible units. For instance, for Taichung city, the Department of Education is responsible for holding disaster-related education at schools, assisted by the Information Bureau, Environmental Protection Department, Police Department, and District Office. The fact that local PDPP associates tasks to the responsible units is very common among local PDPPs in Taiwan.
Every local PDPP has a chapter on evaluation of implementation. The chapter asks each department to identify objectives for each year, including listing the budgets. Every year, each department needs to write a self-evaluation form which is then evaluated by a group of local specialists, including members from the local Disaster Prevention and Response Council, members from other departments, professors, and other specialists. Besides what is written in the local PDPP, the Central Disaster Prevention and Response Council also organises a group of specialists to evaluate local disaster management capability every year.
(2) Urban Planning: between national and local levels
Currently, the Taiwanese government is just beginning to select New Taipei City as the demonstration area for city planning projects at the local level. In other words, the idea of urban planning has not yet been implemented at the local level.
(3) Between Disaster Management and Urban Planning
Except for the BPDPP, all plans associated with disaster management in Taiwan do not consider issues of climate change and coastal erosion, mainly because development of climate change and coastal erosion studies are still at an early stage. In contrast, both climate change and coastal erosion earn a chapter in the Urban Planning Law. Yet since the Urban Planning Law has not yet been implemented at a local level, strategies for the challenges of climate change and coastal erosions are not yet well developed.
30 GNS Science Report 2015/005
4.2 MEXICO
Mexico’s public administration divides land use planning and disaster risk reduction policies into two separate areas, both conceptually and in terms of implementation. Land use planning is produced exclusively at the local level and regulated from the Urban Development Ministry. On the other hand, all disaster risk reduction policies are produced within the Ministry of Internal Affairs as part of the National System of Civil Protection (SINAPROC). This division influences the type of discourses that support each plan, as well as the difficulties in integration between them.
4.2.1 Sustainability and resilience
The idea of sustainability has long been present in legislation and planning documents within the country. This concept is present in several land use and disaster risk reduction plans, both regional and local; it is used mainly to support the strategies expressed in the plans, although the meaning of the concept is not defined in any of them. The use of the concept of sustainability is clear in all the plans analysed for Acapulco, while in Xalapa only in risk reduction documents are there references to the concept. In the case of Comitán there is only one reference to sustainable development in one of the regional risk reduction plans of the State of Chiapas. All other coded documents do not consider the concept of sustainability, or include a reflection on long-term social or environmental outcomes of the planned actions either. In summary, there is no consistent way in which the concept of sustainability is integrated into local plans and there are no specific definitions. The use of the concept is mainly for justifying the validity of the content rather than for providing clear guidance for the goals and strategies contained in the documents.
On the other hand, it is remarkable that none of the local and regional plans analysed include any discussions of resilience although this concept has been recently included in the new General Law of Civil Protection (2012) (LGPC), as well as in the National Programme of Civil Protection (2014-2018) (PNPC). This conceptual development has not yet pervaded local level plans and programs.
4.2.2 Multi-scale implementation
(1) Disaster management: between national and local levels
Since Mexico’s government structure is formally decentralized, provincial and municipal civil protection agencies are supposed to be the key agents to implement risk reduction policies. However, their actual resources and abilities to do so are quite variable.
Municipal governments hold the first responsibility to respond to an event through the local civil protection office; this level of government is also in charge of all urban land use provisions and many public works, particularly water provision, sanitary services and basic infrastructure. The planning system in both land use and risk reduction policy fields is not hierarchical, in the sense that there are some general guidelines in the General Laws and National Programmes (see Appendix 3). Provincial governments are responsible for integrated emergency planning processes and the regulation of environmentally valuable non-urban land, as well as acting as financial, technical and political intermediaries between the federal and local governments. Since each provincial government is autonomous in terms of legislation and planning (regional and local), the ‘way down’ to translate those national guidelines into local plans is very heterogeneous and to some extent erratic. This is
GNS Science Report 2015/005 31
reflected in the coding of the risk reduction plans in each of the three cities, which shows that issues related to multi-scale implementation, such as hazard policies (Q57), rules to address natural hazards (Q66) or implementation support (Q119-Q120) are part of some plans but not of others. The unequal type and quality of content of local disaster risk plans relates to the fact that provincial governments are engaged in differing implementation actions such as the production and update of civil protection laws and mandates, or the provision of financial resources and technical capacities to local agents.
The heterogeneous production of plans reinforces this interpretation. Some of them were directly produced and/or supervised by the provincial governments, while others have been produced under federal programmes or supervised by federal institutions. Plans for Veracruz (all Xalapa documents) and Chiapas (both Comitán Disaster Management Plans) are produced by provincial governments, while all Acapulco plans and the Comitán Risk Atlas were produced and revised within the national Ministry of Social Development (SEDESOL) as part of the Program for Risk Prevention in Human Settlements (PRAH). In this regard, the multi-scalarity of plan implementation lies in an irregularly-decentralized system, together with a planning system that lacks an integrated conceptual framework, objectives, rules and policies.
(2) Urban Planning: local level
In the same manner as risk reduction policies, land use planning is decentralized to the municipal governments, who have the authority to define and control land use as well as establish settlement limits and relocate urban populations. With a few exceptions related mostly to metropolitan area management, municipalities have full authority over present and future land use. Similar to risk reduction plans, the guidelines contained in the National Program of Urban Development (2014-2018) have not pervaded local plans, which consequently have not yet adopted the strategies and lines of action in the National Program. This is partially explained by the fact that in the three cities the local plan is at least 8 years old (Q2) and they are currently in the process of updating. However, the inequality in the conceptual orientation, priorities, mandates, strategies and even the cartographic standards of municipal urban development plans shows that, although land use planning is done mostly at a local scale it does not imply a more homogeneous or better quality process of implementation.
(3) Between Disaster Management and Urban Planning
As explained above, the National Programme of Urban Development (2014-2018) (PNDU) explicitly includes several strategies for urban risk reduction. Nevertheless, the coding shows that none of these risks have been taken into account in local planning and mapping (Q35), include a risk-reduction approach (Q90), or discuss its linkages with other implementation instruments (Q119). This lack of integration at the local scale has been acknowledged many times in public debates in Mexico, but little action has been carried out since changing it involves new mechanisms of collaboration between provincial and municipal governments, as well as explicit mechanisms of financial support to urban planning processes.
32 GNS Science Report 2015/005

4.2.3 Risk reduction
In Mexico, risk reduction has been equated to civil protection on the one hand, and to hazard analysis on the other. Most legislation and planning that relate to risk reduction was developed under the term ‘civil protection’, which until recently referred exclusively to the reactive response to an emergency. The other problem lies in the fact that very few academic studies and planning processes have been able to develop an integrative perspective for risk analysis. Most of them (including the Risk Atlas, land use plans and even emergency management plans) focus on the hazard. Only the Risk Atlas in each of the three cities take into account social vulnerability (Q31), and only Acapulco includes vulnerable facilities in the risk mapping (Q32).
For the cities analysed, the coding shows that all of them make reference to the specific and relevant hazards of each city (except climate change, which is completely absent from these plans). Two out of three Risk Atlases define risk, but its consequences and likelihood are not analysed (Q89-Q92). In summary, risk reduction perspectives are still poorly incorporated into the local level. Even though many of these documents follow the conceptual guidelines published by the National Center of Disaster Prevention (CENAPRED), the information and the local planning process still do not integrate a greater, more complete vision of what risk reduction entails in practical terms.
GNS Science Report 2015/005 33

4.3 NEW ZEALAND
4.3.1 Sustainability and Resilience
Questions 5 and 6 were asked of the plans in order to assess whether sustainability or resilience is the focus, based on the purpose of resource and emergency management legislation. The purpose of the RMA is to:
Promote the sustainable management of natural and physical resources … managing the use, development, and protection of natural and physical resources in a way, or at a rate, which enables people and communities to provide for their social, economic, and cultural wellbeing and for their health and safety (emphasis added)
Likewise, the purpose of the CDEM Act is to:
Improve and promote the sustainable management of hazards in a way that contributes to the social, economic, cultural, and environmental well-being and safety of the public and also to the protection of property (emphasis added).
However, the vision of the National CDEM Strategy is a “Resilient New Zealand” (MCDEM, 2008, p. 6).
Based on the two purposes outlined above and the CDEM vision, one would assume that sustainability would be a primary influence in any discussion around natural hazards in all three plan categories. However, only the three Christchurch plans include reference to sustainability. However, as sustainability is explicit in the RMA, it may not be considered a requirement to include it in the plans.
Question 6 asks a similar question in regards to resilience, as the extended vision for CDEM in New Zealand is “Resilient New Zealand – communities understanding and managing their hazards” (MCDEM, 2008, p. 6). All Auckland City and Christchurch plans include resilience, but only one Wellington plan (the CDEM plan) includes a reference to resilience.
Vulnerability – one of the cornerstones of sustainability and resilience – is included only in the Wellington District Plan.
4.3.2 Risk reduction
Risk reduction – defined in New Zealand as “Identifying and analysing long term risks to human life and property from hazards; taking steps to eliminate these risks if practicable, and, if not, reducing the magnitude of their impact and the likelihood of their occurring” (MCDEM, 2007) – is of most importance to land use planning, as it is considered to be managed under the RMA (see Saunders et al., 2007 for further discussion). However, risk reduction, and in particular natural hazard risk (i.e., consequence and likelihood), is not included in the RMA – only natural hazard mitigation is included. This has led to mitigation under the RMA not needing to result in a reduction of risk – only mitigation from the hazard, which may in fact increase the risk. For example, a development on a flood plain may mitigate the flood hazard by structural works (such as stopbanks), while not considering the risk of damage to property, life safety, etc. if an event occurs above the design standard of those works.
34 GNS Science Report 2015/005
In order to improve the consistency between plans, particularly with regard to risk reduction, resilience should be included in all plans (Saunders et al., 2007). However, care needs to be taken so that the terms sustainability and resilience are not used interchangeably, as a resilient community or land use may not be sustainable in the long term; but a sustainable community should also be a resilient community.
Apart from the Christchurch City Plan, all plans include reference to both risk reduction and mitigation. The Christchurch plan refers to neither.
4.3.3 Implementation
There is a hierarchy of instruments within plans in New Zealand: objectives, policies, rules, and expected outcomes. Good quality plans would see these well linked, as they are in each of the regional policy statements and district plans (CDEM plans do not follow the same format, so are not assessed here).
Cross-boundary issues are address by each plan, except for the Auckland City Unitary Plan and Wellington’s Regional Policy Statement.
Monitoring plan effectiveness is important for effective implementation, and required under the RMA. Three plans do not include plan monitoring – the Auckland City Unitary Plan, the Canterbury Regional Policy Statement, and the Wellington City Plan.
4.3.4 Multi-scale implementation
Are plans implemented at multiple levels? That is, do plans recognise and apply provisions from the top down? From a legislative context (see Appendix 3), for the three city study areas selected, two plans did not refer to the RMA – Auckland City Unitary Plan and Wellington City Plan. As plans are required to be produced under the RMA, it may be implicit within the plans that they are made under this Act. Each of the CDEM plans includes reference to the RMA.
Auckland City Unitary Plan, Wellington City Plan and Christchurch City Plan do not include reference to the CDEM Act or the 2002 Local Government Act. Only the Wellington Regional Policy Statement does not included reference to the Building Act.
GNS Science Report 2015/005 35
4.4 NORWAY
4.4.1 Sustainability and Resilience
The main purpose of the Planning and Building Act is to:
promote sustainable development in the best interests of individuals, society and future generations (Section 1-1).
As Junker (2014) points out, a later section of the act (3-1) provides more detailed goals for the planning, which ranges from “public health, via Sami culture and commerce, crime prevention, climate emissions, to the safe development of buildings and infrastructure, and environmental conservation. …These various aims and interests are not formally ranked, apart from sustainable development being highlighted as the main, overarching purpose”.
Section 6-1 of the Planning and Building Act states that:
In order to promote sustainable development, the King shall draw up a document every four years setting out national expectations as regards regional and municipal planning. This shall be followed up in planning pursuant to this Act and shall serve as the basis for the central government’s participation.
When considering questions 5 and 6; in the coded plans, only the land use plan and emergency plan of Hordaland County refer to the terms sustainability and resilience. In the other documents the terms sustainability and resilience are not found, however several of the documents refer indirectly to these terms, as the overarching purpose.
4.4.2 Vulnerability
The Act relating to Municipal Emergency Preparedness (2011 – Lov om Kommunal beredskapsplikt), states that the:
Municipalities are required to survey the disruptive events that may occur in the municipalities, assess the probability of these events occurring and how their possible occurrence may affect the municipalities. The results of this work must be assessed and collated in a comprehensive risk and vulnerability analysis.
This term is included in several documents, especially the Plans for Civil Protection and Emergency, which includes a description of emergency response actor’s roles and responsibilities, as well as a risk and vulnerability analysis. Concerning questions 31 and 32, the plans discuss/assess vulnerable facilities but not vulnerable populations.
4.4.3 Risk reduction
Regarding Question 7 (Does the plan discuss/address risk reduction and/or mitigation)?
• For the county level, the Civil Protection and Emergency plans discuss/address risk reduction and mitigation
• At the local level, the plans vary in either discussing both or only risk reduction or mitigation.
36 GNS Science Report 2015/005
The National Progress report on the implementation of the Hyogo Framework for Action, published by the Norwegian Directorate for Civil Protection (DSB) (2012) indicates that risk- and vulnerability, physical planning, and emergency plans and exercises are the cornerstones of disaster risk reduction at the local level.
At the national level, Norway’s Planning and Building Act and the Civil Protection Act aim to decrease disasters through risk reduction in planning, and to highlight the role of the municipality level in disaster risk reduction. Both acts impose the use of risk and vulnerability analysis in connection to land-use planning and new area developments (DSB, 2012).
The DSB National Risk Analysis (2013, p.16) makes a clear statement about risk reduction measures; “Risk reduction measures are not proposed in the National Risk Analysis, since this requires more in-depth knowledge and analyses than are found in the National Risk Analysis. Risk reduction measures entail economic prioritisation and are a responsibility that lies with the respective authorities for government sectors, counties and municipalities.”
4.4.4 Implementation
The analysis shows that not all plans consider a hierarchy of instruments, which include objectives, policies, rules and outcomes. For the specific parts it shows that:
a. Objectives (Q47-Q55): If the plans include objectives, they are mainly in the Civil Protection and Emergency Plans and mostly relate to landslides, floods and climate change. One plan also mentions earthquakes (Hordaland County). The latest National Risk Analysis (2014) now also assesses the probability and consequence of an earthquake occurring off the coast of Hordaland, affecting Bergen. Additional hazards mentioned in the plans are extreme weather, sea level rise, ice drift and forest fire.
b. Policies (Q56-Q65): If the plans include policies, they are mainly in the Civil Protection and Emergency Plans and mostly relate to landslides, floods and climate change. These are the same plans that also contain objectives.
c. Rules (Q66-Q74): If plans include rules, they are mostly related to landslides and floods. It is noted that fewer plans contain rules as compared to policies and objectives, and few plans have rules for climate change.
d. Outcomes (Q78-Q86): If plans include outcomes, they are mostly related to landslides and floods. It is noted that fewer plans contain outcomes when compared to the previous instruments.
Itis observed that the plans that have specific objectives for specific hazards also have policies for these hazards. However, there are fewer plans that have rules for specific hazards, they have either no rules or rules only for landslides and floods. There few rules for climate change. When considering outcomes regarding hazards, there are even fewer plans that define outcomes.
Of the assessed plans, there is one exception. The Plan for Civil Protection and Emergency Planning of Hordaland County has objectives, policies, rules and anticipated environmental outcomes for the following hazards: earthquakes, floods and landslides, and for climate change.
Cross boundary (Q121): The county level plans almost all account for cross-boundary issues, such as referring to neighbouring counties. At the local level only one Kommune Plan accounts for cross-boundary issues.
GNS Science Report 2015/005 37
Monitoring:
a. Hazard monitoring (Q106-Q114) – One county-level Civil Protection and Emergency Plan has a provision for monitoring hazards, including landslides and flooding. One local level Civil Protection and Emergency Plan includes monitoring for landslides.
b. Plan monitoring (Q115-Q118) – Several plans, mostly Civil Protection and Emergency Plans, at both the county and local level make provision for monitoring the effectiveness of provisions in the plans. In addition they identify parties responsible for monitoring and evaluation, and contain processes for integrating or updating new hazard or risk information. Three plans, all Civil Protection and Emergency Plans, also have processes for reviewing the document and making changes to hazard objectives, policies and rules. These plans also consider the effectiveness, detail who is responsible, and have processes to update the plan, as detailed above.
4.4.5 Multi-scale implementation
Multi-scale implementation of plans:
Regarding the Civil Protection Act (Q123), all the assessed Civil Protection and Emergency Plans, at both the county and local level, refer to the Norwegian Civil Protection Act. None of the Planning Strategies referred to this Act. For the Planning and Building Act (Q124), almost all the assessed Planning Strategies and Civil Protection and Emergency Plans (at both levels) refer to the Planning and Building Act. Only one local level Kommune Plan does not refer to the Act. Other statues (Q127), mentioned in the plans are for example:
• Several regulations, related for example to requirements for emergency planning and preparedness
• Biodiversity Act
• Cultural Heritage Law
• Forest Law
• Public Health Act
• Royal decrees related to civil defense
• Guidelines on civil protection and flooding and avalanche risks in land use plans
• Policy Guidelines for protected waterways
• Water Resource Act
• Fire Act
38 GNS Science Report 2015/005
5.0 CROSS COMPARISON
5.1 SUSTAINABILITY AND RESILIENCE
The concepts of sustainability, and more recently resilience, are gaining momentum within land use planning. In 2012, 17 sustainable development goals were developed through Rio+20 (the UN Sustainable Development Conference, 2012). One goal – Sustainable Goal 11 – has a focus on resilience and sustainability. The goal is to “Make cities and human settlements inclusive, safe, resilient and sustainable”. This is supported by the aim to “increase … the number of cities and human settlements adopting and implementing integrated policies and plans towards inclusion, resource efficiency, mitigation and adaptation to climate change, resilience to disasters, develop and implement in line with the forthcoming Hyogo Framework holistic disaster risk management at all levels” (UN Division for Sustainable Development, 2014). Suggested guiding principles for the Hyogo Framework for Action included that “The sustainability of development depends on its ability to prevent new risk creation and the reduction of existing risk” (Third United Nations World Conference on Disaster Risk Reduction Preparatory Committee, 2014, p. 4).
Sustainability is integral to managing natural hazard risks, and also to recovery. Three principal elements underpin the concept of sustainable development: economic, environmental, and social well-beings (Berke & Conroy, 2000; Campbell, 1996; Lele, 1991). The interaction and reconciliation of these three well-beings is critical to the pursuit of sustainable development. Social (or human) well-being is key to providing a certain standard of living; the environment must be healthy, productive and diverse in order to support life and to ensure an acceptable standard of living; and a healthy economy is required so that communities can provide for people’s health, wealth, and happiness (Parliamentary Commissioner for the Environment, 2002; Prescott-Allan, 2001).
Comparing the case study examples from Taiwan, Mexico, New Zealand and Norway, there is no standard approach to including concepts of either sustainability or resilience in plans.
Taiwan
Neither sustainability nor resilience is included in the national level Disaster Prevention and Protection Act, nor in the Urban Planning Law. However, the Basic Plan written under the Disaster Prevention and Protection Act regards sustainability as key to the purpose of the Act. There is an opportunity to strengthen the linkage to sustainability by including guidance on implementing sustainable strategies within the Basic Plan. None of the local level plans explicitly include resilience.
Mexico
There is no consistent way in which the concept of sustainability is integrated into local plans; there are no specific definitions, while the use of the concept is mainly for justifying the validity of the content rather than for providing clear guidance for the goals and strategies contained in the documents.
GNS Science Report 2015/005 39
None of the local and regional plans analysed include any discussion of resilience. Although this concept has been recently included in the new General Law of Civil Protection (2012) as well as in the National Programme of Civil Protection (2014-2018), the notion of resilience has not been included in any of the plans analysed. This conceptual development has not yet pervaded local level plans and programs.
New Zealand
Sustainability underpins the key legislation for managing natural hazards in New Zealand, indeed, it is the key purpose of the legislation. Sustainable management is defined, and from a planning perspective, sustainability is the goal. As well as sustainability, resilience is also the goal of the National Civil Defence Emergency Management Strategy. While not specifically required, resilience is included in Auckland and Christchurch plans.
Norway
Similar to New Zealand, sustainable development is explicit in the purpose of the Planning and Building Act. Only one land use and emergency plan referred to the terms sustainability and resilience; however, the terms are implicit in the other plans. It appears from the case studies, that there is no standard imperative to include sustainability and resilience in legislation that can then filter down to local level plans. Despite international guidance in this area (i.e., UN Sustainable Development Goals, Hyogo Framework for Action), opportunities exist for these concepts to be explicitly included in plans. While in some cases (e.g., Norway, New Zealand), the concepts are implicitly included to improve risk reduction – and enhance both sustainability and resilience – these concepts should also be included in Mexican and Taiwanese plans.
5.2 RISK REDUCTION
The concept of risk reduction, and specifically disaster risk reduction, is put forward as Priority 1 of the Hyogo Framework for Action, which aims to ensure that risk reduction is a national and a local priority, with a strong institutional basis for implementation. In addition, in the broader community of climate change adaptation and disaster risk reduction, such as the IPCC Special Report: Managing the Risks of Extreme Events and Disasters to Advance Climate Change Adaptation (SREX), it is stated that disaster risk reduction “denotes both a policy goal or objective and the strategic and instrumental measures employed for anticipating future disaster risk, reducing existing exposure, hazard, or vulnerability, and improving resilience” (IPCC, 2012, p. 34)
For this project we compare if and how the plans in the four different countries at different planning levels address risk reduction. We distinguish between the national level and the case level (county, municipality, and city). In New Zealand, under the National Civil Defence Emergency Management Strategy, risk reduction is explicitly defined as: “Identifying and analysing long term risks to human life and property from hazards; taking steps to eliminate these risks if practicable, and, if not, reducing the magnitude of their impact and the likelihood of their occurring (MCDEM, 2008, p. 5)”
40 GNS Science Report 2015/005
Taiwan
In Taiwan, at the national level, disaster management plans address disaster occurrence rather than risk. In addition, risk reduction is not a term used in national-level urban planning plans
At the local level, the term is not mentioned in the analysed plans, however the idea of disaster reduction is included. This includes setting up scenarios (magnitudes) and producing hazard potential maps.
Mexico
In Mexico, at the national level, most legislation and planning that relates to risk reduction was developed under the term ’civil protection’. This referred, until recently, exclusively to the reactive response to emergency.
At the local level, risk reduction perspectives are still poorly represented. The three cities make reference to relevant hazards, and two out of three Risk Atlases define risk, but its consequences and likelihoods are not analysed.
New-Zealand
In New Zealand, at the national level, risk reduction (and in particular natural hazard risk) is not included in the Resource Management Act; only natural hazard mitigation is included.
At the local level, apart from the Christchurch City Plan, all plans include reference to both risk reduction and mitigation. The Christchurch plan refers to neither.
Norway
In Norway, at the national level, the Planning and Building Act and the Civil Protection Act highlight the role of the municipality level in disaster risk reduction, however they do not include the term risk reduction. Both acts do impose the use of risk and vulnerability analysis in connection to land-use planning and developments in new areas.
At the local level, the County level Civil Protection and Emergency Plans address risk reduction and hazard mitigation. At the municipality level several Civil Protection and Emergency Plans and Land Use Plans mention both, or only risk reduction and/or mitigation.
Overall comparison shows that at the national level, for all four countries, the term ‘risk reduction’ is not specifically included in national-level land use planning legislation. In Taiwan reference is made to disaster occurrence instead of risk. For Mexico, the legislation and planning at the national level that relates to risk reduction was developed under the term ’civil protection’. In New Zealand, the Resource Management Act does not include risk reduction, however the Civil Defence Emergency Management Act does. For Norway, the Planning and Building Act and the Civil Protection Act do not include the term risk reduction.
For the municipal level, it is clear that for both New Zealand and Norway, reference is made to both risk reduction and/or mitigation in the analysed plans. For Taiwan, the term is not included in the plans; however the idea of disaster risk reduction is included. For Mexico, risk reduction perspectives are still poorly addressed, however for two cases the Risk Atlas defines risk.
GNS Science Report 2015/005 41

5.3 MULTI-SCALE IMPLEMENTATION
5.3.1 Implementation
Even though from the sole analysis of a plan it is not possible to completely encompass a process of implementation, certainly the inclusion of some specific elements in the plans facilitates the accomplishment of the plan’s goals. We assume here that implementation initially relies on the adequate framing and distribution of responsibilities among parties, together with a clear definition of their priorities, roles and plan monitoring procedures. These elements are the ones taken into account in the analysis, in which we compare whether plans in different countries define the objectives and strategies to achieve the goals they contain, as well as the necessary instruments to assign responsibilities, evaluate, and follow up the efficacy of the plan in the actual contexts and at relevant scales. The analysis of implementation involves an understanding of how the concepts contained in general laws and acts (sustainability, resilience, risk-based approach) translate into specific priorities and lines of action that local governments and community agents could carry out. We focus our interpretation on such contents.
Taiwan
The new conceptual content of the Basic Plan of Disaster Prevention and Protection (BPDPP) related to climate change, sustainability and risk financing, have not been translated into new objectives, policies and methods within local Plans of Disaster Prevention and Protection (PDPP) in the three selected cities. Although the Disaster Prevention and Protection Act (2012) and local plans are coherent, they have not adjusted their contents to the new national planning framework; therefore, there is a gap between the national legal instrument and the local planning instrument. Despite this problem, in Taiwan it is observable that current risk reduction strategies are clearly assigned to specific departments of local government offices, which includes a list of yearly strategies, tasks and budgets. The coordinated actions include strategies for earthquakes, floods, typhoons, landslide, tsunami, fires and others hazards.
Mexico
Mexico’s planning system is decentralized but not hierarchical, in that risk reduction instruments are not clearly linked to each other in the provincial and municipal plans. It is not possible to follow a clear implementation path between the objectives, policies, rules and actions contained in the plans, even though they all are supposed to make reference to the principles contained in the National Program of Civil Protection and the General Law of Civil Protection. The plans are heterogeneous, with the quality and specific content in each of them differing from what is in the others. No monitoring or evaluation elements were found in the local plans selected.
New Zealand
Regional Policy Statements and District Plans, required by the Resource Management Act 1991, contain four elements (objectives, policies, rules and expected outcomes) which clearly relate to each other. A key element is that they are related to each other through cross-boundary references across local plans. However, even though the RMA requires city plans to include monitoring elements, none of them do it. Within the regional policy statements, it is considered good practice to include a table showing ‘who does what’.
42 GNS Science Report 2015/005
For example, within the Wellington Regional Policy Statement, a table shows whether the Regional Council or the District and City Councils are responsible for developing objectives, policies, and rules for natural hazards.
Norway
In the Norway cases, contrary to New Zealand, plans are not hierarchically related to each other in terms of their objectives, goals and strategies. However, if the plan includes objectives to reduce the impact of specific hazards, they usually include policies but no concrete rules or actions. From all plans analysed, only one of the selected cases develops all elements necessary for successful implementation (objectives, policies, rules and anticipated environmental outcomes). Also, it is remarkable that all local plans do take into account cross-boundary issues with neighbouring counties, and that most local plans include instruments for monitoring the effectiveness of the provisions and for reviewing and improving the contents of the plan.
5.3.2 Comparison
Two issues emerge from the analysis of the four countries with regard to the implementation elements contained in the plans. The first relates to the hierarchy between national (regional) and local levels. While in New Zealand we can observe a coherence of instruments contained in plans at different scales, in Norway and Mexico the local cases do not follow this hierarchical structure of implementation, which means that local plans are more autonomous regarding their content, objectives and strategies. Taiwan also follows a hierarchical structure of implementation, but this structure is currently ‘broken’ by the lack of coherence between the Disaster Prevention and Protection Act (the legal support), the Basic Plan of Disaster Prevention and Protection (the programmatic instrument) and local plans.
The second finding relates to the linkages between different components within plans that allow them to achieve the ultimate goal of reducing the impact of natural hazards. From our perspective, the dimensions included in the coding process – objectives, policies, rules, plan monitoring, implementation support – are required in each plan (or in a set of plans clearly related to each other), in order to guarantee that they will have some positive effect in their specific regions. The coding shows that the four countries are very heterogeneous with regard to the coherence of these elements within plans, with New Zealand in the best position and Mexico in the worst. Taiwan and Norway provide interesting insights on the missing elements of implementation at local levels – in one, conceptual advancements in risk analysis have not been translated into objectives or specific lines of action, while in the other rules and strategies have not been developed enough in relation to the objectives of the plans.
5.3.3 Multi-scale processes
The goal of looking at the issue of multi-scale implementation is discussed if important perspectives are recognized by different national agents and plans responsible for different issues, as well as by officials and plans at both national and local levels. Only when all related plans recognize the same important issues, can the gaps between the plans be reduced and be better implemented.
GNS Science Report 2015/005 43
Taiwan
Regarding disaster prevention and protection, BPDPP plays the middle man between the national level Disaster Prevention and Protection Act and local PDPPs. Yet the most updated version of BPDPP in 2013 includes new ideas such as climate change and land use planning. Yet there are not many tools developed to help the local governments implement these ideas. As a result, the gap between the Disaster Prevention and Protection Act and local PDPPs is smaller than that between BPDPP and local PDPPs.
Most plans associated with disaster prevention and protection in Taiwan do not incorporate issues of climate change and coastal erosion, mainly because studies of these aspects is still at an early stage. In contrast, both climate change and coastal erosion earn a chapter in the Urban Planning Law. However, since the Urban Planning Law is not yet implemented at local level, strategies for meeting the challenges of climate change and coastal erosions are not yet well developed.
Mexico
Similar to the case in Taiwan, the local government takes the major responsibility for disaster management, and there are national guidelines for the local governments to follow. Yet local level resources to implement general guidelines in the General Laws and National Programs are variable. For instance, hazard policies, rules to address natural hazards or implementation support, are part of some local plans but not others. The different type and quality of content of local disaster risk plans relates to the fact that provincial governments are differently engaged in actions such as the production and update of civil protection laws and mandates, or the provision of financial resources and technical capacities to local agents.
Also similar to Taiwan, Mexico’s national level guidelines about urban development have not pervaded local plans. One important reason is that the local plans analysed are at least 8 years old and they are currently in process of being updated.
The National Programme of Urban Development includes explicitly several strategies for urban risk reduction. Nevertheless, the coding shows that none of these risks have been taken into account in local planning and mapping, include a risk-reduction approach, or discuss linkages with other implementation instruments.
New Zealand
Each of the local level CDEM plans for risk and hazard management include reference to the RMA. This says, similar to Taiwan or in Mexico, the national level Act provides guidelines for the local level CDEM plans.
Many local-level land use plans do not refer to the national level RMA, the CDEM Act, or the 2002 Local Government Act. As plans are required to be produced under the RMA, it may be implicit within the plans that they are made under this Act. In this case, the situation is similar to that in Taiwan or in Mexico, which means that the gap between local and national levels on the issue of land use planning is larger than that in disaster management.
44 GNS Science Report 2015/005
Norway
Similar to the cases in other three countries, regarding disaster management, all the assessed Civil Protection and Emergency Plans, at both the county and local level, refer to the Norwegian Civil Protection Act.
As for the issue of land use planning, almost all the assessed Planning Strategies and Civil Protection and Emergency Plans (at both levels) refer to the Planning and Building Act. In this sense, the connection between national and local is better in Norway than in the other three countries.
When comparing the relationship between disaster management and land use planning, none of the Planning Strategies referred to the Norwegian Civil Protection Act. In this case, both Taiwan and Mexico have a better connection between the two. Yet, risk or disaster management in none of the countries are well implemented in urban development-related plans.
5.3.4 Comparison
Between local and national levels, all of the countries have national guidance for local levels to follow. In New Zealand, each local level CDEM plan for risk and hazard management includes reference to the RMA. In Norway, the Norwegian Civil Protection Act is the base of Civil Protection and Emergency Plans. In Taiwan, there are the national level Disaster Prevention and Protection Act and BPDPP for local-level PDPPs. In Mexico, General Laws and National Programs are the base of the local plans. However, we find some implementation problems in both Taiwan and Mexico. In Taiwan, there is a problem in terms of inconsistency between national level BPDPPs and the national level Disaster Prevention and Protection Act. Local level PDPPs follow the Act, but not the BPDPP. For the case of Mexico, locals’ resources to implement, and abilities to follow national level guidelines are variable.
In comparing disaster management and land use policies, we find that for all countries, there is a disconnection between disaster management and land use policies. For instance, in Taiwan, climate change and coastal erosion are important for urban plan policies but not for Disaster Prevention and Protection plans. Like Taiwan, Mexico’s strategies for urban risk reduction have not been taken into account in disaster management policies. For Norway, none of the assessed Planning Strategies referred directly to the Norwegian Civil Protection Act.
We also find that, except for Norway, the gap between local and national levels on the issue of land use planning is larger than that in disaster management. For instance, in New Zealand, many local-level land use plans do not refer to the national level RMA, the CDEM Act, or the 2002 Local Government Act. In Taiwan, there is not even a local-level land use plan.
GNS Science Report 2015/005 45
5.4 RELATED ISSUES
5.4.1 Climate change
In New Zealand, only the land use plans include specific information on climate change; several include specific details about projected sea level rise and its consequences. In contrast, none of the city-level plans mention climate change in Taiwan. The Basic Plan of Disaster Prevention and Protection and National Land use Planning includes specific information on climate change. In Mexico, none of the analysed plans includes information on climate change. Norway is an exemplar. At regional level, some of the Civil Protection and Emergency plans and Land use plans include information on climate change, ranging, for example, from an entire chapter on climate change and how it relates to hazards, to single statements. At the local level, both types of plans include, for some cases, statements about what climate change entails (temperature increase, precipitation).
None of the plans in the four countries include maps with climate change hazard predictions, such as future sea level.
When considering a clear implementation path between objectives, policies, rules and actions in relation to climate change it is noted that for both Mexico and Taiwan, almost none of the plans included an objective, policy, rule or anticipated outcome. For Taiwan, only the National Land use Plan and the Basic Plan of Disaster Prevention and Protection included policies for climate change. For Mexico, only one municipal disaster management plan included anticipated outcomes from climate change. In New Zealand, no one plan included an objective, policy, rule and anticipated outcomes for climate change. Some land use plans included one, two or three aspects only. In the Norway cases, only one local-level land use plan included all aspects. Other civil protection and land use plans at both local and regional level included objectives and policies for climate change.
Regarding whether a plan addresses the effect of climate change on the risks of other hazards, in terms of changing likelihoods and/or consequences, for Taiwan, the national land use plan, the Basic Plan of Disaster Prevention and Protection, and one city-level disaster management plan describe possible consequences of climate change on other hazards. Yet these descriptions are more in a general sense rather than based on local scientific investigations. In Mexico, none of the analysed plans address likelihoods and/or consequences of climate change on other hazards. In Norway, three of the analysed plans, two civil protection plans, and one local land use plan address the consequences of climate change on other hazards. In New Zealand, only land use plans include information on the likelihoods and/or consequences of climate change on other hazards.
5.4.2 Vulnerability
Vulnerability is not a concept that is required to be considered in planning in New Zealand. As such, only one of the case study plans (Wellington District Plan) includes a reference to vulnerability. In contrast, although none of the plans in Taiwan mention the term vulnerability, all plans (including at local and at national levels) have strategies related to vulnerabilities. Taiwan especially puts a lot of effort in formulating strategies for vulnerable groups, e.g., elders (living alone), social welfare institutions, and ethnic minorities.
46 GNS Science Report 2015/005

In Mexico, while laws and national documents define vulnerable populations, the interest is not translated into clear identification of such groups in the local planning documents. The sole mention of vulnerable populations in the plans does not imply that they are correctly targeted or that adequate strategies exist to take care of their specific needs. For example, the three Risk Atlases coded do include vulnerable populations, but they are mostly identified as ‘exposed’ populations. A few other variables, such as gender or level of socioeconomic marginality, are sometimes included in the risk mapping, but there is little or no analysis of the implications of such vulnerability profiles on detailed and more effective risk scenarios. In Norway, however, Norwegian legislation requires comprehensive risk and vulnerability analysis linked to both civil protection and emergency planning and land use planning.
GNS Science Report 2015/005 47

This page is intentionally left blank.
6.0 SUMMARY AND CONCLUSION
The focus of this project has been a comparative analysis of natural hazard risk reduction policies across Mexico, New Zealand, Norway, and Taiwan. To allow for cross comparison between countries, the scope of the study was limited to several hazards they have in common, being floods, landslides, and active faults. In each of these countries, case studies of cities were used in the comparisons; the analysis does not make any inferences of case study findings to a national level.
The objective of the overall project is to improve the understanding of the multi-scale policy implementation for natural hazard risk reduction in four countries, as a key dimension of risk interpretation and action at the political level. This objective has two goals:
1. To ascertain how various natural hazards – and their risks – are included in national, regional and local level policies and plans (i.e., land use plans and emergency management plans).
2. To undertake a comparative analysis of such policies, which will compare, contrast and assess the natural hazard policy implementation in New Zealand, Mexico, Norway, and Taiwan.
Based on these goals, the key research questions for the project are:
1. How is policy implemented at the local level?
2. Is there a consistent approach to how hazard policies in the case studies are mandated and implemented between national, regional and local level plans?
3. What can be learned from how other countries are implementing natural hazard policies?
To assist in answering these questions, four themes formed the basis of the analysis of contents of the plans: sustainability and resilience; risk reduction, integration, and multi-scale implementation.
The methodology employed for the project was a comparative design based on content analysis of published emergency plans and land use plans at national, regional, and local levels, set within the context of international directives for risk reduction. The basis of the methodology is from an in-depth content analysis of operative land use plans in New Zealand.
Our comparative findings based on the case studies are that:
• There is no standard imperative to include sustainability and resilience in legislation that can then filter down to local level plans. Despite international guidance in this area (e.g., UN Sustainable Development Goals, Hyogo Framework for Action), few opportunities exist for these concepts to be explicitly included in plans. Whilst in some cases the concepts are implicitly included (e.g., Norway, New Zealand), to improve risk reduction – and enhance both sustainability and resilience – these concepts should also be included in Mexican and Taiwanese plans.
GNS Science Report 2015/005 49

• At the national level, for all four countries, the term ‘risk reduction’ is not specifically included in national-level land use planning legislation. In Taiwan reference is made to disaster occurrence instead of risk. For Mexico legislation and planning at the national level that relates to risk reduction was developed under the term ’civil protection’. In New Zealand, the Resource Management Act does not include risk reduction, however, the Civil Defence Emergency Management Act does. For Norway, the Planning and Building Act and the Civil Protection Act do not include the term risk reduction.
• At a city level, for both New Zealand and Norway, reference is made to both risk reduction and/or mitigation in the analysed plans. For Taiwan, the term is not included in the plans; however, the idea of disaster risk reduction is included. For Mexico, risk reduction perspectives are still poorly incorporated, given that most local plans are still constructed under a reactive perspective in order to deal with emergencies; however, for two cases the Risk Atlas clearly defines risk.
• Regarding the issue of multi-scalar implementation, the main finding relates to the different hierarchies between national (regional) and local levels. While in New Zealand we can observe a coherence of instruments contained in plans at different scales, in Norway and Mexico the selected local cases do not follow this hierarchical structure of implementation. The implication is that local plans are more autonomous regarding their content, objectives and strategies. Taiwan also follows a hierarchical structure of implementation, but this structure is currently ‘broken’ by the lack of coherence between the Disaster Prevention and Protection Act (the legal support), the Basic Plan of Disaster Prevention and Protection (the programmatic instrument) and local plans.
• When considering the linkage of natural hazard provisions between and within plans, different dimensions need to be specified in each plan (or in a set of plans clearly related to each other) in order to guarantee that they will have some positive effect in their specific contexts. In our study we included the following dimensions; objectives, policies, rules, plan monitoring and implementation support. The case studies within the four countries show that except for New Zealand, no clear linkage of natural hazard provisions is observed between the national, regional and local level plans analysed for Mexico, Norway and Taiwan. However, when considering the linkage of provisions within plans it is observed that all four countries vary with regard to the quality of the conceptual content and risk reduction strategies, with New Zealand in the best position and Mexico in the worst.
• With respect to disaster management and land use policies, we find that for all countries, there is a disconnection between disaster management and land use policies. For instance, in Taiwan, climate change and coastal erosion are important for urban plan policies but not for Disaster Prevention and Protection plans. Like Taiwan, Mexico’s strategies for urban risk reduction have not been taken into account in disaster management policies. For Norway, none of the assessed Planning Strategies referred to the Norwegian Civil Protection Act.
• We also find that, except for Norway, the gap between local and national plans on the issue of land use planning is larger than that in disaster management. For instance, in New Zealand, many local-level land use plans do not refer to the national level RMA, the CDEM Act, or the 2002 Local Government Act, although it is implicit in some cases. In Taiwan, there is not even a local-level land use plan.
50 GNS Science Report 2015/005
Future research aims to build further on the initiated cross comparison analysis and evaluation. The next stage of the project will consider regional and local capability and capacity within authorities who manage land use and emergency management policies for natural hazards and address the opportunities and barriers for improving implementation of policy at multiple levels. Other future research possibilities include the emerging link between disaster risk reduction and climate change adaptation. Climate change will potentially increase the likelihood and consequences of natural hazard occurrence, and countries are starting to develop climate change adaptation strategies, plans and climate laws. A relevant research question to address is: How do these strategies, plans and laws relate to the existing natural hazard provisions?
GNS Science Report 2015/005 51

This page is intentionally left blank.
7.0 ACKNOWLEDGEMENTS
The research was funded by the International START Secretariat, as follow-on research from the World Social Science Fellows Programme and 2013 seminar on “Risk Interpretation and Action: Decision-making under conditions of uncertainty”. The Risk Interpretation and Action Fellows Seminar was held in December 2013 in New Zealand, and was a collaborative seminar co-organised by the World Social Science Fellows programme of the International Social Science Council (ISSC) in partnership with the Risk Interpretation and Action working group of the Integrated Research on Disaster Risk (IRDR) programme, the IRDR International Center of Excellence, Taipei, the International START Secretariat, and the Royal Society of New Zealand.
In addition, the project team acknowledges the financial support from the International Social Science Council (ISSC) and the International START Secretariat that provided us with the valuable opportunity to attend the 2014 Integrated Research on Disaster Risk (IRDR) conference on “Integrated disaster risk science: a tool for sustainability” in Beijing from 7-9 June 2014.
GNS Science Report 2015/005 53

This page is intentionally left blank.
8.0 REFERENCES Arellano, D., & Vera, G. (2005). Institutional Design and Organization of the Civil Protection National
System in Mexico: The case for decentralized and participative policy network. Documento de Trabajo 162. México: División de Administración Pública, Centro de Investigación y Docencia Económicas (CIDE)
Beban, J. G., Coomer, M. A., & McBride, S. (2012). Addressing earthquake hazards : a review of council policies and plans within the Wellington region. GNS Science report. Lower Hutt, GNS Science. 2012/31: 52 p.
Becker, J. S., & Johnston, D. M. (2000). Planning and policy for earthquake hazards in New Zealand. Vol. Institute of Geological & Nuclear Sciences Science Report 2000/28 (pp. 34). Lower Hutt: GNS Science.
Berke, P. R., Lyles, W., & Smith, G. (2014). Impacts of Federal and State Hazard Mitigation Policies and Local Land Use Policy. Journal of Planning Education and Research, 1-17.
Berke, P. R., & Conroy, M. M. (2000). Are we planning for sustainable development? Journal of the American Planning Association, 66(1), 21-33.
Berke, P. R., & Godschalk, D. (2009). Searching for the Good Plan: a meta-analysis of plan quality studies. Journal of Planning Literature, 23(3), 227-240.
Berke, P. R., Crawford, J., Dixon, J., & Ericksen, N. J. (1999). Do cooperative environmental planning mandates produce good plans? Empirical results from the New Zealand experience. Environment and Planning B: Planning and Design, 26, 643-664.
Berke, P. R., Smith, G., & Lyles, W. (2012). Planning for resiliency: evaluation of state mitigation plans under the Disaster Mitigation Act. Natural Hazards Review, 139-149.
Campbell, S. (1996). Green cities, growing cities, just cities? Urban planning and the contradictions of sustainable development. Journal of the American Planning Association, 62(3), 296-312.
Chen, L. C., Wu, J. Y., & Lai, M. J. (2006). The evolution of the natural disaster management system in Taiwan. Journal of the Chinese Institute of Engineers, 29(4), 633-638.
DSB 2011. Rapport Klimatilpasning 2011 – Klimatilpasning i kommuner, flykeskommuner og blant flykesmenn. ISBN 978-82-7768-250-1 DSB, Tønsberg, Norge (DSB – Direktoratet for samfunnssikkerhet og beredskap/ Norwegian Directorate for Civil Protection)
DSB, 2012. Norway – National progress report on the implementation of the Hyogo Framework for Action (2011-2013). DSB, Tønsberg, Norge
DSB, 2013. National Risk Analysis 2013. Disasters that may effect the Norwegian Society. ISBN 978-82-7768-318-8 DSB, Tønsberg, Norge. Printed by Dinamo
DSB, 2014a. Nasjonalt risikobilde 2014. Katastrofer som kan rammed et norske samfunnet. ISBN 978-82-7768-352-2 DSB, Tønsberg, Norge. Printed by Dinamo
DSB, 2014b. Rapport Kommuneundersøkelsen 2014 – Status for samfunnssikkerhets- og beredskapsarbeidet i kommunene. ISBN 978-82-7768-337-9 DSB, Tønsberg, Norge
Eiser, R. J., Bostrom, A., Burton, I., Johnston, D. M., McClure, J., Paton, D., et al. (2012). Risk interpretation and action: a conceptual framework for responses to natural hazards. International Journal of Disaster Risk Reduction, 1, 5-16.
Ericksen, N. J., Berke, P. R., Crawford, J. L., & Dixon, J. E. (2003). Planning for sustainability: New Zealand under the RMA. Hamilton: The International Global Change Institute.
GNS Science Report 2015/005 55
Harbitz, C. B., Glimsdal, S., Løvholt, F., Kveldsvik, V., Pedersen, G. K., & Jensen, A. (2014). Rockslide tsunamis in complex fjords: From an unstable rock slope at Åkerneset to tsunami risk in western Norway. Coastal Engineering, 88, 101-122.
Hsu, H. H., Chou, C., Wu, Y. C., Lu, M. M., Chen, C. T., & Yung-Ming Chen (2011). Climate change in Taiwan: scientific report 2011 (summary). Taipei, Taiwan: National Science Council.
IBHS. (2001). Community land use evaluation for natural hazards. Retrieved 10 August 2008, 2008, from http://www.disastersafety.org/resource/resmgr/PDFs/CLUE.pdf
IPCC. 2012. ‘Managing the Risks of Extreme Events and Disasters to Advance Climate Change Adaptation. A Special Report of Working Groups I and II of the Intergovernmental Panel on Climate Change [Field, C. B., V. Barros, T. F. Stocker, D. Qin, D. J. Dokken, K. L. Ebi, M. D. Mastrandrea, K. J. Mach, G.-K. Plattner, S. K. Allen, M. Tignor and P. M. Midgely (eds.)]. Cambridgeand New York: Cambridge University Press: 582.
Junker, E. (2014). Safety or Salamanders? Natural hazards and environmental conservation in comprehensive planning. Sustainability 6, 4645-4657.
Junker, E. (2015). Legal requirements for risk and vulnerability assessments in Norwegian land-use planning. Local Environment: The International Journal of Justice and Sustainability 20(4), 474-488.
Krippendorff, K. (2013). Content Analysis: an introduction to its methodology (Third ed.). Thousand Oaks: Sage Publications.
Langeland, O., Klausen, J.E., & Winsvold, M. (2013). Climate change adaptation policy in Bergen, ideals and realities. In: P. Schmidt-Thome and J. Klein (editors), Climate change adaptation in practice: from strategy development to implementation. Wiley-Blackwell, ISBN 978-0-470-97700-2, 338 pages
Lele, S. M. (1991). Sustainable development: a critical review. World Development, 19(6), 607-621.
May, P. J., Burby, R. J., Ericksen, N. J., Handmer, J. W., Dixon, J. E., Michaels, S., et al. (1996). Environmental management and governance: intergovernmental approaches to hazards and sustainability. London: Routledge.
MCDEM. (2008). National Civil Defence Emergency Management Strategy 2007. Wellington: Department of Internal Affairs.
National Center of Disaster Prevention (CENAPRED) (2008). Volcanoes. Peligro y riesgo volcánico en México. Mexico City: CENAPRED, 53 pp.
National Development Council (2010). Adaptation Strategy to Climate Change in Taiwan
National Development Council (2014). Population prediction of republic of China, 2014-61. Taipei, Taiwan.
National Population Council (CONAPO) (2012) Catálogo. Sistema urbano nacional 2012. Mexico City: CONAPO, 34 pp.
Organisation for Economic Co-operation and Development (OECD) (2013) Reviews of Risk Management Policies: Mexico 2013. Review of the Mexican National Civil Protection System. París: OECD Publishing
Osofsky, Y. H. (2013) Scales of Law: Rethinking Climate Change Governance. PhD Thesis, Department of Geography. Eugene, OR: University of Oregon
Parliamentary Commissioner for the Environment. (2002). Creating our future: sustainable development for New Zealand. Wellington: Parliamentary Commissioner for the Environment.
56 GNS Science Report 2015/005
Peereboom, I.O., Waagø, O.S., & Myhre, M. (2011). Preliminary flood risk assessment in Norway. Report no. 7/2011. Published by Norwegian Water Resources and Energy Directorate (NVE). ISBN 978-82-410-0747-7.
Pereyra, G. (2012). Mexico: criminal violence and “war on drug trafficking”. Revista Mexicana de Sociología 74(3), 429-460.
Prescott-Allan, R. (2001). The wellbeing of nations: a country-by-country index of quality of life and the environment. Washington: Island Press.
United Nations. (2012). Rio+20 United Nations Conference on Sustainable Development. Retrieved November 2014, from http://www.uncsd2012.org/
Sarantakos, S. (1998). Social Research (Second ed.): MacMillian Education Australia Pty Ltd.
Saunders, W. S. A., Beban, J. G., & Coomer, M. A. (2014a). Analysis of natural hazard provisions in regional policy statements, territorial authority plans, and CDEM Group Plans. GNS Science Report 2014/28, Lower Hutt.
Saunders, W. S. A., Beban, J. G., & Coomer, M. A. (2014b). Assessment of council capability and capacity for managing natural hazards through land use planning. GNS Science Report 2014/50, Lower Hutt.
Saunders, W. S. A., Forsyth, J., Johnston, D. M., & Becker, J. (2007). Strengthening linkages between land-use planning and emergency management in New Zealand. Australian Journal of Emergency Management, 22(1), 36-43.
Saunders, W. S. A., & Ruske, M. (2014). Tabulated results from review of natural hazard provisions in regional policy statements, territorial authority plans, and CDEM group plans: GNS Science.
Schulze, C. (2013). Land use in the Bergen Region, A system dynamics analysis of the jobs-housing imbalance. Master Thesis. System Dynamics Group, Department of Geography. University of Bergen.
Statistics Norway, 2014. Population by municipalities, per 1 January 2014. Website: http://www.ssb.no/en/befolkning/statistikker/folkemengde/aar/2014-02-20?fane=tabell&sort=nummer&tabell=164165 (Accessed on 2 December 2014)
Third United Nations World Conference on Disaster Risk Reduction Preparatory Committee. (2014). Suggested elements for the post-2015 framework for disaster risk reduction. Geneva: United Nations.
UN Division for Sustainable Development. (2014). Open Working Group proposal for Sustainable Development Goals. Retrieved 3 December, 2014, from: http://sustainabledevelopment.un.org/sdgsproposal.html
UNISDR. (2007). Hyogo Framework for Action 2005-2015: Building the resilience of nations and communities to disasters. Extract from the final report of the World Conference on Disaster Reductin. Geneva: UNISDR.
UNISDR. (2013). Proposed elements for consideration in the post-2015 framework for disaster risk reduction. Geneva: UNISDR.
Uribe, E., Montes, M.A., & García, E. (2010). Mapa nacional de Índice de Inundación. Tecnología y Ciencias del Agua 1(2), 73-84.
GNS Science Report 2015/005 57

This page is intentionally left blank.

APPENDICES

This page is intentionally left blank.
A1.0 OVERVIEW OF HAZARDSCAPES
This section provides an overview of the hazardscapes of New Zealand, Norway, Mexico and Taiwan. This in turn provides context for the following section on the planning contexts, and will aid in the discussion of the results.
A1.1 NEW ZEALAND
Located on the active boundaries of the Pacific and Australian plates, New Zealand is subject to a wide variety of geological natural hazards, as well as extreme meteorological events due to the mountainous topography and the orientation of its main islands across the path of major weather systems (see Figure A1.1). While flooding is considered to be the most frequently occurring natural hazard (Glavovic, Saunders, & Becker, 2010), communities also face risks from landslides, coastal storms and erosion, severe winds, snow, and drought, as well as the potentially catastrophic impacts of earthquakes, tsunamis and volcanic eruptions (ODESC, 2007).
GNS Science Report 2015/005 61
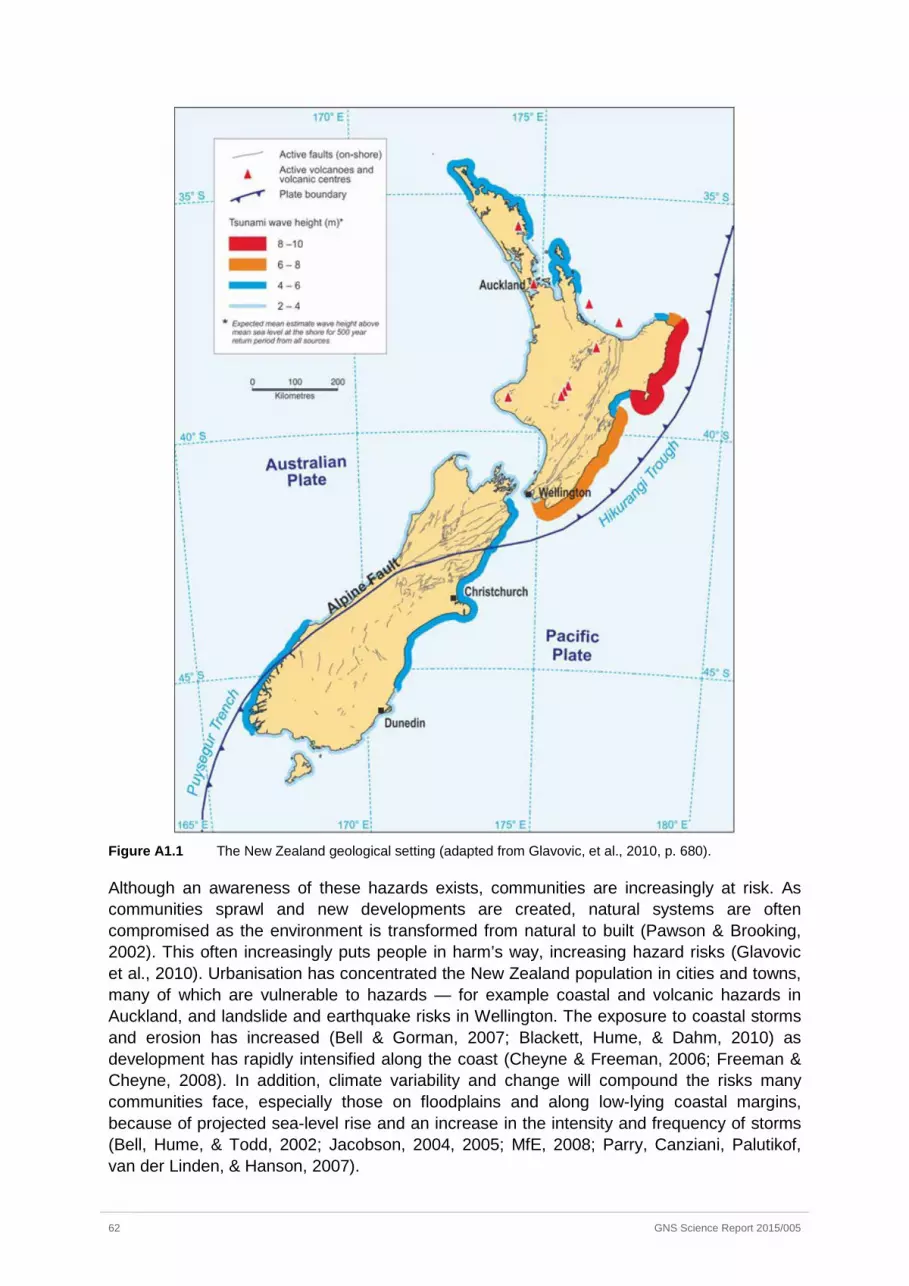
Figure A1.1 The New Zealand geological setting (adapted from Glavovic, et al., 2010, p. 680).
Although an awareness of these hazards exists, communities are increasingly at risk. As communities sprawl and new developments are created, natural systems are often compromised as the environment is transformed from natural to built (Pawson & Brooking, 2002). This often increasingly puts people in harm’s way, increasing hazard risks (Glavovic et al., 2010). Urbanisation has concentrated the New Zealand population in cities and towns, many of which are vulnerable to hazards — for example coastal and volcanic hazards in Auckland, and landslide and earthquake risks in Wellington. The exposure to coastal storms and erosion has increased (Bell & Gorman, 2007; Blackett, Hume, & Dahm, 2010) as development has rapidly intensified along the coast (Cheyne & Freeman, 2006; Freeman & Cheyne, 2008). In addition, climate variability and change will compound the risks many communities face, especially those on floodplains and along low-lying coastal margins, because of projected sea-level rise and an increase in the intensity and frequency of storms (Bell, Hume, & Todd, 2002; Jacobson, 2004, 2005; MfE, 2008; Parry, Canziani, Palutikof, van der Linden, & Hanson, 2007).
62 GNS Science Report 2015/005
A1.2 NORWAY
Norway is located in the Western part of Scandinavia, in Northern Europe. The coastline stretches 25 000 kilometres, facing the North Sea, Atlantic Ocean and Barents Sea. On the eastern side, Norway borders Sweden, Finland and Russia. With a population of just over 5 million at the turn of 2014 (Statistics Norway, 2014) and a total land surface of around 385,000 km2, Norway is one of the most sparsely populated countries of Europe.
The Norwegian Directorate for Civil Protection (DSB – Direktoratet for samfunnssikkerhet og beredskap) conducts an annual National Risk Analysis in which they define the natural hazards which may impact Norway. The analysis is important to civil protection and emergency planning work in Norway. DSB defines natural events as “natural catastrophic events which are triggered by forces of nature or natural phenomenon and not by human activity. Nature itself is the cause of the event, and the consequences can affect people and society in general. Plant, animal and human diseases are also included among the events triggered by natural events” (DSB, 2013). The National Risk Analysis describes serious hazards and threats and presents results from risk analyses conducted on a selection of disruptive events with disastrous consequences for society (worst-case scenarios).
For Norway, the following risk areas are assessed under natural catastrophic events: extreme weather, flooding, landslides, rockslide tsunamis in fjord systems, epidemics, forest fires, space weather (solar storms) and volcanic activity. In the latest report, published in December 2014, an earthquake threat is added to the list of natural catastrophic events. For Norway, the following extreme weather and flood events are noted as events with high impacts (DSB, 2013; DSB, 2014a):
Extreme weather events
• December 2013: Storm Ivar hit Central Norway, with hurricane force winds
• November 2013: Cyclone Hilde hit Trøndelag og Helgeland, lost electricity supply
• December 2011: Cyclone Patrick (Dagmar) hit Norway, Sweden and Finland, with winds above hurricane strength. Compensation payments for damages caused by natural catastrophic events were estimated at 876 million NOK. Electricity supply was affected with 570,000 customers losing power.
• New Year 1992: a hurricane hit the Nordmøre area and claimed one human life; it is one of Norway’s worst natural disasters of all time in terms of lost assets. The hurricane damaged 50,000 to 60,000 buildings, and there was also a considerable damage to infrastructure, cultural monuments, aquaculture facilities and not least of all, to forestry. The financial losses are estimated as being close to 2 billion NOK
Floods events
• October 2014: heavy rainfall caused great flooding in several places on the West coast. Hardest hit were Hordaland and Sogn og Fjordane. Some towns had water levels reaching the level of 1/200 and 1/500 year flood events. Highway E16 and the railroad between Oslo and Bergen were closed for several days. A large number of bridges, roads and tunnels were closed due to flood and landslide hazards. Several houses were swept away by the water and about 500 people were evacuated. The economic damage is huge, but has not yet been calculated.
GNS Science Report 2015/005 63
• May 2013: Gudbrandsdalen was hit by a major flood caused by snow melting and subsequent intense rainfall over a period of three days. Roads and railroads were closed due to flooding, landslides and erosion. Around 220 people were evacuated. The total damage, estimated by Oppland County, was around 1 billion NOK.
• June 2011: Southern Norway was hit by a storm surge as a consequence of large volumes of precipitation and snowmelt. In several places the water flow rate/levels culminated at around the 100-year flood level. More than 270 people were evacuated. Compensation payments for damages caused by natural catastrophic events were estimated at approximately 800 million NOK.
• 1995: Flooding in Eastern Norway, 7000 people were evacuated and one person died, there were reports of approximately 6900 injuries. It is estimated that the flooding caused damage valued at around 1.8 billion NOK.
• 1789: greatest ever known flooding in Norwegian history. The flooding cost the lives of 72 people and more than 1500 farms were damaged.
Different types of weather cause the most severe flooding in various regions of Norway:
• Western and Northern Norway: flooding is usually caused either by the remnants of tropical cyclones, or by a high pressure area over Great Britain or the Continent with a strong westerly wind north of the high pressure area.
• Southern Norway and near the coast of the Oslo Fjord: severe rain flooding coincides with a low pressure close to Great Britain.
• Eastern Norway: low pressures tracking from the south or south-east gives rise to the most hazardous flooding.
Landslides, avalanches and tsunami
Classification of landslide and avalanche types in Norway:
• Hard rock; Rock fall, Rock slide, Deep-seated landslide
• Loose material; Landslide, Debris flow slide, Quick clay landslide
• Snow; Avalanche, Wet snow avalanche
The last major rock landslide disasters in Norway occurred in the 1930s in Tafjord and Leon. The common feature for these landslides was that large rock massifs collapsed and slid down into water and fjords, giving risk to tsunami, enormous flood waves with huge heights that swept over people, buildings, animals and cultivated land. During the landslide-triggered tsunami in Leon in 1905, 61 people were killed, while the 1936 slide in the same place led to the death of 73 people. For the landslide-triggered tsunami that struck Tafjord in 1934, the death toll was 40 (Harbitz et al., 2014).
Landslides and avalanches are natural hazards that cause the greatest number of deaths in Norway. The assessment states that since 1900, over 500 landslides and avalanches have been recorded and 1100 lives have been lost. (DSB, 2013, p.58).
64 GNS Science Report 2015/005
Earthquake scenario
The DSB report National Risk Analysis 2014 (DSB, 2014a) has this year included an earthquake scenario, in which a major earthquake with a magnitude of 6.5 occurs off the coast of Hordaland (Øygarden Fault), which will affect the city of Bergen. The report states that the probability of such an earthquake is very low (expected to occur once in 5,000 to 10,000 years), however it cannot be ignored. The expected consequences are detailed and include a high number of casualties (more than 300 lives), seriously injured (more than 500) and extensive damage to buildings and infrastructure.
A1.3 MEXICO
Mexico (1,964,375 km2, population 112,336,538 in 2010) is located in the border between the North American, Cocos, Rivera and Pacific tectonic plates, resulting in intense seismic activity related to both subduction and lateral displacement. Over the last 200 years, Mexico registered 60 earthquakes of Mag 7+ 4. The most exposed population lives along the south-Pacific coast and in the Mexico City Area, which is built over the soft clays of an ancient lake bed that amplifies the magnitude of seismic waves. In addition to the intense seismic activity, eleven volcanoes in the country have erupted in the last 200 years, one of them monogenetic (Paricutin volcano, which emerged in 1943) (CENAPRED, 2008).
The oceans around Mexico produce an average of 23 tropical cyclones, of which the country receives the direct impact of 4. The population of the 31 municipalities with the most frequent impact of hurricanes (an average of 2 to 4 years) is about 4,000,000 people5. However, independently to the cyclone peaks of rain and wind, recent studies calculate that areas subject to flooding in Mexico are about 8.2% of the country’s surface (161,510 km2) (Uribe et al., 2010). On the other hand, although there are no objective records of the number of landslides that take place nationwide, specialists calculate an average of 35 events every year in which there are casualties.
Some of the main factors that influence the vulnerability of populations to different hazards are poverty, inequality and urbanization. According to the National Council for the Evaluation of Social Development Policy (CONEVAL)6, in 2012 about 45.6% of the nation’s population lived in poverty (which includes multiple dimensions such as income, social protection, education and quality of housing). A high level of urbanization is the most remarkable characteristic of the Mexican demographic structure. According to the National Population Council, there are 384 cities (classified as 15k+) with a total population of 81 million (72.3% of the Mexico’s total population). 11 of these cities are larger than 1 million and 59 of them are considered metropolitan areas (CONAPO, 2012). Undoubtedly, one of the greatest challenges in terms of risk reduction in the country has to do with the unequal structure of these fast-growing cities, together with typically urban problems such as spatial segregation, low-quality housing, political interference and reduced access to public goods.
4 Source: National Center of Disaster Prevention website, http://www.cenapred.unam.mx/es/Publicaciones/archivos/258-ENCASODESISMO.PDF. Last access: Jan 5th, 2015.
5 Source: National Risk Atlas website, http://www.atlasnacionalderiesgos.gob.mx/index.php/riesgos-hidrometeorologicos/ciclones-tropicales-huracanes. Last access: Jan 5th, 2015
6 Source: National Council for the Evaluation of Social Development Policy http://www.coneval.gob.mx/Medicion/Paginas/Medición/Pobreza%202012/Pobreza-2012.aspx, Last access: Jan 5th, 2015
GNS Science Report 2015/005 65

An additional issue that must be acknowledged is the violence that affects large parts of the country. While violence itself represents a social hazard, it also negatively influences the ability of local governments and communities to carry out natural hazard-related risk reduction measures. Drug-related violence has generated a large number of internal displacements (Pereyra, 2012), while many local governments have increasingly failed to control the activity of criminal groups in activities influencing the intensity of risks, such as illegal logging or the vandalization of oil pipelines. In summary, violence is a growing factor that must be taken into account to understand the problems of implementing disaster risk reduction measures at the local level.
A1.4 TAIWAN
Taiwan is located on the conjunction of tectonic systems of Philippine Sea and Euro-Asia plates. It has an area of 36,000 km2 and 70% of the land is sloping. Besides being subject to earthquake and landslide risks, it has in average 3.6 typhoons per year. Like New Zealand, flooding in Taiwan is considered to be the most frequently occurring natural hazard.
Similar to New Zealand, urbanization which leads to concentration of population in cities is a main issue in terms of disaster management. According to Nationalist Statistics, in August 2014, the total resident population in Taiwan is about 23.4 million. About 68% of the population is in urban areas. Taipei has the highest resident population density – 9,915 people per square kilometre.
Besides urbanization, the aging society is another important issue for disaster management in Taiwan. According to Department of Statistics, Taiwan became an aging society in 1993 (which means the percentage of population over 65 years old is larger than 7%). By the end of 2013, the percentage was 11.5%. According to National Development Council, Taiwan might become an aged society (in which the percentage of population over 65 years old is larger than 14%) in 2018 and a super aged society (the percentage is larger than 20%) in 2025 (National Development Council, 2014).
Besides social change such as urbanization and an aging society, climate change is also important in Taiwan. The Scientific Report 2011 (Hsu, Chou, Wu, Lu, Chen, and Chen, 2011) shows that Taiwan has a significant warming trend and the average annual number of rain days has decreased significantly. Also, the annual number of extremely hot days has increased and the number of annual cold periods shows a decreasing trend.
66 GNS Science Report 2015/005

A2.0 CONTEXT OF CASE STUDIES SELECTED IN EACH COUNTRY
A2.1 TAIWAN
Case 1: New Taipei City
New Taipei City is located in northern Taiwan and is considered the most populous city in Taiwan. The city area has 120 km of coastline, and mountains, hills, and plateaus; the city’s main river is Tam-tsui River.
The monthly average total rainfall of New Taipei City is about 180 mm and is higher than the rainfall of the average city in Taiwan. Most rain falls from June to September. The monthly totals in these months are between 200 mm and 350 mm. In November, December, and January, the monthly average total rainfall, between 70 mm and 100 mm, is lower than in other months.
The major disaster risks in New Taipei City are typhoons, landslides and earthquakes. In 1997, Typhoon Winnie led to landslides and destroyed a building, causing 28 deaths, and more than one hundred people lost their houses. In 1999, the Chi-Chi Earthquake caused the collapse of three buildings in the city and resulted in 45 deaths. In both cases the building construction was not adequate, so they did not meet the standard safety factors. The city has 221 potential debris flow torrent paths and this is why landslides an important problem. Besides natural disaster risks, New Taipei City has three nuclear power plants, so the risk of a nuclear accident is also major risk it faces.
Case 2: Kaohsiung City
Kaohsiung is located in the south of Taiwan and is the 2nd most populous city in Taiwan. Just over half of the city is mountainous; the rest is located on hills and plains. The main river is Gaoping River, which has the largest basin area of any river in Taiwan. Ah-kungk-tien Reservoir in the city is the only reservoir in Taiwan that is designed for flood control purpose.
The rain season in Kaohsiung is from May to September, in which 90% of the annual total precipitation falls. Occasionally, the total rainfall in one day can reach 500 mm. In winter, the average number of rainy days in a month is low, only 3. The average annual total rainfall is about 1900 mm. Most rains occur from June to August, with monthly totals of about 400 mm. However, the monthly average total rainfall in November, December, and January, is less than 20 mm.
The main hazards include typhoons (storms), floods, landslides, earthquakes, and toxic and chemicals disasters. In 2001, Severe Tropical Storm Trami dumped 500 mm rainfall in 12 hours and caused 5 deaths and loss of power for about 130,000 households in Kaohsiung. In 2004, 0702 Flood Event produced a total rainfall of 2,142.5 mm in Kaohsiung, and led to 29 deaths and NTD 8,972 million in agricultural losses. In 2009, Typhoon Morakot causes a landslide which smothered the whole of Xiaolin Village, killing more than 470 villagers. The city has 110 potential debris flow torrent paths and three faults. Fortunately, the city not yet had any deaths from earthquakes. Because in Kaohsiung a large portion of the city is industrial area, toxic and chemicals disaster management is also important. In 2014, a propane explosion resulted in more than 30 deaths.
GNS Science Report 2015/005 67
Case 3: Taichung City
Taichung is located in the central Taiwan and the city has the 3rd largest population in Taiwan. Taichung has mountains, hills, basins, plateau, and coastal plain, and city has three main rivers.
The average annual total rainfall is about 1800 mm. Most rains occur from June to August. The monthly total rainfall figure in these months is between 300 mm and 350 mm. The monthly average total rainfall from October to January, is usually less than 40 mm, lower than in other months.
The main natural hazards in Taichung City include earthquakes, typhoons, landslides, and floods. From 1916 to 2000, there were 6 earthquakes that caused deaths in Taichung. An earthquake in 1935, magnitude 7.1, caused the most deaths, 3,276 people, with 17,907 houses destroyed. The second severe earthquake is the Chi-Chi Earthquake in 1999, of magnitude 7.3 and intensity scale 6; it led to 114 deaths and 548 houses destroyed in Taichung. With respect to landslides, Taichung has 107 potential debris flow torrent paths. Typhoon Krosa in 2007 and Typhoon Kalmaegi in 2008 caused landslides in some places but fortunately no deaths occurred.
A2.2 MEXICO
Case 1: Acapulco, Guerrero
Acapulco is a port city located on Mexico’s southern Pacific coast; for many years it has been one of the country’s main tourist destinations. The Metropolitan Area of Acapulco includes urban areas located in two municipalities (Acapulco de Juárez and Coyuca de Benítez), with a total population of 863,431. It is considered the 16th most populated city in Mexico. According to the National Bureau of Social Development (CONEVAL), over half of the municipality of Acapulco’s population (51.6%) lives in poverty; while some studies show that up to 88.8% of the local population lives in low quality dwellings. There is an undefined and contested number of families located in irregular settlements around all districts of the city.
The climate of Acapulco is warm to dry (Awo, Aw) with a rainy summer; the average annual temperature is 28°C and rainfall varies from 1500 to 2000 mm. Two large rivers cross the urban area (Papagayo and Sabana), flowing into two coastal lagoons (Coyuca and Tres Palos). The area in which Papagayo rivers and the Tres Palos lagoon converge, which is called ‘the Diamond Zone’ (Zona Diamante), has been subject to very intense urban and tourism development in the last thirty years, and much of the city’s crucial infrastructure is located in the area, including the international airport. The oldest part of the city is located in the mountains surrounding a bay, mostly on steep slopes with unconsolidated soil.
In terms of hazards, the city is intensively exposed to tropical storms due to the warm sea temperatures at its latitude, with a notable peak between August and October; these storms are associated with landslides and floods. In addition, the city is located in the subduction zone between the Cocos and North American tectonic plates, which also subjects the area to significant seismic activity. There are also historical records of tsunami events.
The city of Acapulco had been hit by two very intense tropical storms in the last 15 years (Hurricane Paulina in 1997 and Hurricane Manuel in 2013), whose catastrophic consequences had a crucial influence in the development of the civil protection policy in the country. In 2004, the Ministry of Social Development generated the first official municipal
68 GNS Science Report 2015/005
Risk Atlas in the country, which was for the city of Acapulco. The importance of tourism activities, together with severe exposure to natural hazards and the existence of multiple risk reduction policies at the local level for several years make this city a relevant case to explore.
Case 2: Xalapa, Veracruz
Xalapa is the capital city of the estate of Veracruz and is located at 1,460 meters above sea level, in the transition zone between the Sierra Madre Oriental mountain range and the coastal plain of the Gulf of Mexico.
Xalapa's Metropolitan Area integrates Xalapa’s city and another five municipalities; the total population is 668,584 inhabitants, 40 per cent of whom live under the poverty line. The economic activities of Xalapa are based mostly on trade and services; nevertheless, there are significant investments in the primary sector in the area, particularly in the production of coffee.
The municipality is within the Trans-Mexican Volcanic Belt, where the geology is predominantly igneous rocks. The Xalapa area has highly productive soils on an irregular topography and the urban area is located in a seismic zone. Many urban sectors have slopes higher than 25%, which makes them unsuitable for urban development and highly prone to landslides, while the city’s lower areas are seasonally flooded, even though the exposure of the city to tropical storms is not particularly great.
The province of Veracruz shows one of the highest levels of institutional consolidation of natural hazards planning in the country. The province’s Law of Civil Protection was one of the first to enforce the use of risk analysis. It includes a semi-decentralized emergency system, in which the provincial level has strong technical capacities, financial resources and more responsibilities in terms of response (rather than a decentralized one in which the municipalities are in charge of all initial responses to natural hazard consequences). At the same time, the information on natural hazard provisions and in risk Atlases is subject to high governmental control and it is not available to most of the low-level committees, emergency brigades and low-level civil protection bureaucracy, which represents a particularly interesting condition for implementation processes in this area.
Case 3: Comitán, Chiapas
Comitán is located in the south-east region of Mexico, in the province of Chiapas. It is an active commercial city in a multi-ethnic region, located on plains surrounded by pine-oak forested mountains. The climate is Warm-subhumid (Cw, Aw) with a rainy summer. The temperature ranges from 14-26°C, with an annual rainfall of between 900-1500 mm. The rivers that cross the city feed the wetlands and lakes of Montebello, a UNESCO Biosphere Reserve located along the Mexican border with Guatemala. The total population of the city is 97,537, about 66% of whom live in poverty. The main economic activities are construction, manufacturing and trade. The predominant hazards are landslides; hurricanes are frequent, with strong rains that bring river floods into the urban area.
The province of Chiapas, one of the poorest in the country, has invested significant resources on its Civil Protection system in terms of technical capacities and financial resources. The structure is more decentralized than Veracruz (the municipalities are in charge of all initial responses to natural hazard consequences), but the regional office of civil protection closely supervises and validates almost all documents used for risk reduction policies, even those produced and financed by the Federal Government for the use of
GNS Science Report 2015/005 69
municipal committees. In general, local-level efforts in this province still show the difficulties of operating in low-capacity municipal governments. However, Comitán is a remarkable exception, given the intervention of a strong Municipal Institute of Planning. It has been one of the pioneer institutional developments in the country, one of the few cases that integrated both risk reduction policies and land use planning at the local level.
A2.3 NEW ZEALAND
Case 1: Auckland
The Auckland urban area, in the North Island of New Zealand, is the largest and most populous urban area in the country. Auckland has a population of 1,413,700, which constitutes 31 percent of the country's population. It is part of the wider Auckland Region, which includes the rural areas and towns north and south of the urban area, plus the islands of the Hauraki Gulf, resulting in a total population of 1,527,100 that is governed by the Auckland Council. Auckland also has the largest Polynesian population of any city in the world.
The city straddles the Auckland volcanic field, which has produced about 90 volcanic eruptions from 50 volcanoes in the last 90,000 years. It is the only city in the world built on a basaltic volcanic field that is still active. It is estimated that the field will stay active for about 1 million years. Surface features include cones, lakes, lagoons, islands and depressions, and several have produced extensive lava flows. Some of the cones and flows have been partly or completely quarried away. The individual volcanoes are all considered extinct, although the volcanic field itself is merely dormant. The trend is for the latest eruptions to occur in the north west of the field. Auckland has at least 14 large lava tube caves which run from the volcanoes down towards the sea.
Case 2: Wellington
Wellington is the capital city of New Zealand, and second most populous urban area of New Zealand, with 191,000 residents. The city straddles the Wellington Fault, a major hazard, which goes through the heart of New Zealand’s capital city and is crossed by numerous bridges, roads and pipelines. Over 75% of people in the Wellington region live within 10 kilometres of the fault. Wellington owes its distinctive landscape to this fault. Near the coast, the sea has flooded into the fault depression to create Wellington Harbour. During earthquakes along the fault, land along the north-western side of Wellington Harbour and the Hutt Valley moves upward, while in areas south-east of the fault land subsides. Further inland, the Hutt River flows down the depression and has filled the Lower and Upper Hutt areas with hundreds of metres of sediment.
Movement along the 75-kilometre-long segment of the Wellington Fault from Cook Strait through Wellington and the Hutt Valley to Kaitoke is considered likely to cause a major earthquake in the future. At least two earthquakes have occurred on this part of the Wellington Fault in the last 1,000 years, with the most recent about 400 years ago. During these earthquakes, sections of land on opposite sides of the fault moved past each other by about 4 metres. Such movement would produce earthquakes of the order of magnitude 7.5.
Large earthquakes on this section of the fault are estimated to occur about every 500 to 770 years (http://www.teara.govt.nz/en/active-faults/page-3).
Famous for being windy, the city is often buffeted by strong gusts that are funnelled through Cook Strait.
70 GNS Science Report 2015/005
Case 3: Christchurch
Christchurch is the largest city in the South Island of New Zealand, and the country's third-most populous urban area. It lies one third of the way down the South Island's east coast, just north of Banks Peninsula. The population of Christchurch City at the 5 March 2013 census was 341,469.
On Saturday 4 September 2010, a magnitude 7.1 earthquake struck Christchurch and the central Canterbury region at 4:35 am. Located near Darfield, west of the city at a depth of 10 kilometres, it caused widespread damage to the city and minor injuries, but no direct fatalities. Nearly six months later on Tuesday 22 February 2011, a second earthquake measuring magnitude 6.3 struck the city at 12:51 pm. It was located closer to the city, near Lyttelton at a depth of 5 km. Although lower on the moment magnitude scale than the previous earthquake, the intensity and violence of the ground shaking was measured to be MM IX, among the strongest ever recorded globally in an urban area and in total 185 people were killed with nationals from more than 20 countries among the victims. Significant liquefaction affected the eastern suburbs, and the total cost to insurers of rebuilding has been estimated at NZ$20–30 billion. 4,558 earthquakes were recorded in the Canterbury region above a magnitude 3.0, from 4 September 2010 to 3 September 2014.
The city has been experiencing rapid growth following the earthquakes, with the central city rebuild, which is outlined in the Christchurch Central Recovery Plan, starting to ramp up, and massive growth in the residential sector, with around 50,000 new houses expected to be constructed in the Greater Christchurch area by 2028, as outlined in the Land Use Recovery Plan (LURP).
A2.4 NORWAY
Case 1: Bergen, Hordaland County
Bergen, in Hordaland County, is located on the west coast of Norway. It is the second largest city in Norway, after Oslo, and is the administrative centre of western Norway. Bergen has a population of 271,949 people at the turn of 2014 (Statistics Norway, 2014). The city is surrounded by mountains and sea. Bergen has a temperate oceanic climate with relatively mild winters and cool summers. Bergen’s annual precipitation is 2250 mm. Both annual precipitation and the number of heavy rainfall days are expected to increase due to climate change in western Norway towards the end of the century, increasing vulnerability to flooding and landslides. As Bergen is located between mountains with steep hills, the city is highly exposed to landslides (Langeland et al., 2013).
Case 2: Otta, Sel Municipality, Oppland County
Otta is a city and administrative centre of Sel municipality in the county of Oppland. Sel municipality has 5,974 inhabitants as of 1 January 2014 (Statistics Norway, 2014). Otta is located in the Ottadalen valley. The river Otta flows through Ottadalen to Gudbrandsdalen, where at the city of Otta, the river empties into the river Gudbrandsdalslågen which continues to flow through the valley. The area is vulnerable to floods and landslides, such as the flooding events in the spring of 1995 and landslides occurring during spring 2008. The floods resulted in a dike breach and close to 6000 acres of cultivated land were flooded. In spring 2008 over 40 landslides were recorded in Sel municipality, leading to the evacuation of two residential areas.
GNS Science Report 2015/005 71
Case 3: Lillestrøm, Skedsmo Municipaloty, Akershus County
Lillestrøm is a city in the municipality of Skedsmo, located in the county of Akershus. Skedsmo municipality has 51,188 inhabitants as of 1 January 2014 (Statistics Norway, 2014). Lillestrøm is situated in eastern Norway, east of Oslo, and lies between the two rivers Nitelva and Leira where they run into the northern bay of the lake Øyeren (Svelle). The water level of the lake Øyeren is also influenced by the river Glomma. Floods that have hit Lillestrøm are mostly caused by the natural rise of water levels in Svelle and Øyeren due to rain and snowmelt. Lillestrøm has experienced damaging floods in the past and measures have been taken to prevent flood damage (Peereboom et al., 2011).
72 GNS Science Report 2015/005
A3.0 PLANNING CONTEXTS
Appendix 3 provides a detailed overview of the planning frameworks in Taiwan, Mexico, New Zealand and Norway. An understanding of each of the planning environments within the case study nations is crucial to understanding the results and subsequent comparisons in Section x.
A3.1 TAIWAN
The Central Disaster Prevention and Protection Council in Taiwan is chaired by the Premier of the Cabinet, Executive Yuan. Under this Council, there is Central Disaster Prevention and Protection Commission, chaired by the Vice Premier. This Commission is responsible for implementing the overall disaster management policies and plans.
Under this Commission, the National Disaster Prevention and Protection Expert Advisory Committee acts as technical advisors and the National Science and Technology Center for Disaster Reduction (NCDR) provides technical support to the Committee. After Typhoon Morakot in 2009, the Office of Disaster Management was established to provide functions similar to those of the Commission; it has 50 official staff members.
Besides the overall management system, different types of disasters have their own governmental agency in charge. For instance, the Ministry to Transportation and Commission handles responses to typhoons and earthquakes. The Ministry of Economic Affairs (MOEA) is responsible for problems caused by flooding, drought, pipe lines, etc.
Overall, although still with problems of implementation, the Taiwanese disaster management system has transformed from an ad‐hoc system to one which promotes hazard mitigation. This progress is notable especially after the Disaster Prevention and Response Act (DPRA) was promulgated in 2000 (Chen, Wu, and Lai, 2006).
GNS Science Report 2015/005 73

A3.2 MEXICO
Mexico’s natural hazard management responsibilities are divided among multiple agencies. The primary government structure that handles the effects of natural hazards is the National System of Civil Protection (SINAPROC), which is not an agency itself but a coordination mandate between multiple government organizations at a national, provincial and municipal levels, and several specialized federal agencies (such as the National Center of Disaster Prevention, Mexican Petroleum and the National Water Commission, among others) (OECD, 2013: 72-3). SINAPROC’s head is the National Board of Civil Protection (Consejo Nacional de Protección Civil), which translates into a top-bottom government structure based at the Ministry of Internal Affairs (Secretaría de Gobernación). This office commands specific actions of emergency management and the implementation of different plans and programmes through different coordination arrangements with provincial and municipal levels of government (Arellano-Gault and Vera-Cortés, 2005: 2-3; OECD, 2013: 66). The federal government issues a National Programme for Civil Protection every six-year presidential term, in which the priorities and the main courses of action are outlined.
The natural hazard management is legally based on the General Law of Civil Protection (2012) and its Regulations (2014). Each of 32 provinces has its own local Law of Civil Protection, which has to align with the General Law. The adjustment of the content of local laws to the national regulation is progressing, but some provincial laws are still outdated with regard to the most recent legislation. In addition to the laws and the National Programme, other relevant normative documents include provincial Risk Atlases, hazard-specific provincial emergency plans, several national contingency-specific plans (e.g., the Popocatepetl volcano emergency plan), municipal emergency plans and municipal risk atlases. On the other hand, settlements planning policy is guided by the General Law of Human Settlements (1993). Even though this legislation is not directly related to risk management, almost all risk prevention and mitigation policies are closely related to the normative and institutional framework established by this law.
Since Mexico’s government structure is formally decentralized, the provincial and municipal civil protection agencies are supposed to be a key, very active part of SINAPROC. However, even though they undoubtedly are an essential link in natural hazards management, their involvement, level of participation and effectiveness is quite variable. Officially, municipal governments hold the first responsibility to respond to an event through the local civil protection office. This level of government is also in charge of all urban land use provisions and many public works, particularly water provision, sanitary services and basic infrastructure. In this regard, municipal governments are the primary government structure that deals with natural hazard land use policies, as well as with emergency situations. On the other hand, provincial governments are responsible for integrated emergency planning processes, the regulation of environmentally valuable non-urban land through ‘ecological plans’ (ordenamientos ecológicos), as well as acting as financial, technical and political intermediaries between the federal and the local governments.
However, the functions and actual effectiveness of the decentralized chain varies greatly from province to province due to several factors, such as variations in local civil protection laws, which give different responsibilities and procedures to local government organizations; the diverse financial resources and technical capacities of local agents; and the level of autonomy from other political leaders and clientelistic networks, among others. While some provinces are highly politically and administratively decentralized, others have strengthened
74 GNS Science Report 2015/005
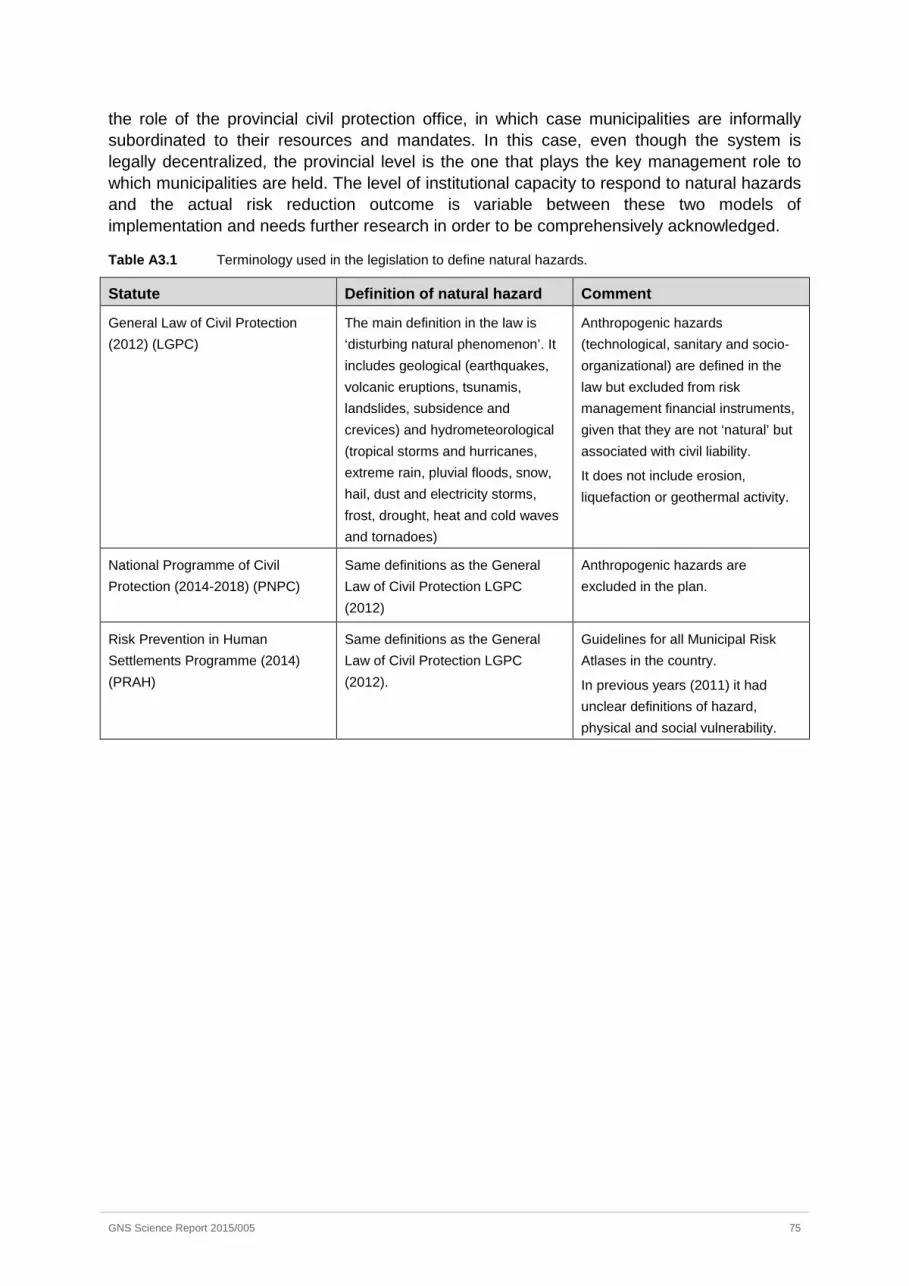
the role of the provincial civil protection office, in which case municipalities are informally subordinated to their resources and mandates. In this case, even though the system is legally decentralized, the provincial level is the one that plays the key management role to which municipalities are held. The level of institutional capacity to respond to natural hazards and the actual risk reduction outcome is variable between these two models of implementation and needs further research in order to be comprehensively acknowledged.
Table A3.1 Terminology used in the legislation to define natural hazards.
Statute Definition of natural hazard Comment
General Law of Civil Protection (2012) (LGPC)
The main definition in the law is ‘disturbing natural phenomenon’. It includes geological (earthquakes, volcanic eruptions, tsunamis, landslides, subsidence and crevices) and hydrometeorological (tropical storms and hurricanes, extreme rain, pluvial floods, snow, hail, dust and electricity storms, frost, drought, heat and cold waves and tornadoes)
Anthropogenic hazards (technological, sanitary and socio-organizational) are defined in the law but excluded from risk management financial instruments, given that they are not ‘natural’ but associated with civil liability.
It does not include erosion, liquefaction or geothermal activity.
National Programme of Civil Protection (2014-2018) (PNPC)
Same definitions as the General Law of Civil Protection LGPC (2012)
Anthropogenic hazards are excluded in the plan.
Risk Prevention in Human Settlements Programme (2014) (PRAH)
Same definitions as the General Law of Civil Protection LGPC (2012).
Guidelines for all Municipal Risk Atlases in the country.
In previous years (2011) it had unclear definitions of hazard, physical and social vulnerability.
GNS Science Report 2015/005 75
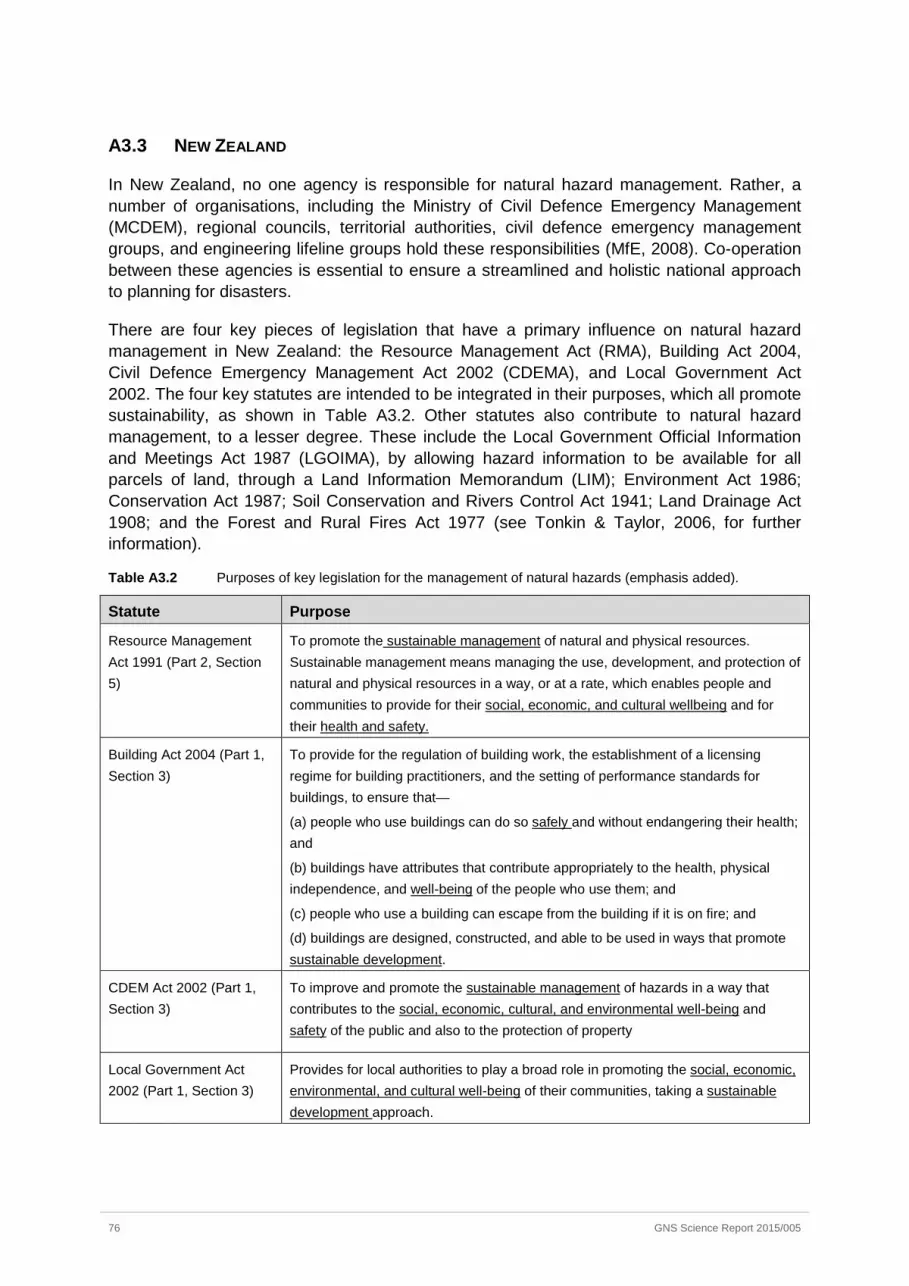
A3.3 NEW ZEALAND
In New Zealand, no one agency is responsible for natural hazard management. Rather, a number of organisations, including the Ministry of Civil Defence Emergency Management (MCDEM), regional councils, territorial authorities, civil defence emergency management groups, and engineering lifeline groups hold these responsibilities (MfE, 2008). Co-operation between these agencies is essential to ensure a streamlined and holistic national approach to planning for disasters.
There are four key pieces of legislation that have a primary influence on natural hazard management in New Zealand: the Resource Management Act (RMA), Building Act 2004, Civil Defence Emergency Management Act 2002 (CDEMA), and Local Government Act 2002. The four key statutes are intended to be integrated in their purposes, which all promote sustainability, as shown in Table A3.2. Other statutes also contribute to natural hazard management, to a lesser degree. These include the Local Government Official Information and Meetings Act 1987 (LGOIMA), by allowing hazard information to be available for all parcels of land, through a Land Information Memorandum (LIM); Environment Act 1986; Conservation Act 1987; Soil Conservation and Rivers Control Act 1941; Land Drainage Act 1908; and the Forest and Rural Fires Act 1977 (see Tonkin & Taylor, 2006, for further information).
Table A3.2 Purposes of key legislation for the management of natural hazards (emphasis added).
Statute Purpose
Resource Management Act 1991 (Part 2, Section 5)
To promote the sustainable management of natural and physical resources. Sustainable management means managing the use, development, and protection of natural and physical resources in a way, or at a rate, which enables people and communities to provide for their social, economic, and cultural wellbeing and for their health and safety.
Building Act 2004 (Part 1, Section 3)
To provide for the regulation of building work, the establishment of a licensing regime for building practitioners, and the setting of performance standards for buildings, to ensure that—
(a) people who use buildings can do so safely and without endangering their health; and
(b) buildings have attributes that contribute appropriately to the health, physical independence, and well-being of the people who use them; and
(c) people who use a building can escape from the building if it is on fire; and
(d) buildings are designed, constructed, and able to be used in ways that promote sustainable development.
CDEM Act 2002 (Part 1, Section 3)
To improve and promote the sustainable management of hazards in a way that contributes to the social, economic, cultural, and environmental well-being and safety of the public and also to the protection of property
Local Government Act 2002 (Part 1, Section 3)
Provides for local authorities to play a broad role in promoting the social, economic, environmental, and cultural well-being of their communities, taking a sustainable development approach.
76 GNS Science Report 2015/005
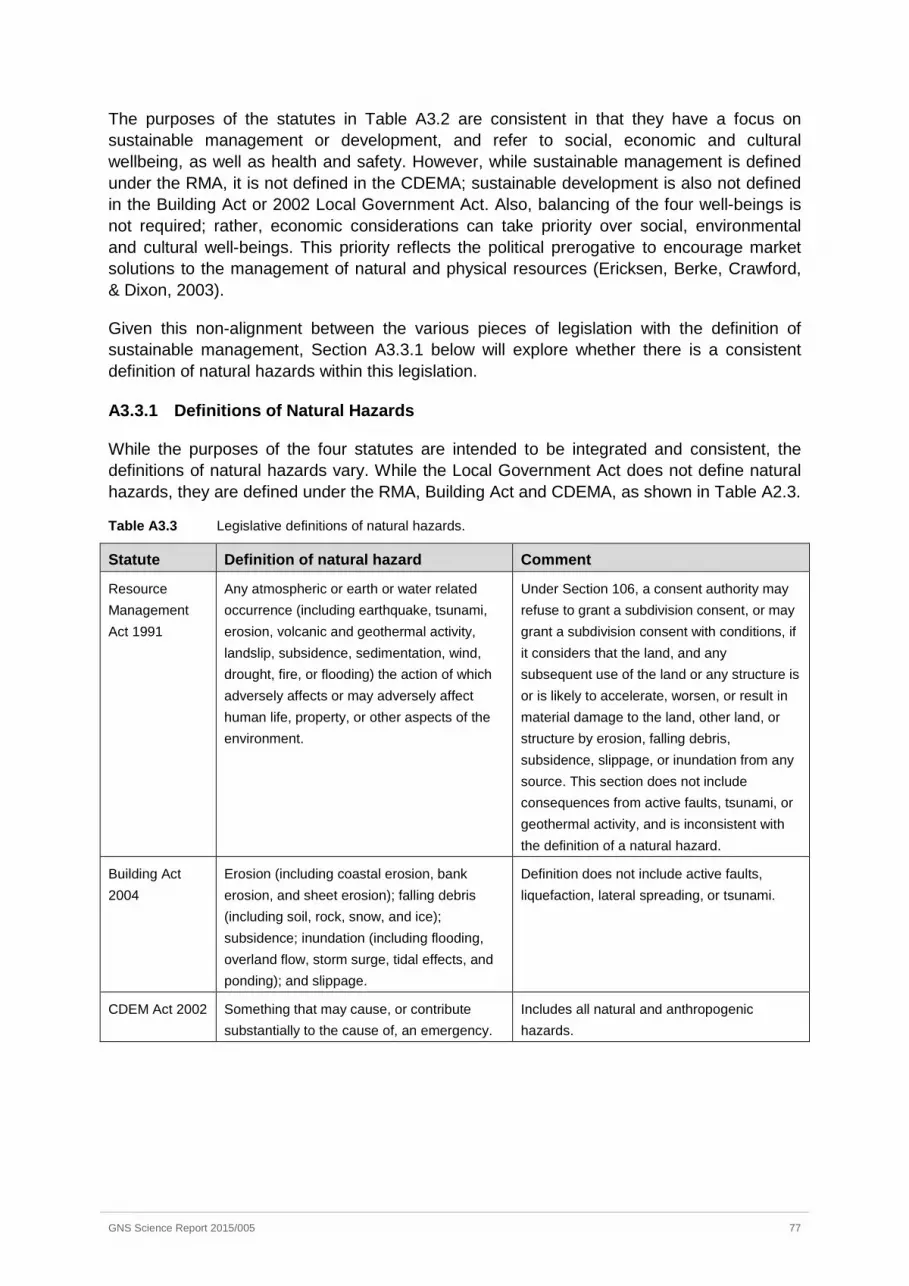
The purposes of the statutes in Table A3.2 are consistent in that they have a focus on sustainable management or development, and refer to social, economic and cultural wellbeing, as well as health and safety. However, while sustainable management is defined under the RMA, it is not defined in the CDEMA; sustainable development is also not defined in the Building Act or 2002 Local Government Act. Also, balancing of the four well-beings is not required; rather, economic considerations can take priority over social, environmental and cultural well-beings. This priority reflects the political prerogative to encourage market solutions to the management of natural and physical resources (Ericksen, Berke, Crawford, & Dixon, 2003).
Given this non-alignment between the various pieces of legislation with the definition of sustainable management, Section A3.3.1 below will explore whether there is a consistent definition of natural hazards within this legislation.
A3.3.1 Definitions of Natural Hazards
While the purposes of the four statutes are intended to be integrated and consistent, the definitions of natural hazards vary. While the Local Government Act does not define natural hazards, they are defined under the RMA, Building Act and CDEMA, as shown in Table A2.3.
Table A3.3 Legislative definitions of natural hazards.
Statute Definition of natural hazard Comment
Resource Management Act 1991
Any atmospheric or earth or water related occurrence (including earthquake, tsunami, erosion, volcanic and geothermal activity, landslip, subsidence, sedimentation, wind, drought, fire, or flooding) the action of which adversely affects or may adversely affect human life, property, or other aspects of the environment.
Under Section 106, a consent authority may refuse to grant a subdivision consent, or may grant a subdivision consent with conditions, if it considers that the land, and any subsequent use of the land or any structure is or is likely to accelerate, worsen, or result in material damage to the land, other land, or structure by erosion, falling debris, subsidence, slippage, or inundation from any source. This section does not include consequences from active faults, tsunami, or geothermal activity, and is inconsistent with the definition of a natural hazard.
Building Act 2004
Erosion (including coastal erosion, bank erosion, and sheet erosion); falling debris (including soil, rock, snow, and ice); subsidence; inundation (including flooding, overland flow, storm surge, tidal effects, and ponding); and slippage.
Definition does not include active faults, liquefaction, lateral spreading, or tsunami.
CDEM Act 2002 Something that may cause, or contribute substantially to the cause of, an emergency.
Includes all natural and anthropogenic hazards.
GNS Science Report 2015/005 77
While the Building Act is limited to certain phenomena, the RMA and CDEMA have unlimited definitions, both of which are based on consequences (i.e., may adversely affect human life, property; may cause or contribute to an emergency). This allows for consequences (and associated vulnerabilities, susceptibilities etc.) to be assessed. The implication of this difference in approach with defining natural hazards is often not fully appreciated by land use planners, building officers, or emergency management officers, and can lead to inappropriate decisions being made. It is therefore important that the linkages between the statutes is understood and integrated between roles (planners, emergency management officers, building officers etc.). The following section outlines these linkages, roles and responsibilities.
A3.3.2 Integrated Roles and Responsibilities
The integration of the practice of hazard management can be improved by understanding how the various roles and responsibilities of central government agencies, regional councils, territorial authorities, and non-statutory planning tools can work together to provide a holistic approach. Figure A3.1 shows these relationships, and areas for improvement.
Figure A3.1 presents the five main statutes that govern natural hazards planning at different levels of government, namely central (orange), regional (green) and district/city (blue) levels. The hierarchy of plans established under each statute provides various regulatory and non-regulatory tools for natural hazards planning. The solid arrows show established relationships in the hierarchy of provisions. The dashed arrows highlight relationships between existing provisions where there is an opportunity for strengthening linkages. The relationships may be one- or two-way. These legislative provisions and the array of tools they provide constitute a robust ‘toolkit’ for natural hazards planning. However, many of these tools are not well known amongst either planners or emergency management officers, nor used to their full potential to reduce hazard risk and build community resilience (Glavovic, Saunders, & Becker, 2010; Saunders, Forsyth, Johnston, & Becker, 2007).
Under Local Government Official Information and Meetings Act 1987, territorial authorities must issue a Land Information Memorandum on request. This Memorandum provides information that a council holds on a parcel of land, including natural hazards. Land Information Memorandums allow the applicant to become aware of any natural hazard on which a council holds information that may affect their property, and enables them to assess their willingness to accept or tolerate that risk. However, if hazard information is included in the district plan, it is not required to be included in the Memorandum. It is questionable whether applicants for Land Information Memorandums are aware that it may not include all information held by a council for a site, if that information is held in the district plan. Many Land Information Memorandum applicants assume that the Memorandum will contain all hazard information available.
78 GNS Science Report 2015/005
A3.4 NEW ZEALAND COASTAL POLICY STATEMENT
The 2010 New Zealand Coastal Policy Statement (NZCPS) (Department of Conservation, 2010) is the only national regulatory policy document that provides guidance on the management of coastal hazards. Regional policy statements, regional plans and district plans must give effect to the Coastal Policy Statement. The Statement specifically includes natural hazards in Policies 24 (Identification of coastal hazards) and 25 (Subdivision, use and development in areas of coastal hazard risk). In particular, Policy 25 states:
… in areas potentially affected by coastal hazard over at least the next 100 years: (a) avoid increasing the risk of social, environmental and economic harm from coastal hazards; (b) avoid redevelopment, or change in land use, that would increase the risk of adverse effects from coastal hazards;… (f) consider the potential effects of tsunami and how to avoid or mitigate them.
Policy 24 refers to “areas at high risk”, but this risk level is not defined, i.e., factors that determine high or low risk are not provided.
GNS Science Report 2015/005 79

Figure A3.1 Legislative roles and responsibilities for hazard management in New Zealand (adapted from Saunders, et al., 2007).
80 GNS Science Report 2015/005

Table A3.4 provides a summary of how these statutes contribute to the management of natural hazards in New Zealand. Primarily the reduction of risk lies with the RMA, whereas emergency management (readiness, response, recovery) lies with the CDEMA.
Table A3.4 Summary of ways in which statutes contribute to the management of natural hazards.
Statute Implication for natural hazard management
Resource Management Act 1991
• Health and safety issue must be addressed
• Local authorities are required to avoid or mitigate the effects of natural hazards, not their occurrence (Canterbury RC v Banks Peninsula DC, 1995).
• NZCPS includes specific coastal hazard policies.
• S106 (consent authority may refuse to grant subdivision consent) does not allow for the consideration of all natural hazards as defined.
• The ability to develop national policy statements and national environmental standards to address natural hazards (none currently exist).
Building Act 2004 • Requires all buildings to be ‘safe from all reasonably foreseeable actions during the life of the building’.
• Reference is made to the joint Australian/New Zealand loading standard AS/NZS1170 (Standards Australia/New Zealand, 2002), where the acceptable annual probability of exceedence for wind and earthquake loads are identified. These relate to the return period for an event (being 1/500, 1/1000 and 1/2500) and the building importance categories of II (Ordinary) III (Important) and IV (Critical). The more important the building, the longer the return period of an event is the structure required to be designed for.
• These annual probabilities of exceedence correspond to a 10%, 5% and 2% probability within the nominal 50 year life of the building.
• The ability to resist actions from other hazards is specified in the Building Code (a regulation that accompanies the Building Act) but no acceptable intensity of action or recurrence interval is prescribed either in the Code or in the Loading Standard (except for snow which has a nominal annual probability of exceedence of 1/150 years).
• Sections 72 – 74 of the Building Act identify the process that Councils must follow when considering a building consent on a site subject to one or more natural hazards. The Building Act allows for Council to decline a building consent if, by granting the consent, the development would worsen or accelerate the effects from a natural hazard. Alternatively, building consent can be granted if:
i. adequate provision has been or will be made to protect the land, building work, or other property from the natural hazard or hazards; or
ii. restore any damage to that land or other property as a result of the building work.
• The definition of natural hazards under the Building Act is limited and does not include tsunami or fault rupture.
CDEM Act 2002 • 4R philosophy – risk reduction is assumed to be managed under the RMA (MCDEM, 2008a; Saunders, et al., 2007).
• Encourage and enable communities to achieve acceptable levels of risk (which are not defined).
• Readiness and response driven, e.g., guidance for tsunami evacuation planning, mapping, and signage (MCDEM, 2008b, 2008c).
GNS Science Report 2015/005 81
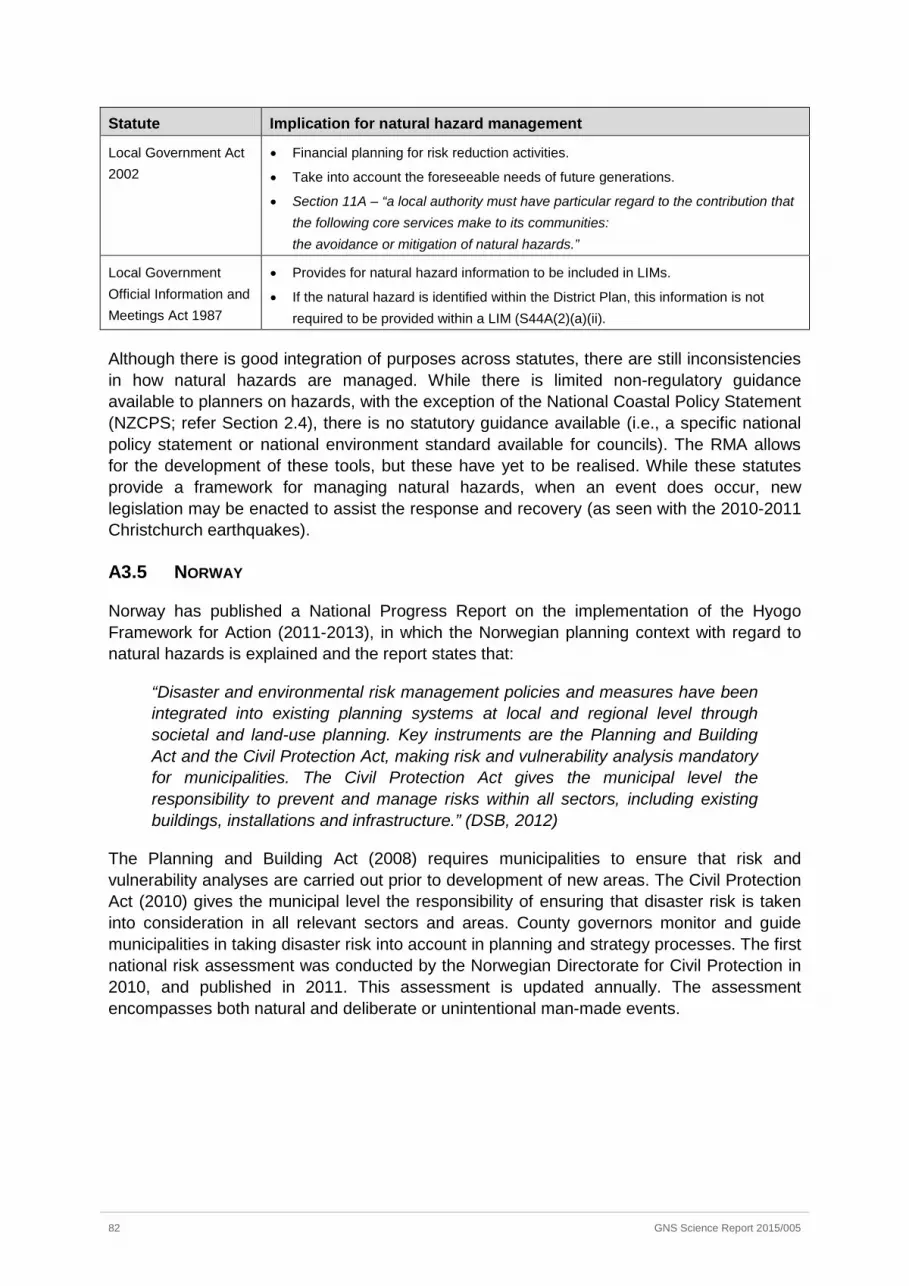
Statute Implication for natural hazard management
Local Government Act 2002
• Financial planning for risk reduction activities.
• Take into account the foreseeable needs of future generations.
• Section 11A – “a local authority must have particular regard to the contribution that the following core services make to its communities: the avoidance or mitigation of natural hazards.”
Local Government Official Information and Meetings Act 1987
• Provides for natural hazard information to be included in LIMs.
• If the natural hazard is identified within the District Plan, this information is not required to be provided within a LIM (S44A(2)(a)(ii).
Although there is good integration of purposes across statutes, there are still inconsistencies in how natural hazards are managed. While there is limited non-regulatory guidance available to planners on hazards, with the exception of the National Coastal Policy Statement (NZCPS; refer Section 2.4), there is no statutory guidance available (i.e., a specific national policy statement or national environment standard available for councils). The RMA allows for the development of these tools, but these have yet to be realised. While these statutes provide a framework for managing natural hazards, when an event does occur, new legislation may be enacted to assist the response and recovery (as seen with the 2010-2011 Christchurch earthquakes).
A3.5 NORWAY
Norway has published a National Progress Report on the implementation of the Hyogo Framework for Action (2011-2013), in which the Norwegian planning context with regard to natural hazards is explained and the report states that:
“Disaster and environmental risk management policies and measures have been integrated into existing planning systems at local and regional level through societal and land-use planning. Key instruments are the Planning and Building Act and the Civil Protection Act, making risk and vulnerability analysis mandatory for municipalities. The Civil Protection Act gives the municipal level the responsibility to prevent and manage risks within all sectors, including existing buildings, installations and infrastructure.” (DSB, 2012)
The Planning and Building Act (2008) requires municipalities to ensure that risk and vulnerability analyses are carried out prior to development of new areas. The Civil Protection Act (2010) gives the municipal level the responsibility of ensuring that disaster risk is taken into consideration in all relevant sectors and areas. County governors monitor and guide municipalities in taking disaster risk into account in planning and strategy processes. The first national risk assessment was conducted by the Norwegian Directorate for Civil Protection in 2010, and published in 2011. This assessment is updated annually. The assessment encompasses both natural and deliberate or unintentional man-made events.
82 GNS Science Report 2015/005
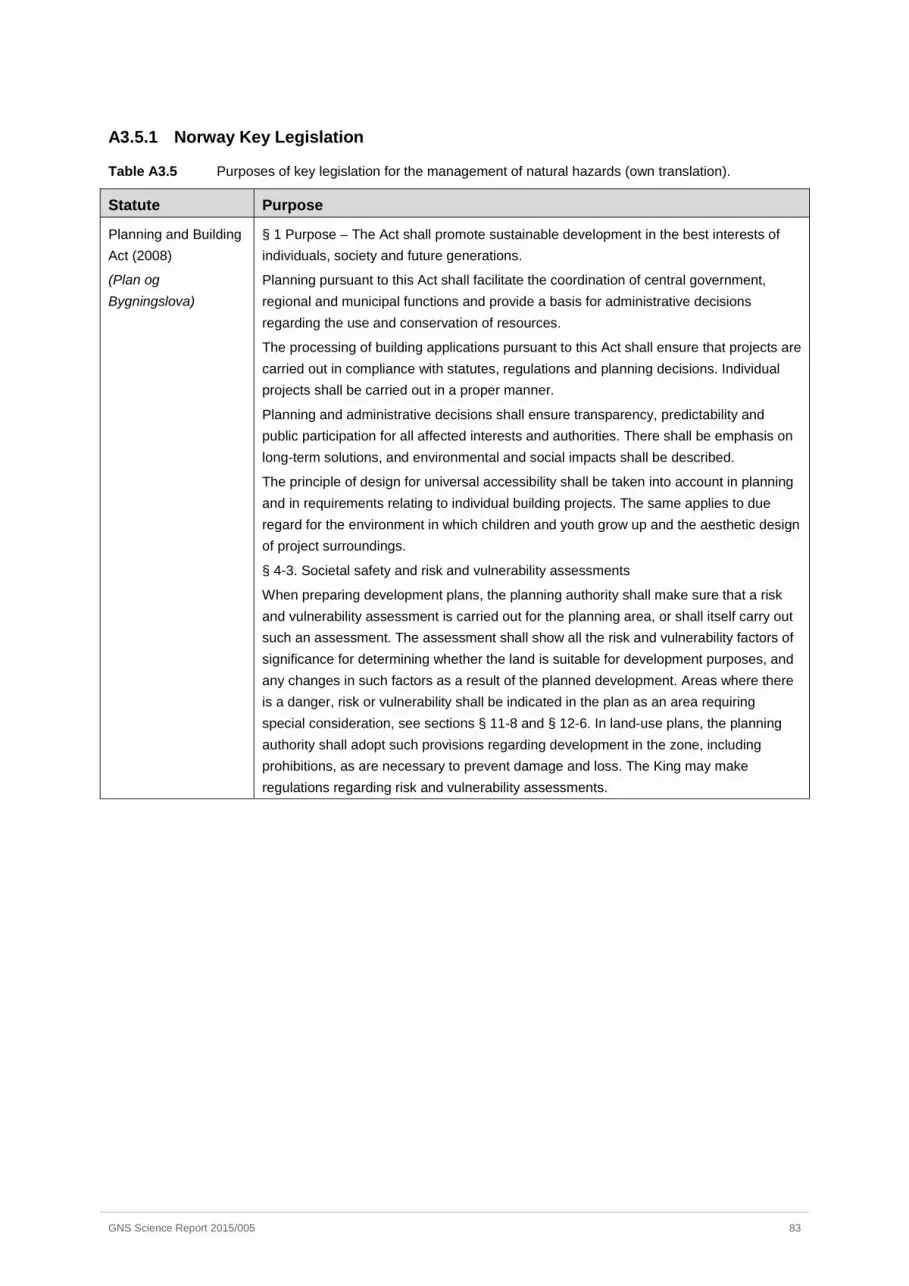
A3.5.1 Norway Key Legislation
Table A3.5 Purposes of key legislation for the management of natural hazards (own translation).
Statute Purpose
Planning and Building Act (2008)
(Plan og Bygningslova)
§ 1 Purpose – The Act shall promote sustainable development in the best interests of individuals, society and future generations.
Planning pursuant to this Act shall facilitate the coordination of central government, regional and municipal functions and provide a basis for administrative decisions regarding the use and conservation of resources.
The processing of building applications pursuant to this Act shall ensure that projects are carried out in compliance with statutes, regulations and planning decisions. Individual projects shall be carried out in a proper manner.
Planning and administrative decisions shall ensure transparency, predictability and public participation for all affected interests and authorities. There shall be emphasis on long-term solutions, and environmental and social impacts shall be described.
The principle of design for universal accessibility shall be taken into account in planning and in requirements relating to individual building projects. The same applies to due regard for the environment in which children and youth grow up and the aesthetic design of project surroundings.
§ 4-3. Societal safety and risk and vulnerability assessments
When preparing development plans, the planning authority shall make sure that a risk and vulnerability assessment is carried out for the planning area, or shall itself carry out such an assessment. The assessment shall show all the risk and vulnerability factors of significance for determining whether the land is suitable for development purposes, and any changes in such factors as a result of the planned development. Areas where there is a danger, risk or vulnerability shall be indicated in the plan as an area requiring special consideration, see sections § 11-8 and § 12-6. In land-use plans, the planning authority shall adopt such provisions regarding development in the zone, including prohibitions, as are necessary to prevent damage and loss. The King may make regulations regarding risk and vulnerability assessments.
GNS Science Report 2015/005 83
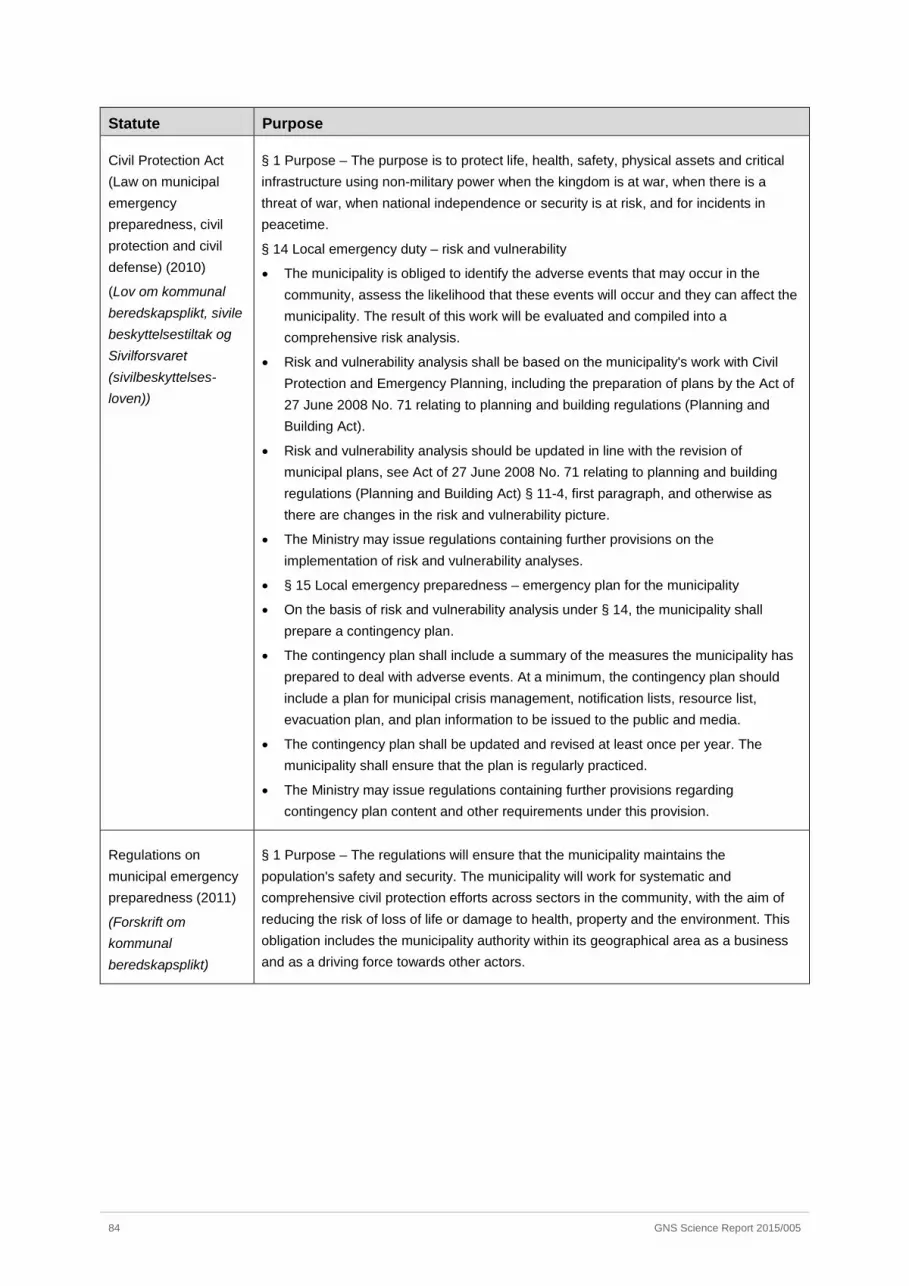
Statute Purpose
Civil Protection Act (Law on municipal emergency preparedness, civil protection and civil defense) (2010)
(Lov om kommunal beredskapsplikt, sivile beskyttelsestiltak og Sivilforsvaret (sivilbeskyttelses-loven))
§ 1 Purpose – The purpose is to protect life, health, safety, physical assets and critical infrastructure using non-military power when the kingdom is at war, when there is a threat of war, when national independence or security is at risk, and for incidents in peacetime.
§ 14 Local emergency duty – risk and vulnerability
• The municipality is obliged to identify the adverse events that may occur in the community, assess the likelihood that these events will occur and they can affect the municipality. The result of this work will be evaluated and compiled into a comprehensive risk analysis.
• Risk and vulnerability analysis shall be based on the municipality's work with Civil Protection and Emergency Planning, including the preparation of plans by the Act of 27 June 2008 No. 71 relating to planning and building regulations (Planning and Building Act).
• Risk and vulnerability analysis should be updated in line with the revision of municipal plans, see Act of 27 June 2008 No. 71 relating to planning and building regulations (Planning and Building Act) § 11-4, first paragraph, and otherwise as there are changes in the risk and vulnerability picture.
• The Ministry may issue regulations containing further provisions on the implementation of risk and vulnerability analyses.
• § 15 Local emergency preparedness – emergency plan for the municipality
• On the basis of risk and vulnerability analysis under § 14, the municipality shall prepare a contingency plan.
• The contingency plan shall include a summary of the measures the municipality has prepared to deal with adverse events. At a minimum, the contingency plan should include a plan for municipal crisis management, notification lists, resource list, evacuation plan, and plan information to be issued to the public and media.
• The contingency plan shall be updated and revised at least once per year. The municipality shall ensure that the plan is regularly practiced.
• The Ministry may issue regulations containing further provisions regarding contingency plan content and other requirements under this provision.
Regulations on municipal emergency preparedness (2011)
(Forskrift om kommunal beredskapsplikt)
§ 1 Purpose – The regulations will ensure that the municipality maintains the population's safety and security. The municipality will work for systematic and comprehensive civil protection efforts across sectors in the community, with the aim of reducing the risk of loss of life or damage to health, property and the environment. This obligation includes the municipality authority within its geographical area as a business and as a driving force towards other actors.
84 GNS Science Report 2015/005

Statute Purpose
Natural Perils Act – Law on protection against and compensation for natural disasters (Natural disasters Act) (1994 – adjustment in 2009)
(Naturskadeloven)
§ 4. By natural disaster damage is meant damage directly caused by a natural disaster such as landslides, storms, floods, storm surges, earthquakes, volcanic eruptions and the like. No compensation is paid for damage immediately caused by lightning, frost (frozen soil layers) or drought. The same applies to damage caused by attacks by animals, insects, bacteria, fungi or the like. Nor can it be claimed compensation from the fund for damage immediately due to precipitation or ice drift, but the fund's board may still provide full or partial replacement in special circumstances.
§ 20 The municipality is obliged to take precautions against natural hazards such as provided in the Planning and Building Act §§ 11.08 subsection A and 28-1, as well as by the essential safeguards.
A3.5.2 Local, Regional, National Level – Disaster Risk Reduction
In the National Risk Analysis, the Norwegian Directorate for Civil Protection (DSB) outlines the roles regarding hazard prevention and emergency preparedness in Norway. “The Norwegian Ministry of Petroleum and Energy has the public administrative responsibility for floods, landslides and avalanches, with the Norwegian Water Resources and Energy Directorate (NVE) as the operative authority. NVE assists municipalities and society in general with managing the challenges related to floods, landslides and avalanches through hazard surveys, guidance in land use planning, implementation of protective measures, monitoring and warning, as well as assistance during events” (DSB, 2013, p.60).
The National Risk Analysis (DSB, 2013) further outlines the general municipal emergency preparedness obligations, which entail that, “municipal authorities are to identify the disruptive events that might occur within their municipalities (following from the Civil Protection Act) and municipal authorities have the responsibility to prevent flooding and landslides and to protect the inhabitants from these (following from Planning and Building Act and the Natural Disasters Act).” The municipal authorities’ land use planning is a vital instrument in this work. NVE has drawn up guidelines that describe the way in which municipal authorities ought to identify and take into consideration the danger of flooding and landslides in their land use plans.
At the local (municipal), regional (county) and national level, multi-hazard analyses are considered an important tool for the planning process. At the national level, the National Risk Analysis is based on scenarios covering a range of natural events, major accidents (e.g., hazardous substances, maritime, nuclear, offshore accidents), and malicious acts (e.g., terrorism, security policy crises, cyberspace). County Governors are responsible for regional assessment, and following the Civil Protection Act, the municipal level is responsible for conducting risk and vulnerability analysis covering all relevant hazards.
The national progress report on the implementation of the Hyogo Framework for Action highlights specific challenges related to disaster risk reduction at the local level. For example because many municipalities in Norway are small, there is limited capacity available for planning, making it a challenge to provide planners and decision-makers with tools and examples to integrate disaster risk reduction in local land-use planning and municipal planning processes (DSB, 2012).
GNS Science Report 2015/005 85

A3.5.3 Local, Regional, National Level – Land use planning
In Norway, there are different laws and guidelines on land use planning at different levels. At the national level, there is the Planning and Building Act (Plan- og byningsloven). At the county level (fylkeskommune), there are the land use guidelines which are defined in the fylkesdelplan (Schulze, 2013). At a municipality level, there are the Kommuneplan and Kommunedelplan. The Planning and Building Act (2008) § 1-1 states the law’s objective: to encourage sustainable development by emphasizing long-term solutions. § 11-1 decrees that municipalities need to have a municipality plan (kommuneplan) which describes the municipality’s goals and how to achieve them (handlingsdel) and contains a map showing the areas zoned for different purposes (arealdel). The kommuneplan’s objective is to enforce municipal, regional and national goals. It needs to include all important aims and tasks in the municipality during a planning period (Miljøverndepartementet, 2012).
A3.5.4 Risk and Vulnerability Assessments
In 2014 the Norwegian Directorate for Civil Protection conducted a municipality survey in which they focused on the Risk and Vulnerability Assessments (RVA) that are being conducted by municipalities. These assessments were introduced as an important tool in municipal safety and contingency work. The statutory requirement for Risk and Vulnerability Assessments in land-use planning came with the adoption of the Planning and Building Act in 2008 (Junker, 2015) and the municipal responsibility for emergency preparedness followed from the Law on municipal emergency preparedness, civil protection and civil defence. A holistic risk and vulnerability analysis is a vital part of this work and aims to create visibility and awareness of risks and vulnerabilities in the municipality. It forms the basis for the municipalities’ long term goals, strategies and measures related to civil protection and emergency.
The municipal survey shows that an increasing number of Norwegian municipalities have completed a comprehensive Risk and Vulnerability Assessment. However, the study also considered the actual implementation of the assessments and states that while 85 percent of Norwegian municipalities indicate that they have completed a risk and vulnerability assessment, only 36 percent meet all regulatory requirements that are set for such an analysis and implementation (DSB, 2014b).
A3.5.5 Climate Change
Another survey conducted by the Norwegian Directorate for Civil Protection from 2011focused on climate change and indicated that 4 out of 10, about half of the municipalities, had assessed climate change threats to some extent (DSB, 2011). Observation from the more recent National Risk Analysis of 2013 state that in the context of civil protection and preparedness “Climate change increases the potential for more extreme weather, and it will create new challenges for work in civil protection and preparedness at the local, regional and national levels.“ (DSB, 2013). In the plans analysed for this study, it is observed that natural hazards are often mentioned in a climate change context.
86 GNS Science Report 2015/005

A4.0 CODING PROTOCOL
GNS Science Report 2015/005 87

This page is intentionally left blank.

Quest Category Abbreviation Question Coding Comments Coder Comments
Q1 Demographic details Document What type of plan is it? 1 – District/City; 2 – RPS; 3 – Unitary; 4 – CDEM Group
Some regional plans may be combined with the RPS. We are just looking at RPS, not regional plans.
Q2 Date What date the plan became operative Date This is the date the plan or relevant part of the plan became operative. We are only looking at operative plans, not proposed plans.
If the plan is partially operative details are made in the comments section on what is operative and not.
Q3 Proposed Is there a proposed plan? 1 – yes; 2 – no
Q4 Reference What is the bibliographic reference for the plan Name of plan
Q5 Vision Sustainability Does the plan discuss/address the need for sustainability in a hazard context?
1 – yes; 2 – no Must be within the plan itself i.e., not the 'forward' section
CCC plan addresses sustainability of water supply given the risk from land use contamination – have currently included this as a hazards context,
Q6 Resilience Does the plan discuss/address resilience to hazards and/or disasters?
1 – yes; 2 – no Must be within the plan itself i.e., not the 'forward' section
Q7 Reduction Does the plan discuss/address risk reduction and/or mitigation?
1 – yes for risk reduction; 2 – yes for mitigation; 3 – yes for both; 4 – no.
Q8 Readiness Does the plan discuss/address readiness? 1 – yes; 2 – no
Q9 Response Does the plan discuss/address response? 1 – yes; 2 – no
Q10 Recovery Does the plan discuss/address recovery? 1 – yes; 2 – no
Q11 Fact Base Definition Does the plan include a definition of a natural hazard? 1 – yes; 2 – no
Q 11a Chapter Is there a specific hazard chapter/section 1– yes; 2 – no Have not said no if there are multiple hazard sections as this is much more disjointed...i.e., If issues are separate from objectives which are separate from rules etc.
Q12 Hazards Does the plan state the relevant hazards posing a risk to the area?
1 – yes; 2 – no
Q13 Location Does the plan describe the location and boundaries of hazardous areas?
1 – yes; 2 – no For broad locations (i.e., CCC plan states that eastern suburbs will suffer from liquefaction) if describes the location but not the boundaries have treated this as a yes
Q14 Magnitude Describe the magnitude of a potential hazards (i.e., intensity and/or duration)?
1 – yes; 2 – no Can be both qualitative and quantitative comments.
Q15 History Information on previous occurrences? (hazard history) 1 – yes; 2 – no Years of previous events etc.
Q16 Characteristics Description/analysis of separate characteristics of the hazard?
1 – yes; 2 – no More than just listing the hazard.
Q17 EQ Does the plan include specific information on earthquake?
1 – yes; 2 – no
Q18 Tsunami Does the plan include specific information on tsunami? 1 – yes; 2 – no
Q19 Landslide Does the plan include specific information on landslides?
1 – yes; 2 – no Can be called a number of things – land instability, land slip, soil erosion, slippage, tunnel gully erosion unstable land etc.
Q20 Volcanoes Does the plan include specific information on volcanoes?
1 – yes; 2 – no Key search words – include lahar, ash, bomb, eruption, volcanic.
GNS Science Report 2015/005 89
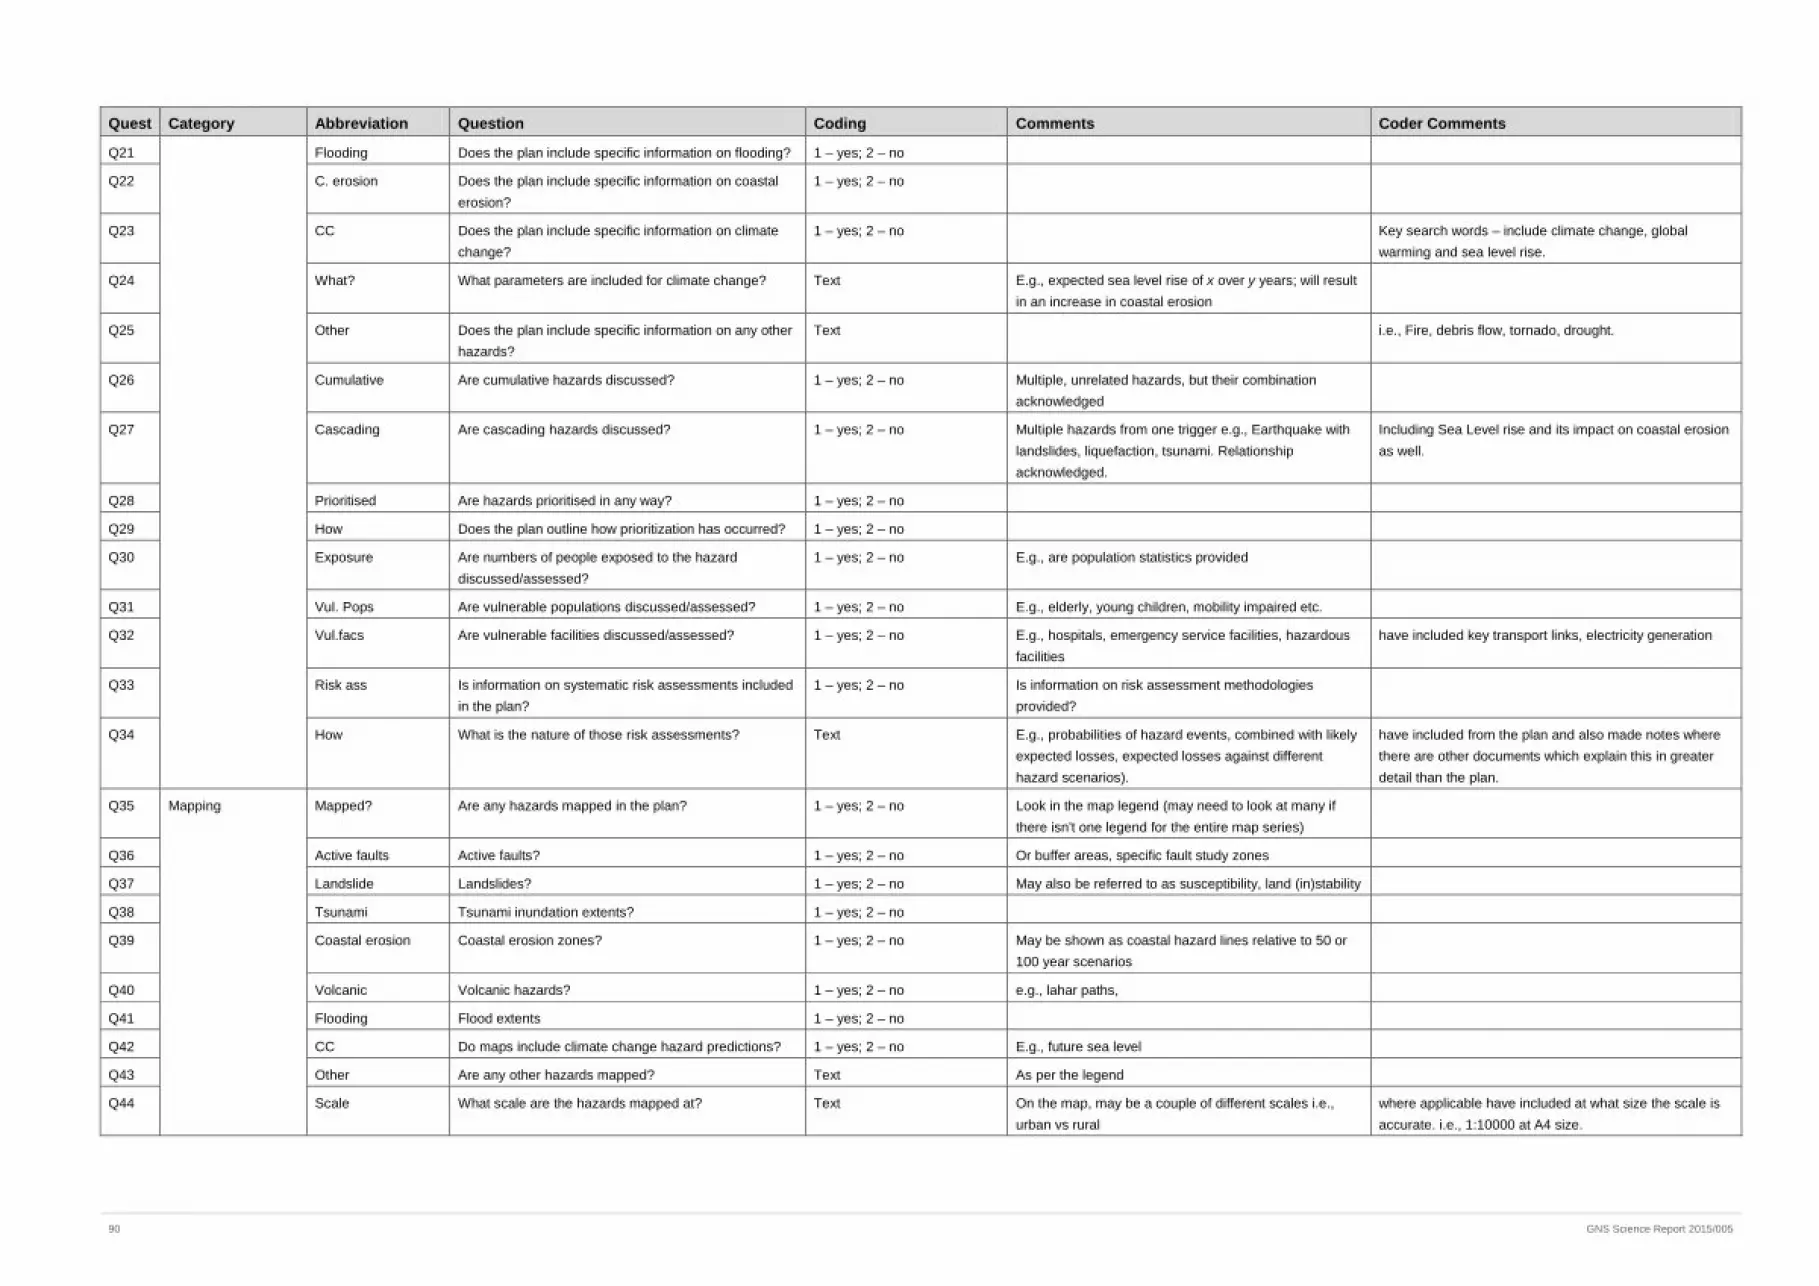
Quest Category Abbreviation Question Coding Comments Coder Comments
Q21 Flooding Does the plan include specific information on flooding? 1 – yes; 2 – no
Q22 C. erosion Does the plan include specific information on coastal erosion?
1 – yes; 2 – no
Q23 CC Does the plan include specific information on climate change?
1 – yes; 2 – no Key search words – include climate change, global warming and sea level rise.
Q24 What? What parameters are included for climate change? Text E.g., expected sea level rise of x over y years; will result in an increase in coastal erosion
Q25 Other Does the plan include specific information on any other hazards?
Text i.e., Fire, debris flow, tornado, drought.
Q26 Cumulative Are cumulative hazards discussed? 1 – yes; 2 – no Multiple, unrelated hazards, but their combination acknowledged
Q27 Cascading Are cascading hazards discussed? 1 – yes; 2 – no Multiple hazards from one trigger e.g., Earthquake with landslides, liquefaction, tsunami. Relationship acknowledged.
Including Sea Level rise and its impact on coastal erosion as well.
Q28 Prioritised Are hazards prioritised in any way? 1 – yes; 2 – no
Q29 How Does the plan outline how prioritization has occurred? 1 – yes; 2 – no
Q30 Exposure Are numbers of people exposed to the hazard discussed/assessed?
1 – yes; 2 – no E.g., are population statistics provided
Q31 Vul. Pops Are vulnerable populations discussed/assessed? 1 – yes; 2 – no E.g., elderly, young children, mobility impaired etc.
Q32 Vul.facs Are vulnerable facilities discussed/assessed? 1 – yes; 2 – no E.g., hospitals, emergency service facilities, hazardous facilities
have included key transport links, electricity generation
Q33 Risk ass Is information on systematic risk assessments included in the plan?
1 – yes; 2 – no Is information on risk assessment methodologies provided?
Q34 How What is the nature of those risk assessments? Text E.g., probabilities of hazard events, combined with likely expected losses, expected losses against different hazard scenarios).
have included from the plan and also made notes where there are other documents which explain this in greater detail than the plan.
Q35 Mapping Mapped? Are any hazards mapped in the plan? 1 – yes; 2 – no Look in the map legend (may need to look at many if there isn't one legend for the entire map series)
Q36 Active faults Active faults? 1 – yes; 2 – no Or buffer areas, specific fault study zones
Q37 Landslide Landslides? 1 – yes; 2 – no May also be referred to as susceptibility, land (in)stability
Q38 Tsunami Tsunami inundation extents? 1 – yes; 2 – no
Q39 Coastal erosion Coastal erosion zones? 1 – yes; 2 – no May be shown as coastal hazard lines relative to 50 or 100 year scenarios
Q40 Volcanic Volcanic hazards? 1 – yes; 2 – no e.g., lahar paths,
Q41 Flooding Flood extents 1 – yes; 2 – no
Q42 CC Do maps include climate change hazard predictions? 1 – yes; 2 – no E.g., future sea level
Q43 Other Are any other hazards mapped? Text As per the legend
Q44 Scale What scale are the hazards mapped at? Text On the map, may be a couple of different scales i.e., urban vs rural
where applicable have included at what size the scale is accurate. i.e., 1:10000 at A4 size.
90 GNS Science Report 2015/005
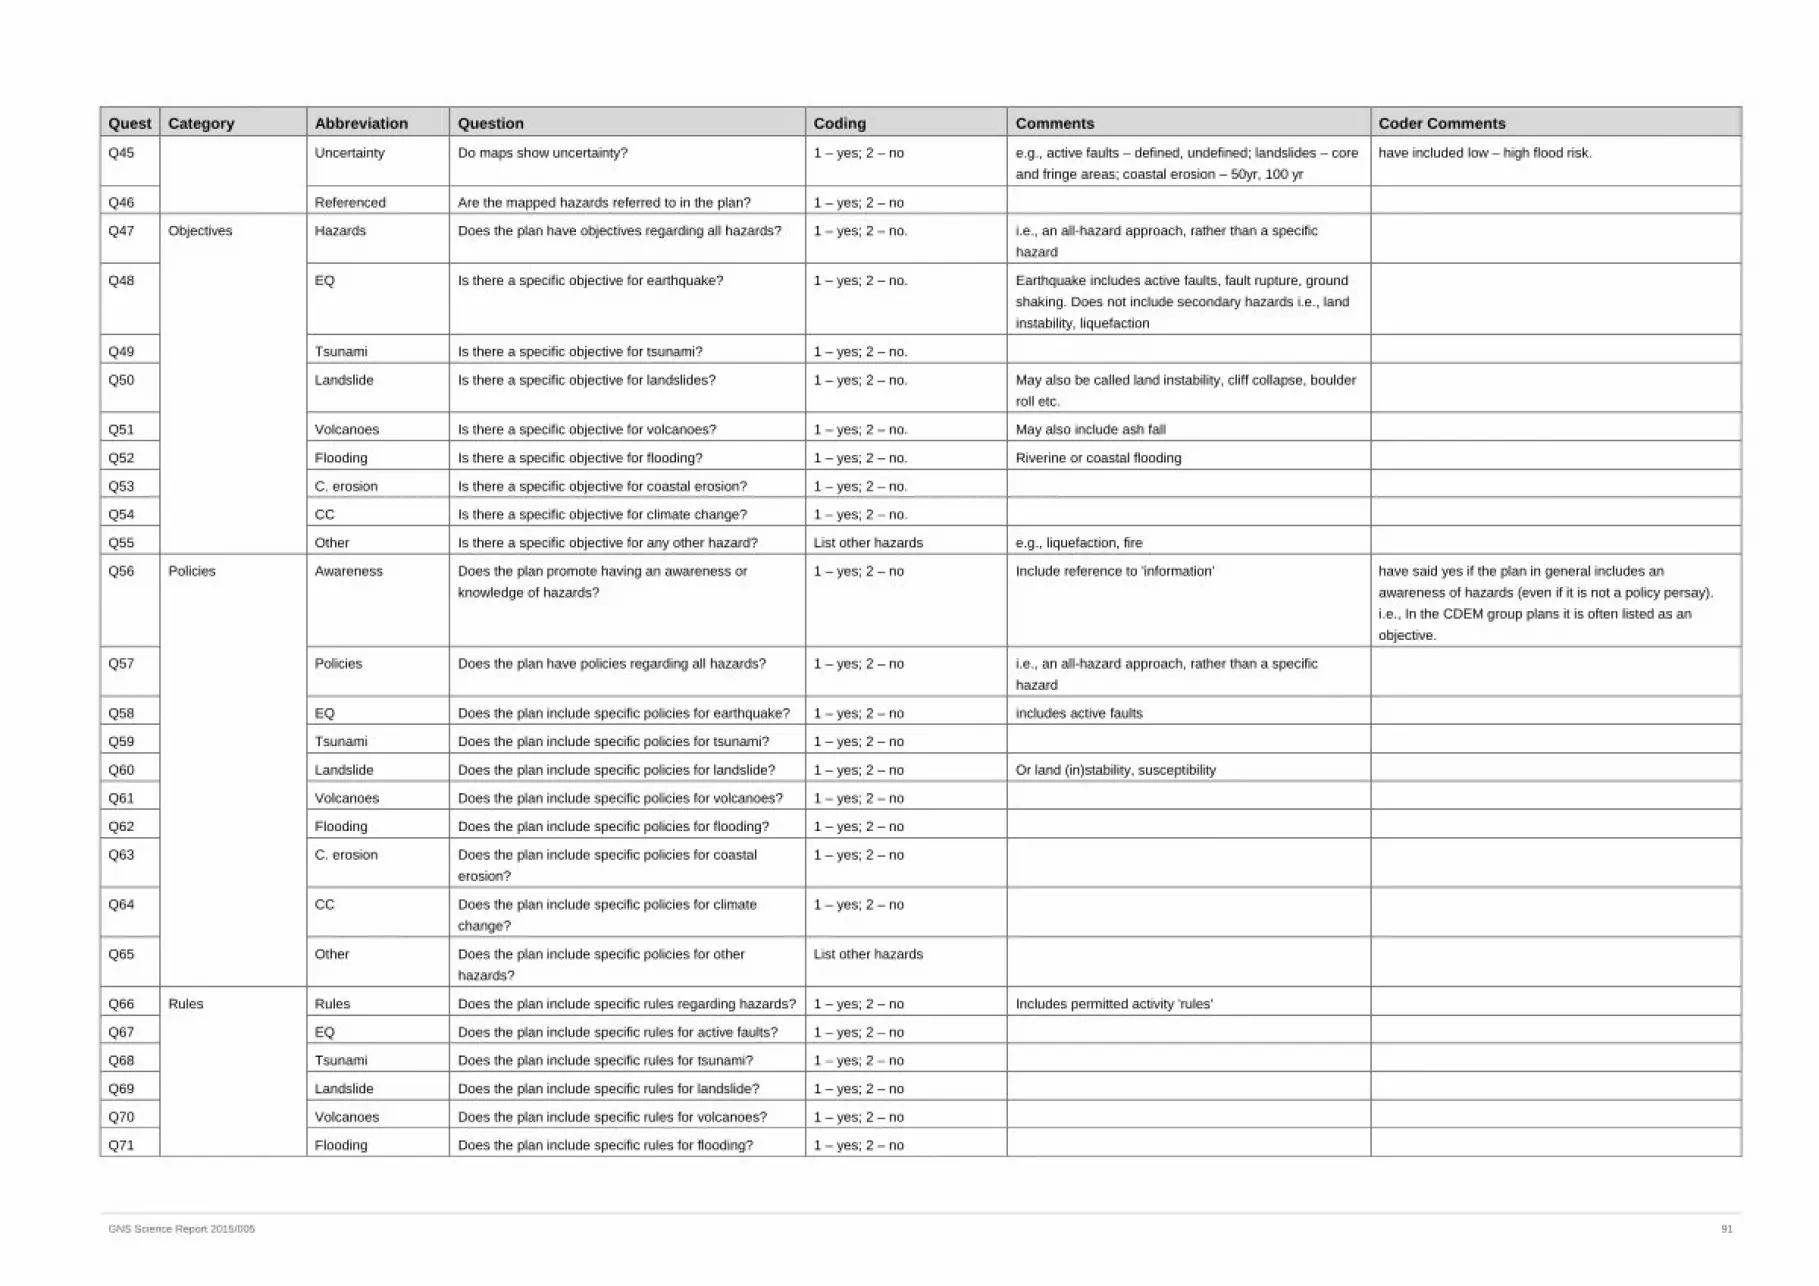
Quest Category Abbreviation Question Coding Comments Coder Comments
Q45 Uncertainty Do maps show uncertainty? 1 – yes; 2 – no e.g., active faults – defined, undefined; landslides – core and fringe areas; coastal erosion – 50yr, 100 yr
have included low – high flood risk.
Q46 Referenced Are the mapped hazards referred to in the plan? 1 – yes; 2 – no
Q47 Objectives Hazards Does the plan have objectives regarding all hazards? 1 – yes; 2 – no. i.e., an all-hazard approach, rather than a specific hazard
Q48 EQ Is there a specific objective for earthquake? 1 – yes; 2 – no. Earthquake includes active faults, fault rupture, ground shaking. Does not include secondary hazards i.e., land instability, liquefaction
Q49 Tsunami Is there a specific objective for tsunami? 1 – yes; 2 – no.
Q50 Landslide Is there a specific objective for landslides? 1 – yes; 2 – no. May also be called land instability, cliff collapse, boulder roll etc.
Q51 Volcanoes Is there a specific objective for volcanoes? 1 – yes; 2 – no. May also include ash fall
Q52 Flooding Is there a specific objective for flooding? 1 – yes; 2 – no. Riverine or coastal flooding
Q53 C. erosion Is there a specific objective for coastal erosion? 1 – yes; 2 – no.
Q54 CC Is there a specific objective for climate change? 1 – yes; 2 – no.
Q55 Other Is there a specific objective for any other hazard? List other hazards e.g., liquefaction, fire
Q56 Policies Awareness Does the plan promote having an awareness or knowledge of hazards?
1 – yes; 2 – no Include reference to 'information' have said yes if the plan in general includes an awareness of hazards (even if it is not a policy persay). i.e., In the CDEM group plans it is often listed as an objective.
Q57 Policies Does the plan have policies regarding all hazards? 1 – yes; 2 – no i.e., an all-hazard approach, rather than a specific hazard
Q58 EQ Does the plan include specific policies for earthquake? 1 – yes; 2 – no includes active faults
Q59 Tsunami Does the plan include specific policies for tsunami? 1 – yes; 2 – no
Q60 Landslide Does the plan include specific policies for landslide? 1 – yes; 2 – no Or land (in)stability, susceptibility
Q61 Volcanoes Does the plan include specific policies for volcanoes? 1 – yes; 2 – no
Q62 Flooding Does the plan include specific policies for flooding? 1 – yes; 2 – no
Q63 C. erosion Does the plan include specific policies for coastal erosion?
1 – yes; 2 – no
Q64 CC Does the plan include specific policies for climate change?
1 – yes; 2 – no
Q65 Other Does the plan include specific policies for other hazards?
List other hazards
Q66 Rules Rules Does the plan include specific rules regarding hazards? 1 – yes; 2 – no Includes permitted activity 'rules'
Q67 EQ Does the plan include specific rules for active faults? 1 – yes; 2 – no
Q68 Tsunami Does the plan include specific rules for tsunami? 1 – yes; 2 – no
Q69 Landslide Does the plan include specific rules for landslide? 1 – yes; 2 – no
Q70 Volcanoes Does the plan include specific rules for volcanoes? 1 – yes; 2 – no
Q71 Flooding Does the plan include specific rules for flooding? 1 – yes; 2 – no
GNS Science Report 2015/005 91
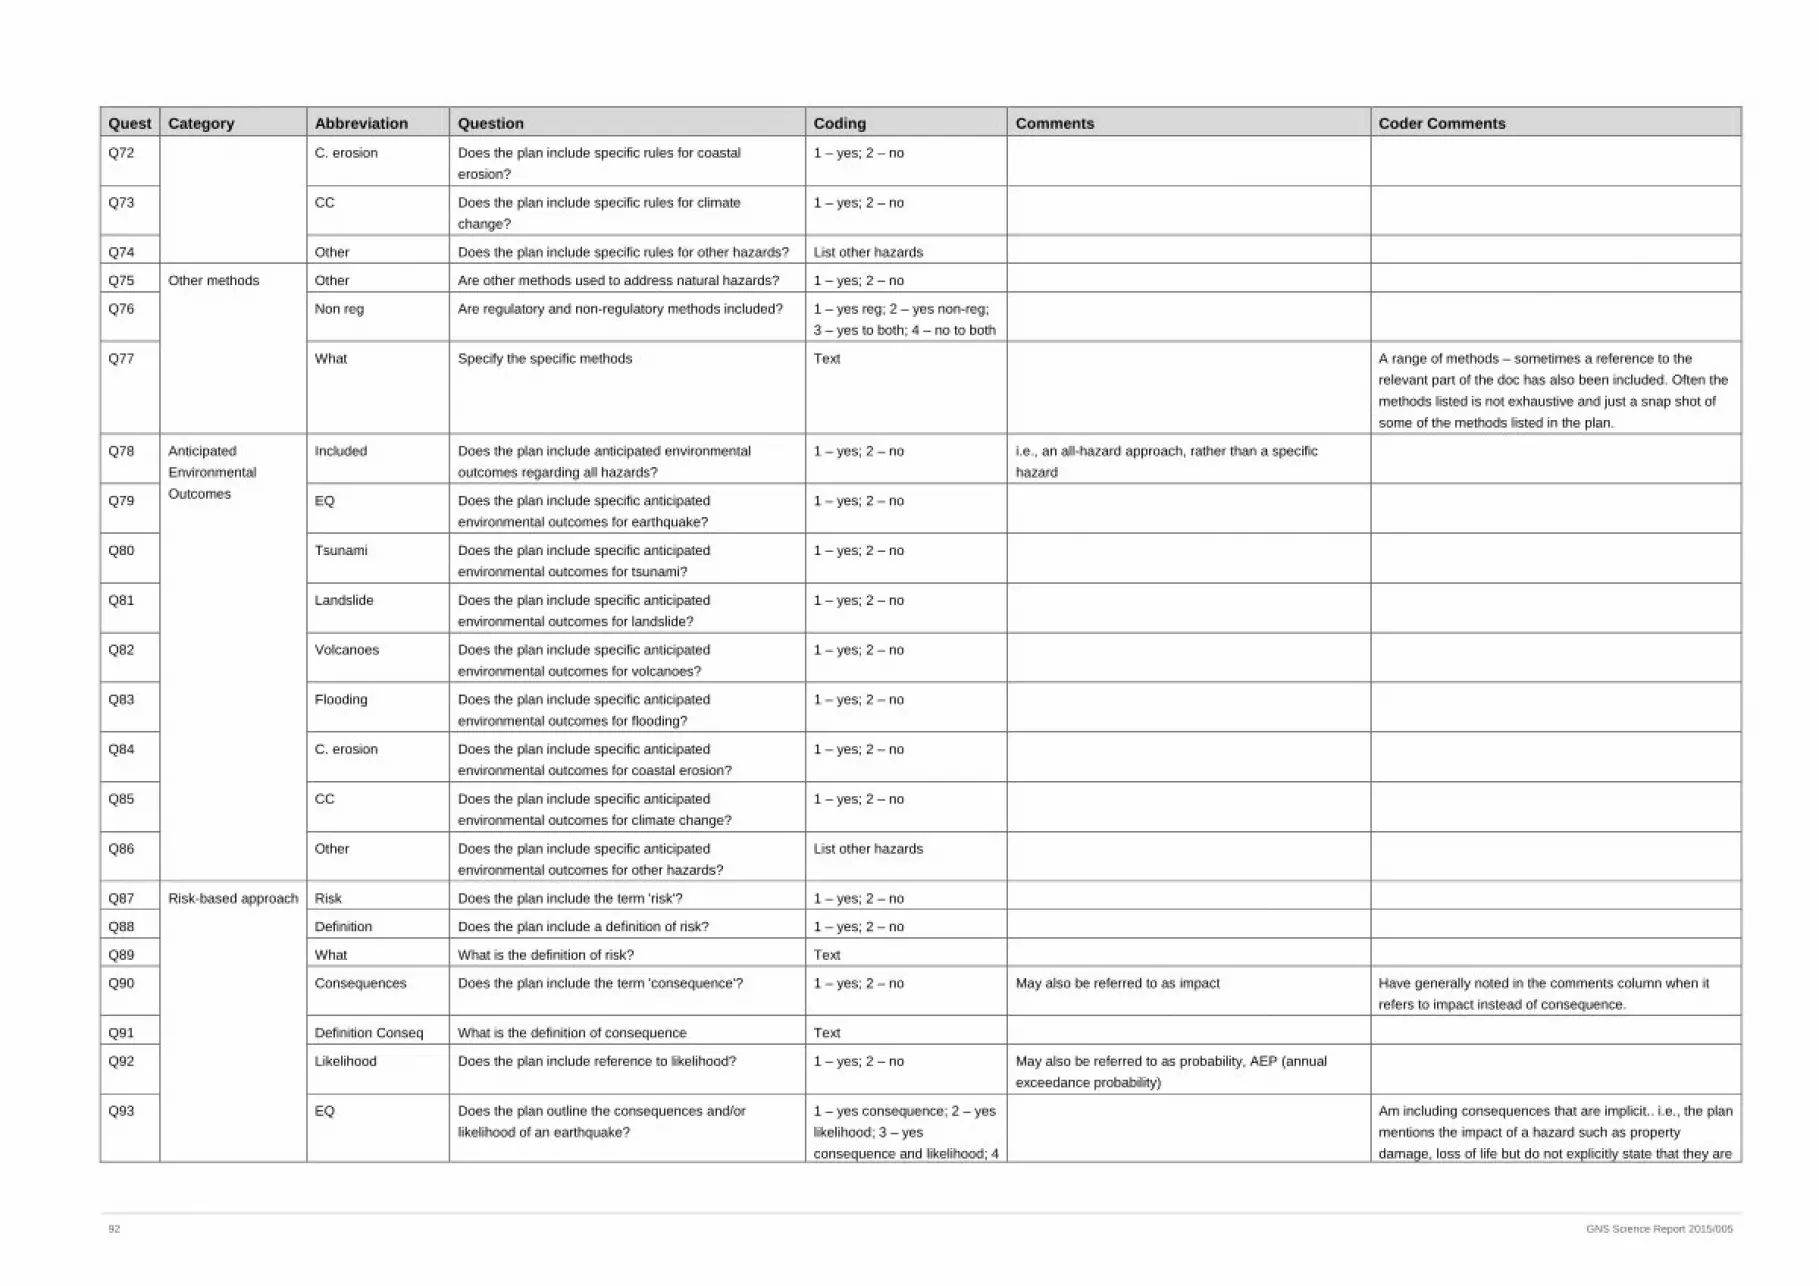
Quest Category Abbreviation Question Coding Comments Coder Comments
Q72 C. erosion Does the plan include specific rules for coastal erosion?
1 – yes; 2 – no
Q73 CC Does the plan include specific rules for climate change?
1 – yes; 2 – no
Q74 Other Does the plan include specific rules for other hazards? List other hazards
Q75 Other methods Other Are other methods used to address natural hazards? 1 – yes; 2 – no
Q76 Non reg Are regulatory and non-regulatory methods included? 1 – yes reg; 2 – yes non-reg; 3 – yes to both; 4 – no to both
Q77 What Specify the specific methods Text A range of methods – sometimes a reference to the relevant part of the doc has also been included. Often the methods listed is not exhaustive and just a snap shot of some of the methods listed in the plan.
Q78 Anticipated Environmental Outcomes
Included Does the plan include anticipated environmental outcomes regarding all hazards?
1 – yes; 2 – no i.e., an all-hazard approach, rather than a specific hazard
Q79 EQ Does the plan include specific anticipated environmental outcomes for earthquake?
1 – yes; 2 – no
Q80 Tsunami Does the plan include specific anticipated environmental outcomes for tsunami?
1 – yes; 2 – no
Q81 Landslide Does the plan include specific anticipated environmental outcomes for landslide?
1 – yes; 2 – no
Q82 Volcanoes Does the plan include specific anticipated environmental outcomes for volcanoes?
1 – yes; 2 – no
Q83 Flooding Does the plan include specific anticipated environmental outcomes for flooding?
1 – yes; 2 – no
Q84 C. erosion Does the plan include specific anticipated environmental outcomes for coastal erosion?
1 – yes; 2 – no
Q85 CC Does the plan include specific anticipated environmental outcomes for climate change?
1 – yes; 2 – no
Q86 Other Does the plan include specific anticipated environmental outcomes for other hazards?
List other hazards
Q87 Risk-based approach Risk Does the plan include the term 'risk'? 1 – yes; 2 – no
Q88 Definition Does the plan include a definition of risk? 1 – yes; 2 – no
Q89 What What is the definition of risk? Text
Q90 Consequences Does the plan include the term 'consequence'? 1 – yes; 2 – no May also be referred to as impact Have generally noted in the comments column when it refers to impact instead of consequence.
Q91 Definition Conseq What is the definition of consequence Text
Q92 Likelihood Does the plan include reference to likelihood? 1 – yes; 2 – no May also be referred to as probability, AEP (annual exceedance probability)
Q93 EQ Does the plan outline the consequences and/or likelihood of an earthquake?
1 – yes consequence; 2 – yes likelihood; 3 – yes consequence and likelihood; 4
Am including consequences that are implicit.. i.e., the plan mentions the impact of a hazard such as property damage, loss of life but do not explicitly state that they are
92 GNS Science Report 2015/005
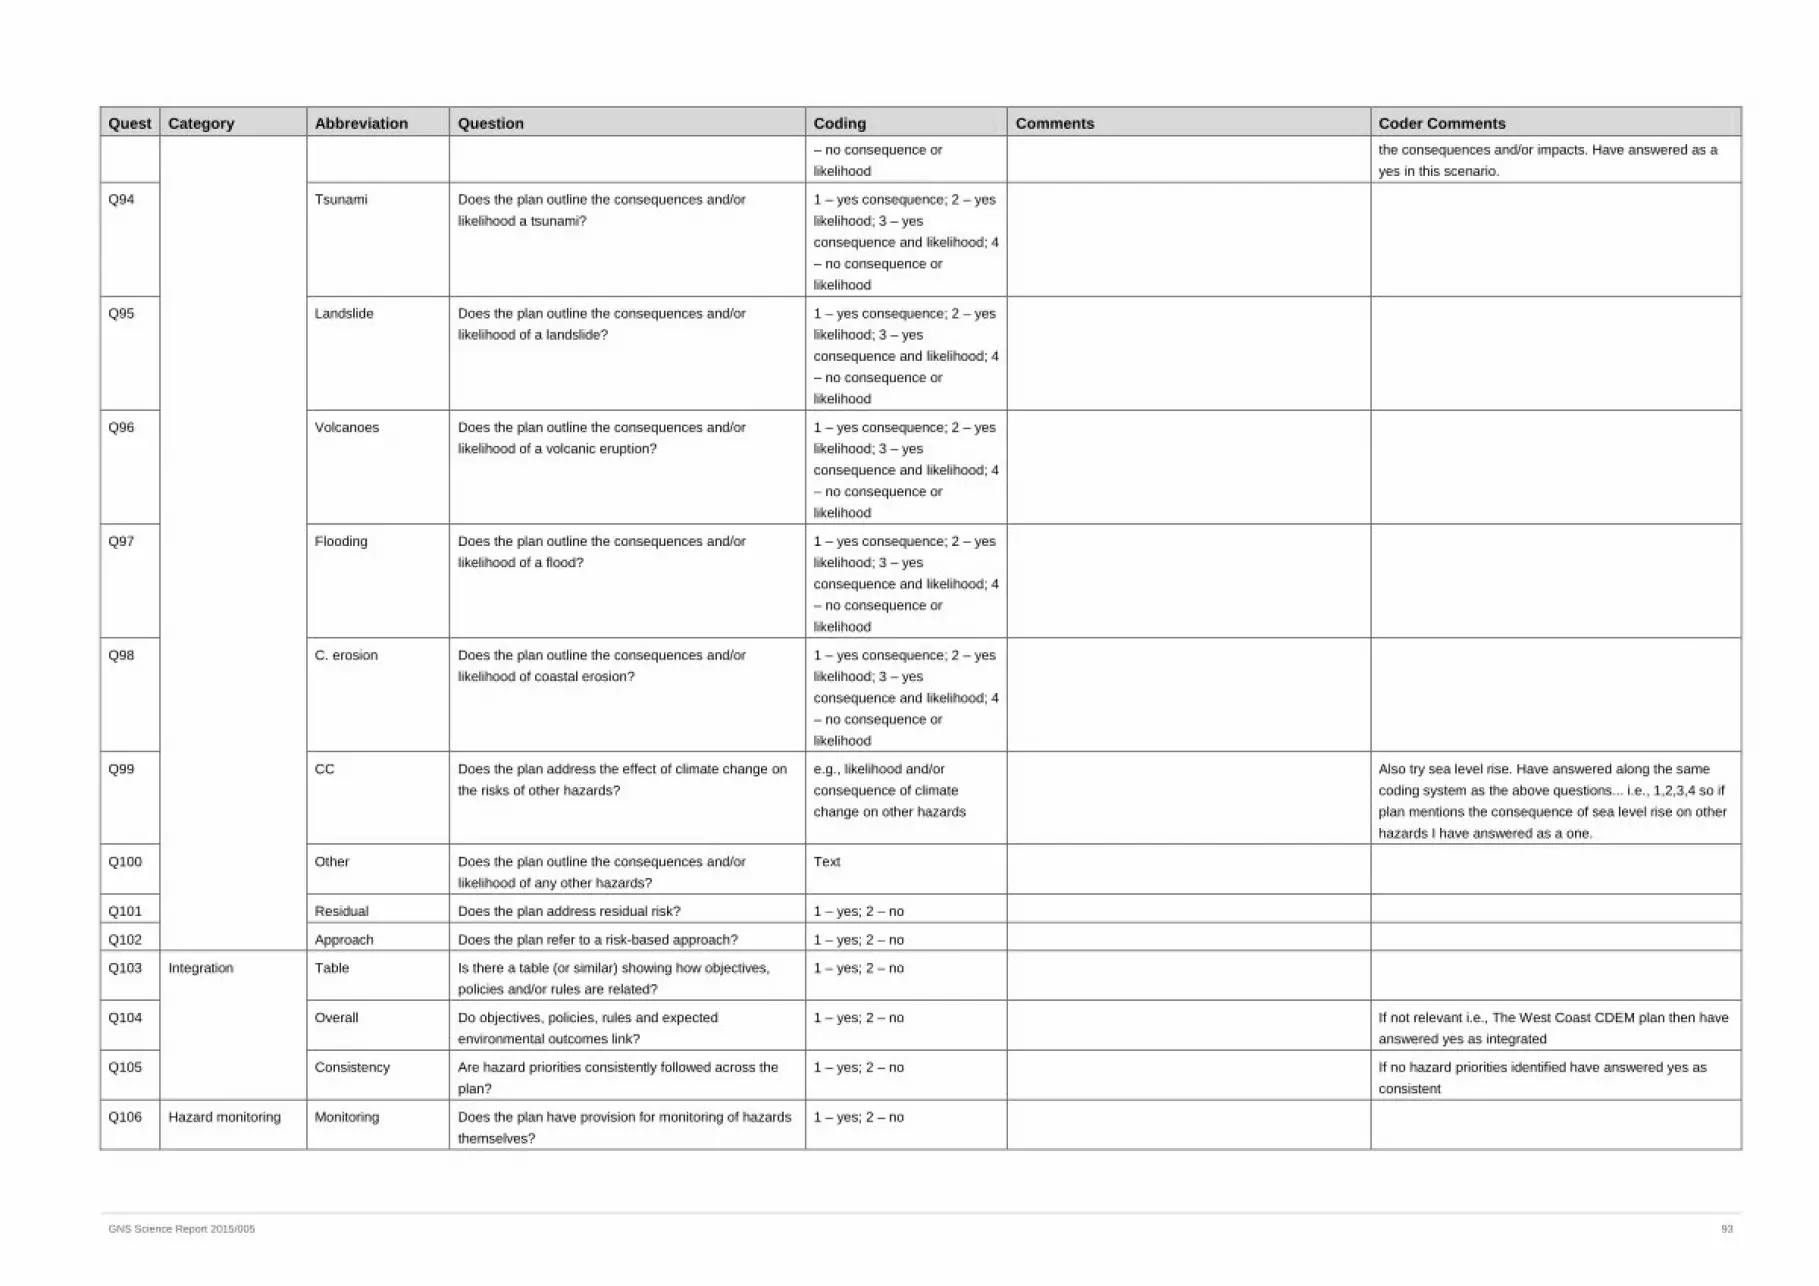
Quest Category Abbreviation Question Coding Comments Coder Comments – no consequence or likelihood
the consequences and/or impacts. Have answered as a yes in this scenario.
Q94 Tsunami Does the plan outline the consequences and/or likelihood a tsunami?
1 – yes consequence; 2 – yes likelihood; 3 – yes consequence and likelihood; 4 – no consequence or likelihood
Q95 Landslide Does the plan outline the consequences and/or likelihood of a landslide?
1 – yes consequence; 2 – yes likelihood; 3 – yes consequence and likelihood; 4 – no consequence or likelihood
Q96 Volcanoes Does the plan outline the consequences and/or likelihood of a volcanic eruption?
1 – yes consequence; 2 – yes likelihood; 3 – yes consequence and likelihood; 4 – no consequence or likelihood
Q97 Flooding Does the plan outline the consequences and/or likelihood of a flood?
1 – yes consequence; 2 – yes likelihood; 3 – yes consequence and likelihood; 4 – no consequence or likelihood
Q98 C. erosion Does the plan outline the consequences and/or likelihood of coastal erosion?
1 – yes consequence; 2 – yes likelihood; 3 – yes consequence and likelihood; 4 – no consequence or likelihood
Q99 CC Does the plan address the effect of climate change on the risks of other hazards?
e.g., likelihood and/or consequence of climate change on other hazards
Also try sea level rise. Have answered along the same coding system as the above questions... i.e., 1,2,3,4 so if plan mentions the consequence of sea level rise on other hazards I have answered as a one.
Q100 Other Does the plan outline the consequences and/or likelihood of any other hazards?
Text
Q101 Residual Does the plan address residual risk? 1 – yes; 2 – no
Q102 Approach Does the plan refer to a risk-based approach? 1 – yes; 2 – no
Q103 Integration Table Is there a table (or similar) showing how objectives, policies and/or rules are related?
1 – yes; 2 – no
Q104 Overall Do objectives, policies, rules and expected environmental outcomes link?
1 – yes; 2 – no If not relevant i.e., The West Coast CDEM plan then have answered yes as integrated
Q105 Consistency Are hazard priorities consistently followed across the plan?
1 – yes; 2 – no If no hazard priorities identified have answered yes as consistent
Q106 Hazard monitoring Monitoring Does the plan have provision for monitoring of hazards themselves?
1 – yes; 2 – no
GNS Science Report 2015/005 93
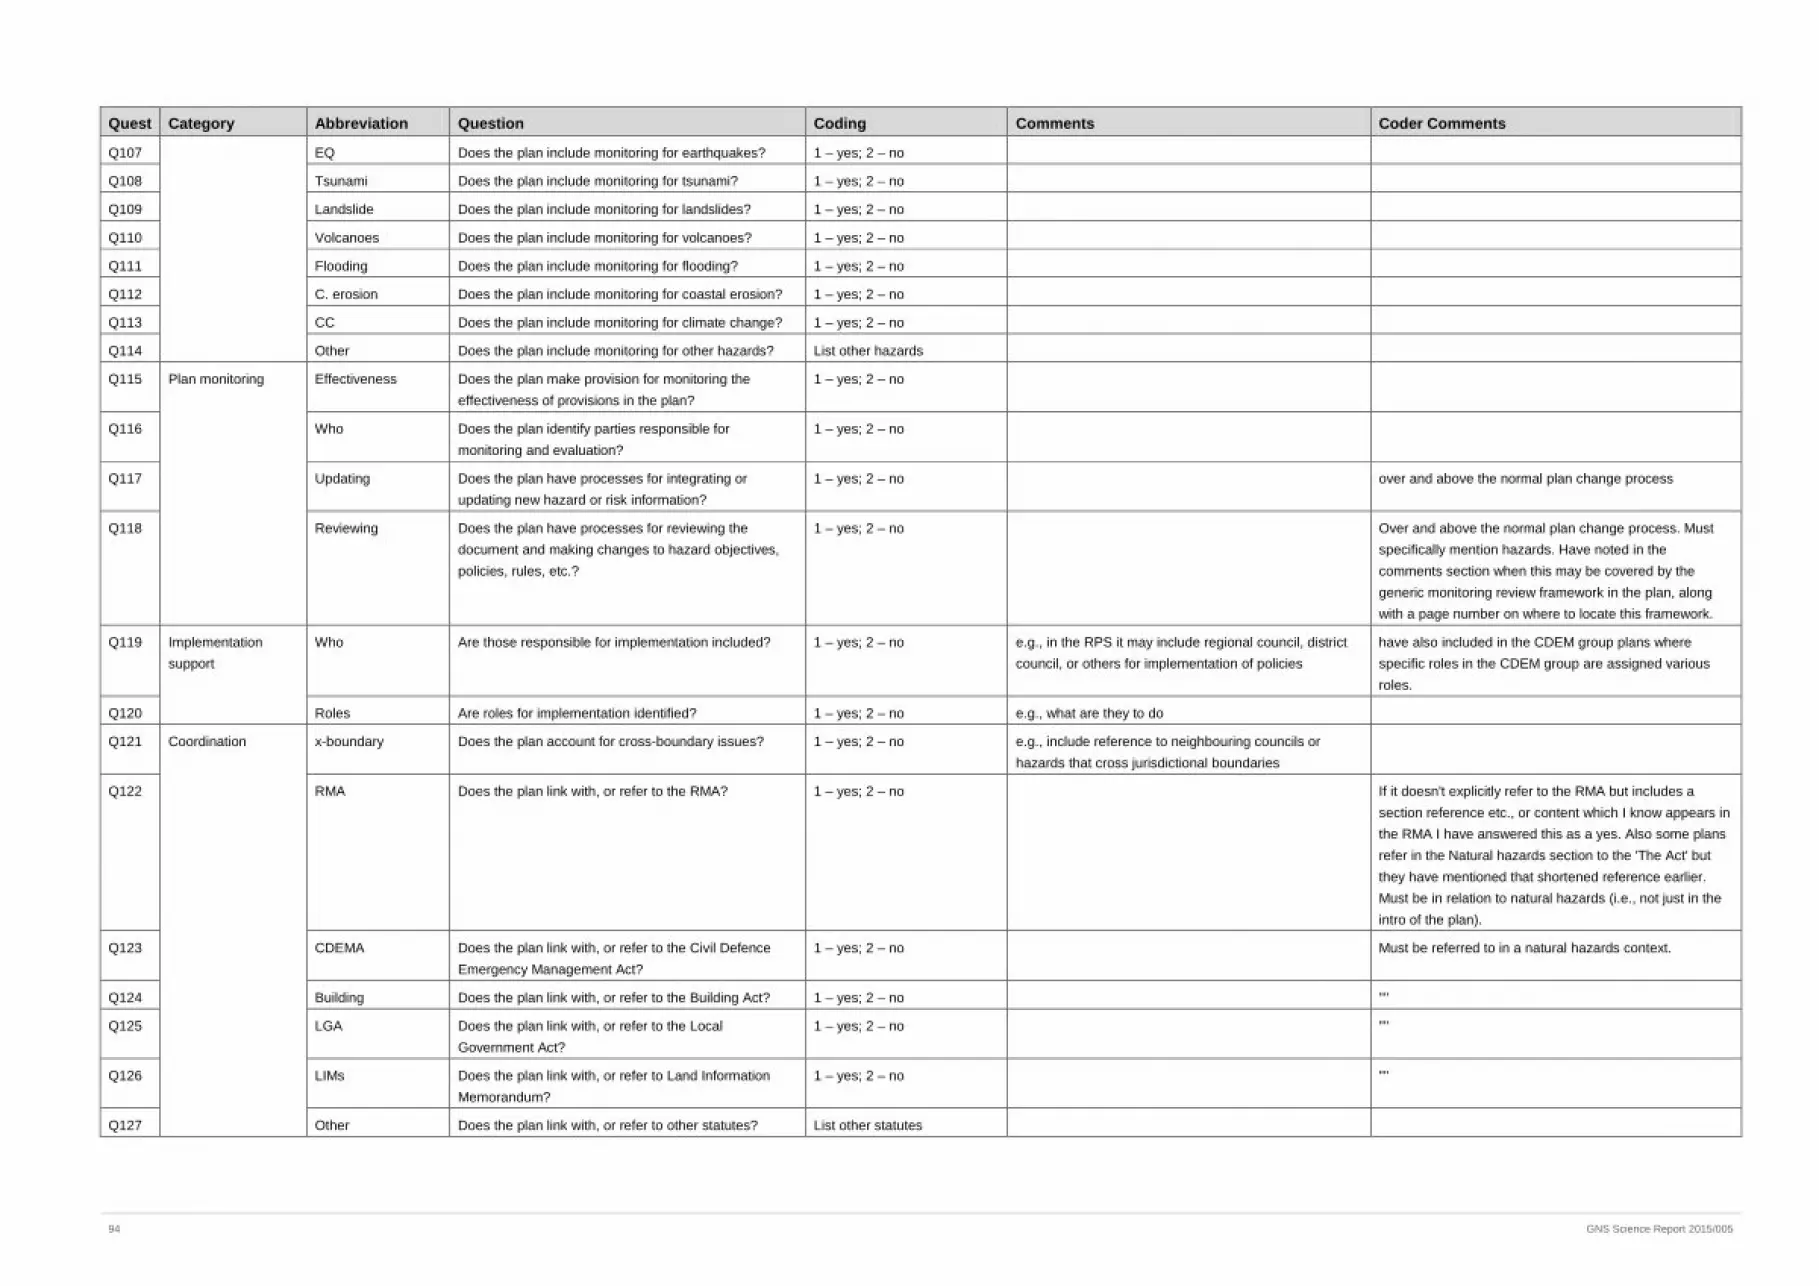
Quest Category Abbreviation Question Coding Comments Coder Comments
Q107 EQ Does the plan include monitoring for earthquakes? 1 – yes; 2 – no
Q108 Tsunami Does the plan include monitoring for tsunami? 1 – yes; 2 – no
Q109 Landslide Does the plan include monitoring for landslides? 1 – yes; 2 – no
Q110 Volcanoes Does the plan include monitoring for volcanoes? 1 – yes; 2 – no
Q111 Flooding Does the plan include monitoring for flooding? 1 – yes; 2 – no
Q112 C. erosion Does the plan include monitoring for coastal erosion? 1 – yes; 2 – no
Q113 CC Does the plan include monitoring for climate change? 1 – yes; 2 – no
Q114 Other Does the plan include monitoring for other hazards? List other hazards
Q115 Plan monitoring Effectiveness Does the plan make provision for monitoring the effectiveness of provisions in the plan?
1 – yes; 2 – no
Q116 Who Does the plan identify parties responsible for monitoring and evaluation?
1 – yes; 2 – no
Q117 Updating Does the plan have processes for integrating or updating new hazard or risk information?
1 – yes; 2 – no over and above the normal plan change process
Q118 Reviewing Does the plan have processes for reviewing the document and making changes to hazard objectives, policies, rules, etc.?
1 – yes; 2 – no Over and above the normal plan change process. Must specifically mention hazards. Have noted in the comments section when this may be covered by the generic monitoring review framework in the plan, along with a page number on where to locate this framework.
Q119 Implementation support
Who Are those responsible for implementation included? 1 – yes; 2 – no e.g., in the RPS it may include regional council, district council, or others for implementation of policies
have also included in the CDEM group plans where specific roles in the CDEM group are assigned various roles.
Q120 Roles Are roles for implementation identified? 1 – yes; 2 – no e.g., what are they to do
Q121 Coordination x-boundary Does the plan account for cross-boundary issues? 1 – yes; 2 – no e.g., include reference to neighbouring councils or hazards that cross jurisdictional boundaries
Q122 RMA Does the plan link with, or refer to the RMA? 1 – yes; 2 – no If it doesn't explicitly refer to the RMA but includes a section reference etc., or content which I know appears in the RMA I have answered this as a yes. Also some plans refer in the Natural hazards section to the 'The Act' but they have mentioned that shortened reference earlier. Must be in relation to natural hazards (i.e., not just in the intro of the plan).
Q123 CDEMA Does the plan link with, or refer to the Civil Defence Emergency Management Act?
1 – yes; 2 – no Must be referred to in a natural hazards context.
Q124 Building Does the plan link with, or refer to the Building Act? 1 – yes; 2 – no ""
Q125 LGA Does the plan link with, or refer to the Local Government Act?
1 – yes; 2 – no ""
Q126 LIMs Does the plan link with, or refer to Land Information Memorandum?
1 – yes; 2 – no ""
Q127 Other Does the plan link with, or refer to other statutes? List other statutes
94 GNS Science Report 2015/005


1 Fairway Drive
Avalon
PO Box 30368
Lower Hutt
New Zealand
T +64-4-570 1444
F +64-4-570 4600
Dunedin Research Centre
764 Cumberland Street
Private Bag 1930
Dunedin
New Zealand
T +64-3-477 4050
F +64-3-477 5232
Wairakei Research Centre
114 Karetoto Road
Wairakei
Private Bag 2000, Taupo
New Zealand
T +64-7-374 8211
F +64-7-374 8199
National Isotope Centre
30 Gracefield Road
PO Box 31312
Lower Hutt
New Zealand
T +64-4-570 1444
F +64-4-570 4657
Principal Location
www.gns.cri.nz
Other Locations


