Embed Size (px)
Citation preview
0
October 29, 2019
9M 2019 RESULTS
PRESENTATION
1
Disclaimer
The information contained in this presentation has not been independently verified and is, in any case, subject tonegotiation, changes and modifications.
None of the Company, its shareholders or any of their respective affiliates shall be liable for the accuracy or completenessof the information or statements included in this presentation, and in no event may its content be construed as any type ofexplicit or implicit representation or warranty made by the Company, its shareholders or any other such person. Likewise,none of the Company, its shareholders or any of their respective affiliates shall be liable in any respect whatsoever(whether in negligence or otherwise) for any loss or damage that may arise from the use of this presentation or of anycontent therein or otherwise arising in connection with the information contained in this presentation. You may not copy ordistribute this presentation to any person.
The Company does not undertake to publish any possible modifications or revisions of the information, data or statementscontained herein should there be any change in the strategy or intentions of the Company, or occurrence of unforeseeablefacts or events that affect the Company’s strategy or intentions.
This presentation may contain forward-looking statements with respect to the business, investments, financial condition,results of operations, dividends, strategy, plans and objectives of the Company. By their nature, forward-looking statementsinvolve risk and uncertainty because they reflect the Company’s current expectations and assumptions as to future eventsand circumstances that may not prove accurate. A number of factors, including political, economic and regulatorydevelopments in Spain and the European Union, could cause actual results and developments to differ materially fromthose expressed or implied in any forward-looking statements contained herein.
The information contained in this presentation does not constitute an offer or invitation to purchase or subscribe for anyordinary shares, and neither it nor any part of it shall form the basis of or be relied upon in connection with any contract orcommitment whatsoever.
2
prisa.comAgenda
1 9M2019 key highlights
2
Summary
9M2019 Group results
9M2019 results by business unit3
4

3
prisa.com
9M2019 Key highlights1
4
prisa.com
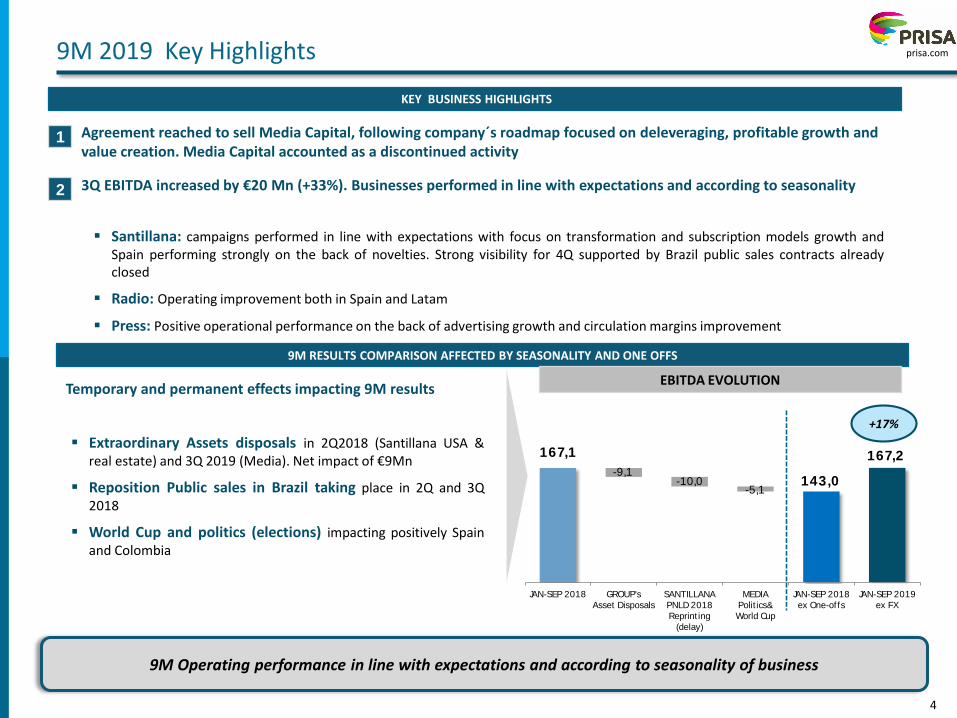
167,1
143,0
167,2-9,1
-10,0-5,1
JAN-SEP 2018 GROUP's
Asset Disposals
SANTILLANA
PNLD 2018
Reprint ing
(delay)
MEDIA
Polit ics&
World Cup
JAN-SEP 2018
ex One-of fs
JAN-SEP 2019
ex FX
▪ Santillana: campaigns performed in line with expectations with focus on transformation and subscription models growth andSpain performing strongly on the back of novelties. Strong visibility for 4Q supported by Brazil public sales contracts alreadyclosed
▪ Radio: Operating improvement both in Spain and Latam
▪ Press: Positive operational performance on the back of advertising growth and circulation margins improvement
9M 2019 Key Highlights
9M Operating performance in line with expectations and according to seasonality of business
Temporary and permanent effects impacting 9M results
▪ Extraordinary Assets disposals in 2Q2018 (Santillana USA &real estate) and 3Q 2019 (Media). Net impact of €9Mn
▪ Reposition Public sales in Brazil taking place in 2Q and 3Q2018
▪ World Cup and politics (elections) impacting positively Spainand Colombia
1
9M RESULTS COMPARISON AFFECTED BY SEASONALITY AND ONE OFFS
2
KEY BUSINESS HIGHLIGHTS
3Q EBITDA increased by €20 Mn (+33%). Businesses performed in line with expectations and according to seasonality
+17%
EBITDA EVOLUTION
Agreement reached to sell Media Capital, following company´s roadmap focused on deleveraging, profitable growth and value creation. Media Capital accounted as a discontinued activity
5
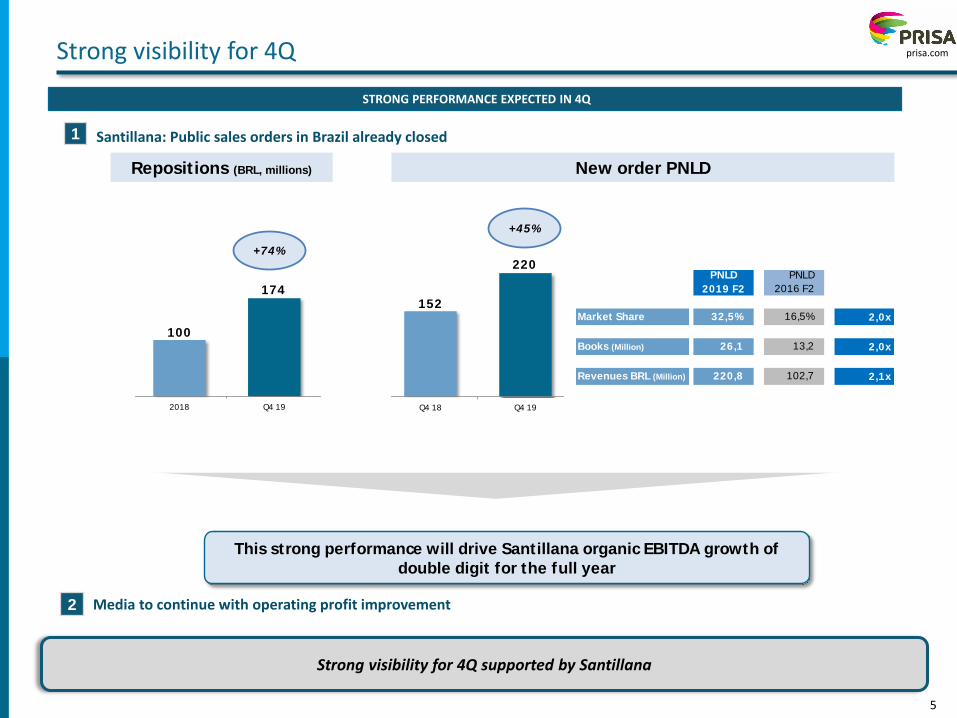
prisa.comStrong visibility for 4Q
Strong visibility for 4Q supported by Santillana
STRONG PERFORMANCE EXPECTED IN 4Q
1
2
Santillana: Public sales orders in Brazil already closed
Media to continue with operating profit improvement
Market Share 32,5% 16,5% 2,0x
Books (Million) 26,1 13,2 2,0x
Revenues BRL (Million) 220,8 102,7 2,1x
PNLD
2019 F2
PNLD
2016 F2
152
220
Q4 18 Q4 19
100
174
2018 Q4 19
New order PNLD Repositions (BRL, millions)
+74%
This strong performance will drive Santillana organic EBITDA growth of
double digit for the full year
+45%
6
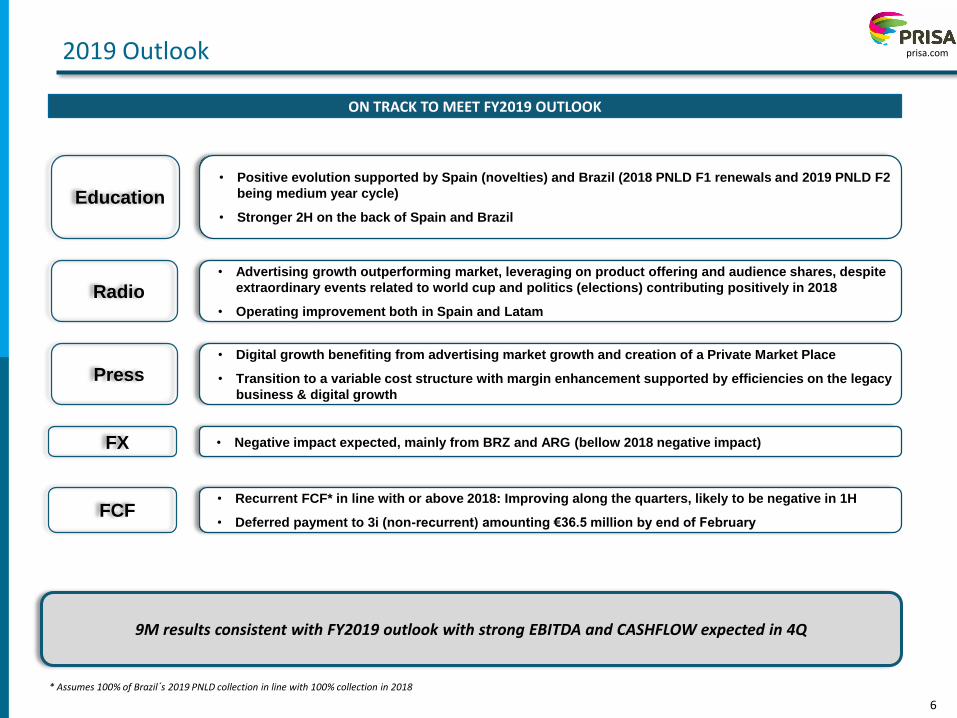
prisa.com2019 Outlook
Education• Positive evolution supported by Spain (novelties) and Brazil (2018 PNLD F1 renewals and 2019 PNLD F2
being medium year cycle)
• Stronger 2H on the back of Spain and Brazil
Radio
Press
• Advertising growth outperforming market, leveraging on product offering and audience shares, despite
extraordinary events related to world cup and politics (elections) contributing positively in 2018
• Operating improvement both in Spain and Latam
• Digital growth benefiting from advertising market growth and creation of a Private Market Place
• Transition to a variable cost structure with margin enhancement supported by efficiencies on the legacy
business & digital growth
FX
FCF
• Negative impact expected, mainly from BRZ and ARG (bellow 2018 negative impact)
• Recurrent FCF* in line with or above 2018: Improving along the quarters, likely to be negative in 1H
• Deferred payment to 3i (non-recurrent) amounting €36.5 million by end of February
9M results consistent with FY2019 outlook with strong EBITDA and CASHFLOW expected in 4Q
ON TRACK TO MEET FY2019 OUTLOOK
* Assumes 100% of Brazil´s 2019 PNLD collection in line with 100% collection in 2018
7
prisa.com
9M 2019 Group results2
8
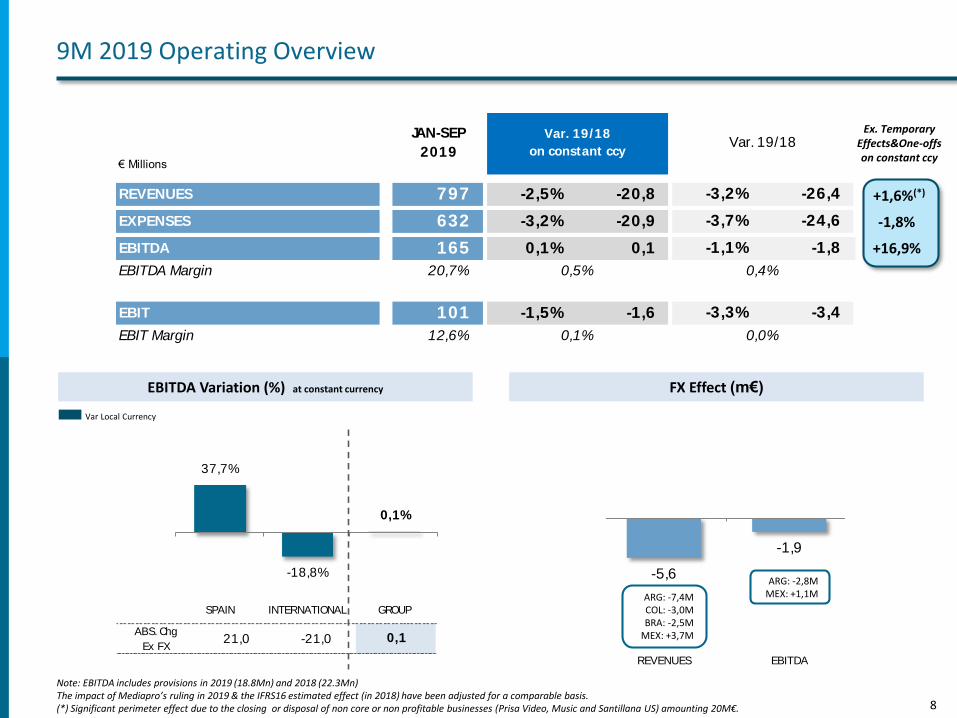
-5,6
-1,9
REVENUES EBITDA
ABS. Chg
Ex FX21,0 -21,0 0,1
37,7%
-18,8%
0,1%
SPAIN INTERNATIONAL GROUP
€ Millions
REVENUES 797 -2,5% -20,8 -3,2% -26,4
EXPENSES 632 -3,2% -20,9 -3,7% -24,6
EBITDA 165 0,1% 0,1 -1,1% -1,8
EBITDA Margin 20,7%
EBIT 101 -1,5% -1,6 -3,3% -3,4
EBIT Margin 12,6%
Var. 19/18
on constant ccy
0,5%
0,1% 0,0%
JAN-SEP
2019Var. 19/18
0,4%
EBITDA Variation (%) at constant currency FX Effect (m€)
9M 2019 Operating Overview
Note: EBITDA includes provisions in 2019 (18.8Mn) and 2018 (22.3Mn) The impact of Mediapro’s ruling in 2019 & the IFRS16 estimated effect (in 2018) have been adjusted for a comparable basis.(*) Significant perimeter effect due to the closing or disposal of non core or non profitable businesses (Prisa Video, Music and Santillana US) amounting 20M€.
Var Local Currency
Ex. TemporaryEffects&One-offson constant ccy
+1,6%(*)
-1,8%
+16,9%
ARG: -7,4MCOL: -3,0MBRA: -2,5M
MEX: +3,7M
ARG: -2,8MMEX: +1,1M
9
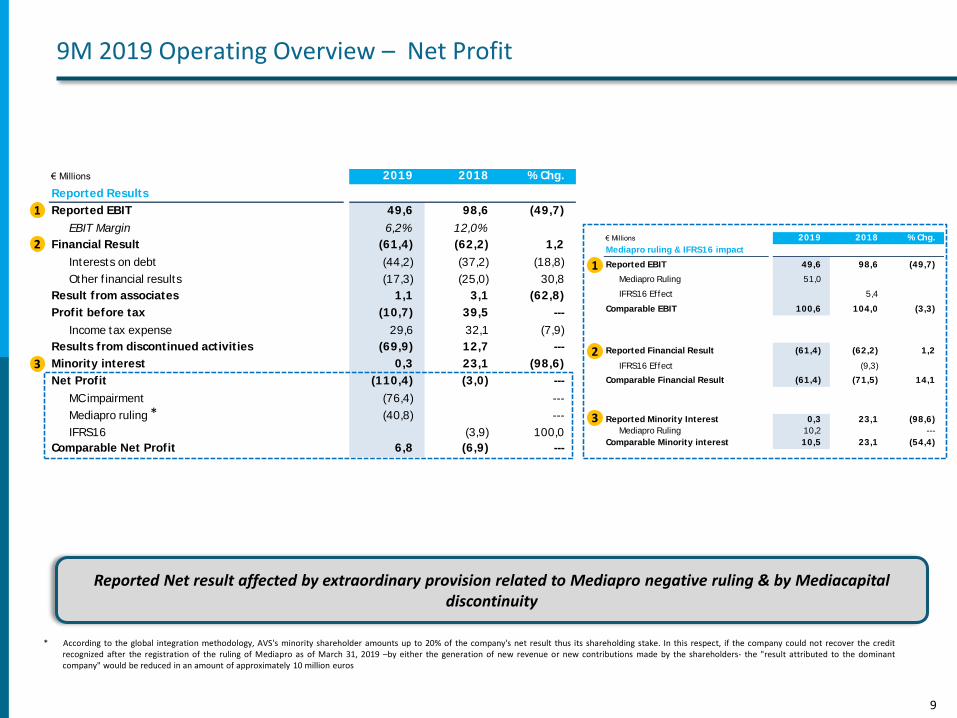
€ Millions 2019 2018 % Chg.
Mediapro ruling & IFRS16 impact
Reported EBIT 49,6 98,6 (49,7)
Mediapro Ruling 51,0
IFRS16 Ef fect 5,4
Comparable EBIT 100,6 104,0 (3,3)
Reported Financial Result (61,4) (62,2) 1,2
IFRS16 Ef fect (9,3)
Comparable Financial Result (61,4) (71,5) 14,1
Reported Minority Interest 0,3 23,1 (98,6)
Mediapro Ruling 10,2 ---
Comparable Minority interest 10,5 23,1 (54,4)
€ Millions 2019 2018 % Chg.
Reported Results
Reported EBIT 49,6 98,6 (49,7)
EBIT Margin 6,2% 12,0%
Financial Result (61,4) (62,2) 1,2
Interests on debt (44,2) (37,2) (18,8)
Other f inancial results (17,3) (25,0) 30,8
Result from associates 1,1 3,1 (62,8)
Profit before tax (10,7) 39,5 ---
Income tax expense 29,6 32,1 (7,9)
Results from discontinued activities (69,9) 12,7 ---
Minority interest 0,3 23,1 (98,6)
Net Profit (110,4) (3,0) ---
MC impairment (76,4) ---
Mediapro ruling (40,8) ---
IFRS16 (3,9) 100,0
Comparable Net Profit 6,8 (6,9) ---
9M 2019 Operating Overview – Net Profit
Reported Net result affected by extraordinary provision related to Mediapro negative ruling & by Mediacapitaldiscontinuity
1
2
3
1
2
3
* According to the global integration methodology, AVS's minority shareholder amounts up to 20% of the company's net result thus its shareholding stake. In this respect, if the company could not recover the creditrecognized after the registration of the ruling of Mediapro as of March 31, 2019 –by either the generation of new revenue or new contributions made by the shareholders- the "result attributed to the dominantcompany" would be reduced in an amount of approximately 10 million euros
*
10
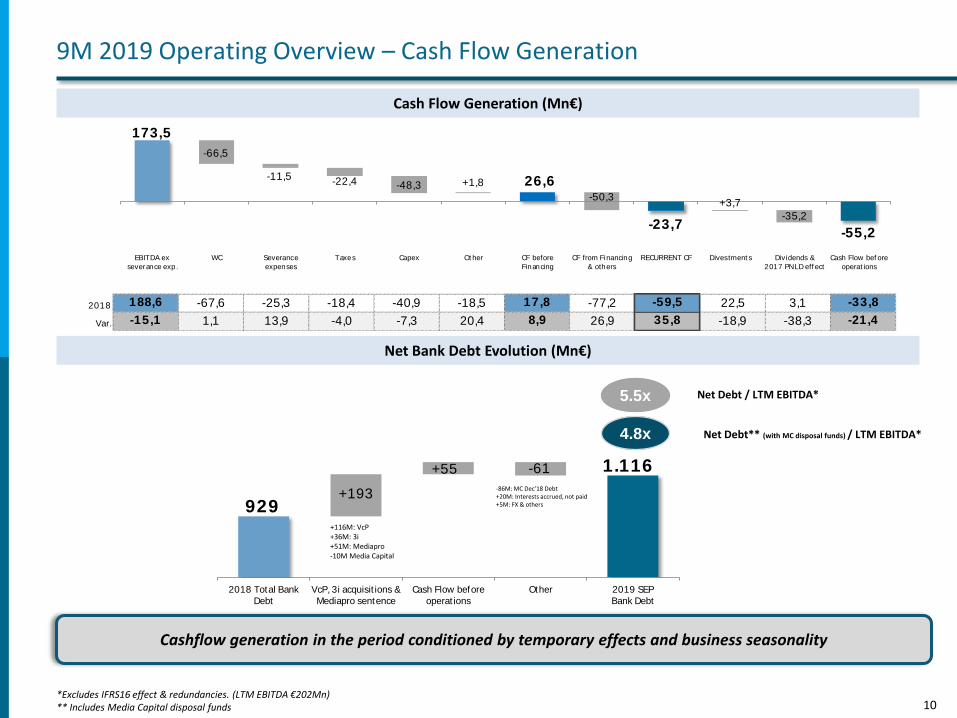
2018 188,6 -67,6 -25,3 -18,4 -40,9 -18,5 17,8 -77,2 -59,5 22,5 3,1 -33,8
Var. -15,1 1,1 13,9 -4,0 -7,3 20,4 8,9 26,9 35,8 -18,9 -38,3 -21,4
173,5
26,6
-23,7-55,2
-66,5
-11,5 -22,4 -48,3 +1,8
-50,3+3,7
-35,2
EBITDA ex
severance exp.
WC Severance
expenses
Taxes Capex Ot her CF before
Financing
CF from Financing
& others
RECURRENT CF Divestment s Dividends &
2017 PNLD eff ect
Cash Flow bef ore
operat ions
929
1.116
+193
+55 -61
2018 Total Bank
Debt
VcP, 3i acquisit ions &
Mediapro sentence
Cash Flow before
operat ions
Other 2019 SEP
Bank Debt
Net Bank Debt Evolution (Mn€)
9M 2019 Operating Overview – Cash Flow Generation
Cash Flow Generation (Mn€)
Cashflow generation in the period conditioned by temporary effects and business seasonality
Net Debt / LTM EBITDA*5.5x
*Excludes IFRS16 effect & redundancies. (LTM EBITDA €202Mn)** Includes Media Capital disposal funds
4.8x Net Debt** (with MC disposal funds) / LTM EBITDA*
-86M: MC Dec’18 Debt+20M: Interests accrued, not paid+5M: FX & others
+116M: VcP+36M: 3i+51M: Mediapro-10M Media Capital
11
prisa.com
9M 2019 results by business unit3
12
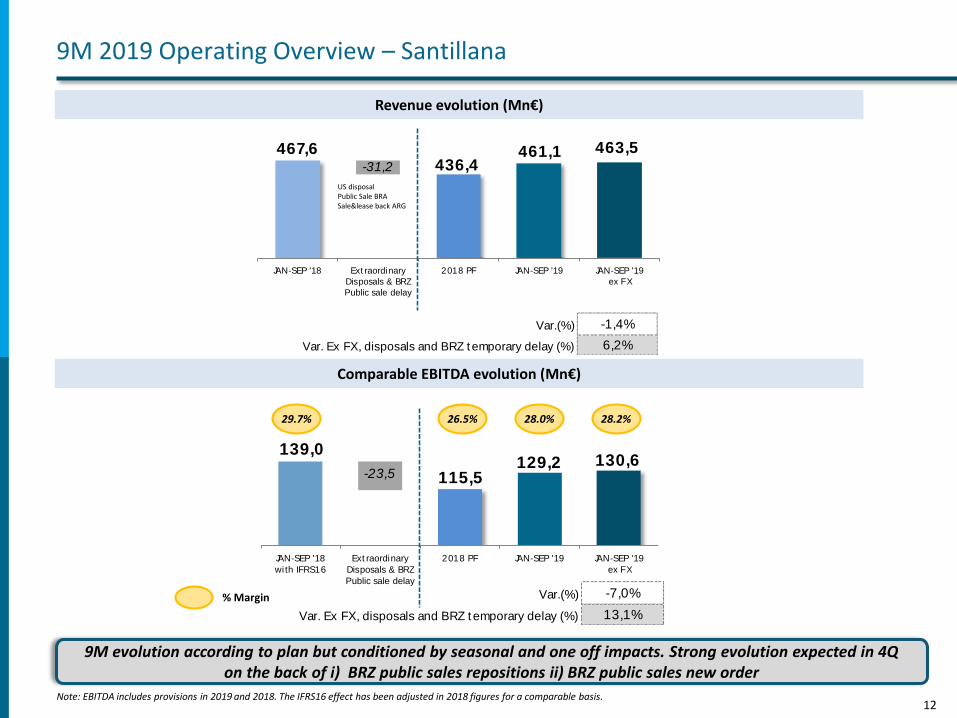
Var.(%) -7,0%
Var. Ex FX, disposals and BRZ temporary delay (%) 13,1%
139,0
115,5129,2 130,6
-23,5
JAN-SEP '18
wi th IFRS16
Ext raordinary
Disposals & BRZ
Public sale delay
2018 PF JAN-SEP '19 JAN-SEP '19
ex FX
Var.(%) -1,4%
Var. Ex FX, disposals and BRZ temporary delay (%) 6,2%
467,6436,4
461,1 463,5-31,2
JAN-SEP '18 Ext raordinary
Disposals & BRZ
Public sale delay
2018 PF JAN-SEP '19 JAN-SEP '19
ex FX
Revenue evolution (Mn€)
Comparable EBITDA evolution (Mn€)
9M 2019 Operating Overview – Santillana
% Margin
29.7% 26.5% 28.0%
9M evolution according to plan but conditioned by seasonal and one off impacts. Strong evolution expected in 4Q on the back of i) BRZ public sales repositions ii) BRZ public sales new order
Note: EBITDA includes provisions in 2019 and 2018. The IFRS16 effect has been adjusted in 2018 figures for a comparable basis.
28.2%
US disposalPublic Sale BRASale&lease back ARG
13
prisa.com
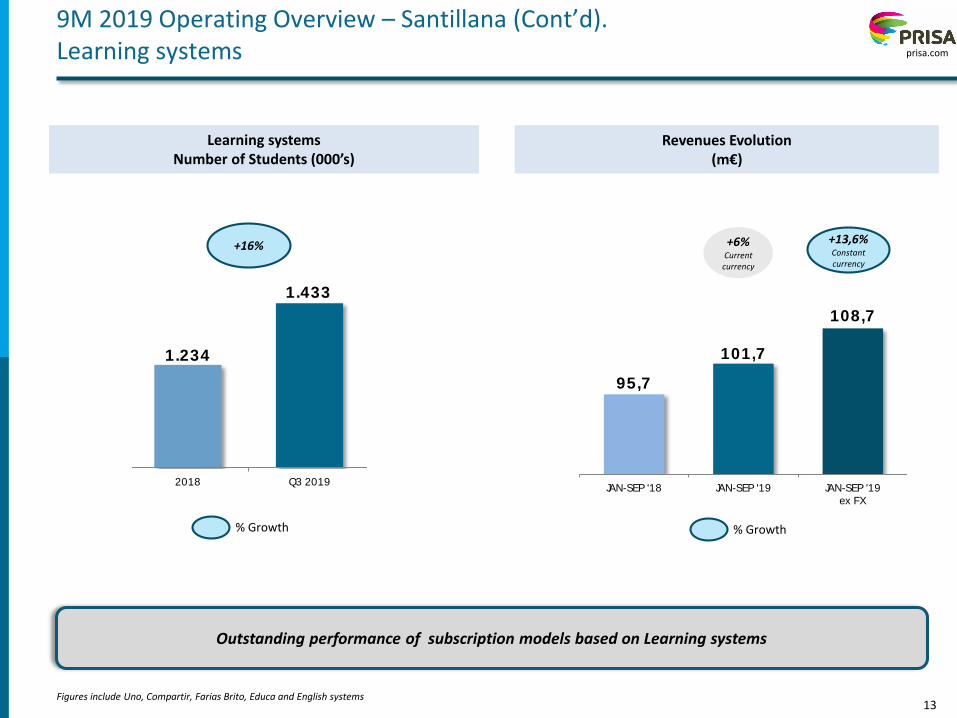
95,7
101,7
108,7
JAN-SEP '18 JAN-SEP '19 JAN-SEP '19
ex FX
1.234
1.433
2018 Q3 2019
9M 2019 Operating Overview – Santillana (Cont’d). Learning systems
Figures include Uno, Compartir, Farias Brito, Educa and English systems
Outstanding performance of subscription models based on Learning systems
Learning systemsNumber of Students (000’s)
+16%
% Growth
Revenues Evolution (m€)
+13,6%Constant currency
+6%Current currency
% Growth
14
prisa.com
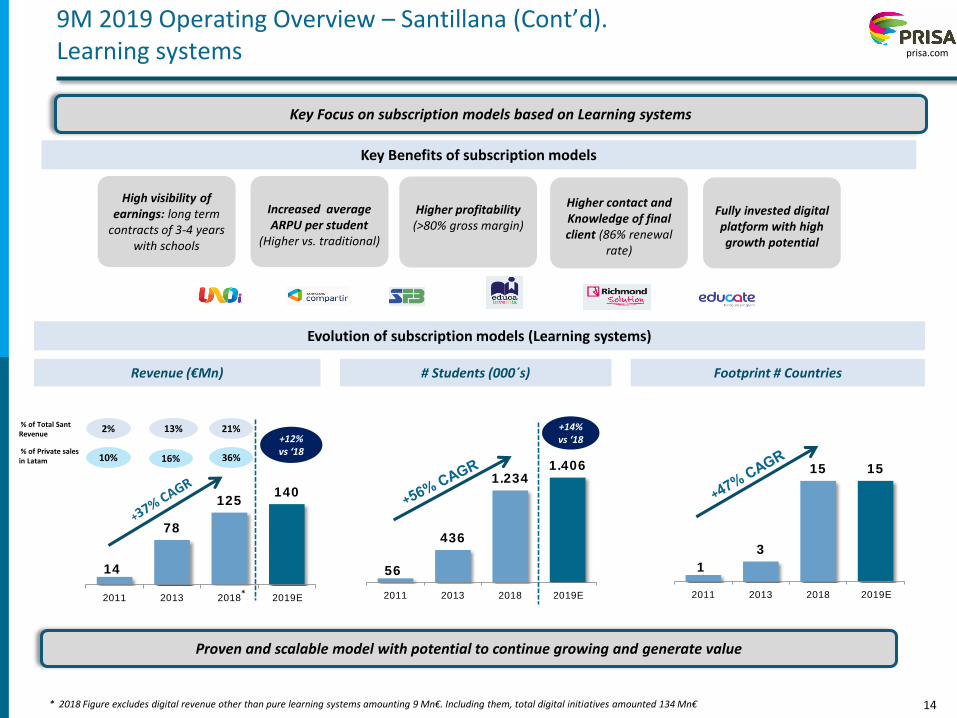
56
436
1.2341.406
2011 2013 2018 2019E
14
78
125140
2011 2013 2018 2019E
1
3
15 15
2011 2013 2018 2019E
9M 2019 Operating Overview – Santillana (Cont’d). Learning systems
Key Focus on subscription models based on Learning systems
Evolution of subscription models (Learning systems)
Key Benefits of subscription models
High visibility of earnings: long term
contracts of 3-4 years with schools
Increased average ARPU per student
(Higher vs. traditional)
Higher profitability(>80% gross margin)
Higher contact and Knowledge of final client (86% renewal
rate)
Fully invested digital platform with high growth potential
Revenue (€Mn) # Students (000´s) Footprint # Countries
% of Total Sant Revenue
2% 13% 21%
Proven and scalable model with potential to continue growing and generate value
% of Private sales in Latam 10% 16% 36%
* 2018 Figure excludes digital revenue other than pure learning systems amounting 9 Mn€. Including them, total digital initiatives amounted 134 Mn€
+12% vs ‘18
*
+14% vs ‘18
15
prisa.com
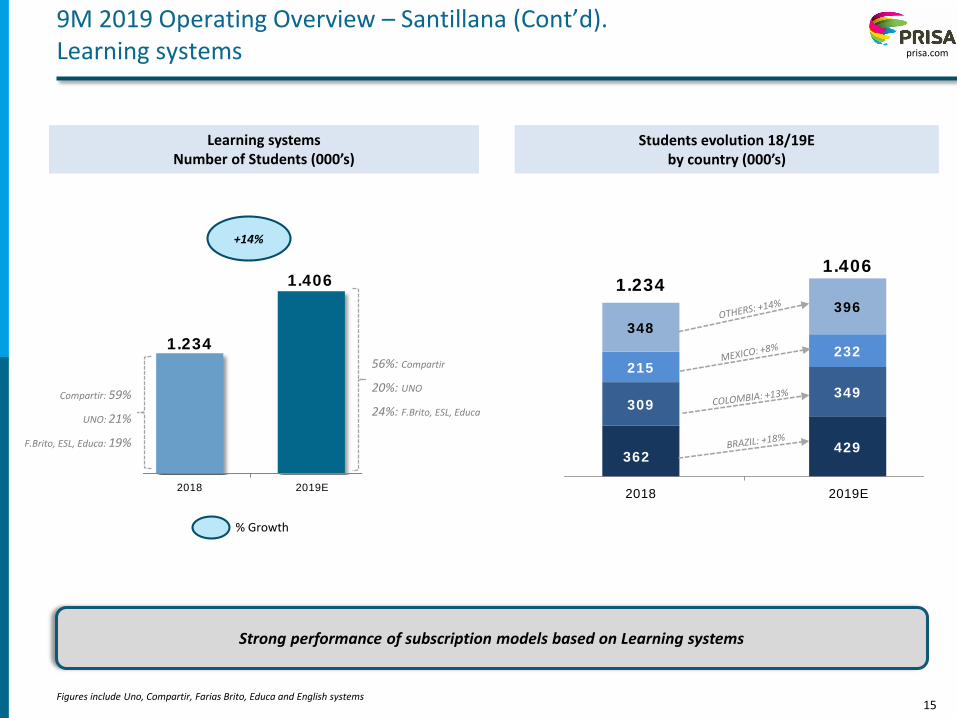
9M 2019 Operating Overview – Santillana (Cont’d). Learning systems
Figures include Uno, Compartir, Farias Brito, Educa and English systems
Strong performance of subscription models based on Learning systems
Learning systemsNumber of Students (000’s)
% Growth
Students evolution 18/19E by country (000’s)
1.234
1.406
2018 2019E
+14%
56%: Compartir
20%: UNO
24%: F.Brito, ESL, Educa
Compartir: 59%
UNO: 21%
F.Brito, ESL, Educa: 19%362
429
309349
215232
348
396
1.2341.406
2018 2019E
16
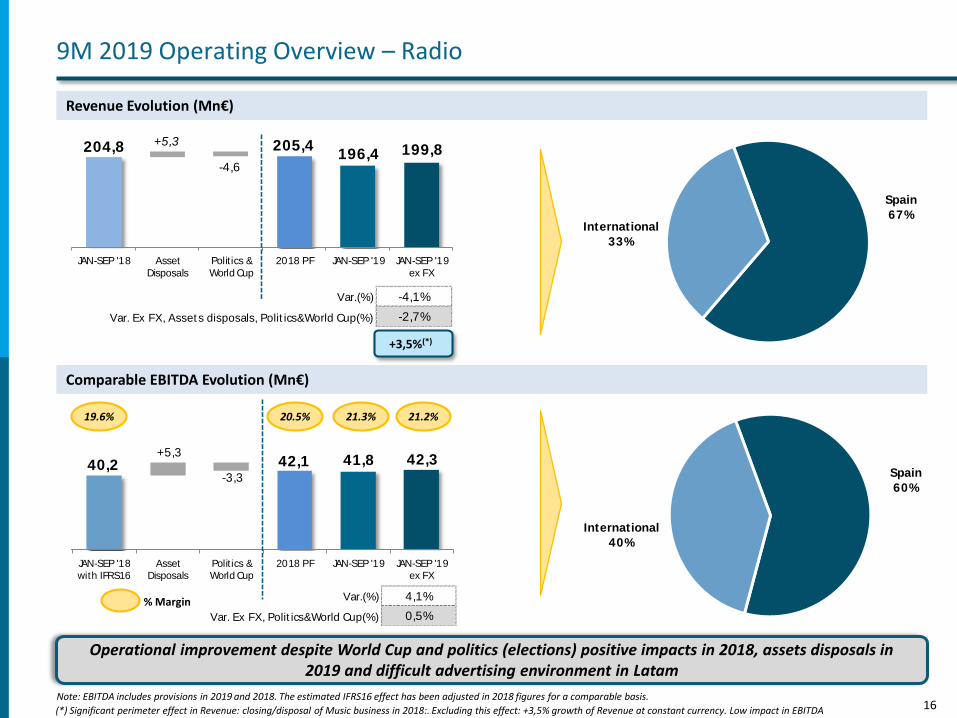
Var.(%) 4,1%
Var. Ex FX, Polit ics&World Cup(%) 0,5%
30,6
40,2 42,1 41,8 42,3
+9,5
+5,3
-3,3
JAN-SEP '18 IFRS16 JAN-SEP '18
with IFRS16
Asset
Disposals
Polit ics &
World Cup
2018 PF JAN-SEP '19 JAN-SEP '19
ex FX
Var.(%) -4,1%
Var. Ex FX, Asset s disposals, Polit ics&World Cup(%) -2,7%
204,8 205,4196,4 199,8
+5,3
-4,6
JAN-SEP '18 Asset
Disposals
Polit ics &
World Cup
2018 PF JAN-SEP '19 JAN-SEP '19
ex FX
Revenue Evolution (Mn€)
Comparable EBITDA Evolution (Mn€)
9M 2019 Operating Overview – Radio
20.5% 21.2%
% Margin
Operational improvement despite World Cup and politics (elections) positive impacts in 2018, assets disposals in 2019 and difficult advertising environment in Latam
Note: EBITDA includes provisions in 2019 and 2018. The estimated IFRS16 effect has been adjusted in 2018 figures for a comparable basis.
21.3%19.6%
+3,5%(*)
(*) Significant perimeter effect in Revenue: closing/disposal of Music business in 2018:. Excluding this effect: +3,5% growth of Revenue at constant currency. Low impact in EBITDA
Spain
67%International
33%
Spain
60%
International
40%
17
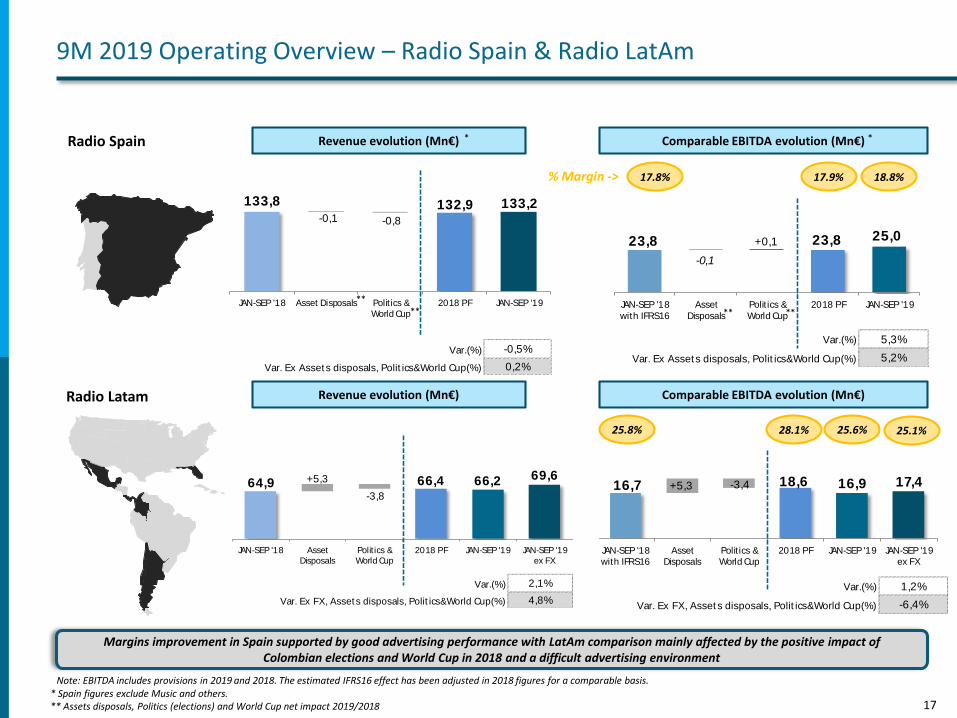
Var.(%) 5,3%
Var. Ex Asset s disposals, Polit ics&World Cup(%) 5,2%
23,8 23,8 25,0
-0,1
+0,1
JAN-SEP '18
with IFRS16
Asset
Disposals
Polit ics &
World Cup
2018 PF JAN-SEP '19
Var.(%) -0,5%
Var. Ex Asset s disposals, Polit ics&World Cup(%) 0,2%
133,8 132,9 133,2-0,1 -0,8
JAN-SEP '18 Asset Disposals Polit ics &
World Cup
2018 PF JAN-SEP '19
Var.(%) 1,2%
Var. Ex FX, Asset s disposals, Polit ics&World Cup(%) -6,4%
13,6 16,7 18,6 16,9 17,4+3,1
+5,3 -3,4
JAN-SEP '18 IFRS16 JAN-SEP '18
with IFRS16
Asset
Disposals
Polit ics &
World Cup
2018 PF JAN-SEP '19 JAN-SEP '19
ex FX
Var.(%) 2,1%
Var. Ex FX, Asset s disposals, Polit ics&World Cup(%) 4,8%
64,9 66,4 66,2 69,6+5,3
-3,8
JAN-SEP '18 Asset
Disposals
Polit ics &
World Cup
2018 PF JAN-SEP '19 JAN-SEP '19
ex FX
9M 2019 Operating Overview – Radio Spain & Radio LatAm
Radio Spain Revenue evolution (Mn€) Comparable EBITDA evolution (Mn€)
Revenue evolution (Mn€) Comparable EBITDA evolution (Mn€)
% Margin -> 17.8%
Margins improvement in Spain supported by good advertising performance with LatAm comparison mainly affected by the positive impact of Colombian elections and World Cup in 2018 and a difficult advertising environment
Note: EBITDA includes provisions in 2019 and 2018. The estimated IFRS16 effect has been adjusted in 2018 figures for a comparable basis.
18.8%
25.8% 25.6%28.1%
* Spain figures exclude Music and others. ** Assets disposals, Politics (elections) and World Cup net impact 2019/2018
17.9%
25.1%
**
* *
Radio Latam
****
**
18
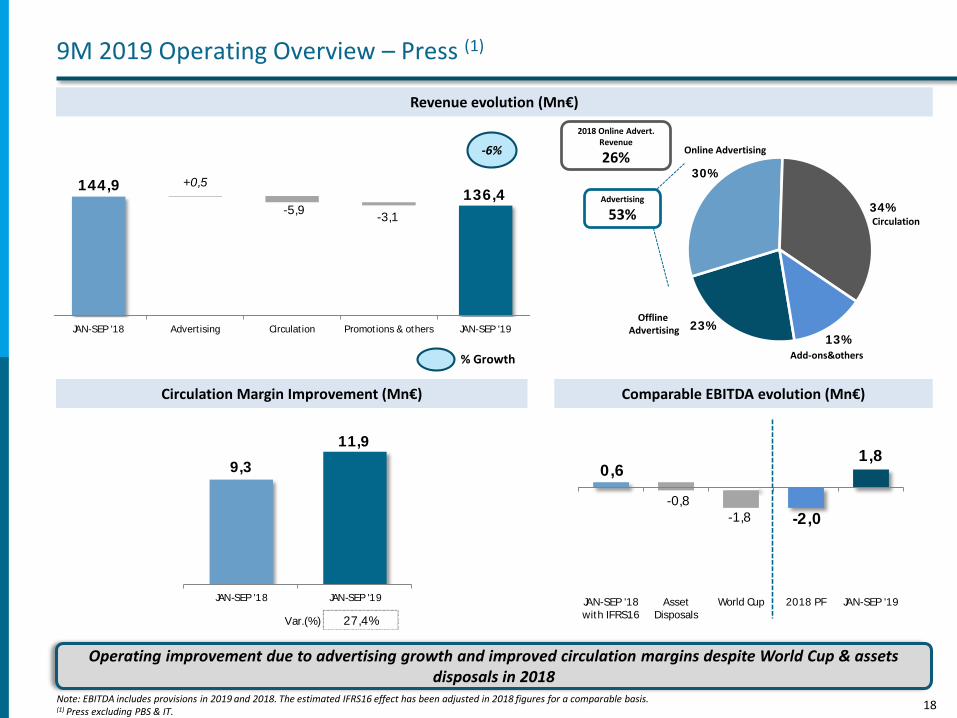
Var.(%) 27,4%
9,3
11,9
JAN-SEP '18 JAN-SEP '19
-2,8
0,6
-2,0
1,8
+3,4 -0,8
-1,8
JAN-SEP '18 IFRS16 JAN-SEP '18
with IFRS16
Asset
Disposals
World Cup 2018 PF JAN-SEP '19
23%
30%
34%
13%
144,9136,4
+0,5
-5,9-3,1
JAN-SEP '18 Advert ising Circulat ion Promot ions & others JAN-SEP '19
Comparable EBITDA evolution (Mn€)
Revenue evolution (Mn€)
Circulation Margin Improvement (Mn€)
Advertising
53%
2018 Online Advert. Revenue
26%
9M 2019 Operating Overview – Press (1)
-6%
% Growth
Operating improvement due to advertising growth and improved circulation margins despite World Cup & assets disposals in 2018
Online Advertising
Offline Advertising
Circulation
Add-ons&others
Note: EBITDA includes provisions in 2019 and 2018. The estimated IFRS16 effect has been adjusted in 2018 figures for a comparable basis.(1) Press excluding PBS & IT.
19
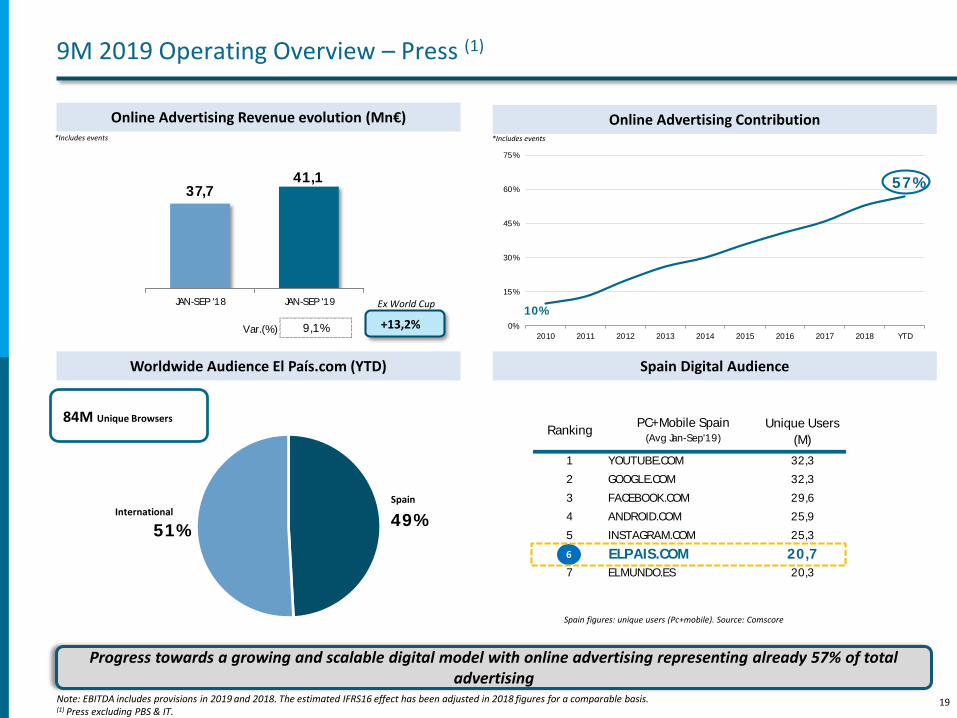
10%
57%
0%
15%
30%
45%
60%
75%
2010 2011 2012 2013 2014 2015 2016 2017 2018 YTD
49%51%
Online Advertising ContributionOnline Advertising Revenue evolution (Mn€)
84M Unique Browsers
19
Worldwide Audience El País.com (YTD) Spain Digital Audience
Spain figures: unique users (Pc+mobile). Source: Comscore
9M 2019 Operating Overview – Press (1)
Progress towards a growing and scalable digital model with online advertising representing already 57% of total advertising
*Includes events
SpainInternational
*Includes events
Note: EBITDA includes provisions in 2019 and 2018. The estimated IFRS16 effect has been adjusted in 2018 figures for a comparable basis.(1) Press excluding PBS & IT.
Var.(%) 9,1%
37,741,1
JAN-SEP '18 JAN-SEP '19
RankingUnique Users
(M)
YoY
(%)
1 YOUTUBE.COM 32,3 5%
2 GOOGLE.COM 32,3 9%
3 FACEBOOK.COM 29,6 2%
4 ANDROID.COM 25,9 5%
5 INSTAGRAM.COM 25,3 18%
6 ELPAIS.COM 20,7 7%
7 ELMUNDO.ES 20,3 3%
PC+Mobile Spain (Avg Jan-Sep'19)
6
+13,2%
Ex World Cup

20
prisa.com
Summary 4
21
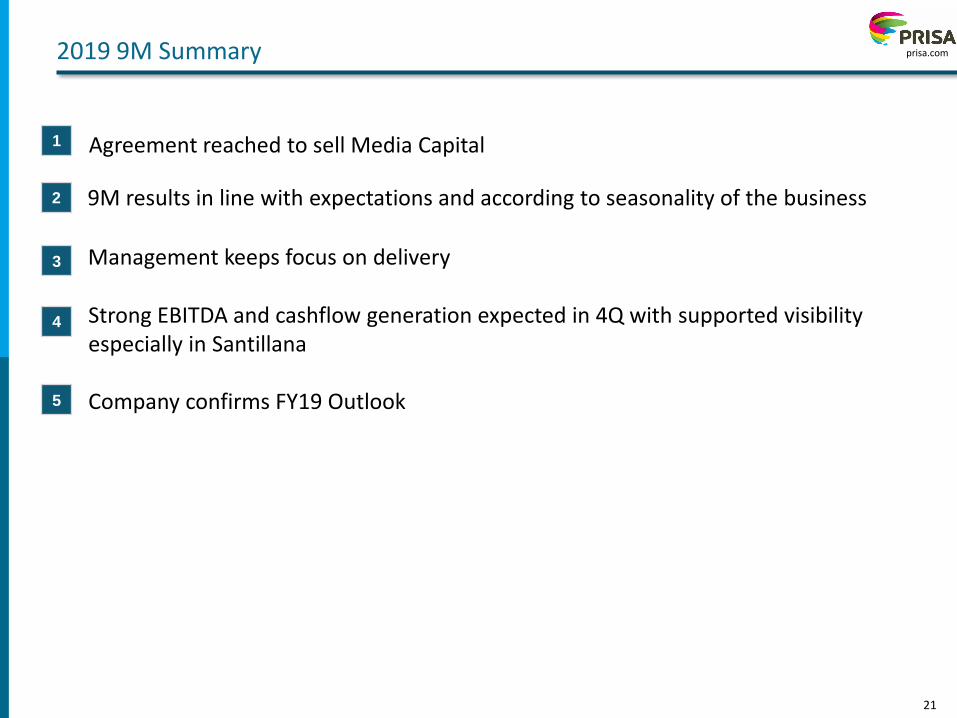
prisa.com2019 9M Summary
Management keeps focus on delivery
2
Strong EBITDA and cashflow generation expected in 4Q with supported visibility especially in Santillana
9M results in line with expectations and according to seasonality of the business
3
4
5 Company confirms FY19 Outlook
1 Agreement reached to sell Media Capital

22
prisa.com
Appendix
23
prisa.com
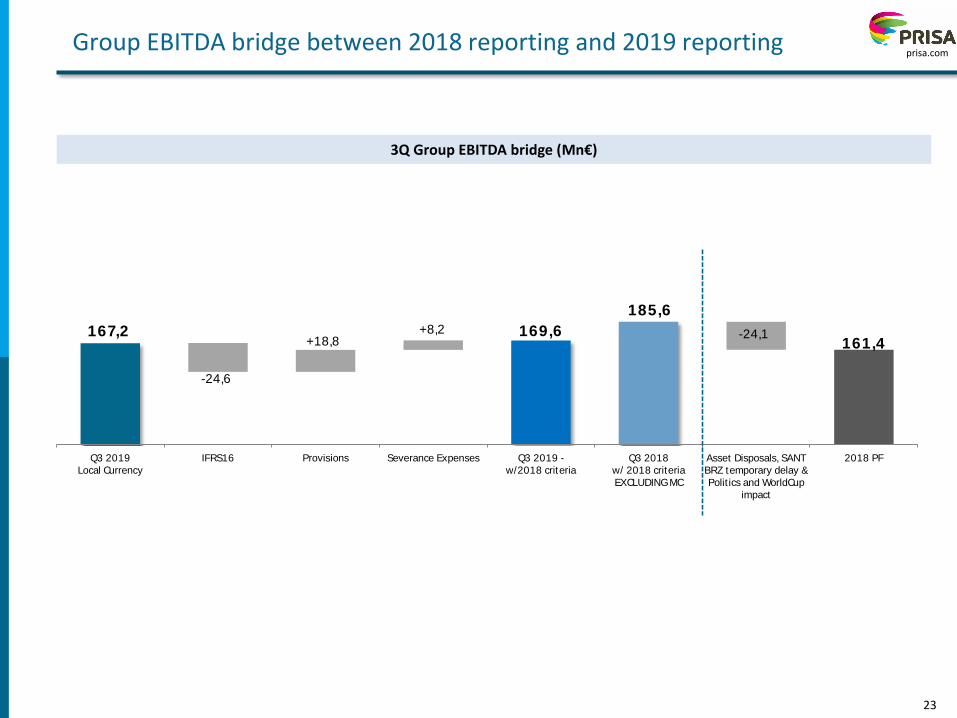
167,2 169,6
185,6
161,4
-24,6
+18,8+8,2 -24,1
Q3 2019
Local Currency
IFRS16 Provisions Severance Expenses Q3 2019 -
w/2018 criteria
Q3 2018
w/ 2018 criteria
EXCLUDING MC
Asset Disposals, SANT
BRZ temporary delay &
Polit ics and WorldCup
impact
2018 PF
Group EBITDA bridge between 2018 reporting and 2019 reporting
3Q Group EBITDA bridge (Mn€)
24
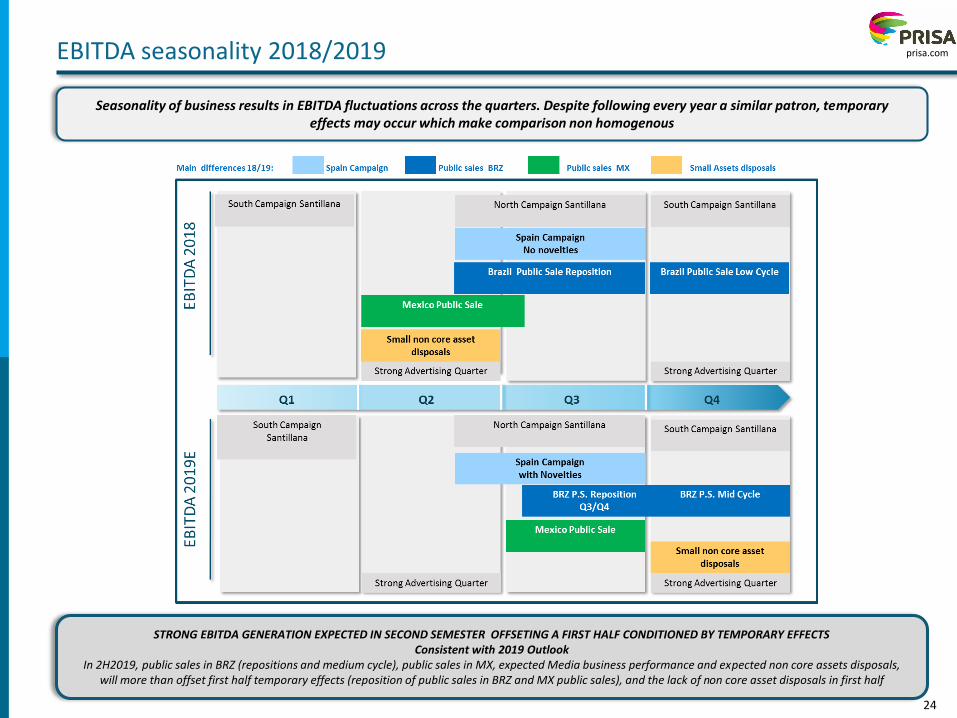
prisa.comEBITDA seasonality 2018/2019
Seasonality of business results in EBITDA fluctuations across the quarters. Despite following every year a similar patron, temporary effects may occur which make comparison non homogenous
STRONG EBITDA GENERATION EXPECTED IN SECOND SEMESTER OFFSETING A FIRST HALF CONDITIONED BY TEMPORARY EFFECTSConsistent with 2019 Outlook
In 2H2019, public sales in BRZ (repositions and medium cycle), public sales in MX, expected Media business performance and expected non core assets disposals, will more than offset first half temporary effects (reposition of public sales in BRZ and MX public sales), and the lack of non core asset disposals in first half
25
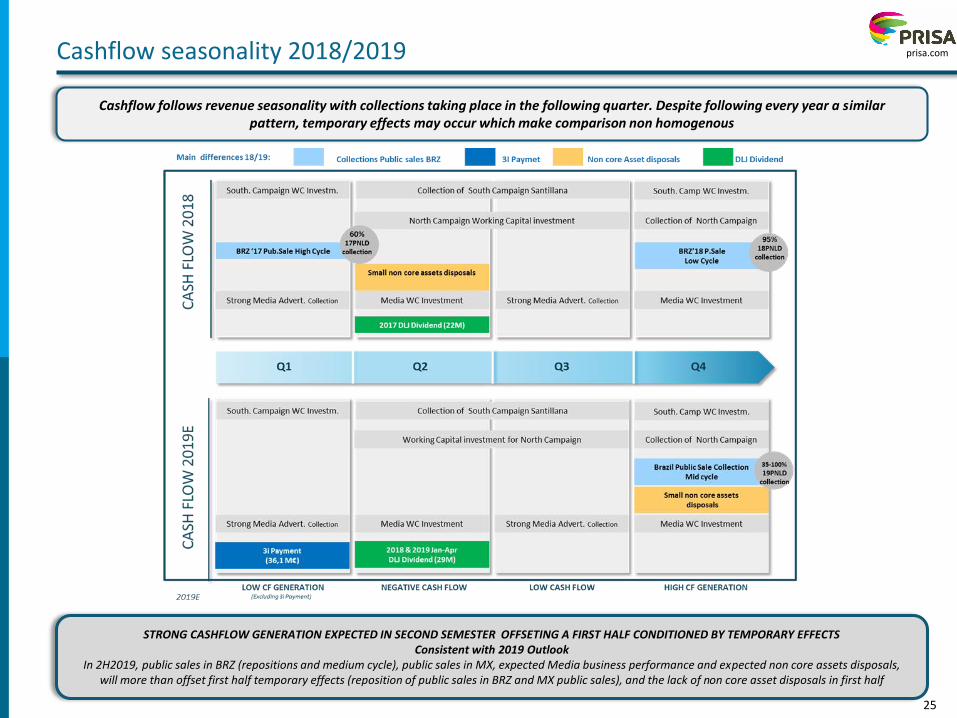
prisa.comCashflow seasonality 2018/2019
Cashflow follows revenue seasonality with collections taking place in the following quarter. Despite following every year a similar pattern, temporary effects may occur which make comparison non homogenous
STRONG CASHFLOW GENERATION EXPECTED IN SECOND SEMESTER OFFSETING A FIRST HALF CONDITIONED BY TEMPORARY EFFECTSConsistent with 2019 Outlook
In 2H2019, public sales in BRZ (repositions and medium cycle), public sales in MX, expected Media business performance and expected non core assets disposals, will more than offset first half temporary effects (reposition of public sales in BRZ and MX public sales), and the lack of non core asset disposals in first half


