Embed Size (px)
Citation preview
2020 Annual Results Presentation
March 2021
“
”
Disclaimer
⚫ The slides/materials used in this presentation are confidential and for reference only. No person shall remove, directly or indirectly reproduce, distribute, spread or send the slides/materials used
in this presentation or any part thereof to any person for any purpose (whether or not he/she and you belong to the same institution).
⚫ Any of the slides/materials used in this presentation or any information contained therein will not constitute any offer for sale or any subscription or purchase of securities. Any part of the
slides/materials used in this presentation will not constitute a basis for any contract, undertaking or investment, and any contract, undertaking or investment shall not rely on any part of the
slides/materials used in this presentation.
⚫ This presentation may contain forward-looking statements. These forward-looking statements are based on a series of assumptions regarding the operation of the Bank and some factors beyond
the control of the Bank. Such assumptions may have significant risks and are affected by unknown factors, and such factors may cause actual results to differ materially from those in the
forward-looking statements in this document. The Bank is not responsible for updating the forward-looking statements regarding the events or circumstances occurring after the date of the
presentation.
⚫ The information expressed or included in this presentation only reflects the situation as of the date of the presentation and is not updated as to the significant progress occurring after the date of
the presentation. This presentation and the information contained therein shall not be deemed or relied upon as a complete and comprehensive analysis of the Bank's finances, operations or
prospects. Some of the information is still in the draft stage.
⚫ This document also contains a number of information and statistics concerning China's banking sector, which is obtained from an external unofficial source by the Bank and has not been
independently audited. The Bank can not guarantee that such source is of the same standards as those of other industries or are comparable to the accuracy and completeness of the relevant
information in other industries. You shall not heavily rely on any statements concerning China's banking sector in this presentation. The information contained in this presentation is not a due
diligence review and shall not be considered as a due diligence review. The information contained in this presentation has not been verified by an independent third party. No person has made
any express or implicit representations or warranties with respect to the impartiality, accuracy, completeness or correctness of the information and opinions contained in this presentation, and no
one shall rely on the impartiality, accuracy, completeness or correctness of such information or opinions. The Bank, its advisers, or their respective directors, senior executives, employees, agents
or advisors are not responsible for this document or its contents and are not liable for any loss arising from any use of this document or its contents (due to negligence or any other reason) or any
loss arising out of or in connection with this document in any other way. The above persons do not have any fiduciary responsibility for this presentation to you.
Notes: 1. Unless otherwise specified, the data in this presentation is all in line with IFRSs and is presented in RMB.
2. Some of the data has been rounded based on the data in the periodic reports.
1
Contents
2
Business Highlights
01
Outlook
02
3
01 Business Highlights
Key Financial Indicators
4
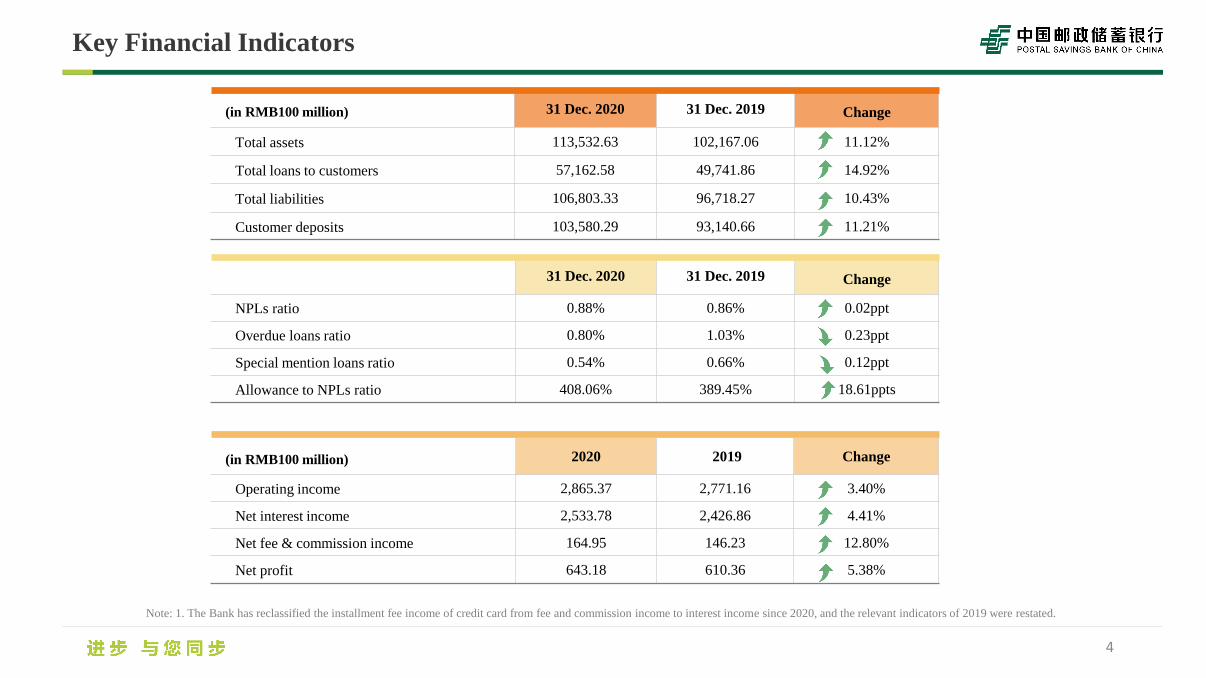
(in RMB100 million) 31 Dec. 2020 31 Dec. 2019 Change
Total assets 113,532.63 102,167.06 11.12%
Total loans to customers 57,162.58 49,741.86 14.92%
Total liabilities 106,803.33 96,718.27 10.43%
Customer deposits 103,580.29 93,140.66 11.21%
31 Dec. 2020 31 Dec. 2019 Change
NPLs ratio 0.88% 0.86% 0.02ppt
Overdue loans ratio 0.80% 1.03% 0.23ppt
Special mention loans ratio 0.54% 0.66% 0.12ppt
Allowance to NPLs ratio 408.06% 389.45% 18.61ppts
(in RMB100 million) 2020 2019 Change
Operating income 2,865.37 2,771.16 3.40%
Net interest income 2,533.78 2,426.86 4.41%
Net fee & commission income 164.95 146.23 12.80%
Net profit 643.18 610.36 5.38%
Note: 1. The Bank has reclassified the installment fee income of credit card from fee and commission income to interest income since 2020, and the relevant indicators of 2019 were restated.
Business Highlights
5
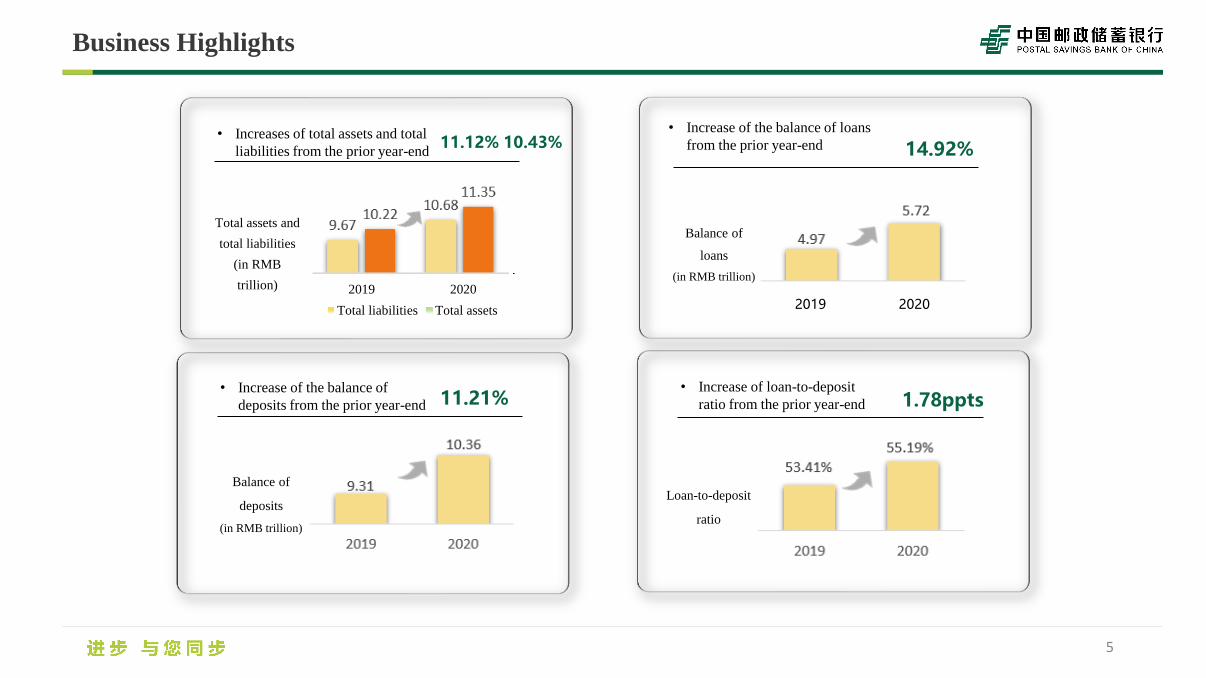
• Increases of total assets and total
liabilities from the prior year-end
Total assets and
total liabilities
(in RMB
trillion)
9.67
10.68 10.22
11.35
2019 2020
Total liabilities Total assets
11.21%• Increase of the balance of
deposits from the prior year-end
Balance of
deposits
(in RMB trillion)
9.31
10.36
2019 2020
4.97
5.72
2019 2020
• Increase of the balance of loans
from the prior year-end
Balance of
loans
(in RMB trillion)
11.12% 10.43% 14.92%
1.78ppts• Increase of loan-to-deposit
ratio from the prior year-end
Loan-to-deposit
ratio
53.41%
55.19%
2019 2020
Business Highlights
6
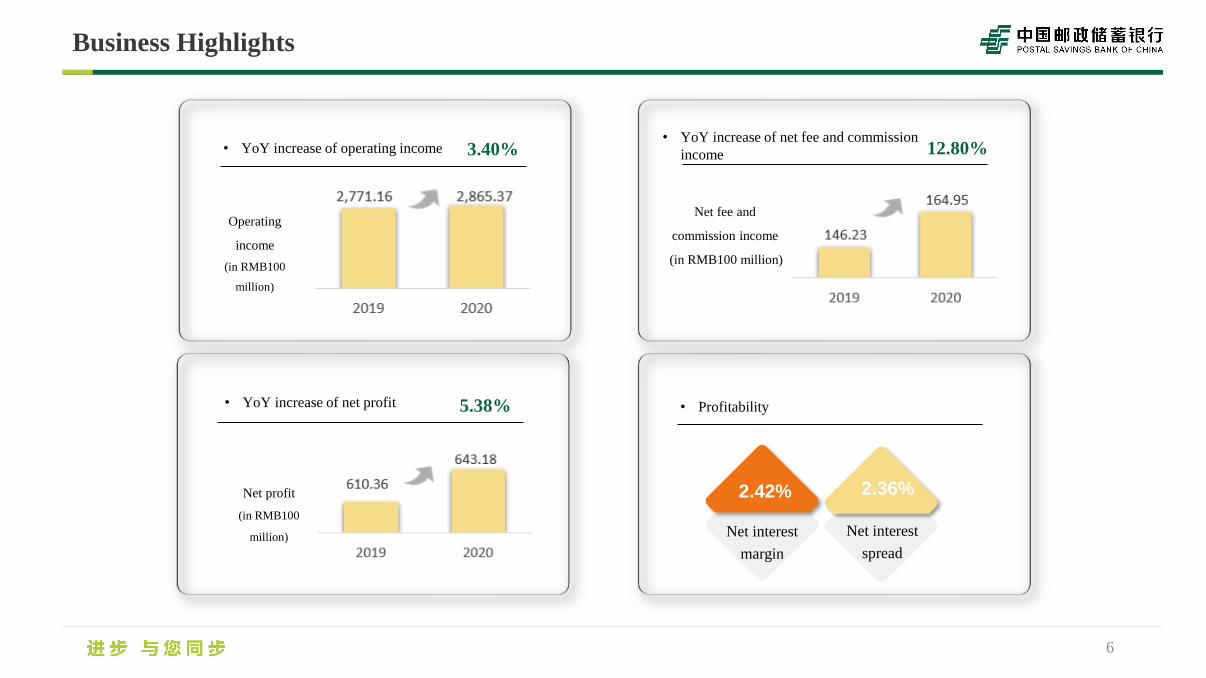
• YoY increase of operating income 3.40%
Operating
income
(in RMB100
million)
Net profit
(in RMB100
million)
• YoY increase of net profit 5.38%
• YoY increase of net fee and commission
income
Net fee and
commission income
(in RMB100 million)
12.80%
• Profitability
2.36%
Net interest
spread
2.42%
Net interest
margin
Business Highlights
7
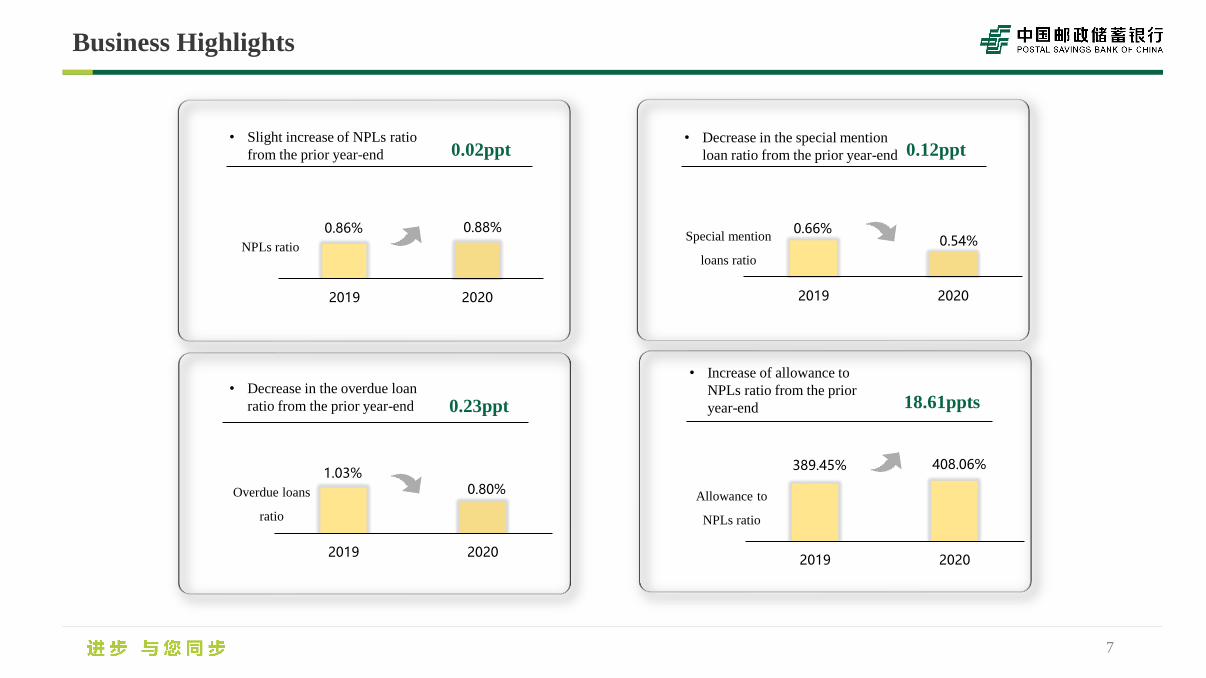
0.02ppt• Slight increase of NPLs ratio
from the prior year-end
NPLs ratio
• Decrease in the overdue loan
ratio from the prior year-end
0.86% 0.88%
2019 2020
389.45% 408.06%
2019 2020
• Increase of allowance to
NPLs ratio from the prior
year-end
Allowance to
NPLs ratio
18.61ppts
0.12ppt• Decrease in the special mention
loan ratio from the prior year-end
Special mention
loans ratio
0.66%0.54%
2019 2020
Overdue loans
ratio
1.03%0.80%
2019 2020
0.23ppt
8
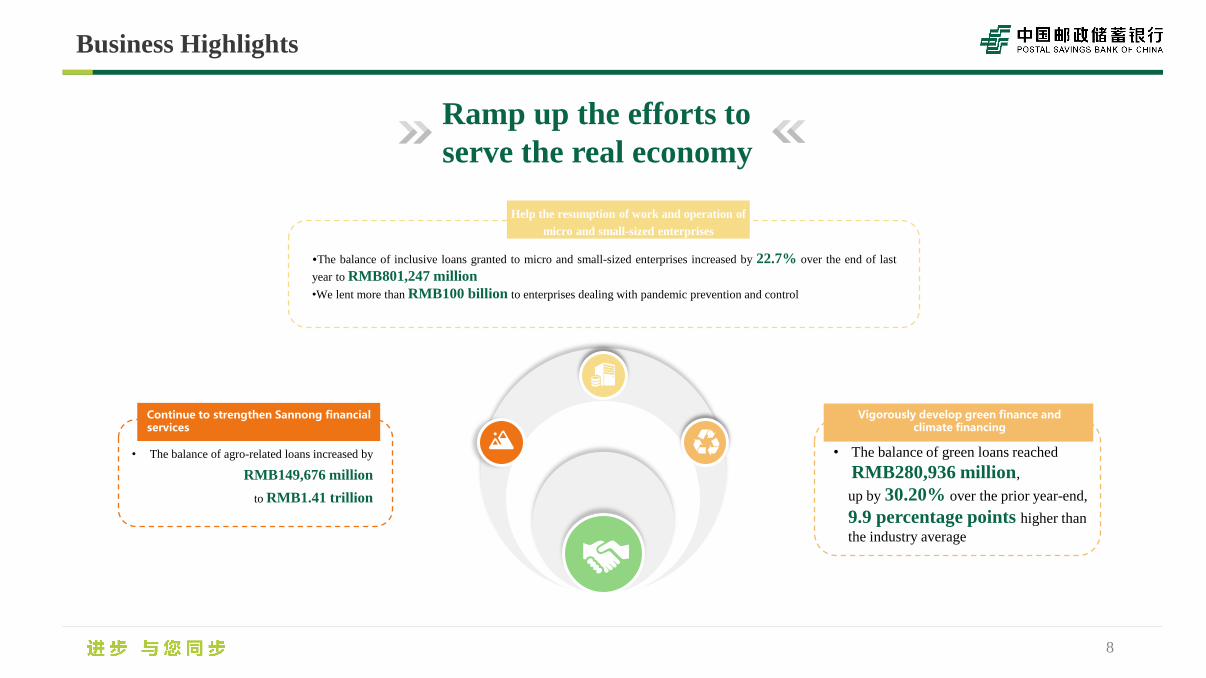
Ramp up the efforts to
serve the real economy
• The balance of agro-related loans increased by
RMB149,676 million
to RMB1.41 trillion
Continue to strengthen Sannong financial services
Vigorously develop green finance and climate financing
•The balance of inclusive loans granted to micro and small-sized enterprises increased by 22.7% over the end of last
year to RMB801,247 million
•We lent more than RMB100 billion to enterprises dealing with pandemic prevention and control
Help the resumption of work and operation of
micro and small-sized enterprises
• The balance of green loans reached
RMB280,936 million,
up by 30.20% over the prior year-end,
9.9 percentage points higher than
the industry average
Business Highlights
Business Highlights
9
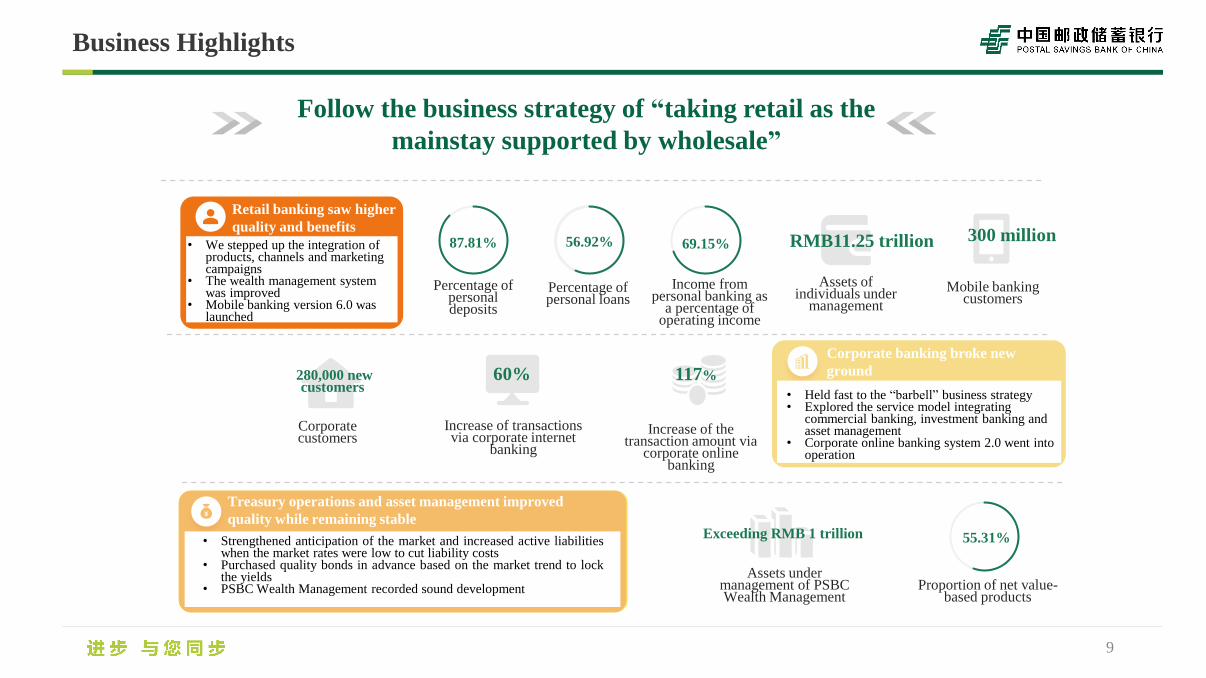
Follow the business strategy of “taking retail as the
mainstay supported by wholesale”
87.81%
Percentage of personal deposits
56.92%
Percentage of personal loans
69.15%
Income from personal banking as
a percentage of operating income
Assets of individuals under
management
Mobile banking customers
RMB11.25 trillion 300 million
280,000 new customers
Corporate customers
Increase of transactions via corporate internet
banking
60%
Increase of the transaction amount via
corporate online banking
117%
Assets under management of PSBC Wealth Management
Exceeding RMB 1 trillion
Proportion of net value-based products
55.31%
Retail banking saw higher
quality and benefits
Corporate banking broke new
ground
Treasury operations and asset management improved
quality while remaining stable
• We stepped up the integration of products, channels and marketing campaigns
• The wealth management system was improved
• Mobile banking version 6.0 was launched
• Held fast to the “barbell” business strategy• Explored the service model integrating
commercial banking, investment banking and asset management
• Corporate online banking system 2.0 went into operation
• Strengthened anticipation of the market and increased active liabilitieswhen the market rates were low to cut liability costs
• Purchased quality bonds in advance based on the market trend to lockthe yields
• PSBC Wealth Management recorded sound development
Business Highlights
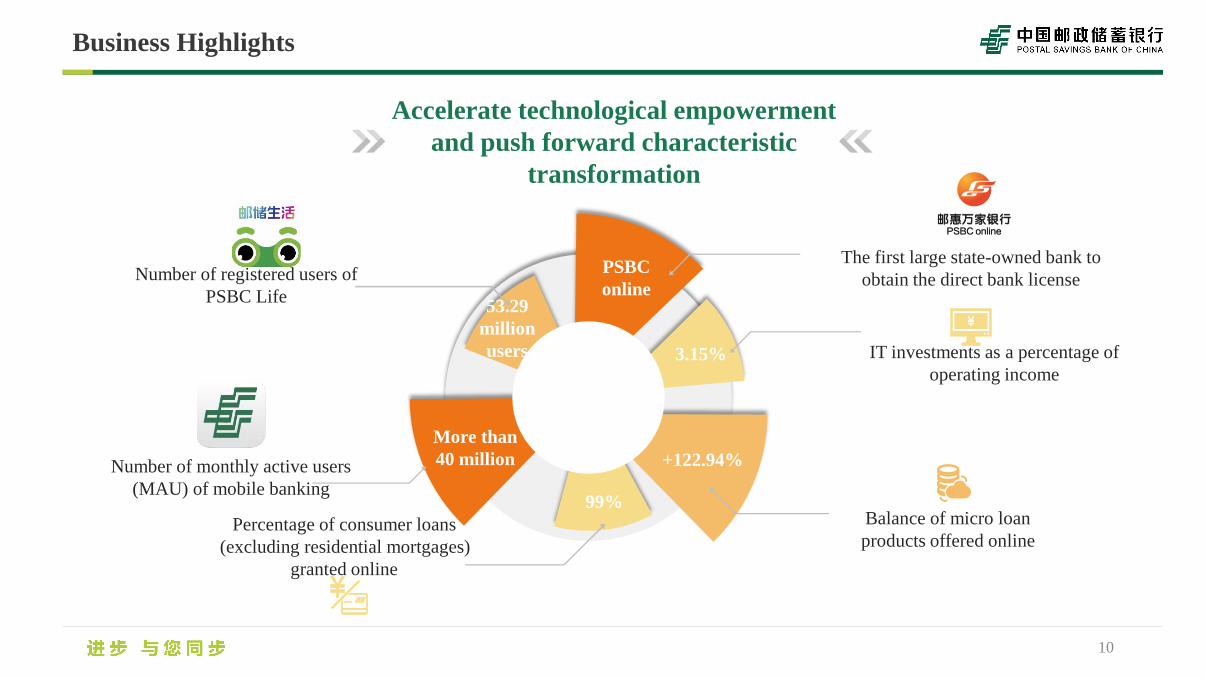
10
Number of monthly active users
(MAU) of mobile banking
Percentage of consumer loans
(excluding residential mortgages)
granted online
Number of registered users of
PSBC Life
The first large state-owned bank to
obtain the direct bank license
IT investments as a percentage of
operating income
Balance of micro loan
products offered online
Accelerate technological empowerment
and push forward characteristic
transformation
PSBC
online
+122.94%
3.15%
More than
40 million
53.29
million
users
99%
Business Highlights
11
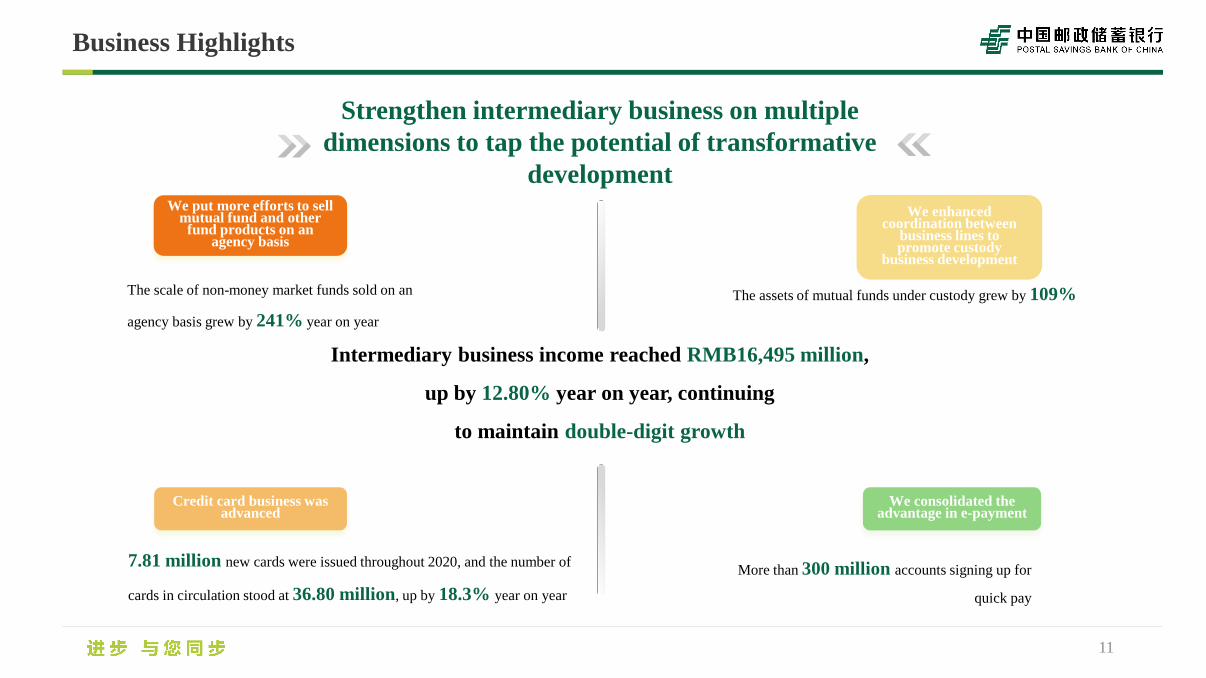
Strengthen intermediary business on multiple
dimensions to tap the potential of transformative
development
The scale of non-money market funds sold on an
agency basis grew by 241% year on year
We put more efforts to sell mutual fund and other
fund products on an agency basis
7.81 million new cards were issued throughout 2020, and the number of
cards in circulation stood at 36.80 million, up by 18.3% year on year
Credit card business was advanced
The assets of mutual funds under custody grew by 109%
We enhanced coordination between
business lines topromote custody
business development
More than 300 million accounts signing up for
quick pay
We consolidated the advantage in e-payment
Intermediary business income reached RMB16,495 million,
up by 12.80% year on year, continuing
to maintain double-digit growth
Business Highlights
12
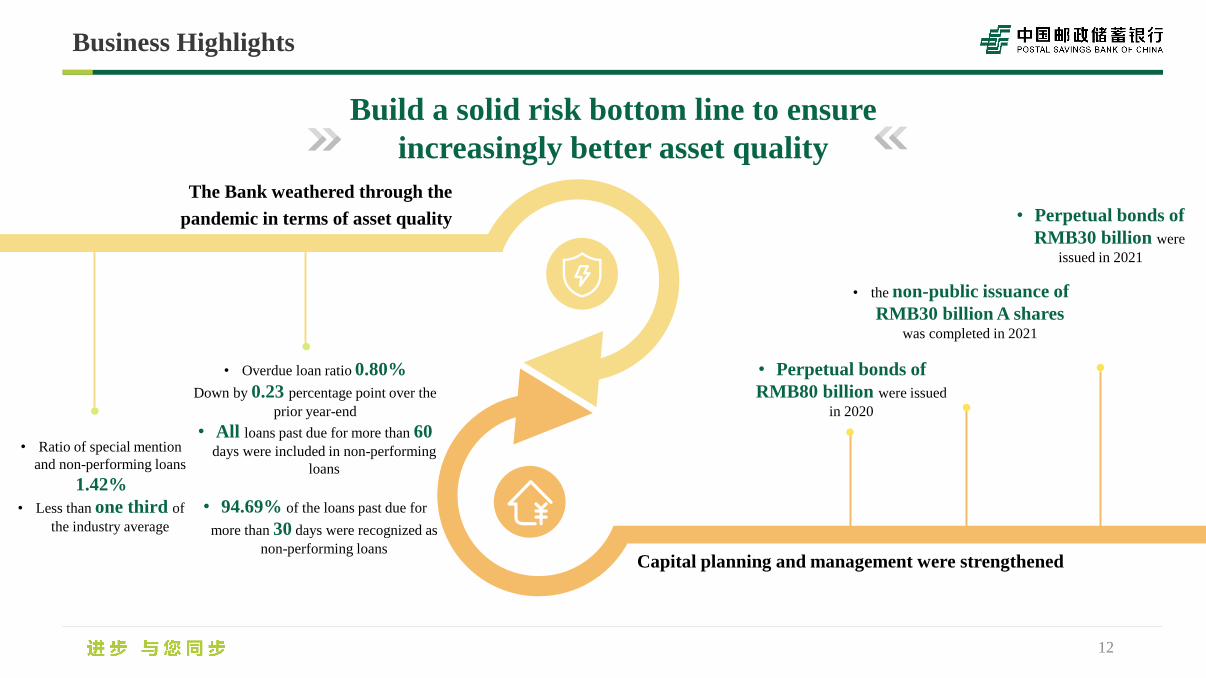
Build a solid risk bottom line to ensure
increasingly better asset quality
The Bank weathered through the
pandemic in terms of asset quality
• Ratio of special mention
and non-performing loans
1.42%
• Less than one third of
the industry average
• Overdue loan ratio 0.80%
Down by 0.23 percentage point over the
prior year-end
• All loans past due for more than 60 days were included in non-performing
loans
• 94.69% of the loans past due for
more than 30 days were recognized as
non-performing loans
• Perpetual bonds of
RMB80 billion were issued
in 2020
• the non-public issuance of
RMB30 billion A shares was completed in 2021
• Perpetual bonds of
RMB30 billion were
issued in 2021
Capital planning and management were strengthened
13
02 Outlook
Outlook
14
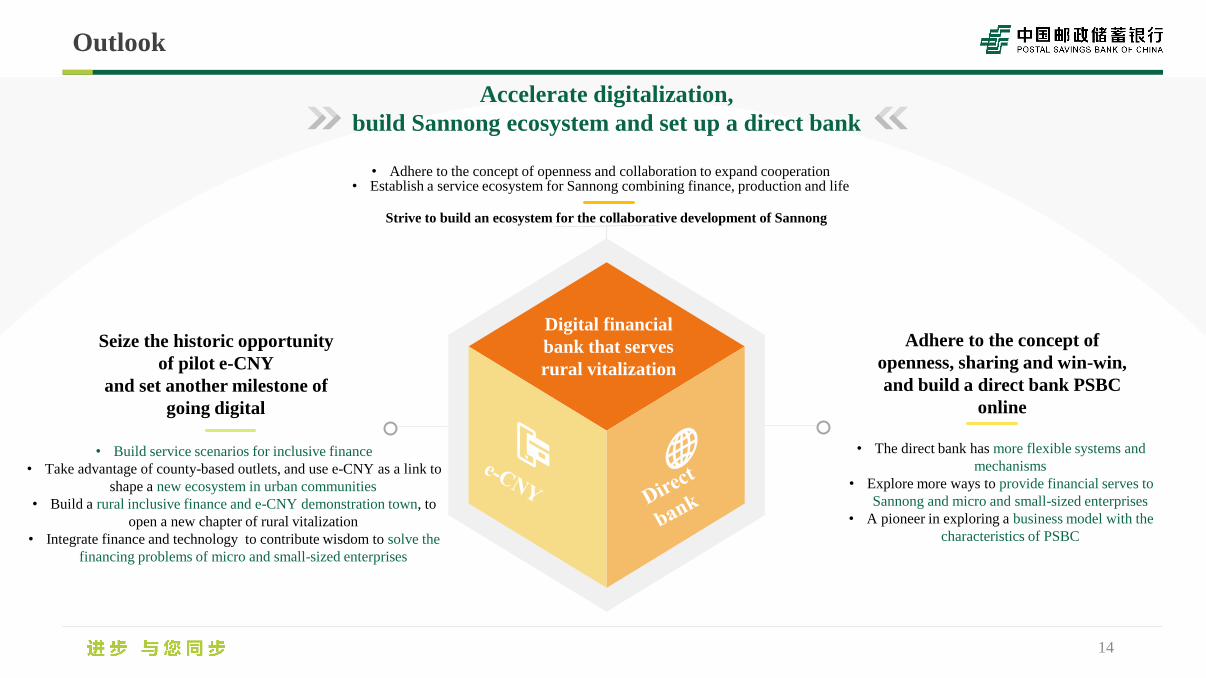
Adhere to the concept of
openness, sharing and win-win,
and build a direct bank PSBC
online
Digital financial
bank that serves
rural vitalization
• The direct bank has more flexible systems and
mechanisms
• Explore more ways to provide financial serves to
Sannong and micro and small-sized enterprises
• A pioneer in exploring a business model with the
characteristics of PSBC
Seize the historic opportunity
of pilot e-CNY
and set another milestone of
going digital
• Build service scenarios for inclusive finance
• Take advantage of county-based outlets, and use e-CNY as a link to
shape a new ecosystem in urban communities
• Build a rural inclusive finance and e-CNY demonstration town, to
open a new chapter of rural vitalization
• Integrate finance and technology to contribute wisdom to solve the
financing problems of micro and small-sized enterprises
Strive to build an ecosystem for the collaborative development of Sannong
• Adhere to the concept of openness and collaboration to expand cooperation• Establish a service ecosystem for Sannong combining finance, production and life
Accelerate digitalization,
build Sannong ecosystem and set up a direct bank
Outlook
15
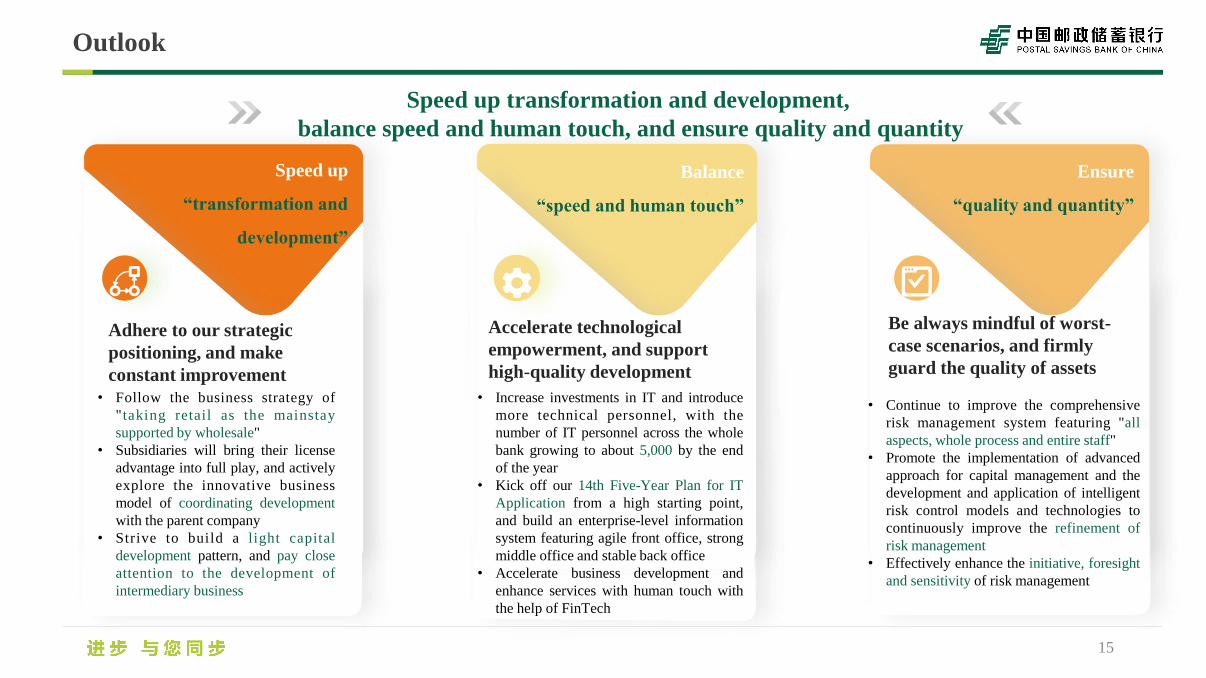
Adhere to our strategic
positioning, and make
constant improvement
Be always mindful of worst-
case scenarios, and firmly
guard the quality of assets
Speed up
“transformation and
development”
Balance
“speed and human touch”
Accelerate technological
empowerment, and support
high-quality development
Ensure
“quality and quantity”
Speed up transformation and development,
balance speed and human touch, and ensure quality and quantity
• Follow the business strategy of
"taking retail as the mainstay
supported by wholesale"
• Subsidiaries will bring their license
advantage into full play, and actively
explore the innovative business
model of coordinating development
with the parent company
• Strive to build a light capital
development pattern, and pay close
attention to the development of
intermediary business
• Increase investments in IT and introduce
more technical personnel, with the
number of IT personnel across the whole
bank growing to about 5,000 by the end
of the year
• Kick off our 14th Five-Year Plan for IT
Application from a high starting point,
and build an enterprise-level information
system featuring agile front office, strong
middle office and stable back office
• Accelerate business development and
enhance services with human touch with
the help of FinTech
• Continue to improve the comprehensive
risk management system featuring "all
aspects, whole process and entire staff"
• Promote the implementation of advanced
approach for capital management and the
development and application of intelligent
risk control models and technologies to
continuously improve the refinement of
risk management
• Effectively enhance the initiative, foresight
and sensitivity of risk management

THANKS!


![Massmart Results Presentation Final[1]](https://img.dokumen.tips/doc/110x75/635e420c6bc330780007cc7d/massmart-results-presentation-final1.jpg)


