Embed Size (px)
Citation preview
David McCall, Kevin Stanton (Intel)IEEE 802.1 TSN / 60802 Plenary, November 2021 Available at http://www.ieee802.org/1/files/public/docs2021
60802 Dynamic Time Sync Error –
Error Model & Monte Carlo Method Analysis
David McCall & Kevin Stanton (Intel)
November 2021 IEEE 802 Plenary – 802.1 TSN – IEEE/IEC 60802
v3
p. 2David McCall , Kevin Stanton (Intel)IEEE 802.1 TSN / 60802 Plenary, November 2021 Available at http://www.ieee802.org/1/files/public/docs2021
Abstract
• Industrial Automation Systems require microsecond-accurate time across long daisy-chains of devices using IEEE Std. 802.1AS™-2020 as specified by IEEE/IEC 60802.
• Simulated protocol and system parameters have thus far either been judged impractical or have failed to meet the time-accuracy requirement.
• An analysis of how errors accumulate suggested that a Monte Carlo method analysis could support fast iteration of potential scenarios and deliver insights into cause and effect.• See 60802-McCall-et-al-Time-Sync-Error-Model-0921-v03.pdf
• In this contribution we:• Describe a Monte Carlo method analysis programmed in Rstudio• Compare the analysis’ results to results from previous time series simulations• Present a detailed analysis of sensitivities and trade offs• Recommend approaches to achieve the stated goals and propose next steps
p. 3David McCall , Kevin Stanton (Intel)IEEE 802.1 TSN / 60802 Plenary, November 2021 Available at http://www.ieee802.org/1/files/public/docs2021
Content
• Background & Recap
• Which Errors to Model & How They Add Up
• Monte Carlo Method Analysis Overview (RStudio)
• Comparison with Time Series Simulations• 7-Sigma Limit
• Error Analysis• Graphical Representation
• Sensitivities & Trade Offs
• Recommendations & Next Steps
p. 4David McCall , Kevin Stanton (Intel)IEEE 802.1 TSN / 60802 Plenary, November 2021 Available at http://www.ieee802.org/1/files/public/docs2021
Background & Recap
4
p. 5David McCall , Kevin Stanton (Intel)IEEE 802.1 TSN / 60802 Plenary, November 2021 Available at http://www.ieee802.org/1/files/public/docs2021
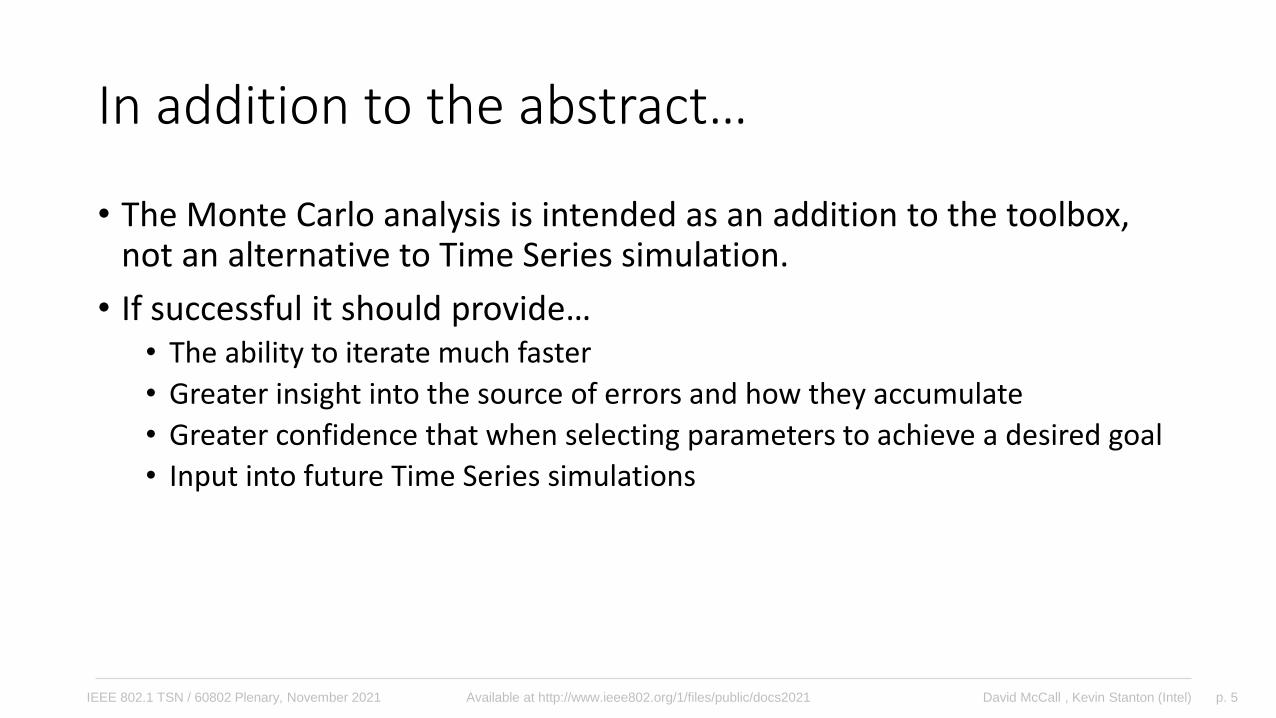
In addition to the abstract…
• The Monte Carlo analysis is intended as an addition to the toolbox, not an alternative to Time Series simulation.
• If successful it should provide…• The ability to iterate much faster
• Greater insight into the source of errors and how they accumulate
• Greater confidence that when selecting parameters to achieve a desired goal
• Input into future Time Series simulations
p. 6David McCall , Kevin Stanton (Intel)IEEE 802.1 TSN / 60802 Plenary, November 2021 Available at http://www.ieee802.org/1/files/public/docs2021
Which Errors to Model& How They Add Up
6
p. 7David McCall , Kevin Stanton (Intel)IEEE 802.1 TSN / 60802 Plenary, November 2021 Available at http://www.ieee802.org/1/files/public/docs2021
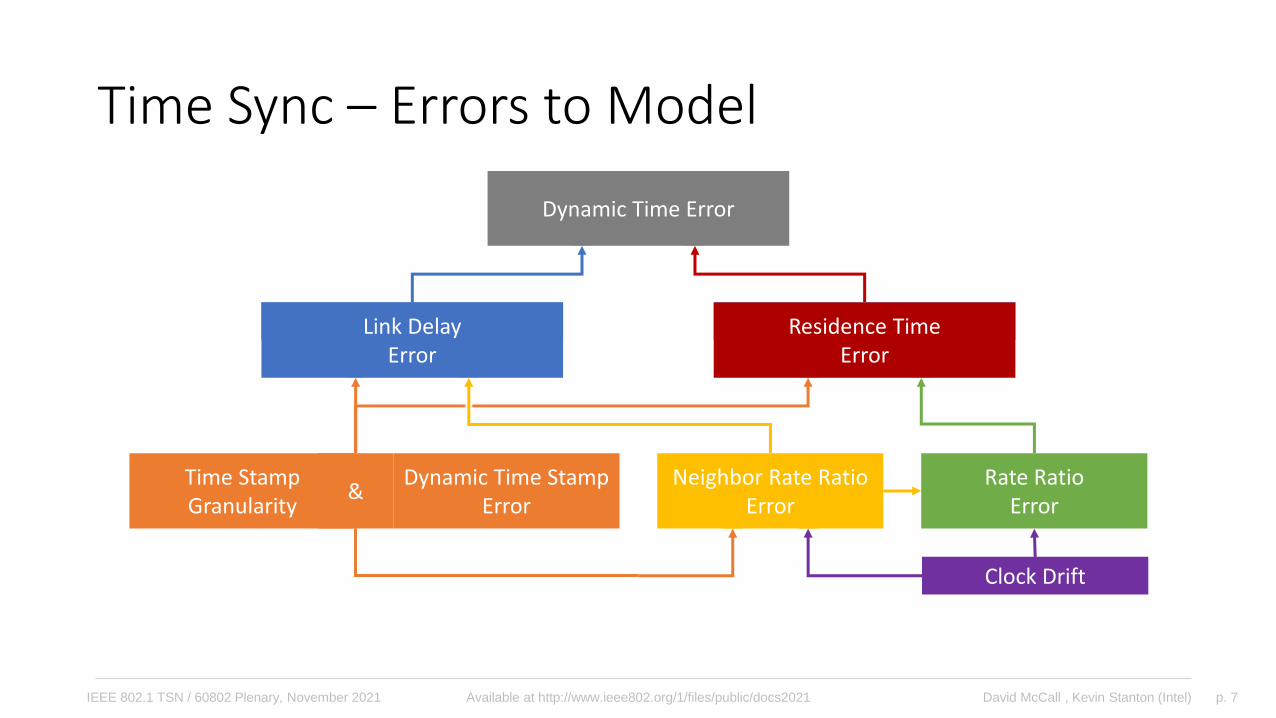
Time Sync – Errors to Model
Dynamic Time Error
Time Stamp Granularity
pDelay Residence Time
Dynamic Time Stamp Error
Clock Drift
Residence TimeError
Rate RatioError
&Neighbor Rate Ratio
Error
Link DelayError
p. 8David McCall , Kevin Stanton (Intel)IEEE 802.1 TSN / 60802 Plenary, November 2021 Available at http://www.ieee802.org/1/files/public/docs2021
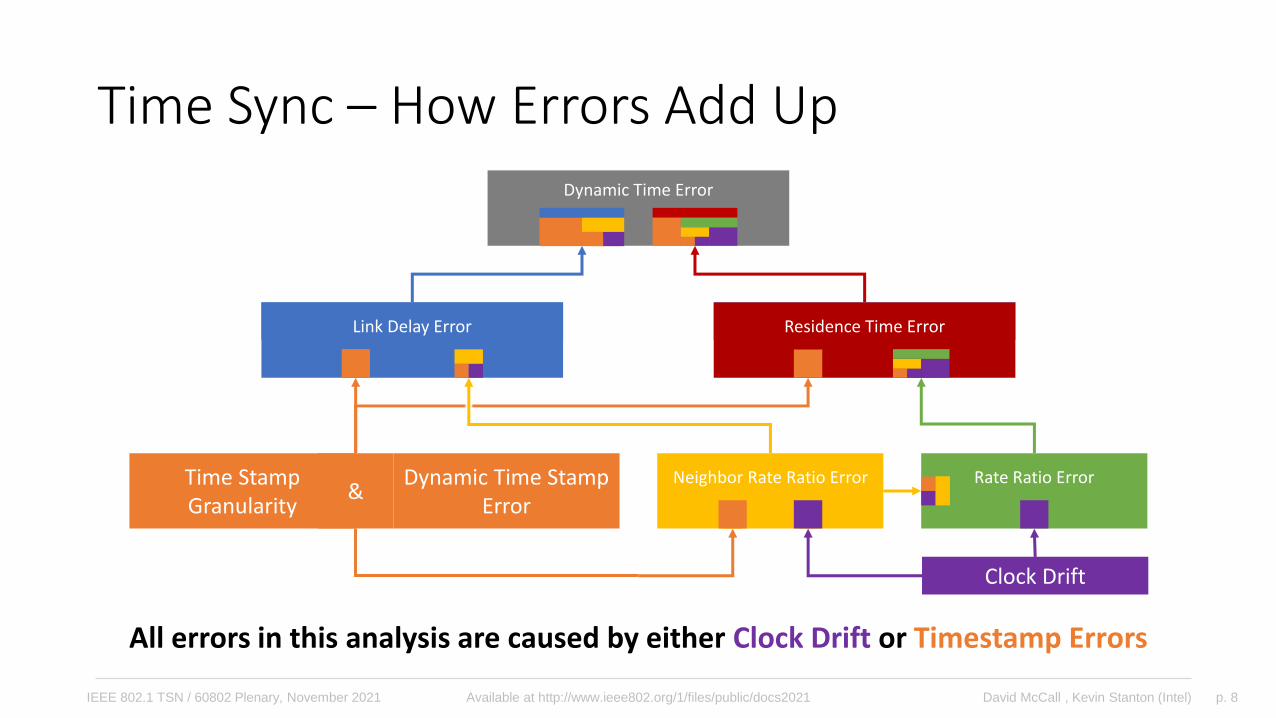
Time Sync – How Errors Add Up
Time Stamp Granularity
pDelay Residence Time
Dynamic Time Stamp Error
Clock Drift
&
Link Delay Error Residence Time Error
Dynamic Time Error
Rate Ratio ErrorNeighbor Rate Ratio Error
All errors in this analysis are caused by either Clock Drift or Timestamp Errors
p. 9David McCall , Kevin Stanton (Intel)IEEE 802.1 TSN / 60802 Plenary, November 2021 Available at http://www.ieee802.org/1/files/public/docs2021
Monte Carlo Method AnalysisOverview of the modelling approach and analysis tool built in RStudio
9
p. 10David McCall , Kevin Stanton (Intel)IEEE 802.1 TSN / 60802 Plenary, November 2021 Available at http://www.ieee802.org/1/files/public/docs2021
Monte Carlo Method Analysis
• Inputs
• Errors, Formulae & Observations
• R & RStudio• Script code availability
• Demo
10
p. 11David McCall , Kevin Stanton (Intel)IEEE 802.1 TSN / 60802 Plenary, November 2021 Available at http://www.ieee802.org/1/files/public/docs2021
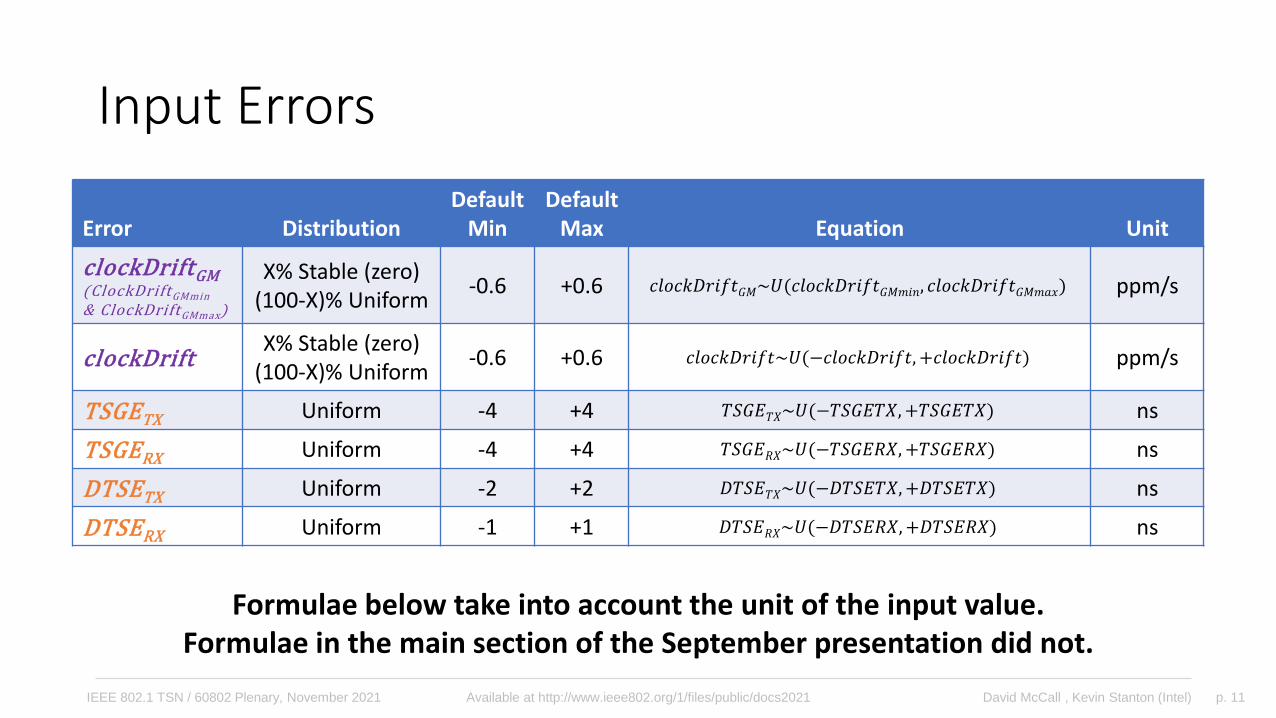
Input Errors
Error DistributionDefault
MinDefault
Max Equation Unit
clockDriftGM(ClockDriftGMmin
& ClockDriftGMmax)
X% Stable (zero)(100-X)% Uniform
-0.6 +0.6 𝑐𝑙𝑜𝑐𝑘𝐷𝑟𝑖𝑓𝑡𝐺𝑀~𝑈(𝑐𝑙𝑜𝑐𝑘𝐷𝑟𝑖𝑓𝑡𝐺𝑀𝑚𝑖𝑛, 𝑐𝑙𝑜𝑐𝑘𝐷𝑟𝑖𝑓𝑡𝐺𝑀𝑚𝑎𝑥) ppm/s
clockDriftX% Stable (zero)
(100-X)% Uniform-0.6 +0.6 𝑐𝑙𝑜𝑐𝑘𝐷𝑟𝑖𝑓𝑡~𝑈(−𝑐𝑙𝑜𝑐𝑘𝐷𝑟𝑖𝑓𝑡, +𝑐𝑙𝑜𝑐𝑘𝐷𝑟𝑖𝑓𝑡) ppm/s
TSGETX Uniform -4 +4 𝑇𝑆𝐺𝐸𝑇𝑋~𝑈(−𝑇𝑆𝐺𝐸𝑇𝑋,+𝑇𝑆𝐺𝐸𝑇𝑋) ns
TSGERX Uniform -4 +4 𝑇𝑆𝐺𝐸𝑅𝑋~𝑈(−𝑇𝑆𝐺𝐸𝑅𝑋,+𝑇𝑆𝐺𝐸𝑅𝑋) ns
DTSETX Uniform -2 +2 𝐷𝑇𝑆𝐸𝑇𝑋~𝑈(−𝐷𝑇𝑆𝐸𝑇𝑋,+𝐷𝑇𝑆𝐸𝑇𝑋) ns
DTSERX Uniform -1 +1 𝐷𝑇𝑆𝐸𝑅𝑋~𝑈(−𝐷𝑇𝑆𝐸𝑅𝑋,+𝐷𝑇𝑆𝐸𝑅𝑋) ns
Formulae below take into account the unit of the input value.Formulae in the main section of the September presentation did not.
p. 12David McCall , Kevin Stanton (Intel)IEEE 802.1 TSN / 60802 Plenary, November 2021 Available at http://www.ieee802.org/1/files/public/docs2021
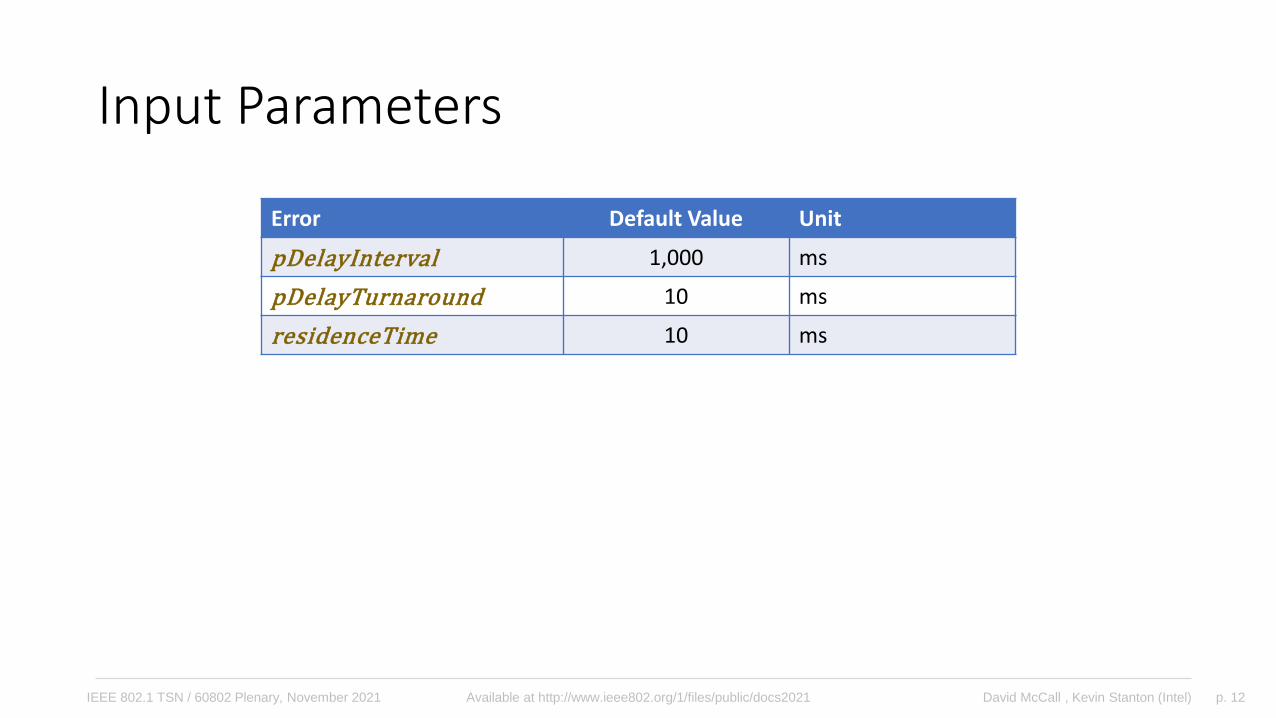
Input Parameters
Error Default Value Unit
pDelayInterval 1,000 ms
pDelayTurnaround 10 ms
residenceTime 10 ms
p. 13David McCall , Kevin Stanton (Intel)IEEE 802.1 TSN / 60802 Plenary, November 2021 Available at http://www.ieee802.org/1/files/public/docs2021
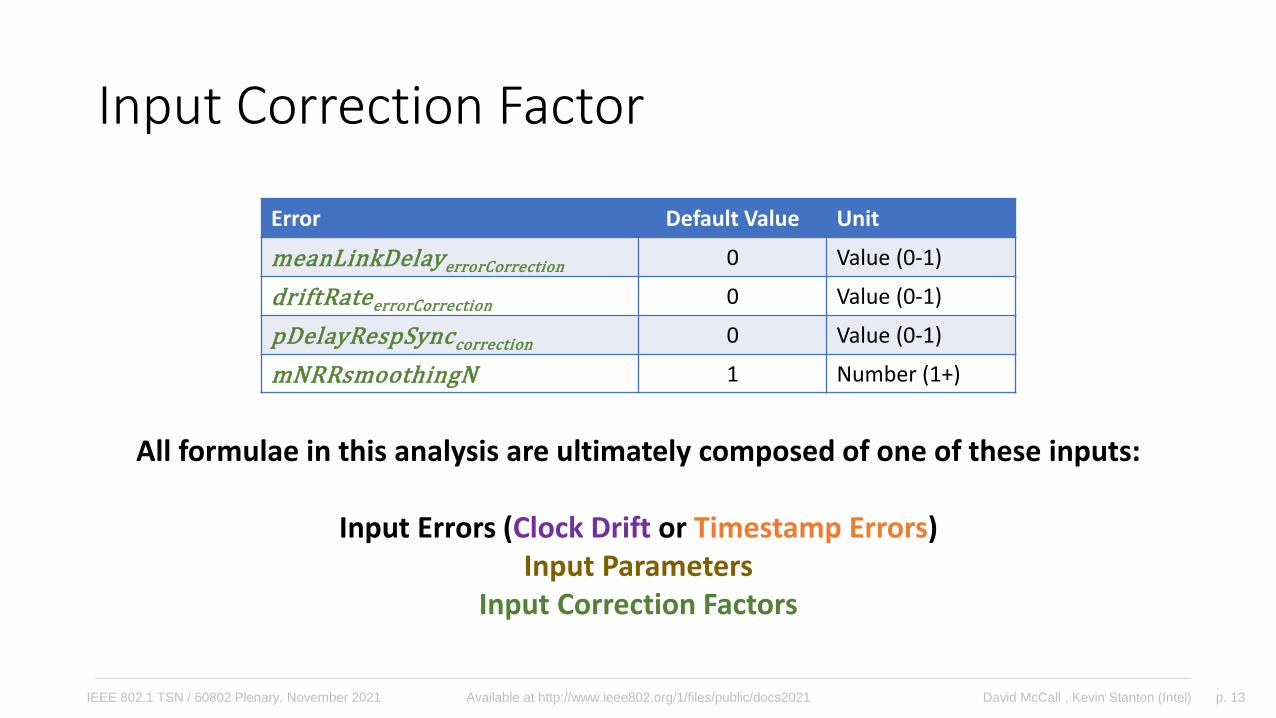
Input Correction Factor
Error Default Value Unit
meanLinkDelayerrorCorrection 0 Value (0-1)
driftRateerrorCorrection 0 Value (0-1)
pDelayRespSynccorrection 0 Value (0-1)
mNRRsmoothingN 1 Number (1+)
All formulae in this analysis are ultimately composed of one of these inputs:
Input Errors (Clock Drift or Timestamp Errors)Input Parameters
Input Correction Factors
p. 14David McCall , Kevin Stanton (Intel)IEEE 802.1 TSN / 60802 Plenary, November 2021 Available at http://www.ieee802.org/1/files/public/docs2021
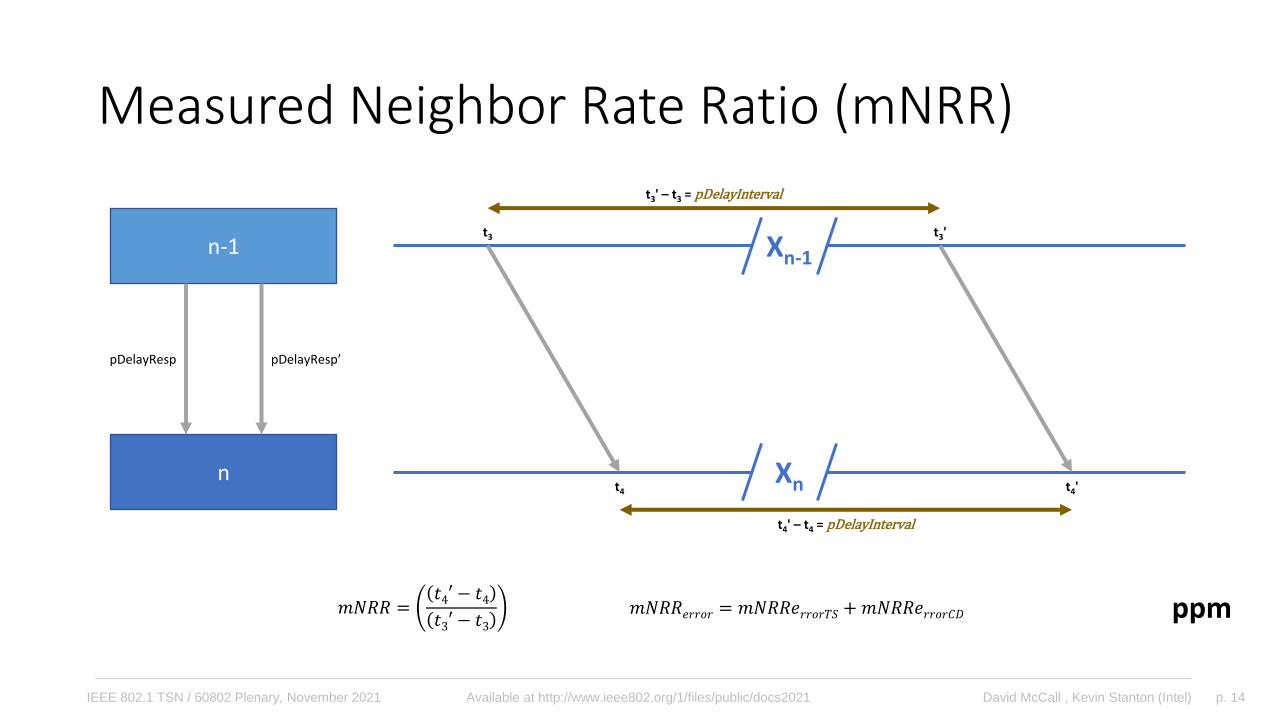
n-1
n
pDelayResp pDelayResp’
t3' – t3 = pDelayInterval
t4' – t4 = pDelayInterval
t4'
t3'
t4
t3
𝑚𝑁𝑅𝑅𝑒𝑟𝑟𝑜𝑟 = 𝑚𝑁𝑅𝑅𝑒𝑟𝑟𝑜𝑟𝑇𝑆 +𝑚𝑁𝑅𝑅𝑒𝑟𝑟𝑜𝑟𝐶𝐷 ppm
Xn-1
Xn
Measured Neighbor Rate Ratio (mNRR)
𝑚𝑁𝑅𝑅 =𝑡4′ − 𝑡4𝑡3′ − 𝑡3
p. 15David McCall , Kevin Stanton (Intel)IEEE 802.1 TSN / 60802 Plenary, November 2021 Available at http://www.ieee802.org/1/files/public/docs2021
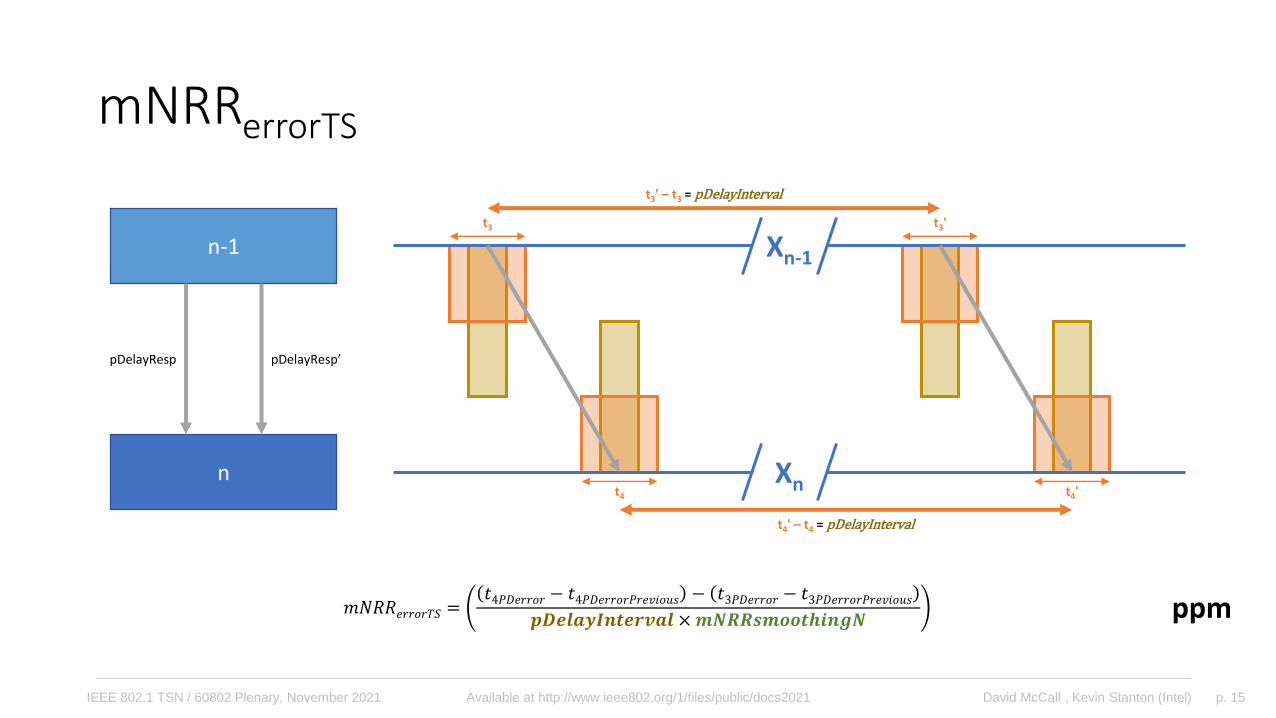
n-1
n
pDelayResp pDelayResp’
t3' – t3 = pDelayInterval
t4' – t4 = pDelayInterval
t4'
t3'
t4
t3
𝑚𝑁𝑅𝑅𝑒𝑟𝑟𝑜𝑟𝑇𝑆 =𝑡4𝑃𝐷𝑒𝑟𝑟𝑜𝑟 − 𝑡4𝑃𝐷𝑒𝑟𝑟𝑜𝑟𝑃𝑟𝑒𝑣𝑖𝑜𝑢𝑠 − 𝑡3𝑃𝐷𝑒𝑟𝑟𝑜𝑟 − 𝑡3𝑃𝐷𝑒𝑟𝑟𝑜𝑟𝑃𝑟𝑒𝑣𝑖𝑜𝑢𝑠
𝒑𝑫𝒆𝒍𝒂𝒚𝑰𝒏𝒕𝒆𝒓𝒗𝒂𝒍 ×𝒎𝑵𝑹𝑹𝒔𝒎𝒐𝒐𝒕𝒉𝒊𝒏𝒈𝑵 ppm
Xn-1
Xn
mNRRerrorTS
p. 16David McCall , Kevin Stanton (Intel)IEEE 802.1 TSN / 60802 Plenary, November 2021 Available at http://www.ieee802.org/1/files/public/docs2021
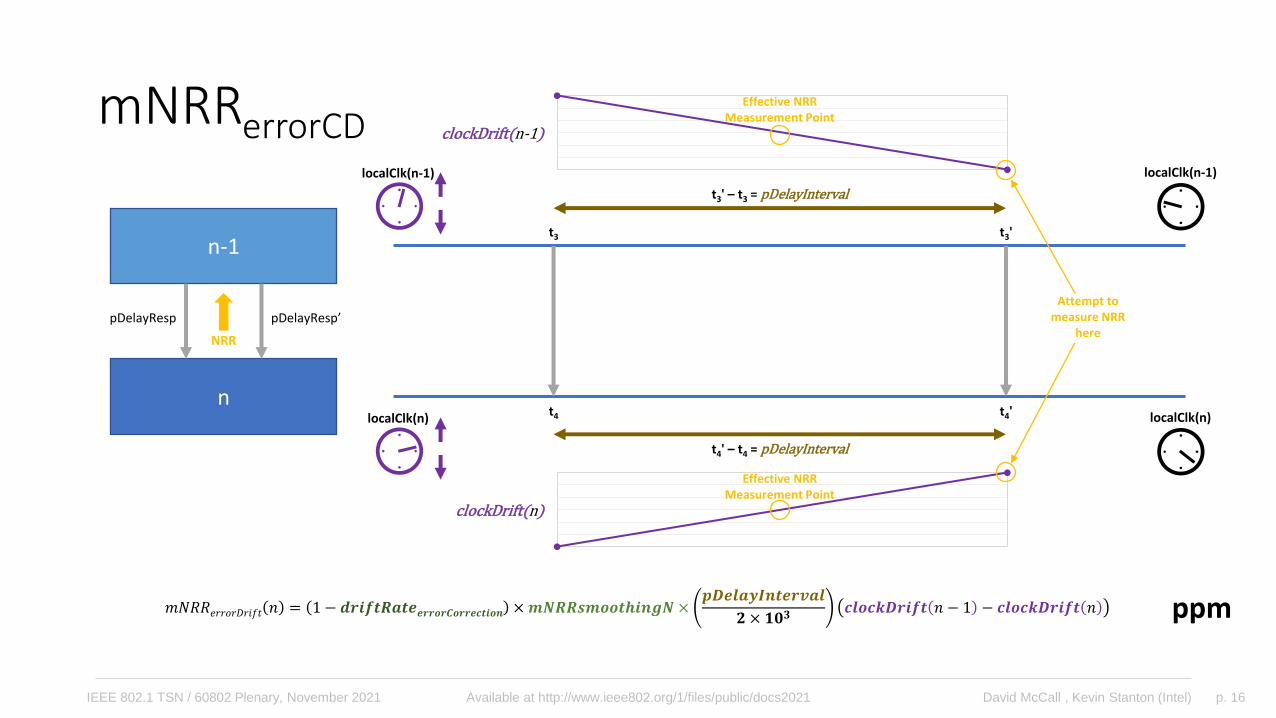
n-1
n
pDelayResp pDelayResp’
NRR
t3' – t3 = pDelayInterval
t4' – t4 = pDelayInterval
localClk(n-1)
localClk(n)
localClk(n-1)
localClk(n)t4'
t3'
t4
t3
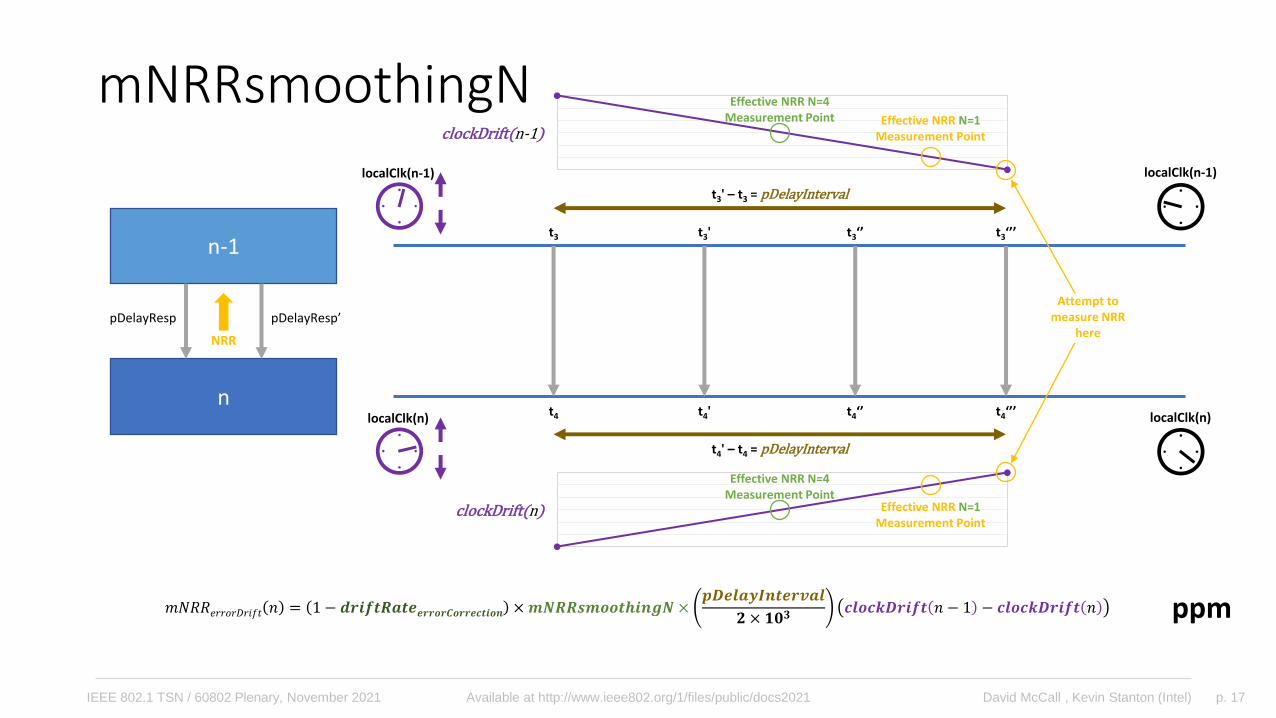
ppm𝑚𝑁𝑅𝑅𝑒𝑟𝑟𝑜𝑟𝐷𝑟𝑖𝑓𝑡 𝑛 = 1 − 𝒅𝒓𝒊𝒇𝒕𝑹𝒂𝒕𝒆𝒆𝒓𝒓𝒐𝒓𝑪𝒐𝒓𝒓𝒆𝒄𝒕𝒊𝒐𝒏 ×𝒎𝑵𝑹𝑹𝒔𝒎𝒐𝒐𝒕𝒉𝒊𝒏𝒈𝑵 ×𝒑𝑫𝒆𝒍𝒂𝒚𝑰𝒏𝒕𝒆𝒓𝒗𝒂𝒍
𝟐 × 𝟏𝟎𝟑𝒄𝒍𝒐𝒄𝒌𝑫𝒓𝒊𝒇𝒕 𝑛 − 1 − 𝒄𝒍𝒐𝒄𝒌𝑫𝒓𝒊𝒇𝒕 𝑛
mNRRerrorCD clockDrift(n-1)
clockDrift(n)
Effective NRRMeasurement Point
Effective NRRMeasurement Point
Attempt tomeasure NRR
here
p. 17David McCall , Kevin Stanton (Intel)IEEE 802.1 TSN / 60802 Plenary, November 2021 Available at http://www.ieee802.org/1/files/public/docs2021
n-1
n
pDelayResp pDelayResp’
NRR
t3' – t3 = pDelayInterval
t4' – t4 = pDelayInterval
localClk(n-1)
localClk(n)
localClk(n-1)
localClk(n)t4‘’’
t3‘’’
t4
t3
ppm𝑚𝑁𝑅𝑅𝑒𝑟𝑟𝑜𝑟𝐷𝑟𝑖𝑓𝑡 𝑛 = 1 − 𝒅𝒓𝒊𝒇𝒕𝑹𝒂𝒕𝒆𝒆𝒓𝒓𝒐𝒓𝑪𝒐𝒓𝒓𝒆𝒄𝒕𝒊𝒐𝒏 ×𝒎𝑵𝑹𝑹𝒔𝒎𝒐𝒐𝒕𝒉𝒊𝒏𝒈𝑵 ×𝒑𝑫𝒆𝒍𝒂𝒚𝑰𝒏𝒕𝒆𝒓𝒗𝒂𝒍
𝟐 × 𝟏𝟎𝟑𝒄𝒍𝒐𝒄𝒌𝑫𝒓𝒊𝒇𝒕 𝑛 − 1 − 𝒄𝒍𝒐𝒄𝒌𝑫𝒓𝒊𝒇𝒕 𝑛
mNRRsmoothingNclockDrift(n-1)
clockDrift(n)
Effective NRR N=1Measurement Point
Effective NRR N=1Measurement Point
Attempt tomeasure NRR
here
t4‘’
t3‘’
t4'
t3'
Effective NRR N=4Measurement Point
Effective NRR N=4Measurement Point
p. 18David McCall , Kevin Stanton (Intel)IEEE 802.1 TSN / 60802 Plenary, November 2021 Available at http://www.ieee802.org/1/files/public/docs2021
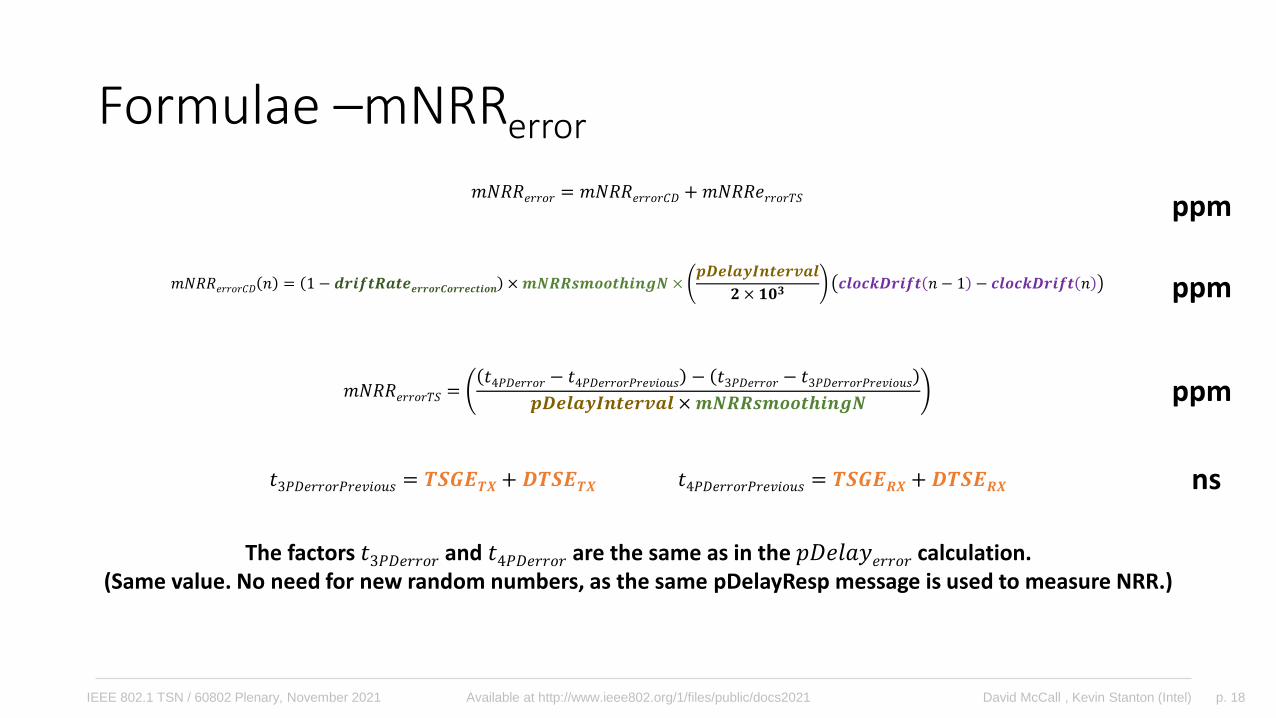
Formulae –mNRRerror
𝑚𝑁𝑅𝑅𝑒𝑟𝑟𝑜𝑟𝑇𝑆 =𝑡4𝑃𝐷𝑒𝑟𝑟𝑜𝑟 − 𝑡4𝑃𝐷𝑒𝑟𝑟𝑜𝑟𝑃𝑟𝑒𝑣𝑖𝑜𝑢𝑠 − 𝑡3𝑃𝐷𝑒𝑟𝑟𝑜𝑟 − 𝑡3𝑃𝐷𝑒𝑟𝑟𝑜𝑟𝑃𝑟𝑒𝑣𝑖𝑜𝑢𝑠
𝒑𝑫𝒆𝒍𝒂𝒚𝑰𝒏𝒕𝒆𝒓𝒗𝒂𝒍 ×𝒎𝑵𝑹𝑹𝒔𝒎𝒐𝒐𝒕𝒉𝒊𝒏𝒈𝑵
ns
The factors 𝑡3𝑃𝐷𝑒𝑟𝑟𝑜𝑟 and 𝑡4𝑃𝐷𝑒𝑟𝑟𝑜𝑟 are the same as in the 𝑝𝐷𝑒𝑙𝑎𝑦𝑒𝑟𝑟𝑜𝑟 calculation.(Same value. No need for new random numbers, as the same pDelayResp message is used to measure NRR.)
𝑚𝑁𝑅𝑅𝑒𝑟𝑟𝑜𝑟𝐶𝐷 𝑛 = 1 − 𝒅𝒓𝒊𝒇𝒕𝑹𝒂𝒕𝒆𝒆𝒓𝒓𝒐𝒓𝑪𝒐𝒓𝒓𝒆𝒄𝒕𝒊𝒐𝒏 ×𝒎𝑵𝑹𝑹𝒔𝒎𝒐𝒐𝒕𝒉𝒊𝒏𝒈𝑵 ×𝒑𝑫𝒆𝒍𝒂𝒚𝑰𝒏𝒕𝒆𝒓𝒗𝒂𝒍
𝟐 × 𝟏𝟎𝟑𝒄𝒍𝒐𝒄𝒌𝑫𝒓𝒊𝒇𝒕 𝑛 − 1 − 𝒄𝒍𝒐𝒄𝒌𝑫𝒓𝒊𝒇𝒕 𝑛 ppm
𝑚𝑁𝑅𝑅𝑒𝑟𝑟𝑜𝑟 = 𝑚𝑁𝑅𝑅𝑒𝑟𝑟𝑜𝑟𝐶𝐷 +𝑚𝑁𝑅𝑅𝑒𝑟𝑟𝑜𝑟𝑇𝑆 ppm
𝑡3𝑃𝐷𝑒𝑟𝑟𝑜𝑟𝑃𝑟𝑒𝑣𝑖𝑜𝑢𝑠 = 𝑻𝑺𝑮𝑬𝑻𝑿+ 𝑫𝑻𝑺𝑬𝑻𝑿 𝑡4𝑃𝐷𝑒𝑟𝑟𝑜𝑟𝑃𝑟𝑒𝑣𝑖𝑜𝑢𝑠 = 𝑻𝑺𝑮𝑬𝑹𝑿 +𝑫𝑻𝑺𝑬𝑹𝑿
ppm
p. 19David McCall , Kevin Stanton (Intel)IEEE 802.1 TSN / 60802 Plenary, November 2021 Available at http://www.ieee802.org/1/files/public/docs2021
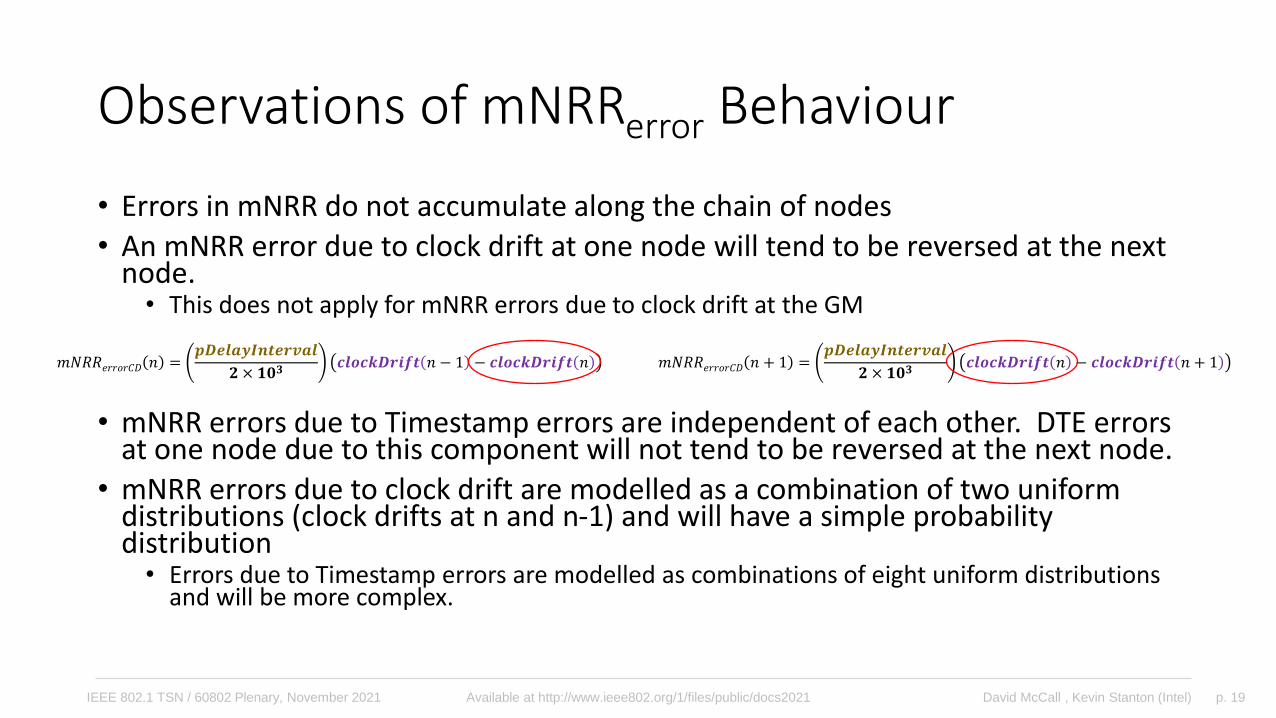
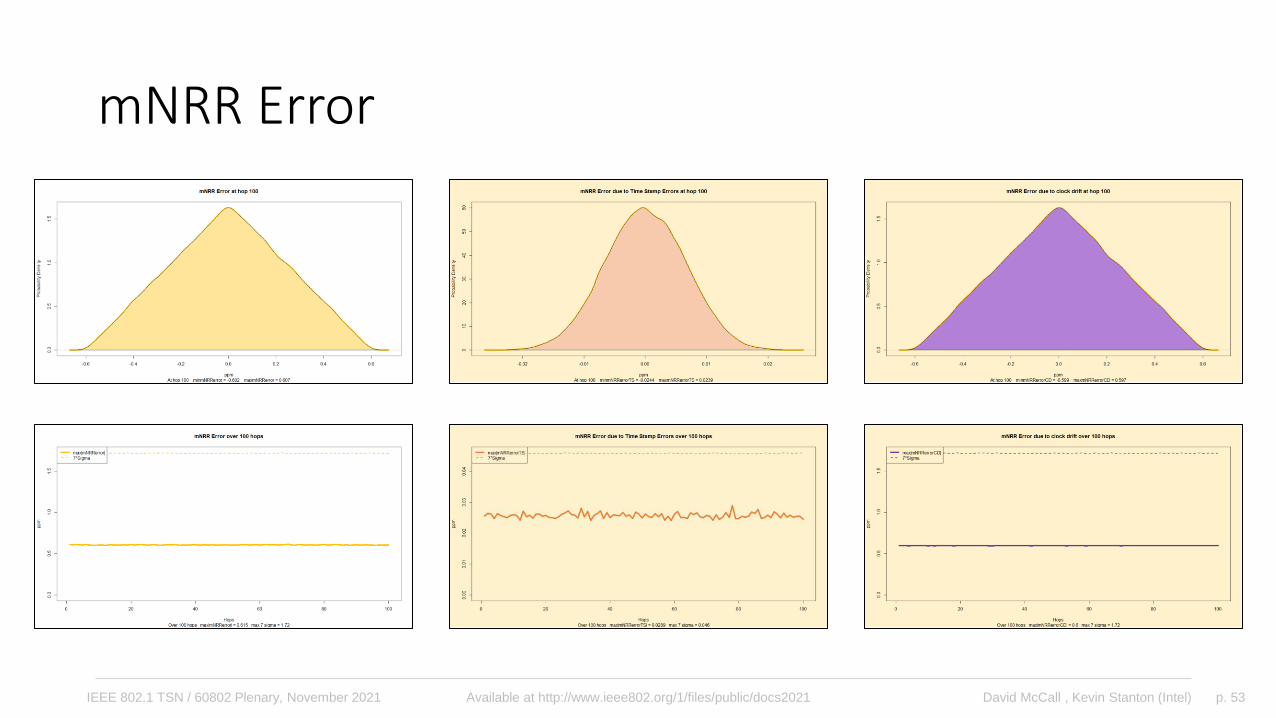
Observations of mNRRerror Behaviour
• Errors in mNRR do not accumulate along the chain of nodes
• An mNRR error due to clock drift at one node will tend to be reversed at the next node.• This does not apply for mNRR errors due to clock drift at the GM
• mNRR errors due to Timestamp errors are independent of each other. DTE errors at one node due to this component will not tend to be reversed at the next node.
• mNRR errors due to clock drift are modelled as a combination of two uniform distributions (clock drifts at n and n-1) and will have a simple probability distribution• Errors due to Timestamp errors are modelled as combinations of eight uniform distributions
and will be more complex.
𝑚𝑁𝑅𝑅𝑒𝑟𝑟𝑜𝑟𝐶𝐷 𝑛 + 1 =𝒑𝑫𝒆𝒍𝒂𝒚𝑰𝒏𝒕𝒆𝒓𝒗𝒂𝒍
𝟐 × 𝟏𝟎𝟑𝒄𝒍𝒐𝒄𝒌𝑫𝒓𝒊𝒇𝒕 𝑛 − 𝒄𝒍𝒐𝒄𝒌𝑫𝒓𝒊𝒇𝒕 𝑛 + 1𝑚𝑁𝑅𝑅𝑒𝑟𝑟𝑜𝑟𝐶𝐷 𝑛 =
𝒑𝑫𝒆𝒍𝒂𝒚𝑰𝒏𝒕𝒆𝒓𝒗𝒂𝒍
𝟐 × 𝟏𝟎𝟑𝒄𝒍𝒐𝒄𝒌𝑫𝒓𝒊𝒇𝒕 𝑛 − 1 − 𝒄𝒍𝒐𝒄𝒌𝑫𝒓𝒊𝒇𝒕 𝑛
p. 20David McCall , Kevin Stanton (Intel)IEEE 802.1 TSN / 60802 Plenary, November 2021 Available at http://www.ieee802.org/1/files/public/docs2021
+
RR(n-2)
NRR(n-2)
RR(n-3)+
RR(1)
NRR(n)
RR(n-1)+
NRR(1) NRR(n-2)
n-2
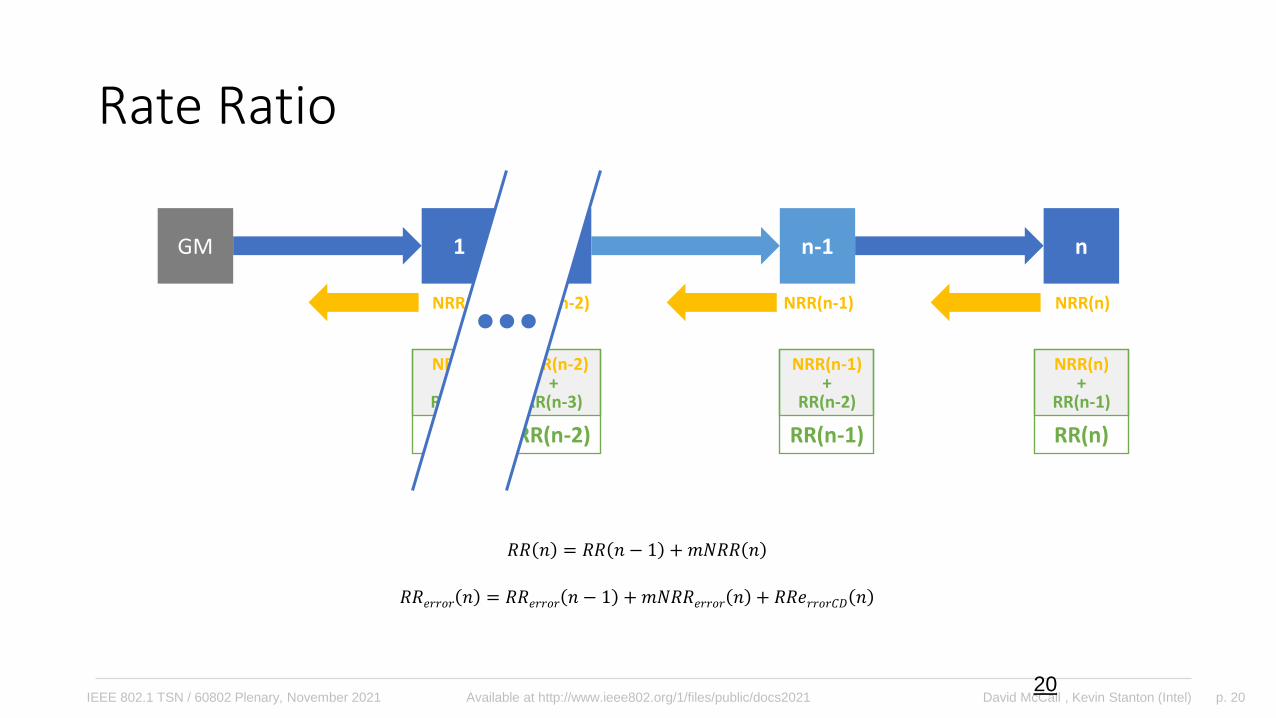
Rate Ratio
20
1 n-1 nGM
NRR(n-1) NRR(n)
RR(n)
NRR(n)
RR(n-1)+
RR(n-1)
NRR(n-1)
RR(n-2)
𝑅𝑅 𝑛 = 𝑅𝑅 𝑛 − 1 +𝑚𝑁𝑅𝑅 𝑛
𝑅𝑅𝑒𝑟𝑟𝑜𝑟 𝑛 = 𝑅𝑅𝑒𝑟𝑟𝑜𝑟 𝑛 − 1 +𝑚𝑁𝑅𝑅𝑒𝑟𝑟𝑜𝑟 𝑛 + 𝑅𝑅𝑒𝑟𝑟𝑜𝑟𝐶𝐷 𝑛
p. 21David McCall , Kevin Stanton (Intel)IEEE 802.1 TSN / 60802 Plenary, November 2021 Available at http://www.ieee802.org/1/files/public/docs2021
timeSync
n-1
n
t2-syncGM1
t1out(n-1)
t2in(n)
t1out(n)
t3
t4
0 to pDelayIntervalpDelayResp
clockDrift(n)
clockDrift(n-1)
Point where mNRRis measured
Point wheremNRR is measured
Point wheremNRR is
applied toRate Ratio
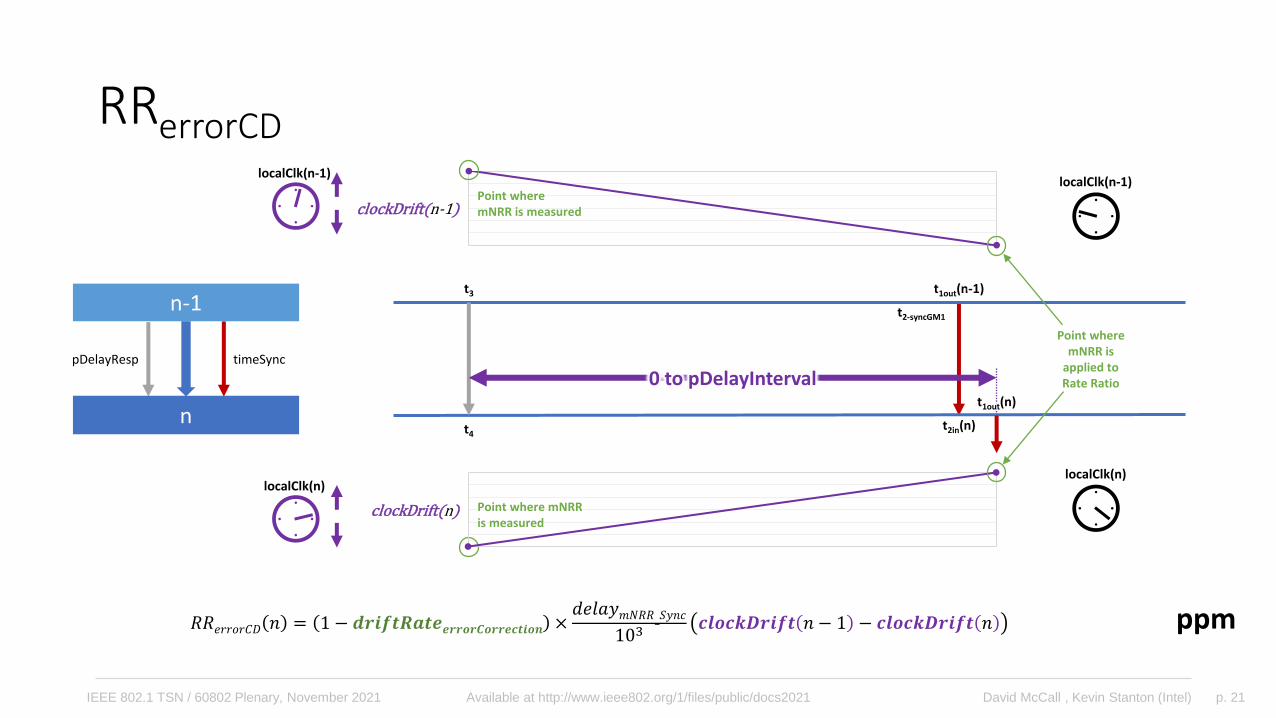
RRerrorCD
𝑅𝑅𝑒𝑟𝑟𝑜𝑟𝐶𝐷 𝑛 = 1 − 𝒅𝒓𝒊𝒇𝒕𝑹𝒂𝒕𝒆𝒆𝒓𝒓𝒐𝒓𝑪𝒐𝒓𝒓𝒆𝒄𝒕𝒊𝒐𝒏 ×𝑑𝑒𝑙𝑎𝑦𝑚𝑁𝑅𝑅_𝑆𝑦𝑛𝑐
103𝒄𝒍𝒐𝒄𝒌𝑫𝒓𝒊𝒇𝒕 𝑛 − 1 − 𝒄𝒍𝒐𝒄𝒌𝑫𝒓𝒊𝒇𝒕 𝑛 ppm
localClk(n-1)
localClk(n)
localClk(n-1)
localClk(n)
p. 22David McCall , Kevin Stanton (Intel)IEEE 802.1 TSN / 60802 Plenary, November 2021 Available at http://www.ieee802.org/1/files/public/docs2021
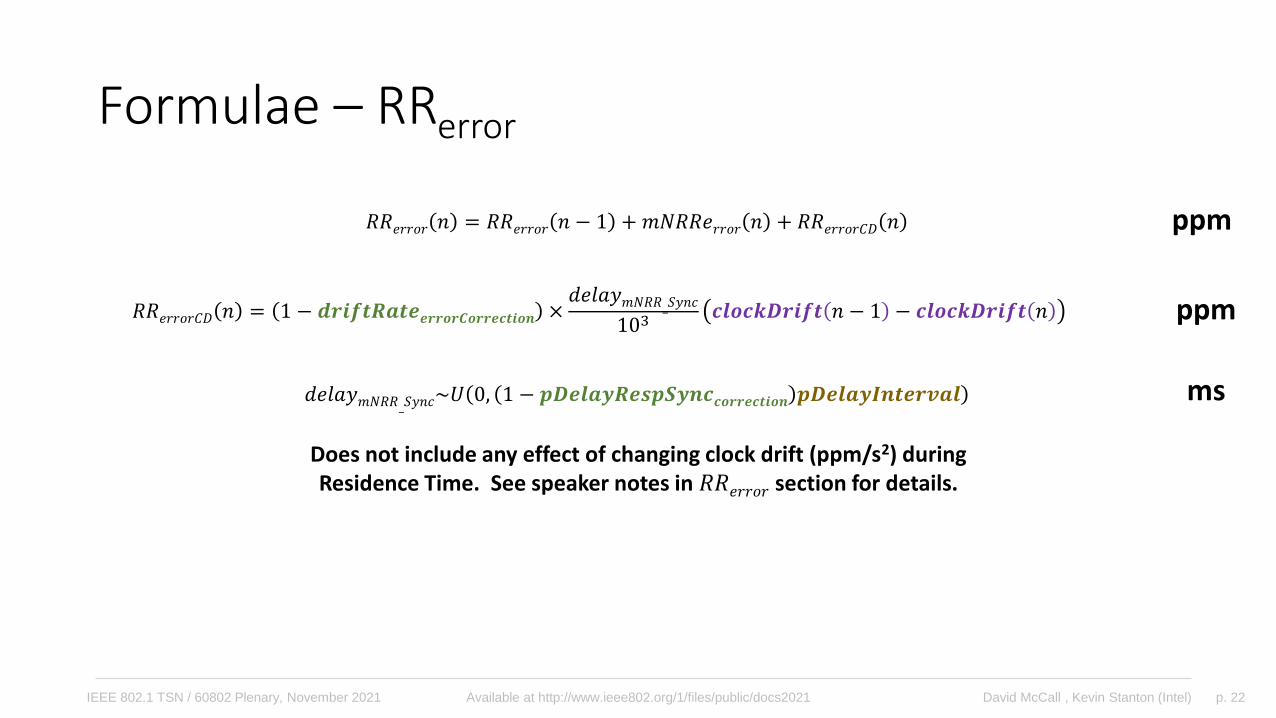
Formulae – RRerror
𝑅𝑅𝑒𝑟𝑟𝑜𝑟 𝑛 = 𝑅𝑅𝑒𝑟𝑟𝑜𝑟 𝑛 − 1 +𝑚𝑁𝑅𝑅𝑒𝑟𝑟𝑜𝑟 𝑛 + 𝑅𝑅𝑒𝑟𝑟𝑜𝑟𝐶𝐷 𝑛 ppm
𝑑𝑒𝑙𝑎𝑦𝑚𝑁𝑅𝑅_𝑆𝑦𝑛𝑐~𝑈 0, 1 − 𝒑𝑫𝒆𝒍𝒂𝒚𝑹𝒆𝒔𝒑𝑺𝒚𝒏𝒄𝒄𝒐𝒓𝒓𝒆𝒄𝒕𝒊𝒐𝒏 𝒑𝑫𝒆𝒍𝒂𝒚𝑰𝒏𝒕𝒆𝒓𝒗𝒂𝒍
𝑅𝑅𝑒𝑟𝑟𝑜𝑟𝐶𝐷 𝑛 = 1 − 𝒅𝒓𝒊𝒇𝒕𝑹𝒂𝒕𝒆𝒆𝒓𝒓𝒐𝒓𝑪𝒐𝒓𝒓𝒆𝒄𝒕𝒊𝒐𝒏 ×𝑑𝑒𝑙𝑎𝑦𝑚𝑁𝑅𝑅_𝑆𝑦𝑛𝑐
103𝒄𝒍𝒐𝒄𝒌𝑫𝒓𝒊𝒇𝒕 𝑛 − 1 − 𝒄𝒍𝒐𝒄𝒌𝑫𝒓𝒊𝒇𝒕 𝑛 ppm
ms
Does not include any effect of changing clock drift (ppm/s2) duringResidence Time. See speaker notes in 𝑅𝑅𝑒𝑟𝑟𝑜𝑟 section for details.
p. 23David McCall , Kevin Stanton (Intel)IEEE 802.1 TSN / 60802 Plenary, November 2021 Available at http://www.ieee802.org/1/files/public/docs2021
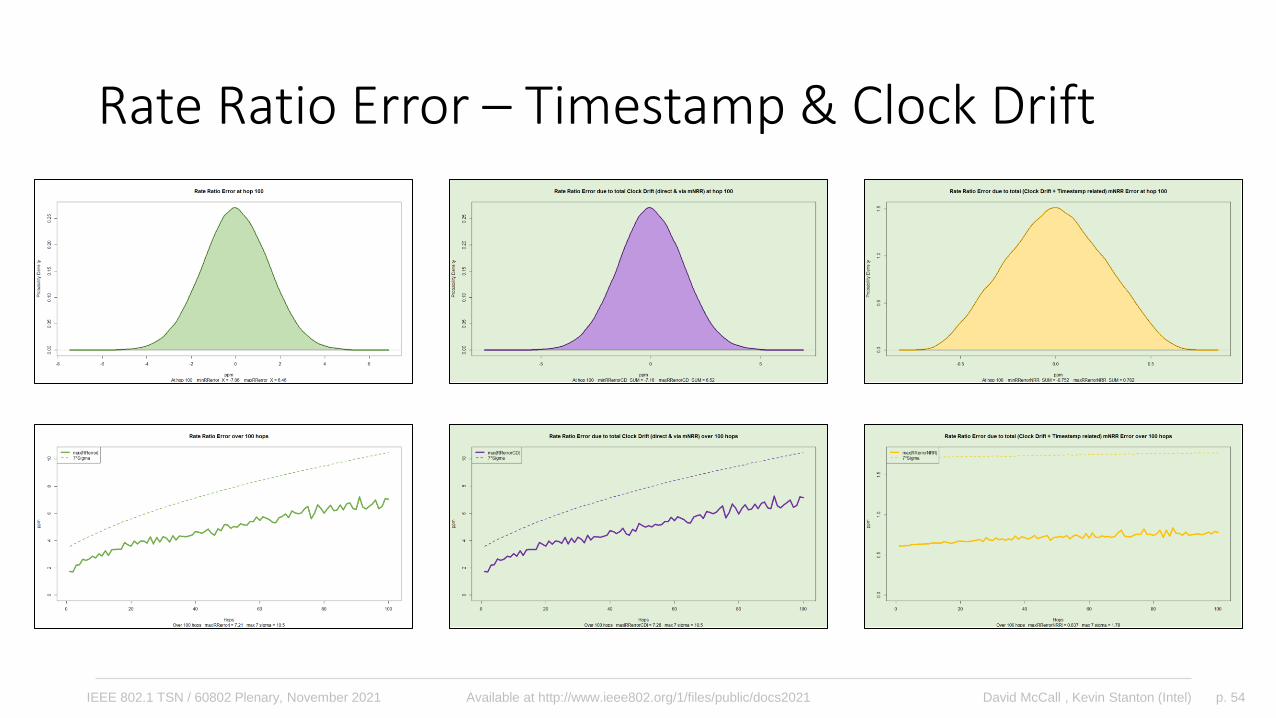
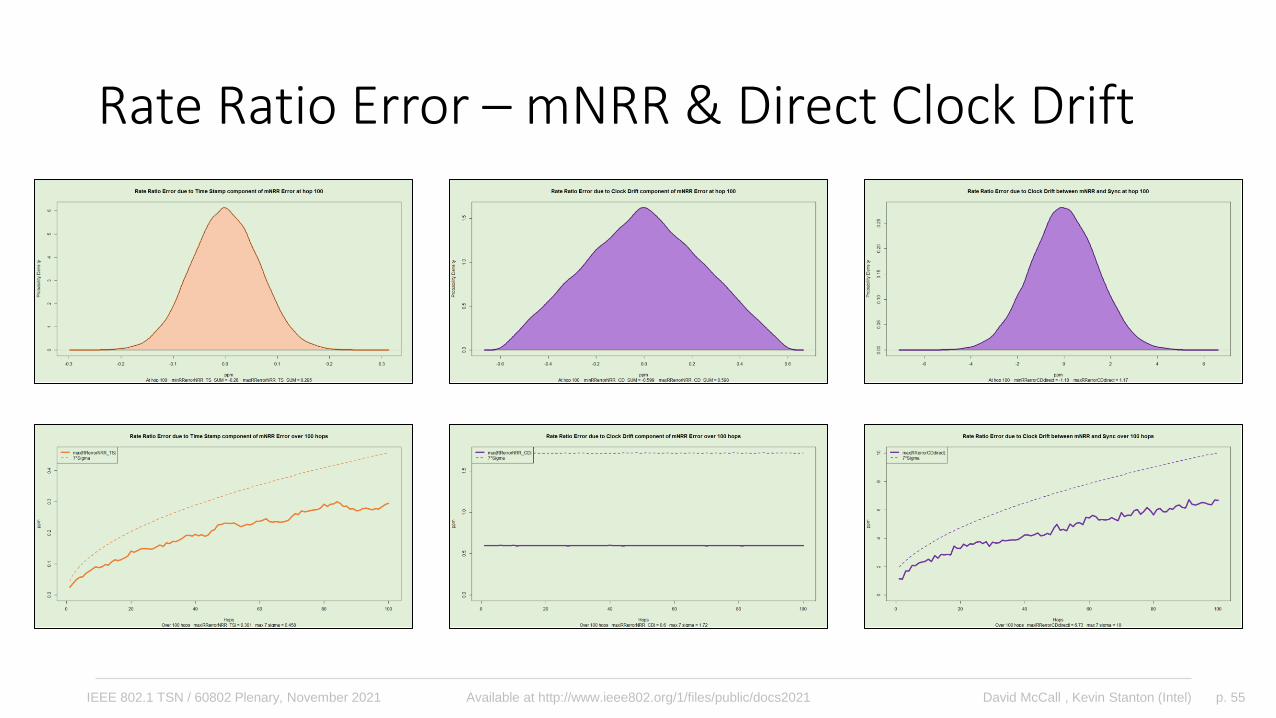
Observations of RRerror Behaviour
• mNRRerror feeds directly into RRerror where they accumulate• Since mNRRerror due to clock drift at one node tends to reverse at the next node, the component of RRerror due to this will
tend not to increase along a chain of devices.
• This does not apply for error due to GM clock drift as it only appears in mNRRerror at the first hop.
• mNRRerrors due to timestamp errors are much less likely to cancel out so RRerror from this source is more likely to increase along a chain of devices.
• RRerror due to clock drift during the delay between measurement of mNRR and when it is applied to Rate Ratio could cancel out…but only if the delay one node is the same as at the next…which is unlikely.
• RRerrorCD is therefore much more likely to increase along a chain of devices than the clock drift component of mNRRerror
• RRerror due to clock drift can be reduced by decreasing pDelayInterval; reduces range of delaymNRRSync
• Similar effect if pDelay messaging can be aligned to occur just before Sync message; modelled using pDelayRespSynccorrection
• Note: see earlier in this presentation for the effect reducing pDelayInterval has on mNRRerror
p. 24David McCall , Kevin Stanton (Intel)IEEE 802.1 TSN / 60802 Plenary, November 2021 Available at http://www.ieee802.org/1/files/public/docs2021
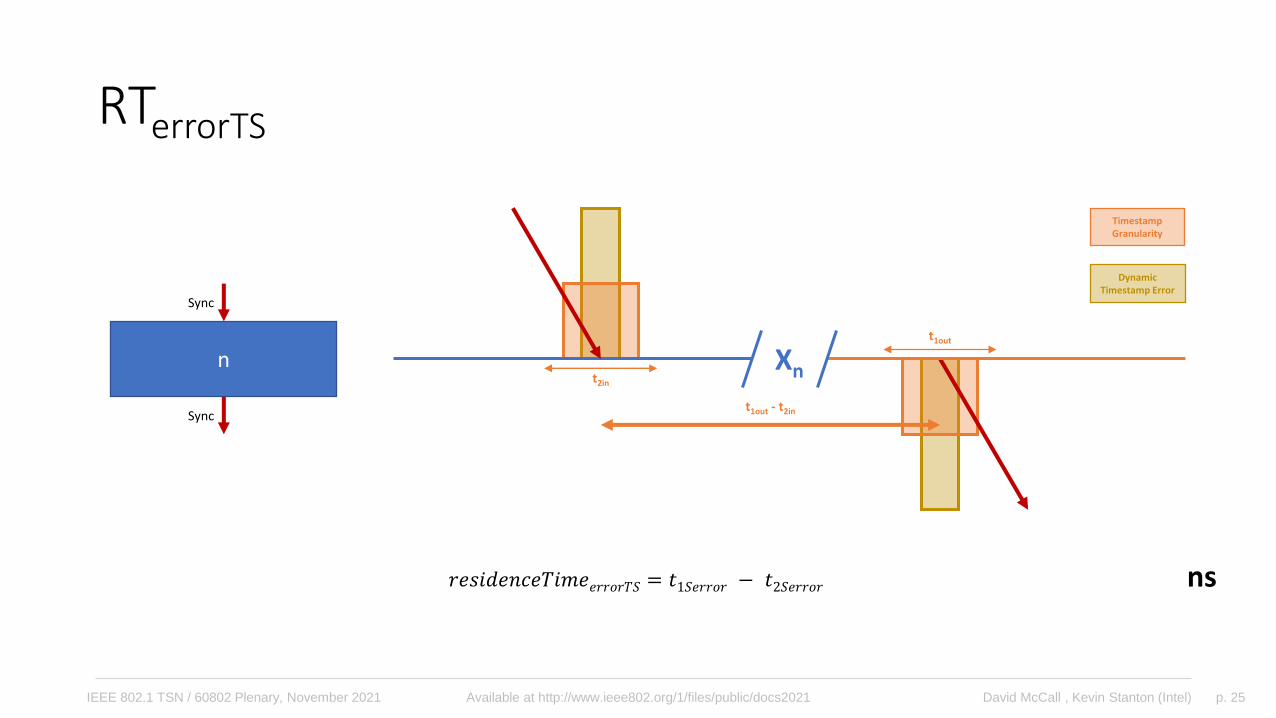
t1out
t2in
n
Sync
t1out - t2in = residenceTime
Xn
Sync
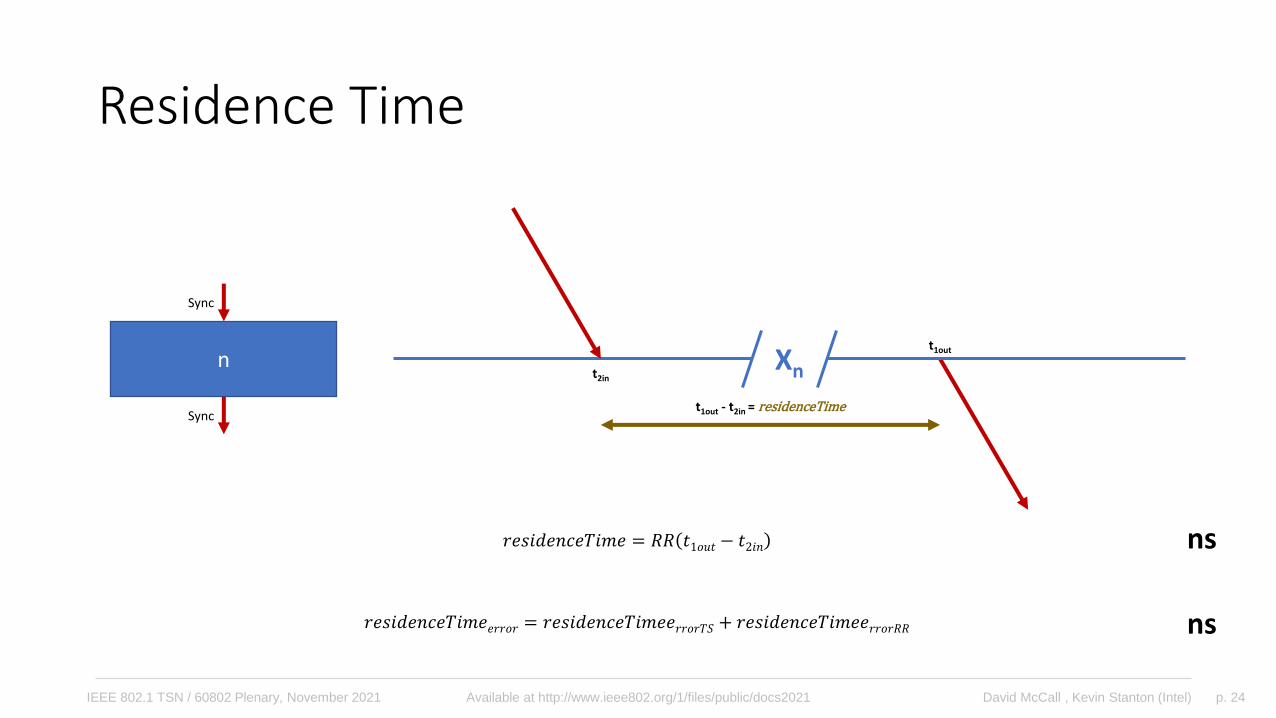
Residence Time
𝑟𝑒𝑠𝑖𝑑𝑒𝑛𝑐𝑒𝑇𝑖𝑚𝑒 = 𝑅𝑅 𝑡1𝑜𝑢𝑡 − 𝑡2𝑖𝑛
𝑟𝑒𝑠𝑖𝑑𝑒𝑛𝑐𝑒𝑇𝑖𝑚𝑒𝑒𝑟𝑟𝑜𝑟 = 𝑟𝑒𝑠𝑖𝑑𝑒𝑛𝑐𝑒𝑇𝑖𝑚𝑒𝑒𝑟𝑟𝑜𝑟𝑇𝑆 + 𝑟𝑒𝑠𝑖𝑑𝑒𝑛𝑐𝑒𝑇𝑖𝑚𝑒𝑒𝑟𝑟𝑜𝑟𝑅𝑅
ns
ns
p. 25David McCall , Kevin Stanton (Intel)IEEE 802.1 TSN / 60802 Plenary, November 2021 Available at http://www.ieee802.org/1/files/public/docs2021
t1out
t2in
n
Sync
t1out - t2in
Xn
Sync
RTerrorTS
𝑟𝑒𝑠𝑖𝑑𝑒𝑛𝑐𝑒𝑇𝑖𝑚𝑒𝑒𝑟𝑟𝑜𝑟𝑇𝑆 = 𝑡1𝑆𝑒𝑟𝑟𝑜𝑟 − 𝑡2𝑆𝑒𝑟𝑟𝑜𝑟
TimestampGranularity
Dynamic Timestamp Error
ns
p. 26David McCall , Kevin Stanton (Intel)IEEE 802.1 TSN / 60802 Plenary, November 2021 Available at http://www.ieee802.org/1/files/public/docs2021
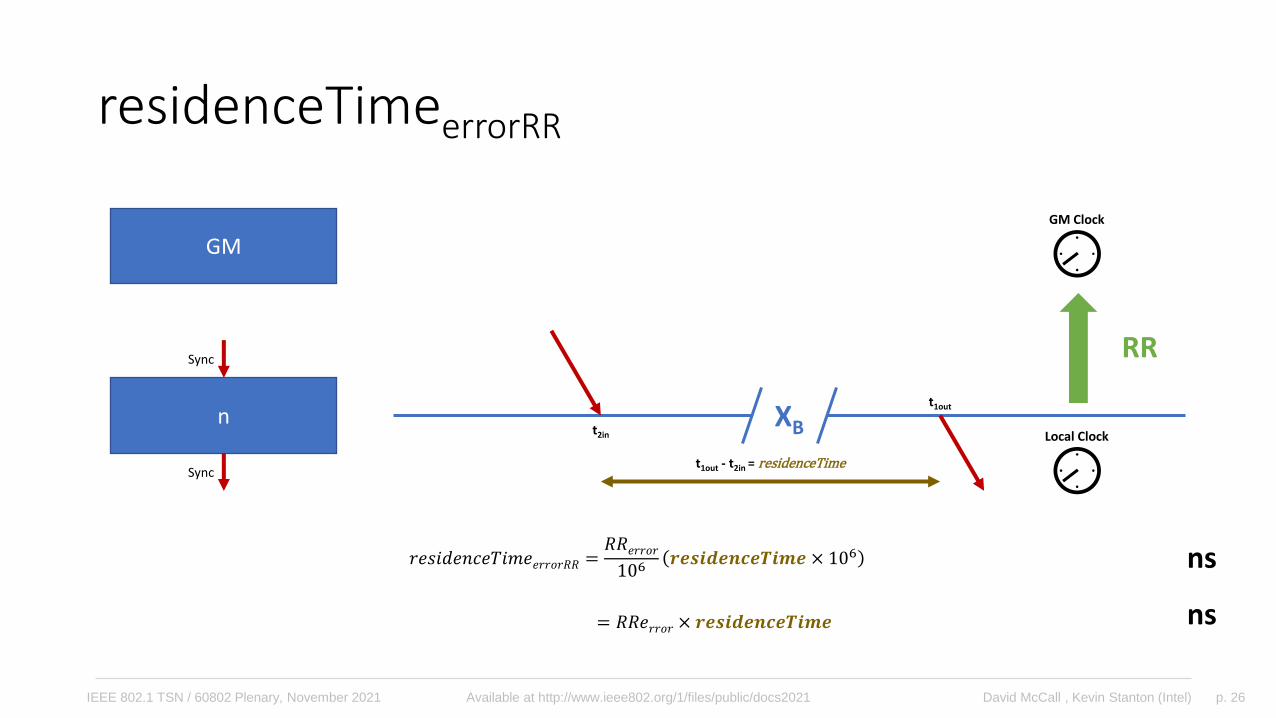
n
Sync
XB
Sync
GM Clock
GM
Local Clock
t1out
t2in
t1out - t2in = residenceTime
RR
residenceTimeerrorRR
𝑟𝑒𝑠𝑖𝑑𝑒𝑛𝑐𝑒𝑇𝑖𝑚𝑒𝑒𝑟𝑟𝑜𝑟𝑅𝑅 =𝑅𝑅𝑒𝑟𝑟𝑜𝑟
106𝒓𝒆𝒔𝒊𝒅𝒆𝒏𝒄𝒆𝑻𝒊𝒎𝒆 × 106
= 𝑅𝑅𝑒𝑟𝑟𝑜𝑟 × 𝒓𝒆𝒔𝒊𝒅𝒆𝒏𝒄𝒆𝑻𝒊𝒎𝒆 ns
ns
p. 27David McCall , Kevin Stanton (Intel)IEEE 802.1 TSN / 60802 Plenary, November 2021 Available at http://www.ieee802.org/1/files/public/docs2021
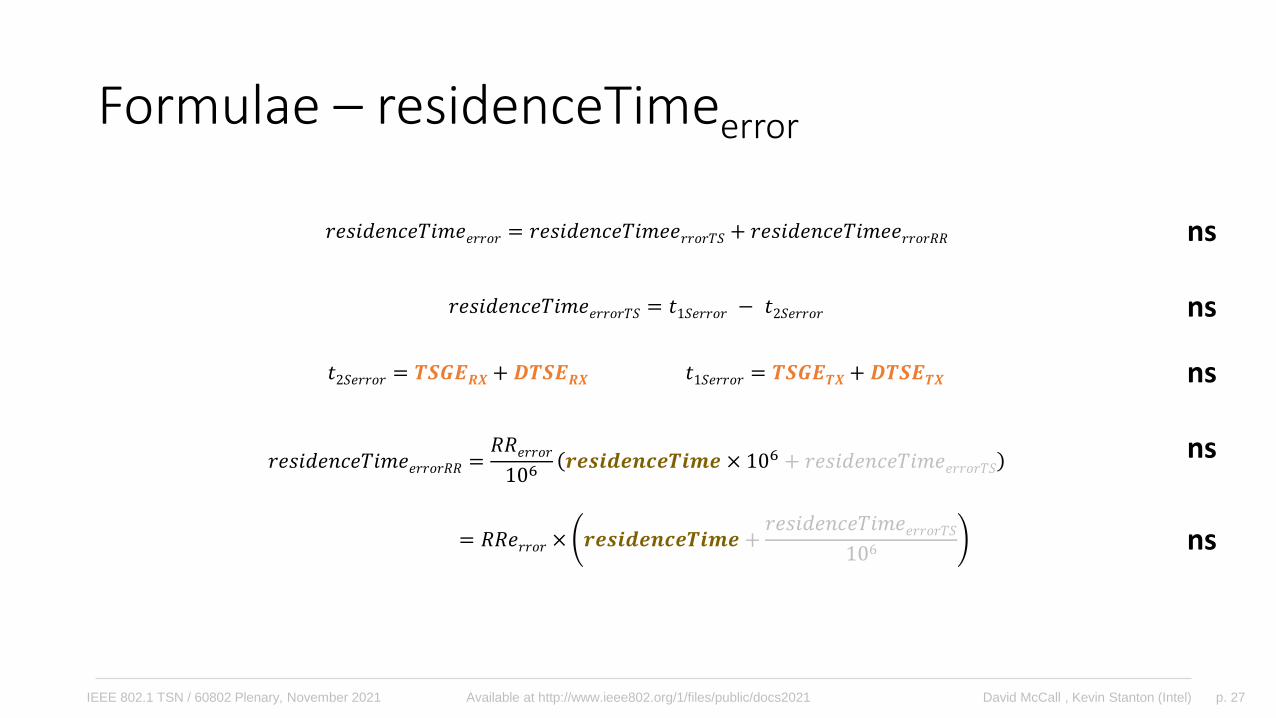
Formulae – residenceTimeerror
ns𝑟𝑒𝑠𝑖𝑑𝑒𝑛𝑐𝑒𝑇𝑖𝑚𝑒𝑒𝑟𝑟𝑜𝑟 = 𝑟𝑒𝑠𝑖𝑑𝑒𝑛𝑐𝑒𝑇𝑖𝑚𝑒𝑒𝑟𝑟𝑜𝑟𝑇𝑆 + 𝑟𝑒𝑠𝑖𝑑𝑒𝑛𝑐𝑒𝑇𝑖𝑚𝑒𝑒𝑟𝑟𝑜𝑟𝑅𝑅
𝑟𝑒𝑠𝑖𝑑𝑒𝑛𝑐𝑒𝑇𝑖𝑚𝑒𝑒𝑟𝑟𝑜𝑟𝑇𝑆 = 𝑡1𝑆𝑒𝑟𝑟𝑜𝑟 − 𝑡2𝑆𝑒𝑟𝑟𝑜𝑟
𝑡2𝑆𝑒𝑟𝑟𝑜𝑟 = 𝑻𝑺𝑮𝑬𝑹𝑿 + 𝑫𝑻𝑺𝑬𝑹𝑿 𝑡1𝑆𝑒𝑟𝑟𝑜𝑟 = 𝑻𝑺𝑮𝑬𝑻𝑿+ 𝑫𝑻𝑺𝑬𝑻𝑿
𝑟𝑒𝑠𝑖𝑑𝑒𝑛𝑐𝑒𝑇𝑖𝑚𝑒𝑒𝑟𝑟𝑜𝑟𝑅𝑅 =𝑅𝑅𝑒𝑟𝑟𝑜𝑟
106𝒓𝒆𝒔𝒊𝒅𝒆𝒏𝒄𝒆𝑻𝒊𝒎𝒆 × 106 + 𝑟𝑒𝑠𝑖𝑑𝑒𝑛𝑐𝑒𝑇𝑖𝑚𝑒𝑒𝑟𝑟𝑜𝑟𝑇𝑆
ns
ns
= 𝑅𝑅𝑒𝑟𝑟𝑜𝑟 × 𝒓𝒆𝒔𝒊𝒅𝒆𝒏𝒄𝒆𝑻𝒊𝒎𝒆 +𝑟𝑒𝑠𝑖𝑑𝑒𝑛𝑐𝑒𝑇𝑖𝑚𝑒𝑒𝑟𝑟𝑜𝑟𝑇𝑆
106
ns
ns
p. 28David McCall , Kevin Stanton (Intel)IEEE 802.1 TSN / 60802 Plenary, November 2021 Available at http://www.ieee802.org/1/files/public/docs2021
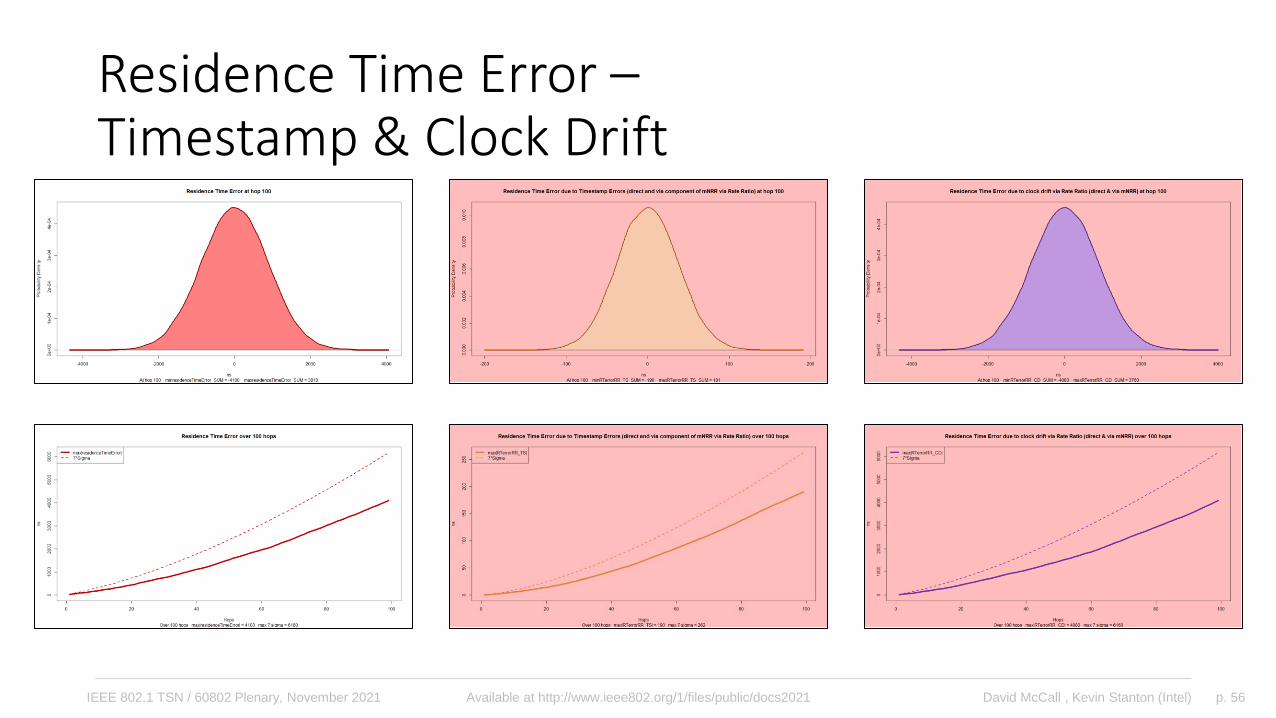
Observations of residenceTimeerror Behaviour
• residenceTimeerror due to timestamp error is independent of Residence Time.• Reducing Residence Time will have no effect on this source of error.
• residenceTimeerror due to RRerror is proportional to Residence Time• Reducing Residence Time can reduce this source of error.
• Since larger RRerror is more likely further along a chain of devices, the amount of Residence Time Error at each node is also likely to increase.• For example: the component of DTE due to Residence Time Error after 100
hops is more likely to be larger from errors in nodes 51-100 than from nodes 1-50.
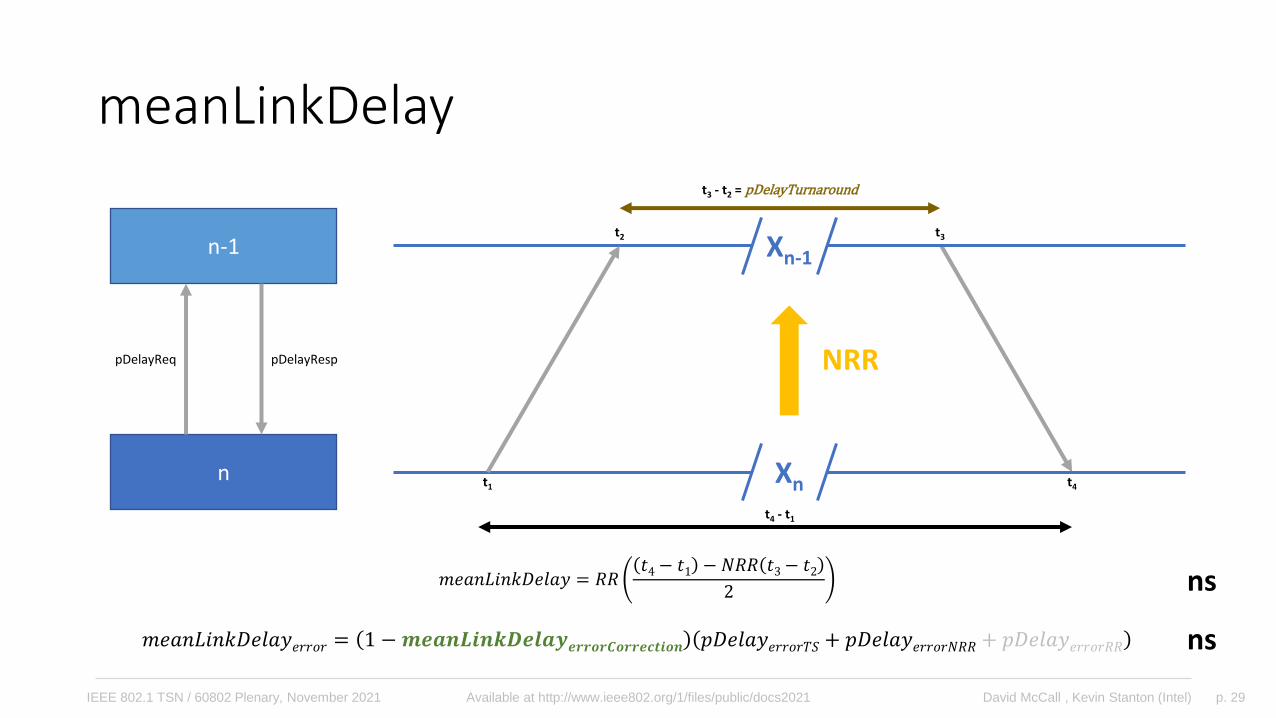
p. 29David McCall , Kevin Stanton (Intel)IEEE 802.1 TSN / 60802 Plenary, November 2021 Available at http://www.ieee802.org/1/files/public/docs2021
n-1
n t1
t2
t4
pDelayReq pDelayResp
t4 - t1
t3 - t2 = pDelayTurnaround
t3
meanLinkDelay
ns𝑚𝑒𝑎𝑛𝐿𝑖𝑛𝑘𝐷𝑒𝑙𝑎𝑦 = 𝑅𝑅𝑡4− 𝑡1 − 𝑁𝑅𝑅 𝑡3− 𝑡2
2
Xn-1
Xn
NRR
𝑚𝑒𝑎𝑛𝐿𝑖𝑛𝑘𝐷𝑒𝑙𝑎𝑦𝑒𝑟𝑟𝑜𝑟 = 1 −𝒎𝒆𝒂𝒏𝑳𝒊𝒏𝒌𝑫𝒆𝒍𝒂𝒚𝒆𝒓𝒓𝒐𝒓𝑪𝒐𝒓𝒓𝒆𝒄𝒕𝒊𝒐𝒏 𝑝𝐷𝑒𝑙𝑎𝑦𝑒𝑟𝑟𝑜𝑟𝑇𝑆 + 𝑝𝐷𝑒𝑙𝑎𝑦𝑒𝑟𝑟𝑜𝑟𝑁𝑅𝑅 + 𝑝𝐷𝑒𝑙𝑎𝑦𝑒𝑟𝑟𝑜𝑟𝑅𝑅 ns
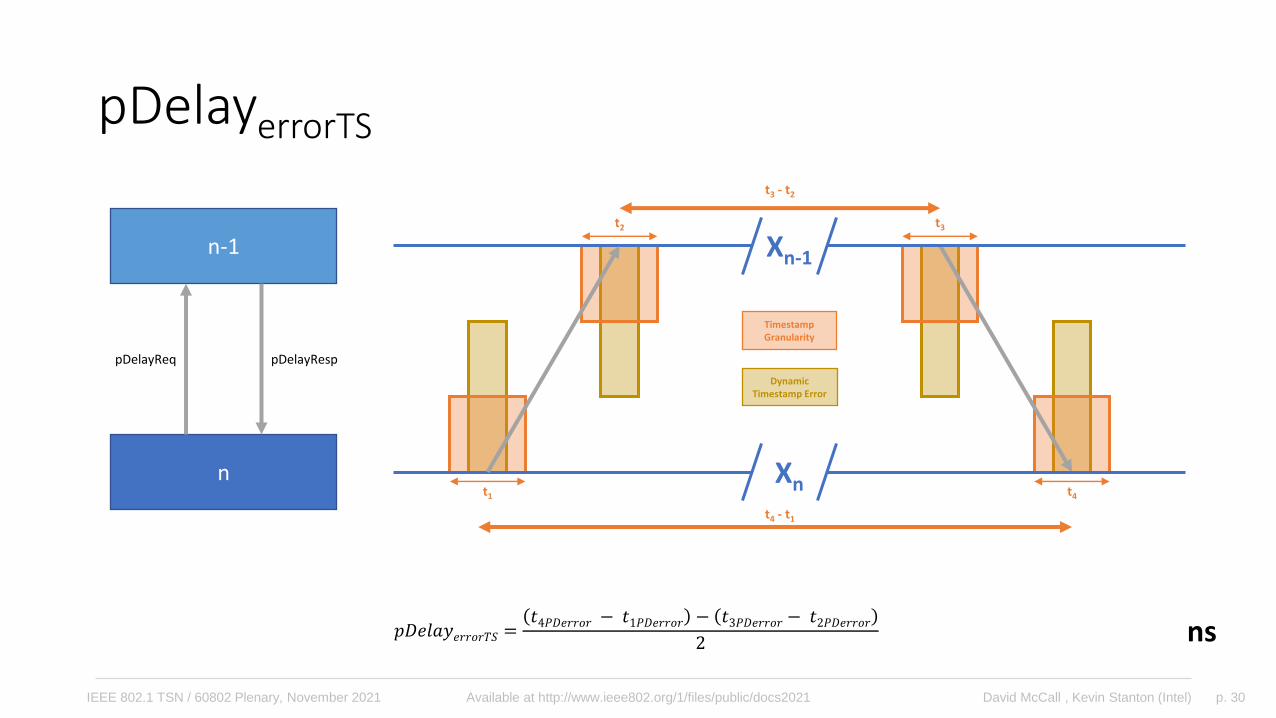
p. 30David McCall , Kevin Stanton (Intel)IEEE 802.1 TSN / 60802 Plenary, November 2021 Available at http://www.ieee802.org/1/files/public/docs2021
n-1
nt1
t2
t4
pDelayReq pDelayResp
t4 - t1
t3 - t2
t3
TimestampGranularity
Dynamic Timestamp Error
pDelayerrorTS
𝑝𝐷𝑒𝑙𝑎𝑦𝑒𝑟𝑟𝑜𝑟𝑇𝑆 =𝑡4𝑃𝐷𝑒𝑟𝑟𝑜𝑟 − 𝑡1𝑃𝐷𝑒𝑟𝑟𝑜𝑟 − 𝑡3𝑃𝐷𝑒𝑟𝑟𝑜𝑟 − 𝑡2𝑃𝐷𝑒𝑟𝑟𝑜𝑟
2 ns
Xn-1
Xn
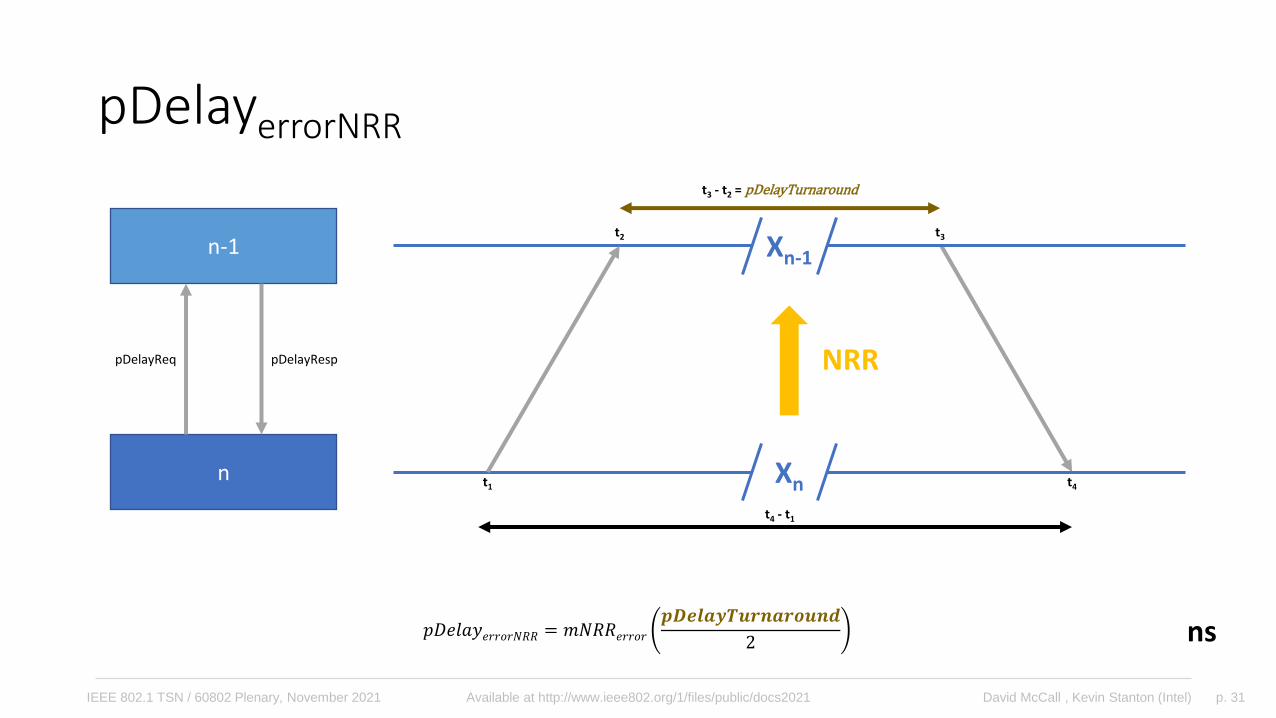
p. 31David McCall , Kevin Stanton (Intel)IEEE 802.1 TSN / 60802 Plenary, November 2021 Available at http://www.ieee802.org/1/files/public/docs2021
n-1
n t1
t2
t4
pDelayReq pDelayResp
t4 - t1
t3 - t2 = pDelayTurnaround
t3
pDelayerrorNRR
ns𝑝𝐷𝑒𝑙𝑎𝑦𝑒𝑟𝑟𝑜𝑟𝑁𝑅𝑅 = 𝑚𝑁𝑅𝑅𝑒𝑟𝑟𝑜𝑟
𝒑𝑫𝒆𝒍𝒂𝒚𝑻𝒖𝒓𝒏𝒂𝒓𝒐𝒖𝒏𝒅
2
Xn-1
Xn
NRR
p. 32David McCall , Kevin Stanton (Intel)IEEE 802.1 TSN / 60802 Plenary, November 2021 Available at http://www.ieee802.org/1/files/public/docs2021
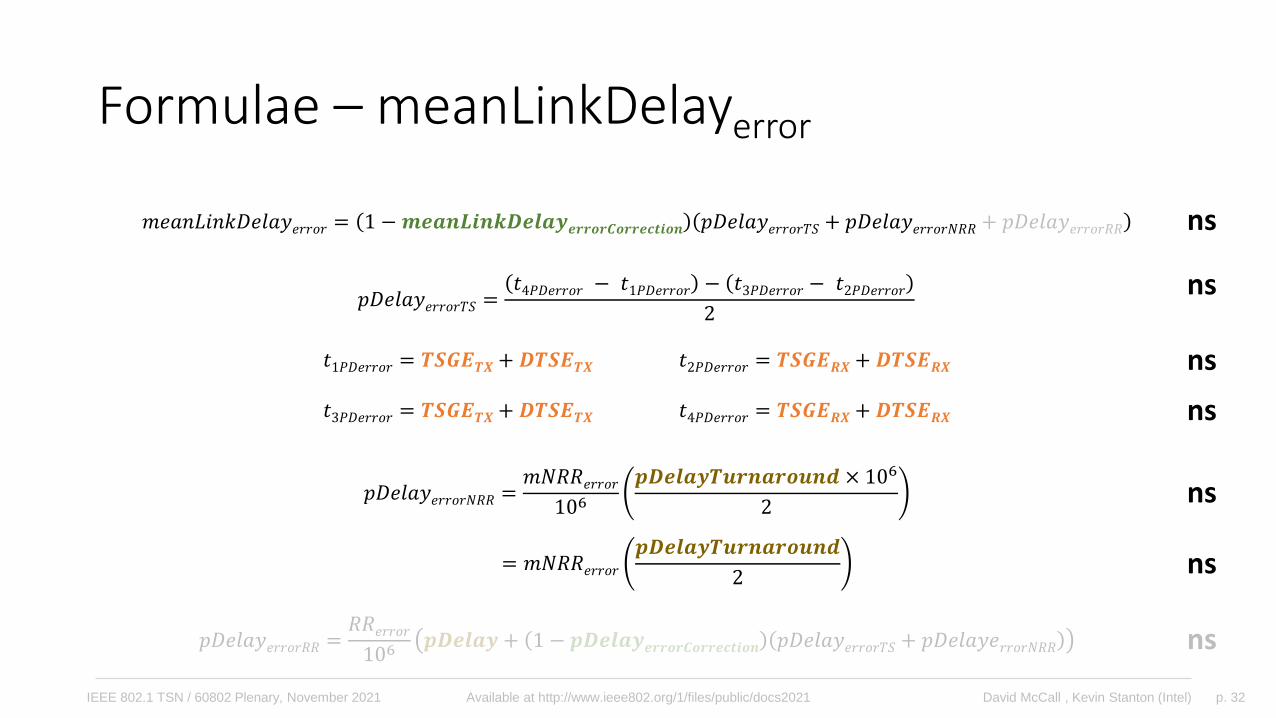
Formulae – meanLinkDelayerror
𝑝𝐷𝑒𝑙𝑎𝑦𝑒𝑟𝑟𝑜𝑟𝑇𝑆 =𝑡4𝑃𝐷𝑒𝑟𝑟𝑜𝑟 − 𝑡1𝑃𝐷𝑒𝑟𝑟𝑜𝑟 − 𝑡3𝑃𝐷𝑒𝑟𝑟𝑜𝑟 − 𝑡2𝑃𝐷𝑒𝑟𝑟𝑜𝑟
2
𝑡1𝑃𝐷𝑒𝑟𝑟𝑜𝑟 = 𝑻𝑺𝑮𝑬𝑻𝑿+ 𝑫𝑻𝑺𝑬𝑻𝑿 𝑡2𝑃𝐷𝑒𝑟𝑟𝑜𝑟 = 𝑻𝑺𝑮𝑬𝑹𝑿+ 𝑫𝑻𝑺𝑬𝑹𝑿
𝑡3𝑃𝐷𝑒𝑟𝑟𝑜𝑟 = 𝑻𝑺𝑮𝑬𝑻𝑿+ 𝑫𝑻𝑺𝑬𝑻𝑿 𝑡4𝑃𝐷𝑒𝑟𝑟𝑜𝑟 = 𝑻𝑺𝑮𝑬𝑹𝑿+ 𝑫𝑻𝑺𝑬𝑹𝑿
𝑝𝐷𝑒𝑙𝑎𝑦𝑒𝑟𝑟𝑜𝑟𝑁𝑅𝑅 =𝑚𝑁𝑅𝑅𝑒𝑟𝑟𝑜𝑟
106𝒑𝑫𝒆𝒍𝒂𝒚𝑻𝒖𝒓𝒏𝒂𝒓𝒐𝒖𝒏𝒅 × 106
2
ns
ns
ns
ns
ns
𝑝𝐷𝑒𝑙𝑎𝑦𝑒𝑟𝑟𝑜𝑟𝑅𝑅 =𝑅𝑅𝑒𝑟𝑟𝑜𝑟
106𝒑𝑫𝒆𝒍𝒂𝒚 + 1 − 𝒑𝑫𝒆𝒍𝒂𝒚𝒆𝒓𝒓𝒐𝒓𝑪𝒐𝒓𝒓𝒆𝒄𝒕𝒊𝒐𝒏 𝑝𝐷𝑒𝑙𝑎𝑦𝑒𝑟𝑟𝑜𝑟𝑇𝑆 + 𝑝𝐷𝑒𝑙𝑎𝑦𝑒𝑟𝑟𝑜𝑟𝑁𝑅𝑅 ns
= 𝑚𝑁𝑅𝑅𝑒𝑟𝑟𝑜𝑟
𝒑𝑫𝒆𝒍𝒂𝒚𝑻𝒖𝒓𝒏𝒂𝒓𝒐𝒖𝒏𝒅
2ns
𝑚𝑒𝑎𝑛𝐿𝑖𝑛𝑘𝐷𝑒𝑙𝑎𝑦𝑒𝑟𝑟𝑜𝑟 = 1 −𝒎𝒆𝒂𝒏𝑳𝒊𝒏𝒌𝑫𝒆𝒍𝒂𝒚𝒆𝒓𝒓𝒐𝒓𝑪𝒐𝒓𝒓𝒆𝒄𝒕𝒊𝒐𝒏 𝑝𝐷𝑒𝑙𝑎𝑦𝑒𝑟𝑟𝑜𝑟𝑇𝑆 + 𝑝𝐷𝑒𝑙𝑎𝑦𝑒𝑟𝑟𝑜𝑟𝑁𝑅𝑅 + 𝑝𝐷𝑒𝑙𝑎𝑦𝑒𝑟𝑟𝑜𝑟𝑅𝑅
p. 33David McCall , Kevin Stanton (Intel)IEEE 802.1 TSN / 60802 Plenary, November 2021 Available at http://www.ieee802.org/1/files/public/docs2021
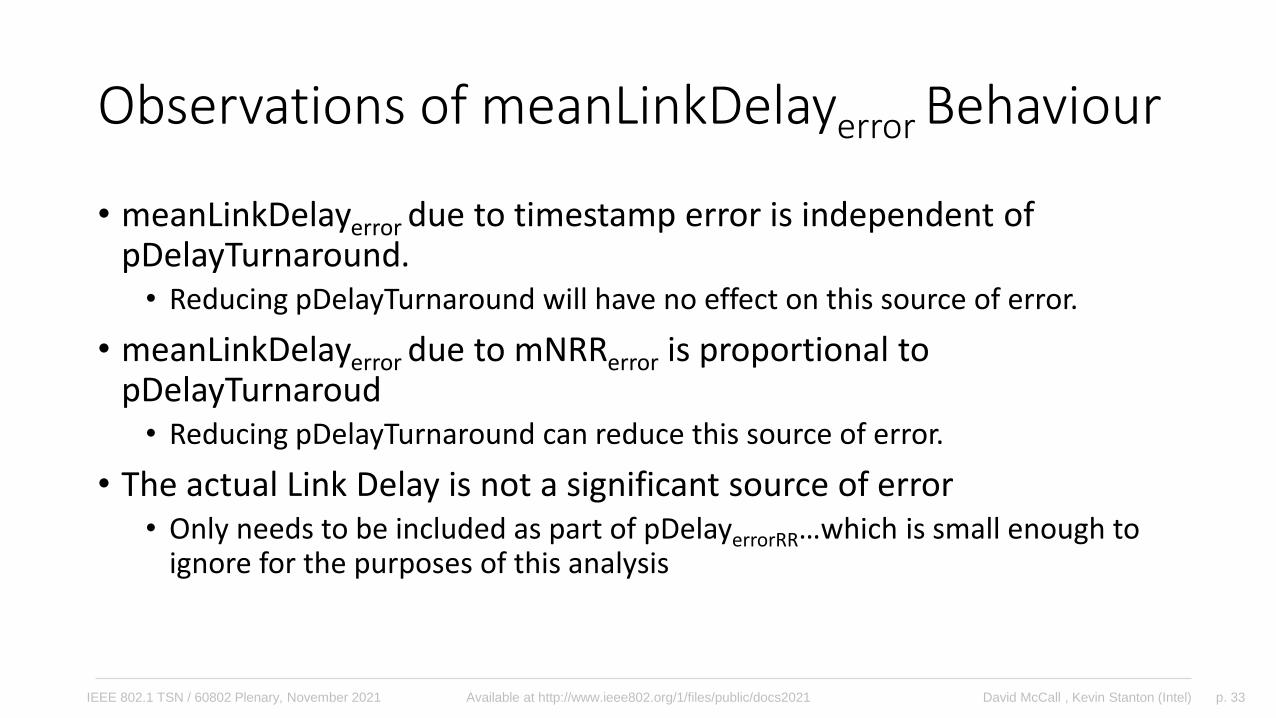
Observations of meanLinkDelayerror Behaviour
• meanLinkDelayerror due to timestamp error is independent of pDelayTurnaround.• Reducing pDelayTurnaround will have no effect on this source of error.
• meanLinkDelayerror due to mNRRerror is proportional to pDelayTurnaroud• Reducing pDelayTurnaround can reduce this source of error.
• The actual Link Delay is not a significant source of error• Only needs to be included as part of pDelayerrorRR…which is small enough to
ignore for the purposes of this analysis
p. 34David McCall , Kevin Stanton (Intel)IEEE 802.1 TSN / 60802 Plenary, November 2021 Available at http://www.ieee802.org/1/files/public/docs2021
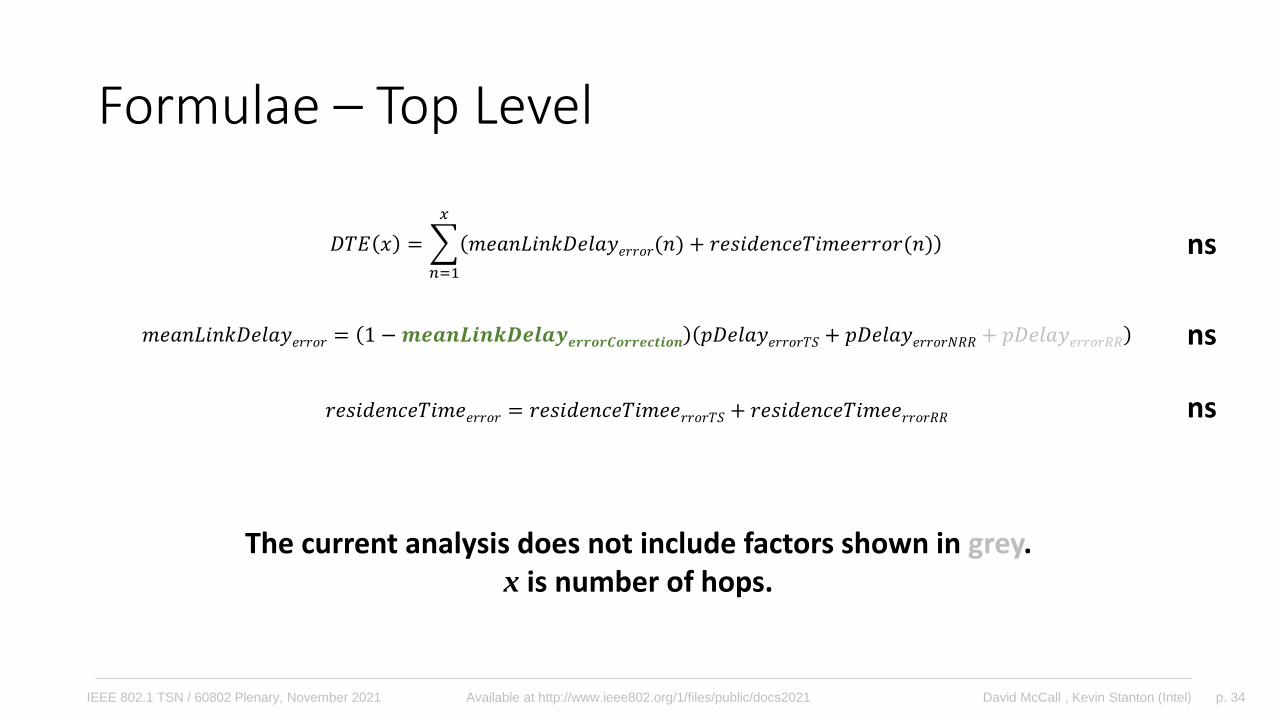
Formulae – Top Level
𝐷𝑇𝐸 𝑥 =
𝑛=1
𝑥
𝑚𝑒𝑎𝑛𝐿𝑖𝑛𝑘𝐷𝑒𝑙𝑎𝑦𝑒𝑟𝑟𝑜𝑟(𝑛) + 𝑟𝑒𝑠𝑖𝑑𝑒𝑛𝑐𝑒𝑇𝑖𝑚𝑒𝑒𝑟𝑟𝑜𝑟(𝑛)
𝑟𝑒𝑠𝑖𝑑𝑒𝑛𝑐𝑒𝑇𝑖𝑚𝑒𝑒𝑟𝑟𝑜𝑟 = 𝑟𝑒𝑠𝑖𝑑𝑒𝑛𝑐𝑒𝑇𝑖𝑚𝑒𝑒𝑟𝑟𝑜𝑟𝑇𝑆 + 𝑟𝑒𝑠𝑖𝑑𝑒𝑛𝑐𝑒𝑇𝑖𝑚𝑒𝑒𝑟𝑟𝑜𝑟𝑅𝑅
The current analysis does not include factors shown in grey.x is number of hops.
ns
ns
ns
𝑚𝑒𝑎𝑛𝐿𝑖𝑛𝑘𝐷𝑒𝑙𝑎𝑦𝑒𝑟𝑟𝑜𝑟 = 1 −𝒎𝒆𝒂𝒏𝑳𝒊𝒏𝒌𝑫𝒆𝒍𝒂𝒚𝒆𝒓𝒓𝒐𝒓𝑪𝒐𝒓𝒓𝒆𝒄𝒕𝒊𝒐𝒏 𝑝𝐷𝑒𝑙𝑎𝑦𝑒𝑟𝑟𝑜𝑟𝑇𝑆 + 𝑝𝐷𝑒𝑙𝑎𝑦𝑒𝑟𝑟𝑜𝑟𝑁𝑅𝑅 + 𝑝𝐷𝑒𝑙𝑎𝑦𝑒𝑟𝑟𝑜𝑟𝑅𝑅
p. 35David McCall , Kevin Stanton (Intel)IEEE 802.1 TSN / 60802 Plenary, November 2021 Available at http://www.ieee802.org/1/files/public/docs2021
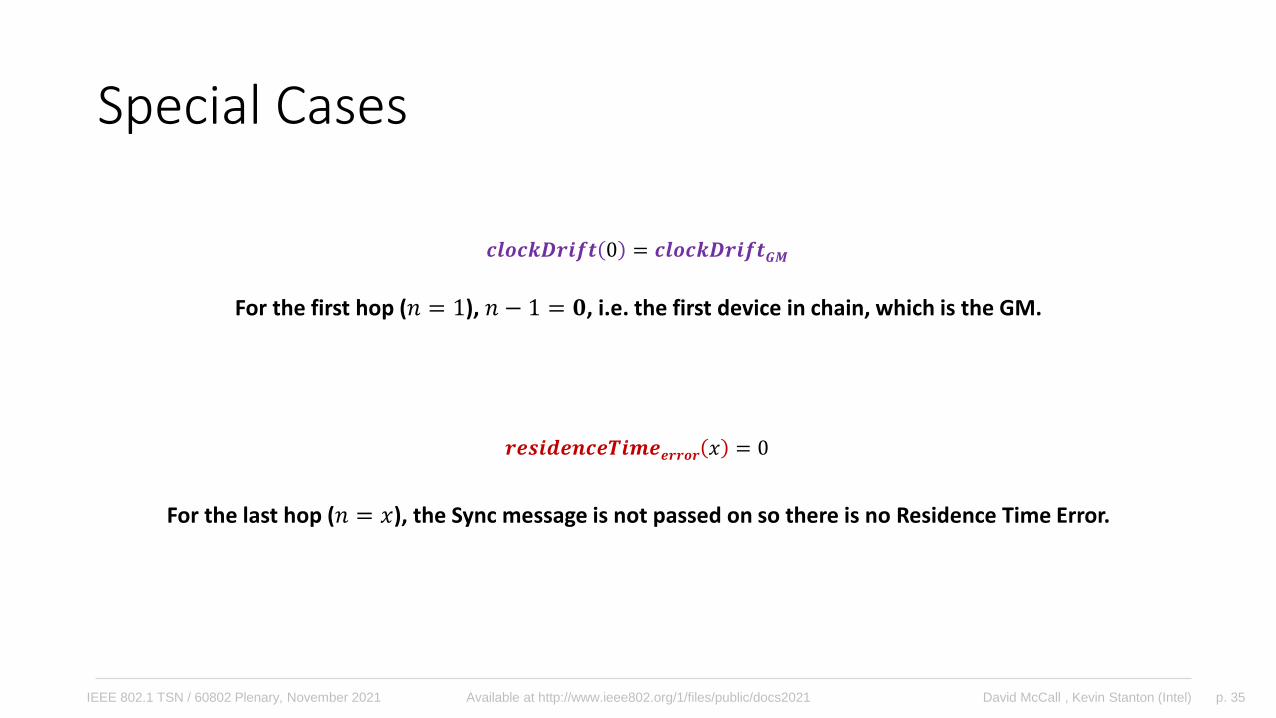
Special Cases
𝒄𝒍𝒐𝒄𝒌𝑫𝒓𝒊𝒇𝒕 0 = 𝒄𝒍𝒐𝒄𝒌𝑫𝒓𝒊𝒇𝒕𝑮𝑴
𝒓𝒆𝒔𝒊𝒅𝒆𝒏𝒄𝒆𝑻𝒊𝒎𝒆𝒆𝒓𝒓𝒐𝒓 𝑥 = 0
For the first hop (𝑛 = 1), 𝑛 − 1 = 𝟎, i.e. the first device in chain, which is the GM.
For the last hop (𝑛 = 𝑥), the Sync message is not passed on so there is no Residence Time Error.
p. 36David McCall , Kevin Stanton (Intel)IEEE 802.1 TSN / 60802 Plenary, November 2021 Available at http://www.ieee802.org/1/files/public/docs2021
Analysis Carried Out Using R & RStudio
• R is available here: https://www.r-project.org/• Open source license: various, but mostly GNU GPL v2 and GPL v3
• RStudio is available here: https://www.rstudio.com/products/rstudio/download/• Open source license: GNU Affero GPL v3
• Model uses write.csv and write.table functions, which are part of R.Utilspackage• Install in RStudio by typing…
install.packages("R.utils")
…in the console window.
p. 37David McCall , Kevin Stanton (Intel)IEEE 802.1 TSN / 60802 Plenary, November 2021 Available at http://www.ieee802.org/1/files/public/docs2021
Availability of Analysis Script
• Intention is to make the script code available under an open source license• Probably BSD 3-Clause
• Other licenses are an option; feedback welcome.
• Timing TBD. Target is before the end of the year.
• Current plan is to simply make the script code available, not to set up an open source project (e.g. GitHub)• I someone wants to
p. 38David McCall , Kevin Stanton (Intel)IEEE 802.1 TSN / 60802 Plenary, November 2021 Available at http://www.ieee802.org/1/files/public/docs2021
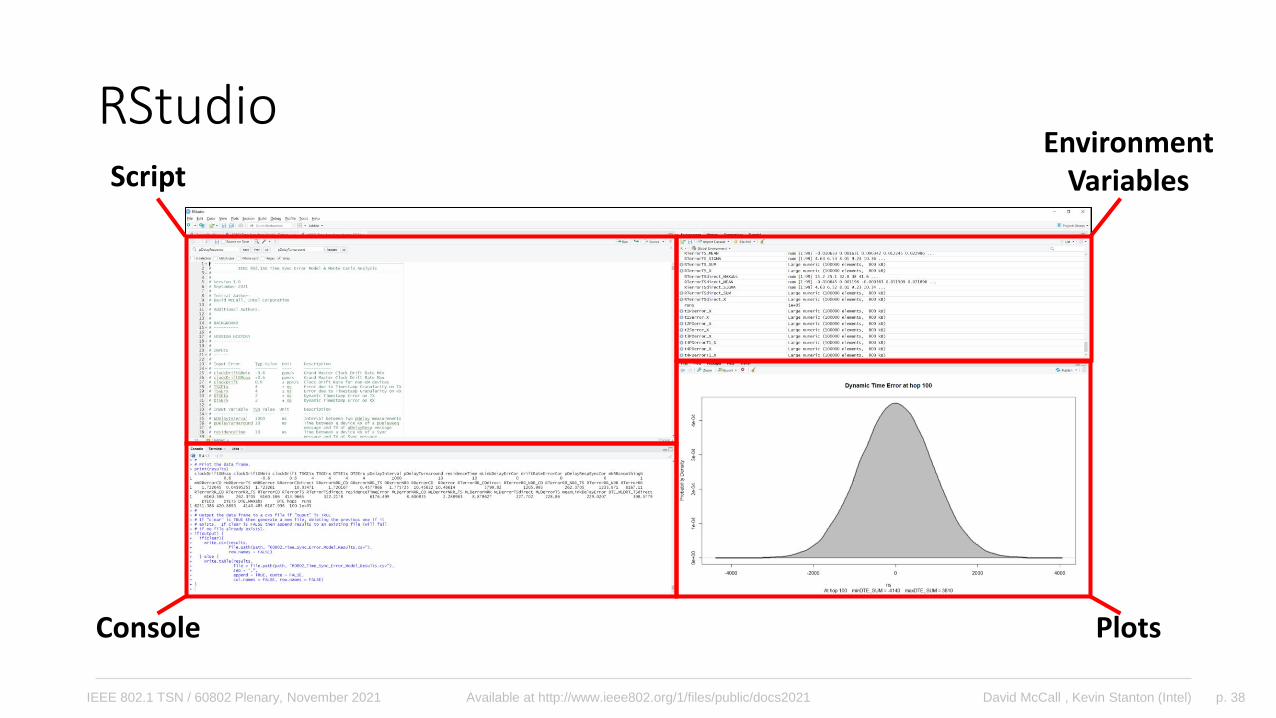
RStudioScript
Console
Environment Variables
Plots
p. 39David McCall , Kevin Stanton (Intel)IEEE 802.1 TSN / 60802 Plenary, November 2021 Available at http://www.ieee802.org/1/files/public/docs2021
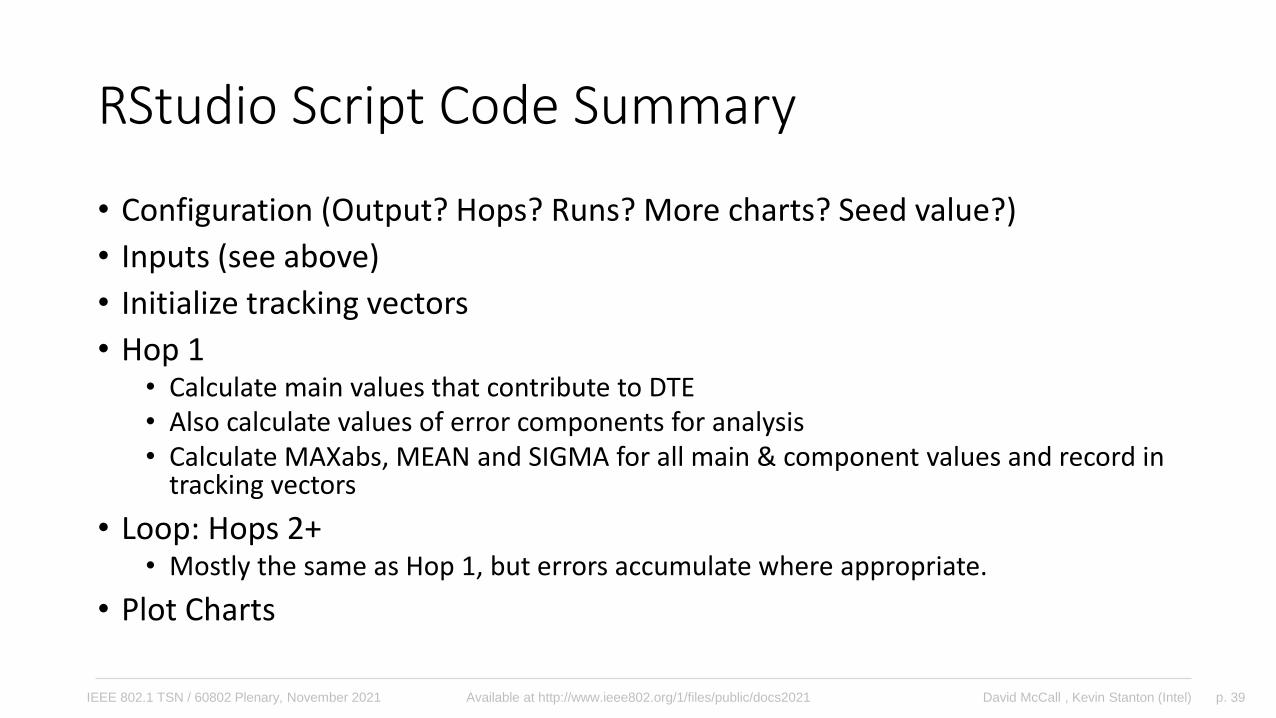
RStudio Script Code Summary
• Configuration (Output? Hops? Runs? More charts? Seed value?)
• Inputs (see above)
• Initialize tracking vectors
• Hop 1• Calculate main values that contribute to DTE• Also calculate values of error components for analysis• Calculate MAXabs, MEAN and SIGMA for all main & component values and record in
tracking vectors
• Loop: Hops 2+• Mostly the same as Hop 1, but errors accumulate where appropriate.
• Plot Charts
p. 40David McCall , Kevin Stanton (Intel)IEEE 802.1 TSN / 60802 Plenary, November 2021 Available at http://www.ieee802.org/1/files/public/docs2021
DemoLenovo Thinkpad T480
Intel(R) Core(TM) i5-8350U CPU @ 1.70GHz 1.90 GHz
16GB RAM
(While running Webex & background corporate apps)
p. 41David McCall , Kevin Stanton (Intel)IEEE 802.1 TSN / 60802 Plenary, November 2021 Available at http://www.ieee802.org/1/files/public/docs2021
Results
• Monte Carlo analysis of errors allows for many “runs” in very little time.• 100hops & 100,000 runs in <30 seconds
• Calculating hops takes <15 seconds; rest of time spent generating plots
• Add approx. 10 seconds to generate additional detailed plots
• Next step: determine if the results are useful.• Compare to previous Time Series Simulation
p. 42David McCall , Kevin Stanton (Intel)IEEE 802.1 TSN / 60802 Plenary, November 2021 Available at http://www.ieee802.org/1/files/public/docs2021
Comparison withTime Series Simulations
p. 43David McCall , Kevin Stanton (Intel)IEEE 802.1 TSN / 60802 Plenary, November 2021 Available at http://www.ieee802.org/1/files/public/docs2021
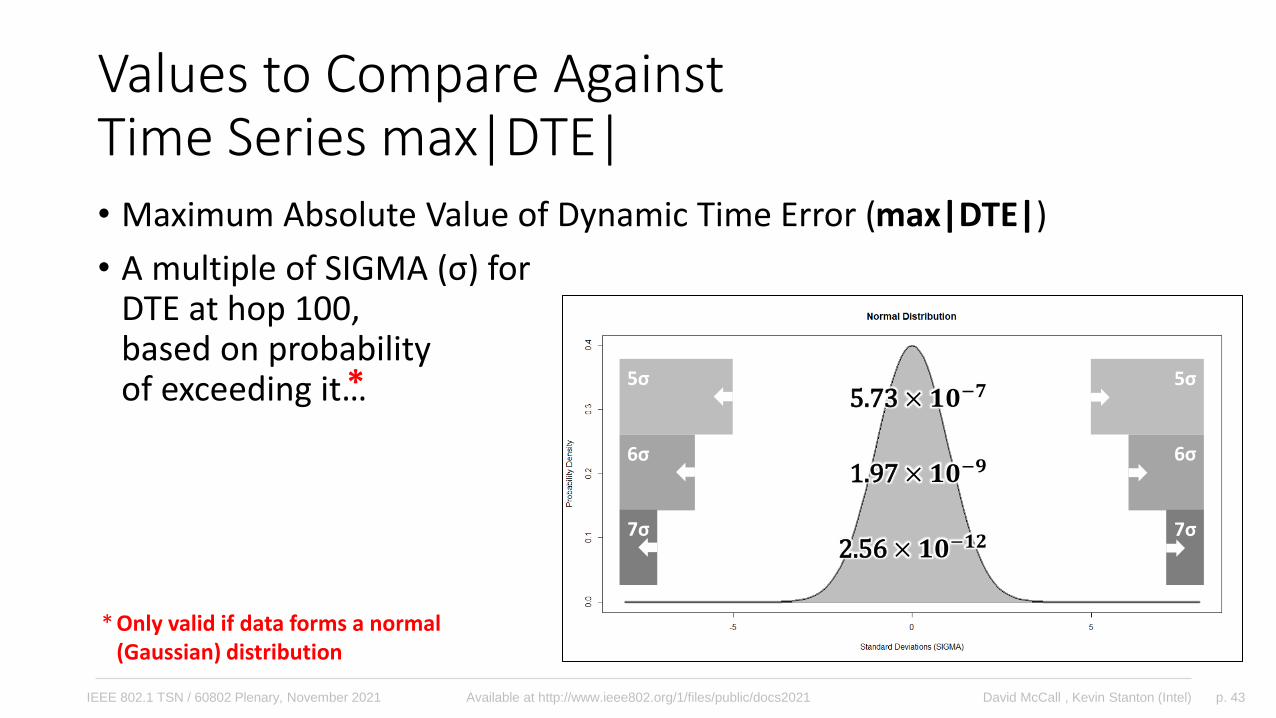
Values to Compare AgainstTime Series max|DTE|• Maximum Absolute Value of Dynamic Time Error (max|DTE|)
• A multiple of SIGMA (σ) forDTE at hop 100,based on probabilityof exceeding it… 5σ 5σ
5.73 × 𝟏𝟎−𝟕
6σ 6σ1.97 × 𝟏𝟎−𝟗
7σ 7σ2.56 × 𝟏𝟎−𝟏𝟐
*
* Only valid if data forms a normal(Gaussian) distribution
p. 44David McCall , Kevin Stanton (Intel)IEEE 802.1 TSN / 60802 Plenary, November 2021 Available at http://www.ieee802.org/1/files/public/docs2021
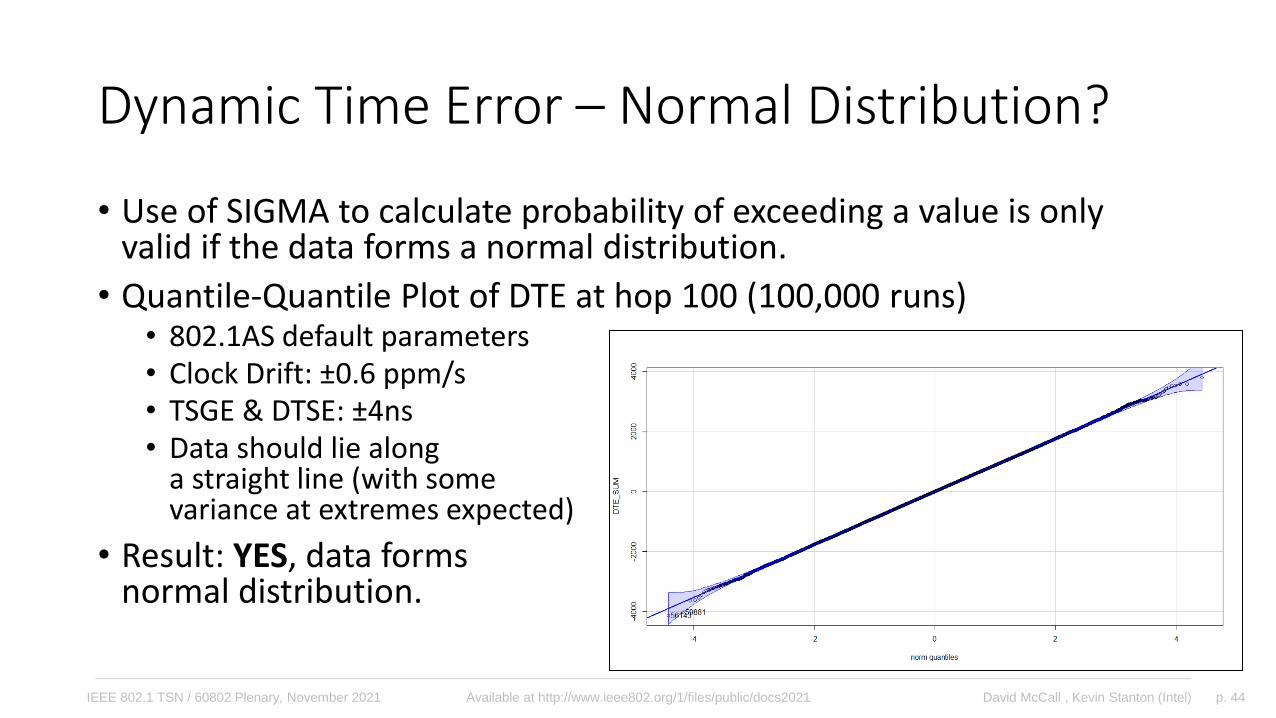
Dynamic Time Error – Normal Distribution?
• Use of SIGMA to calculate probability of exceeding a value is only valid if the data forms a normal distribution.
• Quantile-Quantile Plot of DTE at hop 100 (100,000 runs)• 802.1AS default parameters• Clock Drift: ±0.6 ppm/s• TSGE & DTSE: ±4ns• Data should lie along
a straight line (with somevariance at extremes expected)
• Result: YES, data formsnormal distribution.
p. 45David McCall , Kevin Stanton (Intel)IEEE 802.1 TSN / 60802 Plenary, November 2021 Available at http://www.ieee802.org/1/files/public/docs2021
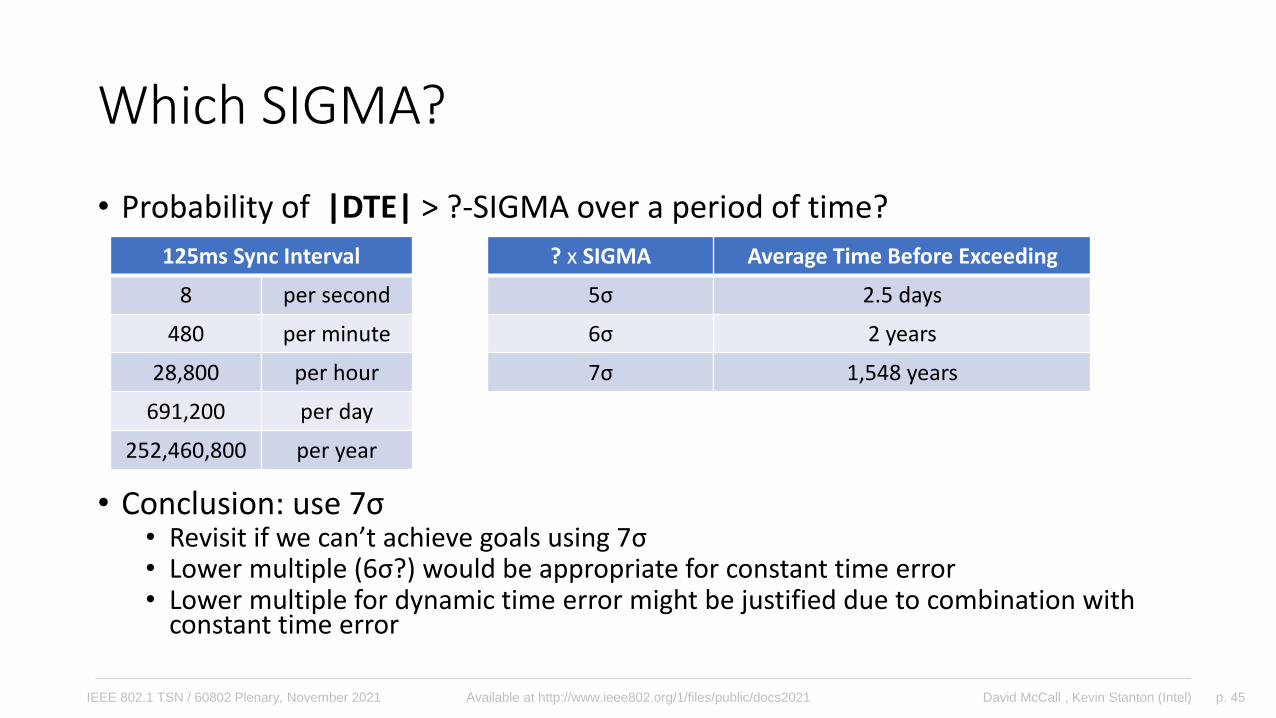
Which SIGMA?
• Probability of |DTE| > ?-SIGMA over a period of time?
• Conclusion: use 7σ• Revisit if we can’t achieve goals using 7σ• Lower multiple (6σ?) would be appropriate for constant time error• Lower multiple for dynamic time error might be justified due to combination with
constant time error
125ms Sync Interval
8 per second
480 per minute
28,800 per hour
691,200 per day
252,460,800 per year
? x SIGMA Average Time Before Exceeding
5σ 2.5 days
6σ 2 years
7σ 1,548 years
p. 46David McCall , Kevin Stanton (Intel)IEEE 802.1 TSN / 60802 Plenary, November 2021 Available at http://www.ieee802.org/1/files/public/docs2021
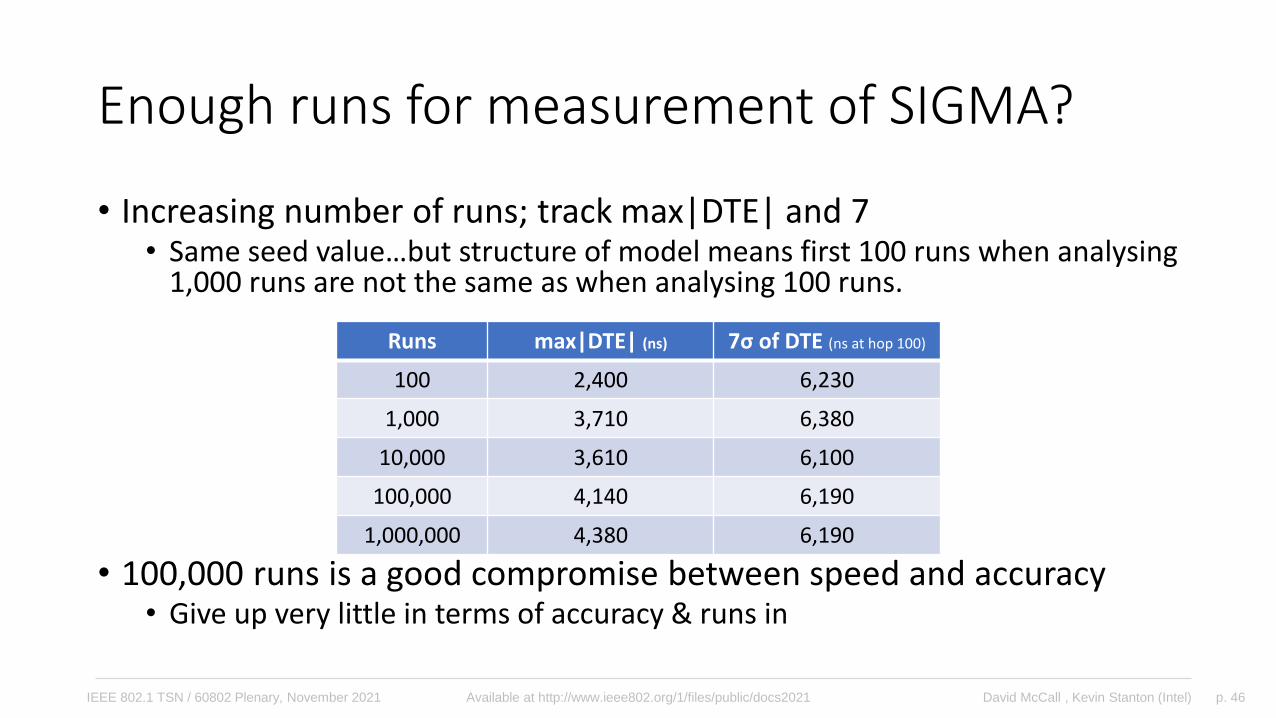
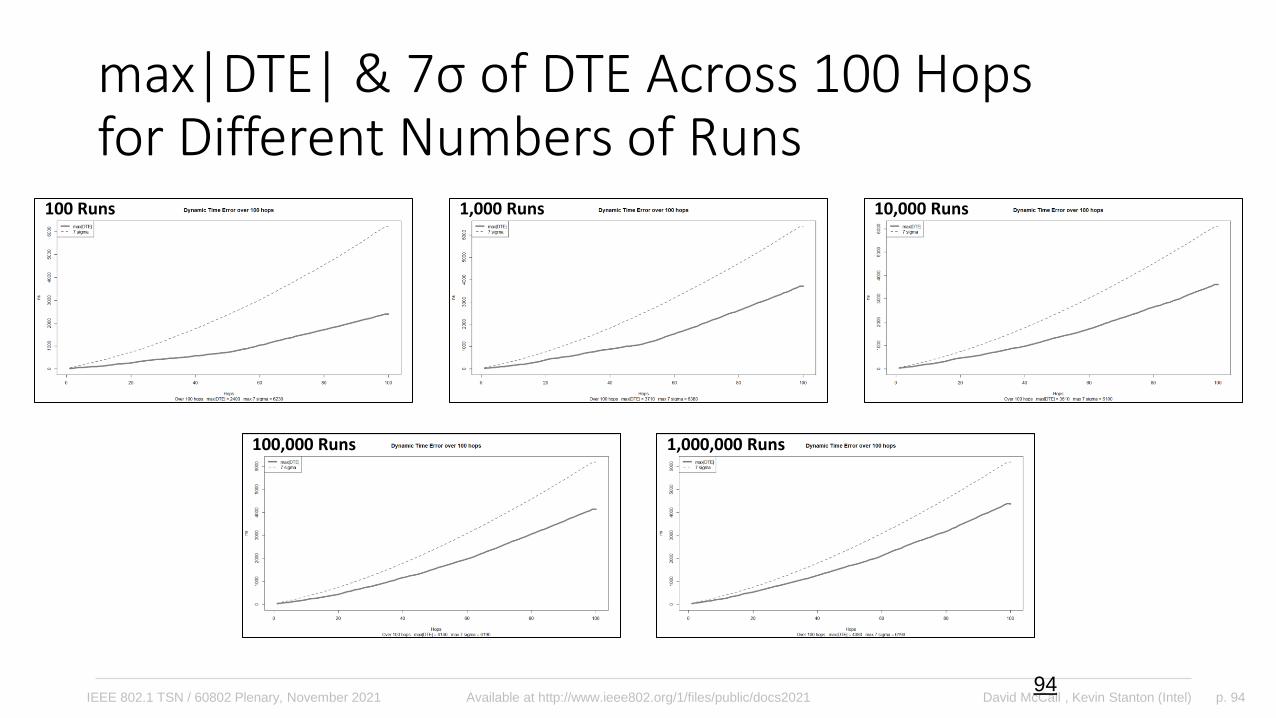
Enough runs for measurement of SIGMA?
• Increasing number of runs; track max|DTE| and 7• Same seed value…but structure of model means first 100 runs when analysing
1,000 runs are not the same as when analysing 100 runs.
• 100,000 runs is a good compromise between speed and accuracy• Give up very little in terms of accuracy & runs in
Runs max|DTE| (ns) 7σ of DTE (ns at hop 100)
100 2,400 6,230
1,000 3,710 6,380
10,000 3,610 6,100
100,000 4,140 6,190
1,000,000 4,380 6,190
p. 47David McCall , Kevin Stanton (Intel)IEEE 802.1 TSN / 60802 Plenary, November 2021 Available at http://www.ieee802.org/1/files/public/docs2021
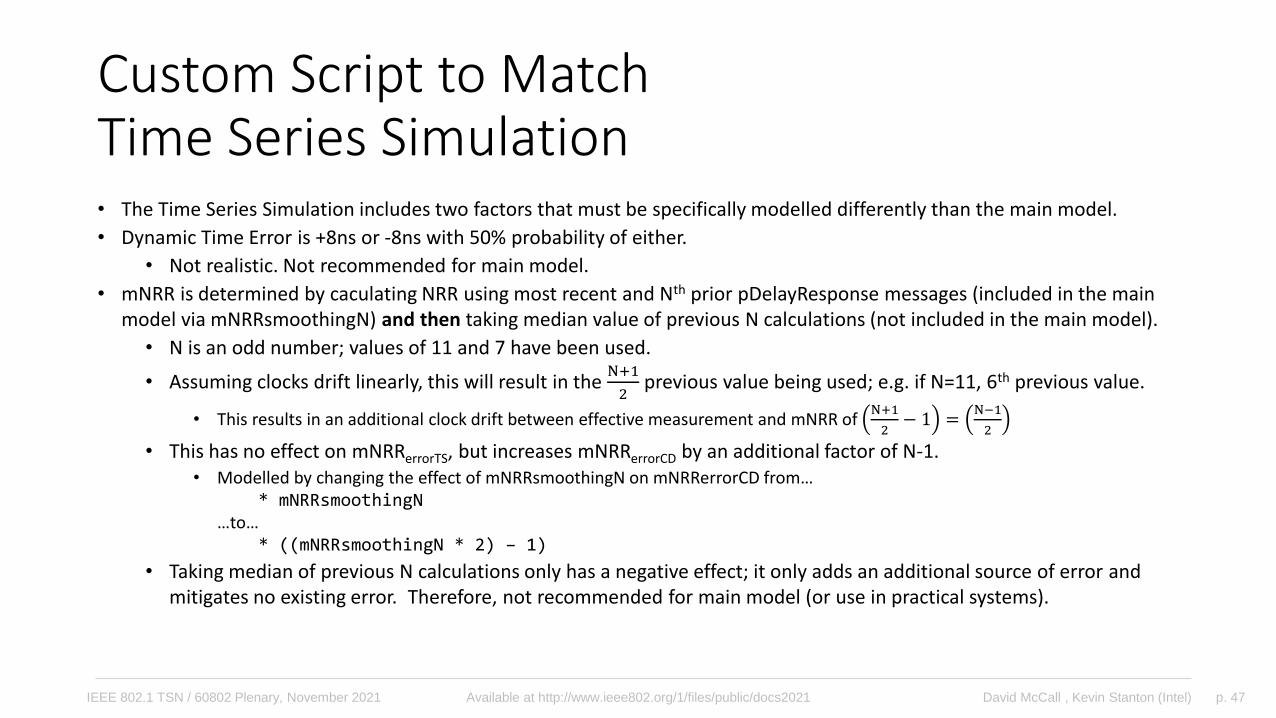
Custom Script to MatchTime Series Simulation• The Time Series Simulation includes two factors that must be specifically modelled differently than the main model.
• Dynamic Time Error is +8ns or -8ns with 50% probability of either.
• Not realistic. Not recommended for main model.
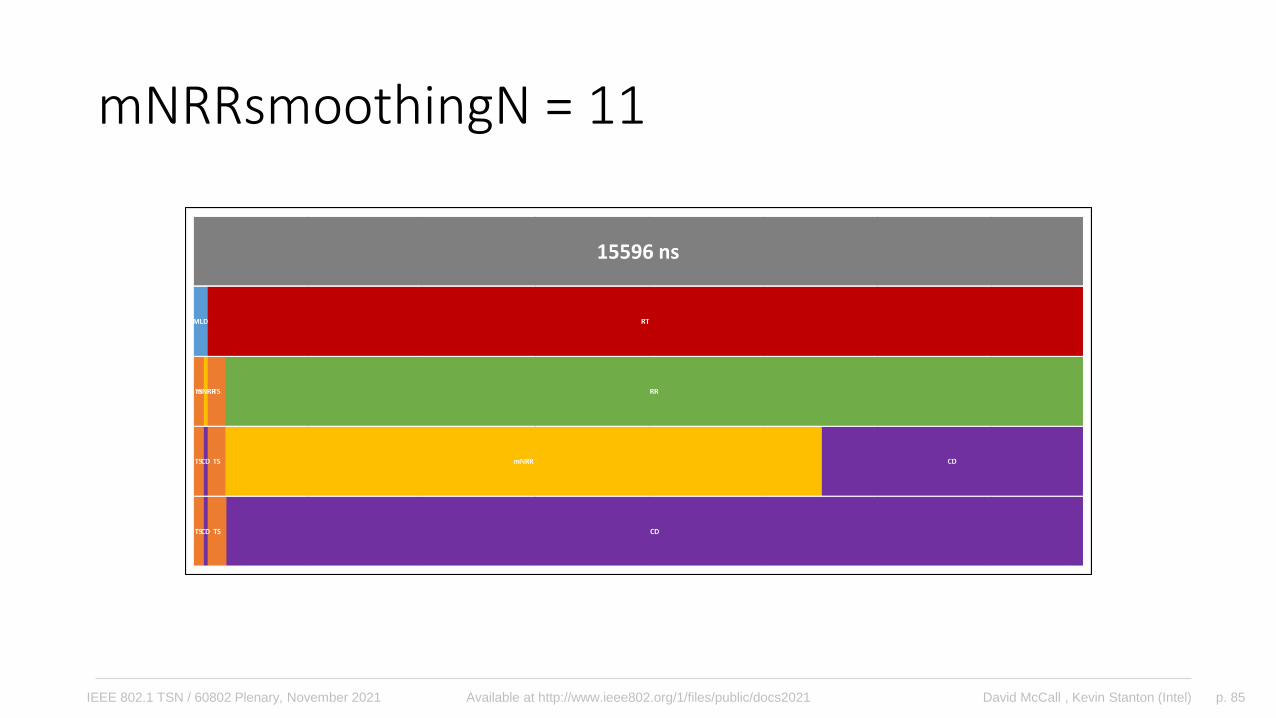
• mNRR is determined by caculating NRR using most recent and Nth prior pDelayResponse messages (included in the main model via mNRRsmoothingN) and then taking median value of previous N calculations (not included in the main model).
• N is an odd number; values of 11 and 7 have been used.
• Assuming clocks drift linearly, this will result in the N+1
2previous value being used; e.g. if N=11, 6th previous value.
• This results in an additional clock drift between effective measurement and mNRR of N+1
2− 1 =
N−1
2
• This has no effect on mNRRerrorTS, but increases mNRRerrorCD by an additional factor of N-1.• Modelled by changing the effect of mNRRsmoothingN on mNRRerrorCD from…
* mNRRsmoothingN…to…
* ((mNRRsmoothingN * 2) – 1)
• Taking median of previous N calculations only has a negative effect; it only adds an additional source of error and mitigates no existing error. Therefore, not recommended for main model (or use in practical systems).
p. 48David McCall , Kevin Stanton (Intel)IEEE 802.1 TSN / 60802 Plenary, November 2021 Available at http://www.ieee802.org/1/files/public/docs2021
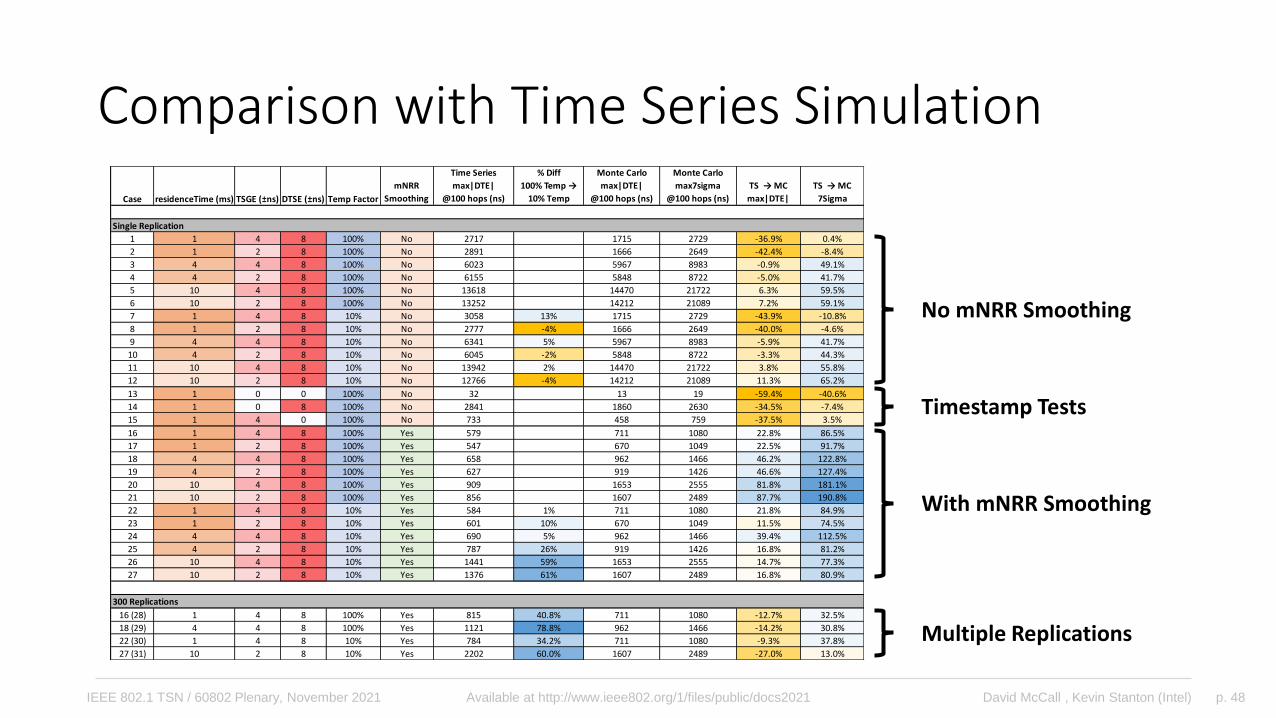
Comparison with Time Series Simulation
Case residenceTime (ms) TSGE (±ns) DTSE (±ns) Temp Factor
mNRR
Smoothing
Time Series
max|DTE|
@100 hops (ns)
% Diff
100% Temp →
10% Temp
Monte Carlo
max|DTE|
@100 hops (ns)
Monte Carlo
max7sigma
@100 hops (ns)
TS → MC
max|DTE|
TS → MC
7Sigma
1 1 4 8 100% No 2717 1715 2729 -36.9% 0.4%
2 1 2 8 100% No 2891 1666 2649 -42.4% -8.4%
3 4 4 8 100% No 6023 5967 8983 -0.9% 49.1%
4 4 2 8 100% No 6155 5848 8722 -5.0% 41.7%
5 10 4 8 100% No 13618 14470 21722 6.3% 59.5%
6 10 2 8 100% No 13252 14212 21089 7.2% 59.1%
7 1 4 8 10% No 3058 13% 1715 2729 -43.9% -10.8%
8 1 2 8 10% No 2777 -4% 1666 2649 -40.0% -4.6%
9 4 4 8 10% No 6341 5% 5967 8983 -5.9% 41.7%
10 4 2 8 10% No 6045 -2% 5848 8722 -3.3% 44.3%
11 10 4 8 10% No 13942 2% 14470 21722 3.8% 55.8%
12 10 2 8 10% No 12766 -4% 14212 21089 11.3% 65.2%
13 1 0 0 100% No 32 13 19 -59.4% -40.6%
14 1 0 8 100% No 2841 1860 2630 -34.5% -7.4%
15 1 4 0 100% No 733 458 759 -37.5% 3.5%
16 1 4 8 100% Yes 579 711 1080 22.8% 86.5%
17 1 2 8 100% Yes 547 670 1049 22.5% 91.7%
18 4 4 8 100% Yes 658 962 1466 46.2% 122.8%
19 4 2 8 100% Yes 627 919 1426 46.6% 127.4%
20 10 4 8 100% Yes 909 1653 2555 81.8% 181.1%
21 10 2 8 100% Yes 856 1607 2489 87.7% 190.8%
22 1 4 8 10% Yes 584 1% 711 1080 21.8% 84.9%
23 1 2 8 10% Yes 601 10% 670 1049 11.5% 74.5%
24 4 4 8 10% Yes 690 5% 962 1466 39.4% 112.5%
25 4 2 8 10% Yes 787 26% 919 1426 16.8% 81.2%
26 10 4 8 10% Yes 1441 59% 1653 2555 14.7% 77.3%
27 10 2 8 10% Yes 1376 61% 1607 2489 16.8% 80.9%
16 (28) 1 4 8 100% Yes 815 40.8% 711 1080 -12.7% 32.5%
18 (29) 4 4 8 100% Yes 1121 78.8% 962 1466 -14.2% 30.8%
22 (30) 1 4 8 10% Yes 784 34.2% 711 1080 -9.3% 37.8%
27 (31) 10 2 8 10% Yes 2202 60.0% 1607 2489 -27.0% 13.0%
Single Replication
300 Replications
No mNRR Smoothing
Timestamp Tests
With mNRR Smoothing
Multiple Replications
p. 49David McCall , Kevin Stanton (Intel)IEEE 802.1 TSN / 60802 Plenary, November 2021 Available at http://www.ieee802.org/1/files/public/docs2021
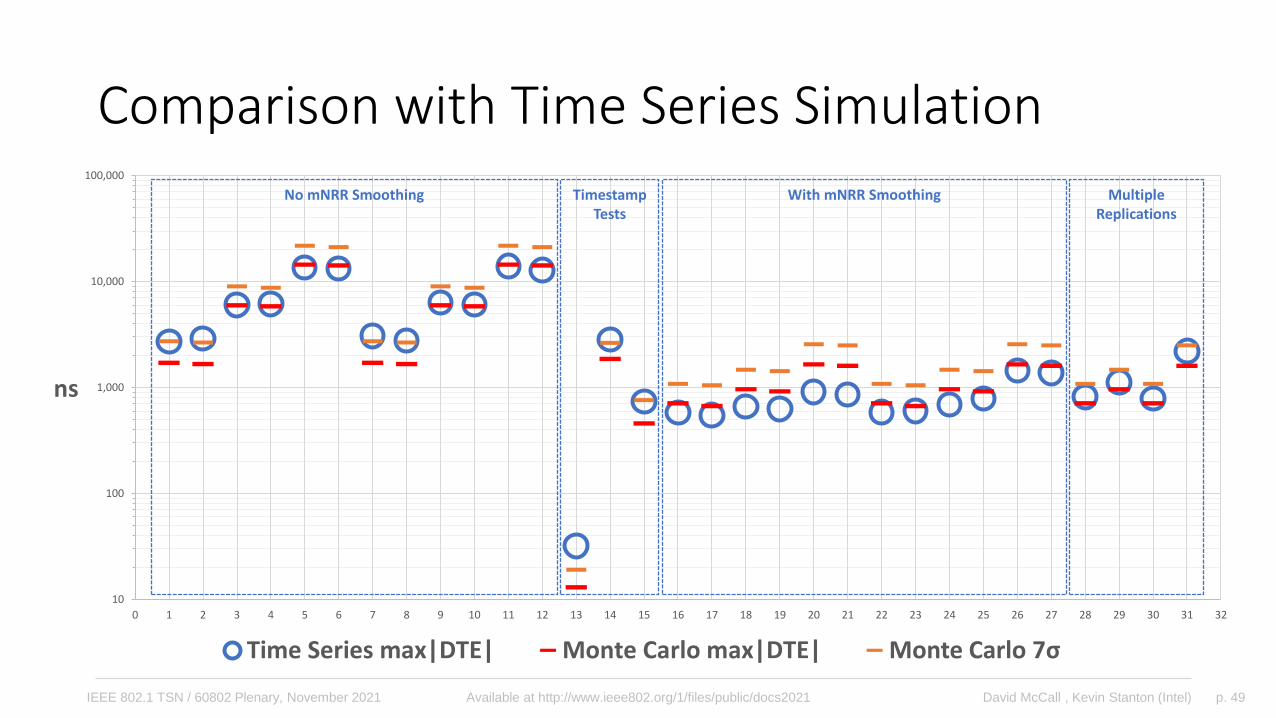
Comparison with Time Series Simulation
10
100
1,000
10,000
100,000
0 1 2 3 4 5 6 7 8 9 10 11 12 13 14 15 16 17 18 19 20 21 22 23 24 25 26 27 28 29 30 31 32
ns
Time Series max|DTE| Monte Carlo max|DTE| Monte Carlo 7σ
No mNRR Smoothing With mNRR SmoothingTimestampTests
Multiple Replications
p. 50David McCall , Kevin Stanton (Intel)IEEE 802.1 TSN / 60802 Plenary, November 2021 Available at http://www.ieee802.org/1/files/public/docs2021
Comparison with Time Series Simulation
• Monte Carlo results broadly align with Time Series results
• Where results deviate the most, they are still usefully close and the Monte Carlo results move in the same direction and by similar amounts as the Time Series results when input parameters change
• The closest matches are between Monte Carlo results and results from multiple replications of the Time Series simulation
• Monte Carlo analysis is definitely good enough for investigatingapproaches to minimising DTE
p. 51David McCall , Kevin Stanton (Intel)IEEE 802.1 TSN / 60802 Plenary, November 2021 Available at http://www.ieee802.org/1/files/public/docs2021
Error Analysis
p. 52David McCall , Kevin Stanton (Intel)IEEE 802.1 TSN / 60802 Plenary, November 2021 Available at http://www.ieee802.org/1/files/public/docs2021
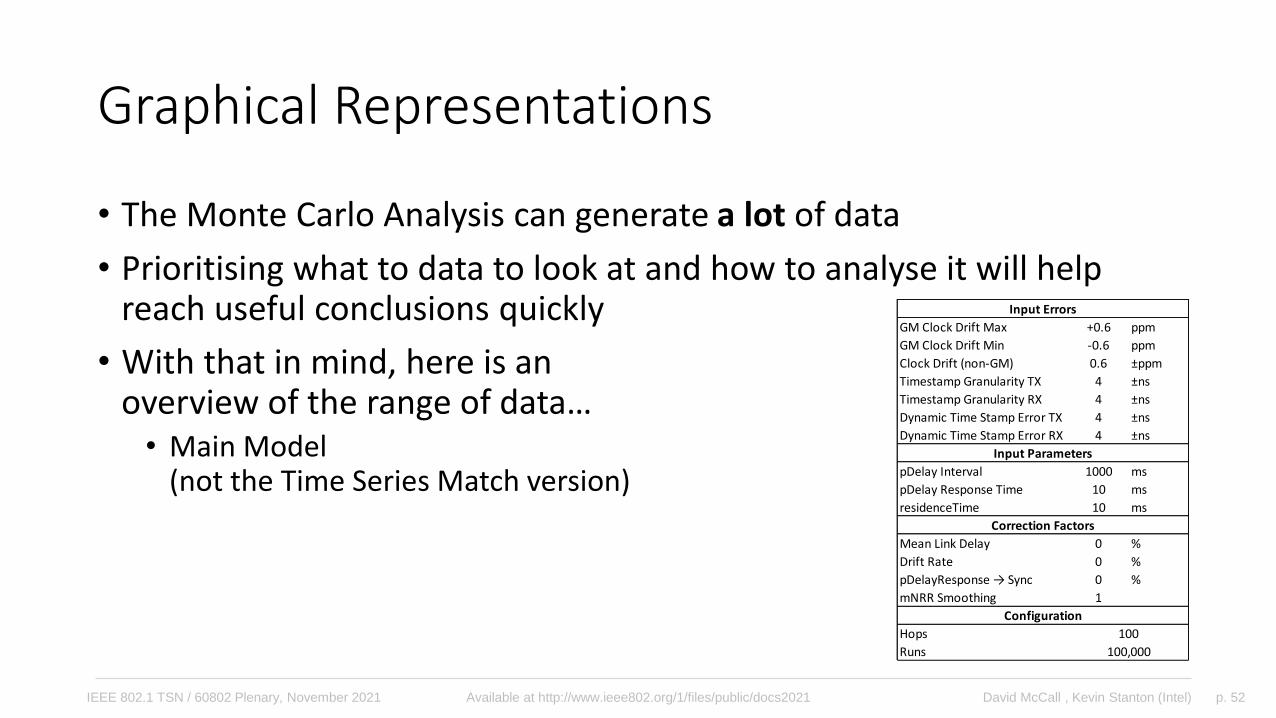
Graphical Representations
• The Monte Carlo Analysis can generate a lot of data
• Prioritising what to data to look at and how to analyse it will help reach useful conclusions quickly
• With that in mind, here is anoverview of the range of data…• Main Model
(not the Time Series Match version)
GM Clock Drift Max +0.6 ppm
GM Clock Drift Min -0.6 ppm
Clock Drift (non-GM) 0.6 ±ppm
Timestamp Granularity TX 4 ±ns
Timestamp Granularity RX 4 ±ns
Dynamic Time Stamp Error TX 4 ±ns
Dynamic Time Stamp Error RX 4 ±ns
pDelay Interval 1000 ms
pDelay Response Time 10 ms
residenceTime 10 ms
Mean Link Delay 0 %
Drift Rate 0 %
pDelayResponse → Sync 0 %
mNRR Smoothing 1
Hops
Runs
Configuration
100
100,000
Input Parameters
Correction Factors
Input Errors
p. 53David McCall , Kevin Stanton (Intel)IEEE 802.1 TSN / 60802 Plenary, November 2021 Available at http://www.ieee802.org/1/files/public/docs2021
mNRR Error
p. 54David McCall , Kevin Stanton (Intel)IEEE 802.1 TSN / 60802 Plenary, November 2021 Available at http://www.ieee802.org/1/files/public/docs2021
Rate Ratio Error – Timestamp & Clock Drift
p. 55David McCall , Kevin Stanton (Intel)IEEE 802.1 TSN / 60802 Plenary, November 2021 Available at http://www.ieee802.org/1/files/public/docs2021
Rate Ratio Error – mNRR & Direct Clock Drift
p. 56David McCall , Kevin Stanton (Intel)IEEE 802.1 TSN / 60802 Plenary, November 2021 Available at http://www.ieee802.org/1/files/public/docs2021
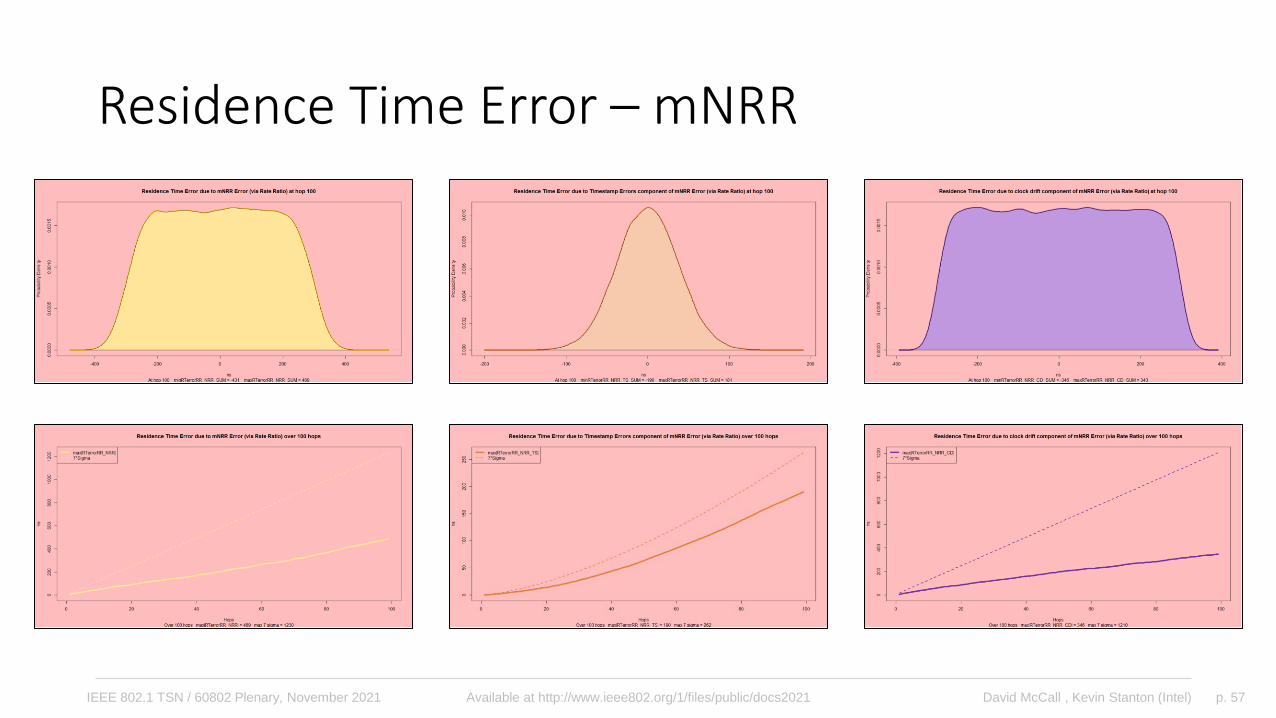
Residence Time Error –Timestamp & Clock Drift
p. 57David McCall , Kevin Stanton (Intel)IEEE 802.1 TSN / 60802 Plenary, November 2021 Available at http://www.ieee802.org/1/files/public/docs2021
Residence Time Error – mNRR
p. 58David McCall , Kevin Stanton (Intel)IEEE 802.1 TSN / 60802 Plenary, November 2021 Available at http://www.ieee802.org/1/files/public/docs2021
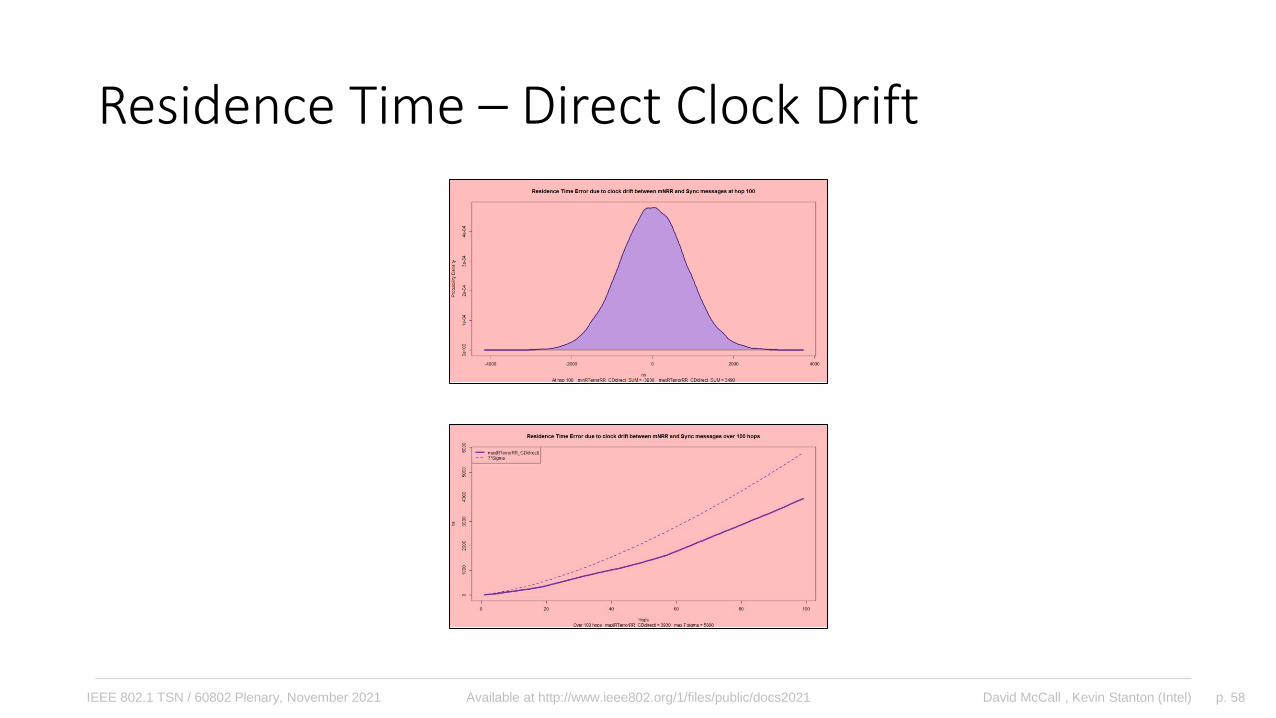
Residence Time – Direct Clock Drift
p. 59David McCall , Kevin Stanton (Intel)IEEE 802.1 TSN / 60802 Plenary, November 2021 Available at http://www.ieee802.org/1/files/public/docs2021
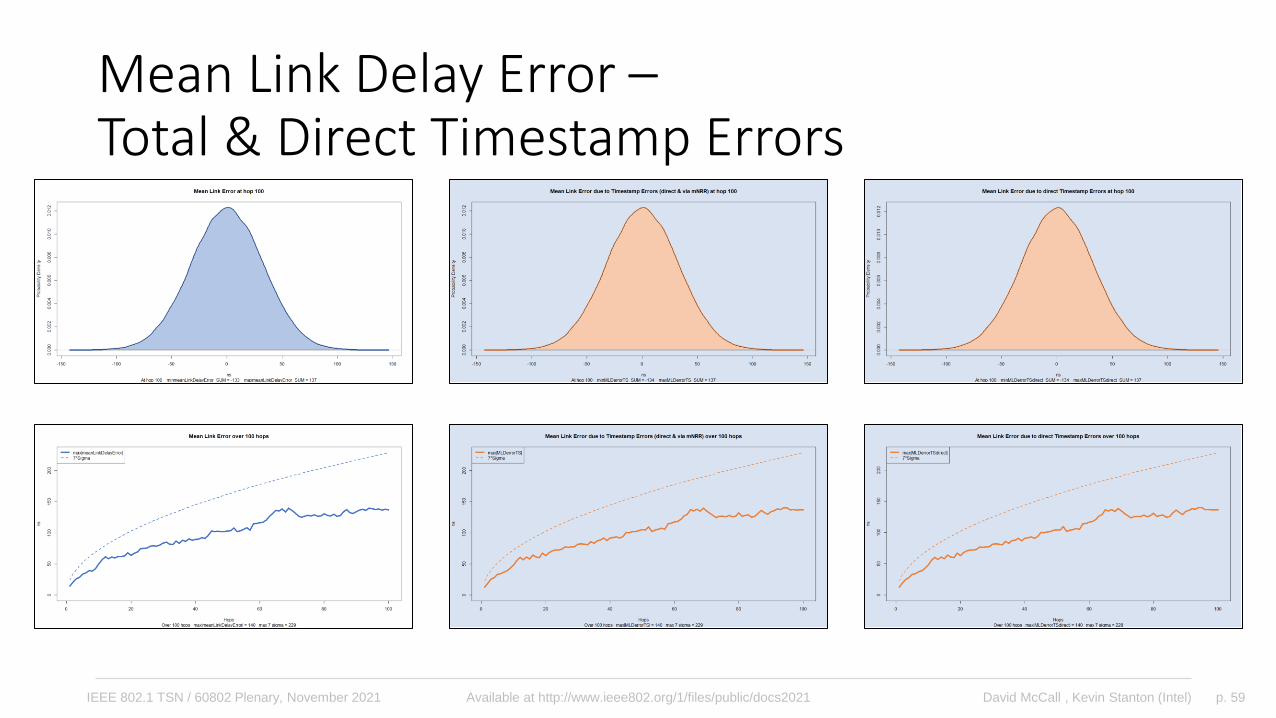
Mean Link Delay Error –Total & Direct Timestamp Errors
p. 60David McCall , Kevin Stanton (Intel)IEEE 802.1 TSN / 60802 Plenary, November 2021 Available at http://www.ieee802.org/1/files/public/docs2021
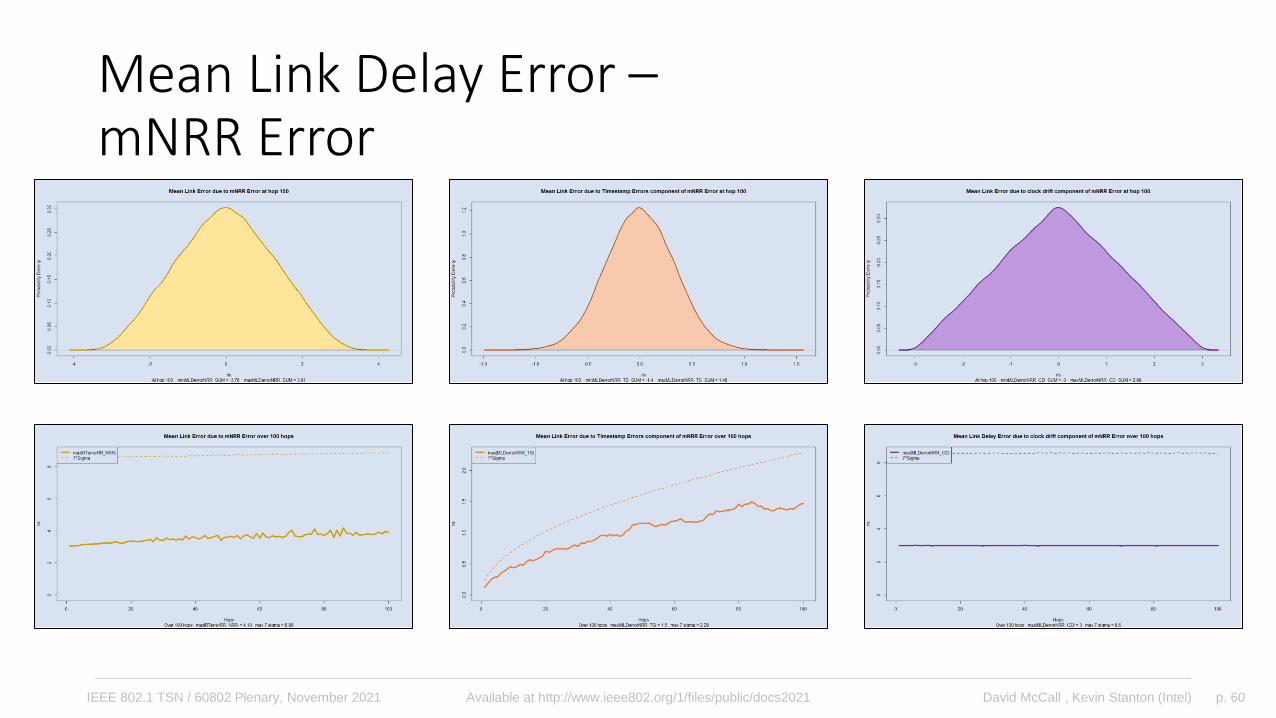
Mean Link Delay Error –mNRR Error
p. 61David McCall , Kevin Stanton (Intel)IEEE 802.1 TSN / 60802 Plenary, November 2021 Available at http://www.ieee802.org/1/files/public/docs2021
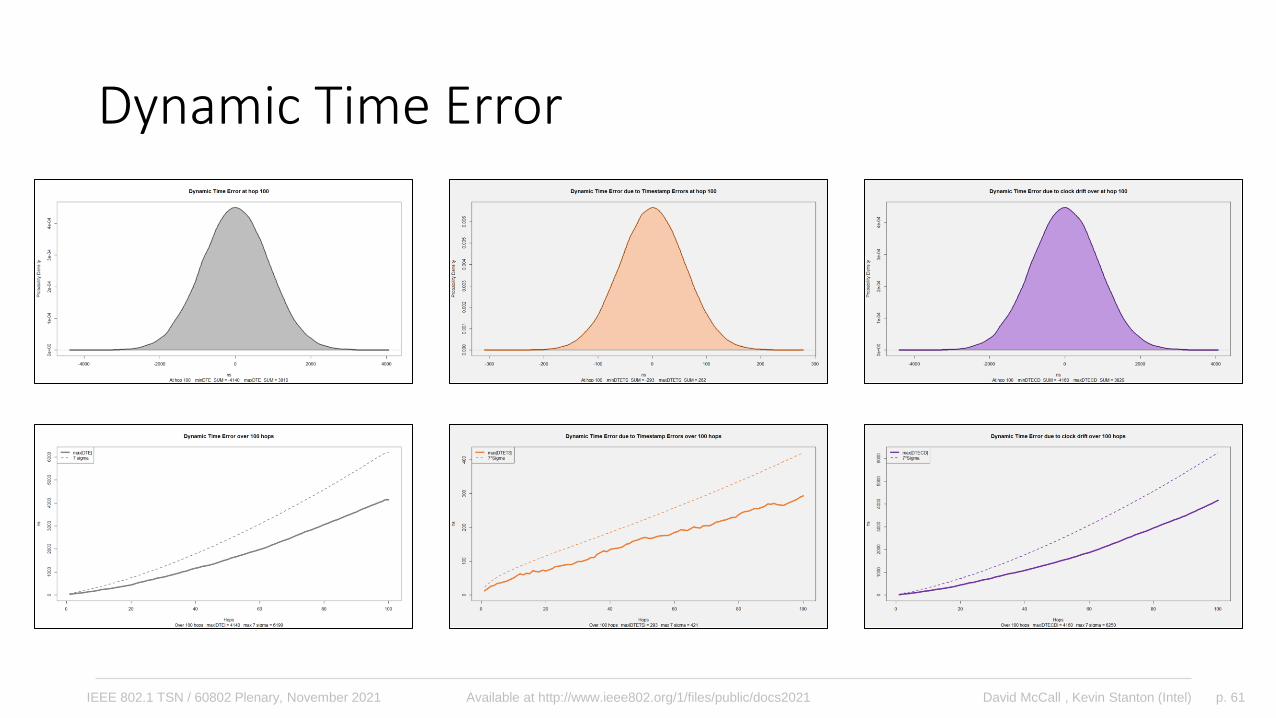
Dynamic Time Error
p. 62David McCall , Kevin Stanton (Intel)IEEE 802.1 TSN / 60802 Plenary, November 2021 Available at http://www.ieee802.org/1/files/public/docs2021
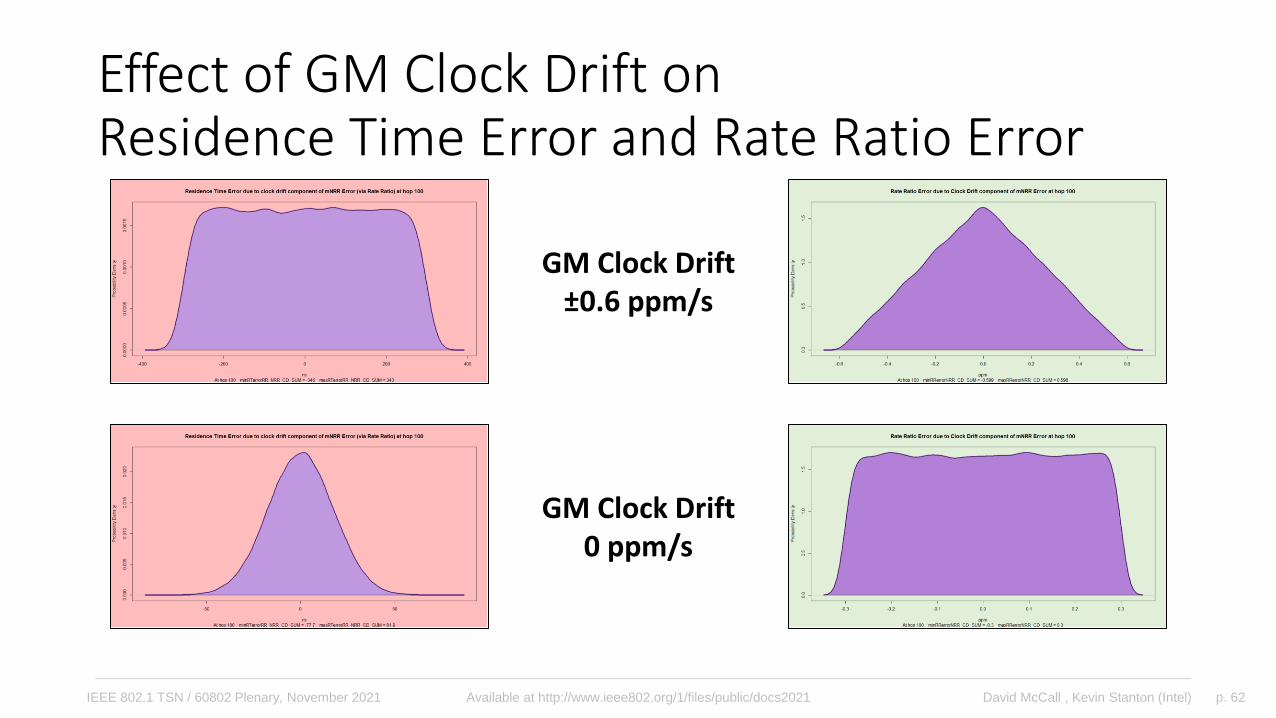
Effect of GM Clock Drift onResidence Time Error and Rate Ratio Error
GM Clock Drift±0.6 ppm/s
GM Clock Drift0 ppm/s

p. 63David McCall , Kevin Stanton (Intel)IEEE 802.1 TSN / 60802 Plenary, November 2021 Available at http://www.ieee802.org/1/files/public/docs2021
Time Sync – How Errors Add Up
Time Stamp Granularity
pDelay Residence Time
Dynamic Time Stamp Error
Clock Drift
&
Link Delay Error Residence Time Error
Dynamic Time Error
Rate Ratio ErrorNeighbor Rate Ratio Error
All errors in this analysis are caused by either Clock Drift or Timestamp Errors
p. 64David McCall , Kevin Stanton (Intel)IEEE 802.1 TSN / 60802 Plenary, November 2021 Available at http://www.ieee802.org/1/files/public/docs2021
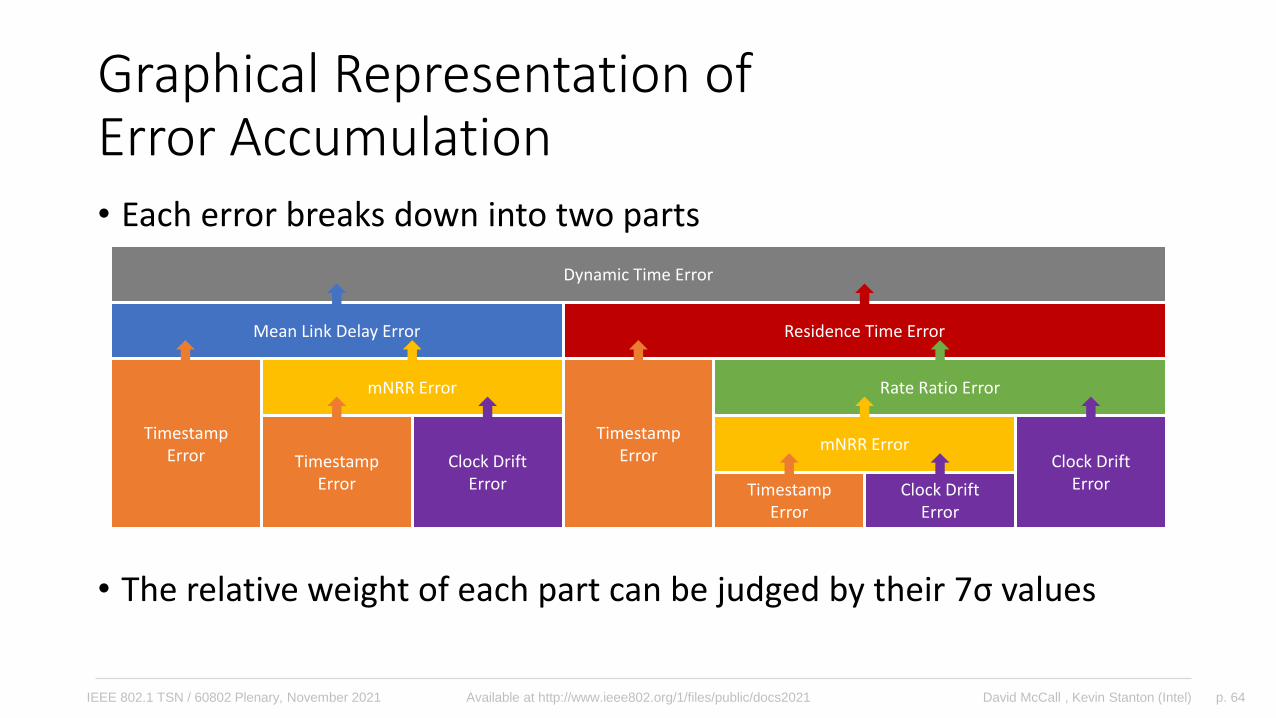
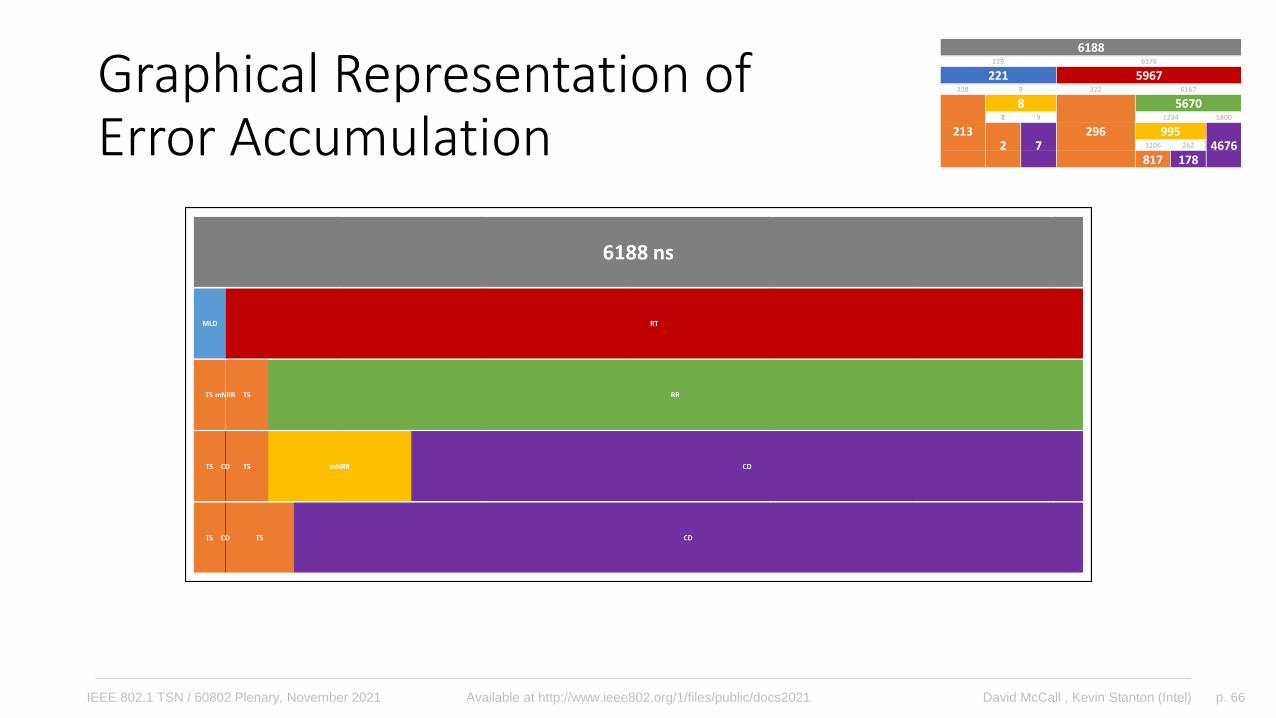
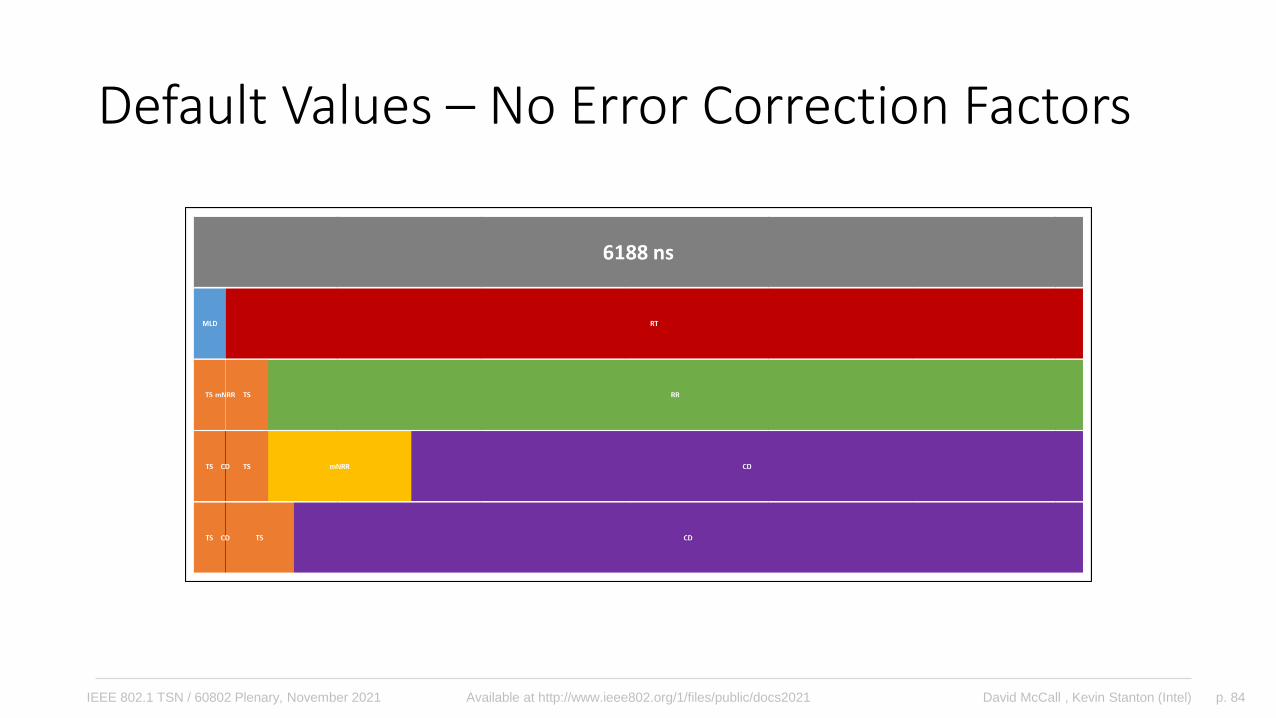
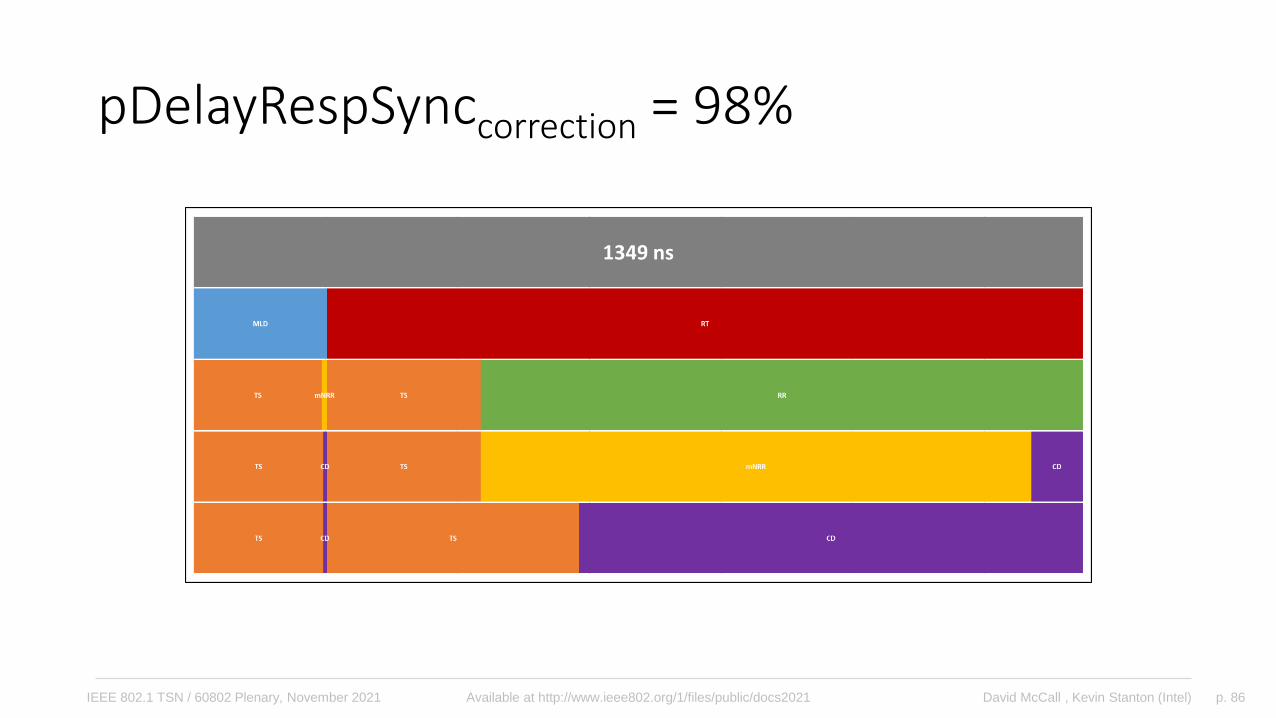
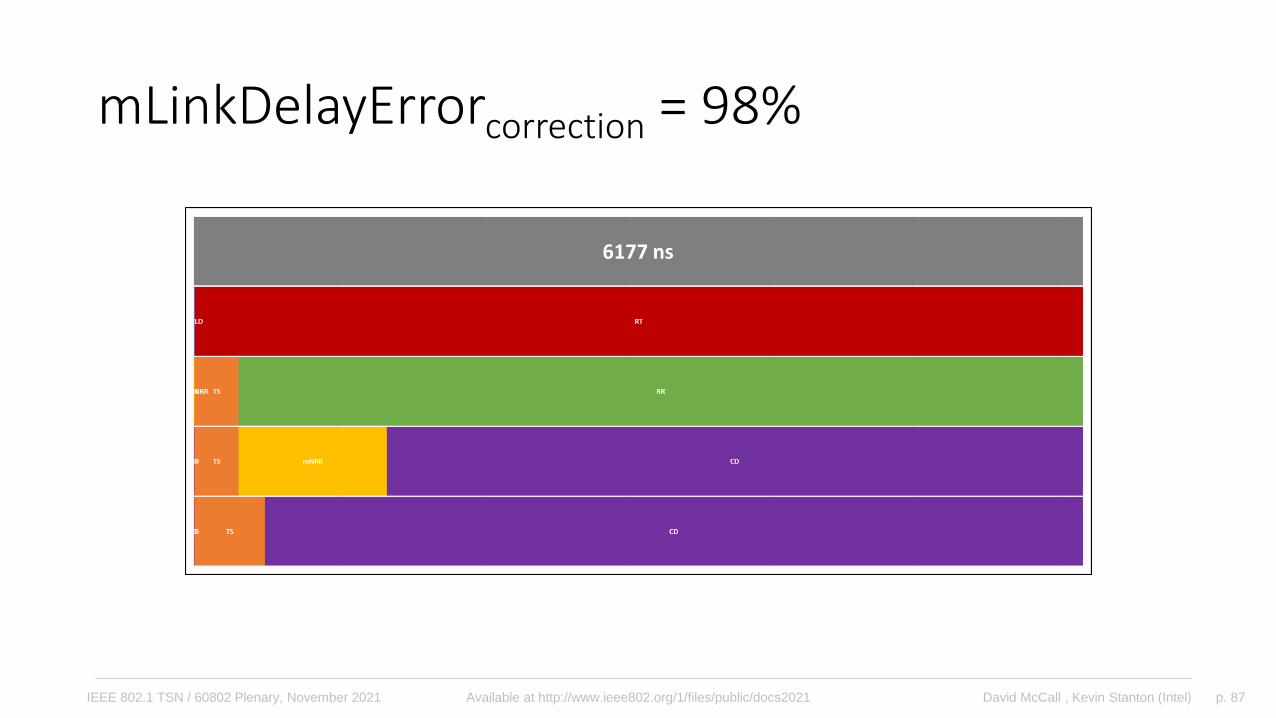
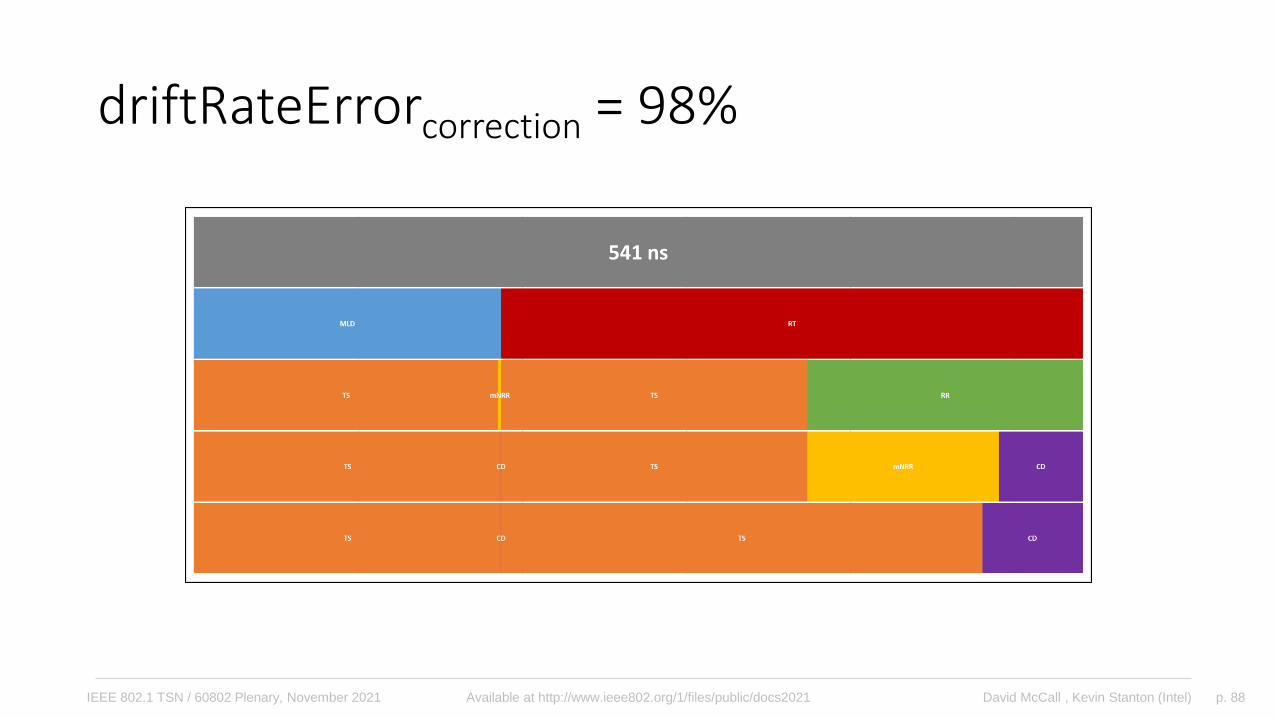
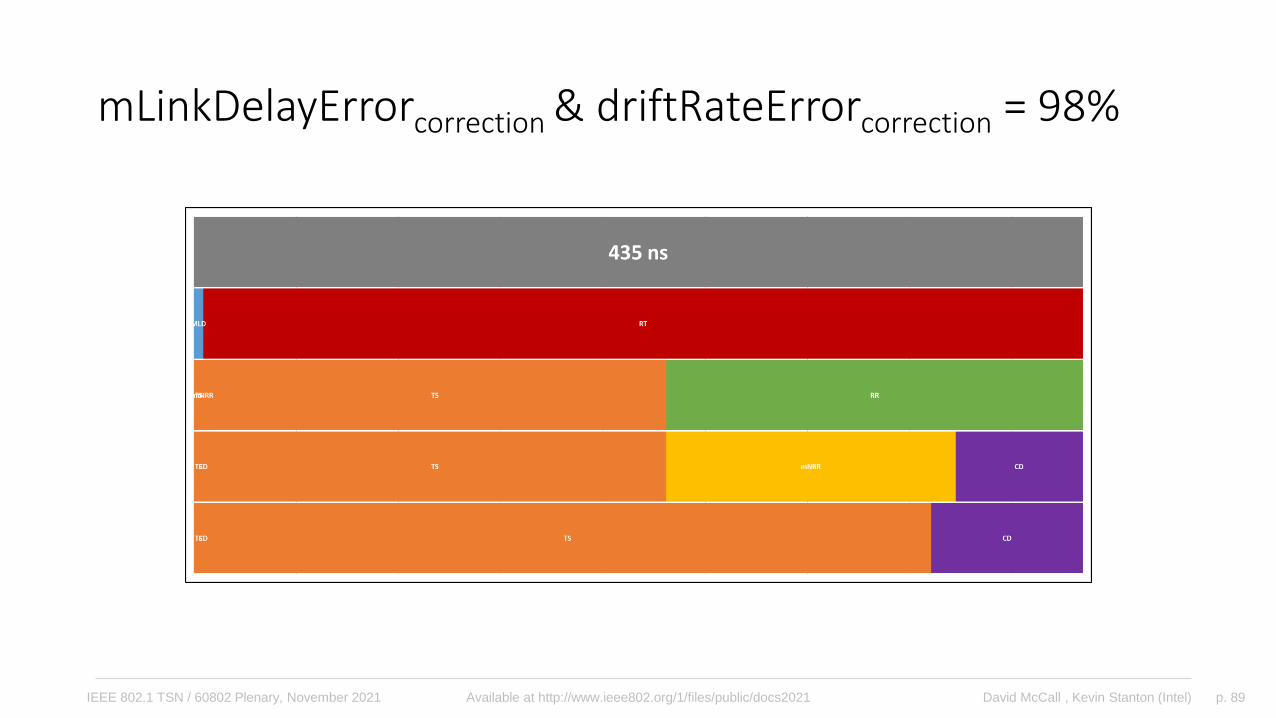
Graphical Representation ofError Accumulation• Each error breaks down into two parts
• The relative weight of each part can be judged by their 7σ values
Dynamic Time Error
Rate Ratio Error
Residence Time Error
TimestampError Timestamp
Error
mNRR Error
Mean Link Delay Error
Clock DriftError
TimestampError
mNRR ErrorClock Drift
ErrorClock DriftError
TimestampError
p. 65David McCall , Kevin Stanton (Intel)IEEE 802.1 TSN / 60802 Plenary, November 2021 Available at http://www.ieee802.org/1/files/public/docs2021
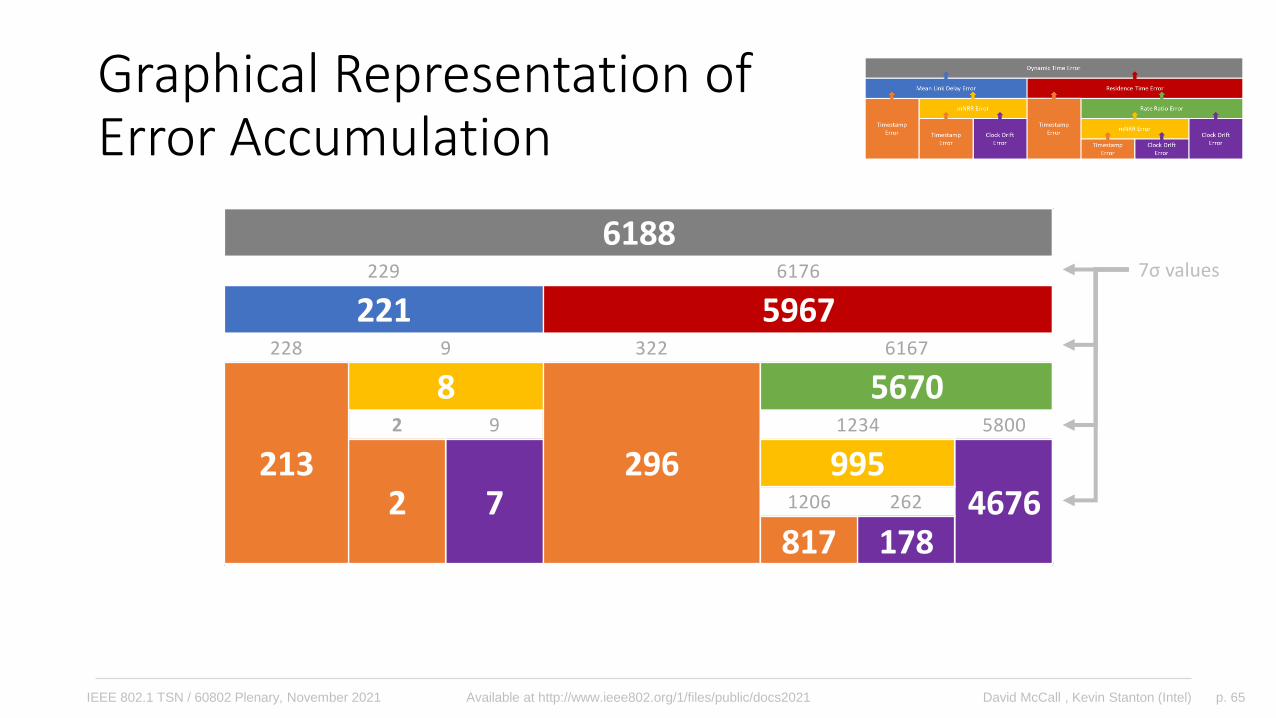
Graphical Representation ofError Accumulation
7σ values
228 322
2 9 5800
1206 262
817 178
2964676
1234
9
86167
5670
9952132 7
229 6176
6188
221 5967
p. 66David McCall , Kevin Stanton (Intel)IEEE 802.1 TSN / 60802 Plenary, November 2021 Available at http://www.ieee802.org/1/files/public/docs2021
Graphical Representation ofError Accumulation
228 322
2 9 5800
1206 262
817 178
2964676
1234
9
86167
5670
9952132 7
229 6176
6188
221 5967
p. 67David McCall , Kevin Stanton (Intel)IEEE 802.1 TSN / 60802 Plenary, November 2021 Available at http://www.ieee802.org/1/files/public/docs2021
pDelayIntervalSensitivity Analysis
p. 68David McCall , Kevin Stanton (Intel)IEEE 802.1 TSN / 60802 Plenary, November 2021 Available at http://www.ieee802.org/1/files/public/docs2021
GM Clock Drift Max +0.6 ppm
GM Clock Drift Min +0.6 ppm
Clock Drift (non-GM) 0.6 ±ppm
Timestamp Granularity TX 4 ±ns
Timestamp Granularity RX 4 ±ns
Dynamic Time Stamp Error TX 4 ±ns
Dynamic Time Stamp Error RX 4 ±ns
pDelay Interval Variable ms
pDelay Response Time 10 ms
residenceTime 10 ms
Mean Link Delay 0 %
Drift Rate 0 %
pDelayResponse → Sync 0 %
mNRR Smoothing 1
Hops
Runs
Input Errors
Input Parameters
Correction Factors
Configuration
100
100,000
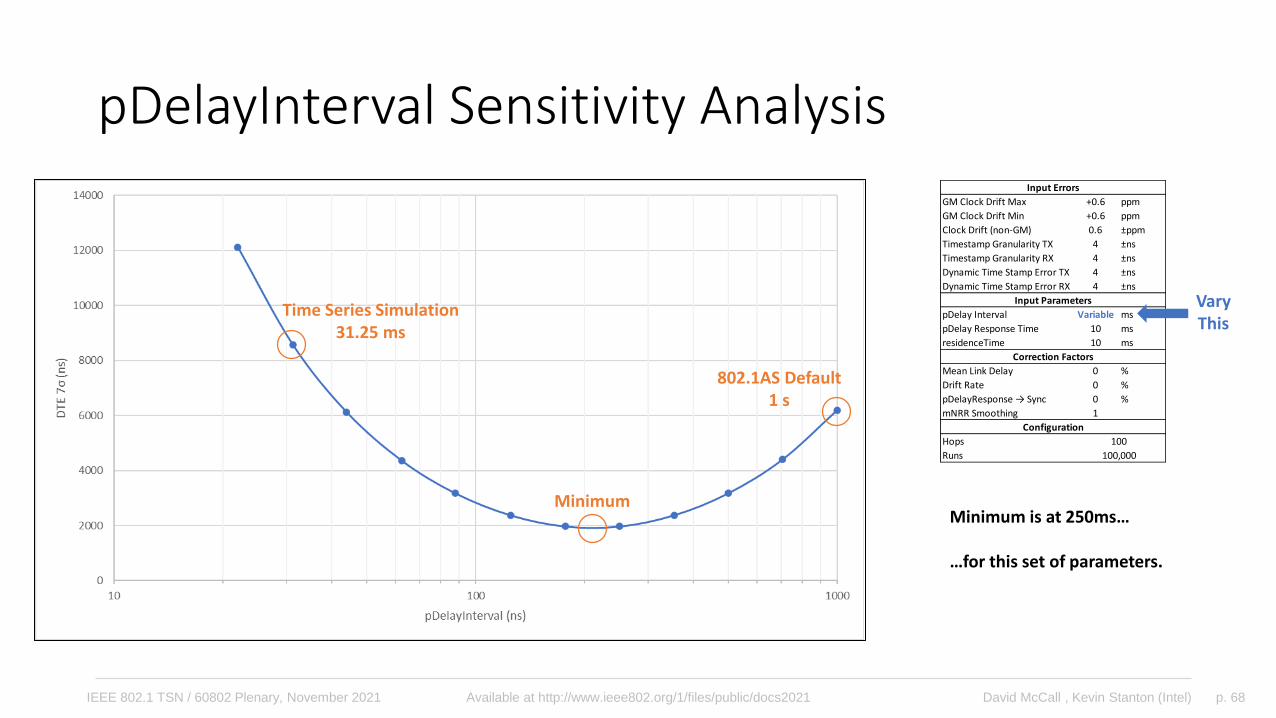
pDelayInterval Sensitivity Analysis
VaryThis
802.1AS Default1 s
Time Series Simulation31.25 ms
Minimum is at 250ms…
…for this set of parameters.
Minimum
p. 69David McCall , Kevin Stanton (Intel)IEEE 802.1 TSN / 60802 Plenary, November 2021 Available at http://www.ieee802.org/1/files/public/docs2021
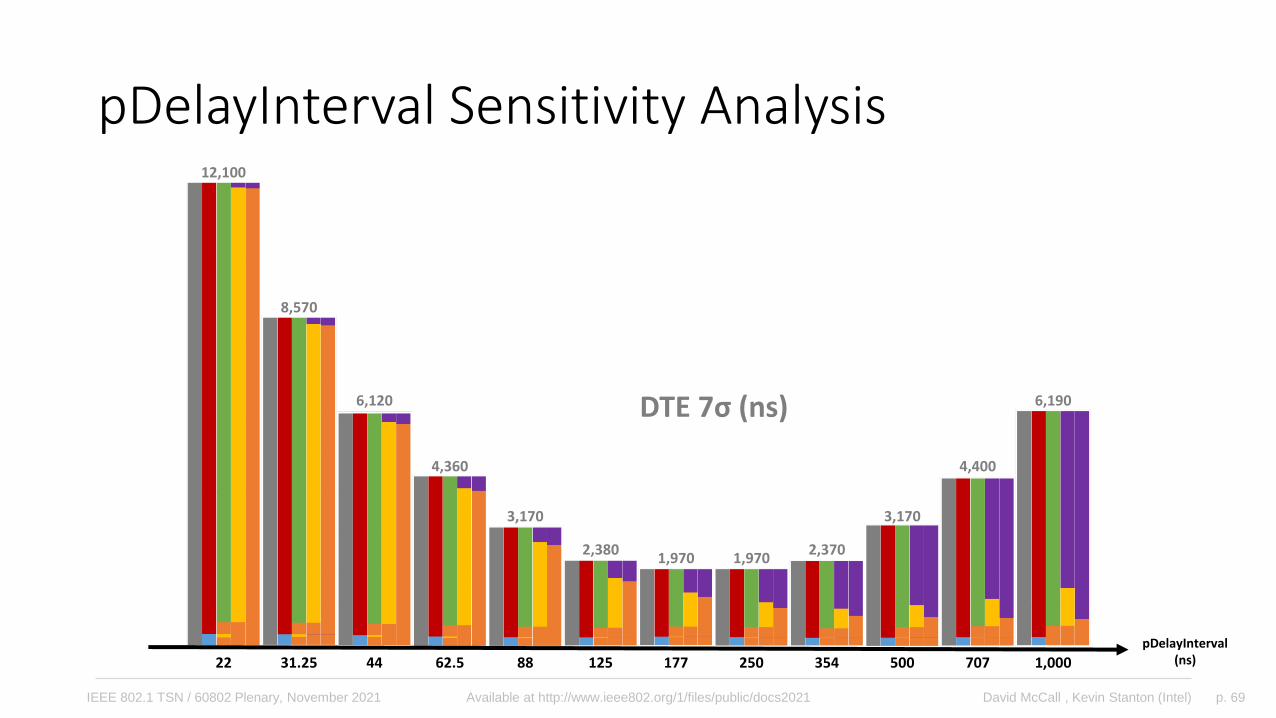
pDelayInterval Sensitivity Analysis12,100
8,570
6,120
4,360
3,170
2,3801,970 1,970
2,370
3,170
4,400
6,190DTE 7σ (ns)
pDelayInterval(ns)22 31.25 44 62.5 88 125 177 250 354 500 707 1,000
p. 70David McCall , Kevin Stanton (Intel)IEEE 802.1 TSN / 60802 Plenary, November 2021 Available at http://www.ieee802.org/1/files/public/docs2021
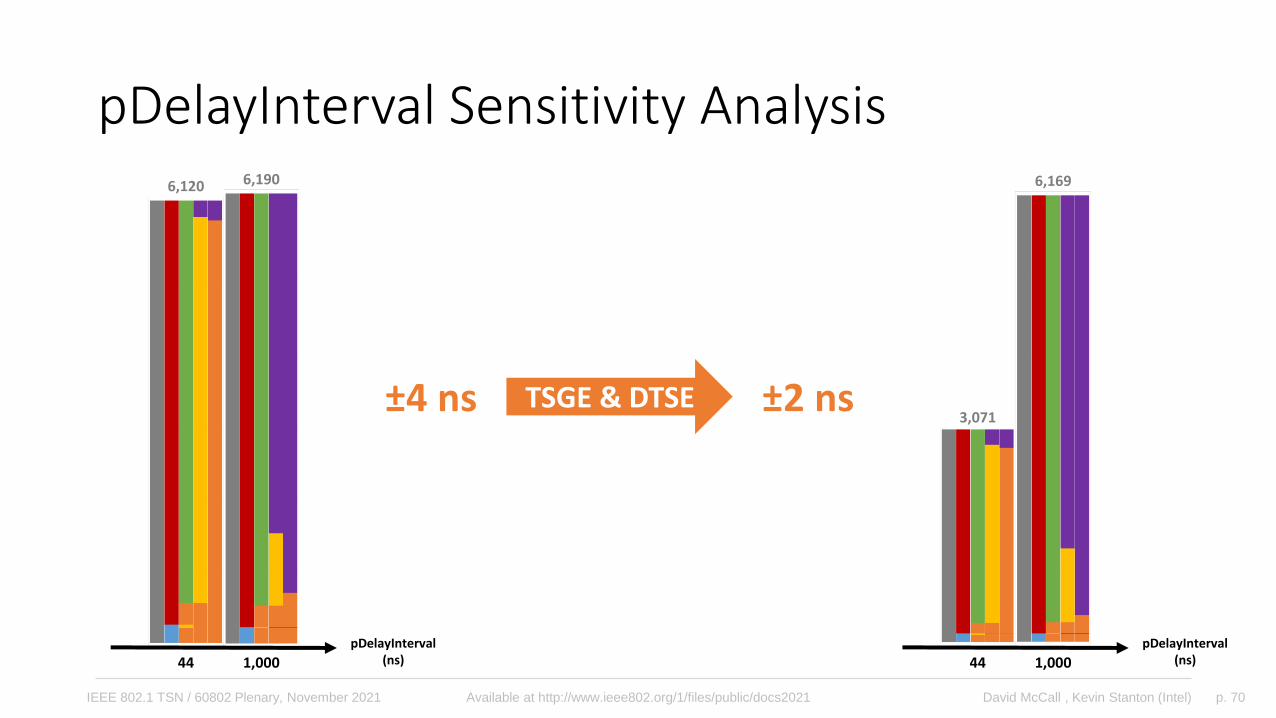
pDelayInterval Sensitivity Analysis6,120 6,190
pDelayInterval(ns)44 1,000
TSGE & DTSE±4 ns ±2 ns3,071
6,169
pDelayInterval(ns)44 1,000
p. 71David McCall , Kevin Stanton (Intel)IEEE 802.1 TSN / 60802 Plenary, November 2021 Available at http://www.ieee802.org/1/files/public/docs2021
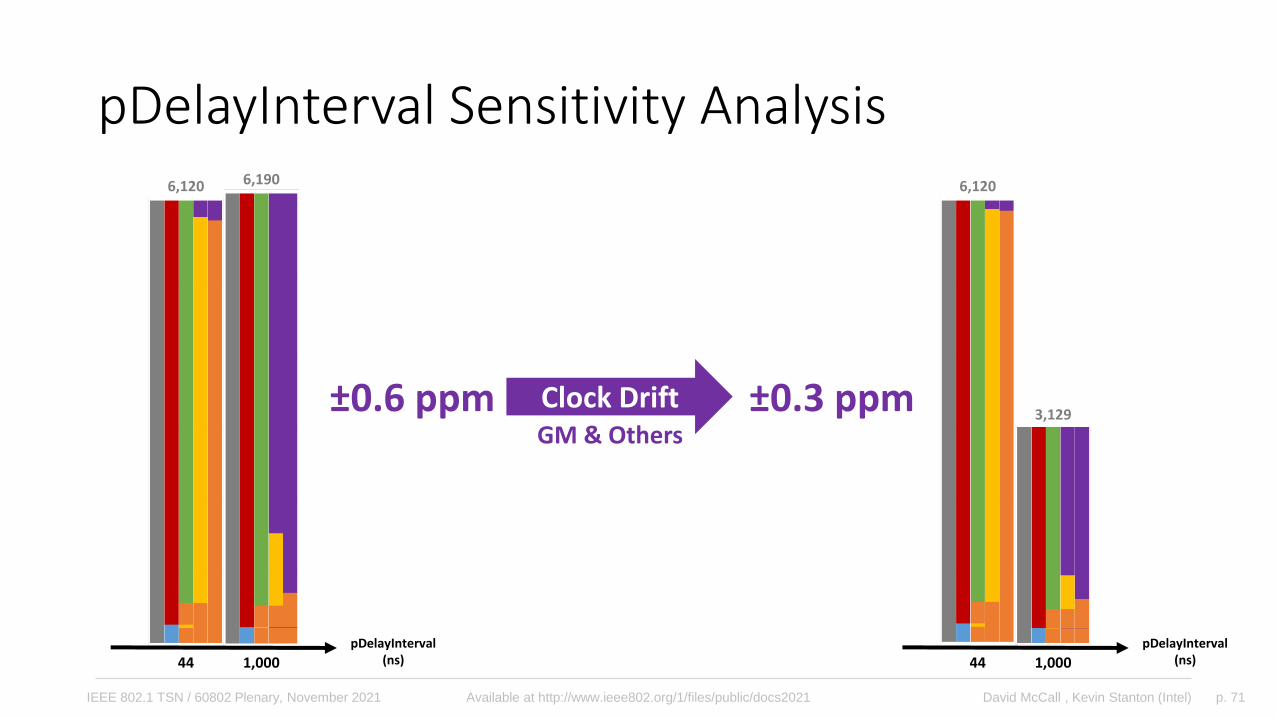
pDelayInterval Sensitivity Analysis6,120 6,190
pDelayInterval(ns)44 1,000
Clock Drift±0.6 ppm ±0.3 ppm
6,120
3,129
pDelayInterval(ns)44 1,000
GM & Others
p. 72David McCall , Kevin Stanton (Intel)IEEE 802.1 TSN / 60802 Plenary, November 2021 Available at http://www.ieee802.org/1/files/public/docs2021
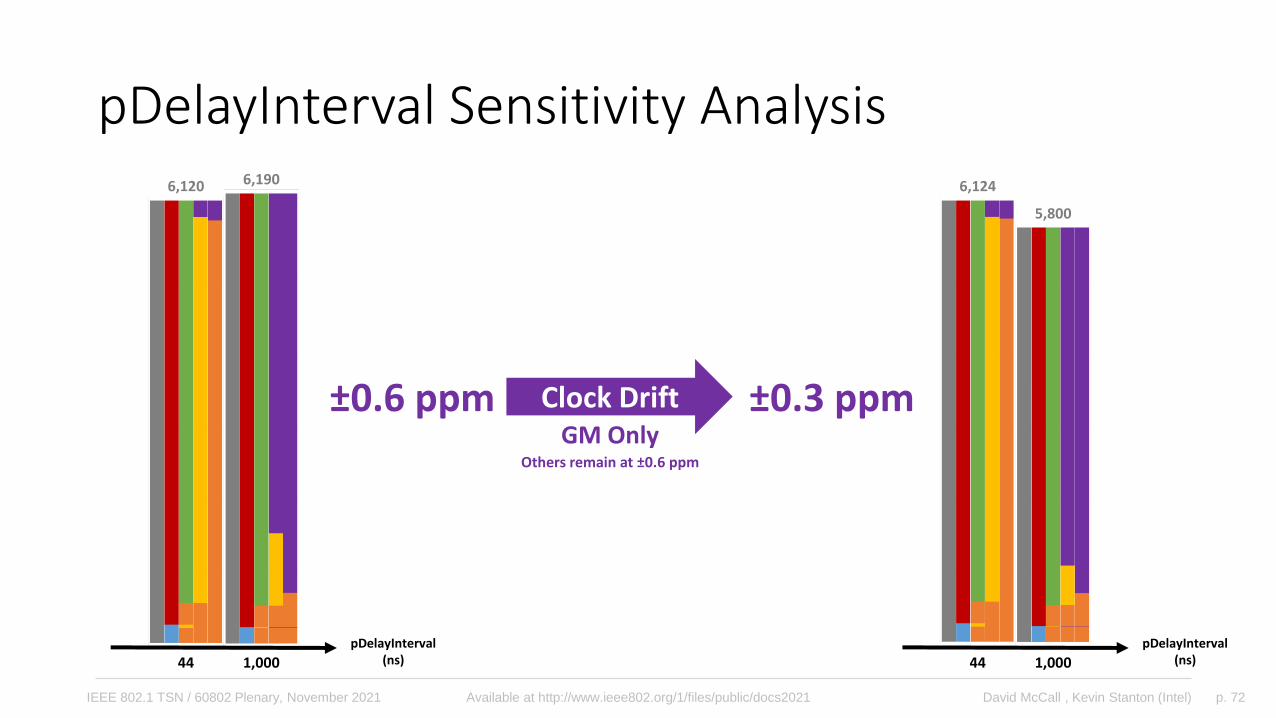
pDelayInterval Sensitivity Analysis6,120 6,190
pDelayInterval(ns)44 1,000
Clock Drift±0.6 ppm ±0.3 ppm
6,124
5,800
pDelayInterval(ns)44 1,000
GM OnlyOthers remain at ±0.6 ppm
p. 73David McCall , Kevin Stanton (Intel)IEEE 802.1 TSN / 60802 Plenary, November 2021 Available at http://www.ieee802.org/1/files/public/docs2021
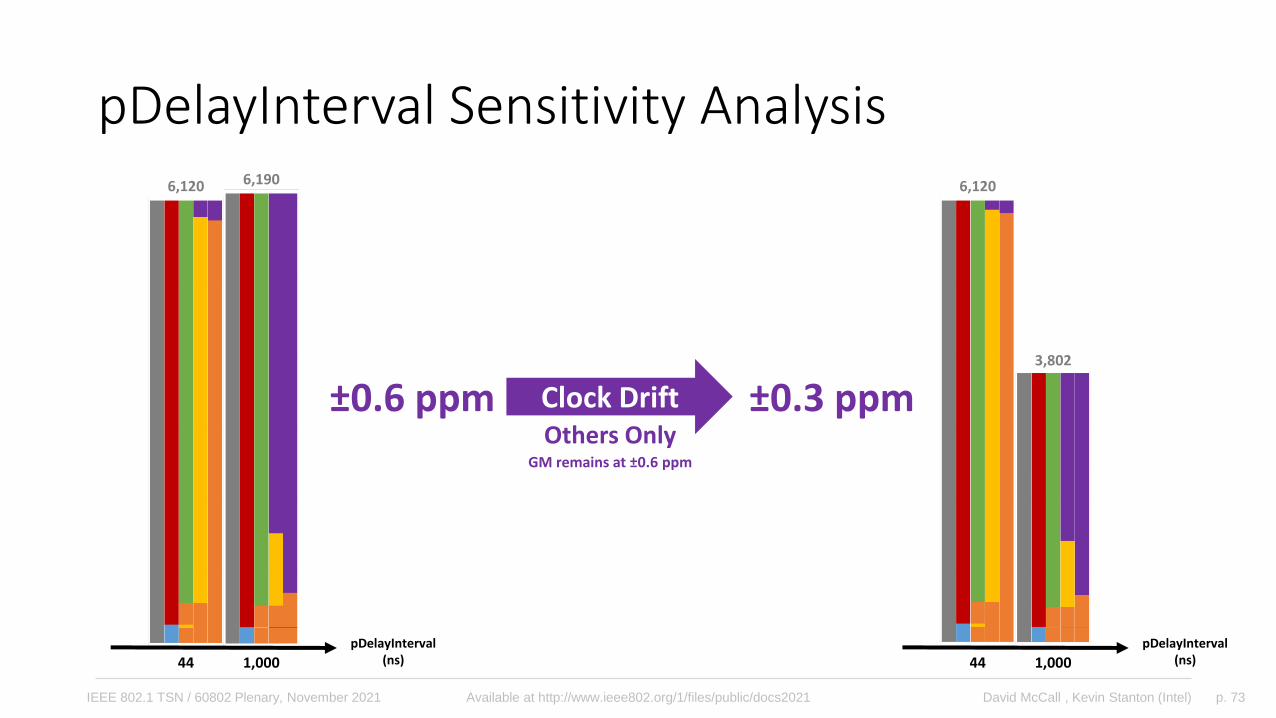
pDelayInterval Sensitivity Analysis6,120 6,190
pDelayInterval(ns)44 1,000
Clock Drift±0.6 ppm ±0.3 ppm
6,120
3,802
pDelayInterval(ns)44 1,000
Others OnlyGM remains at ±0.6 ppm
p. 74David McCall , Kevin Stanton (Intel)IEEE 802.1 TSN / 60802 Plenary, November 2021 Available at http://www.ieee802.org/1/files/public/docs2021
GM Clock Drift Max +0.6 ppm
GM Clock Drift Min +0.6 ppm
Clock Drift (non-GM) 0.6 ±ppm
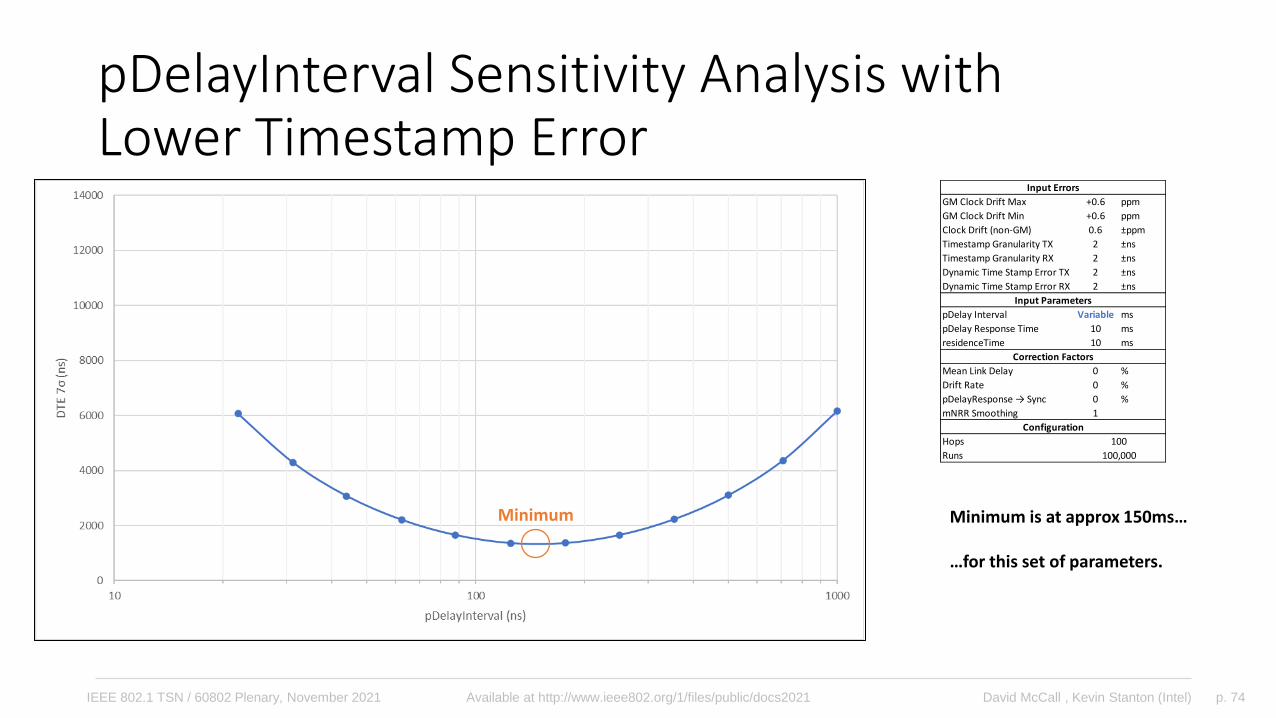
Timestamp Granularity TX 2 ±ns
Timestamp Granularity RX 2 ±ns
Dynamic Time Stamp Error TX 2 ±ns
Dynamic Time Stamp Error RX 2 ±ns
pDelay Interval Variable ms
pDelay Response Time 10 ms
residenceTime 10 ms
Mean Link Delay 0 %
Drift Rate 0 %
pDelayResponse → Sync 0 %
mNRR Smoothing 1
Hops
Runs
Input Errors
Input Parameters
Correction Factors
Configuration
100
100,000
pDelayInterval Sensitivity Analysis withLower Timestamp Error
Minimum is at approx 150ms…
…for this set of parameters.
Minimum
p. 75David McCall , Kevin Stanton (Intel)IEEE 802.1 TSN / 60802 Plenary, November 2021 Available at http://www.ieee802.org/1/files/public/docs2021
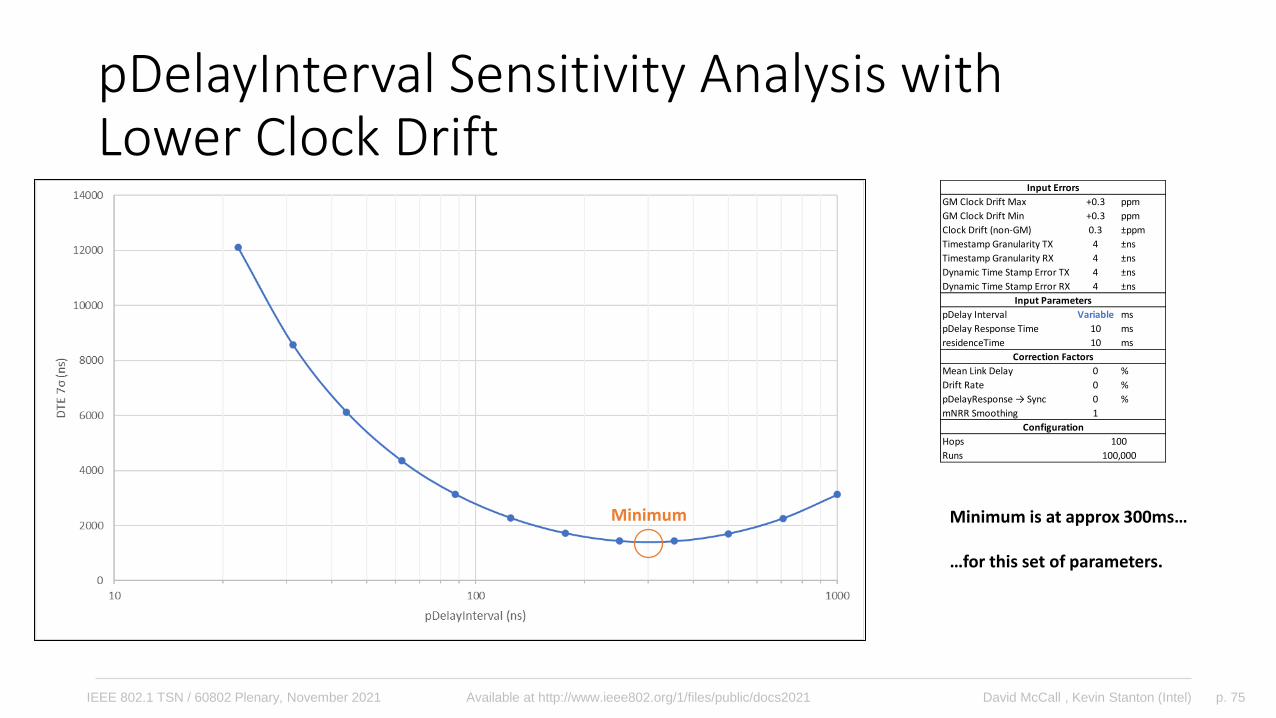
GM Clock Drift Max +0.3 ppm
GM Clock Drift Min +0.3 ppm
Clock Drift (non-GM) 0.3 ±ppm
Timestamp Granularity TX 4 ±ns
Timestamp Granularity RX 4 ±ns
Dynamic Time Stamp Error TX 4 ±ns
Dynamic Time Stamp Error RX 4 ±ns
pDelay Interval Variable ms
pDelay Response Time 10 ms
residenceTime 10 ms
Mean Link Delay 0 %
Drift Rate 0 %
pDelayResponse → Sync 0 %
mNRR Smoothing 1
Hops
Runs
Input Errors
Input Parameters
Correction Factors
Configuration
100
100,000
pDelayInterval Sensitivity Analysis withLower Clock Drift
Minimum is at approx 300ms…
…for this set of parameters.
Minimum
p. 76David McCall , Kevin Stanton (Intel)IEEE 802.1 TSN / 60802 Plenary, November 2021 Available at http://www.ieee802.org/1/files/public/docs2021
pDelayInterval Sensitivity - Conclusion
• Choice of pDelayInterval can have a large impact on DTE.
• pDelay interval can be optimised but the optimal choice depends on other parameters and sources of error.
• Monte Carlo Analysis is an effective tool for investigating this further.
p. 77David McCall , Kevin Stanton (Intel)IEEE 802.1 TSN / 60802 Plenary, November 2021 Available at http://www.ieee802.org/1/files/public/docs2021
pDelayTurnaround Sensitivity Analysis
p. 78David McCall , Kevin Stanton (Intel)IEEE 802.1 TSN / 60802 Plenary, November 2021 Available at http://www.ieee802.org/1/files/public/docs2021
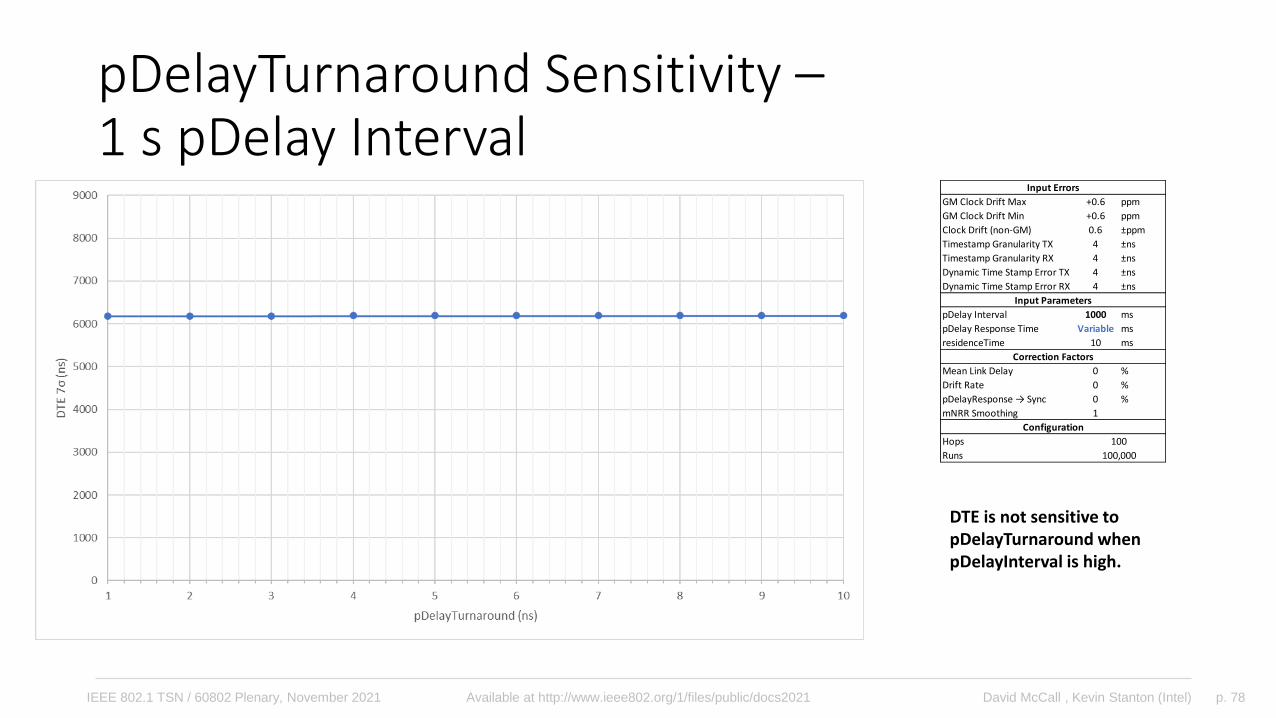
pDelayTurnaround Sensitivity –1 s pDelay Interval
DTE is not sensitive to pDelayTurnaround when pDelayInterval is high.
GM Clock Drift Max +0.6 ppm
GM Clock Drift Min +0.6 ppm
Clock Drift (non-GM) 0.6 ±ppm
Timestamp Granularity TX 4 ±ns
Timestamp Granularity RX 4 ±ns
Dynamic Time Stamp Error TX 4 ±ns
Dynamic Time Stamp Error RX 4 ±ns
pDelay Interval 1000 ms
pDelay Response Time Variable ms
residenceTime 10 ms
Mean Link Delay 0 %
Drift Rate 0 %
pDelayResponse → Sync 0 %
mNRR Smoothing 1
Hops
Runs
Input Errors
Input Parameters
Correction Factors
Configuration
100
100,000
p. 79David McCall , Kevin Stanton (Intel)IEEE 802.1 TSN / 60802 Plenary, November 2021 Available at http://www.ieee802.org/1/files/public/docs2021
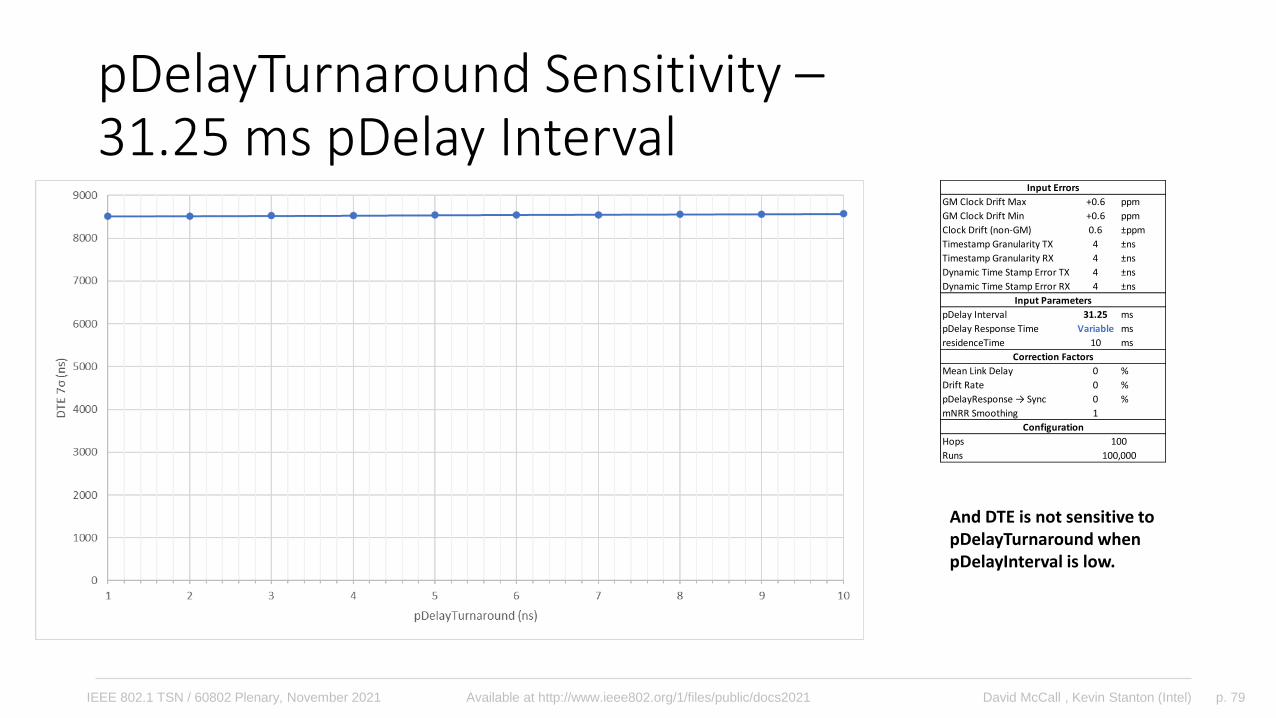
pDelayTurnaround Sensitivity –31.25 ms pDelay Interval
And DTE is not sensitive to pDelayTurnaround when pDelayInterval is low.
GM Clock Drift Max +0.6 ppm
GM Clock Drift Min +0.6 ppm
Clock Drift (non-GM) 0.6 ±ppm
Timestamp Granularity TX 4 ±ns
Timestamp Granularity RX 4 ±ns
Dynamic Time Stamp Error TX 4 ±ns
Dynamic Time Stamp Error RX 4 ±ns
pDelay Interval 31.25 ms
pDelay Response Time Variable ms
residenceTime 10 ms
Mean Link Delay 0 %
Drift Rate 0 %
pDelayResponse → Sync 0 %
mNRR Smoothing 1
Hops
Runs
Input Errors
Input Parameters
Correction Factors
Configuration
100
100,000
p. 80David McCall , Kevin Stanton (Intel)IEEE 802.1 TSN / 60802 Plenary, November 2021 Available at http://www.ieee802.org/1/files/public/docs2021
Residence Time Sensitivity Analysis
p. 81David McCall , Kevin Stanton (Intel)IEEE 802.1 TSN / 60802 Plenary, November 2021 Available at http://www.ieee802.org/1/files/public/docs2021
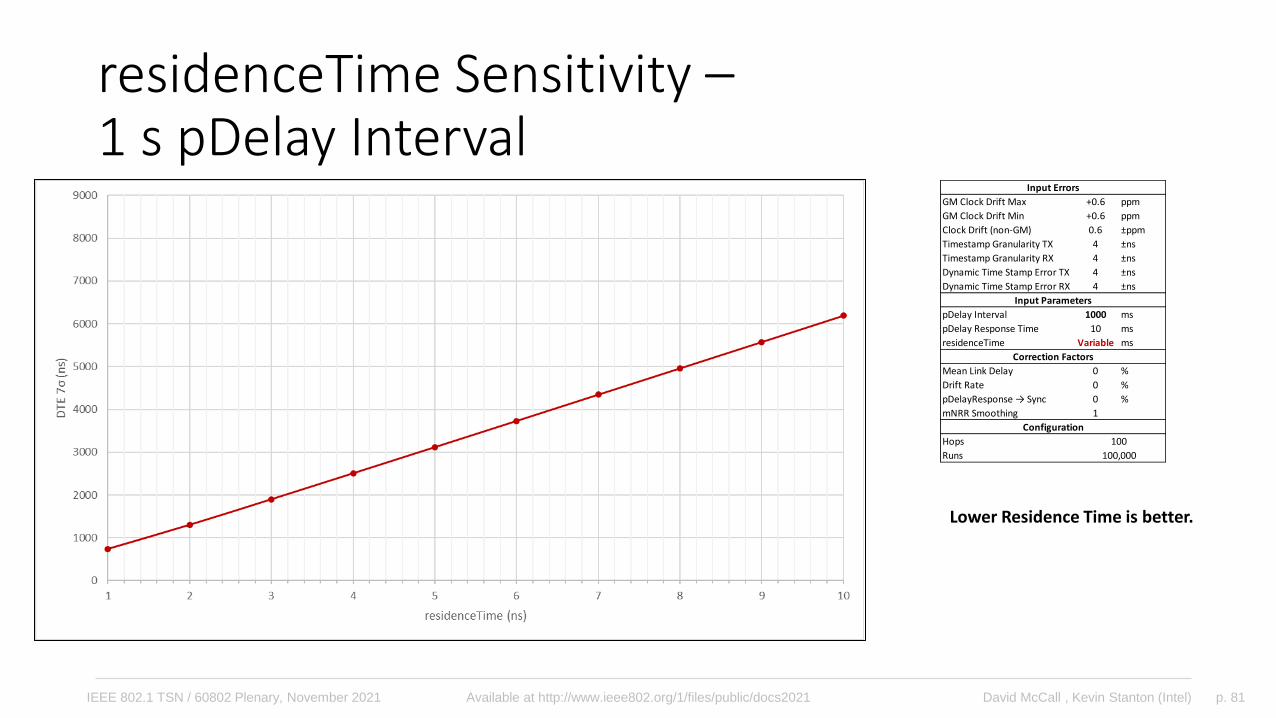
residenceTime Sensitivity –1 s pDelay Interval
Lower Residence Time is better.
GM Clock Drift Max +0.6 ppm
GM Clock Drift Min +0.6 ppm
Clock Drift (non-GM) 0.6 ±ppm
Timestamp Granularity TX 4 ±ns
Timestamp Granularity RX 4 ±ns
Dynamic Time Stamp Error TX 4 ±ns
Dynamic Time Stamp Error RX 4 ±ns
pDelay Interval 1000 ms
pDelay Response Time 10 ms
residenceTime Variable ms
Mean Link Delay 0 %
Drift Rate 0 %
pDelayResponse → Sync 0 %
mNRR Smoothing 1
Hops
Runs
Input Errors
Input Parameters
Correction Factors
Configuration
100
100,000
p. 82David McCall , Kevin Stanton (Intel)IEEE 802.1 TSN / 60802 Plenary, November 2021 Available at http://www.ieee802.org/1/files/public/docs2021
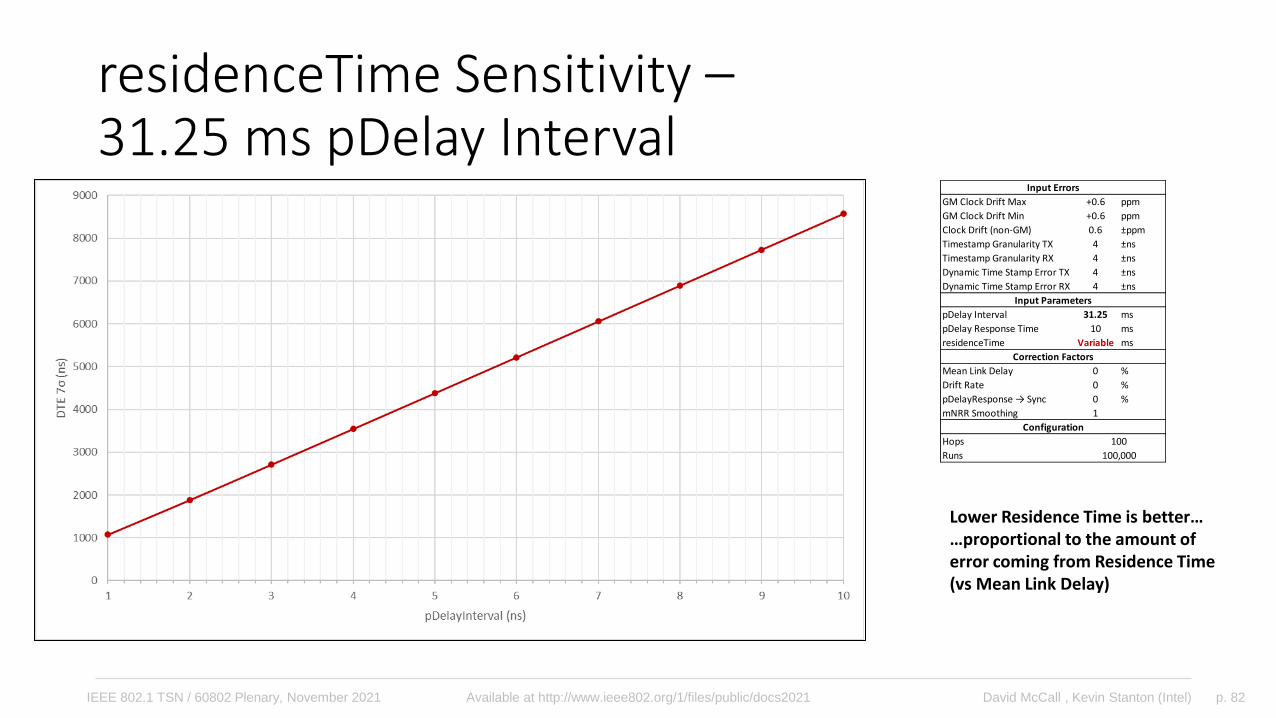
residenceTime Sensitivity –31.25 ms pDelay Interval
Lower Residence Time is better……proportional to the amount of error coming from Residence Time (vs Mean Link Delay)
GM Clock Drift Max +0.6 ppm
GM Clock Drift Min +0.6 ppm
Clock Drift (non-GM) 0.6 ±ppm
Timestamp Granularity TX 4 ±ns
Timestamp Granularity RX 4 ±ns
Dynamic Time Stamp Error TX 4 ±ns
Dynamic Time Stamp Error RX 4 ±ns
pDelay Interval 31.25 ms
pDelay Response Time 10 ms
residenceTime Variable ms
Mean Link Delay 0 %
Drift Rate 0 %
pDelayResponse → Sync 0 %
mNRR Smoothing 1
Hops
Runs
Input Errors
Input Parameters
Correction Factors
Configuration
100
100,000
p. 83David McCall , Kevin Stanton (Intel)IEEE 802.1 TSN / 60802 Plenary, November 2021 Available at http://www.ieee802.org/1/files/public/docs2021
Effect of Error Correction Measures
p. 84David McCall , Kevin Stanton (Intel)IEEE 802.1 TSN / 60802 Plenary, November 2021 Available at http://www.ieee802.org/1/files/public/docs2021
Default Values – No Error Correction Factors
p. 85David McCall , Kevin Stanton (Intel)IEEE 802.1 TSN / 60802 Plenary, November 2021 Available at http://www.ieee802.org/1/files/public/docs2021
mNRRsmoothingN = 11
p. 86David McCall , Kevin Stanton (Intel)IEEE 802.1 TSN / 60802 Plenary, November 2021 Available at http://www.ieee802.org/1/files/public/docs2021
pDelayRespSynccorrection = 98%
p. 87David McCall , Kevin Stanton (Intel)IEEE 802.1 TSN / 60802 Plenary, November 2021 Available at http://www.ieee802.org/1/files/public/docs2021
mLinkDelayErrorcorrection = 98%
p. 88David McCall , Kevin Stanton (Intel)IEEE 802.1 TSN / 60802 Plenary, November 2021 Available at http://www.ieee802.org/1/files/public/docs2021
driftRateErrorcorrection = 98%
p. 89David McCall , Kevin Stanton (Intel)IEEE 802.1 TSN / 60802 Plenary, November 2021 Available at http://www.ieee802.org/1/files/public/docs2021
mLinkDelayErrorcorrection & driftRateErrorcorrection = 98%
p. 90David McCall , Kevin Stanton (Intel)IEEE 802.1 TSN / 60802 Plenary, November 2021 Available at http://www.ieee802.org/1/files/public/docs2021
Recommendation & Next Steps
• Carry out Time Series simulations to validate• Effect of varying input parameters and sources of error.
• Effect of applying correction factors
• Focus on averaging Mean Link Delay & Clock Drift Compensation• Mean Link Delay averaging should be straightforward, but startup may be an
issue.• Can only be investigated via Time Series simulation
• Clock Drift Compensation can be estimated by simply reducing Clock Drift
• I am planning another contribution in December on techniques for compensating for Clock Drift
p. 91David McCall , Kevin Stanton (Intel)IEEE 802.1 TSN / 60802 Plenary, November 2021 Available at http://www.ieee802.org/1/files/public/docs2021
Backup Material
91
p. 92David McCall , Kevin Stanton (Intel)IEEE 802.1 TSN / 60802 Plenary, November 2021 Available at http://www.ieee802.org/1/files/public/docs2021
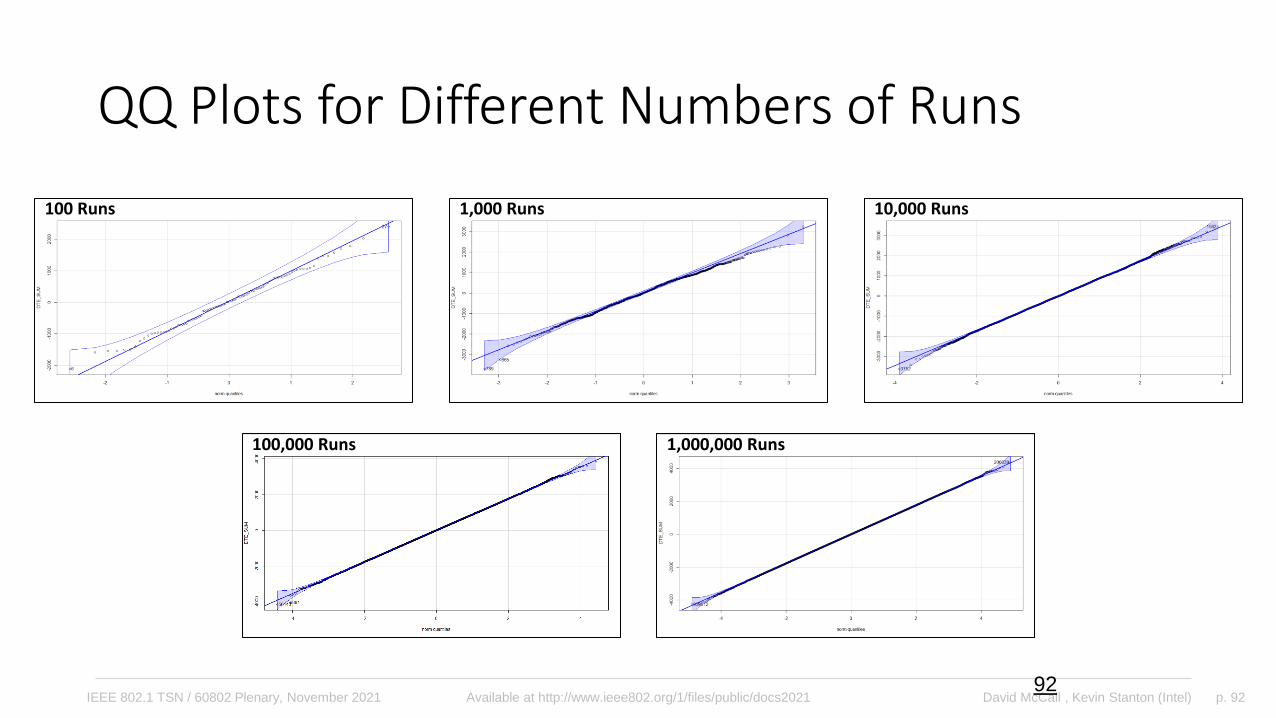
QQ Plots for Different Numbers of Runs
92
100 Runs 1,000 Runs 10,000 Runs
100,000 Runs 1,000,000 Runs
p. 93David McCall , Kevin Stanton (Intel)IEEE 802.1 TSN / 60802 Plenary, November 2021 Available at http://www.ieee802.org/1/files/public/docs2021
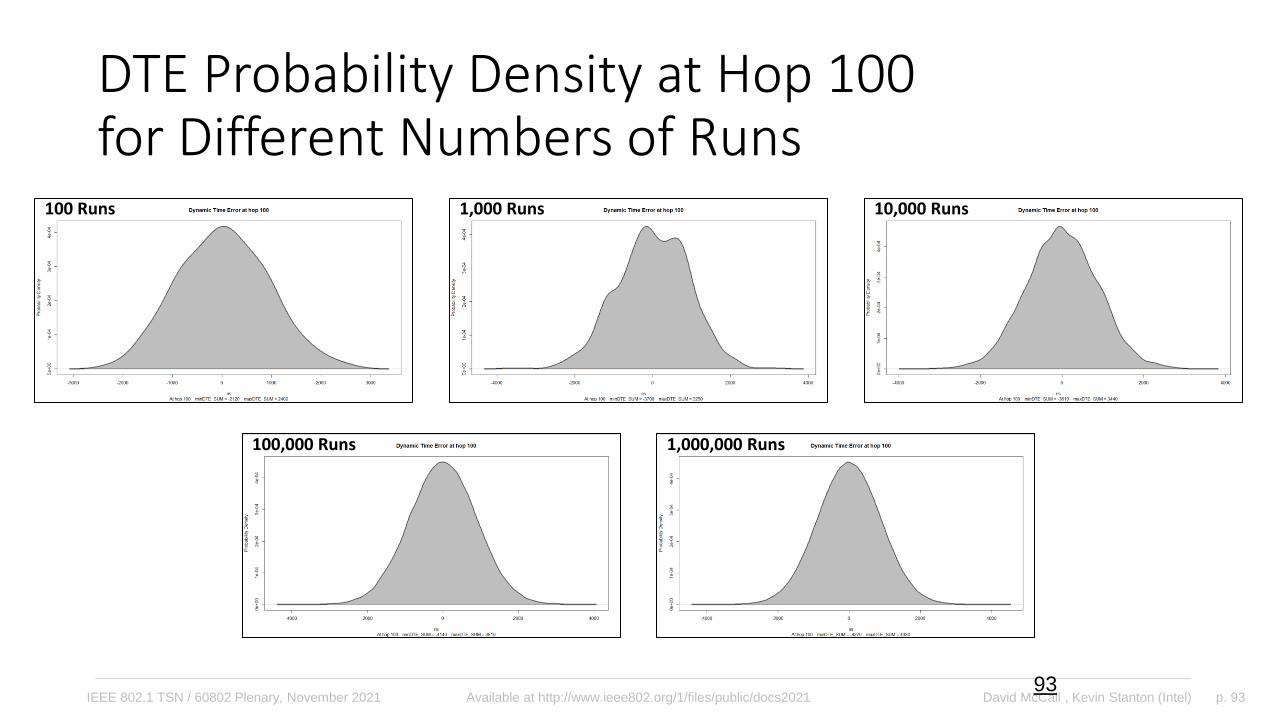
DTE Probability Density at Hop 100for Different Numbers of Runs
93
100 Runs 1,000 Runs 10,000 Runs
100,000 Runs 1,000,000 Runs
p. 94David McCall , Kevin Stanton (Intel)IEEE 802.1 TSN / 60802 Plenary, November 2021 Available at http://www.ieee802.org/1/files/public/docs2021
max|DTE| & 7σ of DTE Across 100 Hopsfor Different Numbers of Runs
94
100 Runs 1,000 Runs 10,000 Runs
100,000 Runs 1,000,000 Runs
p. 95David McCall , Kevin Stanton (Intel)IEEE 802.1 TSN / 60802 Plenary, November 2021 Available at http://www.ieee802.org/1/files/public/docs2021
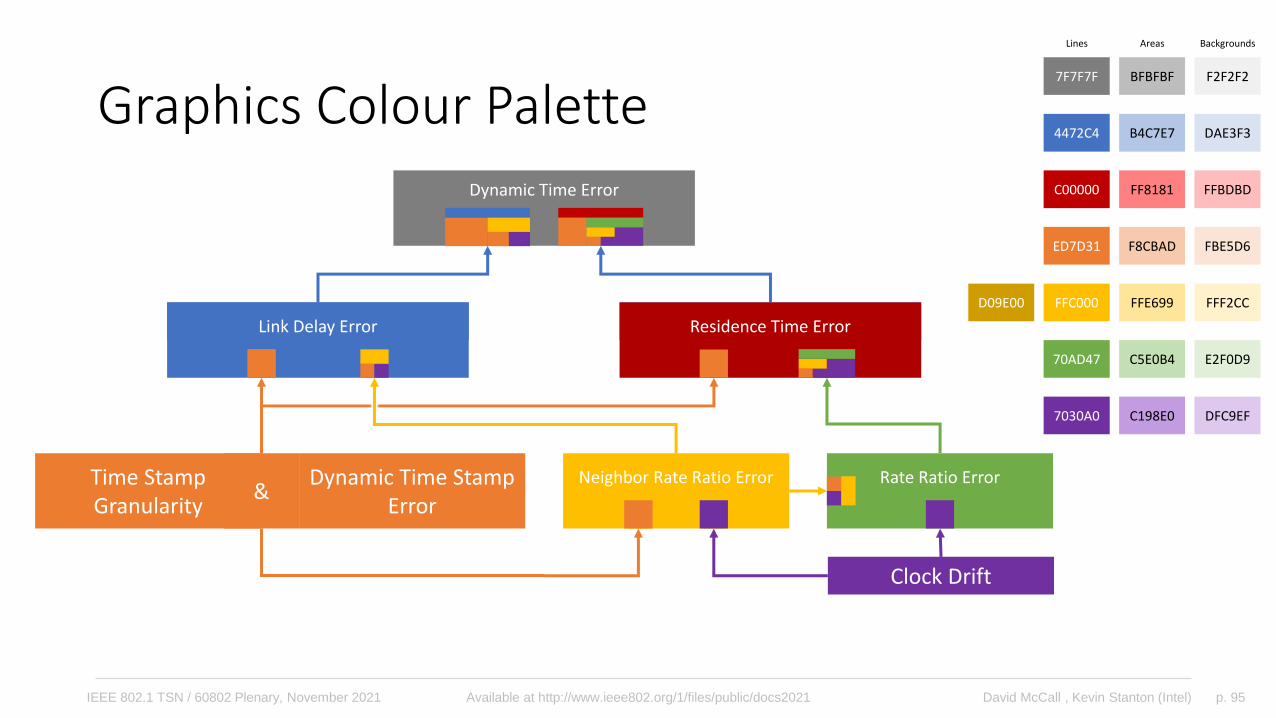
Graphics Colour Palette
Time Stamp Granularity
pDelay Residence Time
Dynamic Time Stamp Error
Clock Drift
&
Link Delay Error Residence Time Error
Dynamic Time Error
Rate Ratio ErrorNeighbor Rate Ratio Error
7F7F7F BFBFBF
4472C4 B4C7E7
ED7D31 F8CBAD
FFC000 FFE699
70AD47 C5E0B4
7030A0 C198E0
F2F2F2
DAE3F3
FBE5D6
FFF2CC
E2F0D9
DFC9EF
C00000 FF8181 FFBDBD
Lines Areas Backgrounds
D09E00
![Prediction of statistical error and optimization of biased Monte Carlo transport calculations. [Integral equations]](https://img.dokumen.tips/doc/110x75/6359a21e10f2bd48220e4928/prediction-of-statistical-error-and-optimization-of-biased-monte-carlo-transport.jpg)


