Embed Size (px)
Citation preview
50Years of Enrolment of Indian primary Education
Dr.T.V.Ramana, Dept of Economics, Andhra University
Campus, Kkainada
1.Introduction
“Education is the engine for Human recourse as
well as economic development”.
Many statistical investigations carried out in the
western countries have shown that out put increased at a
much higher rate than (can be explained by) an increase in
physical inputs like labour and physical capital because of
the quality of human beings as a productive sources has been
consistently improving due to improvement in education and
skills, availability of health services etc. Education can
be oriented as to impart skills and attitudes useful in
improving the quality of family life. Education can
contribute significantly to rural development in a variety
of ways- by widening the horizons of knowledge of the rural
people; can enable to overcome ignorance and superstitions.
Adoptions of new agricultural techniques and new methods of
production are rendered easier if the farmers are educated.
Literate farmers with at least primary education are thought
to be more productive and more responsive to new
agricultural technologies than illiterate farmers. According
to Amartya Kumar Sen and Jean Dreze, education is valuable
to the freedom of a person in certain distinct ways in that
it has a certain personal roles, social roles, schooling
process roles and it has been providing greater literacy to
disadvantaged groups. Dr. B. R. Ambedkar observed that
education is the right weapon to cut the social slavery and
to enlighten the down trodden masses to come up and gain
social status, economic betterment and political freedom.
D.R. Veena presented the empirical results of
correlation between marginal educational effort and the
marginal rate of economic growth as the correlations between
agricultural development and primary education is
significantly related to gross national product at the value
of 0.92, industrial development and some specific
professional and technical education at the value of 0.87,
social change in favor of economic development as reflected
in the adoption of family planning and higher education at
the value of 0.64 are significant values associated to the
national product.
According to Todaro and smith, education contributes to
economic growth in all types countries in the following
ways. It helps in creating a more productive labour force
and endowing it with increased knowledge and skill, it helps
in providing widespread employment and income- earning
opportunities for teachers, school and construction workers,
text book and paper printers, school uniform manufactures,
etc. It helps in creating class of educated leaders to fill
vacancies left by departing expatriates or otherwise vacant
positions in governmental services, public corporations,
private business and professions, and it helps in providing
basic skills and encourages modern attitudes in the diverse
segments of the population of the country . It can be said
that education as a multidimensional phenomenon for the
development of the economies. Keeping this in mind the
present paper evaluated with following objectives.
2.Objectives of the Study
1. To briefly analyze the importance of education
2. To assess the role of Sarva Shiksha Abhiyan (SSA)
3. To analyze the importance of Education
4. To estimate the inter state average annual compound
growth rates in
enrolment of the primary education
5. Another objective of the study is to evaluate the inter
state variations in
enrolment of the primary education
3. Methodology.
The study based on secondary data and covers the period from
1951 to 2001. The analysis in this study is carried out at
the State level and analyzed in terms of average annual
compound growth rates. The average annual compound growth
rates for the inter-census periods i.e., 1951-61, 1961-71,
1971-81, 1981-91 and 1991-2001 are computed by the following
formula:
r = [(Yt / Y0) 1/n -1] X 100. Where-
r = average annual compound growth rate
Yt = a dimension of education /population in the
year’t’,
Y0 = a dimension of education / population in the
base year
n = number of years
Further, co-efficient of variation has been applied to the
data in order to elaborate inter state variations. The C.V
formula is as below:
C.V= S.D * 100 X Where, C.V. = Co-efficient of Variation of inter- states.S.D = Standard Deviation and X = mean. Percentages are alsoused at appropriated places in the study.
4.Analysis of the study
a. Growth of Primary Education in India-a brief view
There has been a tremendous expansion of educational
activity in India since independence. In the constitution of
India, under directive principles, the provision of free and
compulsory education for all children attain under the age
of 14 years has been highlighted. For the achievement of
this goal, great efforts have been made since 1950 onwards.
India has now celebrating 60 years of independence.
During the period of 60 years, the educational system
has become one of the largest educational systems in world
with the largest number of primary schools, graduates and
good engineers from Indian universities. Ultimately the
percentage of literacy has gone up to 64.84 percent
In all National Educational Policies high priority
has given to primary and elementary education. To retain
the child to provide good environment, operation Black Board
(OBB) scheme was launched in 1987-88. Under this scheme,
all exiting primary schools in the country would have been
modified and improved in terms of teachers, students and
learning materials. This scheme has been implemented in all
the blocks in the country. Later the scope of this scheme
has been enlarged to provide at least 3 classrooms and 3
teachers in a primary school where the enrolment exceeds 100
students. A special orientation programme for giving
training to the primary school teachers has been started
with a view to train the teachers in proper use of OBB
scheme, material and minimum levels of learning and it has
covered at last 18 lakh teachers our the country. Besides,
in 1995 the NCTE has been established in the country with a
view to develop regulation and proper maintenance of norms
and standards of teacher education so as to improve the
quality of education in the country.
As a result, there was 5.90 lakh primary schools
consisting 1500 lakh enrolment in the age group of 6-14
years coursing 90 percent of school going population and the
enrolment ratio was 10:5 during 1995-96. On 15th August,
1995 a national programme of Nutritional support to primary
education was launched to 11 crore children from 1 to V
classes and more than 5 lakh primary schools have been taken
under this scheme. In order to alleviation of poverty and
to improve school attendance for reduce dropout, the
government has started this programme in urban schools in
all the states and 4426 blocks were covered with established
5, 57 crore primary schools during 1996-97. Resulting, the
number of primary schools was increased to 5.90 lakh and
upper primary schools were 1.71 lakh. The number of
teachers in this period was 29.05 lakh. The enrolment of 6-
11 age group was increased to 104.3 percent and it was 67.60
percent in upper primary school during 1995-96. The number
of primary schools decreased from 2-20 lakh to 2.45 lakh
over the period, indicating up gradation of large number of
primary schools to upper primary schools. The total
enrolment at these two sections has witness a steady
increased. Later, of the estimated population of 205 million
in the age group of 6-14 years (March 2002) nearly
82.5percent was enrolled in schools. The retention rate of
students at the primary school stage was about 59 percent.
The dropout rate decreased from 35 percent in 2001-2002 to
32 percent in 2004-2005. Upper primary schools is concerned,
the dropout rate was 54.6 percent and 52.8 percent in the
above periods. However dropout rate still remain thigh
especially in the case of girl students.
The number of teachers at elementary level rose and the
PTR (Pupil Teacher Ratio) has remained more or less constant
around 42:1 and 34:1 respectively during 2004-2005.
b. Sarva Shiksha Abhiyan (SSA).
A new programme has been launched in November, 2000 as
an umbrella programme, continued to be implemented to
support and build upon other primary and elementary
education projects. The ultimate objective of the scheme SSA
is- all 6-14 age children would complete five year primary
education by 2007, all 6-14 age children would complete 8
years of schooling by 2010, all gender and social category
gaps would be bridge at primary stage by 2007 and elementary
education level by 2010; and there would be universal
retention by 2010. The programme addressed the needs of 192
million children in 11 lakh habitations for 8.5 lakh
existing primary and upper primary schools. Further, a
special emphasis was made to girls, disadvantaged and SC, ST
pupils by new programme NPEGEL and KGBU under the SSA from
2003. Nearly amount of Rs 3031 crore has been related in
2004-2005.
5. Data analysis
The inter – state average annual compound growth rates
of total number of students in primary education (table-1)
in India has recorded a positive trend but decreased manner
from 1951 to 1981, while the growth rate during the period
1981-91 is increased rather than the pervious periods and
reduced in 1991-2001. Over the entire period from 1951 to
2001 also considered in the study, the country growth rate
is positive and it is registered by 50.04 percent. The
similar trend is found in some States. Incase of Andhra
Pradesh, Gujarat, Jammu and Kasmir, especially Kerala,
Nagaland, Tamilnadu, Tripura, West Bengal and A & N Islands,
the growths rate are continuously decreasing from 1951 to
2001 according to the study. During the period 1951-61, the
growth rates are positive in all states. These are varies
from 24.51 percent in the state of Gujarat to 1.02 percent
in the state of Tamilnadu. The country average is 8.87
percent.
During the period 1961-71 also, the growth rate is positive
in all states of the country. The highest and the lowest
growth rate recorded during this period is 16.39 percent in
Himachal Pradesh and 0.02 percent in Punjab respectively.
The country average is 5.42 percent. During 1971-81, the
growth rates are positive in all states except Manipur. The
state – wise growth rate ranges from 8.63 percent in the
state of Arunachal Pradesh, while it is 0.87 percent in the
state of Manipur; and the country average is 2.75 percent.
During the period of 1981-91, in all states the growth rate
is positive, except in Kerala, and Punjab. Across the
states, the growth rate varies from 7.51 percent in D & N
Haveli to 0.68 percent in the state of Punjab. The country
average is 2.94 percent. These are 8.91 percent in Orissa
and 0.99 percent inlakshdweep. Over a period of 50 years,
the growth rate of all states is positive. Across the
states the highest growth rate is 10.41 percent in Arunachal
Pradesh and the lowest is 1.72 percent in Tamilnadu. The
country average is 5.04 percent. In the entire period of 50
years, (1951-2001), the State of Arunachal Pradesh is in
progressive growth rate compare to the all states even
though, the growth rate of this state is decreasing from
period to period.
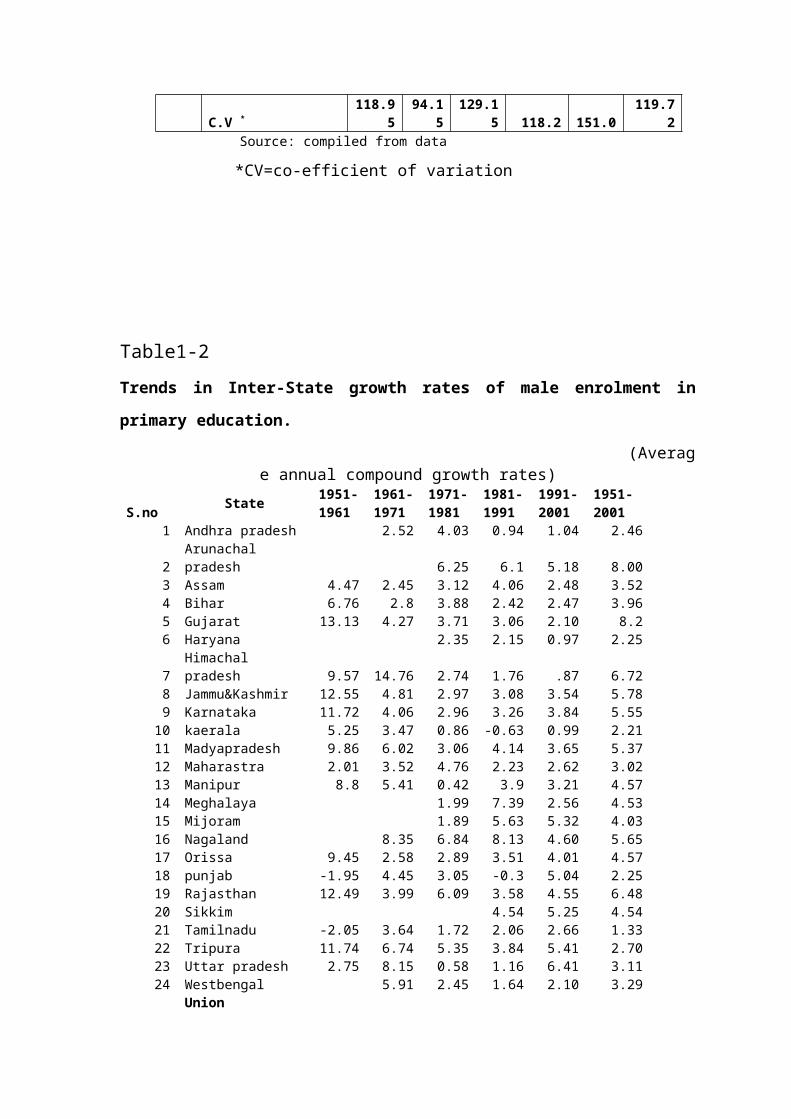
The co-efficient of variation of total students in
primary education among the states are fluctuated during
1951-2001. The highest variation of inter state disparity
level 129.15 is found in 1971.
The inter-state average annual compound growth rate of
male students in primary education of India is presented in
table 7.2. In the country, it is identified form the table
that the growth rate of male students has recorded
decreasing trend from 1951 to 2001.Over the entire period
1951-2001, the growth rate is positive and the similar type
of trend is found in some states (Gujart, Kerala, Tripura,
Wst Bengal, A&N Islands and Delhi).
During the period 1951-61 the growth rate is positive
in all states the growth rates varies from 13.13 percent to
2.05 percent in Gjuarat and the state of Tamilnadu. The
national average being at 5.14 percent. During the period
1961-71, the growth rate is positive in all states. The
highest and the lowest growth rates recorded during this
period 14.76 percent in Himachal Pradesh and 2.25 percent in
the territory of Lakshadweep. The country average is 4.76
percent. Even in the period 1971-81 also, found the similar
trend across the states and national level. The state-wise
growth rate ranges from 7.11 percent in the territory of A
&N Islands to 0.56 percent in Uttar Pradesh while the
country average is 3.73 Percent. During the period 1981-91,
the growth rates in all states are positive, except in
Punjab, Kerala, Goa and Diu and Daman. In this period, in
majority of the states, the growth rate is in progressive to
compare with the previous periods. . Across the states,
the growth rate varies from 8.13 percent in Nagaland and
1.79 percent in the territory of Goa, Diu and Daman. The
country average is 3.62 percent. Positive growth rates have
registered in all states than the period 1981-91 in 1991-01.
Over a period of 50 years, the growth rate of all Sates is
positive. Across the States, the highest growth rate is
8.00 percent in Arunachal Pradesh and 1.18 percent in Goa,
Diu and Daman, while the country average is 4.53 percent.
It is also found in the table that the coefficient of
variation among the states regarding to male students is
higher than the female students from the year 1951 to 2001
and the highest co-efficient of variation among the states
is133.1 recorded even in the economic reforms period (2001)
also.
Table 7.3 presents the inter-state average annual
compound growth rates of female students in primary
education in India. In the country, it is found from the
table that the growth rate has recorded a decreasing trend
from 1951 to 81. While in the period 1981-91 the country
growth rate is positively increased than pervious period and
it is registered by 3.94 percent. Some states have the
similar type of trend. In majority of the states, during
the period 1981-91, the growth rates increased than 1991-01
according to the study.
During the period 1951-61, the growth rates of the
female students is positive in all states, except the state
Tamilnadu, which has in negative growth rate due to its
bifurcation as Andhra Pradesh and Tamilnadu that of madras
state. The growth rate varies from 26.50 percent in
Rajasthan to -1.47 percent Tamilnadu and the national
average being 8.51 percent. In 1961-71, the growth rates are
positive in all states. The highest growth rate is
registered by 24.16 percent in Himachal Pradesh and the
lowest growth rate is 2.45 percent in Punjab. The country
average is 6.99 percent. The growth rates during the
period 1971-81, except in the state Uttar Pradesh are
positive in all states. The state – wise growth rate ranges
from 17.72 percent in Arunachal Pradesh to -3.60 percent in
Uttar Pradesh. The country average growth rate is 2.95
percent according to the study.
Except Kerala (-0.54 percent) all states possessed a
positive trend in growth rates in 1981-91.The state of Goa,
Diu and Daman has lowest growth rate (3.32 percent) after
kerala and the highest growth rate 8.66 percent is
occupied by Sikkim. It is also greater than the national
average (3.94 percent) according to the study.A fluctuated
trend is registered among the states during 1991-01 and
national average declined than previous decade. Over the
period of 50 years, Arunachal Pradesh (15.34 percent),
HimachalPradesh (12.21 percent) and Tripura (10.87 percent)
have better improvement in the growth rates than
theremaining states and national level.
The above analysis reveals that there is no
continuous upward trend in the growth rate but decreasing
trend is found in some states during the entire period of 50
years in India.
The co-efficient of variation i.e; inter state
disparities among the states regarding to the female
enrolment in primary schools are also recorded at higher
level. The highest disparity/variation 144.96 is held
during the year 1951-61 according to the study.
However, the universalisation of primary education was
not realized so far since growth of population is much
faster than growth of primary education. Even then, in our
country, universalisation of primary education is so
essential in order to extract the talents of poorer sections
of the society.
Reasons for inter state disparities:
The State of Madyapradesh, so far as educational
backwardness of tribal community, poverty is the root cause
and prevalence of malnutrition among children under five
years of age. Similarly the high deaths and frequent out
break of diseases like malaria, cholera, gastroenteritis,
and mainly diarrhea due to poor sanitary conditions are
major factors in this state for the low level of enrolment
in primary education . On the other hand, the sate of
Rajasthan would have an innovative programmed like shiksha
karni which has given well results in an experimental
project to improve the enrolment of students, even though
same traditional impositions on women in Rajasthan.
The review of 6th Five year plan, enumerates that
socially disadvantaged groups, such as the economically poor
like SC’s and STs are on the backwardness of the schooling
system and later have become dropouts mostly in their
community in the country. According to the fourth
educational survey, socio-economic compulsions in families,
particularly in rural areas, and among the weaker sections,
not too relevant nature of curricular programmes and lack of
essential facilities in schools seem to be some of the more
important factors contributing to the slow progress in the
enrolment of the primary education. Even the existing
facilities for the education are not optimally utilized by
the primary school going students in the country.
The case study of Rukmini Banerji says that
irregularity of school attendance because she /he (Student)
is required to work either in the market to support the
family or in the home providing supervision and care for
younger siblings. Further the study said that many
households do not have adults who can monitor the progress
of children in school or keep of whether children attend
school regularly or not. Poverty and parental disinterest
were the two main reasons for not going to school regularly
in the study area. The state of Uttarpradesh is one of the
backward states in education. It is so, because more
percent of people are economically and socially very
backward. These conditions lead to the low level of growth
rate of enrolment of this state
Special programmes to reduce inter state disparities
The central and state Governments have been taking
actions to raise enrolment. Some notable measures taken for
the promotions of elementary education were ‘earn while you
learn’ scheme, mid-day meals for children, innovative
curriculum renewal schemes, and special emphasis on
appointment of women teachers, and operation Black Board
scheme: etc.
Sustained efforts to extend education among girls have
been made from the first plan period. Where there are
difficulties in the acceptance of co-education, some
alternatives taking to separate schools. It may be possible
to adopt a shift system as an interim measure – one shift
working for boys and the second for girls. To eradicate the
major obstacle in the way of promoting girls’ education is
the dearth of women teachers. The task of teachers is
employing in primary education to a large extent concern
girls’ education.
A system of incentives to overcome social, economic and
educational handicaps, which lead to high incidence of
dropouts has been an integral part of educational planning
for Universalisation of education since long period in the
country. The measures assume the form of expansion of
physical facilities in schools, provision of free
scholarships, free books, and mid – day – meals. There are
also cases where a small amount Rs. 1/- is paid to the
children so that they will not drop out from the school.
Recently, for this purpose, 5 kgs of rice is giving to each
student in primary level by central government through the
states.
Hear, a list of schems that are operated in various states
are given as below:
State:
Incentive Scheme
1. Andhra Pradesh:- Runs a free mid-day meals scheme for
children in the age group 5-10.
2. Assam:- Mid-day-meal scheme is restricted to certain
blocks.
3. Bihar :- East India Railway Administration tool up the
pioneer in the state.
4. Gujarat :- Mid-day-meal programme was restricted to
certain areas.
5. Karnataka :- Mid- day- meals programmes was introduced
in addition to CARE support.
6. Kerala:- The school lunch programme was started and
super ceded by CARE programme .
7. Orrissa:- Expanded Nutrition programme was sponsored by
who and UNICEF.
8. Pandicharry:- About 80 percent children are provided
free mid-day-meal as incentive.
9. Maharastra:- Free mid-day-meal was started at Bombay to
encourage attendance of children. The CARE programme
was inaugurated through distribution of milk among
primary school children.
10. Punjab:- CARE feeding programme started
11. Rajasthan:- CARE assisted feeding programme was
introduced
12. Tamilnadu:- A scheme was started in order to
solve two vital problems nutrition among children and
poor socio-economic status.
13. Utter Pradesh:- A scheme on voluntary basis was
evolved with the help of applied Nutrition programme.
This was launched by NGOs like praram bhik pathasala
prabhandak simit and shitara up a sanity.
14. WestBengal:- Mid-day-meals for children of primary
and basic schools were arranged from basic schools were
arranged from basic schools were CARE feeding programme
and Bread programme under child nutrition programme.
This meal programme has benefited the SC and ST
students.
These programmes encourages poor families and increase
enrichment. The growth rate of enrolment in same states
recorded progressively may be the impact of the programmes.
References:
Galbraith, J.K., (1961): Economic Development, Harward
University Pressh, U.S.A. p.81
Benjamin Higgins (1993): Education and Economic
Development, Universal Book Stall, New Delhi, p.410.Rajaiah, B. (1987): Economics of Education, Mittal
Publications, Agrawal, J.C. (1995): Education and emerging
India, Doaba House Publications, Delhi,p.26.
Theodore, W.Schultz (1995), “Investment in human capital” in
Ron Ayres (ed) development studies, an introduction through
selected Readings (UK,) p.538
Michel P.Todaro and Stephen C.Smith(2003), Economic
development, Pearson Education Asia, 8th Edition,p.385
Veena DR (2003), Education and Economic Growth,
“dimensions of Indian education system, EPW, vol. XXXI,
No.37, P.21
Todaro M.P(1988), “Economics for a developing World”2nd
Edition, Longman, London,p.249
John Sheehan(1973),Education and economic development : the
economics of education, Gorge Allen and Universel Ltd,
publication, London ,p.62.
Misra and Puri (2004), Indian Economy, p221.
Govt of India (1991-92) Economic survey of India, p.126
Ananda Krishnan. M. (2006), Equity in Higher Education in
knowledge –based society, University News,
Ram Takwale 2006, Solving quality, quantity and equity
Triangle in education , University News pp.119-126
Table1-1Trends in Inter-State growth rates of total enrolment in
primary education.
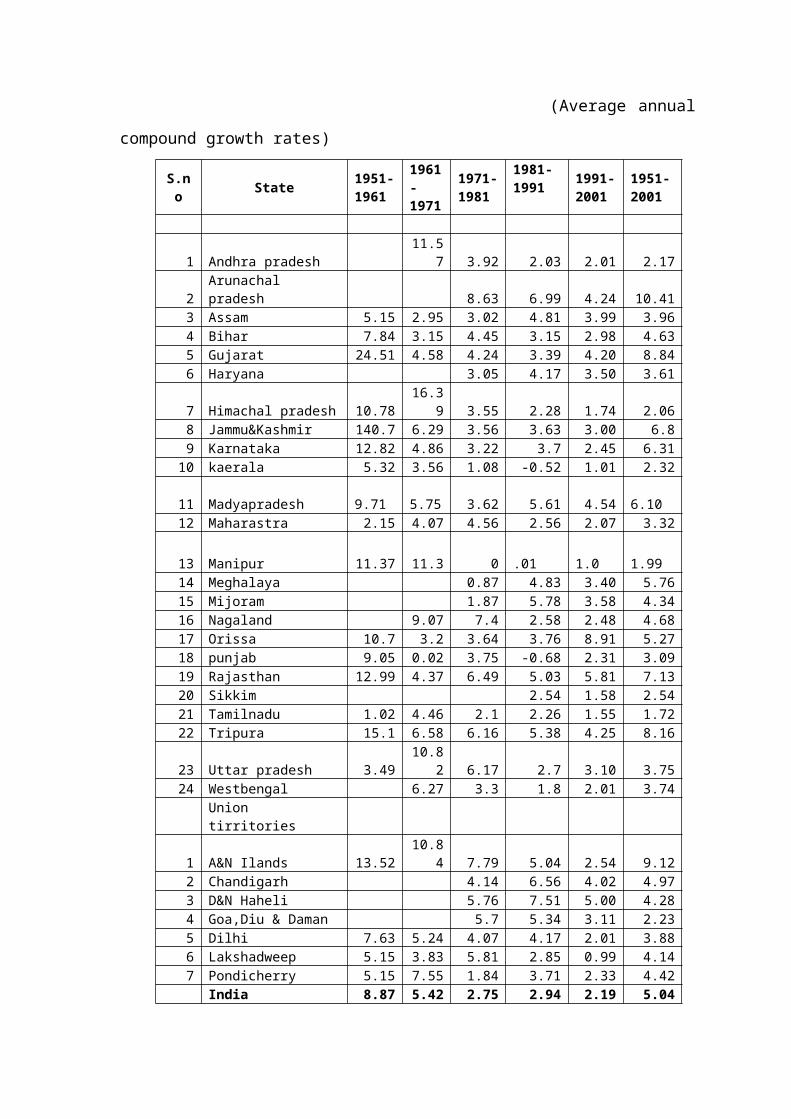
(Average annual
compound growth rates)
S.no State 1951-
1961
1961-1971
1971-1981
1981-1991 1991-
20011951-2001
1 Andhra pradesh11.5
7 3.92 2.03 2.01 2.17
2Arunachal pradesh 8.63 6.99 4.24 10.41
3 Assam 5.15 2.95 3.02 4.81 3.99 3.964 Bihar 7.84 3.15 4.45 3.15 2.98 4.635 Gujarat 24.51 4.58 4.24 3.39 4.20 8.846 Haryana 3.05 4.17 3.50 3.61
7 Himachal pradesh 10.7816.3
9 3.55 2.28 1.74 2.068 Jammu&Kashmir 140.7 6.29 3.56 3.63 3.00 6.89 Karnataka 12.82 4.86 3.22 3.7 2.45 6.3110 kaerala 5.32 3.56 1.08 -0.52 1.01 2.32
11 Madyapradesh 9.71 5.75 3.62 5.61 4.54
6.10
12 Maharastra 2.15 4.07 4.56 2.56 2.07 3.32
13 Manipur 11.37 11.3 0 .01 1.0
1.99
14 Meghalaya 0.87 4.83 3.40 5.7615 Mijoram 1.87 5.78 3.58 4.3416 Nagaland 9.07 7.4 2.58 2.48 4.6817 Orissa 10.7 3.2 3.64 3.76 8.91 5.2718 punjab 9.05 0.02 3.75 -0.68 2.31 3.0919 Rajasthan 12.99 4.37 6.49 5.03 5.81 7.1320 Sikkim 2.54 1.58 2.5421 Tamilnadu 1.02 4.46 2.1 2.26 1.55 1.7222 Tripura 15.1 6.58 6.16 5.38 4.25 8.16
23 Uttar pradesh 3.4910.8
2 6.17 2.7 3.10 3.7524 Westbengal 6.27 3.3 1.8 2.01 3.74
Union tirritories
1 A&N Ilands 13.5210.8
4 7.79 5.04 2.54 9.122 Chandigarh 4.14 6.56 4.02 4.973 D&N Haheli 5.76 7.51 5.00 4.284 Goa,Diu & Daman 5.7 5.34 3.11 2.235 Dilhi 7.63 5.24 4.07 4.17 2.01 3.886 Lakshadweep 5.15 3.83 5.81 2.85 0.99 4.147 Pondicherry 5.15 7.55 1.84 3.71 2.33 4.42
India 8.87 5.42 2.75 2.94 2.19 5.04
C.V *118.9
594.1
5129.1
5 118.2 151.0119.7
2 Source: compiled from data
*CV=co-efficient of variation
Table1-2Trends in Inter-State growth rates of male enrolment in
primary education.
(Average annual compound growth rates)
S.no State 1951-
19611961-1971
1971-1981
1981-1991
1991-2001
1951-2001
1 Andhra pradesh 2.52 4.03 0.94 1.04 2.46
2Arunachal pradesh 6.25 6.1 5.18 8.00
3 Assam 4.47 2.45 3.12 4.06 2.48 3.524 Bihar 6.76 2.8 3.88 2.42 2.47 3.965 Gujarat 13.13 4.27 3.71 3.06 2.10 8.26 Haryana 2.35 2.15 0.97 2.25
7Himachal pradesh 9.57 14.76 2.74 1.76 .87 6.72
8 Jammu&Kashmir 12.55 4.81 2.97 3.08 3.54 5.789 Karnataka 11.72 4.06 2.96 3.26 3.84 5.5510 kaerala 5.25 3.47 0.86 -0.63 0.99 2.2111 Madyapradesh 9.86 6.02 3.06 4.14 3.65 5.3712 Maharastra 2.01 3.52 4.76 2.23 2.62 3.0213 Manipur 8.8 5.41 0.42 3.9 3.21 4.5714 Meghalaya 1.99 7.39 2.56 4.5315 Mijoram 1.89 5.63 5.32 4.0316 Nagaland 8.35 6.84 8.13 4.60 5.6517 Orissa 9.45 2.58 2.89 3.51 4.01 4.5718 punjab -1.95 4.45 3.05 -0.3 5.04 2.2519 Rajasthan 12.49 3.99 6.09 3.58 4.55 6.4820 Sikkim 4.54 5.25 4.5421 Tamilnadu -2.05 3.64 1.72 2.06 2.66 1.3322 Tripura 11.74 6.74 5.35 3.84 5.41 2.7023 Uttar pradesh 2.75 8.15 0.58 1.16 6.41 3.1124 Westbengal 5.91 2.45 1.64 2.10 3.29
Union
tirritories1 A&N Ilands 13.09 10.72 7.11 4.31 5.10 6.762 Chandigarh 2.89 5.48 5.0 4.363 D&N Haheli 5.25 1.95 4.20 3.58
4Goa,Diu & Daman 3.27 -1.79 2.99 1.18
5 Dilhi 8.85 4.4 3.84 3.69 6.21 5.736 Lakshadweep 2.25 5.67 1.29 2.55 3.017 Pondicherry 6.26 1.99 2.7 2.21 3.82
India 5.14 4.76 3.73 3.62 3.20 4.53
C.V *126.3
2 92.72127.3
7123.1
5 133.1 119.18
Source: compiled from data
*CV=co-efficient of variation
Table1-3Trends in Inter-State growth rates of girl’s enrolment in
primary education.
(Average annual compound growth rates)
S.no State 1951-1961
1961-1971
1971-1981
1981-1991
1991-2001
1951-2001
1 Andhra pradesh 3.18 3.74 3.56 3.55 3.46
2Arunachal pradesh 17.72 7.02 7.99 15.34
3 Assam 6.53 3.7 3.02 5.87 5.95 4.774 Bihar 12.58 4.13 6.04 4.79 3.99 6.835 Gujarat 5.08 5 3.9 3.93 3.66 4.66 Haryana 4.6 7.34 6.21 5.93
7Himachal pradesh 17.91 24.16 4.73 3.42 4.30 12.21
8 Jammu&Kashmir 17.25 8.93 4.59 4.33 5.65 8.739 Karnataka 13.64 6.08 3.55 4.33 5.14 6.84
10 kaerala 5.4 3.69 1.36 -0.54 2.53 1.4711 Madyapradesh 9.84 8.4 4.82 8.17 5.42 7.7912 Maharastra 2.48 50.8 5.03 3.35 2.69 4.0213 Manipur 18.12 7.44 1.55 5.99 6.22 8.1214 Meghalaya 3.27 6.31 4.68 4.7815 Mijoram 1.84 4.35 4.89 2.9816 Nagaland 10.24 7.17 4.09 8.55 7.1717 Orissa 14.1 4.55 4.76 4.13 3.65 6.7918 punjab 11.76 2.45 4.6 0.23 5.32 4.6919 Rajasthan 26.5 5.83 7.74 8.32 7.52 9.320 Sikkim 8.66 8.22 2.2821 Tamilnadu -1.47 5.66 2.58 2.5 3.20 9.4422 Tripura 24.66 8.89 5.29 7.35 6.98 10.8723 Uttar pradesh 6.79 17.06 -3.6 4.01 4.11 5.1924 Westbengal 6.88 4.56 2.01 3.20 4.41
Union tirritories
1 A&N Ilands 1305 8.05 5.17 5.10 6.422 Chandigarh 3.26 7.24 6.12 3.553 D&N Haheli 9.11 1.9 4.01 5.444 Goa,Diu & Daman 5.44 -3.32 3.33 0.965 Dilhi 6.27 6.02 3.7 4.8 4.60 5.66 Lakshadweep 3.06 6.4 2.17 2.12 4.327 Pondicherry 7.84 2.86 3.99 4.11 4.48
India 8.51 6.99 2.95 3.94 3.89 5.57
C.V *144.9
6 83.69132.2
6115.9
1 121.0 112.3Source: compiled from data
*CV=co-efficient of variation
![Building a utopie autre [Amazing Archigram! - 50 years of Zoom!/ Zzzzrrtt!/ Thud!/ Blaam!]](https://img.dokumen.tips/doc/110x75/6331cb294e01430403005bcc/building-a-utopie-autre-amazing-archigram-50-years-of-zoom-zzzzrrtt-thud.jpg)