Embed Size (px)
Citation preview
Environmental Toxicology and ChemistryDecember 2011Bjørn Munro Jenssen, IBIGeir Wing Gabrielsen, Norsk polarinstitutt
Submission date:Supervisor:Co-supervisor:
Norwegian University of Science and TechnologyDepartment of Biology
Levels and Effects ofOrganohalogenated Contaminants onThyroid Hormone Levels in GlaucousGulls (Larus hyperboreus) fromKongsfjorden, Svalbard.
Anja Johansen Haugerud

Levels and Effects of Organohalogenated Contaminants on Thyroid Hormone Levels in Glaucous Gulls (Larus hyperboreus) from Kongsfjorden, Svalbard.
Anja Johansen Haugerud
Master’s Thesis in Environmental Toxicology
Department of Biology (IBI)
Norwegian University of Science and Technology (NTNU)
In collaboration with:
Norwegian Polar Institute (NPI) and Norwegian Institute for Air Research (NILU)
Supervisors:
Professor Bjørn Munro Jenssen (IBI, NTNU)
Professor Geir Wing Gabrielsen (NPI)
”- og måker - jeg har sagt det før, og jeg sier det igjen:
Jeg hater måker! De skriker! Og oppfører seg som dyr, og jeg tenker:
Sånn er livet også ganske ofte -
som en våt morgen med dyr som skriker og drypper,
og det er skorpe på leverposteien,
og skorpe både på det ene og det andre.
Sånn er livet. – Og sånn er det å være i båt også -
særlig om morgenen - noen ganger.
Men noen andre ganger - eller for å si det på en annen måte -
noen ganger - i båt om morgenen - og i livet også - forsåvidt –
Noen ganger er det all right ”
Odd Børretzen
Front page: Glaucous gull (Larus hyperboreus). Photo: Anja J. Haugerud.
i
ACKNOWLEDGEMENTS “How did you catch the gulls?” has been one of the most frequent questions I have been
asked during these last two years as a master student in biology at the Norwegian
University of Science and Technology (NTNU). With an automatically triggered nest trap,
has been my answer. In many ways, being trapped has also been one of the most
frequent feelings I have had in these two years. My mind has been fixed upon my twenty
eight glaucous gulls from Kongsfjorden. I have cherished and honored them for better
and for worse these two years – and now it is time to let them fly off into the future. I do
not know what will come – but I do know it has been a wonderful time getting to know
both the gulls and myself better.
This master’s thesis was funded as a part of the International Polar Year (IPY) project
“Contaminants in polar regions” (COPOL). Sincere thanks to all who have helped me
along the way! Thanks to my scientific supervisors Prof. Geir Wing Gabrielsen at the
Norwegian Polar Institute (NPI) and Prof. Bjørn Munro Jenssen at NTNU for inspiring
me. I want to express my recognition to Dr. Kjetil Sagerup (NPI) for the exquisite
knowledge of catching gulls and for a great time in the field. Furthermore, I want to
thank Kings Bay AS for making the fieldwork in Ny-Ålesund to a perfect collaboration.
Thank you, Grethe Stavik Eggen and Elin Noreen (NTNU) for guiding me in the
laboratory, and Sandra Huber, Nicholas Warner and Eldbjørg Heimstad at NILU for an
instructive stay in Tromsø. I am also thankful to Dr. Eugen G. Sørmo, Anette Fenstad and
Kristin Møller Gabrielsen for their contributions.
My wonderful family deserves my thanks for encouraging me in all I do and keeping my
spirits up. Thanks to my roommates for all the gourmet – and not so gourmet dinners,
accompanied by Jane Austen’s handsome Mr. Darcy and Mrs. Bennett’s words of
wisdom. Thanks to my fellow students and good friends at NTNU, especially for a lovely
Byssus time! Thank you for supporting me, Olav – you are my very own Mr. Darcy.
Trondheim, 5th December 2011
Anja Johansen Haugerud

ii
iii
ABSTRACT The glaucous gull (Larus hyperboreus) is one of the largest flying top predators in the
Arctic and is exposed to rather high levels of different persistent organohalogenated
contaminants (OHCs). The present study investigated whether the serum thyroid
hormone (TH) levels in female glaucous gulls breeding in Kongsfjorden (79oN) may be
affected by the various OHCs. A slight decrease in traditional OHCs, like polychlorinated
biphenyls (PCBs) and some pesticides have been reported over the last decade, while
increasing levels of new and emerging compounds like polybrominated diphenyl ethers
(PBDEs) and perfluoroalkyl substances (PFASs) are detected in Arctic marine and
terrestrial wildlife. Although further production of some possible endocrine disruptive
chemicals have been banned by many nations, the chemicals persist, move throughout
the biosphere and are potentially harmful to exposed wildlife and biota.
After 35 years of contaminant research, the Svalbard glaucous gull function as a
bioindicator species. Previous assessments have concluded that OHC levels were high
enough to be of concern for a number of physiological effects, among them endocrine
alterations. However, this is to my knowledge the first biomarker study on levels of THs
in breeding glaucous gulls from Kongsfjorden. Plasma from 19 nesting female glaucous
gulls was analysed for PCBs, organochlorinated pesticides (OCPs) (such as
dichlorodiphenyltrichloroethane [DDT] and chlordanes) and their metabolites, PBDEs
and PFASs. Total and free ranging THs were quantified using radioimmuno assay (RIA).
Multivariate statistics were used to investigate the relationships between the TH levels
and the explanatory variables.
The PCBs represented the most pervasive compound group in the present study, as 61.3
% of the total contaminant burden in female glaucous gulls. The other contaminant
groups contributed as follows: ΣDDTs (17.5 %) > ΣPFASs (14.8 %) > HCB (2.9 %) >
ΣCHLs (2.7 %) > ΣPBDE (0.8 %) > ΣHCH (0.1 %). Several of the PFASs correlated
significantly with the THs. Significant correlations were found between several of the
long-chain Perfluoroalkyl carboxylates (PFCAs) and THs. Surprisingly, even though the
PFCAs represented only 2.8 % of the total contaminant load in the present study, the
PFCAs represented the most important variables explaining the variation in THs.

iv
v
SAMMENDRAG Polarmåker (Larus hyperboreus) er en av de største flyvende toppredatorene i arktiske
strøk og har vist seg å ha høye nivåer av ulike klasser persistente organiske miljøgifter
(POPs). Målet med dette studiet var å undersøke om nivåer av thyroidhormoner (TH) i
hekkende polarmåkehunner fra Kongsfjorden (790N) på noen måte var påvirket av de
ulike POPene. Noen av de mer tradisjonelle miljøgiftene, som utfasede PCBer og noen
pesticider, har vist seg å minke i konsentrasjon det siste tiåret. Derimot måles det nå
høyere nivåer av nyere miljøgifter som bromerte flammehemmere og perfluoroalkylerte
komponenter (PFASs), både i marine og terrestriske arktiske økosystemer. På tross av
utfasing av et utvalg kjemikalier, viser de seg å være resistente mot nedbryting, de
forflyttes i biosfæren og er potensielt giftig for biologiske systemer.
Siden 1972 har polarmåker vært gjenstand for et stort antall studier, hovedsakelig på
Bjørnøya. Arten har derfor status som bioindikator etter 35 års forskning. Likevel er
dette studiet etter min kjennskap det første fra Kongsfjorden som undersøker nivåer av
THer hvor effekter kan kobles til nivåer av POPs. Tidligere studier fra Kongsfjorden har
vist høye nivåer av POPs i biota. Plasmaprøver fra 19 rugende polarmåkehunner ble
analysert for polyklorerte bifenyler (PCBs), organoklorerte pesticider
(diklordifenyltrikloretan [DDT], chlordaner) og deres metabolitter, bromerte
flammehemmere (BFRs) og perfluorerte stoffer (PFASs). Total og fri fraksjon av
thyroidhormoner (THs) ble analysert ved bruk av radioimmunoassay (RIA).
Det ble i dette studiet detektert 22 PCB kongenere, noe som utgjorde hele 61.3 % av
miljøgiftfraksjonen. De andre miljøgiftgruppene utgjorde henholdsvis: ΣDDTs (17.5 %) >
ΣPFASs (14.8 %) > HCB (2.9 %) > ΣCHLs (2.7 %) > ΣPBDE (0.8 %) > ΣHCH (0.1 %).
Positive, signifikante korrelasjoner ble funnet mellom THs og flere av PFASs. Det var de
langkjedede Perfluoroalkyl carboxylatene (PFCAs) som forklarte mest av den observerte
TT3 variasjonen, mens TT4:TT3 ratioen var negativt korrelert med de samme PFCAene.
Overraskende var det denne minste fraksjonen fluorerte forbindelser, som utgjorde kun
2.8 % av den totale miljøgiftmengden, som viste seg å være mest potent i forhold til
observerte effekter i denne studien.
vi
ABBREVIATIONS
AMAP Arctic Monitoring and Assessment Program
BCI Body condition index
BFR Brominated flame retardant
CHL Chlordane
cpm Counts per minute
CV Coefficient of variation
CV-ANOVA Cross validated analysis of variance
DDD Dichlorodiphenyldichloroethane
DDE Dichlorodiphenyltrichloroethylene
DDT Dichlorodiphenyltrichloroethane
EDC Endocrine disrupting chemicals
EI Electron impact
FT3 Free triiodothyronine
FT4 Free thyroxine
FTS Fluorotelomer sulfonate
GC Gas chromatograph
HCB Hexachlorobenzene
ID Identification number
IDs Iodothyronine deiodinases
LC Liquid chromatograph
LOD Limit of detection
LOQ Limit of quantification
MeOH Methanol
MRM Multiple reaction monitoring
MS Mass spectrometer
N Number of observations
NILU Norwegian Institute for Air Research
NPI Norwegian Polar Institute
NTNU Norwegian University of Science and Technology
OC Organochlorine
OCN Octachloronaphtalene
OHC Organohalogenated contaminant
OCP Organochlorinated pesticides
OPLS Orthogonal projection to latent structures
p Probability of rejecting the hypothesis
PBDE Polybrominated diphenyl ethers
PC Principal Component
PCA Principal Component analysis
PCB Polychlorinated biphenyl
PCR Polymerase chain reaction
vii
PFAS Perfluoroalkyl and polyfluoroalkyl substances
PFBA Perfluorobutanoate
PFBS Perfluorobutane sulfonate
PFCA Perfluoroalkyl carboxylates
PFDcA Perfluorodecanoate
PFDcS Perfluorodecane sulfonate
PFDoA Perfluorododecanoate
PFHpS Perfluoroheptane sulfonate
PFHxS Perfluorohexane sulfonate
PFNA Perfluorononanoate
PFOA Perfluorooctanoate
PFOS Perfluorooctane sulfonate
PFPA Perfluoropentanoate
PFSA Perfluoroalkyl sulfonates
PFTeA Perfluorotetradecanoate
PFTriA Perfluorotridecanoate
PLS Projection to latent structures
POP Persistent organic pollutant
Q2 Goodness of prediction coefficient
Qstd Quantification standard
r Pearson correlation coefficient
REACH Registration, Evaluation, Authorization and Restriction of Chemicals
RIA Radioimmuno assay
R2X Explained variance
R2Y Goodness of fit, correlation coefficient
RPM rounds per minute
SD Standard deviation
SIM Selective ion monitoring
SPE Solid phase extraction
Spl Sample
SRM Certified reference material
SULTs Sulfotransferases
TH Thyroid hormone
T3 triiodothyronine
T4 thyroxine
TR Thyroid receptor
TSH Thyroid stimulating hormone
TTR Transthyretin
UGTs UDP-glucuronocyltransferases
UHP Ultra high pressure (gas chromatograph)
UV Unit variance
VIP Variable importance plot
ww Wet weight
viii
TABLE OF CONTENTS
Acknowledgements ........................................................................................................................... i
Abstract .............................................................................................................................................. iii
Sammendrag ...................................................................................................................................... v
Abbreviations.................................................................................................................................... vi
Index of tables, figures and appendix....................................................................................... ix
1 Introduction .................................................................................................................................... 1
2 Materials and Methods ................................................................................................................ 5
2.1. Study area .............................................................................................................................................. 5
2.2 Field sampling ....................................................................................................................................... 6
2.3 Contaminant analysis in glaucous gull plasma ......................................................................... 7
2.4 Lipid analysis ...................................................................................................................................... 16
2.5 Sex determination ............................................................................................................................ 17
2.6 Determination of thyroid hormone levels in glaucous gull serum ................................ 18
2.7 Statistics ............................................................................................................................................... 19
3 Results ............................................................................................................................................ 23
3.1 Biometric characteristics ............................................................................................................... 23
3.2 Contaminant levels and pattern .................................................................................................. 24
3.3 Thyroid hormone levels ................................................................................................................. 28
3.4 Relationships between biometric characteristics, TH levels and OHCs ...................... 29
4 Discussion ..................................................................................................................................... 41
4.1 Prevalence of organohalogenated contaminants (OHCs) ................................................. 41
4.2 Contaminant levels and pattern .................................................................................................. 42
4.3 Thyroid hormone levels ................................................................................................................. 46
4.4 Relationships between biometric variables and OHCs ...................................................... 47
4.5 Relationships between OHCs and thyroid hormones. ........................................................ 48
5 Concluding remarks and further work .............................................................................. 55
6 References .................................................................................................................................... 57
ix
INDEX OF TABLES, FIGURES AND APPENDIX
Tables Table 1: OCPs, PCBs and PBDEs analysed in glaucous gull plasma
Table 2: PFASs analysed in glaucous gull plasma
Table 3: Biometric characteristics
Table 4: OHC concentrations in ng/g ww
Table 5: Thyroid hormone levels
Table 6: Pearson correlations, PFAS and THs
Table 7: Pearson correlations, PCBs and PBDEs and THs
Table 8: TH levels compared with previous studies
Figures Figure 1: Map over sampling area – Kongsfjorden, Svalbard
Figure 2: Photo of the snare placed inside the nest bowl
Figure 3: Photo of the trap installed and camouflaged.
Figure 4: The PCR products from sex determination visualised in agarose gel
Figure 5: The contaminant contribution
Figure 6: Principal Component Analysis (PCA) Plot
Figure 7: Linear relationship: TT3 and PFTriA
Figure 8: Linear relationship: TT3 and PFTeA
Figure 9: Linear relationship: TT4:TT3 and PFTriA
Figure 10: Linear relationship: TT4:TT3 and PFTeA
Figure 11: OPLS VIP plot TT3
Figure 12: OPLS Coefficient plot TT3
Figure 13: OPLS VIP plot TT4:TT3
Figure 14: OPLS Coefficient plot TT4:TT3
Appendix Appendix A: Internal standard POP I and BROM I
Appendix B: Detection limits for PCBs, DDTs, HCB and CHLs
Appendix C: Recoveries PCBs, DDTs, HCB and CHLs
Appendix D: Internal standard PFASs
Appendix E: Detection limits for PFASs
Appendix F: Recoveries PFASs
Appendix G: Individual biometric measurements
Appendix H: Individual thyroid hormone concentrations
Appendix I: Individual OHC concentrations
Appendix J: PCA loadings for the variables

x
1
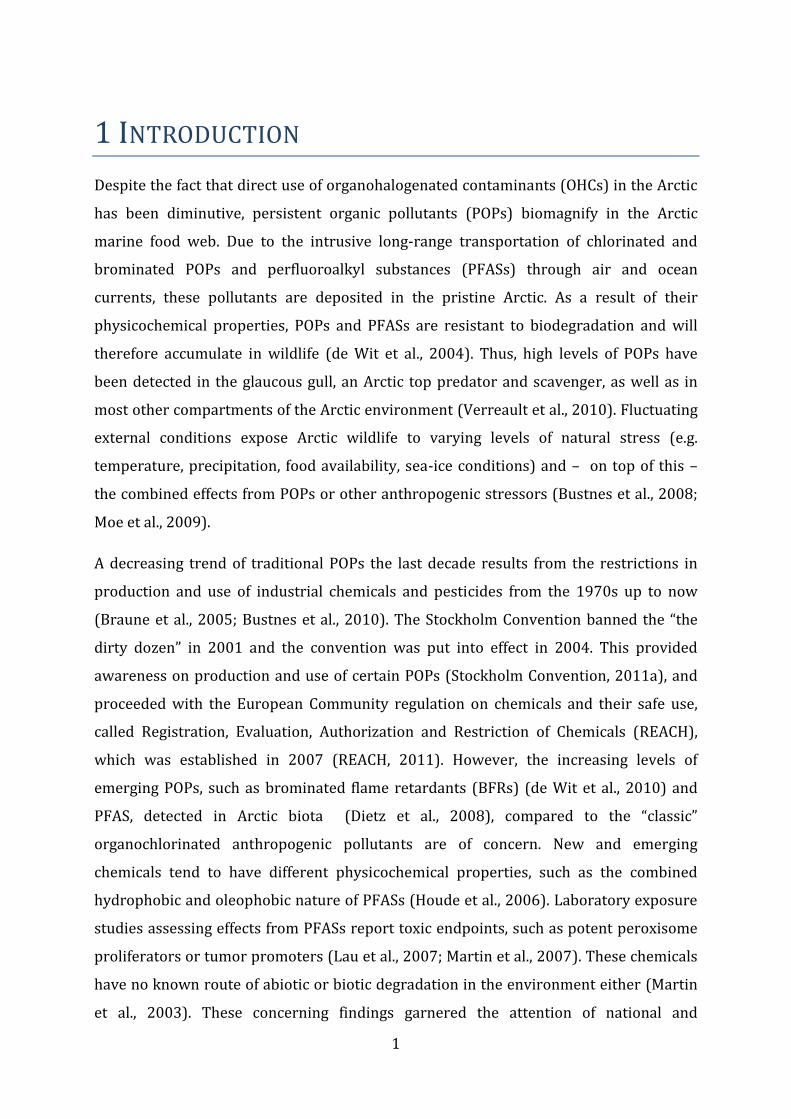
1 INTRODUCTION Despite the fact that direct use of organohalogenated contaminants (OHCs) in the Arctic
has been diminutive, persistent organic pollutants (POPs) biomagnify in the Arctic
marine food web. Due to the intrusive long-range transportation of chlorinated and
brominated POPs and perfluoroalkyl substances (PFASs) through air and ocean
currents, these pollutants are deposited in the pristine Arctic. As a result of their
physicochemical properties, POPs and PFASs are resistant to biodegradation and will
therefore accumulate in wildlife (de Wit et al., 2004). Thus, high levels of POPs have
been detected in the glaucous gull, an Arctic top predator and scavenger, as well as in
most other compartments of the Arctic environment (Verreault et al., 2010). Fluctuating
external conditions expose Arctic wildlife to varying levels of natural stress (e.g.
temperature, precipitation, food availability, sea-ice conditions) and – on top of this –
the combined effects from POPs or other anthropogenic stressors (Bustnes et al., 2008;
Moe et al., 2009).
A decreasing trend of traditional POPs the last decade results from the restrictions in
production and use of industrial chemicals and pesticides from the 1970s up to now
(Braune et al., 2005; Bustnes et al., 2010). The Stockholm Convention banned the “the
dirty dozen” in 2001 and the convention was put into effect in 2004. This provided
awareness on production and use of certain POPs (Stockholm Convention, 2011a), and
proceeded with the European Community regulation on chemicals and their safe use,
called Registration, Evaluation, Authorization and Restriction of Chemicals (REACH),
which was established in 2007 (REACH, 2011). However, the increasing levels of
emerging POPs, such as brominated flame retardants (BFRs) (de Wit et al., 2010) and
PFAS, detected in Arctic biota (Dietz et al., 2008), compared to the “classic”
organochlorinated anthropogenic pollutants are of concern. New and emerging
chemicals tend to have different physicochemical properties, such as the combined
hydrophobic and oleophobic nature of PFASs (Houde et al., 2006). Laboratory exposure
studies assessing effects from PFASs report toxic endpoints, such as potent peroxisome
proliferators or tumor promoters (Lau et al., 2007; Martin et al., 2007). These chemicals
have no known route of abiotic or biotic degradation in the environment either (Martin
et al., 2003). These concerning findings garnered the attention of national and
Introduction
2
international environmental protection agencies (Martin et al., 2004) and demonstrated
the need for regulations on production and use (Jensen and Leffers, 2008). Climate
change might elicit the bioavailability and toxicity of the OHCs (Schiedek et al., 2007), in
addition to an increasing amount of stress caused in wildlife when adapting to
environmental alterations (Jenssen, 2006).
OHCs in the Arctic include industrial chemicals like polychlorinated biphenyls (PCBs),
bi-products such as hexachlorobenzen (HCB), organochlorine pesticides (chlordanes,
dichlorodiphenyltrichloroethane [DDT]) in addition to some more novel compounds,
such as brominated flame retardants (BFRs) (e.g. polybrominated diphenyl ethers
[PBDEs]) and perfluoro and polyfluoroalkyl substances (PFASs) (de Wit et al., 2004).
BFRs are widely used as fireproofing compounds in electrical equipment, furniture and
building materials, like polyurethane foam. They are a proof of that not all contaminants
are decreasing in the environment (de Wit et al., 2004). Due to their structural and
chemical similarities to PCBs, the apprehensive expectations on negative health effects
are equal. Despite the ban of production and use of e.g. penta- and octa-BDEs, increasing
levels are detected in the environment, though low compared to PCBs (de Wit et al.,
2004). A similar trend is expected in the time to come due to the rapid development of
PBDE replacements (de Wit et al., 2010).
PFASs have been in use for more than 50 years in industrial and commercial products
like lubricants, soil and stain repellents, paper coating, drugs, pesticides and fire-fighting
foams (Houde et al., 2006; Buck et al., 2011). Their strong carbon-fluorine bond and
their oil and water repellence due to their amphipatic characters are of great importance
considering the chemical and thermal stability of these compounds in nature (Key et al.,
1997; Houde et al., 2006). There are two major compound groups of PFASs detected in
the environment – perfluoroalkyl carboxylate (PFCA) and perfluoroalkyl sulfonates
(PFSA). The prevailing compounds found in biota are the PFCA Perfluorooctanoate
(PFOA) and Perfluorooctan sulfonate (PFOS) (AMAP, 2009). Increasing amounts of
PFASs have been detected in the environment over the last decades (Verreault et al.,
2007; Miljeteig and Gabrielsen, 2010).
There is a growing body of evidence with respect to OHC-mediated responses in Arctic
wildlife (Letcher et al., 2010). Complex mixtures of known and unknown contaminants
Introduction
3
are assumed to represent the nature of effects from OHCs. The growing number of
persistent OHCs is of great concern, as well as their metabolic and degradation products
(Letcher et al., 2010). New and emerging OHCs, such as PFASs, are of great concern since
there are no known biotic or abiotic degradation pathways for these chemicals and they
display great bioaccumulation potential when the perfluorinated chain exceed 6-7
carbons (Martin et al., 2004).
Thyroid hormones (THs) play a key role for normal development and physiological
function in vertebrates. Normal TH function is dependent on a range of factors, like
iodine uptake, TH synthesis, transport, deiodination and TH nuclear receptor binding
(Yen and Chin, 1994). In avian species the THs control the thermoregulation, body
weight, growth, lipid metabolism, reproduction, moulting and secondary sex
characteristics (similar to the function in mammals) (Merryman and Buckles, 1998a;
Merryman and Buckles, 1998b; McNabb, 2000). The hypothalamic-pituitary-thyroid axis
(HPT-axis) controls the production and release of thyroxine (T4) from the thyroid
glands. When the pituitary gland is stimulated by the hypothalamus, it releases thyroid-
stimulating-hormone (TSH) which stimulates the thyroid glands. In birds, the serum
binding proteins albumin and transthyretin (TTR) transport and distribute T4, which is
converted to the more potent and metabolic active triiodothyronine (T3) by peripheral
deiodinase enzymes (McNabb, 2000; Ucan-Marin et al., 2010). The fact that TH receptors
are present in the nuclei in most cells of the body, demonstrate the widespread effects of
THs (McNabb, 2000; Widmaier et al., 2006). Several other factors influence regular
thyroid function, including food availability and composition, dietary iodine levels,
seasonality, age and time of day (McNabb, 2000). Diurnal patterns in birds demonstrate
that plasma T4 peak during the dark period and T3 rise to their highest levels during
light period (McNabb, 2000).
The glaucous gull (Larus hyperboreus) is one of the largest avian predators with a
circumpolar breeding range (Gilchrist, 2001). As an apex predator and opportunistic
scavenger, the diet varies from pelagic and marine invertebrates, fish, eggs, chicks or
adults of other seabirds, to carrion or human refuse (Løvenskiold, 1964; Anker-Nilssen
et al., 2000). The feeding ecology of the glaucous gull is important for the distribution of
OHCs within populations (Bustnes et al., 2000). Since glaucous gulls occupy an apex
position in the Arctic marine food web and their ability to biotransform contaminants
Introduction
4
seem to be restricted (Henriksen et al., 2000), the species is vulnerable for
bioaccumulation and biomagnification of OHCs (Bustnes et al., 2000).
Contaminant levels and patterns have been reported in glaucous gulls since the first
survey on anthropogenic contaminants in Arctic wildlife in 1972 (Bourne and Bogan,
1972). Since then, high levels of a range of environmental pollutants like PCBs and
pesticides have been suggested to cause several biological and ecological responses and
effects in this top predator (extensively reviewed by Gabrielsen, (2007) and Verreault et
al., (2010)). Previous studies have assessed that high blood levels of OHCs may
contribute to behavioral, developmental and reproductive stress in glaucous gulls
(Bustnes et al., 2003a; Bustnes et al., 2003b; Verreault et al., 2004; Bustnes et al., 2005).
Endocrine disruptive effects are among them, due to alterations in circulating THs
(Verreault et al., 2010).
Several of the OHCs detected in glaucous gulls during the last decades have been toxic
evaluated as possible endocrine disrupters, such as BFRs and PCBs (reviewed by Boas et
al., 2006). Therefore, it is crucial to monitor the POPs of environmental concern and
include the recently identified POPs. Further, this biomarker effect study may contribute
to establish possible links between contaminant exposure and effects. Combined effects
from OHCs and other anthropogenic or natural stressors in glaucous gulls need to be
established. Filling these important knowledge gaps may contribute to strengthen the
legislation regarding new, emerging POPs. The possible harmful effects from
contaminant exposure, novel POPs reaching the Arctic and the indications that climate
change can impact the contaminants’ toxicity and bioavailability, strengthen the need for
continuous monitoring of POPs in Arctic wildlife.
Aim of study The aim of the present study was to investigate whether a selection of OHCs disrupt
levels of THs in female glaucous gulls breeding in Kongsfjorden. It is hypothesized that
high levels of OHCs can be detected in this avian top predator, including the legacy POPs,
such as PCBs, DDTs and chlorinated pesticides in addition to emerging OHCs, such as
BFRs and PFASs. Negative effects from exposure to these recently identified POP
candidates are expected. Therefore, the aim was to investigate possible endocrine
disruptive effects elicited on circulating THs, either from single classes of contaminants
or from their combined effects.
5
2 MATERIALS AND METHODS
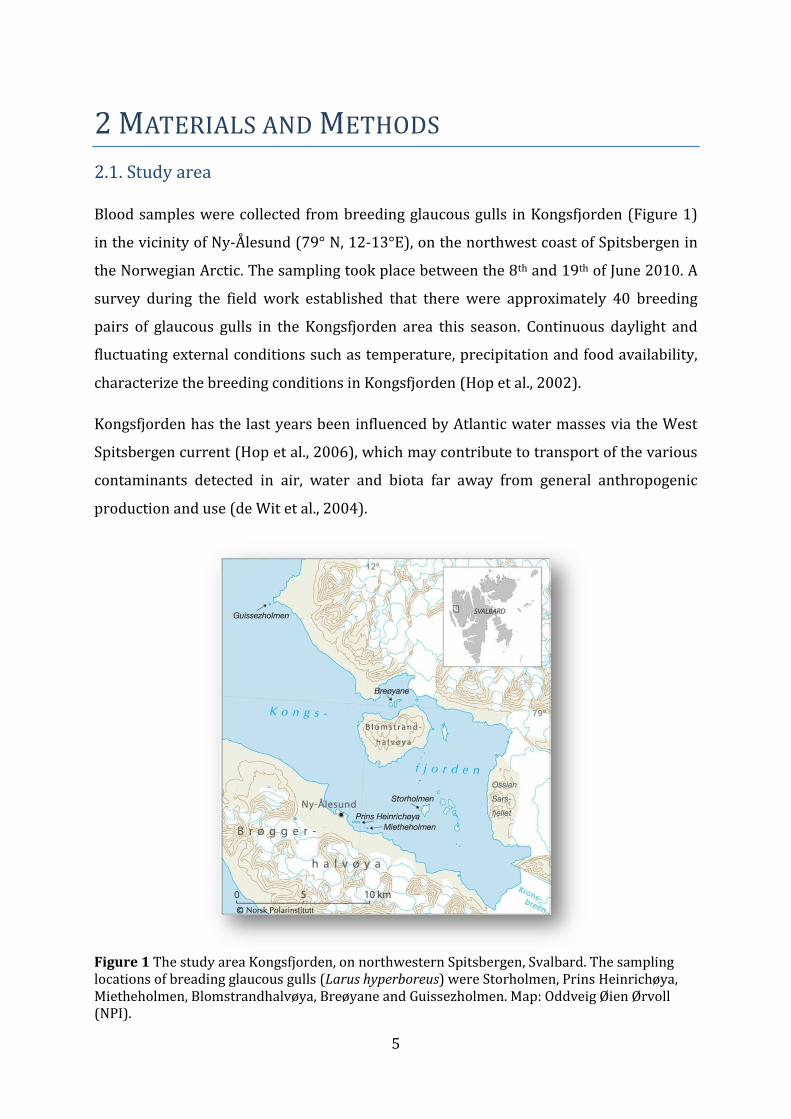
2.1. Study area Blood samples were collected from breeding glaucous gulls in Kongsfjorden (Figure 1)
in the vicinity of Ny-Ålesund (79° N, 12-13°E), on the northwest coast of Spitsbergen in
the Norwegian Arctic. The sampling took place between the 8th and 19th of June 2010. A
survey during the field work established that there were approximately 40 breeding
pairs of glaucous gulls in the Kongsfjorden area this season. Continuous daylight and
fluctuating external conditions such as temperature, precipitation and food availability,
characterize the breeding conditions in Kongsfjorden (Hop et al., 2002).
Kongsfjorden has the last years been influenced by Atlantic water masses via the West
Spitsbergen current (Hop et al., 2006), which may contribute to transport of the various
contaminants detected in air, water and biota far away from general anthropogenic
production and use (de Wit et al., 2004).
Figure 1 The study area Kongsfjorden, on northwestern Spitsbergen, Svalbard. The sampling locations of breading glaucous gulls (Larus hyperboreus) were Storholmen, Prins Heinrichøya, Mietheholmen, Blomstrandhalvøya, Breøyane and Guissezholmen. Map: Oddveig Øien Ørvoll (NPI).
Materials and Methods
6
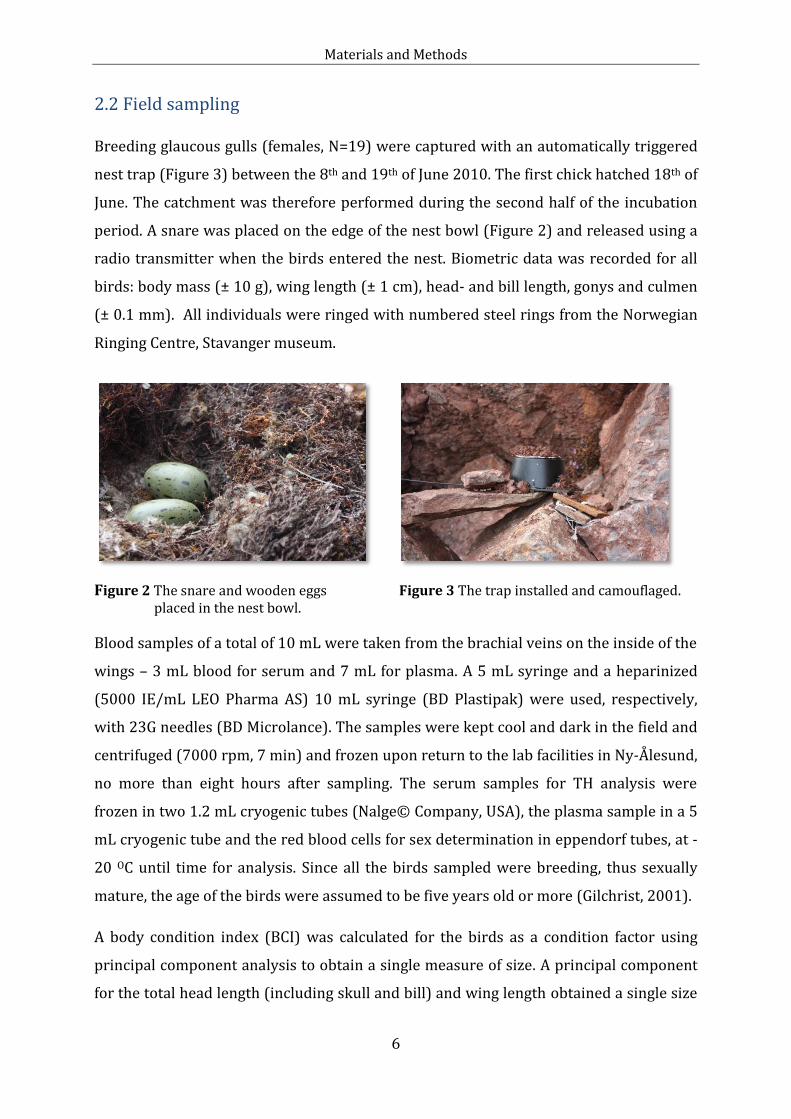
2.2 Field sampling Breeding glaucous gulls (females, N=19) were captured with an automatically triggered
nest trap (Figure 3) between the 8th and 19th of June 2010. The first chick hatched 18th of
June. The catchment was therefore performed during the second half of the incubation
period. A snare was placed on the edge of the nest bowl (Figure 2) and released using a
radio transmitter when the birds entered the nest. Biometric data was recorded for all
birds: body mass (± 10 g), wing length (± 1 cm), head- and bill length, gonys and culmen
(± 0.1 mm). All individuals were ringed with numbered steel rings from the Norwegian
Ringing Centre, Stavanger museum.
Figure 2 The snare and wooden eggs Figure 3 The trap installed and camouflaged. placed in the nest bowl.
Blood samples of a total of 10 mL were taken from the brachial veins on the inside of the
wings – 3 mL blood for serum and 7 mL for plasma. A 5 mL syringe and a heparinized
(5000 IE/mL LEO Pharma AS) 10 mL syringe (BD Plastipak) were used, respectively,
with 23G needles (BD Microlance). The samples were kept cool and dark in the field and
centrifuged (7000 rpm, 7 min) and frozen upon return to the lab facilities in Ny-Ålesund,
no more than eight hours after sampling. The serum samples for TH analysis were
frozen in two 1.2 mL cryogenic tubes (Nalge© Company, USA), the plasma sample in a 5
mL cryogenic tube and the red blood cells for sex determination in eppendorf tubes, at -
20 OC until time for analysis. Since all the birds sampled were breeding, thus sexually
mature, the age of the birds were assumed to be five years old or more (Gilchrist, 2001).
A body condition index (BCI) was calculated for the birds as a condition factor using
principal component analysis to obtain a single measure of size. A principal component
for the total head length (including skull and bill) and wing length obtained a single size
Materials and Methods
7
measure (Jolicoeur and Mosimann, 1960). A linear regression of standardized body mass
residuals (mean=0, SD=1) and the standardized size measure were used to calculate the
BCI.
The approval for this project was given by the Governor of Svalbard (reference number
2010/00093-16), and all sampling and bird-handling were in accordance to current
regulations of the Norwegian Animal Welfare Act.
2.3 Contaminant analysis in glaucous gull plasma The plasma samples were analysed for several OHCs: PCBs, DDTs, chlorinated
pesticides, PBDEs and PFASs. In addition to contaminant analysis, an enzymatic lipid
determination was used to classify the lipid classes present, such as free and total
cholesterol, triglycerides and phospholipids as well as to determine the total lipid
content. DNA, in the form of red blood cells, was used for sex determination, and serum
samples were analysed for TH levels.
The OHC analysis was funded by the Norwegian Polar Institute (NPI) and carried out in
the laboratories at The Norwegian Institute for Air research (NILU) in Tromsø. The sex
determination and TH analysis was funded by and carried out at the Department of
Biology, NTNU (Trondheim, Norway).
2.3.1 Analysis of organochlorinated and brominated compounds: chlorinated
pesticides, PCBs and PBDEs
The glaucous gull plasma samples were quantified for the chlorinated pesticides, PCBs
and PBDEs presented in Table 1. The extraction method used has been previously
described by Herzke et al. (2003).
Materials and Methods
8
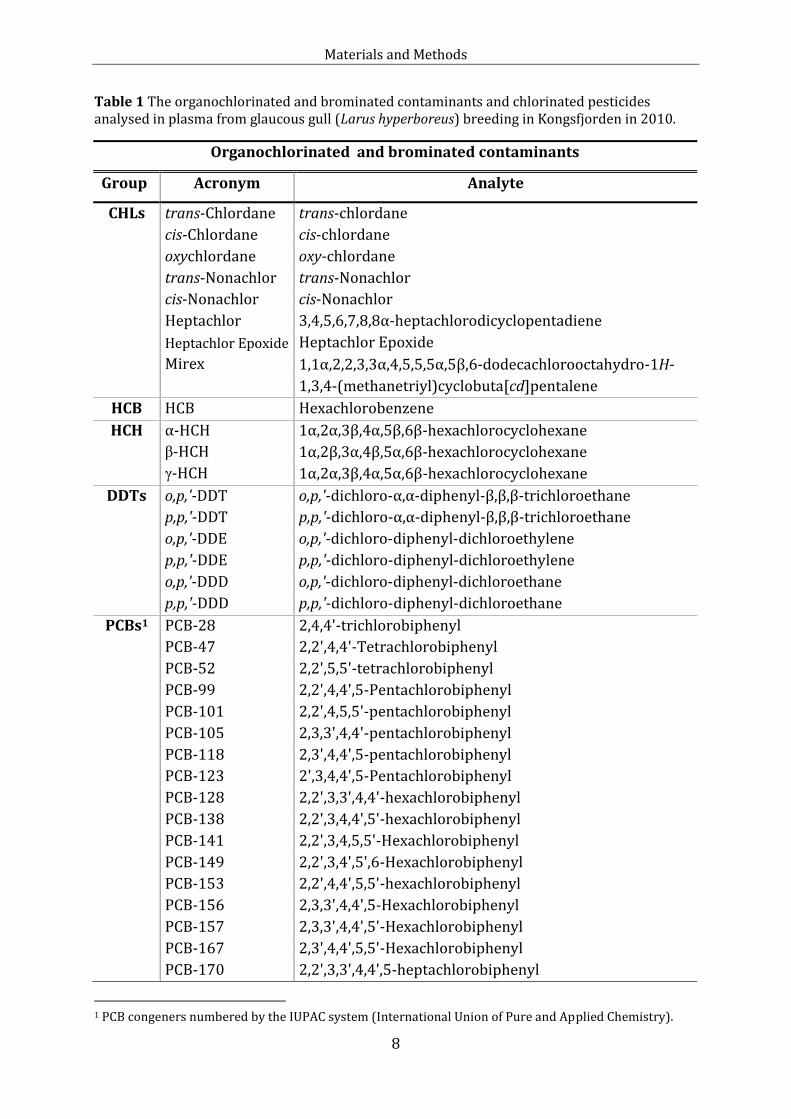
Table 1 The organochlorinated and brominated contaminants and chlorinated pesticides analysed in plasma from glaucous gull (Larus hyperboreus) breeding in Kongsfjorden in 2010.
Organochlorinated and brominated contaminants
Group Acronym Analyte
CHLs trans-Chlordane trans-chlordane
cis-Chlordane cis-chlordane
oxychlordane oxy-chlordane
trans-Nonachlor trans-Nonachlor
cis-Nonachlor cis-Nonachlor
Heptachlor 3,4,5,6,7,8,8α-heptachlorodicyclopentadiene
Heptachlor Epoxide Heptachlor Epoxide
Mirex 1,1α,2,2,3,3α,4,5,5,5α,5β,6-dodecachlorooctahydro-1H-
1,3,4-(methanetriyl)cyclobuta[cd]pentalene
HCB HCB Hexachlorobenzene
HCH α-HCH 1α,2α,3β,4α,5β,6β-hexachlorocyclohexane
β-HCH 1α,2β,3α,4β,5α,6β-hexachlorocyclohexane
γ-HCH 1α,2α,3β,4α,5α,6β-hexachlorocyclohexane
DDTs o,p,'-DDT o,p,'-dichloro-α,α-diphenyl-β,β,β-trichloroethane
p,p,'-DDT p,p,'-dichloro-α,α-diphenyl-β,β,β-trichloroethane
o,p,'-DDE o,p,'-dichloro-diphenyl-dichloroethylene
p,p,'-DDE p,p,'-dichloro-diphenyl-dichloroethylene
o,p,'-DDD o,p,'-dichloro-diphenyl-dichloroethane
p,p,'-DDD p,p,'-dichloro-diphenyl-dichloroethane
PCBs1 PCB-28 2,4,4'-trichlorobiphenyl
PCB-47 2,2',4,4'-Tetrachlorobiphenyl
PCB-52 2,2',5,5'-tetrachlorobiphenyl
PCB-99 2,2',4,4',5-Pentachlorobiphenyl
PCB-101 2,2',4,5,5'-pentachlorobiphenyl
PCB-105 2,3,3',4,4'-pentachlorobiphenyl
PCB-118 2,3',4,4',5-pentachlorobiphenyl
PCB-123 2',3,4,4',5-Pentachlorobiphenyl
PCB-128 2,2',3,3',4,4'-hexachlorobiphenyl
PCB-138 2,2',3,4,4',5'-hexachlorobiphenyl
PCB-141 2,2',3,4,5,5'-Hexachlorobiphenyl
PCB-149 2,2',3,4',5',6-Hexachlorobiphenyl
PCB-153 2,2',4,4',5,5'-hexachlorobiphenyl
PCB-156 2,3,3',4,4',5-Hexachlorobiphenyl
PCB-157 2,3,3',4,4',5'-Hexachlorobiphenyl
PCB-167 2,3',4,4',5,5'-Hexachlorobiphenyl
PCB-170 2,2',3,3',4,4',5-heptachlorobiphenyl
1 PCB congeners numbered by the IUPAC system (International Union of Pure and Applied Chemistry).
Materials and Methods
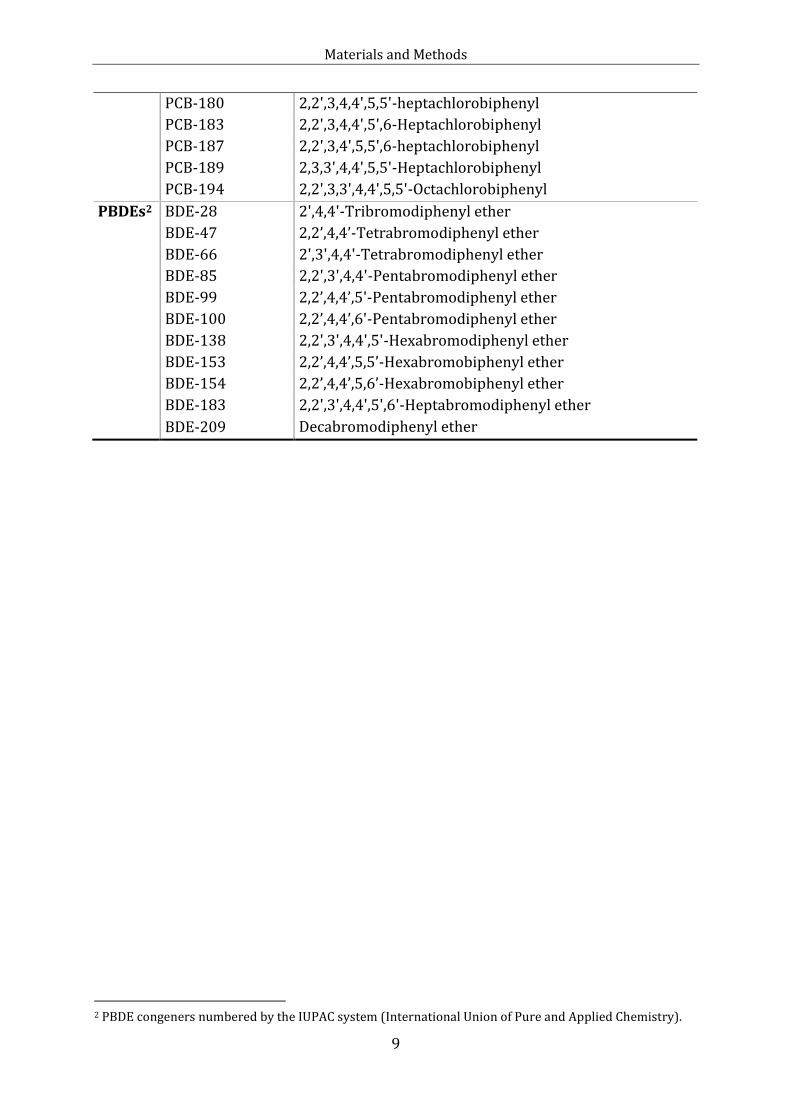
9
PCB-180 2,2',3,4,4',5,5'-heptachlorobiphenyl
PCB-183 2,2',3,4,4',5',6-Heptachlorobiphenyl
PCB-187 2,2',3,4',5,5',6-heptachlorobiphenyl
PCB-189 2,3,3',4,4',5,5'-Heptachlorobiphenyl
PCB-194 2,2',3,3',4,4',5,5'-Octachlorobiphenyl
PBDEs2 BDE-28 2',4,4'-Tribromodiphenyl ether
BDE-47 2,2’,4,4’-Tetrabromodiphenyl ether
BDE-66 2',3',4,4'-Tetrabromodiphenyl ether
BDE-85 2,2',3',4,4'-Pentabromodiphenyl ether
BDE-99 2,2’,4,4’,5'-Pentabromodiphenyl ether
BDE-100 2,2’,4,4’,6'-Pentabromodiphenyl ether
BDE-138 2,2',3',4,4',5'-Hexabromodiphenyl ether
BDE-153 2,2’,4,4’,5,5’-Hexabromobiphenyl ether
BDE-154 2,2’,4,4’,5,6’-Hexabromobiphenyl ether
BDE-183 2,2',3',4,4',5',6'-Heptabromodiphenyl ether
BDE-209 Decabromodiphenyl ether
2 PBDE congeners numbered by the IUPAC system (International Union of Pure and Applied Chemistry).
Materials and Methods
10
Extraction
One mL plasma (homogenized by mixing) (equal to 1 g plasma with a CV%=1.6) was
spiked with 100 µL of internal standard (25 pg/µL) containing mass-labeled OHCs
(Appendix A). Two mL of deionized water – saturated with ammonium sulfate, and 2 mL
of ethanol was added and vortexed to denature proteins. Extraction was conducted
twice using 6 mL n-hexane as solvent. The extract was then up-concentration to 200 µL
using RapidVap (Vacuum Evaporation System Model 7900001, Kansas city, MO, US).
Lipid content was determined by enzymatic determination conducted by UniLab AS
(Tromsø, Norway).
Clean-up
The extracted plasma samples were cleaned-up with activated florisil (magnesium silica,
heated for 8 hours at 450oC) to remove co-extracted biological matrix (i.e.proteins).
Once cool, florisil was packed into individual solid phase extraction (SPE) cartridges
(0.15 – 0.25 mm, Merck, Darmstadt, Germany) with 1 g (± 0.02 g). Concentrated plasma
extracts were loaded onto florisil-packed SPE cartridges using a RapidTrace SPE Work
Station (Caliper Life Science, Hopkinton, USA) and eluted with 9:1 n-hexane:
Dichloromethane (DCM). To help prevent volatilization of the more volatile compounds,
iso-octane was added to all samples after florisil clean-up as a keeper solvent to prevent
evaporation. Samples were then concentrated to 200 µL, followed by gentle stream of
N2. Recovery standard (20 µL) octachloronaphtalene (OCN) 200 pg/µL was added prior
to instrumental quantification on GC-MS. For further details on the extraction and clean-
up, see Herzke et al. (2003).
Instrumental analysis
The organochlorine and brominated contaminants investigated within this study were
analysed by Gas chromatograph – mass spectrometry (GC-MS). This instrumentation
allows for the separation of target compounds based on differences in their volatility
and interactions with the column stationary phase (Harris, 2010). Once separated,
compounds elute from the column where they are ionized within the mass spectrometer
and detected based on their mass/charge ratio (Harris, 2010). Several contaminant
classes were analysed in this analysis, each using different instrumental parameters. The
analysis details for the respective contaminant classes are given below.
Materials and Methods
11
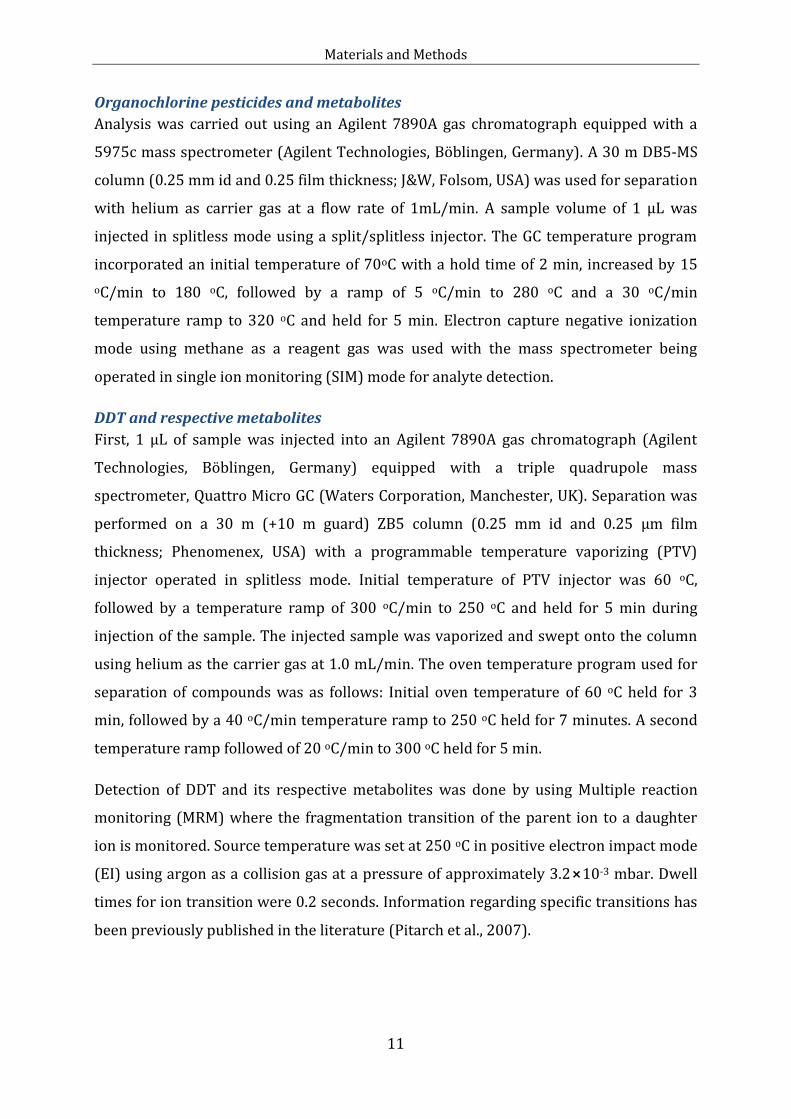
Organochlorine pesticides and metabolites
Analysis was carried out using an Agilent 7890A gas chromatograph equipped with a
5975c mass spectrometer (Agilent Technologies, Böblingen, Germany). A 30 m DB5-MS
column (0.25 mm id and 0.25 film thickness; J&W, Folsom, USA) was used for separation
with helium as carrier gas at a flow rate of 1mL/min. A sample volume of 1 µL was
injected in splitless mode using a split/splitless injector. The GC temperature program
incorporated an initial temperature of 70oC with a hold time of 2 min, increased by 15
oC/min to 180 oC, followed by a ramp of 5 oC/min to 280 oC and a 30 oC/min
temperature ramp to 320 oC and held for 5 min. Electron capture negative ionization
mode using methane as a reagent gas was used with the mass spectrometer being
operated in single ion monitoring (SIM) mode for analyte detection.
DDT and respective metabolites
First, 1 µL of sample was injected into an Agilent 7890A gas chromatograph (Agilent
Technologies, Böblingen, Germany) equipped with a triple quadrupole mass
spectrometer, Quattro Micro GC (Waters Corporation, Manchester, UK). Separation was
performed on a 30 m (+10 m guard) ZB5 column (0.25 mm id and 0.25 µm film
thickness; Phenomenex, USA) with a programmable temperature vaporizing (PTV)
injector operated in splitless mode. Initial temperature of PTV injector was 60 oC,
followed by a temperature ramp of 300 oC/min to 250 oC and held for 5 min during
injection of the sample. The injected sample was vaporized and swept onto the column
using helium as the carrier gas at 1.0 mL/min. The oven temperature program used for
separation of compounds was as follows: Initial oven temperature of 60 oC held for 3
min, followed by a 40 oC/min temperature ramp to 250 oC held for 7 minutes. A second
temperature ramp followed of 20 oC/min to 300 oC held for 5 min.
Detection of DDT and its respective metabolites was done by using Multiple reaction
monitoring (MRM) where the fragmentation transition of the parent ion to a daughter
ion is monitored. Source temperature was set at 250 oC in positive electron impact mode
(EI) using argon as a collision gas at a pressure of approximately 3.2⨯10-3 mbar. Dwell
times for ion transition were 0.2 seconds. Information regarding specific transitions has
been previously published in the literature (Pitarch et al., 2007).
Materials and Methods
12
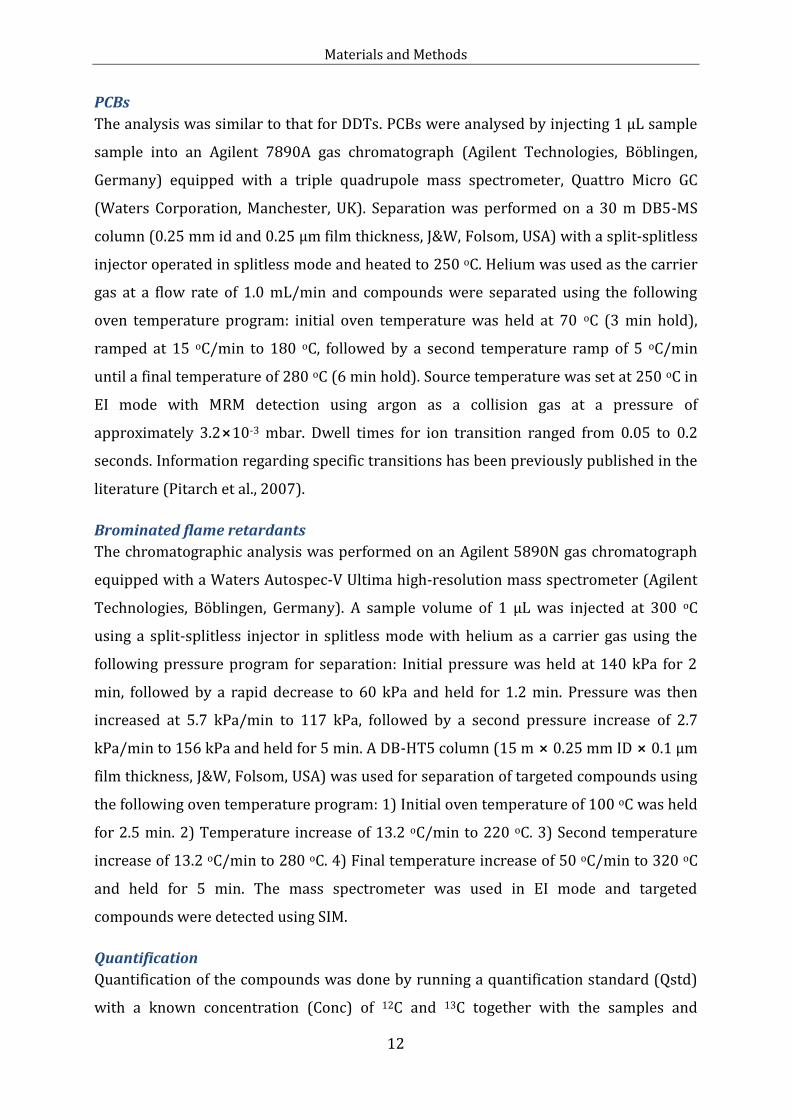
PCBs
The analysis was similar to that for DDTs. PCBs were analysed by injecting 1 µL sample
sample into an Agilent 7890A gas chromatograph (Agilent Technologies, Böblingen,
Germany) equipped with a triple quadrupole mass spectrometer, Quattro Micro GC
(Waters Corporation, Manchester, UK). Separation was performed on a 30 m DB5-MS
column (0.25 mm id and 0.25 µm film thickness, J&W, Folsom, USA) with a split-splitless
injector operated in splitless mode and heated to 250 oC. Helium was used as the carrier
gas at a flow rate of 1.0 mL/min and compounds were separated using the following
oven temperature program: initial oven temperature was held at 70 oC (3 min hold),
ramped at 15 oC/min to 180 oC, followed by a second temperature ramp of 5 oC/min
until a final temperature of 280 oC (6 min hold). Source temperature was set at 250 oC in
EI mode with MRM detection using argon as a collision gas at a pressure of
approximately 3.2⨯10-3 mbar. Dwell times for ion transition ranged from 0.05 to 0.2
seconds. Information regarding specific transitions has been previously published in the
literature (Pitarch et al., 2007).
Brominated flame retardants
The chromatographic analysis was performed on an Agilent 5890N gas chromatograph
equipped with a Waters Autospec-V Ultima high-resolution mass spectrometer (Agilent
Technologies, Böblingen, Germany). A sample volume of 1 µL was injected at 300 oC
using a split-splitless injector in splitless mode with helium as a carrier gas using the
following pressure program for separation: Initial pressure was held at 140 kPa for 2
min, followed by a rapid decrease to 60 kPa and held for 1.2 min. Pressure was then
increased at 5.7 kPa/min to 117 kPa, followed by a second pressure increase of 2.7
kPa/min to 156 kPa and held for 5 min. A DB-HT5 column (15 m ⨯ 0.25 mm ID ⨯ 0.1 µm
film thickness, J&W, Folsom, USA) was used for separation of targeted compounds using
the following oven temperature program: 1) Initial oven temperature of 100 oC was held
for 2.5 min. 2) Temperature increase of 13.2 oC/min to 220 oC. 3) Second temperature
increase of 13.2 oC/min to 280 oC. 4) Final temperature increase of 50 oC/min to 320 oC
and held for 5 min. The mass spectrometer was used in EI mode and targeted
compounds were detected using SIM.
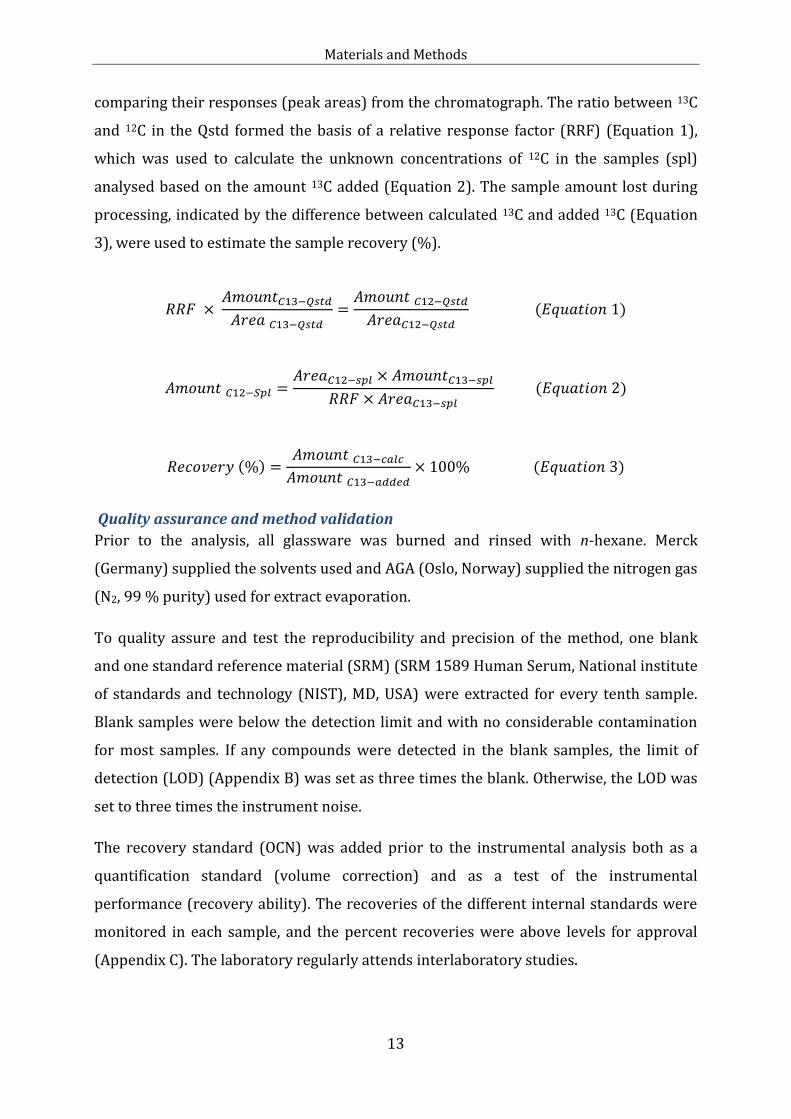
Quantification
Quantification of the compounds was done by running a quantification standard (Qstd)
with a known concentration (Conc) of 12C and 13C together with the samples and
Materials and Methods
13
comparing their responses (peak areas) from the chromatograph. The ratio between 13C
and 12C in the Qstd formed the basis of a relative response factor (RRF) (Equation 1),
which was used to calculate the unknown concentrations of 12C in the samples (spl)
analysed based on the amount 13C added (Equation 2). The sample amount lost during
processing, indicated by the difference between calculated 13C and added 13C (Equation
3), were used to estimate the sample recovery (%).
Quality assurance and method validation
Prior to the analysis, all glassware was burned and rinsed with n-hexane. Merck
(Germany) supplied the solvents used and AGA (Oslo, Norway) supplied the nitrogen gas
(N2, 99 % purity) used for extract evaporation.
To quality assure and test the reproducibility and precision of the method, one blank
and one standard reference material (SRM) (SRM 1589 Human Serum, National institute
of standards and technology (NIST), MD, USA) were extracted for every tenth sample.
Blank samples were below the detection limit and with no considerable contamination
for most samples. If any compounds were detected in the blank samples, the limit of
detection (LOD) (Appendix B) was set as three times the blank. Otherwise, the LOD was
set to three times the instrument noise.
The recovery standard (OCN) was added prior to the instrumental analysis both as a
quantification standard (volume correction) and as a test of the instrumental
performance (recovery ability). The recoveries of the different internal standards were
monitored in each sample, and the percent recoveries were above levels for approval
(Appendix C). The laboratory regularly attends interlaboratory studies.
Materials and Methods
14
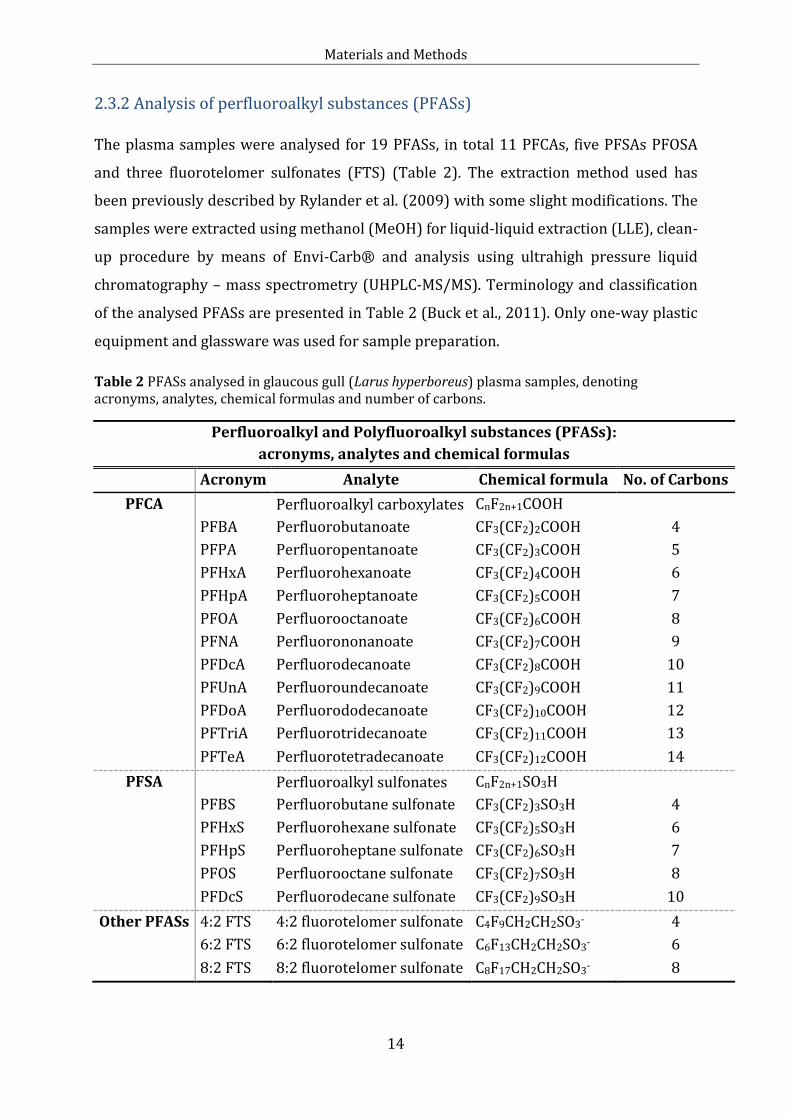
2.3.2 Analysis of perfluoroalkyl substances (PFASs)
The plasma samples were analysed for 19 PFASs, in total 11 PFCAs, five PFSAs PFOSA
and three fluorotelomer sulfonates (FTS) (Table 2). The extraction method used has
been previously described by Rylander et al. (2009) with some slight modifications. The
samples were extracted using methanol (MeOH) for liquid-liquid extraction (LLE), clean-
up procedure by means of Envi-Carb® and analysis using ultrahigh pressure liquid
chromatography – mass spectrometry (UHPLC-MS/MS). Terminology and classification
of the analysed PFASs are presented in Table 2 (Buck et al., 2011). Only one-way plastic
equipment and glassware was used for sample preparation.
Table 2 PFASs analysed in glaucous gull (Larus hyperboreus) plasma samples, denoting acronyms, analytes, chemical formulas and number of carbons.
Perfluoroalkyl and Polyfluoroalkyl substances (PFASs):
acronyms, analytes and chemical formulas
Acronym Analyte Chemical formula No. of Carbons
PFCA
Perfluoroalkyl carboxylates CnF2n+1COOH
PFBA Perfluorobutanoate CF3(CF2)2COOH 4
PFPA Perfluoropentanoate CF3(CF2)3COOH 5
PFHxA Perfluorohexanoate CF3(CF2)4COOH 6
PFHpA Perfluoroheptanoate CF3(CF2)5COOH 7
PFOA Perfluorooctanoate CF3(CF2)6COOH 8
PFNA Perfluorononanoate CF3(CF2)7COOH 9
PFDcA Perfluorodecanoate CF3(CF2)8COOH 10
PFUnA Perfluoroundecanoate CF3(CF2)9COOH 11
PFDoA Perfluorododecanoate CF3(CF2)10COOH 12
PFTriA Perfluorotridecanoate CF3(CF2)11COOH 13
PFTeA Perfluorotetradecanoate CF3(CF2)12COOH 14
PFSA
Perfluoroalkyl sulfonates CnF2n+1SO3H
PFBS Perfluorobutane sulfonate CF3(CF2)3SO3H 4
PFHxS Perfluorohexane sulfonate CF3(CF2)5SO3H 6
PFHpS Perfluoroheptane sulfonate CF3(CF2)6SO3H 7
PFOS Perfluorooctane sulfonate CF3(CF2)7SO3H 8
PFDcS Perfluorodecane sulfonate CF3(CF2)9SO3H 10
Other PFASs 4:2 FTS 4:2 fluorotelomer sulfonate C4F9CH2CH2SO3- 4
6:2 FTS 6:2 fluorotelomer sulfonate C6F13CH2CH2SO3- 6
8:2 FTS 8:2 fluorotelomer sulfonate C8F17CH2CH2SO3- 8
Materials and Methods
15
Extraction
The plasma sample was homogenized by mixing and a volume of 200 µL was spiked
with 20 µL internal standard. The standard consists of a mixture of 13C analogues of
PFASs (0.1 ng/µL) (Appendix D). Finally, 1 mL MeOH was added before 3 x 10 minutes
extraction in the ultrasonic bath (Branson 2210).
Clean-up
The methanol supernatant was transferred to eppendorf centrifuge tubes containing 25
mg ENVI-Carb graphitized carbon adsorbent (Supelclean ENVI-Carb® 120/400, Supelco,
Bellefonte, PA, USA) and 50 µL glacial acetic acid. This clean-up will assure the removal
of matrix, e.g. proteins, in the samples prior to UHPLC-MS/MS analysis. After
centrifugation (10 000 rpm, 10 min), 500 µL of the supernatant was transferred to a
glass vial. As a control parameter for the clean-up precision, 20 µL of recovery standard
was added (branched PFDcA 0.1 ng/µL in MeOH), vortexed and kept in the fridge at
approximately 3 oC until analysis.
Instrumental analysis
An aliquot of 100 µL extract was transferred to an autosampler vial with insert and
diluted with the same amount of 2 mM aqueous NH4OAc. PFASs were analysed by ultra-
high pressure liquid chromatography triple-quadrupole mass spectrometry (UHPLC-
MS/MS). Analysis was performed on a Thermo Scientific quaternary Accela 1250 pump
with a PAL Sample Manager coupled to a Thermo Scientific Vantage MS/MS (Vantage
TSQ). An injection volume of 10 µL was used for sample separation on a Waters Acquity
UPLC HSS 3T column (2.1 ⨯100 mm, 1.8 µm) equipped with a Waters Van guard HSS T3
guard column (2.1 ⨯ 5 mm, 1.8 µm). In order to separate the PFCA contamination
leaching out from the pump and the degasser, a Waters XBridge C18 column (2.1 ⨯ 50
mm, 5 µm) was installed after the pump and before the injector.
Separation was achieved using 2 mM NH4OAc in 90:10 MeOH:water (A) and 2 mM
methanolic NH4OAc (B) as the mobile phases. Details about the analytical conditions are
given in Hanssen et al. (2011) together with parent ions, monitored transitions and
conditions on S-linse and collision energy.
Quantification
The chromatograms were quantified for PFASs using the LCQuan software (version 2.6,
Thermo Scientific). Quantification was done with the internal standard method with
Materials and Methods
16
isotope labeled PFASs. An eight point calibration curve with a concentration range from
0.02 pg/µL to 10 pg/µL was used for quantification of PFASs.
Quality assurance and method validation
During analysis, solvent injections were done regularly in order to monitor instrument
background and carry-over effects. To test cross-contamination as well as
reproducibility and precision during the analysis, one blank sample and one sample
certified reference material (SRM; 1589 human serum, National institute of standards
and technology (NIST), MD, USA) were included for every tenth sample. The LOD was set
to three times the instrument noise. If any compounds were detected in the blank
samples, the limit of detection (LOD; Table E.1) was set as three times the median of the
blank samples. Recoveries of the different internal standards were monitored in each
sample, and the percent recoveries were above levels for approval (Table F.1).
The contaminant results are denoted in ng/g wet weight, since this exposure
concentration is thought to be most relevant for effect studies where several classes of
OHCs are included, such as in the present study (Braathen et al., 2004).
The laboratory regularly participates in interlaboratory testing.
2.4 Lipid analysis The plasma lipid content was analysed at UniLab AS in Tromsø using enzymatic
determination. The total lipid (TL) content was calculated from the amounts of free
cholesterol (FC), total cholesterol (TC), triglycerides (TG) and phospholipids (PL) using
equation 4 (Akins et al., 1989). The enzymatic determination is considered more
accurate than gravimetric lipid determination (Covaci et al., 2006). The results in mg/dl
were converted to lipid percentage per wet weight (ww) sample.
TL = 1.677 x (TC – FC) + FC + TG + PL (Equation 4)
Quality assurance and method validation
UniLab AS notified that the results and validations met the requirements set by the
laboratory, although data on the variation and precision is not further presented here.
Materials and Methods
17
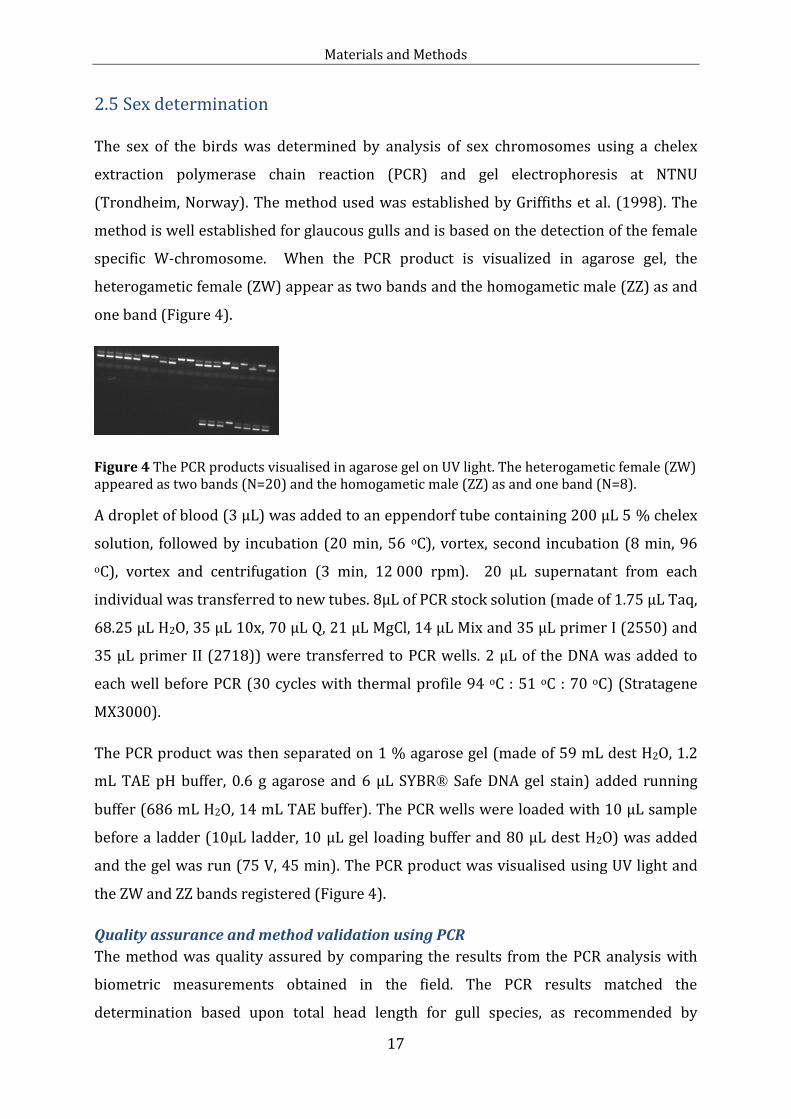
2.5 Sex determination The sex of the birds was determined by analysis of sex chromosomes using a chelex
extraction polymerase chain reaction (PCR) and gel electrophoresis at NTNU
(Trondheim, Norway). The method used was established by Griffiths et al. (1998). The
method is well established for glaucous gulls and is based on the detection of the female
specific W-chromosome. When the PCR product is visualized in agarose gel, the
heterogametic female (ZW) appear as two bands and the homogametic male (ZZ) as and
one band (Figure 4).
Figure 4 The PCR products visualised in agarose gel on UV light. The heterogametic female (ZW) appeared as two bands (N=20) and the homogametic male (ZZ) as and one band (N=8).
A droplet of blood (3 µL) was added to an eppendorf tube containing 200 µL 5 % chelex
solution, followed by incubation (20 min, 56 oC), vortex, second incubation (8 min, 96
oC), vortex and centrifugation (3 min, 12 000 rpm). 20 µL supernatant from each
individual was transferred to new tubes. 8µL of PCR stock solution (made of 1.75 µL Taq,
68.25 µL H2O, 35 µL 10x, 70 µL Q, 21 µL MgCl, 14 µL Mix and 35 µL primer I (2550) and
35 µL primer II (2718)) were transferred to PCR wells. 2 µL of the DNA was added to
each well before PCR (30 cycles with thermal profile 94 oC : 51 oC : 70 oC) (Stratagene
MX3000).
The PCR product was then separated on 1 % agarose gel (made of 59 mL dest H2O, 1.2
mL TAE pH buffer, 0.6 g agarose and 6 µL SYBR® Safe DNA gel stain) added running
buffer (686 mL H2O, 14 mL TAE buffer). The PCR wells were loaded with 10 µL sample
before a ladder (10µL ladder, 10 µL gel loading buffer and 80 µL dest H2O) was added
and the gel was run (75 V, 45 min). The PCR product was visualised using UV light and
the ZW and ZZ bands registered (Figure 4).
Quality assurance and method validation using PCR
The method was quality assured by comparing the results from the PCR analysis with
biometric measurements obtained in the field. The PCR results matched the
determination based upon total head length for gull species, as recommended by
Materials and Methods
18
Coulson et al. (1983). None of the bands were vague, so the uncertainty was
insignificant.
2.6 Determination of thyroid hormone levels in glaucous gull serum The thyroid hormone analysis was carried out using radioimmunoassay (RIA) Coat-A-
Count® TT4, FT4, TT3 and FT3 kits (Siemens medical solution, Diagnostics, Los Angeles,
CA, USA) at NTNU (Trondheim, Norway). The kit is a solid-phase 125I radioimmunoassay
designed to quantitatively measure the TH levels in serum to assess the thyroid status.
Briefly, the method is based on competitive binding between sample THs (T3, T4) and
radioactive 125I labeled THs (T3*, T4*) in pre-coated antibody tubes. A calibration curve
of known concentrations makes quantification of bound 125I labeled THs possible
(Sigmond et al., 1992). The RIA is of the most sensitive and accurate techniques for this
purpose and have been in common use for analyzing avian THs since late 1970s
(McNabb, 2000).
Serum samples were thawed upon analysis and added to the coated tubes. Four
fractions of thyroid hormones were analysed; the total and free (unbound) thyroxin
(TT4 and FT4) and total and free triiodothyronine (TT3 and FT3) and the detection limits
were 309 nmol/L, 129 pmol/L, 9.22 nmol/L and 65 pmol/L, respectively. The kits
procedures were followed and the method is well established and can be extrapolated to
birds (McNabb, 2000; Verreault et al., 2004).
The bound radioactive TH antigen fraction was counted using a gamma scintillation
counter (Cobra Auto Gamma, model 5003, Packard Instrument Company, Dowers grove,
IL, USA). A calibration curve made of known concentrations and the gamma software
were used to calculate the TH concentrations in the samples.
The results were obtained for all glaucous gulls – except for one female (number 13),
which were omitted from further presentation and statistics.
Quality assurance and method validation using RIA
The repeatability and inter- and intra assay precision was tested for each kit by running
duplicates of SRM human serum controls (Immunoassay Plus Control level 2, Biorad
Laboratories, CA, USA), the laboratories own quality control bovine (Bos primigenius)
plasma samples and triplicates (for TT4 and FT4) and duplicates (TT3 and FT3) of
Materials and Methods
19
glaucous gull serum. Readings with coefficient of variation (CV) >15 % were not
approved and reruns performed. According to the laboratories control routines, a range
limit of 15 % was set. Thus, one female bird was removed from further analysis,
resulting in a total of 19 female glaucous gulls presented in this study and included in
statistics.
The blank samples were below LOD, and the range of the results and CV% met the
requirements established by the laboratory. The CV% values of the reference material
were below 15 % for both the intra- and inter-assay precision tests for TT4 (<4.5 %),
FT4 (<12.8 %), TT3 (<6.3 %) and FT3 (<13.9 %). For TT4 sample triplicates, CV%
ranged from 0.8 – 13.7 %. For FT4 sample triplicates, CV% ranged from 1.9-14.6 %. For
TT3 sample replicates, CV% ranged from 0.1-7.8 %. For FT3 sample replicates, CV%
ranged from 0.2-26.3 %. Due to the low concentration range of FT3, the CV% exceeded
15 % for four of the FT3 samples (15.9-26.3 %). This might be a result of the FT3 were
run in duplicates instead of triplicates. The concentrations in these individuals did not
differ considerably from the other samples, a correlation test revealed these samples
correlated with the TT3 values (p<0.001, r=0.858) as for the other samples. When
calculating the relative error the two replicates did not differ more than ±19 % to the
mean. Values in the lower part of the standard curve are important to include in the data
set, despite that CV% ≥15. The difference between the two replicates with CV%=26.3
constitute of only/amount to 0.46 pmol, which result in the bigger CV% for low FT3
concentrations. Therefore, the mean concentration was considered acceptable to use
and TH results from 19 females were included in the multivariate data analysis.
2.7 Statistics
Software
SIMCA P12+ (Version 12.0.0, Umetrics, Umeå, Sweden) and SPSS Statistical software
(Version 19.0 for Windows, IBM, SPSS Inc., Chicago, IL) were used for the multivariate
data analysis. Calculations were performed using Microsoft Excel for Windows 2010.
Statistical significance was set at p ≤ 0.05, with a borderline significance p=0.5–0.75.
Normal distribution
Data were analysed for normality distribution using Shapiro-Wilk’s test (n≤50) in SPSS
19. Variables that were not normally distributed were log10 transformed. This applied
Materials and Methods
20
for the following variables: Capture date, number of eggs, TT3, β-HCH, oxychlordane,
trans-nonachlor, mirex, p,p’-DDT, p,p’-DDE, PCB congeners (PCB)-28/31, -47, -52, -74, -
99, -105, -128, -138, -149, -153, -156, -167, -170, -180, -183, -187, -189, -194, each and
all of the PFASs and PBDEs (except BDE-153), and all the contaminant sums (Σ). All
variables were normally distributed either with no transformation or log10, except for
the PFASs. Due to some extreme outliers according to the SPSS software description
among the PFSAs PFOS (min-max 3.5 – 429.8 ng/g ww) and PFHxS (0.3 – 27 ng/g ww),
these were not normally distributed before the two outliers were excluded. The current
extreme outliers achieved the criteria for extreme outliers in SPSS and all regressions
were tested both with and without the two extreme outlying samples.
Detected compounds were analysed in statistics as individual compounds and
congeners, in addition to summed concentrations, indicated with the symbol Σ. This
denotes for ΣCHLs3, ΣHCH4, ΣDDTs5, ΣPCBs6, Σdl-PCBs7, ΣPBDEs8 and ΣPFASs9.
Statistical treatment of values <Limit of detection (LOD)
All compounds detected in more than 70 % of samples (70 % > LOD) were included in
the statistical analysis. Samples <LOD were set to ½LOD for further use in statistics.
Limit of quantification (LOQ) was set to 3xLOD. Sample concentrations <LOQ were set to
½LOQ. Individual LODs for OCP/PCB/PBDE are presented in Table B.1, and for PFASs in
Table E.2 in Appendix.
Based upon the above criteria, statistical exclusion applied for the following compounds:
the pesticides α-HCH, γ-HCH, Heptachlor, cis-chlordane, o,p’-DDT, o,p’-DDD, p,p’-DDD,
o,p’-DDE, the PBDE congeners (IUPAC numbers) BDE-85, -138, -183 and -209, and the
PFASs PFBA, PFPA, PFHpA, PFHxA, PFOA, PFBS, PFDcS, 4:2 FTS, 6:2 FTS, 8:2 FTS and
PFOSA.
3 ΣCHLs include trans-Chlordane, oxychlordane, trans-nonachlor, cis-nonachlor and mirex.
4 ΣHCH include β-HCH.
5 ΣDDTs include o,p’-DDT and o,p’-DDE.
6 ΣPCBs include the 22 PCB congeners (PCB)-28/31, -47, -52, -66, -74, -99, -101, -105, -118, -128, -138, -
149, -153, -156, -157, -167, -170, -180, -183, -187, -189 and -194.
7 Σdl-PCBs include the six congeners (PCB)-105, -118, -156, -157, -167 and -189.
8 ΣPBDEs include the congeners (BDE)-28, -47, -66, -99, -100, -153 and -154.
9 ΣPFASs include PFNA, PFDcA, PFUnA, PFDoA, PFTria, PFTeA PFHxS and PFOS.
Materials and Methods
21
The lipid percent was calculated and used in the data analysis. Results were obtained
from all analysis (contaminants and THs most importantly) for the 19 females included
in the statistics. Total head length was included as a biometric variable, and the BCI was
included as a condition factor.
Principal component analysis (PCA)
In Simca P12+, Principal component analysis (PCA) was applied to explore the
similarities and differences between observations and identify the variables that made
samples different. In a PCA plot, the variables included are transformed to a dataset of
uncorrelated variables orthogonally projected on each other (Eriksson et al., 2006). The
variables are unit variance (UV) scaled, so that their contribution to the final model is
equal, independent of their absolute values. In addition, the variables are mean centered
(the mean value is subtracted) to increase the models interpretability (Eriksson et al.,
2006). A critical validation of the PCA is essential. This is performed with respect to
explained variance of each of the principal components and the models goodness of
prediction. Significant PCs have eigenvalues>1. BCI or Σ was not included in the PCA to
avoid strong covariations.
Pearson correlation tests
A Pearson correlation test was used to further investigate and confirm or invalidate the
indications from the PCA plot. A significance level of p<0.05 and a borderline
significance of p=0.05-0.075 was set when investigating the relationships between the
THs and explanatory variables in SPSS. Correlations are expressed using the Pearson
correlation coefficient r.
OPLS – Orthogonal projection to latent structures regression
When the explanatory variables show a high degree of multicolinearity, like in the
present dataset, orthogonal projections to latent structures (OPLS) regression can be
done using Simca P12+. This is a statistical tool designed to perform multiple regression
when the number of observations are somehow limited and there is a high degree of co-
linearity, such as in the present dataset. This multiple regression method can assess the
relationships (positive or negative) between the THs and the most important predictor
variables. Further, it may identify combined effects from OHCs on THs. Therefore, the
OPLS complements the statistical series and may detect relationships when several
explanatory variables affect the model, not displayed by a PCA or bivariate test. The
Materials and Methods
22
indications from the PCA and correlation test were used to select a group of explanatory
variables included in the OPLS, to see if significant OPLS regression models could be
obtained for any of the THs.
According to Trygg and Wold (2002), the OPLS and PLS is a better tool than multiple
regression when handling data with a high degree of colinearity and noise in X and Y
matrix. What separates the OPLS from the precursor PLS, is that an OPLS separates the
variation in predictor variable X into variation which is correlating and non-correlating
(orthogonal [900]) with the variation in response variable Y. An OPLS is critical validated
with respect to R2X (explained variance) and R2Y (goodness of fit), and a high goodness
of prediction (Q2) is essential. R2Y >0.7 and a Q2>0.4 denote highly significant models
when analyzing biological data (Lundstedt et al., 1998). “Variable importance in
projection” (VIP) plots denote the importance of each X variable in the predicted model
and rank them in their explanatory power of Y. Combined with Coefficient plots with
jack-knifed confidence intervals, one can identify both the important and significant
model predictors. VIP values >1 are the most relevant variables explaining the Y. An
“Analysis of variance of the cross-validated residuals” (CV-ANOVA) test the significance
of the OPLS regression.
For the THs where significant OPLS models could not be obtained, a multiple linear
regression was performed between the THs and the most correlated variables. This was
performed in the default enter method in SPSS to examine the possible multicolinearity.
The aim for the OPLS and multiple regressions was to investigate the combined effects
from POPs on THs.
23
3 RESULTS
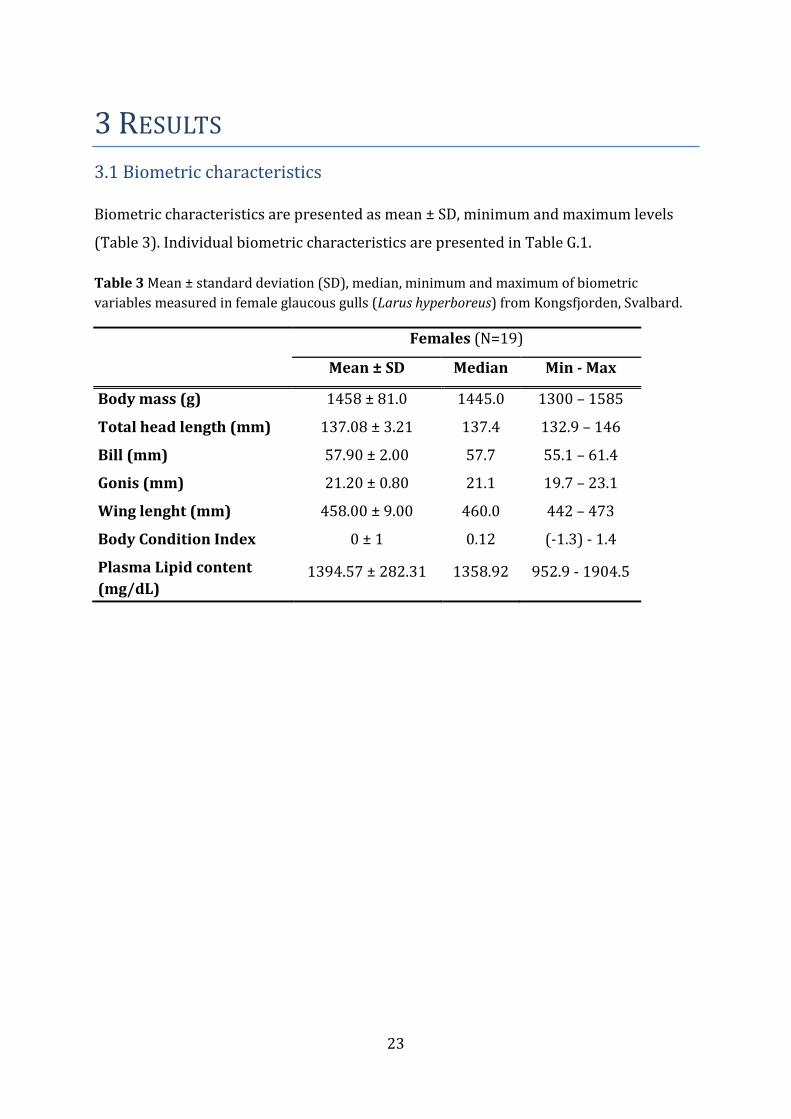
3.1 Biometric characteristics Biometric characteristics are presented as mean ± SD, minimum and maximum levels
(Table 3). Individual biometric characteristics are presented in Table G.1.
Table 3 Mean ± standard deviation (SD), median, minimum and maximum of biometric
variables measured in female glaucous gulls (Larus hyperboreus) from Kongsfjorden, Svalbard.
Females (N=19)
Mean ± SD Median Min - Max
Body mass (g) 1458 ± 81.0 1445.0 1300 – 1585
Total head length (mm) 137.08 ± 3.21 137.4 132.9 – 146
Bill (mm) 57.90 ± 2.00 57.7 55.1 – 61.4
Gonis (mm) 21.20 ± 0.80 21.1 19.7 – 23.1
Wing lenght (mm) 458.00 ± 9.00 460.0 442 – 473
Body Condition Index 0 ± 1 0.12 (-1.3) - 1.4
Plasma Lipid content
(mg/dL) 1394.57 ± 282.31 1358.92 952.9 - 1904.5
Results
24
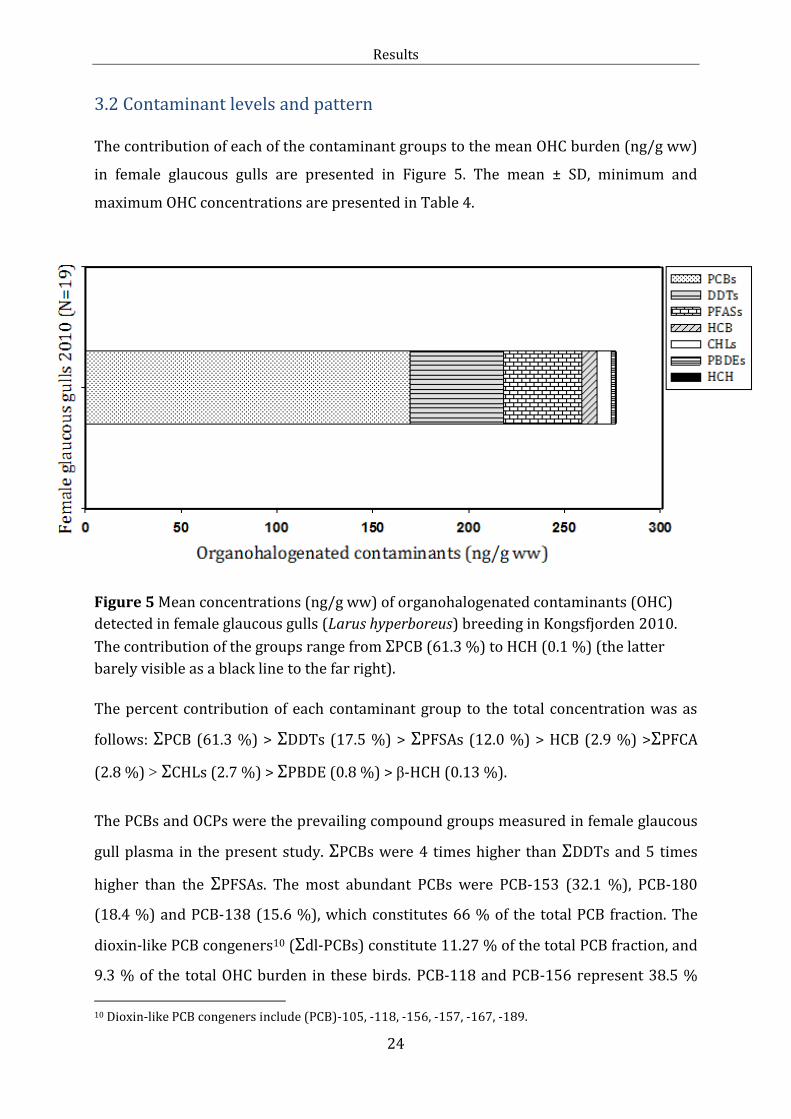
3.2 Contaminant levels and pattern The contribution of each of the contaminant groups to the mean OHC burden (ng/g ww)
in female glaucous gulls are presented in Figure 5. The mean ± SD, minimum and
maximum OHC concentrations are presented in Table 4.
Figure 5 Mean concentrations (ng/g ww) of organohalogenated contaminants (OHC)
detected in female glaucous gulls (Larus hyperboreus) breeding in Kongsfjorden 2010.
The contribution of the groups range from ΣPCB (61.3 %) to HCH (0.1 %) (the latter
barely visible as a black line to the far right).
The percent contribution of each contaminant group to the total concentration was as
follows: ΣPCB (61.3 %) > ΣDDTs (17.5 %) > ΣPFSAs (12.0 %) > HCB (2.9 %) >ΣPFCA
(2.8 %) > ΣCHLs (2.7 %) > ΣPBDE (0.8 %) > β-HCH (0.13 %).
The PCBs and OCPs were the prevailing compound groups measured in female glaucous
gull plasma in the present study. ΣPCBs were 4 times higher than ΣDDTs and 5 times
higher than the ΣPFSAs. The most abundant PCBs were PCB-153 (32.1 %), PCB-180
(18.4 %) and PCB-138 (15.6 %), which constitutes 66 % of the total PCB fraction. The
dioxin-like PCB congeners10 (Σdl-PCBs) constitute 11.27 % of the total PCB fraction, and
9.3 % of the total OHC burden in these birds. PCB-118 and PCB-156 represent 38.5 %
10 Dioxin-like PCB congeners include (PCB)-105, -118, -156, -157, -167, -189.
Results
25
and 36.5 % of the Σdl-PCBs, respectively. The ΣDDTs was the second largest OHC group,
whereas the metabolite p,p’-DDE made up 99.5 % of the DDT group (Table 4 below). The
levels of HCB, ΣPFCA, ΣCHL, ΣPBDE and HCH all contributed <2.9 % to the total
contaminant burden which were low compared to the other groups of OHCs.
The ΣPFASs11 represented the third most abundant contaminant group in the present
study. They constituted 14.8 % of the compound burden in female glaucous gulls. Mean
PFAS plasma concentrations ± SD, median, minimum and maximum are presented in
Table 4. Of the 15 PFASs analysed in the plasma, 11 were detected and eight of these
analytes had 70 % >LOD. PFOS, PFUnA, PFHxS, PFTriA, PFNA, PFDcA, PFDoA, PFTeA,
PFOA, PFBS, PFDcS were detected in all individuals. The short chain PFCAs (PFBA, PFPA,
PFHxA and PFHpA) were not detected in any of the glaucous gull samples. The eight
PFAS with 70 % >LOD contributed to ΣPFASs as follows: PFOS (76.3 %) > PFUnA (6.04
%) > PFHxS (5.2 %) > PFTriA (4.3 %) > PFNA (3.8 %) > PFDcA (2.0 %) > PFDoA (1.5 %)
> PFTeA (0.95 %). The highest PFAS concentration measured in all samples was PFOS,
followed by PFHxS. These two compounds constitute 81.5 % of the total PFAS burden in
glaucous gulls from the present study. Even though the levels of the two PFSAs were in
general higher than the PFCA concentrations, the PFCAs showed greater potency
regarding effects on THs.
ΣPBDE and ΣHCH was the smallest OHC fractions and represent < 1 % of the total
contaminant burden in the female glaucous gulls in the present study. The individual
PBDE congeners contributed to ΣPBDE as follows: BDE-47 (63 %) > BDE-100 (12.6 %) >
BDE-153 (8.4 %) > BDE-99 (8.1 %) > BDE-154 (6.6 %) > BDE-28 (0.89 %) > BDE-66
(0.45 %). β-HCH was the only HCH detected.
11 ΣPFASs include both PFCAs and PFSAs.
Results
26
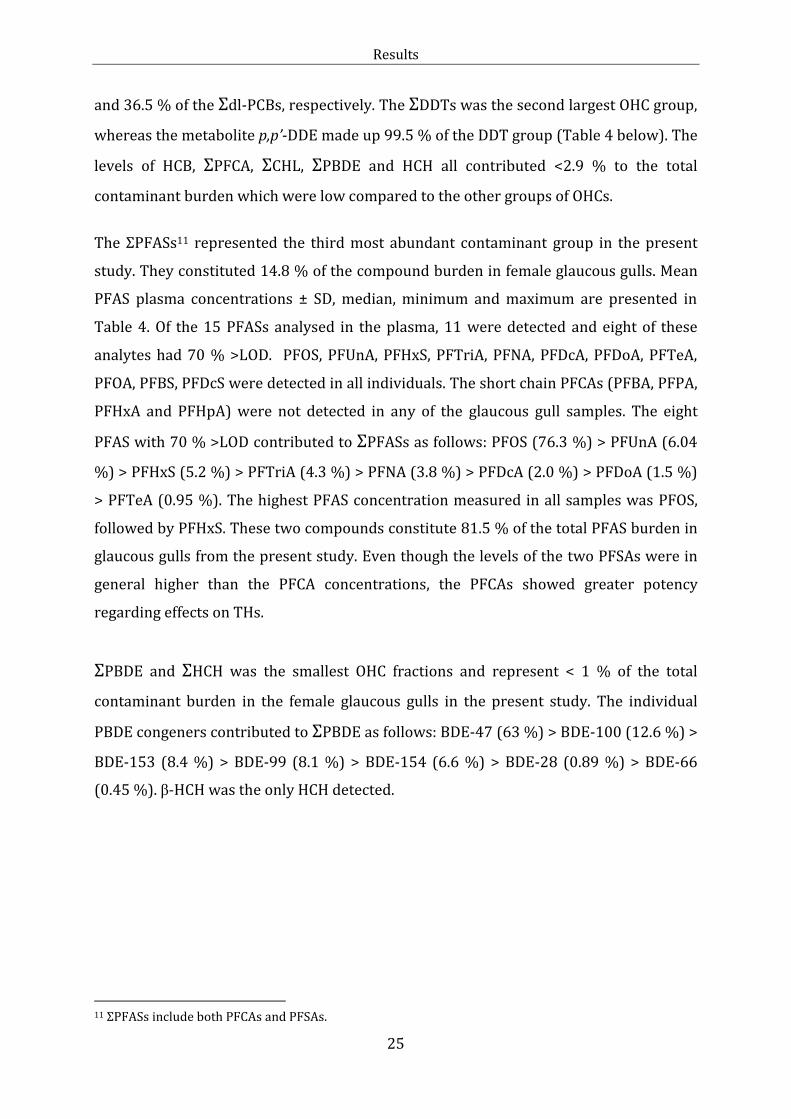
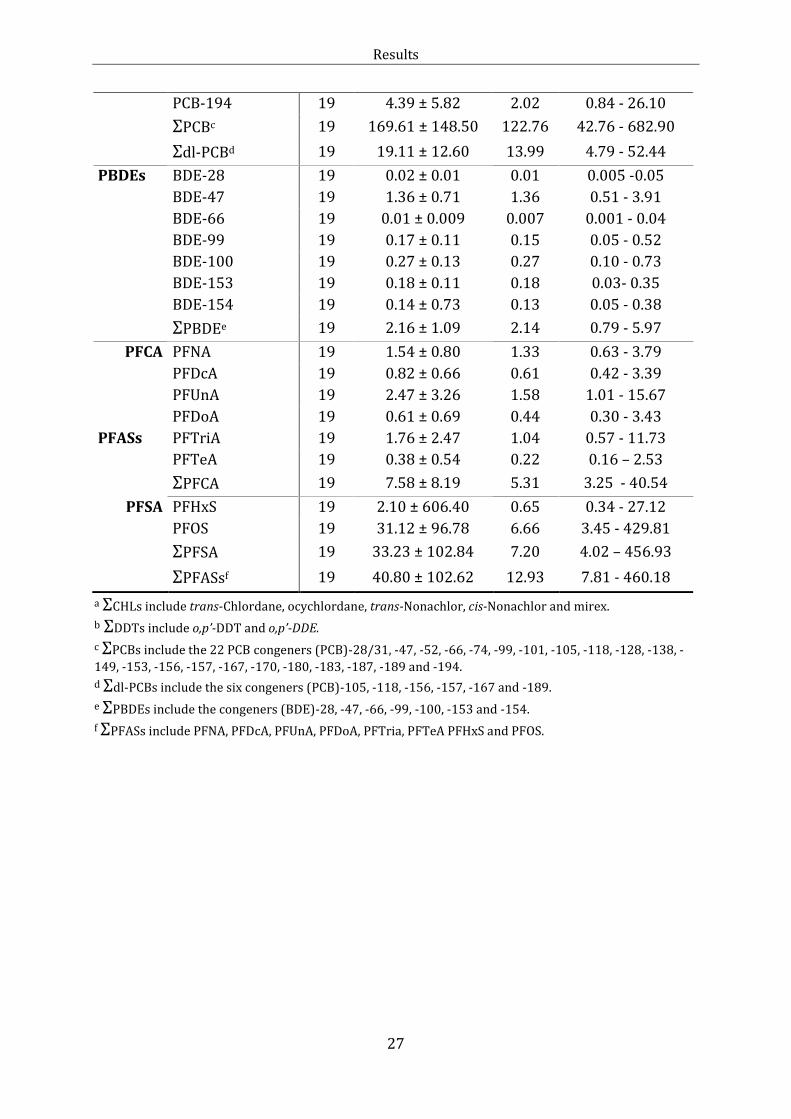
Table 4 Mean ± standard deviation (SD), median, minimum and maximum
concentrations (ng/g ww) of individual organochlorinated and brominated
contaminants and polyfluoroalkyl substances in female glaucous gulls (Larus
hyperboreus) from Kongsfjorden in 2010. Included are the sums denoted with Σ. N
denotes the number of observations per variable.
Female glaucous gulls (N=19)
Analyte (ng/g
ww) N Mean ± SD Median Min - max
Lipid% 19 1.39 ± 0.28 1.36 0.95 - 1.90
CHLs trans-Chlordane 19 0.45 ± 0.23 0.41 0.16 - 1.08
oxy-Chlordane 19 1.88 ± 2.03 0.99 0.05 - 8.49
trans-Nonachlor 19 0.96 ± 0.77 0.93 0.17 - 3.48
cis-Nonachlor 19 0.84 ± 0.47 0.83 0.23 - 2.05
Mirex 19 3.22 ± 2.50 2.17 0.78 - 8.90
ΣCHLsa 19 7.35 ± 5.30 6.09 1.76 - 23.99
DDTs p,p'-DDT 14 0.30 ± 0.31 0.23 0.06 - 1.32
p,p'-DDE 19 48.13 ± 30.60 48.91 13.769 - 133.012
ΣDDTsb 19 48.35 ± 30.82 49.23 13.84 - 134.33
HCB HCB 19 8.09 ± 3.35 7.74 3.83 - 16.64
HCHs β-HCH 18 0.39 ± 0.20 0.33 0.19 - 0.94
PCBs PCB-28/31 19 0.27 ± 0.12 0.29 0.15 - 0.63
PCB-47 19 0.57 ± 0.29 0.49 0.24 - 1.43
PCB-52 16 0.44 ± 0.39 0.35 0.04 - 1.36
PCB-66 19 1.12 ± 0.58 1.19 0.46 - 2.86
PCB-74 19 1.06 ± 0.56 0.99 0.40 - 2.71
PCB-99 19 6.72 ± 4.55 6.69 2.01 - 21.27
PCB-101 16 0.94 ± 0.80 0.71 0.05 - 2.87
PCB-105 19 3.30 ± 1.97 2.54 0.92 - 8.57
PCB-118 19 12.29 ± 7.60 9.77 3.31 - 30.79
PCB-128 19 3.30 ± 2.03 2.63 0.94 - 8.96
PCB-138 19 26.48 ± 16.70 24.44 7.89 - 74.82
PCB-149 18 0.53 ± 0.33 0.45 0.22 - 1.61
PCB-153 19 54.36 ± 50.06 38.31 13.19 - 228.51
PCB-156 19 2.51 ± 1.96 1.79 0.57 - 7.99
PCB-157 13 0.79 ± 0.52 0.67 0.27 - 2.11
PCB-167 19 1.37 ± 0.92 1.03 0.36 - 3.16
PCB-170 19 10.35 ± 14.470 5.538 1.570- 66.283
PCB-180 19 31.05 ± 37.07 16.42 5.88 - 166.35
PCB-183 19 3.73 ± 2.79 2.78 0.97 - 11.58
PCB-187 19 3.99 ± 2.30 3.25 1.52 - 9.95
PCB-189 17 0.52 ± 0.68 0.26 0.08 - 2.97
Results
27
PCB-194 19 4.39 ± 5.82 2.02 0.84 - 26.10
ΣPCBc 19 169.61 ± 148.50 122.76 42.76 - 682.90
Σdl-PCBd 19 19.11 ± 12.60 13.99 4.79 - 52.44
PBDEs BDE-28 19 0.02 ± 0.01 0.01 0.005 -0.05
BDE-47 19 1.36 ± 0.71 1.36 0.51 - 3.91
BDE-66 19 0.01 ± 0.009 0.007 0.001 - 0.04
BDE-99 19 0.17 ± 0.11 0.15 0.05 - 0.52
BDE-100 19 0.27 ± 0.13 0.27 0.10 - 0.73
BDE-153 19 0.18 ± 0.11 0.18 0.03- 0.35
BDE-154 19 0.14 ± 0.73 0.13 0.05 - 0.38
ΣPBDEe 19 2.16 ± 1.09 2.14 0.79 - 5.97
PFCA PFNA 19 1.54 ± 0.80 1.33 0.63 - 3.79
PFDcA 19 0.82 ± 0.66 0.61 0.42 - 3.39
PFUnA 19 2.47 ± 3.26 1.58 1.01 - 15.67
PFDoA 19 0.61 ± 0.69 0.44 0.30 - 3.43
PFASs PFTriA 19 1.76 ± 2.47 1.04 0.57 - 11.73
PFTeA 19 0.38 ± 0.54 0.22 0.16 – 2.53
ΣPFCA 19 7.58 ± 8.19 5.31 3.25 - 40.54
PFSA PFHxS 19 2.10 ± 606.40 0.65 0.34 - 27.12
PFOS 19 31.12 ± 96.78 6.66 3.45 - 429.81
ΣPFSA 19 33.23 ± 102.84 7.20 4.02 – 456.93
ΣPFASsf 19 40.80 ± 102.62 12.93 7.81 - 460.18
a ΣCHLs include trans-Chlordane, ocychlordane, trans-Nonachlor, cis-Nonachlor and mirex.
b ΣDDTs include o,p’-DDT and o,p’-DDE.
c ΣPCBs include the 22 PCB congeners (PCB)-28/31, -47, -52, -66, -74, -99, -101, -105, -118, -128, -138, -
149, -153, -156, -157, -167, -170, -180, -183, -187, -189 and -194.
d Σdl-PCBs include the six congeners (PCB)-105, -118, -156, -157, -167 and -189.
e ΣPBDEs include the congeners (BDE)-28, -47, -66, -99, -100, -153 and -154.
f ΣPFASs include PFNA, PFDcA, PFUnA, PFDoA, PFTria, PFTeA PFHxS and PFOS.
Results
28
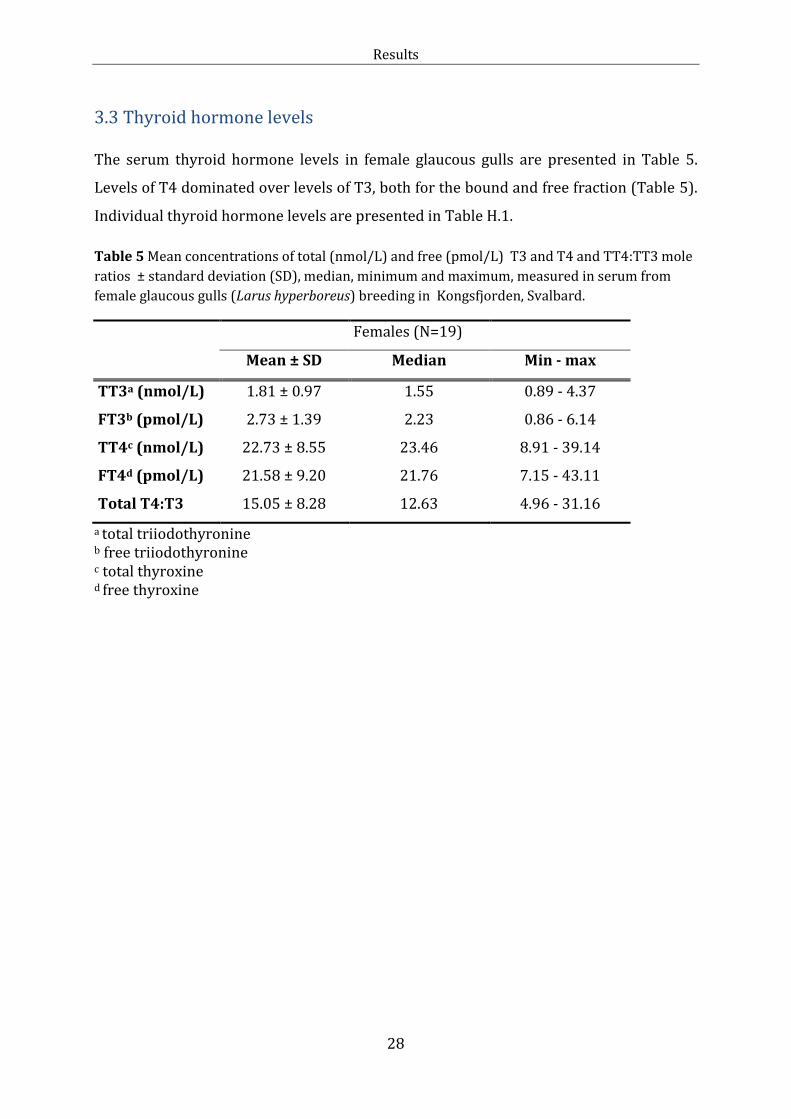
3.3 Thyroid hormone levels The serum thyroid hormone levels in female glaucous gulls are presented in Table 5.
Levels of T4 dominated over levels of T3, both for the bound and free fraction (Table 5).
Individual thyroid hormone levels are presented in Table H.1.
Table 5 Mean concentrations of total (nmol/L) and free (pmol/L) T3 and T4 and TT4:TT3 mole
ratios ± standard deviation (SD), median, minimum and maximum, measured in serum from
female glaucous gulls (Larus hyperboreus) breeding in Kongsfjorden, Svalbard.
Females (N=19)
Mean ± SD Median Min - max
TT3a (nmol/L) 1.81 ± 0.97 1.55 0.89 - 4.37
FT3b (pmol/L) 2.73 ± 1.39 2.23 0.86 - 6.14
TT4c (nmol/L) 22.73 ± 8.55 23.46 8.91 - 39.14
FT4d (pmol/L) 21.58 ± 9.20 21.76 7.15 - 43.11
Total T4:T3 15.05 ± 8.28 12.63 4.96 - 31.16
a total triiodothyronine b free triiodothyronine c total thyroxine d free thyroxine
Results
29
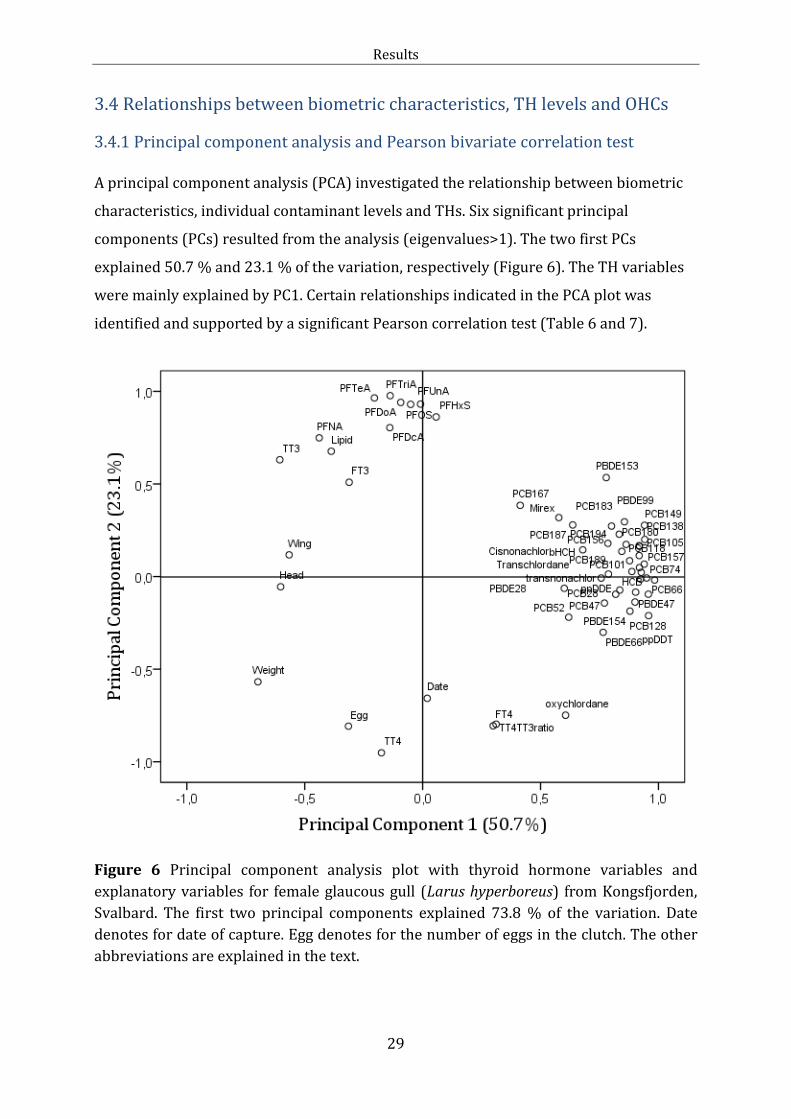
3.4 Relationships between biometric characteristics, TH levels and OHCs
3.4.1 Principal component analysis and Pearson bivariate correlation test
A principal component analysis (PCA) investigated the relationship between biometric
characteristics, individual contaminant levels and THs. Six significant principal
components (PCs) resulted from the analysis (eigenvalues>1). The two first PCs
explained 50.7 % and 23.1 % of the variation, respectively (Figure 6). The TH variables
were mainly explained by PC1. Certain relationships indicated in the PCA plot was
identified and supported by a significant Pearson correlation test (Table 6 and 7).
Figure 6 Principal component analysis plot with thyroid hormone variables and
explanatory variables for female glaucous gull (Larus hyperboreus) from Kongsfjorden,
Svalbard. The first two principal components explained 73.8 % of the variation. Date
denotes for date of capture. Egg denotes for the number of eggs in the clutch. The other
abbreviations are explained in the text.
Results
30
Along PC1 in the PCA plot (Figure 6), the PFASs grouped (PC≈0.9; Individual PCA
loadings in Table J.1) together with TT3, FT3 and lipid percent. Significant positive
bivariate correlations were found for TT3 and PFDcA, PFUnA, PFTriA, PFTeA, PFOS and
lipid percent. Lipid percent correlated positive with PFTriA, PFTeA, PFHxS and PFOS.
TT4, FT4, TT4:TT3 ratio, date of capture and number of eggs, grouped on the opposite
side of PC1 (PC≈0.9).
Along PC2, the chlorinated and brominated contaminants clustered on one side
(PC≈0.9), and displayed a distinct separation from the PFASs. The head and wing length
grouped on the negative side of PC2 (PC ≈ -0.2). A significant inverse relationship was
found between head and PCB-167 and between wing length and β-HCH, HCB, PCB-47
and PCB-187 (Table 7).
The PCA indicated correlations between the THs (Figure 6). This was further supported
by bivariate correlations. TT3 was positively linked with FT3 (p<0.001) and inversely
correlated with TT4:TT3 (p<0.002). TT4 was positively correlated with FT4, FT3 and
TT4:TT3 (p≤0.015). Furthermore, FT4 was positively correlated with TT4:TT3. The BCI
did not explain the variation in TH levels or TT4:TT3 ratio (p<0.001). None of the
biometric variables were significantly correlated with THs. However, a significant
positive correlation was found between the extractable plasma lipid percent and TT3
(Table 6). In contrast, lipid percent was negatively correlated with TT4:TT3 (Table 6).
Neither the body weight, number of eggs nor date of capture was well explained by the
PCA plot. However, some negative relationships were supported by the bivariate
analysis (Table 7). The body weight was inversely correlated with trans-nonachlor,
(PCB)-118, -157, -167, -170, -189 and -194 (Table 7). The BCI was inversely correlated
with PCB-189.
Relationships between the different OHCs
The contaminant variables were better explained by the PCA plot (Figure 6). Along PC1,
the PFASs grouped (PC1=0.7 – 1.0). The six individual PFCAs were not correlated with
the two individual PFSAs or ΣPFASs. Positive correlations between the individual PFCAs
were observed both in the PCA, and further confirmed by the correlation analysis
(p=<0.043). The two PFSAs (PFHxS and PFOS) were correlated, both with each other
and the ΣPFASs. Since PC1 and PC2 are orthogonal projected on each other, the PCA
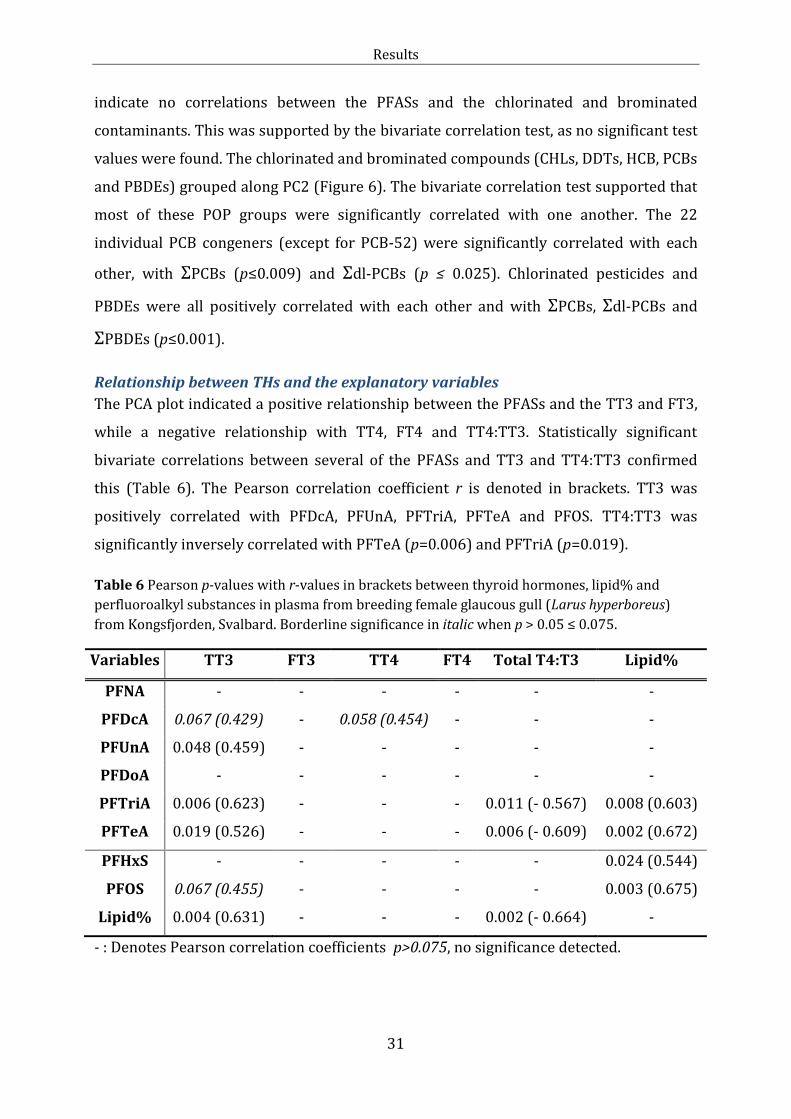
Results
31
indicate no correlations between the PFASs and the chlorinated and brominated
contaminants. This was supported by the bivariate correlation test, as no significant test
values were found. The chlorinated and brominated compounds (CHLs, DDTs, HCB, PCBs
and PBDEs) grouped along PC2 (Figure 6). The bivariate correlation test supported that
most of these POP groups were significantly correlated with one another. The 22
individual PCB congeners (except for PCB-52) were significantly correlated with each
other, with ΣPCBs (p≤0.009) and Σdl-PCBs (p ≤ 0.025). Chlorinated pesticides and
PBDEs were all positively correlated with each other and with ΣPCBs, Σdl-PCBs and
ΣPBDEs (p≤0.001).
Relationship between THs and the explanatory variables
The PCA plot indicated a positive relationship between the PFASs and the TT3 and FT3,
while a negative relationship with TT4, FT4 and TT4:TT3. Statistically significant
bivariate correlations between several of the PFASs and TT3 and TT4:TT3 confirmed
this (Table 6). The Pearson correlation coefficient r is denoted in brackets. TT3 was
positively correlated with PFDcA, PFUnA, PFTriA, PFTeA and PFOS. TT4:TT3 was
significantly inversely correlated with PFTeA (p=0.006) and PFTriA (p=0.019).
Table 6 Pearson p-values with r-values in brackets between thyroid hormones, lipid% and
perfluoroalkyl substances in plasma from breeding female glaucous gull (Larus hyperboreus)
from Kongsfjorden, Svalbard. Borderline significance in italic when p > 0.05 ≤ 0.075.
Variables TT3 FT3 TT4 FT4 Total T4:T3 Lipid%
PFNA - - - - - -
PFDcA 0.067 (0.429) - 0.058 (0.454) - - -
PFUnA 0.048 (0.459) - - - - -
PFDoA - - - - - -
PFTriA 0.006 (0.623) - - - 0.011 (- 0.567) 0.008 (0.603)
PFTeA 0.019 (0.526) - - - 0.006 (- 0.609) 0.002 (0.672)
PFHxS - - - - - 0.024 (0.544)
PFOS 0.067 (0.455) - - - - 0.003 (0.675)
Lipid% 0.004 (0.631) - - - 0.002 (- 0.664) -
- : Denotes Pearson correlation coefficients p>0.075, no significance detected.
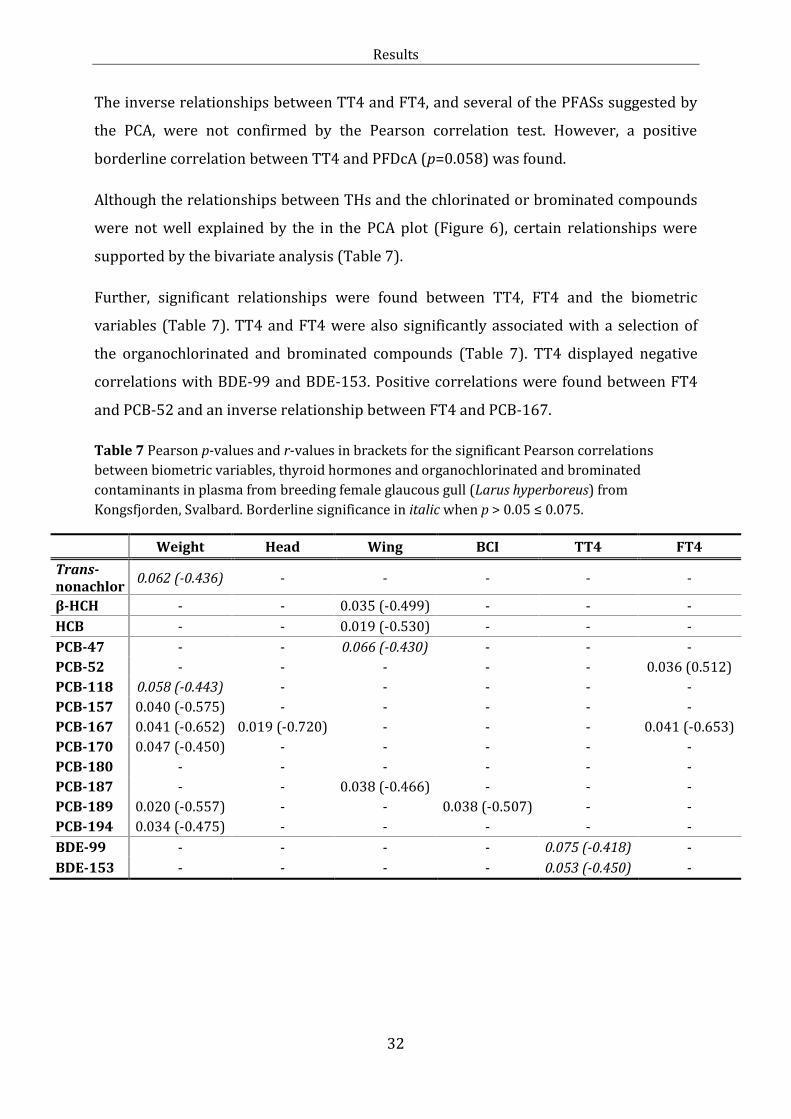
Results
32
The inverse relationships between TT4 and FT4, and several of the PFASs suggested by
the PCA, were not confirmed by the Pearson correlation test. However, a positive
borderline correlation between TT4 and PFDcA (p=0.058) was found.
Although the relationships between THs and the chlorinated or brominated compounds
were not well explained by the in the PCA plot (Figure 6), certain relationships were
supported by the bivariate analysis (Table 7).
Further, significant relationships were found between TT4, FT4 and the biometric
variables (Table 7). TT4 and FT4 were also significantly associated with a selection of
the organochlorinated and brominated compounds (Table 7). TT4 displayed negative
correlations with BDE-99 and BDE-153. Positive correlations were found between FT4
and PCB-52 and an inverse relationship between FT4 and PCB-167.
Table 7 Pearson p-values and r-values in brackets for the significant Pearson correlations
between biometric variables, thyroid hormones and organochlorinated and brominated
contaminants in plasma from breeding female glaucous gull (Larus hyperboreus) from
Kongsfjorden, Svalbard. Borderline significance in italic when p > 0.05 ≤ 0.075.
Weight Head Wing BCI TT4 FT4
Trans-nonachlor
0.062 (-0.436) - - - - -
β-HCH - - 0.035 (-0.499) - - -
HCB - - 0.019 (-0.530) - - -
PCB-47 - - 0.066 (-0.430) - - -
PCB-52 - - - - - 0.036 (0.512)
PCB-118 0.058 (-0.443) - - - - -
PCB-157 0.040 (-0.575) - - - - -
PCB-167 0.041 (-0.652) 0.019 (-0.720) - - - 0.041 (-0.653)
PCB-170 0.047 (-0.450) - - - - -
PCB-180 - - - - - -
PCB-187 - - 0.038 (-0.466) - - -
PCB-189 0.020 (-0.557) - - 0.038 (-0.507) - -
PCB-194 0.034 (-0.475) - - - - -
BDE-99 - - - - 0.075 (-0.418) -
BDE-153 - - - - 0.053 (-0.450) -
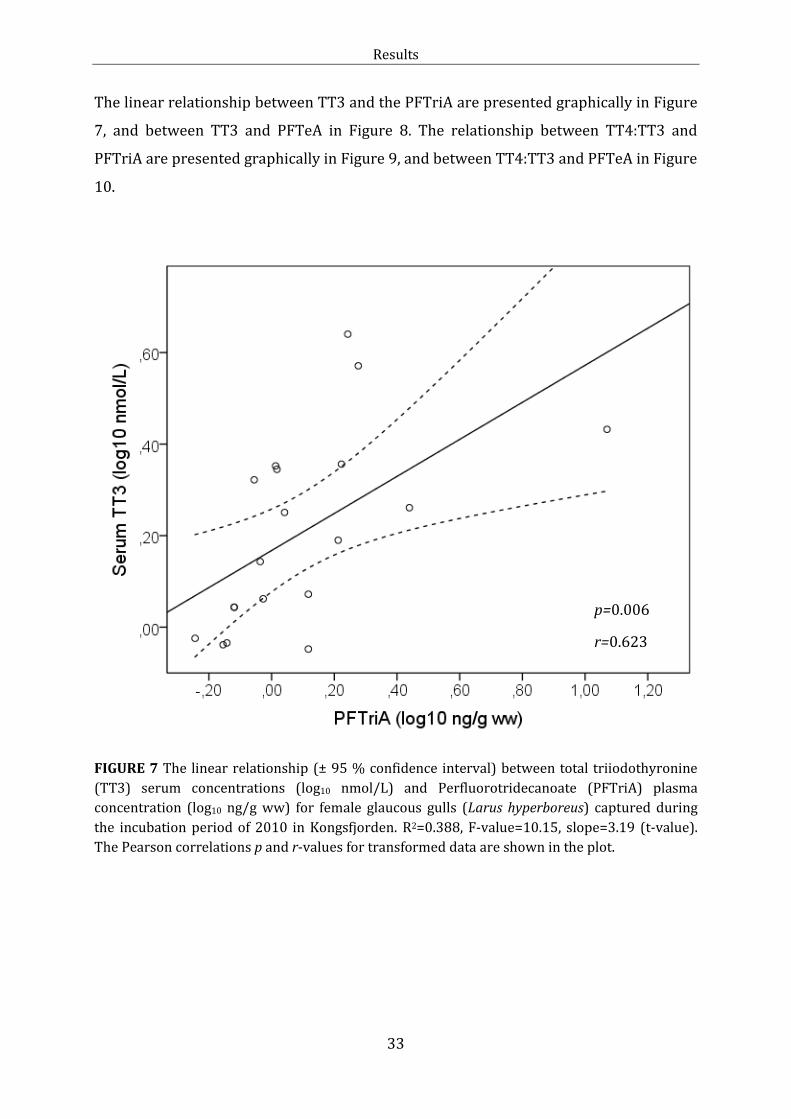
Results
33
The linear relationship between TT3 and the PFTriA are presented graphically in Figure
7, and between TT3 and PFTeA in Figure 8. The relationship between TT4:TT3 and
PFTriA are presented graphically in Figure 9, and between TT4:TT3 and PFTeA in Figure
10.
FIGURE 7 The linear relationship (± 95 % confidence interval) between total triiodothyronine
(TT3) serum concentrations (log10 nmol/L) and Perfluorotridecanoate (PFTriA) plasma
concentration (log10 ng/g ww) for female glaucous gulls (Larus hyperboreus) captured during
the incubation period of 2010 in Kongsfjorden. R2=0.388, F-value=10.15, slope=3.19 (t-value).
The Pearson correlations p and r-values for transformed data are shown in the plot.
p=0.006
r=0.623
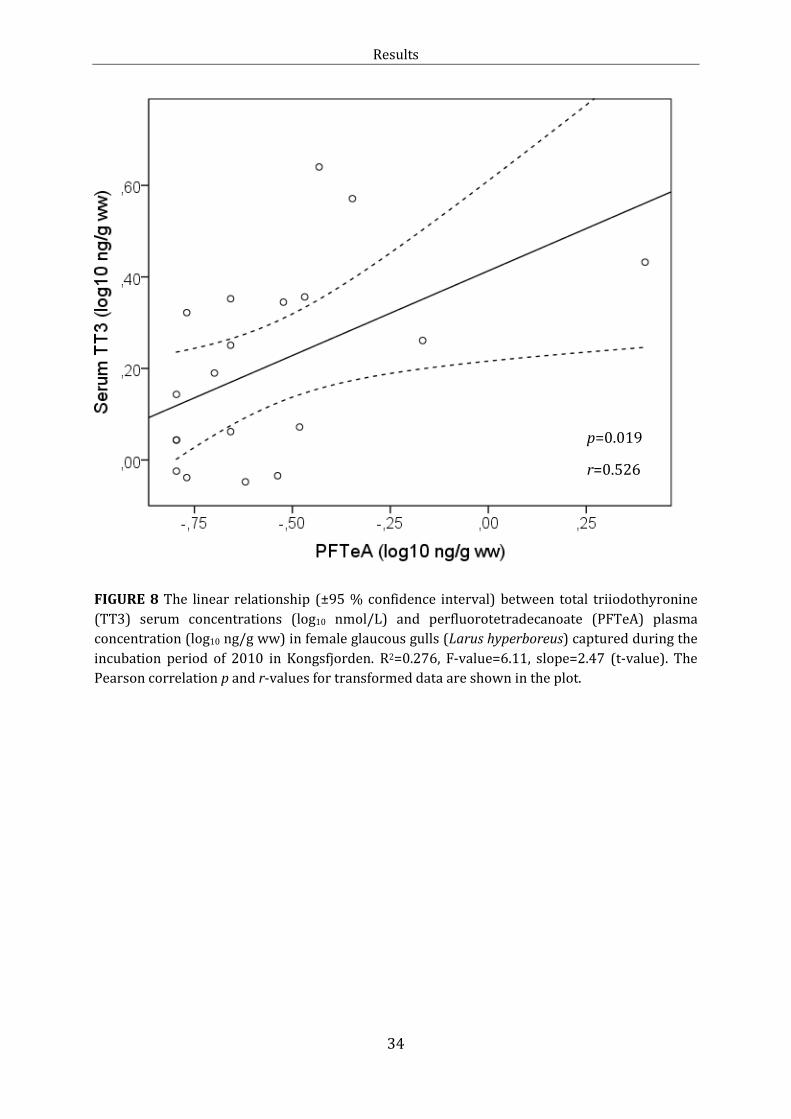
Results
34
FIGURE 8 The linear relationship (±95 % confidence interval) between total triiodothyronine
(TT3) serum concentrations (log10 nmol/L) and perfluorotetradecanoate (PFTeA) plasma
concentration (log10 ng/g ww) in female glaucous gulls (Larus hyperboreus) captured during the
incubation period of 2010 in Kongsfjorden. R2=0.276, F-value=6.11, slope=2.47 (t-value). The
Pearson correlation p and r-values for transformed data are shown in the plot.
p=0.019
r=0.526
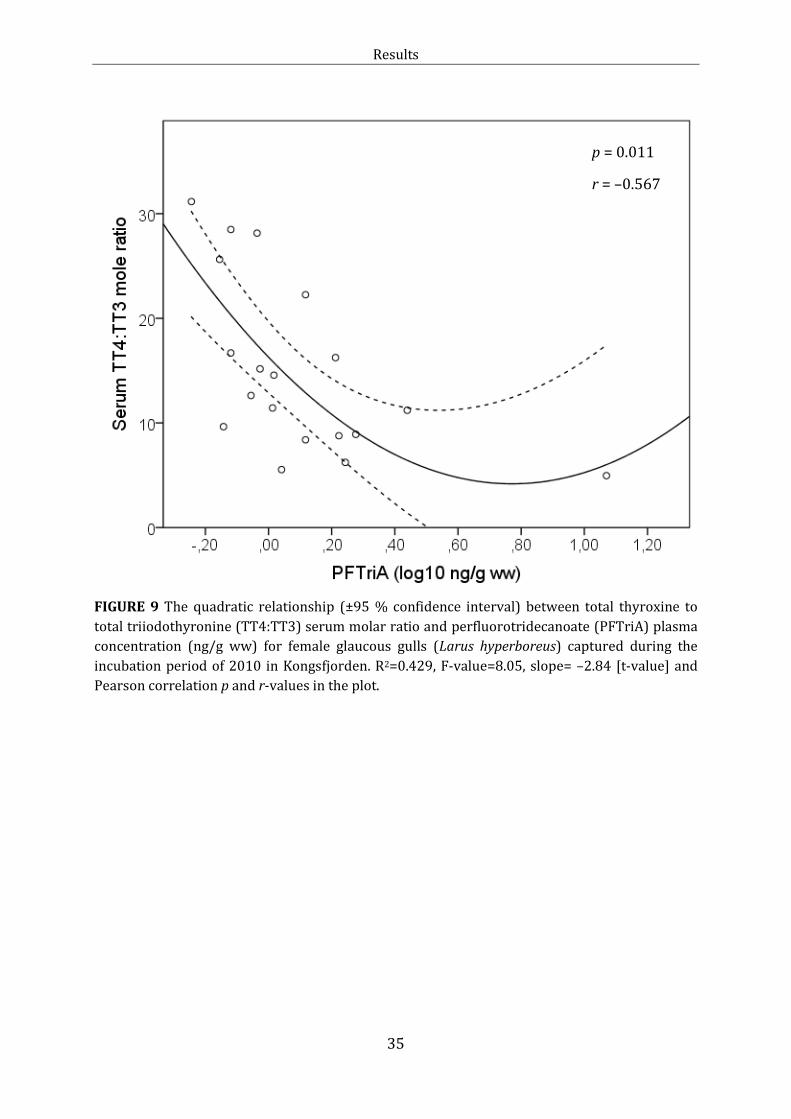
Results
35
FIGURE 9 The quadratic relationship (±95 % confidence interval) between total thyroxine to
total triiodothyronine (TT4:TT3) serum molar ratio and perfluorotridecanoate (PFTriA) plasma
concentration (ng/g ww) for female glaucous gulls (Larus hyperboreus) captured during the
incubation period of 2010 in Kongsfjorden. R2=0.429, F-value=8.05, slope= –2.84 [t-value] and
Pearson correlation p and r-values in the plot.
p = 0.011
r = –0.567
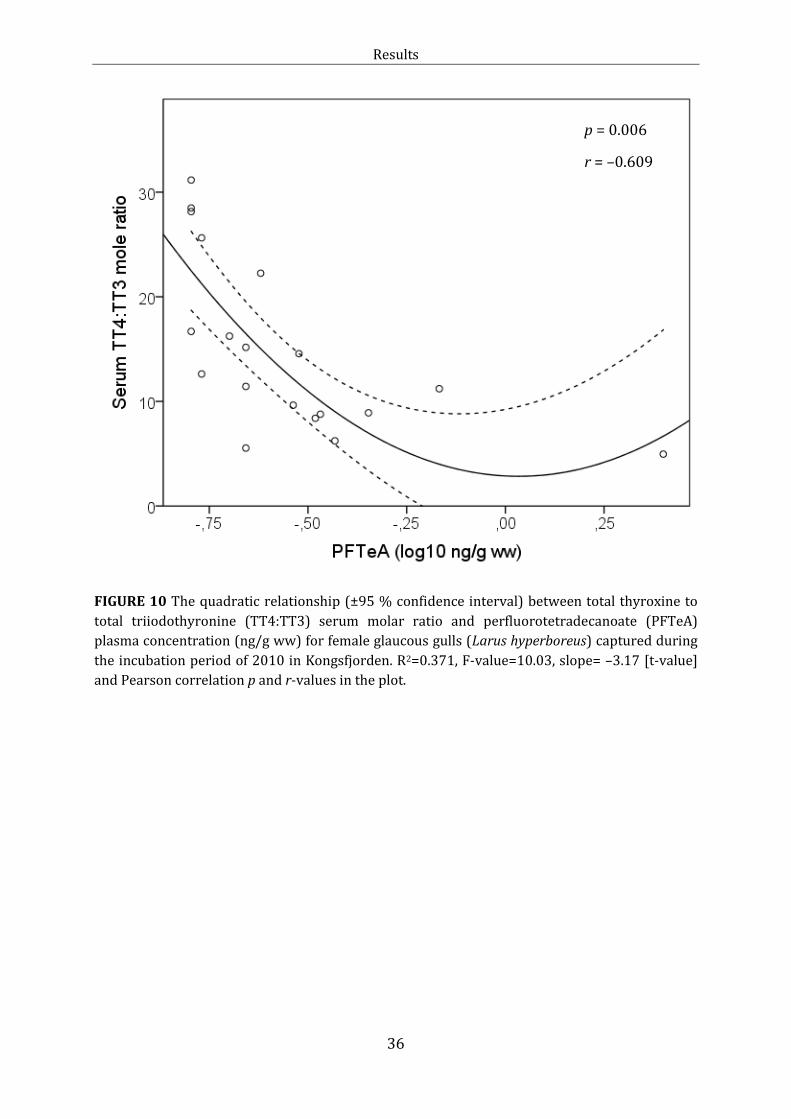
Results
36
FIGURE 10 The quadratic relationship (±95 % confidence interval) between total thyroxine to
total triiodothyronine (TT4:TT3) serum molar ratio and perfluorotetradecanoate (PFTeA)
plasma concentration (ng/g ww) for female glaucous gulls (Larus hyperboreus) captured during
the incubation period of 2010 in Kongsfjorden. R2=0.371, F-value=10.03, slope= –3.17 [t-value]
and Pearson correlation p and r-values in the plot.
p = 0.006
r = –0.609
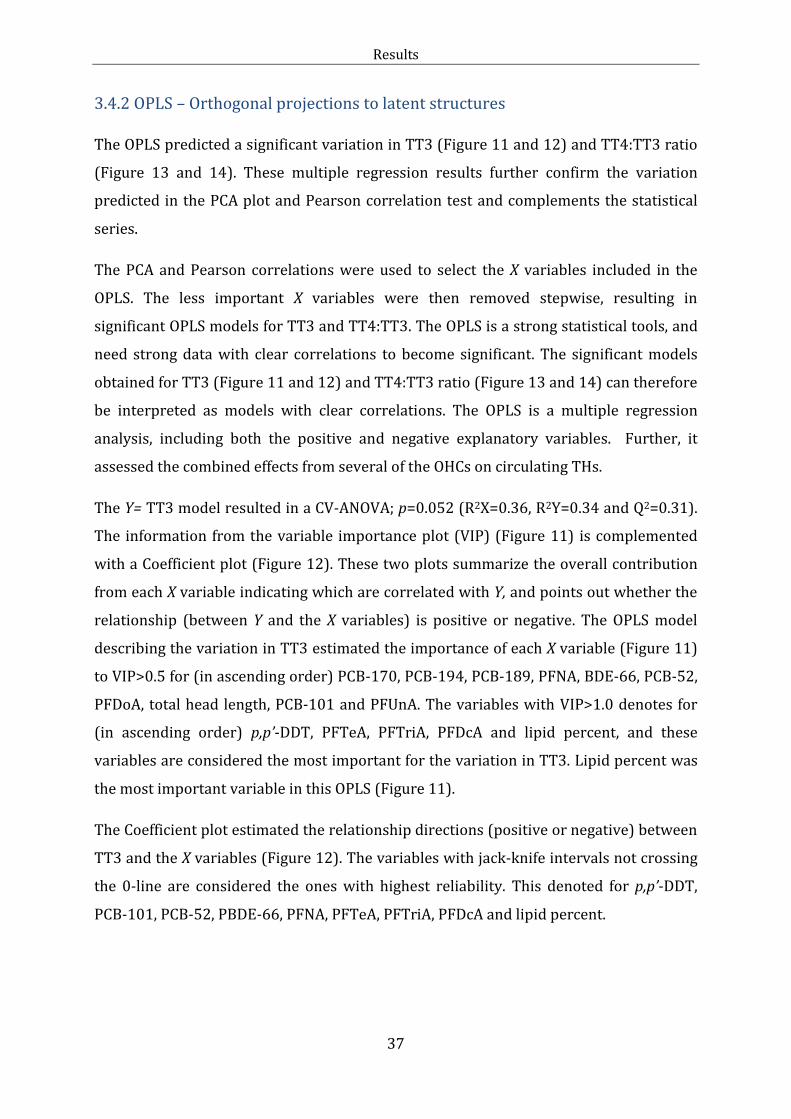
Results
37
3.4.2 OPLS – Orthogonal projections to latent structures
The OPLS predicted a significant variation in TT3 (Figure 11 and 12) and TT4:TT3 ratio
(Figure 13 and 14). These multiple regression results further confirm the variation
predicted in the PCA plot and Pearson correlation test and complements the statistical
series.
The PCA and Pearson correlations were used to select the X variables included in the
OPLS. The less important X variables were then removed stepwise, resulting in
significant OPLS models for TT3 and TT4:TT3. The OPLS is a strong statistical tools, and
need strong data with clear correlations to become significant. The significant models
obtained for TT3 (Figure 11 and 12) and TT4:TT3 ratio (Figure 13 and 14) can therefore
be interpreted as models with clear correlations. The OPLS is a multiple regression
analysis, including both the positive and negative explanatory variables. Further, it
assessed the combined effects from several of the OHCs on circulating THs.
The Y= TT3 model resulted in a CV-ANOVA; p=0.052 (R2X=0.36, R2Y=0.34 and Q2=0.31).
The information from the variable importance plot (VIP) (Figure 11) is complemented
with a Coefficient plot (Figure 12). These two plots summarize the overall contribution
from each X variable indicating which are correlated with Y, and points out whether the
relationship (between Y and the X variables) is positive or negative. The OPLS model
describing the variation in TT3 estimated the importance of each X variable (Figure 11)
to VIP>0.5 for (in ascending order) PCB-170, PCB-194, PCB-189, PFNA, BDE-66, PCB-52,
PFDoA, total head length, PCB-101 and PFUnA. The variables with VIP>1.0 denotes for
(in ascending order) p,p’-DDT, PFTeA, PFTriA, PFDcA and lipid percent, and these
variables are considered the most important for the variation in TT3. Lipid percent was
the most important variable in this OPLS (Figure 11).
The Coefficient plot estimated the relationship directions (positive or negative) between
TT3 and the X variables (Figure 12). The variables with jack-knife intervals not crossing
the 0-line are considered the ones with highest reliability. This denoted for p,p’-DDT,
PCB-101, PCB-52, PBDE-66, PFNA, PFTeA, PFTriA, PFDcA and lipid percent.
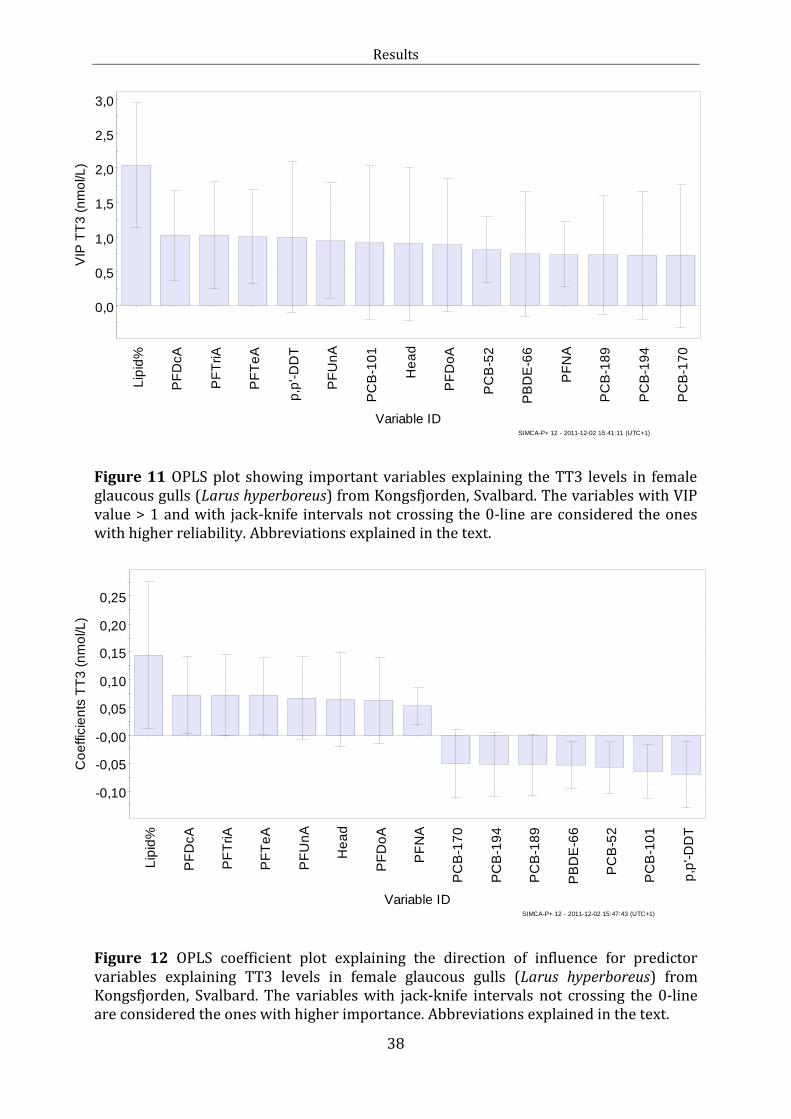
Results
38
0,0
0,5
1,0
1,5
2,0
2,5
3,0
Lip
id%
PF
DcA
PF
TriA
PF
Te
A
p,p
'-D
DT
PF
Un
A
PC
B-1
01
He
ad
PF
Do
A
PC
B-5
2
PB
DE
-66
PF
NA
PC
B-1
89
PC
B-1
94
PC
B-1
70
VIP
TT
3 (
nm
ol/L
)
Variable IDSIMCA-P+ 12 - 2011-12-02 15:41:11 (UTC+1)
-0,10
-0,05
-0,00
0,05
0,10
0,15
0,20
0,25
Lip
id%
PF
DcA
PF
TriA
PF
Te
A
PF
Un
A
He
ad
PF
Do
A
PF
NA
PC
B-1
70
PC
B-1
94
PC
B-1
89
PB
DE
-66
PC
B-5
2
PC
B-1
01
p,p
'-D
DT
Co
effic
ien
ts T
T3
(n
mo
l/L
)
Variable IDSIMCA-P+ 12 - 2011-12-02 15:47:43 (UTC+1)
Figure 11 OPLS plot showing important variables explaining the TT3 levels in female glaucous gulls (Larus hyperboreus) from Kongsfjorden, Svalbard. The variables with VIP value > 1 and with jack-knife intervals not crossing the 0-line are considered the ones with higher reliability. Abbreviations explained in the text.
Figure 12 OPLS coefficient plot explaining the direction of influence for predictor variables explaining TT3 levels in female glaucous gulls (Larus hyperboreus) from Kongsfjorden, Svalbard. The variables with jack-knife intervals not crossing the 0-line are considered the ones with higher importance. Abbreviations explained in the text.
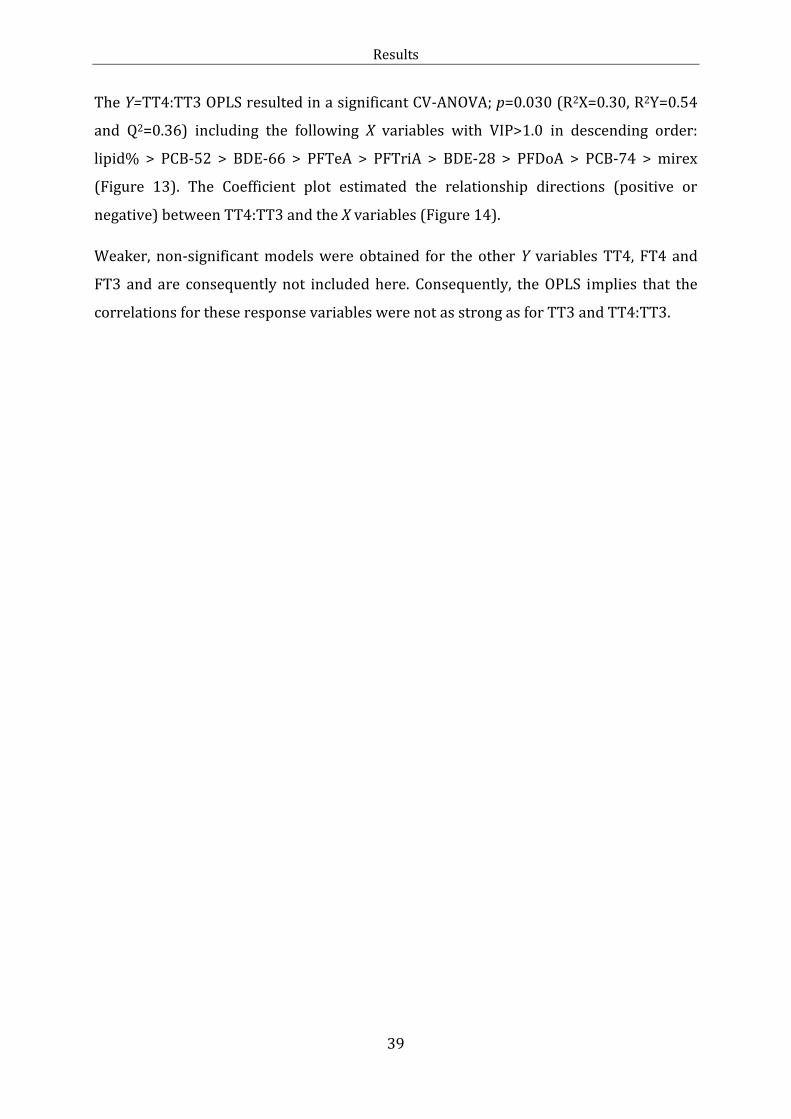
Results
39
The Y=TT4:TT3 OPLS resulted in a significant CV-ANOVA; p=0.030 (R2X=0.30, R2Y=0.54
and Q2=0.36) including the following X variables with VIP>1.0 in descending order:
lipid% > PCB-52 > BDE-66 > PFTeA > PFTriA > BDE-28 > PFDoA > PCB-74 > mirex
(Figure 13). The Coefficient plot estimated the relationship directions (positive or
negative) between TT4:TT3 and the X variables (Figure 14).
Weaker, non-significant models were obtained for the other Y variables TT4, FT4 and
FT3 and are consequently not included here. Consequently, the OPLS implies that the
correlations for these response variables were not as strong as for TT3 and TT4:TT3.
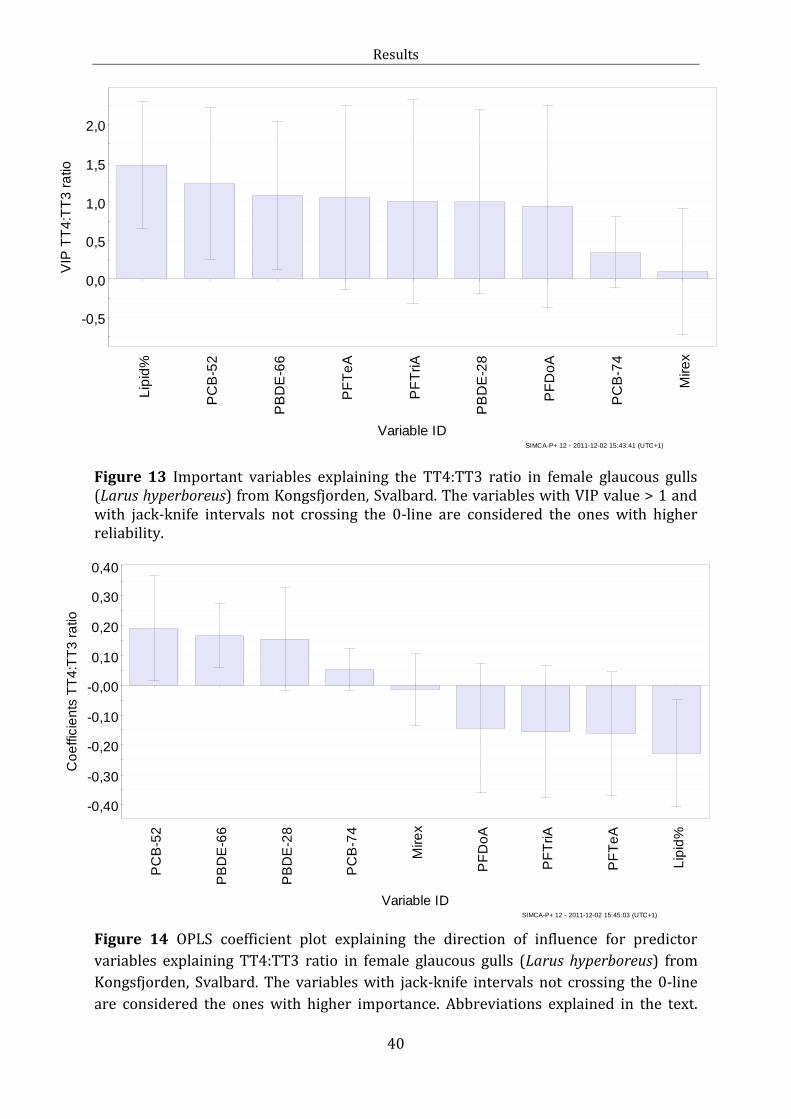
Results
40
-0,5
0,0
0,5
1,0
1,5
2,0
Lip
id%
PC
B-5
2
PB
DE
-66
PF
Te
A
PF
TriA
PB
DE
-28
PF
Do
A
PC
B-7
4
Mire
x
VIP
TT
4:T
T3
ra
tio
Variable IDSIMCA-P+ 12 - 2011-12-02 15:43:41 (UTC+1)
-0,40
-0,30
-0,20
-0,10
-0,00
0,10
0,20
0,30
0,40
PC
B-5
2
PB
DE
-66
PB
DE
-28
PC
B-7
4
Mire
x
PF
Do
A
PF
TriA
PF
Te
A
Lip
id%
Co
effic
ien
ts T
T4
:TT
3 r
atio
Variable IDSIMCA-P+ 12 - 2011-12-02 15:45:03 (UTC+1)
Figure 13 Important variables explaining the TT4:TT3 ratio in female glaucous gulls (Larus hyperboreus) from Kongsfjorden, Svalbard. The variables with VIP value > 1 and with jack-knife intervals not crossing the 0-line are considered the ones with higher reliability.
Figure 14 OPLS coefficient plot explaining the direction of influence for predictor
variables explaining TT4:TT3 ratio in female glaucous gulls (Larus hyperboreus) from
Kongsfjorden, Svalbard. The variables with jack-knife intervals not crossing the 0-line
are considered the ones with higher importance. Abbreviations explained in the text.
41
4 DISCUSSION
4.1 Prevalence of organohalogenated contaminants (OHCs) The present study reported the plasma OHC levels in female glaucous gulls breeding in
Kongsfjorden 2010 and assessed a possible link between several of the OHCs and serum
thyroid hormone levels. PCBs and OCPs were the prevailing compound groups in
glaucous gull plasma (Table 4). The present study aimed to identify the effects of single
classes of contaminants, in addition to any combined effects. Surprisingly – the long-
chain PFCAs constituted of less than 2.8 % of the total POP load in these female glaucous
gulls, but were among the most important explanatory variables regarding the variation
in THs.
It is challenging to elucidate effects from OHCs in wildlife. The sample size used in the
present study, represent a small selection of breeding glaucous gull from the population
in Kongsfjorden. In addition, the present study focus on effect assessment in female
glaucous gulls, due to the small male sample size (N=8) in 2010. Therefore, it is not
appropriate to report the differences in levels or effects between sexes in the present
study. There is limited knowledge about the individual life history and general
physiological conditions of these randomly captured animals. The period the study was
conducted represents a short time window of the glaucous gull life cycle; in addition
there are logistical constraints associated with the study area and season. Arctic biota is
exposed to a complex mixture of anthropogenic contaminants, of which the
quantitatively and qualitatively composition is not fully elucidated (de Wit et al., 2004).
For instance, the OHCs analysed in the present study represents a selection of
compounds within a selection of compound groups. For this reason, it is not possible to
account for the possible impacts or interactions from non-analysed contaminants in the
present study. Furthermore, the contaminants in the present study showed a high
degree of covariation. Such strong intercorrelations in a dataset can complicate the
multivariate data analysis when elucidating responses (Trygg and Wold, 2002).
Multivariate data analysis methods, such as the OPLS, are developed to better handle the
challenges regarding intercorrelations between variables. However, there are still some
uncertainties associated with the interpretation of data. For instance, the non-analysed
Discussion
42
compounds may contribute to the observed indications of effects on THs, while others
merely covary with the compound explaining the variation. Nonetheless, based on this
one-year study from 2010, it is not proper to conclude on a time trend for glaucous gulls
in Kongsfjorden. It is merely possible to compare the geographical relationships, in time
and space, with studies on glaucous gulls from other localities, such as Bjørnøya. When
doing so, it is essential to allow for differences in tissue, analysis procedures, data
handling, sample size and study area. Also note that dissimilarities between sexes,
species, lipid content and time of sampling do take place. In elucidation of these factors,
comparisons are discussed using wet weight basis and focusing on female glaucous
gulls. However, the sampling of data to the present study was conducted during a short
time period (the second half of the incubation period), and is therefore considered to be
a standardised data set.
4.2 Contaminant levels and pattern PCBs and OCPs were the prevailing compound groups measured in plasma from the
female glaucous gull in the present study colony. This pattern reflect the general pattern
of OHCs measured in Arctic seabird tissue (Letcher et al., 2010) and glaucous gull
plasma (Verreault et al., 2006). However, levels of ΣPFASs constituted of only 2.7 % less
than levels of ΣDDTs. Thus, high levels of ΣPFASs were reported in the present study.
The OHC concentrations detected in female glaucous gulls from the present study were
compared to previous levels measured in glaucous gulls from Bjørnøya (Verreault et al.,
2005a; Verreault et al., 2005b). The levels detected in the present study were found to
be similar to or lower than levels reported in glaucous gull plasma sampled at Bjørnøya
in 2004 (Verreault et al., 2006). Data from a one year study like the present is not
sufficient material to draw conclusions considering a time trend in glaucous gulls from
Kongsfjorden. However, the numerous studies on glaucous gulls from Bjørnøya show
decreasing plasma levels of POPs (Bustnes et al., 2010). It might be that future studies
continue to show decreasing levels of some POPs, compared in time or space. Therefore,
the levels in glaucous gulls from Kongsfjorden in the present study may possibly reflect
the overall trend that some of the legacy chlorinated POPs are declining in Arctic marine
wildlife species (Braune et al., 2005; Bustnes et al., 2010; De Laender et al., 2011),
including the glaucous gull (Verreault et al., 2010). It is noteworthy this exclusively
Discussion
43
apply for the POPs faced out of production and use, like PCBs, oxychlordane, HCB and
PFOS (Stockholm Convention, 2011a). Nevertheless, the present study confirm the
persistency of these legacy POPs in biota (de Wit et al., 2004), and display evidence for a
continuous slow decline in levels of POPs in the decades to come.
The major compound group detected in the present study of female glaucous gulls was
PCBs. The PCB blood concentrations in the present study ranged from 42 – 683 ng/g ww
(Table 4), compared to 52 – 1079 ng/g ww in a study from Bjørnøya in 2001 (Bustnes et
al., 2001). Compared to other seabirds in the Arctic, the levels reported in these two
studies may reflect the glaucous gulls’ trophic position and feeding habits (Wold et al.,
2011). However, the somewhat lower levels detected in Kongsfjorden may indicate a
difference in feeding habits and choice of pray between the two locations. This may be
explained by findings indicating that the glaucous gull diet at Bjørnøya in larger part
consist of eggs and chicks from other seabirds (Bustnes et al., 2000). The present study
fall into the line of temporal trends suggesting that the concentrations of legacy POPs
only will decrease slowly in the years to come.
The ΣPBDE was the smallest compound group detected in the female glaucous gull
plasma, only followed by β-HCH (Figure 5). The levels of PBDEs were lower for all
congeners in the females from the present study, compared to a former survey on
plasma concentrations in glaucous gulls sampled at Bjørnøya in the Norwegian Arctic
(Verreault et al., 2005a). BDE-47 was the main contributor to ΣPBDE in both studies.
However, the levels of BDE-47 were sevenfold lower in the present study (1.6 ng/g ww)
compared to what Verreault et al. reported in 2005. However, the pattern of congeners
was the same, as BDE-47 was followed by BDE-99, -100 and 153. This PBDE pattern is
seen in glaucous gulls as well as other Arctic species like the polar cod (Boreogadus
saida) and black guillemot (Cepphus grylle) (Haukås et al., 2007). One of the concerns
regarding PBDEs is the possible toxicological potential as endocrine disrupters detected
in the present study, in spite of the concentrations being 1/10 of the PCBs and OCPs
concentrations. In addition, there is a rapid replacement of existing compounds by new
brominated contaminants. The ban of one hazardous chemical may be followed by the
development and release of new potential toxic congeners (de Wit et al., 2010).
Discussion
44
The different physicochemical properties of the OHCs contribute to the correlations
between POPs indicated both by the PCA (Figure 6) and the bivariate analysis in the
present study. These patterns of inter-correlation are consistent with earlier studies of
species in the Barents Sea food web, including glaucous gulls (Haukås et al., 2007).
Organochlorinated and brominated POPs possess similar physicochemical properties,
thus differing from PFASs. The proteinophilic nature of PFAS compared to the more
lipophilic organochlorinated and brominated POPs (de Wit et al., 2004; Ahrens et al.,
2009), result in differences in physiological partitioning. The PFASs are rather
partitioned into blood and liver due to their protein affinity, as the lipophilic OHCs
partition into the lipid rich compartments. Therefore, the correlation between PCBs,
OCPs and BFRs, and them not correlating with the PFASs as observed in the present
study, was as expected.
The levels of PFAS have previously not been assessed in glaucous gulls from
Kongsfjorden. High levels of 11 PFASs were detected in the present study. Widespread
distributions of PFSAs and PFCAs have been reported in several trophic levels in the
Arctic (Giesy and Kannan, 2001). The present study support that glaucous gulls occupy
an apex position in Kongsfjorden and may be vulnerable for bioaccumulation of PFASs.
Compared to levels in polar bears, another top predator in the Arctic, the pattern of
PFASs found in female glaucous gulls from Kongsfjorden in the present study are
consistent with PFASs detected in polar bears (Bentzen et al., 2008). Thus, PFOS were
the dominating fluorinated compound in both the present study and the one reported by
Bentzen et al., (2008). The present findings of prevailing PFASs levels are in line with
studies from the Norwegian and Russian Arctic, such as in ivory gulls (Pagophila
eburnea) (Miljeteig et al., 2009) and Brünnich guillemot (Uria lomvia) eggs from
Kongsfjorden (Miljeteig and Gabrielsen, 2010). In addition to glaucous gulls and other
seabirds and mammals from the Canadian Arctic (Tomy et al., 2004a).
PFOS continue to be the predominant PFAS detected in fish, reptiles and marine
mammals worldwide (Houde et al., 2011), despite the voluntary phase out of PFOS from
production and use in the Western countries in 2002, followed by ban within the EU in
2008. PFOS was the most pervasive fluorinated compound detected in the present study.
However, the mean plasma concentrations of PFOS were four times higher in mean
plasma levels in glaucous gulls sampled at Bjørnøya in 2004 (Verreault et al., 2005b).
Discussion
45
The ΣPFCAs was 13 times higher in the study by Verreault et al. (2005b), compared to
the present study. There seem to be an indication of geographical difference (Verreault
et al., 2005b), or a temporal decline of PFOS. Temporal trends of PFOS demonstrated a
weak decrease in seabird eggs of herring gulls and Brünnich’s guillemot from Northern
Norway and Svalbard sampled from 1983 to 2003 (Helgason et al., 2011). A slight
decrease was also reported in Brünnich’s guillemots from Kongsfjorden (Miljeteig and
Gabrielsen, 2010) and ringed seals (Phoca hispida) from the Canadian Arctic (Butt et al.,
2007). However, the temporal trends pointed out by Helgason et al. (2012) and Miljeteig
and Gabrielsen (2010), indicate increasing levels of other PFASs, such as PFTriA and
PFUnA. The slight decrease in PFOS, which is also reflected in industrialized regions
(Kato et al., 2011), may be explained by the 3M company ordered phase out of
Perfluorooctansulfonyl fluoride (POSF) chemistry (including PFOS), as their production
ended in 2002 (3M Company, 2000). In addition, PFOS was listed in annex B of the
Stockholm Convention in 2009 (Stockholm Convention, 2011b), resulting in a restriction
of use only permitted in specific situations. However, the continuous emissions of PFOS
from Chinese industry are of concern, as the slow decrease in nature may stagnate due
to this (Butt et al., 2010).
PFOS and PFOA are the most known PFSA and PFCA, respectively (Jensen and Leffers,
2008). High levels of PFOS were detected in all samples of this study, in contrast to
PFOA, which was only detected in lower levels and 42 % of the samples. A similar ratio
is observed in previous studies on PFASs in glaucous gulls from Bjørnøya (Verreault et
al., 2005b). Little is known about how and to what extent OHCs are biotransformed in
Arctic seabirds (Helgason et al., 2010). However, studies demonstrate low activity of
Cythochrome P450 enzymes in glaucous gull, suggesting the species have a low OHC
metabolizing capacity (Henriksen et al., 2000). This may contribute to the accumulation
of POPs in glaucous gulls (Henriksen et al., 2000). However, an in vitro study
demonstrated that rat liver cells are able to biotransform one of the most important
precursors in PFOS based products, perfluorooctansulfonamide (PFOSA), into PFOS (Xu
et al., 2004). The study by Xu et al, (2004), in combination with the concurrent ratio
differences observed between PFOS and PFOA in the present study, may indicate that
glaucous gulls or organisms in their food chain are able to biotransform several
precursor into PFOS (Tomy et al., 2004b). This may explain why PFOS bioaccumulate in
Discussion
46
the environment. However, it is not appropriate to conclude from this as more studies
on the glaucous gulls’ ability to transform PFASs are needed.
In the present study, the PFCA profile was dominated by odd- and long-chain PFCAs, like
PFUnA and PFTriA. Thus, the results show lower concentrations of even-length PFCAs
with one less carbon than odd-length PFCAs. The same accumulation profile of PFCAs as
in the present study was found in eggs from herring gulls (Larus argentatus), collected in
northern Norway from 1983 – 2003 (Verreault et al., 2007). The profile is dominated by
mean concentration of 4.2 and 2.8 ng/g ww, respectively, compared to 2.5 and 1.8 ng/g
ww in the present study. The concentrations were somewhat lower in the present study,
both for PFUnA and PFTriA, although one should be aware of the comparison between
eggs and plasma in this example. This pattern is suggested to be explained by long-range
transport of volatile fluorotelomer alcohols (FTOHs) into the Arctic (Martin et al., 2004).
Two of the major sources to PFCAs in Arctic biota can be found as 8:2 FTOH, and 10:2
FTOH, which are found to degrade to PFCAs (Martin et al., 2004). 8:2 FTOH degrade to
PFOA and PFNA, which is only detected in lower levels in all samples of this study.
However, 10:2 FTOH degrade to PFDcA and PFUnA, which may contribute to the
prevalent concentrations of PFUnA detected in the present study. Therefore, long-range
transport may to a certain extent explain the deposition of PFASs in the Arctic. However,
transportation alone do probably not account for the high levels of PFAS detected in the
present study. Most likely, trophic magnification of PFASs along the food chain and
exposure to PFAS in winter habitat may better explain the high levels detected in all the
samples of the present study (Haukås et al., 2007; Kelly et al., 2009). Further studies are
needed to fully elucidate the sources of exposure, in addition to the PFAS pattern
observed in the glaucous gulls in the present study, in order to eliminate exposure and
risk of effects.
4.3 Thyroid hormone levels There is a lack of well-established baseline TH levels for glaucous gulls. However,
according to McNabb (2000), many avian adults have plasma or serum T4
concentrations ranging from 6 – 19 nmol/L and T3 concentrations ranging from 0.7 –
1.5 nmol/L. In the present study the total T4 ranged from 8.9 – 39.1 nmol/L and the
total T3 ranged from 0.89 – 4.37 nmol/L. Considering that several factors influence
thyroid levels, from species differences, food availability, iodine access, season, age and
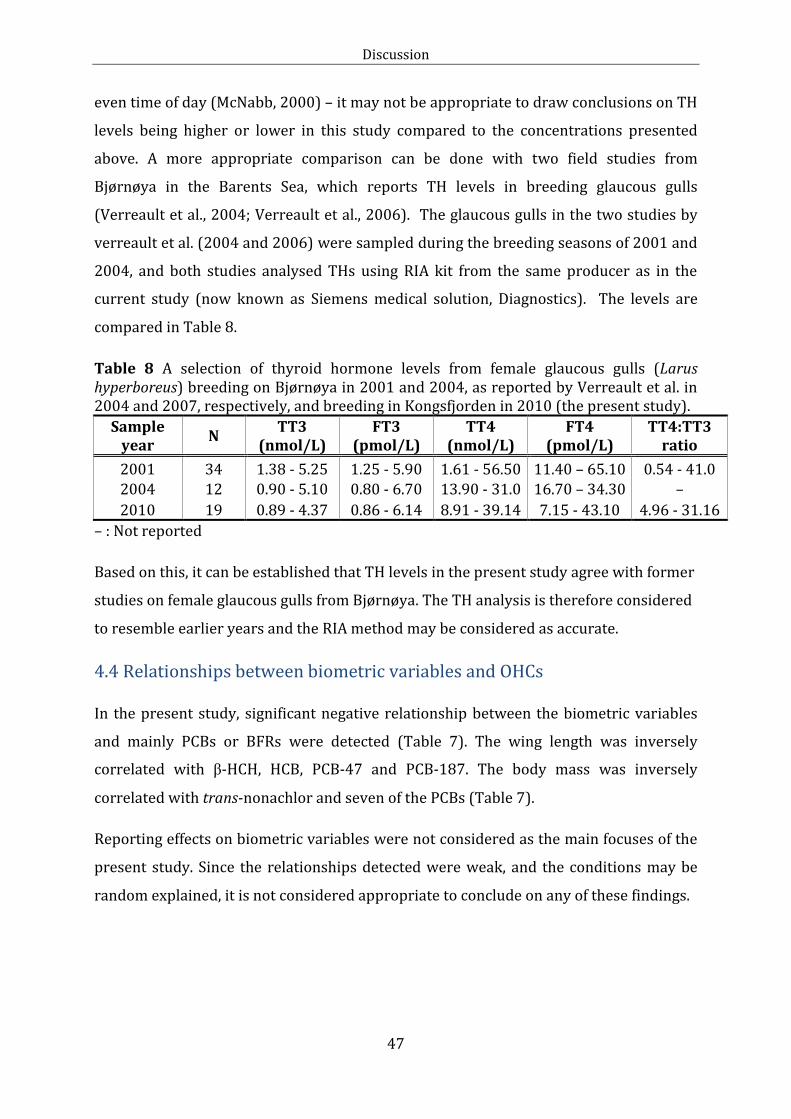
Discussion
47
even time of day (McNabb, 2000) – it may not be appropriate to draw conclusions on TH
levels being higher or lower in this study compared to the concentrations presented
above. A more appropriate comparison can be done with two field studies from
Bjørnøya in the Barents Sea, which reports TH levels in breeding glaucous gulls
(Verreault et al., 2004; Verreault et al., 2006). The glaucous gulls in the two studies by
verreault et al. (2004 and 2006) were sampled during the breeding seasons of 2001 and
2004, and both studies analysed THs using RIA kit from the same producer as in the
current study (now known as Siemens medical solution, Diagnostics). The levels are
compared in Table 8.
Table 8 A selection of thyroid hormone levels from female glaucous gulls (Larus hyperboreus) breeding on Bjørnøya in 2001 and 2004, as reported by Verreault et al. in 2004 and 2007, respectively, and breeding in Kongsfjorden in 2010 (the present study).
Sample year
N TT3
(nmol/L) FT3
(pmol/L) TT4
(nmol/L) FT4
(pmol/L) TT4:TT3
ratio
2001 34 1.38 - 5.25 1.25 - 5.90 1.61 - 56.50 11.40 – 65.10 0.54 - 41.0 2004 12 0.90 - 5.10 0.80 - 6.70 13.90 - 31.0 16.70 – 34.30 –
2010 19 0.89 - 4.37 0.86 - 6.14 8.91 - 39.14 7.15 - 43.10 4.96 - 31.16
– : Not reported
Based on this, it can be established that TH levels in the present study agree with former
studies on female glaucous gulls from Bjørnøya. The TH analysis is therefore considered
to resemble earlier years and the RIA method may be considered as accurate.
4.4 Relationships between biometric variables and OHCs In the present study, significant negative relationship between the biometric variables
and mainly PCBs or BFRs were detected (Table 7). The wing length was inversely
correlated with β-HCH, HCB, PCB-47 and PCB-187. The body mass was inversely
correlated with trans-nonachlor and seven of the PCBs (Table 7).
Reporting effects on biometric variables were not considered as the main focuses of the
present study. Since the relationships detected were weak, and the conditions may be
random explained, it is not considered appropriate to conclude on any of these findings.
Discussion
48
4.5 Relationships between OHCs and thyroid hormones. In the present study, significant positive associations were found between blood levels
of selected PFASs and levels of TT3, TT4 and TT4:TT3 ratio in female glaucous gulls
breeding in Kongsfjorden (Table 6). Significant inverse correlations were found
between TT4 and BDE-99 and BDE-153, in addition to FT4 and the dioxin-like PCB-167
(Table 7). These findings suggest an exposure effect on THs from the different OHCs.
The OPLS model displayed that the lipid percent was among the most important
explanatory variables regarding TT3, along with several of the long-chain PFCAs, namely
PFDcA, PFTriA, PFTeA and PFUnA. PCB-101 and the pesticide p,p’-DDT was the most
important negative predictors of TT3 (Figure 11). These findings suggest that there
might be combined effects from the various OHCs on THs.
The lipid percent being such a strong explanatory variable may indicate a relationship
between TT3 and physiological conditions or feeding ecology. The lipid percent was a
positive predictor for TT3, and a negative predictor for the TT4:TT3 ratio (Figure 12).
This indicates a reduction in TT4, compared to TT3, regarding the ratio.
The positive relationship between TT3 and lipid percent observed in the present study,
may indicate that the general physiological condition for the birds were good. Better fit
birds may forage more or choose pray from different trophic levels than poorer fit birds.
Thyroid hormone levels are affected by several physiological and external factors and
may vary with body condition and nutritional state of the bird (McNabb, 2000). It may
be that the birds with the higher levels of T3 are in better condition, hence having a
better nutritional status. It is established that a reduction in body fat reserves mobilizes
OHCs stored in body fat and increases levels in tissue and blood (Henriksen et al., 1998).
This was supported by significant relationships between body mass and several of the
PCBs found in the present study (Table 7). In addition, the incubation period possibly
represent a period of energy deprivation for the female gulls due to egg production
(Bustnes et al., 2001), followed by increased time spent on the nest (compared to
foraging) during the ~27 days of incubation. Female glaucous gulls tend to incubate
more than males, 54.4 % compared to 45.5 %, respectively (Bustnes et al., 2001).
Therefore, it is challenging to use nutritional status as an explanation for the increased
levels of THs found in the present study.
Discussion
49
A study of the fatty acid composition in glaucous gulls, where the aim was to establish
the species’ trophic position compared to other seabirds in Kongsfjorden, displayed
great individual differences between individual glaucous gulls (Wold et al., 2011). Some
gulls specialise on zooplankton and fish, whereas others forage on seabird eggs and
chicks. This can influence the OHC composition in their food, hence the composition in
blood and tissue (Bustnes et al., 2000). Brünnich’s guillemot and common eider
(Somateria mollissima) eggs and hatchlings have been found to represent a similar OHC
composition as the present study (Murvoll et al., 2007; Miljeteig and Gabrielsen, 2010).
Seabird eggs and hatchlings are an important protein and lipid rich food source for
glaucous gulls during the breeding season. The positive associations between TT3, lipid
percent and several of the PFASs in the glaucous gulls in this study may be better
explained by the increase of eggs and chicks to their diet during the nesting period in
Kongsfjorden.
On the other hand, the high TT3 levels may represent a biomarker indicating PFAS-
mediated endocrine alterations. However, linking responses observed in these glaucous
gulls to a specific cause, is one of the major challenges when trying to understand the
impacts of OHCs in wildlife, and is not easy to conclude upon (Letcher et al., 2010). In the
present study, there are mainly implications of a positive relationship between TT3 and
the long-chain PFCAs with ten or more carbons. None of the short chain PFCAs such as
PFBA, PFPA or PFHxA were detected. In accordance with the present study, Nøst et al
(2011) investigated possible correlations of OHCs and THs in black-legged kittiwake
(Rissa tridactyla) and Northern fulmar (Fulmarus glacialis) chicks from Kongsfjorden in
2006. First, the PFAS profile detected in the study by Nøst et al. (2011) agree with the
present study, reporting that the main PFASs detected in these seabirds were PFOS and
PFUnA. Second, the correlations found by Nøst et al. (2011) imply that OHCs may disrupt
the TH homeostasis in developing seabirds, as well as in adults. The present study
implies the same. Furthermore, in accordance with the present study, Nøst et al. (2011)
found positive correlations between TT4 and PFNA in both seabird species. This is also
in accordance with findings in Northern fulmars from the Canadian Arctic (Braune et al.,
2011)
However, it is challenging to elucidate the possible mechanisms of toxicity based on the
present biomarker study or the study by Nøst et al. (2011). However, there are some
Discussion
50
recent published studies on other species which may explain the observed results in the
present study. After a two-generation PFNA exposure study on zebrafish (Danio rerio),
Liu et al. (2011) reported significantly elevated plasma T3 levels in adults from both
generations (F0 and F1) after 180 days of PFNA exposure. In addition, histological
changes of the thyroid follicles, elevated TTR levels and decreased UDP-
glucuronocyltransferases (UGTs) in the liver was reported by Liu et al. (2011). A down-
regulation of UGTs could result in decreased TH elimination through the bile, hence
increased TH blood levels (Zoeller et al., 2007). Liu et al. (2011) also reported reduced
gene expression of the TH elimination enzymes UGTs. TH disrupting effects were even
displayed in third generation F1 zebrafish larvae, as elevated gene expression related to
TH synthesis and metabolism. The present study indicates increasing levels of TT3 with
increasing levels of long-chain PFCAs. PFNA was included in the OPLS VIP plot as one of
the more important variables explaining TT3 variation. However, neither TTR nor UGTs
were subject of study in the present thesis. Nevertheless, it is feasible that the findings in
zebrafish by Liu et al. (2011) could be extrapolated to the present study as a possible
explanation for the correlations found between TT3 and long-chained PFCAs. However,
aware of the between species differences, it is recommended that future studies focus on
filling the knowledge gaps on the mechanisms of toxicity in avian species from the
Arctic.
Significant positive relationships were found between TT3 and PFOS in glaucous gulls
from the present study. Shi et al. (2009) explored the disruptive effects of PFOS on the
HPT-axis in zebrafish larvae. They discovered that PFOS had the potential to disrupt TH
function by interfering with the gene transcriptions that constitutes a part of the HPT-
axis. Shi et al. (2009) reported among other factors, that corticotropin-releasing factor
(CRF) and thyroid-stimulating hormones (TSH) were significantly up-regulated and
down-regulated, respectively. TTR gene expression was down-regulated. They also
found that the nuclear thyroid receptors (TR) α and β was up-regulated and down-
regulated, respectively. What is especially interesting is that during the experimental
exposure, the T4 content remained unchanged, whereas the T3 levels were significantly
increased. Also here, it is important to express awareness of between-species disparity.
However, the proposed effects of PFOS exerted on HPT-axis reported by Shi et al., may
explain or partly explain the positive relationship between TT3 and PFOS obtained in
this study. THs exert a wide range of effects on biological function and are important in
Discussion
51
all vertebrates, either fish (Power et al., 2001), birds (McNabb, 2000) or humans
(Widmaier et al., 2006). Furthermore, several physiological and external factors play a
key role in TH function, such as iodine uptake, TH synthesis, deiodination and TH
nuclear receptor binding (Yen and Chin, 1994; McNabb, 2007). Considering all these
potential routes of toxicity and the numerous possible sites of actions regarding effects
of OHCs on THs, it is a challenge to evaluate mechanisms of toxicity in the present study.
Furthermore, the potential toxicity of PFASs still remains to be fully elucidated.
However, establishing the mechanisms of toxicity in one species may contribute to
understand the toxic potential of these contaminants in other species. Furthermore,
knowing the mechanisms of toxicity might make it easier to evaluate the physiological
and ecological consequences for glaucous gulls exposed to high levels of OHCs in the
future.
The significant inverse relationships between TT4 and the BFRs BDE-153 and BDE-99,
in addition to FT4 and PCB-167 found in the present study, are consistent with earlier
findings in glaucous gulls (Verreault et al., 2006). PBDEs and dioxin-like PCBs are
proposed endocrine disrupters by e.g. Boas et al. (2006), as their structural resemblance
to THs may interfere with the HPT-axis. The general understanding of the interaction
suggests that chlorinated and brominated contaminants may alter TH levels in gulls as
well as humans, by competitive binding on TH carrier proteins, like albumin or TTR
(Ucan-Marin et al., 2010). It has been suggested that T4 is more susceptible than T3
towards the disturbance of transport by TTR in gull species (Ucan-Marin et al., 2009).
Several in vivo and in vitro studies have reported that organochlorinated and
brominated contaminants may outdistance T4 for the binding sites on TTR plasma
proteins (Meerts et al., 2000; Hakk and Letcher, 2003; Legler and Brouwer, 2003; Ucan-
Marin et al., 2010). Based on this, the results in question support the hypothesis that T4
displaced from TTR binding sites may result in increased T4 excretion through urine or
bile (Verreault et al., 2006).
Possible explanations for the decrease in TT4:TT3 ratio may be presented based on a
decline in T4 relative to T3. In the present study, levels of T4 dominated over levels of
T3, both for the bound and free fraction (Table 5). This is consistent with T4 being the
major TH excreted from the thyroid gland, reflected by being the major plasma
circulating TH (McNabb, 1992). Deiodinases in the peripheral tissue convert T4 to T3
Discussion
52
(Yen and Chin, 1994). However, increasing plasma OHC concentrations are reported to
disturb the production, conversion and distribution of THs. For instance, OHCs were
found to disturb the conversion of T4 to T3 mediated by mono-deiodinase enzymes
(Brouwer et al., 1998). In addition, OHCs were found to interfere directly with the
thyroid gland and with several of the TH metabolizing enzymes converting T4 into T3.
For instance, UGTs, iodothyronine deiodinases (IDs), and sulfotransferases (SULTs) in
both brain and liver, in addition to the plasma transport system of THs. This proposes an
explanation for the observed decline in TT4:TT3 ratios in the present study.
Further, Vongphachan et al. (2011) observed an up-regulation of type II
deiodothyronine deiodinase (D2) mRNA in neuronal cell cultures from embryonic
herring gulls (Larus argentatus) and chickens (Gallus domesticus) exposed to PFCAs. D2
enzymes convert T4 into the physiologically more active T3. If these in vitro results can
be physiologically extrapolated, a consequence could be elevated T4 deiodination in D2
containing tissue like the brain, pituitairy gland or muscles, consequently increasing the
T3 levels at the site of action (Kogai and Brent, 2005). Consequently, this may explain or
partly explain the increased levels of circulating T3 detected in the present study.
Vongphachan et al. (2011) also reported that TTR mRNA expression was down-
regulated after administration of PFHxS in concentrations as low as 0.1 µM. One of the
major tasks for TTR is to transport T4 into the central nervous system prior to T3
formation (McNabb, 2007). A reduction in TTR could consequently lead to a TH
deficiency in target tissue, possibly altering TH depending processes (Vongphachan et
al., 2011). Consequently, this may explain or partly explain the decreased levels of
circulating TT4 compared to TT3 detected in the present study.
Lipid percent, PCB-52 and BDE-66 were among the most important explanatory
variables concerning the TT4:TT3 variation. One significant and one nearly significant
decrease in TT4:TT3 ratios were found in two former studies on glaucous gulls,
associated with specific organochlorine (OC) classes, like DDTs (Verreault et al., 2004;
Verreault et al., 2006). Birds with higher OC exposure had lower levels of plasma T4 and
TT4:TT3 ratios, concurrently elevated T3 levels. In the present study, the OPLS
predicted significant explanations for TT3 levels (p=0.052), lipids and PFASs were
positive explanatory variables, hence p,p’-DDT and PCB-101 were negative explanatory
variables. These findings may indicate combined effects from the different classes of
Discussion
53
contaminants. Diurnal patterns demonstrated in birds, indicate that plasma T4 peak
during the dark period and T3 rise to their highest levels during light period (McNabb,
2000). This might be a physiological variation explaining the TH ratios observed in the
present study. However, it is not elucidated what the consequence might be for the
glaucous gulls if the positive correlations observed in the present study between TT3
and PFASs might have increased the T3 levels additionally. In long-term, a T4 deficiency
may result in less conversion of T4 into T3. Such an alteration in TH function may result
in behavioral, developmental or reproductive stress (Bustnes et al., 2003a; Bustnes et al.,
2003b; Verreault et al., 2004; Bustnes et al., 2005).
Diurnal patterns in avians indicate that plasma T4 peak during the dark period and T3
rise to their highest levels during light period (McNabb, 2000). This might be a
physiological variation explaining the TH ratios observed in the present study. However,
it is not elucidated what the consequence might be for the glaucous gulls if the positive
correlations between TT3 and PFASs observed in the present study cause an additional
increase in TT3 levels. In the long-term, a T4 deficiency may result in less conversion of
T4 into the physiologically active FT3. Such an alteration in TH function may result in
behavioral, developmental or reproductive stress (Bustnes et al., 2003a; Bustnes et al.,
2003b; Verreault et al., 2004; Bustnes et al., 2005).
Climate change is considered one of the major stressors to Arctic wildlife (Jenssen, 2006;
Letcher et al., 2010). Alterations in climate been displayed through changes in levels and
patterns of OHCs in for instance Hudson Bay polar bears (McKinney et al., 2009),
explained by changes in sea-ice conditions and consequently a change in polar bear diet.
McKinney et al. found that levels of CHLs and PCBs went from decreasing to increasing
levels, and PBDEs increased faster than expected due to changes in feeding ecology.
Feeding ecology is an important explanatory factor regarding OHC levels and pattern in
glaucous gulls as well (Bustnes et al., 2000). It is therefore recommended to further
investigate what climate change might cause of alterations in food webs in Kongsfjorden
and elsewhere in the Arctic. It is also considered important to assess what climate
change might do with bioavailability, toxicity or even biodegradation of OHCs in the
Arctic (Letcher et al., 2010).
It is a challenge to detect changes in endocrine endpoints due to the general lack of
baseline endocrine information in Arctic species. In addition, most of the toxicological
Discussion
54
studies establishing effect thresholds have been assessed in non-Arctic animals. It is not
established what additional stressors, such as climate change, combined with
anthropogenic contaminants might result in. Therefore, it is tenuous to draw
conclusions applicable in wild populations based on individual biomarker studies
(Letcher et al., 2010). However, the growing body of evidence is favoring the hypothesis
that environmental contaminant exposure, regarding both old and new emerging OHCs,
may be linked to endocrine disruptive endpoints in Svalbard glaucous gulls.
55
5 CONCLUDING REMARKS AND FURTHER WORK The correlations in the present study between the endocrine endpoints and plasma
levels of OHCs indicate an exposure effect on circulating thyroid hormones in female
glaucous gulls from Kongsfjorden. The positive correlations between TT3 and the long-
chain PFCAs may indicate a disturbance of TH homeostasis. Hence, potential biological
hazardous effects may be related to these compounds. It is recommended that future
studies evaluate the effect mechanisms behind these potential effects on circulating THs.
Surprisingly; it was the minor levels of PFCAs that displayed the highest potency
regarding effects on THs and explained more of the variation in TT3 than the higher
concentrations of e.g. PCBs or PFOS. Based upon the indications of endocrine disruptive
effects from PFASs in the present study, the lack of control on production and use are of
concern.
High levels of OHCs were detected in female glaucous gulls from Kongsfjorden compared
to other seabirds breeding in the area, such as common eiders and Brünnich guillemots
(both birds and eggs) (Murvoll et al., 2007; Miljeteig and Gabrielsen, 2010). However,
the levels were in general a little lower in this particular study of glaucous gulls,
compared to former studies on glaucous gulls from Bjørnøya (Bustnes et al., 2010;
Verreault et al., 2010). The results in question may indicate geographical differences in
OHC exposure between glaucous gull populations or they may be in agreement with
studies that show slowly decreasing levels of some legacy POPs (Braune et al., 2005; De
Laender et al., 2011). The mechanisms behind the possible interactions between THs
and OHCs, as observed in the present study, may be explained or partly explained by
increased TH production, increased conversion of T4 into T3, increased excretion of T4
relative to T3 or inhibited metabolism of TH.
In elucidation of the indications that the Arctic and Kongsfjorden environment is
changing due to alterations in climate, it is important to be a step ahead to assess what
changes in environmental factors can cause of stress on wildlife. E.g. increased sea or air
temperatures or reduced ice-cover, in addition to anthropogenic stressors as new
hazardous chemicals (e.g. siloxane, PFCAs) may elicit new or expanding effects in biota.
Concluding Remarks and Further Work
56
Only future surveys may display the potential impacts from climate change on the
bioavailability, degradation or effects of OHCs in Arctic wildlife (Letcher et al., 2010).
The rapid replacement of established hazardous chemicals (de Wit et al., 2010;
Stockholm Convention, 2011b), point out the importance of regulations on production
and use of chemicals by national and international environmental protection agencies.
57
REFERENCES
3M Company. (2000). Available at: http://solutions.3m.com/wps/portal/3M/en_US/PFOS/PFOA/Information/phase-out-technologies/ [Accessed 5 November 2011].
Ahrens, L., Siebert, U. and Ebinghaus, R. (2009). Total body burden and tissue distribution of polyfluorinated compounds in harbor seals (Phoca vitulina) from the German Bight. Marine Pollution Bulletin 58, 520-525.
Akins, J. R., Waldrep, K. and Bernert, J. T. (1989). The Estimation of Total Serum-Lipids by a Completely Enzymatic Summation Method. Clinica Chimica Acta 184, 219-226.
AMAP. (2009). Arctic Pollution 2009. Arctic Monitoring and Assessment Programme, Oslo, xi+83pp.
Anker-Nilssen, T., Bakken, V., Strøm, H., Golovkin, A. N., Bianki, V. V. and Tatarinkova, I. P. (2000). The status of marine seabirds breeding in the Barents Sea region, Report nr 113. Norsk Polarinstiutt.
Bentzen, T. W., Muir, D. C. G., Amstrup, S. C. and O'Hara, T. M. (2008). Organohalogen concentrations in blood and adipose tissue of Southern Beaufort Sea polar bears. Science of the Total Environment 406, 352-367.
Boas, M., Feldt-Rasmussen, U., Skakkebaek, N. E. and Main, K. M. (2006). Environmental chemicals and thyroid function. European Journal of Endocrinology 154, 599-611.
Bourne, W. R. P. and Bogan, J. A. (1972). Polychlorinated biphenyls in North Atlantic seabirds. Marine Pollution Bulletin 3, 171-175.
Braathen, M., Derocher, A. E., Wiig, O., Sormo, E. G., Lie, E., Skaare, J. U. and Jenssen, B. M. (2004). Relationships between PCBs and thyroid hormones and retinol in female and male polar bears. Environmental Health Perspectives 112, 826-833.
Braune, B. M., Outridge, P. M., Fisk, A. T., Muir, D. C. G., Helm, P. A., Hobbs, K., Hoekstra, P. F., Kuzyk, Z. A., Kwan, M., Letcher, R. J. et al. (2005). Persistent organic pollutants and mercury in marine biota of the Canadian Arctic: An overview of spatial and temporal trends. Science of the Total Environment 351, 4-56.
Braune, B. M., Trudeau, S., Jeffrey, D. A. and Mallory, M. L. (2011). Biomarker responses associated with halogenated organic contaminants in northern fulmars (Fulmarus glacialis) breeding in the Canadian Arctic. Environmental Pollution 159, 2891-2898.
Brouwer, A., Morse, D. C., Lans, M. C., Schuur, A. G., Murk, A. J., Klasson-Wehler, E., Bergman, A. and Visser, T. J. (1998). Interactions of persistent environmental
References
58
organohalogens with the thyroid hormone system: Mechanisms and possible consequences for animal and human health. Toxicology and Industrial Health 14, 59-84.
Buck, R. C., Franklin, J., Berger, U., Conder, J. M., Cousins, I. T., de Voogt, P., Jensen, A. A., Kannan, K., Mabury, S. A. and van Leeuwen, S. P. J. (2011). Perfluoroalkyl and polyfluoroalkyl substances in the environment: Terminology, classification, and origins. Integrated Environmental Assessment and Management 7, 513-541.
Bustnes, J. O., Erikstad, K. E., Bakken, V., Mehlum, F. and Skaare, J. U. (2000). Feeding ecology and the concentration of organochlorines in glaucous gulls. Ecotoxicology 9, 179-186.
Bustnes, J. O., Bakken, V., Erikstad, K. E., Mehlum, F. and Skaare, J. U. (2001). Patterns of incubation and nest-site attentiveness in relation to organochlorine (PCB) contamination in glaucous gulls. Journal of Applied Ecology 38, 791-801.
Bustnes, J. O., Bakken, V., Skaare, J. U. and Erikstad, K. E. (2003a). Age and accumulation of persistent organochlorines: A study of arctic-breeding glaucous gulls (Larus hyperboreus). Environmental Toxicology and Chemistry 22, 2173-2179.
Bustnes, J. O., Erikstad, K. E., Skaare, J. U., Bakken, V. and Mehlum, F. (2003b). Ecological effects of organochlorine pollutants in the Arctic: A study of the Glaucous Gull. Ecological Applications 13, 504-515.
Bustnes, J. O., Miland, O., Fjeld, M., Erikstad, K. E. and Skaare, J. U. (2005). Relationships between ecological variables and four organochlorine pollutants in an artic glaucous gull (Larus hyperboreus) population. Environmental Pollution 136, 175-185.
Bustnes, J. O., Fauchald, P., Tveraa, T., Helberg, A. and Skaare, J. U. (2008). The potential impact of environmental variation on the concentrations and ecological effects of pollutants in a marine avian top predator. Environment International 34, 193-201.
Bustnes, J. O., Gabrielsen, G. W. and Verreault, J. (2010). Climate Variability and Temporal Trends of Persistent Organic Pollutants in the Arctic: A Study of Glaucous Gulls. Environmental Science & Technology 44, 3155-3161.
Butt, C. M., Muir, D. C. G., Stirling, I., Kwan, M. and Mabury, S. A. (2007). Rapid response of arctic ringed seals to changes in perfluoroalkyl production. Environmental Science & Technology 41, 42-49.
Butt, C. M., Berger, U., Bossi, R. and Tomy, G. T. (2010). Levels and trends of poly- and perfluorinated compounds in the arctic environment. Science of the Total Environment 408, 2936-2965.
Coulson, J. C., Thomas, C. S., Butterfield, J. E. L., Duncan, N., Monaghan, P. and Shedden, C. (1983). The use of head and bill lenght to sex live gulls Laridae. Ibis 125, 549-557.
Covaci, A., Voorspoels, S., Thomsen, C., van Bavel, B. and Neels, H. (2006). Evaluation of total lipids using enzymatic methods for the normalization of persistent organic pollutant levels in serum. Science of the Total Environment 366, 361-366.
References
59
De Laender, F., Hammer, J., Hendriks, A. J., Soetaert, K. and Janssen, C. R. (2011). Combining Monitoring Data and Modeling Identifies PAHs as Emerging Contaminants in the Arctic. Environmental Science & Technology 45, 9024-9029.
de Wit, C., Fisk, A., Hobbs, K., Muir, D., Gabrielsen, G., Kallenborn, R., Krahn, M., Norstrom, R. and Skaare, J. (2004). AMAP Assessment 2002: Persistent organic pollutants in the Arctic. Arctic Monitoring and Assessment Programme (AMAP). Oslo, Norway, xvi + 310 pp.
de Wit, C. A., Herzke, D. and Vorkamp, K. (2010). Brominated flame retardants in the Arctic environment — trends and new candidates. Science of the Total Environment 408, 2885-2918.
Dietz, R., Bossi, R., Riget, F. F., Sonne, C. and Born, E. W. (2008). Increasing perfluoroalkyl contaminants in east Greenland polar bears (Ursus maritimus): A new toxic threat to the Arctic bears. Environmental Science & Technology 42, 2701-2707.
Eriksson, L., Johansson, E., Kettaneh-Wold, N., Trygg, J., Wikstrom, C. and Wold, S. (2006). Multi- and megavariate data analysis. Part I. Basic principles and applications, Umeå.
Gabrielsen, G. W. (2007). Levels and effects of persistent organic pollutants in Arctic animals. In "Arctic-Alpine Ecosystems and People in a Changing Environment", (ed. J. B. Orbaek, Kallenborn, R., Tombre, I., Hegseth, E.N., Falk-Petersen, S. and A. H. Hoel A.H.), pp. 377-412, Chapter 20: Springer Verlag, Berlin.
Giesy, J. P. and Kannan, K. (2001). Global distribution of perfluorooctane sulfonate in wildlife. Environmental Science & Technology 35, 1339-1342.
Gilchrist, H. G. (2001). Glaucous gull, Larus hyperboreus. No. 573 In: The birds of North America (Poole A, Gill F, eds.). Philadelphia: Birds of North America, 1 - 31.
Griffiths, R., Double, M. C., Orr, K. and Dawson, R. J. G. (1998). A DNA test to sex most birds. Molecular Ecology 7, 1071-1075.
Hakk, H. and Letcher, R. J. (2003). Metabolism in the toxicokinetics and fate of brominated flame retardants - a review. Environment International 29, 801-828.
Hanssen, L., Dudarev, A., Huber, S., Odland, J. and Sandanger, T. (2011). Partition of perfluoroalkyl substances (PFASs) in whole blood and plasma, assessed in maternal and umbilical cord samples from inhabitants in Arctic Russia and Uzbekistan. Submitted.
Harris, D. C. (2010). Quantitative Chemical Analysis. New York: W.H.Freeman and company.
Haukås, M., Berger, U., Hop, H., Gulliksen, B. and Gabrielsen, G. W. (2007). Bioaccumulation of per- and polyfluorinated alkyl substances (PFAS) in selected species from the Barents Sea food web. Environmental Pollution 148, 360-371.
Helgason, L. B., Arukwe, A., Gabrielsen, G. W., Harju, M., Hegseth, M. N., Heimstad, E. S., Jorgensen, E. H., Mortensen, A. S. and Wolkers, J. (2010). Biotransformation of PCBs in Arctic seabirds: Characterization of phase I and II pathways at transcriptional,
References
60
translational and activity levels. Comparative Biochemistry and Physiology C-Toxicology & Pharmacology 152, 34-41.
Helgason, L. B., Gabrielsen, G. W. and Sagerup, K. (2011). Organohalogen pollutants in seabird eggs from Northern Norway and Svalbard. In Global Contaminant Trends of Persistent Organic Chemicals, (ed. B. Loganathan): Taylor&Francis.
Henriksen, E. O., Gabrielsen, G. W. and Skaare, J. U. (1998). Validation of the use of blood samples to assess tissue concentrations of organochlorines in glaucous gulls (Larus hyperboreus). Chemosphere 37, 2627-2643.
Henriksen, E. O., Gabrielsen, G. W., Trudeau, S., Wolkers, J., Sagerup, K. and Skaare, J. U. (2000). Organochlorines and possible biochemical effects in glaucous gulls (Larus hyperboreus) from Bjornoya, the Barents sea. Archives of Environmental Contamination and Toxicology 38, 234-243.
Herzke, D., Gabrielsen, G. W., Evenset, A. and Burkow, I. C. (2003). Polychlorinated camphenes (toxaphenes), polybrominated diphenylethers and other halogenated organic pollutants in glaucous gull (Larus hyperboreus) from Svalbard and Bjornoya (Bear Island). Environmental Pollution 121, 293-300.
Hop, H., Pearson, T., Hegseth, E. N., Kovacs, K. M., Wiencke, C., Kwasniewski, S., Eiane, K., Mehlum, F., Gulliksen, B., Wlodarska-Kowalezuk, M. et al. (2002). The marine ecosystem of Kongsfjorden, Svalbard. Polar Research 21, 167-208.
Hop, H., Falk-Petersen, S., Svendsen, H., Kwasniewski, S., Pavlov, V., Pavlova, O. and Soreide, J. E. (2006). Physical and biological characteristics of the pelagic system across Fram Strait to Kongsfjorden. Progress in Oceanography 71, 182-231.
Houde, M., Martin, J. W., Letcher, R. J., Solomon, K. R. and Muir, D. C. G. (2006). Biological monitoring of polyfluoroalkyl substances: A review. Environmental Science & Technology 40, 3463-3473.
Houde, M., De Silva, A. O., Muir, D. C. G. and Letcher, R. J. (2011). Monitoring of Perfluorinated Compounds in Aquatic Biota: An Updated Review PFCs in Aquatic Biota. Environmental Science & Technology 45, 7962-7973.
Jensen, A. A. and Leffers, H. (2008). Emerging endocrine disrupters: perfluoroalkylated substances. International Journal of Andrology 31, 161-169.
Jenssen, B. M. (2006). Endocrine-disrupting chemicals and climate change: A worst-case combination for arctic marine mammals and seabirds? Environmental Health Perspectives 114, 76-80.
Jolicoeur, P. and Mosimann, J. E. (1960). Size and shape variation in the painted turtle, a principal component analysis. Growth, 24:339-354.
Kato, K., Wong, L. Y., Jia, L. T., Kuklenyik, Z. and Calafat, A. M. (2011). Trends in Exposure to Polyfluoroalkyl Chemicals in the US Population: 1999-2008. Environmental Science & Technology 45, 8037-8045.
References
61
Kelly, B. C., Ikonomou, M. G., Blair, J. D., Surridge, B., Hoover, D., Grace, R. and Gobas, F. (2009). Perfluoroalkyl Contaminants in an Arctic Marine Food Web: Trophic Magnification and Wildlife Exposure. Environmental Science & Technology 43, 4037-4043.
Key, B. D., Howell, R. D. and Criddle, C. S. (1997). Fluorinated organics in the biosphere. Environmental Science & Technology 31, 2445-2454.
Kogai, T. and Brent, G. (2005). Thyroid hormones (T4, T3). In Endocrinology, (ed. S. Melmed and P. Conn): Humana Press.
Lau, C., Anitole, K., Hodes, C., Lai, D., Pfahles-Hutchens, A. and Seed, J. (2007). Perfluoroalkyl acids: A review of monitoring and toxicological findings. Toxicological Sciences 99, 366-394.
Legler, J. and Brouwer, A. (2003). Are brominated flame retardants endocrine disruptors? Environment International 29, 879-885.
Letcher, R. J., Bustnes, J. O., Dietz, R., Jenssen, B. M., Jorgensen, E. H., Sonne, C., Verreault, J., Vijayan, M. M. and Gabrielsen, G. W. (2010). Exposure and effects assessment of persistent organohalogen contaminants in arctic wildlife and fish. Science of the Total Environment 408, 2995-3043.
Liu, Y., Wang, J. S., Fang, X. M., Zhang, H. X. and Dai, J. Y. (2011). The thyroid-disrupting effects of long-term perfluorononanoate exposure on zebrafish (Danio rerio). Ecotoxicology 20, 47-55.
Lundstedt, T., Seifert, E., Abramo, L., Thelin, B., Nystrom, A., Pettersen, J. and Bergman, R. (1998). Experimental design and optimization. Chemometrics and Intelligent Laboratory Systems 42, 3-40.
Løvenskiold, H. L. (1964). Avifauna svalbardensis. Norsk Polarinstiutt Skrifter, 129:1-460.
Martin, J. W., Mabury, S. A., Solomon, K. R. and Muir, D. C. G. (2003). Bioconcentration and tissue distribution of perfluorinated acids in rainbow trout (Oncorhynchus mykiss). Environmental Toxicology and Chemistry 22, 196-204.
Martin, J. W., Smithwick, M. M., Braune, B. M., Hoekstra, P. F., Muir, D. C. G. and Mabury, S. A. (2004). Identification of long-chain perfluorinated acids in biota from the Canadian Arctic. Environmental Science & Technology 38, 373-380.
Martin, M. T., Brennan, R. J., Hu, W. Y., Ayanoglu, E., Lau, C., Ren, H. Z., Wood, C. R., Corton, J. C., Kavlock, R. J. and Dix, D. J. (2007). Toxicogenomic study of triazole fungicides and perfluoroalkyl acids in rat livers predicts toxicity and categorizes chemicals based on mechanisms of toxicity. Toxicological Sciences 97, 595-613.
McKinney, M. A., Peacock, E. and Letcher, R. J. (2009). Sea Ice-associated Diet Change Increases the Levels of Chlorinated and Brominated Contaminants in Polar Bears. Environmental Science & Technology 43, 4334-4339.
McNabb, A. (1992). Thyroid hormones. New Jersey: Prentice Hall Inc.
References
62
McNabb, F. (2000). Thyroids. Whittow, GC. (Ed.), Sturkie's Avian Physiology, 5th ed.: Academic Press, New York, p.461-471.
McNabb, F. M. A. (2007). The Hypothalamic-Pituitary-Thyroid (HPT) Axis in Birds and Its Role in Bird Development and Reproduction. Critical Reviews in Toxicology 37, 163-193.
Meerts, I., van Zanden, J. J., Luijks, E. A. C., van Leeuwen-Bol, I., Marsh, G., Jakobsson, E., Bergman, A. and Brouwer, A. (2000). Potent competitive interactions of some brominated flame retardants and related compounds with human transthyretin in vitro. Toxicological Sciences 56, 95-104.
Merryman, J. I. and Buckles, E. L. (1998a). The avian thyroid gland. Part one: A review of the anatomy and physiology. Journal of Avian Medicine and Surgery 12, 234-237.
Merryman, J. I. and Buckles, E. L. (1998b). The avian thyroid gland. Part two: A review of function and pathophysiology. Journal of Avian Medicine and Surgery 12, 238-242.
Miljeteig, C., Strom, H., Gavrilo, M. V., Volkov, A., Jenssen, B. M. and Gabrielsen, G. W. (2009). High Levels of Contaminants in Ivory Gull Pagophila eburnea Eggs from the Russian and Norwegian Arctic. Environmental Science & Technology 43, 5521-5528.
Miljeteig, C. and Gabrielsen, G. (2010). Contaminants in Brünnich's guillemots from Kongsfjorden and Bjørnøya in the period from 1993 to 2007. Brief Report Series, Norwegian Polar Institute, Tromsø.
Moe, B., Stempniewicz, L., Jakubas, D., Angelier, F., Chastel, O., Dinessen, F., Gabrielsen, G. W., Hanssen, F., Karnovsky, N. J., Ronning, B. et al. (2009). Climate change and phenological responses of two seabird species breeding in the high-Arctic. Marine Ecology-Progress Series 393, 235-246.
Murvoll, K. M., Skaare, J. U., Jensen, H. and Jenssen, B. M. (2007). Associations between persistent organic pollutants and vitamin status in Brunnich's guillemot and common eider hatchlings. Science of the Total Environment 381, 134-145.
Nøst, T. H., Helgason, L. B., Harju, M., Heimstad, E. S., Gabrielsen, G. W. and Jenssen, B. M. (2011). Halogenated organic contaminants and their correlations with circulating thyroid hormones in developing Arctic seabirds. Science of the Total Environment In review.
Pitarch, E., Medina, C., Portoles, T., Lopez, F. J. and Hernandez, F. (2007). Determination of priority organic micro-pollutants in water by gas chromatography coupled to triple quadrupole mass spectrometry. Analytica Chimica Acta 583, 246-258.
Power, D. M., Llewellyn, L., Faustino, M., Nowell, M. A., Bjornsson, B. T., Einarsdottir, I. E., Canario, A. V. M. and Sweeney, G. E. (2001). Thyroid hormones in growth and development of fish. Comparative Biochemistry and Physiology C-Toxicology & Pharmacology 130, 447-459.
REACH. (2011). Available at: http://ec.europa.eu/environment/chemicals/reach/reach_intro.htm [Accessed 31 October 2011].
References
63
Rylander, C., Duong, T. P., Odland, J. O. and Sandanger, T. M. (2009). Perfluorinated compounds in delivering women from south central Vietnam. Journal of Environmental Monitoring 11, 2002-2008.
Schiedek, D., Sundelin, B., Readman, J. W. and Macdonald, R. W. (2007). Interactions between climate change and contaminants. Marine Pollution Bulletin 54, 1845-1856.
Shi, X., Liu, C., Wu, G. and Zhou, B. (2009). Waterborne exposure to PFOS causes disruption of the hypothalamus-pituitary-thyroid axis in zebrafish larvae. Chemosphere 77, 1010-1018.
Sigmond, J., Salomons, B. and Terpstra, M. (1992). Immunoassay patents: A survey of patents and patent applications, 1980 - 1991,. London, GBR, Spon Press.
Stockholm Convention. (2011a). Stockholm Convention on persistent organic pollutants (POPs). Available at: http://chm.pops.int/convention/thePOPs/tabid/673/language/en-US/default.aspx [Accessed 1 November 2011].
Stockholm Convention. (2011b). Stockholm Convention on persistent organic pollutants (POPs) Available at: http://chm.pops.int/Implementation/NewPOPs/ThenewPOPs/tabid/672/Default.aspx [Accessed 5 November 2011].
Tomy, G. T., Budakowski, W., Halldorson, T., Helm, P. A., Stern, G. A., Friesen, K., Pepper, K., Tittlemier, S. A. and Fisk, A. T. (2004a). Fluorinated organic compounds in an eastern Arctic marine food web. Environmental Science & Technology 38, 6475-6481.
Tomy, G. T., Tittlemier, S. A., Palace, V. P., Budakowski, W. R., Braekevelt, E., Brinkworth, L. and Friesen, K. (2004b). Biotransformation of N-ethyl perfluorooctanesulfonamide by rainbow trout (Onchorhynchus mykiss) liver microsomes. Environmental Science & Technology 38, 758-762.
Trygg, J. and Wold, S. (2002). Orthogonal projections to latent structures (O-PLS). Journal of Chemometrics 16, 119-128.
Ucan-Marin, F., Arukwe, A., Mortensen, A., Gabrielsen, G. W., Fox, G. A. and Letcher, R. J. (2009). Recombinant Transthyretin Purification and Competitive Binding with Organohalogen Compounds in Two Gull Species (Larus argentatus and Larus hyperboreus). Toxicological Sciences 107, 440-450.
Ucan-Marin, F., Arukwe, A., Mortensen, A. S., Gabrielsen, G. W. and Letcher, R. J. (2010). Recombinant Albumin and Transthyretin Transport Proteins from Two Gull Species and Human: Chlorinated and Brominated Contaminant Binding and Thyroid Hormones. Environmental Science & Technology 44, 497-504.
Verreault, J., Skaare, J. U., Jenssen, B. M. and Gabrielsen, G. W. (2004). Effects of organochlorine contaminants on thyroid hormone levels in arctic breeding glaucous gulls, Larus hyperboreus. Environmental Health Perspectives 112, 532-537.
Verreault, J., Gabrielsen, G. V., Chu, S. G., Muir, D. C. G., Andersen, M., Hamaed, A. and Letcher, R. J. (2005a). Flame retardants and methoxylated and hydroxylated
References
64
polybrominated diphenyl ethers in two Norwegian Arctic top predators: Glaucous gulls and polar bears. Environmental Science & Technology 39, 6021-6028.
Verreault, J., Houde, M., Gabrielsen, G. W., Berger, U., Haukas, M., Letcher, R. J. and Muir, D. C. G. (2005b). Perfluorinated alkyl substances in plasma, liver, brain, and eggs of glaucous gulls (Larus hyperboreus) from the Norwegian Arctic. Environmental Science & Technology 39, 7439-7445.
Verreault, J., Bech, C., Letcher, R. J., Ropstad, E., Dahl, E. and Gabrielsen, G. W. (2006). Organohalogen contamination in breeding glaucous gulls from the Norwegian Arctic: Associations with basal metabolism and circulating thyroid hormones. Environmental Pollution 145, 138-145.
Verreault, J., Berger, U. and Gabrielsen, G. W. (2007). Trends of perfluorinated alkyl substances in herring gull eggs from two coastal colonies in northern norway: 1983-2003. Environmental Science & Technology 41, 6671-6677.
Verreault, J., Gabrielsen, G. W. and Bustnes, J. O. (2010). The Svalbard Glaucous Gull as Bioindicator Species in the European Arctic: Insight from 35 Years of Contaminants Research. In Reviews of Environmental Contamination and Toxicology, vol. 205 (ed. D. M. Whitacre), pp. 77-116. New York: Springer.
Vongphachan, V., Cassone, C. G., Wu, D. M., Chiu, S. Z., Crump, D. and Kennedy, S. W. (2011). Effects of Perfluoroalkyl Compounds on mRNA Expression Levels of Thyroid Hormone-Responsive Genes in Primary Cultures of Avian Neuronal Cells. Toxicological Sciences 120, 392-402.
Widmaier, E., Raff, H. and Strang, K. (2006). Vander's Human Physiology: The mechanism of Body Function, 11th ed, McGraw-Hill, New York, p. 319-349.
Wold, A., Jaeger, I., Hop, H., Gabrielsen, G. W. and Falk-Petersen, S. (2011). Arctic seabird food chains explored by fatty acid composition and stable isotopes in Kongsfjorden, Svalbard. Polar Biology 34, 1147-1155.
Xu, L., Krenitsky, D. M., Seacat, A. M., Butenhoff, J. L. and Anders, M. W. (2004). Biotransformation of N-ethyl-N-(2-hydroxyethyl)perfluorooetanesulfonamide by rat liver microsomes, cytosol, and slices and by expressed rat and human cytochromes P450. Chemical Research in Toxicology 17, 767-775.
Yen, P. M. and Chin, W. W. (1994). Molecular mechanism of dominant-negative activity by nuclear hormone receptors. Molecular Endocrinology 8, 1450-1454.
Zoeller, R. T., Tan, S. W. and Tyl, R. W. (2007). General background on the hypothalamic-pituitary-thyroid (HPT) axis. Critical Reviews in Toxicology 37, 11-53.
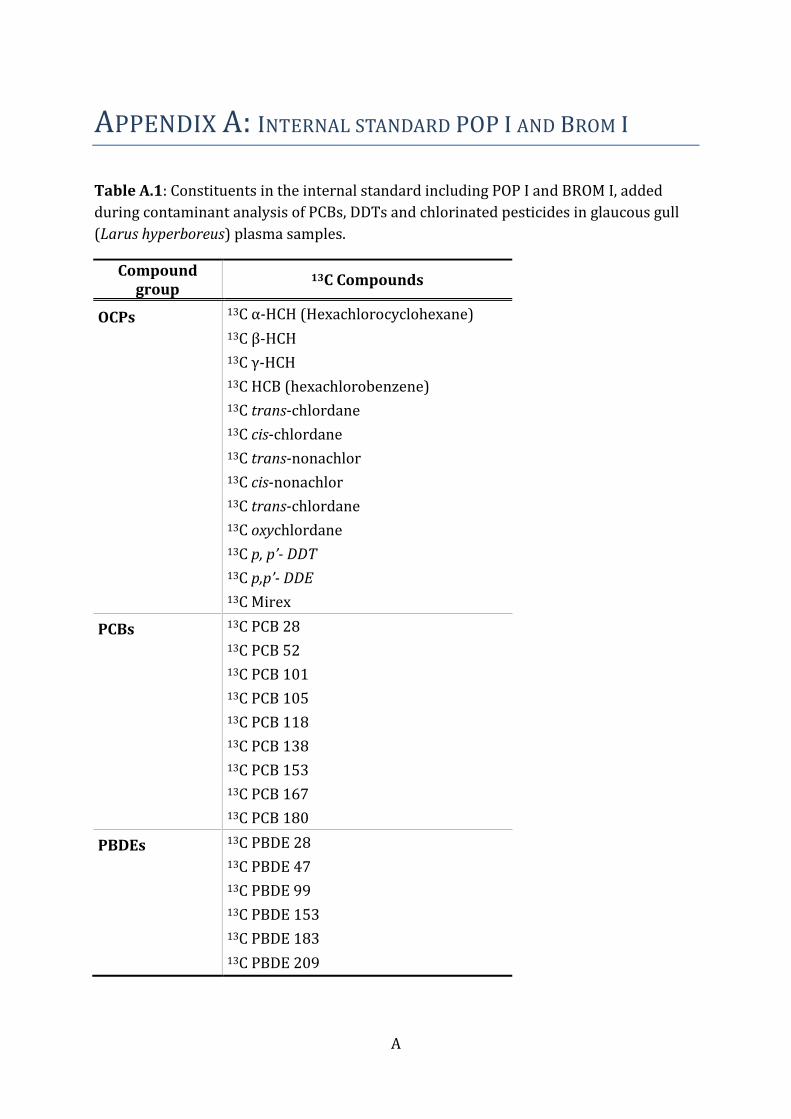
A
APPENDIX A: INTERNAL STANDARD POP I AND BROM I
Table A.1: Constituents in the internal standard including POP I and BROM I, added
during contaminant analysis of PCBs, DDTs and chlorinated pesticides in glaucous gull
(Larus hyperboreus) plasma samples.
Compound group
13C Compounds
OCPs 13C α-HCH (Hexachlorocyclohexane)
13C β-HCH
13C γ-HCH
13C HCB (hexachlorobenzene)
13C trans-chlordane
13C cis-chlordane
13C trans-nonachlor
13C cis-nonachlor
13C trans-chlordane
13C oxychlordane
13C p, p’- DDT
13C p,p’- DDE
13C Mirex
PCBs 13C PCB 28
13C PCB 52
13C PCB 101
13C PCB 105
13C PCB 118
13C PCB 138
13C PCB 153
13C PCB 167
13C PCB 180
PBDEs 13C PBDE 28
13C PBDE 47
13C PBDE 99
13C PBDE 153
13C PBDE 183
13C PBDE 209
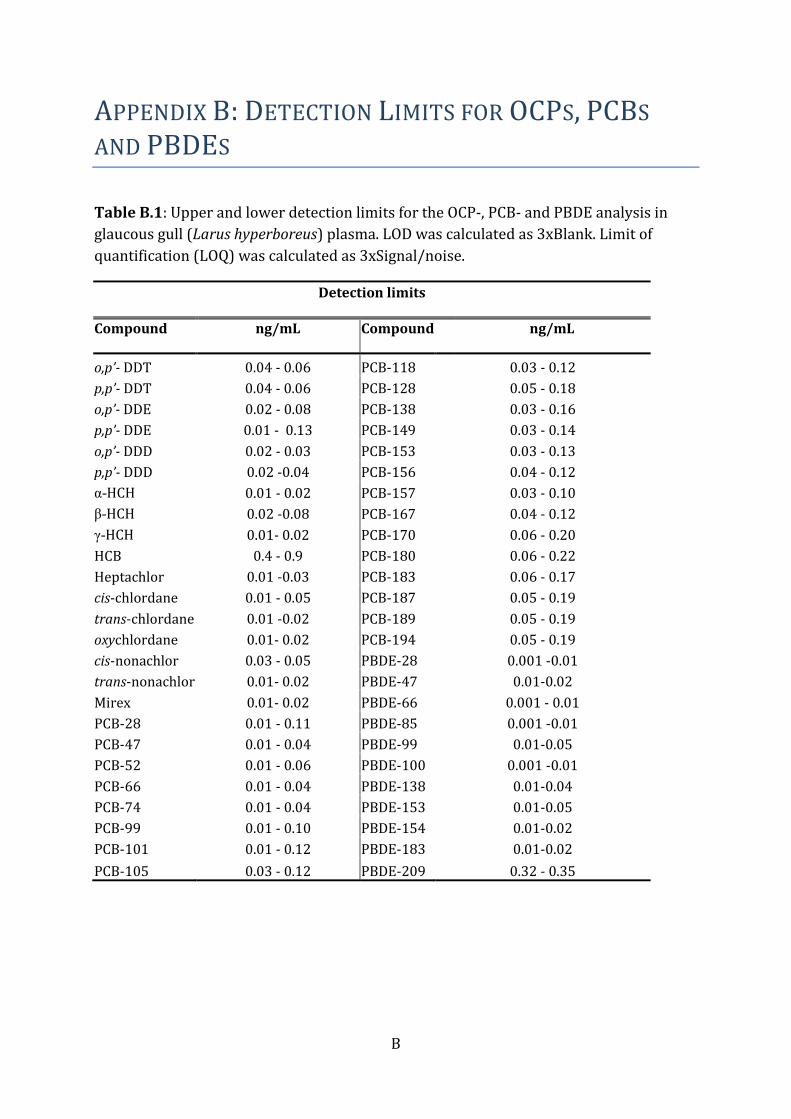
B
APPENDIX B: DETECTION LIMITS FOR OCPS, PCBS
AND PBDES
Table B.1: Upper and lower detection limits for the OCP-, PCB- and PBDE analysis in
glaucous gull (Larus hyperboreus) plasma. LOD was calculated as 3xBlank. Limit of
quantification (LOQ) was calculated as 3xSignal/noise.
Detection limits
Compound ng/mL Compound ng/mL
o,p’- DDT 0.04 - 0.06 PCB-118 0.03 - 0.12
p,p’- DDT 0.04 - 0.06 PCB-128 0.05 - 0.18
o,p’- DDE 0.02 - 0.08 PCB-138 0.03 - 0.16
p,p’- DDE 0.01 - 0.13 PCB-149 0.03 - 0.14
o,p’- DDD 0.02 - 0.03 PCB-153 0.03 - 0.13
p,p’- DDD 0.02 -0.04 PCB-156 0.04 - 0.12
α-HCH 0.01 - 0.02 PCB-157 0.03 - 0.10
β-HCH 0.02 -0.08 PCB-167 0.04 - 0.12
γ-HCH 0.01- 0.02 PCB-170 0.06 - 0.20
HCB 0.4 - 0.9 PCB-180 0.06 - 0.22
Heptachlor 0.01 -0.03 PCB-183 0.06 - 0.17
cis-chlordane 0.01 - 0.05 PCB-187 0.05 - 0.19
trans-chlordane 0.01 -0.02 PCB-189 0.05 - 0.19
oxychlordane 0.01- 0.02 PCB-194 0.05 - 0.19
cis-nonachlor 0.03 - 0.05 PBDE-28 0.001 -0.01
trans-nonachlor 0.01- 0.02 PBDE-47 0.01-0.02
Mirex 0.01- 0.02 PBDE-66 0.001 - 0.01
PCB-28 0.01 - 0.11 PBDE-85 0.001 -0.01
PCB-47 0.01 - 0.04 PBDE-99 0.01-0.05
PCB-52 0.01 - 0.06 PBDE-100 0.001 -0.01
PCB-66 0.01 - 0.04 PBDE-138 0.01-0.04
PCB-74 0.01 - 0.04 PBDE-153 0.01-0.05
PCB-99 0.01 - 0.10 PBDE-154 0.01-0.02
PCB-101 0.01 - 0.12 PBDE-183 0.01-0.02
PCB-105 0.03 - 0.12 PBDE-209 0.32 - 0.35
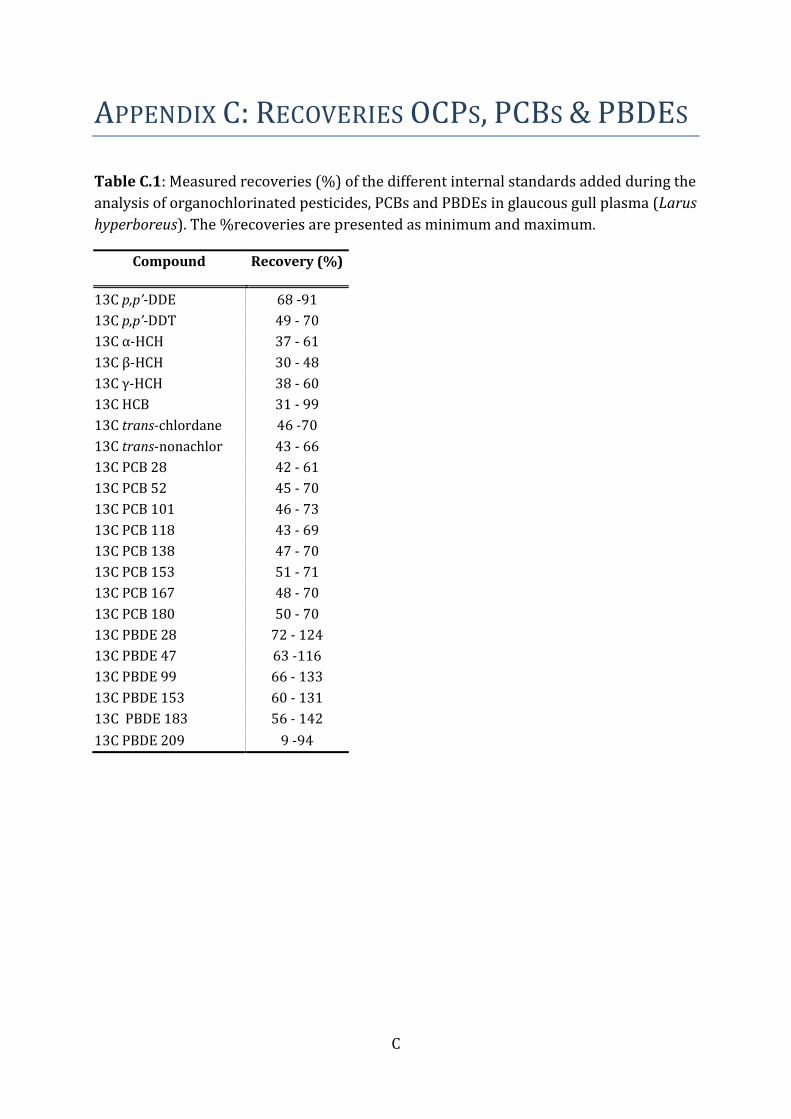
C
APPENDIX C: RECOVERIES OCPS, PCBS & PBDES
Table C.1: Measured recoveries (%) of the different internal standards added during the
analysis of organochlorinated pesticides, PCBs and PBDEs in glaucous gull plasma (Larus
hyperboreus). The %recoveries are presented as minimum and maximum.
Compound Recovery (%)
13C p,p’-DDE 68 -91
13C p,p’-DDT 49 - 70
13C α-HCH 37 - 61
13C β-HCH 30 - 48
13C γ-HCH 38 - 60
13C HCB 31 - 99
13C trans-chlordane 46 -70
13C trans-nonachlor 43 - 66
13C PCB 28 42 - 61
13C PCB 52 45 - 70
13C PCB 101 46 - 73
13C PCB 118 43 - 69
13C PCB 138 47 - 70
13C PCB 153 51 - 71
13C PCB 167 48 - 70
13C PCB 180 50 - 70
13C PBDE 28 72 - 124
13C PBDE 47 63 -116
13C PBDE 99 66 - 133
13C PBDE 153 60 - 131
13C PBDE 183 56 - 142
13C PBDE 209 9 -94

D
APPENDIX D: INTERNAL STANDARD PFASS
Table D.1: Constituents in the internal standard added during contaminant analysis of
PFASs in glaucous gull (Larus hyperboreus) plasma samples.
13C PFASs
13C4 PFBA
13C5 PFPA
13C5 PFHxA
13C4 PFHpA
13C4 PFOA
13C5 PFNA
13C6 PFDcA
13C7 PFUnA
13C2 PFDoA
13C3 PFHxS
13C4 PFOS
13C8 PFOSA
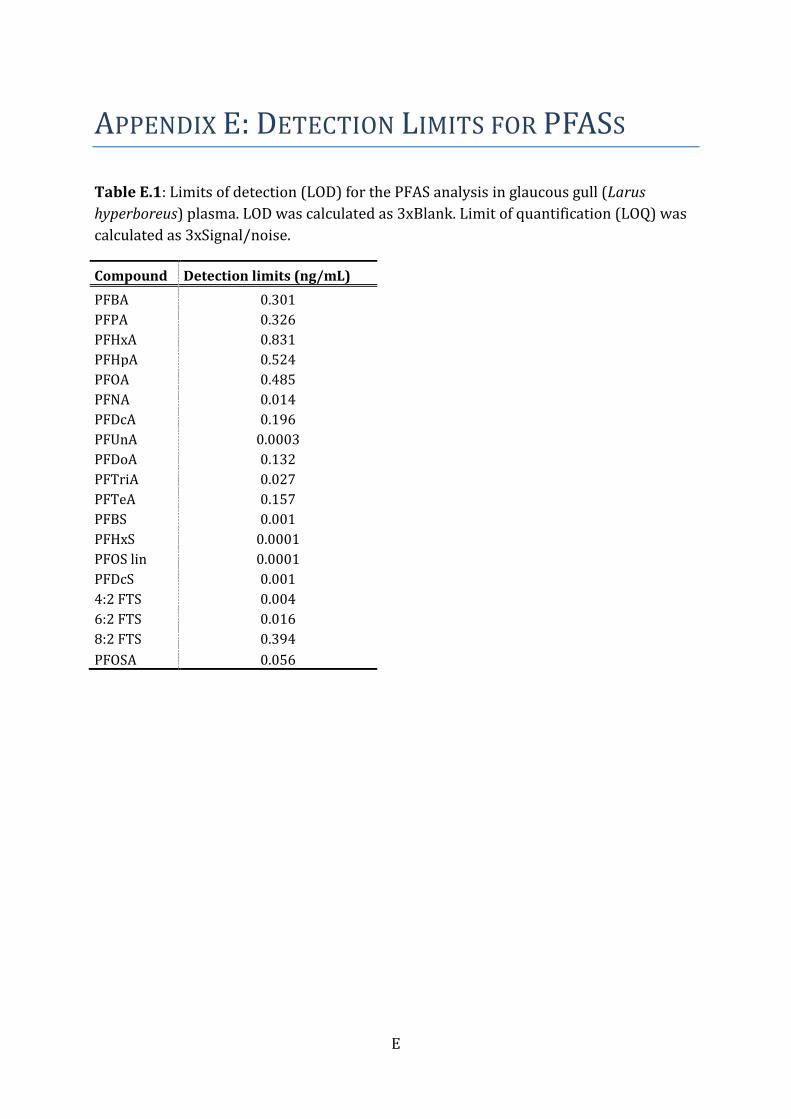
E
APPENDIX E: DETECTION LIMITS FOR PFASS
Table E.1: Limits of detection (LOD) for the PFAS analysis in glaucous gull (Larus
hyperboreus) plasma. LOD was calculated as 3xBlank. Limit of quantification (LOQ) was
calculated as 3xSignal/noise.
Compound Detection limits (ng/mL)
PFBA 0.301
PFPA 0.326
PFHxA 0.831
PFHpA 0.524
PFOA 0.485
PFNA 0.014
PFDcA 0.196
PFUnA 0.0003
PFDoA 0.132
PFTriA 0.027
PFTeA 0.157
PFBS 0.001
PFHxS 0.0001
PFOS lin 0.0001
PFDcS 0.001
4:2 FTS 0.004
6:2 FTS 0.016
8:2 FTS 0.394
PFOSA 0.056
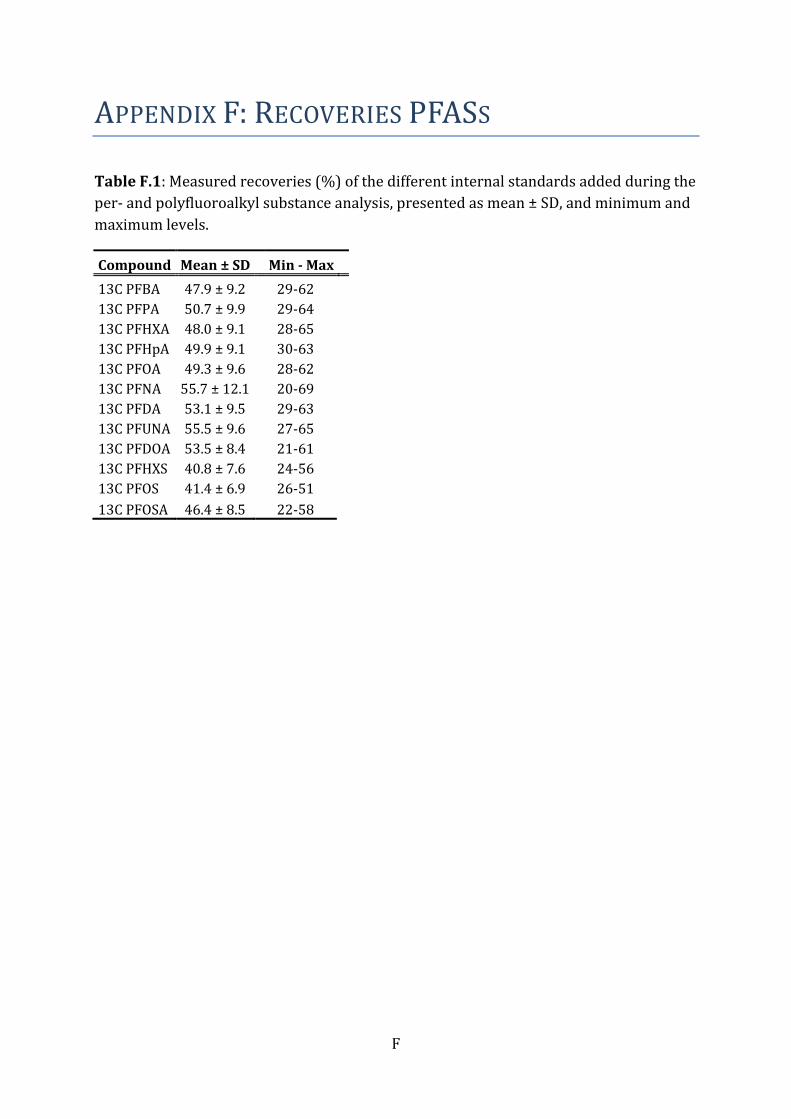
F
APPENDIX F: RECOVERIES PFASS
Table F.1: Measured recoveries (%) of the different internal standards added during the
per- and polyfluoroalkyl substance analysis, presented as mean ± SD, and minimum and
maximum levels.
Compound Mean ± SD Min - Max
13C PFBA 47.9 ± 9.2 29-62
13C PFPA 50.7 ± 9.9 29-64
13C PFHXA 48.0 ± 9.1 28-65
13C PFHpA 49.9 ± 9.1 30-63
13C PFOA 49.3 ± 9.6 28-62
13C PFNA 55.7 ± 12.1 20-69
13C PFDA 53.1 ± 9.5 29-63
13C PFUNA 55.5 ± 9.6 27-65
13C PFDOA 53.5 ± 8.4 21-61
13C PFHXS 40.8 ± 7.6 24-56
13C PFOS 41.4 ± 6.9 26-51
13C PFOSA 46.4 ± 8.5 22-58
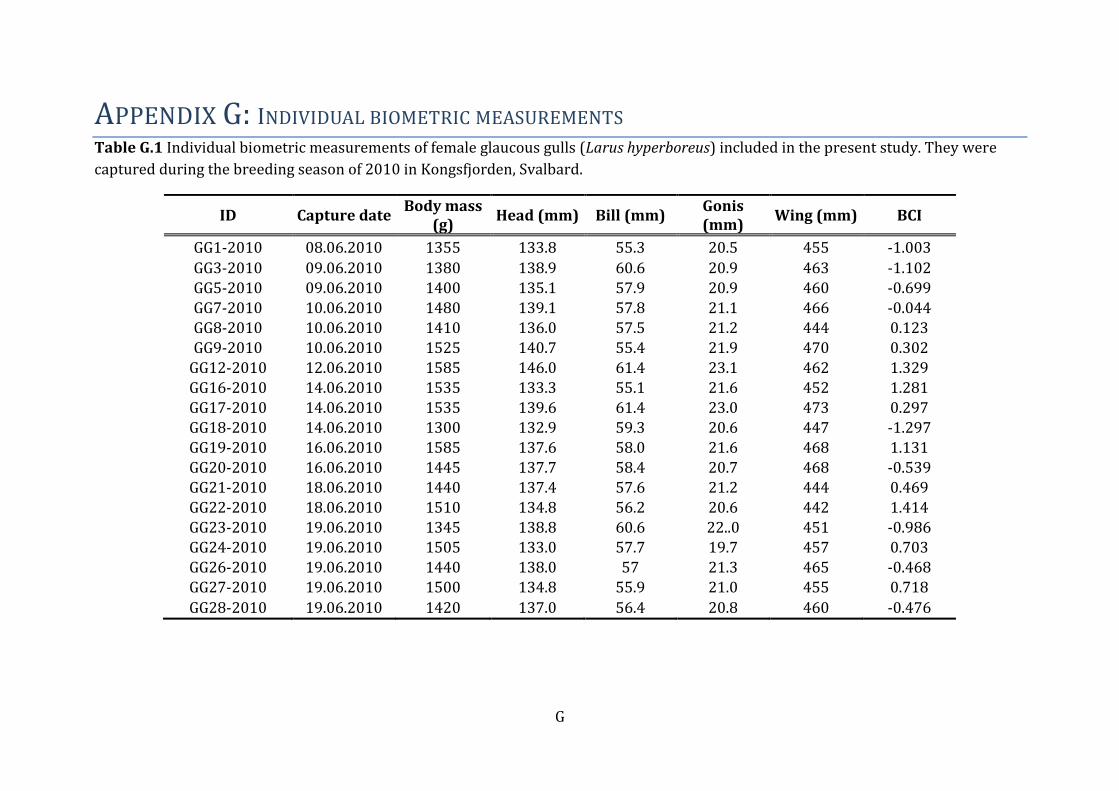
G
APPENDIX G: INDIVIDUAL BIOMETRIC MEASUREMENTS Table G.1 Individual biometric measurements of female glaucous gulls (Larus hyperboreus) included in the present study. They were
captured during the breeding season of 2010 in Kongsfjorden, Svalbard.
ID Capture date Body mass
(g) Head (mm) Bill (mm)
Gonis (mm)
Wing (mm) BCI
GG1-2010 08.06.2010 1355 133.8 55.3 20.5 455 -1.003
GG3-2010 09.06.2010 1380 138.9 60.6 20.9 463 -1.102 GG5-2010 09.06.2010 1400 135.1 57.9 20.9 460 -0.699 GG7-2010 10.06.2010 1480 139.1 57.8 21.1 466 -0.044 GG8-2010 10.06.2010 1410 136.0 57.5 21.2 444 0.123 GG9-2010 10.06.2010 1525 140.7 55.4 21.9 470 0.302
GG12-2010 12.06.2010 1585 146.0 61.4 23.1 462 1.329 GG16-2010 14.06.2010 1535 133.3 55.1 21.6 452 1.281 GG17-2010 14.06.2010 1535 139.6 61.4 23.0 473 0.297 GG18-2010 14.06.2010 1300 132.9 59.3 20.6 447 -1.297 GG19-2010 16.06.2010 1585 137.6 58.0 21.6 468 1.131 GG20-2010 16.06.2010 1445 137.7 58.4 20.7 468 -0.539 GG21-2010 18.06.2010 1440 137.4 57.6 21.2 444 0.469
GG22-2010 18.06.2010 1510 134.8 56.2 20.6 442 1.414 GG23-2010 19.06.2010 1345 138.8 60.6 22..0 451 -0.986 GG24-2010 19.06.2010 1505 133.0 57.7 19.7 457 0.703 GG26-2010 19.06.2010 1440 138.0 57 21.3 465 -0.468 GG27-2010 19.06.2010 1500 134.8 55.9 21.0 455 0.718
GG28-2010 19.06.2010 1420 137.0 56.4 20.8 460 -0.476
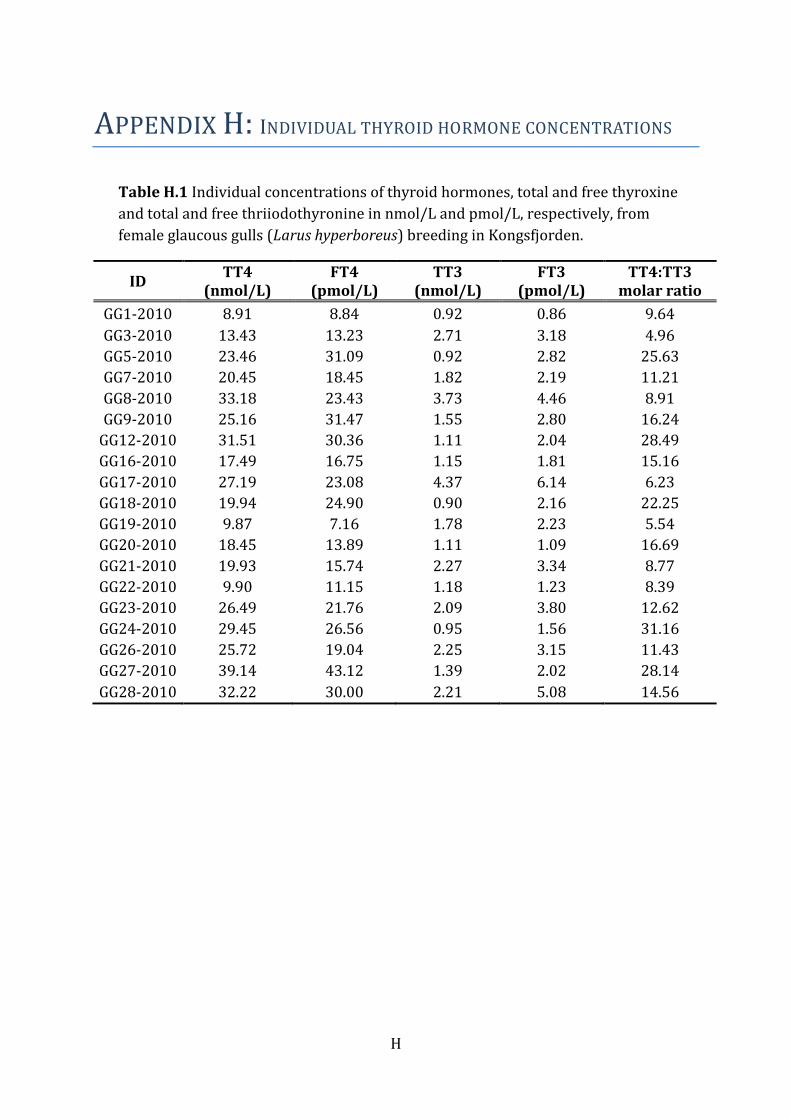
H
APPENDIX H: INDIVIDUAL THYROID HORMONE CONCENTRATIONS
Table H.1 Individual concentrations of thyroid hormones, total and free thyroxine
and total and free thriiodothyronine in nmol/L and pmol/L, respectively, from
female glaucous gulls (Larus hyperboreus) breeding in Kongsfjorden.
ID TT4
(nmol/L) FT4
(pmol/L) TT3
(nmol/L) FT3
(pmol/L) TT4:TT3
molar ratio
GG1-2010 8.91 8.84 0.92 0.86 9.64
GG3-2010 13.43 13.23 2.71 3.18 4.96
GG5-2010 23.46 31.09 0.92 2.82 25.63
GG7-2010 20.45 18.45 1.82 2.19 11.21
GG8-2010 33.18 23.43 3.73 4.46 8.91
GG9-2010 25.16 31.47 1.55 2.80 16.24
GG12-2010 31.51 30.36 1.11 2.04 28.49
GG16-2010 17.49 16.75 1.15 1.81 15.16
GG17-2010 27.19 23.08 4.37 6.14 6.23
GG18-2010 19.94 24.90 0.90 2.16 22.25
GG19-2010 9.87 7.16 1.78 2.23 5.54
GG20-2010 18.45 13.89 1.11 1.09 16.69
GG21-2010 19.93 15.74 2.27 3.34 8.77
GG22-2010 9.90 11.15 1.18 1.23 8.39
GG23-2010 26.49 21.76 2.09 3.80 12.62
GG24-2010 29.45 26.56 0.95 1.56 31.16
GG26-2010 25.72 19.04 2.25 3.15 11.43
GG27-2010 39.14 43.12 1.39 2.02 28.14
GG28-2010 32.22 30.00 2.21 5.08 14.56
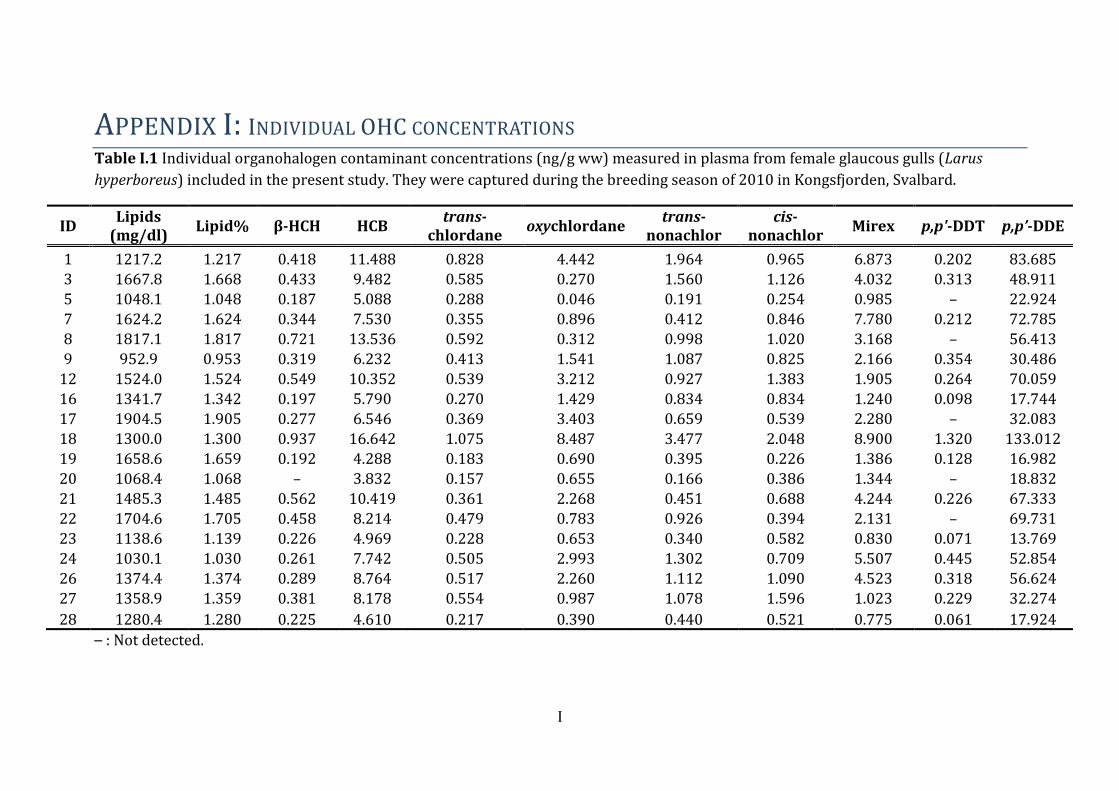
I
APPENDIX I: INDIVIDUAL OHC CONCENTRATIONS Table I.1 Individual organohalogen contaminant concentrations (ng/g ww) measured in plasma from female glaucous gulls (Larus
hyperboreus) included in the present study. They were captured during the breeding season of 2010 in Kongsfjorden, Svalbard.
ID Lipids
(mg/dl) Lipid% β-HCH HCB
trans-chlordane
oxychlordane trans-
nonachlor cis-
nonachlor Mirex p,p'-DDT p,p’-DDE
1 1217.2 1.217 0.418 11.488 0.828 4.442 1.964 0.965 6.873 0.202 83.685 3 1667.8 1.668 0.433 9.482 0.585 0.270 1.560 1.126 4.032 0.313 48.911 5 1048.1 1.048 0.187 5.088 0.288 0.046 0.191 0.254 0.985 – 22.924 7 1624.2 1.624 0.344 7.530 0.355 0.896 0.412 0.846 7.780 0.212 72.785 8 1817.1 1.817 0.721 13.536 0.592 0.312 0.998 1.020 3.168 – 56.413 9 952.9 0.953 0.319 6.232 0.413 1.541 1.087 0.825 2.166 0.354 30.486
12 1524.0 1.524 0.549 10.352 0.539 3.212 0.927 1.383 1.905 0.264 70.059 16 1341.7 1.342 0.197 5.790 0.270 1.429 0.834 0.834 1.240 0.098 17.744 17 1904.5 1.905 0.277 6.546 0.369 3.403 0.659 0.539 2.280 – 32.083 18 1300.0 1.300 0.937 16.642 1.075 8.487 3.477 2.048 8.900 1.320 133.012 19 1658.6 1.659 0.192 4.288 0.183 0.690 0.395 0.226 1.386 0.128 16.982 20 1068.4 1.068 – 3.832 0.157 0.655 0.166 0.386 1.344 – 18.832 21 1485.3 1.485 0.562 10.419 0.361 2.268 0.451 0.688 4.244 0.226 67.333
22 1704.6 1.705 0.458 8.214 0.479 0.783 0.926 0.394 2.131 – 69.731 23 1138.6 1.139 0.226 4.969 0.228 0.653 0.340 0.582 0.830 0.071 13.769 24 1030.1 1.030 0.261 7.742 0.505 2.993 1.302 0.709 5.507 0.445 52.854 26 1374.4 1.374 0.289 8.764 0.517 2.260 1.112 1.090 4.523 0.318 56.624 27 1358.9 1.359 0.381 8.178 0.554 0.987 1.078 1.596 1.023 0.229 32.274
28 1280.4 1.280 0.225 4.610 0.217 0.390 0.440 0.521 0.775 0.061 17.924
– : Not detected.
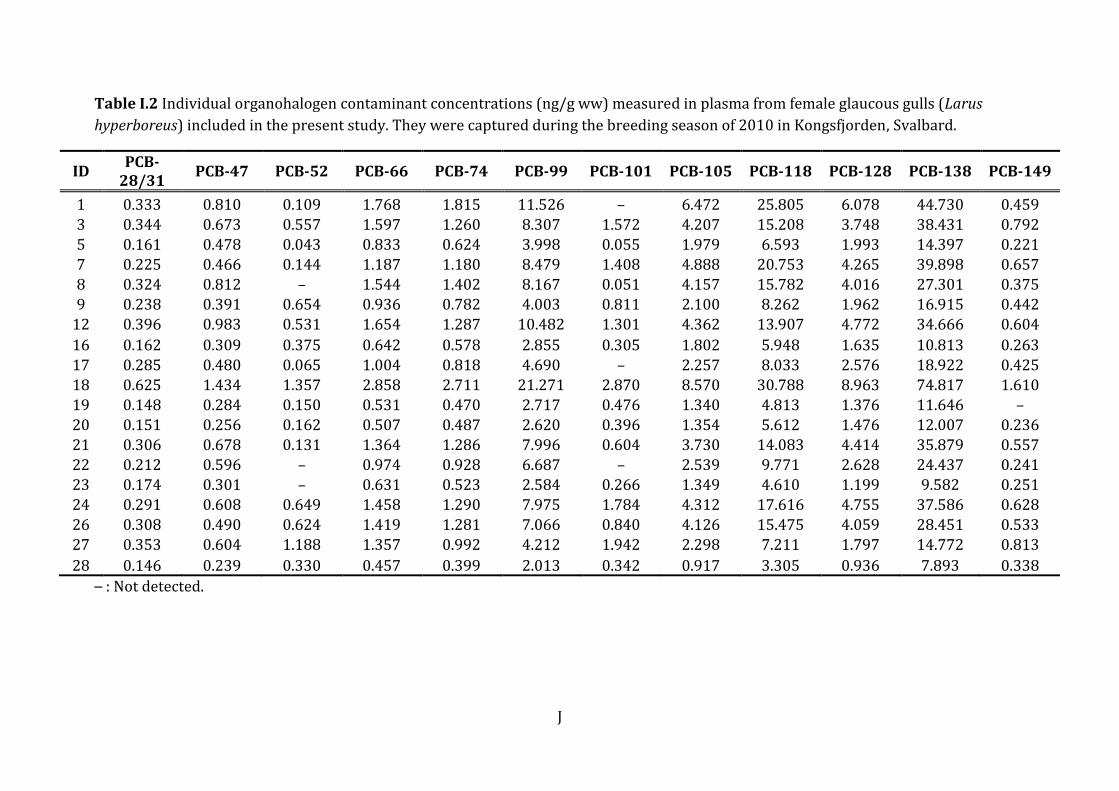
J
Table I.2 Individual organohalogen contaminant concentrations (ng/g ww) measured in plasma from female glaucous gulls (Larus
hyperboreus) included in the present study. They were captured during the breeding season of 2010 in Kongsfjorden, Svalbard.
ID PCB-
28/31 PCB-47 PCB-52 PCB-66 PCB-74 PCB-99 PCB-101 PCB-105 PCB-118 PCB-128 PCB-138 PCB-149
1 0.333 0.810 0.109 1.768 1.815 11.526 – 6.472 25.805 6.078 44.730 0.459
3 0.344 0.673 0.557 1.597 1.260 8.307 1.572 4.207 15.208 3.748 38.431 0.792 5 0.161 0.478 0.043 0.833 0.624 3.998 0.055 1.979 6.593 1.993 14.397 0.221 7 0.225 0.466 0.144 1.187 1.180 8.479 1.408 4.888 20.753 4.265 39.898 0.657 8 0.324 0.812 – 1.544 1.402 8.167 0.051 4.157 15.782 4.016 27.301 0.375 9 0.238 0.391 0.654 0.936 0.782 4.003 0.811 2.100 8.262 1.962 16.915 0.442
12 0.396 0.983 0.531 1.654 1.287 10.482 1.301 4.362 13.907 4.772 34.666 0.604
16 0.162 0.309 0.375 0.642 0.578 2.855 0.305 1.802 5.948 1.635 10.813 0.263
17 0.285 0.480 0.065 1.004 0.818 4.690 – 2.257 8.033 2.576 18.922 0.425 18 0.625 1.434 1.357 2.858 2.711 21.271 2.870 8.570 30.788 8.963 74.817 1.610 19 0.148 0.284 0.150 0.531 0.470 2.717 0.476 1.340 4.813 1.376 11.646 – 20 0.151 0.256 0.162 0.507 0.487 2.620 0.396 1.354 5.612 1.476 12.007 0.236 21 0.306 0.678 0.131 1.364 1.286 7.996 0.604 3.730 14.083 4.414 35.879 0.557 22 0.212 0.596 – 0.974 0.928 6.687 – 2.539 9.771 2.628 24.437 0.241 23 0.174 0.301 – 0.631 0.523 2.584 0.266 1.349 4.610 1.199 9.582 0.251 24 0.291 0.608 0.649 1.458 1.290 7.975 1.784 4.312 17.616 4.755 37.586 0.628
26 0.308 0.490 0.624 1.419 1.281 7.066 0.840 4.126 15.475 4.059 28.451 0.533 27 0.353 0.604 1.188 1.357 0.992 4.212 1.942 2.298 7.211 1.797 14.772 0.813
28 0.146 0.239 0.330 0.457 0.399 2.013 0.342 0.917 3.305 0.936 7.893 0.338
– : Not detected.
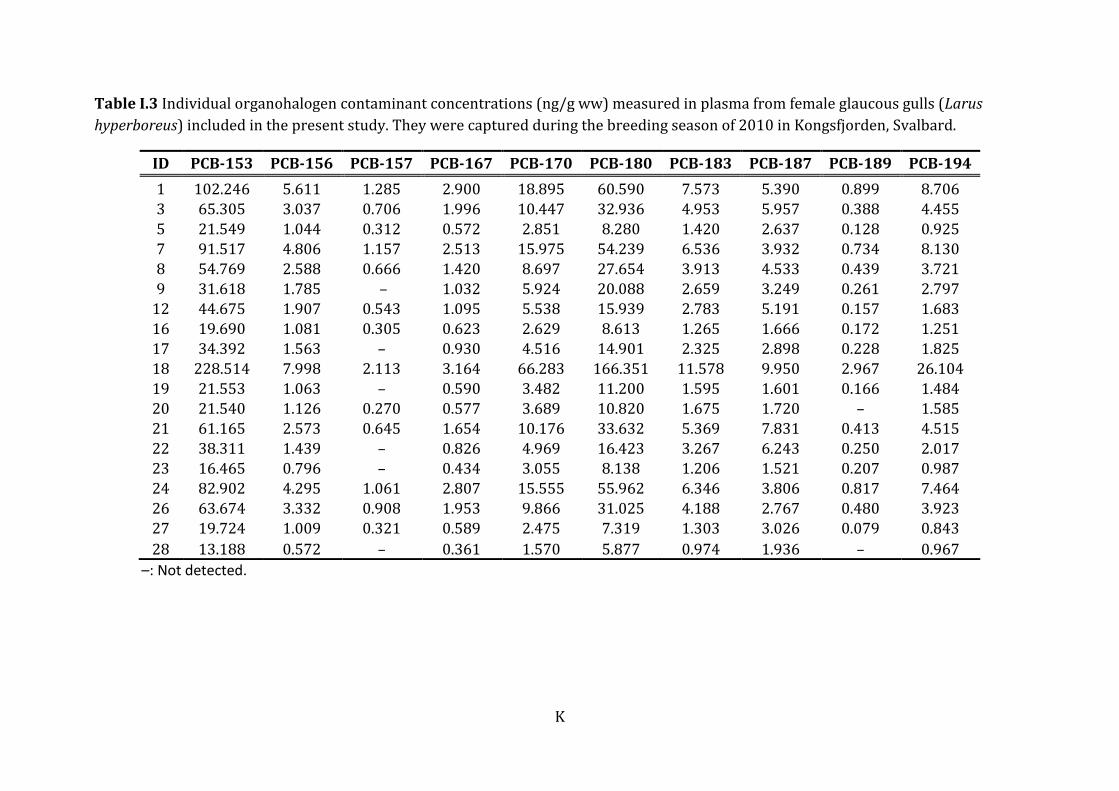
K
Table I.3 Individual organohalogen contaminant concentrations (ng/g ww) measured in plasma from female glaucous gulls (Larus
hyperboreus) included in the present study. They were captured during the breeding season of 2010 in Kongsfjorden, Svalbard.
ID PCB-153 PCB-156 PCB-157 PCB-167 PCB-170 PCB-180 PCB-183 PCB-187 PCB-189 PCB-194
1 102.246 5.611 1.285 2.900 18.895 60.590 7.573 5.390 0.899 8.706 3 65.305 3.037 0.706 1.996 10.447 32.936 4.953 5.957 0.388 4.455
5 21.549 1.044 0.312 0.572 2.851 8.280 1.420 2.637 0.128 0.925 7 91.517 4.806 1.157 2.513 15.975 54.239 6.536 3.932 0.734 8.130 8 54.769 2.588 0.666 1.420 8.697 27.654 3.913 4.533 0.439 3.721 9 31.618 1.785 – 1.032 5.924 20.088 2.659 3.249 0.261 2.797
12 44.675 1.907 0.543 1.095 5.538 15.939 2.783 5.191 0.157 1.683 16 19.690 1.081 0.305 0.623 2.629 8.613 1.265 1.666 0.172 1.251 17 34.392 1.563 – 0.930 4.516 14.901 2.325 2.898 0.228 1.825
18 228.514 7.998 2.113 3.164 66.283 166.351 11.578 9.950 2.967 26.104 19 21.553 1.063 – 0.590 3.482 11.200 1.595 1.601 0.166 1.484 20 21.540 1.126 0.270 0.577 3.689 10.820 1.675 1.720 – 1.585 21 61.165 2.573 0.645 1.654 10.176 33.632 5.369 7.831 0.413 4.515 22 38.311 1.439 – 0.826 4.969 16.423 3.267 6.243 0.250 2.017 23 16.465 0.796 – 0.434 3.055 8.138 1.206 1.521 0.207 0.987 24 82.902 4.295 1.061 2.807 15.555 55.962 6.346 3.806 0.817 7.464
26 63.674 3.332 0.908 1.953 9.866 31.025 4.188 2.767 0.480 3.923 27 19.724 1.009 0.321 0.589 2.475 7.319 1.303 3.026 0.079 0.843
28 13.188 0.572 – 0.361 1.570 5.877 0.974 1.936 – 0.967
–: Not detected.
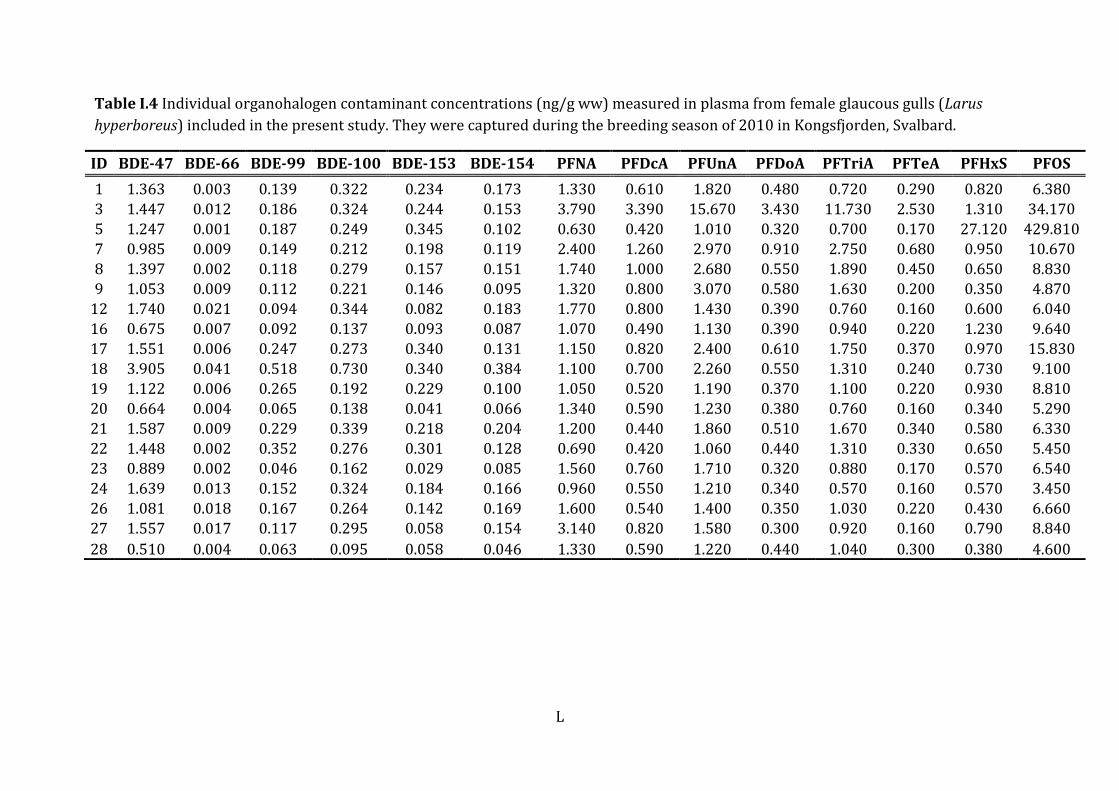
L
Table I.4 Individual organohalogen contaminant concentrations (ng/g ww) measured in plasma from female glaucous gulls (Larus
hyperboreus) included in the present study. They were captured during the breeding season of 2010 in Kongsfjorden, Svalbard.
ID BDE-47 BDE-66 BDE-99 BDE-100 BDE-153 BDE-154 PFNA PFDcA PFUnA PFDoA PFTriA PFTeA PFHxS PFOS
1 1.363 0.003 0.139 0.322 0.234 0.173 1.330 0.610 1.820 0.480 0.720 0.290 0.820 6.380 3 1.447 0.012 0.186 0.324 0.244 0.153 3.790 3.390 15.670 3.430 11.730 2.530 1.310 34.170
5 1.247 0.001 0.187 0.249 0.345 0.102 0.630 0.420 1.010 0.320 0.700 0.170 27.120 429.810 7 0.985 0.009 0.149 0.212 0.198 0.119 2.400 1.260 2.970 0.910 2.750 0.680 0.950 10.670 8 1.397 0.002 0.118 0.279 0.157 0.151 1.740 1.000 2.680 0.550 1.890 0.450 0.650 8.830 9 1.053 0.009 0.112 0.221 0.146 0.095 1.320 0.800 3.070 0.580 1.630 0.200 0.350 4.870
12 1.740 0.021 0.094 0.344 0.082 0.183 1.770 0.800 1.430 0.390 0.760 0.160 0.600 6.040 16 0.675 0.007 0.092 0.137 0.093 0.087 1.070 0.490 1.130 0.390 0.940 0.220 1.230 9.640 17 1.551 0.006 0.247 0.273 0.340 0.131 1.150 0.820 2.400 0.610 1.750 0.370 0.970 15.830
18 3.905 0.041 0.518 0.730 0.340 0.384 1.100 0.700 2.260 0.550 1.310 0.240 0.730 9.100 19 1.122 0.006 0.265 0.192 0.229 0.100 1.050 0.520 1.190 0.370 1.100 0.220 0.930 8.810 20 0.664 0.004 0.065 0.138 0.041 0.066 1.340 0.590 1.230 0.380 0.760 0.160 0.340 5.290 21 1.587 0.009 0.229 0.339 0.218 0.204 1.200 0.440 1.860 0.510 1.670 0.340 0.580 6.330 22 1.448 0.002 0.352 0.276 0.301 0.128 0.690 0.420 1.060 0.440 1.310 0.330 0.650 5.450 23 0.889 0.002 0.046 0.162 0.029 0.085 1.560 0.760 1.710 0.320 0.880 0.170 0.570 6.540 24 1.639 0.013 0.152 0.324 0.184 0.166 0.960 0.550 1.210 0.340 0.570 0.160 0.570 3.450
26 1.081 0.018 0.167 0.264 0.142 0.169 1.600 0.540 1.400 0.350 1.030 0.220 0.430 6.660 27 1.557 0.017 0.117 0.295 0.058 0.154 3.140 0.820 1.580 0.300 0.920 0.160 0.790 8.840
28 0.510 0.004 0.063 0.095 0.058 0.046 1.330 0.590 1.220 0.440 1.040 0.300 0.380 4.600
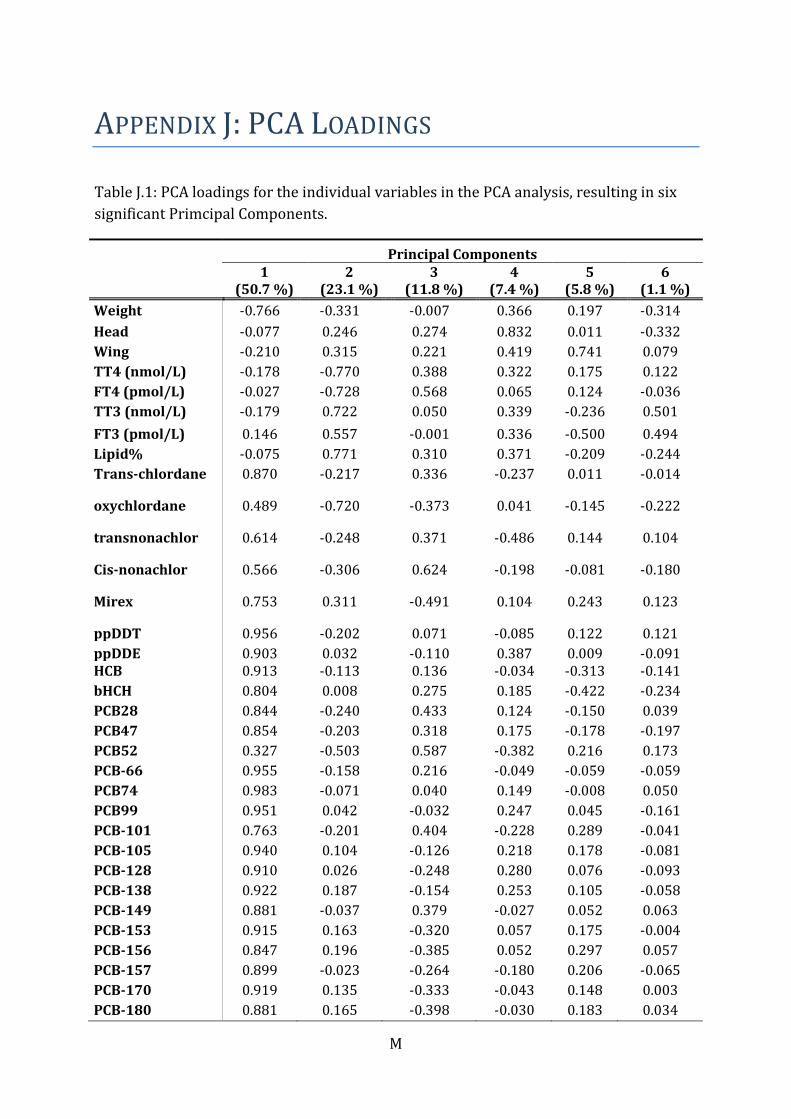
M
APPENDIX J: PCA LOADINGS
Table J.1: PCA loadings for the individual variables in the PCA analysis, resulting in six
significant Primcipal Components.
Principal Components
1 (50.7 %)
2 (23.1 %)
3 (11.8 %)
4 (7.4 %)
5 (5.8 %)
6 (1.1 %)
Weight -0.766 -0.331 -0.007 0.366 0.197 -0.314
Head -0.077 0.246 0.274 0.832 0.011 -0.332
Wing -0.210 0.315 0.221 0.419 0.741 0.079
TT4 (nmol/L) -0.178 -0.770 0.388 0.322 0.175 0.122
FT4 (pmol/L) -0.027 -0.728 0.568 0.065 0.124 -0.036
TT3 (nmol/L) -0.179 0.722 0.050 0.339 -0.236 0.501
FT3 (pmol/L) 0.146 0.557 -0.001 0.336 -0.500 0.494
Lipid% -0.075 0.771 0.310 0.371 -0.209 -0.244
Trans-chlordane 0.870 -0.217 0.336 -0.237 0.011 -0.014
oxychlordane 0.489 -0.720 -0.373 0.041 -0.145 -0.222
transnonachlor 0.614 -0.248 0.371 -0.486 0.144 0.104
Cis-nonachlor 0.566 -0.306 0.624 -0.198 -0.081 -0.180
Mirex 0.753 0.311 -0.491 0.104 0.243 0.123
ppDDT 0.956 -0.202 0.071 -0.085 0.122 0.121
ppDDE 0.903 0.032 -0.110 0.387 0.009 -0.091 HCB 0.913 -0.113 0.136 -0.034 -0.313 -0.141
bHCH 0.804 0.008 0.275 0.185 -0.422 -0.234
PCB28 0.844 -0.240 0.433 0.124 -0.150 0.039
PCB47 0.854 -0.203 0.318 0.175 -0.178 -0.197
PCB52 0.327 -0.503 0.587 -0.382 0.216 0.173
PCB-66 0.955 -0.158 0.216 -0.049 -0.059 -0.059
PCB74 0.983 -0.071 0.040 0.149 -0.008 0.050
PCB99 0.951 0.042 -0.032 0.247 0.045 -0.161
PCB-101 0.763 -0.201 0.404 -0.228 0.289 -0.041
PCB-105 0.940 0.104 -0.126 0.218 0.178 -0.081
PCB-128 0.910 0.026 -0.248 0.280 0.076 -0.093
PCB-138 0.922 0.187 -0.154 0.253 0.105 -0.058
PCB-149 0.881 -0.037 0.379 -0.027 0.052 0.063
PCB-153 0.915 0.163 -0.320 0.057 0.175 -0.004
PCB-156 0.847 0.196 -0.385 0.052 0.297 0.057
PCB-157 0.899 -0.023 -0.264 -0.180 0.206 -0.065
PCB-170 0.919 0.135 -0.333 -0.043 0.148 0.003
PCB-180 0.881 0.165 -0.398 -0.030 0.183 0.034
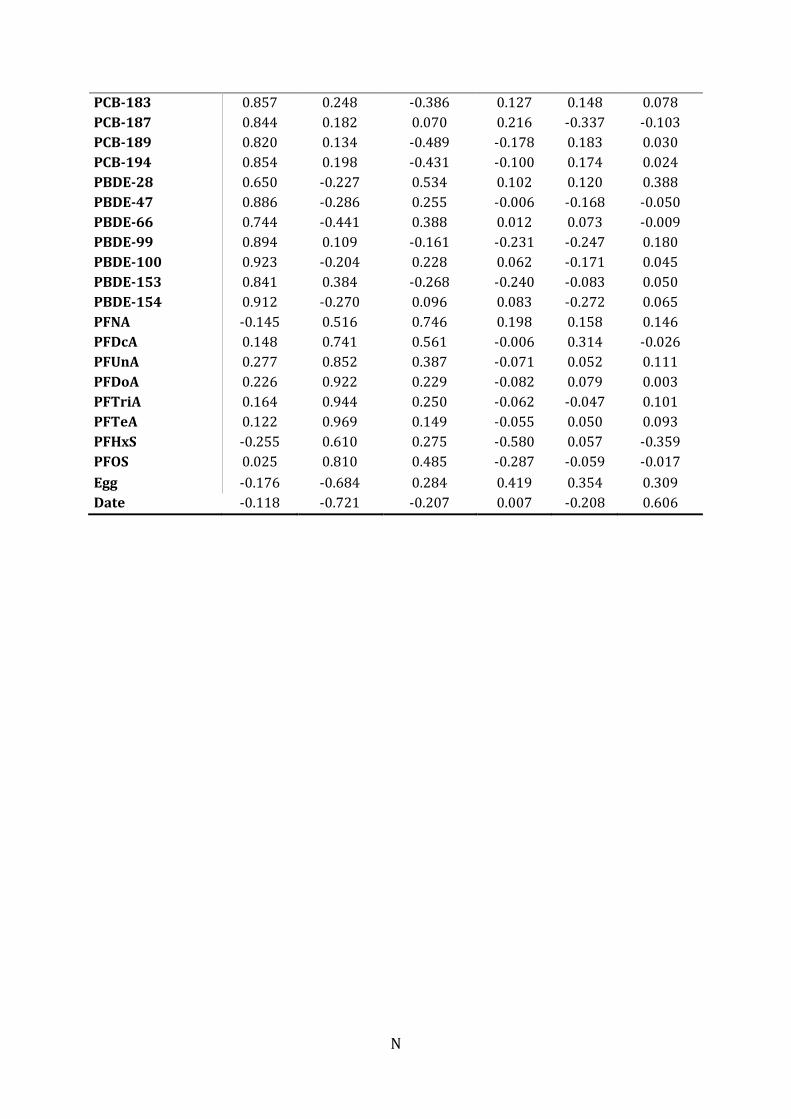
N
PCB-183 0.857 0.248 -0.386 0.127 0.148 0.078
PCB-187 0.844 0.182 0.070 0.216 -0.337 -0.103
PCB-189 0.820 0.134 -0.489 -0.178 0.183 0.030
PCB-194 0.854 0.198 -0.431 -0.100 0.174 0.024
PBDE-28 0.650 -0.227 0.534 0.102 0.120 0.388
PBDE-47 0.886 -0.286 0.255 -0.006 -0.168 -0.050
PBDE-66 0.744 -0.441 0.388 0.012 0.073 -0.009
PBDE-99 0.894 0.109 -0.161 -0.231 -0.247 0.180
PBDE-100 0.923 -0.204 0.228 0.062 -0.171 0.045
PBDE-153 0.841 0.384 -0.268 -0.240 -0.083 0.050
PBDE-154 0.912 -0.270 0.096 0.083 -0.272 0.065
PFNA -0.145 0.516 0.746 0.198 0.158 0.146
PFDcA 0.148 0.741 0.561 -0.006 0.314 -0.026
PFUnA 0.277 0.852 0.387 -0.071 0.052 0.111
PFDoA 0.226 0.922 0.229 -0.082 0.079 0.003
PFTriA 0.164 0.944 0.250 -0.062 -0.047 0.101
PFTeA 0.122 0.969 0.149 -0.055 0.050 0.093
PFHxS -0.255 0.610 0.275 -0.580 0.057 -0.359
PFOS 0.025 0.810 0.485 -0.287 -0.059 -0.017
Egg -0.176 -0.684 0.284 0.419 0.354 0.309
Date -0.118 -0.721 -0.207 0.007 -0.208 0.606


