Embed Size (px)
Citation preview
2016‐2018
3‐Year Financial Projection St. Clair Catholic District School Board
2
St. Clair Catholic DSB | 3‐Year Financial Projection 2016‐2018
TableofContents Section 1: Introduction .............................................................................................................................................. 1 Section 2: Projection Assumptions ............................................................................................................................ 2
Section 3: Projection Development Risks .................................................................................................................. 6 Section 4: Average Class Size Targets ........................................................................................................................ 7
Section 5: Revenue Projection ................................................................................................................................... 8 Section 6: Expenditure Projection ............................................................................................................................. 9
Section 7: Surplus / (Deficit) Projection .................................................................................................................. 10 Section 8: Board Administration Envelope .............................................................................................................. 11
Section 9: Special Education Envelope .................................................................................................................... 12
Section 10: Impact of the Projection on Budget Development ............................................................................... 13 Section 11: Appendices ........................................................................................................................................... 14
OurMission
Walking together in Christ's light with parish and family, we are called to build a safe and inclusive Catholic learning community and to serve as partners in the formation of life‐long learners by:
living our faith;
promoting educational achievement and innovation;
fostering stewardship, leadership and social justice.
1 St. Clair Catholic DSB | 3‐Year Financial Projection 2016‐2018
Section1:Introduction The St. Clair Catholic District School Board (SCCDSB) has an obligation to make wise decisions on the use of human and public resources. The development of projections is an important element of corporate planning. Projections inform the allocation of resources to support the Board’s strategic plan, annual district goals and school improvement planning. To assist in the achievement of long‐term goals by helping to predict any possible shortfall of future funding SCCDSB, led by Corporate Services, has produced a 3‐Year Financial Projection (“projection”). This document, “3‐Year Financial Projection 2016‐2018”, represents that projection.
The projection will: 1. Provide an estimate of operating revenues, expenditures and surplus or deficit position for the purposes
of compliance with Ministry of Education (“Ministry”) requirements; 2. Provide SCCDSB’s projected enrolment and teacher staffing levels; 3. Provide a description of the risks associated with making projections; and 4. Provide a framework for future decision making regarding SCCDSB budget development.
The projection captures the current and future financial status of SCCDSB assuming service levels remain status quo with 2015. Understanding where we are, will help us determine where we need to be. The SCCDSB 2015 Revised Budget Estimates are used as a starting point for the framework of the expenditure projection. This projection does not include capital expenditures. Readers of this document should reference the Capital Plan 2016‐2021 (“LTCP”) in conjunction with the projection as it illustrates past, present and future student enrolment as well as the factors that influence student enrolment and as a result of the analysis, the capital needs of the Board. The student enrolment used in the projection are current at the time of release of this document and therefore do not match the LTCP. In addition to providing an overall projection for the Board this document will also provide projections for Board Administration and Special Education. Both of these areas are specifically identified by the Ministry as funding that is enveloped. The Board cannot overspend on Board Administration and conversely cannot underspend on Special Education. Projections are dynamic, therefore the 3‐Year Financial Projection is a fluid document that will be updated on a yearly basis and will illustrate SCCDSB’s financial situation. The projection is a snapshot in time which illustrates the current state of SCCDSB at the time of release of this document.
2 St. Clair Catholic DSB | 3‐Year Financial Projection 2016‐2018
Section2:ProjectionAssumptions The projection is developed in accordance with specific assumptions. The revenue projection is based on the 2016 Budget Estimates. The baseline for the expenditure projection is the 2015 Revised Budget Estimates. Assumptions include legislative and regulatory requirements in addition to contractual, negotiated and self‐determined conditions or restrictions that must be respected.
Legislative,Regulatoryand/orFundingModelRequirements
The baseline for the projection, the 2015 Revised Budget Estimates, are compliant with Ministry of Education:
regulations and enveloping provisions;
maximum class size regulations for teacher staffing i.e. FDK, Primary (Grade 1‐3) and Grade 4‐8; and
minimum instructional time requirements for teacher staffing. The results of the projection will provide an assessment of what is necessary to meet the requirements above for the next 3 years.
RetirementGratuityandPost‐RetirementBenefits
Board spending includes unavoidable actuarially calculated retirement gratuity adjustments of $853K each year for the next 8 years and post‐retirement benefit adjustments of $170K each year for the next 6 years. To ensure compliance the Board must set aside cash to pay for these future costs and therefore must plan for a minimum surplus of $1,023,000. The results of the projection will provide an assessment of what is necessary to meet this requirement for the next 3 years.
ProvincialGrantsandOtherRevenues
The Ministry releases new grant regulations each spring for the following school year. The projection assumes that provincial grants calculations and benchmarks will not change from those provided in the 2016 Budget Estimates. This projection takes into account any known future phased‐in grant calculation changes. For the Board, GSN funding represents the overwhelming majority of revenues.
Educational Program Other (EPO) grants will be assumed based on the those announced for the 2016 Budget Estimates. These targeted funds must be used for the intended initiatives, therefore the expenditures will exactly offset the funds and will have a zero impact on the surplus/deficit position. Known sources of other revenues will be identified and included in the projection. Any new funding identified is not used to fund additional expenditures unless consideration for the use of these funds for pre‐established initiatives has already occurred and been resolved.
3 St. Clair Catholic DSB | 3‐Year Financial Projection 2016‐2018
EnrolmentProjections
The Ministry allocates funding to board’s using a funding formula whose primary driver is student enrolment. Section 3 Demographics of the LTCP provides a detailed description of the Board’s geographic population trends, population projections, live birth data, net migration and residential development. Section 4 Enrolment Trends and Projections of the LTCP provides a detailed description of Student Apportionment and Enrolment Methodology. Although the enrolment projections used in the LTCP are not the same that are used in this document the methodology for building the enrolment is the same.
EnrolmentProjectionMethodology(fromtheLTCP)
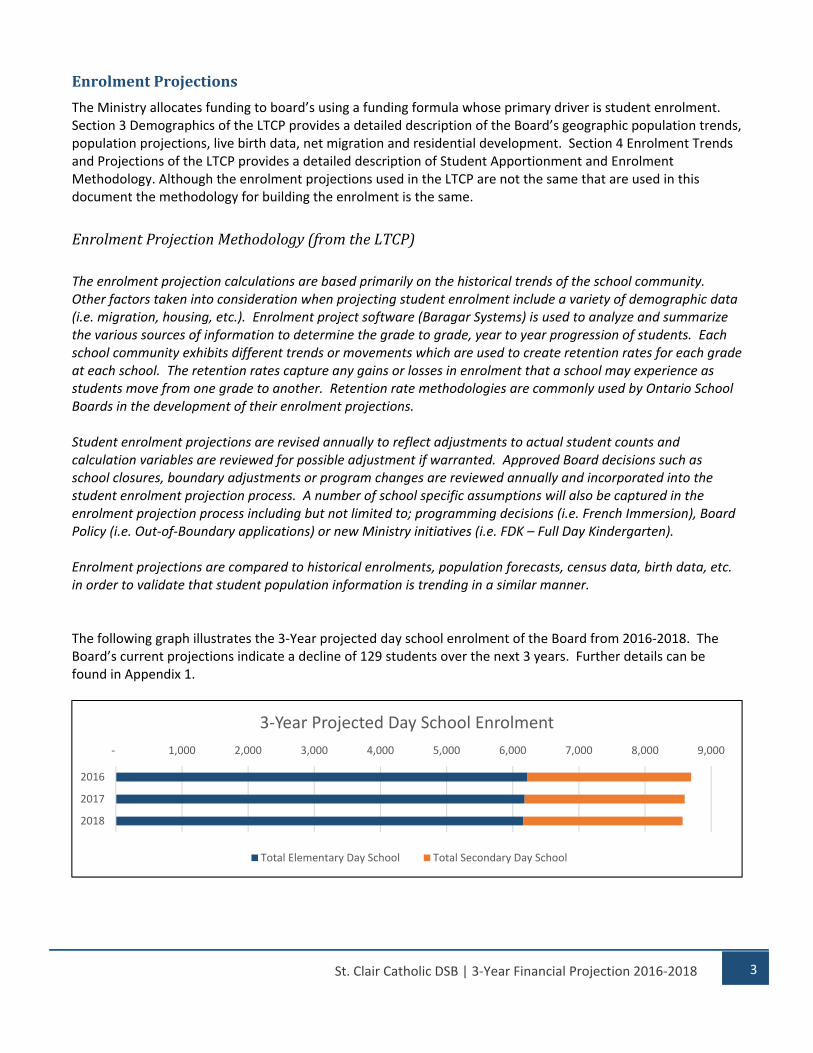
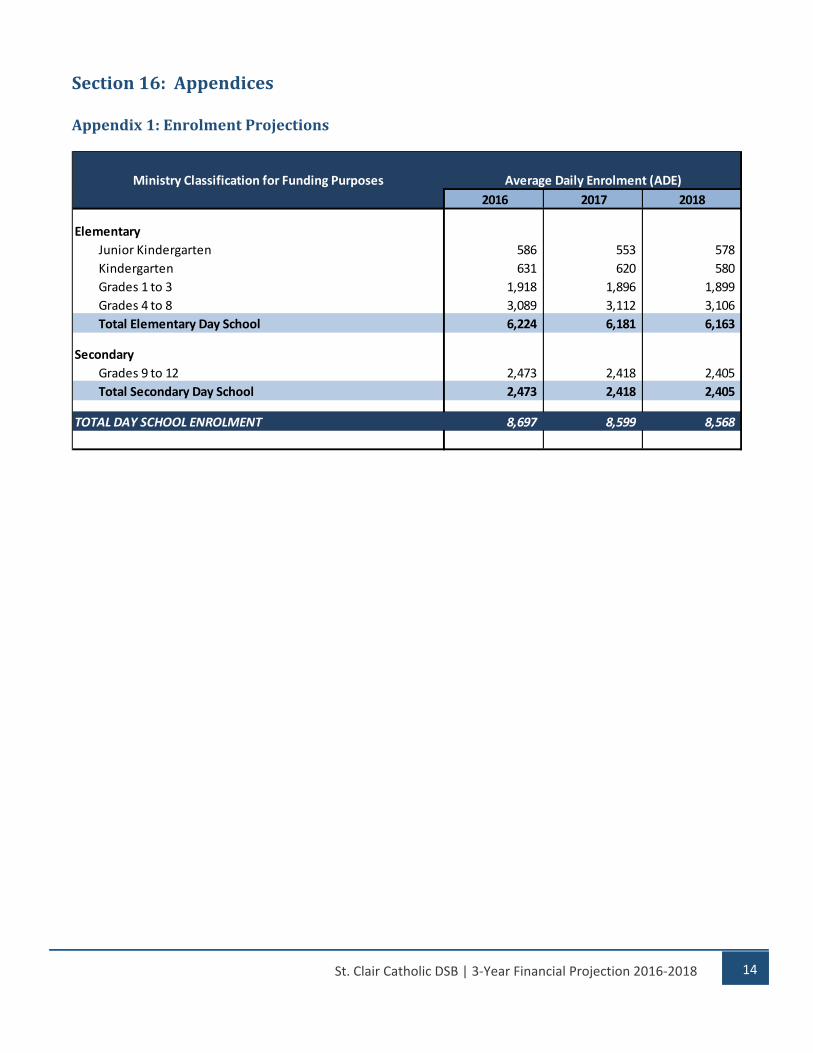
The enrolment projection calculations are based primarily on the historical trends of the school community. Other factors taken into consideration when projecting student enrolment include a variety of demographic data (i.e. migration, housing, etc.). Enrolment project software (Baragar Systems) is used to analyze and summarize the various sources of information to determine the grade to grade, year to year progression of students. Each school community exhibits different trends or movements which are used to create retention rates for each grade at each school. The retention rates capture any gains or losses in enrolment that a school may experience as students move from one grade to another. Retention rate methodologies are commonly used by Ontario School Boards in the development of their enrolment projections. Student enrolment projections are revised annually to reflect adjustments to actual student counts and calculation variables are reviewed for possible adjustment if warranted. Approved Board decisions such as school closures, boundary adjustments or program changes are reviewed annually and incorporated into the student enrolment projection process. A number of school specific assumptions will also be captured in the enrolment projection process including but not limited to; programming decisions (i.e. French Immersion), Board Policy (i.e. Out‐of‐Boundary applications) or new Ministry initiatives (i.e. FDK – Full Day Kindergarten). Enrolment projections are compared to historical enrolments, population forecasts, census data, birth data, etc. in order to validate that student population information is trending in a similar manner. The following graph illustrates the 3‐Year projected day school enrolment of the Board from 2016‐2018. The Board’s current projections indicate a decline of 129 students over the next 3 years. Further details can be found in Appendix 1.
‐ 1,000 2,000 3,000 4,000 5,000 6,000 7,000 8,000 9,000
2016
2017
2018
3‐Year Projected Day School Enrolment
Total Elementary Day School Total Secondary Day School

4 St. Clair Catholic DSB | 3‐Year Financial Projection 2016‐2018
OperatingExpenditures
General Guidelines
Operating expenditures in this projection do not exceed the expenditures reported in the 2015 Revised Budget Estimates, unless increases are known and required by legislation or contractual obligations. Employee Compensation
Salaries and benefits are provided for in accordance with existing employee collective agreements / contractual obligations. An increase of 1% as at September 1, 2016 and 0.5% increase mid‐way through the 2016 school year are incorporated as agreed during central negotiations. The budget for Life insurance and Extended Health and Dental Benefits are based on the Board’s cost to participate in the provincial Employee Life and Health Trusts. Instructional staff requirements are calculated using the Board’s projected student enrolment and considering the Ministry’s maximum class size and minimum instructional time regulations.
Non‐instructional staff salary and benefits are calculated based on existing staff levels. Future known staff changes are incorporated into the projection.
Debt Servicing Costs
Annual debt servicing costs are based on existing debt repayment obligations. Transportation Costs
In the projection transportation costs are based on Board policy, proposed service levels and negotiated contract rates. The Board does not overspend on transportation; however, the use of the funding will not be used in the projection to offset other areas where the Board is overspent. School Operations Costs
The projection recognizes that the Board does not overspend on school operations costs; however, the use of the funding will not be used in the projection to offset other areas where the Board is overspent. Utility costs are included in School Operations costs and therefore where these costs are estimated to increase other expenditures in the School Operations area are reduced to ensure a balanced budget in this area. Administration and Governance Costs
The projection recognizes that administration and governance revenue cannot be overspent.
5 St. Clair Catholic DSB | 3‐Year Financial Projection 2016‐2018
Ministry or Contractually Required Expenditures
The projection recognizes that certain funds are restricted. In other words, funds received must be spent in the specific area or placed into deferred revenue for future use. These include:
Funds to meet maximum class size regulations for teacher staffing i.e. FDK, Primary (Grade 1‐3) and Grade 4‐8;
Funds to ensure minimum instructional time requirements for teacher staffing;
Special Education Grant;
Literacy and Math Outside the School Day Allocation;
Student Success, Grade 7 to 12 Allocation;
Grade 7 and 8 Literacy and Numeracy and Student Success Teachers Allocation;
School Effectiveness Framework Allocation;
Ontario Focused Intervention Partnership (OFIP) Tutoring Allocation;
Specialist High Skills Major (SHSM) Allocation;
Mental Health Leader Allocation;
System Librarian Allocation;
First Nation, Métis and Inuit Minimum Allocation; and
New Teacher Induction Program (NTIP) funding.
6 St. Clair Catholic DSB | 3‐Year Financial Projection 2016‐2018
Section3:ProjectionDevelopmentRisks The Board is challenged each year to identify and consider significant risks during the budget planning process and to develop strategies to mitigate the risks of spending beyond budget levels. These risks make it difficult to develop a reliable projection. Understanding the risks is important when making projection assumptions.
EnrolmentProjections
The accuracy of student enrolment projections and the procedures used in their development is critical to the development of the projection. Given that the Province allocates funding to each board using a funding formula whose primary driver is student enrolment; the Board must ensure enrolment projections are as accurate as possible. The Board mitigates this risk by ensuring that the procedures used to develop enrolment projections are reasonable, documented and followed appropriately.
MinistryGrants
Majority of Board funds come by way of provincial grants and therefore the projection is driven by the calculation of the grants to come in future years. The Province controls the amount of the grants, timing of the grants, complexity of the grants, enveloped funding and the number of special purpose grants. The revenue projection relies on complex manual calculations and benchmarks using the 2016‐17 Budget Estimates as a baseline. The calculations are complex and there is a risk of miscalculation. The Board mitigates this risk by using peer review of calculations.
LabourNegotiations
Issues bargained centrally by the Ministry have resulted in a financial impact to boards. When contractual changes are introduced it may take a number of years to see the true impact of the associated costs. Data is collected over time to make predictions of future costs.
ImpactofBill115
Projecting the cost impact of Bill 115 is based on limited historical information. An increase to projected expenditures for sick leave and maternity leave costs are anticipated but the extent is unknown. This risk will be mitigated as more predictable data is obtained over time.
ExtendedHealthandDentalBenefits
The costs associated with extended health and dental benefits continue to increase year over year due to high cost specialty drugs. This risk of rising costs will be mitigated when Employee Life and Health Trusts take over management of the board plans during the 2016‐17 school year. The date of the plans being moved to the trusts are not known at the time of producing the projection. When this happens the cost to the board will be fixed for the number of years stated in centrally negotiated contracts allowing for more accurate budgeting.
StudentAccommodationPlanning
The projection does not take into account the result of student accommodation planning, the results of which are unknown at the time of the calculations.
OtherUnknownCosts
The projection does not take into account potential weather fluctuations which may impact utility costs and snow removal costs. The projection does not include unexpected litigation costs that exceed historical patterns.
7 St. Clair Catholic DSB | 3‐Year Financial Projection 2016‐2018
Section4:AverageClassSizeTargetsandProjectedTeacherStaffing
The Education Act Ontario Reg. 132/12 outlines the average class size targets that the Board is required to meet. The projection takes these targets into account through calculation of the number of teachers and Early Childhood Educators.
The requirements on primary class size (Grade 1‐3) are that each board must organize primary classes so that:
At least 90 percent of a board’s primary classes have 20 or fewer students; and Up to 10 percent of a board’s primary classes can have a higher cap of up to 23 students.
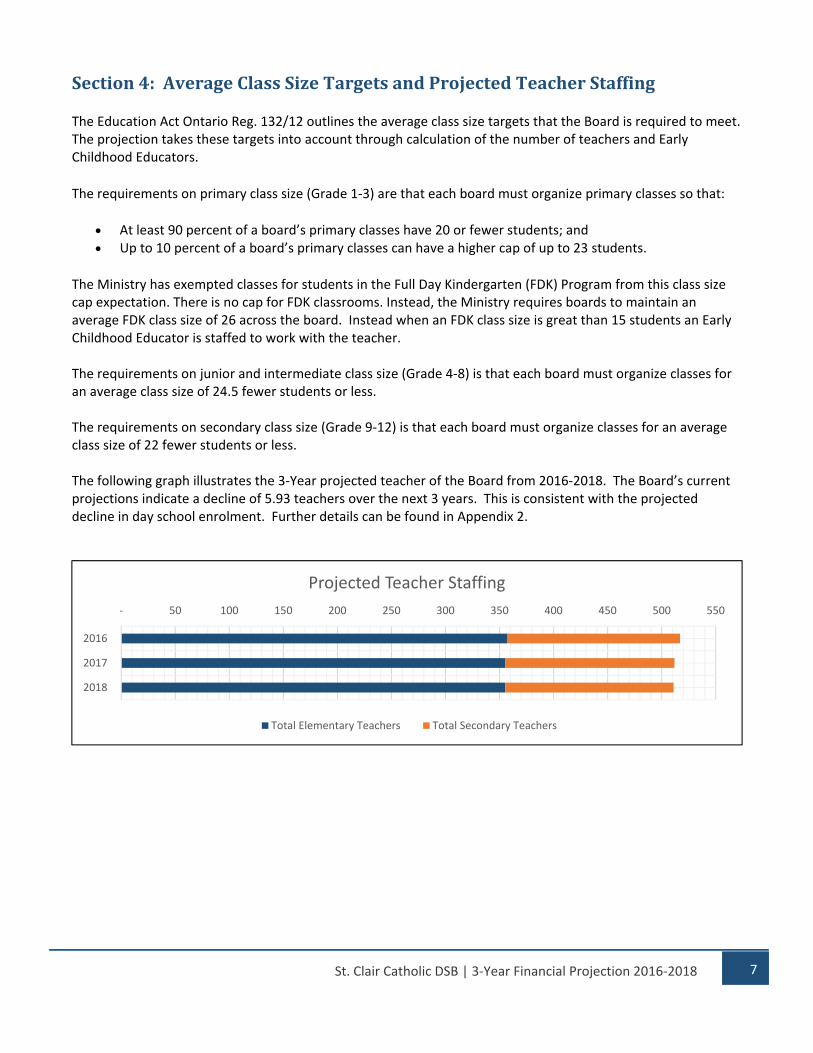
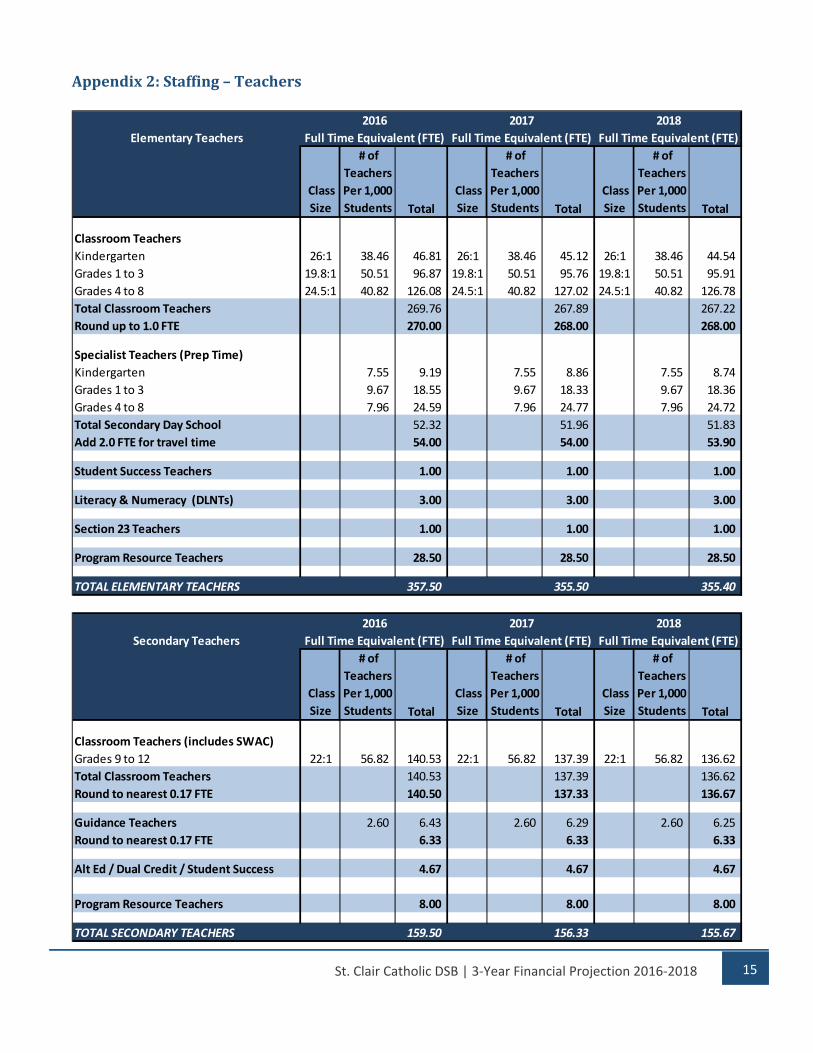
The Ministry has exempted classes for students in the Full Day Kindergarten (FDK) Program from this class size cap expectation. There is no cap for FDK classrooms. Instead, the Ministry requires boards to maintain an average FDK class size of 26 across the board. Instead when an FDK class size is great than 15 students an Early Childhood Educator is staffed to work with the teacher. The requirements on junior and intermediate class size (Grade 4‐8) is that each board must organize classes for an average class size of 24.5 fewer students or less. The requirements on secondary class size (Grade 9‐12) is that each board must organize classes for an average class size of 22 fewer students or less. The following graph illustrates the 3‐Year projected teacher of the Board from 2016‐2018. The Board’s current projections indicate a decline of 5.93 teachers over the next 3 years. This is consistent with the projected decline in day school enrolment. Further details can be found in Appendix 2.
‐ 50 100 150 200 250 300 350 400 450 500 550
2016
2017
2018
Projected Teacher Staffing
Total Elementary Teachers Total Secondary Teachers
8 St. Clair Catholic DSB | 3‐Year Financial Projection 2016‐2018
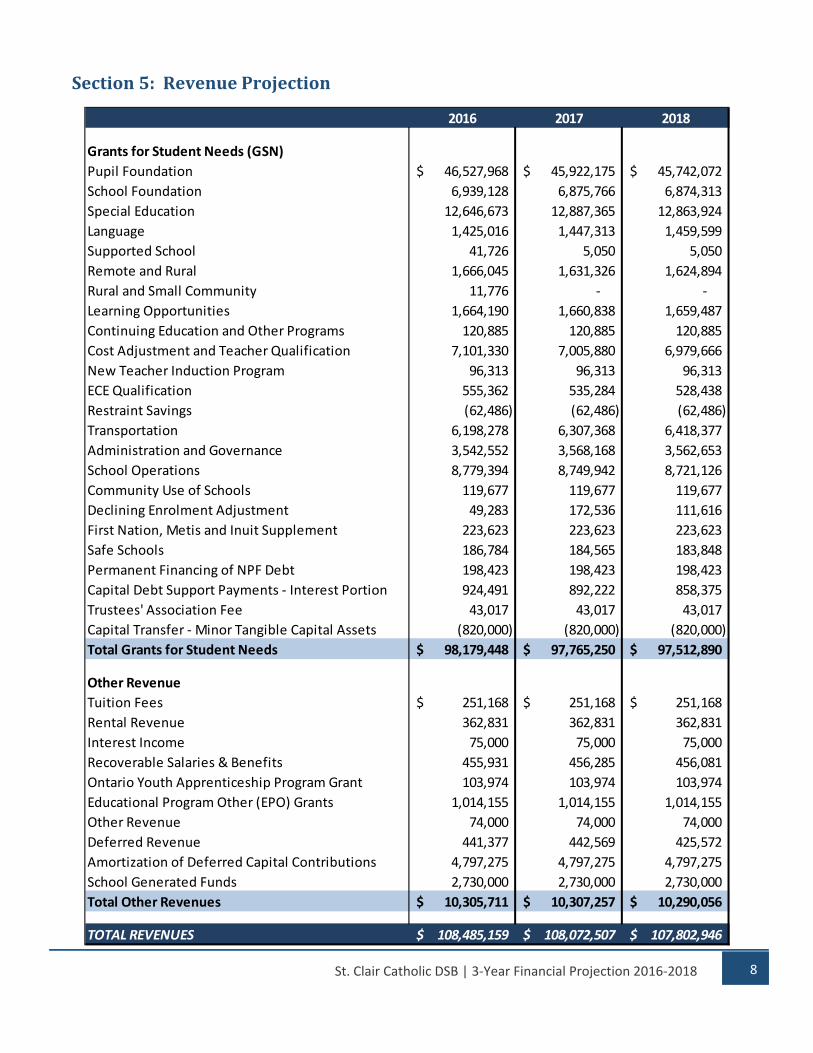
Section5:RevenueProjection
2016 2017 2018
Grants for Student Needs (GSN)
Pupil Foundation 46,527,968$ 45,922,175$ 45,742,072$
School Foundation 6,939,128 6,875,766 6,874,313
Special Education 12,646,673 12,887,365 12,863,924
Language 1,425,016 1,447,313 1,459,599
Supported School 41,726 5,050 5,050
Remote and Rural 1,666,045 1,631,326 1,624,894
Rural and Small Community 11,776 ‐ ‐
Learning Opportunities 1,664,190 1,660,838 1,659,487
Continuing Education and Other Programs 120,885 120,885 120,885
Cost Adjustment and Teacher Qualification 7,101,330 7,005,880 6,979,666
New Teacher Induction Program 96,313 96,313 96,313
ECE Qualification 555,362 535,284 528,438
Restraint Savings (62,486) (62,486) (62,486)
Transportation 6,198,278 6,307,368 6,418,377
Administration and Governance 3,542,552 3,568,168 3,562,653
School Operations 8,779,394 8,749,942 8,721,126
Community Use of Schools 119,677 119,677 119,677
Declining Enrolment Adjustment 49,283 172,536 111,616
First Nation, Metis and Inuit Supplement 223,623 223,623 223,623
Safe Schools 186,784 184,565 183,848
Permanent Financing of NPF Debt 198,423 198,423 198,423
Capital Debt Support Payments ‐ Interest Portion 924,491 892,222 858,375
Trustees' Association Fee 43,017 43,017 43,017
Capital Transfer ‐ Minor Tangible Capital Assets (820,000) (820,000) (820,000)
Total Grants for Student Needs 98,179,448$ 97,765,250$ 97,512,890$
Other Revenue
Tuition Fees 251,168$ 251,168$ 251,168$
Rental Revenue 362,831 362,831 362,831
Interest Income 75,000 75,000 75,000
Recoverable Salaries & Benefits 455,931 456,285 456,081
Ontario Youth Apprenticeship Program Grant 103,974 103,974 103,974
Educational Program Other (EPO) Grants 1,014,155 1,014,155 1,014,155
Other Revenue 74,000 74,000 74,000
Deferred Revenue 441,377 442,569 425,572
Amortization of Deferred Capital Contributions 4,797,275 4,797,275 4,797,275
School Generated Funds 2,730,000 2,730,000 2,730,000
Total Other Revenues 10,305,711$ 10,307,257$ 10,290,056$
TOTAL REVENUES 108,485,159$ 108,072,507$ 107,802,946$
9 St. Clair Catholic DSB | 3‐Year Financial Projection 2016‐2018
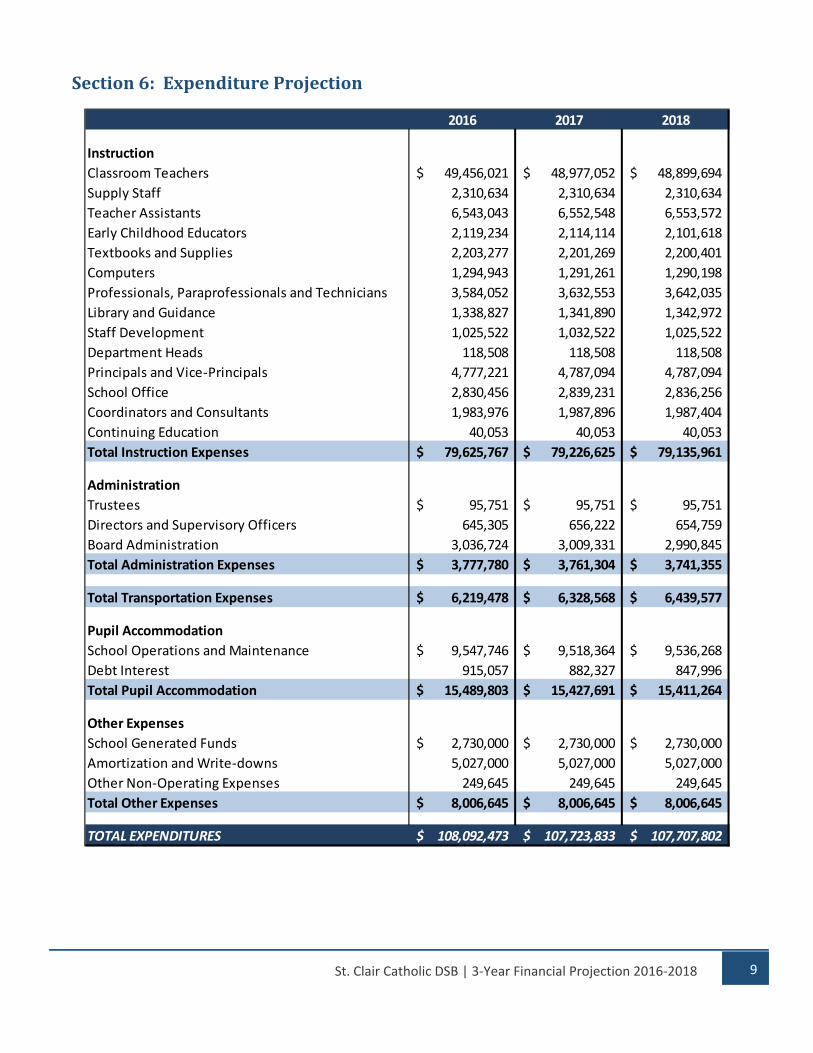
Section6:ExpenditureProjection
2016 2017 2018
Instruction
Classroom Teachers 49,456,021$ 48,977,052$ 48,899,694$
Supply Staff 2,310,634 2,310,634 2,310,634
Teacher Assistants 6,543,043 6,552,548 6,553,572
Early Childhood Educators 2,119,234 2,114,114 2,101,618
Textbooks and Supplies 2,203,277 2,201,269 2,200,401
Computers 1,294,943 1,291,261 1,290,198
Professionals, Paraprofessionals and Technicians 3,584,052 3,632,553 3,642,035
Library and Guidance 1,338,827 1,341,890 1,342,972
Staff Development 1,025,522 1,032,522 1,025,522
Department Heads 118,508 118,508 118,508
Principals and Vice‐Principals 4,777,221 4,787,094 4,787,094
School Office 2,830,456 2,839,231 2,836,256
Coordinators and Consultants 1,983,976 1,987,896 1,987,404
Continuing Education 40,053 40,053 40,053
Total Instruction Expenses 79,625,767$ 79,226,625$ 79,135,961$
Administration
Trustees 95,751$ 95,751$ 95,751$
Directors and Supervisory Officers 645,305 656,222 654,759
Board Administration 3,036,724 3,009,331 2,990,845
Total Administration Expenses 3,777,780$ 3,761,304$ 3,741,355$
Total Transportation Expenses 6,219,478$ 6,328,568$ 6,439,577$
Pupil Accommodation
School Operations and Maintenance 9,547,746$ 9,518,364$ 9,536,268$
Debt Interest 915,057 882,327 847,996
Total Pupil Accommodation 15,489,803$ 15,427,691$ 15,411,264$
Other Expenses
School Generated Funds 2,730,000$ 2,730,000$ 2,730,000$
Amortization and Write‐downs 5,027,000 5,027,000 5,027,000
Other Non‐Operating Expenses 249,645 249,645 249,645
Total Other Expenses 8,006,645$ 8,006,645$ 8,006,645$
TOTAL EXPENDITURES 108,092,473$ 107,723,833$ 107,707,802$
10 St. Clair Catholic DSB | 3‐Year Financial Projection 2016‐2018
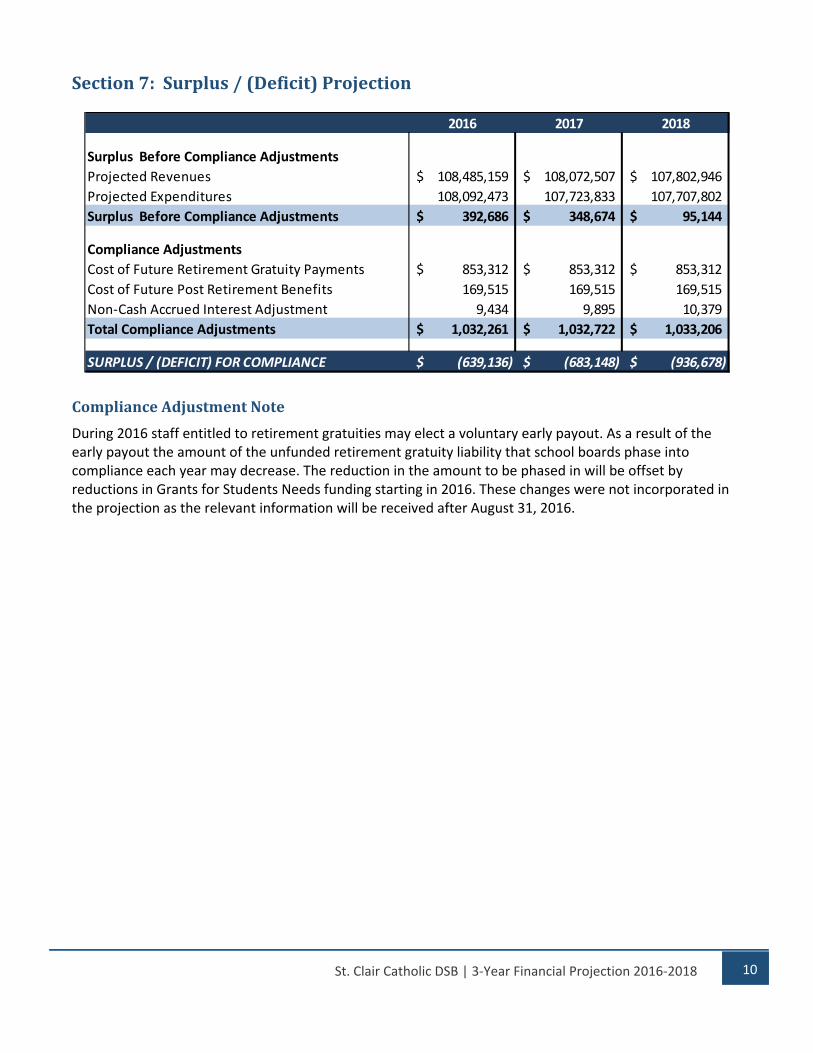
Section7:Surplus/(Deficit)Projection
ComplianceAdjustmentNote
During 2016 staff entitled to retirement gratuities may elect a voluntary early payout. As a result of the early payout the amount of the unfunded retirement gratuity liability that school boards phase into compliance each year may decrease. The reduction in the amount to be phased in will be offset by reductions in Grants for Students Needs funding starting in 2016. These changes were not incorporated in the projection as the relevant information will be received after August 31, 2016.
2016 2017 2018
Surplus Before Compliance Adjustments
Projected Revenues 108,485,159$ 108,072,507$ 107,802,946$
Projected Expenditures 108,092,473 107,723,833 107,707,802
Surplus Before Compliance Adjustments 392,686$ 348,674$ 95,144$
Compliance Adjustments
Cost of Future Retirement Gratuity Payments 853,312$ 853,312$ 853,312$
Cost of Future Post Retirement Benefits 169,515 169,515 169,515
Non‐Cash Accrued Interest Adjustment 9,434 9,895 10,379
Total Compliance Adjustments 1,032,261$ 1,032,722$ 1,033,206$
SURPLUS / (DEFICIT) FOR COMPLIANCE (639,136)$ (683,148)$ (936,678)$
11 St. Clair Catholic DSB | 3‐Year Financial Projection 2016‐2018
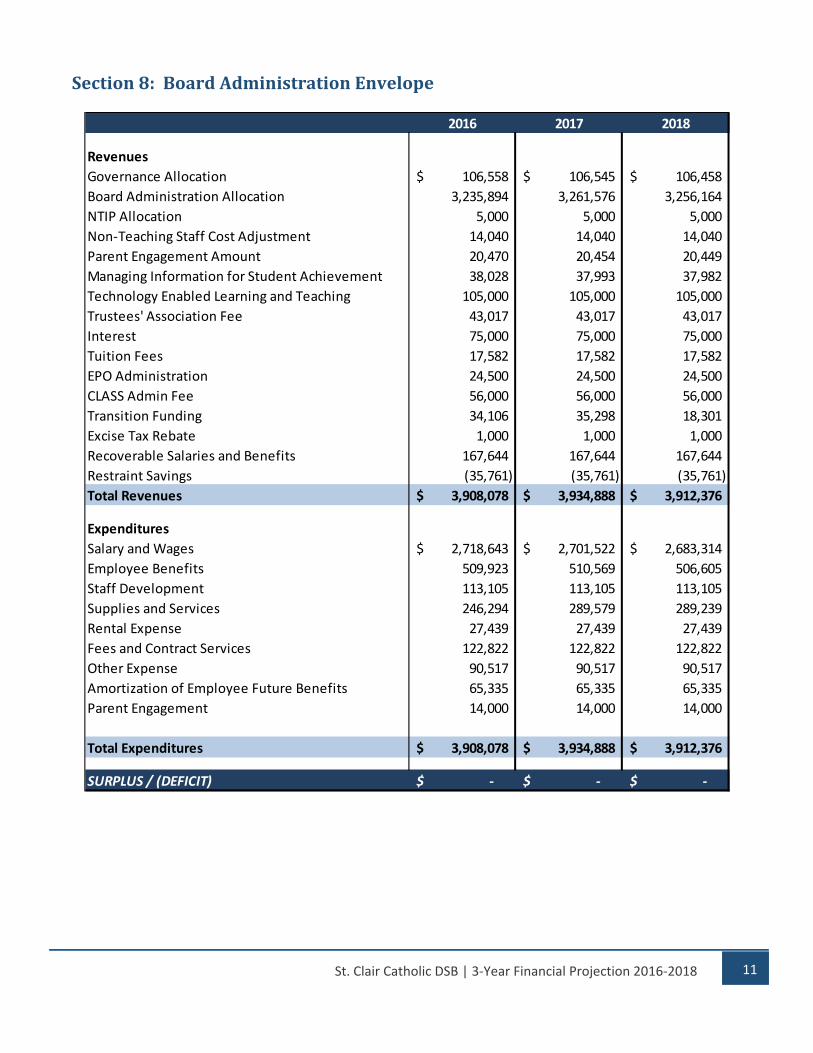
Section8:BoardAdministrationEnvelope
2016 2017 2018
Revenues
Governance Allocation 106,558$ 106,545$ 106,458$
Board Administration Allocation 3,235,894 3,261,576 3,256,164
NTIP Allocation 5,000 5,000 5,000
Non‐Teaching Staff Cost Adjustment 14,040 14,040 14,040
Parent Engagement Amount 20,470 20,454 20,449
Managing Information for Student Achievement 38,028 37,993 37,982
Technology Enabled Learning and Teaching 105,000 105,000 105,000
Trustees' Association Fee 43,017 43,017 43,017
Interest 75,000 75,000 75,000
Tuition Fees 17,582 17,582 17,582
EPO Administration 24,500 24,500 24,500
CLASS Admin Fee 56,000 56,000 56,000
Transition Funding 34,106 35,298 18,301
Excise Tax Rebate 1,000 1,000 1,000
Recoverable Salaries and Benefits 167,644 167,644 167,644
Restraint Savings (35,761) (35,761) (35,761)
Total Revenues 3,908,078$ 3,934,888$ 3,912,376$
Expenditures
Salary and Wages 2,718,643$ 2,701,522$ 2,683,314$
Employee Benefits 509,923 510,569 506,605
Staff Development 113,105 113,105 113,105
Supplies and Services 246,294 289,579 289,239
Rental Expense 27,439 27,439 27,439
Fees and Contract Services 122,822 122,822 122,822
Other Expense 90,517 90,517 90,517
Amortization of Employee Future Benefits 65,335 65,335 65,335
Parent Engagement 14,000 14,000 14,000
Total Expenditures 3,908,078$ 3,934,888$ 3,912,376$
SURPLUS / (DEFICIT) ‐$ ‐$ ‐$
12 St. Clair Catholic DSB | 3‐Year Financial Projection 2016‐2018
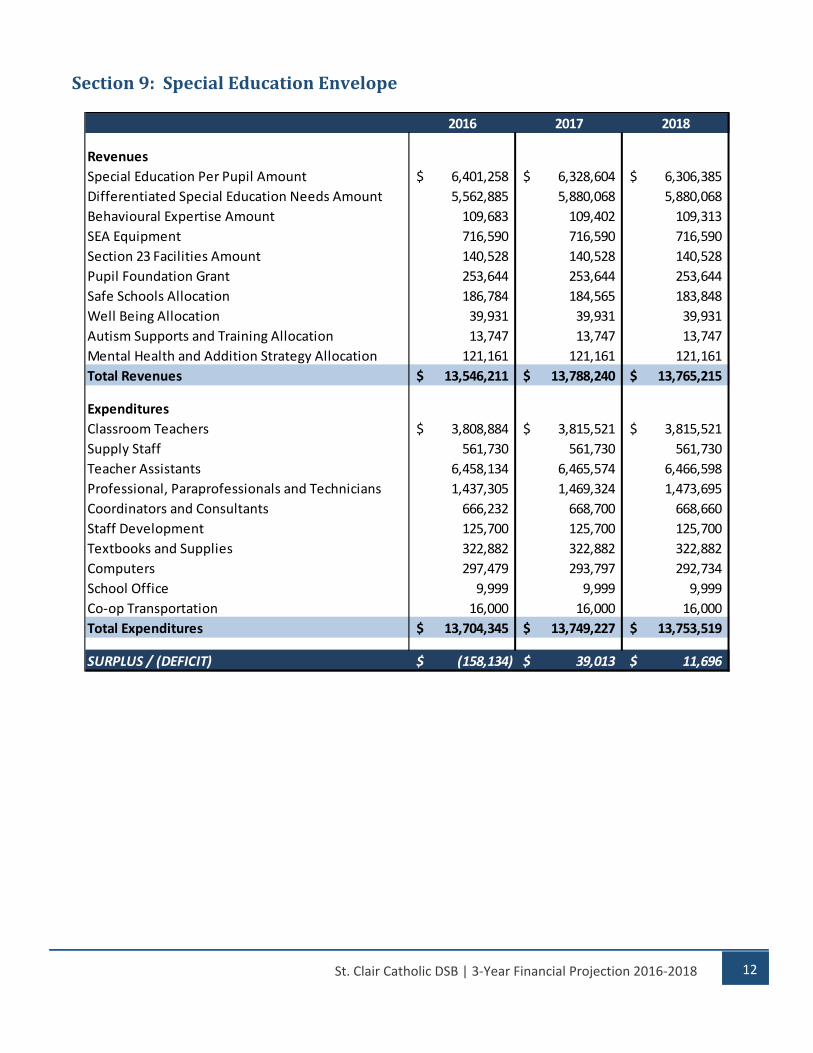
Section9:SpecialEducationEnvelope
2016 2017 2018
Revenues
Special Education Per Pupil Amount 6,401,258$ 6,328,604$ 6,306,385$
Differentiated Special Education Needs Amount 5,562,885 5,880,068 5,880,068
Behavioural Expertise Amount 109,683 109,402 109,313
SEA Equipment 716,590 716,590 716,590
Section 23 Facilities Amount 140,528 140,528 140,528
Pupil Foundation Grant 253,644 253,644 253,644
Safe Schools Allocation 186,784 184,565 183,848
Well Being Allocation 39,931 39,931 39,931
Autism Supports and Training Allocation 13,747 13,747 13,747
Mental Health and Addition Strategy Allocation 121,161 121,161 121,161
Total Revenues 13,546,211$ 13,788,240$ 13,765,215$
Expenditures
Classroom Teachers 3,808,884$ 3,815,521$ 3,815,521$
Supply Staff 561,730 561,730 561,730
Teacher Assistants 6,458,134 6,465,574 6,466,598
Professional, Paraprofessionals and Technicians 1,437,305 1,469,324 1,473,695
Coordinators and Consultants 666,232 668,700 668,660
Staff Development 125,700 125,700 125,700
Textbooks and Supplies 322,882 322,882 322,882
Computers 297,479 293,797 292,734
School Office 9,999 9,999 9,999
Co‐op Transportation 16,000 16,000 16,000
Total Expenditures 13,704,345$ 13,749,227$ 13,753,519$
SURPLUS / (DEFICIT) (158,134)$ 39,013$ 11,696$
13 St. Clair Catholic DSB | 3‐Year Financial Projection 2016‐2018
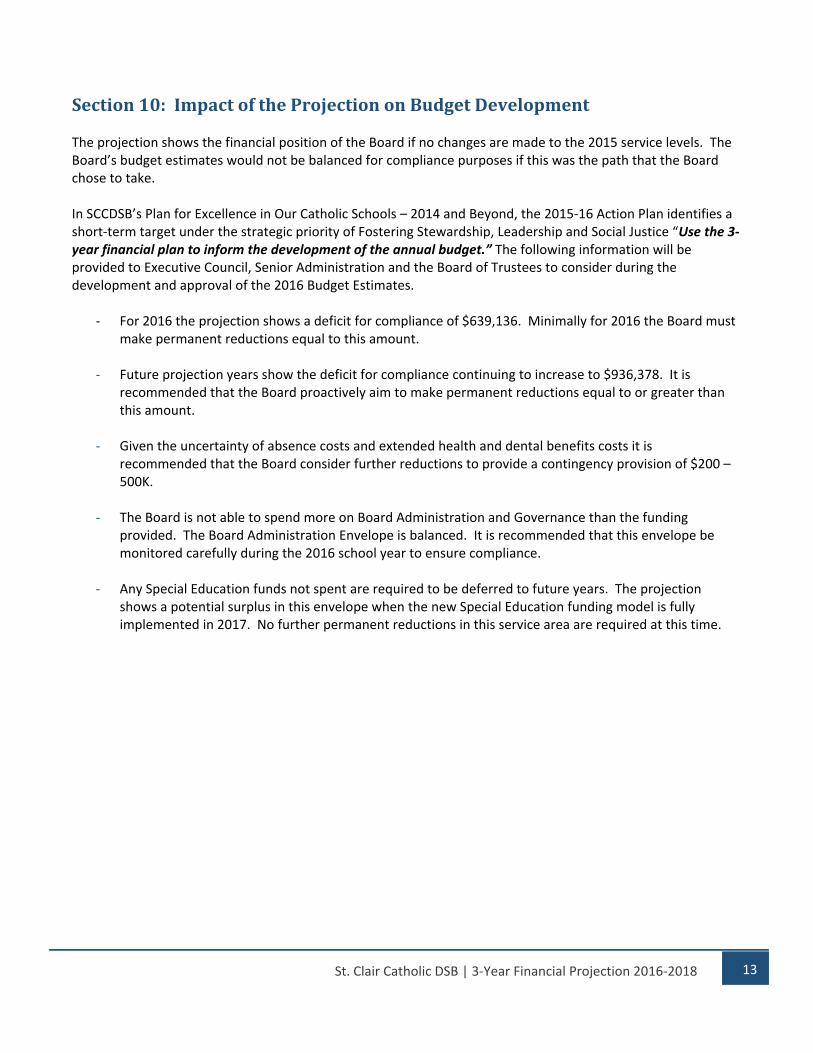
Section10:ImpactoftheProjectiononBudgetDevelopment The projection shows the financial position of the Board if no changes are made to the 2015 service levels. The Board’s budget estimates would not be balanced for compliance purposes if this was the path that the Board chose to take. In SCCDSB’s Plan for Excellence in Our Catholic Schools – 2014 and Beyond, the 2015‐16 Action Plan identifies a short‐term target under the strategic priority of Fostering Stewardship, Leadership and Social Justice “Use the 3‐year financial plan to inform the development of the annual budget.” The following information will be provided to Executive Council, Senior Administration and the Board of Trustees to consider during the development and approval of the 2016 Budget Estimates.
‐ For 2016 the projection shows a deficit for compliance of $639,136. Minimally for 2016 the Board must make permanent reductions equal to this amount.
‐ Future projection years show the deficit for compliance continuing to increase to $936,378. It is recommended that the Board proactively aim to make permanent reductions equal to or greater than this amount.
‐ Given the uncertainty of absence costs and extended health and dental benefits costs it is recommended that the Board consider further reductions to provide a contingency provision of $200 – 500K.
‐ The Board is not able to spend more on Board Administration and Governance than the funding provided. The Board Administration Envelope is balanced. It is recommended that this envelope be monitored carefully during the 2016 school year to ensure compliance.
‐ Any Special Education funds not spent are required to be deferred to future years. The projection shows a potential surplus in this envelope when the new Special Education funding model is fully implemented in 2017. No further permanent reductions in this service area are required at this time.
14 St. Clair Catholic DSB | 3‐Year Financial Projection 2016‐2018
Section16:AppendicesAppendix1:EnrolmentProjections
Year 2016 2017 2018
Elementary
Junior Kindergarten 586 553 578
Kindergarten 631 620 580
Grades 1 to 3 1,918 1,896 1,899
Grades 4 to 8 3,089 3,112 3,106
Total Elementary Day School 6,224 6,181 6,163
Secondary
Grades 9 to 12 2,473 2,418 2,405
Total Secondary Day School 2,473 2,418 2,405
TOTAL DAY SCHOOL ENROLMENT 8,697 8,599 8,568
Ministry Classification for Funding Purposes Average Daily Enrolment (ADE)
15 St. Clair Catholic DSB | 3‐Year Financial Projection 2016‐2018
Appendix2:Staffing–Teachers
Elementary Teachers
Class
Size
# of
Teachers
Per 1,000
Students Total
Class
Size
# of
Teachers
Per 1,000
Students Total
Class
Size
# of
Teachers
Per 1,000
Students Total
Classroom Teachers
Kindergarten 26:1 38.46 46.81 26:1 38.46 45.12 26:1 38.46 44.54
Grades 1 to 3 19.8:1 50.51 96.87 19.8:1 50.51 95.76 19.8:1 50.51 95.91
Grades 4 to 8 24.5:1 40.82 126.08 24.5:1 40.82 127.02 24.5:1 40.82 126.78
Total Classroom Teachers 269.76 267.89 267.22
Round up to 1.0 FTE 270.00 268.00 268.00
Specialist Teachers (Prep Time)
Kindergarten 7.55 9.19 7.55 8.86 7.55 8.74
Grades 1 to 3 9.67 18.55 9.67 18.33 9.67 18.36
Grades 4 to 8 7.96 24.59 7.96 24.77 7.96 24.72
Total Secondary Day School 52.32 51.96 51.83
Add 2.0 FTE for travel time 54.00 54.00 53.90
Student Success Teachers 1.00 1.00 1.00
Literacy & Numeracy (DLNTs) 3.00 3.00 3.00
Section 23 Teachers 1.00 1.00 1.00
Program Resource Teachers 28.50 28.50 28.50
TOTAL ELEMENTARY TEACHERS 357.50 355.50 355.40
Secondary Teachers
Class
Size
# of
Teachers
Per 1,000
Students Total
Class
Size
# of
Teachers
Per 1,000
Students Total
Class
Size
# of
Teachers
Per 1,000
Students Total
Classroom Teachers (includes SWAC)
Grades 9 to 12 22:1 56.82 140.53 22:1 56.82 137.39 22:1 56.82 136.62
Total Classroom Teachers 140.53 137.39 136.62
Round to nearest 0.17 FTE 140.50 137.33 136.67
Guidance Teachers 2.60 6.43 2.60 6.29 2.60 6.25
Round to nearest 0.17 FTE 6.33 6.33 6.33
Alt Ed / Dual Credit / Student Success 4.67 4.67 4.67
Program Resource Teachers 8.00 8.00 8.00
TOTAL SECONDARY TEACHERS 159.50 156.33 155.67
Full Time Equivalent (FTE) Full Time Equivalent (FTE) Full Time Equivalent (FTE)
2016 2017 2018
Full Time Equivalent (FTE) Full Time Equivalent (FTE) Full Time Equivalent (FTE)
2016 2017 2018


