Embed Size (px)
Citation preview

2023 Electric Integrated Resource Plan Technical Advisory Committee Meeting No. 2 Agenda
Tuesday, February 8, 2022 Virtual Meeting
Topic Time Staff Introductions 9:00 John Lyons Process Update 9:10 John Lyons Demand & Economic Forecast 9:30 Grant Forsyth Load and Resource Balance Update 11:00 James Gall Adjourn 11:30
Microsoft Teams meeting Join on your computer or mobile app Click here to join the meeting Or call in (audio only) +1 509-931-1514,,935268410# United States, Spokane Phone Conference ID: 935 268 410# Find a local number | Reset PIN Learn More | Meeting options

2023 Avista Electric IRP
TAC 2 – February 8, 2022
John Lyons, Ph.D. Senior Resource Policy Analyst
2023 IRP Introduction

Meeting Guidelines• IRP team is working remotely and is available for questions and comments
• Stakeholder feedback form• Responses shared with TAC at meetings, by email and in Appendix• Would a form and/or section on the web site be helpful?
• IRP data posted to web site – updated descriptions and navigation are in development
• Virtual IRP meetings on Microsoft Teams until able to hold large meetings again
• TAC presentations and meeting notes posted on IRP page
• This meeting is being recorded and an automated transcript made
2

Virtual TAC Meeting Reminders
• Please mute mics unless speaking or asking a question
• Raise hand or use the chat box for questions or comments
• Respect the pause
• Please try not to speak over the presenter or a speaker
• Please state your name before commenting for the note taker
• This is a public advisory meeting – presentations and comments will be
documented and recorded
3

Integrated Resource PlanningThe Integrated Resource Plan (IRP):
• Required by Idaho and Washington* every other year• Washington requires IRP every four years and update at two years
• Guides resource strategy over the next twenty + years
• Current and projected load & resource position
• Resource strategies under different future policies• Generation resource choices• Conservation / demand response • Transmission and distribution integration• Avoided costs
• Market and portfolio scenarios for uncertain future events and issues
4

Technical Advisory Committee• The public process piece of the IRP – input on what to study, how to study,
and review of assumptions and results
• Wide range of participants involved in all or parts of the process• Please ask questions
• Always soliciting new TAC members
• Open forum while balancing need to get through topics
• Welcome requests for new studies or different modeling assumptions.
• Available by email or phone for questions or comments between meetings
5

2023 IRP Process Update• Draft Work Plan sent with today’s presentations
• Are any days of the week better or worse for future meetings?• Based on feedback from last TAC – aiming for shorter and more frequent
meetings
• Intend to file 2023 IRP on June 1, 2023 – allow time to incorporate results of 2022 All-Source RFP
• Idaho Extension• Filed request under Docket No. AVU-E-22-01 to file the next IRP on June 1, 2023,
instead of April 1, 2023• January 25, 2022: Staff recommendation to set a public comment deadline of
February 24, 2022, and Company reply due by March 5, 2022
• Washington IRP update on January 1, 2022, with 3 of the 4 requirements –only Preferred Resource Strategy will not be ready with RFP results
6

2023 IRP TAC Meeting Schedule• TAC 3: Wednesday, March 9, 2022
• Preliminary Natural Gas Market Overview and Price Forecast
• Preliminary Wholesale Electric Price Forecast
• Non-Energy Impact Study (DNV)
• Existing Resource Overview
• TAC 4: August 2022• Conservation Potential Assessment (AEG)
• Demand Response Potential Assessment (AEG)
• Energy Efficiency Inclusion of Social Cost of Greenhouse Gas (WA Only)
• TAC 5: Early September 2022• IRP Generation Option Transmission Planning Studies
• Distribution System Planning with the IRP
• Western Resource Adequacy Program update
7

2023 IRP TAC Meeting Schedule• TAC 6: End of September 2022
• Supply Side Resource Cost Assumptions, including DERs
• Ancillary Services and Intermittent Generation Analysis
• All-Source RFP Update
• Energy and Peak Forecast update
• Load & Resource Balance update
• TAC 7: October 2022• Hydro Impacts from Global Climate Change studies
• Load Impacts from Global Climate Change studies
• DER Study Scope for 2025 IRP
• Clean Energy Implementation Plan update
• Final Wholesale Natural Gas and Electric Price Forecasts
• Discuss portfolio and market scenario options
8

2023 IRP TAC Meeting Schedule• Technical Modeling Workshop October 2022
• PRiSM model overview
• Risk Assessment overview
• Washington use of electricity modeling
• TAC 8: February 2023• Wholesale Market Scenario results
• RFP update
• Jurisdictional allocation update
• Draft Preferred Resource Strategy
• Washington 100% clean energy planning standard modeling
• Market risk assessment
9

2023 IRP TAC Meeting Schedule• Virtual Public Meeting – Natural Gas & Electric IRPs (February/March 2023)
• Recorded presentation
• Daytime comment and question session
• Evening comment and question session
• TAC 9: March 2023• Final Preferred Resource Strategy
• Portfolio scenario analysis
• Final report overview & comment plant
• Action Items
10
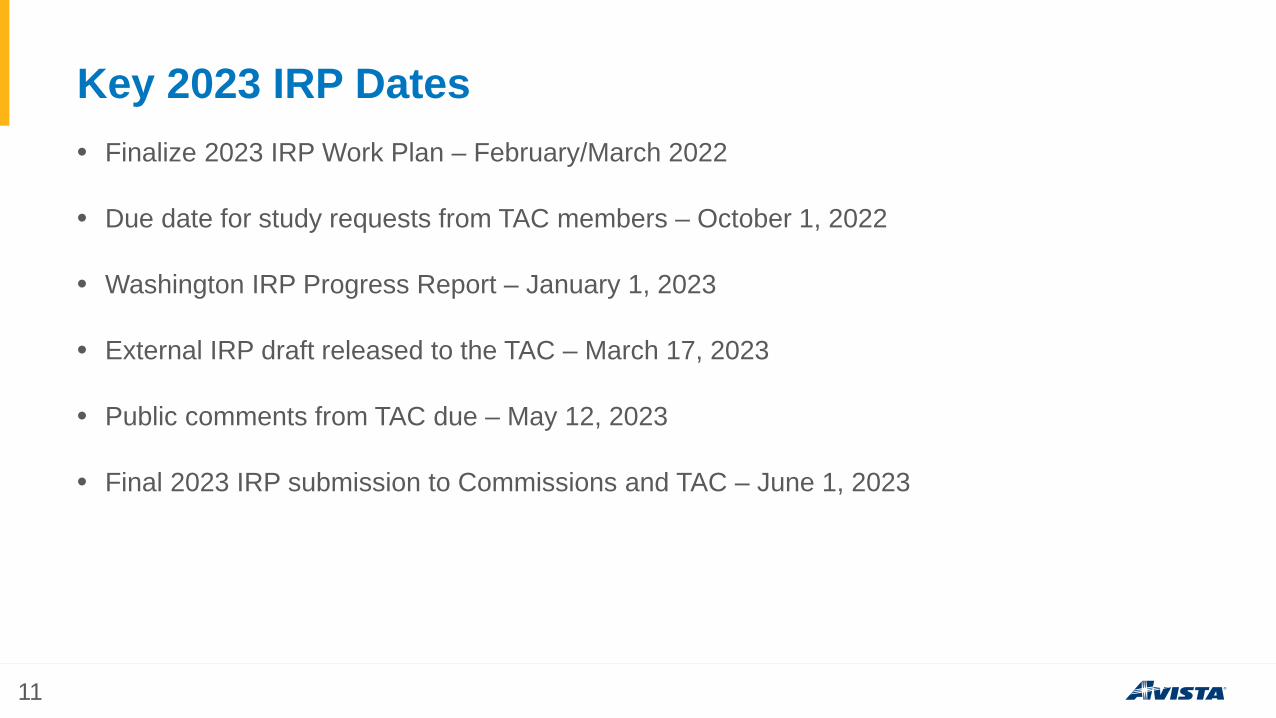
Key 2023 IRP Dates• Finalize 2023 IRP Work Plan – February/March 2022
• Due date for study requests from TAC members – October 1, 2022
• Washington IRP Progress Report – January 1, 2023
• External IRP draft released to the TAC – March 17, 2023
• Public comments from TAC due – May 12, 2023
• Final 2023 IRP submission to Commissions and TAC – June 1, 2023
11

Today’s Agenda9:00 Introductions, Lyons
9:10 Process Update, Lyons
9:30 Demand and Economic Forecast, Forsyth
11:00 Load and Resource Balance Update
11:30 Adjourn
12

2023 IRP: Preliminary Economic Conditions and ForecastsGrant Forsyth, Ph.D.Chief [email protected]
TAC MeetingFebruary 8, 2022

Outline
“Models are predicting what’s normal in a world that isn’t normal.”-Erica Groshen, former head of the BLS and current economic advisor to Cornell University’s Industrial and
Labor Relations School.
Quote from: “Here’s another thing the pandemic messed up: economic forecasts,” by David J. Lynch, The Washington Post, January 11, 2022
o Service Area Economy
o Long-run Energy Forecast
o Peak Load Forecast

Service Area Economy: Non-Farm Employment Structure
Source: BLS and author’s calculations.
Comments
• Employment structure very similar to the U.S.
• Employment dominated by private services. Without service sector growth, very little employment growth will be generated.
• Majority of public sector employment is local and related to education.
• If agriculture is considered, it would account for about 1% to 1.5% of employment.
Private Goods
14%
Private Services
69%
Government17%
Avista WA-ID MSAPrivate Goods14%
Private Services
71%
Government15%
U.S.
Federal10%
State23%
Local67%
Avista WA-ID MSA Government
Federal12%
State23%
Local65%
U.S. Government

Service Area Economy: Non-Farm Employment
Source: BLS, WA ESD, and author’s calculations.
Comments
• Region has recovered from the pandemic faster than the U.S.
• Strong growth in ID and an Amazon expansion in WA were important drivers.
• However, the region is still suffering many of the same problems seen in the rest of the U.S.: labor shortages, supply disruptions, and inflation. Shelter cost growth has been some of the fastest in the U.S.
89
101100
85
98
84
86
88
90
92
94
96
98
100
102Fe
b-20
Mar
-20
Apr-
20
May
-20
Jun-
20
Jul-2
0
Aug-
20
Sep-
20
Oct
-20
Nov
-20
Dec-
20
Jan-
21
Feb-
21
Mar
-21
Apr-
21
May
-21
Jun-
21
Jul-2
1
Aug-
21
Sep-
21
Oct
-21
Nov
-21
Dec-
21
Feb.
202
0 In
dex
= 10
0
Avista WA-ID MSAs U.S.

Service Area Economy: WA-ID Metro Population Growth
Comments• Population growth drives
most of our customer growth.
• Significantly higher than U.S. growth because of in-migration. Without in-migration, growth would look like U.S.
• Pandemic suppressed growth in 2021. We expect a rebound in service area growth after 2021.
• Growth is highest on the ID side.
0.0%
0.5%
1.0%
1.5%
2.0%
2.5%
2007 2008 2009 2010 2011 2012 2013 2014 2015 2016 2017 2018 2019 2020 2021
Ann
ual G
row
th
Population Growth in Avista WA-ID MSAs
Source: BEA, U.S. Census, and author’s calculations.
2008-2012: Employment Growth Slowing = Slowing
In-migration2013-2017: Employment
Growth Increasing = Increasing In-migration

Service Area Economy: Spokane+Kootenai Residential Units Permitted
Source: Construction Monitor and author’s calculations.
Comments
• Strongly connected to population growth.
• Held up surprisingly well in the pandemic. Recessions would normally push down permitting.
• Even with strong permitting, demand has outstripped supply of housing. This has pushed price growth to some of the highest in the U.S.
• Apartments and duplexes have been an important source of new housing in both WA and ID. Duplexes are counted as “single family” in the graph.
1,1241,510
2,013 1,9242,484
3,142 3,043 3,252 3,133 3,246 3,237972757
1,071 1,063
1,205
2,380
1,719 1,151 1,482
2,6912,327
0
1,000
2,000
3,000
4,000
5,000
6,000
7,000
2011 2012 2013 2014 2015 2016 2017 2018 2019 2020 2021
Uni
ts P
erm
itted
Total Spokane+Kootenai Single Family, WA-IDTotal Spokane+Kootenai Apartments, WA-ID

Service Area Economy: U.S. GDP Growth Assumptions
Source: Various and author’s calculations.
Comments
• Long-run growth is a function of population growth and labor productivity growth.
• U.S. continues to have weak productivity growth and weak population growth.
• The Fed’s long-run expectation for GDP growth has fallen from 2% to 1.8% (yellow line). This is the growth rate assumed from 2027 to 2045.
• The assumed long-run GDP forecast is lower compared to previous IRPs. Long-run GDP growth must exceed 2.3% before forecasted industrial load will grow.
0.0%
0.5%
1.0%
1.5%
2.0%
2.5%
3.0%
3.5%
4.0%
4.5%
2022 2023 2024 2025 2026
Annu
al G
row
th
Average Fall 2021 Forecast Current Forecast Average
Medium-Term
Long-Term
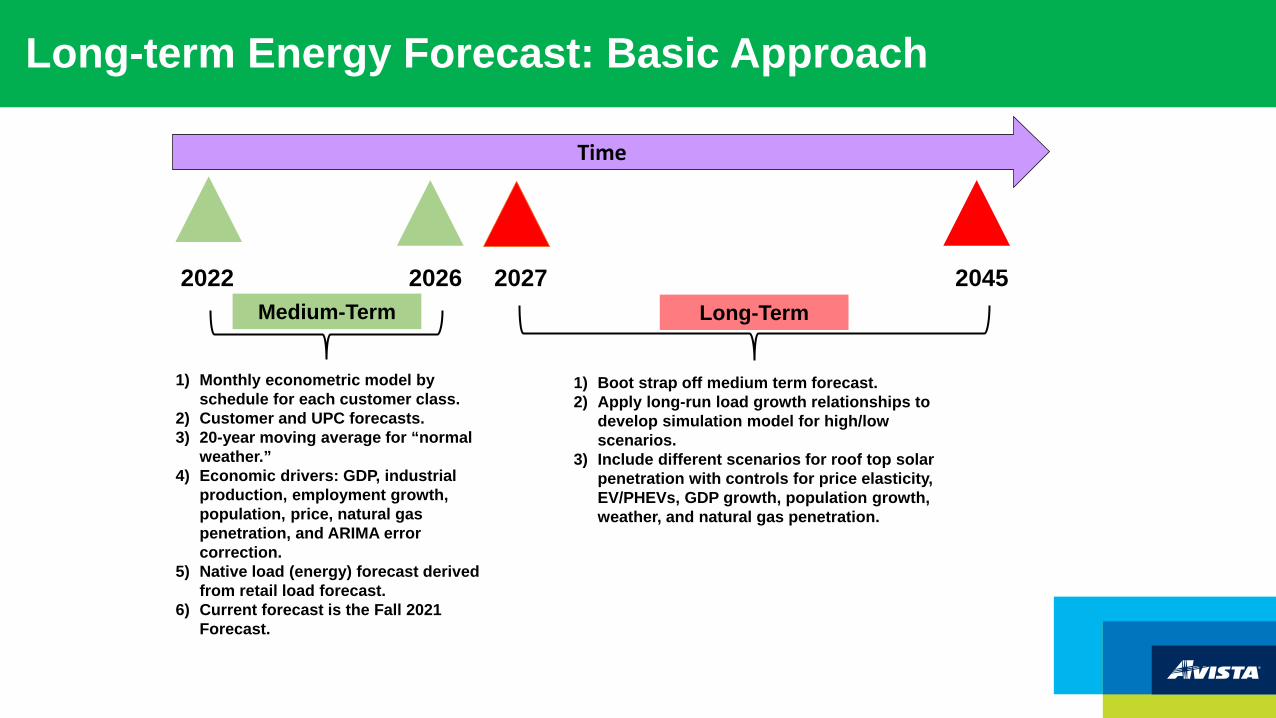
Long-term Energy Forecast: Basic Approach
2022
Time
2026 20452027
1) Monthly econometric model by schedule for each customer class.
2) Customer and UPC forecasts.3) 20-year moving average for “normal
weather.”4) Economic drivers: GDP, industrial
production, employment growth, population, price, natural gas penetration, and ARIMA error correction.
5) Native load (energy) forecast derived from retail load forecast.
6) Current forecast is the Fall 2021 Forecast.
1) Boot strap off medium term forecast. 2) Apply long-run load growth relationships to
develop simulation model for high/low scenarios.
3) Include different scenarios for roof top solar penetration with controls for price elasticity, EV/PHEVs, GDP growth, population growth, weather, and natural gas penetration.
Medium-Term Long-Term

Long-term Energy Forecast: Growth Relationships
Load = Customers x Use Per Customer (UPC)
Load Growth ≈ Customer Growth + UPC Growth
Population growth is the primary driver of residential customer growth and
residential growth is primary driver of commercial customer growth.
Industrial customer growth reflects a long-run trend of declining customers.
Assumed to be a function of multiple factors; the major
factors can be altered to see impacts.

Long-term Energy Forecast: Residential Customer Growth
IRP Avg. Annual Growth
2021 IRP 0.80%
2023 IRP 0.86%
2023 WA 0.69%
2023 ID 1.17%
Comments
• From 2027 on, the time-path reflects IHS population forecasts.
• The higher growth rate in this IRP reflects higher forecasted growth in ID.
0.4%
0.5%
0.6%
0.7%
0.8%
0.9%
1.0%
1.1%
1.2%20
23
2024
2025
2026
2027
2028
2029
2030
2031
2032
2033
2034
2035
2036
2037
2038
2039
2040
2041
2042
2043
2044
2045
Annu
al G
row
th
Annual Residential Customer Growth Rates
2023 IRP Residential Customer Growth2021 IRP Residential Customer Growth
Medium-Term Long-Term

Long-term Energy Forecast: Residential Solar Penetration
Comments
• Solar penetration similar to 2021 IRP.
• Current penetration is 0.4% of residential customers. This is projected to grow to 2.5% by 2045.
• Current system size is around 7,000 watts, with the assumption of 8,900 watts by 2045
• This remains a highly uncertain projection given on-going changes to public policy.
0
2,000
4,000
6,000
8,000
10,000
12,00020
2320
2420
2520
2620
2720
2820
2920
3020
3120
3220
3320
3420
3520
3620
3720
3820
3920
4020
4120
4220
4320
4420
45
Tota
l PV
Custo
mer
s
Projected Base-Line Residental Solar Customers
2023 IRP Base-Line Residential Solar Customers2021 IRP Base-Line Residential Solar Customers

Long-term Energy Forecast: Light Duty EVs, 2023-2045
Comments
• Similar to 2021 IRP.
• Current light duty EVs are around 2,600. This is projected to grow to 106,000 by 2045.
• Current penetration is 0.3% of household vehicles. This is projected to grow to 13% by 2045.
• This remains a highly uncertain projection given on-going changes in the EV industry and public policy.
0
20,000
40,000
60,000
80,000
100,000
120,00020
2320
2420
2520
2620
2720
2820
2920
3020
3120
3220
3320
3420
3520
3620
3720
3820
3920
4020
4120
4220
4320
4420
45
Tota
l EVs
Projected Residental EVs
2021 IRP Projected EV 2023 IRP Projected EV

Long-term Energy Forecast: Net Solar and EV Impacts, 2023-2045
Comments
• EVs start to dominate load impacts in late 2030s.
-5
0
5
10
15
20
25
30
35
40
45
2023
2024
2025
2026
2027
2028
2029
2030
2031
2032
2033
2034
2035
2036
2037
2038
2039
2040
2041
2042
2043
2044
2045
Aver
age M
egaw
atts
Average Megawatt Impact of Solar and EV/PHEV
2023 IRP Residential Base-Line, Renewable Contribution (Load Reduction)2023 IRP Estimated Annual KWH EV LoadNet Impact on Residential Load
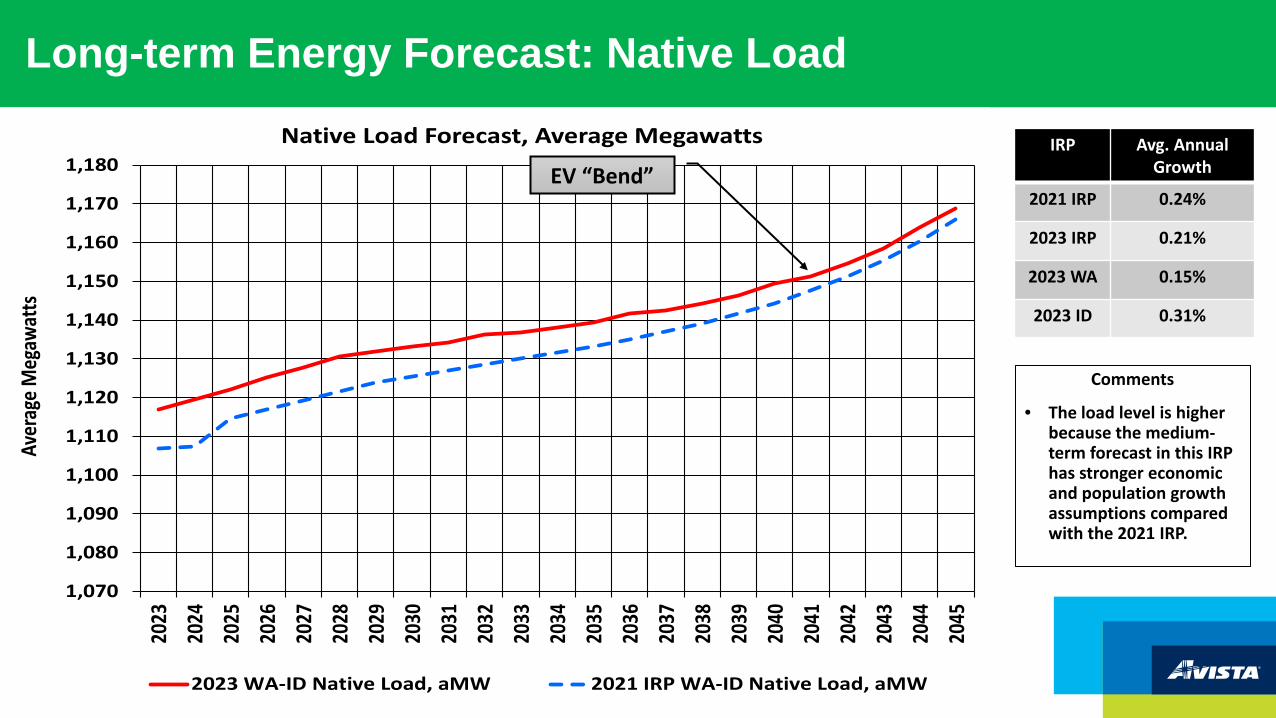
Long-term Energy Forecast: Native Load
IRP Avg. Annual Growth
2021 IRP 0.24%
2023 IRP 0.21%
2023 WA 0.15%
2023 ID 0.31%
Comments
• The load level is higher because the medium-term forecast in this IRP has stronger economic and population growth assumptions compared with the 2021 IRP.
1,070
1,080
1,090
1,100
1,110
1,120
1,130
1,140
1,150
1,160
1,170
1,18020
2320
2420
2520
2620
2720
2820
2920
3020
3120
3220
3320
3420
3520
3620
3720
3820
3920
4020
4120
4220
4320
4420
45
Aver
age M
egaw
atts
Native Load Forecast, Average Megawatts
2023 WA-ID Native Load, aMW 2021 IRP WA-ID Native Load, aMW
EV “Bend”

Long-term Energy Forecast: State Native Load
IRP Avg. Annual Growth
2023 IRP 0.21%
2023 WA 0.15%
2023 ID 0.31%
Comments
• ID load growth is higher because (1) its population growth forecast is higher and (2) lower solar penetration compared to WA.
• WA long-term forecast assumes gas penetration (as a share of residential electric customers) is constant. In ID the model assumes a gradual increase.
415
420
425
430
435
440
445
450
455
460
680
685
690
695
700
705
710
715
720
725
2023
2024
2025
2026
2027
2028
2029
2030
2031
2032
2033
2034
2035
2036
2037
2038
2039
2040
2041
2042
2043
2044
2045
ID A
vera
ge M
egaw
atts
WA
Aver
age M
egaw
atts
State Native Load Forecast, Average Megawatts
2023 WA Native Load, aMW 2023 ID Native Load, aMW
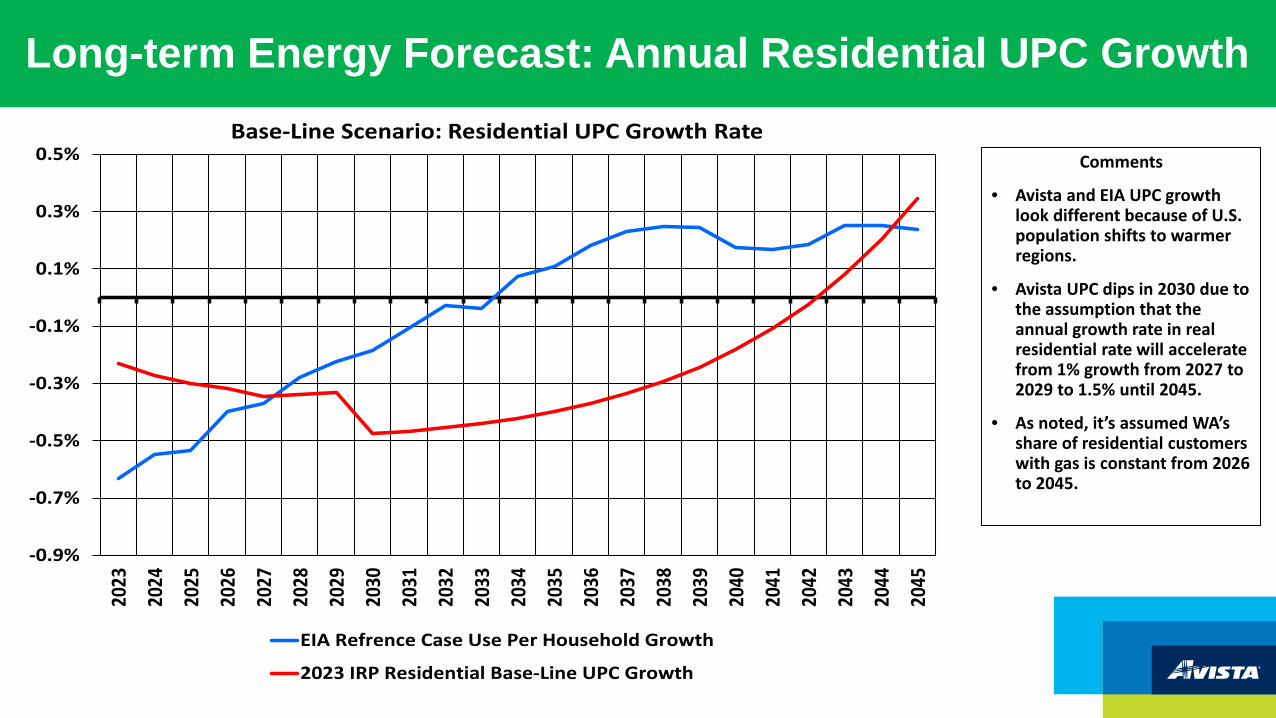
Long-term Energy Forecast: Annual Residential UPC Growth
-0.9%
-0.7%
-0.5%
-0.3%
-0.1%
0.1%
0.3%
0.5%
2023
2024
2025
2026
2027
2028
2029
2030
2031
2032
2033
2034
2035
2036
2037
2038
2039
2040
2041
2042
2043
2044
2045
Base-Line Scenario: Residential UPC Growth Rate
EIA Refrence Case Use Per Household Growth
2023 IRP Residential Base-Line UPC Growth
Comments
• Avista and EIA UPC growth look different because of U.S. population shifts to warmer regions.
• Avista UPC dips in 2030 due to the assumption that the annual growth rate in real residential rate will accelerate from 1% growth from 2027 to 2029 to 1.5% until 2045.
• As noted, it’s assumed WA’s share of residential customers with gas is constant from 2026 to 2045.
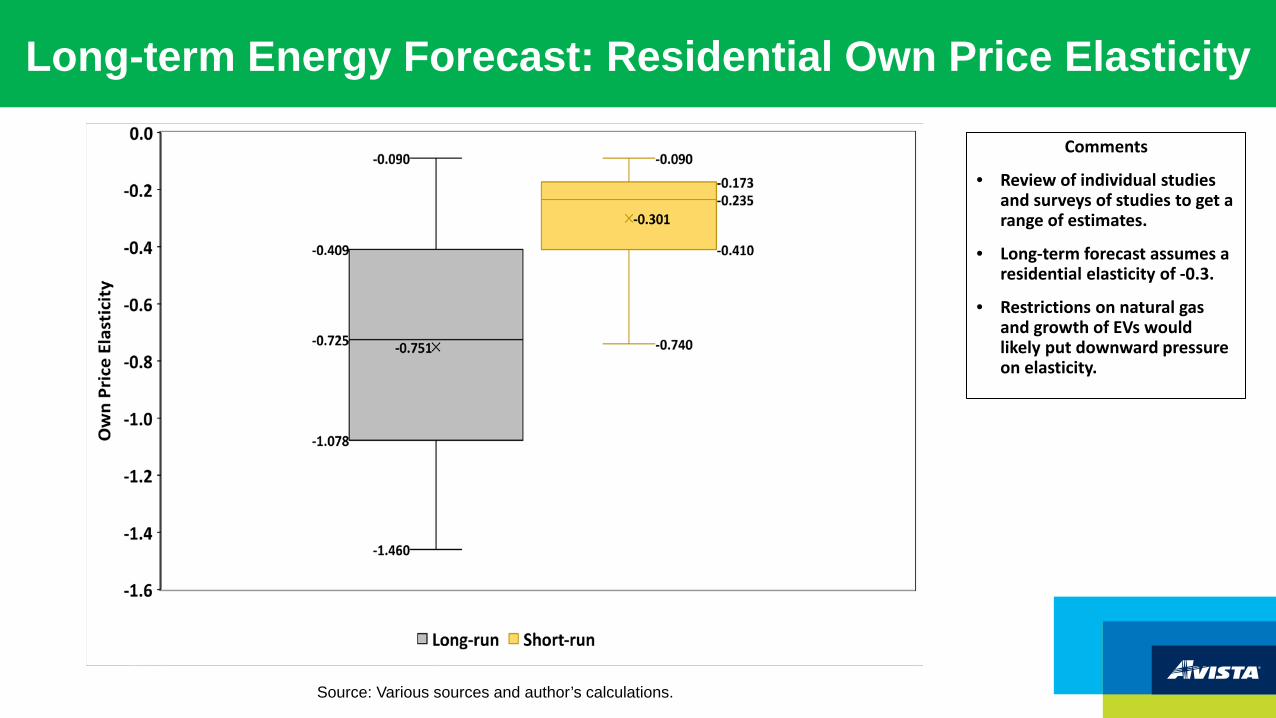
Long-term Energy Forecast: Residential Own Price Elasticity
Comments
• Review of individual studies and surveys of studies to get a range of estimates.
• Long-term forecast assumes a residential elasticity of -0.3.
• Restrictions on natural gas and growth of EVs would likely put downward pressure on elasticity.
Source: Various sources and author’s calculations.

Long-term Energy Forecast: Conservation Impacts
IRP Avg. Annual Growth
2023 IRP No Conservation
0.89%
2023 IRP 0.21%
Comments
• Based on historical conservation behavior.
900
950
1,000
1,050
1,100
1,150
1,200
1,250
1,300
1,350
1,400
2023
2024
2025
2026
2027
2028
2029
2030
2031
2032
2033
2034
2035
2036
2037
2038
2039
2040
2041
2042
2043
2044
2045
Aver
age
Meg
awat
ts
aMW Load Comparision with Conservation Adjustment
Base-Line Native Load Base-Line Native Load with Conservation Added Back

Peak Load Forecast: The Basic Model
• Based on monthly peak MW loads since 2004. The peak is pulled from hourly load data for each day for each month. The model used for this IRP underwent a major revision after the 2021 IRP.
• Monthly time-series regression model that initially excludes certain industrial loads, EVs, and solar. However, those are added back for the final forecast. As part of the model revision, the forecasted impact of EVs and solar were improved for this IRP.
• Explanatory variables include HDD-CDD and monthly and day-of-week dummy variables. The level of real U.S. GDP is the primary economic driver in the model—the higher GDP, the higher peak loads. The model allows GDP impact to differ between winter and summer. This separation was improved on in the revised model, and it significantly changes the results between winter and summer. The revised model shows Avista is a winter peaking utility until around 2030. This reflects a forecasted summer peak that is expected to grow notably faster than the winter peak.
• The coefficients of the model are used to generate a distribution of peak loads by month based on historical max/min temperatures since 1890, holding GDP constant. A starting expected peak load is then calculated using the average peak load simulated for that month going back to 1890. For the 2023 IRP, the starting winter peak average uses data back to 1890; the starting summer peak using a 30-year average.
• The long-run growth rate of peak loads for summer and winter are calculated using GDP growth under the “all else constant” assumption for all other factors in the model.

Peak Load Forecast: Winter and Summer Forecast
Peak Avg. Growth2023-45
Winter 0.37%
Summer 0.73%
Comments
• Extreme value of analysis of winter and summer temperatures suggests cold is still a risk.
• Impacts of electrification policies still being evaluated.
• There is no trended climate in the current forecast.
1,100
1,200
1,300
1,400
1,500
1,600
1,700
1,800
1,900
2,000
2,10019
9719
9920
0120
0320
0520
0720
0920
1120
1320
1520
1720
1920
2120
2320
2520
2720
2920
3120
3320
3520
3720
3920
4120
4320
45
Meg
awat
ts
Winter and Summer Peak, Megawatts
Winter Peak Summer Peak

Peak Load Forecast: Change in IRP Summer Peak
1,500
1,600
1,700
1,800
1,900
2,000
2,10020
2320
2420
2520
2620
2720
2820
2920
3020
3120
3220
3320
3420
3520
3620
3720
3820
3920
4020
4120
4220
4320
4420
4520
46
Meg
awat
ts
Summer Peak: Current and Previous IRP, Megawatts
2021 IRP Max Summer 2023 IRP Max Summer

Peak Load Forecast: Change in IRP Winter Peak
1,650
1,700
1,750
1,800
1,850
1,900
1,950
2,00020
2320
2420
2520
2620
2720
2820
2920
3020
3120
3220
3320
3420
3520
3620
3720
3820
3920
4020
4120
4220
4320
4420
4520
46
Meg
awat
ts
Winter Peak: Current and Previous IRP, Megawatts
2021 IRP Max Winter 2023 IRP Max Winter

Questions?
Avista, Electric Technical Advisory Committee
February 8th, 2022 – TAC 2
James Gall, Electric IRP Manager
Load & Resource Balance Update

Major L&R Changes Since 2021 IRP
• Load forecast
• 30 MW industrial demand response (Washington Rate Case Settlement)
• Chelan County PUD purchase • ~88 MW or ~54 aMW equal to 5% of Rocky Reach and Rock Island projects
2
2022 2023 2024 2025 2026-2030
2031-2033
2034-2045
Existing Slice 5% 5% 5% 5% 5%
April 2021 Contract 5% 5% 5% 5%
December 2021 Contract 5% 10% 10%

System Capacity Position Western Resource Adequacy Program not included at this time
Seasonal winter/summer peak not included at this time, short position begins in Nov 1, 20263
(600)
(500)
(400)
(300)
(200)
(100)
0
100
200
300
400
2022
2023
2024
2025
2026
2027
2028
2029
2030
2031
2032
2033
2034
2035
2036
2037
2038
2039
2040
2041
2042
2043
2044
2045
Meg
awat
ts1 Hour Peak Load & Resource Position
JanuaryAugust
2027J: 162 A: 127
2030J: 196A: 190
2040J: 353 A: 405
Peak Planning Criteria16% winter PRM7% summer PRMOperating reserves (~6%)Regulation (16 MW)

System Planning Energy Position
4
(500)
(400)
(300)
(200)
(100)
0
100
200
300
40020
22
2023
2024
2025
2026
2027
2028
2029
2030
2031
2032
2033
2034
2035
2036
2037
2038
2039
2040
2041
2042
2043
2044
2045
Meg
awat
ts
Energy Load & Resource PositionJanuary
August
Annual
Energy Contingency Metrics10th percentile hydro90th percentile load
2023 IRP will update contingency metrics for wind/solar variability (TBD in future TAC meeting)
2023 IRP will energy planning constraint beyond annual

Monthly Planning Energy Position
5
(400)
(200)
0
200
400
600
800
Jan
Feb
Mar Ap
r
May Jun
Jul
Aug
Sep
Oct
Nov
Dec
Aver
age
Meg
awat
ts2025 2030 2040

2030 Washington CETA Planning
• Draft rules were released January 19th, 2022
• Creates a planning standard for renewable energy using two compliance mechanisms
• Must plan for renewable generation equal to or greater then 80% of retail load to qualify as primary compliance by 2030
• Remaining retail load must be offset using Alternative Compliance- Alternative compliance could be an unbundled REC, energy transformation project, compliance
payment
• Planning standard time step and risk level is not defined in the draft rule
6

Avista Clean Energy Position for Planning Standard (strawman)• Monthly retail load vs generation comparison• Renewable generation exceeding monthly retail load qualifies as alternative compliance
• On/off peak estimates could be used
• Expected Case Methodology• Median Hydro• Expected Loads• Historical average wind/solar if available
• Resource allocation• Existing hydro (PT Ratio)• Wind (PT Ratio + WA purchase hourly Idaho share of energy)• Solar (allocated to WA)• Kettle Falls (PT Ratio + WA purchase hourly Idaho share of energy, 95.4% qualifying)• New Chelan PUD contracts (PT Ratio + WA purchase hourly Idaho share of energy)
PT Ratio is ~65.5% Washington, and 34.5% Idaho7
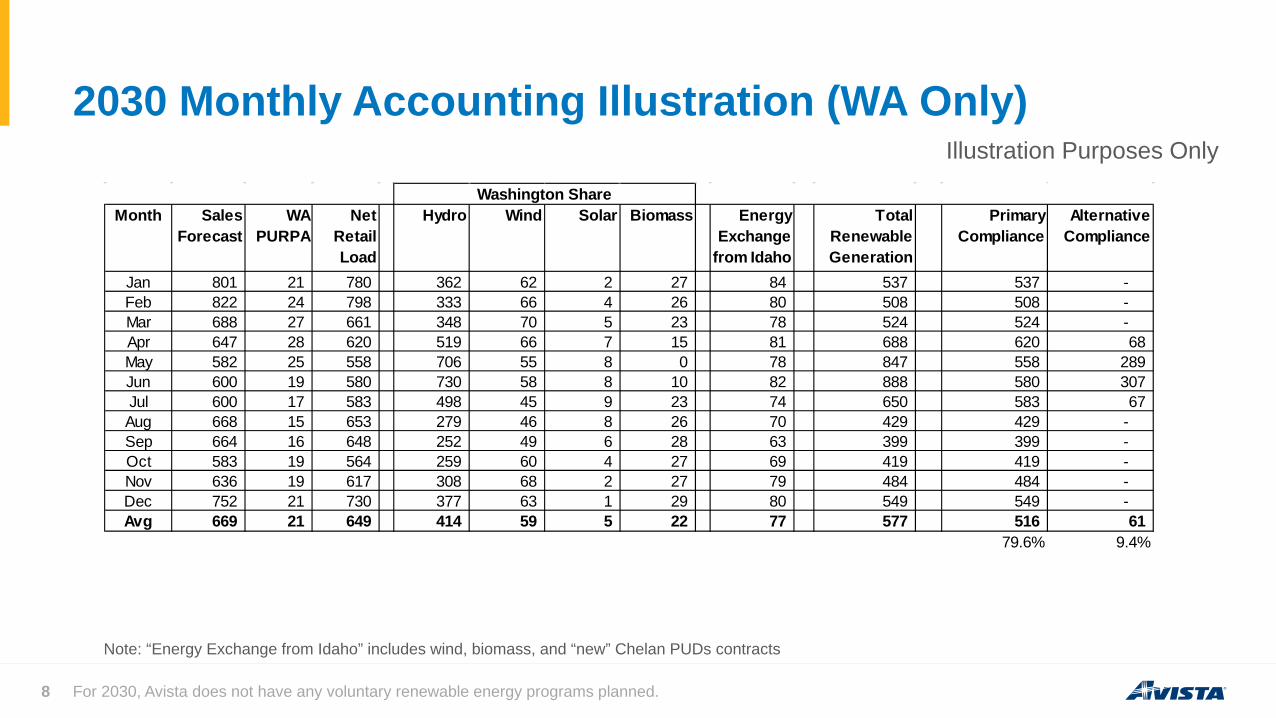
2030 Monthly Accounting Illustration (WA Only)
For 2030, Avista does not have any voluntary renewable energy programs planned.8
Month Sales Forecast
WA PURPA
Net Retail Load
Hydro Wind Solar Biomass Energy Exchange
from Idaho
Total Renewable Generation
Primary Compliance
Alternative Compliance
Jan 801 21 780 362 62 2 27 84 537 537 - Feb 822 24 798 333 66 4 26 80 508 508 - Mar 688 27 661 348 70 5 23 78 524 524 - Apr 647 28 620 519 66 7 15 81 688 620 68 May 582 25 558 706 55 8 0 78 847 558 289 Jun 600 19 580 730 58 8 10 82 888 580 307 Jul 600 17 583 498 45 9 23 74 650 583 67 Aug 668 15 653 279 46 8 26 70 429 429 - Sep 664 16 648 252 49 6 28 63 399 399 - Oct 583 19 564 259 60 4 27 69 419 419 - Nov 636 19 617 308 68 2 27 79 484 484 - Dec 752 21 730 377 63 1 29 80 549 549 - Avg 669 21 649 414 59 5 22 77 577 516 61
79.6% 9.4%
Washington Share
Illustration Purposes Only
Note: “Energy Exchange from Idaho” includes wind, biomass, and “new” Chelan PUDs contracts

Current Annual CETA Energy Position
9
0%
10%
20%
30%
40%
50%
60%
70%
80%
90%
100%
2022
2023
2024
2025
2026
2027
2028
2029
2030
2031
2032
2033
2034
2035
2036
2037
2038
2039
2040
2041
2042
2043
2044
2045
Perc
ent o
f Ret
ail L
oad
Primary ComplianceAlternative CompliancePrimary Compliance Goal
Does not include Idaho hydro used for Alternative Compliance

Compliance Window CETA Energy Position
10
79.6% 76.4% 72.7% 67.5% 63.9%
9.4%7.1%
5.7%4.4%
0.0%
11.0% 16.5% 21.6%28.1%
36.1%
0%
10%
20%
30%
40%
50%
60%
70%
80%
90%
100%
2030-33 2034-37 2038-41 2042-44 2045
Perc
ent o
f Ret
ail L
oad
Primary ComplianceAlternative ComplianceTotal ShortfallPrimary Compliance Goal
20% 15% 10% 5% 0%Alternative Compliance Goal Limit