Embed Size (px)
Citation preview

EN EN
EUROPEAN COMMISSION
Brussels, 23.5.2022
SWD(2022) 611 final
COMMISSION STAFF WORKING DOCUMENT
2022 Country Report – Finland
Accompanying the document
Recommendation for a COUNCIL RECOMMENDATION
on the 2022 National Reform Programme of Finland and delivering a Council opinion
on the 2022 Stability Programme of Finland
{COM(2022) 611 final} - {SWD(2022) 640 final}


2
Finland’s economy weathered the COVID-19 crisis well
Finland experienced one of the mildest
recessions in the EU. As a result of the COVID-19 outbreak, Finnish real GDP fell by 2.3% in 2020, compared to 5.9% in the EU. The main reason behind the decline in GDP was a drop in domestic demand as consumers increased their precautionary savings and had fewer opportunities to spend. The economy started to rebound already in the third quarter of 2020, consolidating strongly as of the second quarter of 2021, and growth exceeded pre-crisis levels in the second quarter of 2021. Overall, in 2021, Finland’s real GDP growth stood at 3.5% on the back of strong domestic demand.
Public finances helped cushion the shock. In 2021, the general government deficit declined to 2.6% of GDP, thanks to strong revenue collection and gradual withdrawal of stimulus measures, and is forecast to further diminish in 2022 and 2023. At the same time, the debt ratio, which decreased to 65.8% in 2021, is expected to slightly increase in 2022 and 2023 (see Annex 18). These projections also take into account additional spending on defence amounting to 0.3% of GDP in 2022 and 0.1% in 2023, as announced by the Finnish government.
The current geopolitical events shake up the economic landscape
Having started strongly in 2022, the
Finnish economy is set to face risks stemming from the Russian invasion of
Ukraine. The start of 2022 has been promising on the back of good economic data
and positive expectations by businesses and households. However, the Russian invasion is set to have dampening effects on the international trade, investment and financial flows. These could be significant for Finland as a neighbouring country to Russia. For example, in 2021, Finland’s exports of goods and services to Russia amounted to 4.5% of total exports. Country’s imports from Russia amounted to 8.7% of all imports, with crude oil and nickel accounting for a significant share. However, the trade turnover with Russia has been markedly below that of 2013 and 2014, when initial sanctions on Russia were introduced.
More than 2000 Finnish companies have
been involved in trade with Russia and
now are set to look for new trade
partners and business models. A number of Finnish businesses decided to pull out from the Russian market completely, while Finnair, the flag carrier and largest airline of Finland, due to the closure of the Russian airspace, lost its competitive route between Europe and Asia. Some Finnish companies, directly or via their subsidiaries, have investments in Russia or participate in large joint infrastructure projects, such as Nord Stream 2. It is projected that some businesses will be able to adjust and find new trading partners, consequently contributing to faster export growth already in 2023.
The geopolitical situation and elevated inflation weigh on business and
household sentiments. This is expected to translate into lower levels of private investment, slower growth of household income and, consequently, consumption. In addition, the pressure on the agricultural sector is set to increase due to rising energy and fertilizer prices, feed and wage costs. On the other hand, an increase in public investment, declining unemployment rate and expected deceleration of inflation allow to
ECONOMIC AND EMPLOYMENT SNAPSHOT

3
project a somewhat stronger growth of the economy in 2023. Against the backdrop of all these developments, Finland’s real GDP growth is expected to reach 1.6% in 2022 and 1.7% in 2023.
Recovery in the labour market has been strong
Employment was hit by the COVID-19
crisis, but its recovery has been fast and firm. The employment rate dropped during the economic recession, but the rebound was fast and the employment rate as well as the number of vacancies rose above pre-pandemic levels in 2021. After having risen to 7.7% in 2020, the unemployment rate is forecast to drop to 7.2% in 2022. Relatively high structural unemployment persists compared to other Nordic countries. The government has set ambitious objectives to increase the employment rate to 75% by 2025 and to 80% by 2030. Meeting these targets requires more people entering the labour market, which would play a very positive role in supporting economic growth, fiscal sustainability and social cohesion.
Graph 1.1: Labour market indicators
Source: Eurostat
Despite favourable social outcomes, the
labour market still faces some issues. Finland had one of the lowest gender employment gaps in the EU in 2021 (see Annex 12), although the gender pay gap was
slightly above average in 2020. Although the share of young people (15-29) not in employment, education or training remains below the EU average (see Annex 12) and decreased in 2021, the indicator is higher among non-EU-born people and remains especially high for non-EU-born women. In this context, Finland is taking steps to counter employment gaps for vulnerable groups, such as non-EU nationals. The persistent shortages of skilled labour and high structural unemployment point to the key role of reskilling and upskilling in ensuring the supply of skilled workers better matches labour market needs. This challenge will become even more pronounced in the next decade in the face of the twin transition and a shrinking workforce due to demographic trends. Furthermore, employment should also be boosted by the gradual removal of the right to additional days of unemployment security for employees close to their retirement age (known as the "unemployment tunnel"). The reform features in Finland’s Recovery and Resilience plan and is envisaged to enter into force in 2023.
Ageing remains a major challenge
Rapid ageing is a major societal and
economic challenge. It is estimated that the share of the workforce in the Finnish population will shrink considerably. According to the 2021 Ageing Report, the working age population is projected to shrink by 1.4 percentage points or 78 500 people between 2019 and 2030. Finland has the highest old-age dependency ratio in the EU (1) while its fertility rate is in the lower half of the ranking (2). Net migration is also relatively
(1) The old-age dependency ratio in Finland stands at 39.4
persons aged 65 or older per 100 persons aged 20 to 74. It is the highest level in the EU, shared with Italy. 2020 data, Eurostat.
(2) The fertility rate in Finland amounts to 1.35 live births per woman. It is one of the lowest fertility rates in the EU, after MT, ES, IT, CY, LU and EL (counting from the lowest). 2019 data, Eurostat.
0
10 000
20 000
30 000
40 000
50 000
60 000
70 000
6.0
6.5
7.0
7.5
8.0
8.5
9.0
Unemployment, % Vacancies (rhs)

4
low (3). Beyond the need for the welfare system to take care of the growing number of older people, the ageing society raises other economic challenges such as decreasing productivity, narrowing tax bases and declining economic dynamism, as evidenced by a falling rate of start-ups and less innovation.
Ageing costs weigh on long-term fiscal
sustainability. The ageing of society puts a structural burden on public finances, especially related to the costs of long-term care. According to the European Commission’s recent debt sustainability assessment, Finland will face debt-related challenges in the medium and long term (4). Looking at these challenges more broadly, it is important to take into account the interaction between the old-age dependency ratio and the adequacy of the Finnish pension system (reformed in 2017), the health and long-term care system (with a reform underway) and the social security system (with a reform pending).
The capacity to further raise taxes to
cover growing expenditures is limited. General government expenditures tend to grow faster than revenues, not least because of ageing-related spending (health and long-term care). Scope for increasing revenues is limited by the relatively high taxation level. The public sector already accounts for a relatively high share of GDP (above 50%). The average tax-revenue-to-GDP ratio amounts to 42% and is in the upper half of the ranking in the EU (5). The government is therefore seeking solutions to improve fiscal sustainability by broadening the tax base (increasing the employment rate) and structural reforms aimed at containing expenditure (e.g. health and social services care reform).
(3) About 16 thousand net migrants incoming (both EU and
non-EU) in 2019, compared to 68 thousand in Sweden (European Commission, Atlas of Migration 2021)
(4) See Annex 19.
(5) After Denmark, France, Belgium, Sweden, Italy and Austria; 2020, Eurostat. See also Annex 17.
The housing market needs to be monitored
Risks present in the real estate market may impact the banking sector. Both households and professional investors finance a significant share of their real estate transactions with debt. The economic uncertainty that came with the pandemic had a dampening effect on both residential and commercial real estate market activity. The market quickly recovered, both in terms of construction as well as house sales and investment flows (6). However, major regional discrepancies persist, particularly between major urban centres where prices are high and the more remote regions of the country. Concerns over growing household indebtedness and some households’ potential vulnerability to economic shocks were reflected in the set of recommendations issued to Finland by the European Systemic Risk Board in 2019 (7), advocating a set of borrower-based measures to contain the risks.
The banking sector is sound and
profitable but has some vulnerabilities. At the onset of the COVID-19 pandemic, banks reacted swiftly by granting their customers flexible arrangements, including loan repayment moratoria. The lowering of requirements for banks’ reserves provided the sector with additional lending and loss-absorbing capacity. The banks weathered the most acute part of the crisis rather well. There has been a modest inflow of non-performing loans, but the ratio is still noticeably lower than the EU average. The sector is nonetheless heavily exposed to real estate, and the borrowers’ debt-to-income ratio is one of the highest in the EU (8). The international exposure of Finnish banks remains mostly limited to the Nordic and Baltic region, with no direct links to either Ukraine or Russia.
(6) In 2021 the transaction volume in the Finnish property
market amounted to some EUR 7 billion, a 24% rise from 2020 or 10% increase compared to 2019.
(7) ESRB/2019/8.
(8) See also Annex 16.

5
Various structural reforms aim to improve productivity
The impact of a structural shift away from manufacturing to services has
affected aggregate productivity. Total factor productivity has stalled for several years and remains below that of Nordic peers. At the same time, low investment in areas that provide most support to productivity growth (machinery and equipment, including information and communication technology equipment, and intellectual property products) could hinder the return to higher potential growth. The low level of productive investment is expected to continue to be a drag on productivity, and therefore on non-cost competitiveness. In terms of research, development and innovation, Finland’s productive investment is narrowly concentrated, with an increasing gap between the most productive firms and the least productive ones.
Graph 1.2: Index of total factor productivity
Source: European Commission
After a contraction of the electronics
sector in the previous decade, successive
governments took action to address
Finland’s loss of cost-competitiveness. In 2016, the social partners concluded a Competitiveness Pact, a comprehensive labour market agreement that increased working time and cut employees’ income, in order to reverse the losses in cost competitiveness and boost job creation. A reform of the pension system and an activation model for the unemployed were also launched. This strategy
was successful for the industry in lowering the labour costs but prompted criticism related to the perceived decrease in welfare standards. In 2019, the new government committed to increasing the employment rate, combined with a reversal of some of the budgetary consolidation measures and with investments in human capital (health care, education and social policies). While Finland's digital connectivity advances in line with the other countries, it is still slightly below the EU average (see Annex 8), in particular lacking in some rural areas.
Other structural reforms are underway with a view to increasing productivity. The government set an objective to increase the research & development expenditure to 4% of GDP by 2030 from 2.9% of GDP in 2020 (see also Annex 9). These investments may also improve the productivity and competitiveness of the economy. The government is also pursuing reforms aimed at enhancing skills and promoting continuous learning in a society that already boasts top education levels (9).
The green transition is high on the national agenda
Finland has adopted ambitious climate
targets. Finland adopted the objective of becoming carbon-neutral and the first fossil-free welfare society by 2035. Legislation has been adopted to phase out coal-fired power generation by 1 May 2029. Achieving these targets will require a comprehensive set of policies and measures that will impact the whole economy. Finland’s economy being one of the most energy-intensive in the EU, this will also require large public and private sector investments. Energy, industry, transport and buildings are the main sectors that will need to contribute to hefty reductions in greenhouse gas emissions. Challenges on the way include delays in the deployment of renewable energy investments related to the resource situation of permitting and supervising authorities.
(9) 47.5% of people aged 25-64 had tertiary education
attainment; second level in the EU after Ireland; 2020, Eurostat.
80.0
90.0
100.0
110.0
04 05 06 07 08 09 10 11 12 13 14 15 16 17 18 19 20
(20
05
=10
0)
Finland Sweden Denmark

6
Moreover, peat is still a major source of energy in remote and sparsely populated areas. The phasing out of peat is likely to lead to employment shifts in these areas for which up- and reskilling could be particularly important (see Annex 6).
Finland is one of the Member States with
the highest share of renewables in its
energy mix. The share of renewable energy in Finland’s energy mix was 43.8% in 2020, an overachievement of its 2020 target of 38%. The renewable share is even higher for electricity, with 52% of all electricity produced in Finland coming from renewable sources in 2020. 45% of renewable electricity was produced with hydro power, 23% with wind power and nearly all the rest with wood-based fuels. 34% of total electricity was produced with nuclear power and 14% with fossil fuels and peat (10). In December 2021, Finland activated the Olkiluoto 3 nuclear reactor, which is expected to provide 1 600 MW of electrical output. When the new reactor is fully operational, nuclear power is expected to provide approximately 40% of Finland’s electricity consumption (11). Strong interconnections between Finland and neighbouring countries are needed to ensure a well-functioning electricity market in the whole region and to increase the projected contribution of renewable energy to the energy mix. Large additional investments are necessary to meet medium and long term climate targets, as well as diversification away from Russia as a source of energy imports (see also section 3).
Finland is a top performer on many of the UN's Sustainable Development Goals
(SDGs). Finland performs well on many SDGs related to environmental sustainability. Greenhouse gas emissions in Finland have decreased at a similar pace to the EU as a whole (-27% in 2020 since 1990), and Finland’s energy mix contains the second-highest share of renewables (43.8%). On the
(10) Statistics Finland, 3 November 2021:
https://www.stat.fi/til/salatuo/2020/salatuo_2020_2021-11-02_tie_001_en.html
(11) Teollisuuden Voima Oyj https://www.tvo.fi/en/index/production/plantunits/ol3.html
fairness dimension, Finland had one of the lowest gender employment gaps in the EU in 2021, although the gender pay gap was slightly above average in 2020. The rate of people at risk of poverty or social exclusion in Finland was 15.9% in 2020, well below the EU average of 21.6%. In addition, income inequalities in Finland are among the lowest in the EU. On the productivity dimension, Finland performs well: R&D spending in terms of GDP was 2.8% in 2019, above the EU average of 2.2%. At the same time, further investments in digital infrastructure are needed to close connectivity gaps throughout Finland and support growth and economic activity in remote areas. On macroeconomic stability, Finland scores very well on indicators related to peace, justice and institutional strength. (See Annex 1 for more details).
THE RECOVERY AND RESILIENCE PLAN IS UNDERWAY
7
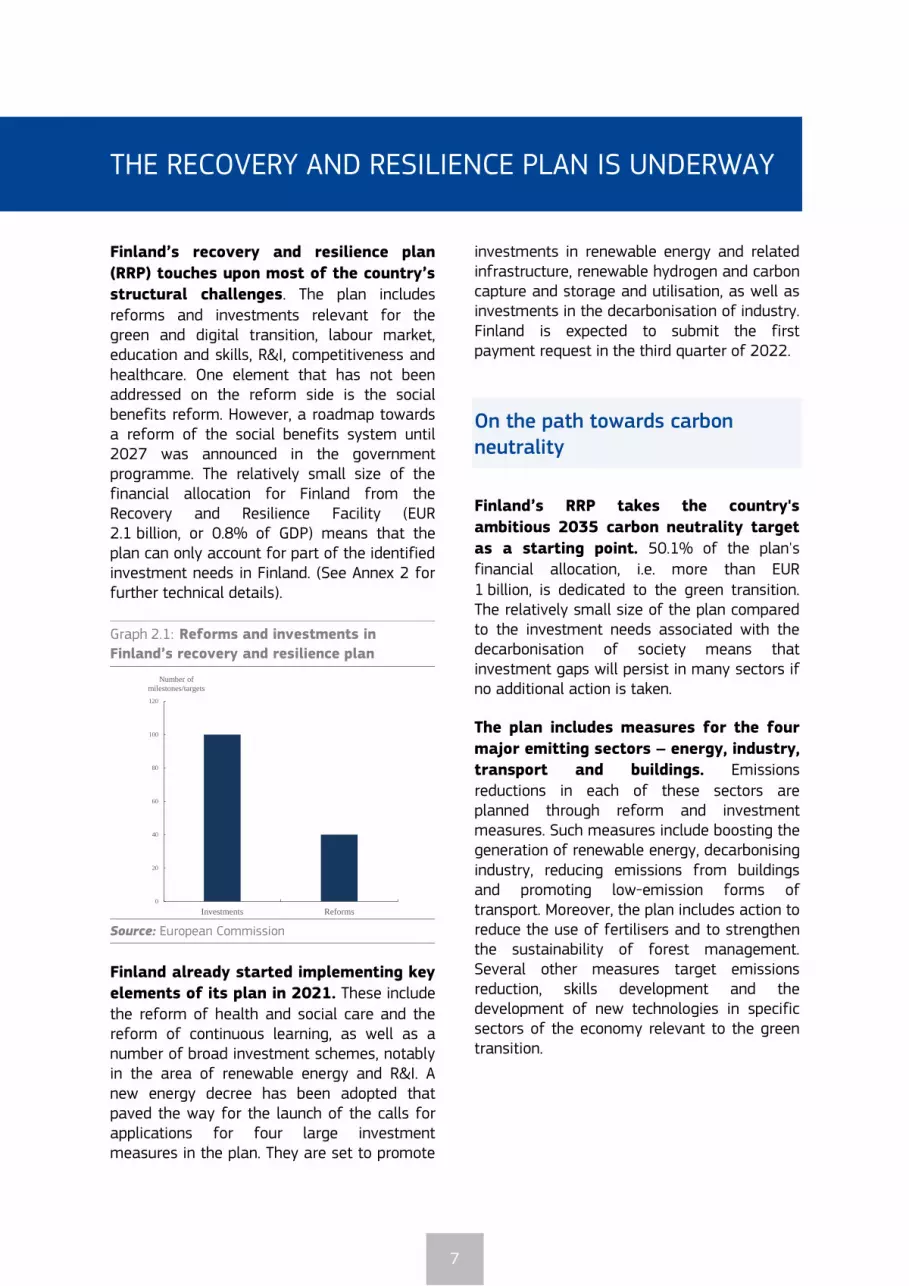
Finland’s recovery and resilience plan
(RRP) touches upon most of the country’s
structural challenges. The plan includes reforms and investments relevant for the green and digital transition, labour market, education and skills, R&I, competitiveness and healthcare. One element that has not been addressed on the reform side is the social benefits reform. However, a roadmap towards a reform of the social benefits system until 2027 was announced in the government programme. The relatively small size of the financial allocation for Finland from the Recovery and Resilience Facility (EUR 2.1 billion, or 0.8% of GDP) means that the plan can only account for part of the identified investment needs in Finland. (See Annex 2 for further technical details).
Graph 2.1: Reforms and investments in
Finland’s recovery and resilience plan
Source: European Commission
Finland already started implementing key elements of its plan in 2021. These include the reform of health and social care and the reform of continuous learning, as well as a number of broad investment schemes, notably in the area of renewable energy and R&I. A new energy decree has been adopted that paved the way for the launch of the calls for applications for four large investment measures in the plan. They are set to promote
investments in renewable energy and related infrastructure, renewable hydrogen and carbon capture and storage and utilisation, as well as investments in the decarbonisation of industry. Finland is expected to submit the first payment request in the third quarter of 2022.
On the path towards carbon neutrality
Finland’s RRP takes the country's
ambitious 2035 carbon neutrality target
as a starting point. 50.1% of the plan's financial allocation, i.e. more than EUR 1 billion, is dedicated to the green transition. The relatively small size of the plan compared to the investment needs associated with the decarbonisation of society means that investment gaps will persist in many sectors if no additional action is taken.
The plan includes measures for the four
major emitting sectors – energy, industry, transport and buildings. Emissions reductions in each of these sectors are planned through reform and investment measures. Such measures include boosting the generation of renewable energy, decarbonising industry, reducing emissions from buildings and promoting low-emission forms of transport. Moreover, the plan includes action to reduce the use of fertilisers and to strengthen the sustainability of forest management. Several other measures target emissions reduction, skills development and the development of new technologies in specific sectors of the economy relevant to the green transition.
0
20
40
60
80
100
120
Investments Reforms
Number of
milestones/targets
THE RECOVERY AND RESILIENCE PLAN IS UNDERWAY

8
Increasing Finland’s competitiveness through digital and green transitions, research & innovation
The RRP includes a number of
investments promoting the
competitiveness of key sectors of
Finland’s economy. The plan also puts emphasis on the cultural and creative sectors as well as tourism, which were disproportionally hit by the crisis. Some investments are foreseen to increase productivity by providing incentives for growth of small and medium-sized enterprises (SMEs) and supporting their access to finance and internationalisation.
Several measures contribute to
addressing challenges related to the digital transition. Support for high-speed broadband connectivity should help improve access to high-speed connections in sparsely populated areas, with benefits for productivity and maintaining economic activity in those regions. The RRP contains measures to increase the availability of study places in areas relevant for the digital transformation and to reform the continuous learning framework, as well as to strengthen the promotion of digital skills. Other measures are expected to contribute to the digital transition in several areas, including by supporting the digitalisation of businesses, in particular SMEs, and of the public sector (12), by fostering cyber and information security, and supporting research and innovation in key technologies, including semi-conductors, artificial intelligence and 6G. Digitalisation is also addressed as a cross-cutting theme by using digital solutions as part of other measures to help reach climate and environmental objectives, including the digitalisation of transport and energy infrastructure. Likewise, there is a strong emphasis on digital health solutions, ranging from the use of data analytics to improve diagnostics to investments in e-health to ensure continuity of
(12) See also Annexes 8 and 11.
care. Together, the measures supporting the digital transition objectives account for 27.5% of the Finnish plan’s financial allocation.
The plan includes substantial investments
promoting research, development and innovation (RDI). Measures included in the plan contribute to raising the share of RDI expenditure in GDP and increasing the ambition level of RDI activities, in line with the National Roadmap for Research, Development and Innovation adopted in spring 2020. In particular, the plan encourages private sector investments in RDI activities and cooperation between public and private entities involved in RDI, including at international level. Many research entities and companies, including SMEs, may apply for grants for projects promoting innovation and cross-sector cooperation. Research and innovation infrastructures will be supported at both national and local level. Funding may be granted for research infrastructure projects that complement the acquisition of LUMI - the international supercomputer hosted in Finland - or quantum computers.
Addressing challenges related to labour market, skills development and healthcare
The RRP addresses the challenges related
to Finland’s shrinking workforce and
relatively high structural unemployment, contributing to implementing the
European Pillar of Social Rights. One of the key measures is the “Nordic employment service model” for delivering public employment services. This new model is expected to increase the number of job search interviews to at least 2 million a year as of 2023, compared to 1 million in 2019. It is estimated that this will contribute to the employment of around 10 000 people by 2025. Furthermore, phasing out the ‘unemployment tunnel’ (the right to additional days of unemployment security for employees close to their retirement age) will help increase the available workforce and decrease incentives to lay off employees closer to

9
retirement age. Measures are also planned to strengthen the integrated services for young people at Ohjaamo guidance centres (13) and for people with partial work ability through a dedicated programme. Finland also aims to attract international talent by streamlining permit procedures for job-and education-based migration.
The plan also includes measures to boost
skills for the labour market. The measures contribute to the ongoing reform of continuous learning, supporting in particular the twin green and digital transitions, under-represented groups with low skills, and matching with the labour market’s needs. At least 7 800 people will participate in training programmes to respond to changes in working life, including digitalisation and the green transition. The plan also aims to improve the level of education. At least 600 tertiary-level study places will be created, targeted at sectors experiencing labour shortages, such as health and long-term care, education, technology and ICT.
In the social and healthcare area, the
plan aims to improve resilience and equal
access to services, whilst making the system more cost-effective. It supports implementation of the health and social services reform, which consists of a reorganisation of the provision of services at regional level (22 welfare areas).
The related investments aim to gradually
reduce the delays accumulated during the
COVID-19 crisis and contribute to the implementation of the so-called 7-day care guarantee, which is designed to ensure that people can access non-urgent care no later than 7 days after the initial assessment of need for care (14). Investments in digital innovation are expected to help address unmet medical needs, especially in the more remote
(13) One-Stop Guidance Centres for under 30-year-olds
providing free assistance and support in various areas such as studying, employment and housing.
(14) In 2019, the median waiting times ranged from 20 to 50 days depending on the region. The COVID-19 pandemic has increased the backlog in the provision of healthcare services and it is estimated that the waiting times have further increased.
areas. To address the risks to the sustainability of the social and healthcare system posed by the ageing population, the plan also includes measures to strengthen the cost-effectiveness of the system based on knowledge and evidence.
10
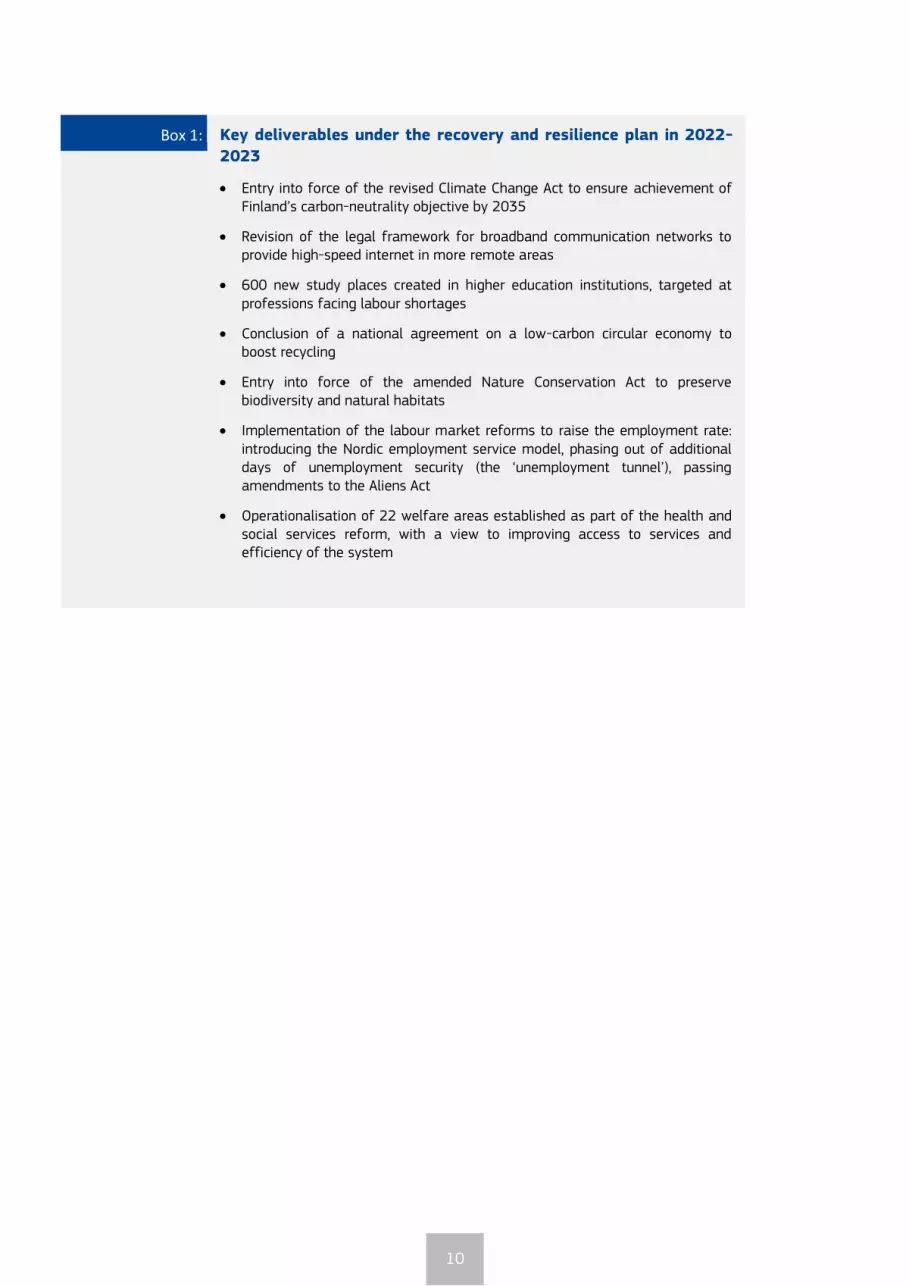
Box 1: Key deliverables under the recovery and resilience plan in 2022-
2023
Entry into force of the revised Climate Change Act to ensure achievement of Finland’s carbon-neutrality objective by 2035
Revision of the legal framework for broadband communication networks to provide high-speed internet in more remote areas
600 new study places created in higher education institutions, targeted at professions facing labour shortages
Conclusion of a national agreement on a low-carbon circular economy to boost recycling
Entry into force of the amended Nature Conservation Act to preserve biodiversity and natural habitats
Implementation of the labour market reforms to raise the employment rate: introducing the Nordic employment service model, phasing out of additional days of unemployment security (the ‘unemployment tunnel’), passing amendments to the Aliens Act
Operationalisation of 22 welfare areas established as part of the health and social services reform, with a view to improving access to services and efficiency of the system

FURTHER PRIORITIES AHEAD
11
Beyond the challenges addressed by the
RRP, as outlined above, Finland faces
additional challenges not sufficiently
covered in the plan. Some measures were introduced recently (see Annex 4 on progress on CSRs), but more efforts are needed, most notably on the access to health and long-term care services and the shortage of health workers. Moreover, the social security system needs to be redesigned to address some of Finland’s key social and economic challenges. The government’s ambitious green targets and the Russian invasion of Ukraine also call for additional investment in several sectors. Addressing these challenges will also help to make further progress in achieving the Sustainable Development Goals related to good health and wellbeing, affordable and clean energy, climate action, and decent work and economic growth.
Health and long-term care sectors face structural challenges
Addressing the cost-effectiveness of and
equal access to social and healthcare services has been a long-standing policy
challenge. Progress is underway with the launch of the reform of health and social services. Its first stage should be implemented by January 2023 when 22 welfare areas (15) start operating. These will provide the basic structure for implementing the further stages of the reform. A more centralised management (transferred to the welfare areas from municipalities) is expected to improve access to healthcare and help curb cost increases in the long term by allowing the cost-effectiveness of both healthcare and
(15) 21 welfare areas and the City of Helsinki, responsible
for organising health, social and rescue services within its own area.
long-term care to be better monitored and managed. (16) Digitalisation of health services as well as the increase in higher education places related to sectors experiencing labour shortages are expected to reduce the scarcity of health workers in Finland in the medium term.
The proportion of people reporting unmet
needs for medical care is higher than the
EU average and that of most other Nordic countries. In 2020, 5.4% of the Finnish population reported unmet medical care needs due to financial reasons, geographical barriers or waiting times (see Annex 12). Long waiting times persist in both primary and specialised care, particularly for people who are not eligible for occupational health care, such as the unemployed and retired people. This situation results in the low score for self-reported unmet need for medical care in the Social Scoreboard accompanying the European Pillar of Social Rights. The health and social care reform and the RRP measures aim to address issues of access, integration and coordination between primary and specialist care, and between health and other public services provided at different levels of government. The Government has prepared draft legislation which aims to reduce the maximum waiting times for access to primary health care, applicable in public health care. The 7-day care guarantee would apply to both physical and mental health problems. The proposal is set to be submitted to the Parliament in spring 2022.
In the aftermath of the COVID-19
pandemic, the health sector continues to suffer from labour shortages. This issue has been addressed only indirectly in the RRP. Finland has fewer professionally active doctors than the EU average (3.2 compared with 3.8 per 1 000 population), but the highest number
(16) See also Annex 14.
FURTHER PRIORITIES AHEAD

12
of nurses in the EU (14.3 compared to 8.9 per 1 000) (17). The National Institute for Health and Welfare (THL) has estimated that health care centres would have to recruit between 1 600 and 2 600 doctors to achieve the 7-day care guarantee. Moreover, the uneven geographic distribution of healthcare resources heightens disparities in access to care. The density of doctors is much greater in the capital region of Helsinki and in other major cities, owing to the concentration of hospitals and specialised care units in urban areas, while relatively few doctors working in remote and sparsely populated regions. The long-term care sector also suffers from a shortage of health workers. The new requirement to gradually increase the staff-to-patient ratio in 24-hour elderly care units from 0.5 to 0.7 per patient (by 1 April 2023) (18) will further increase the staff needs in the sector.
Further measures are needed to increase the numbers of health workers and
improve their geographical distribution. More training places should be made available to increase the number of trained employees. Increasing the number of degree programme study places and reskilling/upskilling possibilities could help in this respect. Measures to improve the attractiveness of health and long-term care related professions would also be warranted, especially for nursing. The national programme on the sufficiency and availability of healthcare and social welfare personnel was launched in November 2021. The aim is to find sustainable solutions for meeting the need for labour in healthcare and social welfare in the short, medium and long term so that regional differences are taken into account.
The social security system needs to be redesigned
Finland has a developed social security
system that still needs to be streamlined
(17) The latest available data on health workers for Finland
are from 2014
(18) Legislative amendment adopted in July 2020.
and refocused. The social security system provides ample coverage and protects well against poverty. Social spending is the highest in the EU in relative terms. Before the COVID-19 pandemic, spending on social security in Finland accounted for 24% of GDP compared to 19% of GDP in the EU on average (2019 data). However, over the last 20-30 years, the welfare state has developed in a piecemeal fashion, through many small changes. These have resulted in a complex and bureaucratic system. For example, the system is characterised by significant variation in terms of definitions (e.g. concepts of income, family etc.) and procedures (e.g. delays for applications and disbursements). The information flow between various public authorities and services is not sufficient. The housing policy and the housing benefits system are complex and do not always reach their objectives efficiently.
The planned social security reform is key
to raising the employment rate. The complex social benefit system is largely responsible for inherent disincentives to work (19). Allowing for more flexibility in combining work income and social benefits will increase the incentives for beneficiaries, especially those with low earning prospects, to take up work. Promoting activation measures for the unemployed in order to make the system more enabling is another solution being considered. Tackling these challenges is key for Finland to contribute to reaching the 2030 EU headline targets on employment and poverty reduction. Other fundamental issues for the future model of the welfare state are also under discussion, such as basing the social security system on the principle of social insurance or guaranteed basic income.
The RRP recalls the commitment of the
authorities to pursue the social security
reform. A parliamentary committee has been tasked by March 2027 to prepare the reform that would revamp Finland’s welfare system. The committee includes representatives of all parties in Parliament, various external experts as well as representatives of the labour
(19) Finnish Ministry of Social Affairs and Health,
https://stm.fi/en/social-security-reform
13
market and business lobbies. It started its work in 2020. In January 2022, the committee published the results of its problem-mapping work, in the form of five reports on the problems, choices and basic principles of the Finnish social security system (20). In the next stage, the committee will focus on developing possible solutions to the problems identified. A study on alternative ways of organising social security has also been launched in preparation of the reform. The committee is expected to publish an interim report on its work in early 2023, by the end of the current parliamentary term. The policy proposals for the reform should be ready in time for discussions on the next government’s programme.
Ambitious green targets and reducing fossil energy dependence call for additional investment
While the RRP focuses on reducing greenhouse gas emissions in several key
sectors, more investments will be
required to match Finland’s ambitious green targets. This is the case for all emitting sectors, but is particularly true in the renewable energy, buildings and transport sectors, where the remaining investment needs to achieve overall carbon neutrality targets are very large.
The additional investments required
include existing and new sources of
renewable energy. Additional capacity is expected to be added in the coming years mainly in (offshore) wind power, but also in other renewable energy sources including solar and geothermal. While Finland’s share of renewables in the energy mix is already high, the planned increase in renewable energy to meet the 2035 carbon neutrality target is expected to require large investments in network infrastructure. At the same time, the phase-out of the use of coal by 2029 requires a shift in the management of the electricity
(20) https://stm.fi/en/-/reports-on-problems-choices-and-
basic-principles-of-finnish-social-security-system-completed
network and an investment in network transmission capacity. Additional investment needs in transport include improving the efficiency of the public transport system and electrification of the rail network. The Finnish authorities are planning a cross-border rail connection between Finland and Sweden at Tornio and have applied for funding from the Connecting Europe Facility for this project (21), which could improve supply chain security in Finland by creating additional overland supply routes. At the same time, the transport network has a large maintenance deficit (estimated at EUR 2.8 billion).
Delays in granting permits for capital
investment projects, including in
renewable energy, are still frequent and reducing them requires further efforts. According to the OECD (22), long permitting processing times can slow down, or undermine, investment projects in Finland. Recent estimates (23) show that at least EUR 3 billion worth of investments are pending due to administrative procedures linked to permits. Streamlining permit procedures for renewable energy installations by removing process-related barriers, especially with regard to administrative procedures, could speed up the deployment of investments. In the transport sector, long distances in domestic transport and cold weather conditions create specific obstacles to the rollout of electric vehicles. The use of zero-emission vehicles can reduce energy dependency, and thanks to higher-than-expected sales of electric vehicles in Finland in 2021 the share of zero-emissions vehicles in Finland has now caught up with the EU average. Moreover, additional reforms are required to achieve Finland’s objective of reducing emissions from transport by 50% by 2030 compared to 2005. As the following
(21) Finnish government website, 16 December 2021:
https://valtioneuvosto.fi/en/-/finland-applies-for-funding-from-the-eu-s-connecting-europe-facility-for-several-transport-projects
(22) OECD, 21 May 2021, “The Impact of Regulation in International Investment in Finland”, https://doi.org/10.1787/b1bf8bee-en
(23) Finnish Confederation of Industries, 29 November 2021: https://ek.fi/ajankohtaista/tiedotteet/yli-3-miljardin-euron-investoinnit-pysahdyksissa-viranomaisten-lupakasittelyssa-elinkeinoelama-peraa-reformia/

14
paragraph shows, decarbonising Finland’s fleet of vehicles is important also in the geopolitical context, as increased sustainable mobility efforts will reduce Finland’s reliance on fossil oil, which in turn will reduce its dependence on Russian fossil fuels.
Some sectors in Finland depend on
imports of energy resources from Russia,
but the country is already diversifying
away from Russian imports. According to 2020 data on the overall energy mix, oil (25.6%), gas (6.9%) and solid fossil fuels (9.4%) are still significant energy sources, with approximately half of all coal imports, two thirds of gas and 84% of crude oil imports coming from Russia in 2020 (24). Finland's dependence on Russia for these fuel sources is, however, expected to decrease over time. Finnish gas consumers are mainly power plants and industries such as steel, oil refinery and the chemical industry. In electricity generation, gas can in principle be replaced by other inputs, while industry is already shifting to alternative sources of gas, though in some sectors additional investment will be required for the decarbonisation and electrification of industry (25). Finland is developing a third liquefied natural gas (LNG) terminal, which is expected to be operational by October 2022. The Balticconnector bi-directional natural gas pipeline between Finland and Estonia was put in use in 2020, creating an alternative gas supply route for the Finnish market and connecting the country to the Baltic states and, since the opening of the Gas Interconnection Poland-Lithuania in May 2022, to the rest of the EU. LNG and pipeline gas import capacity is soon expected to cover the majority of Finnish gas imports. Finland's main users of crude oil have already taken action to replace most of Russian oil imports with
(24) Eurostat (2020), share of Russian imports over total
imports of natural gas, crude oil. Total imports include intra-EU trade. Crude oil does not include refined oil products.
(25) https://energia.fi/energiapolitiikka/ukrainan_sota/venajan_merkitys_suomen_energiahuollolle
imports from other sources (26). The planned construction of the Hanhikivi nuclear power plant by a firm partially owned by a Finnish subsidiary of the Russian state corporation Rosatom has now been put permanently on hold by the Finnish power company. Imports of wood chips from Russia can be an important heating source locally, in particular in Eastern Finland, which may require replacement with biofuels from other domestic and international sources. The Russian invasion of Ukraine is expected to speed up and expand investment in Finland for decarbonisation and ensure energy efficiency and security of supply. It should be noted that any new investments should be future proof, where possible, to avoid lock in effects in the path to climate neutrality.
(26) Including the Neste refinery in Porvoo:
https://www.neste.com/releases-and-news/oil-products/neste-has-mostly-replaced-russian-crude-oil-other-crudes

KEY FINDINGS
15
Finland’s recovery and resilience plan
includes measures to address a series of
its structural challenges through:
Contributing to the reduction of greenhouse gas emissions in the most relevant sectors through reforms and investments.
Supporting high-speed broadband connectivity, reforming the continuous learning framework and promoting digital skills.
Investing in R&I.
Addressing Finland’s shrinking workforce and tackling structural unemployment.
Supporting the health and social services reform.
Beyond the reforms and investments in
the RRP, Finland would benefit from:
Implementing the health and social services reform to improve equal access to services and increase the cost-effectiveness of the healthcare sector.
Addressing persisting staff shortages in the healthcare sector, in terms of numbers of health workers and their uneven geographical distribution.
Reforming the social security system to increase efficiency of social benefits, improve incentives to work and support sustainability of public finances in the long term, thereby mitigating the impacts of population ageing.
Pursuing ongoing structural reforms that focus on the green and digital transition, research and promoting innovation to provide effective ways to increase stagnating productivity.
Promoting substantial additional investments in renewable energy and sustainable transport to speed up the progress towards the 2035 target for the decarbonisation of society and improve the security of energy supply. The deployment of energy investments will also require speeding up the processing of environmental permits.
KEY FINDINGS


ANNEXES


19
Cross-cutting progress indicators 21
Annex 1: Sustainable Development Goals 21
Annex 2: Recovery and Resilience Plan – implementation 23
Annex 3: Other EU instruments for recovery and growth 24
Annex 4: Progress in the implementation of country-specific recommendations 26
Environmental sustainability 28
Annex 5: Green Deal 28
Annex 6: Employment and social impact of the green transition 32
Resource efficiency and productivity 34
Annex 7: Resource efficiency and productivity 34
Annex 8: Digital transition 36
Annex 9: Innovation 38
Annex 10: Industry and single market 40
Annex 11: Public administration 43
Fairness 45
Annex 12: Employment, skills and social policy challenges in light of the European Pillar of Social Rights 45
Annex 13: Education and skills 47
Annex 14: Health and health systems 49
Annex 15: Economic and social performance at regional level 51
Macroeconomic Stability 54
Annex 16: Key financial sector developments 54
Annex 17: Taxation 55
Annex 18: Key economic and financial indicators 57
Annex 19: Debt sustainability analysis 58
LIST OF TABLES
Table A2.1: Key elements of the Finnish RRP 23
Table A4.1: Summary table on 2019, 2020 and 2021 CSRs 27
Table A5.1: Indicators underpinning the progress on EU Green Deal from macroeconomic perspective 31
Table A7.1: Selected resource efficiency indicators 35
Table A8.1: Key Digital Economy and Society Index Indicators 37
Table A9.1: Key research, development and innovation indicators 39
Table A10.1: Key single market and industry indicators 41
LIST OF ANNEXES

20
Table A11.1: Public administration indicators for Finland 44
Table A12.1: Social Scoreboard for Finland 45
Table A13.1: EU-level targets and other contextual indicators under the European Education Area strategic framework 48
Table A14.1: Key health indicators 50
Table A15.1: Finland, selected indicators at regional level 51
Table A16.1: Financial soundness indicators 54
Table A17.1: Indicators on taxation 55
Table A18.1: Key economic and financial indicators 57
Table A19.1: Heat map of fiscal sustainability risks for Finland 58
Table A19.2: Heat map of fiscal sustainability risks for Finland 59
LIST OF GRAPHS
Graph A1.1: Progress towards SDGs in Finland in the last five years 22
Graph A2.1: Share of RRF funds contributing to each policy pillar 23
Graph A3.1: ESIF 2014-2020 total budget by fund(1),(2) 24
Graph A3.2: Cohesion policy contribution to the SDGs (EUR billion) 25
Graph A4.1: Finland’s progress on the 2019-2020 CSRs (2022 European Semester cycle) 26
Graph A5.1: Fiscal aspects of the green transition 28
Graph A5.2: Energy Share in energy mix (solids, oil, gas, nuclear, renewables(1)) 29
Graph A5.3: Biodiversity Terrestrial protected areas and organic farming 29
Graph A5.4: Mobility Share of zero emission vehicles (% of new registrations) 30
Graph A6.1: Fair green transition challenges 32
Graph A6.2: Energy poverty by income decile 32
Graph A7.1: Economic importance and expansion of the circular economy 34
Graph A11.1: Performance on evidence-based policy making indicators 43
Graph A14.1: Life expectancy at birth, years 49
Graph A14.2: Projected increase in public expenditure on health care over 2019-2070 (reference scenario) 49
Graph A15.1: GDP per capita (2010) and GDP growth (2010-2019) in Finland 51
Graph A15.2: Labour productivity, EU-27, Finland´s NUTS 2 regions, 2000-2019 51
Graph A15.3: Territories most affected by climate transition in Finland 52
Graph A17.1: Indicators on tax wedge 56

ANNEX 1: SUSTAINABLE DEVELOPMENT GOALS
21
This Annex assesses Finland’s progress on
the Sustainable Development Goals (SDGs)
along the four dimensions of competitive
sustainability. The 17 SDGs and their related indicators provide a policy framework under the UN’s 2030 Agenda for Sustainable Development. The aim is to end all forms of poverty, fight inequalities and tackle climate change, while ensuring that no one is left behind. The EU and its Member States are committed to this historic global framework agreement and to playing an active role in maximising progress towards the SDGs. The graph below is based on the EU SDG indicator set developed to monitor progress on SDGs in an EU context.
While Finland performs very well on several SDG indicators related to environmental
sustainability (SDG 6, 7, 9, 11, 12, 13), it
needs to pay attention to progress on other
indicators (SDG 2, 15). Finland performs particularly well on SDG 13 ‘climate action’, including the share of renewable energy in gross final energy consumption: Finland reached a share of 43.8 % in 2020, which is very high in comparison to the European average (22.09 % in 2020) and the second-highest in the EU after Sweden. Many measures in Finland’s RRP are expected to further contribute to greenhouse gas emission savings, including investments in renewable energy, decarbonisation of industry and research and development for low-carbon technologies. On SDG 2 'zero hunger', Finland's obesity rate is above the EU average (20.9% in Finland vs 16.5% in the EU in 2019) and has been increasing (from 18.3% in 2014).
Finland performs very well on SDG indicators
assessing the fairness of society and
economy (SDG 1, 3, 4, 5, 8, 10). (27) On ‘gender equality’ only two EU Member States (France and Sweden) score higher than Finland, but Finland is improving at a faster pace on this indicator. On ‘quality education’, Finland’s tertiary education attainment among the population aged 25-34 is well above the EU average at 43.8 % in 2020, and has increased strongly in recent years, up from 40.3 % in 2018. The RRP includes measures to support the ongoing reform of health and long-
(27) See ‘Annex 12 – Employment, skills and social policy
challenges in light of the European Pillar of Social Rights’ for further information.
term care, aiming to improve the health and wellbeing status.
Finland performs very well on SDG indicators related to productivity (SDG 4, 8, 9). Compared to the EU average (54 %), Finland performs very well in digital skills with a 79 % share of adults with at least basic digital skills in 2021. Finland also performs well on SDG 8 ‘Decent work and economic growth’ and SDG 9 ‘Industry, innovation, and infrastructure’. While Finland’s spending on R&D at 2.94 % in 2020 is well above the EU average of 2.32 % and has been increasing each year since 2016 (2.72 %), it is still below the 2009 peak of 3.73 %. The RRP includes measures to further improve the situation by boosting spending on research, development and innovation through funding packages for the promotion of the green and digital transition.
Finland performs very well overall on SDG
indicators related to macroeconomic stability
(8, 16). Finland already performs very well on
SDG 16 ‘peace, justice and strong institutions’ and the RRP includes a reform to improve the supervision and enforcement of the prevention of money laundering, which will further improve the stability of and trust in public institutions in Finland. On SDG 8 'Decent work and economic growth', Finland has increased its investment share of GDP by more than the EU average between 2015 and 2020 while it continues to perform above the EU average on all metrics related to employment.
CROSS-CUTTING PROGRESS INDICATORS
ANNEX 1: SUSTAINABLE DEVELOPMENT GOALS

22
Graph A1.1: Progress towards SDGs in Finland in the last five years
For detailed datasets on the various SDGs see the annual ESTAT report ‘Sustainable development in the European Union’, https://ec.europa.eu/eurostat/web/products-statistical-books/-/KS-03-21-096; Extensive country specific data on the short-term progress of Member States can be found here: Key findings - Sustainable development indicators - Eurostat (europa.eu). Source: Eurostat, latest update of 28 April 2022. Data mainly refer to 2015-2020 and 2016-2021.

ANNEX 2: RECOVERY AND RESILIENCE PLAN – IMPLEMENTATION
23
The Recovery and Resilience Facility (RRF) is the centrepiece of the EU’s efforts to support its recovery from the COVID-19 pandemic, fast forward the twin transition and strengthen resilience against future shocks. Finland submitted its recovery and resilience plan (RRP) on 27 May 2021. The Commission’s positive assessment on 4 October and Council’s approval on 29 October paved the way for disbursing EUR 2.1 billion in grants under the Recovery and Resilience Facility over the period 2021-2026. The financing agreement was signed on 13 January 2022. The key elements of the Finnish RRP are set out in the Table A2.1. The share of funds contributing to each of the RRF’s six policy pillars is outlined in the
graph below.
The progress made by Finland in the
implementation of its plan is published in the
Recovery and Resilience Scoreboard. The Scoreboard also gives an overview on the progress of the implementation of the RRF as a whole, in a transparent manner.
ANNEX 2: RECOVERY AND RESILIENCE PLAN – IMPLEMENTATION
Graph A2.1: Share of RRF funds contributing to each policy pillar
(1) Each measure contributes towards two policy areas of the six pillars, therefore the total contribution to all pillars displayed on this chart amounts to 200% of the estimated cost of the 22 RRPs approved in 2021. The bottom part represents the amount of the primary pillar, the top part the amount of the secondary pillar. Source: RRF Scoreboard: https://ec.europa.eu/economy_finance/recovery-and-resilience-scoreboard/country_overview.html
Table A2.1: Key elements of the Finnish RRP
(1) See Pfeiffer P., Varga J. and in ’t Veld J. (2021), “Quantifying Spillovers of NGEU investment”, European Economy Discussion Papers, No. 144 and Afman et al. (2021), “An overview of the economics of the Recovery and Resilience Facility”, Quarterly Report on the Euro Area (QREA), Vol. 20, No. 3 pp. 7-16. Source: European Commission
0%
10%
20%
30%
40%
50%
60%
Green transition Digitaltransformation
Smart,sustainable andinclusive growth
Social andterritorialcohesion
Health, andeconomic,social andinstitutionalresilience
Policies for thenext generation
Total allocation EUR 2.1 billion in grants (1% of 2019 GDP)
Investments and Reforms 39 investments and 18 reforms
Total number of Milestones and Targets 140
Estimated macroeconomic impact (1) Raise GDP by 0.4%-0.6% by 2026 (0.4% in spillover effects)
Pre-financing disbursed EUR 271 million (January 2022)
First instalment Finland did not yet submit a first payment request

ANNEX 3: OTHER EU INSTRUMENTS FOR RECOVERY AND GROWTH
24
The EU’s budget of more than EUR 1.2 trillion
for 2021-2027 is the investment lever to
help implement EU priorities. Underpinned by an additional amount of about EUR 800 billion through NextGenerationEU and its largest instrument, the Recovery and Resilience Facility, it represents significant firepower to support the recovery and sustainable growth.
Graph A3.1: ESIF 2014-2020 total budget by
fund(1),(2)
(1) bln EUR in current prices, % of total (2) The data for the EAFRD and REACT-EU refer to the period 2014-2022 Source: European Commission, Cohesion Open Data
In 2021-2027, EU Cohesion policy funds (28)
will support long-term development
objectives in Finland by investing EUR 2.12 billion (29) including EUR 465.7 million from the Just Transition Fund directed to alleviate the socio-economic impacts of the green transition in the most vulnerable regions. The 2021-2027 Cohesion policy funds Partnership agreements and programmes are designed to take into account the 2019-2020 CSRs and investment guidance provided within the context of the European Semester, ensuring synergies and complementarities with other EU funding. In addition, Finland will benefit from EUR 4.4 billion support for the 2023-27 period from the Common Agricultural Policy, which supports social, environmental, and economic sustainability and innovation in agriculture and rural areas, contributing to the European Green Deal, and ensuring long-term food security.
(28) European Regional Development Fund (ERDF), European
Social Fund+ (ESF+), Cohesion Fund (CF), Just Transition Fund (JTF), Interreg.
(29) Current prices, source: Cohesion Open Data
In 2014-2020, the European Structural and
Investment Funds (ESIF) for Finland are set
to finance investment totalling EUR 4.90
billion (30) from the EU budget. The overall investment including national financing amounts to EUR 10.76 billion (Graph 3.1), representing around 0.68% of GDP for 2014-2020 and 14.94% of public investment (31). By 31 December 2021, 105% of the total was allocated to specific projects and 68% was reported as spent, leaving EUR 3.44 billion to be spent by the end of 2023 (32). Among the eleven objectives the most relevant ones for cohesion policy funding in Finland are research and innovation, competitiveness of SMEs, sustainable and quality employment, and low carbon economy (in total EUR 2 billion). By end 2020, cohesion policy investments have already supported 17 748 companies involved in projects led by R&D institutions, 2 468 SMEs started exporting or expanded to new export markets, over 39 000 young people under 30s who were unemployed or outside of working life involved in ESF projects, and 1 732 new low-carbon solutions developed in communities.
Cohesion policy funds are already
substantially contributing to the Sustainable
Development Goals (SDGs) objectives. In Finland, Cohesion policy funds are supporting 8 of the 17 SDGs with up to 95% of the expenditure contributing to the attainment of the goals.
The REACT-EU under NextGenerationEU provided EUR 234.9 million of additional
funding to 2014-2020 cohesion policy
allocations for Finland to ensure a balanced recovery, foster convergence and provide vital support to regions following the impact of the coronavirus outbreak. REACT-EU provided support in Finland to strengthen SMEs in view of digitalisation and green economy, develop research and innovation in view of digitalisation (30) ESIF includes cohesion policy funds (ERDF, ESF+, CF, Interreg)
and European Agricultural Fund for Rural Development (EAFRD) and European Maritime and Fisheries Fund (EMFF). According to the ‘N+3 rule’, the funds committed for the years 2014-2020 must be spent by 2023 at latest (by 2025 for EAFRD). Data source: Cohesion Open data cut-off date 31.12.2021 for ERDF, ESF+, CF, Interreg; cut-off date 31.12.2020 for EAFRD and EMFF.”
(31) Public investment is gross fixed capital formation plus capital transfers, general government.
(32) Including REACT-EU. ESIF data on https://cohesiondata.ec.europa.eu/countries/FI
7.7672%
0.152%
1.7516%
1.1110%
EAFRD EMFF ERDF ESF
ANNEX 3: OTHER EU INSTRUMENTS FOR RECOVERY AND GROWTH

25
and carbon neutrality, enhance digital skills, and promote the rapid ability of enterprises and entrepreneurs to change. Over 100% of the total allocation is already covered by selected operations.
The Commission is engaged in providing tailor-made expertise via the Technical
Support Instrument to support Finland in designing and implementing growth-enhancing reforms, including for implementing its RRP. Since 2019, Finland has received assistance through 19 technical support projects. Projects delivered in 2021 aimed, for example, at assessing regulatory barriers to investment, attracting high quality foreign investment and analysing the impact of digital economy on taxation and state revenues. The Commission also assisted Finland in implementing specific reforms and investments in the RRP, for instance for the design of a positive credit register. In 2022, new projects will start to assist, amongst others, with the application of the “Do No Significant Harm” principle to different EU and national funds.
Finland benefits also from other EU
programmes. These include the Connecting Europe Facility, which allocated EU funding of EUR 259.2 million to specific projects on strategic transport networks, and Horizon 2020, which allocated EU funding of EUR 1 520 million.
Graph A3.2: Cohesion policy contribution to the SDGs (EUR billion)
Source: European Commission, DG REGIO
0.01
0.01
0.07
0.18
0.20
0.35
0.54
1.15
0.0 0.4 0.8 1.2
SDG 3 Good health and well being
SDG 13 Climate action
SDG 12 Responsible consumption and production
SDG 7 Affordable and clean energy
SDG 1 No poverty
SDG 4 Quality education
SDG 9 Industry, innovation, infrastructure
SDG 8 Decent work and economic growth
ANNEX 4: PROGRESS IN THE IMPLEMENTATION OF COUNTRY-SPECIFIC RECOMMENDATIONS
26
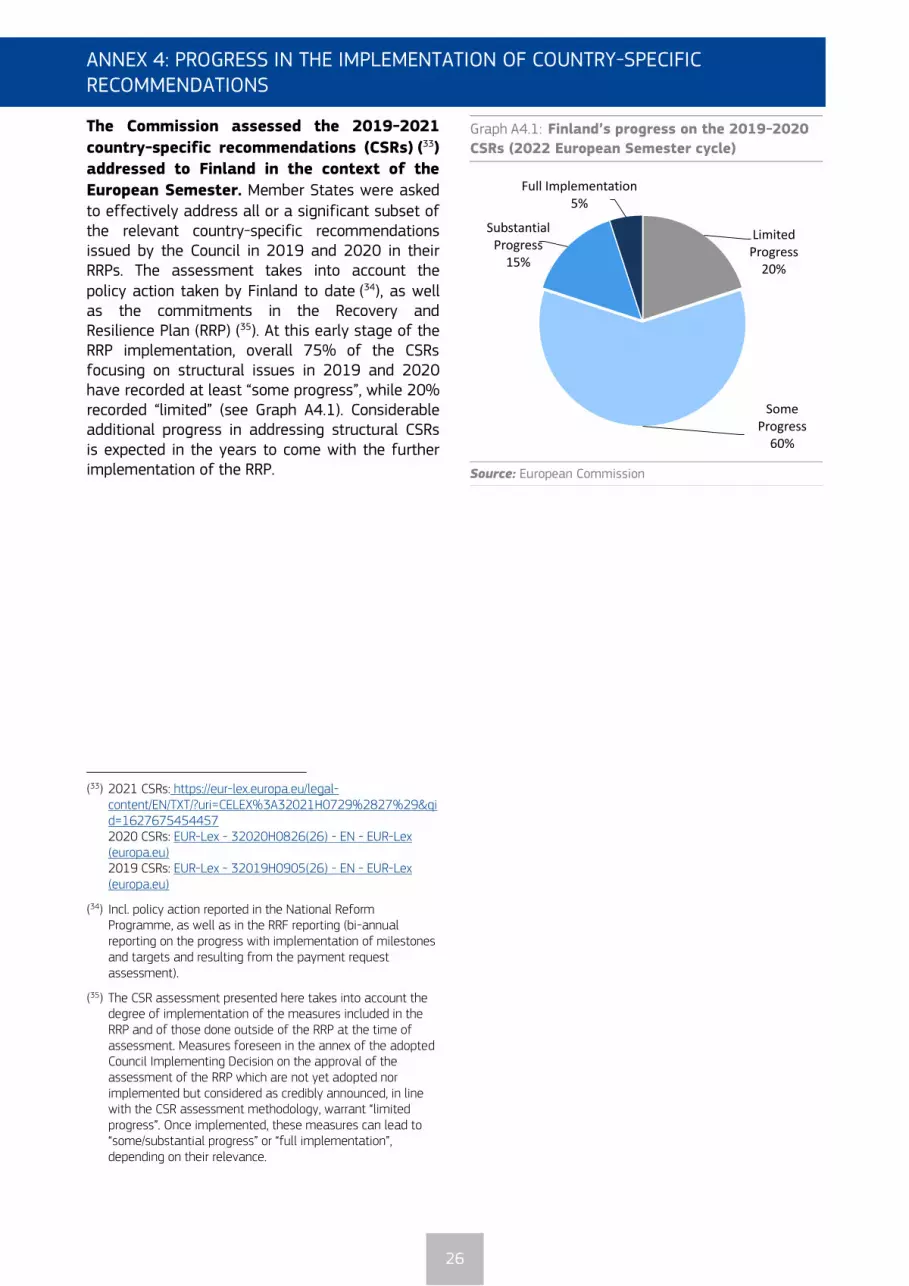
The Commission assessed the 2019-2021
country-specific recommendations (CSRs) (33)
addressed to Finland in the context of the
European Semester. Member States were asked to effectively address all or a significant subset of the relevant country-specific recommendations issued by the Council in 2019 and 2020 in their RRPs. The assessment takes into account the policy action taken by Finland to date (34), as well as the commitments in the Recovery and Resilience Plan (RRP) (35). At this early stage of the RRP implementation, overall 75% of the CSRs focusing on structural issues in 2019 and 2020 have recorded at least “some progress”, while 20% recorded “limited” (see Graph A4.1). Considerable additional progress in addressing structural CSRs is expected in the years to come with the further implementation of the RRP.
(33) 2021 CSRs: https://eur-lex.europa.eu/legal-
content/EN/TXT/?uri=CELEX%3A32021H0729%2827%29&qid=1627675454457 2020 CSRs: EUR-Lex - 32020H0826(26) - EN - EUR-Lex (europa.eu) 2019 CSRs: EUR-Lex - 32019H0905(26) - EN - EUR-Lex (europa.eu)
(34) Incl. policy action reported in the National Reform Programme, as well as in the RRF reporting (bi-annual reporting on the progress with implementation of milestones and targets and resulting from the payment request assessment).
(35) The CSR assessment presented here takes into account the degree of implementation of the measures included in the RRP and of those done outside of the RRP at the time of assessment. Measures foreseen in the annex of the adopted Council Implementing Decision on the approval of the assessment of the RRP which are not yet adopted nor implemented but considered as credibly announced, in line with the CSR assessment methodology, warrant “limited progress”. Once implemented, these measures can lead to “some/substantial progress” or “full implementation”, depending on their relevance.
Graph A4.1: Finland’s progress on the 2019-2020
CSRs (2022 European Semester cycle)
Source: European Commission
Limited Progress
20%
Some Progress
60%
Substantial Progress
15%
Full Implementation5%
ANNEX 4: PROGRESS IN THE IMPLEMENTATION OF COUNTRY-SPECIFIC RECOMMENDATIONS

27
Table A4.1: Summary table on 2019, 2020 and 2021 CSRs
* See footnote 35. Source: European Commission
Finland Assessment in May 2022* RRP coverage of CSRs until 2026
2019 CSR1 Some Progress
Ensure that the nominal growth rate of net primary government
expenditure does not exceed 1.9 % in 2020, corresponding to an
annual structural adjustment of 0.5 % of GDP.
Not relevant anymore Not applicable
Improve the cost-effectiveness of and equal access to social and
healthcare services.Some Progress
Relevant RRP measures planned as of 2021,
2023, 2024, and 2025
2019 CSR 2 Some Progress
Improve incentives to work Some ProgressRelevant RRP measures planned as of 2022,
2023, 2024, and 2025
and enhance skills Substantial ProgressRelevant RRP measures planned as of 2021,
2022, 2023, 2024, and 2025
and enhance active inclusion, notably through well-integrated
services for the unemployed and the inactive.Some Progress
Relevant RRP measures planned as of 2022,
2023, 2024, and 2025
2019 CSR 3 Some Progress
Focus investment-related economic policy on research and
innovation, taking into account regional disparities,Substantial Progress
Relevant RRP measures planned as of 2021,
2022, 2023, 2025 and 2026
focus investment-related economic policy on low carbon and energy
transition, taking into account regional disparities,Some Progress
Relevant RRP measures planned as of 2021,
2022, 2023, 2024, 2025 and 2026
and focus investment-related economic policy on sustainable
transport, taking into account regional disparitiesLimited Progress
Relevant RRP measure planned as of 2022,
2024, and 2026
2019 CSR4 Some Progress
Strengthen the monitoring of household debt Some ProgressRelevant RRP measure planned as of 2023,
2025, and 2026
and establish the credit registry system Limited ProgressRelevant RRP measure planned as of 2023,
2025, and 2026
2020 CSR1 Some Progress
Take all necessary measures, in line with the general escape clause
of the Stability and Growth Pact, to effectively address the COVID-
19 pandemic, sustain the economy and support the ensuing
recovery. When economic conditions allow, pursue fiscal policies
aimed at achieving prudent medium-term fiscal positions and
ensuring debt sustainability, while enhancing investment.
Not relevant anymore Not applicable
Address shortages of health workers to strengthen the resilience of
the health system Some Progress
Relevant RRP measure planned as of 2021,
2022 and 2023
and improve access to social and health services. Some ProgressRelevant RRP measure planned as of 2021,
2023, 2024 and 2025
2020 CSR2 Some Progress
Strengthen measures to support employment and Some ProgressRelevant RRP measure planned as of 2021,
2022, 2023, 2024 and 2025
bolster active labour market policies. Some ProgressRelevant RRP measure planned as of 2022,
2023, 2024 and 2025
2020 CSR 3 Some Progress
Take measures to provide liquidity to the real economy, in particular
to small and medium-sized enterprises. Substantial Progress
Relevant RRP measure planned as of 2021,
2022, 2023, 2024, 2025 and 2026
Front-load mature public investment projects and Full Implementation
promote private investment to foster the economic recovery. Some Progress
Focus investment on the green and digital transition, in particular on
clean and efficient production and use of energy,Some Progress
Relevant RRP measure planned as of 2021,
2022, 2023, 2024, 2025 and 2026
sustainable and efficient infrastructure Limited ProgressRelevant RRP measure planned as of 2021,
2022, 2023, 2024, 2025 and 2026
as well as research and innovation. Some ProgressRelevant RRP measure planned as of 2021,
2022, 2023, 2025 and 2026
2020 CSR 4 Limited Progress
Ensure effective supervision and enforcement of the anti-money
laundering framework.Limited Progress
Relevant RRP measure planned as of 2025
and 2026
2021 CSR1 Substantial Progress
In 2022, maintain a supportive fiscal stance, including the impulse
provided by the Recovery and Resilience Facility, and preserve
nationally financed investment.
Full Implementation Not applicable
When economic conditions allow, pursue a fiscal policy aimed at
achieving prudent medium-term fiscal positions and ensuring fiscal
sustainability in the medium term.
Substantial Progress Not applicable
At the same time, enhance investment to boost growth potential.
Pay particular attention to the composition of public finances, on
both the revenue and expenditure sides of the budget, and to the
quality of budgetary measures in order to ensure a sustainable and
inclusive recovery. Prioritise sustainable and growth-enhancing
investment, in particular investment supporting the green and digital
transition.
Substantial Progress Not applicable
Give priority to fiscal structural reforms that will help provide
financing for public policy priorities and contribute to the long-term
sustainability of public finances, including, where relevant, by
strengthening the coverage, adequacy and sustainability of health
and social protection systems for all.
Some Progress Not applicable

ENVIRONMENTAL SUSTAINABILITY
ANNEX 5: GREEN DEAL
28
The European Green Deal intends to transform the EU into a fair and prosperous society, with a modern, resource-efficient and competitive economy where there are no net emissions of greenhouse gases in 2050 and where economic growth is decoupled from resource use. This annex offers a snapshot of the most significant and economically relevant developments in Finland in the respective building blocks of the European Green Deal. It is complemented by Annex 6 on the employment and social impact of the green transition and Annex 7 for circular economy aspects of the Green Deal.
Finland will have to sustain its ongoing
efforts to reduce greenhouse gas emissions
in line with its EU and domestic targets. Between 1990 and 2019, greenhouse gas emissions (excluding land use) in Finland decreased by 23%. This reduction is comparable to the EU average. Finland’s greenhouse gas emission intensity is below the European Union average, but emissions per capita remain well above the EU average. Finland has set a target of reaching carbon neutrality by 2035 including the objective to become the first fossil free welfare society. The country’s greenhouse gas emissions in 2020 in sectors not covered by the EU emissions trading system (ETS) just exceeded the 2020 target of reducing emissions by 16% compared to 2005. In its National Energy and Climate Plan, Finland includes additional measures to achieve reductions similar to its current ESR target for 2030 of 39%. Additional investments and reforms will be needed to reach the proposed new ESR target of –a reduction of 50% for Finland under the Fit for 55 package. Under current land management practices, Finland is projected to increase net removals of carbon dioxide by 2030. In its Recovery and Resilience Plan (RRP), Finland allocates 50% of the financial allocation to climate objectives and the plan includes crucial reforms and investments to further the transition to a more sustainable, low-carbon and climate-resilient economy (36).
(36) The share of financial allocation contributing to climate
objectives has been calculated using Annex VI of the RRF Regulation.
Graph A5.1: Fiscal aspects of the green transition
Source: Eurostat
While Finland performs well in collecting
environmental taxes, both government
spending in environmental protection as well
as decreasing fossil fuel subsidies could
present challenges. Finland’s tax revenues, both as a share of total tax revenues and as a share of GDP are above EU average, with energy taxes largely driving environmental taxation. A considerable extent is attributed to transport and a smaller one to pollution taxes. However, the Finnish government spends a significantly lower share of its public spending on environmental protection than the EU average. At the same time, fossil fuel subsidies have been showing a considerable increasing trend. Public budget risks as a consequence of uninsured climate perils are considered low. For more indicators on taxation, see Annex 17.
Finland’s energy mix already contains a high
share of renewables, making Finland one of
the EU frontrunners in renewable energy. In 2020, the share of final consumption of energy from renewables and biofuels reached 39%. Solid biofuels (27%) and oil (26%) have the second and third highest share. Finland is committing to phase out coal in power generation by 2029 and provides support for a voluntary phase out by 2025. In its National Energy and Climate Plan (NECP), Finland is proposing to further increase its share of renewable energy target to 50% by 2030, and expand the use of nuclear energy, as well as decreasing solids and oil shares.
0.0
1.0
2.0
3.0
4.0
5.0
6.0
7.0
Environmental taxes (% ofGDP)
Environmental taxes (% oftotal taxation)
Government expenditure onenvironmental protection (%
of total expenditure)
FI (2020) EU27 (2020)
ENVIRONMENTAL SUSTAINABILITY
ANNEX 5: GREEN DEAL

29
Graph A5.2: Energy
Share in energy mix (solids, oil, gas, nuclear,
renewables(1))
(1) The share of renewables includes waste Source: Eurostat. The energy mix is based on gross inland
consumption, and excludes heat and electricity. The share of renewables includes biofuels and non-renewable waste.
In terms of biodiversity and ecosystem
health, Finland has a comprehensive
biodiversity strategy for 2014-2020, and its
action plan for 2013-2020 covers many
issues relevant to the implementation of the
Nature Directives. The terrestrial part of the Natura 2000 network covers 14.45 % of the Finnish national territory (EU average 18.17 %), with the SPAs covering 7.3 % (EU average 12.4 %) and the SCIs covering 14.4 % (EU average 13.9 %). Thanks to an effective use of EU funding, measures are being taken to restore and manage Natura 2000 sites. Some progress has also been made in better applying measures to protect species and habitats through agricultural management. However, biodiversity loss continues and it is currently unclear whether these measures are sufficient to offset the agricultural intensification and resulting eutrophication occurring in the wider countryside. The conservation status of many grassland habitats and many of their associated species is still unfavourable.
Graph A5.3: Biodiversity
Terrestrial protected areas and organic farming
Source: EEA (terrestrial protected areas) and Eurostat
(organic farming). For terrestrial protected areas data for 2018, and data for the EU average (2016, 2017) is lacking.
In Finland, forestry is the most-reported
pressure on Natura 2000 sites, affecting
37% of sites. Finland has about 20 million hectares of forests, three-quarters of which consists of privately owned and economically used forests. Of the twelve forest habitats reported by Finland, ten have an unfavourable status, six have an unfavourable-bad status and are declining, and no habitat has improved since the last reporting round.
In terms of air pollution, Finland is one of the
few Member States without an infringement
procedure for exceeding EU limit values of
one or more air pollutants. The emission of numerous air pollutants has decreased significantly in Finland since 2014-2016, continuing the previous downward trend. NOx emissions in particular have declined by over 10 % since that period. Finland is one of the main producers and is the main consumer of peat in Europe. Phasing out peat and restoration of drained peatlands and wetlands could contribute notably to Finland’s goal to achieve carbon neutrality by 2035.
0
10
20
30
40
50
60
70
80
90
100
2005 2010 2015 2018 2019 2020
Solid fossil fuels, peat and oil shale Oil Gas Nuclear Renewables
0
5
10
15
20
25
30
2016 2017 2019 2020
Terrestrial protected areas (% total area)
Area under organic farming (% total utilised agricultural area)
EU27 (terrestrial)
EU27 (organic)

30
Graph A5.4: Mobility
Share of zero emission vehicles (% of new
registrations)
Source: European Alternative Fuels Observatory. Zero
emission vehicles (passenger cars) include battery and fuel cell electric vehicles (BEV, FCEV).
In terms of mobility, sales of zero-emission
vehicles are increasing only since recent years. Finland’s share of zero-emission vehicles in new passenger car registrations has surpassed the EU average for the first time in 2021 and their share in the national fleet of vehicles has rapidly caught up with the EU average over recent years.
0.0
2.0
4.0
6.0
8.0
10.0
12.0
2016 2017 2018 2019 2020 2021
% o
f ne
w r
egis
trat
ions
FI EU27

31
Table A5.1: Indicators underpinning the progress on EU Green Deal from macroeconomic perspective
(1) The 2030 non-ETS GHG target is based on the Effort Sharing Regulation. The FF55 targets are based on the COM proposal to increase EU's climate ambition by 2030. Renewables and Energy Efficiency targets and national contributions under the Governance Regulation (Regulation (EU) 2018/1999). (2) Distance to target is the gap between Member States’ 2030 target under the Effort Sharing Regulation and projected emissions, with existing measures (WEM) and with additional measures (WAM) respectively, as a percentage of 2005 base year emissions. (3) Percentage of total revenues from taxes and social contributions (excluding imputed social contributions). Revenues from the ETS are included in environmental tax revenues (in 2017 they amounted to 1.5% of total environmental tax revenues at the EU level). (4) Covers expenditure on gross fixed capital formation to be used for the production of environmental protection services (i.e. abatement and prevention of pollution) covering all sectors, i.e. government, industry and specialised providers. (5) The climate protection gap indicator is part of the European adaptation strategy (February 2021), and is defined as the share of non-insured economic losses caused by climate-related disasters. (6) Sulphur oxides (SO2 equivalent), Ammonia, Particulates < 10µm, Nitrogen oxides in total economy (divided by GDP). (7) Transportation and storage (NACE Section H). (8) Zero emission vehicles include battery electric vehicles (BEV) and fuel cell electric vehicles (FCEV). (9) European Commission Report (2019) 'Benchmarking smart metering deployment in the EU-28'. (10) European Commission (2021). Each year the DESI is re-calculated for all countries for previous years to reflect any possible change in the choice of indicators and corrections to the underlying data. Country scores and rankings may thus differ compared with previous publications. Source: Eurostat, JRC, European Commission, EEA, EAFO
Target Target
2005 2019 2020 2030 WEM WAM 2030 WEM WAM
Non-ETS GHG emission reduction target (1) MTCO2 eq; %; pp (2) 34.4 -13% -16% -39% -9 -6 -50% -20 -17
2005 2016 2017 2018 2019 2020
Share of energy from renewable sources in gross final
consumption of energy (1) % 29% 39% 41% 41% 43% 44% 51%
Energy efficiency: primary energy consumption (1) Mtoe 33.6 32.3 32.2 32.8 32.1 29.9 34.8
Energy efficiency: final energy consumption (1) Mtoe 25.2 25.2 25.3 25.8 25.4 23.3 24.9
2015 2016 2017 2018 2019 2020 2018 2019 2020
Environmental taxes (% of GDP) % of GDP 2.9 3.1 3.0 2.9 2.8 2.8 2.4 2.4 2.2
Environmental taxes (% of total taxation) % of taxation (3) 6.7 7.1 6.9 6.9 6.6 6.5 6.0 5.9 5.6
Government expenditure on environmental protection % of total exp. 0.42 0.41 0.37 0.37 0.36 0.40 1.66 1.70 1.61
Investment in environmental protection % of GDP (4) 0.31 0.33 0.28 0.29 - - 0.42 0.38 0.41
Fossil fuel subsidies EUR2020bn 0.90 0.92 0.95 0.98 1.15 - 56.87 55.70 -
Climate protection gap (5) score 1-4
Net GHG emissions 1990 = 100 78 82 79 81 77 68 79 76 69
GHG emissions intensity of the economy kg/EUR'10 0.31 0.32 0.30 0.30 0.28 0.25 0.32 0.31 0.30
Energy intensity of the economy kgoe/EUR'10 0.17 0.17 0.17 0.17 0.16 0.16 0.12 0.11 0.11
Final energy consumption (FEC) 2015=100 100.0 104.0 104.3 106.4 104.8 96.4 103.5 102.9 94.6
FEC in residential building sector 2015=100 100.0 107.9 116.4 114.9 113.7 106.8 101.9 101.3 101.3
FEC in services building sector 2015=100 100.0 105.6 108.1 112.5 110.2 102.7 102.4 100.1 94.4
Smog-precursor emission intensity (to GDP) (4)
tonne/EUR'10 (6) 1.05 1.04 0.96 0.90 0.89 - 0.99 0.93 -
Years of life lost caused due to air pollution by PM2.5 per 100.000 inh. 292 282 269 370 288 - 863 762 -
Years of life lost due to air pollution by NO2 per 100.000 inh. 9 < 1 < 1 < 1 < 1 - 120 99 -
Nitrate in ground water mg NO3/litre - - - - - - 21.7 20.7 -
Terrestrial protected areas % of total - 9.9 15.0 - 13.2 13.2 - 25.7 25.7
Marine protected areas % of total - 10.0 - - 11.0 - - 10.7 -
Organic farming% of total utilised
agricultural area9.9 10.5 11.4 13.1 13.5 13.9 8.0 8.5 9.1
00-06 06-12 12-18
Net land take per 10,000 km2 13.0 11.0 5.0
2015 2016 2017 2018 2019 2020 2018 2019 2020
GHG emissions intensity of transport (to GVA) (7) kg/EUR'10 1.16 1.28 1.21 1.20 1.21 1.19 0.89 0.87 0.83
Share of zero emission vehicles (8) % in new registrations 0.2 0.2 0.4 0.6 1.7 4.4 1.0 1.9 5.4
2 4 8 17 14 15 8 8 12
Share of electrified railways % 55.1 55.2 55.4 56.2 56.2 - 55.6 56.0 -
19.9 18.2 18.1 18.4 18.3 - 28.9 28.8 -
Year FI EU
Share of smart meters in total metering points (9)
- electricity% of total 2018 99.8 35.8
Share of smart meters in total metering points (9)
- gas% of total 2018 0.0 13.1
ICT used for environmental sustainability (10) % 2021 76.7 65.9
Dig
ital
Bio
dive
rsit
y
2000-2006 2006-2012 2012-2018
Mob
ility
Number of plug-in electric vehicles per charging point
Congestion (average number of hours spent in road congestion per year by a
representative commuting driver)
3.3 3.3 0.7
Fisc
al a
nd f
inan
cial
indi
cato
rs
0.7 out of 4 (slight decrease from historical level of 1). This is a low risk category (4 being a high risk).
Clim
ate
Ener
gyPo
llut
ion
Prog
ress
to
poli
cy t
arge
ts
National contribution to 2030
EU target
FINLAND EU
'Fit for 55'
Distance Distance
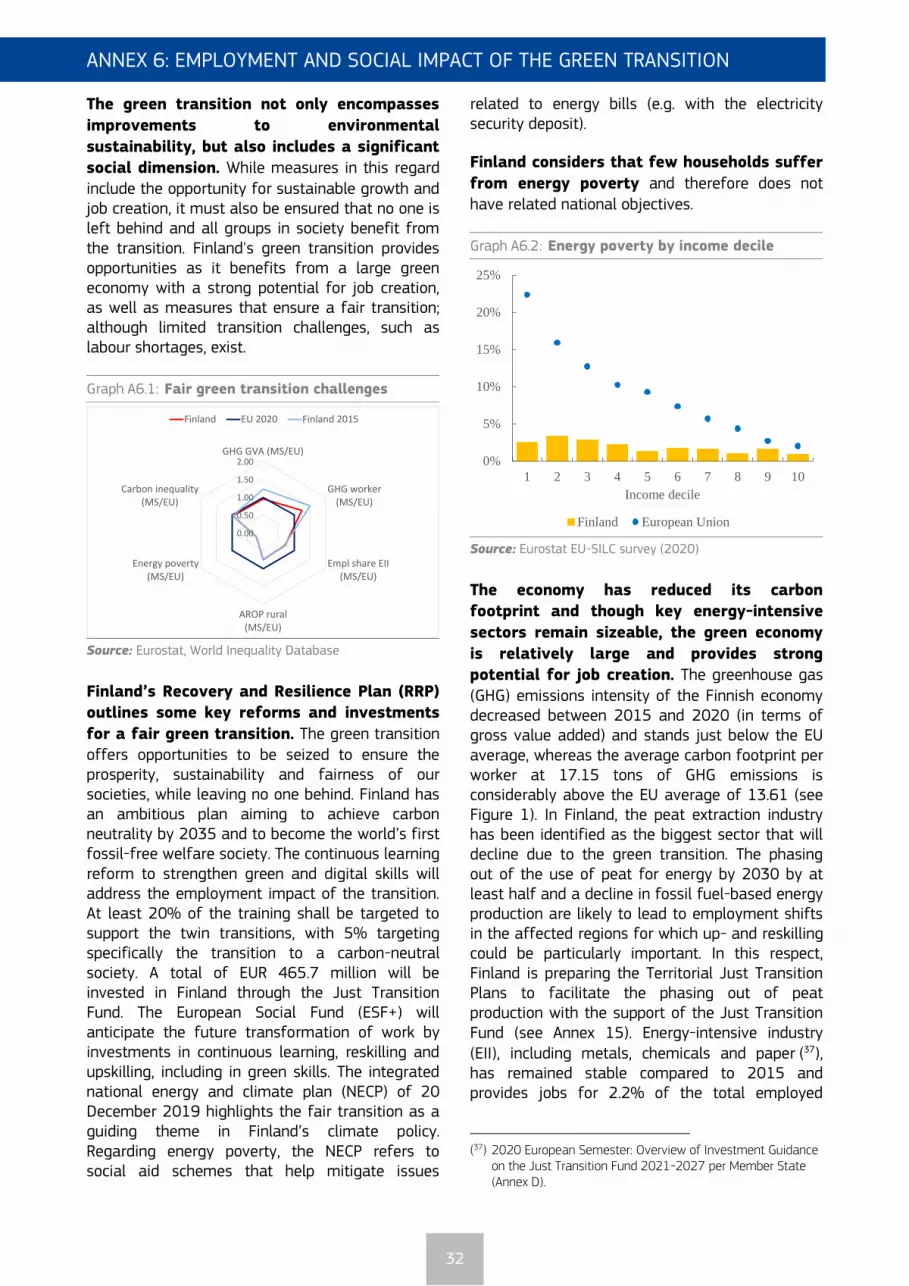
ANNEX 6: EMPLOYMENT AND SOCIAL IMPACT OF THE GREEN TRANSITION
32
The green transition not only encompasses
improvements to environmental
sustainability, but also includes a significant social dimension. While measures in this regard include the opportunity for sustainable growth and job creation, it must also be ensured that no one is left behind and all groups in society benefit from the transition. Finland's green transition provides opportunities as it benefits from a large green economy with a strong potential for job creation, as well as measures that ensure a fair transition; although limited transition challenges, such as labour shortages, exist.
Graph A6.1: Fair green transition challenges
Source: Eurostat, World Inequality Database
Finland’s Recovery and Resilience Plan (RRP)
outlines some key reforms and investments
for a fair green transition. The green transition offers opportunities to be seized to ensure the prosperity, sustainability and fairness of our societies, while leaving no one behind. Finland has an ambitious plan aiming to achieve carbon neutrality by 2035 and to become the world’s first fossil-free welfare society. The continuous learning reform to strengthen green and digital skills will address the employment impact of the transition. At least 20% of the training shall be targeted to support the twin transitions, with 5% targeting specifically the transition to a carbon-neutral society. A total of EUR 465.7 million will be invested in Finland through the Just Transition Fund. The European Social Fund (ESF+) will anticipate the future transformation of work by investments in continuous learning, reskilling and upskilling, including in green skills. The integrated national energy and climate plan (NECP) of 20 December 2019 highlights the fair transition as a guiding theme in Finland’s climate policy. Regarding energy poverty, the NECP refers to social aid schemes that help mitigate issues
related to energy bills (e.g. with the electricity security deposit).
Finland considers that few households suffer
from energy poverty and therefore does not have related national objectives.
Graph A6.2: Energy poverty by income decile
Source: Eurostat EU-SILC survey (2020)
The economy has reduced its carbon
footprint and though key energy-intensive
sectors remain sizeable, the green economy
is relatively large and provides strong
potential for job creation. The greenhouse gas (GHG) emissions intensity of the Finnish economy decreased between 2015 and 2020 (in terms of gross value added) and stands just below the EU average, whereas the average carbon footprint per worker at 17.15 tons of GHG emissions is considerably above the EU average of 13.61 (see Figure 1). In Finland, the peat extraction industry has been identified as the biggest sector that will decline due to the green transition. The phasing out of the use of peat for energy by 2030 by at least half and a decline in fossil fuel-based energy production are likely to lead to employment shifts in the affected regions for which up- and reskilling could be particularly important. In this respect, Finland is preparing the Territorial Just Transition Plans to facilitate the phasing out of peat production with the support of the Just Transition Fund (see Annex 15). Energy-intensive industry (EII), including metals, chemicals and paper (37), has remained stable compared to 2015 and provides jobs for 2.2% of the total employed
(37) 2020 European Semester: Overview of Investment Guidance
on the Just Transition Fund 2021-2027 per Member State (Annex D).
0.00
0.50
1.00
1.50
2.00GHG GVA (MS/EU)
GHG worker(MS/EU)
Empl share EII(MS/EU)
AROP rural(MS/EU)
Energy poverty(MS/EU)
Carbon inequality(MS/EU)
Finland EU 2020 Finland 2015
0%
5%
10%
15%
20%
25%
1 2 3 4 5 6 7 8 9 10
Income decile
Finland European Union
ANNEX 6: EMPLOYMENT AND SOCIAL IMPACT OF THE GREEN TRANSITION

33
workforce (3.1% in the EU). The environmental goods and services sector already provides jobs to a comparatively large share of the employed population (5.1% vs 2.2% in the EU) (38). Labour shortages in greening sectors such as manufacturing have been identified (39).
As for the social dimension of the green
transition, ensuring access to essential
transport and energy services, appears overall less of a challenge in Finland. The share of the rural population at risk of poverty has slightly increased from 13.8% in 2015 to 14.1% in 2020 (18.7% in the EU) (40). The share of the population unable to keep their homes adequately warm remains stable at 1.8%, which is well below the EU average (8%). All income groups have rather low percentage of people affected and numbers stay well below EU average (see Figure 2). Consumption patterns vary across the population: the average carbon footprint of the top 10% of emitters is about 5.2 times higher than that of the bottom 50% of the population (5.3 times in the EU).
Tax systems are key to ensuring a fair
transition towards carbon neutrality (41). Finland’s revenues from total environmental taxes remained stable between 2015 and 2019, moving from 2.89% of GDP to 2.81%. They stood at 2.75% in 2020 (against 2.24% in the EU). The labour tax wedge for low-income earners (42) dropped from 34.1% in 2015 to 31.9% in 2019. It stood at 32.0% in 2021, compared to the EU average of 31.9% in 2021 (see Annex 17). Redistributive measures accompanying environmental taxation can have the potential to foster progressive measures and to have a positive impact on the disposable income of
(38) There is currently no common EU-wide definition of green
jobs. The environmental goods and services sector (EGSS) accounts only report on an economic sector that generates environmental products, i.e. goods and services produced for environmental protection or resource management.
(39) Eurofound (2021), Tackling labour shortages in EU Member States, Publications Office of the European Union, Luxembourg.
(40) Based on COM(2021) 568 final (Annex I) as a proxy for potential transport challenges in the context of the green transition (e.g. due to vulnerability to fuel prices).
(41) COM(2021) 801 final.
(42) Tax wedge for a single earner at 50% of the national average wage (Tax and benefits database, European Commission/OECD).
households in the lowest segments of the income distribution (43).
(43) SWD(2021) 641 final PART 3/3, on distributional effects of
energy taxation revision, based on the European Commission Joint Research Centre GEM-E3 and Euromod models.

RESOURCE EFFICIENCY AND PRODUCTIVITY
ANNEX 7: RESOURCE EFFICIENCY AND PRODUCTIVITY
34
The efficient use of resources is key to
ensuring competitiveness and open strategic
autonomy, while minimizing the
environmental impact. The green transition presents a major opportunity for European industry by creating markets for clean technologies and products. It will have an impact across the entire value chain in sectors such as energy and transport, construction and renovation, food and electronics, helping to create sustainable, local and well-paid jobs across Europe.
In 2020, the circular (secondary) use of
material in Finland was 6.2%. This percentage is well below the EU27 average of 12.8% and very limited progress was made over the last few years. In 2021, Finland adopted an ambitious Circular Economy programme which, inter alia, targets doubling the circular material use rate by 2035 and restricts the use of domestic primary raw materials. Further, Finland’s RRP contains measures to improve the re-use and recycling of industrial side streams.
Graph A7.1: Economic importance and expansion of
the circular economy
Source: Eurostat
In 2020, the resource productivity in Finland
with 1.09 PPS generated per kg of material consumed remains well below the EU
average of 2.23 PPS per kg. Finland’s Circular Economy Programme, adopted in 2021, commits to doubling the productivity of resources by 2035 (compared to 2015) (44). Waste generation in Finland has started to increase in recent years. This growth rate is well above the EU average. It
(44) The high metal footprint and domestic material consumption
per capita, and the low energy productivity as well as resource productivity might be obstacles to the ongoing transitions (see Resilience Dashboards | European Commission (europa.eu).”
also indicates that Finland’s generation of waste is not decoupled from its economic growth.
Eco-innovation is an important enabling factor for the circular economy. A successful transition to a circular economy requires social and technological innovation as its full potential can only be reached when implemented across all value chains. Product design approaches and new business models can help to produce systemic circularity innovations, creating new business opportunities.
Finland ranked 2nd on the 2021 Eco-Innovation Scoreboard, with a total score of
157, resulting in an eco-innovation leader
performance. In three out of five components of the Eco-Innovation Index of 2021 Finland performs above the EU average, namely the eco-innovation inputs, eco-innovation outputs and socio-economic outputs. While its performance is below the EU average regarding eco-innovation activities and resource efficiency outcomes.
1.74% 1.65% 1.58%0.96% 0.93% 0.88%
1.72% 1.73% 1.75%
0.94% 0.94%0.96%
0.0%
0.2%
0.4%
0.6%
0.8%
1.0%
1.2%
1.4%
1.6%
1.8%
2.0%
2015 2016 2017
Persons employed in the circular economy, FI (% of total employment)Value added at factor cost, FI (% of GDP )Persons employed in the circular economy, EU27 (% of total employment)Value added at factor cost, EU27 (% of GDP )
RESOURCE EFFICIENCY AND PRODUCTIVITY
ANNEX 7: RESOURCE EFFICIENCY AND PRODUCTIVITY

35
Table A7.1: Selected resource efficiency indicators
Source: Eurostat
SUB-POLICY AREA 2015 2016 2017 2018 2019 2020 EU27
Circularity
Resource Productivity (Purchasing power standard (PPS) per kilogram) 1.00 0.99 0.99 0.97 1.08 1.03 2.23 2020
Material Intensity (kg/EUR) 1.00 1.01 1.01 1.03 0.92 0.97 0.45 2020
Circular Material Use Rate (%) 6.4 5.3 5.6 5.9 6.3 6.2 12.8 2020
Material footprint (Tones/capita) 31.97 30.65 31.298 32.906 29.5 - 14.584 2019
Waste
Waste generation (kg/capita, total waste) - 22,359 - 23,253 - - 5,234 2018
Landfilling (% of total waste treated) - 88 - 82.1 - - 38.5 2018
Recycling rate (% of municipal waste) 40.6 42 40.5 42.3 43.5 41.6 47.8 2020
Hazardous waste (% of municipal waste) - 1.9 - 1.5 - - 4.3 2018
Competitiveness
Gross value added in environmental goods and services sector (% of GDP) 5.63 5.64 5.92 5.69 5.77 - 2.32 2019
Private investment in circular economy (% of GDP) 0.09 0.1 0.08 - - - 0.12 2018
Latest year
EU 27

ANNEX 8: DIGITAL TRANSITION
36
The Digital Economy and Society Index (DESI)
monitors EU Member States’ digital progress.
The areas of human capital, digital connectivity, the integration of digital
technologies by businesses and digital public
services reflect the Digital Decade’s four cardinal points (45). This Annex describes Finland’s DESI performance.
The Finnish recovery and resilience plan
devotes a large part of the budget to the
actions on digital objectives (27.5%). It envisages investments in digital public services, measures for digitalization in health and employment services, digitalization of rail systems and the implementation of smart energy grids. Finland will also invest in data-driven innovation, cybersecurity, connectivity in the areas where the market mechanism cannot deliver, digital skills at various stages of education and life, deployment of advanced technologies and digital R&D&I, and the digitalization of businesses.
Finland is among the best performing
countries in human capital in most of the indicators, including basic digital skills, ICT specialists and also the female ICT specialists.
In the indicators for digital connectivity,
Finland advances in line with the other
countries. It scores slightly below the EU average on the very high-capacity networks (VHCN) coverage including fibre to the premises, and above average on the 5G technology coverage. Obviously, geography is one of the main factors contributing to this average figure.
Finland excels in the integration of digital
technology with all indicators significantly above the EU averages for SMEs with at least a basic level of digital intensity, for enterprises using big data solutions, and especially in the use of cloud services and Artificial Intelligence.
In digital public services, Finland performs very well. The possibilities for online interaction between government authorities and the public - for citizens as well as for businesses - approach saturation and are considerably above EU average.
(45) 2030 Digital Compass: the European Way for the Digital
Decade Communication, COM (2021) 118 final
ANNEX 8: DIGITAL TRANSITION

37
Table A8.1: Key Digital Economy and Society Index Indicators
(*) The 5G coverage indicator does not measure users’ experience, which may be affected by a variety of factors such as the type of device used, environmental conditions, number of concurrent users and network capacity. 5G coverage refers to the percentage of populated areas as reported by operators and national regulatory authorities. Source: Digital Economy and Society Index
EU
EU top-
performance
Human capital DESI 2020 DESI 2021 DESI 2022 DESI 2022 DESI 2022
At least basic digital skills NA NA 79% 54% 79%
% individuals 2021 2021 2021
ICT specialists 6.8% 7.6% 7.4% 4.5% 8.0%
% individuals in employment aged 15-74 2019 2020 2021 2021 2021
Female ICT specialists 21% 23% 24% 19% 28%
% ICT specialists 2019 2020 2021 2021 2021
Connectivity
Fixed Very High Capacity Network (VHCN) coverage 62% 67% 68% 70% 100%
% households 2019 2020 2021 2021 2021
5G coverage (*) NA 12% 72% 66% 99.7%
% populated areas 2020 2021 2021 2021
Integration of digital technology
SMEs with at least a basic level of digital intensity NA NA 82% 55% 86%
% SMEs 2021 2021 2021
Big data 19% 22% 22% 14% 31%
% enterprises 2018 2020 2020 2020 2020
Cloud NA NA 66% 34% 69%
% enterprises 2021 2021 2021
Artificial Intelligence NA NA 16% 8% 24%
% enterprises 2021 2021 2021
Digital public services
Digital public services for citizens NA NA 90 75 100
Score (0 to 100) 2021 2021 2021
Digital public services for businesses NA NA 93 82 100
Score (0 to 100) 2021 2021 2021
Finland

ANNEX 9: INNOVATION
38
This Annex provides a general overview of
the performance of Finland’s research and
innovation system. Finland is an Innovation Leader according to the 2021 European Innovation Scoreboard (46) and its performance relative to the EU has improved over time. Starting from 129% in 2018, the performance level reached 135% of the EU average in 2021.
Finland is a strong promoter of the green transition and invests in related R&I
infrastructure. Finland’s Recovery and Resilience Plan has a robust R&D focus, including investments in green R&I and research infrastructures. After a strong decline between 2010 and 2017, R&D intensity started to recover as of 2018 and reached 2.94% in 2020. While R&D expenditure is among the highest in the EU, it remains below the ambitious target of 4% of GDP by 2030, set by Finland in its National Roadmap for Research, Development and Innovation adopted in spring 2020. Finance for innovation is readily available, with Venture Capital (market statistics) as percentage of GDP being nearly three times higher than the EU average.
Business innovation is supported by a strong
framework of Research and Technology
Organisations. While Finland does not provide R&I tax incentives and public support for business R&D remains well below the EU average, businesses R&I activities are strongly supported by a strong network of research and technology organisations. After experiencing a strong decline (mostly driven by the manufacturing sector), business R&D intensity has improved in recent years and is among the highest in the EU. The Finnish R&I framework benefits from strong academia-business linkages, as reflected by the relatively high share of public-private scientific publications. The country’s technological production, as measured by patent applications, has been on a downward trend since 2010 but still remains substantially higher than the EU average.
(46) https://ec.europa.eu/docsroom/documents/45913
ANNEX 9: INNOVATION

39
Table A9.1: Key research, development and innovation indicators
Data: Eurostat, OECD, DG JRC, Science-Metrix (Scopus database and EPO’s Patent Statistical database), Invest Europe Source: DG Research and Innovation - Common R&I Strategy and Foresight Service - Chief Economist Unit
Compound EU
annual growth average
R&D Intensity (GERD) 3.71 2.87 2.76 2.80 2.91 -2.4 2.32
Public expenditure on R&D 1.10 0.94 0.92 0.94 0.94 -1.6 0.78
Business expenditure on R&D (BERD) 2.58 1.91 1.81 1.84 1.95 -2.8 1.53
Scientific publications within the top 10% most cited
worldwide, % of total in Finland 11.5 11.3 12.2 : : 0.7 9.9
PCT patent appl.-s per billion GDP (in PPS€) 9.9 8.1 7.7 : : -3.2 3.5
Public-private scientific co-publications as % of total
publications11.9 11.0 11.4 10.9 10.2 -1.5 9.05
New graduates in science & engineering per thousand pop.
aged 25-3423.8 17.8 17.2 17.6 : 0.9 16.3
Public sector support for BERD as % of GDP 0.074 0.081 0.070 0.066 : -1.2 0.196
Share of environment-related patents in total patent
applications filed under PCT (%) 14.0 14.4 12.9 : : -0.9 12.8
Venture Capital (market statistics) as % of GDP 0.062 0.058 0.070 0.093 0.142 8.7 0.054
Finance for innovation and Economic renewal
Key indicators as % of GDP
Quality of the R&I system
Academia-business cooperation
Human capital and skills availability
Public support for business enterprise expenditure on R&D (BERD)
Green innovation
2020Finland 2010 2015 2018 2019
ANNEX 10: INDUSTRY AND SINGLE MARKET
40
Productivity growth is a critical driver of
economic prosperity, well-being and
convergence over the long run. A major source of productivity for the EU economy is a well-functioning single market, where fair and effective competition and a business friendly environment are ensured, in which small and medium enterprises (SMEs) can operate and innovate without difficulty. Businesses and industry rely heavily on robust supply chains and are facing bottlenecks that bear a negative impact on firms’ productivity levels, employment, turnover and entry/exit rates. This may impact the Member States’ capacity to deliver on Europe’s green and digital transformation.
Finland’s labour productivity is worsening
relative to the EU average. Within the Nordics, it is on a par with Sweden but has been lagging behind Danish productivity since the financial crisis. Productivity in manufacturing is however performing better than in services. The productivity of Finnish SMEs is significantly higher than the EU average (value added per person employed EUR 64 600 compared to the EU average of EUR 40 000 in 2020). Skills shortages (23% of firms report labour shortages vs. 14% in EU) and relatively low rates of investment in equipment and in intangible assets all have an impact on productivity.
The Finnish economy has been somewhat
affected by global supply chain disruptions. Finland’s economy relies slightly less on both extra-EU and Single Market sources of value added, relative to domestic inputs, compared to the EU average. Overall, 23% of firms reported shortages in materials or equipment in 2021 (vs. 26% for the EU average), with impacts felt especially in manufacturing. Moreover, due to its geographic location, the shortage of shipping containers had a pronounced impact.
The economy is well integrated into the
Single Market. Finland performs above EU average in terms of transposition of Single Market directives, and on average concerning Single Market related infringements. Concerning regulated professions, Finland is more liberal than the EU average. Relative to its clear strengths in business digitalisation, Finland has still untapped potential in e-commerce in support of trade in the Single Market, as with only 23% of SMEs selling online it is clearly below the level of its Nordic
peers. The Finnish RRP has measures that aim to push SMEs towards enhanced internationalisation.
Overall, Finland offers a very good
environment for doing business in Europe,
and there are continuous improvements. Access to finance for SMEs is above the EU average (0.81 compared to 0.56 for the EU, 2020), and Finland has one of the best corruption perception scores in the world. Business digitalisation is also a strength of Finland: 79% of Finnish SMEs have at least basic level of digital intensity (compared to the EU average of 55%). On the downside, lengthy administrative procedures related to permitting can be seen as undermining possible investment projects overall.
ANNEX 10: INDUSTRY AND SINGLE MARKET

41
Table A10.1: Key single market and industry indicators
(Continued on the next page)
SUB-POLICY AREA INDICATOR NAME DESCRIPTION 2021 2020 2019 2018 2017 Growth ratesEU27
average*
Value added by source (domestic)
VA that depends on domestic intermediate inputs, % [source: OECD (TiVA), 2018]
71.08 62.6%
Value added by source (EU)
VA imported from the rest of the EU, % [source: OECD (TiVA), 2018]
14.85 19.7%
Value added by source (extra-EU)
% VA imported from the rest of the world, % [source: OECD (TiVA), 2018]
14.1 17.6%
Cos
t
com
peti
tive
ness
Producer energy price (industry)
Index (2015=100) [source: Eurostat, sts_inppd_a] n.a. n.a. n.a. n.a. n.a. n.a. 127.3
Material Shortage using survey data
Average (across sectors) of firms facing constraints, % [source: ECFIN CBS]
23 6 9 17 9 156% 26%
Labour Shortage using survey data
Average (across sectors) of firms facing constraints, % [source: ECFIN CBS]
23 9 23 21 13 77% 14%
Sectoral producer pricesAverage (across sectors), 2021 compared to 2020 and 2019, index [source:Eurostat]
5.4% 5.4%
Concentration in selected raw materials
Import concentration a basket of critical raw materials, index [source: COMEXT]
0.19 0.2 0.22 0.23 0.25 -24% 17%
Installed renewables electricity capacity
Share of renewable electricity to total capacity, % [source:Eurostat, nrg_inf_epc]
37.60 35.20 34.20 34.00 11% 47.8%
Net Private investmentsChange in private capital stock, net of depreciation, % GDP [source: Ameco]
3.4 4 4.7 4.3 -20.9% 2.6%
Net Public investmentsChange in public capital stock, net of depreciation, % GDP [source: Ameco]
1.3 0.8 0.8 0.7 86% 0.4%
Sing
le
Mar
ket
inte
grat
ion
Intra-EU tradeRatio of Intra-EU trade to Extra-EU trade, index [source: Ameco]
1.85 1.71 1.62 1.58 1.64 13% 1.59
Prof
essi
onal
serv
ices
rest
rict
iven
ess
Regulatory restrictiveness indicator
Restrictiveness of access to and exercise of regulated professions (professions with above median restrictiveness, out of the 7 professions analysed in SWD (2021)185 [source: SWD (2021)185; SWD(2016)436 final])
0 2 -100% 3.37
Prof
essi
onal
qual
ific
atio
ns
reco
gnit
ion
Recognition decisions w/o compensation
Professionals qualified in another EU MS applying to host MS, % over total decisions taken by host MS [source: Regulated professions database]
54 45%
Transposition - overall5 sub-indicators, sum of scores [source: Single Market Scoreboard]
Above average
Above average
Above average
Above average
Infringements - overall4 sub-indicators, sum of scores [source: Single Market Scoreboard]
On average
On averageAbove
averageAbove
average
Inve
stm
ent
prot
ecti
on
Confidence in investment protection
Companies confident that their investment is protected by the law and courts of MS if something goes wrong, % of all firms surveyed [source: Flash Eurobarometer 504]
82 56%
Inve
stm
ent
dyna
mic
s
SINGLE MARKET
Com
plia
nce
-
coop
erat
ion
EC
and
MS
HEADLINE INDICATORS
Econ
omic
str
uctu
re
RESILIENCE
Shor
tage
s/su
pply
cha
in
disr
upti
ons
Stra
tegi
c
depe
nden
cies

42
Table (continued)
(*) latest available. Source: See above in the table the respective source for each indicator in the column “description”.
Bankruptcies Index (2015=100) [source: Eurostat, sts_rb_a] n.a. n.a. n.a. n.a. n.a. n.a. 70.1
Business registrations Index (2015=100) [source: Eurostat, sts_rb_a] n.a. n.a. n.a. n.a. n.a. n.a. 105.6
Late paymentsShare of SMEs experiencing late payments in past 6 months, % [source: SAFE]
43.5 45.2 48.2 n.a. n.a. -10% 45%
EIF Access to finance index - Loan
Composite: SME external financing over last 6 months, index from 0 to 1 (the higher the better) [source: EIF SME Access to Finance Index]
0.81 0.62 0.33 0.46 75.8% 0.56
EIF Access to finance index - Equity
Composite: VC/GDP, IPO/GDP, SMEs using equity, index from 0 to 1 (the higher the better) [source: EIF SME Access to Finance Index]
0.33 0.31 0.55 0.82 -59.9% 0.18
% of rejected or refused loans
SMEs whose bank loans’ applications were refused or rejected, % [source: SAFE]
10.4 13.6 10.2 5.8 6.5 59.8% 12.4%
SME contractorsContractors which are SMEs, % of total [source: Single Market Scoreboard]
62 61 61 60 3.3% 63%
SME bidsBids from SMEs, % of total [source: Single Market Scoreboard]
50 74 68 76 -34% 70.8%
Bus
ines
s
dem
ogra
phy
Acc
ess
to f
ina
nce
BUSINESS ENVIRONMENT - SMEsPu
blic
proc
urem
ent
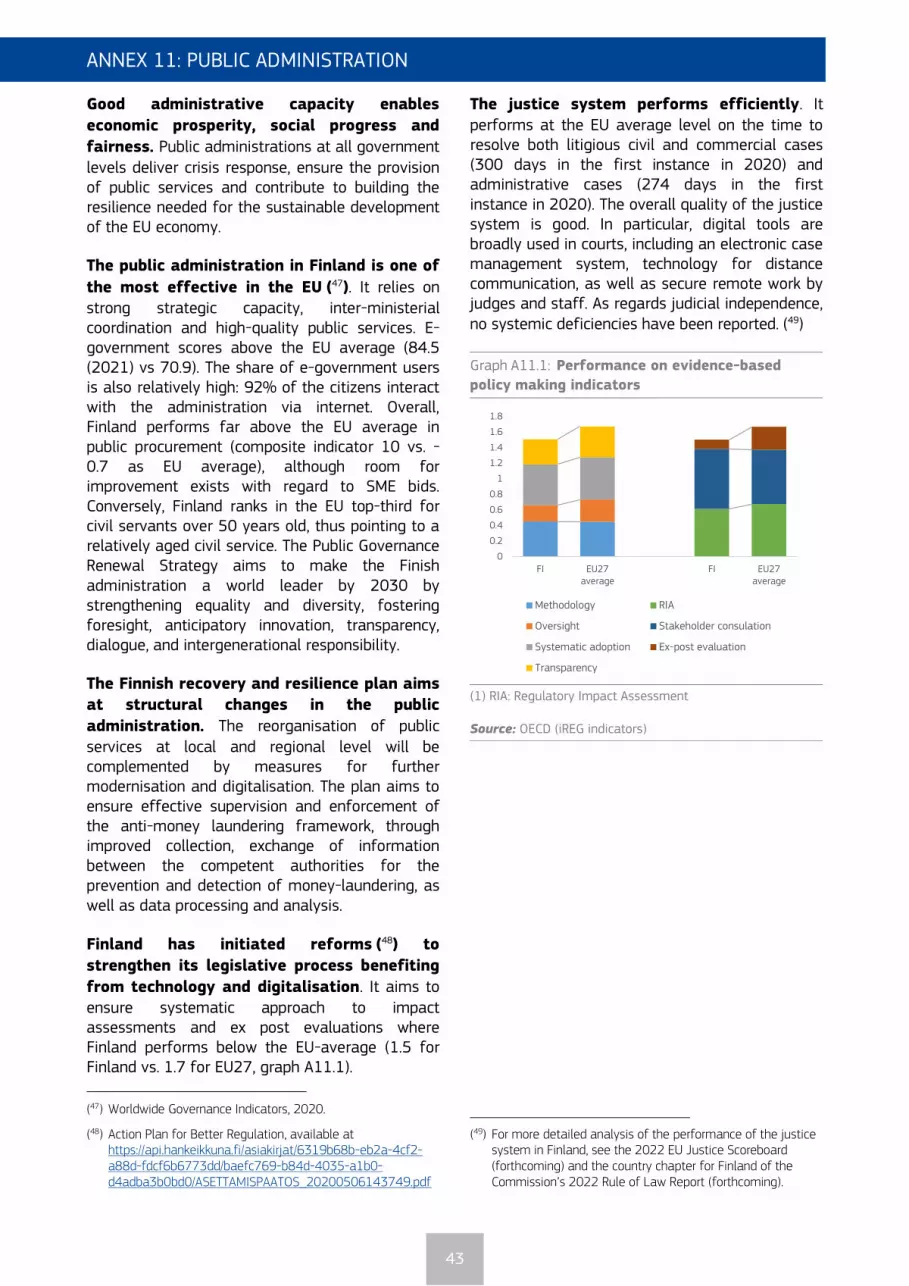
ANNEX 11: PUBLIC ADMINISTRATION
43
Good administrative capacity enables
economic prosperity, social progress and
fairness. Public administrations at all government levels deliver crisis response, ensure the provision of public services and contribute to building the resilience needed for the sustainable development of the EU economy.
The public administration in Finland is one of
the most effective in the EU (47). It relies on strong strategic capacity, inter-ministerial coordination and high-quality public services. E-government scores above the EU average (84.5 (2021) vs 70.9). The share of e-government users is also relatively high: 92% of the citizens interact with the administration via internet. Overall, Finland performs far above the EU average in public procurement (composite indicator 10 vs. -0.7 as EU average), although room for improvement exists with regard to SME bids. Conversely, Finland ranks in the EU top-third for civil servants over 50 years old, thus pointing to a relatively aged civil service. The Public Governance Renewal Strategy aims to make the Finish administration a world leader by 2030 by strengthening equality and diversity, fostering foresight, anticipatory innovation, transparency, dialogue, and intergenerational responsibility.
The Finnish recovery and resilience plan aims
at structural changes in the public
administration. The reorganisation of public services at local and regional level will be complemented by measures for further modernisation and digitalisation. The plan aims to ensure effective supervision and enforcement of the anti-money laundering framework, through improved collection, exchange of information between the competent authorities for the prevention and detection of money-laundering, as well as data processing and analysis.
Finland has initiated reforms (48) to
strengthen its legislative process benefiting
from technology and digitalisation. It aims to ensure systematic approach to impact assessments and ex post evaluations where Finland performs below the EU-average (1.5 for Finland vs. 1.7 for EU27, graph A11.1).
(47) Worldwide Governance Indicators, 2020.
(48) Action Plan for Better Regulation, available at https://api.hankeikkuna.fi/asiakirjat/6319b68b-eb2a-4cf2-a88d-fdcf6b6773dd/baefc769-b84d-4035-a1b0-d4adba3b0bd0/ASETTAMISPAATOS_20200506143749.pdf
The justice system performs efficiently. It performs at the EU average level on the time to resolve both litigious civil and commercial cases (300 days in the first instance in 2020) and administrative cases (274 days in the first instance in 2020). The overall quality of the justice system is good. In particular, digital tools are broadly used in courts, including an electronic case management system, technology for distance communication, as well as secure remote work by judges and staff. As regards judicial independence, no systemic deficiencies have been reported. (49)
Graph A11.1: Performance on evidence-based
policy making indicators
(1) RIA: Regulatory Impact Assessment Source: OECD (iREG indicators)
(49) For more detailed analysis of the performance of the justice
system in Finland, see the 2022 EU Justice Scoreboard (forthcoming) and the country chapter for Finland of the Commission’s 2022 Rule of Law Report (forthcoming).
0
0.2
0.4
0.6
0.8
1
1.2
1.4
1.6
1.8
FI EU27average
FI EU27average
Methodology RIA
Oversight Stakeholder consulation
Systematic adoption Ex-post evaluation
Transparency
ANNEX 11: PUBLIC ADMINISTRATION

44
Table A11.1: Public administration indicators for Finland
(1) High values stand for good performance barring indicators # 7 and 8. (2) Measures the user centricity (including for cross-border services) and transparency of digital public services as well as the existence of key enablers for the provision of those services. (3) Break in the series in 2021. (4) Defined as the absolute value of the difference between the share of men and women in senior civil service positions. Source: ICT use survey, Eurostat (# 1); E-government benchmark report (# 2); Open data maturity report (# 3); Fiscal Governance
Database (# 4, 9, 10); Labour Force Survey, Eurostat (# 5, 6, 8), European Institute for Gender Equality (# 7), Single Market Scoreboard public procurement composite indicator (# 11); OECD Indicators of Regulatory Policy and Governance (# 12). .
FI 2017 2018 2019 2020 2021 EU27
1 88.0 87.0 91.0 91.0 92.0 70.8
2 na na na na 84.5 70.9
3 na na na na 85.8 81.1
4 37.5 47.5 37.5 56.1 na 56.8
5 71.6 72.4 72.3 75.0 71.1 55.3
6 43.8 44.3 42.5 41.0 45.2 18.6
7 0.2 1.4 2.4 11.0 12.6 21.8
8 24.1 24.7 24.0 24.0 26.9 21.3
9 0.78 0.78 0.78 0.80 na 0.72
10 1.2 1.2 1.3 1.3 na 1.5
11 4.7 6.3 7.3 10.0 na -0.7
12 1.43 na na 1.50 na 1.7
Index of regulatory policy and governance practices in the areas of stakeholder engagement, Regulatory Impact Assessment (RIA) and ex post evaluation of legislation
Educational attainment level, adult learning, gender parity and ageing
Open government and independent fiscal institutions
Participation rate of public administration employees in adult learning (3)
Gender parity in senior civil service positions (4)
Share of public sector workers between 55 and 74 years (3)
E-government
Public Financial Management
Evidence-based policy making
Indicator (1)
Medium term budgetary framework index
Strength of fiscal rules index
Public procurement composite indicator
Share of individuals who used internet within the last year to interact with public authorities (%)
2021 e-government benchmark´s overall score (2)
2021 open data maturity index
Scope Index of Fiscal Institutions
Share of public administration employees with tertiary education, levels 5-8 (3)

FAIRNESS
ANNEX 12: EMPLOYMENT, SKILLS AND SOCIAL POLICY CHALLENGES IN LIGHT OF THE EUROPEAN PILLAR OF SOCIAL RIGHTS
45
The European Pillar of Social Rights provides
the compass for upward convergence
towards better working and living conditions in the EU. The implementation of its 20 principles on equal opportunities and access to the labour market, fair working conditions, social protection and inclusion, supported by the 2030 EU headline targets on employment, skills and poverty reduction, will strengthen the EU’s drive towards a digital, green and fair transition. This Annex provides an overview of Finland’s progress in achieving the goals under the European Pillar of Social Rights.
Table A12.1: Social Scoreboard for Finland
Update of 29 April 2022. Members States are classified on the Social Scoreboard according to a statistical methodology agreed with the EMCO and SPC Committees. It looks jointly at levels and changes of the indicators in comparison with the respective EU averages and classifies Member States in seven categories. For methodological details, please consult the Joint Employment Report 2022. Due to changes in the definition of the individuals' level of digital skills in 2021, exceptionally only levels are used in the assessment of this indicator; NEET: neither in employment nor in education and training; GDHI: gross disposable household income. Source: European Commission
In spite of the impact of the COVID-19 crisis,
the Finnish labour market performs well
across most dimensions of the Social
Scoreboard. The employment rate (75.5% in 2020 and 76.8% in 2021) is higher than the EU average (73.1%). Finland had one of the lowest gender employment gaps in the EU in 2021, although the gender pay gap was slightly above average (in 2020 16.7% in Finland, 13% in the EU). The share of young people (15-29) neither in employment nor in education or training (NEET) has increased in 2020 (to 10.3% from 9.5% in 2019), and the increase is even higher (more than 3pps) among non-EU born NEETs. However, the rate remains below the EU average of 13.2%, and has recovered in 2021 (9.3%). The reform on “Strengthening the multidisciplinary services for young people” (Ohjaamo services) in the Finnish recovery and resilience plan (RRP) will specifically address the young people NEET by improving their employment prospects. The employment gap for the non-EU born is improving, while for non-EU born women it remains high at 20 pps. At the same time, Finland is taking steps to reduce employment gaps for vulnerable groups, such as third-country nationals. To phase out the “unemployment tunnel” for older workers, there is scope to promote tailored activation measures for this group. Finland engaged in a long-term reform in this respect, in the context of its RRP. Phasing out of the additional days of unemployment allowance for older people should start in 2023. In parallel, the eligibility for disability benefits for this particular age group may need to be adjusted. The European Social Fund Plus (ESF+) investment will help the unemployed, inactive and those who face difficulties to integrate to the labour market, and support acquisition of skills through continuous learning and flexible educational paths.
Finland performs well on upskilling and
reskilling, particularly on digital skills. Based on 2021 data, participation in learning over the past four weeks stood at a very high level, at 30.5% (versus 10.8% in the EU). Yet, older workers, especially men, on average have lower skills than younger workers and the labour market performance of those having no education, primary education or lower secondary education is relatively poor. In 2021, 79% of 16-74 year-olds had basic or above basic digital skills, one of the highest rates in the EU. Having reformed the vocational education and training system, Finland is implementing a continuous learning reform to
8.2
79.0
9.3
2.0
3.7
76.8
7.7
1.8
109.3
15.9
14.5
51.4
19.9
4.1
39.6
5.4
Critical
situationTo watch
Weak but
improving
Good but to
monitorOn average
Equal opportunities
and access to the
labour market
Early leavers from education and training
(% of population aged 18-24) (2021)
Youth NEET
(% of total population aged 15-29) (2021)
Gender employment gap (percentage points) (2021)
Income quintile ratio (S80/S20) (2020)
Individuals' level of digital skills (% of population 16-
74) (2021)
Dynamic labour
markets and fair
working conditions
Social protection
and inclusion
At risk of poverty or social exclusion for children (in %)
(2020)
Disability employment gap (ratio) (2020)
Better than average
At risk of poverty or social exclusion (in %) (2020)
Employment rate
(% population aged 20-64) (2021)
Unemployment rate
(% population aged 15-74) (2021)
Long term unemployment
(% population aged 15-74) (2021)
GDHI per capita growth (2008=100) (2020)
Best performers
Impact of social transfers (other than pensions) on
poverty reduction (% reduction of AROP) (2020)
Children aged less than 3 years in formal childcare (%
of under 3-years-olds) (2020)
Self-reported unmet need for medical care (% of
population 16+) (2020)
Housing cost overburden (% of population) (2020)
FAIRNESS
ANNEX 12: EMPLOYMENT, SKILLS AND SOCIAL POLICY CHALLENGES IN LIGHT OF THE EUROPEAN PILLAR OF SOCIAL RIGHTS

46
increase opportunities for retraining and continuing professional development throughout the working life. For more on Finland’s performance on education indicators, see Annex 13.
Poverty risks are relatively low in Finland, however, self-reported unmet needs for
medical care remain a challenge. This mainly concerns long waiting times in both primary and specialised care, particularly for people who are not eligible for occupational health care. Multiple and overlapping coverage schemes, combined with regional variation in waiting times and co-payments, favour people in work and wealthier households, exacerbating income- and age-based inequalities in access and financial protection. Due to the COVID-19 pandemic, there has been an increase of self-reported unmet needs for medical care from 4.7% in 2019 to 5.4% in 2020 (versus 1.8 in the EU). The long waiting times for primary healthcare and specialised care concern especially those not covered by occupational and private healthcare insurance and those in the lowest income quintile, of whom 7% reported unmet needs in 2020, compared to 2.8 % in the highest income quintile. The recently adopted social and healthcare reform and the planned 7-day care guarantee for non-urgent care are expected to improve access to care. However, the successful implementation of the reform also depends on the availability of healthcare workers, which may pose a key challenge in the next decade due to population ageing and growing demand for social services. The ESF+ will invest in social innovations through supporting the well-being of children who receive child welfare services and will support persons in disadvantaged position by providing food and basic commodities.
ANNEX 13: EDUCATION AND SKILLS
47
This Annex outlines the main challenges for
Finland’s education and training system in
light of the EU-level targets of the European Education Area Strategic Framework and
other contextual indicators, based on the
analysis from the 2021 Education and Training Monitor. Finland’s education and training system struggles with quality and equity challenges that risk worsening as a result of the pandemic. Performing above the EU average in most indicators, Finland lags significantly behind the EU average and the EU-level targets in terms of participation in early childhood education of children aged over 3 until the minimum compulsory school age.
The shortages of teachers in early childhood education and care (ECEC) challenges the
expected increase of ECEC participation. The participation rate in Finland is below EU average. Recently adopted reforms in ECEC have not born the expected fruits. They include the restoration of children’s right to ECEC, the transfer of the sector to the Ministry of Education and Culture, pilots of free-of-charge ECEC for five-year-olds, an extended pilot of two year pre-primary education and a new national curriculum. Challenging working conditions and relatively low salaries reduce the attractiveness of the ECEC teachers’ profession, leading to staff shortages. The 2018 reform required that two thirds of ECEC staff to have a Bachelor degree, which may also exacerbate shortages. The announced creation of 400 new study places for ECEC teachers is a step in the right direction but might not be enough to remedy the situation. Meanwhile, the birth rate has increased again over the last 2 years, after previous decline (from 1.35 to 1.46), requiring further improvement to the provision of ECEC.
Finland records good average student
performance levels, but gaps have been
widening, notably in reading. Current educational challenges in education include the growing impact of students’ home background on educational achievement and increasing performance gaps between students and between schools. In a study on equality, equity and participation, the Finnish Education Evaluation Centre (FINEEC) (50) reported that “(…) basic education seems not to be able to close the gaps
(50) https://karvi.fi/2021/12/09/matematiikan-osaamisen-taso-
on-laskenut-ja-eriytynyt/
caused by students’ home background”. Another study (51) also reports that students’ attainment had declined and differences between students increased. The decline in Finnish students’ reading skills and reading habits is also a matter of general concern.
The shift to distance learning during the COVID-19 pandemic was quite effective but
upper-secondary students seem to have been
badly affected, in particular their mental health. Upper-secondary students were the first to switch to distance learning and the last to be released from it. FINEEC reports on data collected during the COVID-19 pandemic indicate that while most students considered their studies to have advanced as planned, about half of the students feel less motivated and a fifth believe that their studies had not advanced as planned. A joint study from Tampere and Helsinki Universities (52) reported that 40% of the upper-secondary schools’ counselling and guidance staff felt that personal student welfare services provided by multi-professional teams had weakened during the pandemic. The teachers surveyed also reported of declining performance.
Recent reforms in upper-secondary education
pose challenges to students and teachers. Apart from the extension of compulsory education to 18, the main novelty in secondary education is the reform of student grading in the final assessment (53). The extension of compulsory education has brought new requirements for upper secondary regarding support for learning and monitoring of absenteeism in upper-secondary education. The Trade Union for Education (OAJ) has criticized the fact that an excessive share of teachers’ time is now taken up by work not directly related to teaching and learning. An impact assessment of the 2018 reform of higher education students’ selection, has been launched by the Prime Minister’s Offices.
(51) https://karvi.fi/wp-content/uploads/2021/04/KARVI_0821.pdf
(52) https://tuhat.helsinki.fi/ws/portalfiles/portal/141903720/Raportti_ensituloksista_elokuu_2020.pdf
(53) https://www.oph.fi/sites/default/files/documents/Perusopetuksen%20p%C3%A4%C3%A4tt%C3%B6arvioinnin%20kriteerit%2031.12.2020_0.pdf
ANNEX 13: EDUCATION AND SKILLS

48
Finland is widening its higher education
offer, notably for the study fields most
demanded. The National Recovery and Resilience Plan contributes to widening their higher education offer and increasing study places, especially in areas with labour shortage. The Minister of Science and Culture expressed the intention of re-decentralising higher education by allowing the establishment of smaller units across the country and allowing existing institutions to expand into new fields of science. However, several stakeholders are concerned that the reform might endanger the quality of Finnish higher education and the international attractiveness of Finnish universities.
Universities managed the impact of the COVID-19 crisis relatively well with regard to both research and education, but students’ wellbeing was badly affected. Higher education run largely in a remote mode since the onset of the COVID-19 pandemic. At the end of the spring semester, Bachelor degrees will be awarded to students who have studied all or most of their courses without a live
contact to either their fellow students or teachers. Demands for psycho-social help at the Student Health Services keep growing since the beginning of the pandemic.
Table A13.1: EU-level targets and other contextual indicators under the European Education Area
strategic framework
(1) The 2018 EU average on PISA reading performance does not include ES; u = low reliability, : = not available; Data is not yet available for the remaining EU-level targets under the European Education Area strategic framework, covering underachievement in digital skills, exposure of vocational education training graduates to work based learning and participation of adults in learning. Source: Eurostat (UOE, LFS); OECD (PISA).
96% 79.8% 91.9% 88.8% 2019 92.8% 2019
Reading < 15% 11.1% 20.4% 13.5% 2018 22.5% 2018
Mathematics < 15% 13.6% 22.2% 15.0% 2018 22.9% 2018
Science < 15% 11.5% 21.1% 12.9% 2018 22.3% 2018
< 9 % 9.2% 11.0% 8.2% 9.7%
Men 10.6% 12.5% 9.3% 11.4%
Women 7.9% 9.4% 7.1% 7.9%
Cities 7.2% 9.6% 5.8% 8.7%
Rural areas 11.2% 12.2% 11.0% 10.0%
Native 8.7% 10.0% 7.7% 8.5%
EU-born : u 20.7% : u 21.4%
Non EU-born 16.8% u 23.4% 15.7% 21.6%
45% 40.2% 36.5% 40.1% 41.2%
Men 32.1% 31.2% 33.6% 35.7%
Women 48.7% 41.8% 47.0% 46.8%
Cities 47.7% 46.2% 47.8% 51.4%
Rural areas 29.0% 26.9% 25.1% 29.6%
Native 41.5% 37.7% 42.0% 42.1%
EU-born 23.7% 32.7% 28.5% 40.7%
Non EU-born 31.1% 27.0% 28.2% 34.7%
36.0% 38.3% 38.1% 2019 38.9% 2019
2015 2021
Indicator Target Finland EU27 Finland EU27
Participation in early childhood education (age 3+)
Low achieving 15-year-olds in:
Early leavers from
education and training (age
18-24)
Total
By gender
By degree of
urbanisation
By country of
birth
Tertiary educational
attainment (age 25-34)
Total
By gender
By degree of
urbanisation
By country of
birth
Share of school teachers (ISCED 1-3) who are 50 years or over

ANNEX 14: HEALTH AND HEALTH SYSTEMS
49
Especially relevant in light of the ongoing
COVID-19 pandemic, resilient healthcare is a
prerequisite for a sustainable economy and society. This Annex provides a snapshot of the healthcare sector in Finland.
Life expectancy in Finland is higher than in
the EU as a whole. Its growth trend was disrupted in 2020 due to COVID-19, dropping
by little over a month. As of 17 April 2022, Finland reported 0.64 cumulative COVID-19 deaths per 1 000 inhabitants and 172 confirmed cumulative COVID-19 cases per 1 000 inhabitants. Treatable mortality in Finland is low, pointing to an overall effective health system.
Graph A14.1: Life expectancy at birth, years
Source: Eurostat database.
Health spending is slightly lower than the EU
average, both per person and relative to GDP. Public expenditure on health accounts for over three quarters of total spending. It is projected to increase by 0.8 percentage points (pp) of GDP by 2070 (compared to 0.9 pp for the EU).
Graph A14.2: Projected increase in public
expenditure on health care over 2019-2070
(reference scenario)
Source: European Commission / EPC (2021)
Unmet medical care needs are high, mainly
due to waiting times (see also Annex 12). This is linked to the uneven geographic distribution of resources and differences in coverage schemes. The recent health and social care reform and planned reform of a basic care guarantee are expected to reduce inequalities, foster better quality and availability of services and curb expenditure growth. However, the reform’s success will depend on staff availability, notably doctors to effectively ensure access to primary care.
Through its Recovery and Resilience Plan,
Finland plans to invest EUR 409.8 million
(19.7% of the total RRP budget) to clear the backlog in social and health services due to COVID-19. The plan will also foster equal access, and overhaul service delivery models and increase digitalisation of the health system.
80.9 80.9 8181.3
80.4
81.5 81.7 81.882.1 82
2016 2017 2018 2019 2020
EU Finland
6.6
6.1
0.9
0.8
0 2 4 6 8
EU
Finland
% of GDP
2019
2070increase
ANNEX 14: HEALTH AND HEALTH SYSTEMS

50
Table A14.1: Key health indicators
Source: Data sources: Eurostat Database; except: * Eurostat Database and OECD, ** ECDC. Notes: Doctors' density data refer to
practising doctors except for FI, EL, PT (licensed to practice) and SK (professionally active). Nurses' density data refer to practising nurses (imputation from year 2014 for FI) except for IE, FR, PT, SK (professionally active) and EL (nurses working in hospitals only). More information: https://ec.europa.eu/health/state-health-eu/country-health-profiles_en.
2016 2017 2018 2019 2020 EU average (latest year)
Treatable mortality per 100 000 population
(mortality avoidable through optimal quality
healthcare)
76.8 75.7 71.1 69.1 92.1 (2017)
Cancer mortality per 100 000 population 219.7 216.9 212.8 214.5 252.5 (2017)
Current expenditure on health, % GDP 9.4 9.1 9.0 9.2 9.9 (2019)
Public share of health expenditure, % of current
health expenditure76.2 76.4 77.0 77.8 79.5 (2018)
Spending on prevention, % of current health
expenditure 4.0 4.0 4.1 3.9 2.8 (2018)
Acute care beds per 100 000 population 293.6 279.5 284.1 260.7 387.4 (2019)
Doctors per 1 000 population * 4.5 4.6 4.6 3.8 (2018)
Nurses per 1 000 population * 14.3 14.3 14.3 8.2 (2018)
Consumption of antibacterials for systemic use in
the community, daily defined dose per 1 000
inhabitants per day **
15.0 13.6 13.2 12.6 10.0 14.5 (2020)

ANNEX 15: ECONOMIC AND SOCIAL PERFORMANCE AT REGIONAL LEVEL
51
The regional dimension is an important
factor when assessing economic and social
developments in Member States. Taking into account this dimension enables a well-calibrated and targeted policy response that fosters cohesion and ensures sustainable and resilient economic development across all regions.
Territorial cohesion remains a challenge, with an evident regional divide between the
Greater Helsinki region and the three
mainland Finland NUTS2 regions, linked to disparities in labour productivity. In terms of GDP per capita, the capital region performed well above the EU average (144%) in 2019 and 1.5 times higher than the weakest Pohjois- ja Itä-Suomi region, where GDP per head corresponds to 93% of the EU average. Länsi-Suomi also score slightly below the EU average.
Graph A15.1: GDP per capita (2010) and GDP
growth (2010-2019) in Finland
Source: European Commission
Finland lost some ground in terms of GDP per capita (PPS) in comparison with EU average
between 2009 (119%) and 2016 (110%). The
country has experienced an overall reduction in the internal dispersion of GDP per capita, but this has happened through a downward convergence on the part of the capital region, rather than through a catch-up on the part of the poorest regions.
Graph A15.2: Labour productivity, EU-27, Finland´s
NUTS 2 regions, 2000-2019
(1) Unit: real GVA in MM EUR (2015 prices) by employment in thousands of persons. (2) The light red circle shows the capital city region. The blue circles show the remaining NUTS2 regions. (3) The green diamond shows the national average. The purple line shows the EU27 average. Source: European Commission
In 2019, national labour productivity was
above the EU average (at 132%), but has been decreasing during the last two decades (it was 139% in 2010 and 142% in 2000). The gap between the capital region and the remaining territories increased during the years of the recession, 2008-2010, revealing a greater strength of the socio-economic system of Helsinki-Uusimaa compared to the more peripheral and less populated areas of the country. Then the gap decreased to pre-crisis levels, mainly due to a worsening in the productivity of the capital region, especially after 2011, coinciding with the apex of
ANNEX 15: ECONOMIC AND SOCIAL PERFORMANCE AT REGIONAL LEVEL
Table A15.1: Finland, selected indicators at regional level
Source: Eurostat, *EDGAR Database.
NUTS 2 RegionGDP per head
(PPS)
Productivity
(GVA (PPS) per
person
employed)
Real
productivity
growth
GDP growthGDP per head
growth
Population
growth
Unemployment
rate
Employment in
high-
technology
sectors
CO2 emissions
from fossil
fuels per head
Innovation
performance
EU27=100, 2019 EU27=100, 2018
Avg % change on
preceding year,
2010-2019
Avg % change on
preceding year,
2010-2019
Avg % change on
preceding year,
2010-2019
Total % change,
2011-2019
% of active
population, 2020
% of total
employment,
2020
tCO2 equivalent,
2018
RIS regional
performance group
European Union 100 100 1.00 1.57 1.39 1.8 7.1 4.5 7.2
Suomi / Finland 111 105 0.49 1.12 0.78 2.8 7.8 6.6
Länsi-Suomi 98 98 0.40 0.63 0.41 1.4 7.7 4.5 7.7 Leader innovator -
Helsinki-Uusimaa 144 117 -0.05 1.37 0.45 10.2 7.2 10.2 9.9 Leader innovator +
Etelä-Suomi 99 101 1.00 0.99 0.92 -0.7 7.7 5.1 10.4 Strong innovator +
Pohjois- ja Itä-
Suomi93 97 0.95 1.34 1.35 -1.5 8.8 5.1 9.3 Strong innovator +
Åland 116 85 -0.51 -0.14 -0.79 6.7 3.8

52
the crisis of the Nokia company.
Graph A15.3: Territories most affected by climate
transition in Finland
Source: European Commission
Finland is one of the main producers and the
main consumer of peat in Europe. Essential reduction in the use of peat for energy contribute notably to Finland´s goal to achieve carbon neutrality by 2035. The European Commission has proposed the North and East Finland NUTS3-regions as the most affected by the transition from peat to carbon neutral energy production to be supported from the Just Transition Fund (JTF). Finland has asked for an extension of the territorial scope of JTF to include six more NUTS3-regions and four municipalities from Pirkanmaa NUTS3-region. The territorial Just Transition Plans will include measures to address the social, employment and demographic aspects of the transition.
The ICT-take up is high in Finland. In 2020, 88% of the population used Internet for interaction with public authorities against 56% on average in the EU. The capital region has a share of 93%, while it is only slightly lower in the other regions, with the lowest being in Pohjois- ja Itä-Suomi at 85%.
The Finnish regions have strong innovation
performance. Helsinki-Uusimaa and Länsi-Suomi belong to category of ‘leader innovators´, while Etelä-Suomi and Pohjois- ja Itä-Suomi are ´strong innovators. There are factors pointing to a reduced
capacity of the non-capital regions to intercept growth trends in dynamic and advanced sectors. For instance, the share of population aged 30-34 with a tertiary degree is more than 12 percentage points higher in the capital region than in the remaining regions on average (53% as against 40.8%, EU-average being 39.4%). Employment in high technology sectors, as well as total R&D expenditure, are twice as high in Helsinki-Uusimaa as in the rest of the country.
The Greater Helsinki region benefited from
lower unemployment and risk of poverty
rates than the non-capital regions in 2020. The unemployment rate at 7.2% in the capital region nevertheless exceeded the EU average of 7.1%. Both Länsi-Suomi and Etelä-Suomi had a little higher unemployment rate at 7.7%, while in Pohjois- ja Itä-Suomi it rose up to 8.8%. Demographic dynamics (see table 15.1) differ even more markedly between the capital region and the rest of the mainland Finland regions. Looking to the at risk of poverty rate (AROP), Finland performs better than the EU average (17,1% in 2020), but regional differences are significant with Pohjois- and Itä-Suomi region (15,9%) standing at almost 8,5 percentage points higher than the Helsinki-Uusimaa (7,4%) and 3,4 points higher than the Etelä-Suomi region (12.5%).
The COVID-19 pandemic affected all regions,
but to a different degree. In all regions, mortality between week 9 of 2020 and week 30 of 2021 was higher than average mortality in the same weeks of years 2015-2019. Such excess mortality varies considerably across regions, being above 9% in the capital, most densely populated region, that is more than twice as much as in the second most affected region Pohjois- ja Itä-Suomi (4%), and far more than in Länsi-Suomi and Åland (below 2%). The incidence of the pandemic is also reflected in the annual change in the share of persons usually working from home, which increased in 2020 by more than 18 percentage points in Helsinki-Uusimaa, while in other regions increased by 8 points.
The places hit most by the pandemic are not those, which suffer most in socio-economic
terms. In 2020, the unemployment rate increased more in Etelä-Suomi, Länsi-Suomi and Pohjois- ja Itä-Suomi than in the capital region (+2 percentage points as against +1 in the latter) compared to what would be expected based on the 2015-2019 trend. This points, again, to an overall

53
stronger socio-economic system in the capital region, more able to cope with the pandemic-induced economic crisis.

MACROECONOMIC STABILITY
ANNEX 16: KEY FINANCIAL SECTOR DEVELOPMENTS
54
This Annex provides an overview of key
developments in Finland’s financial sector. Finland has a big and heavily concentrated banking system. The ratio of total assets in relation to the country’s economic output is close to 300%, while the 5 top players own over 80% of total banking sector assets. The sector is efficient, competitive and invests heavily into IT systems to keep up with the newest technologies. Domestic banks have operations both in Finland and abroad. Their international exposure remains however mostly limited to the Nordic and Baltic regions. Overall, the sector has locally some 20 thousand employees.
Finnish lenders generated an 8.7% average
return on equity in 2021. Following the pandemic, the profitability of the banking sector rapidly recovered to reach pre-pandemic levels in 2021. This reflects the strengthening of the operating environment in Finland following the uncertainty-driven 2020. Finnish banks are well-capitalised – the capital adequacy ratio (CAR at 21.4%) belongs to the highest in the EU - while the share of problem loans is low, equivalent to just 1.2% of the loan portfolio.
Businesses are overall in good financial
health and households seized the opportunity of low interest rates to invest into real
estate assets. This is reflected in the dynamic lending growth trend (4.5% year-on-year growth).
Nevertheless, private debt (154.6% the GDP against a euro area average of 96%) and, household debt in particular, are high and remain a key structural vulnerability of the Finnish economy. This vulnerability in the household segment is somehow mitigated by the long maturities of mortgages (on average above 20 years), low interest burden and overall strong payment culture. Domestic banks continue to be reliant on wholesale funding (for over 40% of total assets), which in particular in crisis times may become an issue. Nevertheless, the loan to deposit ratio has been trending down over the past years, and reached 108.4%, down from close to 137% before the pandemic.
MACROECONOMIC STABILITY
ANNEX 16: KEY FINANCIAL SECTOR DEVELOPMENTS
Table A16.1: Financial soundness indicators
(1) Last data: Q3 2021. Source: ECB, Eurostat, Refinitiv.
2017 2018 2019 2020 2021
Total assets of the banking sector (% of GDP) 199.7 269.2 271.7 295.9 287.9
Share (total assets) of the five largest bank (%) 73.5 81.6 80.4 80.1 -
Share (total assets) of domestic credit institutions (%)146.0 89.2 88.0 86.5 84.5
Financial soundness indicators:1
- non-performing loans (% of total loans) 1.2 1.5 1.4 1.5 1.2
- capital adequacy ratio (%) 23.4 20.9 21.3 21.2 21.4
- return on equity (%) 8.8 8.1 4.9 5.8 8.7
NFC credit growth (year-on-year % change) 4.2 8.4 7.2 4.5 3.9
HH credit growth (year-on-year % change) 2.7 2.2 2.9 3.3 4.0
Cost-to-income ratio (%)1
55.7 55.4 60.7 55.6 50.0
Loan-to-deposit ratio (%)1
94.8 133.2 136.7 127.7 108.4
Central bank liquidity as % of liabilities 2.5 1.8 0.9 3.9 5.5
Private sector debt (% of GDP) 147.7 145.3 146.1 154.6 -
Long-term interest rate spread versus Bund (basis points) 23.1 26.6 31.9 29.0 27.8
Market funding ratio (%) 64.4 63.8 62.7 62.5 -
Green bond issuance (bn EUR) 1.4 0.6 3.4 3.9 4.5

ANNEX 17: TAXATION
55
This Annex provides an indicator-based
overview of Finland’s tax system. It includes information on the tax structure, i.e. the types of tax that Finland derives most revenue from, the tax burden for workers, and the progressivity and redistributive effect of the tax system. It also provides information on tax collection and compliance and on the risks of aggressive tax planning activity.
Finland’s tax revenues in relation to GDP are
relatively high, and the tax system relies
primarily on labour and consumption taxes. Finland has a relatively high taxation level which limits the room for further tax increases necessary to address faster growing government expenditure. In 2020, Finnish labour tax revenues as % of GDP were around the EU average. By contrast, consumption and environmental tax revenues as % of GDP were above the EU aggregate. Recurrent taxes on property are relatively low compared to the EU average.
Finland’s labour tax burden is around the EU
average for different wage levels. The labour tax wedge for Finland in 2021 was around the EU average at various wage levels, i.e. for single persons at the average wage (100%) as well as at 50%, 67%, and slightly higher for those at 167% of the average wage. Second earners at a wage level of 67% of the average wage, whose spouse earns the average wage, face a lower tax wedge compared to the EU average, and they are not taxed more heavily than single persons at the
same wage level. On the other hand, in 2020 the tax-benefit system helped reduce inequality as measured by the GINI coefficient, by more than the EU average.
Finland is doing well in terms of tax
administration. Outstanding tax arrears have declined slightly by 0.2 pp. to 5.0% of total revenue. This is significantly below the EU27 average of 31.8%, though that average is inflated by very large values in a few Member States. The VAT gap (an indicator of the effectiveness of VAT enforcement and compliance) has dropped by 1.1 pp to 2.9%, well below the EU-wide gap of 10.5%. Finally, the average forward-looking effective corporate income tax rates were close to the EU average in 2020.
ANNEX 17: TAXATION
Table A17.1: Indicators on taxation
(1) Forward-looking Effective Tax Rate (OECD). (*) EU-27 simple average, as no aggregated EU-27 value. Source: European Commission, Eurostat, OECD.
2010 2018 2019 2020 2021 2010 2018 2019 2020 2021
Total taxes (including compulsory actual social contributions) (% of
GDP)40.6 42.4 42.3 41.9 42.8 37.9 40.1 39.9 40.1
Labour taxes (as % of GDP) 21.1 21.0 21.0 20.9 20.0 20.7 20.7 21.5
Consumption taxes (as % of GDP) 12.9 14.2 14.0 14.1 10.8 11.1 11.1 10.8
Capital taxes (as % of GDP) 6.5 7.2 7.2 7.2 7.1 8.2 8.1 7.9
Total property taxes (as % of GDP) 1.1 1.5 1.6 1.6 1.9 2.2 2.2 2.3
Recurrent taxes on immovable property (as % of GDP) 0.6 0.8 0.8 0.8 1.1 1.2 1.2 1.2
Environmental taxes as % of GDP 2.7 2.9 2.8 2.7 2.4 2.4 2.4 2.2
Tax wedge at 50% of Average Wage (Single person) (*) 33.5 32.6 31.8 30.4 32.0 33.9 32.4 32.0 31.5 31.9
Tax wedge at 100% of Average Wage (Single person) (*) 42.3 42.6 42.2 41.4 42.7 41.0 40.2 40.1 39.9 39.7
Corporate Income Tax - Effective Average Tax rates (1) (*) 20.0 20.0 19.8 19.8 19.5 19.3
Difference in GINI coefficient before and after taxes and cash social
transfers (pensions excluded from social transfers)11.7 12.3 11.5 11.5 8.4 7.9 7.4 8.3
Outstanding tax arrears: Total year-end tax debt (including debt
considered not collectable) / total revenue (in %) (*)5.2 5.0 31.9 31.8
VAT Gap (% of VTTL) 4.0 2.9 11.2 10.5
Dividends, Interests and Royalties (paid and received) as a share of
GDP (%)8.7 7.5 6.6 10.7 10.5
FDI flows through SPEs (Special Purpose Entities), % of total FDI
flows (in and out)0.0 1.0 47.8 46.2 36.7
Tax structure
Progressivity &
fairness
Tax administration &
compliance
Financial Activity
Risk
Finland EU-27
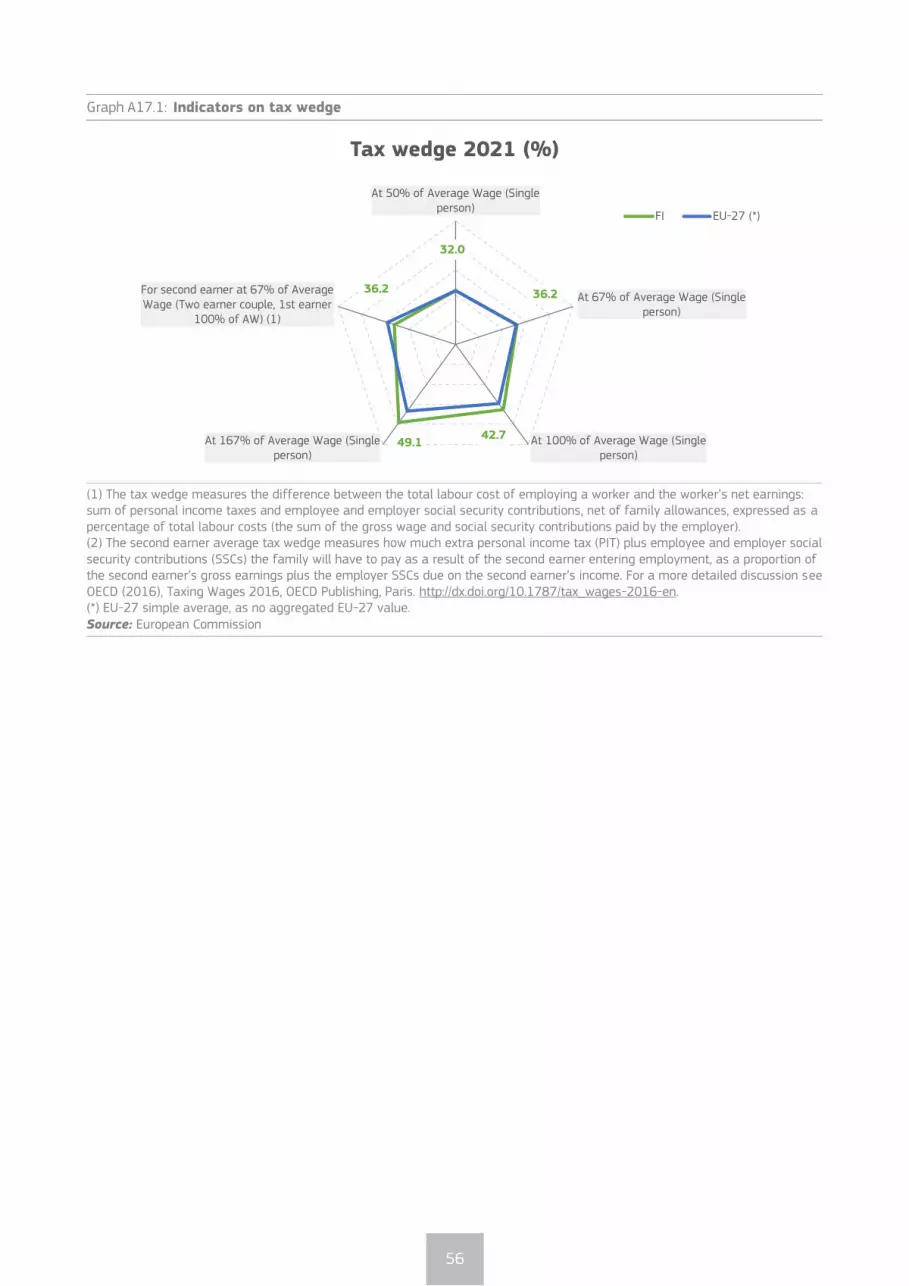
56
Graph A17.1: Indicators on tax wedge
(1) The tax wedge measures the difference between the total labour cost of employing a worker and the worker’s net earnings: sum of personal income taxes and employee and employer social security contributions, net of family allowances, expressed as a percentage of total labour costs (the sum of the gross wage and social security contributions paid by the employer). (2) The second earner average tax wedge measures how much extra personal income tax (PIT) plus employee and employer social security contributions (SSCs) the family will have to pay as a result of the second earner entering employment, as a proportion of the second earner’s gross earnings plus the employer SSCs due on the second earner’s income. For a more detailed discussion see OECD (2016), Taxing Wages 2016, OECD Publishing, Paris. http://dx.doi.org/10.1787/tax_wages-2016-en. (*) EU-27 simple average, as no aggregated EU-27 value. Source: European Commission
32.0
36.2
42.749.1
36.2
At 50% of Average Wage (Singleperson)
At 67% of Average Wage (Singleperson)
At 100% of Average Wage (Singleperson)
At 167% of Average Wage (Singleperson)
For second earner at 67% of AverageWage (Two earner couple, 1st earner
100% of AW) (1)
Tax wedge 2021 (%)
FI EU-27 (*)
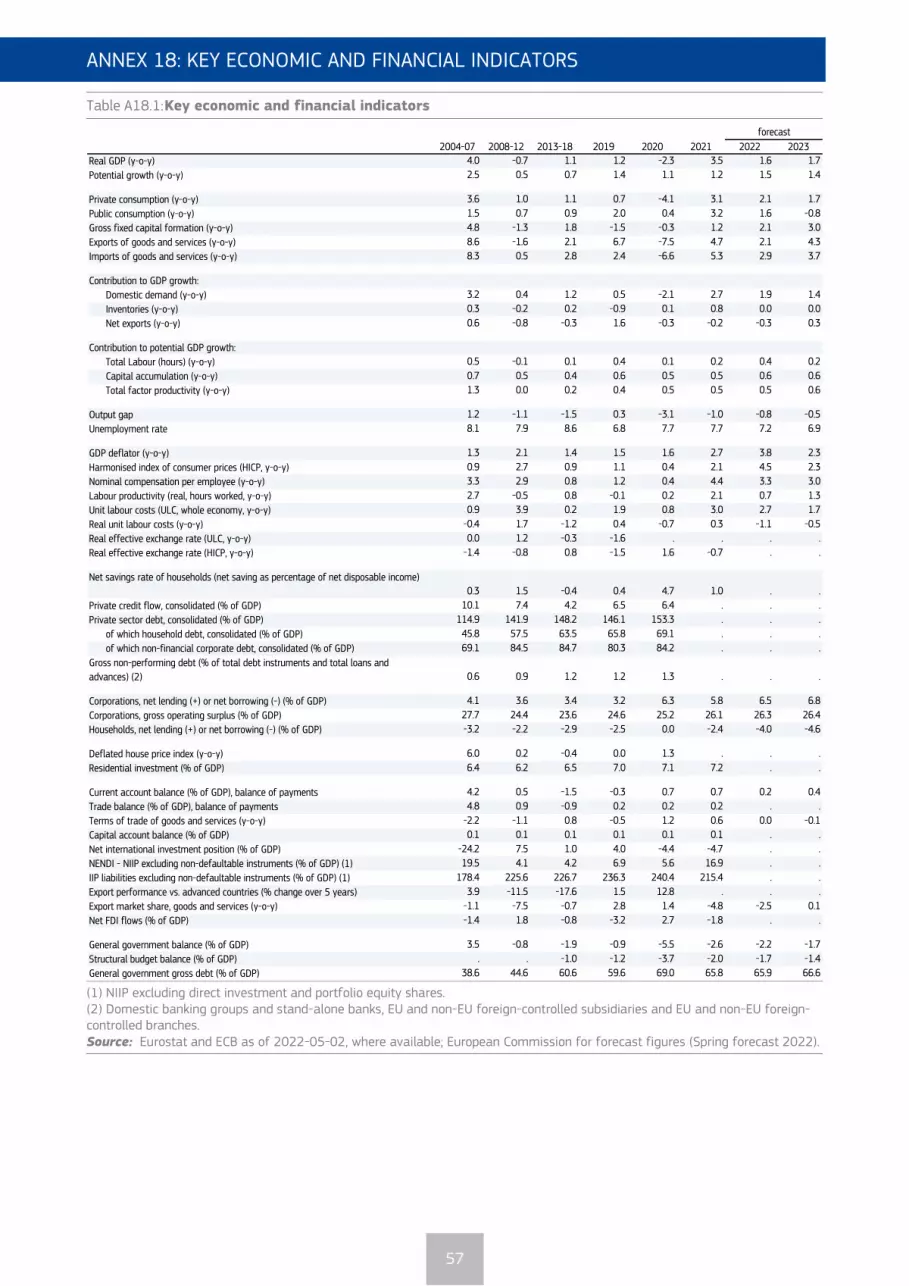
ANNEX 18: KEY ECONOMIC AND FINANCIAL INDICATORS
57
ANNEX 18: KEY ECONOMIC AND FINANCIAL INDICATORS
Table A18.1: Key economic and financial indicators
(1) NIIP excluding direct investment and portfolio equity shares. (2) Domestic banking groups and stand-alone banks, EU and non-EU foreign-controlled subsidiaries and EU and non-EU foreign-controlled branches. Source: Eurostat and ECB as of 2022-05-02, where available; European Commission for forecast figures (Spring forecast 2022).
2004-07 2008-12 2013-18 2019 2020 2021 2022 2023
Real GDP (y-o-y) 4.0 -0.7 1.1 1.2 -2.3 3.5 1.6 1.7
Potential growth (y-o-y) 2.5 0.5 0.7 1.4 1.1 1.2 1.5 1.4
Private consumption (y-o-y) 3.6 1.0 1.1 0.7 -4.1 3.1 2.1 1.7
Public consumption (y-o-y) 1.5 0.7 0.9 2.0 0.4 3.2 1.6 -0.8
Gross fixed capital formation (y-o-y) 4.8 -1.3 1.8 -1.5 -0.3 1.2 2.1 3.0
Exports of goods and services (y-o-y) 8.6 -1.6 2.1 6.7 -7.5 4.7 2.1 4.3
Imports of goods and services (y-o-y) 8.3 0.5 2.8 2.4 -6.6 5.3 2.9 3.7
Contribution to GDP growth:
Domestic demand (y-o-y) 3.2 0.4 1.2 0.5 -2.1 2.7 1.9 1.4
Inventories (y-o-y) 0.3 -0.2 0.2 -0.9 0.1 0.8 0.0 0.0
Net exports (y-o-y) 0.6 -0.8 -0.3 1.6 -0.3 -0.2 -0.3 0.3
Contribution to potential GDP growth:
Total Labour (hours) (y-o-y) 0.5 -0.1 0.1 0.4 0.1 0.2 0.4 0.2
Capital accumulation (y-o-y) 0.7 0.5 0.4 0.6 0.5 0.5 0.6 0.6
Total factor productivity (y-o-y) 1.3 0.0 0.2 0.4 0.5 0.5 0.5 0.6
Output gap 1.2 -1.1 -1.5 0.3 -3.1 -1.0 -0.8 -0.5
Unemployment rate 8.1 7.9 8.6 6.8 7.7 7.7 7.2 6.9
GDP deflator (y-o-y) 1.3 2.1 1.4 1.5 1.6 2.7 3.8 2.3
Harmonised index of consumer prices (HICP, y-o-y) 0.9 2.7 0.9 1.1 0.4 2.1 4.5 2.3
Nominal compensation per employee (y-o-y) 3.3 2.9 0.8 1.2 0.4 4.4 3.3 3.0
Labour productivity (real, hours worked, y-o-y) 2.7 -0.5 0.8 -0.1 0.2 2.1 0.7 1.3
Unit labour costs (ULC, whole economy, y-o-y) 0.9 3.9 0.2 1.9 0.8 3.0 2.7 1.7
Real unit labour costs (y-o-y) -0.4 1.7 -1.2 0.4 -0.7 0.3 -1.1 -0.5
Real effective exchange rate (ULC, y-o-y) 0.0 1.2 -0.3 -1.6 . . . .
Real effective exchange rate (HICP, y-o-y) -1.4 -0.8 0.8 -1.5 1.6 -0.7 . .
Net savings rate of households (net saving as percentage of net disposable income)0.3 1.5 -0.4 0.4 4.7 1.0 . .
Private credit flow, consolidated (% of GDP) 10.1 7.4 4.2 6.5 6.4 . . .
Private sector debt, consolidated (% of GDP) 114.9 141.9 148.2 146.1 153.3 . . .
of which household debt, consolidated (% of GDP) 45.8 57.5 63.5 65.8 69.1 . . .
of which non-financial corporate debt, consolidated (% of GDP) 69.1 84.5 84.7 80.3 84.2 . . .
Gross non-performing debt (% of total debt instruments and total loans and
advances) (2) 0.6 0.9 1.2 1.2 1.3 . . .
Corporations, net lending (+) or net borrowing (-) (% of GDP) 4.1 3.6 3.4 3.2 6.3 5.8 6.5 6.8
Corporations, gross operating surplus (% of GDP) 27.7 24.4 23.6 24.6 25.2 26.1 26.3 26.4
Households, net lending (+) or net borrowing (-) (% of GDP) -3.2 -2.2 -2.9 -2.5 0.0 -2.4 -4.0 -4.6
Deflated house price index (y-o-y) 6.0 0.2 -0.4 0.0 1.3 . . .
Residential investment (% of GDP) 6.4 6.2 6.5 7.0 7.1 7.2 . .
Current account balance (% of GDP), balance of payments 4.2 0.5 -1.5 -0.3 0.7 0.7 0.2 0.4
Trade balance (% of GDP), balance of payments 4.8 0.9 -0.9 0.2 0.2 0.2 . .
Terms of trade of goods and services (y-o-y) -2.2 -1.1 0.8 -0.5 1.2 0.6 0.0 -0.1
Capital account balance (% of GDP) 0.1 0.1 0.1 0.1 0.1 0.1 . .
Net international investment position (% of GDP) -24.2 7.5 1.0 4.0 -4.4 -4.7 . .
NENDI - NIIP excluding non-defaultable instruments (% of GDP) (1) 19.5 4.1 4.2 6.9 5.6 16.9 . .
IIP liabilities excluding non-defaultable instruments (% of GDP) (1) 178.4 225.6 226.7 236.3 240.4 215.4 . .
Export performance vs. advanced countries (% change over 5 years) 3.9 -11.5 -17.6 1.5 12.8 . . .
Export market share, goods and services (y-o-y) -1.1 -7.5 -0.7 2.8 1.4 -4.8 -2.5 0.1
Net FDI flows (% of GDP) -1.4 1.8 -0.8 -3.2 2.7 -1.8 . .
General government balance (% of GDP) 3.5 -0.8 -1.9 -0.9 -5.5 -2.6 -2.2 -1.7
Structural budget balance (% of GDP) . . -1.0 -1.2 -3.7 -2.0 -1.7 -1.4
General government gross debt (% of GDP) 38.6 44.6 60.6 59.6 69.0 65.8 65.9 66.6
forecast

ANNEX 19: DEBT SUSTAINABILITY ANALYSIS
58
This annex assesses fiscal sustainability
risks for Finland over the short, medium and
long term. It follows the same multi-dimensional approach as the 2021 Fiscal Sustainability Report, updated on the basis of the Commission 2022 spring forecast.
Table 1 presents the baseline debt
projections. It shows the projected government debt and its breakdown into the primary balance, the snowball effect (the combined impact of interest payments and nominal GDP growth on the debt dynamics) and the stock-flow adjustment. These projections assume that no new fiscal policy measures are taken after 2023, and include the expected positive impact of investments under Next Generation EU.
Graph 1 shows four alternative scenarios around the baseline, to illustrate the impact
of changes in assumptions. The ‘historical SPB’ scenario assumes that the structural primary balance (SPB) gradually returns to its past average level. In the ‘lower SPB’ scenario, the SPB is permanently weaker than in the baseline. The ‘adverse interest-growth rate’ scenario assumes a less favourable snowball effect than in the
baseline. In the ‘financial stress’ scenario, the country temporarily faces higher market interest rates in 2022.
Graph 2 shows the outcome of the stochastic
projections. These projections show the impact on debt of 2 000 different shocks affecting the government’s budgetary position, economic growth, interest rates and exchange rates. The cone covers 80% of all the simulated debt paths, therefore excluding tail events.
Table 2 shows the S1 and S2 fiscal
sustainability indicators and their main
drivers. S1 measures the consolidation effort needed to bring debt to 60% of GDP in 15 years. S2 measures the consolidation effort required to stabilise debt over an infinite horizon. The initial budgetary position measures the effort required to cover future interest payments, the ageing costs component accounts for the need to absorb the projected change in ageing-related public expenditure such as pensions, health care and long-term care, and the debt requirement measures the additional adjustment needed to reach the 60% of GDP debt target.
ANNEX 19: DEBT SUSTAINABILITY ANALYSIS
Table A19.1: Heat map of fiscal sustainability risks for Finland
Source: European Commission
Table 1. Baseline debt projections 2019 2020 2021 2022 2023 2024 2025 2026 2027 2028 2029 2030 2031 2032Gross debt ratio (% of GDP) 59.6 69.0 65.8 65.9 66.6 66.1 65.4 64.7 64.3 63.9 63.7 63.3 62.9 62.5Change in debt -0.2 9.4 -3.2 0.1 0.7 -0.5 -0.7 -0.7 -0.4 -0.4 -0.3 -0.4 -0.4 -0.4
of whichPrimary deficit 0.1 4.8 2.1 1.7 1.2 1.2 1.2 1.1 1.2 1.3 1.3 1.4 1.4 1.4Snowball effect -0.8 1.1 -3.6 -2.9 -2.0 -1.7 -1.8 -1.8 -1.6 -1.6 -1.6 -1.8 -1.8 -1.7Stock-flow adjustment 0.5 3.4 -1.7 1.3 1.5 0.0 0.0 0.0 0.0 0.0 0.0 0.0 0.0 0.0
Gross financing needs (% of GDP) 7.6 18.8 7.2 9.6 9.6 8.5 8.6 8.6 8.8 9.1 9.3 9.5 9.6 9.6
S1 S2Overall index (pps. of GDP) 0.0 3.1
of whichInitial budgetary position -0.9 1.2Debt requirement 0.5Ageing costs 0.4 2.0
of which Pensions -0.1 0.4Health care 0.3 0.7Long-term care 0.6 1.7Others -0.4 -0.8
Table 2. Breakdown of the S1 and S2 sustainability gap indicators
45
50
55
60
65
70
75
80
85
2019 2021 2023 2025 2027 2029 2031
Baseline Historical SPB scenarioLower SPB scenario Financial stress scenarioAdverse 'r-g' scenario
Graph 1. Deterministic debt projections (% of GDP)
p10-p20
p20-p40
p40-p60
p60-p80
p80-p90
45
55
65
75
85
2019 2020 2021 2022 2023 2024 2025 2026
Graph 2. Stochastic debt projections (% of GDP)
Median Baseline

59
Finally, the heat map presents the overall
fiscal sustainability risk classification
(Table A19.2). The short-term risk category is based on the S0 indicator, an early-detection indicator of fiscal stress in the upcoming year. The medium-term risk category is derived from the debt sustainability analysis (DSA) and the S1 indicator. The DSA assesses risks to sustainability based on several criteria: the projected debt level in 10 years’ time, the debt trajectory (‘peak year’), the plausibility of fiscal assumptions and room for tighter positions if needed (‘fiscal consolidation space’), the probability of debt not stabilising in the next 5 years and the size of uncertainty. The long-term risk category is based on the S2 indicator and the DSA.
Overall, short-term risks to fiscal
sustainability are low. The Commission’s early-detection indicator (S0) does not signal major short-term fiscal risks (Table A19.2).
Medium-term risks to fiscal sustainability are medium. On the one hand, the debt sustainability analysis (DSA) points to low risks. In the baseline, government debt is projected to decline steadily from 66% of GDP in 2022 to 62% of GDP in 2032 (Table 1). This debt path is rather robust to possible shocks to fiscal, macroeconomic and financial variables, as illustrated by alternative scenarios and stochastic simulations, all pointing to low risks (Table A19.1 and A19.2). On the other hand, the sustainability gap indicator S1 signals medium risks, as a (very) small fiscal adjustment would be needed to reduce debt to 60% of GDP in 15 years’ time (Table 2). Overall,
the medium risks reflect the current deficit, moderate debt level and the projected increase in public expenditure on long-term care.
Long-term risks to fiscal sustainability are
medium. Over the long term, the sustainability gap indicator S2 (at 3.1 pps. of GDP) points to medium risks, while the DSA points to low risks, leading to the overall medium risk assessment. The S2 indicator suggests that, to stabilise debt over the long term, it will be necessary to address budgetary pressures on long-term care and health care stemming from population ageing (Table 2).
Table A19.2: Heat map of fiscal sustainability risks for Finland
(1) Debt level in 2032: green: below 60% of GDP, yellow: between 60% and 90%, red: above 90%. (2) The debt peak year indicates whether debt is projected to increase overall over the next decade. Green: debt peaks early; yellow: peak towards the middle of the projection period; red: late peak. (3) Fiscal consolidation space measures the share of past fiscal positions in the country that were more stringent than the one assumed in the baseline. Green: high value, i.e. the assumed fiscal position is plausible by historical standards and leaves room for corrective measures if needed; yellow: intermediate; red: low. (4) Probability of the debt ratio exceeding in 2026 its 2021 level: green: low probability, yellow: intermediate, red: high (also reflecting the initial debt level). (5) The difference between the 90th and 10th percentiles measures uncertainty, based on the debt distribution under 2000 different shocks. Green, yellow and red cells indicate increasing uncertainty. Source: European Commission (for further details on the Commission’s multi-dimensional approach, see the 2021 Fiscal
Sustainability Report).
BaselineHistorical
SPB
Lower
SPB
Adverse
'r-g'
Financial
stress
Overall LOW LOW LOW LOW LOW LOW
Debt level (2032), % GDP 62 52 65 67 63Debt peak year 2023 2023 2023 2023 2023Fiscal consolidation space 92% 67% 93% 92% 92%Probability of debt ratio exceeding in 2026 its 2021 level 44%Difference between 90th and 10th percentiles (pps. GDP) 24
Short term Medium term Long term
Overall (S0)
Overall (S1+DSA)
S1
Debt sustainability analysis (DSA)
S2Overall
(S2+DSA)Overall
MEDIUM MEDIUM
Deterministic scenariosStochastic
projections
LOW MEDIUM MEDIUM LOW


