Embed Size (px)
Citation preview

Republic of the Philippines
Philippine Statistics AuthorityRegional Statistical Services Office V
RegionalSocial andEconomic
TrendsBicol Region
2021ISSN-0119-4003

About the coverThe cover of the Regional Social and Economic Trends (RSET) has been redesigned to reflect the establishment of the PhilippineStatistics Authority which merged the National Statistical Coordination Board, National Statistics Office, Bureau of AgriculturalStatistics and Bureau of Labor and Employment Statistics.The photomontage represents the various sectors featured in the RSET chapters. The photos showcase the products and developmentsin Bicol region. Meanwhile, the circles symbolize the continued release of the RSET which remains as a reliable source of officialstatistics that are useful for strategic planning, policy, program and project formulation, business and investment decision-making,research and feasibility studies, and media news articles and investigative stories.
(Credits to the owners of the photos)

2021 Regional
Social and Economic Trends
Bicol Region
Republic of the Philippines Philippine Statistics Authority Regional Statistical Services Office V

The Regional Social and Economic Trends (RSET), Bicol Region is an annual publication prepared by the Regional Statistical Services Office V of the
PHILIPPINE STATISTICS AUTHORITY (PSA).
TERMS OF USE OF PSA PUBLICATIONS The PSA reserves its exclusive right to reproduce all its publications in whatever form. Any part of this publication should not be reproduced, recopied, lend or repackaged for other parties for any commercial purposes without written permission from the PSA. Any part of this publication may only be reproduced for internal use of the recipient/customer company. Should any portion of the data in this publication are to be included in a report/article, the source of the data, the title of the publication and the PSA as publisher should always be cited. Any information derived from the manipulation of data contained in the publication will no longer be the responsibility of PSA.
ISSN 0119-4003
Published by the Philippine Statistics Authority
Regional Statistical Services Office V PSA V Building, Regional Center Site, Brgy. 42 Rawis
Legazpi City 4500 Philippines
The RSET (Bicol Region) is available in printed and electronic formats (Excel/Word/PDF).
Back issues of this publication are available for purchase. For inquiries, please contact us at 4817479; 7420337
or at [email protected]

FOREWORD Now on its 26th edition, the Regional Social and Economic Trends (RSET) for the Bicol Region, has proven to be very useful for planning and decision-making and for setting policies towards effective governance and improved service delivery at the local level. The Philippine Statistics Authority (PSA), through its Regional Statistical Services Offices (RSSOs) in its commitment to widely disseminate information produced by the Philippine Statistical System, continues to update and publish local level statistics designed to address the varied statistical needs of planners and policy makers at the local level. The RSET, a compendium of local level statistics, presents annual time series data on various sectors of the region and its component provinces, cities, and municipalities. It also contains data that are disaggregated in different dimensions and includes a glossary of terms of official concepts and definitions for statistical purposes. We acknowledge the valuable contributions of our various data sources without which the publication of the RSET would not have been made possible. We likewise appreciate the support of our clients who continue to patronize and recognize this publication as an important tool for evidence-based decision making. We reiterate our call on our partner agencies to continue our collaboration towards the empowerment of the countryside by making statistics more available and accessible to users. To continue improving our statistical products and services, we enjoin both our data sources and users to share their comments and suggestions to guide us in improving future editions of the RSET and other publications of the PSA.
DENNIS S. MAPA, Ph.D. Undersecretary
National Statistician and Civil Registrar General
October 2021

Foreword iii
PSA Officials vi
List of Data Sources vii
Standard Symbols Used vii
Figure References viii
Summary of Major Statistical Series 1
Overview of the Region 12
Chapter 1 POPULATION and HOUSING 1 - 1
Chapter 2 INCOME and PRICES 2 - 1
Chapter 3 ECONOMIC ACCOUNTS 3 - 1
Chapter 4 ENVIRONMENT and NATURAL RESOURCES 4 - 1
Chapter 5 AGRICULTURE and AGRARIAN REFORM 5 - 1
Chapter 6 ESTABLISHMENT CHARACTERISTICS: INDUSTRIAL SECTOR 6 - 1
Chapter 7 TRADE 7 - 1
Chapter 8 TOURISM 8 - 1
Chapter 9 VITAL, HEALTH and NUTRITION STATISTICS 9 - 1
Chapter 10 EDUCATION 10 - 1
Chapter 11 LABOR and EMPLOYMENT 11 - 1
Chapter 12 SOCIAL SERVICES 12 - 1
Chapter 13 TRANSPORTATION and COMMUNICATION 13 - 1
Chapter 14 ENERGY and WATER RESOURCES 14 - 1
Chapter 15 PUBLIC ADMINISTRATION 15 - 1
Chapter 16 MONEY and BANKING 16 - 1
Chapter 17 PUBLIC ORDER, SAFETY and JUSTICE 17 - 1
Appendix
Glossary of Terms Appendix - 1
CONTENTS
v

vi
Republic of the Philippines
THE PHILIPPINE STATISTICS AUTHORITY OFFICIALS
CLAIRE DENNIS S. MAPA, Ph. D. Undersecretary
National Statistician and Civil Registrar General
Deputy National Statisticians
ASEC. LEO B. MALAGAR USEC. CLAIRE DENNIS S. MAPA, Ph. D. Civil Registration and
Central Support Office
Concurrent - Sectoral Statistics Office
MINERVA ELOISA P. ESQUIVIAS ASEC. ROSALINDA P. BAUTISTA OIC - Censuses and Technical
Coordination Office
Philippine Identification System (PhilSys) – Registry Office
Assistant National Statisticians
Marizza B. Grande OIC - Civil Registration Service
Socrates L. Ramores Finance and Administrative Service
Wilma A. Guillen Social Sector Statistics Service
Divina Gracia L. Del Prado Economic Sector Statistics Service
Vivian R. Ilarina Macroeconomic Accounts Service
Florante C. Varona OIC - National Censuses Service
Severa B. De Costo OIC - Standards Service
Cesar Reynaldo V. Vinuya Information Technology and Dissemination Services
Editha R. Orcilla Policy, Coordination
and Monitoring Service
Edgar M. Fajutagana Registration and Systems Management Service
Plenee Grace J. Castillo Interim – Community-Based Statistics Service
Regional Director
Cynthia L. Perdiz Regional Statistical Services Office V
* As of October 2021

LIST OF DATA SOURCES
Bangko Sentral ng Pilipinas Department of Public Works and Highways
Bureau of Internal Revenue Department of Social Welfare and Development
Bureau of Local Government Finance, Department of Tourism
Department of Finance Department of Trade and Industry
Commission on Higher Education Department of Transportation and Communication
Cooperative Development Authority Civil Aviation Authority of the Philippines
Department of Agrarian Reform Land Transportation Franchising and
Department of Budget and Management Regulatory Board
Department of Education Land Transportation Office
Department of Energy National Telecommunications Commission
Energy Policy and Planning Bureau Telecommunications Office
Department of Environment and Natural Resources National Electrification Administration
Forest Management Bureau National Grid Corporation of the Philippines
Land Management Bureau National Irrigation Administration
Mines and Geo-Sciences Bureau National Nutrition Council
Department of Health Philippine Ports Authority
Department of the Interior and Local Government Philippine Statistics Authority
Bureau of Fire Protection Public Attorney's Office, Department of Justice
Bureau of Jail Management and Penology Securities and Exchange Commission
Philippine National Police
Department of Labor and Employment
Bureau of Labor Relations
National Conciliation and Mediation Board
STANDARD SYMBOLS USED
SYMBOL MEANING
1. SY School Year
2. n.e.s. Not Elsewhere Stated
3. n.e.c. Not Elsewhere Classified
4. p Preliminary
5. r Revised
6. ... Data Not Available
7. - (dash) Nil or Zero
8. .. Not Applicable
9. ( - ) Negative
10. * Less than half the unit employed
vii

FIGURE REFERENCES
Figure ReferenceNumber Table Number
1.1 Population of Region V Provinces, Census Years 2000 - 2020 1.1
1.2 Population Distribution by Province, Region V, Census Year 2020 1.2
1.3 Land Area and Population Density by Province, Region V, Census Year 2020 1.3
1.4 Population Pyramid in Region V, Census Year 2015 1.5
1.5 Number of Households and Average Household Size, Region VCensus Years 2000 - 2015 1.13
1.6 Distribution of Households by Tenure Status of the Housing UnitRegion V, Census Year 2015 1.15B
1.7 Distribution of Households by Type of Building, Region VCensus Year 2015 1.16B
1.8 Distribution of Households by Main Source of Water Supply For DrinkingRegion V, Census Year 2015 1.21
1.9 Distribution of Households by Usual Manner of Garbage DisposalRegion V, Census Year 2010 1.24
2.1 Total Number of Families, Average Family Income and Expenditure by Income ClassRegion V, 2018 2.2
2.2 Average Annual Family Income and Expenditure by Province, Region V, 2018 2.5
2.3 Distribution of Total Family Income by Income Decile, Region V, 2015 and 2018 2.7
2.4 Distribution of Total Family Expenditure by Expenditure Group, Region V, 2018 2.9D
2.5 Total Family Expenditure by Income Class, Region V, 2012, 2015 and 2018 2.9B, 2.9C, & 2.9D
2.6 Consumer Price Index and Inflation Rate by Province, 2020 2.12A
2.7 Consumer Price Index and Inflation Rate, Region V, 2014 - 2020 2.12A
2.8 Annual Poverty Incidence of Families by Province, 2012, 2015 and 2018 2.10A
3.1 Gross Regional Domestic Product, Growth Rates by Industry, At Constant2018 Prices, Region V, 2019 - 2020 3.3B
3.2 Distribution of Gross Regional Domestic Product by Industry, At Constant2018 Prices, Philippines and Region V, 2020 3.1B & 3.3B
3.3 Gross Regional Domestic Product, Growth Rates by Region, At Constant2018 Prices, Philippines, 2020 3.2B
3.4 Per Capita Gross Regional Domestic Product by Region, At Constant2018 Prices, Philippines, 2020 3.4B
4.1 Status of Land Classification, Region V, 2016 - 2020 4.1
4.2 Land Distribution by Province, Region V, 2020 4.1
5.1 Distribution of Total Farm Area, Region V, 2012 5.1A
5.2 Total Area of Farms by Province, 1991, 2002, and 2012 5.1A
5.3 Palay Production and Area Harvested, Region V, 2016 - 2020 5.3A
5.4 Palay Production and Area Harvested by Province, 2020 5.3A
viii
Title

FIGURE REFERENCES
Figure ReferenceNumber Table Number
Title
5.5 Palay Production by Type of Farm, Region V, 2016 - 2020 5.3B
5.6 Palay Production by Type of Farm, by Province, 2020 5.3B
5.7 Corn Production and Area Harvested, Region V, 2016 - 2020 5.4A
5.8 Corn Production and Area Harvested by Province, 2020 5.4A
5.9 Corn Production by Cropping Season, Region V, 2016 - 2020 5.4B
5.10 Corn Production by Cropping Season, by Province, 2020 5.4B
5.11 Production of Major Crops by Type of Crop, Region V, 2015 - 2020 5.5A
5.12 Fish Production by Type of Production, Region V, 2011-2020 5.8
5.13 Fish Production by Type of Production and Province, 2020 5.8
5.14 Distribution of Registered/Confirmed Cooperatives by Type, Region V, 2020 5.11
6.1 Number of Establishments and Total Employment by Province, Region V, 2016 6.1
6.2 Floor Area of Private Building Construction by Type of Construction,Region V, 2016 - 2020 6.2
6.3 Annual Business Name Registration, Region V, 2017 - 2020 6.3
6.4 Generated Paid-Up Capital of Stock/Non-Stock Corporations and PartnershipsRegion V, 2015 - 2019 6.5
6.5 Value of Private Building Construction by Construction Type and 6.2by Province, Region V, 2020
7.1 Volume of Air Trade in Region V, 2010 - 2014 7.1
7.2 Value of Commodity Flow by Mode of Transport, Region V, 2010 - 2014 7.3
7.3 Volume of Commodity Flow in Region V, 2010 - 2014 7.4
7.4 Value of Exports and Imports, Region V, 2013 - 2019 7.5
7.5 Distribution of Exports by Continent, Region V, 2019 7.6
7.6 Distribution of Imports by Continent, Region V, 2019 7.6
8.1 Distribution of Visitor Arrivals, Domestic and Foreign by Country of Residence,Region V, 2019 8.1
8.2 Visitor Arrivals by Province, Domestic and Foreign, Region V, 2019 8.2
8.3 Visitor Arrivals, Domestic and Foreign, Region V, 2011 - 2019 8.1
8.4 Number of Hotels/Accommodation Establishments and Hotel/AccommodationRooms by Province, Region V, 2020 8.3
9.1 Nutritional Status of Pre-Schoolers by Province, 2018 9.7A
9.2 Coverage of Fully Immunized Children by Province/City, 2018 9.9
10.1 Number of Teachers in Public Elementary Schools by Schools Division,Region V, SY 2019-2020 to SY 2020-2021 10.2
11.1 Labor Force and Employment Status, Region V, October 2016 - 2020 11.1
11.2 Labor Force Participation Rate, Employment Rate and Unemployment Rate,Region V, October 2016 - 2020 11.2
ix

FIGURE REFERENCES
Figure ReferenceNumber Table Number
Title
11.3 Distribution of Employed Persons by Major Industry Group and Sex,Region V, October 2020 11.3
11.4 Employed Persons by Class of Worker and Sex, Region V, October 2020 11.3
11.5 Distribution of Employed Persons by Sex and Major Occupation Group ,Region V, October 2020 11.5B
11.6 Percentage Distribution of Overseas Filipino Workers by Sex, Region V,2014 - 2018 11.7
11.7 Distribution of Employed Persons by Highest Grade Completed and Sex,Region V, October 2018 11.6A
11.8 Distribution of Employed Persons by Highest Grade Completed and Sex,Region V, October 2020 11.6B
11.9 Number and Membership of Existing Labor Unions/Organizations,Region V, 2015 - 2019 11.9
12.1 Women in Especially Difficult Circumstances, Region V, 2020 12.2
12.2 Children Sexually Abused, Region V, 2020 12.3A
12.3 Household Population 5 Years Old and Over with at Least One Type of 12.5BFunctional Disability by Sex and Province, 2010
13.1 Registered Motor Vehicles by Classification, Region V, 2018 - 2020 13.1A
13.2 Existing National Road Length by Surface Type, Region V, 2015 - 2019 13.6
13.3 Total Cargo Throughput, Region V, 2020 13.9
13.4 Total Passenger Traffic, Region V, 2016 - 2020 13.9
13.5 Number of Existing Cell Sites by Province, 2020 13.15
13.6 Distribution of Telephone Lines by Province, 2020 13.11
13.7 Number of Licensed Radio Stations by Type of Station, Region V, 2017 - 2020 13.10
14.1 Energy Generation and Sales by Power Generating Plants, Region V, 2013 - 2020 14.1
14.2 Energization Coverage by Province, As of December 31, 2020 14.2
14.3 Percentage of Residential Service Connections by Electric Cooperative, Region V, 2020 14.5
14.4 Percentage of Residential Power Distribution by Electric Cooperative,Region V, 2020 14.4
14.5 Service Area of Existing Irrigation Systems, Region V, 2011 - 2020 14.7 & 14.8
15.1 Expenditure Program of Provincial and City Governments, Region V, 2019 15.3
15.2 Distribution of Income of Municipal Governments by Province, 2019 15.4
16.1 Number and Type of Banking Institutions, Region V, 2016 - 2020 16.1
16.2 Distribution of Loan Portfolio of Banking Offices, Region V, 2020 16.4
16.3 Deposit Liabilities of Banking Offices, Region V, 2016 - 2020 16.2
17.1 Crime Incidence by Type of Crime and Province, Region V, 2020 17.1
17.2 Fire Incidence, Deaths and Injuries, Region V, 2011 - 2020 17.3
x

SUMMARY OF MAJOR
STATISTICAL SERIES

SUMMARY OF MAJOR STATISTICAL SERIES: REGION V
Latest Data Compared toStatistical Series Reference Reference
Period Period
Chapter 1. Population and Housing
1. Total Population May 1, 2020 6,082,165 Aug. 1, 2015 5,796,989 4.9
2. Population Density May 1, 2020 336 Aug. 1, 2015 320 4.9 (Persons per Square Kilometer)
3. Provincial Population
Albay May 1, 2020 1,374,768 Aug. 1, 2015 1,314,826 4.6 Camarines Norte May 1, 2020 629,699 Aug. 1, 2015 583,313 8.0 Camarines Sur May 1, 2020 2,068,244 Aug. 1, 2015 1,952,544 5.9 Catanduanes May 1, 2020 271,879 Aug. 1, 2015 260,964 4.2 Masbate May 1, 2020 908,920 Aug. 1, 2015 892,393 1.9 Sorsogon May 1, 2020 828,655 Aug. 1, 2015 792,949 4.5
4. City Population
Iriga City May 1, 2020 114,457 Aug. 1, 2015 111,757 2.4 Legazpi City May 1, 2020 209,533 Aug. 1, 2015 196,639 6.6 Ligao City May 1, 2020 118,096 Aug. 1, 2015 111,399 6.0 Masbate City May 1, 2020 104,522 Aug. 1, 2015 95,389 9.6 Naga City May 1, 2020 209,170 Aug. 1, 2015 196,003 6.7 Sorsogon City May 1, 2020 182,237 Aug. 1, 2015 168,110 8.4 Tabaco City May 1, 2020 140,961 Aug. 1, 2015 133,868 5.3
5. Number of Households Aug. 1, 2015 1,216,421 May 1, 2010 1,111,753 9.4
6. Household Size Aug. 1, 2015 4.8 May 1, 2010 4.9 (2.4)
7. Occupied Housing Units May 1, 2010 1,102,228 May 1, 2000 883,175 24.8
Chapter 2. Income and Prices
1. Family IncomeTotal (Million Pesos) 2018 300,778 2015 236,476 27.2 Average (Thousand Pesos) 2018 235 2015 187 25.6
2. Family ExpendituresTotal (Million Pesos) 2018 247,626 2015 202,469 22.3 Average (Thousand Pesos) 2018 193 2015 160 20.9
3. Annual Per Capita PovertyThreshold (Pesos) 2018 24,461 2015 22,503 8.7
4. Poverty Incidence (Percent)Families 2018 20.0 2015 31.0 (11.0) Population 2018 27.0 2015 39.8 (12.9)
5. Consumer Price Index (2012=100)Region V 2020 126.4 2019 121.3 4.2 Albay 2020 128.6 2019 121.0 6.3 Camarines Norte 2020 130.7 2019 125.5 4.1 Camarines Sur 2020 127.9 2019 123.5 3.6 Catanduanes 2020 125.4 2019 118.6 5.7 Masbate 2020 123.8 2019 121.7 1.7 Sorsogon 2020 118.7 2019 114.1 4.0
Value Value Percent Change
3

SUMMARY OF MAJOR STATISTICAL SERIES: REGION V
Latest Data Compared toStatistical Series Reference Reference
Period PeriodValue Value
Percent Change
Chapter 3. Economic Accounts
1. Gross Regional Domestic Product (Thousand Pesos)
At Current PricesGross Regional Domestic Product 2020 515,793,741 2019 560,835,429 (8.0) Agriculture, Forestry, & Fishing 2020 89,080,182 2019 85,787,072 3.8 Industry 2020 165,557,201 2019 203,554,535 (18.7) Services 2020 261,156,359 2019 271,493,822 (3.8)
At Constant 2018 PricesGross Regional Domestic Product 2020 517,464,559 2019 564,941,774 (8.4) Agriculture, Forestry, & Fishing 2020 92,558,526 2019 93,731,957 (1.3) Industry 2020 176,908,632 2019 204,768,924 (13.6) Services 2020 247,997,401 2019 266,440,892 (6.9)
2. Per Capita GRDP (Pesos)At Current Prices 2020 84,090 2019 92,373 (9.0) At Constant 2018 Prices 2020 84,362 2019 93,050 (9.3)
3. Household Final Consumption Expenditure on GRDP (Thousand Pesos)At Current Prices 2020 575,210,210 2019 604,161,059 (4.8) At Constant 2018 Prices 2020 544,797,915 2019 595,337,807 (8.5)
4. Per Capita Household Final Consumption Expenditure (Pesos)At Current Prices 2020 93,777 2019 99,509 (5.8) At Constant 2018 Prices 2020 88,818 2019 98,056 (9.4)
Chapter 4. Environment and Natural Resources
1. Total Land Area (Hectares) 2020 1,763,249 2019 1,763,249 -
Alienable and Disposable 2020 1,222,060 2019 1,222,060 - Forest Lands 2020 541,189 2019 541,189 -
2. Volume of Gold Production (Kg) 2020 6,367.1 2019 6,760.6 (5.8)
Chapter 5. Agriculture and Agrarian Reform
1. Crop Production (Metric Tons)
Palay 2020 1,294,991 2019 1,192,904 8.6 Corn 2020 282,001 2019 248,243 13.6 Abaca 2020 28,089 2019 28,939 (2.9) Banana 2020 64,350 2019 78,179 (17.7) Coconut 2020 1,150,857 2019 1,246,479 (7.7) Pineapple 2020 164,162 2019 163,275 0.5 Sugarcane 2020 205,029 2019 181,898 12.7
2. Crop Area Harvested (Hectares)
Palay 2020 346,629 2019 341,731 1.4 Corn 2020 106,985 2019 105,067 1.8 Abaca 2020 43,130 2019 43,160 (0.1) Banana 2020 19,017 2019 19,247 (1.2) Coconut 2020 453,995 2019 453,994 0.0 Pineapple 2020 4,609 2019 4,612 (0.1) Sugarcane 2020 3,937 2019 3,910 0.7
4

SUMMARY OF MAJOR STATISTICAL SERIES: REGION V
Latest Data Compared toStatistical Series Reference Reference
Period PeriodValue Value
Percent Change
3. Livestock and Poultry Inventory (Heads)
Carabao As of Jan. 1 2021 325,063 As of Jan. 1 2020 316,528 2.7 Cattle As of Jan. 1 2021 110,802 As of Jan. 1 2020 112,581 (1.6) Goat As of Jan. 1 2021 164,053 As of Jan. 1 2020 159,631 2.8 Swine As of Jan. 1 2021 763,640 As of Jan. 1 2020 891,457 (14.3) Chicken As of Jan. 1 2021 8,884,399 As of Jan. 1 2020 8,751,535 1.5 Duck As of Jan. 1 2021 687,240 As of Jan. 1 2020 578,444 18.8
4. Fish Production (Metric Tons) 2020 238,848 2019 237,513 0.6
Commercial Fishing 2020 57,880 2019 41,364 39.9 Municipal Fishing 2020 126,392 2019 125,083 1.0 Aquaculture 2020 54,576 2019 71,066 (23.2)
5. Agrarian Reform Accomplishment
Land Distribution (Hectares) 2020 2,883.2 2019 4,505.7 (36.0) Number of Beneficiaries 2020 1,496 2019 2,231 (32.9)
Chapter 6. Establishment Characteristics: Industrial Sector
1. Private Building Construction
Total Number 2020 1,979 2019 4,011 (50.7) Floor Area (sq.m.) 2020 415,254 2019 970,635 (57.2) Value (Thousand Pesos) 2020 5,113,782 2019 11,541,822 (55.7)
Residential Number 2020 1,356 2019 2,688 (49.6)
Floor Area (sq.m.) 2020 192,797 2019 354,033 (45.5) Value (Thousand Pesos) 2020 2,200,142 2019 3,797,469 (42.1)
Non-Residential Number 2020 511 2019 1,027 (50.2) Floor Area (sq.m.) 2020 218,941 2019 606,823 (63.9) Value (Thousand Pesos) 2020 2,516,857 2019 7,009,792 (64.1)
Additions/Alterations and Repairs Number 2020 112 2019 296 (62.2) Floor Area (sq.m.) 2020 3,516 2019 9,779 (64.0) Value (Thousand Pesos) 2020 396,782 2019 734,561 (46.0)
2 Business Name Registered 2020 36,549 2019 23,309 56.8
Chapter 7. Trade
1. Commodity Flow by Mode
Air Inflow Volume (Kilograms) 2014 7,000 2013 44,000 (84.1) Value (Pesos) 2014 1,823,000 2013 2,986,000 (38.9)
Outflow Volume (Kilograms) 2014 547,000 2013 208,000 163.0 Value (Pesos) 2014 31,163,000 2013 20,159,000 54.6
5

SUMMARY OF MAJOR STATISTICAL SERIES: REGION V
Latest Data Compared toStatistical Series Reference Reference
Period PeriodValue Value
Percent Change
Rail Inflow Volume (Kilograms) 2006 206,000 2005 335,000 (38.5) Value (Pesos) 2006 9,035,000 2005 14,294,000 (36.8)
Outflow Volume (Kilograms) 2006 345,000 2005 296,000 16.6 Value (Pesos) 2006 9,813,000 2005 6,849,000 43.3
2. Value of Commodity Flow (Pesos)
Inflow 2014 10,709,565 2013 9,362,336 14.4 Outflow 2014 12,099,007 2013 21,642,222 (44.1)
3. Value of Trade (FOB in US$)
Exports 2020 393,653,354 2019 315,895,654 24.6 Imports 2020 21,123,256 2019 35,548,628 (40.6)
Chapter 8. Tourism
1. Tourist Arrivals 2019 3,524,389 2018 6,117,600 (42.4)
Domestic 2019 3,123,389 2018 5,091,441 (38.7) Foreign 2019 401,000 2018 1,026,159 (60.9)
2. Hotels/Accommodation 2020 912 2019 912 - Establishments
3. Hotel/Accommodation Rooms 2020 14,612 2019 14,612 -
Chapter 9. Vital, Health and Nutrition Statistics
1. Registered Marriages 2020 12,209 2019 26,125 (53.3)
2. Registered Live Births 2020 95,827 2019 107,819 (11.1)
3. Registered Deaths 2020 34,782 2019 38,213 (9.0)
4. Hospitals 2018 55 2017 50 10.0 Government 2018 22 2017 20 10.0 Private 2018 33 2017 30 10.0
5. Hospital Beds 2018 3,340 2017 3,075 8.6 Government 2018 1,366 2017 1,466 (6.8) Private 2018 1,749 2017 1,609 8.7
6. Nutritional Status of Pre-Schoolers
Number of Children Weighed 2018 598,538 2017 614,972 (2.7)
Below Normal 2018 53,686 2017 62,140 (13.6)Underweight 2018 41,573 2017 47,031 (11.6)Severely Underweight 2018 12,113 2017 15,109 (19.8)
Normal 2018 534,578 2017 542,268 (1.4)Overweight 2018 10,274 2017 10,564 (2.7)
6

SUMMARY OF MAJOR STATISTICAL SERIES: REGION V
Latest Data Compared toStatistical Series Reference Reference
Period PeriodValue Value
Percent Change
Chapter 10. Education
1. Number of Schools
Pre-school SY 2020-2021 3,566 SY 2019-2020 3,604 (1.1) Public SY 2020-2021 3,156 SY 2019-2020 3,154 0.1 Private SY 2020-2021 410 SY 2019-2020 450 (8.9)
Elementary SY 2020-2021 3,474 SY 2019-2020 3,481 (0.2) Public SY 2020-2021 3,161 SY 2019-2020 3,158 0.1 Private SY 2020-2021 313 SY 2019-2020 323 (3.1)
Secondary SY 2020-2021 1,057 SY 2019-2020 1,024 3.2 Public SY 2020-2021 746 SY 2019-2020 729 2.3 Private SY 2020-2021 311 SY 2019-2020 295 5.4
Tertiary SY 2019-2020 170 SY 2018-2019 169 0.6 Public SY 2019-2020 56 SY 2018-2019 55 1.8 Private SY 2019-2020 114 SY 2018-2019 114 -
2. Classroom Teachers (Public Schools)
Kinder SY 2020-2021 39,089 SY 2019-2020 39,039 0.1 Elementary SY 2020-2021 20,810 SY 2019-2020 20,655 0.8 Secondary SY 2020-2021 6,811 SY 2019-2020 6,638 2.6
3. Enrolment
Pre-school SY 2020-2021 128,188 SY 2019-2020 135,879 (5.7) Public SY 2020-2021 123,345 SY 2019-2020 126,336 (2.4) Private SY 2020-2021 4,843 SY 2019-2020 9,543 (49.3)
Elementary SY 2020-2021 808,903 SY 2019-2020 858,022 (5.7) Public SY 2020-2021 781,246 SY 2019-2020 819,043 (4.6) Private SY 2020-2021 27,657 SY 2019-2020 38,979 (29.0)
Secondary SY 2020-2021 730,297 SY 2019-2020 791,849 (7.8) Public SY 2020-2021 623,410 SY 2019-2020 675,601 (7.7) Private SY 2020-2021 106,887 SY 2019-2020 116,248 (8.1)
4. Performance Indicators(Elementary Schools)
Participation Rate SY 2020-2021 87.26 SY 2019-2020 92.68 (5.4) Retention Rate SY 2020-2021 94.24 SY 2019-2020 98.29 (4.1) Transition Rate SY 2020-2021 92.83 SY 2019-2020 99.01 (6.2) Cohort Survival Rate SY 2020-2021 - SY 2019-2020 96.44 - Average Repetition Rate SY 2020-2021 - SY 2019-2020 3.65 - Average School Leaver Rate SY 2020-2021 - SY 2019-2020 0.58 - Graduation Rate SY 2020-2021 - SY 2019-2020 97.28 - Completion Rate SY 2020-2021 - SY 2019-2020 95.60 -
5. Performance Indicators(Junior High Schools)
Participation Rate SY 2020-2021 75.09 SY 2019-2020 82.27 (7.2) Retention Rate SY 2020-2021 88.12 SY 2019-2020 93.49 (5.4) Transition Rate SY 2020-2021 81.60 SY 2019-2020 93.20 (11.6) Cohort Survival Rate SY 2020-2021 - SY 2019-2020 84.11 - Average Repetition Rate SY 2020-2021 - SY 2019-2020 3.95 -
7

SUMMARY OF MAJOR STATISTICAL SERIES: REGION V
Latest Data Compared toStatistical Series Reference Reference
Period PeriodValue Value
Percent Change
Average School Leaver Rate SY 2020-2021 - SY 2019-2020 5.78 - Graduation Rate SY 2020-2021 - SY 2019-2020 98.48 - Completion Rate SY 2020-2021 - SY 2019-2020 82.52 -
6. Tertiary Education
Enrolment SY 2019-2020 172,941 SY 2018-2019 152,482 13.4 Graduates SY 2018-2019 44,777 SY 2017-2018 41,699 7.4
7. Functional Literacy Rate of HouseholdPopulation 10 to 64 Years Old 2019 88.9 2013 87.1 1.8
Chapter 11. Labor and Employment
1. Total Population 15 Years Oldand Over (Thousands) October 2020 3,950 October 2019 4,246 (7.0)
In the Labor Force October 2020 2,335 October 2019 2,616 (10.8)
Employed October 2020 2,144 October 2019 2,492 (14.0) Underemployed October 2020 378 October 2019 650 (41.9) Unemployed October 2020 191 October 2019 124 53.2
2. Employed Persons by Industry October 2020 October 2019 2,492 (100.0) (Thousands)
Agriculture October 2020 696 October 2019 762 (8.7) Industry October 2020 387 October 2019 426 (9.2) Services October 2020 1,061 October 2019 1,304 (18.6)
3. Number of Labor Unions 2019 3 2018 17 (82.4)
Membership (Thousands) 2019 408 2018 2,166 (81.2)
4. Number of CBAs Filed 2018 7 2017 7 -
Workers Covered 2018 359 2017 561 (36.0)
Chapter 12. Social Services
1. Clients Served by the DSWD
Families 2020 1,373,959 2019 890,082 54.4 Children 2020 337,336 2019 403,393 (16.4) Youth 2020 441,750 2019 238,780 85.0 Women 2020 33,577 2019 61,564 (45.5) Persons with Disability 2020 355 2019 488 (27.3) Senior Citizen 2020 313,010 2019 251,627 24.4
Disadvantaged Women 2020 149 2019 195 (23.6) Disadvantaged Children 2020 46 2019 245 (81.2)
2. Number of Day Care Centers 2020 4,580 2019 4,447 3.0 Day Care Workers 2020 4,580 2019 4,793 (4.4)
3. Household Population 5 years old and over with at least one type of functional disability
Both Sexes 2010 198,949 - - - Male 2010 94,238 - - - Female 2010 104,711 - - -
8

SUMMARY OF MAJOR STATISTICAL SERIES: REGION V
Latest Data Compared toStatistical Series Reference Reference
Period PeriodValue Value
Percent Change
Chapter 13. Transportation and Communication
1. Registered Motor Vehicles 2020 455,474 2019 495,019 (8.0)
By ClassificationPrivate 2020 407,244 2019 439,874 (7.4) Government 2020 2,687 2019 3,179 (15.5) Diplomatic 2020 - 2019 - - For Hire 2020 45,543 2019 51,966 (12.4) Exempt 2020 - 2019 - -
By TypeCars 2020 25,618 2019 23,239 10.2 Utility Vehicles 2020 55,114 2019 55,360 (0.4) Buses 2020 1,076 2019 1,315 (18.2) Trucks 2020 12,738 2019 12,811 (0.6) Motorcycles/Tricycles 2020 347,118 2019 389,306 (10.8) Trailers 2020 695 2019 727 (4.4) Sports Utility Vehicles 2020 13,115 2019 12,261 7.0
2. Franchise Approved
Application 2016 1,236 2015 1,350 (8.4) Units 2016 1,568 2015 1,585 (1.1)
3. National Road Length (Kilometers) 2019 2,389.23 2018 2,389.25 (0.0)
Concrete 2019 1,409.52 2018 1,464.48 (3.8) Asphalt 2019 918.71 2018 857.89 7.1 Gravel 2019 57.77 2018 63.65 (9.2) Earth 2019 3.23 2018 3.23 0.1
4. Shipping Statistics
Cargo Throughput (Metric Tons) 2020 2,731,369 2019 3,738,573 (26.9) Shipping Tonnage 2020 10,986,698 2019 15,846,015 (30.7) Shipcalls 2020 16,434 2019 24,867 (33.9) Passenger Traffic 2020 1,684,179 2019 5,385,058 (68.7)
5. Radio Stations 2020 15,976 2019 15,649 2.1
Government 2020 6,628 2019 6,101 8.6 Private 2020 9,348 2019 9,548 (2.1) Broadcast Station 2020 355 2019 387 (8.3) Others 2020 8,993 2019 9,161 (1.8)
6. Number of Telegraph Stations 2012 67 2011 79 (15.2)
7. Volume of Telegraphic Messages 2012 28,885 2011 31,847 (9.3)
8. Households with Internet AccessFrom Home 2010 41,163 - - - From Elsewhere 2010 90,253 - - -
9

SUMMARY OF MAJOR STATISTICAL SERIES: REGION V
Latest Data Compared toStatistical Series Reference Reference
Period PeriodValue Value
Percent Change
10. Number of Existing Cell Sites 2020 875 2019 607 44.2
Globe 2020 479 2019 260 84.2 Smart 2020 396 2019 276 43.5 Sun Cellular 2020 0 2019 71 (100.0)
11. Telephone Facilities
Exchange 2018 76 2017 76 - Lines 2018 130,364 2017 84,626 54.0 Connections 2018 56,529 2017 32,334 74.8 Telephone Density 2018 2.12 2017 1.38 54.1
Chapter 14. Energy and Water Resources
1. Energy Generation (Gigawatt-Hour) 2020 2,231,124 2019 1,998,212 11.7
Geothermal Power Plant 2020 1,980,741 2019 1,784,486 11.0 Oil-Based Power Plant 2020 184,975 2019 157,153 17.7 Hydro Power Plants 2020 23,549 2019 15,407 52.8
2. Energization Coverage
Municipalities 2020 112 2019 112 - Barangays 2020 3,427 2019 3,427 -
3. Service Connections 2020 1,163,846 2019 1,118,669 4.0
Residential 2020 1,109,652 2019 1,063,958 4.3 Commercial 2020 36,082 2019 36,205 (0.3) Industrial 2020 861 2019 865 (0.5) Others 2020 17,251 2019 17,641 (2.2)
4. Total Power Distributed 2020 1,504,296 2019 1,502,753 0.1 (Thousand Kilowatt-Hour)Residential 2020 934,807 2019 841,516 11.1 Commercial 2020 337,340 2019 404,180 (16.5) Industrial 2020 105,794 2019 121,855 (13.2) Others 2020 126,355 2019 135,202 (6.5)
5. Irrigation System Coverage
National Systems Number 2020 10 2019 10 - Service Area (Hectares) 2020 24,105 2019 24,019 0.4 Farmer Beneficiaries 2020 35,034 2019 34,895 0.4
Communal Systems Number 2020 847 2019 834 1.6 Service Area (Hectares) 2020 77,005 2019 76,629 0.5
Private Systems Number 2020 553 2019 553 - Service Area (Hectares) 2020 24,932 2019 24,932 -
10

SUMMARY OF MAJOR STATISTICAL SERIES: REGION V
Latest Data Compared toStatistical Series Reference Reference
Period PeriodValue Value
Percent Change
Chapter 15. Public Administration
1. Number of Provinces by Classification
First July 2008 3 July 2005 2 50.0 Second July 2008 2 July 2005 3 (33.3) Third July 2008 1 July 2005 1 -
2. Number of Cities/Municipalities by Classification
First July 2008 21 July 2005 10 110.0 Second July 2008 14 July 2005 18 (22.2) Third July 2008 26 July 2005 19 36.8 Fourth July 2008 33 July 2005 42 (21.4) Fifth July 2008 16 July 2005 24 (33.3) Sixth July 2008 1 July 2005 - -
3. Internal Revenue Collections 2020 8,938,766.4 2019 9,071,087.9 (1.5) (Thousand Pesos)Business Taxes 2020 2,760,232.5 2019 3,169,848.6 (12.9) Income Taxes 2020 5,488,128.9 2019 5,244,271.7 4.6 Other Taxes 2020 690,404.9 2019 656,967.6 5.1
4. Expenditure Program of ProvincialGovernments (Million Pesos) 2019 39,766.656 2018 23,741.322 67.5
Economic Services 2019 7,017.411 2018 4,271.200 64.3 Social Services 2019 8,744.111 2018 5,865.160 49.1 General Public Services 2019 23,148.607 2018 13,121.520 76.4 Others 2019 856.527 2018 483.442 77.2
5. Income of Municipal Governments 2019 28,696.49 2018 27,391.24 4.8 (Million Pesos)
Chapter 16. Money and Banking
1. Banking Institutions 2020 549 2019 532 3.2
Universal and Commercial Banks 2020 161 2019 157 2.5 Thrift Banks 2020 113 2019 115 (1.7) Rural and Cooperative Banks 2020 275 2019 260 5.8
2. Total Deposits of Banking 2020 196,660 2019 181,742 8.2 Offices (Million Pesos)
Universal and Commercial Banks 2020 179,653 2019 163,755 9.7 Thrift Banks 2020 9,875 2019 11,868 (16.8) Rural and Cooperative Banks 2020 7,132 2019 6,118 16.6
3. Loan Portfolio of Banking Offices (Million Pesos) 2020 57,115 2019 58,171 (1.8)
Universal and Commercial Banks 2020 37,917 2019 40,477 (6.3) Thrift Banks 2020 11,204 2019 10,849 3.3 Rural and Cooperative Banks 2020 7,995 2019 6,845 16.8
11

SUMMARY OF MAJOR STATISTICAL SERIES: REGION V
Latest Data Compared toStatistical Series Reference Reference
Period PeriodValue Value
Percent Change
Chapter 17. Public Order, Safety and Justice
1. Crime Incidence 2020 9,912 2019 16,203 (38.8)
Index Crimes 2020 2,303 2019 3,730 (38.3) Non-Index Crimes 2020 7,609 2019 12,473 (39.0)
2. Crime Solution Rate 2020 63.6 2019 67.5 (5.8)
3. Fire Incidence
Number 2020 476 2019 580 (17.9) Deaths/Injuries 2020 28 2019 26 7.7 Value of Damages to Property (Thousand Pesos) 2020 108,338.4 2019 52,012.9 108.3
4. Number of Policemen 2020 10,199 2019 9,478 7.6
5. Number of Firemen 2020 1,912 2019 1,844 3.7
6. Jail Population 2020 3,068 2019 3,216 (4.6)
Sentenced 2020 302 2019 302 - Detained 2020 2,766 2019 2,914 (5.1)
7. Clientele Assisted by the Public Attorney's Office 2020 505,127 2019 760,545 (33.6)
8. Cases Handled 2020 29,053 2019 31,947 (9.1)
Terminated 2020 13,622 2019 19,385 (29.7) Pending 2020 15,431 2019 12,562 22.8
12

12
Bicol Region, or Region V, is situated at the southernmost tip of the Luzon landmass with a total area of roughly 18,114.47 sq.km., 6.0 percent of the country’s total land area. It is straddled between 11o - 30’ to 14o - 20’ North latitude and 122o - 20’ to 124o - 30’ East longitude. As of June 2012, the region has 6 provinces; 7 cities; 107 municipalities; and 3,471 barangays. A region rich in history and natural resources, Bicol is inhabited by hospitable, smiling, and fun-loving people.
The province of Albay, which is strategically located at the center of the region, is home to the world famous Mount Mayon with its perfect cone shape. Located at the southeastern seaboard of Albay and 556 kilometers away from Metro Manila is Legazpi City, Albay's capital and major center of business. Called the Gateway City of Bicol, Legazpi City's strategic location, accessibility by land, air and sea transportation facilities are the reasons for being selected as the Regional Center.
On the northernmost part of the region is the province of Camarines Norte whose capital, Daet, holds the distinction of being the town to erect the first monument of the country’s national hero, Jose Rizal. Because of proximity to Quezon province, majority of the people speak fluent Tagalog. On the other hand, Sorsogon province located at the southernmost tip of the Luzon mainland and serving as gateway between the Visayas and Luzon, has a mixture of Visayan and Bicol dialects. South of Camarines Norte is Camarines Sur, the region's largest province occupying 30.4 percent of Bicol's land area. Camarines Sur's business center is Naga City, known as the Heart of Bicol. Naga City is home to Bicol Region's patroness, Our Lady of Peñafrancia and is host to Colegio de Sta. Isabel, the first known normal school for girls in the Orient.
Catanduanes and Masbate are island provinces. Catanduanes boasts of its white beaches and resorts while Masbate, which lies exactly at the center of the Philippine archipelago, is known for its mining and cattle industry. Region V is also known for its natural resorts and white beaches. With its strategic location in the Philippine archipelago, the region is accessible by land, air, and sea transportation facilities.
In 2020, the region’s economy is mainly in the service sector with 49.5 percent of its workforce dependent on the industry. Being surrounded by water, the region has thirteen major fishing grounds supplying fish markets in places as far as Metro Manila. It is also the site of two major geothermal fields which contribute substantially to the Luzon Power Grid.
The distribution of the region's total output in 2020 by major economic sector showed that 17.9 percent was contributed by agriculture, forestry, and fishing; 34.2 percent by industry; and 47.9 percent by services. The economy of the Bicol Region contracted by 8.4 percent in 2020.
The region's population count as of May 1, 2020 was placed at 6,082,165 with an average annual population growth rate of 1.02 percent during the 2015-2015 period. The region’s population density reached 336 persons per square kilometer. In 2020, the region's population is projected to reach 6.4 million based on the 2015 POPCEN.
OVERVIEW OF THE REGION

1 - 1
Data on size, distribution, growth, and demographic characteristics of the population and the stock and condition of housing are essential in the planning and decision making processes of the governmental instrumentalities and private businesses alike. The data provide the bases in determining what, where, how and when public services and facilities and interventions should be put in place. The impact of services, programs, and projects implemented are measured vis-à-vis the effects in the socioeconomic well-being of the populace, as the ultimate beneficiaries of governance and development. Entrepreneurs and corporate executives and managers in the private sector use the data in making decisions on the level, form, programming, distribution, and situs of resources that will be invested. The returns in their investments are largely determined by their responses to the market created by the demands of the consumers and readiness to supply goods and services that satisfy the needs and capabilities of the public. This chapter presents data series pertaining to the region and by province/city/ municipality, where available. The data include the population counts during several censuses conducted nationwide as well as the demographic characteristics, migration patterns and housing units. Projections of the population of the region up to 2040, which are estimated based on the results of the population census and demographic surveys, are also presented. The data sources are the Philippine Statistics Authority for censal data and the Technical Working Group on Population Projections of the Technical Committee on Population and Housing of the Philippine Statistics Authority for the population projections. Sector Highlights The population of the Bicol Region was placed at 6,082,165 as of May 1, 2020. Regional population grew at an annual average rate of 1.02 percent between 2015 and 2020.
The region's population density increased from 320 persons per square kilometer in 2015
to 336 persons per square kilometer in 2020.
Urban population in the region was placed at 23.2 percent of total population in 2015. All barangays in forty-three of the 114 cities/municipalities of the region were classified as rural in 2015.
Population 19 years old and below comprised almost half (48.1%) of total household population in
2015. In 2015, about 46 percent of the household population 10 years old and over in Region V were
legally married. There were relatively more people living-in/having common law relationships in 2015 at 10.1 percent of total population aged over 10 years old than in 2010 at 5.9 percent.
In 2015, the bulk (62.9%) of married people belonged to the age bracket 30-54.
There were 71.1 dependent persons for every 100 economically active population in 2015. Among
the provinces, Albay recorded the lowest dependency ratio at 65.4 dependent persons per 100 economically active population
There were 103.4 males for every 100 females in 2015.
Chapter 1 POPULATION AND HOUSING

1 - 2
Sector Highlights (Continued) Bicol region is projected to remain an outmigration area up to the year 2020 as reflected in the
negative net migration rates. Average household size slightly decreased from 4.9 persons per household in 2010 to 4.8 in 2015. An occupied housing unit in 2010 had an average of 4.9 persons/occupants. In 2015, four fifths of the households in Bicol region used electricity as the main source for lighting
while 14.2 percent used kerosene. Almost a fourth (22.4%) of the households in Bicol Region in 2015 draw drinking water from own
use faucet from a community water system and a fifth (22.0%), from shared faucets of community water system.
More than half (51.7%) of the households in Bicol Region in 2010 have for their own exclusive use water, sealed toilets with own septic tanks or connected to a sewer system. Some 13.8 percent of the households, on the other, did not have any toilet facility.
About 84 percent of the households in Bicol Region reported having at least one household convenience/devices. Majority of the households have radio/radio cassette recorders (60.5%) and television sets (59.1%).
In Bicol Region, 37.2 percent of households disposed of their garbage by burning while 22.0 percent fed their garbage to animals and 20.9 percent of the households have their garbage picked up by garbage trucks.
Albay registered the highest Human Development Index (HDI) among the provinces in the region in
2012 at 0.541. Camarines Norte registered the greatest improvement in HDI from 2009 to 2012 with a 10.4 percent change in the index.

Table 1.1 Total Population, Growth Rate, Land Area and Population Densityby Province, Census Years 2015 and 2020 1 - 5
Table 1.2 Population and Growth Rate by Province/City/MunicipalityCensus Years 1990 - 2020 1 - 6
Table 1.3 Population, Land Area and Density by Province/City/MunicipalityCensus Years 1990 - 2020 1 - 12
Table 1.4 Total Population, Urban Population and Percent Urban by Province andCity/Municipality, Census Years 2010 - 2015 1 - 19
Table 1.5A Household Population by Sex and Age Group and ProvinceCensus Years 1995 - 2015 1 - 22
Table 1.5B Household Population by Sex and Age Group and CityCensus Years 2010 and 2015 1 - 30
Table 1.6 Household Population 10 Years and Over by Sex, Age Group, MaritalStatus and Province, Census Years 2010 and 2015 1 - 33
Table 1.7 Age Dependency Ratio by Province/City, Census Years 1980 - 2015 1 - 47
Table 1.8 Sex Ratio by Province/City/Municipality, Census Years 1980 - 2015 1 - 48
Table 1.9 Household Population by Ethnicity and Province, Census Year 2010 1 - 51
Table 1.10 Household Population Five Years Old and Over by Sex, Place ofPrevious Residence 5 Years Ago and Province/CityCensus Years 1990, 2000 and 2010 1 - 55
Table 1.11 Projected Net Migration Rates by Sex and Province, 1995 - 2000 to2015 - 2020 1 - 59
Table 1.12 Projected Population by Age Group, Sex, Five-Calendar Years and Province, 2010 - 2045 1 - 60
Table 1.13 Number of Households and Average Household Size by Province/City/Municipality, Census Years 2000 - 2015 1 - 67
Table 1.14 Number of Households by Language Generally Spoken at Homeand Province, Census Year 2010 1 - 71
Table 1.15A Households in Occupied Housing Units by Tenure Status of the HousingUnit and Province/City/Municipality, Census Years 2000 and 2010 1 - 72
Table 1.15B Households in Occupied Housing Units by Tenure Status of the HousingUnit and Province/City/Municipality, Census Year 2015 1 - 78
Table 1.16A Households by Type of Building, Tenure Status of the Lot and ProvinceCensus Years 2000 and 2010 1 - 84
Table 1.16B Households by Type of Building, Tenure Status of the Lot and ProvinceCensus Year 2015 1 - 86
Table 1.17 Occupied Housing Units, Number of Households and HouseholdPopulation by Type of Building and Province/CityCensus Years 2010 and 2015 1 - 90
1 - 3

Table 1.18 Number of Occupied Housing Units by Construction Materials of theOuter Walls and Roof, and Province/City, Census Year 2015 1 - 96
Table 1.19 Households by Kind of Fuel For Lighting and Province/City/MunicipalityCensus Year 2015 1 - 100
Table 1.20 Households by Kind of Fuel For Cooking and Province/City/MunicipalityCensus Year 2010 1 - 103
Table 1.21 Households by Main Source of Water Supply for Drinking and Province/City/Municipality, Census Year 2015 1 - 106
Table 1.22 Households by Kind of Toilet Facility and Province/City/MunicipalityCensus Year 2010 1 - 112
Table 1.23 Households Reporting Presence of Household Convenience/DevicesProvince/City/Municipality, Census Year 2010 1 - 118
Table 1.24 Households by Usual Manner of Garbage Disposal and Province/City/Municipality, Census Year 2010 1 - 124
Table 1.25 Human Development Index by Component and Province, 2000 - 2012 1 - 127
Figure 1.1 Population of Region V Provinces, Census Years 2000 - 2020 1 - 5
Figure 1.2 Population Distribution by Province, Region V, Census Year 2020 1 - 18
Figure 1.3 Land Area and Population Density by Province, Region VCensus Year 2020 1 - 18
Figure 1.4 Population Pyramid in Region V, Census Year 2015 1 - 47
Figure 1.5 Number of Households and Average Household Size, Region VCensus Years 2000 - 2015 1 - 70
Figure 1.6 Distribution of Households by Tenure Status of the Housing UnitRegion V, Census Year 2015 1 - 89
Figure 1.7 Distribution of Households by Type of Building, Region VCensus Year 2015 1 - 89
Figure 1.8 Distribution of Households by Main Source of Water Supply For DrinkingRegion V, Census Year 2015 1 - 128
Figure 1.9 Distribution of Households by Usual Manner of Garbage DisposalRegion V, Census Year 2010 1 - 128
1 - 4

Table 1.1TOTAL POPULATION, GROWTH RATE, LAND AREA AND POPULATION DENSITY BY PROVINCECensus Years 2015 and 2020(Growth Rate in percent; Land Area in sq. km.)
Total Population Growth Rate Density (Pop/sq.km)2015 2020 2010-15 2015-20 2015 2020
Region V 5,796,989 6,082,165 1.29 1.02 18,114.47 320 336
Albay 1,314,826 1,374,768 1.22 0.94 2,574.91 511 534
Camarines Norte 583,313 629,699 1.38 1.62 2,277.93 256 276
Camarines Sur 1,952,544 2,068,244 1.32 1.22 5,511.90 354 375
Catanduanes 260,964 271,879 1.11 0.87 1,492.16 175 182
Masbate 892,393 908,920 1.28 0.39 4,138.56 216 220
Sorsogon 792,949 828,655 1.30 0.93 2,119.01 374 391
Sources: Philippine Statistics Authority Land Management Bureau, Department of Environment and Natural Resources - data on Land Area
Figure 1.1 POPULATION OF REGION V PROVINCESCENSUS YEARS 2000 - 2020
Province Land Area
0
500,000
1,000,000
1,500,000
2,000,000
2,500,000
2000 2007 2010 2015 2020
Po
pu
lati
on
Albay Cam. Norte Cam. Sur Catanduanes Masbate Sorsogon
1 - 5

Table 1.2POPULATION AND GROWTH RATE BY PROVINCE/CITY/MUNICIPALITYCensus Years 1990 - 2020
Province and 1990 1995 2000City / Municipality Population Growth Rate Population Growth Rate Population Growth Rate
Region V 3,910,001 1.18 4,325,307 1.91 4,686,669 1.73
Albay 903,785 1.10 1,005,315 2.01 1,090,907 1.77
Bacacay 49,202 1.02 56,295 2.56 58,357 0.77Camalig 49,975 0.82 53,129 1.15 58,141 1.95Daraga 83,928 1.37 91,829 1.70 101,031 2.07Guinobatan 59,187 0.94 65,512 1.92 71,071 1.76Jovellar 14,884 -0.09 16,876 2.38 17,357 0.60
LEGAZPI CITY 121,116 1.96 141,657 2.98 157,010 2.23Libon 60,281 1.40 63,190 0.89 66,213 1.01Ligao City 72,560 0.38 80,861 2.05 90,603 2.47Malilipot 24,160 0.39 26,834 1.99 29,541 2.08Malinao 31,349 1.00 33,872 1.46 36,231 1.45
Manito 16,011 0.38 18,451 2.69 20,420 2.20Oas 53,061 0.15 56,536 1.20 62,063 2.02Pio Duran 36,859 0.86 41,850 2.41 44,423 1.29Polangui 61,556 1.02 67,314 1.69 70,451 0.98Rapu-Rapu 26,362 0.41 28,797 1.67 29,176 0.28
Santo Domingo 22,939 1.50 25,586 2.07 27,392 1.47Tabaco City 85,697 1.67 96,993 2.35 107,166 2.16Tiwi 34,658 1.89 39,733 2.59 44,261 2.34
Camarines Norte 1/ 390,982 2.41 439,151 2.20 470,654 1.50
Basud 27,295 1.71 30,190 1.91 33,885 2.50Capalonga 23,557 0.82 25,336 1.37 26,577 1.03DAET 66,477 1.95 74,341 2.12 80,632 1.76Jose Panganiban 44,408 3.91 45,396 0.41 46,064 0.31Labo 70,371 2.19 77,414 1.80 81,388 1.08
Mercedes 34,300 2.18 38,641 2.26 41,713 1.65Paracale 39,192 4.47 43,824 2.12 42,453 -0.68San Lorenzo Ruiz (Imelda) 9,286 0.47 10,811 2.89 11,678 1.67San Vicente 7,321 1.08 8,220 2.19 8,984 1.92Santa Elena 2/ 20,105 4.38 33,955 10.32 37,878 2.37
Talisay 16,896 1.99 17,841 1.02 21,509 4.09Vinzons 31,774 1.96 33,182 0.82 37,893 2.88
1/ Includes counts for nine contested barangays in the 2000 census. 2/ Includes 11,814 persons for barangays Don Tomas, Guitol, Kabuluan, Kagtalaba, Maulawin, Patag Ibaba, Patag Iraya, Plaridel 1 and Tabugon, in the 2000 census. 3/ Growth rate between 2000 and 2010.
Note: Growth Rate Formula:* Geometric Growth Rate : r = {antilog [(log(Pn/Po))/n]-1} x 100
where: r = annual population growth rate Pn = the population count at the end of the period Po = the population count at the beginning of the period n = the number of years
Source: Philippine Statistics Authority
1 - 6

2007 2010 2015 2020Population Growth Rate Population Growth Rate 3/ Population Growth Rate Population Growth Rate
5,106,160 1.19 5,420,411 1.46 5,796,989 1.29 6,082,165 1.02
1,187,185 1.17 1,233,432 1.23 1,314,826 1.22 1,374,768 0.94
61,574 0.74 65,724 1.20 68,906 0.90 72,485 1.0760,319 0.51 63,585 0.90 66,904 0.97 72,042 1.57
110,625 1.26 115,804 1.37 126,595 1.71 133,893 1.1974,386 0.63 75,967 0.67 82,361 1.55 85,786 0.8617,615 0.20 16,899 -0.27 17,308 0.46 17,795 0.59
175,843 1.57 182,201 1.50 196,639 1.46 209,533 1.3568,846 0.54 71,527 0.77 75,172 0.95 75,073 -0.03
101,179 1.53 104,914 1.48 111,399 1.15 118,096 1.2433,593 1.79 35,567 1.87 37,785 1.16 40,857 1.6639,516 1.20 42,770 1.67 45,301 1.10 47,395 0.96
21,652 0.81 22,819 1.12 24,707 1.52 26,162 1.2163,888 0.40 64,785 0.43 67,960 0.91 66,084 -0.5944,972 0.17 45,028 0.14 46,693 0.69 49,070 1.0577,122 1.26 82,307 1.57 88,221 1.33 89,176 0.2332,646 1.56 35,875 2.09 36,920 0.55 36,151 -0.44
30,711 1.59 32,414 1.70 34,967 1.45 37,765 1.63123,513 1.98 125,083 1.56 133,868 1.30 140,961 1.09
49,185 1.46 50,163 1.26 53,120 1.10 56,444 1.29
513,785 1.22 542,915 1.44 583,313 1.38 629,699 1.62
36,763 1.13 38,176 1.20 41,017 1.38 45,133 2.0329,683 1.54 31,299 1.65 32,215 0.55 36,223 2.5094,184 2.16 95,572 1.71 104,799 1.77 111,700 1.3549,028 0.86 55,557 1.89 59,639 1.36 63,662 1.3888,087 1.10 92,041 1.24 101,082 1.80 109,245 1.65
44,375 0.86 47,674 1.34 50,841 1.23 55,334 1.8046,856 1.37 53,243 2.29 59,149 2.02 60,198 0.3712,299 0.72 12,592 0.76 14,063 2.12 15,757 2.42
9,615 0.94 10,114 1.19 10,396 0.52 12,579 4.0940,300 0.86 40,828 0.75 40,786 -0.02 43,582 1.40
22,942 0.89 23,904 1.06 25,841 1.49 27,244 1.1239,653 0.63 41,915 1.01 43,485 0.70 49,042 2.56
1 - 7

Table 1.2 - Continued
POPULATION AND GROWTH RATE BY PROVINCE/CITY/MUNICIPALITYCensus Years 1990 - 2020
Province and 1990 1995 2000City / Municipality Population Growth Rate Population Growth Rate Population Growth Rate
Camarines Sur 1,305,919 1.74 1,432,598 1.75 1,551,549 1.72
Baao 39,040 1.42 41,366 1.09 46,693 2.63Balatan 19,324 2.44 21,075 1.64 22,537 1.45Bato 35,294 1.72 38,771 1.78 42,739 2.11Bombon 10,874 2.82 11,739 1.44 12,843 1.94Buhi 57,496 1.69 61,887 1.39 67,762 1.96
Bula 48,240 1.73 54,650 2.37 57,474 1.09Cabusao 15,305 3.51 15,966 0.80 16,201 0.31Calabanga 54,261 2.35 59,164 1.63 67,408 2.83Camaligan 15,436 3.46 17,411 2.28 19,188 2.10Canaman 20,298 2.55 22,732 2.14 27,719 4.34
Caramoan 36,107 1.01 39,416 1.66 39,642 0.12Del Gallego 17,047 2.38 18,760 1.81 20,456 1.87Gainza 7,095 1.34 7,743 1.65 8,412 1.79Garchitorena 19,439 1.42 19,481 0.04 23,021 3.64Goa 39,888 0.96 43,206 1.51 48,490 2.50
Iriga City 74,269 1.17 82,482 1.98 88,893 1.62Lagonoy 38,163 0.95 40,126 0.94 42,636 1.31Libmanan 77,565 1.26 85,337 1.81 88,476 0.78Lupi 24,809 1.58 25,390 0.43 26,148 0.63Magarao 16,623 2.17 18,264 1.78 20,964 3.00
Milaor 18,199 1.94 21,213 2.91 22,635 1.40Minalabac 35,922 1.70 37,574 0.85 41,734 2.27Nabua 60,885 1.34 65,988 1.52 70,909 1.55Naga City 115,329 2.43 126,972 1.82 137,810 1.77Ocampo 30,876 2.22 34,898 2.32 36,316 0.86
Pamplona 24,097 2.06 26,176 1.56 29,177 2.35Pasacao 31,960 2.36 36,070 2.29 38,423 1.36PILI 52,481 1.97 61,520 3.02 67,393 1.97Presentacion 14,788 1.11 15,346 0.70 16,410 1.45Ragay 41,438 1.73 44,154 1.20 47,743 1.69
Sagñay 22,422 1.03 26,530 3.20 26,619 0.07San Fernando 20,608 1.84 24,196 3.05 27,433 2.73San Jose 27,517 1.42 31,362 2.48 32,512 0.77Sipocot 49,501 1.30 53,392 1.43 56,576 1.25Siruma 13,103 1.21 13,870 1.07 16,339 3.57
Tigaon 33,650 2.42 39,186 2.89 40,210 0.55Tinambac 46,570 1.63 49,185 1.03 55,608 2.66
Catanduanes 187,000 0.65 202,464 1.50 215,356 1.33
Bagamanoc 10,179 0.73 10,407 0.42 9,684 -1.53Baras 9,769 -0.50 11,843 3.67 11,653 -0.35Bato 15,331 0.15 16,535 1.43 17,761 1.54Caramoran 20,999 0.80 21,963 0.84 23,790 1.73Gigmoto 6,487 0.56 6,736 0.71 7,055 1.00
3/ Growth rate between 2000 and 2010.
1 - 8

2007 2010 2015 2020Population Growth Rate Population Growth Rate 3/ Population Growth Rate Population Growth Rate
1,693,821 1.22 1,822,371 1.62 1,952,544 1.32 2,068,244 1.22
52,466 1.62 54,971 1.64 58,849 1.31 61,493 0.9325,982 1.98 28,699 2.45 30,922 1.43 30,669 -0.1744,437 0.54 48,306 1.23 52,137 1.46 52,155 0.0114,083 1.28 15,437 1.86 16,512 1.29 17,995 1.8370,756 0.60 73,809 0.86 77,143 0.84 81,306 1.11
62,024 1.06 68,011 1.70 69,430 0.39 73,143 1.1017,599 1.15 18,049 1.09 18,397 0.36 19,257 0.9773,333 1.17 78,119 1.48 83,033 1.17 88,906 1.4520,758 1.09 22,254 1.49 24,109 1.54 25,036 0.8031,583 1.82 32,390 1.57 34,210 1.05 36,205 1.20
40,810 0.40 44,945 1.26 47,605 1.10 51,728 1.7621,272 0.54 23,064 1.21 25,397 1.85 26,403 0.82
9,404 1.55 10,345 2.09 11,262 1.63 11,584 0.5924,825 1.05 25,204 0.91 27,010 1.33 29,436 1.8354,035 1.50 58,503 1.89 63,308 1.51 71,368 2.55
97,983 1.35 105,919 1.77 111,757 1.03 114,457 0.5046,093 1.08 51,814 1.97 55,465 1.30 56,714 0.4792,839 0.67 100,002 1.23 108,716 1.60 112,994 0.8227,630 0.76 30,118 1.42 32,167 1.26 33,897 1.1122,515 0.99 24,274 1.48 25,694 1.09 26,742 0.84
26,452 2.17 28,474 2.32 31,150 1.72 33,963 1.8443,957 0.72 48,162 1.44 52,390 1.61 53,981 0.6375,422 0.85 80,111 1.23 83,874 0.88 86,490 0.65
160,516 2.12 174,931 2.41 196,003 2.19 209,170 1.3839,759 1.26 43,523 1.83 45,934 1.03 51,073 2.26
31,895 1.24 34,471 1.68 36,390 1.04 39,333 1.6541,533 1.08 45,946 1.80 49,035 1.25 53,461 1.8376,496 1.76 82,307 2.02 89,545 1.62 99,196 2.1820,266 2.95 20,023 2.01 20,996 0.91 22,591 1.5552,021 1.19 54,934 1.41 58,214 1.11 59,770 0.56
29,082 1.23 31,314 1.64 34,546 1.89 36,841 1.3630,697 1.56 33,281 1.95 35,258 1.10 38,626 1.9435,768 1.32 38,523 1.71 40,623 1.02 43,973 1.6857,861 0.31 64,042 1.25 64,855 0.24 68,169 1.0517,035 0.58 17,050 0.43 17,764 0.78 19,419 1.89
45,509 1.72 48,611 1.91 55,272 2.47 60,524 1.9359,125 0.85 62,435 1.16 67,572 1.52 70,176 0.80
232,757 1.08 246,300 1.35 260,964 1.11 271,879 0.87
10,183 0.69 11,370 1.62 11,551 0.30 11,086 -0.8611,787 0.16 12,243 0.49 12,848 0.92 13,484 1.0218,738 0.74 19,984 1.19 21,279 1.20 21,748 0.4625,618 1.03 28,063 1.66 30,056 1.31 32,114 1.40
7,569 0.97 8,003 1.27 8,368 0.85 8,712 0.85
1 - 9

Table 1.2 - Continued
POPULATION AND GROWTH RATE BY PROVINCE/CITY/MUNICIPALITYCensus Years 1990 - 2020
Province and 1990 1995 2000City / Municipality Population Growth Rate Population Growth Rate Population Growth Rate
Pandan 15,784 0.41 15,725 -0.07 17,696 2.56Panganiban 8,344 1.20 8,480 0.30 8,877 0.98San Andres 26,727 0.64 30,242 2.34 31,463 0.85San Miguel 11,587 0.27 12,052 0.74 12,205 0.27Viga 16,270 0.25 18,569 2.51 18,105 -0.54
VIRAC 45,523 1.28 49,912 1.74 57,067 2.91
Masbate 599,355 0.26 653,852 1.64 707,668 1.71
Aroroy 53,060 3.23 55,110 0.71 58,751 1.38Baleno 17,390 -0.94 18,105 0.76 19,897 2.04Balud 26,121 0.62 27,933 1.26 30,068 1.59Batuan 10,525 0.11 12,705 3.59 12,038 -1.15Cataingan 39,496 0.03 42,065 1.19 46,593 2.21
Cawayan 38,336 2.07 45,834 3.40 52,256 2.85Claveria 31,211 -1.87 35,648 2.52 38,398 1.60Dimasalang 17,367 -1.03 20,566 3.22 21,550 1.01Esperanza 14,674 0.34 17,023 2.82 16,209 -1.04Mandaon 25,670 0.06 28,716 2.12 31,572 2.05
MASBATE CITY 4/ 58,714 1.04 66,049 2.23 71,441 1.70Milagros 33,305 1.57 38,925 2.96 44,575 2.95Mobo 24,879 0.96 25,049 0.13 28,233 2.60Monreal 18,796 0.79 18,775 -0.02 19,832 1.18Palanas 21,763 -1.52 23,580 1.51 24,666 0.97
Pio V. Corpuz 18,847 -1.09 20,649 1.73 21,519 0.89Placer 38,568 0.77 40,394 0.87 44,418 2.05San Fernando 16,904 -1.04 18,722 1.93 19,179 0.52San Jacinto 23,068 -1.34 24,048 0.78 24,780 0.64San Pascual 33,396 -1.45 34,705 0.72 37,868 1.89
Uson 37,265 0.12 39,251 0.98 43,825 2.39
Sorsogon 522,960 0.44 591,927 2.35 650,535 2.04
Bacon 32,810 0.26 38,603 3.09 42,166 1.91Barcelona 16,251 0.12 18,405 2.36 19,041 0.73Bulan 66,450 0.87 74,219 2.09 82,688 2.34Bulusan 18,009 -0.02 19,501 1.50 20,469 1.04Casiguran 22,277 0.22 25,804 2.79 28,057 1.81
Castilla 34,702 -0.02 40,506 2.94 45,072 2.31Donsol 33,159 -0.19 36,013 1.56 39,995 2.27Gubat 43,296 -0.13 49,716 2.62 52,707 1.26Irosin 37,887 0.80 41,005 1.49 45,507 2.26Juban 20,671 0.50 23,803 2.68 26,848 2.61
Magallanes 24,754 -0.40 28,707 2.81 31,315 1.88Matnog 25,957 0.71 29,309 2.30 32,712 2.38Pilar 46,268 0.15 51,318 1.96 57,898 2.62Prieto Diaz 15,324 -0.18 18,106 3.18 18,925 0.95Santa Magdalena 12,274 -0.67 13,900 2.36 14,623 1.09
SORSOGON CITY 5/ 72,871 1.87 83,012 2.47 92,512 2.35
3/ Growth rate between 2000 and 2010. 4/ Converted into a city under Republic Act (RA) No. 8807; ratified on September 30, 2000. 5/ Converted into a city under Republic Act No. 8806; ratified on December 16, 2000;
taken from municipalities of Sorsogon and Bacon.
1 - 10

2007 2010 2015 2020Population Growth Rate Population Growth Rate 3/ Population Growth Rate Population Growth Rate
19,005 0.99 19,393 0.92 20,516 1.08 21,473 0.969,290 0.63 9,738 0.93 9,287 -0.90 9,713 0.95
33,781 0.98 35,779 1.29 36,779 0.53 38,480 0.9612,966 0.84 14,107 1.46 15,006 1.18 15,680 0.9319,266 0.86 20,669 1.33 21,624 0.86 22,869 1.18
64,554 1.71 66,951 1.61 73,650 1.83 76,520 0.81
768,939 1.15 834,650 1.66 892,393 1.28 908,920 0.39
62,635 0.89 76,139 2.62 86,168 2.38 88,351 0.5321,639 1.16 24,401 2.06 26,096 1.29 28,855 2.1431,484 0.64 35,841 1.77 38,124 1.18 40,155 1.1012,585 0.61 13,764 1.35 15,086 1.76 14,610 -0.6748,827 0.65 49,078 0.52 50,327 0.48 50,623 0.12
59,658 1.84 63,115 1.90 67,033 1.15 69,265 0.6940,336 0.68 41,572 0.80 43,693 0.95 42,142 -0.7622,723 0.73 25,245 1.59 26,192 0.70 24,909 -1.0516,834 0.52 17,357 0.69 18,568 1.29 17,534 -1.2034,401 1.19 38,161 1.91 41,262 1.50 44,122 1.42
81,585 1.85 85,227 1.78 95,389 2.17 104,522 1.9448,185 1.08 52,619 1.67 57,473 1.69 57,538 0.0232,740 2.06 34,896 2.14 38,813 2.05 40,823 1.0721,693 1.24 25,366 2.49 26,614 0.92 25,164 -1.1724,830 0.09 25,501 0.33 26,222 0.53 27,322 0.87
22,102 0.37 23,292 0.79 23,236 -0.05 23,744 0.4648,469 1.21 55,438 2.24 55,826 0.13 56,340 0.1919,565 0.28 21,309 1.06 23,057 1.51 21,600 -1.3626,508 0.93 27,974 1.22 30,372 1.58 29,686 -0.4841,736 1.35 44,753 1.68 46,674 0.80 44,449 -1.02
50,404 1.95 53,602 2.03 56,168 0.89 57,166 0.37
709,673 1.21 740,743 1.31 792,949 1.30 828,655 0.93
19,428 0.28 20,340 0.66 20,990 0.60 20,987 0.0091,730 1.44 93,943 1.28 100,076 1.21 105,190 1.0521,374 0.60 22,089 0.76 22,884 0.68 23,932 0.9530,165 1.00 30,995 1.00 32,842 1.11 35,602 1.71
49,407 1.27 52,903 1.61 57,827 1.71 60,635 1.0043,996 1.32 47,563 1.75 49,711 0.84 50,281 0.2455,501 0.71 57,327 0.84 59,534 0.72 60,294 0.2749,968 1.30 51,777 1.30 56,662 1.73 59,267 0.9528,989 1.06 30,335 1.23 32,320 1.21 35,297 1.87
34,418 1.31 35,443 1.25 37,038 0.84 37,411 0.2134,517 0.74 37,641 1.41 41,101 1.69 41,989 0.4563,539 1.29 68,245 1.66 74,564 1.70 75,793 0.3419,762 0.60 20,478 0.79 22,442 1.76 22,644 0.1915,425 0.74 16,520 1.23 16,848 0.37 17,096 0.31
151,454 1.63 155,144 1.42 168,110 1.54 182,237 1.71
1 - 11

Table 1.3 POPULATION, LAND AREA AND DENSITY BY PROVINCE/CITY/MUNICIPALITYCensus Years 1990 - 2020(Land Area in square kilometers; Density in persons per square kilometer)
Province and PopulationCity / Municipality 1990 1995 2000 2007 2010 2015 2020
Region V 3,910,001 4,325,307 4,686,669 5,106,160 5,420,411 5,796,989 6,082,165
Albay 903,785 1,005,315 1,090,907 1,187,185 1,233,432 1,314,826 1,374,768
Bacacay 49,202 56,295 58,357 61,574 65,724 68,906 72,485Camalig 49,975 53,129 58,141 60,319 63,585 66,904 72,042Daraga 83,928 91,829 101,031 110,625 115,804 126,595 133,893Guinobatan 59,187 65,512 71,071 74,386 75,967 82,361 85,786Jovellar 14,884 16,876 17,357 17,615 16,899 17,308 17,795
LEGAZPI CITY 121,116 141,657 157,010 175,843 182,201 196,639 209,533Libon 60,281 63,190 66,213 68,846 71,527 75,172 75,073Ligao City 72,560 80,861 90,603 101,179 104,914 111,399 118,096Malilipot 24,160 26,834 29,541 33,593 35,567 37,785 40,857Malinao 31,349 33,872 36,231 39,516 42,770 45,301 47,395
Manito 16,011 18,451 20,420 21,652 22,819 24,707 26,162Oas 53,061 56,536 62,063 63,888 64,785 67,960 66,084Pio Duran 36,859 41,850 44,423 44,972 45,028 46,693 49,070Polangui 61,556 67,314 70,451 77,122 82,307 88,221 89,176Rapu-Rapu 26,362 28,797 29,176 32,646 35,875 36,920 36,151
Santo Domingo 22,939 25,586 27,392 30,711 32,414 34,967 37,765Tabaco City 85,697 96,993 107,166 123,513 125,083 133,868 140,961Tiwi 34,658 39,733 44,261 49,185 50,163 53,120 56,444
Camarines Norte 1/ 390,982 439,151 470,654 513,785 542,915 583,313 629,699
Basud 27,295 30,190 33,885 36,763 38,176 41,017 45,133Capalonga 23,557 25,336 26,577 29,683 31,299 32,215 36,223DAET 66,477 74,341 80,632 94,184 95,572 104,799 111,700Jose Panganiban 44,408 45,396 46,064 49,028 55,557 59,639 63,662Labo 70,371 77,414 81,388 88,087 92,041 101,082 109,245
Mercedes 34,300 38,641 41,713 44,375 47,674 50,841 55,334Paracale 39,192 43,824 42,453 46,856 53,243 59,149 60,198San Lorenzo Ruiz 9,286 10,811 11,678 12,299 12,592 14,063 15,757San Vicente 7,321 8,220 8,984 9,615 10,114 10,396 12,579Santa Elena 2/ 20,105 33,955 37,878 40,300 40,828 40,786 43,582
Talisay 16,896 17,841 21,509 22,942 23,904 25,841 27,244Vinzons 31,774 33,182 37,893 39,653 41,915 43,485 49,042
Camarines Sur 1,305,919 1,432,598 1,551,549 1,693,821 1,822,371 1,952,544 2,068,244
Baao 39,040 41,366 46,693 52,466 54,971 58,849 61,493Balatan 19,324 21,075 22,537 25,982 28,699 30,922 30,669Bato 35,294 38,771 42,739 44,437 48,306 52,137 52,155Bombon 10,874 11,739 12,843 14,083 15,437 16,512 17,995Buhi 57,496 61,887 67,762 70,756 73,809 77,143 81,306
1/ Includes counts for nine contested barangays in the 2000 census. 2/ Includes 11,814 persons for barangays Don Tomas, Guitol, Kabuluan, Kagtalaba, Maulawin,
Patag Ibaba, Patag Iraya, Plaridel 1 and Tabugon, in the 2000 census. * Land area was based on cadastral survey (certified and provided to the DBM) from the LMB, DENR. ** Estimated land area (certified and provided to the DBM) from the LMB, DENR.
Sources: Philippine Statistics Authority Land Management Bureau, Department of Environment and Natural Resources
1 - 12

Density1990 1995 2000 2007 2010 2015 2020
18,114.47 216 239 259 282 299 320 336
2,574.91 351 390 424 461 479 511 534
122.13 ** 403 461 478 504 538 564 594130.90 * 382 406 444 461 486 511 550118.64 * 707 774 852 932 976 1,067 1,129244.43 * 242 268 291 304 311 337 351105.40 ** 141 160 165 167 160 164 169
161.61 * 749 877 972 1,088 1,127 1,217 1,297235.70 * 256 268 281 292 303 319 319246.75 ** 294 328 367 410 425 451 479
44.13 * 547 608 669 761 806 856 926107.50 * 292 315 337 368 398 421 441
107.40 ** 149 172 190 202 212 230 244263.61 * 201 214 235 242 246 258 251133.70 ** 276 313 332 336 337 349 367123.59 * 498 545 570 624 666 714 722155.30 ** 170 185 188 210 231 238 233
51.22 ** 448 500 535 600 633 683 737117.14 ** 732 828 915 1,054 1,068 1,143 1,203105.76 ** 328 376 419 465 474 502 534
2,277.93 172 193 207 226 238 256 276
260.28 ** 105 116 130 141 147 158 173290.00 ** 81 87 92 102 108 111 125
46.00 ** 1,445 1,616 1,753 2,047 2,078 2,278 2,428214.44 ** 207 212 215 229 259 278 297589.36 ** 119 131 138 149 156 172 185
173.69 ** 197 222 240 255 274 293 319197.90 ** 198 221 215 237 269 299 304119.37 ** 78 91 98 103 105 118 132
57.49 * 127 143 156 167 176 181 219199.35 ** 101 170 190 202 205 205 219
30.76 * 549 580 699 746 777 840 88699.29 ** 320 334 382 399 422 438 494
5,511.90 237 260 281 307 331 354 375
106.63 ** 366 388 438 492 516 552 57793.09 * 208 226 242 279 308 332 329
107.12 * 329 362 399 415 451 487 48728.73 * 378 409 447 490 537 575 626
246.65 * 233 251 275 287 299 313 330
Land Area
1 - 13

Table 1.3 - ContinuedPOPULATION, LAND AREA AND DENSITY BY PROVINCE/CITY/MUNICIPALITYCensus Years 1990 - 2020(Land Area in square kilometers; Density in persons per square kilometer)
Province and PopulationCity / Municipality 1990 1995 2000 2007 2010 2015 2020
Bula 48,240 54,650 57,474 62,024 68,011 69,430 73,143Cabusao 15,305 15,966 16,201 17,599 18,049 18,397 19,257Calabanga 54,261 59,164 67,408 73,333 78,119 83,033 88,906Camaligan 15,436 17,411 19,188 20,758 22,254 24,109 25,036Canaman 20,298 22,732 27,719 31,583 32,390 34,210 36,205
Caramoan 36,107 39,416 39,642 40,810 44,945 47,605 51,728Del Gallego 17,047 18,760 20,456 21,272 23,064 25,397 26,403Gainza 7,095 7,743 8,412 9,404 10,345 11,262 11,584Garchitorena 19,439 19,481 23,021 24,825 25,204 27,010 29,436Goa 39,888 43,206 48,490 54,035 58,503 63,308 71,368
Iriga City 74,269 82,482 88,893 97,983 105,919 111,757 114,457Lagonoy 38,163 40,126 42,636 46,093 51,814 55,465 56,714Libmanan 77,565 85,337 88,476 92,839 100,002 108,716 112,994Lupi 24,809 25,390 26,148 27,630 30,118 32,167 33,897Magarao 16,623 18,264 20,964 22,515 24,274 25,694 26,742
Milaor 18,199 21,213 22,635 26,452 28,474 31,150 33,963Minalabac 35,922 37,574 41,734 43,957 48,162 52,390 53,981Nabua 60,885 65,988 70,909 75,422 80,111 83,874 86,490Naga City 115,329 126,972 137,810 160,516 174,931 196,003 209,170Ocampo 30,876 34,898 36,316 39,759 43,523 45,934 51,073
Pamplona 24,097 26,176 29,177 31,895 34,471 36,390 39,333Pasacao 31,960 36,070 38,423 41,533 45,946 49,035 53,461PILI 52,481 61,520 67,393 76,496 82,307 89,545 99,196Presentacion 14,788 15,346 16,410 20,266 20,023 20,996 22,591Ragay 41,438 44,154 47,743 52,021 54,934 58,214 59,770
Sagñay 22,422 26,530 26,619 29,082 31,314 34,546 36,841San Fernando 20,608 24,196 27,433 30,697 33,281 35,258 38,626San Jose 27,517 31,362 32,512 35,768 38,523 40,623 43,973Sipocot 49,501 53,392 56,576 57,861 64,042 64,855 68,169Siruma 13,103 13,870 16,339 17,035 17,050 17,764 19,419
Tigaon 33,650 39,186 40,210 45,509 48,611 55,272 60,524Tinambac 46,570 49,185 55,608 59,125 62,435 67,572 70,176
Catanduanes 187,000 202,464 215,356 232,757 246,300 260,964 271,879
Bagamanoc 10,179 10,407 9,684 10,183 11,370 11,551 11,086Baras 9,769 11,843 11,653 11,787 12,243 12,848 13,484Bato 15,331 16,535 17,761 18,738 19,984 21,279 21,748Caramoran 20,999 21,963 23,790 25,618 28,063 30,056 32,114Gigmoto 6,487 6,736 7,055 7,569 8,003 8,368 8,712
Pandan 15,784 15,725 17,696 19,005 19,393 20,516 21,473Panganiban 8,344 8,480 8,877 9,290 9,738 9,287 9,713San Andres 26,727 30,242 31,463 33,781 35,779 36,779 38,480San Miguel 11,587 12,052 12,205 12,966 14,107 15,006 15,680Viga 16,270 18,569 18,105 19,266 20,669 21,624 22,869
VIRAC 45,523 49,912 57,067 64,554 66,951 73,650 76,520
* Land area was based on cadastral survey (certified and provided to the DBM) from the LMB, DENR. ** Estimated land area (certified and provided to the DBM) from the LMB, DENR.
1 - 14

Density1990 1995 2000 2007 2010 2015 2020
Land Area
167.64 ** 288 326 343 370 406 414 43646.80 ** 327 341 346 376 386 393 411
163.80 ** 331 361 412 448 477 507 5434.68 * 3,298 3,720 4,100 4,435 4,755 5,151 5,350
43.27 * 469 525 641 730 749 791 837
276.00 * 131 143 144 148 163 172 187208.31 ** 82 90 98 102 111 122 127
14.75 * 481 525 570 638 701 764 785243.80 ** 80 80 94 102 103 111 121206.18 * 193 210 235 262 284 307 346
137.35 * 541 601 647 713 771 814 833377.90 ** 101 106 113 122 137 147 150359.80 * 216 237 246 258 278 302 314199.12 ** 125 128 131 139 151 162 170
44.97 * 370 406 466 501 540 571 595
33.64 ** 541 631 673 786 846 926 1,010126.10 ** 285 298 331 349 382 415 428
96.20 ** 633 686 737 784 833 872 89977.40 * 1,490 1,640 1,780 2,074 2,260 2,532 2,702
118.33 ** 261 295 307 336 368 388 432
80.60 ** 299 325 362 396 428 451 488149.54 ** 214 241 257 278 307 328 358126.25 * 416 487 534 606 652 709 786143.80 ** 103 107 114 141 139 146 157400.22 ** 104 110 119 130 137 145 149
154.76 ** 145 171 172 188 202 223 23871.76 ** 287 337 382 428 464 491 53848.04 * 573 653 677 745 802 846 915
243.43 * 203 219 232 238 263 266 280141.27 * 93 98 116 121 121 126 137
72.35 * 465 542 556 629 672 764 837351.62 * 132 140 158 168 178 192 200
1,492.16 125 136 144 156 165 175 182
80.74 * 126 129 120 126 141 143 137109.50 ** 89 108 106 108 112 117 123
48.62 * 315 340 365 385 411 438 447263.74 * 80 83 90 97 106 114 122181.82 ** 36 37 39 42 44 46 48
119.90 ** 132 131 148 159 162 171 17979.96 * 104 106 111 116 122 116 121
167.31 * 160 181 188 202 214 220 230129.94 * 89 93 94 100 109 115 121158.23 * 103 117 114 122 131 137 145
152.40 ** 299 328 374 424 439 483 502
1 - 15

Table 1.3 - ContinuedPOPULATION, LAND AREA AND DENSITY BY PROVINCE/CITY/MUNICIPALITYCensus Years 1990 - 2020(Land Area in square kilometers; Density in persons per square kilometer)
Province and PopulationCity / Municipality 1990 1995 2000 2007 2010 2015 2020
Masbate 599,355 653,852 707,668 768,939 834,650 892,393 908,920
Aroroy 53,060 55,110 58,751 62,635 76,139 86,168 88,351Baleno 17,390 18,105 19,897 21,639 24,401 26,096 28,855Balud 26,121 27,933 30,068 31,484 35,841 38,124 40,155Batuan 10,525 12,705 12,038 12,585 13,764 15,086 14,610Cataingan 39,496 42,065 46,593 48,827 49,078 50,327 50,623
Cawayan 38,336 45,834 52,256 59,658 63,115 67,033 69,265Claveria 31,211 35,648 38,398 40,336 41,572 43,693 42,142Dimasalang 17,367 20,566 21,550 22,723 25,245 26,192 24,909Esperanza 14,674 17,023 16,209 16,834 17,357 18,568 17,534Mandaon 25,670 28,716 31,572 34,401 38,161 41,262 44,122
MASBATE CITY 3/ 58,714 66,049 71,441 81,585 85,227 95,389 104,522Milagros 33,305 38,925 44,575 48,185 52,619 57,473 57,538Mobo 24,879 25,049 28,233 32,740 34,896 38,813 40,823Monreal 18,796 18,775 19,832 21,693 25,366 26,614 25,164Palanas 21,763 23,580 24,666 24,830 25,501 26,222 27,322
Pio V. Corpuz 18,847 20,649 21,519 22,102 23,292 23,236 23,744Placer 38,568 40,394 44,418 48,469 55,438 55,826 56,340San Fernando 16,904 18,722 19,179 19,565 21,309 23,057 21,600San Jacinto 23,068 24,048 24,780 26,508 27,974 30,372 29,686San Pascual 33,396 34,705 37,868 41,736 44,753 46,674 44,449
Uson 37,265 39,251 43,825 50,404 53,602 56,168 57,166
Sorsogon 522,960 591,927 650,535 709,673 740,743 792,949 828,655
Bacon 32,810 38,603 42,166Barcelona 16,251 18,405 19,041 19,428 20,340 20,990 20,987Bulan 66,450 74,219 82,688 91,730 93,943 100,076 105,190Bulusan 18,009 19,501 20,469 21,374 22,089 22,884 23,932Casiguran 22,277 25,804 28,057 30,165 30,995 32,842 35,602
Castilla 34,702 40,506 45,072 49,407 52,903 57,827 60,635Donsol 33,159 36,013 39,995 43,996 47,563 49,711 50,281Gubat 43,296 49,716 52,707 55,501 57,327 59,534 60,294Irosin 37,887 41,005 45,507 49,968 51,777 56,662 59,267Juban 20,671 23,803 26,848 28,989 30,335 32,320 35,297
Magallanes 24,754 28,707 31,315 34,418 35,443 37,038 37,411Matnog 25,957 29,309 32,712 34,517 37,641 41,101 41,989Pilar 46,268 51,318 57,898 63,539 68,245 74,564 75,793Prieto Diaz 15,324 18,106 18,925 19,762 20,478 22,442 22,644Santa Magdalena 12,274 13,900 14,623 15,425 16,520 16,848 17,096
SORSOGON CITY 4/ 72,871 83,012 92,512 151,454 155,144 168,110 182,237
3/ Converted into a city under Republic Act (RA) No. 8807; ratified on September 30, 2000. 4/ Converted into a city under Republic Act No. 8806; ratified on December 16, 2000;
taken from municipalities of Sorsogon and Bacon. * Land area was based on cadastral survey (certified and provided to the DBM) from the LMB, DENR. ** Estimated land area (certified and provided to the DBM) from the LMB, DENR.
1 - 16

Density1990 1995 2000 2007 2010 2015 2020
Land Area
4,138.56 145 158 171 186 202 216 220
440.30 ** 121 125 133 142 173 196 201204.38 ** 85 89 97 106 119 128 141231.00 * 113 121 130 136 155 165 174
56.28 ** 187 226 214 224 245 268 260191.64 * 206 220 243 255 256 263 264
260.19 ** 147 176 201 229 243 258 266182.98 * 171 195 210 220 227 239 230148.07 ** 117 139 146 153 170 177 168
67.49 * 217 252 240 249 257 275 260319.15 * 80 90 99 108 120 129 138
188.00 * 312 351 380 434 453 507 556565.30 ** 59 69 79 85 93 102 102143.47 ** 173 175 197 228 243 271 285128.67 ** 146 146 154 169 197 207 196119.53 * 182 197 206 208 213 219 229
89.33 * 211 231 241 247 261 260 266193.03 * 200 209 230 251 287 289 292
77.50 ** 218 242 247 252 275 298 279122.40 ** 188 196 202 217 229 248 243246.65 * 135 141 154 169 181 189 180
163.20 ** 228 241 269 309 328 344 350
2,119.01 247 279 307 335 350 374 391
197 232 25361.18 * 266 301 311 318 332 343 343
196.96 * 337 377 420 466 477 508 53496.30 ** 187 203 213 222 229 238 24987.13 * 256 296 322 346 356 377 409
186.20 ** 186 218 242 265 284 311 326156.20 ** 212 231 256 282 305 318 322134.51 * 322 370 392 413 426 443 448149.87 * 253 274 304 333 345 378 395121.49 * 170 196 221 239 250 266 291
150.09 * 165 191 209 229 236 247 249162.40 ** 160 180 201 213 232 253 259248.00 ** 187 207 233 256 275 301 306
49.07 ** 312 369 386 403 417 457 46143.50 ** 282 320 336 355 380 387 393
276.11 ** 264 301 335 549 562 609 660
1 - 17

Figure 1.2 POPULATION DISTRIBUTION BY PROVINCE, REGION VCENSUS YEAR 2020
Figure 1.3 LAND AREA AND POPULATION DENSITY BY PROVINCE, REGION VCENSUS YEAR 2020
0
50
100
150
200
250
300
350
400
450
500
550
600
0
500
1,000
1,500
2,000
2,500
3,000
3,500
4,000
4,500
5,000
5,500
6,000
Po
pu
lati
on
De
ns
ity
(pe
rso
ns
/sq
.km
.)
La
nd
Are
a (
sq
.km
.)
Land Area
Density
Camarines Sur34.0%
Albay22.6%
Masbate14.9%
Sorsogon13.6%
Camarines Norte10.4%
Catanduanes4.5%
1 - 18

Table 1.4 TOTAL POPULATION, URBAN POPULATION AND PERCENT URBAN BY PROVINCEAND CITY/MUNICIPALITYCensus Years 2010 - 2015
Province and Total Population Urban Population Percent UrbanCity / Municipality 2010 2015 2010 2015 2,010.0 2,015.0
Region V 5,420,411 5,796,989 831,380 1,344,903 15.3 23.2
Albay 1,233,432 1,314,826 225,217 355,566 18.3 27.0
Bacacay 65,724 68,906 7,468 14,594 11.4 21.2Camalig 63,585 66,904 7,802 10,905 12.3 16.3Daraga 115,804 126,595 36,298 60,993 31.3 48.2Guinobatan 75,967 82,361 6,497 17,357 8.6 21.1Jovellar 16,899 17,308 - - - -
LEGAZPI CITY 182,201 196,639 90,862 112,389 49.9 57.2Libon 71,527 75,172 6,767 8,179 9.5 10.9Ligao City 104,914 111,399 3,184 16,884 3.0 15.2Malilipot 35,567 37,785 - 5,110 - 13.5Malinao 42,770 45,301 - 3,761 - 8.3
Manito 22,819 24,707 3,192 6,098 14.0 24.7Oas 64,785 67,960 - - - - Pio Duran 45,028 46,693 - - - - Polangui 82,307 88,221 - 14,454 - 16.4Rapu-Rapu 35,875 36,920 6,217 5,840 17.3 15.8
Santo Domingo 32,414 34,967 - 4,739 - 13.6Tabaco City 125,083 133,868 42,772 60,909 34.2 45.5Tiwi 50,163 53,120 14,158 13,354 28.2 25.1
Camarines Norte 542,915 583,313 109,050 176,113 20.1 30.2
Basud 38,176 41,017 - - - - Capalonga 31,299 32,215 - - - - DAET 95,572 104,799 53,545 80,229 56.0 76.6Jose Panganiban 55,557 59,639 16,595 19,882 29.9 33.3Labo 92,041 101,082 5,337 23,566 5.8 23.3
Mercedes 47,674 50,841 6,690 7,448 14.0 14.6Paracale 53,243 59,149 12,601 23,850 23.7 40.3San Lorenzo Ruiz 12,592 14,063 - - - - San Vicente 10,114 10,396 - - - - Santa Elena 40,828 40,786 14,282 14,862 35.0 36.4
Talisay 23,904 25,841 - 4,144 - 16.0Vinzons 41,915 43,485 - 2,132 - 4.9
Camarines Sur 1,822,371 1,952,544 353,130 580,544 19.4 29.7
Baao 54,971 58,849 7,176 21,654 13.1 36.8Balatan 28,699 30,922 5,515 11,008 19.2 15.6Bato 48,306 52,137 - 7,472 - 14.3Bombon 15,437 16,512 - - - - Buhi 73,809 77,143 5,830 12,429 7.9 16.1
Source: Philippine Statistics Authority
1 - 19

Table 1.4 - ContinuedTOTAL POPULATION, URBAN POPULATION AND PERCENT URBAN BY PROVINCEAND CITY/MUNICIPALITYCensus Years 2010 - 2015
Province and Total Population Urban Population Percent UrbanCity / Municipality 2010 2015 2010 2015 2,010.0 2,015.0
Bula 68,011 69,430 5,624 5,963 8.3 8.6Cabusao 18,049 18,397 5,116 5,143 28.3 28.0Calabanga 78,119 83,033 10,582 27,635 13.5 33.3Camaligan 22,254 24,109 - 4,510 - 18.7Canaman 32,390 34,210 - - - -
Caramoan 44,945 47,605 - 2,142 - 4.5Del Gallego 23,064 25,397 - 497 - 2.0Gainza 10,345 11,262 - - - - Garchitorena 25,204 27,010 - - - - Goa 58,503 63,308 1,762 11,426 3.0 18.0
Iriga City 105,919 111,757 45,526 59,408 43.0 53.2Lagonoy 51,814 55,465 - - - - Libmanan 100,002 108,716 1,990 13,974 2.0 12.9Lupi 30,118 32,167 - - - - Magarao 24,274 25,694 - 8,676 - 33.8
Milaor 28,474 31,150 2,996 4,740 10.5 15.2Minalabac 48,162 52,390 5,795 6,529 12.0 12.5Nabua 80,111 83,874 13,635 28,836 17.0 34.4Naga City 174,931 196,003 160,423 184,534 91.7 94.1Ocampo 43,523 45,934 - 5,063 - 11.0
Pamplona 34,471 36,390 5,077 19,057 14.7 52.4Pasacao 45,946 49,035 13,375 21,619 29.1 44.1PILI 82,307 89,545 40,234 60,372 48.9 67.4Presentacion 20,023 20,996 5,088 8,692 25.4 41.4Ragay 54,934 58,214 - 8,407 - 14.4
Sagñay 31,314 34,546 - - - - San Fernando 33,281 35,258 5,273 7,857 15.8 22.3San Jose 38,523 40,623 - 3,735 - 9.2Sipocot 64,042 64,855 5,854 5,779 9.1 8.9Siruma 17,050 17,764 - 7,620 - 42.9
Tigaon 48,611 55,272 6,259 7,901 12.9 14.3Tinambac 62,435 67,572 - 7,866 - 11.6
Catanduanes 246,300 260,964 6,681 17,682 2.7 6.8
Bagamanoc 11,370 11,551 - - - - Baras 12,243 12,848 - - - - Bato 19,984 21,279 558 607 2.8 2.9Caramoran 28,063 30,056 - - - - Gigmoto 8,003 8,368 - - - -
Pandan 19,393 20,516 - - - - Panganiban 9,738 9,287 - - - - San Andres 35,779 36,779 152 178 0.4 0.5San Miguel 14,107 15,006 - 717 - 4.8Viga 20,669 21,624 - - - -
VIRAC 66,951 73,650 5,971 16,180 8.9 22.0
1 - 20

Table 1.4 - ContinuedTOTAL POPULATION, URBAN POPULATION AND PERCENT URBAN BY PROVINCEAND CITY/MUNICIPALITYCensus Years 2010 - 2015
Province and Total Population Urban Population Percent UrbanCity / Municipality 2010 2015 2010 2015 2,010.0 2,015.0
Masbate 834,650 892,393 74,013 99,029 8.9 11.1
Aroroy 76,139 86,168 11,919 18,630 15.7 21.6Baleno 24,401 26,096 - - - - Balud 35,841 38,124 - - - - Batuan 13,764 15,086 - - - - Cataingan 49,078 50,327 7,595 7,745 15.5 15.4
Cawayan 63,115 67,033 2,199 10,286 3.5 15.3Claveria 41,572 43,693 - - - - Dimasalang 25,245 26,192 - 2,627 - 10.0Esperanza 17,357 18,568 - - - - Mandaon 38,161 41,262 - - - -
MASBATE CITY 85,227 95,389 46,376 49,937 54.4 52.4Milagros 52,619 57,473 - - - - Mobo 34,896 38,813 - 3,511 - 9.0Monreal 25,366 26,614 5,924 6,293 23.4 23.6Palanas 25,501 26,222 - - - -
Pio V. Corpuz 23,292 23,236 - - - - Placer 55,438 55,826 - - - - San Fernando 21,309 23,057 - - - - San Jacinto 27,974 30,372 - - - - San Pascual 44,753 46,674 - - - -
Uson 53,602 56,168 - - - -
Sorsogon 740,743 792,949 63,289 115,969 8.5 14.6
Barcelona 20,340 20,990 - - - - Bulan 93,943 100,076 7,127 7,573 7.6 7.6Bulusan 22,089 22,884 - - - - Casiguran 30,995 32,842 - - - - Castilla 52,903 57,827 6,010 10,567 11.4 18.3
Donsol 47,563 49,711 - 3,061 - 6.2Gubat 57,327 59,534 - 7,205 - 12.1Irosin 51,777 56,662 2,793 7,557 5.4 13.3Juban 30,335 32,320 - - - - Magallanes 35,443 37,038 - - - -
Matnog 37,641 41,101 - - - - Pilar 68,245 74,564 - 4,196 - 5.6Prieto Diaz 20,478 22,442 - - - - Santa Magdalena 16,520 16,848 - - - - SORSOGON CITY 155,144 168,110 47,359 75,810 30.5 45.1
1 - 21

Table 1.5A HOUSEHOLD POPULATION BY SEX, AGE GROUP AND PROVINCE/CITYCensus Years 1995 - 2015
Province/ 1995 2000Age Group Both Sexes Female Male Both Sexes Female Male
Region V
All Ages 4,319,172 2,128,812 2,190,360 4,681,111 2,292,382 2,388,729
Under 1 127,733 61,860 65,873 131,975 63,958 68,0171 - 4 524,921 254,378 270,543 524,515 254,547 269,9685 - 9 625,050 303,739 321,311 660,189 319,886 340,303
10 - 14 567,255 277,264 289,991 606,783 296,153 310,63015 - 19 465,618 224,440 241,178 486,161 233,064 253,097
20 - 24 338,322 164,969 173,353 375,210 181,990 193,22025 - 29 304,424 150,673 153,751 308,272 150,171 158,10130 - 34 261,953 129,362 132,591 296,304 145,187 151,11735 - 39 234,569 116,308 118,261 265,666 128,149 137,51740 - 44 192,200 95,891 96,309 231,811 112,422 119,389
45 - 49 164,507 82,742 81,765 191,235 93,135 98,10050 - 54 136,094 69,216 66,878 160,978 80,605 80,37355 - 59 113,283 58,183 55,100 128,792 64,973 63,81960 - 64 89,963 46,323 43,640 108,609 56,392 52,21765 - 69 70,602 37,323 33,279 78,318 41,072 37,246
70 - 74 46,698 24,857 21,841 58,993 32,088 26,90575 & over 55,980 31,284 24,696 67,300 38,590 28,710
Albay 1/
All Ages 1,003,719 496,882 506,837 1,090,019 536,772 553,247
Under 1 28,202 13,522 14,680 28,726 13,900 14,8261 - 4 116,522 56,073 60,449 115,002 55,642 59,3605 - 9 140,417 68,207 72,210 147,893 71,363 76,530
10 - 14 132,635 64,900 67,735 138,860 67,834 71,02615 - 19 111,664 54,116 57,548 117,730 57,068 60,662
20 - 24 79,612 38,979 40,633 90,942 44,351 46,59125 - 29 70,255 34,852 35,403 73,316 36,118 37,19830 - 34 60,768 30,304 30,464 70,074 34,558 35,51635 - 39 54,792 27,673 27,119 62,223 30,281 31,94240 - 44 45,865 23,185 22,680 54,559 27,115 27,444
45 - 49 40,342 20,299 20,043 46,123 22,608 23,51550 - 54 31,774 16,264 15,510 39,861 20,050 19,81155 - 59 26,485 13,603 12,882 30,018 15,184 14,83460 - 64 21,325 11,055 10,270 25,071 13,011 12,06065 - 69 17,373 9,422 7,951 18,587 9,957 8,630
70 - 74 11,391 6,195 5,196 14,549 8,117 6,43275 & over 14,297 8,233 6,064 16,485 9,615 6,870
1/ Includes household population of Legazpi City, Ligao City and Tabaco City.
Source: Philippine Statistics Authority
1 - 22

2007 2010 2015Both Sexes Female Male Both Sexes Female Male Both Sexes Female Male
5,097,293 2,492,016 2,605,277 5,411,521 2,650,970 2,760,551 5,780,963 2,841,544 2,939,419
133,059 64,462 68,597 130,207 62,665 67,542 129,315 61,730 67,585557,480 270,548 286,932 532,874 257,091 275,783 557,123 268,226 288,897706,589 341,042 365,547 698,978 337,442 361,536 705,753 340,493 365,260683,951 331,395 352,556 689,917 332,860 357,057 708,201 342,132 366,069527,319 243,600 283,719 593,956 281,354 312,602 622,896 297,987 324,909
364,730 171,169 193,561 436,191 206,494 229,697 484,345 234,605 249,740330,719 160,592 170,127 359,445 173,092 186,353 398,493 193,938 204,555304,268 149,590 154,678 337,480 164,145 173,335 356,166 173,119 183,047297,639 146,154 151,485 306,921 150,697 156,224 338,421 165,150 173,271265,138 130,166 134,972 291,031 142,623 148,408 299,657 146,717 152,940
226,069 111,324 114,745 251,550 123,560 127,990 282,930 138,885 144,045189,000 94,493 94,507 212,880 106,298 106,582 239,772 118,550 121,222151,713 77,357 74,356 170,226 86,830 83,396 200,028 100,840 99,188117,604 62,225 55,379 135,008 71,772 63,236 156,568 81,727 74,841
92,840 50,295 42,545 99,972 55,021 44,951 116,830 64,101 52,729
67,251 37,654 29,597 75,345 43,310 32,035 80,674 46,564 34,11081,924 49,950 31,974 89,540 55,716 33,824 103,791 66,780 37,011
1,184,813 582,149 602,664 1,231,607 606,811 624,796 1,312,309 648,865 663,444
28,239 13,784 14,455 27,444 13,001 14,443 26,662 12,607 14,055119,087 57,515 61,572 113,013 54,319 58,694 115,965 55,523 60,442155,515 74,660 80,855 149,539 72,152 77,387 150,938 72,540 78,398154,330 74,699 79,631 148,515 71,462 77,053 152,839 74,032 78,807127,726 60,100 67,626 136,122 65,198 70,924 141,412 68,255 73,157
91,096 43,136 47,960 103,319 49,603 53,716 114,354 55,784 58,57080,660 38,975 41,685 86,547 41,825 44,722 93,353 45,884 47,46972,047 35,624 36,423 79,989 39,113 40,876 84,855 41,444 43,41170,697 34,960 35,737 71,958 35,565 36,393 80,440 39,401 41,03962,617 30,774 31,843 68,433 33,696 34,737 70,804 35,075 35,729
53,953 27,063 26,890 59,211 29,349 29,862 66,488 32,679 33,80945,429 23,060 22,369 50,304 25,626 24,678 56,468 28,074 28,39437,496 19,262 18,234 41,309 21,227 20,082 47,211 24,338 22,87328,177 14,937 13,240 33,422 17,816 15,606 38,131 20,186 17,94521,940 12,029 9,911 23,232 12,923 10,309 28,795 15,875 12,920
15,859 9,033 6,826 17,509 10,105 7,404 18,981 11,059 7,92219,945 12,538 7,407 21,741 13,831 7,910 24,613 16,109 8,504
1 - 23

Table 1.5A - Continued
HOUSEHOLD POPULATION BY SEX, AGE GROUP AND PROVINCE/CITYCensus Years 1995 - 2015
Province/ 1995 2000Age Group Both Sexes Female Male Both Sexes Female Male
Camarines Norte
All Ages 438,477 214,000 224,477 470,087 229,175 240,912
Under 1 13,029 6,425 6,604 12,953 6,269 6,6841 - 4 53,191 25,775 27,416 52,349 25,441 26,9085 - 9 64,064 30,942 33,122 64,728 31,493 33,235
10 - 14 56,488 27,645 28,843 60,617 29,443 31,17415 - 19 46,015 22,062 23,953 48,742 23,509 25,233
20 - 24 35,010 16,925 18,085 38,977 18,719 20,25825 - 29 33,098 16,045 17,053 32,030 15,560 16,47030 - 34 28,728 13,971 14,757 31,947 15,382 16,56535 - 39 25,135 12,059 13,076 28,382 13,509 14,87340 - 44 20,284 9,923 10,361 24,400 11,636 12,764
45 - 49 16,561 8,108 8,453 19,592 9,487 10,10550 - 54 13,170 6,613 6,557 15,614 7,749 7,86555 - 59 10,598 5,374 5,224 12,157 6,117 6,04060 - 64 8,271 4,184 4,087 9,809 5,088 4,72165 - 69 6,108 3,184 2,924 7,130 3,718 3,412
70 - 74 4,020 2,177 1,843 4,944 2,688 2,25675 & over 4,707 2,588 2,119 5,716 3,367 2,349
Camarines Sur 2/
All Ages 1,430,167 705,141 725,026 1,549,388 759,434 789,954
Under 1 40,137 19,313 20,824 43,096 21,034 22,0621 - 4 170,189 82,299 87,890 172,375 83,858 88,5175 - 9 208,345 101,188 107,157 215,516 104,260 111,256
10 - 14 188,465 92,236 96,229 202,348 98,960 103,38815 - 19 159,390 77,591 81,799 164,606 79,193 85,413
20 - 24 115,480 56,486 58,994 127,867 62,091 65,77625 - 29 101,777 50,459 51,318 102,066 50,095 51,97130 - 34 86,841 43,042 43,799 96,964 47,567 49,39735 - 39 77,701 38,703 38,998 87,637 42,428 45,20940 - 44 64,250 31,986 32,264 76,973 37,505 39,468
45 - 49 54,760 27,491 27,269 64,429 31,298 33,13150 - 54 43,906 22,260 21,646 53,897 26,947 26,95055 - 59 35,969 18,486 17,483 41,398 20,761 20,63760 - 64 28,568 14,638 13,930 34,637 17,961 16,67665 - 69 22,530 11,804 10,726 25,053 13,147 11,906
70 - 74 14,946 7,889 7,057 18,953 10,164 8,78975 & over 16,913 9,270 7,643 21,573 12,165 9,408
2/ Includes household population of Iriga City and Naga City.
1 - 24

2007 2010 2015Both Sexes Female Male Both Sexes Female Male Both Sexes Female Male
512,881 250,282 262,599 542,315 264,818 277,497 581,809 285,551 296,258
13,896 6,720 7,176 13,563 6,611 6,952 13,869 6,603 7,26653,485 25,835 27,650 53,495 25,833 27,662 58,147 28,139 30,00869,625 33,585 36,040 67,349 32,439 34,910 70,867 34,361 36,50667,598 32,947 34,651 67,582 32,622 34,960 67,723 32,659 35,06452,776 24,526 28,250 57,766 27,643 30,123 60,019 28,935 31,084
37,368 17,604 19,764 44,927 21,155 23,772 48,218 23,397 24,82134,023 16,703 17,320 36,821 17,944 18,877 41,187 19,839 21,34831,705 15,556 16,149 34,707 16,823 17,884 36,504 17,857 18,64731,773 15,590 16,183 31,828 15,532 16,296 34,321 16,816 17,50528,357 13,737 14,620 31,187 15,056 16,131 30,550 14,839 15,711
23,948 11,507 12,441 26,479 12,789 13,690 30,004 14,528 15,47619,711 9,653 10,058 22,177 10,733 11,444 25,315 12,334 12,98115,169 7,638 7,531 17,176 8,658 8,518 20,651 10,147 10,50411,357 5,928 5,429 13,350 6,984 6,366 15,950 8,207 7,743
8,848 4,816 4,032 9,336 5,120 4,216 11,522 6,262 5,260
5,971 3,385 2,586 6,798 3,921 2,877 7,597 4,425 3,1727,271 4,552 2,719 7,774 4,955 2,819 9,365 6,203 3,162
1,690,203 825,297 864,906 1,818,699 889,817 928,882 1,947,487 955,872 991,615
43,151 20,573 22,578 44,035 21,181 22,854 43,745 20,982 22,763181,732 87,778 93,954 180,248 87,040 93,208 187,372 89,976 97,396234,157 113,068 121,089 237,281 114,528 122,753 238,263 114,803 123,460222,079 107,508 114,571 228,669 110,311 118,358 239,922 116,056 123,866177,365 82,341 95,024 198,605 94,179 104,426 210,756 101,047 109,709
127,029 59,530 67,499 151,809 71,615 80,194 164,806 79,224 85,582112,662 54,656 58,006 123,959 59,393 64,566 138,466 67,465 71,001101,801 50,155 51,646 114,764 55,772 58,992 122,417 59,456 62,961
97,612 48,036 49,576 101,744 50,005 51,739 114,962 55,947 59,01587,620 43,298 44,322 95,818 47,158 48,660 99,533 48,738 50,795
75,189 37,120 38,069 83,438 41,092 42,346 92,921 45,747 47,17463,752 31,868 31,884 71,243 35,638 35,605 79,228 39,333 39,89550,718 25,717 25,001 57,331 29,105 28,226 66,324 33,476 32,84838,473 20,353 18,120 44,969 23,858 21,111 52,203 27,127 25,07629,547 15,971 13,576 32,145 17,591 14,554 38,494 21,082 17,412
21,229 11,818 9,411 23,858 13,677 10,181 25,596 14,707 10,88926,087 15,507 10,580 28,783 17,674 11,109 32,479 20,706 11,773
1 - 25

Table 1.5A - Continued
HOUSEHOLD POPULATION BY SEX, AGE GROUP AND PROVINCE/CITYCensus Years 1995 - 2015
Province/ 1995 2000Age Group Both Sexes Female Male Both Sexes Female Male
Catanduanes
All Ages 202,243 99,331 102,912 215,151 105,751 109,400
Under 1 6,073 2,989 3,084 5,821 2,728 3,0931 - 4 24,430 11,762 12,668 23,261 11,383 11,8785 - 9 28,306 13,809 14,497 30,068 14,564 15,504
10 - 14 26,054 12,504 13,550 27,622 13,450 14,17215 - 19 20,500 9,616 10,884 22,307 10,648 11,659
20 - 24 14,540 7,003 7,537 16,664 8,022 8,64225 - 29 13,949 6,864 7,085 13,659 6,511 7,14830 - 34 11,856 5,810 6,046 12,970 6,384 6,58635 - 39 10,555 5,170 5,385 11,756 5,680 6,07640 - 44 8,396 4,203 4,193 9,756 4,696 5,060
45 - 49 7,604 3,892 3,712 8,167 4,094 4,07350 - 54 6,861 3,478 3,383 7,315 3,776 3,53955 - 59 6,228 3,236 2,992 6,593 3,361 3,23260 - 64 5,243 2,705 2,538 6,042 3,214 2,82865 - 69 4,451 2,348 2,103 4,595 2,400 2,195
70 - 74 3,043 1,594 1,449 3,740 2,043 1,69775 & over 4,154 2,348 1,806 4,815 2,797 2,018
Masbate 3/
All Ages 653,641 323,048 330,593 707,055 345,837 361,218
Under 1 22,352 10,929 11,423 22,601 11,036 11,5651 - 4 86,990 42,725 44,265 87,681 42,730 44,9515 - 9 98,889 48,354 50,535 108,236 53,002 55,234
10 - 14 86,335 42,428 43,907 93,163 45,606 47,55715 - 19 65,965 31,540 34,425 68,134 32,429 35,705
20 - 24 49,479 24,231 25,248 51,419 25,194 26,22525 - 29 44,312 22,109 22,203 45,713 21,899 23,81430 - 34 38,268 18,886 19,382 42,871 20,998 21,87335 - 39 35,027 17,312 17,715 38,610 18,469 20,14140 - 44 27,958 13,979 13,979 34,519 16,502 18,017
45 - 49 22,964 11,657 11,307 27,259 13,198 14,06150 - 54 20,404 10,505 9,899 21,791 10,877 10,91455 - 59 17,760 9,226 8,534 19,414 9,965 9,44960 - 64 13,705 7,127 6,578 17,400 9,045 8,35565 - 69 9,748 5,014 4,734 11,684 6,013 5,671
70 - 74 6,358 3,266 3,092 8,071 4,248 3,82375 & over 7,127 3,760 3,367 8,489 4,626 3,863
3/ Includes household population of Masbate City.
1 - 26

2007 2010 2015Both Sexes Female Male Both Sexes Female Male Both Sexes Female Male
232,290 113,122 119,168 245,574 119,691 125,883 258,874 126,467 132,407
5,826 2,886 2,940 5,777 2,711 3,066 5,793 2,833 2,96025,431 12,418 13,013 23,021 11,115 11,906 24,516 11,855 12,66130,987 14,734 16,253 30,668 14,635 16,033 30,932 14,808 16,12431,188 15,010 16,178 31,430 15,087 16,343 31,673 15,027 16,64623,976 10,923 13,053 27,649 12,882 14,767 27,688 12,943 14,745
16,013 7,417 8,596 19,480 9,133 10,347 20,876 10,018 10,85813,812 6,603 7,209 15,754 7,552 8,202 17,039 8,254 8,78513,178 6,480 6,698 14,522 7,072 7,450 15,609 7,547 8,06213,152 6,367 6,785 13,441 6,524 6,917 14,668 7,250 7,41812,275 5,939 6,336 13,254 6,403 6,851 13,308 6,451 6,857
10,380 4,956 5,424 11,478 5,558 5,920 13,058 6,308 6,7508,337 4,178 4,159 9,462 4,587 4,875 11,116 5,348 5,7686,936 3,558 3,378 7,597 3,906 3,691 9,080 4,468 4,6125,970 3,171 2,799 6,350 3,399 2,951 7,134 3,668 3,4665,226 2,855 2,371 5,364 2,962 2,402 5,510 3,026 2,484
3,961 2,199 1,762 4,469 2,579 1,890 4,293 2,492 1,8015,642 3,428 2,214 5,858 3,586 2,272 6,581 4,171 2,410
768,082 374,725 393,357 833,638 408,003 425,635 890,170 436,714 453,456
24,054 11,799 12,255 22,718 11,163 11,555 22,156 10,673 11,48397,916 47,868 50,048 93,543 45,420 48,123 97,884 47,695 50,189
118,775 57,942 60,833 119,143 57,880 61,263 122,243 59,567 62,676112,432 54,618 57,814 116,469 56,520 59,949 119,171 57,731 61,440
74,093 33,197 40,896 90,747 42,451 48,296 95,002 44,878 50,124
47,022 21,940 25,082 60,225 28,437 31,788 69,085 33,797 35,28845,401 22,084 23,317 49,827 23,744 26,083 56,113 26,988 29,12543,300 20,940 22,360 47,660 23,144 24,516 49,446 23,654 25,79241,948 20,366 21,582 45,186 22,074 23,112 47,145 22,766 24,37936,601 17,958 18,643 41,375 20,294 21,081 43,315 21,038 22,277
30,872 15,214 15,658 35,773 17,601 18,172 40,276 19,899 20,37725,725 12,894 12,831 30,652 15,329 15,323 34,070 16,888 17,18220,233 10,433 9,800 23,901 12,288 11,613 29,207 14,665 14,54215,994 8,594 7,400 17,991 9,601 8,390 21,965 11,433 10,53213,196 7,186 6,010 14,896 8,237 6,659 15,956 8,716 7,240
10,138 5,580 4,558 11,573 6,632 4,941 12,059 6,922 5,13710,382 6,112 4,270 11,959 7,188 4,771 15,077 9,404 5,673
1 - 27

Table 1.5A - Continued
HOUSEHOLD POPULATION BY SEX, AGE GROUP AND PROVINCE/CITYCensus Years 1995 - 2015
Province/ 1995 2000Age Group Both Sexes Female Male Both Sexes Female Male
Sorsogon 4/
All Ages 590,925 290,410 300,515 649,411 315,413 333,998
Under 1 17,940 8,682 9,258 18,778 8,991 9,7871 - 4 73,599 35,744 37,855 73,847 35,493 38,3545 - 9 85,029 41,239 43,790 93,748 45,204 48,544
10 - 14 77,278 37,551 39,727 84,173 40,860 43,31315 - 19 62,084 29,515 32,569 64,642 30,217 34,425
20 - 24 44,201 21,345 22,856 49,341 23,613 25,72825 - 29 41,033 20,344 20,689 41,488 19,988 21,50030 - 34 35,492 17,349 18,143 41,478 20,298 21,18035 - 39 31,359 15,391 15,968 37,058 17,782 19,27640 - 44 25,447 12,615 12,832 31,604 14,968 16,636
45 - 49 22,276 11,295 10,981 25,665 12,450 13,21550 - 54 19,979 10,096 9,883 22,500 11,206 11,29455 - 59 16,243 8,258 7,985 19,212 9,585 9,62760 - 64 12,851 6,614 6,237 15,650 8,073 7,57765 - 69 10,392 5,551 4,841 11,269 5,837 5,432
70 - 74 6,940 3,736 3,204 8,736 4,828 3,90875 & over 8,782 5,085 3,697 10,222 6,020 4,202
4/ Includes household population of Sorsogon City.
1 - 28

2007 2010 2015Both Sexes Female Male Both Sexes Female Male Both Sexes Female Male
709,024 346,441 362,583 739,688 361,830 377,858 790,314 388,075 402,239
17,893 8,700 9,193 16,670 7,998 8,672 17,090 8,032 9,05879,829 39,134 40,695 69,554 33,364 36,190 73,239 35,038 38,20197,530 47,053 50,477 94,998 45,808 49,190 92,510 44,414 48,09696,324 46,613 49,711 97,252 46,858 50,394 96,873 46,627 50,24671,383 32,513 38,870 83,067 39,001 44,066 88,019 41,929 46,090
46,202 21,542 24,660 56,431 26,551 29,880 67,006 32,385 34,62144,161 21,571 22,590 46,537 22,634 23,903 52,335 25,508 26,82742,237 20,835 21,402 45,838 22,221 23,617 47,335 23,161 24,17442,457 20,835 21,622 42,764 20,997 21,767 46,885 22,970 23,91537,668 18,460 19,208 40,964 20,016 20,948 42,147 20,576 21,571
31,727 15,464 16,263 35,171 17,171 18,000 40,183 19,724 20,45926,046 12,840 13,206 29,042 14,385 14,657 33,575 16,573 17,00221,161 10,749 10,412 22,912 11,646 11,266 27,555 13,746 13,80917,633 9,242 8,391 18,926 10,114 8,812 21,185 11,106 10,07914,083 7,438 6,645 14,999 8,188 6,811 16,553 9,140 7,413
10,093 5,639 4,454 11,138 6,396 4,742 12,148 6,959 5,18912,597 7,813 4,784 13,425 8,482 4,943 15,676 10,187 5,489
1 - 29

Table 1.5B HOUSEHOLD POPULATION BY SEX, AGE GROUP AND CITYCensus Years 2010 and 2015
2010 2015Both Sexes Female Male Both Sexes Female Male
Iriga City
All Ages 105,456 52,288 53,168 111,225 55,321 55,904
Under 1 2,353 1,179 1,174 2,259 1,072 1,1871 - 4 9,497 4,665 4,832 9,578 4,685 4,8935 - 9 12,680 6,149 6,531 12,450 6,116 6,334
10 - 14 12,274 5,906 6,368 12,919 6,270 6,64915 - 19 11,077 5,388 5,689 11,687 5,643 6,044
20 - 24 9,116 4,361 4,755 9,617 4,760 4,85725 - 29 7,411 3,499 3,912 8,437 4,101 4,33630 - 34 6,964 3,480 3,484 7,378 3,637 3,74135 - 39 6,233 3,103 3,130 6,975 3,437 3,53840 - 44 5,895 2,892 3,003 6,104 3,013 3,091
45 - 49 5,367 2,684 2,683 5,584 2,749 2,83550 - 54 4,348 2,212 2,136 4,887 2,482 2,40555 - 59 3,507 1,811 1,696 4,011 2,054 1,95760 - 64 3,033 1,636 1,397 3,149 1,676 1,47365 - 69 2,055 1,115 940 2,434 1,300 1,134
70 - 74 1,551 906 645 1,585 932 65375 & over 2,095 1,302 793 2,171 1,394 777
Legazpi City
All Ages 181,640 90,914 90,726 195,872 98,240 97,632
Under 1 3,805 1,796 2,009 3,632 1,648 1,9841 - 4 15,621 7,493 8,128 15,940 7,647 8,2935 - 9 19,999 9,535 10,464 20,614 9,987 10,627
10 - 14 19,673 9,468 10,205 20,553 9,898 10,65515 - 19 20,368 10,136 10,232 20,954 10,251 10,703
20 - 24 16,862 8,347 8,515 18,922 9,449 9,47325 - 29 14,340 7,078 7,262 15,486 7,703 7,78330 - 34 12,712 6,296 6,416 13,794 6,795 6,99935 - 39 11,378 5,784 5,594 12,635 6,254 6,38140 - 44 10,637 5,396 5,241 11,111 5,699 5,412
45 - 49 9,149 4,658 4,491 10,386 5,270 5,11650 - 54 7,742 4,089 3,653 8,728 4,476 4,25255 - 59 6,346 3,310 3,036 7,344 3,932 3,41260 - 64 4,706 2,505 2,201 5,804 3,157 2,64765 - 69 3,141 1,795 1,346 4,030 2,256 1,774
70 - 74 2,308 1,360 948 2,585 1,567 1,01875 & over 2,853 1,868 985 3,354 2,251 1,103
Ligao City
All Ages 104,738 51,373 53,365 111,241 54,655 56,586
Under 1 2,544 1,197 1,347 2,252 1,066 1,1861 - 4 10,100 4,837 5,263 10,157 4,880 5,2775 - 9 13,317 6,431 6,886 13,275 6,352 6,923
10 - 14 13,144 6,343 6,801 13,461 6,524 6,93715 - 19 11,580 5,510 6,070 12,325 5,985 6,340
Source: Philippine Statistics Authority
City / Age Group
1 - 30

Table 1.5B - Continued
HOUSEHOLD POPULATION BY SEX, AGE GROUP AND CITYCensus Years 2010 and 2015
2010 2015Both Sexes Female Male Both Sexes Female MaleCity / Age Group
20 - 24 8,583 4,137 4,446 9,862 4,758 5,10425 - 29 7,307 3,547 3,760 7,808 3,822 3,98630 - 34 6,618 3,242 3,376 7,128 3,495 3,63335 - 39 5,947 2,918 3,029 6,700 3,266 3,43440 - 44 5,713 2,779 2,934 5,902 2,929 2,973
45 - 49 4,826 2,343 2,483 5,506 2,667 2,83950 - 54 4,064 2,031 2,033 4,513 2,184 2,32955 - 59 3,259 1,684 1,575 3,752 1,905 1,84760 - 64 2,630 1,413 1,217 3,009 1,587 1,42265 - 69 1,904 1,029 875 2,199 1,176 1,023
70 - 74 1,500 865 635 1,451 820 63175 & over 1,702 1,067 635 1,941 1,239 702
Masbate City
All Ages 84,947 42,166 42,781 94,640 47,278 47,362
Under 1 2,246 1,090 1,156 2,306 1,108 1,1981 - 4 9,015 4,352 4,663 10,268 4,945 5,3235 - 9 11,350 5,487 5,863 12,363 6,012 6,351
10 - 14 11,021 5,411 5,610 11,969 5,869 6,10015 - 19 9,652 4,696 4,956 10,328 5,205 5,123
20 - 24 6,847 3,330 3,517 8,459 4,214 4,24525 - 29 5,744 2,783 2,961 6,639 3,263 3,37630 - 34 5,300 2,642 2,658 5,661 2,774 2,88735 - 39 4,672 2,314 2,358 5,286 2,618 2,66840 - 44 4,472 2,246 2,226 4,482 2,217 2,265
45 - 49 3,857 1,970 1,887 4,340 2,202 2,13850 - 54 3,220 1,613 1,607 3,628 1,862 1,76655 - 59 2,447 1,267 1,180 2,981 1,510 1,47160 - 64 1,699 926 773 2,085 1,123 96265 - 69 1,309 736 573 1,478 836 642
70 - 74 990 607 383 1,026 630 39675 & over 1,106 696 410 1,341 890 451
Naga City
All Ages 173,731 88,413 85,318 194,348 98,728 95,620
Under 1 3,785 1,818 1,967 3,818 1,859 1,9591 - 4 15,105 7,263 7,842 15,656 7,461 8,1955 - 9 19,289 9,332 9,957 20,245 9,751 10,494
10 - 14 19,738 9,642 10,096 20,000 9,805 10,19515 - 19 19,286 9,938 9,348 21,889 11,049 10,840
20 - 24 16,462 8,382 8,080 18,866 9,496 9,37025 - 29 13,714 6,914 6,800 15,908 8,077 7,83130 - 34 12,410 6,328 6,082 14,050 7,005 7,04535 - 39 10,591 5,476 5,115 13,085 6,686 6,39940 - 44 9,849 4,980 4,869 11,091 5,726 5,365
1 - 31

Table 1.5B - Continued
HOUSEHOLD POPULATION BY SEX, AGE GROUP AND CITYCensus Years 2010 and 2015
2010 2015Both Sexes Female Male Both Sexes Female MaleCity / Age Group
45 - 49 8,703 4,524 4,179 9,743 5,032 4,71150 - 54 7,369 3,866 3,503 8,458 4,439 4,01955 - 59 5,813 2,984 2,829 7,127 3,792 3,33560 - 64 4,158 2,303 1,855 5,362 2,883 2,47965 - 69 2,806 1,666 1,140 3,736 2,194 1,542
70 - 74 2,039 1,270 769 2,287 1,403 88475 & over 2,614 1,727 887 3,027 2,070 957
Sorsogon City
All Ages 154,678 76,876 77,802 166,967 83,050 83,917
Under 1 3,423 1,670 1,753 3,494 1,645 1,8491 - 4 13,942 6,671 7,271 14,832 7,097 7,7355 - 9 19,171 9,226 9,945 18,515 9,039 9,476
10 - 14 19,443 9,472 9,971 19,347 9,266 10,08115 - 19 17,201 8,297 8,904 18,797 9,118 9,679
20 - 24 12,105 5,874 6,231 14,619 7,144 7,47525 - 29 9,966 5,019 4,947 11,683 5,823 5,86030 - 34 9,947 4,963 4,984 10,471 5,228 5,24335 - 39 9,115 4,546 4,569 10,318 5,171 5,14740 - 44 9,003 4,531 4,472 8,939 4,430 4,509
45 - 49 7,868 3,914 3,954 8,668 4,348 4,32050 - 54 6,389 3,167 3,222 7,520 3,757 3,76355 - 59 4,977 2,595 2,382 5,974 3,029 2,94560 - 64 3,968 2,130 1,838 4,623 2,486 2,13765 - 69 3,086 1,665 1,421 3,452 1,917 1,535
70 - 74 2,226 1,313 913 2,505 1,430 1,07575 & over 2,848 1,823 1,025 3,210 2,122 1,088
Tabaco City
All Ages 124,811 61,563 63,248 133,508 66,233 67,275
Under 1 2,916 1,415 1,501 2,778 1,321 1,4571 - 4 11,560 5,579 5,981 11,729 5,586 6,1435 - 9 15,090 7,245 7,845 15,332 7,372 7,960
10 - 14 15,083 7,365 7,718 15,262 7,482 7,78015 - 19 14,139 6,743 7,396 14,523 7,116 7,407
20 - 24 10,520 5,036 5,484 11,885 5,730 6,15525 - 29 8,786 4,245 4,541 9,559 4,713 4,84630 - 34 8,257 4,011 4,246 8,726 4,298 4,42835 - 39 7,350 3,703 3,647 8,484 4,111 4,37340 - 44 6,932 3,316 3,616 7,280 3,654 3,626
45 - 49 5,912 2,930 2,982 6,750 3,273 3,47750 - 54 5,043 2,561 2,482 5,714 2,833 2,88155 - 59 4,150 2,113 2,037 4,778 2,490 2,28860 - 64 3,161 1,688 1,473 3,783 1,976 1,80765 - 69 2,173 1,251 922 2,715 1,528 1,187
70 - 74 1,655 1,008 647 1,756 1,059 69775 & over 2,084 1,354 730 2,454 1,691 763
1 - 32

Table 1.6HOUSEHOLD POPULATION 10 YEARS AND OVER BY SEX, AGE GROUP,MARITAL STATUS AND PROVINCECensus Years 2010 and 2015
2 0 1 0Household Pop'n. Single Legally Widowed Divorced/ Common Unknown10 Years & Over Married Separated Law/Live-in
Region V
Both Sexes 4,049,462 1,828,334 1,750,824 190,536 38,612 237,516 3,640
Below 20 1,283,873 1,248,203 15,457 231 583 18,076 1,32320 - 24 436,191 287,319 92,324 460 2,385 53,089 61425 - 29 359,445 123,669 180,863 1,121 3,522 49,837 43330 - 34 337,480 58,884 236,820 2,359 4,438 34,703 27635 - 39 306,921 33,095 240,907 4,237 4,926 23,529 227
40 - 44 291,031 23,353 236,790 7,396 5,532 17,796 16445 - 49 251,550 16,040 205,783 11,072 5,067 13,424 16450 - 54 212,880 11,301 171,327 16,189 4,145 9,796 12255 - 59 170,226 8,069 131,589 20,534 3,330 6,612 9260 - 64 135,008 6,173 96,926 25,349 2,132 4,362 66
65 - 69 99,972 4,325 65,314 26,159 1,225 2,893 5670 - 74 75,345 3,284 42,277 27,160 734 1,848 42
75 & Over 89,540 4,619 34,447 48,269 593 1,551 61
Female 1,993,772 812,683 883,903 149,217 23,644 122,242 2,083
Below 20 614,214 586,720 11,769 132 448 14,508 63720 - 24 206,494 112,154 60,577 305 1,972 31,144 34225 - 29 173,092 44,046 101,546 786 2,532 23,914 26830 - 34 164,145 20,515 123,651 1,609 2,872 15,331 16735 - 39 150,697 11,767 122,129 2,949 2,927 10,773 152
40 - 44 142,623 8,824 116,805 5,239 3,242 8,399 11445 - 49 123,560 6,703 99,321 8,144 2,885 6,400 10750 - 54 106,298 5,217 81,703 12,310 2,365 4,623 8055 - 59 86,830 4,204 61,734 16,072 1,870 2,884 6660 - 64 71,772 3,712 44,677 20,294 1,154 1,892 43
65 - 69 55,021 2,845 29,290 21,003 669 1,180 3470 - 74 43,310 2,384 17,938 21,872 395 691 30
75 & Over 55,716 3,592 12,763 38,502 313 503 43
Male 2,055,690 1,015,651 866,921 41,319 14,968 115,274 1,557
Below 20 669,659 661,483 3,688 99 135 3,568 68620 - 24 229,697 175,165 31,747 155 413 21,945 27225 - 29 186,353 79,623 79,317 335 990 25,923 16530 - 34 173,335 38,369 113,169 750 1,566 19,372 10935 - 39 156,224 21,328 118,778 1,288 1,999 12,756 75
40 - 44 148,408 14,529 119,985 2,157 2,290 9,397 5045 - 49 127,990 9,337 106,462 2,928 2,182 7,024 5750 - 54 106,582 6,084 89,624 3,879 1,780 5,173 4255 - 59 83,396 3,865 69,855 4,462 1,460 3,728 2660 - 64 63,236 2,461 52,249 5,055 978 2,470 23
65 - 69 44,951 1,480 36,024 5,156 556 1,713 2270 - 74 32,035 900 24,339 5,288 339 1,157 12
75 & Over 33,824 1,027 21,684 9,767 280 1,048 18
Source: Philippine Statistics Authority
Province/Sex/Age Group
1 - 33

2 0 1 5Household Pop'n. Single Legally Widowed Divorced/ Common Unknown10 Years & Over Married Separated Law/Live-in
4,404,413 2,010,408 1,687,214 212,107 48,827 444,503 1,354
1,334,910 1,303,111 5,110 83 344 25,487 775487,018 326,051 62,511 651 2,704 95,044 57401,138 152,106 146,064 1,314 4,370 97,192 92358,015 75,241 203,668 2,359 5,636 71,042 69339,814 46,092 233,966 4,049 6,575 49,071 61
300,568 30,460 223,330 6,909 6,604 33,209 56283,743 24,061 216,579 11,403 6,436 25,210 54240,351 17,150 183,210 16,466 5,589 17,890 46200,418 12,021 149,120 22,400 4,341 12,493 43156,772 8,967 108,786 28,141 3,018 7,830 30
116,952 5,851 73,892 30,699 1,656 4,823 3180,762 3,806 43,495 29,907 840 2,700 14
103,952 5,491 37,483 57,726 714 2,512 26
2,175,211 899,936 853,260 164,280 29,005 228,266 464
641,817 616,900 4,137 51 272 20,321 136235,430 132,521 42,623 423 2,191 57,634 38194,307 56,734 85,143 883 3,153 48,340 54173,354 27,098 108,684 1,601 3,660 32,279 32165,351 16,521 120,061 2,735 3,906 22,104 24
146,894 11,560 111,970 4,756 3,607 14,969 32139,032 9,578 106,061 8,106 3,507 11,750 30118,667 7,568 87,680 12,121 3,016 8,257 25100,936 5,836 70,169 17,072 2,403 5,431 25
81,779 4,937 49,978 21,904 1,630 3,315 15
64,153 3,742 33,303 24,297 855 1,935 2146,611 2,622 18,702 23,836 433 1,006 1266,880 4,319 14,749 46,495 372 925 20
2,229,202 1,110,472 833,954 47,827 19,822 216,237 890
693,093 686,211 973 32 72 5,166 639251,588 193,530 19,888 228 513 37,410 19206,831 95,372 60,921 431 1,217 48,852 38184,661 48,143 94,984 758 1,976 38,763 37174,463 29,571 113,905 1,314 2,669 26,967 37
153,674 18,900 111,360 2,153 2,997 18,240 24144,711 14,483 110,518 3,297 2,929 13,460 24121,684 9,582 95,530 4,345 2,573 9,633 21
99,482 6,185 78,951 5,328 1,938 7,062 1874,993 4,030 58,808 6,237 1,388 4,515 15
52,799 2,109 40,589 6,402 801 2,888 1034,151 1,184 24,793 6,071 407 1,694 237,072 1,172 22,734 11,231 342 1,587 6
1 - 34

Table 1.6 - Continued
HOUSEHOLD POPULATION 10 YEARS AND OVER BY SEX, AGE GROUP,MARITAL STATUS AND PROVINCECensus Years 2010 and 2015
2 0 1 0Household Pop'n. Single Legally Widowed Divorced/ Common Unknown10 Years & Over Married Separated Law/Live-in
Province/Sex/Age Group
Albay
Both Sexes 941,611 433,235 404,700 46,645 9,295 47,064 672
Below 20 284,637 278,574 2,574 32 109 3,197 15120 - 24 103,319 73,542 18,210 80 506 10,867 11425 - 29 86,547 34,326 40,545 257 826 10,498 9530 - 34 79,989 16,237 54,928 556 1,104 7,094 7035 - 39 71,958 9,076 55,924 964 1,232 4,698 64
40 - 44 68,433 6,541 55,422 1,718 1,372 3,334 4645 - 49 59,211 4,474 48,300 2,697 1,246 2,448 4650 - 54 50,304 3,066 40,451 3,913 973 1,872 2955 - 59 41,309 2,216 31,952 5,067 853 1,201 2060 - 64 33,422 1,735 23,993 6,407 495 777 15
65 - 69 23,232 1,216 14,906 6,361 271 468 1070 - 74 17,509 928 9,576 6,499 166 336 4
75 & over 21,741 1,304 7,919 12,094 142 274 8
Female 467,339 194,644 204,922 36,790 6,048 24,497 438
Below 20 136,660 131,959 1,962 11 83 2,570 7520 - 24 49,603 30,057 12,361 58 410 6,643 7425 - 29 41,825 12,765 23,057 187 627 5,130 5930 - 34 39,113 5,833 28,943 402 736 3,150 4935 - 39 35,565 3,372 28,524 690 792 2,136 51
40 - 44 33,696 2,581 27,395 1,230 890 1,567 3345 - 49 29,349 1,890 23,458 1,996 790 1,180 3550 - 54 25,626 1,483 19,555 3,062 590 912 2455 - 59 21,227 1,164 15,119 3,920 521 488 1560 - 64 17,816 1,034 11,022 5,146 280 324 10
65 - 69 12,923 823 6,585 5,155 162 192 670 - 74 10,105 660 4,016 5,223 86 118 2
75 & over 13,831 1,023 2,925 9,710 81 87 5
Male 474,272 238,591 199,778 9,855 3,247 22,567 234
Below 20 147,977 146,615 612 21 26 627 7620 - 24 53,716 43,485 5,849 22 96 4,224 4025 - 29 44,722 21,561 17,488 70 199 5,368 3630 - 34 40,876 10,404 25,985 154 368 3,944 2135 - 39 36,393 5,704 27,400 274 440 2,562 13
40 - 44 34,737 3,960 28,027 488 482 1,767 1345 - 49 29,862 2,584 24,842 701 456 1,268 1150 - 54 24,678 1,583 20,896 851 383 960 555 - 59 20,082 1,052 16,833 1,147 332 713 560 - 64 15,606 701 12,971 1,261 215 453 5
65 - 69 10,309 393 8,321 1,206 109 276 470 - 74 7,404 268 5,560 1,276 80 218 2
75 & over 7,910 281 4,994 2,384 61 187 3
1 - 35

2 0 1 5Household Pop'n. Single Legally Widowed Divorced/ Common Unknown10 Years & Over Married Separated Law/Live-in
1,021,212 475,555 393,499 51,838 11,222 88,852 246
294,906 289,413 921 10 28 4,337 197114,858 83,217 12,501 95 542 18,499 4
93,679 40,175 32,058 228 979 20,232 785,136 20,686 47,437 504 1,353 15,148 880,657 12,564 55,403 937 1,506 10,241 6
70,933 8,364 52,722 1,676 1,611 6,556 466,609 6,675 50,819 2,688 1,512 4,909 656,540 4,694 43,157 4,014 1,290 3,381 447,287 3,206 35,331 5,441 1,009 2,296 438,169 2,482 26,394 7,133 716 1,442 2
28,813 1,629 18,209 7,714 351 907 318,993 995 10,068 7,296 165 469 - 24,632 1,455 8,479 14,102 160 435 1
508,983 215,671 199,817 40,501 7,017 45,940 37
142,650 138,419 729 5 23 3,473 155,959 35,317 8,667 61 445 11,465 445,956 15,547 19,107 159 748 10,389 641,480 7,643 25,551 355 958 6,968 539,429 4,637 28,633 643 931 4,581 4
35,101 3,325 26,682 1,173 930 2,988 332,697 2,686 24,954 1,954 872 2,225 628,086 2,110 20,650 3,010 742 1,571 324,359 1,650 16,894 4,212 580 1,021 220,202 1,390 12,207 5,598 421 586 -
15,883 1,067 8,201 6,060 194 359 211,063 716 4,240 5,854 86 167 - 16,118 1,164 3,302 11,417 87 147 1
512,229 259,884 193,682 11,337 4,205 42,912 209
152,256 150,994 192 5 5 864 19658,899 47,900 3,834 34 97 7,034 - 47,723 24,628 12,951 69 231 9,843 143,656 13,043 21,886 149 395 8,180 341,228 7,927 26,770 294 575 5,660 2
35,832 5,039 26,040 503 681 3,568 133,912 3,989 25,865 734 640 2,684 - 28,454 2,584 22,507 1,004 548 1,810 122,928 1,556 18,437 1,229 429 1,275 217,967 1,092 14,187 1,535 295 856 2
12,930 562 10,008 1,654 157 548 17,930 279 5,828 1,442 79 302 - 8,514 291 5,177 2,685 73 288 -
1 - 36

Table 1.6 - Continued
HOUSEHOLD POPULATION 10 YEARS AND OVER BY SEX, AGE GROUP,MARITAL STATUS AND PROVINCECensus Years 2010 and 2015
2 0 1 0Household Pop'n. Single Legally Widowed Divorced/ Common Unknown10 Years & Over Married Separated Law/Live-in
Province/Sex/Age Group
Camarines Norte
Both Sexes 407,908 173,192 175,868 18,533 5,005 35,067 243
Below 20 125,348 120,599 1,496 24 101 3,050 7820 - 24 44,927 27,005 9,459 48 344 8,032 3925 - 29 36,821 10,685 18,474 120 473 7,041 2830 - 34 34,707 4,981 24,039 239 572 4,850 2635 - 39 31,828 3,030 24,326 424 612 3,423 13
40 - 44 31,187 2,094 24,819 734 728 2,798 1445 - 49 26,479 1,532 21,136 1,070 669 2,060 1250 - 54 22,177 1,047 17,443 1,627 529 1,518 1355 - 59 17,176 721 13,027 2,062 405 957 460 - 64 13,350 536 9,336 2,565 286 621 6
65 - 69 9,336 358 5,987 2,496 146 345 470 - 74 6,798 261 3,587 2,684 71 193 2
75 & over 7,774 343 2,739 4,440 69 179 4
Female 199,935 75,475 88,605 14,841 2,976 17,895 143
Below 20 60,265 56,550 1,136 14 79 2,449 3720 - 24 21,155 9,995 6,255 34 283 4,564 2425 - 29 17,944 3,571 10,607 76 336 3,333 2130 - 34 16,823 1,503 12,639 164 355 2,144 1835 - 39 15,532 934 12,419 315 349 1,508 7
40 - 44 15,056 676 12,149 528 390 1,306 745 - 49 12,789 567 10,079 786 364 985 850 - 54 10,733 403 8,114 1,224 304 680 855 - 59 8,658 337 6,038 1,664 210 406 360 - 64 6,984 293 4,182 2,089 150 265 5
65 - 69 5,120 215 2,622 2,061 78 142 270 - 74 3,921 181 1,424 2,212 40 63 1
75 & over 4,955 250 941 3,674 38 50 2
Male 207,973 97,717 87,263 3,692 2,029 17,172 100
Below 20 65,083 64,049 360 10 22 601 4120 - 24 23,772 17,010 3,204 14 61 3,468 1525 - 29 18,877 7,114 7,867 44 137 3,708 730 - 34 17,884 3,478 11,400 75 217 2,706 835 - 39 16,296 2,096 11,907 109 263 1,915 6
40 - 44 16,131 1,418 12,670 206 338 1,492 745 - 49 13,690 965 11,057 284 305 1,075 450 - 54 11,444 644 9,329 403 225 838 555 - 59 8,518 384 6,989 398 195 551 160 - 64 6,366 243 5,154 476 136 356 1
65 - 69 4,216 143 3,365 435 68 203 270 - 74 2,877 80 2,163 472 31 130 1
75 & over 2,819 93 1,798 766 31 129 2
1 - 37

2 0 1 5Household Pop'n. Single Legally Widowed Divorced/ Common Unknown10 Years & Over Married Separated Law/Live-in
440,393 183,122 168,360 20,581 5,876 62,384 70
127,920 123,148 548 4 48 4,131 4148,433 28,109 6,819 45 333 13,124 341,567 12,914 14,951 99 534 13,065 436,729 6,058 19,952 241 648 9,826 434,495 3,713 22,921 345 718 6,798 -
30,637 2,467 21,891 630 767 4,881 130,083 2,101 22,395 1,094 774 3,718 125,372 1,515 18,873 1,630 715 2,631 820,682 1,065 15,071 2,211 577 1,755 315,968 777 10,777 2,896 367 1,148 3
11,530 514 7,115 2,998 223 678 27,604 316 3,872 2,961 105 350 - 9,373 425 3,175 5,427 67 279 -
216,631 79,980 84,894 16,425 3,439 31,838 55
61,650 57,848 459 3 44 3,257 3923,440 10,735 4,614 35 258 7,798 - 19,857 4,380 8,621 63 368 6,423 217,871 1,979 10,795 174 423 4,497 316,832 1,151 11,890 241 449 3,101 -
14,849 840 10,993 443 407 2,165 114,542 752 10,878 795 422 1,694 112,337 604 8,945 1,206 387 1,191 410,152 458 6,950 1,708 299 735 2
8,209 408 4,837 2,306 175 482 1
6,262 294 3,115 2,465 110 276 24,427 204 1,618 2,429 58 118 - 6,203 327 1,179 4,557 39 101 -
223,762 103,142 83,466 4,156 2,437 30,546 15
66,270 65,300 89 1 4 874 224,993 17,374 2,205 10 75 5,326 321,710 8,534 6,330 36 166 6,642 218,858 4,079 9,157 67 225 5,329 117,663 2,562 11,031 104 269 3,697 -
15,788 1,627 10,898 187 360 2,716 - 15,541 1,349 11,517 299 352 2,024 - 13,035 911 9,928 424 328 1,440 410,530 607 8,121 503 278 1,020 1
7,759 369 5,940 590 192 666 2
5,268 220 4,000 533 113 402 - 3,177 112 2,254 532 47 232 - 3,170 98 1,996 870 28 178 -
1 - 38

Table 1.6 - Continued
HOUSEHOLD POPULATION 10 YEARS AND OVER BY SEX, AGE GROUP,MARITAL STATUS AND PROVINCECensus Years 2010 and 2015
2 0 1 0Household Pop'n. Single Legally Widowed Divorced/ Common Unknown10 Years & Over Married Separated Law/Live-in
Province/Sex/Age Group
Camarines Sur
Both Sexes 1,357,135 620,828 585,539 62,422 12,178 74,410 1,758
Below 20 427,274 416,195 4,695 89 167 5,405 72320 - 24 151,809 102,922 31,487 158 759 16,175 30825 - 29 123,959 44,915 61,669 348 1,188 15,628 21130 - 34 114,764 21,211 80,391 768 1,382 10,905 10735 - 39 101,744 11,071 80,192 1,395 1,547 7,443 96
40 - 44 95,818 7,527 78,442 2,500 1,665 5,628 5645 - 49 83,438 5,073 68,694 3,703 1,552 4,351 6550 - 54 71,243 3,621 57,647 5,487 1,333 3,115 4055 - 59 57,331 2,573 44,462 6,888 1,107 2,259 4260 - 64 44,969 1,916 32,268 8,598 679 1,478 30
65 - 69 32,145 1,324 20,944 8,518 392 941 2670 - 74 23,858 995 13,433 8,575 235 594 26
75 & over 28,783 1,485 11,215 15,395 172 488 28
Female 667,068 276,273 295,411 48,692 7,500 38,234 958
Below 20 204,490 196,051 3,562 52 130 4,335 36020 - 24 71,615 40,485 20,762 102 629 9,477 16025 - 29 59,393 16,034 34,585 237 850 7,562 12530 - 34 55,772 7,575 41,852 528 908 4,855 5435 - 39 50,005 3,982 40,687 943 923 3,414 56
40 - 44 47,158 2,858 38,793 1,781 984 2,706 3645 - 49 41,092 2,198 33,156 2,756 882 2,063 3750 - 54 35,638 1,726 27,522 4,142 762 1,463 2355 - 59 29,105 1,402 20,646 5,410 635 983 2960 - 64 23,858 1,190 14,764 6,886 381 617 20
65 - 69 17,591 898 9,265 6,834 205 372 1770 - 74 13,677 730 5,703 6,877 123 226 18
75 & over 17,674 1,144 4,114 12,144 88 161 23
Male 690,067 344,555 290,128 13,730 4,678 36,176 800
Below 20 222,784 220,144 1,133 37 37 1,070 36320 - 24 80,194 62,437 10,725 56 130 6,698 14825 - 29 64,566 28,881 27,084 111 338 8,066 8630 - 34 58,992 13,636 38,539 240 474 6,050 5335 - 39 51,739 7,089 39,505 452 624 4,029 40
40 - 44 48,660 4,669 39,649 719 681 2,922 2045 - 49 42,346 2,875 35,538 947 670 2,288 2850 - 54 35,605 1,895 30,125 1,345 571 1,652 1755 - 59 28,226 1,171 23,816 1,478 472 1,276 1360 - 64 21,111 726 17,504 1,712 298 861 10
65 - 69 14,554 426 11,679 1,684 187 569 970 - 74 10,181 265 7,730 1,698 112 368 8
75 & over 11,109 341 7,101 3,251 84 327 5
1 - 39

2 0 1 5Household Pop'n. Single Legally Widowed Divorced/ Common Unknown10 Years & Over Married Separated Law/Live-in
1,483,049 690,536 569,892 69,316 16,050 136,476 779
452,141 442,396 1,545 37 151 7,599 413165,634 114,665 20,767 272 901 28,995 34139,100 55,586 51,157 508 1,497 30,285 67122,902 26,940 71,434 815 1,928 21,744 41115,368 16,159 80,445 1,357 2,250 15,114 43
99,825 10,128 75,124 2,265 2,142 10,128 3893,179 7,628 71,956 3,760 2,083 7,716 3679,411 5,444 61,128 5,434 1,793 5,588 2466,436 3,854 49,609 7,621 1,377 3,948 2752,284 2,902 36,644 9,455 915 2,356 12
38,552 1,838 24,362 10,336 530 1,470 1625,644 1,231 13,839 9,516 265 782 1132,573 1,765 11,882 17,940 218 751 17
731,676 310,052 288,492 53,369 9,628 69,937 198
217,679 210,261 1,259 20 106 6,025 879,510 46,711 14,248 162 719 17,647 2367,613 20,948 30,151 332 1,061 15,086 3559,553 9,768 38,177 546 1,260 9,786 1656,034 5,886 40,992 929 1,385 6,828 14
48,814 3,874 37,631 1,550 1,188 4,551 2045,800 3,126 35,241 2,655 1,119 3,644 1539,393 2,488 29,305 4,041 981 2,563 1533,508 1,857 23,396 5,757 782 1,702 1427,146 1,648 16,719 7,339 472 961 7
21,111 1,214 10,845 8,181 287 574 1014,741 871 5,901 7,520 150 290 920,774 1,400 4,627 14,337 118 280 12
751,373 380,484 281,400 15,947 6,422 66,539 581
234,462 232,135 286 17 45 1,574 40586,124 67,954 6,519 110 182 11,348 1171,487 34,638 21,006 176 436 15,199 3263,349 17,172 33,257 269 668 11,958 2559,334 10,273 39,453 428 865 8,286 29
51,011 6,254 37,493 715 954 5,577 1847,379 4,502 36,715 1,105 964 4,072 2140,018 2,956 31,823 1,393 812 3,025 932,928 1,997 26,213 1,864 595 2,246 1325,138 1,254 19,925 2,116 443 1,395 5
17,441 624 13,517 2,155 243 896 610,903 360 7,938 1,996 115 492 211,799 365 7,255 3,603 100 471 5
1 - 40

Table 1.6 - Continued
HOUSEHOLD POPULATION 10 YEARS AND OVER BY SEX, AGE GROUP,MARITAL STATUS AND PROVINCECensus Years 2010 and 2015
2 0 1 0Household Pop'n. Single Legally Widowed Divorced/ Common Unknown10 Years & Over Married Separated Law/Live-in
Province/Sex/Age Group
Catanduanes
Both Sexes 186,108 85,928 75,152 9,606 1,687 13,620 115
Below 20 59,079 57,656 357 7 20 981 5820 - 24 19,480 13,321 2,739 19 76 3,302 2325 - 29 15,754 5,775 6,724 48 124 3,075 830 - 34 14,522 2,789 9,333 88 170 2,134 835 - 39 13,441 1,668 10,126 174 215 1,256 2
40 - 44 13,254 1,252 10,570 284 226 921 145 - 49 11,478 920 9,135 472 247 702 250 - 54 9,462 671 7,388 683 215 502 355 - 59 7,597 533 5,720 899 151 293 160 - 64 6,350 399 4,580 1,097 93 179 2
65 - 69 5,364 331 3,544 1,301 65 120 370 - 74 4,469 251 2,594 1,480 55 89 -
75 & over 5,858 362 2,342 3,054 30 66 4
Female 91,230 38,094 37,838 7,323 956 6,973 46
Below 20 27,969 26,828 284 3 13 820 2120 - 24 9,133 5,237 1,853 10 69 1,957 725 - 29 7,552 2,102 3,883 31 86 1,445 530 - 34 7,072 999 4,997 60 112 900 435 - 39 6,524 606 5,127 117 130 543 1
40 - 44 6,403 462 5,214 194 114 419 - 45 - 49 5,558 372 4,398 325 122 340 150 - 54 4,587 305 3,450 483 115 233 155 - 59 3,906 265 2,736 703 69 132 160 - 64 3,399 223 2,176 870 45 84 1
65 - 69 2,962 207 1,655 1,009 35 54 270 - 74 2,579 183 1,174 1,165 33 24 -
75 & over 3,586 305 891 2,353 13 22 2
Male 94,878 47,834 37,314 2,283 731 6,647 69
Below 20 31,110 30,828 73 4 7 161 3720 - 24 10,347 8,084 886 9 7 1,345 1625 - 29 8,202 3,673 2,841 17 38 1,630 330 - 34 7,450 1,790 4,336 28 58 1,234 435 - 39 6,917 1,062 4,999 57 85 713 1
40 - 44 6,851 790 5,356 90 112 502 145 - 49 5,920 548 4,737 147 125 362 150 - 54 4,875 366 3,938 200 100 269 255 - 59 3,691 268 2,984 196 82 161 - 60 - 64 2,951 176 2,404 227 48 95 1
65 - 69 2,402 124 1,889 292 30 66 170 - 74 1,890 68 1,420 315 22 65 -
75 & over 2,272 57 1,451 701 17 44 2
1 - 41
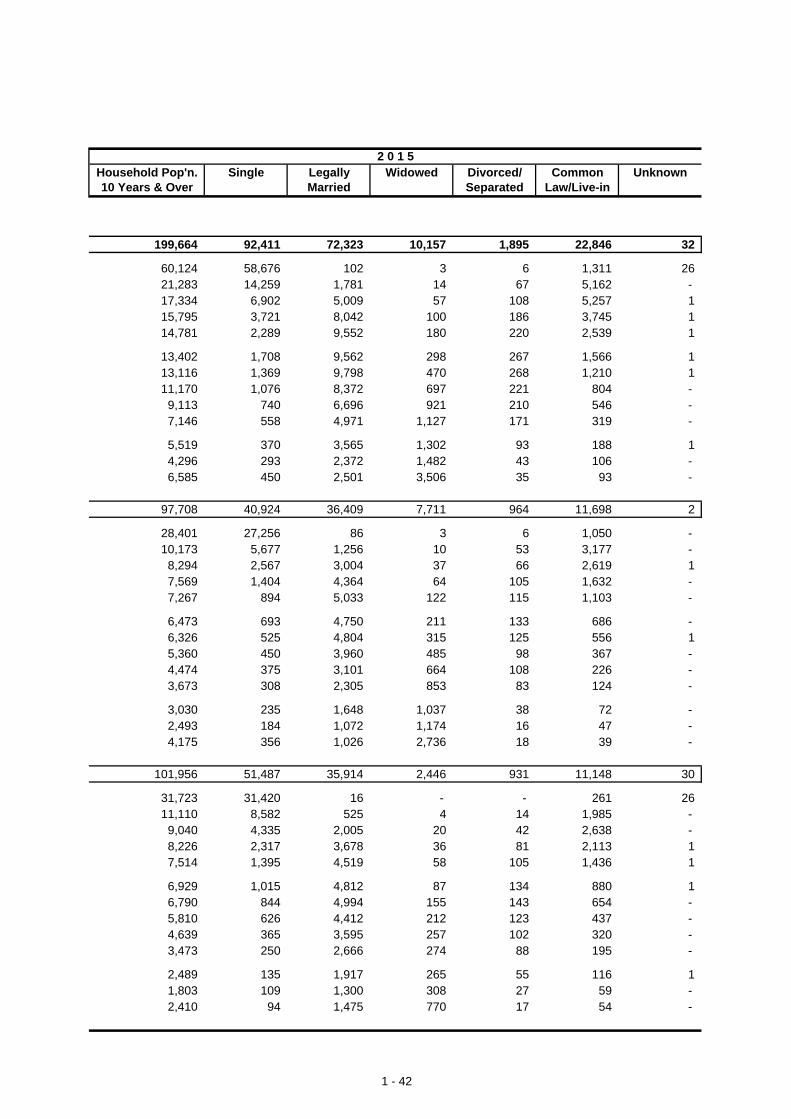
2 0 1 5Household Pop'n. Single Legally Widowed Divorced/ Common Unknown10 Years & Over Married Separated Law/Live-in
199,664 92,411 72,323 10,157 1,895 22,846 32
60,124 58,676 102 3 6 1,311 2621,283 14,259 1,781 14 67 5,162 - 17,334 6,902 5,009 57 108 5,257 115,795 3,721 8,042 100 186 3,745 114,781 2,289 9,552 180 220 2,539 1
13,402 1,708 9,562 298 267 1,566 113,116 1,369 9,798 470 268 1,210 111,170 1,076 8,372 697 221 804 -
9,113 740 6,696 921 210 546 - 7,146 558 4,971 1,127 171 319 -
5,519 370 3,565 1,302 93 188 14,296 293 2,372 1,482 43 106 - 6,585 450 2,501 3,506 35 93 -
97,708 40,924 36,409 7,711 964 11,698 2
28,401 27,256 86 3 6 1,050 - 10,173 5,677 1,256 10 53 3,177 -
8,294 2,567 3,004 37 66 2,619 17,569 1,404 4,364 64 105 1,632 - 7,267 894 5,033 122 115 1,103 -
6,473 693 4,750 211 133 686 - 6,326 525 4,804 315 125 556 15,360 450 3,960 485 98 367 - 4,474 375 3,101 664 108 226 - 3,673 308 2,305 853 83 124 -
3,030 235 1,648 1,037 38 72 - 2,493 184 1,072 1,174 16 47 - 4,175 356 1,026 2,736 18 39 -
101,956 51,487 35,914 2,446 931 11,148 30
31,723 31,420 16 - - 261 2611,110 8,582 525 4 14 1,985 -
9,040 4,335 2,005 20 42 2,638 - 8,226 2,317 3,678 36 81 2,113 17,514 1,395 4,519 58 105 1,436 1
6,929 1,015 4,812 87 134 880 16,790 844 4,994 155 143 654 - 5,810 626 4,412 212 123 437 - 4,639 365 3,595 257 102 320 - 3,473 250 2,666 274 88 195 -
2,489 135 1,917 265 55 116 11,803 109 1,300 308 27 59 - 2,410 94 1,475 770 17 54 -
1 - 42

Table 1.6 - Continued
HOUSEHOLD POPULATION 10 YEARS AND OVER BY SEX, AGE GROUP,MARITAL STATUS AND PROVINCECensus Years 2010 and 2015
2 0 1 0Household Pop'n. Single Legally Widowed Divorced/ Common Unknown10 Years & Over Married Separated Law/Live-in
Province/Sex/Age Group
Masbate
Both Sexes 598,234 259,515 275,326 26,201 4,722 32,024 446
Below 20 207,216 199,250 4,508 39 94 3,159 16620 - 24 60,225 32,604 20,010 87 353 7,107 6425 - 29 49,827 11,661 31,508 214 465 5,936 4330 - 34 47,660 5,391 37,047 409 593 4,184 3635 - 39 45,186 3,171 37,603 720 603 3,064 25
40 - 44 41,375 2,242 34,849 1,142 709 2,408 2545 - 49 35,773 1,562 30,110 1,621 581 1,880 1950 - 54 30,652 1,078 25,387 2,282 452 1,433 2055 - 59 23,901 744 18,987 2,854 337 966 1360 - 64 17,991 604 13,259 3,218 221 680 9
65 - 69 14,896 418 10,107 3,661 143 561 670 - 74 11,573 336 6,842 3,954 86 346 9
75 & over 11,959 454 5,109 6,000 85 300 11
Female 293,540 115,275 138,695 20,266 2,711 16,327 266
Below 20 98,971 92,846 3,451 27 73 2,494 8020 - 24 28,437 11,777 12,399 64 292 3,869 3625 - 29 23,744 3,810 16,767 156 307 2,676 2830 - 34 23,144 1,835 18,854 253 349 1,829 2435 - 39 22,074 1,139 18,666 485 302 1,465 17
40 - 44 20,294 896 17,069 796 364 1,150 1945 - 49 17,601 712 14,495 1,172 316 892 1450 - 54 15,329 526 12,138 1,742 230 680 1355 - 59 12,288 432 8,981 2,213 191 461 1060 - 64 9,601 405 6,212 2,538 122 319 5
65 - 69 8,237 290 4,735 2,886 75 247 470 - 74 6,632 255 3,005 3,168 46 150 8
75 & over 7,188 352 1,923 4,766 44 95 8
Male 304,694 144,240 136,631 5,935 2,011 15,697 180
Below 20 108,245 106,404 1,057 12 21 665 8620 - 24 31,788 20,827 7,611 23 61 3,238 2825 - 29 26,083 7,851 14,741 58 158 3,260 1530 - 34 24,516 3,556 18,193 156 244 2,355 1235 - 39 23,112 2,032 18,937 235 301 1,599 8
40 - 44 21,081 1,346 17,780 346 345 1,258 645 - 49 18,172 850 15,615 449 265 988 550 - 54 15,323 552 13,249 540 222 753 755 - 59 11,613 312 10,006 641 146 505 360 - 64 8,390 199 7,047 680 99 361 4
65 - 69 6,659 128 5,372 775 68 314 270 - 74 4,941 81 3,837 786 40 196 1
75 & over 4,771 102 3,186 1,234 41 205 3
1 - 43

2 0 1 5Household Pop'n. Single Legally Widowed Divorced/ Common Unknown10 Years & Over Married Separated Law/Live-in
650,045 284,486 260,757 29,693 6,426 68,560 123
214,584 207,928 1,482 11 66 5,079 1869,431 39,108 13,712 145 482 15,973 1156,456 15,210 26,300 263 602 14,070 1149,726 7,159 31,841 397 725 9,590 1447,373 4,418 34,703 673 900 6,672 7
43,457 2,923 33,660 1,133 820 4,911 1040,424 2,438 31,567 1,777 786 3,847 934,187 1,714 26,565 2,366 723 2,812 729,289 1,263 22,144 3,193 503 2,178 821,995 822 15,656 3,684 396 1,427 10
15,969 544 10,341 3,998 192 886 812,065 374 6,843 4,170 118 557 315,089 585 5,943 7,883 113 558 7
319,288 126,877 131,323 22,456 3,519 35,035 78
102,772 97,431 1,187 7 53 4,086 833,899 15,057 9,073 104 391 9,266 827,054 5,417 14,547 184 414 6,483 923,700 2,430 16,282 260 400 4,320 822,804 1,492 17,476 404 454 2,976 2
21,058 1,054 16,592 742 392 2,271 719,920 994 15,468 1,232 364 1,855 716,905 788 12,735 1,692 359 1,329 214,684 639 10,394 2,420 261 964 611,436 476 7,247 2,804 227 676 6
8,722 379 4,783 3,081 97 376 66,924 274 3,089 3,286 54 218 39,410 446 2,450 6,240 53 215 6
330,757 157,609 129,434 7,237 2,907 33,525 45
111,812 110,497 295 4 13 993 1035,532 24,051 4,639 41 91 6,707 329,402 9,793 11,753 79 188 7,587 226,026 4,729 15,559 137 325 5,270 624,569 2,926 17,227 269 446 3,696 5
22,399 1,869 17,068 391 428 2,640 320,504 1,444 16,099 545 422 1,992 217,282 926 13,830 674 364 1,483 514,605 624 11,750 773 242 1,214 210,559 346 8,409 880 169 751 4
7,247 165 5,558 917 95 510 25,141 100 3,754 884 64 339 - 5,679 139 3,493 1,643 60 343 1
1 - 44

Table 1.6 - Continued
HOUSEHOLD POPULATION 10 YEARS AND OVER BY SEX, AGE GROUP,MARITAL STATUS AND PROVINCECensus Years 2010 and 2015
2 0 1 0Household Pop'n. Single Legally Widowed Divorced/ Common Unknown10 Years & Over Married Separated Law/Live-in
Province/Sex/Age Group
Sorsogon
Both Sexes 558,466 255,636 234,239 27,129 5,725 35,331 406
Below 20 180,319 175,929 1,827 40 92 2,284 14720 - 24 56,431 37,925 10,419 68 347 7,606 6625 - 29 46,537 16,307 21,943 134 446 7,659 4830 - 34 45,838 8,275 31,082 299 617 5,536 2935 - 39 42,764 5,079 32,736 560 717 3,645 27
40 - 44 40,964 3,697 32,688 1,018 832 2,707 2245 - 49 35,171 2,479 28,408 1,509 772 1,983 2050 - 54 29,042 1,818 23,011 2,197 643 1,356 1755 - 59 22,912 1,282 17,441 2,764 477 936 1260 - 64 18,926 983 13,490 3,464 358 627 4
65 - 69 14,999 678 9,826 3,822 208 458 770 - 74 11,138 513 6,245 3,968 121 290 1
75 & over 13,425 671 5,123 7,286 95 244 6
Female 274,660 112,922 118,432 21,305 3,453 18,316 232
Below 20 85,859 82,486 1,374 25 70 1,840 6420 - 24 26,551 14,603 6,947 37 289 4,634 4125 - 29 22,634 5,764 12,647 99 326 3,768 3030 - 34 22,221 2,770 16,366 202 412 2,453 1835 - 39 20,997 1,734 16,706 399 431 1,707 20
40 - 44 20,016 1,351 16,185 710 500 1,251 1945 - 49 17,171 964 13,735 1,109 411 940 1250 - 54 14,385 774 10,924 1,657 364 655 1155 - 59 11,646 604 8,214 2,162 244 414 860 - 64 10,114 567 6,321 2,765 176 283 2
65 - 69 8,188 412 4,428 3,058 114 173 370 - 74 6,396 375 2,616 3,227 67 110 1
75 & over 8,482 518 1,969 5,855 49 88 3
Male 283,806 142,714 115,807 5,824 2,272 17,015 174
Below 20 94,460 93,443 453 15 22 444 8320 - 24 29,880 23,322 3,472 31 58 2,972 2525 - 29 23,903 10,543 9,296 35 120 3,891 1830 - 34 23,617 5,505 14,716 97 205 3,083 1135 - 39 21,767 3,345 16,030 161 286 1,938 7
40 - 44 20,948 2,346 16,503 308 332 1,456 345 - 49 18,000 1,515 14,673 400 361 1,043 850 - 54 14,657 1,044 12,087 540 279 701 655 - 59 11,266 678 9,227 602 233 522 460 - 64 8,812 416 7,169 699 182 344 2
65 - 69 6,811 266 5,398 764 94 285 470 - 74 4,742 138 3,629 741 54 180 -
75 & over 4,943 153 3,154 1,431 46 156 3
1 - 45

2 0 1 5Household Pop'n. Single Legally Widowed Divorced/ Common Unknown10 Years & Over Married Separated Law/Live-in
610,050 284,298 222,383 30,522 7,358 65,385 104
185,235 181,550 512 18 45 3,030 8067,379 46,693 6,931 80 379 13,291 553,002 21,319 16,589 159 650 14,283 247,727 10,677 24,962 302 796 10,989 147,140 6,949 30,942 557 981 7,707 4
42,314 4,870 30,371 907 997 5,167 240,332 3,850 30,044 1,614 1,013 3,810 133,671 2,707 25,115 2,325 847 2,674 327,611 1,893 20,269 3,013 665 1,770 121,210 1,426 14,344 3,846 453 1,138 3
16,569 956 10,300 4,351 267 694 112,160 597 6,501 4,482 144 436 - 15,700 811 5,503 8,868 121 396 1
300,925 126,432 112,325 23,818 4,438 33,818 94
88,665 85,685 417 13 40 2,430 8032,449 19,024 4,765 51 325 8,281 325,533 7,875 9,713 108 496 7,340 123,181 3,874 13,515 202 514 5,076 - 22,985 2,461 16,037 396 572 3,515 4
20,599 1,774 15,322 637 557 2,308 119,747 1,495 14,716 1,155 605 1,776 - 16,586 1,128 12,085 1,687 449 1,236 113,759 857 9,434 2,311 373 783 111,113 707 6,663 3,004 252 486 1
9,145 553 4,711 3,473 129 278 16,963 373 2,782 3,573 69 166 -
10,200 626 2,165 7,208 57 143 1
309,125 157,866 110,058 6,704 2,920 31,567 10
96,570 95,865 95 5 5 600 - 34,930 27,669 2,166 29 54 5,010 227,469 13,444 6,876 51 154 6,943 124,546 6,803 11,447 100 282 5,913 124,155 4,488 14,905 161 409 4,192 -
21,715 3,096 15,049 270 440 2,859 120,585 2,355 15,328 459 408 2,034 117,085 1,579 13,030 638 398 1,438 213,852 1,036 10,835 702 292 987 - 10,097 719 7,681 842 201 652 2
7,424 403 5,589 878 138 416 - 5,197 224 3,719 909 75 270 - 5,500 185 3,338 1,660 64 253 -
1 - 46

Table 1.7AGE DEPENDENCY RATIO BY PROVINCE/CITYCensus Years 1980 - 2015
Ratio1980 1990 1995 2000 2007 2010 2015
Region V 97.6 90.5 87.7 83.2 83.7 74.9 71.1
Albay 94.5 88.0 84.9 80.4 79.4 68.6 65.4
Camarines Norte 97.5 85.6 85.1 79.5 79.2 71.4 69.8
Camarines Sur 96.8 91.2 86.1 84.4 84.2 74.3 70.6
Catanduanes 101.3 89.8 91.3 86.7 87.3 76.7 73.1
Masbate 100.7 94.7 94.6 92.5 101.5 88.0 83.3
Sorsogon 99.5 92.2 90.0 86.1 86.3 75.4 69.5
Iriga City 87.1 81.8 73.8 73.9 73.2 67.5 64.0
Legazpi City 82.5 77.3 73.4 68.7 63.6 59.0 56.5
Ligao City ... ... ... ... 85.2 73.0 67.3
Masbate City ... ... ... ... 87.9 77.3 75.6
Naga City 76.8 76.1 71.3 66.3 63.0 60.3 54.8
Sorsogon City ... ... ... ... 77.9 70.8 64.3
Tabaco City ... ... ... ... 76.6 68.1 63.8
Source: Philippine Statistics Authority
Figure 1.4 POPULATION PYRAMID IN REGION VCENSUS YEAR 2015
Province / City
400,000 300,000 200,000 100,000 0 100,000 200,000 300,000 400,000
Under 1
1 - 4
5 - 9
10 - 14
15 - 19
20 - 24
25 - 29
30 - 34
35 - 39
40 - 44
45 - 49
50 - 54
55 - 59
60 - 64
65 - 69
70 - 74
75 & over
1 - 47

Table 1.8SEX RATIO BY PROVINCE/CITY/MUNICIPALITYCensus Years 1980 - 2015(Ratio in males per 100 females)
Province/ RatioCity/Municipality 1980 1990 1995 2000 2007 2010 2015
Region V 103.2 103.4 103.0 104.3 104.5 104.1 103.4
Albay 102.5 102.2 102.1 103.1 103.5 103.0 102.4
Bacacay 103.2 102.4 103.2 103.6 104.6 104.5 102.7Camalig 100.1 101.0 101.1 103.7 104.0 103.7 103.3Daraga 98.4 98.4 98.3 98.7 100.1 100.3 100.0Guinobatan 101.0 100.0 101.3 101.1 103.7 103.1 101.5Jovellar 102.5 101.1 100.0 107.1 103.8 104.3 105.9
LEGAZPI CITY 99.2 99.4 98.1 99.1 99.4 99.8 99.7Libon 106.5 103.7 104.0 112.2 106.4 105.0 104.0Ligao 104.8 103.0 103.9 101.7 104.7 103.9 103.7Malilipot 99.9 99.8 100.6 102.2 103.0 102.0 101.1Malinao 105.0 104.8 105.8 104.7 105.4 105.5 104.3
Manito 108.0 108.2 106.1 106.8 106.5 106.3 105.6Oas 103.8 104.9 103.9 104.2 105.5 104.8 104.2Pio Duran 106.6 105.5 107.0 106.2 109.0 106.1 103.4Polangui 101.5 103.1 102.4 101.5 103.3 101.6 102.7Rapu-Rapu 106.2 106.1 106.3 108.3 108.4 106.5 107.1
Santo Domingo 104.7 103.0 104.2 103.7 105.5 103.5 103.6Tabaco 102.5 103.4 102.8 105.3 102.7 102.7 101.7Tiwi 105.6 104.5 103.2 105.2 105.8 104.5 103.5
Camarines Norte 104.9 105.8 105.1 105.3 104.9 104.8 104.1
Basud 106.8 107.0 105.2 104.1 104.7 105.7 104.0Capalonga 106.1 107.3 107.2 109.9 108.7 108.8 107.5DAET 97.8 99.6 99.0 99.7 97.6 98.8 98.0Jose Panganiban 107.6 108.4 108.8 106.1 107.4 107.4 105.6Labo 106.2 106.7 106.5 106.8 107.2 105.5 106.6
Mercedes 107.8 107.4 106.7 106.4 106.7 106.3 105.6Paracale 105.9 107.1 106.2 104.3 106.8 106.3 106.9San Lorenzo Ruiz (Imelda) 112.2 109.7 106.9 107.9 107.7 105.9 105.4San Vicente 107.4 108.4 105.1 103.4 102.2 102.6 100.7Santa Elena 105.8 109.0 108.7 112.3 107.5 106.6 104.9
Talisay 101.8 103.2 103.0 103.6 104.3 102.6 102.8Vinzons 106.2 105.8 104.0 104.8 105.7 106.2 104.2
Source: Philippine Statistics Authority
1 - 48

Table 1.8 - ContinuedSEX RATIO BY PROVINCE/CITY/MUNICIPALITYCensus Years 1980 - 2015(Ratio in males per 100 females)
Province/ RatioCity/Municipality 1980 1990 1995 2000 2007 2010 2015
Camarines Sur 102.8 103.2 102.9 104.1 104.8 104.4 103.9
Baao 102.9 102.8 103.3 106.3 105.7 105.2 104.2Balatan 105.8 104.8 102.3 104.4 107.2 107.1 107.7Bato 103.6 105.0 103.6 106.9 106.2 104.9 106.3Bombon 96.7 101.4 102.6 102.7 105.2 104.5 102.7Buhi 102.9 104.4 102.8 102.4 104.3 105.0 103.5
Bula 103.9 104.7 105.3 104.2 105.5 105.4 104.7Cabusao 105.3 106.2 107.2 105.8 109.3 108.3 102.9Calabanga 105.0 105.1 104.3 105.8 105.6 105.0 105.0Camaligan 99.9 103.7 102.9 104.1 102.1 101.4 102.1Canaman 103.7 104.4 101.5 101.6 102.4 102.3 104.5
Caramoan 104.5 104.2 105.0 106.5 107.7 106.9 105.8Del Gallego 106.9 106.6 107.0 107.0 106.5 107.9 105.9Gainza 100.0 107.2 107.6 105.1 104.5 104.8 104.6Garchitorena 106.8 107.1 106.0 105.8 108.0 108.6 108.2Goa 105.3 101.6 102.6 102.3 104.1 105.2 102.9
Iriga City 98.1 99.5 99.5 101.0 102.6 101.7 101.5Lagonoy 104.5 103.8 103.4 106.4 106.0 106.3 106.1Libmanan 103.9 104.8 103.7 105.6 106.4 106.1 105.4Lupi 106.7 107.6 106.9 108.9 107.6 106.0 106.2Magarao 100.5 102.2 100.5 102.2 104.3 102.3 102.3
Milaor 103.4 104.9 105.4 104.7 105.2 105.3 104.9Minalabac 104.9 104.4 104.8 107.1 108.9 107.9 106.5Nabua 95.5 99.2 99.1 100.0 102.0 101.4 101.7Naga City 94.1 96.5 95.6 97.5 96.0 96.5 97.2Ocampo 102.5 103.4 103.6 108.8 107.3 106.1 105.3
Pamplona 104.5 105.0 105.8 105.5 109.2 108.3 106.7Pasacao 109.7 108.1 106.8 107.5 107.6 107.7 104.3PILI 103.2 101.9 103.2 105.1 105.9 104.9 105.9Presentacion 108.3 107.0 107.0 105.2 105.7 106.4 104.7Ragay 103.3 103.6 104.7 104.1 105.5 105.2 104.5
Sangay 109.0 106.3 106.9 107.7 107.5 107.3 105.9San Fernando 104.6 104.6 105.4 105.3 107.7 106.7 105.9San Jose 105.3 102.2 101.9 101.5 105.6 104.1 102.4Sipocot 104.6 104.5 103.7 105.1 105.5 104.2 103.7Siruma 105.9 108.1 108.2 112.8 109.8 110.6 110.4
Tigaon 104.9 102.7 103.3 103.4 107.3 106.0 105.7Tinambac 107.0 105.0 105.6 106.9 107.4 106.1 106.6
Catanduanes 102.9 104.1 103.6 103.5 105.3 105.2 105.1
Bagamanoc 105.7 104.7 107.0 109.3 110.0 107.4 108.6Baras 106.1 102.7 103.2 104.5 108.5 107.5 105.8Bato 96.7 99.6 98.0 101.2 104.1 103.5 103.1Caramoran 105.4 109.3 108.5 106.3 109.2 110.3 108.9Gigmoto 101.8 105.7 106.0 111.5 106.5 105.1 106.8
1 - 49

Table 1.8 - ContinuedSEX RATIO BY PROVINCE/CITY/MUNICIPALITYCensus Years 1980 - 2015(Ratio in males per 100 females)
Province/ RatioCity/Municipality 1980 1990 1995 2000 2007 2010 2015
Pandan 109.2 109.3 107.3 105.9 109.3 107.1 107.0Panganiban 106.6 110.1 109.8 107.5 107.5 109.8 109.4San Andres 104.0 104.7 103.8 102.5 104.0 103.7 105.1San Miguel 104.0 106.4 105.3 103.9 109.1 108.1 112.2Viga 108.4 105.3 107.5 105.5 110.8 108.4 109.7
VIRAC 97.1 99.2 98.5 99.4 99.9 100.9 99.7
Masbate 102.5 103.2 102.4 104.5 105.0 104.3 104.1
Aroroy 105.7 106.7 104.7 108.6 108.4 107.0 107.4Baleno 100.4 101.6 102.7 103.5 106.8 105.5 107.9Balud 103.3 102.9 102.8 104.7 105.4 104.5 104.0Batuan 108.1 107.8 103.1 103.1 105.2 104.5 104.8Cataingan 100.3 103.0 101.9 104.4 104.0 102.7 101.6
Cawayan 100.4 102.8 103.3 105.2 105.9 105.0 106.1Claveria 105.3 103.9 102.4 107.0 105.0 104.8 106.4Dimasalang 99.9 102.2 101.4 100.2 102.4 103.1 102.6Esperanza 100.2 100.5 100.6 100.4 103.3 103.0 102.5Mandaon 104.9 106.4 103.8 105.3 106.0 104.6 103.0
MASBATE CITY 100.3 100.8 99.2 101.7 99.8 101.5 101.0Milagros 105.5 104.9 104.1 106.1 106.9 104.7 106.5Mobo 103.6 104.2 102.2 104.8 107.0 105.3 105.0Monreal 102.7 104.6 107.8 112.0 111.6 108.9 105.1Palanas 101.0 98.4 98.4 100.8 102.6 101.4 99.2
Pio V. Corpuz 95.2 97.8 99.4 104.3 104.0 102.1 100.6Placer 99.2 101.0 100.9 102.0 103.3 103.2 101.0San Fernando 104.2 106.2 103.9 102.8 103.8 103.7 103.8San Jacinto 103.3 103.9 101.9 103.9 105.5 105.3 105.8San Pascual 105.8 102.9 104.4 105.4 107.2 106.0 105.5
Uson 104.2 104.3 102.3 105.4 104.7 104.4 104.0
Sorsogon 104.9 104.2 103.7 106.1 104.7 104.4 104.1
Bacon 102.6 103.4 102.8 104.3Barcelona 102.6 101.2 102.9 105.3 104.5 104.3 104.2Bulan 105.3 104.7 104.2 106.9 104.5 104.8 103.9Bulusan 104.6 102.9 103.5 104.9 106.5 105.7 105.2Casiguran 106.2 105.1 106.1 107.0 106.0 104.9 103.0
Castilla 106.8 107.2 105.4 106.5 106.3 106.4 107.0Donsol 107.2 105.0 104.7 107.6 106.9 106.4 106.4Gubat 102.8 102.4 103.6 104.7 103.7 104.0 102.7Irosin 104.8 104.0 103.1 109.5 104.4 103.3 103.3Juban 109.1 106.0 104.2 104.0 105.4 104.8 104.2
Magallanes 106.3 104.5 103.2 105.5 107.8 105.6 105.7Matnog 108.7 107.0 108.9 110.5 109.6 107.9 107.0Pilar 104.7 104.7 103.2 107.0 105.7 105.9 105.6Prieto Diaz 106.3 105.1 103.1 104.5 103.3 105.5 104.7Santa Magdalena 105.4 106.5 107.4 106.6 106.4 105.0 102.1
SORSOGON CITY 101.7 101.6 100.1 103.5 101.3 101.2 102.0
1 - 50

Table 1.9 HOUSEHOLD POPULATION BY ETHNICITY AND PROVINCECensus Year 2010
Ethnicity Region V Albay Cam. Norte Cam. Sur Catanduanes Masbate Sorsogon
Total 5,411,521 1,231,607 542,315 1,818,699 245,574 833,638 739,688
Abelling/Abellen/Aberling/Abor 22 - - 1 7 14 - Adasen 11 - - 11 - - - Aeta/Ayta 1,828 469 187 846 79 17 230 Agta 5,862 1,141 3 4,546 - 5 167 Agta-Cimaron 3,310 76 9 2,081 - 47 1,097 Agta-Agay 11 1 - - - - 10 Agta-Dumagat 523 116 38 294 13 3 59 Agta-Tabangnon 22,783 5,616 - 15,243 - - 1,924 Agta-Taboy 607 582 1 16 - - 8 Agutaynen 70 4 - 26 2 25 13
Akeanon 272 43 11 99 15 62 42 Alangan 8 - - 6 - - 2 Ambala 247 27 5 44 - 156 15 Applai 19 3 7 7 - - 2 Aromanen-Manobo 40 1 11 - 28 - Ata 52 8 16 19 - 1 8 Ata/Negrito 24 14 - 7 - 1 2 Ata-Manobo 5 - - 1 - 4 - Ati 32 9 - 9 - 14 - Ayangan 5 1 4 - - - -
B’laan/Blaan 53 4 1 15 2 22 9 Badjao 89 14 1 37 5 29 3 Bago 45 6 7 19 - - 13 Bagobo 24 12 - 11 1 - - Bagobo-Tagabawa 20 - 1 5 - 14 - Bajao/Bajau 23 1 - 11 - 6 5 Balangao 163 59 24 60 1 1 18 Balatok 28 7 4 3 6 - 8 Baliwon/Gaddang 17 - - 17 - - - Banao 207 17 15 109 16 6 44
Bangon 590 127 52 197 39 54 121 Bantoanon 577 114 84 287 22 8 62 Banwaon 402 100 53 149 16 31 53 Batak 579 174 57 213 20 2 113 Batangan 2,067 441 203 721 146 360 196 Belwang 586 115 48 249 22 10 142 Bikol/Bicol 4,316,948 1,187,044 447,761 1,712,116 236,171 20,164 713,692 Binongan 2,866 669 231 1,417 160 37 352 Bisaya/Binisaya 72,989 8,547 4,659 9,422 1,919 42,774 5,668 Boholano 1,855 299 141 366 98 748 203
Bontok 88 17 6 20 5 31 9 Bugkalot/Ilongot 99 14 12 24 7 - 42 Buhid 18 3 - 9 - 2 4 Buhid (Bangon) 33 - 5 18 - - 10 Bukidnon 252 50 18 99 10 30 45 Cagayanen 650 210 57 233 15 48 87
Source: Philippine Statistics Authority
1 - 51

Table 1.9 - ContinuedHOUSEHOLD POPULATION BY ETHNICITY AND PROVINCECensus Year 2010
Ethnicity Region V Albay Cam. Norte Cam. Sur Catanduanes Masbate Sorsogon
Calinga 24 6 4 10 - 4 - Capizeño 464 55 8 124 26 195 56 Caviteño 1,383 242 166 676 61 96 142 Caviteño-Chavacano 194 49 15 73 6 36 15
Cebuano 207,460 1,758 619 1,930 675 201,586 892 Chinese 836 240 112 287 34 70 93 Clata/Klata 10 - - 6 4 - - Cotabateño 259 65 12 111 13 27 31 Cotabateño-Chavacano 151 35 18 46 6 29 17 Cuyonon/Cuyonen 103 16 17 26 6 24 14 Davao-Chavacano 339 70 21 108 18 85 37 Davaweño 1,368 388 170 389 81 139 201 Diangan 40 3 - 5 7 25 - Dibabawon 27 10 - 5 - 6 6
Dibabeen Mulitaan 9 1 - - - 8 - Dibaben 172 41 26 44 15 8 38 Direrayaan 18 - - 12 - - 6 Dumagat/Alta 12 1 1 5 - - 5 Dumagat 299 21 200 29 7 19 23 Eskaya 5 1 - 4 - - - Gaddang 241 46 16 109 29 - 41 Gubang 7 5 - 2 - - - Gubatnon 137 16 18 49 - 20 34 Guiangan 9 1 - 3 1 - 4
Halawodnon 21 - - 12 - 9 - Hanunuo 17 1 3 4 - 9 - Henanga 46 13 6 8 6 - 13 Higaonon 99 37 6 27 - 24 5 Hiligaynon Ilonggo 13,396 1,454 597 1,721 615 8,142 867 Ibaloi/Ibaloy 55 16 18 11 - - 10 Ibanag 493 110 42 268 14 10 49 Ibatan 76 11 8 22 10 18 7 Ifugao 152 48 14 60 7 5 18 Ilianen 39 15 - 19 - - 5
Illaud 10 1 - 3 1 5 - Ilocano 11,584 3,008 1,293 4,030 851 718 1,684 Iranon/Iranun/Iraynon 34 2 3 22 - 1 6 Iraya 18 3 - 13 - 2 - Isinai 84 19 17 36 - 8 4 Isneg/Isnag/Apayao 16 3 3 2 4 - 4 Isoroken 77 26 20 23 - 1 7 Itawis 83 38 8 23 5 2 7 Itneg/Tingguian 30 - - 9 - 3 18 Ivatan 27 7 - 7 - 3 10
Iwak/Iowak/Owak/I-wak 7 - 1 - - 6 - Jama Mapun 11 - - 3 1 - 7 Kabayukan 3 1 - 2 - - -
1 - 52

Table 1.9 - ContinuedHOUSEHOLD POPULATION BY ETHNICITY AND PROVINCECensus Year 2010
Ethnicity Region V Albay Cam. Norte Cam. Sur Catanduanes Masbate Sorsogon
Kabihug 724 - 724 - - - - Kadaklan/kachakran 6 2 - 4 - - - Kailawan/Kaylawan 14 7 - 4 - - 3 Kalagan 21 10 3 1 6 - 1 Kalanguya 5 - - 2 - - 3 Kalanguya-Ikalahan - - - - - - - Kalibugan/Kolibugan 34 17 2 10 - - 5
Kalinga 86 20 8 32 - 8 18 Kamiguin 32 7 7 3 - 11 4 Kankanaey 81 16 10 38 6 9 2 Kapampangan 2,534 701 275 989 135 99 335 Karao 20 - 1 1 - 14 4 Karay-a 546 62 33 160 73 161 57 Karulano 7 - - 3 1 3 - Kaunana 3 3 - - - - - Ke’ney or Ken-ey/Tau’t-Bato 9 1 - 7 - - 1 Kirenteken - - - - - - -
Lahitanen 75 29 3 7 3 9 24 Lambangian 13 1 - 9 - - 3 Langilan 68 1 1 1 4 61 - Livunganen 13 3 1 4 - - 5 Mabaka 2 - - - - 1 1 Maeng 16 - - 8 - 8 - Magahats 2 - - - - 2 - Mag-anti/Mag-Antsi/Mag-anch 2 - - 1 1 - - Magbekin/Magbukon/Magbuku - - - - - - - Mag-indi - - - - - - -
Magkunana 1 - - 1 - - - Maguindanao 666 114 88 217 44 55 148 Majokayong 2 - - - - 2 - Malaueg 3 1 1 1 - - - Mamanwa 58 9 4 15 - 20 10 Mandaya 31 6 5 5 3 7 5 Mangguangan 4 - - - - 2 2 Manobo 151 16 10 47 3 49 26 Manobo-Blit 2 - - 2 - - - Manobo-Dulangan 33 - - - - 33 -
Mansaka 19 - - - - 19 - Manubo-Ubo/Manobo-Ubo 198 21 11 21 1 133 11 Maranao 3,022 770 393 678 31 637 513 Masadiit 106 3 - 18 - 84 1 Masbateño/Masbatenon 552,603 720 211 440 69 550,016 1,147 Matigsalog/Matigsalug 85 - - - - 77 8 Molbog 382 92 34 56 37 63 100 Muyadan 176 10 4 - 2 160 - Obu-Manuvu/Ubo-Manobo 53 4 2 - - 43 4 Pala’wan/Palawan-o 349 58 28 138 16 51 58
1 - 53

Table 1.9 - ContinuedHOUSEHOLD POPULATION BY ETHNICITY AND PROVINCECensus Year 2010
Ethnicity Region V Albay Cam. Norte Cam. Sur Catanduanes Masbate Sorsogon
Palawani 126 33 12 50 5 5 21 Pan-ayanon 70 13 11 34 2 - 10 Panay-Bukidnon 31 1 6 13 - 11 - Pangasinan/Panggalato 2,713 797 305 932 204 110 365 Parananum 5 - - 5 - - - Pulangien/Pulangiyen 39 2 15 18 4 - - Ratagnon 39 1 - 3 - 3 32 Remontado - - - - - - - Romblomanon 486 82 24 135 21 165 59 Sama Badajo 9 1 3 - - 5 -
Sama Bangingi 35 - - 3 - 32 - Sama Laut 23 6 - 11 - - 6 Sama/Samal 486 113 48 115 49 93 68 Sangil 10 5 - - - 3 2 Sibuyan Mangyan-Tagabukid 504 9 7 4 - 478 6 Subanen/Subanon/Subanun 86 26 9 20 - 18 13 Surigaonon 818 203 61 254 45 148 107 T’boli/Tboli 31 9 4 8 1 8 1 Tadyawan 5 - - - - 5 - Tagabawa 34 8 11 6 - 4 5
Tagakaulo 8 1 3 3 - - 1 Tagalog 153,031 10,389 81,432 50,481 2,401 2,571 5,757 Tagbanua 72 1 12 29 3 12 15 Tagbanua (Kalamianen) 29 5 1 18 1 - 4 Tagbanua/Calamian 92 1 29 11 - 48 3 Talaandig 68 7 29 24 1 5 2 Talaingod 41 5 12 16 8 - - Tau-buid 35 16 13 5 - - 1 Tausug 380 128 59 116 12 11 54 Teduray 24 4 - 1 - 6 13
Tigwahanon 27 2 2 15 - 1 7 Tinananen 37 7 1 10 - 12 7 Tuwali 21 - 3 11 - 1 6 Waray 9,785 2,248 749 2,682 903 1,727 1,476 Yakan 76 8 5 10 14 31 8 Yapayao - - - - - - - Yogad 6 4 - 2 - - - Zambageño-Chavacano 924 198 112 359 65 81 109 Zambal 382 102 51 152 25 14 38 Other Local Ethnicity 476 86 117 188 7 39 39
American/English 219 38 22 104 29 8 18 Other Foreign Ethnicity 1,026 306 105 445 39 49 82 Not Stated 11 - - 11 - - -
1 - 54

Table 1.10 HOUSEHOLD POPULATION FIVE YEARS OLD AND OVER BY SEX, PLACE OF PREVIOUSRESIDENCE 5 YEARS AGO AND PROVINCE/CITYCensus Years 1990, 2000 and 2010
Province/Cityand Sex
1990 2000 2010 1990 2000 2010
Region V
Both Sexes 3,309,333 4,024,621 4,748,440 3,176,363 3,823,088 4,626,730Female 1,630,824 2,050,744 2,331,214 1,562,672 1,952,295 2,266,871Male 1,678,509 1,973,877 2,417,226 1,613,691 1,870,793 2,359,859
Albay
Both Sexes 667,522 946,291 1,091,150 645,639 900,900 1,065,073Female 329,998 467,230 539,491 318,699 443,592 525,470Male 337,524 479,061 551,659 326,940 457,308 539,603
Camarines Norte
Both Sexes 330,530 404,785 475,257 306,275 384,288 459,906Female 160,817 207,320 232,374 148,925 197,214 224,455Male 169,713 197,465 242,883 157,350 187,074 235,451
Camarines Sur
Both Sexes 937,541 1,333,917 1,594,416 901,007 1,261,950 1,548,624Female 460,345 654,542 781,596 441,642 617,698 757,110Male 477,196 679,375 812,820 459,365 644,252 791,514
Catanduanes
Both Sexes 159,945 186,069 216,776 153,190 178,996 207,422Female 78,537 94,429 105,865 75,087 91,008 100,870Male 81,408 91,640 110,911 78,103 87,988 106,552
Masbate
Both Sexes 502,027 596,773 717,377 485,885 565,819 706,410Female 247,426 304,702 351,420 239,390 289,357 345,919Male 254,601 292,071 365,957 246,495 276,462 360,491
Sorsogon
Both Sexes 444,219 556,786 653,464 433,099 531,135 639,295Female 217,881 285,857 320,468 212,019 273,156 313,047Male 226,338 270,929 332,996 221,080 257,979 326,248
Note: Provincial data includes city data.
Source: Philippine Statistics Authority
Household Population 5 Years Old and Over Same City/Municipality
1 - 55

Place of Previous Residence 5 Years Ago
1990 2000 2010 1990 2000 2010 1990 2000 2010 1990 2000 2010
56,763 33,279 39,633 70,829 63,361 77,442 1,683 5,226 4,580 3,695 99,667 5529,971 15,314 21,517 35,549 30,979 40,441 697 2,722 2,355 1,935 49,434 3026,792 17,965 18,116 35,280 32,382 37,001 986 2,504 2,225 1,760 50,233 25
7,901 6,691 7,617 12,746 16,251 17,361 340 1,084 1,094 896 21,365 54,146 3,696 4,188 6,570 8,557 9,286 125 484 544 458 10,901 33,755 2,995 3,429 6,176 7,694 8,075 215 600 550 438 10,464 2
8,478 5,158 4,818 15,240 8,913 10,083 223 645 446 314 5,781 44,339 2,496 2,538 7,321 4,406 5,181 70 348 197 162 2,856 34,139 2,662 2,280 7,919 4,507 4,902 153 297 249 152 2,925 1
18,373 13,604 18,284 17,224 18,666 25,373 446 2,315 2,101 491 37,382 349,610 7,486 10,109 8,637 9,464 13,244 201 1,110 1,116 255 18,784 178,763 6,118 8,175 8,587 9,202 12,129 245 1,205 985 236 18,598 17
1,665 843 2,203 4,615 3,128 6,675 204 386 474 271 2,716 2860 391 1,192 2,340 1,528 3,514 113 148 288 137 1,354 1805 452 1,011 2,275 1,600 3,161 91 238 186 134 1,362 1
8,786 4,773 4,114 6,737 6,605 6,755 56 258 89 563 19,318 94,460 2,292 2,079 3,257 3,271 3,382 20 140 35 299 9,642 54,326 2,481 2,035 3,480 3,334 3,373 36 118 54 264 9,676 4
3,291 2,210 2,597 6,689 9,798 11,195 170 538 376 970 13,105 11,804 1,022 1,411 3,471 4,878 5,834 64 281 175 523 6,520 11,487 1,188 1,186 3,218 4,920 5,361 106 257 201 447 6,585 -
Other Province Foreign Country UnknownOther City/Municipality Same Province
1 - 56

Table 1.10 - Continued
HOUSEHOLD POPULATION FIVE YEARS OLD AND OVER BY SEX, PLACE OF PREVIOUSRESIDENCE 5 YEARS AGO AND PROVINCE/CITYCensus Years 1990, 2000 and 2010
Province/Cityand Sex
1990 2000 2010 1990 2000 2010
Household Population 5 Years Old and Over Same City/Municipality
Iriga City
Both Sexes 63,967 77,538 93,606 61,521 73,496 92,203Female 32,244 38,857 46,444 30,979 36,822 45,731Male 31,723 38,681 47,162 30,542 36,674 46,472
Legazpi City
Both Sexes 104,326 137,245 162,214 99,276 128,312 157,406Female 52,668 67,864 81,625 49,904 63,653 79,032Male 51,658 69,381 80,589 49,372 64,659 78,374
Ligao City
Both Sexes - 77,925 92,094 - 74,162 90,518Female - 38,622 45,339 - 36,673 44,496Male - 39,303 46,755 - 37,489 46,022
Masbate City
Both Sexes - 60,516 73,686 - 56,426 72,019Female - 30,173 36,724 - 27,983 35,868Male - 30,343 36,962 - 28,443 36,151
Naga City
Both Sexes 99,256 119,653 154,841 90,471 111,677 147,139Female 50,908 58,652 79,332 46,027 55,107 74,982Male 48,348 61,001 75,509 44,444 56,570 72,157
Sorsogon City
Both Sexes - 79,078 137,313 - 74,786 133,530Female - 39,131 68,535 - 36,942 66,491Male - 39,947 68,778 - 37,844 67,039
Tabaco City
Both Sexes - 92,885 110,335 - 87,881 107,334Female - 45,390 54,569 - 42,771 52,950Male - 47,495 55,766 - 45,110 54,384
1 - 57

Place of Previous Residence 5 Years Ago
1990 2000 2010 1990 2000 2010 1990 2000 2010 1990 2000 2010
Other Province Foreign Country UnknownOther City/Municipality Same Province
1,054 474 444 1,268 1,060 831 105 396 128 19 2,112 - 575 233 224 630 542 425 49 209 64 11 1,051 - 479 241 220 638 518 406 56 187 64 8 1,061 -
1,919 1,450 1,535 2,965 2,988 3,109 74 197 164 92 4,298 - 1,070 628 857 1,616 1,373 1,660 28 121 76 50 2,089 -
849 822 678 1,349 1,615 1,449 46 76 88 42 2,209 -
- 358 401 - 960 1,055 - 69 118 - 2,376 2- 192 211 - 509 576 - 31 56 - 1,217 - - 166 190 - 451 479 - 38 62 - 1,159 2
- 1,153 779 - 1,054 860 - 50 28 - 1,833 - - 686 432 - 553 413 - 20 11 - 931 - - 467 347 - 501 447 - 30 17 - 902 -
5,296 2,486 4,327 3,345 2,118 3,045 65 259 326 79 3,113 43,107 901 2,570 1,707 977 1,610 27 131 166 40 1,536 42,189 1,585 1,757 1,638 1,141 1,435 38 128 160 39 1,577 -
- 538 764 - 1,112 2,890 - 51 129 - 2,591 - - 305 436 - 564 1,549 - 26 59 - 1,294 - - 233 328 - 548 1,341 - 25 70 - 1,297 -
- 1,107 777 - 1,971 2,096 - 152 128 - 1,774 - - 622 468 - 1,033 1,100 - 56 51 - 908 - - 485 309 - 938 996 - 96 77 - 866 -
1 - 58

Table 1.11PROJECTED NET MIGRATION RATES BY SEX AND PROVINCE1995-2000 to 2015-2020
Net Migration Rate Projected Net Migration Rate1985-1990 1975-1980 1995-2000 2000-2005 2005-2010 2010-2015 2015-2020
Female
Region V -0.032560 -0.027673 -0.036505 -0.038654 -0.036505 -0.034476 -0.034476
Albay -0.039039 -0.046094 -0.028781 -0.024712 -0.021219 -0.018219 -0.018219Camarines Norte -0.005306 -0.044014 -0.002651 -0.001874 -0.001325 -0.000936 -0.000936Camarines Sur -0.028334 -0.021996 -0.030553 -0.031726 -0.032945 -0.034210 -0.034210Catanduanes -0.031784 -0.051610 -0.024166 -0.021071 -0.018373 -0.016020 -0.016020Masbate -0.082752 -0.051905 -0.095452 -0.097815 -0.095452 -0.090948 -0.090948Sorsogon -0.057581 -0.030096 -0.073920 -0.080249 -0.073920 -0.066346 -0.066346
Male
Region V -0.025626 -0.017670 -0.033896 -0.038984 -0.033896 -0.029473 -0.029473
Albay -0.033200 -0.035163 -0.024338 -0.020838 -0.017841 -0.015276 -0.015276Camarines Norte 0.006101 -0.033320 0.006101 0.006406 0.007407 0.008104 0.008104Camarines Sur -0.021840 -0.014403 -0.027961 -0.031637 -0.035796 -0.040503 -0.040503Catanduanes -0.021536 -0.035691 -0.016218 -0.014074 -0.012213 -0.010598 -0.010598Masbate -0.066165 -0.038490 -0.090946 -0.102106 -0.090946 -0.078851 -0.078851Sorsogon -0.047733 -0.016469 -0.077745 -0.091581 -0.077745 -0.062835 -0.062835
Source: 1995 Census-Based National, Regional and Provincial Population ProjectionsPrepared by: Technical Advisory Group and NSO Population Projections UnitReviewed and endorsed by: Technical Committee on Population and Housing Statistics
for NSCB Executive Board Approval
Sex / Province
1 - 59

Table 1.12 PROJECTED POPULATION BY AGE GROUP, SEX, FIVE-CALENDAR YEARS AND PROVINCE2010 - 2045 (Medium Series)
Age/Sex 2010 2015 2020 2025 2030 2035 2040 2045
Region V
Both Sexes0-4 716,300 737,100 798,000 848,600 866,100 854,600 828,500 795,900 5-9 703,300 711,800 733,000 794,400 845,400 863,200 852,300 826,500
10-14 692,700 699,400 708,600 730,200 792,000 843,200 861,300 850,400 15-19 595,900 678,600 688,600 700,300 723,900 786,500 838,300 856,800 20-24 438,900 578,500 664,300 677,500 691,800 717,200 780,600 833,000 25-29 362,200 429,600 569,900 656,800 671,600 687,300 713,400 777,400 30-34 338,500 357,000 425,000 565,500 652,800 668,300 684,500 711,000 35-39 309,300 333,400 352,700 420,900 561,300 648,900 665,100 681,800 40-44 292,400 303,300 328,100 348,000 416,500 556,600 644,600 661,300 45-49 252,600 284,900 296,600 322,000 342,700 411,100 550,700 638,900 50-54 213,900 243,600 276,200 288,900 314,900 336,100 404,400 543,100 55-59 170,800 203,200 232,900 265,500 279,000 305,200 326,900 394,700 60-64 135,500 158,500 189,800 218,900 251,000 265,100 291,400 313,400 65-69 100,300 120,900 142,500 172,200 200,000 231,000 245,600 271,500 70-74 75,700 84,600 103,100 122,700 149,500 175,300 204,100 218,600 75-79 46,600 58,000 66,000 81,600 98,600 121,800 144,600 170,400
80 & over 43,400 49,700 61,800 74,600 93,600 117,100 148,400 184,800 All ages 5,488,300 6,032,100 6,637,100 7,288,600 7,950,700 8,588,500 9,184,700 9,729,500
Male0-4 366,400 378,900 410,200 436,300 445,300 439,400 426,000 409,300 5-9 363,800 364,000 376,600 408,200 434,400 443,600 438,000 424,800
10-14 358,600 361,900 362,500 375,200 406,900 433,200 442,600 437,000 15-19 313,700 352,900 357,300 358,700 372,200 404,100 430,600 440,100 20-24 231,900 305,000 345,500 351,400 354,100 368,500 400,900 427,800 25-29 188,200 226,700 300,000 341,100 348,000 351,500 366,400 399,200 30-34 174,300 185,100 223,800 297,200 338,500 345,900 349,800 365,000 35-39 157,600 171,400 182,600 221,400 294,600 336,200 344,000 348,200 40-44 149,300 154,200 168,300 179,800 218,700 291,700 333,500 341,600 45-49 128,700 144,800 150,200 164,600 176,600 215,300 288,000 329,900 50-54 107,200 123,000 139,300 145,300 160,000 172,300 210,800 282,800 55-59 83,700 100,400 116,100 132,300 138,800 153,600 166,100 204,200 60-64 63,500 75,900 91,800 107,000 122,900 129,800 144,500 157,100 65-69 45,100 54,600 65,900 80,700 95,000 110,100 117,300 131,600 70-74 32,200 36,000 44,200 54,200 67,100 80,000 93,700 100,800 75-79 18,800 23,000 26,200 32,700 40,800 51,400 62,200 73,900
80 & over 15,200 17,500 21,500 25,800 32,600 41,700 54,000 68,600 All ages 2,798,200 3,075,300 3,382,000 3,711,900 4,046,500 4,368,300 4,668,400 4,941,900
Female0-4 349,900 358,200 387,800 412,300 420,800 415,200 402,500 386,600 5-9 339,500 347,800 356,400 386,200 411,000 419,600 414,300 401,700
10-14 334,100 337,500 346,100 355,000 385,100 410,000 418,700 413,400 15-19 282,200 325,700 331,300 341,600 351,700 382,400 407,700 416,700 20-24 207,000 273,500 318,800 326,100 337,700 348,700 379,700 405,200 25-29 174,000 202,900 269,900 315,700 323,600 335,800 347,000 378,200 30-34 164,200 171,900 201,200 268,300 314,300 322,400 334,700 346,000 35-39 151,700 162,000 170,100 199,500 266,700 312,700 321,100 333,600 40-44 143,100 149,100 159,800 168,200 197,800 264,900 311,100 319,700 45-49 123,900 140,100 146,400 157,400 166,100 195,800 262,700 309,000 50-54 106,700 120,600 136,900 143,600 154,900 163,800 193,600 260,300 55-59 87,100 102,800 116,800 133,200 140,200 151,600 160,800 190,500 60-64 72,000 82,600 98,000 111,900 128,100 135,300 146,900 156,300 65-69 55,200 66,300 76,600 91,500 105,000 120,900 128,300 139,900 70-74 43,500 48,600 58,900 68,500 82,400 95,300 110,400 117,800 75-79 27,800 35,000 39,800 48,900 57,800 70,400 82,400 96,500
80 & over 28,200 32,200 40,300 48,800 61,000 75,400 94,400 116,200 All ages 2,690,100 2,956,800 3,255,100 3,576,700 3,904,200 4,220,200 4,516,300 4,787,600
Source: Philippine Statistics Authority, 2010 Census-based Population Projections in collaboration with the Inter-Agency Working Group on Population Projections
1 - 60

Table 1.12 - ContinuedPROJECTED POPULATION BY AGE GROUP, SEX, FIVE-CALENDAR YEARS AND PROVINCE2010 - 2045 (Medium Series)
Age/Sex 2010 2015 2020 2025 2030 2035 2040 2045
Albay
Both Sexes0-4 151,700 153,700 162,100 167,100 165,900 159,700 151,400 141,800 5-9 150,500 150,900 153,000 161,700 166,800 165,500 159,600 151,300
10-14 149,100 149,700 150,300 152,400 161,200 166,400 165,100 159,100 15-19 136,500 146,300 147,400 148,300 150,500 159,200 164,200 163,000 20-24 103,800 132,300 142,800 144,300 145,400 147,800 156,200 161,200 25-29 87,100 101,500 130,200 140,800 142,700 144,000 146,400 154,900 30-34 80,100 85,800 100,400 129,200 140,000 142,000 143,500 146,000 35-39 72,500 78,900 84,900 99,500 128,300 139,200 141,400 143,000 40-44 68,700 71,000 77,700 83,700 98,400 127,300 138,300 140,600 45-49 59,400 67,000 69,500 76,200 82,400 97,100 125,800 137,000 50-54 50,500 57,500 65,000 67,700 74,600 80,900 95,700 124,300 55-59 41,400 48,300 55,300 62,800 65,700 72,700 79,000 93,600 60-64 33,600 38,700 45,600 52,400 59,900 63,000 69,800 76,200 65-69 23,300 30,300 35,200 41,700 48,400 55,500 58,800 65,600 70-74 17,600 19,900 26,100 30,700 36,700 42,800 49,700 52,900 75-79 11,000 13,800 15,800 21,100 25,200 30,600 36,000 42,200
80 & over 10,800 12,400 15,400 18,800 24,700 31,100 39,000 48,300 All ages 1,247,600 1,358,000 1,476,700 1,598,400 1,716,800 1,824,800 1,919,900 2,001,000
Male0-4 78,500 79,000 83,300 85,900 85,300 82,100 77,800 72,900 5-9 77,900 78,100 78,600 83,100 85,700 85,100 82,100 77,800
10-14 77,400 77,500 77,800 78,300 82,800 85,500 84,900 81,800 15-19 71,200 76,100 76,300 76,700 77,300 81,800 84,400 83,800 20-24 54,100 69,000 74,100 74,500 75,000 75,700 80,000 82,600 25-29 45,100 52,800 67,700 72,900 73,500 74,100 74,800 79,200 30-34 41,000 44,300 52,100 67,100 72,400 73,100 73,800 74,600 35-39 36,700 40,300 43,800 51,600 66,600 72,000 72,800 73,600 40-44 34,900 35,900 39,700 43,100 51,000 66,000 71,500 72,400 45-49 30,000 33,900 35,000 38,800 42,300 50,200 65,100 70,700 50-54 24,800 28,800 32,700 33,900 37,800 41,400 49,300 64,100 55-59 20,100 23,400 27,400 31,200 32,600 36,500 40,100 47,900 60-64 15,700 18,400 21,600 25,500 29,300 30,800 34,600 38,300 65-69 10,400 13,700 16,200 19,200 22,900 26,500 28,100 31,900 70-74 7,400 8,400 11,200 13,500 16,200 19,500 22,900 24,500 75-79 4,400 5,500 6,200 8,500 10,400 12,700 15,500 18,400
80 & over 3,500 4,200 5,300 6,400 8,600 11,000 13,900 17,700 All ages 633,100 689,300 749,000 810,200 869,700 924,000 971,600 1,012,200
Female0-4 73,200 74,700 78,800 81,200 80,600 77,600 73,600 68,900 5-9 72,600 72,800 74,400 78,600 81,100 80,400 77,500 73,500
10-14 71,700 72,200 72,500 74,100 78,400 80,900 80,200 77,300 15-19 65,300 70,200 71,100 71,600 73,200 77,400 79,800 79,200 20-24 49,700 63,300 68,700 69,800 70,400 72,100 76,200 78,600 25-29 42,000 48,700 62,500 67,900 69,200 69,900 71,600 75,700 30-34 39,100 41,500 48,300 62,100 67,600 68,900 69,700 71,400 35-39 35,800 38,600 41,100 47,900 61,700 67,200 68,600 69,400 40-44 33,800 35,100 38,000 40,600 47,400 61,300 66,800 68,200 45-49 29,400 33,100 34,500 37,400 40,100 46,900 60,700 66,300 50-54 25,700 28,700 32,300 33,800 36,800 39,500 46,400 60,200 55-59 21,300 24,900 27,900 31,600 33,100 36,200 38,900 45,700 60-64 17,900 20,300 24,000 26,900 30,600 32,200 35,200 37,900 65-69 12,900 16,600 19,000 22,500 25,500 29,000 30,700 33,700 70-74 10,200 11,500 14,900 17,200 20,500 23,300 26,800 28,400 75-79 6,600 8,300 9,600 12,600 14,800 17,900 20,500 23,800
80 & over 7,300 8,200 10,100 12,400 16,100 20,100 25,100 30,600 All ages 614,500 668,700 727,700 788,200 847,100 900,800 948,300 988,800
1 - 61

Table 1.12 - ContinuedPROJECTED POPULATION BY AGE GROUP, SEX, FIVE-CALENDAR YEARS AND PROVINCE2010 - 2045 (Medium Series)
Age/Sex 2010 2015 2020 2025 2030 2035 2040 2045
Camarines Norte
Both Sexes0-4 70,600 73,700 79,200 84,200 86,900 87,400 86,200 84,000 5-9 67,700 70,100 73,000 78,300 83,200 85,800 86,200 85,000
10-14 67,800 67,400 69,800 72,800 78,100 83,000 85,600 86,000 15-19 57,900 67,100 67,800 71,000 74,700 80,900 86,500 89,500 20-24 45,100 57,200 67,700 69,500 73,900 78,400 85,500 92,000 25-29 37,000 44,500 57,100 68,000 70,300 75,000 79,900 87,200 30-34 34,800 36,700 44,200 56,600 67,500 69,800 74,500 79,500 35-39 32,000 34,300 36,200 43,600 56,100 66,900 69,200 73,900 40-44 31,300 31,500 33,700 35,600 43,200 55,600 66,500 68,900 45-49 26,600 30,500 30,800 33,200 35,300 42,900 55,400 66,400 50-54 22,300 25,700 29,700 30,100 32,700 34,800 42,300 54,700 55-59 17,300 21,200 24,500 28,600 29,200 31,500 33,800 41,200 60-64 13,400 16,000 19,700 22,900 26,800 27,400 29,800 32,100 65-69 9,300 11,900 14,300 17,800 20,900 24,500 25,300 27,700 70-74 6,800 7,900 10,100 12,200 15,200 18,100 21,400 22,200 75-79 4,100 5,100 6,000 7,800 9,700 12,300 14,800 17,800
80 & over 3,600 4,300 5,300 6,600 8,700 11,300 14,800 18,700 All ages 547,600 605,100 669,100 738,800 812,400 885,600 957,700 1,026,800
Male0-4 35,400 37,900 40,700 43,300 44,700 44,900 44,300 43,200 5-9 35,100 35,100 37,400 40,100 42,600 43,900 44,100 43,500
10-14 35,100 34,900 35,000 37,300 40,000 42,500 43,800 44,000 15-19 30,200 34,900 35,300 35,700 38,300 41,400 44,200 45,700 20-24 23,900 30,000 35,500 36,500 37,600 40,700 44,400 47,700 25-29 19,000 23,600 30,000 35,800 37,200 38,500 41,900 45,700 30-34 18,000 18,800 23,400 29,700 35,500 36,900 38,200 41,600 35-39 16,400 17,700 18,500 23,000 29,300 35,000 36,400 37,700 40-44 16,200 16,100 17,300 18,100 22,700 28,900 34,600 36,000 45-49 13,800 15,700 15,700 17,000 18,000 22,500 28,800 34,600 50-54 11,500 13,200 15,200 15,200 16,600 17,600 22,100 28,300 55-59 8,600 10,800 12,400 14,400 14,500 15,800 16,800 21,200 60-64 6,400 7,800 9,800 11,300 13,200 13,300 14,600 15,600 65-69 4,200 5,500 6,700 8,600 10,000 11,700 12,000 13,200 70-74 2,900 3,400 4,400 5,500 7,000 8,300 9,800 10,000 75-79 1,600 2,000 2,400 3,200 4,100 5,400 6,400 7,700
80 & over 1,200 1,500 1,800 2,300 3,100 4,100 5,600 7,100 All ages 279,500 308,900 341,500 377,000 414,400 451,400 488,000 522,800
Female0-4 35,200 35,800 38,500 40,900 42,200 42,500 41,900 40,800 5-9 32,600 35,000 35,600 38,200 40,600 41,900 42,100 41,500
10-14 32,700 32,500 34,800 35,500 38,100 40,500 41,800 42,000 15-19 27,700 32,200 32,500 35,300 36,400 39,500 42,300 43,800 20-24 21,200 27,200 32,200 33,000 36,300 37,700 41,100 44,300 25-29 18,000 20,900 27,100 32,200 33,100 36,500 38,000 41,500 30-34 16,800 17,900 20,800 26,900 32,000 32,900 36,300 37,900 35-39 15,600 16,600 17,700 20,600 26,800 31,900 32,800 36,200 40-44 15,100 15,400 16,400 17,500 20,500 26,700 31,900 32,900 45-49 12,800 14,800 15,100 16,200 17,300 20,400 26,600 31,800 50-54 10,800 12,500 14,500 14,900 16,100 17,200 20,200 26,400 55-59 8,700 10,400 12,100 14,200 14,700 15,700 17,000 20,000 60-64 7,000 8,200 9,900 11,600 13,600 14,100 15,200 16,500 65-69 5,100 6,400 7,600 9,200 10,900 12,800 13,300 14,500 70-74 3,900 4,500 5,700 6,700 8,200 9,800 11,600 12,200 75-79 2,500 3,100 3,600 4,600 5,600 6,900 8,400 10,100
80 & over 2,400 2,800 3,500 4,300 5,600 7,200 9,200 11,600 All ages 268,100 296,200 327,600 361,800 398,000 434,200 469,700 504,000
1 - 62

Table 1.12 - ContinuedPROJECTED POPULATION BY AGE GROUP, SEX, FIVE-CALENDAR YEARS AND PROVINCE2010 - 2045 (Medium Series)
Age/Sex 2010 2015 2020 2025 2030 2035 2040 2045
Camarines Sur
Both Sexes0-4 242,300 254,000 273,600 289,600 294,800 291,000 282,300 270,700 5-9 238,700 241,100 252,800 272,700 288,800 294,400 290,700 282,100
10-14 229,700 237,700 240,100 251,900 271,700 288,000 293,400 289,800 15-19 199,500 225,500 234,000 236,700 248,600 268,300 284,200 289,500 20-24 153,000 194,000 220,500 229,400 232,300 244,100 263,400 279,000 25-29 125,000 149,900 191,100 217,900 227,000 230,100 242,000 261,200 30-34 115,200 123,300 148,500 189,900 216,800 226,100 229,300 241,200 35-39 102,700 113,700 122,000 147,300 188,600 215,700 225,200 228,600 40-44 96,300 100,800 112,000 120,500 145,700 186,900 214,200 223,800 45-49 83,800 94,000 98,600 110,000 118,600 143,800 184,800 212,000 50-54 71,600 80,900 91,200 96,000 107,400 116,200 141,300 182,100 55-59 57,500 68,000 77,200 87,500 92,700 104,100 113,000 137,800 60-64 45,200 53,400 63,400 72,700 82,800 88,200 99,600 108,400 65-69 32,300 40,200 48,100 57,600 66,500 76,400 82,000 92,900 70-74 23,900 27,200 34,400 41,400 50,300 58,500 67,800 73,300 75-79 15,000 18,400 21,400 27,400 33,500 41,100 48,500 56,800
80 & over 14,000 16,100 19,900 24,300 31,200 39,500 50,200 62,300 All ages 1,845,700 2,038,200 2,248,800 2,472,800 2,697,300 2,912,400 3,111,900 3,291,500
Male0-4 124,600 130,600 140,700 148,900 151,600 149,600 145,200 139,200 5-9 123,500 124,000 130,000 140,200 148,500 151,400 149,500 145,100
10-14 118,900 123,000 123,500 129,500 139,700 148,100 150,900 149,100 15-19 104,900 117,100 121,300 121,800 127,800 137,900 146,100 148,900 20-24 81,100 102,100 114,400 118,600 119,200 125,100 135,000 143,100 25-29 65,200 79,400 100,400 112,800 117,100 117,800 123,800 133,600 30-34 59,400 64,200 78,500 99,600 112,000 116,500 117,300 123,300 35-39 52,300 58,500 63,500 77,800 98,800 111,400 116,000 116,900 40-44 49,000 51,200 57,500 62,600 76,800 97,800 110,500 115,200 45-49 42,600 47,600 49,900 56,300 61,400 75,600 96,500 109,100 50-54 35,800 40,700 45,800 48,200 54,600 59,800 73,900 94,600 55-59 28,300 33,500 38,300 43,400 46,100 52,400 57,700 71,600 60-64 21,200 25,700 30,600 35,400 40,400 43,200 49,500 54,700 65-69 14,600 18,100 22,300 26,900 31,500 36,300 39,200 45,200 70-74 10,200 11,600 14,700 18,300 22,500 26,600 31,100 33,900 75-79 6,000 7,300 8,500 10,900 13,900 17,300 20,800 24,600
80 & over 5,200 5,800 7,000 8,500 10,900 14,200 18,400 23,300 All ages 942,800 1,040,400 1,146,900 1,259,700 1,372,800 1,481,000 1,581,400 1,671,400
Female0-4 117,700 123,400 132,900 140,700 143,200 141,400 137,100 131,500 5-9 115,200 117,100 122,800 132,500 140,300 143,000 141,200 137,000
10-14 110,800 114,700 116,600 122,400 132,000 139,900 142,500 140,700 15-19 94,600 108,400 112,700 114,900 120,800 130,400 138,100 140,600 20-24 71,900 91,900 106,100 110,800 113,100 119,000 128,400 135,900 25-29 59,800 70,500 90,700 105,100 109,900 112,300 118,200 127,600 30-34 55,800 59,100 70,000 90,300 104,800 109,600 112,000 117,900 35-39 50,400 55,200 58,500 69,500 89,800 104,300 109,200 111,700 40-44 47,300 49,600 54,500 57,900 68,900 89,100 103,700 108,600 45-49 41,200 46,400 48,700 53,700 57,200 68,200 88,300 102,900 50-54 35,800 40,200 45,400 47,800 52,800 56,400 67,400 87,500 55-59 29,200 34,500 38,900 44,100 46,600 51,700 55,300 66,200 60-64 24,000 27,700 32,800 37,300 42,400 45,000 50,100 53,700 65-69 17,700 22,100 25,800 30,700 35,000 40,100 42,800 47,700 70-74 13,700 15,600 19,700 23,100 27,800 31,900 36,700 39,400 75-79 9,000 11,100 12,900 16,500 19,600 23,800 27,700 32,200
80 & over 8,800 10,300 12,900 15,800 20,300 25,300 31,800 39,000 All ages 902,900 997,800 1,101,900 1,213,100 1,324,500 1,431,400 1,530,500 1,620,100
1 - 63

Table 1.12 - ContinuedPROJECTED POPULATION BY AGE GROUP, SEX, FIVE-CALENDAR YEARS AND PROVINCE2010 - 2045 (Medium Series)
Age/Sex 2010 2015 2020 2025 2030 2035 2040 2045
Catanduanes
Both Sexes0-4 31,100 35,500 39,300 42,000 43,200 43,600 44,000 44,100 5-9 30,800 30,900 35,300 39,000 41,900 42,900 43,300 43,700
10-14 31,500 30,600 30,800 35,200 39,000 41,900 43,100 43,500 15-19 27,700 31,100 30,600 31,000 35,800 39,800 43,100 44,500 20-24 19,700 27,300 31,200 31,200 32,000 37,200 41,800 45,400 25-29 16,000 19,500 27,100 31,200 31,300 32,400 37,500 42,300 30-34 14,700 15,800 19,300 26,900 31,000 31,100 32,000 37,200 35-39 13,600 14,500 15,600 19,100 26,700 30,700 30,900 31,900 40-44 13,300 13,300 14,300 15,500 19,100 26,600 30,700 30,900 45-49 11,500 13,000 13,100 14,100 15,400 18,900 26,500 30,700 50-54 9,500 11,100 12,600 12,800 13,800 15,200 18,700 26,300 55-59 7,600 9,000 10,700 12,100 12,400 13,500 14,800 18,400 60-64 6,400 7,000 8,400 9,900 11,400 11,700 12,900 14,200 65-69 5,400 5,600 6,300 7,500 9,000 10,500 10,900 11,900 70-74 4,500 4,500 4,700 5,300 6,500 7,900 9,300 9,700 75-79 2,900 3,400 3,500 3,700 4,200 5,200 6,400 7,600
80 & over 3,000 3,100 3,700 4,000 4,400 5,100 6,200 7,800 All ages 249,200 275,200 306,500 340,500 377,100 414,200 452,100 490,100
Male0-4 16,100 18,200 20,200 21,600 22,200 22,400 22,600 22,700 5-9 16,100 16,000 18,100 20,000 21,500 22,000 22,200 22,400
10-14 16,400 16,000 15,900 18,100 20,000 21,400 22,000 22,200 15-19 14,800 16,200 16,000 16,000 18,300 20,300 21,900 22,600 20-24 10,600 14,600 16,300 16,400 16,600 19,100 21,400 23,200 25-29 8,400 10,400 14,500 16,300 16,500 16,900 19,400 21,900 30-34 7,600 8,300 10,300 14,300 16,200 16,400 16,700 19,300 35-39 7,000 7,500 8,100 10,100 14,200 16,000 16,300 16,600 40-44 6,900 6,800 7,300 8,000 10,100 14,100 16,000 16,200 45-49 5,900 6,700 6,700 7,200 8,000 10,000 14,000 15,900 50-54 4,900 5,700 6,400 6,500 7,000 7,800 9,800 13,800 55-59 3,700 4,600 5,400 6,100 6,200 6,800 7,500 9,600 60-64 3,000 3,300 4,200 4,900 5,600 5,800 6,400 7,100 65-69 2,400 2,500 2,900 3,600 4,300 5,000 5,200 5,700 70-74 1,900 1,900 2,000 2,300 3,000 3,700 4,300 4,500 75-79 1,200 1,300 1,400 1,500 1,700 2,200 2,800 3,300
80 & over 1,100 1,100 1,300 1,400 1,500 1,800 2,300 2,900 All ages 128,000 141,100 157,000 174,300 192,900 211,700 230,800 249,900
Female0-4 15,000 17,300 19,100 20,400 21,000 21,200 21,400 21,400 5-9 14,700 14,900 17,200 19,000 20,400 20,900 21,100 21,300
10-14 15,100 14,600 14,900 17,100 19,000 20,500 21,100 21,300 15-19 12,900 14,900 14,600 15,000 17,500 19,500 21,200 21,900 20-24 9,100 12,700 14,900 14,800 15,400 18,100 20,400 22,200 25-29 7,600 9,100 12,600 14,900 14,800 15,500 18,100 20,400 30-34 7,100 7,500 9,000 12,600 14,800 14,700 15,300 17,900 35-39 6,600 7,000 7,500 9,000 12,500 14,700 14,600 15,300 40-44 6,400 6,500 7,000 7,500 9,000 12,500 14,700 14,700 45-49 5,600 6,300 6,400 6,900 7,400 8,900 12,500 14,800 50-54 4,600 5,400 6,200 6,300 6,800 7,400 8,900 12,500 55-59 3,900 4,400 5,300 6,000 6,200 6,700 7,300 8,800 60-64 3,400 3,700 4,200 5,000 5,800 5,900 6,500 7,100 65-69 3,000 3,100 3,400 3,900 4,700 5,500 5,700 6,200 70-74 2,600 2,600 2,700 3,000 3,500 4,200 5,000 5,200 75-79 1,700 2,100 2,100 2,200 2,500 3,000 3,600 4,300
80 & over 1,900 2,000 2,400 2,600 2,900 3,300 3,900 4,900 All ages 121,200 134,100 149,500 166,200 184,200 202,500 221,300 240,200
1 - 64

Table 1.12 - ContinuedPROJECTED POPULATION BY AGE GROUP, SEX, FIVE-CALENDAR YEARS AND PROVINCE2010 - 2045 (Medium Series)
Age/Sex 2010 2015 2020 2025 2030 2035 2040 2045
Masbate
Both Sexes0-4 125,600 113,200 126,300 139,600 146,300 144,600 138,300 132,000 5-9 120,000 124,100 112,100 125,400 138,900 145,800 144,300 138,200
10-14 117,000 118,600 123,100 111,400 125,000 138,400 145,500 144,000 15-19 91,000 112,800 115,000 120,100 109,100 122,700 136,200 143,300 20-24 60,500 86,800 108,600 111,200 116,700 106,300 120,100 133,500 25-29 50,200 58,400 84,600 106,400 109,300 115,200 105,100 119,100 30-34 47,800 48,900 57,400 83,600 105,400 108,600 114,700 104,800 35-39 45,500 46,600 48,000 56,600 82,800 104,700 108,100 114,300 40-44 41,600 44,400 45,700 47,300 55,800 82,000 103,800 107,300 45-49 36,000 40,200 43,200 44,600 46,300 54,900 80,900 102,700 50-54 30,800 34,400 38,800 41,900 43,600 45,300 53,900 79,700 55-59 24,000 29,000 32,700 37,100 40,200 42,000 43,900 52,500 60-64 18,000 22,100 26,900 30,500 34,900 38,000 39,900 41,900 65-69 15,000 16,000 19,600 24,300 27,600 31,900 34,800 36,900 70-74 11,700 12,500 13,500 16,800 20,800 24,000 27,800 30,700 75-79 6,700 8,800 9,600 10,500 13,200 16,600 19,400 22,900
80 & over 5,400 6,500 8,600 10,300 11,900 15,000 19,200 23,900 All ages 846,800 923,300 1,013,700 1,117,600 1,227,800 1,336,000 1,435,900 1,527,700
Male0-4 64,100 58,200 64,900 71,800 75,200 74,400 71,100 67,900 5-9 61,700 63,300 57,600 64,500 71,400 75,000 74,200 71,100
10-14 60,200 61,100 62,900 57,300 64,300 71,200 74,900 74,100 15-19 48,400 58,700 59,700 61,700 56,400 63,300 70,200 73,800 20-24 32,000 46,400 56,600 57,800 59,900 54,900 61,900 68,700 25-29 26,300 30,900 45,200 55,400 56,700 59,000 54,200 61,200 30-34 24,600 25,600 30,300 44,600 54,800 56,300 58,700 54,000 35-39 23,300 24,000 25,100 29,900 44,100 54,400 56,000 58,500 40-44 21,200 22,700 23,500 24,700 29,400 43,700 53,900 55,600 45-49 18,300 20,400 22,000 22,800 24,100 28,900 43,000 53,200 50-54 15,400 17,300 19,500 21,200 22,200 23,500 28,200 42,200 55-59 11,700 14,300 16,300 18,500 20,100 21,200 22,600 27,300 60-64 8,400 10,500 13,000 14,900 17,100 18,700 19,800 21,200 65-69 6,700 7,200 9,000 11,400 13,100 15,200 16,700 17,900 70-74 5,000 5,300 5,800 7,400 9,400 10,900 12,700 14,200 75-79 2,800 3,500 3,800 4,200 5,400 7,000 8,300 9,900
80 & over 2,000 2,400 3,000 3,500 4,100 5,300 6,900 8,800 All ages 432,100 471,800 518,200 571,600 627,700 682,900 733,300 779,600
Female0-4 61,500 55,000 61,400 67,800 71,100 70,200 67,200 64,100 5-9 58,300 60,800 54,500 60,900 67,500 70,800 70,100 67,100
10-14 56,800 57,500 60,200 54,100 60,700 67,200 70,600 69,900 15-19 42,600 54,100 55,300 58,400 52,700 59,400 66,000 69,500 20-24 28,500 40,400 52,000 53,400 56,800 51,400 58,200 64,800 25-29 23,900 27,500 39,400 51,000 52,600 56,200 50,900 57,900 30-34 23,200 23,300 27,100 39,000 50,600 52,300 56,000 50,800 35-39 22,200 22,600 22,900 26,700 38,700 50,300 52,100 55,800 40-44 20,400 21,700 22,200 22,600 26,400 38,300 49,900 51,700 45-49 17,700 19,800 21,200 21,800 22,200 26,000 37,900 49,500 50-54 15,400 17,100 19,300 20,700 21,400 21,800 25,700 37,500 55-59 12,300 14,700 16,400 18,600 20,100 20,800 21,300 25,200 60-64 9,600 11,600 13,900 15,600 17,800 19,300 20,100 20,700 65-69 8,300 8,800 10,600 12,900 14,500 16,700 18,100 19,000 70-74 6,700 7,200 7,700 9,400 11,400 13,100 15,100 16,500 75-79 3,900 5,300 5,800 6,300 7,800 9,600 11,100 13,000
80 & over 3,400 4,100 5,600 6,800 7,800 9,700 12,300 15,100 All ages 414,700 451,500 495,500 546,000 600,100 653,100 702,600 748,100
1 - 65

Table 1.12 - ContinuedPROJECTED POPULATION BY AGE GROUP, SEX, FIVE-CALENDAR YEARS AND PROVINCE2010 - 2045 (Medium Series)
Age/Sex 2010 2015 2020 2025 2030 2035 2040 2045
Sorsogon
Both Sexes0-4 95,000 107,000 117,500 126,100 129,000 128,300 126,300 123,300 5-9 95,600 94,700 106,800 117,300 125,800 128,800 128,200 126,200
10-14 97,600 95,400 94,500 106,500 117,000 125,500 128,600 128,000 15-19 83,300 95,800 93,800 93,200 105,200 115,600 124,100 127,000 20-24 56,800 80,900 93,500 91,900 91,500 103,400 113,600 121,900 25-29 46,900 55,800 79,800 92,500 91,000 90,600 102,500 112,700 30-34 45,900 46,500 55,200 79,300 92,100 90,700 90,500 102,300 35-39 43,000 45,400 46,000 54,800 78,800 91,700 90,300 90,100 40-44 41,200 42,300 44,700 45,400 54,300 78,200 91,100 89,800 45-49 35,300 40,200 41,400 43,900 44,700 53,500 77,300 90,100 50-54 29,200 34,000 38,900 40,400 42,800 43,700 52,500 76,000 55-59 23,000 27,700 32,500 37,400 38,800 41,400 42,400 51,200 60-64 18,900 21,300 25,800 30,500 35,200 36,800 39,400 40,600 65-69 15,000 16,900 19,000 23,300 27,600 32,200 33,800 36,500 70-74 11,200 12,600 14,300 16,300 20,000 24,000 28,100 29,800 75-79 6,900 8,500 9,700 11,100 12,800 16,000 19,500 23,100
80 & over 6,600 7,300 8,900 10,600 12,700 15,100 19,000 23,800 All ages 751,400 832,300 922,300 1,020,500 1,119,300 1,215,500 1,307,200 1,392,400
Male0-4 47,700 55,000 60,400 64,800 66,300 66,000 65,000 63,400 5-9 49,500 47,500 54,900 60,300 64,700 66,200 65,900 64,900
10-14 50,600 49,400 47,400 54,700 60,100 64,500 66,100 65,800 15-19 44,200 49,900 48,700 46,800 54,100 59,400 63,800 65,300 20-24 30,200 42,900 48,600 47,600 45,800 53,000 58,200 62,500 25-29 24,200 29,600 42,200 47,900 47,000 45,200 52,300 57,600 30-34 23,700 23,900 29,200 41,900 47,600 46,700 45,100 52,200 35-39 21,900 23,400 23,600 29,000 41,600 47,400 46,500 44,900 40-44 21,100 21,500 23,000 23,300 28,700 41,200 47,000 46,200 45-49 18,100 20,500 20,900 22,500 22,800 28,100 40,600 46,400 50-54 14,800 17,300 19,700 20,300 21,800 22,200 27,500 39,800 55-59 11,300 13,800 16,300 18,700 19,300 20,900 21,400 26,600 60-64 8,800 10,200 12,600 15,000 17,300 18,000 19,600 20,200 65-69 6,800 7,600 8,800 11,000 13,200 15,400 16,100 17,700 70-74 4,800 5,400 6,100 7,200 9,000 11,000 12,900 13,700 75-79 2,800 3,400 3,900 4,400 5,300 6,800 8,400 10,000
80 & over 2,200 2,500 3,100 3,700 4,400 5,300 6,900 8,800 All ages 382,700 423,800 469,400 519,100 569,000 617,300 663,300 706,000
Female0-4 47,300 52,000 57,100 61,300 62,700 62,300 61,300 59,900 5-9 46,100 47,200 51,900 57,000 61,100 62,600 62,300 61,300
10-14 47,000 46,000 47,100 51,800 56,900 61,000 62,500 62,200 15-19 39,100 45,900 45,100 46,400 51,100 56,200 60,300 61,700 20-24 26,600 38,000 44,900 44,300 45,700 50,400 55,400 59,400 25-29 22,700 26,200 37,600 44,600 44,000 45,400 50,200 55,100 30-34 22,200 22,600 26,000 37,400 44,500 44,000 45,400 50,100 35-39 21,100 22,000 22,400 25,800 37,200 44,300 43,800 45,200 40-44 20,100 20,800 21,700 22,100 25,600 37,000 44,100 43,600 45-49 17,200 19,700 20,500 21,400 21,900 25,400 36,700 43,700 50-54 14,400 16,700 19,200 20,100 21,000 21,500 25,000 36,200 55-59 11,700 13,900 16,200 18,700 19,500 20,500 21,000 24,600 60-64 10,100 11,100 13,200 15,500 17,900 18,800 19,800 20,400 65-69 8,200 9,300 10,200 12,300 14,400 16,800 17,700 18,800 70-74 6,400 7,200 8,200 9,100 11,000 13,000 15,200 16,100 75-79 4,100 5,100 5,800 6,700 7,500 9,200 11,100 13,100
80 & over 4,400 4,800 5,800 6,900 8,300 9,800 12,100 15,000 All ages 368,700 408,500 452,900 501,400 550,300 598,200 643,900 686,400
1 - 66

Table 1.13 NUMBER OF HOUSEHOLDS AND AVERAGE HOUSEHOLD SIZEBY PROVINCE/CITY/MUNICIPALITYCensus Years 2000 - 2015
2000 2007 2010 2015No. of Average No. of Average No. of Average No. of Average
Households HH Size Households HH Size Households HH Size Households HH Size
Region V 893,833 5.2 1,024,215 5.0 1,111,753 4.9 1,216,421 4.8
Albay 208,640 5.2 237,356 5.0 255,672 4.8 277,127 4.7
Bacacay 11,154 5.2 12,439 5.0 13,530 4.9 14,365 4.8Camalig 11,275 5.2 12,394 4.9 13,564 4.7 14,788 4.5Daraga 20,082 5.0 22,913 4.8 24,923 4.6 27,648 4.6Guinobatan 14,154 5.0 15,906 4.7 16,607 4.6 18,239 4.5Jovellar 3,234 5.4 3,324 5.3 3,555 4.8 3,812 4.5
LEGAZPI CITY 30,612 5.1 35,487 4.9 38,398 4.7 41,742 4.7Libon 12,572 5.3 13,395 5.1 14,552 4.9 15,528 4.8Ligao City 17,031 5.3 19,853 5.1 21,140 5.0 22,552 4.9Malilipot 5,714 5.2 6,896 4.9 7,366 4.8 8,104 4.7Malinao 6,966 5.2 8,003 4.9 8,760 4.9 9,765 4.6
Manito 3,776 5.4 4,294 5.0 4,710 4.8 5,101 4.8Oas 11,715 5.3 12,428 5.1 13,212 4.9 14,068 4.8Pio Duran 7,966 5.6 8,424 5.3 9,127 4.9 9,467 4.9Polangui 13,773 5.1 16,022 4.8 16,973 4.8 18,313 4.8Rapu-Rapu 5,591 5.2 6,287 5.1 6,933 5.2 7,401 5.0
Santo Domingo 5,390 5.1 6,426 4.8 6,887 4.7 7,516 4.6Tabaco City 19,599 5.5 23,460 5.3 25,329 4.9 27,702 4.8Tiwi 8,036 5.5 9,405 5.2 10,106 5.0 11,016 4.8
Camarines Norte 91,866 5.1 106,747 4.8 116,728 4.6 129,999 4.5
Basud 6,508 5.2 7,678 4.8 8,283 4.6 9,123 4.5Capalonga 5,031 5.3 5,908 5.0 6,627 4.7 7,169 4.5DAET 16,267 4.9 19,988 4.7 20,768 4.6 23,270 4.5Jose Panganiban 8,969 5.1 10,468 4.8 11,996 4.6 13,855 4.3Labo 15,786 5.2 18,046 4.9 19,810 4.6 22,256 4.5
Mercedes 7,932 5.3 9,125 4.9 9,959 4.8 10,899 4.7Paracale 8,431 5.0 9,816 4.8 11,414 4.7 13,176 4.5San Lorenzo Ruiz (Imelda) 2,220 5.3 2,531 4.9 2,744 4.6 3,184 4.4San Vicente 1,765 5.1 2,028 4.7 2,230 4.5 2,400 4.3Santa Elena 7,280 5.2 8,106 5.0 8,763 4.7 9,214 4.4
Talisay 4,270 5.0 4,891 4.7 5,225 4.6 5,803 4.5Vinzons 7,407 5.1 8,162 4.9 8,909 4.7 9,650 4.5
Source: Philippine Statistics Authority
Province/City/Municipality
1 - 67

Table 1.13 - Continued
NUMBER OF HOUSEHOLDS AND AVERAGE HOUSEHOLD SIZEBY PROVINCE/CITY/MUNICIPALITYCensus Years 2000 - 2015
2000 2007 2010 2015No. of Average No. of Average No. of Average No. of Average
Households HH Size Households HH Size Households HH Size Households HH Size
Province/City/Municipality
Camarines Sur 288,172 5.4 335,163 5.0 364,472 5.0 400,615 4.9
Baao 8,496 5.5 10,013 5.2 10,572 5.2 11,443 5.1Balatan 4,141 5.4 4,932 5.3 5,482 5.2 5,881 5.3Bato 7,737 5.5 8,825 5.0 9,122 5.3 9,869 5.3Bombon 2,335 5.5 2,717 5.2 3,183 4.8 3,461 4.8Buhi 13,238 5.1 14,013 5.1 15,598 4.7 16,541 4.7
Bula 10,088 5.7 11,996 5.2 12,855 5.3 13,589 5.1Cabusao 2,999 5.4 3,585 4.9 3,750 4.8 3,902 4.7Calabanga 12,444 5.4 14,391 5.1 15,603 5.0 17,211 4.8Camaligan 3,432 5.6 4,236 4.9 4,534 4.9 4,848 5.0Canaman 5,215 5.3 6,153 5.1 6,582 4.9 7,103 4.8
Caramoan 7,660 5.2 8,357 4.9 9,005 5.0 9,946 4.8Del Gallego 3,730 5.5 4,269 5.0 4,835 4.8 5,249 4.8Gainza 1,529 5.5 1,830 5.1 2,020 5.1 2,251 5.0Garchitorena 3,873 5.9 4,451 5.6 4,593 5.5 5,216 5.2Goa 9,139 5.3 10,780 5.0 11,700 5.0 12,842 4.9
Iriga City 17,061 5.2 19,298 5.1 21,759 4.8 21,840 5.1Lagonoy 8,135 5.2 9,264 5.0 10,374 5.0 11,312 4.9Libmanan 16,889 5.2 18,694 5.0 20,670 4.8 23,629 4.6Lupi 4,858 5.4 5,790 4.8 6,401 4.7 7,013 4.6Magarao 3,910 5.4 4,437 5.1 4,830 5.0 5,333 4.8
Milaor 4,013 5.6 5,050 5.2 5,484 5.2 6,324 4.9Minalabac 7,566 5.5 8,625 5.1 9,336 5.2 10,313 5.1Nabua 12,724 5.6 14,331 5.3 15,201 5.3 16,625 5.0Naga City 26,317 5.2 32,045 5.0 35,929 4.8 42,152 4.6Ocampo 6,615 5.5 8,025 5.0 8,587 5.1 9,322 4.9
Pamplona 5,421 5.4 6,302 5.1 6,839 5.0 7,583 4.8Pasacao 6,828 5.6 7,918 5.2 8,906 5.2 9,948 4.9PILI 12,389 5.4 14,992 5.1 16,193 5.0 18,178 4.9Presentacion 3,095 5.3 3,550 5.7 3,815 5.2 4,048 5.2Ragay 9,147 5.2 10,848 4.8 11,630 4.7 12,496 4.7
Sagñay 4,899 5.4 5,725 5.1 6,168 5.1 6,981 4.9San Fernando 5,046 5.4 5,986 5.1 6,529 5.1 7,246 4.8San Jose 6,043 5.4 7,114 5.0 7,687 5.0 8,684 4.7Sipocot 10,761 5.3 12,023 4.8 13,156 4.9 13,531 4.8Siruma 2,950 5.5 3,370 5.1 3,385 5.0 3,780 4.7
Tigaon 7,413 5.4 9,460 4.8 9,944 4.9 11,600 4.8Tinambac 10,036 5.5 11,768 5.0 12,215 5.1 13,325 5.1
1 - 68

Table 1.13 - Continued
NUMBER OF HOUSEHOLDS AND AVERAGE HOUSEHOLD SIZEBY PROVINCE/CITY/MUNICIPALITYCensus Years 2000 - 2015
2000 2007 2010 2015No. of Average No. of Average No. of Average No. of Average
Households HH Size Households HH Size Households HH Size Households HH Size
Province/City/Municipality
Catanduanes 41,019 5.3 46,092 5.0 49,368 5.0 53,814 4.8
Bagamanoc 1,879 5.2 2,132 4.8 2,263 5.0 2,410 4.8Baras 2,190 5.3 2,366 5.0 2,566 4.8 2,818 4.5Bato 3,497 5.1 3,846 4.9 4,180 4.8 4,563 4.7Caramoran 4,293 5.5 4,881 5.3 5,295 5.3 5,893 5.1Gigmoto 1,319 5.3 1,454 5.2 1,551 5.2 1,749 4.8
Pandan 3,181 5.6 3,554 5.3 3,786 5.1 4,208 4.9Panganiban 1,581 5.6 1,788 5.2 1,912 5.1 2,011 4.6San Andres 6,059 5.2 6,726 5.0 7,224 4.9 7,710 4.7San Miguel 2,387 5.1 2,508 5.2 2,726 5.2 3,052 4.9Viga 3,431 5.3 3,646 5.3 3,927 5.2 4,332 5.0
VIRAC 11,202 5.1 13,191 4.9 13,938 4.8 15,068 4.8
Masbate 138,945 5.1 155,886 4.9 171,644 4.9 188,013 4.7
Aroroy 10,736 5.5 11,805 5.3 14,581 5.2 17,087 5.0Baleno 3,612 5.5 3,999 5.4 4,782 5.1 5,369 4.8Balud 5,547 5.4 6,256 5.0 7,240 4.9 7,867 4.8Batuan 2,529 4.8 2,596 4.9 2,896 4.7 3,625 4.2Cataingan 9,310 5.0 10,047 4.9 10,548 4.7 10,833 4.6
Cawayan 10,304 5.1 12,686 4.7 13,316 4.7 15,063 4.4Claveria 7,730 5.0 8,074 5.0 8,692 4.8 9,173 4.8Dimasalang 4,367 4.9 4,641 4.9 5,156 4.9 5,430 4.8Esperanza 3,389 4.8 3,616 4.7 3,913 4.4 4,097 4.5Mandaon 6,119 5.2 6,799 5.1 7,701 5.0 8,741 4.7
MASBATE CITY 1/ 13,400 5.3 15,978 5.1 17,058 5.0 19,237 4.9Milagros 8,304 5.4 9,050 5.3 10,290 5.1 11,494 5.0Mobo 5,199 5.4 6,171 5.3 6,755 5.2 7,752 5.0Monreal 3,791 5.2 4,383 5.0 5,008 5.1 5,270 5.0Palanas 5,141 4.8 5,352 4.6 5,568 4.6 5,856 4.5
Pio V. Corpuz 4,769 4.5 4,914 4.5 5,338 4.4 5,285 4.4Placer 9,035 4.9 10,370 4.7 11,433 4.8 11,958 4.7San Fernando 4,222 4.5 4,329 4.5 4,765 4.5 5,402 4.3San Jacinto 5,652 4.4 6,222 4.3 6,530 4.3 7,065 4.3San Pascual 7,353 5.1 8,355 5.0 9,183 4.9 9,836 4.7
Uson 8,436 5.2 10,243 4.9 10,891 4.9 11,573 4.9
1/ Converted into a city under Republic Act (RA) No. 8807; ratified on September 30, 2000.
1 - 69

Table 1.13 - Continued
NUMBER OF HOUSEHOLDS AND AVERAGE HOUSEHOLD SIZEBY PROVINCE/CITY/MUNICIPALITYCensus Years 2000 - 2015
2000 2007 2010 2015No. of Average No. of Average No. of Average No. of Average
Households HH Size Households HH Size Households HH Size Households HH Size
Province/City/Municipality
Sorsogon 125,191 5.2 142,971 5.0 153,869 4.8 166,853 4.7
Bacon 8,136 5.2Barcelona 3,887 4.9 4,308 4.5 4,651 4.4 4,794 4.4Bulan 15,683 5.3 18,291 5.0 19,582 4.8 20,798 4.8Bulusan 4,218 4.9 4,641 4.6 4,900 4.5 5,307 4.3Casiguran 5,381 5.2 6,087 5.0 6,410 4.8 7,107 4.6
Castilla 8,695 5.2 9,969 5.0 11,022 4.8 12,298 4.7Donsol 7,503 5.3 8,637 5.1 9,397 5.1 10,322 4.8Gubat 10,876 4.8 11,930 4.7 12,710 4.5 13,471 4.4Irosin 8,639 5.3 9,913 5.0 10,447 5.0 11,418 5.0Juban 4,957 5.4 5,683 5.1 6,025 5.0 6,650 4.8
Magallanes 5,886 5.3 6,585 5.2 7,187 4.9 7,497 4.9Matnog 6,069 5.4 6,783 5.1 7,481 5.0 8,395 4.9Pilar 10,833 5.3 12,504 5.1 13,727 5.0 15,032 5.0Prieto Diaz 3,623 5.2 3,981 5.0 4,219 4.9 4,781 4.7Santa Magdalena 2,894 5.1 3,335 4.6 3,417 4.8 3,589 4.7
SORSOGON CITY 2 / 17,911 5.1 30,324 5.0 32,694 4.7 35,394 4.7
2/ Converted into a city under Republic Act No. 8806; ratified on December 16, 2000;
taken from municipalities of Sorsogon and Bacon.
Figure 1.5 NUMBER OF HOUSEHOLDS AND AVERAGE HOUSEHOLD SIZEREGION V, CENSUS YEARS 2000 - 2015
0.0
1.0
2.0
3.0
4.0
5.0
6.0
7.0
8.0
9.0
10.0
11.0
12.0
13.0
0
100,000
200,000
300,000
400,000
500,000
600,000
700,000
800,000
900,000
1,000,000
1,100,000
1,200,000
1,300,000
2000 2007 2010 2015
Aver
age
Hou
seho
ld S
ize
Num
ber o
f Hou
seho
lds
Number of Households
Average Household Size
1 - 70

Table 1.14NUMBER OF HOUSEHOLDS BY LANGUAGE GENERALLY SPOKEN AT HOME AND PROVINCECensus Year 2010
Total 1,111,753 255,672 116,728 364,472 49,368 171,644 153,869
Abelling/Abellen/Aberling/Aborlin 5 5 - - - - - Adasen 30 5 10 5 - 5 5Aeta/Ayta 10 - 5 - - - 5Agta 133 - - 133 - - - Ata 5 - - - - - 5Bangon 5 - - - - - 5Bantoanon 10 - - 10 - - - Batangan 15 - - 5 - 10 - Belwang 10 5 - - 5 - - Bikol/Bicol 841,172 250,554 40,250 345,434 48,891 3,870 152,173Binongan 5 - - 5 - - - Bisaya/Binisaya 9,612 179 84 54 - 9,174 121Boholano 59 - - 10 - 49 - Bontok 19 - - - - 19 - Bukidnon 4 - - - - 4 - Capizeño 5 - - - - 5 - Caviteño-Chavacano 10 - - 10 - - - Cebuano 46,041 15 - 5 - 46,021 - Chinese 71 36 20 10 - - 5Cotabateño 14 - - 5 - 9 - Davao-Chavacano 10 - - - - 10 - Davaweño 5 - - - - - 5Diangan 5 - - - - 5 - Gaddang 5 - 5 - - - - Hiligaynon Ilonggo 4,874 - 10 - - 4,854 10Ilocano 30 10 10 5 5 - - Isinai 5 5 - - - - - Kabihug 172 - 172 - - - - Kapampangan 45 5 10 25 - - 5Karay-a 24 19 - - - 5 - Maranao 254 60 41 15 - 55 83Masbateño/Masbatenon 107,048 25 5 5 5 106,987 21Molbog 15 5 - - - 10 - Obu-Manuvu/Ubo-Manobo 5 - - - - 5 - Pan-ayanon 5 - - - - 5 - Sama Bangingi 5 - - - - 5 - Sama Laut 5 - 5 - - - - Sama/Samal 5 - 5 - - - - Surigaonon 5 5 - - - - - Tagalog 101,131 4,595 76,056 18,188 437 501 1,354Tagbanua 5 - - - - 5 - Talaingod 10 - 5 5 - - - Tausug 10 - - 5 - - 5Waray 61 15 - 10 5 15 16Zambageño-Chavacano 20 - 10 10 - - - Other Local Dialects 413 - - 413 - - - American/English 240 98 15 67 15 5 40Other Foreign Languages 101 30 10 36 5 10 10
Note: Figures are based on 20-percent sample households. Details may not add up to total due to rounding off.
Source: Philippine Statistics Authority
Masbate SorsogonLanguage Generally Spoken at Home Region V Albay Camarines
NorteCamarines
SurCatandua
nes
1 - 71

Table 1.15A HOUSEHOLDS IN OCCUPIED HOUSING UNITS BY TENURE STATUS OF THE HOUSING UNIT ANDPROVINCE/CITY/MUNICIPALITYCensus Years 2000 and 2010
2 0 0 0Tenure Status of the Housing Unit
Province/ Occupied Total Owned/ Being Occupied Being OccupiedCity/Municipality Housing Number of Being Rented For Free For Free Not
Units Households Amortized With Consent Without Consent Reportedof Owner of Owner
Region V 883,175 893,833 693,145 34,908 133,367 6,985 25,428
Albay 206,443 208,640 165,529 8,054 26,360 3,376 5,321
Bacacay 11,113 11,154 9,248 125 1,418 63 300Camalig 11,150 11,275 8,855 204 1,766 53 397Daraga 19,751 20,082 15,771 1,108 2,270 324 609Guinobatan 13,958 14,154 11,473 576 1,545 51 509Jovellar 3,211 3,234 2,452 47 632 32 71
LEGAZPI CITY 30,173 30,612 22,886 1,933 3,376 1,273 1,144Libon 12,518 12,572 10,860 256 1,183 53 220Ligao 16,885 17,031 12,556 684 3,019 271 501Malilipot 5,701 5,714 4,740 60 496 305 113Malinao 6,946 6,966 5,730 154 948 10 124
Manito 3,742 3,776 3,015 45 601 10 105Oas 11,583 11,715 9,395 389 1,717 39 175Pio Duran 7,932 7,966 6,813 335 717 30 71Polangui 13,541 13,773 10,604 625 2,172 51 321Rapu-Rapu 5,505 5,591 4,662 105 737 - 87
Santo Domingo 5,344 5,390 4,328 261 680 - 121Tabaco 19,393 19,599 15,206 1,018 2,177 792 406Tiwi 7,997 8,036 6,935 129 906 19 47
Camarines Norte 90,838 91,866 74,392 4,453 10,961 266 1,794
Basud 6,460 6,508 5,550 172 745 10 31Capalonga 4,978 5,031 3,819 54 1,004 24 130DAET 16,020 16,267 12,464 1,702 1,681 80 340Jose Panganiban 8,873 8,969 6,812 808 1,094 11 244Labo 15,614 15,786 13,224 506 1,846 31 179
Mercedes 7,777 7,932 6,686 382 777 29 58Paracale 8,370 8,431 7,120 309 931 11 60San Lorenzo Ruiz
(Imelda) 2,204 2,220 1,815 9 330 12 54San Vicente 1,759 1,765 1,449 18 263 8 27Santa Elena 7,171 7,280 6,005 218 581 11 465
Talisay 4,254 4,270 2,955 134 1,044 20 117Vinzons 7,358 7,407 6,493 141 665 19 89
Camarines Sur 283,604 288,172 222,417 12,768 41,973 1,717 9,297
Baao 8,337 8,496 7,216 177 964 47 92Balatan 4,078 4,141 3,160 235 535 21 190Bato 7,546 7,737 6,373 72 1,001 22 269Bombon 2,330 2,335 1,880 24 352 72 7Buhi 12,681 13,238 10,481 230 2,021 59 447
Source: Philippine Statistics Authority
1 - 72
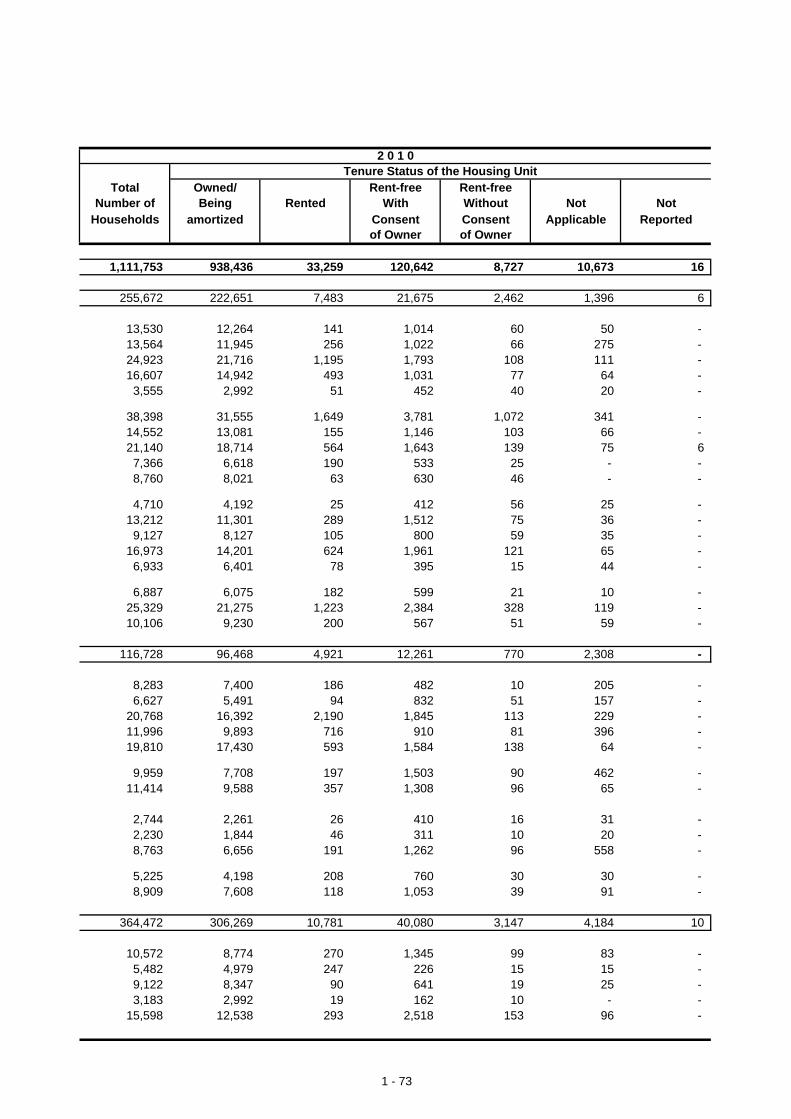
2 0 1 0Tenure Status of the Housing Unit
Total Owned/ Rent-free Rent-freeNumber of Being Rented With Without Not Not
Households amortized Consent Consent Applicable Reportedof Owner of Owner
1,111,753 938,436 33,259 120,642 8,727 10,673 16
255,672 222,651 7,483 21,675 2,462 1,396 6
13,530 12,264 141 1,014 60 50 - 13,564 11,945 256 1,022 66 275 - 24,923 21,716 1,195 1,793 108 111 - 16,607 14,942 493 1,031 77 64 -
3,555 2,992 51 452 40 20 -
38,398 31,555 1,649 3,781 1,072 341 - 14,552 13,081 155 1,146 103 66 - 21,140 18,714 564 1,643 139 75 6
7,366 6,618 190 533 25 - - 8,760 8,021 63 630 46 - -
4,710 4,192 25 412 56 25 - 13,212 11,301 289 1,512 75 36 -
9,127 8,127 105 800 59 35 - 16,973 14,201 624 1,961 121 65 -
6,933 6,401 78 395 15 44 -
6,887 6,075 182 599 21 10 - 25,329 21,275 1,223 2,384 328 119 - 10,106 9,230 200 567 51 59 -
116,728 96,468 4,921 12,261 770 2,308 -
8,283 7,400 186 482 10 205 - 6,627 5,491 94 832 51 157 -
20,768 16,392 2,190 1,845 113 229 - 11,996 9,893 716 910 81 396 - 19,810 17,430 593 1,584 138 64 -
9,959 7,708 197 1,503 90 462 - 11,414 9,588 357 1,308 96 65 -
2,744 2,261 26 410 16 31 - 2,230 1,844 46 311 10 20 - 8,763 6,656 191 1,262 96 558 -
5,225 4,198 208 760 30 30 - 8,909 7,608 118 1,053 39 91 -
364,472 306,269 10,781 40,080 3,147 4,184 10
10,572 8,774 270 1,345 99 83 - 5,482 4,979 247 226 15 15 - 9,122 8,347 90 641 19 25 - 3,183 2,992 19 162 10 - -
15,598 12,538 293 2,518 153 96 -
1 - 73

Table 1.15A - Continued
HOUSEHOLDS IN OCCUPIED HOUSING UNITS BY TENURE STATUS OF THE HOUSING UNIT ANDPROVINCE/CITY/MUNICIPALITYCensus Years 2000 and 2010
2 0 0 0Tenure Status of the Housing Unit
Province/ Occupied Total Owned/ Being Occupied Being OccupiedCity/Municipality Housing Number of Being Rented For Free For Free Not
Units Households Amortized With Consent Without Consent Reportedof Owner of Owner
Bula 9,810 10,088 7,920 50 1,579 42 497Cabusao 2,973 2,999 2,260 165 531 - 43Calabanga 12,323 12,444 9,670 380 2,043 81 270Camaligan 3,424 3,432 2,711 336 304 28 53Canaman 5,162 5,215 4,015 404 689 18 89
Caramoan 7,640 7,660 6,081 182 1,199 18 180Del Gallego 3,711 3,730 2,783 64 669 30 184Gainza 1,515 1,529 1,384 31 100 - 14Garchitorena 3,833 3,873 2,578 236 870 17 172Goa 8,992 9,139 7,328 527 1,100 26 158
Iriga City 16,739 17,061 13,868 1,005 1,470 - 718Lagonoy 8,084 8,135 6,315 172 1,363 - 285Libmanan 16,683 16,889 12,937 736 2,840 40 336Lupi 4,815 4,858 3,949 77 768 17 47Magarao 3,887 3,910 3,085 214 439 13 159
Milaor 3,953 4,013 3,376 93 477 9 58Minalabac 7,513 7,566 6,236 111 901 22 296Nabua 12,545 12,724 10,954 363 866 62 479Naga City 25,674 26,317 18,271 3,919 3,049 224 854Ocampo 6,587 6,615 4,757 91 1,486 118 163
Pamplona 5,312 5,421 4,101 255 818 63 184Pasacao 6,730 6,828 4,894 284 1,332 31 287PILI 12,130 12,389 8,789 542 2,448 212 398Presentacion 3,087 3,095 2,542 57 403 30 63Ragay 9,099 9,147 6,190 230 2,134 19 574
Sangay 4,851 4,899 3,890 94 739 38 138San Fernando 5,013 5,046 4,047 92 732 - 175San Jose 5,891 6,043 4,748 156 865 155 119Sipocot 10,624 10,761 8,871 371 1,322 74 123Siruma 2,939 2,950 1,986 98 733 20 113
Tigaon 7,208 7,413 5,036 346 1,399 70 562Tinambac 9,885 10,036 7,735 349 1,432 19 501
Catanduanes 40,146 41,019 33,203 1,377 5,348 373 718
Bagamanoc 1,866 1,879 1,405 33 433 - 8Baras 2,180 2,190 1,785 20 374 - 11Bato 3,478 3,497 2,932 132 357 - 76Caramoran 4,201 4,293 3,491 85 616 59 42Gigmoto 1,290 1,319 1,029 13 158 5 114
Pandan 3,120 3,181 2,651 65 308 134 23Panganiban 1,546 1,581 1,381 - 172 9 19San Andres 5,952 6,059 5,323 59 618 30 29San Miguel 2,226 2,387 2,005 63 278 - 41Viga 3,405 3,431 2,866 50 418 42 55
VIRAC 10,882 11,202 8,335 857 1,616 94 300
1 - 74

2 0 1 0Tenure Status of the Housing Unit
Total Owned/ Rent-free Rent-freeNumber of Being Rented With Without Not Not
Households amortized Consent Consent Applicable Reportedof Owner of Owner
12,855 11,373 70 1,222 75 116 - 3,750 3,259 36 351 75 29 -
15,603 13,302 389 1,666 124 122 - 4,534 3,845 313 298 35 44 - 6,582 4,852 302 1,150 88 190 -
9,005 7,244 180 1,450 126 5 - 4,835 4,040 109 572 41 73 - 2,020 1,840 20 151 5 5 - 4,593 3,561 119 832 53 28 -
11,700 9,058 561 1,881 112 87 -
21,759 19,023 1,154 1,376 101 105 - 10,374 9,069 136 989 65 115 - 20,670 17,395 303 2,215 216 541 -
6,401 5,543 96 685 47 30 - 4,830 4,124 198 442 19 46 -
5,484 4,797 98 476 58 55 - 9,336 7,332 52 1,628 116 207 -
15,201 13,684 241 1,113 63 100 - 35,929 27,714 3,441 3,756 442 576 -
8,587 7,218 155 998 166 51 -
6,839 6,265 77 421 39 37 - 8,906 7,306 223 1,118 78 182 -
16,193 13,435 527 2,069 86 75 - 3,815 3,166 45 366 36 202 -
11,630 9,599 231 1,393 180 227 -
6,168 5,412 34 566 40 116 - 6,529 5,789 55 586 63 36 - 7,687 6,867 91 676 20 33 -
13,156 11,410 236 1,265 65 179 - 3,385 3,022 10 260 30 64 -
9,944 7,867 196 1,736 105 40 - 12,215 10,231 166 1,480 81 247 10
49,368 40,296 1,722 7,063 252 36 -
2,263 1,550 26 672 16 - - 2,566 2,243 37 282 - 4 - 4,180 3,528 141 500 10 - - 5,295 4,362 75 796 45 17 - 1,551 1,282 24 235 10 - -
3,786 3,103 50 594 39 - - 1,912 1,537 55 314 5 - - 7,224 6,220 145 814 44 - - 2,726 2,332 68 311 11 5 - 3,927 3,195 49 674 5 4 -
13,938 10,943 1,051 1,870 68 5 -
1 - 75

Table 1.15A - Continued
HOUSEHOLDS IN OCCUPIED HOUSING UNITS BY TENURE STATUS OF THE HOUSING UNIT ANDPROVINCE/CITY/MUNICIPALITYCensus Years 2000 and 2010
2 0 0 0Tenure Status of the Housing Unit
Province/ Occupied Total Owned/ Being Occupied Being OccupiedCity/Municipality Housing Number of Being Rented For Free For Free Not
Units Households Amortized With Consent Without Consent Reportedof Owner of Owner
Masbate 137,659 138,945 100,624 4,505 27,698 546 5,572
Aroroy 10,618 10,736 7,912 454 1,995 28 347Baleno 3,600 3,612 2,976 92 286 - 258Balud 5,487 5,547 4,481 145 802 18 101Batuan 2,455 2,529 1,231 54 1,199 - 45Cataingan 9,216 9,310 7,156 222 1,634 90 208
Cawayan 10,226 10,304 8,529 157 1,267 16 335Claveria 7,617 7,730 5,379 181 1,684 35 451Dimasalang 4,260 4,367 3,430 130 774 - 33Esperanza 3,378 3,389 2,138 24 1,155 - 72Mandaon 6,055 6,119 4,381 192 1,320 12 214
MASBATE CITY 1/ 13,208 13,400 9,528 1,311 1,938 78 545Milagros 8,202 8,304 6,442 217 1,428 39 178Mobo 5,174 5,199 3,567 100 1,309 27 196Monreal 3,788 3,791 2,437 62 1,212 - 80Palanas 5,112 5,141 4,207 81 701 12 140
Pio V. Corpuz 4,755 4,769 3,058 40 1,403 20 248Placer 8,983 9,035 5,765 416 2,192 37 625San Fernando 4,194 4,222 3,421 79 620 - 102San Jacinto 5,628 5,652 4,486 209 849 39 69San Pascual 7,309 7,353 4,802 184 1,444 10 913
Uson 8,394 8,436 5,298 155 2,486 85 412
Sorsogon 124,485 125,191 96,980 3,751 21,027 707 2,726
Bacon 8,067 8,136 6,696 94 1,071 10 265Barcelona 3,879 3,887 2,832 29 886 13 127Bulan 15,600 15,683 11,745 510 3,057 100 271Bulusan 4,195 4,218 3,591 96 446 20 65Casiguran 5,356 5,381 4,333 102 891 19 36
Castilla 8,648 8,695 6,514 148 1,858 29 146Donsol 7,484 7,503 5,859 191 1,424 19 10Gubat 10,844 10,876 9,138 331 1,358 11 38Irosin 8,569 8,639 6,998 296 1,171 42 132Juban 4,942 4,957 3,431 52 1,242 24 208
Magallanes 5,845 5,886 4,068 250 1,486 49 33Matnog 6,036 6,069 4,287 189 1,230 102 261Pilar 10,806 10,833 7,761 198 2,336 108 430Prieto Diaz 3,603 3,623 2,997 52 519 39 16Santa Magdalena 2,884 2,894 2,202 112 488 28 64
SORSOGON 17,727 17,911 14,528 1,101 1,564 94 624
1/ Converted into a city under Republic Act (RA) No. 8807; ratified on September 30, 2000.
1 - 76

2 0 1 0Tenure Status of the Housing Unit
Total Owned/ Rent-free Rent-freeNumber of Being Rented With Without Not Not
Households amortized Consent Consent Applicable Reportedof Owner of Owner
171,644 140,703 4,342 24,820 1,029 750 -
14,581 12,032 471 1,910 50 119 - 4,782 4,112 85 550 24 11 - 7,240 6,560 55 589 31 5 - 2,896 2,037 46 784 29 - -
10,548 8,877 161 1,427 73 10 -
13,316 11,137 358 1,741 50 31 - 8,692 7,492 100 1,010 55 35 - 5,156 4,358 121 628 35 14 - 3,913 3,261 10 594 36 11 - 7,701 6,569 205 777 31 120 -
17,058 13,110 1,289 2,446 86 127 - 10,290 8,911 144 1,122 40 73 -
6,755 5,103 177 1,346 70 60 - 5,008 3,920 91 895 101 - - 5,568 4,462 30 1,015 40 20 -
5,338 4,534 24 750 29 - - 11,433 9,214 362 1,772 50 35 -
4,765 3,533 116 1,065 36 15 - 6,530 4,524 304 1,648 49 5 - 9,183 7,892 19 1,200 56 15 -
10,891 9,065 174 1,550 57 45 -
153,869 132,049 4,010 14,743 1,067 1,999 -
4,651 4,122 44 386 25 75 - 19,582 16,638 806 2,015 97 25 -
4,900 4,367 19 470 20 24 - 6,410 5,767 107 447 23 66 -
11,022 9,926 104 881 30 81 - 9,397 8,106 164 921 56 149 -
12,710 11,422 252 810 50 177 - 10,447 8,971 282 996 49 149 -
6,025 4,790 41 1,102 86 5 -
7,187 6,336 101 604 26 119 - 7,481 6,100 169 1,016 123 73 -
13,727 11,471 250 1,627 53 326 - 4,219 3,651 46 301 41 179 - 3,417 2,841 90 461 25 - -
32,694 27,540 1,536 2,704 364 551 -
1 - 77

Table 1.15BHOUSEHOLDS IN OCCUPIED HOUSING UNITS BY TENURE STATUS OF THE HOUSING UNIT ANDPROVINCE/CITY/MUNICIPALITYCensus Year 2015
Province/ Occupied Total Own or owner Rent house/ Own house City/Municipality Housing Number of like possession room rent lot
Units Households of house and lot including lot
Region V 1,207,809 1,216,369 598,165 42,852 44,975
Albay 275,601 277,091 149,129 9,599 6,786
Bacacay 14,348 14,365 8,805 284 175Camalig 14,763 14,787 7,243 321 558Daraga 27,551 27,648 17,276 1,573 726Guinobatan 17,882 18,239 8,607 667 682Jovellar 3,811 3,812 1,274 48 92
LEGAZPI CITY 41,437 41,742 18,366 2,517 1,019Libon 15,461 15,528 7,467 181 427Ligao City 22,491 22,552 13,047 504 362Malilipot 8,059 8,104 5,939 281 30Malinao 9,748 9,765 5,784 94 71
Manito 5,056 5,066 1,826 38 61Oas 14,036 14,068 7,670 194 519Pio Duran 9,452 9,467 4,229 127 494Polangui 18,188 18,313 11,345 699 324Rapu-Rapu 7,395 7,401 3,294 100 277
Santo Domingo 7,415 7,516 4,585 226 59Tabaco City 27,533 27,702 15,552 1,553 873Tiwi 10,975 11,016 6,820 192 37
Camarines Norte 128,679 129,994 57,697 6,638 6,751
Basud 9,078 9,123 4,528 222 115Capalonga 7,091 7,169 2,964 176 236DAET 22,803 23,270 12,329 2,627 1,766Jose Panganiban 3,154 13,855 4,871 781 672Labo 13,381 22,256 9,600 1,008 1,041
Mercedes 22,201 10,899 3,841 418 782Paracale 10,866 13,171 6,531 474 669San Lorenzo Ruiz
(Imelda) 13,096 3,184 1,918 45 60San Vicente 2,394 2,400 1,384 63 19Santa Elena 9,182 9,214 2,569 333 1,213
Talisay 5,801 5,803 3,124 227 105Vinzons 9,632 9,650 4,038 264 73
Camarines Sur 396,642 400,615 208,344 15,015 14,676
Baao 11,390 11,443 6,885 307 100Balatan 5,801 5,881 2,096 160 1,391Bato 9,720 9,869 5,750 105 427Bombon 3,441 3,461 1,440 91 155Buhi 16,266 16,541 9,700 298 239
Source: Philippine Statistics Authority
1 - 78

Own house Own house Rent-free house Rent-free house rent-free lot rent-free lot and lot and lot Not Not
with consent without consent with consent without consent Applicable Reportedof owner of owner of owner of owner
432,967 23,423 71,725 2,262 0 0
90,279 7,816 12,808 674 0 0
3,804 685 582 30 0 05,881 116 661 7 0 05,674 557 1,737 105 0 06,827 372 1,077 7 0 02,233 10 152 3 0 0
14,440 3,572 1,557 271 0 06,575 70 793 15 0 07,433 168 1,005 33 0 01,334 134 376 10 0 03,214 112 457 33 0 0
2,757 22 359 3 0 04,640 323 702 20 0 04,142 161 287 27 0 04,665 451 782 47 0 03,398 37 282 13 0 0
1,846 287 498 15 0 08,195 412 1,083 34 0 03,221 327 418 1 0 0
46,346 2,366 9,964 232 0 0
3,383 77 783 15 0 02,938 102 740 13 0 04,376 266 1,851 55 0 06,040 368 1,104 19 0 08,707 265 1,606 29 0 0
5,210 96 539 13 0 04,190 216 1,061 30 0 0
914 24 221 2 0 0694 6 233 1 0 0
4,107 255 712 25 0 0
1,791 109 445 2 0 03,996 582 669 28 0 0
130,507 6,969 24,363 741 0 0
3,208 95 817 31 0 01,831 28 361 14 0 02,760 109 705 13 0 01,402 20 333 20 0 05,129 143 998 34 0 0
Tenure Status of the Housing Unit and Lot
1 - 79

Table 1.15B - Continued
HOUSEHOLDS IN OCCUPIED HOUSING UNITS BY TENURE STATUS OF THE HOUSING UNIT ANDPROVINCE/CITY/MUNICIPALITYCensus Year 2015
Province/ Occupied Total Own or owner Rent house/ Own house City/Municipality Housing Number of like possession room rent lot
Units Households of house and lot including lot
Bula 13,482 13,589 8,121 82 138Cabusao 3,897 3,902 1,406 56 163Calabanga 17,035 17,211 7,458 464 990Camaligan 4,737 4,848 3,166 442 257Canaman 6,968 7,103 3,481 356 244
Caramoan 9,878 9,946 4,886 228 157Del Gallego 5,243 5,249 2,127 145 52Gainza 2,206 2,251 1,242 38 7Garchitorena 5,094 5,216 3,113 129 203Goa 12,791 12,842 6,837 525 318
Iriga City 21,717 21,840 15,381 889 479Lagonoy 11,176 11,312 6,724 203 143Libmanan 23,343 23,629 10,349 394 1,687Lupi 6,996 7,013 4,219 73 334Magarao 5,317 5,333 2,566 261 212
Milaor 6,154 6,324 3,965 145 92Minalabac 10,263 10,313 4,659 75 419Nabua 16,509 16,625 12,492 288 69Naga City 41,280 42,152 21,351 6,018 2,264Ocampo 9,267 9,322 4,262 167 243
Pamplona 7,567 7,583 3,841 116 177Pasacao 9,838 9,948 4,240 369 190PILI 18,062 18,178 9,515 1,098 318Presentacion 4,038 4,048 1,329 40 139Ragay 12,453 12,496 3,929 315 677
Sangay 6,947 6,981 3,214 45 195San Fernando 7,214 7,246 4,628 128 57San Jose 8,597 8,684 4,606 129 183Sipocot 13,472 13,531 7,115 298 552Siruma 3,762 3,780 1,260 40 46
Tigaon 11,444 11,600 5,148 169 541Tinambac 13,277 13,325 5,843 329 818
Catanduanes 53,482 53,814 32,867 1,971 804
Bagamanoc 2,408 2,410 1,476 43 44Baras 2,798 2,818 1,735 33 17Bato 4,517 4,563 2,616 185 72Caramoran 5,865 5,893 2,870 70 70Gigmoto 1,744 1,749 1,083 30 1
Pandan 4,192 4,208 2,407 73 19Panganiban 2,007 2,011 1,192 56 6San Andres 7,646 7,710 4,637 192 422San Miguel 3,029 3,052 2,096 56 18Viga 4,318 4,332 2,570 80 17
VIRAC 14,958 15,068 10,185 1,153 118
1 - 80

Own house Own house Rent-free house Rent-free house rent-free lot rent-free lot and lot and lot Not Not
with consent without consent with consent without consent Applicable Reportedof owner of owner of owner of owner
Tenure Status of the Housing Unit and Lot
4,222 136 871 19 0 01,965 27 272 13 0 07,253 75 946 25 0 0
691 49 243 0 0 02,492 101 420 9 0 0
4,039 71 543 22 0 02,364 277 273 11 0 0
474 295 185 10 0 01,064 369 314 24 0 04,152 41 947 22 0 0
3,544 84 1,413 50 0 03,150 514 560 18 0 09,791 273 1,094 41 0 01,920 227 237 3 0 01,909 63 318 4 0 0
1,673 51 384 14 0 04,486 149 518 7 0 02,452 141 1,155 28 0 08,413 1,244 2,770 92 0 03,790 115 739 6 0 0
2,929 189 319 12 0 04,055 277 800 17 0 05,598 302 1,331 16 0 02,222 13 299 6 0 06,212 325 991 47 0 0
3,318 12 193 4 0 01,862 67 498 6 0 02,707 506 545 8 0 04,851 190 504 21 0 02,273 24 131 6 0 0
4,915 275 498 54 0 05,391 92 838 14 0 0
11,786 599 5,701 86 0 0
557 11 272 7 0 0703 24 305 1 0 0979 44 661 6 0 0
2,038 231 601 13 0 0321 6 301 7 0 0
1,269 19 420 1 0 0561 12 180 4 0 0
1,609 141 696 13 0 0494 19 366 3 0 0
1,088 14 559 4 0 0
2,167 78 1,340 27 0 0
1 - 81

Table 1.15B - Continued
HOUSEHOLDS IN OCCUPIED HOUSING UNITS BY TENURE STATUS OF THE HOUSING UNIT ANDPROVINCE/CITY/MUNICIPALITYCensus Year 2015
Province/ Occupied Total Own or owner Rent house/ Own house City/Municipality Housing Number of like possession room rent lot
Units Households of house and lot including lot
Masbate 187,299 188,013 71,896 5,272 8,652
Aroroy 17,039 17,087 5,239 618 731Baleno 5,341 5,369 2,691 100 36Balud 7,843 7,867 3,846 89 290Batuan 3,587 3,625 998 44 2Cataingan 10,764 10,833 5,431 217 123
Cawayan 15,039 15,063 6,704 369 1,294Claveria 9,159 9,173 2,943 70 101Dimasalang 5,386 5,430 2,080 126 213Esperanza 4,062 4,097 1,472 22 107Mandaon 8,724 8,741 3,637 153 233
MASBATE CITY 1/ 19,083 19,237 7,229 1,893 981Milagros 11,439 11,494 3,311 126 1,586Mobo 7,721 7,752 3,762 183 185Monreal 5,256 5,270 2,105 97 16Palanas 5,843 5,856 2,804 111 32
Pio V. Corpuz 5,269 5,285 1,915 28 17Placer 11,934 11,958 3,409 252 2,141San Fernando 5,397 5,402 2,076 137 54San Jacinto 7,060 7,065 3,471 338 138San Pascual 9,819 9,836 3,306 165 56
Uson 11,534 11,573 3,467 134 316
Sorsogon 166,106 166,842 78,232 4,357 7,306
Barcelona 4,788 4,794 2,086 49 28Bulan 20,598 20,787 10,645 786 1,631Bulusan 5,285 5,307 2,927 77 75Casiguran 7,088 7,107 2,449 142 612Castilla 12,266 12,298 5,806 131 422
Donsol 10,252 10,322 4,350 163 373Gubat 13,454 13,471 7,273 273 456Irosin 11,395 11,418 5,004 310 819Juban 6,636 6,650 2,433 88 62Magallanes 7,470 7,497 1,925 123 525
Matnog 8,347 8,395 3,594 132 323Pilar 14,960 15,032 6,955 228 390Prieto Diaz 4,773 4,781 2,546 47 35Santa Magdalena 3,587 3,589 2,071 54 11SORSOGON CITY 35,207 35,394 18,168 1,754 1,544
1/ Converted into a city under Republic Act (RA) No. 8807; ratified on September 30, 2000.
1 - 82

Own house Own house Rent-free house Rent-free house rent-free lot rent-free lot and lot and lot Not Not
with consent without consent with consent without consent Applicable Reportedof owner of owner of owner of owner
Tenure Status of the Housing Unit and Lot
88,348 3,334 10,200 311 0 0
8,931 772 722 74 0 01,994 41 494 13 0 03,055 70 503 14 0 02,308 60 210 3 0 04,613 19 420 10 0 0
5,885 98 699 14 0 05,218 178 644 19 0 02,733 32 239 7 0 02,250 3 239 4 0 04,209 16 486 7 0 0
6,796 925 1,382 31 0 05,630 114 707 20 0 03,177 41 399 5 0 02,659 106 283 4 0 02,394 143 368 4 0 0
3,098 40 177 10 0 05,351 307 482 16 0 02,622 60 427 26 0 02,566 232 304 16 0 05,777 23 501 8 0 0
7,082 54 514 6 0 0
65,701 2,339 8,689 218 0 0
2,350 28 244 9 0 06,446 295 966 18 0 01,877 19 322 10 0 03,516 62 323 3 0 05,177 243 501 18 0 0
4,477 112 823 24 0 04,314 294 851 10 0 04,646 58 562 19 0 03,769 71 223 4 0 04,618 49 253 4 0 0
3,972 36 328 10 0 06,389 253 800 17 0 01,654 232 261 6 0 01,086 9 355 3 0 0
11,410 578 1,877 63 0 0
1 - 83

Table 1.16A HOUSEHOLDS BY TYPE OF BUILDING, TENURE STATUS OF THE LOT AND PROVINCECensus Years 2000 and 2010
2 0 0 0Province and Type of Building
Tenure Status of the Lot Number of Single Duplex Multi-Unit Commercial/ Institutional OtherHouseholds House Residential Industrial/ Living Housing
(3 or more) Agricultural Quarters Unit
Region V 893,833 857,408 14,666 9,422 1,803 342 238Owned/being amortized 446,549 434,135 7,455 3,399 703 130 129Rented 58,598 51,756 2,455 3,376 675 48 11Rent-free w/ consent of owner 329,607 323,355 3,446 1,672 266 125 60Rent-free w/o consent of owner 18,183 17,440 453 170 39 7 19Not Reported 20,882 12,669 405 258 36 15 9Not Applicable 20,014 18,053 452 547 84 17 10
Albay 208,640 199,225 4,225 2,268 395 65 127Owned/being amortized 105,755 102,162 2,233 942 156 25 112Rented 11,133 9,747 547 651 134 11 1Rent-free w/ consent of owner 73,792 72,276 907 386 63 23 4Rent-free w/o consent of owner 8,734 8,287 290 108 12 2 3Not Reported 4,943 2,936 123 78 5 1 4Not Applicable 4,283 3,817 125 103 25 3 3
Camarines Norte 91,866 87,749 1,910 1,234 196 36 28Owned/being amortized 40,159 38,767 841 377 85 15 3Rented 9,686 8,533 482 543 71 9 1Rent-free w/ consent of owner 37,385 36,573 468 223 24 6 12Rent-free w/o consent of owner 1,482 1,442 16 2 3 - 10Not Reported 1,417 898 33 18 4 3 1Not Applicable 1,737 1,536 70 71 9 3 1
Camarines Sur 288,172 273,754 5,616 4,258 723 128 60Owned/being amortized 152,949 148,319 2,762 1,373 229 45 9Rented 18,991 15,891 989 1,673 305 21 7Rent-free w/ consent of owner 98,073 95,475 1,384 754 126 47 29Rent-free w/o consent of owner 4,267 4,080 117 43 8 4 5Not Reported 7,324 4,262 191 123 20 4 4Not Applicable 6,568 5,727 173 292 35 7 6
Catanduanes 41,019 39,938 507 298 36 10 - Owned/being amortized 27,297 26,812 318 117 20 6 - Rented 1,718 1,542 61 106 7 - - Rent-free w/ consent of owner 10,285 10,087 111 60 7 3 - Rent-free w/o consent of owner 246 244 1 1 - - - Not Reported 653 479 5 6 2 - - Not Applicable 820 774 11 8 - 1 -
Masbate 138,945 134,824 1,273 789 220 70 17Owned/being amortized 63,415 62,168 702 282 118 31 3Rented 9,075 8,465 217 263 63 4 1Rent-free w/ consent of owner 57,340 56,722 275 163 24 26 13Rent-free w/o consent of owner 1,410 1,383 16 8 1 - - Not Reported 3,887 2,522 22 24 4 6 - Not Applicable 3,818 3,564 41 49 10 3 -
Sorsogon 125,191 121,918 1,135 575 233 33 6Owned/being amortized 56,974 55,907 599 308 95 8 2Rented 7,995 7,578 159 140 95 3 1Rent-free w/ consent of owner 52,732 52,222 301 86 22 20 2Rent-free w/o consent of owner 2,044 2,004 13 8 15 1 1Not Reported 2,658 1,572 31 9 1 1 - Not Applicable 2,788 2,635 32 24 5 - -
Source: Philippine Statistics Authority
1 - 84

2 0 1 0 Type of Building
Not Number of Single Duplex Multi-Unit Commercial/ Institutional Other NotReported Households House Residential Industrial/ Living Housing Reported
(3 or more) Agricultural Quarters Unit
9,954 1,188,667 1,136,767 26,217 20,590 2,792 179 110 2,012 598 635,460 616,209 11,898 5,681 957 46 - 669 277 62,747 52,330 3,695 5,599 869 26 - 228 683 379,375 368,575 6,579 2,799 485 59 - 878
55 23,056 21,949 660 317 38 4 - 88 7,490 11,096 10,359 350 196 35 11 110 35
851 76,933 67,345 3,035 5,998 408 33 - 114
2,335 274,157 261,456 7,711 4,067 581 35 12 295 125 152,392 147,304 3,493 1,244 215 11 - 125
42 11,015 9,068 747 1,014 160 7 - 19 133 80,450 77,545 1,944 717 109 8 - 127
32 10,389 9,856 329 167 21 1 - 15 1,796 1,424 1,330 40 35 7 - 12 -
207 18,487 16,353 1,158 890 69 8 - 9
713 124,918 118,362 3,359 2,439 329 14 36 379 71 61,878 59,731 1,421 503 119 5 - 99 47 10,420 8,481 786 986 101 2 - 64 79 40,349 38,940 827 336 59 5 - 182
9 2,179 2,098 36 26 5 - - 14 460 1,902 1,798 35 17 3 - 36 13
47 8,190 7,314 254 571 42 2 - 7
3,633 390,548 367,867 9,895 10,559 1,171 72 32 952 212 218,491 210,090 4,515 3,235 339 14 - 298 105 20,811 16,290 1,398 2,642 378 11 - 92 258 114,949 110,663 2,332 1,290 224 24 - 416
10 5,730 5,375 185 103 10 2 - 55 2,720 4,475 4,046 233 125 21 6 32 12
328 26,092 21,403 1,232 3,164 199 15 - 79
230 53,805 51,367 929 1,331 102 3 9 64 24 33,167 32,450 513 142 28 1 - 33
2 2,301 1,905 125 234 32 - - 5 17 13,386 13,082 186 88 8 1 - 21 - 448 444 2 1 - 1 - -
161 65 51 2 - 1 - 9 2 26 4,438 3,435 101 866 33 - - 3
1,752 181,166 178,038 1,504 1,107 330 21 16 150 111 83,505 82,472 628 219 141 1 - 44
62 10,089 9,262 311 389 103 2 - 22 117 75,724 74,921 421 245 56 12 - 69
2 1,479 1,459 13 3 1 - - 3 1,309 847 799 12 16 2 2 16 -
151 9,522 9,125 119 235 27 4 - 12
1,291 164,073 159,677 2,819 1,087 279 34 5 172 55 86,027 84,162 1,328 338 115 14 - 70 19 8,111 7,324 328 334 95 4 - 26 79 54,517 53,424 869 123 29 9 - 63
2 2,831 2,717 95 17 1 - - 1 1,044 2,383 2,335 28 3 1 3 5 8
92 10,204 9,715 171 272 38 4 - 4
1 - 85

Table 1.16B HOUSEHOLDS BY TYPE OF BUILDING, TENURE STATUS OF THE LOT AND PROVINCECensus Year 2015
2 0 1 5Province and Type of Building
Tenure Status of the Lot Number of Single Duplex Multi-Unit Comm'l/ Inst. Other NotHouseholds House Residential Ind'l/ Living Housing Reported
(3 or more) Agri'l Quarters Unit
Region V 1,216,369 1,134,906 53,016 25,638 1,456 171 53 1,129Own or owner like possession of house and lot 598,165 563,477 24,069 9,593 635 57 10 324
Rent house/room including lot 42,852 28,902 5,631 7,866 345 44 10 54Own house rent lot 44,975 41,657 2,309 878 59 1 5 66Own house rent-free lot w/ consent of owner 432,967 414,097 13,928 4,168 181 22 18 553Own house rent-free lot w/o consent of owner 23,423 21,637 1,248 482 12 2 2 40Rent-free house and lot w/ consent of owner 71,725 63,136 5,654 2,576 220 45 6 88Rent-free house and lot w/o consent of owner 2,262 2,000 177 75 4 0 2 4Not Applicable 0 0 0 0 0 0 0 0Not Reported 0 0 0 0 0 0 0 0
Albay 277,091 257,323 13,393 5,891 288 24 4 168Own or owner like possession of house and lot 149,129 139,879 6,787 2,232 161 12 2 56
Rent house/room including lot 9,599 6,984 1,191 1,361 55 4 0 4Own house rent lot 6,786 6,338 340 90 9 1 0 8Own house rent-free lot w/ consent of owner 90,279 85,469 3,274 1,430 30 0 2 74Own house rent-free lot w/o consent of owner 7,816 6,989 577 233 3 0 0 14Rent-free house and lot w/ consent of owner 12,808 11,081 1,164 518 29 7 0 9Rent-free house and lot w/o consent of owner 674 583 60 27 1 0 0 3Not Applicable 0 0 0 0 0 0 0 0Not Reported 0 0 0 0 0 0 0 0
Camarines Norte 129,994 118,699 7,385 3,491 270 21 5 123Own or owner like possession of house and lot 57,697 53,807 2,777 986 90 6 0 31
Rent house/room including lot 6,638 4,091 1,090 1,367 76 6 0 8Own house rent lot 6,751 5,991 524 203 19 0 0 14Own house rent-free lot w/ consent of owner 46,346 43,818 1,966 474 26 4 1 57Own house rent-free lot w/o consent of owner 2,366 2,243 92 25 1 0 0 5Rent-free house and lot w/ consent of owner 9,964 8,546 913 431 58 5 3 8Rent-free house and lot w/o consent of owner 232 203 23 5 0 0 1 0Not Applicable 0 0 0 0 0 0 0 0Not Reported 0 0 0 0 0 0 0 0
Source: Philippine Statistics Authority
1 - 86

Table 1.16B - Continued
HOUSEHOLDS BY TYPE OF BUILDING, TENURE STATUS OF THE LOT AND PROVINCECensus Year 2015
2 0 1 5Province and Type of Building
Tenure Status of the Lot Number of Single Duplex Multi-Unit Comm'l/ Inst. Other NotHouseholds House Residential Ind'l/ Living Housing Reported
(3 or more) Agri'l Quarters Unit
Camarines Sur 400,615 370,082 17,637 11,796 537 76 15 472Own or owner like possession of house and lot 208,344 194,771 8,271 4,927 214 18 4 139
Rent house/room including lot 15,015 9,086 1,981 3,755 127 27 2 37Own house rent lot 14,676 13,512 731 384 19 0 1 29Own house rent-free lot w/ consent of owner 130,507 124,351 4,346 1,496 85 12 5 212Own house rent-free lot w/o consent of owner 6,969 6,503 307 140 5 1 0 13Rent-free house and lot w/ consent of owner 24,363 21,205 1,949 1,063 84 18 2 42Rent-free house and lot w/o consent of owner 741 654 52 31 3 0 1 0Not Applicable 0 0 0 0 0 0 0 0Not Reported 0 0 0 0 0 0 0 0
Catanduanes 53,814 50,446 2,624 619 92 26 2 5Own or owner like possession of house and lot 32,867 31,156 1,402 250 41 14 1 3
Rent house/room including lot 1,971 1,461 280 202 25 2 1 0Own house rent lot 804 783 19 2 0 0 0 0Own house rent-free lot w/ consent of owner 11,786 11,343 395 44 3 0 0 1Own house rent-free lot w/o consent of owner 599 572 24 2 1 0 0 0Rent-free house and lot w/ consent of owner 5,701 5,051 500 117 22 10 0 1Rent-free house and lot w/o consent of owner 86 80 4 2 0 0 0 0Not Applicable 0 0 0 0 0 0 0 0Not Reported 0 0 0 0 0 0 0 0
Masbate 188,013 179,992 5,285 2,308 145 12 22 249Own or owner like possession of house and lot 71,896 69,219 1,927 615 62 4 2 67
Rent house/room including lot 5,272 3,679 682 865 33 2 7 4Own house rent lot 8,652 8,224 324 85 7 0 4 8Own house rent-free lot w/ consent of owner 88,348 86,166 1,641 363 24 1 6 147Own house rent-free lot w/o consent of owner 3,334 3,128 137 61 1 1 2 4Rent-free house and lot w/ consent of owner 10,200 9,294 552 313 18 4 1 18Rent-free house and lot w/o consent of owner 311 282 22 6 0 0 0 1Not Applicable 0 0 0 0 0 0 0 0Not Reported 0 0 0 0 0 0 0 0
1 - 87

Table 1.16B - Continued
HOUSEHOLDS BY TYPE OF BUILDING, TENURE STATUS OF THE LOT AND PROVINCECensus Year 2015
2 0 1 5Province and Type of Building
Tenure Status of the Lot Number of Single Duplex Multi-Unit Comm'l/ Inst. Other NotHouseholds House Residential Ind'l/ Living Housing Reported
(3 or more) Agri'l Quarters Unit
Sorsogon 166,842 158,364 6,692 1,533 124 12 5 112Own or owner like possession of house and lot 78,232 74,645 2,905 583 67 3 1 28
Rent house/room including lot 4,357 3,601 407 316 29 3 0 1Own house rent lot 7,306 6,809 371 114 5 0 0 7Own house rent-free lot w/ consent of owner 65,701 62,950 2,306 361 13 5 4 62Own house rent-free lot w/o consent of owner 2,339 2,202 111 21 1 0 0 4Rent-free house and lot w/ consent of owner 8,689 7,959 576 134 9 1 0 10Rent-free house and lot w/o consent of owner 218 198 16 4 0 0 0 0Not Applicable 0 0 0 0 0 0 0 0Not Reported 0 0 0 0 0 0 0 0
1 - 88

Figure 1.6 DISTRIBUTION OF HOUSEHOLDS BY TENURE STATUS OF THEHOUSING UNIT, REGION V, CENSUS YEAR 2015
Figure 1.7 DISTRIBUTION OF HOUSEHOLDS BY TYPE OF BUILDING,REGION V, CENSUS YEAR 2015
Own or owner like possession of house and lot
49.2%
Own house rent-free lot with
consent of owner35.6%
Rent-free house and lot with
consent of owner5.9%
Own house, rent lot3.7%
Rent house/room including lot
3.5%
Own house rent-free lot without
consent of owner1.9%
Rent-free house and lot wthout
consent of owner0.2%
Single House93.3%
Duplex 4.4%
Multi-Unit Residential (3 or
more)2.1%
Commercial/Industrial/Agricultural
0.1%Institutional Living
Quarters0.0%
Other Housing Unit0.0%
Not Reported0.1%
1 - 89

Table 1.17 OCCUPIED HOUSING UNITS, NUMBER OF HOUSEHOLDS AND HOUSEHOLD POPULATIONBY TYPE OF BUILDING AND PROVINCE/CITYCensus Years 2010 - 2015
2010Occupied Number Household Households HH Pop'n.Housing of Population to Occupied to Occupied
Units Households Housing Units Housing Units
Region V 1,102,228 1,111,753 5,411,521 1.01 4.91
Single House 1,060,294 1,069,439 5,229,864 1.01 4.93Duplex 22,967 23,182 102,294 1.01 4.45Multi-Unit Residential 14,476 14,594 60,015 1.01 4.15Commercial/Industrial/Agricultural 2,350 2,384 9,817 1.01 4.18Institutional Living Quarters 141 146 616 1.04 4.37Other Housing Unit 110 110 544 1.00 4.95Not Reported 1,890 1,898 8,371 1.00 4.43
Albay 253,309 255,672 1,231,607 1.01 4.86
Single House 242,848 245,105 1,186,495 1.01 4.89Duplex 6,487 6,553 28,603 1.01 4.41Multi-Unit Residential 3,149 3,177 12,932 1.01 4.11Commercial/Industrial/Agricultural 502 512 2,171 1.02 4.32Institutional Living Quarters 25 27 126 1.08 5.04Other Housing Unit 12 12 39 1.00 3.25Not Reported 286 286 1,241 1.00 4.34
Camarines Norte 115,570 116,728 542,315 1.01 4.69
Single House 109,922 111,048 518,646 1.01 4.72Duplex 3,089 3,105 13,106 1.01 4.24Multi-Unit Residential 1,860 1,868 7,476 1.00 4.02Commercial/Industrial/Agricultural 282 287 1,143 1.02 4.05Institutional Living Quarters 12 12 55 1.00 4.58Other Housing Unit 36 36 212 1.00 5.89Not Reported 369 372 1,677 1.01 4.54
Camarines Sur 360,726 364,472 1,818,699 1.01 5.04
Single House 342,912 346,478 1,740,115 1.01 5.07Duplex 8,565 8,663 39,251 1.01 4.58Multi-Unit Residential 7,333 7,397 31,237 1.01 4.26Commercial/Industrial/Agricultural 960 972 3,900 1.01 4.06Institutional Living Quarters 56 57 194 1.02 3.46Other Housing Unit 32 32 132 1.00 4.13Not Reported 868 873 3,870 1.01 4.46
Catanduanes 49,098 49,368 245,574 1.01 5.00
Single House 47,672 47,933 239,596 1.01 5.03Duplex 821 828 3,684 1.01 4.49Multi-Unit Residential 463 465 1,705 1.00 3.68Commercial/Industrial/Agricultural 69 69 246 1.00 3.57Institutional Living Quarters 3 3 17 1.00 5.67Other Housing Unit 9 9 39 1.00 4.33Not Reported 61 61 287 1.00 4.70
Note: Provincial data include cities.
Source: Philippine Statistics Authority
Province/City and Type of Building
1 - 90

2015Occupied Number Household Households HH Pop'n.Housing of Population to Occupied to Occupied
Units Households Housing Units Housing Units
1,207,809 1,216,369 5,780,721 1.01 4.79
1,127,321 1,134,906 5,432,898 1.01 4.8252,494 53,016 231,794 1.01 4.4225,287 25,638 103,909 1.01 4.11
1,434 1,456 6,105 1.02 4.26154 171 654 1.11 4.25
53 53 195 1.00 3.681,066 1,129 5,166 1.06 4.85
275,601 277,091 1,312,154 1.01 4.76
256,105 257,323 1,227,370 1.00 4.7913,292 13,393 58,502 1.01 4.40
5,731 5,891 24,112 1.03 4.21284 288 1,302 1.01 4.58
24 24 101 1.00 4.214 4 14 1.00 3.50
161 168 753 1.04 4.68
128,679 129,994 581,787 1.01 4.52
117,542 118,699 536,240 1.01 4.567,291 7,385 30,537 1.01 4.193,437 3,491 13,456 1.02 3.92
261 270 950 1.03 3.6421 21 93 1.00 4.43
5 5 8 1.00 1.60122 123 503 1.01 4.12
396,642 400,615 1,947,487 1.01 4.91
366,538 370,082 1,816,291 1.01 4.9617,383 17,637 78,510 1.01 4.5211,690 11,796 48,025 1.01 4.11
531 537 2,214 1.01 4.1759 76 262 1.29 4.4415 15 55 1.00 3.67
426 472 2,130 1.11 5.00
53,482 53,814 258,874 1.01 4.84
50,134 50,446 244,199 1.01 4.872,609 2,624 11,576 1.01 4.44
614 619 2,588 1.01 4.2192 92 379 1.00 4.1226 26 98 1.00 3.77
2 2 7 1.00 3.505 5 27 1.00 5.40
1 - 91

Table 1.17 - ContinuedOCCUPIED HOUSING UNITS, NUMBER OF HOUSEHOLDS AND HOUSEHOLD POPULATIONBY TYPE OF BUILDING AND PROVINCE/CITYCensus Years 2010 - 2015
2010Occupied Number Household Households HH Pop'n.Housing of Population to Occupied to Occupied
Units Households Housing Units Housing Units
Province/City and Type of Building
Masbate 170,585 171,644 833,638 1.01 4.89
Single House 167,880 168,913 822,031 1.01 4.90Duplex 1,371 1,385 6,064 1.01 4.42Multi-Unit Residential 865 872 3,405 1.01 3.94Commercial/Industrial/Agricultural 299 303 1,384 1.01 4.63Institutional Living Quarters 16 17 89 1.06 5.56Other Housing Unit 16 16 99 1.00 6.19Not Reported 138 138 566 1.00 4.10
Sorsogon 152,940 153,869 739,688 1.01 4.84
Single House 149,060 149,962 722,981 1.01 4.85Duplex 2,634 2,648 11,586 1.01 4.40Multi-Unit Residential 806 815 3,260 1.01 4.04Commercial/Industrial/Agricultural 238 241 973 1.01 4.09Institutional Living Quarters 29 30 135 1.03 4.66Other Housing Unit 5 5 23 1.00 4.60Not Reported 168 168 730 1.00 4.35
Iriga City 21,488 21,759 105,456 1.01 4.91
Single House 20,664 20,932 102,133 1.01 4.94Duplex 432 432 1,859 1.00 4.30Multi-Unit Residential 322 325 1,226 1.01 3.81Commercial/Industrial/Agricultural 50 50 166 1.00 3.32Institutional Living Quarters 6 6 20 1.00 3.33Other Housing Unit 4 4 15 1.00 3.75Not Reported 10 10 37 1.00 3.70
Legazpi City 37,894 38,398 181,640 1.01 4.79
Single House 34,921 35,380 169,220 1.01 4.85Duplex 1,730 1,758 7,457 1.02 4.31Multi-Unit Residential 1,069 1,083 4,177 1.01 3.91Commercial/Industrial/Agricultural 150 153 689 1.02 4.59Institutional Living Quarters 6 6 32 1.00 5.33Other Housing Unit 1 1 6 1.00 6.00Not Reported 17 17 59 1.00 3.47
Ligao City 20,990 21,140 104,738 1.01 4.99
Single House 20,524 20,667 102,660 1.01 5.00Duplex 230 235 1,044 1.02 4.54Multi-Unit Residential 159 160 671 1.01 4.22Commercial/Industrial/Agricultural 53 54 260 1.02 4.91Institutional Living Quarters 3 3 21 1.00 7.00Other Housing Unit - - - - - Not Reported 21 21 82 1.00 3.90
Note: Provincial data include cities.
1 - 92

2015Occupied Number Household Households HH Pop'n.Housing of Population to Occupied to Occupied
Units Households Housing Units Housing Units
187,299 188,013 890,170 1.00 4.75
179,331 179,992 855,597 1.00 4.775,255 5,285 23,115 1.01 4.402,290 2,308 9,364 1.01 4.09
144 145 718 1.01 4.9912 12 50 1.00 4.1722 22 90 1.00 4.09
245 249 1,236 1.02 5.04
166,106 166,842 790,249 1.00 4.76
157,671 158,364 753,201 1.00 4.786,664 6,692 29,554 1.00 4.431,525 1,533 6,364 1.01 4.17
122 124 542 1.02 4.4412 12 50 1.00 4.17
5 5 21 1.00 4.20107 112 517 1.05 4.83
21,717 21,840 111,225 1.01 5.12
20,379 20,494 104,781 1.01 5.14778 784 3,776 1.01 4.85536 538 2,540 1.00 4.74
16 16 88 1.00 5.503 3 12 1.00 4.001 1 6 1.00 6.004 4 22 1.00 5.50
41,437 41,742 195,872 1.01 4.73
36,397 36,656 174,429 1.01 4.793,084 3,114 13,615 1.01 4.411,879 1,892 7,477 1.01 3.98
60 61 276 1.02 4.609 9 41 1.00 4.560 0 0 #DIV/0! #DIV/0!8 10 34 1.25 4.25
22,491 22,552 111,241 1.00 4.95
21,675 21,727 107,492 1.00 4.96655 657 2,996 1.00 4.57131 134 601 1.02 4.59
17 17 75 1.00 4.411 1 6 1.00 6.000 0 0 - -
12 16 71 1.33 5.92
1 - 93

Table 1.17 - ContinuedOCCUPIED HOUSING UNITS, NUMBER OF HOUSEHOLDS AND HOUSEHOLD POPULATIONBY TYPE OF BUILDING AND PROVINCE/CITYCensus Years 2010 - 2015
2010Occupied Number Household Households HH Pop'n.Housing of Population to Occupied to Occupied
Units Households Housing Units Housing Units
Province/City and Type of Building
Masbate City 16,909 17,058 84,947 1.01 5.02
Single House 15,563 15,699 79,194 1.01 5.09Duplex 690 700 3,109 1.01 4.51Multi-Unit Residential 562 565 2,202 1.01 3.92Commercial/Industrial/Agricultural 64 64 314 1.00 4.91Institutional Living Quarters 2 2 7 1.00 3.50Other Housing Unit 5 5 33 1.00 6.60Not Reported 23 23 88 1.00 3.83
Naga City 35,210 35,929 173,731 1.02 4.93
Single House 27,122 27,738 138,528 1.02 5.11Duplex 3,100 3,153 14,190 1.02 4.58Multi-Unit Residential 4,559 4,604 19,240 1.01 4.22Commercial/Industrial/Agricultural 220 222 874 1.01 3.97Institutional Living Quarters 19 20 57 1.05 3.00Other Housing Unit 5 5 8 1.00 1.60Not Reported 185 187 834 1.01 4.51
Sorsogon City 32,494 32,694 154,678 1.01 4.76
Single House 30,933 31,121 148,098 1.01 4.79Duplex 1,003 1,008 4,315 1.00 4.30Multi-Unit Residential 455 461 1,831 1.01 4.02Commercial/Industrial/Agricultural 37 37 140 1.00 3.78Institutional Living Quarters 16 17 72 1.06 4.50Other Housing Unit 1 1 10 1.00 10.00Not Reported 49 49 212 1.00 4.33
Tabaco City 25,042 25,329 124,811 1.01 4.98
Single House 23,431 23,706 117,842 1.01 5.03Duplex 914 922 4,097 1.01 4.48Multi-Unit Residential 542 546 2,200 1.01 4.06Commercial/Industrial/Agricultural 89 89 384 1.00 4.31Institutional Living Quarters 6 6 36 1.00 6.00Other Housing Unit 6 6 20 1.00 3.33Not Reported 54 54 232 1.00 4.30
1 - 94

2015Occupied Number Household Households HH Pop'n.Housing of Population to Occupied to Occupied
Units Households Housing Units Housing Units
19,083 19,237 94,640 1.01 4.96
16,217 16,339 81,939 1.01 5.051,576 1,592 7,291 1.01 4.631,240 1,254 5,155 1.01 4.16
39 39 198 1.00 5.085 5 24 1.00 4.803 3 9 1.00 3.003 5 24 1.67 8.00
41,280 42,152 194,348 1.02 4.71
29,506 30,136 145,722 1.02 4.944,542 4,693 20,178 1.03 4.447,087 7,164 27,834 1.01 3.93
103 108 391 1.05 3.8013 13 48 1.00 3.69
2 2 9 1.00 4.5027 36 166 1.33 6.15
35,207 35,394 166,967 1.01 4.74
32,770 32,948 156,366 1.01 4.771,798 1,803 8,021 1.00 4.46
574 576 2,288 1.00 3.9943 44 180 1.02 4.19
7 7 30 1.00 4.291 1 7 1.00 7.00
14 15 75 1.07 5.36
27,533 27,702 133,508 1.01 4.85
24,475 24,632 120,253 1.01 4.911,922 1,930 8,545 1.00 4.451,097 1,100 4,550 1.00 4.15
26 27 117 1.04 4.502 2 10 1.00 5.002 2 6 1.00 3.009 9 27 1.00 3.00
1 - 95

Table 1.18 NUMBER OF OCCUPIED HOUSING UNITS BY CONSTRUCTION MATERIALS OF THEOUTER WALLS AND ROOF BY PROVINCECensus Year 2015
Province andConstruction Materials of the Outer Walls
Region V 1,207,809 649,731 48,908Concrete/brick/stone 504,931 413,053 45,832Wood 191,451 84,999 676Half concrete/brick/stone and half wood 180,805 92,249 1,964Galvanized iron/aluminum 10,353 6,225 381Bamboo/sawali/cogon/nipa 306,843 48,162 - Asbestos 422 366 10Glass 165 145 12Makeshift/salvaged/improvised materials 6,585 1,629 - Trapal 1,551 410 - Others 2,561 1,014 5No walls 267 94 3Not Reported 1,875 1,385 25
Albay 275,601 150,723 24,958Concrete/brick/stone 147,152 108,764 24,107Wood 30,416 11,609 192Half concrete/brick/stone and half wood 42,637 20,985 579Galvanized iron/aluminum 2,292 1,352 70Bamboo/sawali/cogon/nipa 50,949 7,306 0Asbestos 15 5 4Glass 3 0 3Makeshift/salvaged/improvised materials 1,620 437 0Trapal 136 27 0Others 106 44 2No walls 7 2 1
Camarines Norte 128,679 71,056 3,897Concrete/brick/stone 57,704 49,303 3,587Wood 24,517 8,646 80Half concrete/brick/stone and half wood 20,434 9,892 192Galvanized iron/aluminum 924 551 34Bamboo/sawali/cogon/nipa 24,160 2,305 0Asbestos 50 47 0Glass 98 90 2Makeshift/salvaged/improvised materials 407 77 0Trapal 127 25 0Others 122 43 0No walls 20 2 0Not Reported 116 75 2
Camarines Sur 396,642 217,063 11,371Concrete/brick/stone 162,680 141,142 10,244Wood 49,420 23,385 235Half concrete/brick/stone and half wood 60,354 30,724 771Galvanized iron/aluminum 3,787 2,219 93Bamboo/sawali/cogon/nipa 116,157 17,943 0Asbestos 164 132 4Glass 15 11 3Makeshift/salvaged/improvised materials 1,958 469 0Trapal 599 154 0Others 489 221 3No walls 167 58 1Not Reported 852 605 17
Source: Philippine Statistics Authority
Total Occupied Housing Units Galvanized Iron/
Aluminum
Tile/ Concrete/ Clay Tile
1 - 96

Construction Materials of the Roof
65,892 434,845 278 4,242 1,074 2,521 31812,800 32,387 194 297 76 275 17
6,128 98,465 26 520 200 397 4041,977 43,800 26 302 46 399 42
1,081 2,623 2 18 12 9 23,663 253,047 0 893 407 621 50
28 - 17 0 0 1 03 - 4 0 0 1 0
75 2,622 0 2,141 71 47 00 848 0 47 240 6 0
11 743 1 15 16 756 011 140 0 9 6 4 0
115 170 8 0 0 5 16716,633 81,445 65 1,268 230 186 93
5,004 8,959 58 196 21 38 5754 17,640 0 162 33 22 4
9,872 11,001 4 106 11 65 14313 542 0 8 5 2 0662 42,542 0 270 110 31 28
3 0 3 0 0 0 00 0 0 0 0 0 0
14 624 0 519 19 7 00 77 0 5 26 1 00 34 0 2 4 20 00 3 0 0 1 0 0
7,255 45,962 34 212 70 175 181,224 3,532 16 9 4 27 21,019 14,665 7 39 23 38 04,570 5,722 5 16 2 33 2
77 260 0 1 0 1 0338 21,397 0 48 20 46 6
0 0 2 0 0 1 02 0 4 0 0 0 0
12 221 0 90 6 1 00 81 0 7 14 0 01 51 0 1 0 26 01 14 0 1 1 1 0
11 19 0 0 0 1 825,770 139,857 78 1,171 398 802 132
3,728 7,312 56 39 30 125 42,348 23,067 4 138 66 153 24
17,482 11,103 9 97 23 131 14399 1,063 1 5 4 3 0
1,678 95,831 0 250 156 285 1422 0 6 0 0 0 0
1 0 0 0 0 0 027 797 0 623 31 11 0
0 350 0 13 82 0 06 162 1 0 4 92 0
10 89 0 6 2 1 069 83 1 0 0 1 76
Makeshift/ Salvaged/
Improvised Materials
Trapal Others Not Reported
Half Galvanized
Iron and Half Concrete
Bamboo/ Cogon/ Nipa/
Anahaw
Asbestos
1 - 97
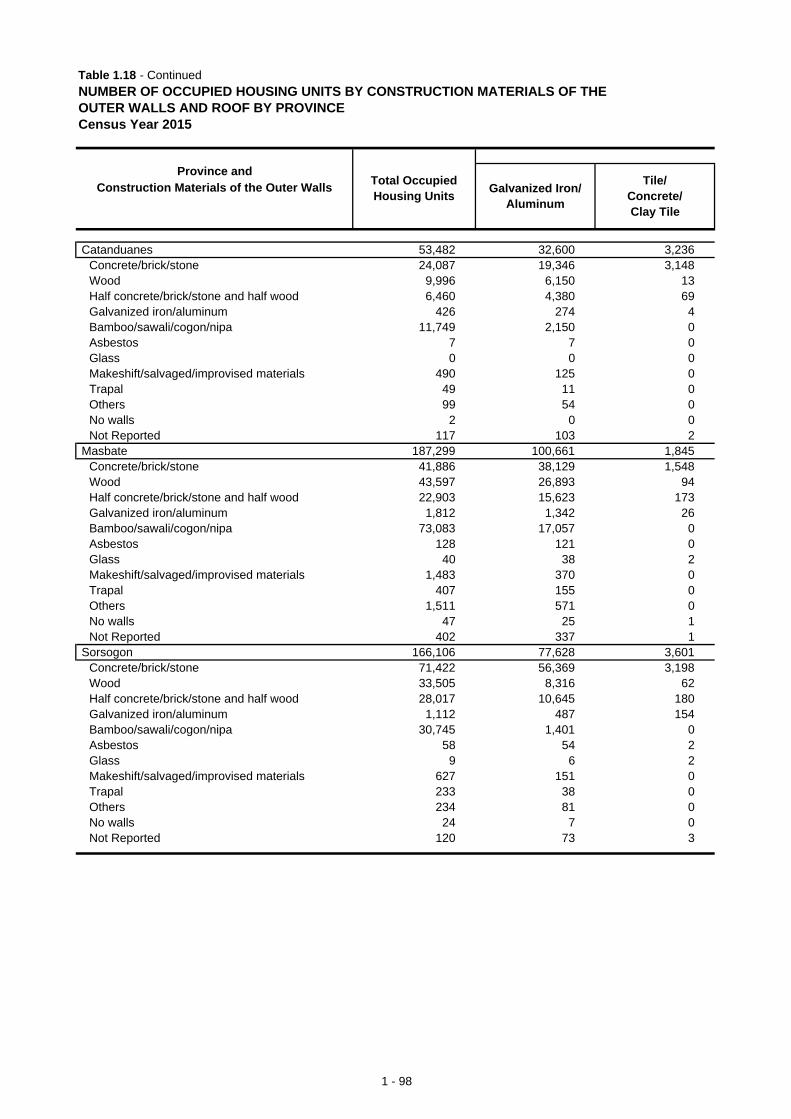
Table 1.18 - Continued
NUMBER OF OCCUPIED HOUSING UNITS BY CONSTRUCTION MATERIALS OF THEOUTER WALLS AND ROOF BY PROVINCECensus Year 2015
Province andConstruction Materials of the Outer Walls Total Occupied
Housing Units Galvanized Iron/ Aluminum
Tile/ Concrete/ Clay Tile
Catanduanes 53,482 32,600 3,236Concrete/brick/stone 24,087 19,346 3,148Wood 9,996 6,150 13Half concrete/brick/stone and half wood 6,460 4,380 69Galvanized iron/aluminum 426 274 4Bamboo/sawali/cogon/nipa 11,749 2,150 0Asbestos 7 7 0Glass 0 0 0Makeshift/salvaged/improvised materials 490 125 0Trapal 49 11 0Others 99 54 0No walls 2 0 0Not Reported 117 103 2
Masbate 187,299 100,661 1,845Concrete/brick/stone 41,886 38,129 1,548Wood 43,597 26,893 94Half concrete/brick/stone and half wood 22,903 15,623 173Galvanized iron/aluminum 1,812 1,342 26Bamboo/sawali/cogon/nipa 73,083 17,057 0Asbestos 128 121 0Glass 40 38 2Makeshift/salvaged/improvised materials 1,483 370 0Trapal 407 155 0Others 1,511 571 0No walls 47 25 1Not Reported 402 337 1
Sorsogon 166,106 77,628 3,601Concrete/brick/stone 71,422 56,369 3,198Wood 33,505 8,316 62Half concrete/brick/stone and half wood 28,017 10,645 180Galvanized iron/aluminum 1,112 487 154Bamboo/sawali/cogon/nipa 30,745 1,401 0Asbestos 58 54 2Glass 9 6 2Makeshift/salvaged/improvised materials 627 151 0Trapal 233 38 0Others 234 81 0No walls 24 7 0Not Reported 120 73 3
1 - 98

Construction Materials of the RoofMakeshift/ Salvaged/
Improvised Materials
Trapal Others Not Reported
Half Galvanized
Iron and Half Concrete
Bamboo/ Cogon/ Nipa/
Anahaw
Asbestos
1,486 15,644 0 244 96 156 20620 941 0 9 2 15 6137 3,626 0 26 15 23 6661 1,275 0 18 4 51 2
9 137 0 2 0 0 053 9,388 0 59 58 41 0
0 0 0 0 0 0 00 0 0 0 0 0 03 216 0 129 5 12 00 25 0 1 11 1 01 30 0 0 1 13 00 2 0 0 0 0 02 4 0 0 0 0 6
6,689 75,868 60 1,101 171 873 31655 1,474 39 27 5 9 0
1,136 15,256 10 100 30 78 04,256 2,794 2 41 4 10 0
113 328 1 0 1 1 0502 55,056 0 245 37 184 2
3 0 4 0 0 0 00 0 0 0 0 0 0
14 423 0 660 4 12 00 149 0 15 84 4 03 350 0 11 5 571 00 16 0 2 1 2 07 22 4 0 0 2 29
8,059 76,069 41 246 109 329 241,569 10,169 25 17 14 61 0
734 24,211 5 55 33 83 65,136 11,905 6 24 2 109 10
170 293 0 2 2 2 2430 28,833 0 21 26 34 0
0 0 2 0 0 0 00 0 0 0 0 1 05 341 0 120 6 4 00 166 0 6 23 0 00 116 0 1 2 34 00 16 0 0 1 0 0
15 19 3 0 0 1 6
1 - 99

Table 1.19 HOUSEHOLDS BY KIND OF FUEL FOR LIGHTING AND PROVINCE/CITY/MUNICIPALITYCensus Year 2015
Fuel for LightingProvince/ Total Liquified Oil None/
City/Municipality Number of Electricity Kerosene Petroleum (Vegetable Solar Solar Others NotHouseholds (Gaas) Gas animal Panel Lamp Reported
(LPG) and others)
Region V 1,216,369 1,009,648 173,317 1,733 153 13,996 10,466 5,975 1,081
Albay 277,091 246,196 28,021 251 29 627 1,231 542 194
Bacacay 14,365 12,727 1,503 6 0 40 73 16 0Camalig 14,787 13,432 1,265 3 2 20 34 25 6Daraga 27,648 25,750 1,708 31 3 32 86 31 7Guinobatan 18,239 15,844 2,224 33 0 27 68 38 5Jovellar 3,812 2,676 1,109 0 0 9 13 1 4
LEGAZPI CITY 41,742 38,635 2,782 54 4 68 114 64 21Libon 15,528 12,849 2,543 5 2 50 56 13 10Ligao City 22,552 20,006 2,413 19 1 40 46 19 8Malilipot 8,104 7,537 474 1 2 9 59 15 7Malinao 9,765 8,828 860 5 0 16 39 13 4
Manito 5,066 4,729 322 0 1 8 6 0 0Oas 14,068 11,742 2,232 5 4 18 51 11 5Pio Duran 9,467 7,908 1,511 6 0 13 20 8 1Polangui 18,313 16,552 1,645 14 2 38 27 16 19Rapu-Rapu 7,401 4,964 1,855 6 2 153 183 169 69
Santo Domingo 7,516 7,056 367 2 0 14 54 13 10Tabaco City 27,702 24,624 2,566 60 5 65 284 87 11Tiwi 11,016 10,337 642 1 1 7 18 3 7
Camarines Norte 129,994 116,113 11,619 255 7 883 401 618 98
Basud 9,123 8,249 834 1 0 5 13 16 5Capalonga 7,169 6,140 948 2 1 8 57 13 0DAET 23,270 22,213 876 41 3 19 24 56 38Jose Panganiban 3,184 2,740 423 1 0 10 4 4 2Labo 13,855 12,519 1,225 7 0 6 34 54 10
Mercedes 22,256 19,525 2,532 36 0 31 65 53 14Paracale 10,899 9,549 1,083 7 0 74 11 166 9San Lorenzo Ruiz
(Imelda) 13,171 11,968 874 82 3 65 52 122 5San Vicente 2,400 2,061 323 0 0 2 6 6 2Santa Elena 9,214 8,289 862 1 0 6 46 8 2
Talisay 5,803 5,340 435 4 0 7 7 8 2Vinzons 9,650 7,520 1,204 73 0 650 82 112 9
Camarines Sur 400,615 343,171 52,958 302 44 754 1,059 1,851 476
Baao 11,443 10,117 1,210 2 2 23 32 52 5Balatan 5,881 5,107 738 1 0 18 5 2 10Bato 9,869 8,820 973 15 0 12 18 15 16Bombon 3,461 3,155 268 0 0 4 12 20 2Buhi 16,541 14,241 2,170 21 0 15 22 12 60
Note: Figures are based on 20-percent sample households. Details may not add up to total due to rounding off.
Source: Philippine Statistics Authority
1 - 100

Table 1.19 - Continued
HOUSEHOLDS BY KIND OF FUEL FOR LIGHTING AND PROVINCE/CITY/MUNICIPALITYCensus Year 2015
Fuel for LightingProvince/ Total Liquified Oil None/
City/Municipality Number of Electricity Kerosene Petroleum (Vegetable Solar Solar Others NotHouseholds (Gaas) Gas animal Panel Lamp Reported
(LPG) and others)
Bula 13,589 12,027 1,486 8 1 20 31 15 1Cabusao 3,902 3,471 421 1 0 2 2 4 1Calabanga 17,211 14,839 2,273 3 0 12 26 51 7Camaligan 4,848 4,613 202 3 1 3 7 18 1Canaman 7,103 6,534 490 3 2 5 32 32 5
Caramoan 9,946 6,843 2,581 7 3 59 34 413 6Del Gallego 5,249 4,501 702 0 0 6 27 8 5Gainza 2,251 2,118 106 0 1 0 8 17 1Garchitorena 5,216 3,096 1,733 11 1 68 53 252 2Goa 12,842 9,944 2,819 12 2 25 23 17 0
Iriga City 21,840 19,584 2,114 39 2 29 47 22 3Lagonoy 11,312 9,463 1,747 2 2 23 27 23 25Libmanan 23,629 19,729 3,714 50 1 36 62 29 8Lupi 7,013 5,714 1,255 5 0 3 16 13 7Magarao 5,333 4,783 480 2 1 9 16 41 1
Milaor 6,324 5,670 577 5 1 5 20 37 9Minalabac 10,313 8,986 1,236 7 1 16 20 35 12Nabua 16,625 15,531 1,028 3 0 11 30 19 3Naga City 42,152 39,308 2,060 50 8 93 143 313 177Ocampo 9,322 7,492 1,759 1 2 6 29 31 2
Pamplona 7,583 6,728 799 1 1 14 17 21 2Pasacao 9,948 8,515 1,344 5 0 26 27 26 5PILI 18,178 16,222 1,808 2 1 31 47 55 12Presentacion 4,048 3,077 953 0 1 5 6 4 2Ragay 12,496 9,846 2,554 3 0 19 53 13 8
Sagñay 6,981 5,202 1,733 0 2 9 19 14 2San Fernando 7,246 6,387 755 0 0 6 34 12 52San Jose 8,684 7,746 912 0 0 3 15 5 3Sipocot 13,531 11,519 1,963 3 1 11 27 3 4Siruma 3,780 2,651 889 5 0 103 23 107 2
Tigaon 11,600 9,516 1,929 31 2 8 39 67 8Tinambac 13,325 10,076 3,177 1 5 16 10 33 7
Catanduanes 53,814 47,981 5,398 15 0 21 81 303 15
Bagamanoc 2,410 2,039 342 0 0 5 9 14 1Baras 2,818 2,536 271 0 0 2 4 4 1Bato 4,563 4,163 365 0 0 1 0 33 1Caramoran 5,893 5,074 741 0 0 0 4 74 0Gigmoto 1,749 1,614 121 0 0 0 4 7 3
Pandan 4,208 3,481 684 0 0 0 17 25 1Panganiban 2,011 1,805 200 0 0 0 0 2 4San Andres 7,710 6,772 871 1 0 3 9 53 1San Miguel 3,052 2,710 317 0 0 1 2 22 0Viga 4,332 3,727 589 0 0 0 4 9 3
VIRAC 15,068 14,060 897 14 0 9 28 60 0
1 - 101

Table 1.19 - Continued
HOUSEHOLDS BY KIND OF FUEL FOR LIGHTING AND PROVINCE/CITY/MUNICIPALITYCensus Year 2015
Fuel for LightingProvince/ Total Liquified Oil None/
City/Municipality Number of Electricity Kerosene Petroleum (Vegetable Solar Solar Others NotHouseholds (Gaas) Gas animal Panel Lamp Reported
(LPG) and others)
Masbate 188,013 103,742 61,739 856 53 11,603 7,403 2,485 132
Aroroy 17,087 10,196 5,307 38 2 268 437 827 12Baleno 5,369 3,325 1,918 1 1 55 41 24 4Balud 7,867 5,391 2,134 11 0 99 184 45 3Batuan 3,625 2,235 1,279 6 2 30 61 11 1Cataingan 10,833 5,659 3,680 146 2 601 488 246 11
Cawayan 15,063 6,485 4,632 125 6 2,612 985 211 7Claveria 9,173 2,411 4,491 7 3 1,405 704 141 11Dimasalang 5,430 3,155 1,705 3 1 293 255 15 3Esperanza 4,097 1,961 1,542 0 0 320 267 6 1Mandaon 8,741 5,118 2,884 101 1 282 338 13 4
MASBATE CITY 19,237 14,758 3,981 11 23 97 202 147 18Milagros 11,494 6,597 3,866 7 1 439 520 64 0Mobo 7,752 5,255 2,008 117 1 175 170 24 2Monreal 5,270 2,918 2,088 30 0 95 74 63 2Palanas 5,856 2,513 2,012 102 0 811 382 31 5
Pio V. Corpuz 5,285 3,531 1,550 12 1 30 64 92 5Placer 11,958 5,600 4,131 81 2 1,266 826 39 13San Fernando 5,402 3,508 1,816 6 0 22 15 33 2San Jacinto 7,065 4,034 2,684 5 2 138 176 26 0San Pascual 9,836 2,552 3,911 31 4 2,308 932 92 6
Uson 11,573 6,540 4,120 16 1 257 282 335 22
Sorsogon 166,842 152,445 13,582 54 20 108 291 176 166
Barcelona 4,794 4,383 382 0 0 4 12 10 3Bulan 20,787 19,487 1,249 1 3 11 19 8 9Bulusan 5,307 5,032 253 0 0 1 5 7 9Casiguran 7,107 6,338 721 2 1 7 13 23 2Castilla 12,298 10,523 1,697 1 0 11 32 19 15
Donsol 10,322 9,309 992 4 1 1 4 1 10Gubat 13,471 12,188 1,175 23 3 13 44 15 10Irosin 11,418 10,914 473 3 1 3 8 7 9Juban 6,650 6,164 466 0 1 0 11 0 8Magallanes 7,497 6,392 1,062 0 0 3 16 9 15
Matnog 8,395 7,562 798 3 2 4 4 6 16Pilar 15,032 12,617 2,286 10 2 22 71 14 10Prieto Diaz 4,781 4,350 387 0 0 3 6 10 25Santa Magdalena 3,589 3,372 206 1 0 3 0 7 0SORSOGON CITY 35,394 33,814 1,435 6 6 22 46 40 25
1 - 102

Table 1.20 HOUSEHOLDS BY KIND OF FUEL FOR COOKING AND PROVINCE/CITY/MUNICIPALITYCensus Year 2010
Fuel for CookingProvince/ Total Liquified None/
City/Municipality Number of Electricity Kerosene Petroleum Charcoal Wood Others NotHouseholds (Gaas) Gas Reported
(LPG)
Region V 1,111,753 11,301 13,375 177,325 317,889 589,187 2,375 303
Albay 255,672 3,158 2,680 51,130 55,980 142,072 617 35
Bacacay 13,530 124 136 1,834 1,516 9,921 - - Camalig 13,564 178 199 1,939 1,846 9,380 21 - Daraga 24,923 580 203 7,288 5,879 10,967 - 5Guinobatan 16,607 125 118 3,506 3,269 9,577 7 5Jovellar 3,555 19 20 197 371 2,948 - -
LEGAZPI CITY 38,398 474 609 12,088 13,718 11,427 77 5Libon 14,552 129 70 1,775 1,461 11,076 40 - Ligao City 21,140 439 216 4,174 2,381 13,900 20 9Malilipot 7,366 80 45 1,305 1,182 4,748 - 5Malinao 8,760 30 137 1,222 1,374 5,957 40 -
Manito 4,710 25 15 165 1,391 3,114 - - Oas 13,212 142 121 2,362 1,559 8,724 303 - Pio Duran 9,127 59 50 662 2,542 5,808 5 - Polangui 16,973 195 207 4,237 2,582 9,693 60 - Rapu-Rapu 6,933 30 34 353 2,154 4,362 - -
Santo Domingo 6,887 97 51 1,257 1,520 3,948 15 - Tabaco City 25,329 301 352 5,473 9,027 10,150 20 5Tiwi 10,106 129 95 1,294 2,207 6,372 9 -
Camarines Norte 116,728 1,167 1,170 22,552 61,947 29,728 139 25
Basud 8,283 31 35 1,020 4,806 2,380 5 5Capalonga 6,627 20 63 431 4,850 1,263 - - DAET 20,768 480 100 8,731 9,191 2,245 20 - Jose Panganiban 11,996 139 204 2,801 6,344 2,473 35 - Labo 19,810 75 278 2,593 11,617 5,227 10 10
Mercedes 9,959 109 94 835 6,892 2,019 10 - Paracale 11,414 87 54 2,241 6,243 2,789 - - San Lorenzo Ruiz
(Imelda) 2,744 15 20 131 1,508 1,070 - - San Vicente 2,230 30 30 360 876 934 - - Santa Elena 8,763 46 130 737 5,624 2,222 5 -
Talisay 5,225 90 45 1,159 1,749 2,172 10 - Vinzons 8,909 45 116 1,513 2,246 4,935 44 10
Camarines Sur 364,472 4,584 4,965 63,803 99,071 190,494 1,423 133
Baao 10,572 60 117 2,549 969 6,836 41 - Balatan 5,482 47 41 345 2,667 2,377 - 5Bato 9,122 40 63 1,043 2,040 5,916 15 5Bombon 3,183 45 10 478 1,277 1,289 83 - Buhi 15,598 167 296 2,228 1,363 11,519 5 20
Note: Figures are based on 20-percent sample households. Details may not add up to total due to rounding off.
Source: Philippine Statistics Authority
1 - 103

Table 1.20 - Continued
HOUSEHOLDS BY KIND OF FUEL FOR COOKING AND PROVINCE/CITY/MUNICIPALITYCensus Year 2010
Fuel for CookingProvince/ Total Liquified None/
City/Municipality Number of Electricity Kerosene Petroleum Charcoal Wood Others NotHouseholds (Gaas) Gas Reported
(LPG)
Bula 12,855 97 299 1,468 1,271 9,705 10 5Cabusao 3,750 15 15 331 1,722 1,632 30 5Calabanga 15,603 150 84 2,258 5,905 7,043 163 - Camaligan 4,534 55 29 1,478 2,314 628 30 - Canaman 6,582 103 102 2,136 2,553 1,667 21 -
Caramoan 9,005 55 96 352 809 7,692 - - Del Gallego 4,835 15 76 323 2,746 1,670 - 5Gainza 2,020 46 15 440 860 588 65 5Garchitorena 4,593 25 94 165 1,351 2,952 5 - Goa 11,700 329 293 1,630 2,347 7,085 10 5
Iriga City 21,759 712 501 5,555 2,042 12,934 5 10Lagonoy 10,374 49 223 964 2,953 6,180 5 - Libmanan 20,670 178 161 2,361 5,273 12,626 64 6Lupi 6,401 42 50 272 2,791 3,235 11 - Magarao 4,830 44 59 1,420 1,796 1,392 114 5
Milaor 5,484 45 40 1,149 1,640 2,566 45 - Minalabac 9,336 40 169 967 1,805 6,237 114 5Nabua 15,201 383 339 3,578 1,053 9,827 20 - Naga City 35,929 1,033 571 17,012 12,764 4,500 36 15Ocampo 8,587 54 80 928 1,062 6,391 66 5
Pamplona 6,839 30 30 796 1,803 3,966 213 - Pasacao 8,906 44 82 681 4,703 3,396 - - PILI 16,193 212 188 4,233 3,510 7,941 110 - Presentacion 3,815 15 47 159 402 3,192 - - Ragay 11,630 71 166 681 6,285 4,421 5 -
Sagñay 6,168 26 160 388 937 4,651 5 - San Fernando 6,529 37 21 1,082 2,356 2,946 71 16San Jose 7,687 50 24 1,083 1,759 4,746 25 - Sipocot 13,156 62 105 1,243 5,313 6,412 16 5Siruma 3,385 30 55 153 1,336 1,811 - -
Tigaon 9,944 120 111 1,142 2,083 6,467 21 - Tinambac 12,215 57 149 730 5,210 6,059 - 11
Catanduanes 49,368 199 354 9,549 2,755 36,482 30 -
Bagamanoc 2,263 15 34 385 35 1,793 - - Baras 2,566 14 27 374 75 2,076 - - Bato 4,180 36 36 923 148 3,029 9 - Caramoran 5,295 5 10 468 588 4,224 - - Gigmoto 1,551 10 - 145 53 1,343 - -
Pandan 3,786 5 16 340 91 3,334 - - Panganiban 1,912 5 - 406 10 1,491 - - San Andres 7,224 50 25 962 219 5,967 - - San Miguel 2,726 5 76 271 15 2,359 - - Viga 3,927 9 44 539 16 3,318 - -
VIRAC 13,938 44 86 4,735 1,505 7,547 21 -
1 - 104

Table 1.20 - Continued
HOUSEHOLDS BY KIND OF FUEL FOR COOKING AND PROVINCE/CITY/MUNICIPALITYCensus Year 2010
Fuel for CookingProvince/ Total Liquified None/
City/Municipality Number of Electricity Kerosene Petroleum Charcoal Wood Others NotHouseholds (Gaas) Gas Reported
(LPG)
Masbate 171,644 817 3,024 9,666 33,012 124,959 95 71
Aroroy 14,581 109 298 989 3,366 9,804 15 - Baleno 4,782 10 158 372 540 3,697 5 - Balud 7,240 5 24 169 646 6,396 - - Batuan 2,896 - 45 35 875 1,916 24 - Cataingan 10,548 87 210 321 788 9,131 - 11
Cawayan 13,316 30 130 468 2,087 10,595 - 5Claveria 8,692 10 126 370 1,941 6,239 5 - Dimasalang 5,156 5 64 297 1,208 3,577 5 - Esperanza 3,913 15 70 123 113 3,581 5 5Mandaon 7,701 30 186 290 828 6,368 - -
MASBATE CITY 17,058 234 271 3,347 6,805 6,396 - 5Milagros 10,290 5 74 363 1,325 8,522 - - Mobo 6,755 34 66 389 1,211 5,039 5 10Monreal 5,008 40 61 160 1,487 3,245 15 - Palanas 5,568 25 101 159 305 4,978 - -
Pio V. Corpuz 5,338 5 20 245 327 4,736 - 5Placer 11,433 19 402 350 1,611 9,040 5 5San Fernando 4,765 15 35 203 1,386 3,111 - 15San Jacinto 6,530 36 130 536 1,662 4,161 - 5San Pascual 9,183 21 438 183 2,668 5,868 5 -
Uson 10,891 81 115 295 1,831 8,559 5 5
Sorsogon 153,869 1,376 1,182 20,625 65,124 65,452 71 39
Barcelona 4,651 55 15 443 2,554 1,579 - 5Bulan 19,582 272 260 2,301 11,546 5,192 5 5Bulusan 4,900 24 5 573 2,534 1,763 - - Casiguran 6,410 85 59 557 3,038 2,656 - 15Castilla 11,022 105 30 577 3,374 6,926 5 5
Donsol 9,397 15 81 686 3,015 5,595 5 - Gubat 12,710 169 50 1,969 4,964 5,553 5 - Irosin 10,447 84 56 1,569 4,888 3,834 16 - Juban 6,025 34 150 583 2,169 3,090 - - Magallanes 7,187 30 65 463 3,859 2,759 11 -
Matnog 7,481 14 45 543 4,229 2,645 - 5Pilar 13,727 38 100 979 3,147 9,443 20 - Prieto Diaz 4,219 5 35 420 1,214 2,546 - - Santa Magdalena 3,417 5 60 395 2,211 746 - - SORSOGON CITY 32,694 439 172 8,567 12,382 11,124 5 5
1 - 105

Table 1.21 HOUSEHOLDS BY MAIN SOURCE OF WATER SUPPLY FOR DRINKING AND PROVINCE/CITY/MUNICIPALITYCensus Year 2015
Source of Water Supply for Drinking
Region V 1,216,369 271,902 267,918 81,520 203,462 26,492
Albay 277,091 64,948 58,458 19,972 48,171 4,723
Bacacay 14,365 3,449 2,766 1,314 2,477 393Camalig 14,787 2,788 1,574 1,550 4,266 1,137Daraga 27,648 6,228 3,520 2,768 7,467 135Guinobatan 18,239 3,662 3,077 2,045 4,582 127Jovellar 3,812 123 746 299 1,044 625
LEGAZPI CITY 41,742 5,040 2,943 2,470 7,160 597Libon 15,528 1,200 2,668 1,684 3,606 50Ligao City 22,552 7,932 5,792 1,505 3,226 496Malilipot 8,104 3,263 2,262 327 607 10Malinao 9,765 4,275 3,549 311 499 5
Manito 5,066 1,384 2,940 95 108 5Oas 14,068 1,907 1,941 1,696 2,717 136Pio Duran 9,467 715 4,034 1,201 2,428 58Polangui 18,313 3,277 3,510 936 2,601 70Rapu-Rapu 7,401 797 3,687 233 917 117
Santo Domingo 7,516 2,968 1,842 309 828 52Tabaco City 27,702 12,928 6,415 910 2,564 700Tiwi 11,016 3,012 5,192 319 1,074 10
Camarines Norte 129,994 34,791 38,367 4,371 13,988 1,029
Basud 9,123 1,631 1,707 484 1,442 89Capalonga 7,169 393 2,008 150 754 49DAET 23,270 14,361 6,393 507 950 19Jose Panganiban 13,855 1,570 1,838 373 2,530 97Labo 22,256 5,784 5,497 739 2,774 378
Mercedes 10,899 1,739 6,399 221 897 138Paracale 13,171 1,623 3,522 559 1,609 146San Lorenzo Ruiz
(Imelda) 3,184 1,534 882 69 90 1San Vicente 2,400 831 995 150 242 15Santa Elena 9,214 957 2,354 198 944 38
Talisay 5,803 1,873 2,472 337 801 5Vinzons 9,650 2,495 4,300 584 955 54
Camarines Sur 400,615 109,113 80,889 43,404 72,573 7,878
Baao 11,443 3,547 896 2,034 2,266 211Balatan 5,881 167 674 1,782 2,092 251Bato 9,869 642 533 1,445 2,814 1,324Bombon 3,461 1,334 796 139 615 8Buhi 16,541 6,524 4,929 740 2,261 164
Note: Figures are based on 20-percent sample households. Details may not add up to total due to rounding off.
Source: Philippine Statistics Authority
Total Number of
Households
Province/ City/Municipality
Own use faucet community
water system
Shared faucet community
water system
Own use tubed/piped
deep well
Shared tubed/piped
deep well
Tubed/piped shallow well
1 - 106

Source of Water Supply for Drinking
115,420 66,111 17,258 4,558 40,030 120,722 976
12,958 15,859 3,266 1,128 5,313 42,191 104
1,944 1,595 92 23 51 261 - 619 1,252 334 135 206 924 2390 1,262 184 20 497 5,177 - 731 1,661 762 59 211 1,315 7425 305 231 9 1 2 2
3,113 2,678 340 5 958 16,364 74640 347 25 20 1,000 4,288 - 673 1,418 115 21 68 1,306 -
5 1,004 230 113 - 281 225 367 50 13 68 603 -
322 200 1 9 - 2 - 467 181 205 133 1,613 3,072 - 538 26 9 9 118 331 - 790 564 54 250 41 6,217 3849 361 283 46 22 89 -
129 990 42 32 260 58 61,218 1,337 288 230 179 925 8
80 311 21 1 20 976 -
12,836 7,726 1,145 601 7,896 7,179 65
1,775 414 121 34 501 915 101,997 253 93 24 1,389 49 10
226 11 47 3 173 568 121,063 2,581 235 151 1,215 2,198 42,467 2,039 293 51 1,739 486 9
839 116 58 43 410 39 - 777 1,356 95 257 2,060 1,167 -
513 46 24 7 2 15 116 30 25 - - 96 -
2,016 855 45 31 392 1,383 1
103 10 1 - 2 196 31,044 15 108 - 13 67 15
20,989 18,561 4,892 1,092 15,739 24,897 588
905 951 11 1 30 441 15072 418 137 24 27 237 - 29 591 124 23 1 2,338 535 88 18 - 1 426 1
515 688 227 50 363 79 1
Bottled water OthersProtected spring
Unprotected spring
Lake, river, rain and others
PeddlerDug well
1 - 107

Table 1.21 - Continued
HOUSEHOLDS BY MAIN SOURCE OF WATER SUPPLY FOR DRINKING AND PROVINCE/CITY/MUNICIPALITYCensus Year 2015
Source of Water Supply for DrinkingTotal Number of
Households
Province/ City/Municipality
Own use faucet community
water system
Shared faucet community
water system
Own use tubed/piped
deep well
Shared tubed/piped
deep well
Tubed/piped shallow well
Bula 13,589 2,252 1,048 3,760 4,562 138Cabusao 3,902 815 1,301 159 450 0Calabanga 17,211 5,155 4,567 1,601 2,064 223Camaligan 4,848 1,086 359 76 64 4Canaman 7,103 1,131 750 422 245 20
Caramoan 9,946 1,007 3,563 204 2,347 173Del Gallego 5,249 1,591 1,277 313 897 53Gainza 2,251 902 809 2 6 - Garchitorena 5,216 667 2,092 112 939 38Goa 12,842 3,203 2,581 1,850 1,959 107
Iriga City 21,840 12,125 2,817 2,427 1,997 260Lagonoy 11,312 2,325 3,042 942 3,210 298Libmanan 23,629 5,789 6,237 2,851 5,317 149Lupi 7,013 2,287 1,934 581 463 36Magarao 5,333 1,798 1,444 139 454 15
Milaor 6,324 386 514 850 805 29Minalabac 10,313 913 1,384 2,713 3,089 413Nabua 16,625 3,934 3,123 3,950 3,719 261Naga City 42,152 24,981 7,214 825 1,255 32Ocampo 9,322 868 724 1,911 4,612 221
Pamplona 7,583 206 745 1,753 2,755 140Pasacao 9,948 1,198 2,857 951 1,819 182PILI 18,178 7,281 2,498 2,616 3,414 52Presentacion 4,048 939 2,418 49 335 3Ragay 12,496 1,888 2,763 474 2,995 599
Sagñay 6,981 1,085 1,927 489 1,564 247San Fernando 7,246 477 1,506 1,962 1,648 10San Jose 8,684 1,548 1,261 1,013 3,488 886Sipocot 13,531 2,935 2,479 808 1,818 194Siruma 3,780 39 568 71 789 198
Tigaon 11,600 3,141 2,893 1,115 2,115 284Tinambac 13,325 2,947 4,366 275 1,331 655
Catanduanes 53,814 12,112 13,155 2,422 10,509 3,381
Bagamanoc 2,410 274 1,076 21 638 22Baras 2,818 1,414 757 80 78 15Bato 4,563 1,883 1,356 145 208 40Caramoran 5,893 1,015 2,548 110 1,564 63Gigmoto 1,749 105 599 193 694 2
Pandan 4,208 285 908 48 433 1,877Panganiban 2,011 316 625 22 612 12San Andres 7,710 1,491 1,416 911 2,722 151San Miguel 3,052 1,373 869 9 3 22Viga 4,332 590 1,685 107 839 6
VIRAC 15,068 3,366 1,316 776 2,718 1,171
1 - 108

Source of Water Supply for Drinking
Bottled water OthersProtected spring
Unprotected spring
Lake, river, rain and others
PeddlerDug well
290 945 39 5 49 451 5010 0 7 3 1,022 133 2
545 1,007 261 90 640 1,015 430 1 1 1 2,507 749 -
15 11 - 19 2,771 1,717 2
2,054 501 25 21 8 42 1797 186 52 9 39 33 2
- - - - 452 80 - 1,222 129 4 3 2 1 71,039 1,122 541 51 4 373 12
761 661 260 39 137 350 6285 638 223 69 7 270 3675 1,742 179 61 179 445 5934 514 165 5 4 89 1
15 8 - - 696 759 5
214 11 - 1 3,225 288 179 321 5 12 1,118 256 1027 26 - 2 2 1,550 3191 316 43 10 426 6,876 83
130 564 168 5 - 110 9
72 145 17 1 1,209 529 11573 841 84 32 4 1,407 0
42 605 32 10 63 1,471 9445 212 3 20 - 24 -
1,875 707 417 6 265 504 3
440 664 515 - 6 40 461 172 82 17 379 926 6
193 77 30 3 1 175 91,919 2,003 427 338 81 520 91,924 124 13 23 11 18 2
548 936 437 14 7 90 202,558 636 345 124 3 85 -
426 2,817 1,752 37 22 7,177 4
108 79 6 2 4 180 - - 216 124 7 1 126 -
12 279 193 4 2 440 114 314 248 - 1 16 -
3 65 63 15 - 7 3
50 459 101 - - 47 - 6 108 243 - - 67 -
25 142 85 - - 767 - 18 564 58 4 1 131 -
153 255 579 0 1 117 -
37 336 52 5 12 5,279 -
1 - 109

Table 1.21 - Continued
HOUSEHOLDS BY MAIN SOURCE OF WATER SUPPLY FOR DRINKING AND PROVINCE/CITY/MUNICIPALITYCensus Year 2015
Source of Water Supply for DrinkingTotal Number of
Households
Province/ City/Municipality
Own use faucet community
water system
Shared faucet community
water system
Own use tubed/piped
deep well
Shared tubed/piped
deep well
Tubed/piped shallow well
Masbate 188,013 8,220 34,558 4,283 29,537 5,500
Aroroy 17,087 655 6,150 455 2,053 420Baleno 5,369 104 2,058 321 920 375Balud 7,867 329 823 268 934 369Batuan 3,625 137 524 178 1,256 57Cataingan 10,833 237 1,103 202 1,404 233
Cawayan 15,063 60 1,721 158 1,635 102Claveria 9,173 1,152 3,060 369 2,335 218Dimasalang 5,430 311 1,486 57 722 226Esperanza 4,097 132 198 11 368 93Mandaon 8,741 62 321 107 1,193 168
MASBATE CITY 19,237 1,172 2,072 359 3,177 873Milagros 11,494 350 1,279 149 1,111 243Mobo 7,752 372 2,265 191 1,086 260Monreal 5,270 256 1,243 94 498 373Palanas 5,856 979 2,175 81 591 137
Pio V. Corpuz 5,285 182 751 76 353 511Placer 11,958 10 180 43 675 20San Fernando 5,402 187 1,506 100 1,249 123San Jacinto 7,065 424 1,566 240 1,881 183San Pascual 9,836 933 2,103 596 4,204 440
Uson 11,573 176 1,974 228 1,892 76
Sorsogon 166,842 42,718 42,491 7,068 28,684 3,981
Barcelona 4,794 1,878 280 13 205 5Bulan 20,787 4,431 7,643 591 3,358 434Bulusan 5,307 3,629 1,290 4 26 63Casiguran 7,107 4,416 1,770 29 185 86Castilla 12,298 1,082 2,843 1,113 3,764 133
Donsol 10,322 1,873 2,038 848 3,691 35Gubat 13,471 4,768 1,695 197 2,492 283Irosin 11,418 3,519 4,849 216 660 60Juban 6,650 1,927 2,622 389 569 54Magallanes 7,497 2,956 2,898 46 539 178
Matnog 8,395 1,169 4,772 62 321 105Pilar 15,032 1,587 2,369 1,235 5,177 367Prieto Diaz 4,781 142 1,113 165 490 1,696Santa Magdalena 3,589 1,565 852 97 751 2SORSOGON CITY 35,394 7,776 5,457 2,063 6,456 480
1 - 110

Source of Water Supply for Drinking
Bottled water OthersProtected spring
Unprotected spring
Lake, river, rain and others
PeddlerDug well
58,065 9,515 3,510 1,453 7,894 25,304 174
3,319 240 325 202 664 2,602 21,067 181 45 117 41 139 14,225 43 5 100 465 305 11,048 214 6 - 17 188 - 3,931 996 414 46 646 1,608 13
8,360 9 1 136 192 2,689 - 997 663 133 226 7 10 3
1,454 187 261 32 18 675 12,410 177 68 4 135 499 25,461 8 7 42 849 519 4
1,971 864 249 27 1,120 7,259 944,990 399 14 85 1,772 1,101 1
770 1,224 491 3 23 1,067 - 1,888 101 372 123 170 151 1
505 980 191 5 22 190 -
1,412 1,079 480 6 102 333 - 6,493 58 40 - 1,262 3,177 -
709 476 74 46 368 537 271,224 248 209 182 1 906 1
727 639 97 36 1 43 17
5,104 729 28 35 19 1,306 6
10,146 11,633 2,693 247 3,166 13,974 41
68 2,246 - - - 98 11,599 428 64 38 715 1,485 1
64 115 67 8 - 41 - 95 256 161 21 21 66 1
875 1,686 154 3 175 467 3
858 489 87 12 190 201 - 1,232 850 415 1 524 1,012 2
64 751 429 6 60 803 1336 433 228 - 9 81 2194 577 59 4 16 30 -
287 351 309 7 620 390 22,737 147 123 113 8 1,168 1
408 229 14 5 3 514 2108 158 51 - 1 4 -
1,221 2,917 532 29 824 7,614 25
1 - 111

Table 1.22 HOUSEHOLDS BY KIND OF TOILET FACILITY AND PROVINCE/CITY/MUNICIPALITYCensus Year 2010
Kind of Toilet FacilityProvince/ Total Water-sealed Water-sealed Water-sealed
City/Municipality Number of sewer septic tank sewer septic tank other depositoryHouseholds used exclusively shared with other used exclusively
by household households by household
Region V 1,111,753 575,224 82,531 102,928
Albay 255,672 145,280 19,801 22,104
Bacacay 13,530 7,570 1,136 1,479Camalig 13,564 5,876 980 1,950Daraga 24,923 16,656 1,108 2,071Guinobatan 16,607 9,499 838 1,187Jovellar 3,555 679 143 509
LEGAZPI CITY 38,398 26,022 2,508 3,046Libon 14,552 6,346 1,379 1,667Ligao City 21,140 12,348 1,634 775Malilipot 7,366 4,065 942 1,079Malinao 8,760 4,587 806 780
Manito 4,710 2,602 361 300Oas 13,212 6,627 1,131 975Pio Duran 9,127 3,590 1,033 510Polangui 16,973 9,132 1,360 1,864Rapu-Rapu 6,933 2,916 356 1,107
Santo Domingo 6,887 5,088 705 85Tabaco City 25,329 15,604 2,476 2,202Tiwi 10,106 6,076 904 517
Camarines Norte 116,728 69,569 8,852 10,796
Basud 8,283 5,785 378 725Capalonga 6,627 2,840 250 1,146DAET 20,768 15,221 1,608 1,811Jose Panganiban 11,996 6,436 826 1,130Labo 19,810 10,613 2,031 2,543
Mercedes 9,959 4,742 1,088 732Paracale 11,414 7,174 647 522San Lorenzo Ruiz
(Imelda) 2,744 2,092 121 175San Vicente 2,230 1,886 77 145Santa Elena 8,763 4,483 536 1,025
Talisay 5,225 3,983 587 218Vinzons 8,909 4,314 702 622
Camarines Sur 364,472 188,454 31,762 43,571
Baao 10,572 4,787 1,428 1,136Balatan 5,482 1,020 292 948Bato 9,122 3,845 1,322 1,636Bombon 3,183 1,684 271 240Buhi 15,598 7,465 1,514 1,747
Note: Figures are based on 20-percent sample households. Details may not add up to total due to rounding off.
Source: Philippine Statistics Authority
1 - 112

Kind of Toilet FacilityWater-sealed Others
other depository Closed Pit Open Pit (pail system Noneshared with other and others)
households
42,414 95,923 40,699 19,141 152,894
9,551 30,464 10,410 2,956 15,105
378 2,187 255 71 454469 2,879 766 211 434844 2,756 552 308 628248 2,718 1,081 247 789133 830 344 61 856
1,222 2,285 1,156 417 1,7431,080 2,325 757 106 893
800 2,470 1,212 278 1,623262 437 255 55 271188 1,326 228 85 760
226 460 305 138 318781 2,477 364 110 747424 1,690 880 127 873577 2,719 838 157 326438 492 313 163 1,148
159 354 89 45 3621,080 1,566 574 316 1,512
242 495 442 61 1,370
3,796 7,583 2,749 1,646 11,738
252 535 74 15 518216 243 95 202 1,635623 861 124 132 386332 1,023 391 283 1,574558 2,126 600 251 1,088
395 136 148 227 2,490322 1,045 464 191 1,048
20 96 35 11 1925 24 - 10 83
504 628 466 161 961
51 297 39 15 35518 567 312 148 1,727
19,152 38,394 10,596 4,990 27,553
738 1,269 537 273 405682 2,025 135 15 365
1,242 730 92 25 23086 503 181 41 177
693 2,492 662 202 823
1 - 113

Table 1.22 - Continued
HOUSEHOLDS BY KIND OF TOILET FACILITY AND PROVINCE/CITY/MUNICIPALITYCensus Year 2010
Kind of Toilet FacilityProvince/ Total Water-sealed Water-sealed Water-sealed
City/Municipality Number of sewer septic tank sewer septic tank other depositoryHouseholds used exclusively shared with other used exclusively
by household households by household
Bula 12,855 6,516 1,014 1,319Cabusao 3,750 1,745 184 711Calabanga 15,603 7,374 1,848 2,500Camaligan 4,534 3,378 651 120Canaman 6,582 3,823 446 912
Caramoan 9,005 3,981 162 952Del Gallego 4,835 2,711 205 468Gainza 2,020 1,239 237 336Garchitorena 4,593 2,255 171 206Goa 11,700 5,732 716 1,290
Iriga City 21,759 14,933 1,750 1,380Lagonoy 10,374 4,619 607 1,429Libmanan 20,670 9,048 901 3,848Lupi 6,401 2,854 283 1,371Magarao 4,830 2,945 607 488
Milaor 5,484 2,916 650 875Minalabac 9,336 3,659 764 2,441Nabua 15,201 7,259 1,374 3,105Naga City 35,929 27,553 3,511 2,303Ocampo 8,587 3,683 1,316 707
Pamplona 6,839 3,202 897 1,136Pasacao 8,906 3,973 844 1,123PILI 16,193 9,462 2,113 1,377Presentacion 3,815 1,827 121 325Ragay 11,630 5,629 575 852
Sagñay 6,168 2,332 542 815San Fernando 6,529 3,205 739 951San Jose 7,687 4,238 579 874Sipocot 13,156 6,815 794 1,174Siruma 3,385 1,604 143 287
Tigaon 9,944 3,934 1,175 947Tinambac 12,215 5,212 1,020 1,242
Catanduanes 49,368 30,810 5,595 2,376
Bagamanoc 2,263 1,545 97 19Baras 2,566 1,640 208 67Bato 4,180 2,631 576 540Caramoran 5,295 2,608 804 111Gigmoto 1,551 994 130 145
Pandan 3,786 2,076 690 121Panganiban 1,912 1,580 94 48San Andres 7,224 4,402 804 266San Miguel 2,726 1,654 153 49Viga 3,927 2,069 161 555
VIRAC 13,938 9,611 1,879 454
1 - 114

Kind of Toilet FacilityWater-sealed Others
other depository Closed Pit Open Pit (pail system Noneshared with other and others)
households
479 2,334 519 347 326134 469 78 15 415818 1,161 512 85 1,305
95 156 25 15 94332 781 191 59 39
234 1,113 90 270 2,202179 335 133 116 688
84 30 10 - 8354 626 181 108 992
602 1,394 580 299 1,087
672 2,156 573 60 235577 918 253 123 1,848
1,383 3,336 1,023 70 1,062312 755 164 5 658118 388 81 34 168
520 366 39 - 118876 1,040 189 35 331
1,040 1,944 336 30 114728 643 120 509 563555 964 325 36 1,001
524 420 70 15 575667 757 85 489 967947 1,059 129 344 762102 249 15 84 1,093272 1,170 837 378 1,918
494 824 217 126 817765 430 134 62 243648 663 116 56 513371 2,470 500 114 917192 45 25 35 1,055
532 988 1,031 245 1,092404 1,390 408 268 2,272
1,226 1,679 787 209 6,686
95 95 119 14 279103 126 116 13 292
79 30 5 - 32086 64 119 49 1,45522 132 19 16 94
36 54 10 15 78332 99 5 - 54
236 129 24 15 1,34815 321 55 15 464
149 381 189 28 396
374 247 128 45 1,201
1 - 115

Table 1.22 - Continued
HOUSEHOLDS BY KIND OF TOILET FACILITY AND PROVINCE/CITY/MUNICIPALITYCensus Year 2010
Kind of Toilet FacilityProvince/ Total Water-sealed Water-sealed Water-sealed
City/Municipality Number of sewer septic tank sewer septic tank other depositoryHouseholds used exclusively shared with other used exclusively
by household households by household
Masbate 171,644 53,575 5,993 11,298
Aroroy 14,581 4,167 561 1,294Baleno 4,782 1,579 222 588Balud 7,240 2,084 169 1,175Batuan 2,896 817 10 287Cataingan 10,548 2,910 245 224
Cawayan 13,316 2,894 505 436Claveria 8,692 2,072 164 884Dimasalang 5,156 1,723 290 69Esperanza 3,913 929 171 213Mandaon 7,701 2,884 172 702
MASBATE CITY 17,058 9,211 852 1,066Milagros 10,290 3,069 367 510Mobo 6,755 2,738 336 321Monreal 5,008 1,210 231 203Palanas 5,568 1,921 180 475
Pio V. Corpuz 5,338 1,383 75 661Placer 11,433 2,252 401 593San Fernando 4,765 1,934 97 268San Jacinto 6,530 2,308 198 468San Pascual 9,183 1,974 243 206
Uson 10,891 3,516 505 654
Sorsogon 153,869 87,536 10,528 12,783
Barcelona 4,651 2,324 358 647Bulan 19,582 11,035 1,693 997Bulusan 4,900 3,156 241 145Casiguran 6,410 4,184 544 169Castilla 11,022 5,018 783 1,275
Donsol 9,397 3,455 519 639Gubat 12,710 8,348 833 726Irosin 10,447 6,189 834 1,102Juban 6,025 3,186 497 946Magallanes 7,187 4,236 688 321
Matnog 7,481 3,464 363 693Pilar 13,727 3,760 643 1,830Prieto Diaz 4,219 2,695 244 594Santa Magdalena 3,417 1,916 249 334SORSOGON CITY 32,694 24,569 2,038 2,365
1 - 116

Kind of Toilet FacilityWater-sealed Others
other depository Closed Pit Open Pit (pail system Noneshared with other and others)
households
3,931 6,930 11,945 6,098 71,875
371 648 1,224 381 5,935162 565 552 170 944288 352 543 157 2,472
91 101 528 229 834277 364 798 91 5,638
152 375 735 299 7,920233 211 847 699 3,582
34 126 439 127 2,34842 41 118 15 2,385
267 341 275 97 2,963
379 933 747 245 3,623179 373 923 238 4,630223 236 215 99 2,587
65 65 67 814 2,35375 308 464 351 1,795
141 126 671 188 2,094306 594 882 203 6,202
61 139 263 448 1,555295 267 442 215 2,337
73 452 797 837 4,601
219 313 417 193 5,075
4,758 10,873 4,212 3,242 19,937
165 509 54 65 529396 1,856 558 622 2,425
14 265 60 19 999124 398 59 158 773257 803 292 371 2,223
583 1,084 522 496 2,098241 1,039 387 202 935533 596 153 131 910167 325 146 115 643372 197 204 265 904
192 410 276 226 1,858671 2,160 987 310 3,365119 152 24 - 391133 211 59 45 469791 866 431 217 1,417
1 - 117

Table 1.23 HOUSEHOLDS REPORTING PRESENCE OF HOUSEHOLD CONVENIENCE/DEVICESBY PROVINCE/CITY/MUNICIPALITYCensus Year 2010
Households Household Convenience / DevicesProvince/ Total with at least Radio/ Landline/
City/Municipality Number of household Radio Television CD / DVD/ Component/ WirelessHouseholds convenience/ Cassete Set VCD Player Stereo Set Telephone
device
Region V 1,111,753 935,224 672,738 656,548 466,961 167,862 31,287
Albay 255,672 224,113 166,961 177,907 121,972 45,410 7,672
Bacacay 13,530 11,702 8,810 8,750 6,068 2,083 112Camalig 13,564 11,844 9,428 9,201 5,711 1,979 241Daraga 24,923 22,811 18,276 19,308 13,073 5,770 1,357Guinobatan 16,607 14,374 11,014 11,490 7,342 2,927 269Jovellar 3,555 2,924 2,160 1,837 1,116 310 5
LEGAZPI CITY 38,398 35,799 28,109 31,357 22,827 9,518 3,036Libon 14,552 11,803 8,465 8,519 5,248 1,599 95Ligao City 21,140 18,147 13,374 14,920 10,121 3,751 478Malilipot 7,366 6,486 4,441 4,815 3,399 1,283 85Malinao 8,760 7,352 5,353 5,419 4,226 1,570 50
Manito 4,710 4,165 3,178 3,238 1,800 644 20Oas 13,212 11,007 8,084 8,436 5,419 1,945 243Pio Duran 9,127 8,016 5,541 5,758 3,491 892 10Polangui 16,973 15,346 11,530 12,642 8,481 3,056 478Rapu-Rapu 6,933 5,353 3,614 3,184 2,393 569 20
Santo Domingo 6,887 6,354 4,554 5,123 3,430 1,274 75Tabaco City 25,329 22,002 15,418 17,314 12,340 4,682 817Tiwi 10,106 8,628 5,610 6,597 5,488 1,557 281
Camarines Norte 116,728 99,230 69,859 72,702 54,545 18,575 3,148
Basud 8,283 7,070 5,213 5,340 3,767 1,059 60Capalonga 6,627 5,161 2,726 3,222 2,699 685 15DAET 20,768 19,575 15,922 17,129 12,327 5,897 1,883Jose Panganiban 11,996 9,955 6,202 7,564 6,231 1,866 190Labo 19,810 16,714 12,412 11,134 8,600 2,781 293
Mercedes 9,959 7,974 5,526 5,733 3,987 1,192 184Paracale 11,414 9,672 5,785 7,040 5,556 1,112 29San Lorenzo Ruiz
(Imelda) 2,744 2,257 1,639 1,527 1,040 299 9San Vicente 2,230 1,944 1,431 1,415 1,060 415 10Santa Elena 8,763 7,276 4,576 4,721 3,739 1,047 159
Talisay 5,225 4,681 3,477 3,598 2,583 1,013 220Vinzons 8,909 6,952 4,948 4,278 2,954 1,208 94
Camarines Sur 364,472 308,974 232,873 231,455 160,183 57,734 17,084
Baao 10,572 9,168 6,695 7,228 4,701 1,629 700Balatan 5,482 4,608 3,330 3,004 1,852 617 56Bato 9,122 7,757 5,638 6,112 3,973 1,451 361Bombon 3,183 2,898 2,309 2,531 1,423 404 142Buhi 15,598 12,514 9,223 8,667 6,091 2,147 182
Note: Figures are based on 20-percent sample households. Details may not add up to total due to rounding off.
Source: Philippine Statistics Authority
1 - 118

Household Convenience / Devices Households Motorized without any
Cellular Personal Refrigerator/ Cooking Washing Car/Jeep/ Motorcycle/ Boat/ householdphone Computer Freezer Range Machine Van Tricycle Banca convenience/
device
688,135 79,901 262,527 146,255 153,780 42,811 189,278 57,949 176,529
171,576 23,521 73,897 39,665 37,953 11,935 46,725 6,411 31,559
7,878 790 3,143 1,356 1,374 392 1,326 896 1,8288,936 1,046 3,959 1,972 1,539 521 2,343 20 1,720
18,509 3,514 9,918 5,352 4,660 1,769 4,803 107 2,11211,128 1,384 4,754 2,317 2,538 715 3,253 46 2,233
1,691 84 522 165 178 61 294 15 631
29,532 6,661 15,624 8,208 8,475 3,329 7,820 516 2,5998,047 578 2,918 1,411 1,385 423 2,666 565 2,749
13,756 1,530 6,256 3,369 4,087 1,027 4,870 351 2,9935,220 505 1,863 1,037 861 299 954 203 8805,693 460 1,936 1,309 844 225 1,636 93 1,408
3,015 115 767 269 289 91 407 172 5458,006 763 3,276 1,852 1,732 385 2,552 316 2,2055,779 278 1,497 584 990 173 1,279 563 1,111
11,910 1,646 4,877 2,931 3,189 734 4,279 79 1,6273,041 109 649 302 113 5 118 1,002 1,580
5,063 588 1,796 877 706 279 1,101 263 53317,526 2,560 7,162 4,754 3,933 990 5,088 716 3,327
6,847 910 2,980 1,599 1,061 517 1,936 489 1,478
76,151 8,204 30,272 19,283 21,386 4,104 21,374 4,843 17,498
5,272 371 1,911 866 1,001 259 1,479 40 1,2133,560 241 1,349 774 866 100 857 654 1,466
16,728 3,635 9,536 6,614 7,661 1,508 6,280 276 1,1937,402 644 2,948 1,863 2,212 360 1,875 824 2,041
12,534 927 4,336 2,756 2,821 527 3,022 75 3,096
5,802 381 1,481 1,046 1,145 180 1,138 800 1,9857,345 391 2,377 1,698 1,477 209 1,684 444 1,742
1,726 70 427 185 178 69 364 9 4871,661 221 632 387 395 122 519 10 2865,524 349 1,790 997 1,401 316 1,227 735 1,487
3,782 430 1,484 903 1,045 143 1,299 70 5444,817 545 2,000 1,194 1,185 313 1,630 906 1,957
232,258 31,120 93,072 52,725 56,612 18,776 64,244 13,315 55,498
6,821 1,009 2,846 1,754 2,106 522 2,044 116 1,4043,047 141 797 415 525 153 741 386 8745,871 592 2,082 1,157 1,329 349 1,592 802 1,3652,082 287 762 244 615 178 532 45 2859,281 847 3,267 1,349 1,719 589 2,732 1,007 3,084
1 - 119

Table 1.23 - Continued
HOUSEHOLDS REPORTING PRESENCE OF HOUSEHOLD CONVENIENCE/DEVICESBY PROVINCE/CITY/MUNICIPALITYCensus Year 2010
Households Household Convenience / DevicesProvince/ Total with at least Radio/ Landline/
City/Municipality Number of household Radio Television CD / DVD/ Component/ WirelessHouseholds convenience/ Cassete Set VCD Player Stereo Set Telephone
device
Bula 12,855 11,411 8,976 8,835 5,126 1,679 136Cabusao 3,750 2,965 2,164 2,306 1,469 445 5Calabanga 15,603 13,382 10,391 10,425 6,897 2,340 578Camaligan 4,534 4,270 3,269 3,803 2,521 1,014 327Canaman 6,582 5,998 4,863 5,286 3,169 1,301 676
Caramoan 9,005 6,261 3,642 3,410 2,676 753 50Del Gallego 4,835 4,083 2,489 2,457 2,134 602 63Gainza 2,020 1,862 1,446 1,572 897 279 36Garchitorena 4,593 3,171 1,948 1,569 1,395 287 5Goa 11,700 9,249 6,573 5,656 4,555 1,497 331
Iriga City 21,759 19,456 15,539 16,170 11,397 4,760 2,990Lagonoy 10,374 7,669 5,120 4,848 3,794 1,162 195Libmanan 20,670 17,534 13,999 12,879 8,187 2,479 479Lupi 6,401 5,094 3,456 3,272 2,154 560 - Magarao 4,830 4,384 3,571 3,674 2,517 928 273
Milaor 5,484 4,948 4,029 4,210 2,796 830 222Minalabac 9,336 7,976 6,297 6,244 3,579 879 83Nabua 15,201 13,805 10,545 11,663 7,487 3,461 1,270Naga City 35,929 33,950 28,148 30,679 23,272 10,974 5,908Ocampo 8,587 6,651 5,075 4,907 3,338 1,058 51
Pamplona 6,839 5,792 4,105 4,155 2,612 751 73Pasacao 8,906 7,338 5,652 5,060 3,566 868 90PILI 16,193 14,448 10,988 11,771 8,597 3,458 920Presentacion 3,815 2,262 1,452 1,434 1,108 337 20Ragay 11,630 10,068 7,069 6,099 4,425 1,410 21
Sagñay 6,168 4,586 3,390 2,406 1,761 724 15San Fernando 6,529 5,719 4,611 4,281 2,673 1,046 121San Jose 7,687 6,462 4,278 4,512 3,320 1,187 89Sipocot 13,156 11,383 8,598 7,919 5,482 1,707 298Siruma 3,385 2,724 1,854 1,479 828 195 29
Tigaon 9,944 7,668 5,020 4,885 4,044 1,220 203Tinambac 12,215 9,460 7,122 6,046 4,368 1,294 86
Catanduanes 49,368 40,908 24,105 30,780 24,294 7,777 297
Bagamanoc 2,263 1,638 445 1,055 874 260 - Baras 2,566 1,982 1,274 1,538 1,282 508 - Bato 4,180 3,677 2,519 2,854 2,082 787 10Caramoran 5,295 4,100 2,114 2,484 2,228 574 5Gigmoto 1,551 1,155 277 903 810 187 -
Pandan 3,786 2,709 1,307 1,624 1,436 350 - Panganiban 1,912 1,579 514 1,065 876 350 15San Andres 7,224 6,133 4,491 4,711 3,466 1,037 16San Miguel 2,726 2,140 948 1,595 1,447 360 5Viga 3,927 2,853 901 2,161 1,720 450 -
VIRAC 13,938 12,941 9,315 10,788 8,073 2,913 245
1 - 120

Household Convenience / Devices Households Motorized without any
Cellular Personal Refrigerator/ Cooking Washing Car/Jeep/ Motorcycle/ Boat/ householdphone Computer Freezer Range Machine Van Tricycle Banca convenience/
device
8,004 426 2,845 1,570 1,662 407 2,293 368 1,4442,026 160 686 406 450 94 590 319 785
10,139 1,092 3,443 2,002 2,218 690 3,014 761 2,2213,497 661 1,657 1,004 1,120 235 1,052 51 2644,545 1,072 2,421 1,161 1,400 652 1,354 101 584
3,974 154 939 526 192 59 674 1,083 2,7443,254 211 887 461 590 81 581 283 7521,263 142 522 273 226 61 360 208 1581,838 81 477 274 177 30 170 623 1,4226,918 889 2,577 1,720 1,541 399 2,320 50 2,451
15,598 2,988 8,291 5,712 5,055 2,047 6,420 76 2,3035,563 654 1,763 1,003 976 279 1,554 748 2,705
12,977 859 4,061 2,035 2,379 557 2,315 317 3,1363,787 166 1,091 374 442 144 626 164 1,3073,626 510 1,627 1,148 1,031 288 1,117 162 446
3,793 494 1,491 706 754 268 892 201 5365,210 338 1,832 718 816 307 1,781 269 1,360
11,128 1,761 5,998 3,023 3,614 1,148 3,859 142 1,39629,716 9,380 17,400 11,986 12,665 5,175 9,395 299 1,979
4,853 357 1,684 950 844 314 1,285 5 1,936
4,437 292 1,257 739 784 143 739 64 1,0474,503 319 1,323 469 668 153 748 454 1,568
11,916 2,052 5,619 3,383 3,642 1,315 3,959 65 1,7451,243 75 449 194 105 29 183 445 1,5537,600 476 2,193 915 1,321 243 1,462 670 1,562
2,917 139 808 314 279 94 692 409 1,5824,049 451 1,482 597 842 298 971 152 8104,875 399 1,607 809 674 244 1,602 238 1,2258,244 721 2,932 1,185 1,937 455 1,303 378 1,7731,562 59 390 147 78 33 289 949 661
5,971 540 1,711 1,188 886 428 1,676 35 2,2766,134 328 1,854 813 948 313 1,328 871 2,755
31,624 3,383 12,936 6,560 8,621 1,395 11,589 2,724 8,460
1,211 62 540 263 326 21 337 268 6251,406 79 602 262 336 66 311 95 5842,842 228 1,231 713 781 124 936 176 5032,860 69 797 364 376 43 731 436 1,195
858 55 289 149 124 15 194 100 396
2,010 116 622 298 345 35 535 183 1,0771,265 96 430 272 341 51 438 244 3334,709 310 1,598 799 972 176 1,542 709 1,0911,501 98 658 516 418 67 486 10 5862,167 129 846 332 496 112 924 163 1,074
10,796 2,141 5,321 2,592 4,105 685 5,155 340 997
1 - 121

Table 1.23 - Continued
HOUSEHOLDS REPORTING PRESENCE OF HOUSEHOLD CONVENIENCE/DEVICESBY PROVINCE/CITY/MUNICIPALITYCensus Year 2010
Households Household Convenience / DevicesProvince/ Total with at least Radio/ Landline/
City/Municipality Number of household Radio Television CD / DVD/ Component/ WirelessHouseholds convenience/ Cassete Set VCD Player Stereo Set Telephone
device
Masbate 171,644 132,942 89,397 52,149 42,532 16,523 1,247
Aroroy 14,581 11,407 7,842 4,562 4,144 1,356 104Baleno 4,782 3,785 2,273 1,879 1,305 457 15Balud 7,240 5,578 3,371 2,133 1,988 621 15Batuan 2,896 2,014 1,273 964 679 172 15Cataingan 10,548 7,958 5,247 2,600 2,392 1,142 16
Cawayan 13,316 10,002 6,774 2,460 2,211 740 15Claveria 8,692 6,953 6,007 1,447 1,168 462 76Dimasalang 5,156 4,203 2,516 1,684 1,422 592 5Esperanza 3,913 2,830 1,701 798 811 369 16Mandaon 7,701 6,203 4,181 2,014 1,941 860 10
MASBATE CITY 17,058 14,546 8,236 10,093 7,121 3,181 816Milagros 10,290 7,419 4,845 2,494 2,238 799 25Mobo 6,755 5,244 3,581 2,773 2,069 774 25Monreal 5,008 3,704 2,434 1,416 1,069 438 5Palanas 5,568 4,468 2,972 1,530 1,355 560 5
Pio V. Corpuz 5,338 4,059 2,746 1,566 1,563 587 10Placer 11,433 8,545 6,164 2,336 1,980 684 30San Fernando 4,765 3,826 2,703 1,905 1,340 583 15San Jacinto 6,530 5,330 4,184 2,415 1,711 665 - San Pascual 9,183 6,673 5,294 1,598 1,140 352 -
Uson 10,891 8,197 5,055 3,482 2,887 1,128 31
Sorsogon 153,869 129,057 89,543 91,555 63,435 21,843 1,839
Barcelona 4,651 4,116 2,645 2,784 1,836 614 9Bulan 19,582 16,402 11,294 11,789 7,710 3,160 316Bulusan 4,900 3,856 1,771 2,568 1,912 527 5Casiguran 6,410 5,511 4,089 3,800 2,530 769 37Castilla 11,022 9,397 6,825 6,240 3,892 1,325 5
Donsol 9,397 7,331 4,999 5,139 2,991 886 20Gubat 12,710 10,689 7,676 7,632 5,448 1,831 379Irosin 10,447 8,743 5,756 6,213 4,740 1,562 92Juban 6,025 4,712 3,052 3,167 2,118 692 35Magallanes 7,187 6,019 4,323 3,720 2,511 831 5
Matnog 7,481 5,589 3,088 3,485 2,873 652 15Pilar 13,727 10,905 7,885 7,399 4,388 1,354 19Prieto Diaz 4,219 3,368 1,747 2,344 1,836 501 10Santa Magdalena 3,417 2,587 1,692 1,734 1,465 395 63SORSOGON CITY 32,694 29,833 22,701 23,541 17,185 6,742 828
1 - 122

Household Convenience / Devices Households Motorized without any
Cellular Personal Refrigerator/ Cooking Washing Car/Jeep/ Motorcycle/ Boat/ householdphone Computer Freezer Range Machine Van Tricycle Banca convenience/
device
79,208 4,770 18,485 8,961 9,384 2,436 21,565 19,497 38,702
5,870 299 1,141 820 767 242 1,898 1,639 3,1742,691 119 638 175 338 20 596 314 9972,920 87 661 260 398 56 1,014 1,394 1,6621,167 47 260 76 91 5 312 442 8825,221 432 1,181 722 601 161 1,122 515 2,590
4,897 172 772 225 316 92 1,490 2,402 3,3143,224 135 346 256 181 40 677 1,599 1,7392,945 146 625 692 309 78 440 523 9531,872 77 226 95 81 24 410 562 1,0834,213 186 728 383 497 59 1,115 1,108 1,498
10,603 1,645 4,630 2,178 3,105 807 3,937 972 2,5124,352 164 852 451 348 80 1,068 1,164 2,8713,209 228 1,017 386 337 106 970 287 1,5111,800 56 400 181 140 26 402 900 1,3042,948 161 598 309 207 134 619 285 1,100
2,448 74 460 287 123 64 644 677 1,2795,093 160 783 396 314 120 1,195 1,297 2,8882,617 105 639 313 349 20 754 590 9393,059 230 992 157 222 50 1,116 470 1,2002,729 54 206 164 88 30 543 1,760 2,510
5,327 191 1,330 436 573 223 1,241 598 2,694
97,318 8,903 33,865 19,061 19,824 4,165 23,781 11,159 24,812
2,957 221 1,006 556 600 161 888 292 53511,980 1,058 4,028 1,987 2,861 411 3,426 2,067 3,180
3,106 240 1,068 553 441 155 459 307 1,0444,131 226 1,000 591 588 167 832 456 8996,852 288 1,682 671 702 171 1,426 967 1,625
4,659 300 1,393 899 811 170 1,124 750 2,0668,136 854 3,148 1,480 2,045 387 1,849 399 2,0217,142 683 2,401 1,515 1,198 280 1,989 - 1,7043,490 194 1,012 519 508 112 816 416 1,3134,310 302 1,227 497 774 133 789 1,400 1,168
4,074 223 1,197 593 577 100 668 1,110 1,8927,523 417 2,133 964 748 187 1,329 1,151 2,8222,677 115 779 403 669 101 521 316 8512,007 151 679 362 521 67 398 91 830
24,275 3,630 11,112 7,472 6,781 1,562 7,266 1,438 2,861
1 - 123

Table 1.24 HOUSEHOLDS BY USUAL MANNER OF GARBAGE DISPOSAL AND PROVINCE/CITY/MUNICIPALITYCensus Year 2010
Total Usual Manner of Garbage DisposalProvince/ Number of Picked up Dumping in Feeding
City/Municipality Households by garbage individual pit Burning Composting Burying to Otherstruck (not burned) animals
Region V 1,111,753 232,021 116,621 413,653 53,196 47,631 244,106 4,523
Albay 255,672 71,215 33,179 85,077 18,741 14,227 32,140 1,093
Bacacay 13,530 870 2,633 4,224 1,643 1,784 2,371 5Camalig 13,564 2,451 1,170 5,941 1,524 1,110 1,265 102Daraga 24,923 9,548 3,140 7,011 1,116 935 3,163 10Guinobatan 16,607 2,975 2,748 4,918 1,787 575 3,447 157Jovellar 3,555 10 490 1,474 270 230 1,080 -
LEGAZPI CITY 38,398 19,880 3,758 6,919 1,641 1,592 4,455 153Libon 14,552 1,491 1,314 7,403 2,222 1,184 869 68Ligao City 21,140 6,352 3,002 7,087 705 1,369 2,558 67Malilipot 7,366 411 1,102 1,406 472 384 3,502 90Malinao 8,760 210 1,219 5,563 982 408 240 139
Manito 4,710 10 730 1,714 273 303 1,675 5Oas 13,212 1,369 2,101 6,882 956 1,316 563 25Pio Duran 9,127 1,609 640 5,491 288 523 561 15Polangui 16,973 4,968 2,913 5,621 1,901 517 1,028 25Rapu-Rapu 6,933 39 2,550 2,881 577 752 35 98
Santo Domingo 6,887 3,189 324 1,547 259 315 1,226 26Tabaco City 25,329 14,338 1,747 4,537 1,567 591 2,460 88Tiwi 10,106 1,493 1,598 4,458 556 339 1,642 20
Camarines Norte 116,728 26,589 16,920 54,232 6,365 5,633 6,617 371
Basud 8,283 721 1,751 4,133 1,169 282 203 25Capalonga 6,627 741 857 4,406 179 425 - 19DAET 20,768 10,793 2,365 6,116 556 790 108 40Jose Panganiban 11,996 3,544 801 6,056 637 693 250 15Labo 19,810 2,879 4,451 9,969 1,694 545 197 75
Mercedes 9,959 1,939 1,438 1,462 223 501 4,338 58Paracale 11,414 3,022 1,334 5,210 565 390 878 15San Lorenzo Ruiz
(Imelda) 2,744 10 352 1,628 287 427 40 - San Vicente 2,230 275 792 1,030 70 63 - - Santa Elena 8,763 1,197 551 6,226 278 511 - -
Talisay 5,225 139 972 3,420 236 428 - 29Vinzons 8,909 1,329 1,256 4,575 472 577 603 95
Camarines Sur 364,472 75,082 27,037 189,431 14,386 14,851 42,376 1,309
Baao 10,572 2,413 488 6,430 419 357 440 25Balatan 5,482 95 403 3,556 539 373 517 - Bato 9,122 1,737 779 3,970 158 411 2,058 10Bombon 3,183 865 203 140 55 40 1,880 - Buhi 15,598 3,582 1,346 8,542 899 762 453 15
Note: Figures are based on 20-percent sample households. Details may not add up to total due to rounding off.
Source: Philippine Statistics Authority
1 - 124

Table 1.24 - Continued
HOUSEHOLDS BY USUAL MANNER OF GARBAGE DISPOSAL AND PROVINCE/CITY/MUNICIPALITYCensus Year 2010
Total Usual Manner of Garbage DisposalProvince/ Number of Picked up Dumping in Feeding
City/Municipality Households by garbage individual pit Burning Composting Burying to Otherstruck (not burned) animals
Bula 12,855 889 572 9,159 530 302 1,398 5Cabusao 3,750 10 369 2,107 286 383 380 216Calabanga 15,603 3,707 1,063 7,120 568 1,176 1,899 71Camaligan 4,534 286 147 1,509 130 159 2,275 29Canaman 6,582 2,461 345 3,400 174 138 45 20
Caramoan 9,005 686 768 6,175 330 276 765 5Del Gallego 4,835 1,097 95 3,158 307 173 5 - Gainza 2,020 - 266 1,424 152 69 15 94Garchitorena 4,593 362 450 2,240 252 265 994 31Goa 11,700 2,437 1,138 6,538 521 910 150 6
Iriga City 21,759 6,027 1,469 12,016 1,099 717 430 - Lagonoy 10,374 398 1,952 5,868 647 559 810 140Libmanan 20,670 1,607 1,560 15,701 531 914 321 35Lupi 6,401 376 1,027 4,771 116 65 5 41Magarao 4,830 211 359 145 288 341 3,470 16
Milaor 5,484 87 600 3,906 156 425 275 36Minalabac 9,336 44 339 8,117 122 143 566 5Nabua 15,201 1,191 1,141 10,860 908 453 633 15Naga City 35,929 29,982 825 3,625 410 166 896 25Ocampo 8,587 933 352 6,809 151 75 263 5
Pamplona 6,839 35 505 3,370 345 103 2,447 34Pasacao 8,906 1,893 738 5,199 326 727 19 5PILI 16,193 4,211 1,090 8,338 745 632 1,113 64Presentacion 3,815 19 519 2,098 150 295 704 29Ragay 11,630 2,517 1,433 2,222 369 791 4,248 51
Sagñay 6,168 1,115 182 4,006 463 102 299 - San Fernando 6,529 139 851 4,841 180 349 142 26San Jose 7,687 30 903 2,306 300 611 3,477 60Sipocot 13,156 1,317 735 8,539 492 292 1,732 48Siruma 3,385 - 199 1,794 139 238 919 96
Tigaon 9,944 960 491 6,431 410 229 1,397 25Tinambac 12,215 1,364 1,337 2,999 722 831 4,938 25
Catanduanes 49,368 9,164 5,084 10,724 2,328 1,081 20,536 450
Bagamanoc 2,263 620 93 555 224 63 639 70Baras 2,566 76 608 953 135 91 697 5Bato 4,180 1,778 323 1,232 39 74 734 - Caramoran 5,295 10 450 873 98 35 3,656 173Gigmoto 1,551 138 92 247 144 144 785 -
Pandan 3,786 34 289 196 35 21 3,197 14Panganiban 1,912 460 326 543 160 24 400 - San Andres 7,224 677 1,057 1,718 603 236 2,891 42San Miguel 2,726 10 615 745 453 26 824 53Viga 3,927 358 371 759 138 137 2,160 5
VIRAC 13,938 5,002 860 2,903 299 230 4,555 88
1 - 125

Table 1.24 - Continued
HOUSEHOLDS BY USUAL MANNER OF GARBAGE DISPOSAL AND PROVINCE/CITY/MUNICIPALITYCensus Year 2010
Total Usual Manner of Garbage DisposalProvince/ Number of Picked up Dumping in Feeding
City/Municipality Households by garbage individual pit Burning Composting Burying to Otherstruck (not burned) animals
Masbate 171,644 10,725 11,568 8,561 4,036 2,823 133,069 862
Aroroy 14,581 664 297 493 253 95 12,770 10Baleno 4,782 233 276 70 370 26 3,807 - Balud 7,240 40 115 40 121 102 6,812 10Batuan 2,896 168 131 10 - 20 2,567 - Cataingan 10,548 595 812 939 611 133 7,374 84
Cawayan 13,316 388 1,267 1,280 324 437 9,574 46Claveria 8,692 235 637 212 90 304 7,215 - Dimasalang 5,156 347 702 627 143 191 3,078 68Esperanza 3,913 270 363 410 20 104 2,727 19Mandaon 7,701 38 247 283 45 96 6,977 15
MASBATE CITY 17,058 4,597 702 124 121 50 11,338 126Milagros 10,290 88 202 152 95 66 9,657 29Mobo 6,755 448 504 372 87 222 5,118 5Monreal 5,008 35 207 278 30 40 4,412 5Palanas 5,568 285 550 725 71 84 3,815 39
Pio V. Corpuz 5,338 175 419 262 294 139 3,952 97Placer 11,433 735 1,441 331 946 272 7,691 16San Fernando 4,765 69 44 56 - 15 4,581 - San Jacinto 6,530 915 424 169 29 46 4,894 54San Pascual 9,183 344 1,192 664 221 196 6,542 24
Uson 10,891 55 1,036 1,063 165 186 8,170 215
Sorsogon 153,869 39,246 22,833 65,628 7,340 9,016 9,368 438
Barcelona 4,651 750 786 2,743 122 239 11 - Bulan 19,582 6,038 3,306 6,343 590 1,370 1,788 148Bulusan 4,900 67 1,295 1,926 139 941 532 - Casiguran 6,410 1,095 1,132 3,248 485 270 166 15Castilla 11,022 961 1,129 6,988 436 315 1,192 -
Donsol 9,397 1,346 1,227 4,712 749 602 714 47Gubat 12,710 3,026 1,709 6,200 189 1,167 420 - Irosin 10,447 2,255 2,485 3,828 614 595 670 - Juban 6,025 473 1,350 3,352 365 224 261 - Magallanes 7,187 924 1,382 2,741 477 1,405 253 5
Matnog 7,481 490 1,037 4,371 222 639 646 76Pilar 13,727 1,734 1,238 8,298 1,254 379 794 31Prieto Diaz 4,219 95 983 1,495 336 230 1,080 - Santa Magdalena 3,417 843 798 1,471 64 74 162 5SORSOGON CITY 32,694 19,150 2,978 7,910 1,299 566 680 111
1 - 126

Table 1.25 HUMAN DEVELOPMENT INDEX BY COMPONENT AND PROVINCE2000 - 2012
Human Life Mean Expected Real Per Life Education IncomeProvince Develop- Expectancy Years of Years of Capita Expectancy Index Index
ment Index at Birth Schooling Schooling Income Index(HDI) (years) (pesos)
2000
Albay 0.474 68.7 7.9 12.3 32,662 0.770 0.822 0.168Camarines Norte 0.436 62.9 8.0 11.5 31,270 0.679 0.800 0.152Camarines Sur 0.451 69.8 7.5 10.8 31,525 0.788 0.749 0.155Catanduanes 0.433 64.5 7.9 13.0 29,951 0.704 0.844 0.137Masbate 0.306 63.8 6.0 11.0 23,284 0.693 0.679 0.061Sorsogon 0.446 68.0 7.4 12.6 30,634 0.760 0.802 0.145
2003
Albay 0.490 70.3 8.3 12.2 33,346 0.796 0.838 0.176Camarines Norte 0.448 63.8 8.2 12.4 31,494 0.693 0.837 0.155Camarines Sur 0.456 71.4 7.4 11.8 31,052 0.814 0.776 0.150Catanduanes 0.666 65.6 7.6 12.5 62,086 0.721 0.811 0.505Masbate 0.407 64.9 6.5 11.3 29,640 0.710 0.711 0.134Sorsogon 0.483 69.9 7.5 12.3 33,540 0.790 0.801 0.178
2006
Albay 0.531 72.0 8.1 12.3 37,016 0.822 0.833 0.218Camarines Norte 0.445 64.6 8.0 10.8 32,023 0.706 0.775 0.161Camarines Sur 0.436 73.0 8.2 11.8 28,455 0.839 0.821 0.120Catanduanes 0.463 66.7 7.8 11.8 32,628 0.739 0.799 0.168Masbate 0.372 66.0 7.1 11.9 26,030 0.728 0.768 0.092Sorsogon 0.435 71.8 7.7 12.1 28,869 0.819 0.805 0.125
2009
Albay 0.498 73.6 8.5 12.5 32,795 0.848 0.858 0.170Camarines Norte 0.469 65.5 8.1 10.9 33,903 0.720 0.786 0.182Camarines Sur 0.491 74.6 8.2 11.7 32,702 0.864 0.814 0.169Catanduanes 0.606 67.8 8.5 12.1 48,545 0.756 0.841 0.350Masbate 0.406 67.1 7.1 11.5 28,393 0.745 0.754 0.119Sorsogon 0.492 73.7 7.8 12.4 32,942 0.849 0.820 0.171
2012
Albay 0.541 75.2 8.8 12.5 36,162 0.850 0.872 0.214Camarines Norte 0.518 66.4 8.9 11.8 37,484 0.713 0.850 0.229Camarines Sur 0.540 76.2 8.8 12.5 35,763 0.865 0.870 0.209Catanduanes 0.513 68.9 9.8 12.8 34,388 0.752 0.929 0.194Masbate 0.422 68.2 7.2 11.5 29,054 0.742 0.757 0.134Sorsogon 0.505 75.5 8.7 12.7 32,499 0.854 0.873 0.173
Source: Human Development Network (HDN)United Nations Development Programme (UNDP)Philippine Statistics Authority
1 - 127

Figure 1.8 DISTRIBUTION OF HOUSEHOLDS BY MAIN SOURCE OF WATER SUPPLYFOR DRINKING, REGION V, CENSUS YEAR 2015
Note: Others include Unprotected spring, Lake, river, rain and others, and Peddler
Figure 1.9 DISTRIBUTION OF HOUSEHOLDS BY USUAL MANNER OF GARBAGE DISPOSALREGION V, CENSUS YEAR 2010
Own use faucet community water
system22.4%
Shared faucet community water
system22.0%
Shared tubed/piped deep well
16.7%
Bottled water9.9%
Dug well9.5%
Own use tubed/piped deep
well6.7%
Protected spring5.4%
Others5.2%
Tubed/piped shallow well
2.2%
Burning37.2%
Dumping in individual pit(not burned)
10.5%
Picked up by garbage truck
20.9%
Dumping in individual pit (not
burned)10.5%
Composting4.8%
Burying4.3%
Others0.4%
1 - 128

2 - 1
Data on the levels and patterns of family income and expenditure, poverty incidence and threshold and price indices are vital indicators of the socioeconomic status of the people. Specifically, these data provide a picture of the standard of living, the varying degrees of inequality, the purchasing capacity, and the demand for goods and services of families. The data are essential in the conceptualization and assessment of poverty alleviation programs of government, private and non-government organizations. The data have become more significant to all sectors now that genuine efforts are being demonstrated in pursuing the social reform agenda. The trends, patterns and signals shown by the data have been given wide and serious attention due to the far reaching ramifications on policies and programs aimed at people empowerment. The usage of the data has accordingly permeated all echelons of the government bureaucracy, private businesses and even ordinary citizens themselves. With the support provided by the data, interventions can be implemented to help the citizenry respond to situations brought about by the increased prices and incidence of poverty and low income capacity, among others. This chapter presents data for the region and by province pertaining to family income, expenditures and consumer price indices. Several indicators derived from these basic data such as poverty incidence and threshold, inflation rate and purchasing power of the peso are also presented in this chapter. The income, expenditures and price data are generated from the results of the Family Income and Expenditures Survey (FIES) and price surveys of the Philippine Statistics Authority (PSA). The poverty statistics, on the other hand, are computed by the Technical Working Group on Income Statistics of the PSA using the results of the FIES. Sector Highlights Average family income in the Bicol Region increased by 25.7 percent between 2015 and 2018,
based on the results of the 2018 Family Income and Expenditures Survey. Average family expenditure, on the other hand, rose by 20.6 percent.
Families in the PhP60,000 – PhP99,999 income bracket recorded a big drop from about 269
thousand families in 2015 to about 166 thousand families in 2018. On the contrary, families in the PhP100,000.00 – PhP249,999 income bracket rose from about 666 thousand families in 2015 to about 734 thousand families in 2018. In 2018, income class PhP250,000 and over was further classified into PhP250,000 – PhP499,999 income bracket and PhP500,000 and over income bracket.
The upper 30 percent of families in the Bicol Region retained its share at 53.3 percent of the total
family income in 2018. Income equality slightly increased from a Gini ratio of 0.3960 in 2015 to 0.3967 in 2018.
Majority of families in Bicol Region in 2018 derived their incomes from multiple sources.
Families with income sourced from wages and salaries accounted for 47.9 percent. Food remained the biggest expenditure item of families, accounting for 47.0 percent of total family
expenditures in 2018. For families in the under PhP40,000 income bracket, food took up 62.7 percent of total family expenditure.
A Bicolano, on the average, needed PhP24,461 in 2018 to be considered non-poor. The 2018
incidence of poor families dropped to 20.0 percent from 31.0 percent in 2015.
Annual Inflation Rate in the Bicol Region averaged 4.2 percent in 2020 with the highest recorded in December at 6.6 percent and the lowest in May at 3.0 percent.
Chapter 2 INCOME AND PRICES

Table 2.1 Total Number of Families, Total and Average Family Income andExpenditure by Region, 2009, 2012, 2015 and 2018 2 - 4
Table 2.2 Total Number of Families, Total and Average Family Income andExpenditure by Income Class, Region V, 2009, 2012, 2015 and 2018 2 - 6
Table 2.3 Total Number of Families, Total and Average Family Income andExpenditure by Expenditure Class, Region V, 2009, 2012, 2015 and 2018 2 - 7
Table 2.4A Total Number of Families, Average Income and Expenditure by FamilySize and Income Class, Region V, 2006 and 2009 2 - 8
Table 2.4B Total Number of Families, Average Income and Expenditure by FamilySize and Income Class, Region V, 2012 and 2015 2 - 10
Table 2.4C Total Number of Families, Average Income and Expenditure by FamilySize and Income Class, Region V, 2018 2 - 11
Table 2.5 Average Annual Family Income and Expenditure, Standard Error andCoefficient of Variation by Province, 2009 and 2012 2 - 12
Table 2.6 Mean and Median Family Income and Expenditure by Income Decile,Region V, 2009, 2012, 2015 and 2018 2 - 13
Table 2.7 Distribution of Total Annual Family Income by Decile and Gini RatioRegion V, 2009, 2012, 2015 and 2018 2 - 14
Table 2.8 Total Number of Families by Main Source of Income and Income Class,Region V, 2009, 2012, 2015 and 2018 2 - 15
Table 2.9A Distribution of Total Family Expenditure by Expenditure Group andIncome Class, Region V, 2006 and 2009 2 - 17
Table 2.9B Distribution of Total Family Expenditure by Expenditure Group andIncome Class, Region V, 2012 2 - 19
Table 2.9C Distribution of Total Family Expenditure by Expenditure Group andIncome Class, Region V, 2015 2 - 20
Table 2.9D Distribution of Total Family Expenditure by Expenditure Group andIncome Class, Region V, 2018 2 - 21
Table 2.10A Annual Per Capita Poverty Thresholds and Poverty Incidence Among Families and Population by Province, 2012, 2015 and 2018 2 - 22
Table 2.10B Annual Per Capita Food Thresholds and Subsistence Incidence Among Families and Population by Province, 2012, 2015 and 2018 2 - 22
Table 2.11 Poverty Incidence for the Basic Sectors, Region V, 2012, 2015 and 2018 2 - 23
Table 2.12A Consumer Price Index, Inflation Rate and Purchasing Power of the PesoFor All Income Households by Month and Province, 2014 - 2020 2 - 24
Table 2.12B Consumer Price Index For All Income Households by Month andProvince, 2020 2 - 28
2 - 2

Figure 2.1 Total Number of Families, Average Income and Expenditure by Income ClassRegion V, 2018 2 - 11
Figure 2.2 Average Annual Family Income and Expenditure by Province, Region V, 2018 2 - 12
Figure 2.3 Distribution of Total Family Income by Income Decile, Region V2015 and 2018 2 - 14
Figure 2.4 Distribution of Total Family Expenditure by Expenditure GroupRegion V, 2018 2 - 16
Figure 2.5 Total Family Expenditure by Income Class, Region V, 2012, 2015 and 2018 2 - 16
Figure 2.6 Consumer Price Index and Inflation Rate by Province, 2020 2 - 31
Figure 2.7 Consumer Price Index and Inflation Rate, Region V, 2014 - 2020 2 - 32
Figure 2.8 Annual Poverty Incidence of Families by Province, 2012, 2015 and 2018 2 - 32
2 - 3

Table 2.1TOTAL NUMBER OF FAMILIES, TOTAL AND AVERAGE FAMILY INCOME AND EXPENDITUREBY REGION2009, 2012, 2015 AND 2018(Total Number of Families in Thousands; Totals in Million Pesos; Averages in Thousand Pesos)
Total Number Income Expenditureof Families Total Average Total Average
2009
Philippines 18,452 3,804,325 206 3,239,186 176
NCR 2,461 876,564 356 760,363 309CAR 322 70,454 219 56,182 175Ilocos 1,005 187,342 186 152,646 152Cagayan Valley 653 118,187 181 92,306 141Central Luzon 2,028 448,001 221 382,492 189Calabarzon 2,406 598,038 249 511,515 213Mimaropa 590 83,374 141 71,121 121Bicol 1,070 162,567 152 146,595 137Western Visayas 1,452 231,473 159 207,669 143Central Visayas 1,374 252,424 184 208,641 152Eastern Visayas 865 138,599 160 110,885 128Zamboanga Peninsula 662 95,410 144 76,598 116Northern Mindanao 839 138,259 165 116,690 139Davao 884 146,292 166 125,043 142Soccsksargen 801 123,067 154 105,539 132Caraga 470 69,864 149 58,951 125ARMM 572 64,412 113 55,950 98
2012
Philippines 21,426 5,026,798 235 4,125,312 193
NCR 2,917 1,106,169 379 947,599 325CAR 375 96,351 257 70,633 188Ilocos 1,105 225,050 204 175,220 159Cagayan Valley 771 150,089 195 107,884 140Central Luzon 2,386 618,893 259 503,995 211Calabarzon 3,082 876,006 284 748,129 243Mimaropa 638 114,117 179 88,215 138Bicol 1,165 189,185 162 167,256 144Western Visayas 1,604 324,028 202 260,971 163Central Visayas 1,577 329,415 209 258,635 164Eastern Visayas 902 149,493 166 118,998 132Zamboanga Peninsula 772 124,903 162 93,829 122Northern Mindanao 976 185,015 190 139,353 143Davao 1,078 209,405 194 167,651 156Soccsksargen 988 160,674 163 138,089 140Caraga 532 95,809 180 75,352 142ARMM 557 72,196 130 63,506 114
Source: Family Income and Expenditure SurveyPhilippine Statistics Authority
Year / Region
2 - 4

Table 2.1 - Continued
TOTAL NUMBER OF FAMILIES, TOTAL AND AVERAGE FAMILY INCOME AND EXPENDITUREBY REGION2009, 2012, 2015 AND 2018(Total Number of Families in Thousands; Totals in Million Pesos; Averages in Thousand Pesos)
Total Number Income Expenditureof Families Total Average Total Average
Year / Region
2015
Philippines 22,730 6,068,162 267 4,882,860 215
NCR 3,019 1,282,823 425 1,053,215 349CAR 402 113,531 282 84,004 209Ilocos 1,170 278,515 238 212,525 182Cagayan Valley 816 193,589 237 132,063 162Central Luzon 2,507 750,054 299 600,095 239Calabarzon 3,251 1,013,942 312 875,400 269Mimaropa 697 154,612 222 111,907 161Bicol 1,262 236,476 187 202,469 160Western Visayas 1,699 384,039 226 299,808 176Central Visayas 1,672 399,734 239 323,434 193Eastern Visayas 976 191,720 197 151,994 156Zamboanga Peninsula 824 156,872 190 118,758 144Northern Mindanao 1,029 227,998 221 166,005 161Davao 1,156 285,560 247 219,680 190Soccsksargen 1,055 198,438 188 170,863 162Caraga 579 114,745 198 92,243 159ARMM 616 85,514 139 68,397 111
2018
Philippines 24,747 7,754,486 313 5,905,688 239
NCR 3,318 1,527,770 460 1,223,445 369CAR 422 149,519 354 97,290 230Ilocos 1,213 348,097 287 248,059 205Cagayan Valley 853 225,945 265 148,503 174Central Luzon 2,783 929,598 334 752,116 270Calabarzon 3,760 1,444,429 384 1,145,420 305Mimaropa 737 189,684 257 128,792 175Bicol 1,280 300,778 235 247,626 193Western Visayas 1,832 486,534 266 370,758 202Central Visayas 1,839 566,572 308 375,362 204Eastern Visayas 1,059 239,889 227 189,091 179Zamboanga Peninsula 839 191,059 228 136,256 162Northern Mindanao 1,120 280,508 250 195,666 175Davao 1,284 344,108 268 243,347 189Soccsksargen 1,131 273,827 242 205,013 181Caraga 619 150,299 243 115,659 187ARMM 657 105,870 161 83,284 127
2 - 5

Table 2.2TOTAL NUMBER OF FAMILIES, TOTAL AND AVERAGE FAMILY INCOME AND EXPENDITUREBY INCOME CLASS, REGION V2009, 2012, 2015 AND 2018(Number of Families in Thousands; Totals in Million Pesos; Averages in Thousand Pesos)
Total Number Income Expenditureof Families Total Average Total Average
2009Region V 1,070 162,567 152 146,595 137
Under 40,000 45 1,357 30 1,444 3240,000 - 59,999 130 6,634 51 7,194 5560,000 - 99,999 353 28,425 81 29,565 84100,000 - 249,999 396 58,792 148 56,223 142250,000 and over 145 67,361 465 52,170 360
2012Region V 1,165 189,185 162 167,256 144
Under 40,000 44 1,259 29 1,422 3240,000 - 59,999 111 5,680 51 5,947 5460,000 - 99,999 357 28,925 81 29,427 82100,000 - 249,999 477 70,562 148 66,072 138250,000 and over 175 82,760 472 64,387 367
2015Region V 1,262 236,476 187 202,469 160
Under 40,000 25 783 32 783 3240,000 - 59,999 66 3,350 50 3,300 5060,000 - 99,999 269 22,288 83 22,222 83100,000 - 249,999 666 101,328 152 93,758 141250,000 and over 236 108,728 462 82,406 350
2018Region V 1,280 300,778 235 247,626 193
Under 40,000 8 266 32 274 3340,000 - 59,999 36 1,871 52 1,877 5260,000 - 99,999 166 13,622 82 13,501 82100,000 - 249,999 734 119,120 162 109,773 149250,000 - 499,999 235 78,918 336 64,145 273500,000 and over 101 86,980 863 58,055 576
Note: Details may not add up to totals due to rounding.
Source: Family Income and Expenditure SurveyPhilippine Statistics Authority
Income Class
2 - 6

Table 2.3TOTAL NUMBER OF FAMILIES, TOTAL AND AVERAGE FAMILY INCOME AND EXPENDITUREBY EXPENDITURE CLASS, REGION V2009, 2012, 2015 AND 2018(Number of Families in Thousands; Totals in Million Pesos; Averages in Thousand Pesos)
Total Number Income Expenditureof Families Total Average Total Average
2009Region V 1,070 162,567 152 146,595 137
Under 40,000 … 1,525 32 1,451 3140,000 - 59,999 … 5,795 53 5,628 5160,000 - 99,999 … 29,705 82 29,289 80100,000 - 249,999 … 68,925 158 64,071 147250,000 and over … 56,618 503 46,155 410
2012Region V 1,165 189,185 162 167,256 144
Under 40,000 … 1,399 31 1,380 3140,000 - 59,999 … 5,941 54 5,631 5160,000 - 99,999 … 31,109 84 29,840 81100,000 - 249,999 … 81,847 162 74,099 147250,000 and over … 68,889 507 56,305 415
2015Region V 1,262 236,476 187 202,469 160
Under 40,000 … 896 34 800 3040,000 - 59,999 … 3,833 53 3,577 5060,000 - 99,999 … 27,279 89 25,072 82100,000 - 249,999 … 115,863 169 102,913 150250,000 and over … 88,605 511 70,107 404
2018Region V 1,280 300,778 235 247,626 193
Under 40,000 … 426 37 365 3240,000 - 59,999 … 2,702 59 2,367 5260,000 - 99,999 … 18,191 93 16,194 83100,000 - 249,999 … 142,158 182 123,672 159250,000 - 499,999 … 82,140 419 64,921 332500,000 and over … 55,161 1,039 40,105 756
Note: Details may not add up to totals due to rounding.
Source: Family Income and Expenditure SurveyPhilippine Statistics Authority
Expenditure Class
2 - 7

Table 2.4ATOTAL NUMBER OF FAMILIES, AVERAGE INCOME AND EXPENDITURE BY FAMILY SIZE ANDINCOME CLASS, REGION V2006 AND 2009(Average Income and Expenditure in Pesos)
2006Income Class
All Income Under 40,000 - 60,000 - 100,000 -Class 40,000 59,999 99,999 249,999
Region VNumber of Families 1,010 113 205 329 267Average Income 126,422 3,472 10,343 25,860 40,327Average Expenditure 111,590 3,940 10,883 25,736 37,102
One PersonNumber of Families 38 21 7 6 2Average Income 2,428 510 341 410 312Average Expenditure 2,135 513 304 350 265
Two PersonsNumber of Families 86 26 27 14 12Average Income 11,124 762 1,351 1,110 2,073Average Expenditure 7,696 848 1,362 1,057 1,825
Three PersonsNumber of Families 118 21 31 27 27Average Income 13,621 697 1,552 2,181 4,292Average Expenditure 11,682 764 1,583 1,968 3,677
Four PersonsNumber of Families 169 16 38 50 45Average Income 22,673 532 1,914 3,906 7,096Average Expenditure 19,806 629 2,039 3,896 6,726
Five PersonsNumber of Families 164 13 28 65 42Average Income 19,508 454 1,472 4,967 6,196Average Expenditure 17,796 540 1,574 4,957 5,804
Six PersonsNumber of Families 145 11 26 54 41Average Income 17,671 374 1,301 4,282 6,249Average Expenditure 16,489 470 1,378 4,308 5,626
Seven PersonsNumber of Families 117 2 24 41 37Average Income 16,091 74 1,194 3,145 5,451Average Expenditure 14,522 100 1,308 3,187 5,125
Eight PersonsNumber of Families 78 1 13 33 24Average Income 9,986 48 687 2,689 3,633Average Expenditure 9,457 52 743 2,718 3,562
Nine PersonsNumber of Families 48 - 5 22 15Average Income 6,564 - 280 1,803 2,271Average Expenditure 5,833 - 306 1,845 1,965
Ten PersonsNumber of Families 47 1 5 17 20Average Income 6,756 21 252 1,366 2,754Average Expenditure 6,175 24 287 1,449 2,527
Note: Details may not add up to totals due to rounding.
Source: Family Income and Expenditure Survey Philippine Statistics Authority
Family Size
2 - 8

2009Income Class
250,000 All Income Under 40,000 - 60,000 - 100,000 - 250,000and over Class 40,000 59,999 99,999 249,999 and over
95 1,070 45 130 353 396 14546,420 162,567 1,357 6,634 28,425 58,792 67,36133,929 146,595 1,444 7,194 29,565 56,223 52,170
2 37 14 12 5 5 1855 2,771 350 580 349 874 619702 2,401 344 556 338 720 443
6 105 17 25 32 19 125,828 11,764 511 1,215 2,392 2,850 4,7972,605 9,997 558 1,241 2,223 2,447 3,529
11 131 7 25 39 42 184,899 19,029 234 1,286 3,039 6,231 8,2393,690 15,972 244 1,319 2,994 5,602 5,813
20 163 4 26 57 54 239,226 24,869 121 1,392 4,517 8,232 10,6066,515 22,051 135 1,511 4,452 7,726 8,226
15 190 2 19 67 78 236,419 29,591 68 997 5,437 11,628 11,4604,922 26,708 75 1,149 5,738 11,060 8,686
14 156 2 10 62 58 235,465 23,118 56 524 5,158 8,581 8,7994,707 22,407 67 622 5,519 8,543 7,656
13 125 - 8 42 54 216,226 24,170 - 418 3,424 7,865 12,4624,802 21,857 - 527 3,750 7,788 9,792
6 79 * 3 26 39 102,928 12,767 17 168 2,131 5,800 4,6512,382 11,850 21 204 2,337 5,924 3,364
5 39 - 1 13 21 52,209 6,779 - 54 1,043 3,004 2,6771,716 6,311 - 64 1,145 2,752 2,350
4 43 - - 11 25 82,364 7,709 - - 932 3,727 3,0501,887 7,040 - - 1,068 3,661 2,311
2 - 9

Table 2.4BTOTAL NUMBER OF FAMILIES, AVERAGE INCOME AND EXPENDITURE BY FAMILY SIZE ANDINCOME CLASS, REGION V2012 AND 2015(Number of Families in Thousands; Average Income and Expenditure in Thousand Pesos)
Income ClassAll Income Under 40,000 - 60,000 - 100,000 - 250,000
Class 40,000 59,999 99,999 249,999 and over
2012Number of Families 1,165 44 111 357 477 175Average Income 162 29 51 81 148 472Average Expenditure 144 32 54 82 138 367
Five Persons or less
Average Income 153 29 51 80 147 474Average Expenditure 132 32 53 79 134 357
Six Persons or more
Average Income 176 32 55 83 149 468Average Expenditure 161 51 60 88 142 382
2015Number of Families 1,262 25 66 269 666 236Average Income 187 32 50 83 152 462Average Expenditure 160 32 50 83 141 350
Five Persons or less
Average Income 178 32 50 82 148 471Average Expenditure 149 31 49 80 133 350
Six Persons or more
Average Income 203 32 54 86 157 447Average Expenditure 179 42 55 92 149 350
Note: Details may not add up to totals due to rounding.
Source: Family Income and Expenditure Survey Philippine Statistics Authority
Family Size
2 - 10

Table 2.4CTOTAL NUMBER OF FAMILIES, AVERAGE INCOME AND EXPENDITURE BY FAMILY SIZE ANDINCOME CLASS, REGION V2018(Number of Families in Thousands; Average Income and Expenditure in Thousand Pesos)
Income ClassAll Income Under 40,000 - 60,000 - 100,000 - 250,000 - 500,000
Class 40,000 59,999 99,999 249,999 499,999 and over
2018Number of Families 1,280 8 36 166 734 235 101Average Income 235 32 52 82 162 336 863Average Expenditure 193 33 52 82 149 273 576
Five Persons or less
Average Income 215 32 52 82 157 341 809Average Expenditure 178 33 52 80 143 271 565
Six Persons or more
Average Income 276 - 55 86 172 329 957Average Expenditure 225 - 59 93 161 275 596
Note: Details may not add up to totals due to rounding.
Source: Family Income and Expenditure Survey Philippine Statistics Authority
Figure 2.1 TOTAL NUMBER OF FAMILIES, AVERAGE INCOME AND EXPENDITUREBY INCOME CLASS, REGION V, 2018
Family Size
0
50
100
150
200
250
300
350
400
450
500
550
600
650
700
750
800
0
50
100
150
200
250
300
350
400
450
500
550
600
650
700
750
800
850
900
Under 40,000 40,000 -59,999
60,000 -99,999
100,000 -249,999
250000 -499,000
500,000 &over
Nu
mb
er
of
Fa
mil
ies
(In
Th
ou
sa
nd
s)
Ave
rag
e I
nc
om
e a
nd
Ex
pe
nd
itu
re (
In T
ho
us
an
d P
es
os
)
Income Class
Number of Families
Average Income
Average Expenditure
2 - 11

Table 2.5AVERAGE ANNUAL FAMILY INCOME AND EXPENDITURE, STANDARD ERROR, COEFFICIENTOF VARIATION BY PROVINCE2009 AND 2012(In Pesos)
Income Expenditure
EstimateStandard
ErrorCoefficient of Variation
EstimateStandard
ErrorCoefficient of Variation
2009
Albay 158,629 11,751 7.4 147,647 10,322 7.0Camarines Norte 149,238 19,526 13.1 134,279 12,932 9.6Camarines Sur 152,074 9,437 6.2 137,682 7,626 5.5Catanduanes 241,147 58,492 24.3 172,918 24,849 14.4Masbate 126,563 15,083 11.9 119,167 15,405 12.9Sorsogon 142,671 9,205 6.5 129,405 6,662 5.1
2012
Albay 174,015 16,058 9.2 145,254 11,162 7.7Camarines Norte 167,610 10,054 6.0 147,288 8,643 5.8Camarines Sur 176,714 13,356 7.6 151,761 10,116 6.7Catanduanes 164,804 20,817 12.6 151,334 14,744 9.7Masbate 132,460 11,091 8.4 112,525 9,546 8.5Sorsogon 137,528 10,804 7.9 124,249 7,269 5.9
Note: Details may not add up to totals due to rounding.
Source: Family Income and Expenditure Survey Philippine Statistics Authority
Figure 2.2 AVERAGE ANNUAL FAMILY INCOME AND EXPENDITURE BY PROVINCEREGION V, 2012
Year / Province
0
20
40
60
80
100
120
140
160
180
200
Albay CamarinesNorte
Camarines Sur Catanduanes Masbate Sorsogon
Ave
rag
e I
nc
om
e a
nd
Ex
pe
nd
itu
re (
In T
ho
us
an
d
Pe
so
s)
Average Income
Average Expenditure
2 - 12

Table 2.6MEAN AND MEDIAN FAMILY INCOME AND EXPENDITURE BY INCOME DECILE, REGION V2009, 20012, 2015 AND 2018(In Thousand Pesos)
Income ExpenditureMean Median Mean Median
2009 Region V 152 101 137 102
First Decile 39 42 42 43Second Decile 58 58 62 61Third Decile 71 71 76 73Fourth Decile 83 84 86 85Fifth Decile 95 95 97 94Sixth Decile 108 109 109 108Seventh Decile 129 129 127 126Eighth Decile 164 163 155 154Ninth Decile 237 236 213 214Tenth Decile 535 428 404 352
2012 Region V 162 110 144 106
First Decile 69 69 74 74Second Decile 84 82 88 86Third Decile 94 94 94 94Fourth Decile 100 99 99 95Fifth Decile 110 105 108 101Sixth Decile 121 109 117 106Seventh Decile 131 126 121 117Eighth Decile 168 147 148 132Ninth Decile 231 215 199 187Tenth Decile 516 412 387 314
2015 Region V 187 136 160 126
First Decile 91 88 94 89Second Decile 112 107 110 105Third Decile 112 109 109 104Fourth Decile 126 121 119 114Fifth Decile 130 129 122 114Sixth Decile 141 137 128 122Seventh Decile 163 151 147 135Eighth Decile 186 163 161 145Ninth Decile 276 261 229 212Tenth Decile 538 482 386 331
2018 Region V 235 166 193 151
First Decile 110 105 111 105Second Decile 134 128 129 124Third Decile 143 138 136 131Fourth Decile 152 146 142 134Fifth Decile 169 153 154 140Sixth Decile 187 172 167 157Seventh Decile 204 189 177 161Eighth Decile 234 222 200 184Ninth Decile 332 305 256 231Tenth Decile 685 589 463 392
Source: Family Income and Expenditure Survey Philippine Statistics Authority
Year Income Decile
2 - 13

Table 2.7DISTRIBUTION OF TOTAL ANNUAL FAMILY INCOME BY DECILE AND GINI RATIO, REGION V2009, 2012, 2015 AND 2018
2009 2012 2015 2018Income Decile % Cummulative % Cummulative % Cummulative % Cummulative
Share % Share Share % Share Share % Share Share % Share
Region V
First Decile 2.6 2.6 4.3 4.3 4.9 4.9 4.7 4.7
Second Decile 3.8 6.4 5.2 9.4 6.0 10.8 5.7 10.3
Third Decile 4.7 11.1 5.8 15.3 6.0 16.8 6.1 16.4
Fourth Decile 5.5 16.6 6.2 21.4 6.7 23.5 6.5 22.9
Fifth Decile 6.2 22.8 6.8 28.2 7.0 30.5 7.2 30.1
Sixth Decile 7.1 29.9 7.5 35.7 7.5 38.0 7.9 38.0
Seventh Decile 8.5 38.4 8.1 43.7 8.7 46.7 8.7 46.7
Eighth Decile 10.8 49.2 10.3 54.0 10.0 56.6 10.0 56.7
Ninth Decile 15.6 64.8 14.2 68.3 14.7 71.3 14.1 70.8
Tenth Decile 35.1 100.0 31.7 100.0 28.7 100.0 29.2 100.0
GINI Ratio 0.4268 0.4233 0.3960 0.3967
Source: Family Income and Expenditure Survey Philippine Statistics Authority
Figure 2.3 DISTRIBUTION OF TOTAL FAMILY INCOME BY INCOME DECILEREGION V, 2015 AND 2018
0 2 4 6 8 10 12 14 16 18 20 22 24 26 28 30 32
First
Second
Third
Fourth
Fifth
Sixth
Seventh
Eighth
Ninth
Tenth
In Percent
Inc
om
e D
ec
ile
2018 2015
2 - 14

Table 2.8TOTAL NUMBER OF FAMILIES BY MAIN SOURCE OF INCOME AND INCOME CLASS, REGION V2009, 2012, 2015 AND 2018(In Thousands)
Total Income ClassMain Source of Income Number of Under 40,000- 60,000- 100,000- 250,000- 500,000
Families 40,000 59,999 99,999 249,999 499,000 and over
2009
Region V 1,070 45 130 353 396 145 -
Wages / Salaries 406 8 44 131 160 62 -Entrepreneurial Activities 340 11 37 138 129 25 -Other sources of income 323 26 48 84 106 58 -
2012
Region V 1,165 44 111 357 477 175 -
Wages / Salaries 424 9 32 123 174 85 -Entrepreneurial Activities 286 9 30 87 129 32 -Other sources of income 454 26 49 147 174 58 -
2015
Region V 1,262 25 66 269 666 236 -
Wages / Salaries 529 2 11 97 292 127 -Entrepreneurial Activities 295 3 16 66 176 34 -Other sources of income 438 20 39 107 198 74 -
2018
Region V 1,280 8 36 166 734 235 101
Wages / Salaries 613 0 5 60 364 126 58Entrepreneurial Activities 274 1 5 33 175 45 15Other sources of income 393 7 26 73 195 64 28
Note: Data for income class 250,000 - 499,000 for year 2009 to 2015 indicates income class 250,000 and over Income class was updated starting 2018.
Source: Family Income and Expenditure Survey Philippine Statistics Authority
2 - 15

Figure 2.4 DISTRIBUTION OF TOTAL FAMILY EXPENDITURE BY EXPENDITURE GROUPREGION V, 2018
Figure 2.5 TOTAL FAMILY EXPENDITURE BY INCOME CLASSREGION V, 2012, 2015 AND 2018
Food Expenditure46.9%
Other Expenditure12.3%
Housing10.1%
Water, Electricity and Gas
7.7%
Miscellaneous Goods and Services
6.4%
Transportation5.3%
Health3.5%
Clothing and Footwear
2.8%
Education2.7%
Furnishings, household
equipment and routine household
2.4%
0
20,000
40,000
60,000
80,000
100,000
120,000
Under 40,000 40,000 - 59,999 60,000 - 99,999 100,000 -249,999
250,000 -499,000
500,000 & over
In M
illi
on
Pe
so
s
Income Class
2012 2015 2018
Note: Income class 250,000-499,000 for year 2012 and 2015 indicates income class 250,000 & over. Income class 500,000 & over was updated starting year 2018.
2 - 16
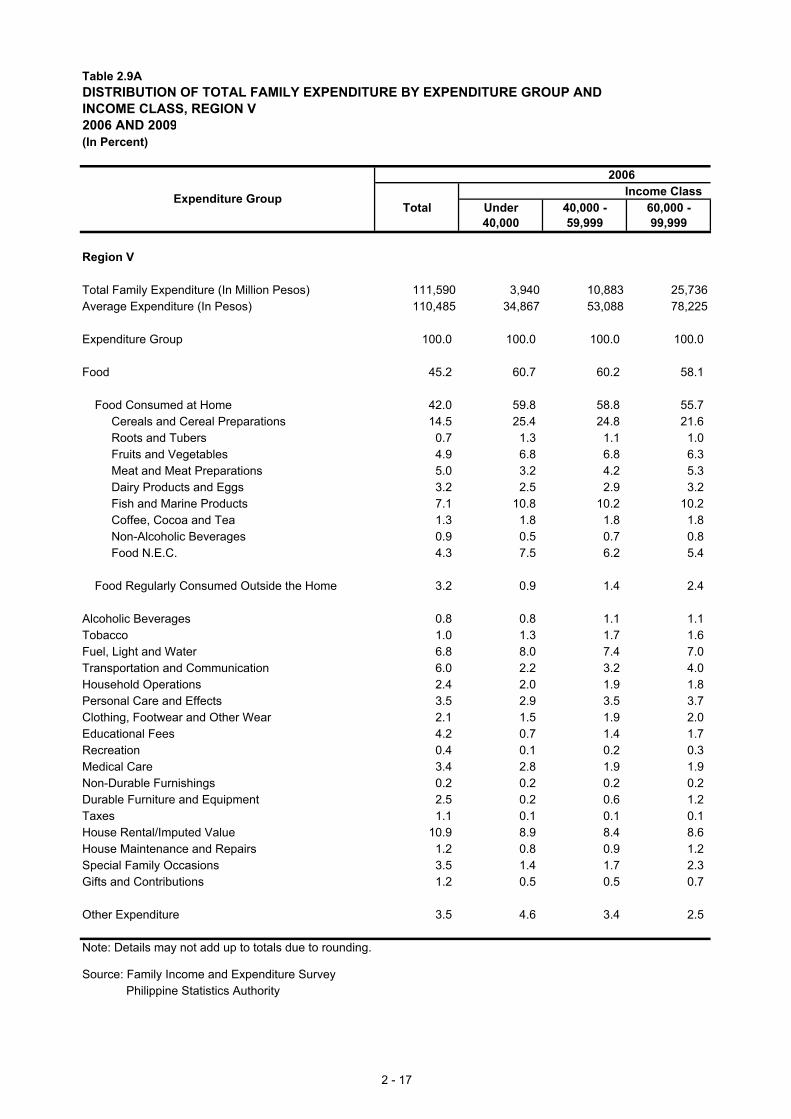
Table 2.9ADISTRIBUTION OF TOTAL FAMILY EXPENDITURE BY EXPENDITURE GROUP ANDINCOME CLASS, REGION V2006 AND 2009(In Percent)
2006Income Class
Total Under 40,000 - 60,000 -40,000 59,999 99,999
Region V
Total Family Expenditure (In Million Pesos) 111,590 3,940 10,883 25,736Average Expenditure (In Pesos) 110,485 34,867 53,088 78,225
Expenditure Group 100.0 100.0 100.0 100.0
Food 45.2 60.7 60.2 58.1
Food Consumed at Home 42.0 59.8 58.8 55.7 Cereals and Cereal Preparations 14.5 25.4 24.8 21.6 Roots and Tubers 0.7 1.3 1.1 1.0 Fruits and Vegetables 4.9 6.8 6.8 6.3 Meat and Meat Preparations 5.0 3.2 4.2 5.3 Dairy Products and Eggs 3.2 2.5 2.9 3.2 Fish and Marine Products 7.1 10.8 10.2 10.2 Coffee, Cocoa and Tea 1.3 1.8 1.8 1.8 Non-Alcoholic Beverages 0.9 0.5 0.7 0.8 Food N.E.C. 4.3 7.5 6.2 5.4
Food Regularly Consumed Outside the Home 3.2 0.9 1.4 2.4
Alcoholic Beverages 0.8 0.8 1.1 1.1Tobacco 1.0 1.3 1.7 1.6Fuel, Light and Water 6.8 8.0 7.4 7.0Transportation and Communication 6.0 2.2 3.2 4.0Household Operations 2.4 2.0 1.9 1.8Personal Care and Effects 3.5 2.9 3.5 3.7Clothing, Footwear and Other Wear 2.1 1.5 1.9 2.0Educational Fees 4.2 0.7 1.4 1.7Recreation 0.4 0.1 0.2 0.3Medical Care 3.4 2.8 1.9 1.9Non-Durable Furnishings 0.2 0.2 0.2 0.2Durable Furniture and Equipment 2.5 0.2 0.6 1.2Taxes 1.1 0.1 0.1 0.1House Rental/Imputed Value 10.9 8.9 8.4 8.6House Maintenance and Repairs 1.2 0.8 0.9 1.2Special Family Occasions 3.5 1.4 1.7 2.3Gifts and Contributions 1.2 0.5 0.5 0.7
Other Expenditure 3.5 4.6 3.4 2.5
Note: Details may not add up to totals due to rounding.
Source: Family Income and Expenditure SurveyPhilippine Statistics Authority
Expenditure Group
2 - 17

2009Income Class
100,000 - 250,000 - Total Under 40,000 - 60,000 - 100,000 - 250,000 -249,999 and over 40,000 59,999 99,999 249,999 and over
37,102 33,929 146,595 1,444 7,194 29,565 56,223 52,170138,959 355,147 137,005 32,089 55,338 83,754 141,977 359,793
100.0 100.0 100.0 100.0 100.0 100.0 100.0 100.0
45.4 28.5 47.4 62.1 61.5 61.1 51.2 33.2
41.4 24.8 43.8 61.8 59.9 58.3 47.2 29.313.5 5.8 16.2 24.0 26.0 25.0 17.8 7.9
0.6 0.4 0.7 1.8 1.2 1.1 0.7 0.44.7 3.1 5.0 7.9 7.3 6.6 5.2 3.45.5 4.7 4.8 2.9 3.4 4.4 5.2 4.93.5 3.1 3.3 2.3 2.3 2.8 3.4 3.66.9 3.4 6.8 9.2 10.2 9.7 7.4 3.91.4 0.7 1.3 2.0 1.9 1.7 1.4 0.81.0 1.0 1.0 0.4 0.7 0.9 1.0 1.14.2 2.6 4.8 11.3 7.0 6.0 5.0 3.3
4.0 3.7 3.6 0.3 1.7 2.7 4.0 3.9
0.9 0.4 0.7 0.7 0.8 1.0 0.8 0.51.1 0.3 0.9 2.1 1.6 1.5 0.9 0.46.9 6.2 6.2 7.7 6.6 6.2 6.2 6.06.3 8.4 5.7 2.0 3.2 3.6 5.5 7.61.9 3.5 2.3 2.2 1.8 1.8 1.9 3.13.7 3.2 3.6 2.8 3.4 3.7 3.9 3.32.2 2.4 2.1 1.6 1.8 1.9 2.1 2.23.9 7.8 3.6 0.4 0.7 1.3 3.4 5.70.4 0.7 0.4 0.1 0.1 0.2 0.3 0.63.1 5.3 3.5 1.7 1.8 1.6 2.5 5.80.3 0.3 0.2 0.2 0.2 0.2 0.2 0.33.1 3.7 3.0 0.0 0.7 0.9 3.2 4.40.8 2.5 1.0 0.0 0.1 0.1 0.4 2.3
11.2 13.3 10.7 11.2 9.9 8.9 10.1 12.31.2 1.4 0.9 0.3 0.4 0.8 1.0 0.83.9 4.9 3.6 1.0 1.7 1.9 3.3 5.10.8 2.2 1.3 0.6 0.7 0.7 1.0 2.1
2.9 5.0 3.0 3.3 2.8 2.5 1.9 4.4
2 - 18

Table 2.9BDISTRIBUTION OF TOTAL FAMILY EXPENDITURE BY EXPENDITURE GROUP ANDINCOME CLASS, REGION V2012(In Percent)
Income ClassTotal Under 40,000 - 60,000 - 100,000 - 250,000 -
40,000 59,999 99,999 249,999 and over
Region V
Total Family Expenditure (In Million Pesos) 167,256 1,422 5,947 29,427 66,072 64,387Average Expenditure (In Thousand Pesos) 144 32 54 82 138 367
Percent to Total Expenditure 100.0 100.0 100.0 100.0 100.0 100.0
Food Expenditures 49.0 62.7 63.8 62.3 55.7 34.4
Food Consumed at Home 43.4 53.2 59.1 57.7 49.4 29.0Bread and cereals 16.6 24.5 26.3 25.7 19.6 8.3Meat 5.6 3.0 4.0 4.5 6.0 6.0Fish and sea foods 7.0 8.7 10.6 9.8 8.2 4.2Milk, cheese and eggs 3.2 2.7 2.6 3.1 3.6 3.0Oils and Fats 0.9 1.0 1.1 1.2 1.0 0.6Fruits 2.1 3.4 3.2 2.8 2.2 1.5Vegetables 3.0 4.2 5.1 4.3 3.4 1.9Sugar, Jam, Honey, chocolate and confectionary 1.4 1.8 2.0 2.0 1.5 0.8Food not elsewhere classified 1.2 1.2 1.8 1.7 1.4 0.8Coffee, Cocoa and Tea 1.4 2.1 2.0 2.0 1.6 0.8Mineral water, softdrinks, fruit and vegetable juices 0.9 0.6 0.5 0.7 1.0 1.0
Food Regularly Consumed Outside the Home 5.6 9.4 4.6 4.7 6.3 5.4
Alcoholic Beverages 0.5 0.9 0.6 0.6 0.6 0.4Tobacco 0.8 1.4 1.5 1.4 0.9 0.4Other Vegetables-based products 0.0 0.2 0.1 0.1 0.0 0.0Clothing and Footwear 2.5 1.9 2.0 2.2 2.3 3.0Furnishings, household equipment and routine househo 2.8 2.0 2.2 2.1 2.2 3.8Health 3.7 2.3 2.1 1.9 3.1 5.2Housing, water, electricity, gas and other fuels 18.0 21.7 18.5 16.6 17.4 19.2Transportation 6.0 1.8 3.0 3.9 5.3 8.1Communication 1.9 0.7 0.5 1.1 1.6 2.7Recreation and culture 1.4 0.3 0.5 0.7 1.1 2.2Education 3.8 0.3 0.6 1.7 3.1 5.8Accomodation Services 0.2 0.0 0.0 0.1 0.1 0.3Miscellaneous Goods and Services 6.5 3.3 4.1 4.4 5.3 9.1
Other Expenditure 2.7 0.5 0.6 0.8 1.1 5.4
Note: Details may not add up to totals due to rounding.
Source: Family Income and Expenditure SurveyPhilippine Statistics Authority
Expenditure Group
2 - 19

Table 2.9CDISTRIBUTION OF TOTAL FAMILY EXPENDITURE BY EXPENDITURE GROUP ANDINCOME CLASS, REGION V2015(In Percent)
Income ClassTotal Under 40,000 - 60,000 - 100,000 - 250,000 -
40,000 59,999 99,999 249,999 and over
Region V
Total Family Expenditure (In Million Pesos) 202,469 783 3,300 22,222 93,758 82,406Average Expenditure (In Thousand Pesos) 160 32 50 83 141 350
Percent to Total Expenditure 100.0 100.0 100.0 100.0 100.0 100.0
Food Expenditures 48.0 61.5 61.6 61.2 55.1 35.6
Food Consumed at Home 42.3 55.8 56.5 56.5 49.2 29.9Bread and cereals 16.4 25.1 25.2 24.5 20.4 9.2Meat 5.3 3.6 4.2 4.9 5.6 5.2Fish and Seafood 6.5 7.7 8.6 8.9 7.7 4.4Milk, Cheese and Eggs 3.2 2.8 3.0 3.4 3.4 3.0Oils and Fats 0.8 1.0 1.0 1.1 0.9 0.6Fruits 1.9 3.2 2.9 2.5 2.0 1.6Vegetables 3.0 4.8 5.0 4.3 3.5 2.1Sugar, Jam, Honey, Chocolate and Confectionary 1.3 1.9 1.8 1.7 1.5 0.8Food Products Not Elsewhere Classified 1.3 2.1 1.7 1.7 1.5 0.9Coffee, Tea and Cocoa 1.5 3.1 2.3 2.3 1.7 1.1Mineral Water, Softdrinks, Fruit and Vegetable Juices 1.0 0.6 0.6 0.9 1.0 1.0
Food Regularly Consumed Outside the Home 5.7 5.7 5.2 4.8 5.9 5.7
Alcoholic Beverages 0.5 0.3 0.5 0.6 0.6 0.4Tobacco 1.2 0.9 1.8 1.9 1.6 0.6Other Vegetables-Based Products 0.0 0.5 0.1 0.1 0.0 0.0Clothing and Footwear 2.7 1.8 2.0 2.2 2.4 3.1Furnishings and Routine Household Maintenance 2.4 2.5 2.2 2.2 2.0 2.9Health 3.7 1.9 1.7 2.8 2.9 5.0House Rent/Rental Value 9.3 12.7 10.9 8.5 8.6 10.3Water, Electricity, Gas and Other Fuels 7.4 10.3 8.6 7.1 7.2 7.8Transport 4.7 2.3 2.8 3.3 4.7 5.3Communication 1.5 0.2 0.6 0.7 1.1 2.2Recreation and Culture 0.8 0.3 0.5 0.6 0.6 1.0Education 4.1 0.1 0.3 1.4 3.4 5.8Accomodation Services 0.1 - - 0.0 0.1 0.2Miscellaneous Goods and Services 6.1 3.7 4.3 4.5 4.9 8.0Durable Furniture and Equipment 2.2 - 0.3 0.9 1.6 3.2Special Family Occasion 2.9 0.2 1.4 1.6 2.4 3.8Other Expenditure 2.3 0.5 0.3 0.5 0.7 4.8
Note: Details may not add up to totals due to rounding.
Source: Family Income and Expenditure SurveyPhilippine Statistics Authority
Expenditure Group
2 - 20

Table 2.9DDISTRIBUTION OF TOTAL FAMILY EXPENDITURE BY EXPENDITURE GROUP ANDINCOME CLASS, REGION V2018(In Percent)
Income ClassTotal Under 40,000 - 60,000 - 100,000 - 250,000 - 500,000 -
40,000 59,999 99,999 249,999 499,000 and over
Region V
Total Family Expenditure (In Million Pesos) 247,626 274 1,877 13,501 109,773 64,145 58,055Average Expenditure (In Thousand Pesos) 193 33 52 82 149 273 576
Percent to Total Expenditure 100.0 100.0 100.0 100.0 100.0 100.0 100.0
Food Expenditures 47.0 62.7 59.5 59.2 55.1 44.4 31.2
Food Consumed at Home 40.9 50.7 53.2 54.6 49.3 37.9 24.8Bread and cereals 14.5 21.6 22.3 22.3 19.0 12.4 6.4Meat 6.2 3.0 5.6 5.8 6.7 6.6 5.2Fish and Seafood 6.0 7.3 7.4 8.0 7.3 5.4 3.6Milk, Cheese and Eggs 3.7 3.2 3.7 4.2 3.9 3.8 3.0Oils and Fats 0.8 0.9 1.0 1.1 1.0 0.8 0.5Fruits 1.9 5.0 2.9 2.7 2.2 1.7 1.4Vegetables 3.0 4.4 4.3 4.3 3.7 2.7 1.8Sugar, Jam, Honey, Chocolate and Confectiona 1.0 1.3 1.5 1.4 1.2 0.9 0.7Food Products Not Elsewhere Classified 1.1 1.4 1.5 1.7 1.4 1.0 0.6Coffee, Tea and Cocoa 1.6 2.1 2.3 2.3 1.9 1.5 0.9Mineral Water, Softdrinks, Fruit and Vegetable 1.0 0.6 0.7 0.8 1.0 1.2 0.9
Food Regularly Consumed Outside the Home 6.1 11.9 6.3 4.6 5.8 6.5 6.3
Alcoholic Beverages 0.5 0.3 0.5 0.6 0.6 0.5 0.3Tobacco 1.2 0.6 1.7 1.7 1.6 1.0 0.4Other Vegetables-Based Products 0.0 0.1 0.2 0.1 0.1 0.0 0.0Clothing and Footwear 2.8 2.0 1.9 2.3 2.5 2.9 3.4Furnishings and Routine Household Maintenance 2.4 2.3 2.5 2.3 2.1 2.1 3.4Health 3.5 2.0 1.9 2.3 2.0 3.8 6.1House Rent/Rental Value 10.1 14.9 12.5 9.9 9.3 10.6 11.0Water, Electricity, Gas and Other Fuels 7.7 8.3 8.7 8.0 7.8 7.9 7.1Transport 5.3 1.9 3.1 3.6 4.8 5.4 6.3Communication 1.5 0.1 0.5 0.7 0.9 1.8 2.5Recreation and Culture 0.9 0.1 0.3 0.6 0.7 0.8 1.3Education 2.7 0.1 0.5 1.0 1.8 2.9 4.7Accomodation Services 1.6 0.2 0.6 0.6 0.7 1.4 3.6Miscellaneous Goods and Services 6.4 4.0 4.2 4.6 5.0 6.8 9.0Durable Furniture and Equipment 3.4 0.3 0.4 1.1 2.3 3.5 6.0Special Family Occasion 3.1 0.2 1.0 1.5 2.6 3.9 3.7Other Expenditure 1.6 0.2 0.6 0.6 0.7 1.4 3.6
Note: Details may not add up to totals due to rounding.
Source: Family Income and Expenditure SurveyPhilippine Statistics Authority
Expenditure Group
2 - 21

Table 2.10AANNUAL PER CAPITA POVERTY THRESHOLDS AND POVERTY INCIDENCEAMONG FAMILIES AND POPULATION BY PROVINCE2012, 2015 and 2018(Threshold in Pesos; Incidence in Percent)
Province
2012 2015 3/ 2018 2012 2015 3/ 2018 2012 2015 3/ 2018
Region V 18,257 22,503 24,461 32.3 31.0 20.0 41.1 39.8 27.0
Albay 18,610 22,328 24,902 33.9 18.5 15.0 41.0 26.2 21.2Camarines Norte 18,390 23,940 25,051 21.7 35.1 22.4 28.7 43.6 30.5Camarines Sur 18,717 22,874 24,271 31.7 28.5 21.0 41.2 36.8 28.4Catanduanes 18,303 21,668 24,380 27.1 33.6 14.4 33.8 43.4 20.3Masbate 17,487 20,406 22,911 40.6 35.5 25.8 51.3 45.4 33.0Sorsogon 17,535 23,268 26,069 31.3 46.2 19.6 40.7 56.9 26.1
1/ The per capita income required or the amount to be spent to satisfy the nutritional requirements
(2,000 calories) and other basic needs. 2/ The proportion of poor families/population to the total number of families/population. 3/ Revised/updated based on the following: a) rebasing of the Consumer Price Index (CPI) market basket of prices
from 2006 to 2012; and b) adoption of the 2015 Census of Population results with the new urban-rural classification for the weights in the Family Income and Expenditure Survey (FIES).
Source: Philippine Statistics Authority
Table 2.10BANNUAL PER CAPITA FOOD THRESHOLDS AND SUBSISTENCE INCIDENCEAMONG FAMILIES AND POPULATION BY PROVINCE2012, 2015 and 2018(Threshold in Pesos; Incidence in Percent)
Province
2012 2015 3/ 2018 2012 2015 3/ 2018 2012 2015 3/ 2018
Region V 12,744 15,753 17,083 12.0 9.9 4.6 16.8 14.2 7.1
Albay 12,942 15,618 17,391 15.2 6.6 3.2 19.6 10.9 5.4Camarines Norte 12,777 16,702 17,512 6.6 12.2 5.2 9.9 18.3 8.1Camarines Sur 13,080 15,984 16,926 10.1 7.4 5.3 15.1 10.4 8.1Catanduanes 12,781 15,131 17,035 19.7 13.0 3.5 24.3 16.9 5.2Masbate 12,211 14,250 15,985 14.7 10.8 5.3 20.3 14.8 7.6Sorsogon 12,244 16,245 18,172 10.3 16.3 4.4 14.5 22.3 6.6
1/ The per capita income required or the amount to be spent to satisfy the nutritional requirements
(2,000 calories). 2/ The proportion of poor families/population whose annual per capita income falls below the annual per capita
food threshold to the total number of families/population. 3/ Revised/updated based on the following: a) rebasing of the Consumer Price Index (CPI) market basket of prices
from 2006 to 2012; and b) adoption of the 2015 Census of Population results with the new urban-rural classification for the weights in the Family Income and Expenditure Survey (FIES).
Source: Philippine Statistics Authority
Annual Per Capita Poverty Threshold 1/
Annual Poverty Incidence Among Families 2/
Annual Poverty Incidence Among Population 2/
Annual Per Capita Food Threshold 1/
Annual Subsistence Incidence Among
Families 2/
Annual Subsistence Incidence Among
Population 2/
2 - 22

Table 2.11POVERTY INCIDENCE FOR THE BASIC SECTORS, REGION V2012, 2015 AND 2018(Poverty Incidence in Percent)
Poverty Incidence
Coefficient of
Variation
Poverty Incidence
Coefficient of
Variation
Poverty Incidence
Coefficient of
Variation
Women 1/ 40.7 5.2 39.9 4.8 26.4 3.9Youth 2/ 3/ 36.2 6.7 36.7 5.7 24.3 4.5Children 4/ 5/ 51.1 4.4 50.8 3.9 35.4 3.5Senior Citizens 6/ 7/ 26.5 7.9 22.6 9.1 14.9 6.4Individuals Residing in Urban Areas 8/ 22.8 20.0 27.5 13.8 16.8 12.7Migrant and Formal Sector Workers 9/ 10/ 32.1 7.2 30.8 6.6 19.5 5.0Farmers 11/ 12/ 37.0 8.1 48.9 5.4 34.2 4.4Fishermen 13/ 14/ 45.6 13.1 51.7 10.3 28.9 9.3Self-employed and Unpaid Family Workers 15/ 16/ 34.8 6.8 34.3 6.7 20.5 5.4Individuals Residing in Rural Areas 17/ - - 44.1 4.8 30.2 3.7Persons with Disability 18/ 19/ - - - - 22.9 10.1Employed Population 20/ 21/ 33.8 5.9 29.7 6.0 - -Unemployed Population 22/ 23/ 24/ 34.3 11.5 29.2 14.0 - -
Notes:
Source: Philippine Statistics Authority
18/ Persons with disability are those who experienced a lot of difficulty or who cannot do at all any of the following: a) Seeing even if wearing eyeglasses; b) Hearing even if using hearing aid; c) Walking or climbing steps; d) Remembering or concentrating; e) Self-care; and f) Communicating. The Washington Group on Disability Statistics recommended this cut-off for disability.19/ Poverty incidence among persons aged 15 years and above with disability refers to the proportion of persons with disability with per capita income less thank the per capita poverty threshold to the total number of persons with disability.20/ Employed refers to individuals who are 15 years and over, who during the reference period are reported either at work or with a job but not at work.21/ Poverty incidence among employed refers to the proportion of employed with per capita income less than the per capita poverty threshold to the total number of employed.22/ Unemployed refers to individuals who are 15 years and over, who during the reference period are reported without work and currently available for work and seeking work.23/ Poverty incidence among unemployed population refers to the proportion of unemployed with per capita income less than the per capita poverty threshold to the total number of employed.
2/ Youth refers to individuals aged 15 to 30 years old, based on RA 8044, The Youth in Nation-Building Act.
13/ Fishermen refer to employed individuals 15 years old and over whose primary occupation is fishing. These include occupations under Skilled Agricultural, Forestry and Fishery Works and Elementary Occupations in the 2012 Philippine Standard Occupational Classification (PSOC)14/ Poverty incidence among fishermen refers to the proportion of fishermen with per capita income less than the per capita poverty threshold to the total number of fishermen.15/ Self-employed and unpaid family workers refer to employed individuals 15 years old and over who are either self-employed or worked without pay on family owned farm or business.16/ Poverty incidence among self-employed and unpaid family workers refers to the proportion of self-employed and unpaid family workers with per capita income less than the per capita poverty threshold to the total number of self-employed and unpaid family workers17/ Poverty incidence among individuals residing in rural areas refers to the proportion of individuals residing in rural areas with per capita income less than the per capita poverty threshold to the total number of individuals residing in rural areas
8/ Poverty incidence among individuals residing in urban areas refers to the proportion of individuals residing in urban areas with per capita income less than the per capita poverty threshold to the total number of individuals residing in urban areas
2015 r 2018
1/ Poverty incidence among women refers to the proportion of women with per capita income less than the per capita poverty threshold to the total number of women.
Basic Sectors
2012
r - revised; The 2015 estimates were revised/updated based on the following: a) rebasing of the Consumer Price Index (CPI) market basket of prices from2006 to 2012; b) adoption of the 2015 Census of Population (PopCen) results for the weights in the merged FIES-LFS; and c) updated urban-rural classification of barangays based on the 2015 PopCen.
24/ Poverty incidence among unemployed population was generated only for 2006 and 2009 since the 2003 Labor Force Survey still used the old definition of unemployed.
9/ Migrant and formal sector workers refer to individuals who are Overseas Contract Workers (OCW) or Workers other than OCWs or employed persons working for private establishments and government organizations and corporations.10/ Poverty incidence among migrant and formal sector workers refers to the proportion of migrant and formal sector workers with per capita income less than the per capita poverty threshold to the total number of migrant and formal sector workers. 11/ Farmers refer to employed individuals 15 years old and over whose primary occupation is farming, plant growing or animal production. These include occupations under Skilled Agricultural, Forestry and Fishery Works and Elementary Occupations in the 2012 Philippine Standard Occupational Classification (PSOC).12/ Poverty incidence among farmers refers to the proportion of farmers with per capita income less than the per capita poverty threshold to the total number of farmers.
3/ Poverty incidence among youth refers to the proportion of youth with per capita income less than the per capita poverty threshold to the total number of youth.4/ Child refers to individual below 18 years old based on, RA 7610, Special Protection of Children Against Abuse, Exploitation and Discrimination Act.
5/ Poverty incidence among children refers to the proportion of children with per capita income less than the per capita poverty threshold to the total number of children.6/ Senior citizen refers to an individual aged 60 years old and above, based on RA 9257, the Expanded Senior Citizens Act.
7/ Poverty incidence among senior citizens refers to the proportion of senior citizens with per capita income less than the per capita poverty threshold to the total number of senior citizens.
2 - 23

Table 2.12A
CONSUMER PRICE INDEX, INFLATION RATE AND PURCHASING POWER OF THE PESOFOR ALL INCOME HOUSEHOLDS BY MONTH AND PROVINCE (2012 = 100)2014 - 2020(Inflation Rate in Percent)
Year Month CPI Inflation CPI Inflation CPI InflationRate Rate Rate
2014 Annual Average 107.4 4.3 107.2 3.6 108.1 5.1January 106.6 4.9 106.2 4.5 108.3 6.8February 106.9 4.7 106.0 3.7 108.8 6.8March 106.3 3.9 105.5 1.7 107.1 5.7April 106.4 4.3 106.3 2.7 107.1 5.4May 106.7 4.5 107.2 3.2 107.2 5.5June 107.1 4.4 107.0 2.4 107.5 5.4July 107.5 4.7 107.2 4.7 107.2 2.1August 108.3 5.5 108.7 5.9 108.5 5.9September 108.7 4.5 109.0 4.9 109.2 5.4October 108.5 4.3 108.1 3.9 108.9 5.3November 108.1 3.4 107.6 3.4 109.0 4.5December 107.8 2.0 107.5 1.5 108.3 2.1
2015 Annual Average 107.8 0.4 107.6 0.4 108.3 0.2January 108.2 1.5 108.2 1.9 108.4 0.1February 108.1 1.1 108.5 2.4 108.2 (0.6)March 107.7 1.3 108.2 2.6 107.9 0.7April 108.0 1.5 108.0 1.6 108.3 1.1May 107.5 0.7 107.2 0.0 107.8 0.6June 107.3 0.2 107.1 0.1 107.4 (0.1)July 107.6 0.1 107.3 0.1 107.9 0.7August 107.7 (0.6) 107.8 (0.8) 107.9 (0.6)September 107.6 (1.0) 107.2 (1.7) 108.7 (0.5)October 107.9 (0.6) 107.2 (0.8) 109.0 0.1November 108.1 0.0 107.1 (0.5) 109.1 0.1December 108.1 0.3 107.0 (0.5) 109.3 0.9
2016 Annual Average 108.9 1.0 108.0 0.4 111.4 2.9January 108.7 0.5 107.5 (0.6) 110.2 1.7February 108.5 0.4 107.9 (0.6) 109.9 1.6March 108.3 0.6 107.5 (0.6) 110.9 2.8April 108.4 0.4 107.3 (0.6) 111.2 2.7May 108.7 1.1 107.7 0.5 111.3 3.2June 108.8 1.4 107.8 0.7 111.1 3.4July 108.6 0.9 107.7 0.4 111.0 2.9August 108.7 0.9 107.7 (0.1) 111.5 3.3September 108.9 1.2 108.2 0.9 111.6 2.7October 109.4 1.4 108.5 1.2 111.9 2.7November 109.9 1.7 108.8 1.6 113.2 3.8December 110.3 2.0 109.7 2.5 113.0 3.4
2017 Annual Average 110.3 1.3 110.0 1.9 112.9 1.3January 110.7 1.8 110.3 2.6 113.2 2.7February 110.5 1.8 110.5 2.4 113.1 2.9March 110.1 1.7 110.2 2.5 112.6 1.5April 110.5 1.9 110.0 2.5 113.1 1.7May 110.0 1.2 109.2 1.4 112.5 1.1June 109.8 0.9 109.2 1.3 112.0 0.8
Source: Philippine Statistics Authority
Region V Albay Camarines Norte
2 - 24

Purchasing CPI Inflation CPI Inflation CPI Inflation CPI Inflation Power of
Rate Rate Rate Rate the Peso
108.4 4.7 106.3 3.9 106.6 4.1 105.9 3.9 0.93107.6 5.8 105.3 4.2 105.1 2.6 105.4 4.4 0.94107.8 5.5 105.8 4.0 105.8 3.2 106.0 4.5 0.94107.5 5.1 106.0 4.6 105.8 3.7 104.9 3.7 0.94107.1 4.9 106.1 4.7 105.4 4.0 105.1 4.4 0.94107.1 5.0 106.1 4.6 105.8 4.5 105.7 5.0 0.94107.9 5.1 106.4 4.4 106.0 4.1 105.9 4.9 0.93108.9 5.7 106.9 4.6 106.7 4.4 105.5 4.4 0.93109.5 5.6 106.1 4.3 108.0 5.8 105.7 3.8 0.92109.8 4.6 106.6 3.3 107.5 4.4 107.2 4.1 0.92109.7 4.5 107.0 3.4 107.7 4.3 107.3 4.6 0.92109.4 3.7 106.7 2.6 108.0 4.1 106.0 2.4 0.93109.0 2.3 106.4 1.7 107.2 3.6 105.9 1.0 0.93
109.4 0.9 107.0 0.7 107.1 0.5 104.9 (0.9) 0.93109.2 1.5 106.6 1.2 108.1 2.9 106.3 0.9 0.92109.3 1.4 106.6 0.8 107.5 1.6 105.7 (0.3) 0.93108.9 1.3 107.5 1.4 106.2 0.4 105.5 0.6 0.93109.3 2.1 107.3 1.1 106.3 0.9 106.5 1.3 0.93108.8 1.6 107.5 1.3 106.8 0.9 105.3 (0.4) 0.93109.0 1.0 107.1 0.7 106.5 0.5 104.1 (1.7) 0.93109.3 0.4 107.0 0.1 107.0 0.3 104.3 (1.1) 0.93109.4 (0.1) 106.8 0.7 107.0 (0.9) 104.3 (1.3) 0.93109.5 (0.3) 106.7 0.1 106.4 (1.0) 104.3 (2.7) 0.93109.8 0.1 106.5 (0.5) 107.5 (0.2) 104.2 (2.9) 0.93110.2 0.7 107.4 0.7 107.9 (0.1) 104.3 (1.6) 0.93110.4 1.3 107.3 0.8 107.5 0.3 104.1 (1.7) 0.93
109.9 0.5 107.5 0.5 109.3 2.1 106.5 1.5 0.92110.1 0.8 107.2 0.6 109.4 1.2 106.4 0.1 0.92109.5 0.2 106.9 0.3 108.2 0.7 106.7 0.9 0.92109.2 0.3 107.3 (0.2) 108.1 1.8 106.2 0.7 0.92109.5 0.2 106.6 (0.7) 108.1 1.7 106.4 (0.1) 0.92109.7 0.8 107.1 (0.4) 108.8 1.9 106.5 1.1 0.92109.9 0.8 107.6 0.5 109.1 2.4 106.5 2.3 0.92109.7 0.4 107.5 0.5 109.0 1.9 105.9 1.5 0.92109.5 0.1 107.0 0.2 109.8 2.6 105.7 1.3 0.92109.7 0.2 107.5 0.7 109.9 3.3 105.9 1.5 0.92110.3 0.5 107.9 1.3 110.0 2.3 106.7 2.4 0.91110.9 0.6 108.3 0.8 110.0 1.9 107.1 2.7 0.91111.1 0.6 108.9 1.5 111.0 3.3 107.4 3.2 0.91
111.2 1.2 109.9 2.2 111.0 1.6 106.4 (0.1) 0.91111.2 1.0 109.1 1.8 112.0 2.4 107.9 1.4 0.90111.1 1.5 109.1 2.1 111.2 2.8 107.1 0.4 0.90110.6 1.3 110.1 2.6 110.0 1.8 106.9 0.7 0.91111.4 1.7 109.8 3.0 110.1 1.9 108.0 1.5 0.90110.8 1.0 110.0 2.7 110.6 1.7 106.8 0.3 0.91111.1 1.1 109.8 2.0 110.3 1.1 105.6 (0.8) 0.91
SorsogonCamarines Sur Catanduanes Masbate
2 - 25

Table 2.12A - Continued
CONSUMER PRICE INDEX, INFLATION RATE AND PURCHASING POWER OF THE PESOFOR ALL INCOME HOUSEHOLDS BY MONTH AND PROVINCE (2012 = 100)2014 - 2020(Inflation Rate in Percent)
Year Month CPI Inflation CPI Inflation CPI InflationRate Rate Rate
Region V Albay Camarines Norte
July 109.6 0.9 109.0 1.2 112.0 0.9August 109.6 0.8 109.1 1.3 112.5 0.9September 110.0 1.0 109.6 1.3 112.6 0.9October 110.3 0.8 109.8 1.2 112.8 0.8November 110.9 0.9 110.2 1.3 114.3 1.0December 112.1 1.6 112.9 2.9 114.4 1.2
2018 Annual Average 118.0 7.0 118.2 7.5 121.6 7.7January 114.1 3.1 115.0 4.3 117.5 3.8February 114.8 3.9 116.0 5.0 118.5 4.8March 115.8 5.2 116.9 6.1 119.2 5.9April 116.6 5.5 117.4 6.7 120.0 6.1May 117.0 6.4 117.5 7.6 120.9 7.5June 117.4 6.9 118.0 8.1 120.5 7.6July 117.7 7.4 117.4 7.7 122.2 9.1August 119.5 9.0 119.0 9.1 123.7 10.0September 121.1 10.1 121.0 10.4 124.6 10.7October 121.2 9.9 121.4 10.6 124.8 10.6November 120.8 8.9 119.7 8.6 123.8 8.3December 119.9 7.0 119.0 5.4 122.9 7.4
2019 Annual Average 121.3 2.8 121.0 2.4 125.5 3.2January 120.3 5.4 119.5 3.9 124.1 5.6February 120.6 5.1 119.6 3.1 124.4 5.0March 120.3 3.9 119.5 2.2 124.2 4.2April 120.5 3.3 119.3 1.6 123.7 3.1May 120.9 3.3 120.3 2.4 125.0 3.4June 120.9 3.0 120.9 2.5 124.6 3.4July 121.0 2.8 121.0 3.1 124.8 2.1August 121.2 1.4 120.6 1.3 125.5 1.5September 121.4 0.2 121.0 0.0 126.1 1.2October 122.1 0.7 122.1 0.6 127.7 2.3November 122.6 1.5 123.0 2.8 127.2 2.7December 123.9 3.3 125.7 5.6 128.2 4.3
2020 Annual Average 126.4 4.2 128.6 6.3 130.7 4.1January 125.0 3.9 127.0 6.3 130.0 4.8February 124.9 3.6 126.5 5.8 130.1 4.6March 124.2 3.2 126.0 5.4 128.7 3.6April 124.2 3.1 125.8 5.4 129.3 4.5May 124.5 3.0 126.7 5.3 129.7 3.8June 126.1 4.3 127.9 5.8 130.4 4.7July 126.1 4.2 128.2 6.0 129.7 3.9August 126.0 4.0 128.5 6.6 129.3 3.0September 126.9 4.5 128.9 6.5 130.0 3.1October 127.1 4.1 129.2 5.8 130.6 2.3November 129.4 5.5 133.2 8.3 133.6 5.0December 132.1 6.6 134.8 7.2 137.1 6.9
2 - 26

Purchasing CPI Inflation CPI Inflation CPI Inflation CPI Inflation Power of
Rate Rate Rate Rate the Peso
SorsogonCamarines Sur Catanduanes Masbate
110.8 1.0 109.7 2.0 110.3 1.2 105.1 (0.8) 0.91110.6 1.0 109.2 2.1 111.0 1.1 104.9 (0.8) 0.91111.1 1.3 109.7 2.0 111.2 1.2 105.3 (0.6) 0.91111.4 1.0 110.2 2.1 111.3 1.2 106.0 (0.7) 0.91112.0 1.0 110.6 2.1 111.3 1.2 106.4 (0.7) 0.90112.7 1.4 111.7 2.6 112.7 1.5 107.2 (0.2) 0.89
119.3 7.3 116.9 6.4 119.8 7.9 110.8 4.1 0.85114.2 2.7 113.1 3.7 116.0 3.6 108.5 0.6 0.88115.0 3.5 114.3 4.8 116.6 4.9 108.6 1.4 0.87116.3 5.2 115.3 4.7 117.6 6.9 109.1 2.1 0.86117.1 5.1 115.5 5.2 118.8 7.9 109.9 1.8 0.86117.7 6.2 116.1 5.5 118.9 7.5 110.5 3.5 0.85118.3 6.5 116.1 5.7 120.0 8.8 110.7 4.8 0.85118.6 7.0 117.4 7.0 119.8 8.6 111.0 5.6 0.85121.4 9.8 118.0 8.1 121.2 9.2 111.8 6.6 0.84123.2 10.9 119.1 8.6 122.8 10.4 112.7 7.0 0.83123.4 10.8 120.2 9.1 122.4 10.0 112.7 6.3 0.83123.9 10.6 119.3 7.9 121.9 9.5 112.4 5.6 0.83122.7 8.9 118.0 5.6 121.1 7.5 112.2 4.7 0.83
123.5 3.5 118.6 1.5 121.7 1.6 114.1 3.0 0.82122.8 7.5 118.1 4.4 121.4 4.7 112.4 3.6 0.83123.2 7.1 118.1 3.3 121.8 4.5 113.0 4.1 0.83122.5 5.3 117.5 1.9 121.4 3.2 113.6 4.1 0.83123.2 5.2 117.5 1.7 121.6 2.4 113.9 3.6 0.83122.9 4.4 118.0 1.6 121.9 2.5 114.3 3.4 0.83122.7 3.7 118.4 2.0 121.9 1.6 114.0 3.0 0.83122.8 3.5 118.3 0.8 121.7 1.6 114.6 3.2 0.83123.3 1.6 118.4 0.3 121.5 0.2 114.6 2.5 0.83124.3 0.9 118.3 (0.7) 120.7 (1.7) 113.5 0.7 0.82124.4 0.8 119.0 (1.0) 121.0 (1.1) 114.3 1.4 0.82124.8 0.7 119.7 0.3 122.1 0.2 114.8 2.1 0.82125.1 2.0 121.4 2.9 123.4 1.9 116.0 3.4 0.81
127.9 3.6 125.4 5.7 123.8 1.7 118.7 4.0 0.79125.9 2.5 122.6 3.8 124.0 2.1 117.8 4.8 0.80126.1 2.4 122.8 4.0 122.7 0.7 118.1 4.5 0.80125.6 2.5 122.1 3.9 121.7 0.2 117.5 3.4 0.81125.4 1.8 122.4 4.2 122.2 0.5 117.6 3.2 0.81125.0 1.7 122.7 4.0 122.2 0.2 118.4 3.6 0.80128.0 4.3 125.8 6.3 122.9 0.8 118.5 3.9 0.79127.9 4.2 125.3 5.9 123.8 1.7 118.1 3.1 0.79127.9 3.7 125.2 5.7 123.4 1.6 117.6 2.6 0.79128.3 3.2 127.6 7.9 124.6 3.2 119.5 5.3 0.79128.8 3.5 127.4 7.1 124.4 2.8 119.1 4.2 0.79130.4 4.5 129.3 8.0 126.0 3.2 120.6 5.1 0.77135.0 7.9 131.4 8.2 127.9 3.6 121.2 4.5 0.76
2 - 27
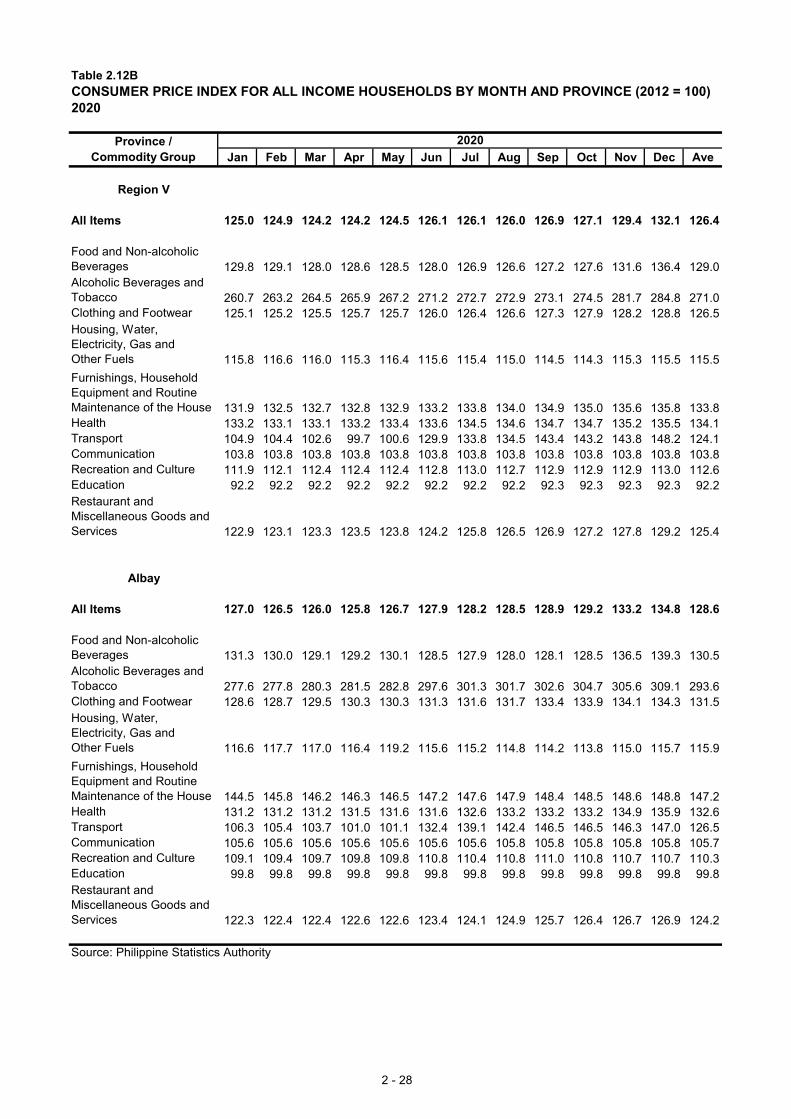
Table 2.12BCONSUMER PRICE INDEX FOR ALL INCOME HOUSEHOLDS BY MONTH AND PROVINCE (2012 = 100)2020
2020
Jan Feb Mar Apr May Jun Jul Aug Sep Oct Nov Dec Ave
Region V
All Items 125.0 124.9 124.2 124.2 124.5 126.1 126.1 126.0 126.9 127.1 129.4 132.1 126.4
Food and Non-alcoholic Beverages 129.8 129.1 128.0 128.6 128.5 128.0 126.9 126.6 127.2 127.6 131.6 136.4 129.0Alcoholic Beverages and Tobacco 260.7 263.2 264.5 265.9 267.2 271.2 272.7 272.9 273.1 274.5 281.7 284.8 271.0Clothing and Footwear 125.1 125.2 125.5 125.7 125.7 126.0 126.4 126.6 127.3 127.9 128.2 128.8 126.5Housing, Water, Electricity, Gas and Other Fuels 115.8 116.6 116.0 115.3 116.4 115.6 115.4 115.0 114.5 114.3 115.3 115.5 115.5
Furnishings, Household Equipment and Routine Maintenance of the House 131.9 132.5 132.7 132.8 132.9 133.2 133.8 134.0 134.9 135.0 135.6 135.8 133.8Health 133.2 133.1 133.1 133.2 133.4 133.6 134.5 134.6 134.7 134.7 135.2 135.5 134.1Transport 104.9 104.4 102.6 99.7 100.6 129.9 133.8 134.5 143.4 143.2 143.8 148.2 124.1Communication 103.8 103.8 103.8 103.8 103.8 103.8 103.8 103.8 103.8 103.8 103.8 103.8 103.8Recreation and Culture 111.9 112.1 112.4 112.4 112.4 112.8 113.0 112.7 112.9 112.9 112.9 113.0 112.6Education 92.2 92.2 92.2 92.2 92.2 92.2 92.2 92.2 92.3 92.3 92.3 92.3 92.2Restaurant and Miscellaneous Goods and Services 122.9 123.1 123.3 123.5 123.8 124.2 125.8 126.5 126.9 127.2 127.8 129.2 125.4
Albay
All Items 127.0 126.5 126.0 125.8 126.7 127.9 128.2 128.5 128.9 129.2 133.2 134.8 128.6
Food and Non-alcoholic Beverages 131.3 130.0 129.1 129.2 130.1 128.5 127.9 128.0 128.1 128.5 136.5 139.3 130.5Alcoholic Beverages and Tobacco 277.6 277.8 280.3 281.5 282.8 297.6 301.3 301.7 302.6 304.7 305.6 309.1 293.6Clothing and Footwear 128.6 128.7 129.5 130.3 130.3 131.3 131.6 131.7 133.4 133.9 134.1 134.3 131.5Housing, Water, Electricity, Gas and Other Fuels 116.6 117.7 117.0 116.4 119.2 115.6 115.2 114.8 114.2 113.8 115.0 115.7 115.9
Furnishings, Household Equipment and Routine Maintenance of the House 144.5 145.8 146.2 146.3 146.5 147.2 147.6 147.9 148.4 148.5 148.6 148.8 147.2Health 131.2 131.2 131.2 131.5 131.6 131.6 132.6 133.2 133.2 133.2 134.9 135.9 132.6Transport 106.3 105.4 103.7 101.0 101.1 132.4 139.1 142.4 146.5 146.5 146.3 147.0 126.5Communication 105.6 105.6 105.6 105.6 105.6 105.6 105.6 105.8 105.8 105.8 105.8 105.8 105.7Recreation and Culture 109.1 109.4 109.7 109.8 109.8 110.8 110.4 110.8 111.0 110.8 110.7 110.7 110.3Education 99.8 99.8 99.8 99.8 99.8 99.8 99.8 99.8 99.8 99.8 99.8 99.8 99.8Restaurant and Miscellaneous Goods and Services 122.3 122.4 122.4 122.6 122.6 123.4 124.1 124.9 125.7 126.4 126.7 126.9 124.2
Source: Philippine Statistics Authority
Province / Commodity Group
2 - 28

Table 2.12B - Continued
CONSUMER PRICE INDEX FOR ALL INCOME HOUSEHOLDS BY MONTH AND PROVINCE (2012 = 100)2020
2020
Jan Feb Mar Apr May Jun Jul Aug Sep Oct Nov Dec AveProvince /
Commodity Group
Camarines Norte
All Items 130.0 130.1 128.7 129.3 129.7 130.4 129.7 129.3 130.0 130.6 133.6 137.1 130.7
Food and Non-alcoholic Beverages 134.1 134.2 132.1 134.7 134.8 132.9 129.3 128.3 129.1 130.5 134.5 140.8 132.9Alcoholic Beverages and Tobacco 281.9 281.9 282.6 282.8 286.1 286.9 287.9 287.9 287.9 287.9 330.9 331.6 293.0Clothing and Footwear 123.4 123.5 123.5 123.5 123.7 123.7 123.8 123.8 123.9 123.9 123.9 124.0 123.7Housing, Water, Electricity, Gas and Other Fuels 118.7 119.1 117.1 115.0 116.5 116.0 115.7 116.0 115.4 115.2 116.0 116.6 116.4
Furnishings, Household Equipment and Routine Maintenance of the House 135.8 137.4 138.3 138.3 138.4 138.5 142.1 142.0 142.0 142.0 142.7 143.1 140.1Health 147.0 147.0 147.2 147.4 147.8 147.8 153.8 154.4 154.5 154.5 154.5 155.3 150.9Transport 108.2 106.7 104.6 100.6 100.7 126.5 138.1 138.2 143.6 143.1 147.6 150.6 125.7Communication 102.6 102.6 102.6 102.6 102.6 102.6 102.6 102.6 102.6 102.6 102.6 102.6 102.6Recreation and Culture 110.6 110.6 110.6 110.6 110.6 110.8 111.4 110.7 110.7 110.7 110.9 111.5 110.8Education 85.9 85.9 85.9 85.9 85.9 85.9 85.9 85.9 85.9 85.9 85.9 85.9 85.9Restaurant and Miscellaneous Goods and Services 127.1 127.1 127.2 127.2 127.4 127.9 128.8 128.9 128.9 128.9 129.0 129.6 128.2
Camarines Sur
All Items 125.9 126.1 125.6 125.4 125.0 128.0 127.9 127.9 128.3 128.8 130.4 135.0 127.9
Food and Non-alcoholic Beverages 134.0 133.9 133.3 133.3 132.2 132.3 131.4 131.4 131.3 132.3 135.0 143.3 133.6Alcoholic Beverages and Tobacco 266.4 272.8 273.9 276.3 277.1 277.2 277.4 277.6 277.7 277.7 277.7 282.3 276.2Clothing and Footwear 118.1 118.2 118.4 118.4 118.4 118.5 118.9 119.1 119.1 119.7 120.0 121.2 119.0Housing, Water, Electricity, Gas and Other Fuels 113.3 113.9 113.4 113.0 113.5 112.6 112.8 112.5 112.1 111.9 112.8 112.5 112.9
Furnishings, Household Equipment and Routine Maintenance of the House 130.6 130.6 130.9 131.0 131.2 131.3 131.5 131.7 134.0 134.2 135.4 135.5 132.3Health 139.7 139.8 139.9 139.6 139.8 139.9 139.6 139.3 139.6 139.4 139.8 139.9 139.7Transport 104.1 104.2 102.5 99.8 100.0 145.7 147.1 146.6 152.0 151.7 151.6 155.5 130.1Communication 103.5 103.5 103.5 103.5 103.5 103.5 103.5 103.5 103.5 103.5 103.5 103.5 103.5Recreation and Culture 110.7 111.0 111.3 111.3 111.3 111.7 111.9 111.6 111.9 111.8 111.8 111.9 111.5Education 87.6 87.6 87.6 87.6 87.6 87.6 87.6 87.6 87.6 87.6 87.6 87.6 87.6Restaurant and Miscellaneous Goods and Services 124.8 125.0 125.1 125.2 125.3 125.4 126.4 127.7 128.4 128.9 130.3 133.4 127.2
2 - 29

Table 2.12B - Continued
CONSUMER PRICE INDEX FOR ALL INCOME HOUSEHOLDS BY MONTH AND PROVINCE (2012 = 100)2020
2020
Jan Feb Mar Apr May Jun Jul Aug Sep Oct Nov Dec AveProvince /
Commodity Group
Catanduanes
All Items 122.6 122.8 122.1 122.4 122.7 125.8 125.3 125.2 127.6 127.4 129.3 131.4 125.4
Food and Non-alcoholic Beverages 126.3 126.2 124.9 126.4 126.5 126.1 124.2 123.9 123.9 123.1 126.2 129.4 125.6Alcoholic Beverages and Tobacco 188.6 193.9 196.1 197.9 199.0 200.0 200.7 202.6 201.4 203.8 209.9 209.1 200.3Clothing and Footwear 123.0 123.5 123.7 123.8 123.8 123.7 123.7 125.3 125.0 126.7 126.7 127.0 124.7Housing, Water, Electricity, Gas and Other Fuels 117.0 116.6 115.4 114.2 115.3 125.3 125.5 125.5 125.2 125.1 125.0 125.6 121.3
Furnishings, Household Equipment and Routine Maintenance of the House 122.7 123.2 122.5 122.0 122.0 122.0 122.0 122.1 122.1 122.7 122.7 122.6 122.4Health 115.6 115.7 115.7 116.0 116.0 116.1 116.1 115.8 115.8 115.9 115.0 115.1 115.7Transport 103.9 103.1 101.2 97.2 97.5 118.4 118.6 118.8 149.4 150.5 155.8 157.0 122.6Communication 100.9 100.9 100.9 100.5 100.5 100.5 100.5 100.5 100.5 100.5 100.6 100.5 100.6Recreation and Culture 118.7 119.2 119.1 119.1 119.1 119.4 121.0 121.0 121.0 121.6 121.8 121.8 120.2Education 77.8 77.8 77.8 77.8 77.8 77.8 77.8 77.8 77.8 77.8 77.8 77.8 77.8Restaurant and Miscellaneous Goods and Services 124.3 126.1 127.4 128.5 128.5 130.3 132.3 132.3 132.3 132.0 132.2 135.5 130.1
Masbate
All Items 124.0 122.7 121.7 122.2 122.2 122.9 123.8 123.4 124.6 124.4 126.0 127.9 123.8
Food and Non-alcoholic Beverages 125.7 123.4 121.7 122.9 122.2 123.1 122.8 122.1 123.8 123.2 126.3 127.1 123.7Alcoholic Beverages and Tobacco 212.4 212.9 212.9 213.6 214.6 214.8 216.7 216.7 216.8 216.8 219.0 220.8 215.7Clothing and Footwear 144.8 144.8 144.8 144.8 144.8 144.8 146.3 147.0 148.4 149.5 150.1 150.3 146.7Housing, Water, Electricity, Gas and Other Fuels 120.3 120.1 119.7 119.2 119.5 119.9 120.0 119.4 119.4 119.7 120.3 121.7 119.9
Furnishings, Household Equipment and Routine Maintenance of the House 116.6 116.6 116.8 117.0 117.0 117.4 118.0 118.1 118.4 118.4 118.5 118.6 117.6Health 118.8 117.5 117.7 118.1 118.6 119.2 119.9 120.1 119.6 119.6 119.1 118.7 118.9Transport 104.3 103.8 102.3 100.1 100.5 102.1 105.6 105.6 110.7 110.1 109.4 128.8 106.9Communication 102.4 102.4 102.4 102.4 102.4 102.4 102.4 102.4 102.4 102.4 102.4 102.4 102.4Recreation and Culture 117.5 118.0 118.5 118.5 118.5 118.5 118.8 118.1 118.1 118.1 118.2 118.3 118.3Education 148.8 148.8 148.8 148.8 148.8 148.8 148.8 148.8 148.8 148.8 148.8 148.8 148.8Restaurant and Miscellaneous Goods and Services 116.8 116.8 117.0 117.3 119.5 119.6 126.5 126.6 126.6 126.6 126.6 126.7 122.2
2 - 30

Table 2.12B - Continued
CONSUMER PRICE INDEX FOR ALL INCOME HOUSEHOLDS BY MONTH AND PROVINCE (2012 = 100)2020
2020
Jan Feb Mar Apr May Jun Jul Aug Sep Oct Nov Dec AveProvince /
Commodity Group
Sorsogon
All Items 117.8 118.1 117.5 117.6 118.4 118.5 118.1 117.6 119.5 119.1 120.6 121.2 118.7
Food and Non-alcoholic Beverages 116.6 116.1 114.9 115.8 116.3 116.4 115.5 114.9 116.9 116.0 118.2 120.0 116.5Alcoholic Beverages and Tobacco 298.0 299.8 301.0 302.2 302.7 304.1 304.5 303.8 303.7 309.9 317.7 322.8 305.9Clothing and Footwear 120.5 120.5 120.8 120.8 120.9 120.9 120.9 120.9 121.7 121.7 122.1 122.8 121.2Housing, Water, Electricity, Gas and Other Fuels 114.6 116.2 116.1 115.8 116.4 115.6 115.0 114.3 113.6 113.2 114.7 114.1 115.0
Furnishings, Household Equipment and Routine Maintenance of the House 127.4 127.6 127.6 127.6 127.8 127.9 127.9 127.9 127.6 127.7 127.9 128.4 127.8Health 126.8 126.8 126.8 126.9 127.3 127.7 127.9 127.6 127.9 128.7 128.7 128.7 127.7Transport 102.7 101.6 99.8 96.4 103.0 110.2 111.8 111.8 138.9 138.5 138.5 139.4 116.1Communication 104.4 104.4 104.4 104.4 104.4 104.4 104.4 104.4 104.4 104.4 104.4 104.4 104.4Recreation and Culture 115.7 115.7 115.7 115.7 115.7 115.7 115.7 115.0 115.1 115.4 115.4 115.5 115.5Education 74.3 74.3 74.3 74.3 74.3 74.3 74.3 74.3 75.2 75.2 75.2 75.2 74.6Restaurant and Miscellaneous Goods and Services 120.6 120.6 120.7 120.9 120.9 120.9 121.1 121.2 121.3 121.3 121.3 121.5 121.0
Figure 2.6 CONSUMER PRICE INDEX AND INFLATION RATEBY PROVINCE, 2020
0.0
0.5
1.0
1.5
2.0
2.5
3.0
3.5
4.0
4.5
5.0
5.5
6.0
6.5
7.0
0
20
40
60
80
100
120
140
160
180
200
220
240
Region V Albay CamarinesNorte
CamarinesSur
Catanduanes Masbate Sorsogon
Infl
atio
n R
ate
Co
ns
um
er
Pri
ce
Ind
ex
(2
01
2=
10
0)
CPI Inflation Rate
2 - 31

Figure 2.7 CONSUMER PRICE INDEX AND INFLATION RATEREGION V, 2014 - 2020
Figure 2.8 ANNUAL POVERTY INCIDENCE OF FAMILIES BY PROVINCE2012, 2015 AND 2018
0
1
2
3
4
5
6
7
8
100
110
120
130
140
150
160
170
180
190
2014 2015 2016 2017 2018 2019 2020
Infl
atio
n R
ate
(in
Per
cen
t)
Co
ns
um
er
Pri
ce
Ind
ex
(2
01
2=
10
0)
CPI Inflation Rate
0
5
10
15
20
25
30
35
40
45
50
Albay CamarinesNorte
Camarines Sur Catanduanes Masbate Sorsogon
In P
erc
en
t
2012 2015 2018
2 - 32

3 - 1
The economic accounts of the region, which are presented in terms of the Gross Regional Domestic Product (GRDP), provide a comprehensive and meaningful quantitative picture of the regional economy. Specifically, the GRDP shows the levels and growth of the region's economic performance; the structure of the regional economy by industrial origin; and the sectors that contributed and are of great potential to the region's growth. The accounts likewise serve as a yardstick for assessing the economic performance of the region during a given period and over a span of time. With its usefulness in charting the socioeconomic growth path of the region, the GRDP, a macroeconomic indicator of economic performance, is necessary in planning, policy formulation and analytical exercises. This chapter presents the GRDP on an annual basis in terms of levels, growth and indices at constant and current prices. The series reflected in the following tables include final estimates for 2018, revised estimates for 2019 and preliminary estimates for 2020 with 2018 as the base year. The series is generated by the Macroeconomic Accounts Services of the Philippine Statistics Authority using primary and secondary data gathered from various data producers in the country. Sector Highlights The economy of the Bicol Region declined by 8.4 percent in 2020 compared with 8.2 percent
growth in 2019. The main drivers of the decline were Construction which recorded a decline of 20.2 percent, Transportation and storage reduced by 37.8 percent, and Other services with -34.7 percent.
Services remained to account for the largest share in the region’s economy in 2020 at 47.9 percent, followed by Industry with 34.2 percent, and Agriculture, forestry and fishing with 17.9 percent share. As to contribution to the decline, Industry contributed -4.9 percentage points to the -8.4 percent regional decline in 2020. Services contributed -3.3 percentage points while Agriculture, forestry, and fishing contributed -0.2 percentage point.
Services declined by 6.9 percent in 2020 from 9.8 percent growth in the previous year. Transportation and storage, Other services, and Accommodation and food service activities had the biggest declines at 37.8 percent, 34.7 percent, and 26.3 percent, respectively
Industry contracted by 13.6 percent in 2020 as compared with the 7.9 percent growth in 2019.
Mining and quarrying had the biggest contraction at 26.9 percent, followed by Construction at 20.2 percent. Manufacturing and Electricity, steam, water and waste management also declined by 3.9 percent and 6.7 percent, respectively.
Agriculture, forestry, and fishing decreased by 1.3 percent in 2020 from 4.7 percent growth in 2019.
Per capita GRDP decreased to PhP84,362 in 2020 from Php93,050 in 2019.
Chapter 3 ECONOMIC ACCOUNTS

Table 3.1A Gross Regional Domestic Product by Industrial Origin, PhilippinesAt Current Prices, 2017 - 2020 3 - 4
Table 3.1B Gross Regional Domestic Product by Industrial Origin, PhilippinesAt Constant 2018 Prices, 2017 - 2020 3 - 4
Table 3.2A Gross Regional Domestic Product by Region, At Current Prices2017 - 2020 3 - 5
Table 3.2B Gross Regional Domestic Product by Region, At Constant 2018 Prices2017 - 2020 3 - 5
Table 3.3A Gross Regional Domestic Product by Industrial Origin, Region VAt Current Prices, 2017 - 2020 3 - 6
Table 3.3B Gross Regional Domestic Product by Industrial Origin, Region VAt Constant 2018 Prices, 2017 - 2020 3 - 6
Table 3.4A Per Capita Gross Regional Domestic Product by Region, At Current Prices2017 - 2020 3 - 7
Table 3.4B Per Capita Gross Regional Domestic Product by Region, At Constant 2018Prices, 2017 - 2020 3 - 7
Table 3.5A Expenditure on Gross Regional Domestic Product, PhilippinesAt Current Prices, 2017 - 2020 3 - 8
Table 3.5B Expenditure on Gross Regional Domestic Product, PhilippinesAt Constant 2018 Prices, 2017 - 2020 3 - 8
Table 3.6A Expenditure on Gross Regional Domestic Product by RegionAt Current Prices, 2017 - 2020 3 - 9
Table 3.6B Expenditure on Gross Regional Domestic Product by RegionAt Constant 2018 Prices, 2017 - 2020 3 - 9
Table 3.7A Expenditure on Gross Regional Domestic Product, Region VAt Current Prices, 2017 - 2020 3 - 10
Table 3.7B Expenditure on Gross Regional Domestic Product, Region VAt Constant 2018 Prices, 2017 - 2020 3 - 10
Table 3.8A Per Capita Personal Consumption Expenditure, by RegionAt Current Prices, 2017 - 2020 3 - 11
Table 3.8B Per Capita Personal Consumption Expenditure, by RegionAt Constant 2018 Prices, 2017 - 2020 3 - 11
Figure 3.1 Gross Regional Domestic Product, Growth Rates by Industry, At Constant2018 Prices, Region V, 2019 - 2020 3 - 3
Figure 3.2 Distribution of Gross Regional Domestic Product by Industry, At Constant2018 Prices, Philippines and Region V, 2020 3 - 3
Figure 3.3 Gross Regional Domestic Product, Growth Rates by Region, At Constant2018 Prices, Philippines, 2020 3 - 12
Figure 3.4 Per Capita Gross Regional Domestic Product by Region, At Constant2018 Prices, Philippines, 2020 3 - 12
3 - 2

Figure 3.1 GROSS REGIONAL DOMESTIC PRODUCT, GROWTH RATESBY INDUSTRY, AT CONSTANT 2018 PRICES
REGION V, 2019 - 2020
Figure 3.2 DISTRIBUTION OF GROSS REGIONAL DOMESTIC PRODUCTBY INDUSTRY, AT CONSTANT 2018 PRICES
PHILIPPINES AND REGION V, 2020
Services47.9%
Industry 34.2%
AFF17.9%
Region V
Services60.7%
Industry29.2%
AFF10.2%
Philippines
-14.0
-10.0
-6.0
-2.0
2.0
6.0
10.0
GRDP AFF Industry Services
In P
erc
en
t
2018-19
2019-20
3 - 3

Table 3.1AGROSS DOMESTIC PRODUCT BY INDUSTRIAL ORIGIN, PHILIPPINESAT CURRENT PRICES2017 - 2020(In Thousand Pesos)
Industry 2017 2018 2019 2020
Agriculture, Forestry, and Fishing 1,685,956,186 1,762,616,497 1,721,538,720 1,827,010,193
Industry Sector 4,987,947,862 5,582,525,289 5,919,281,491 5,094,221,546 a. Mining and Quarrying 148,093,883 163,322,489 161,656,373 136,038,605 b. Manufacturing 3,228,580,415 3,488,331,181 3,614,016,234 3,170,116,573 c. Electricity, steam, water and waste management 505,119,168 557,030,202 607,881,483 610,952,763 d. Construction 1,106,154,397 1,373,841,418 1,535,727,401 1,177,113,605
Services Sector 9,882,747,035 10,920,048,472 11,877,042,960 11,017,350,685 a. Wholesale and retail trade; repair of motor
vehicles and motorcycles 2,926,501,505 3,237,304,499 3,517,653,083 3,321,007,391b. Transportation and storage 637,191,430 697,839,118 757,661,348 548,973,320
c. Accommodation and food service activities 346,118,963 403,289,258 431,777,679 253,656,178 d. Information and communication 490,329,657 515,924,842 562,833,690 592,818,484
e. Financial and insurance activities 1,326,582,521 1,498,146,708 1,681,870,098 1,822,567,878 f. Real estate and ownership of dwellings 1,076,332,466 1,189,672,646 1,255,643,617 1,078,017,236
g. Professional and business services 1,110,458,029 1,159,264,990 1,219,756,806 1,132,869,122h. Public administration and defense;
compulsory social activities 642,126,960 767,706,111 890,687,724 950,763,267i. Education 649,365,897 731,607,263 778,867,606 715,250,142j. Human health and social work activities 289,060,244 308,268,043 329,862,202 329,707,741
k. Other services 388,679,363 411,024,994 450,429,107 271,719,927
Gross Domestic Product 16,556,651,083 18,265,190,258 19,517,863,172 17,938,582,424
Source: Philippine Statistics Authority
Table 3.1BGROSS DOMESTIC PRODUCT BY INDUSTRIAL ORIGIN, PHILIPPINESAT CONSTANT 2018 PRICES2017 - 2020(In Thousand Pesos)
Industry 2017 2018 2019 2020
Agriculture, Forestry, and Fishing 1,743,134,294 1,762,616,497 1,783,855,147 1,780,544,487
Industry Sector 5,202,581,583 5,582,525,289 5,887,868,697 5,112,114,595 a. Mining and Quarrying 160,065,486 163,322,489 168,857,016 136,939,921 b. Manufacturing 3,317,641,433 3,488,331,181 3,620,455,938 3,266,647,577 c. Electricity, steam, water and waste management 523,160,631 557,030,202 591,311,996 589,089,164 d. Construction 1,201,714,033 1,373,841,418 1,507,243,748 1,119,437,932
Services Sector 10,230,262,209 10,920,048,472 11,711,026,767 10,634,575,023 a. Wholesale and retail trade; repair of motor
vehicles and motorcycles 3,057,552,347 3,237,304,499 3,489,299,399 3,279,284,960b. Transportation and storage 648,153,071 697,839,118 742,346,502 512,769,341
c. Accommodation and food service activities 371,233,704 403,289,258 425,692,446 232,388,791 d. Information and communication 483,683,446 515,924,842 557,007,142 584,980,597
e. Financial and insurance activities 1,382,520,585 1,498,146,708 1,676,448,102 1,768,603,523 f. Real estate and ownership of dwellings 1,129,083,298 1,189,672,646 1,238,469,481 1,027,859,730
g. Professional and business services 1,117,256,516 1,159,264,990 1,182,158,583 1,064,317,515h. Public administration and defense;
compulsory social activities 666,393,280 767,706,111 871,564,283 911,353,728i. Education 671,837,203 731,607,263 766,089,016 683,563,405j. Human health and social work activities 309,315,895 308,268,043 323,261,217 310,930,256
k. Other services 393,232,863 411,024,994 438,690,597 258,523,178
Gross Domestic Product 17,175,978,086 18,265,190,258 19,382,750,611 17,527,234,105
Source: Philippine Statistics Authority
3 - 4

Table 3.2AGROSS REGIONAL DOMESTIC PRODUCT BY REGIONAT CURRENT PRICES 2017 - 2020(In Thousand Pesos)
Region 2017 2018 2019 2020
Philippines 16,556,651,083 18,265,190,258 19,517,863,172 17,938,582,424
NCR National Capital Region 5,327,124,065 5,814,440,130 6,294,194,685 5,797,058,343CAR Cordillera Administrative Region 280,805,810 308,267,122 322,106,088 296,523,327
I Ilocos Region 527,801,491 587,597,251 630,300,658 597,981,618II Cagayan Valley 358,686,602 385,061,271 399,370,781 367,095,722
III Central Luzon 1,860,323,671 2,062,393,875 2,184,815,143 1,862,908,072IVA CALABARZON 2,423,069,480 2,706,994,745 2,865,792,547 2,565,124,332
MIMAROPA 321,948,705 370,744,808 375,589,553 341,983,262V Bicol Region 465,966,050 522,014,835 560,835,429 515,793,741
VI Western Visayas 791,281,769 860,107,768 919,163,055 850,746,746VII Central Visayas 1,067,272,679 1,180,945,761 1,270,612,311 1,164,719,190
VIII Eastern Visayas 397,386,688 444,384,029 455,533,643 413,291,591IX Zamboanga Peninsula 344,667,607 379,428,020 399,109,397 394,567,642X Northern Mindanao 737,898,187 821,122,015 885,223,985 861,506,489
XI Davao Region 748,538,551 841,429,225 922,613,763 889,457,659XII SOCCKSARGEN 420,127,877 454,304,549 474,892,618 467,905,541
XIII Caraga 273,088,164 290,561,794 302,930,146 291,665,099BARMM Bangsamoro Autonomous Region
in Muslim Mindanao 210,663,685 235,393,060 254,779,370 260,254,050
Source: Philippine Statistics Authority
Table 3.2BGROSS REGIONAL DOMESTIC PRODUCT BY REGIONAT CONSTANT 2018 PRICES 2017 - 2020(In Thousand Pesos)
Region 2017 2018 2019 2020
Philippines 17,175,978,086 18,265,190,258 19,382,750,611 17,527,234,105
NCR National Capital Region 5,507,681,038 5,814,440,130 6,224,134,457 5,596,389,427CAR Cordillera Administrative Region 291,775,205 308,267,122 321,722,276 289,898,072
I Ilocos Region 554,680,762 587,597,251 630,362,667 581,894,468II Cagayan Valley 368,250,759 385,061,271 411,513,567 370,865,964
III Central Luzon 1,929,193,858 2,062,393,875 2,183,779,631 1,880,093,241IVA CALABARZON 2,527,658,901 2,706,994,745 2,831,599,919 2,535,284,422
MIMAROPA 341,505,717 370,744,808 386,783,632 357,386,005V Bicol Region 488,370,132 522,014,835 564,941,774 517,464,559
VI Western Visayas 820,773,095 860,107,768 913,909,365 825,445,426VII Central Visayas 1,102,761,503 1,180,945,761 1,254,113,393 1,129,843,546
VIII Eastern Visayas 415,257,479 444,384,029 469,292,504 433,414,325IX Zamboanga Peninsula 356,798,449 379,428,020 396,878,798 376,048,233X Northern Mindanao 766,435,831 821,122,015 867,432,424 822,553,826
XI Davao Region 785,051,181 841,429,225 900,885,668 832,093,644XII SOCCKSARGEN 424,972,061 454,304,549 469,982,193 450,001,744
XIII Caraga 276,299,208 290,561,794 306,260,878 284,138,649BARMM Bangsamoro Autonomous Region
in Muslim Mindanao 218,512,906 235,393,060 249,157,465 244,418,555
Source: Philippine Statistics Authority
3 - 5

Table 3.3AGROSS REGIONAL DOMESTIC PRODUCT BY INDUSTRIAL ORIGIN, REGION VAT CURRENT PRICES2017 - 2020(In Thousand Pesos)
Industry 2017 2018 2019 2020
Agriculture, Forestry, and Fishing 89,567,870 89,547,860 85,787,072 89,080,182
Industry Sector 158,992,829 189,863,118 203,554,535 165,557,201 a. Mining and Quarrying 8,445,103 10,118,475 9,911,437 9,063,825 b. Manufacturing 52,673,698 55,828,936 54,145,139 38,413,863 c. Electricity, steam, water and waste management 31,185,623 32,111,481 33,548,199 32,888,244 d. Construction 66,688,405 91,804,226 105,949,761 85,191,268
Services Sector 217,405,351 242,603,857 271,493,822 261,156,359 a. Wholesale and retail trade; repair of motor
vehicles and motorcycles 55,217,847 61,187,421 68,781,006 68,224,676b. Transportation and storage 19,819,809 22,626,588 26,841,724 20,783,795
c. Accommodation and food service activities 7,805,185 9,160,651 10,979,142 8,643,095 d. Information and communication 12,316,034 13,286,599 14,965,224 15,732,393
e. Financial and insurance activities 28,158,570 32,957,464 36,349,828 38,601,302 f. Real estate and ownership of dwellings 21,765,807 23,819,071 24,632,671 22,581,761
g. Professional and business services 9,904,588 10,192,794 10,736,406 9,222,810h. Public administration and defense;
compulsory social activities 17,529,159 20,728,853 24,082,243 25,683,216i. Education 28,229,989 31,615,341 34,561,399 33,265,821j. Human health and social work activities 9,763,157 9,774,903 10,820,533 12,540,927
k. Other services 6,895,205 7,254,171 8,743,645 5,876,562
Gross Regional Domestic Product 465,966,050 522,014,835 560,835,429 515,793,741
Source: Philippine Statistics Authority
Table 3.3BGROSS DOMESTIC PRODUCT BY INDUSTRIAL ORIGIN, REGION VAT CONSTANT 2018 PRICES2017 - 2020(In Thousand Pesos)
Industry 2017 2018 2019 2020
Agriculture, Forestry, and Fishing 91,311,479 89,547,860 93,731,957 92,558,526
Industry Sector 167,686,202 189,863,118 204,768,924 176,908,632 a. Mining and Quarrying 8,722,502 10,118,475 9,920,172 7,247,668 b. Manufacturing 52,685,239 55,828,936 60,135,422 57,801,999 c. Electricity, steam, water and waste management 31,379,481 32,111,481 32,439,687 30,255,561 d. Construction 74,898,981 91,804,226 102,273,643 81,603,404
Services Sector 229,372,451 242,603,857 266,440,892 247,997,401 a. Wholesale and retail trade; repair of motor
vehicles and motorcycles 59,023,220 61,187,421 68,327,570 66,489,958b. Transportation and storage 22,434,610 22,626,588 23,531,696 14,642,079
c. Accommodation and food service activities 8,527,141 9,160,651 10,238,797 7,547,909 d. Information and communication 12,603,336 13,286,599 14,069,540 14,869,466
e. Financial and insurance activities 29,971,270 32,957,464 36,452,294 37,578,280 f. Real estate and ownership of dwellings 23,133,544 23,819,071 23,851,280 21,121,405
g. Professional and business services 10,316,120 10,192,794 10,428,379 9,404,927h. Public administration and defense;
compulsory social activities 18,191,596 20,728,853 23,565,187 24,619,363i. Education 26,310,453 31,615,341 37,250,948 34,411,154j. Human health and social work activities 11,814,826 9,774,903 10,477,760 11,924,008
k. Other services 7,046,337 7,254,171 8,247,440 5,388,853
Gross Regional Domestic Product 488,370,132 522,014,835 564,941,774 517,464,559
Source: Philippine Statistics Authority
3 - 6

Table 3.4APER CAPITA GROSS REGIONAL DOMESTIC PRODUCT BY REGIONAT CURRENT PRICES 2017 - 2020(In Pesos)
Region 2017 2018 2019 2020
Philippines 158,940 172,712 181,920 164,919
NCR National Capital Region 401,598 432,181 461,671 419,935CAR Cordillera Administrative Region 159,756 173,651 179,759 164,030
I Ilocos Region 102,915 113,471 120,613 113,452II Cagayan Valley 101,390 107,568 110,333 100,361
III Central Luzon 159,443 173,452 180,481 151,287IVA CALABARZON 160,625 175,563 182,040 159,748
MIMAROPA 105,511 119,813 119,786 107,716V Bicol Region 78,481 86,916 92,373 84,090
VI Western Visayas 102,914 110,783 117,302 107,623VII Central Visayas 139,860 152,478 161,787 146,376
VIII Eastern Visayas 87,192 96,204 97,322 87,149IX Zamboanga Peninsula 93,325 101,872 106,305 104,307X Northern Mindanao 152,911 167,832 178,607 171,716
XI Davao Region 148,272 164,042 177,082 168,112XII SOCCKSARGEN 100,120 106,486 109,949 106,855
XIII Caraga 102,656 107,932 111,248 105,940BARMM Bangsamoro Autonomous Region
in Muslim Mindanao 47,404 51,898 55,039 55,087
Source: Philippine Statistics Authority
Table 3.4BPER CAPITA GROSS REGIONAL DOMESTIC PRODUCT BY REGIONAT CONSTANT 2018 PRICES 2017 - 2020(In Pesos)
Region 2017 2018 2019 2020
Philippines 164,885 172,712 180,661 161,137
NCR National Capital Region 415,210 432,181 456,532 405,399CAR Cordillera Administrative Region 165,997 173,651 179,544 160,365
I Ilocos Region 108,156 113,471 120,625 110,400II Cagayan Valley 104,093 107,568 113,688 101,392
III Central Luzon 165,346 173,452 180,396 152,683IVA CALABARZON 167,558 175,563 179,868 157,890
MIMAROPA 111,920 119,813 123,356 112,568V Bicol Region 82,254 86,916 93,050 84,362
VI Western Visayas 106,750 110,783 116,631 104,422VII Central Visayas 144,511 152,478 159,686 141,993
VIII Eastern Visayas 91,113 96,204 100,261 91,393IX Zamboanga Peninsula 96,610 101,872 105,711 99,411X Northern Mindanao 158,825 167,832 175,018 163,952
XI Davao Region 155,504 164,042 172,912 157,270XII SOCCKSARGEN 101,274 106,486 108,812 102,767
XIII Caraga 103,863 107,932 112,471 103,206BARMM Bangsamoro Autonomous Region
in Muslim Mindanao 49,170 51,898 53,825 51,736
Source: Philippine Statistics Authority
3 - 7

Table 3.5AEXPENDITURE ON GROSS REGIONAL DOMESTIC PRODUCT, PHILIPPINESAT CURRENT PRICES2017 - 2020(In Thousand Pesos)
Type of Expenditure 2017 2018 2019 2020
1. Household Final Consumption Expenditure 11,950,863,583 13,250,084,431 14,288,332,663 13,478,489,312
2. Government Final Consumption Expenditure 1,874,770,250 2,199,637,346 2,433,439,250 2,740,783,324
3. Gross Capital Formation 4,231,677,010 4,959,105,466 5,153,068,851 3,118,277,451A. Fixed Capital 4,245,610,148 4,983,346,471 5,300,100,183 3,817,050,877
1. Construction 2,421,829,516 2,939,785,849 3,290,529,095 2,322,937,2952. Durable Equipment 1,393,962,824 1,527,020,104 1,451,964,555 943,816,6003. Breeding Stock and Orchard Development 326,781,657 397,760,165 418,118,772 423,311,7334. Intellectual Property Products 103,036,150 118,780,353 139,487,762 126,985,249
B. Changes in Inventories -15,471,546 -26,943,785 -148,526,300 -699,712,362C. Valuables 1,538,408 2,702,780 1,494,968 938,936
4. Exports of goods and services to ROW 4,892,869,684 5,518,572,505 5,539,739,492 4,518,389,677A. Exports of goods to Rest of the World 2,758,686,166 3,081,897,178 2,941,577,197 2,551,888,408B. Exports of services to Rest of the World 2,134,183,518 2,436,675,327 2,598,162,295 1,966,501,269
5. Less: Imports of goods and services from ROW 6,393,529,443 7,662,209,491 7,896,717,085 5,917,357,340A. Imports of goods from Rest of the World 5,102,168,074 6,233,942,054 6,344,798,772 4,790,019,986B. Imports of services from Rest of the World 1,291,361,370 1,428,267,437 1,551,918,313 1,127,337,354
6. Net Exports to Rest of the Philippines - - - -
Gross Regional Domestic Expenditure 16,556,651,083 18,265,190,258 19,517,863,172 17,938,582,424
Source: Philippine Statistics Authority
Table 3.5BEXPENDITURE ON GROSS REGIONAL DOMESTIC PRODUCT, PHILIPPINESAT CONSTANT 2018 PRICES 2017 - 2020(In Thousand Pesos)
Type of Expenditure 2017 2018 2019 2020
1. Household Final Consumption Expenditure 12,527,828,038 13,250,084,431 14,027,455,562 12,913,708,620
2. Government Final Consumption Expenditure 1,939,879,738 2,199,637,346 2,399,867,444 2,652,951,890
3. Gross Capital Formation 4,456,327,663 4,959,105,466 5,132,349,167 3,366,706,948A. Fixed Capital 4,412,035,368 4,983,346,471 5,175,519,970 3,754,622,583
1. Construction 2,558,243,187 2,939,785,849 3,205,990,712 2,233,732,3722. Durable Equipment 1,388,078,584 1,527,020,104 1,424,524,975 1,001,452,1423. Breeding Stock and Orchard Development 368,250,283 397,760,165 403,626,950 391,191,3504. Intellectual Property Products 97,463,313 118,780,353 141,377,333 128,246,719
B. Changes in Inventories 42,766,421 -26,943,785 -44,600,241 -388,620,313C. Valuables 1,525,874 2,702,780 1,429,437 704,679
4. Exports of goods and services to ROW 4,935,390,133 5,518,572,505 5,664,043,030 4,743,507,710A. Exports of goods to Rest of the World 2,725,526,958 3,081,897,178 3,116,492,170 2,849,277,293B. Exports of services to Rest of the World 2,209,863,175 2,436,675,327 2,547,550,859 1,894,230,416
5. Less: Imports of goods and services from ROW 6,683,447,486 7,662,209,491 7,840,964,591 6,149,641,063A. Imports of goods from Rest of the World 5,384,937,508 6,233,942,054 6,311,705,691 5,030,860,423B. Imports of services from Rest of the World 1,298,509,978 1,428,267,437 1,529,258,899 1,118,780,640
6. Net Exports to Rest of the Philippines - - - -
Gross Regional Domestic Expenditure 17,175,978,086 18,265,190,258 19,382,750,611 17,527,234,105
Source: Philippine Statistics Authority
3 - 8

Table 3.6AEXPENDITURES ON GROSS REGIONAL DOMESTIC PRODUCT BY REGIONAT CURRENT PRICES 2017 - 2020(In Thousand Pesos)
Region 2017 2018 2019 2020
Philippines 16,556,651,083 18,265,190,258 19,517,863,172 17,938,582,424
NCR National Capital Region 5,327,124,065 5,814,440,130 6,294,194,685 5,797,058,343CAR Cordillera Administrative Region 280,805,810 308,267,122 322,106,088 296,523,327
I Ilocos Region 527,801,491 587,597,251 630,300,658 597,981,618II Cagayan Valley 358,686,602 385,061,271 399,370,781 367,095,722
III Central Luzon 1,860,323,671 2,062,393,875 2,184,815,143 1,862,908,072IV A CALABARZON 2,423,069,480 2,706,994,745 2,865,792,547 2,565,124,332
MIMAROPA 321,948,705 370,744,808 375,589,553 341,983,262V Bicol Region 465,966,050 522,014,835 560,835,429 515,793,741
VI Western Visayas 791,281,769 860,107,768 919,163,055 850,746,746VII Central Visayas 1,067,272,679 1,180,945,761 1,270,612,311 1,164,719,190
VIII Eastern Visayas 397,386,688 444,384,029 455,533,643 413,291,591IX Zamboanga Peninsula 344,667,607 379,428,020 399,109,397 394,567,642X Northern Mindanao 737,898,187 821,122,015 885,223,985 861,506,489
XI Davao Region 748,538,551 841,429,225 922,613,763 889,457,659XII SOCCKSARGEN 420,127,877 454,304,549 474,892,618 467,905,541
XIII Caraga 273,088,164 290,561,794 302,930,146 291,665,099BARMM Bangsamoro Autonomous Region
in Muslim Mindanao 210,663,685 235,393,060 254,779,370 260,254,050
Source: Philippine Statistics Authority
Table 3.6BEXPENDITURES ON GROSS REGIONAL DOMESTIC PRODUCT BY REGIONAT CONSTANT 2018 PRICES 2017 - 2020(In Thousand Pesos)
Region 2017 2018 2019 2020
Philippines 17,175,978,086 18,265,190,258 19,382,750,611 17,527,234,105
NCR National Capital Region 5,507,681,038 5,814,440,130 6,224,134,457 5,596,389,427CAR Cordillera Administrative Region 291,775,205 308,267,122 321,722,276 289,898,072
I Ilocos Region 554,680,762 587,597,251 630,362,667 581,894,468II Cagayan Valley 368,250,759 385,061,271 411,513,567 370,865,964
III Central Luzon 1,929,193,858 2,062,393,875 2,183,779,631 1,880,093,241IV A CALABARZON 2,527,658,901 2,706,994,745 2,831,599,919 2,535,284,422
MIMAROPA 341,505,717 370,744,808 386,783,632 357,386,005V Bicol Region 488,370,132 522,014,835 564,941,774 517,464,559
VI Western Visayas 820,773,095 860,107,768 913,909,365 825,445,426VII Central Visayas 1,102,761,503 1,180,945,761 1,254,113,393 1,129,843,546
VIII Eastern Visayas 415,257,479 444,384,029 469,292,504 433,414,325IX Zamboanga Peninsula 356,798,449 379,428,020 396,878,798 376,048,233X Northern Mindanao 766,435,831 821,122,015 867,432,424 822,553,826
XI Davao Region 785,051,181 841,429,225 900,885,668 832,093,644XII SOCCKSARGEN 424,972,061 454,304,549 469,982,193 450,001,744
XIII Caraga 276,299,208 290,561,794 306,260,878 284,138,649BARMM Bangsamoro Autonomous Region
in Muslim Mindanao 218,512,906 235,393,060 249,157,465 244,418,555
Source: Philippine Statistics Authority
3 - 9

Table 3.7AEXPENDITURE ON GROSS REGIONAL DOMESTIC PRODUCT, REGION VAT CURRENT PRICES2017 - 2020(In Thousand Pesos)
Type of Expenditure 2017 2018 2019 2020
1. Household Final Consumption Expenditure 500,855,605 561,324,804 604,161,059 575,210,210
2. Government Final Consumption Expenditure 75,396,058 85,143,886 97,437,825 108,163,745
3. Gross Capital Formation 142,545,107 181,534,196 202,053,823 136,305,863A. Fixed Capital 140,308,855 182,022,140 203,955,904 158,121,149
1. Construction 120,252,992 158,139,684 179,527,715 136,320,8322. Durable Equipment 3,816,183 4,242,428 4,515,750 3,460,9183. Breeding Stock and Orchard Development 12,336,033 14,725,496 14,440,718 14,334,3894. Intellectual Property Products 3,903,647 4,914,532 5,471,720 4,005,010
B. Changes in Inventories 2,236,237 -487,965 -1,902,098 -21,815,302C. Valuables 15 21 17 16
4. Exports of goods and services to ROW 13,500,115 14,659,882 14,644,622 9,435,401A. Exports of goods to Rest of the World 4,450,401 4,089,561 3,365,114 1,622,516B. Exports of services to Rest of the World 9,049,714 10,570,320 11,279,509 7,812,885
5. Less: Imports of goods and services from ROW 47,561,817 74,924,887 76,573,342 61,560,317A. Imports of goods from Rest of the World 32,096,211 57,348,329 57,786,900 49,194,283B. Imports of services from Rest of the World 15,465,605 17,576,558 18,786,442 12,366,035
6. Net Exports to Rest of the Philippines -218,769,017.3 -245,723,046.2 -280,888,558.0 -251,761,160.6
Gross Regional Domestic Expenditure 465,966,050 522,014,835 560,835,429 515,793,741
Source: Philippine Statistics Authority
Table 3.7BEXPENDITURE ON GROSS REGIONAL DOMESTIC PRODUCT, PHILIPPINESAT CONSTANT 2018 PRICES 2017 - 2020(In Thousand Pesos)
Type of Expenditure 2017 2018 2019 2020
1. Household Final Consumption Expenditure 533,662,743 561,324,804 595,337,807 544,797,915
2. Government Final Consumption Expenditure 78,014,511 85,143,886 96,093,570 104,697,518
3. Gross Capital Formation 160,202,016 181,534,196 198,313,314 140,428,210A. Fixed Capital 150,073,093 182,022,140 200,642,895 151,448,877
1. Construction 128,478,151 158,139,684 176,240,096 130,355,4122. Durable Equipment 3,784,962 4,242,428 4,534,324 3,980,4003. Breeding Stock and Orchard Development 14,360,998 14,725,496 14,254,934 13,073,3624. Intellectual Property Products 3,448,982 4,914,532 5,613,541 4,039,703
B. Changes in Inventories 10,128,909 -487,965 -2,329,598 -11,020,680C. Valuables 14 21 16 14
4. Exports of goods and services to ROW 13,671,618 14,659,882 14,618,226 9,174,228A. Exports of goods to Rest of the World 4,350,213 4,089,561 3,570,300 1,595,612B. Exports of services to Rest of the World 9,321,405 10,570,320 11,047,926 7,578,616
5. Less: Imports of goods and services from ROW 49,274,240 74,924,887 75,257,439 61,036,163A. Imports of goods from Rest of the World 33,568,303 57,348,329 56,744,410 49,110,640B. Imports of services from Rest of the World 15,705,937 17,576,558 18,513,029 11,925,523
6. Net Exports to Rest of the Philippines -247,906,517 -245,723,046 -264,163,704 -220,597,149
Gross Regional Domestic Expenditure 488,370,132 522,014,835 564,941,774 517,464,559
Source: Philippine Statistics Authority
3 - 10

Table 3.8APER CAPITA HOUSEHOLD FINAL CONSUMPTION EXPENDITURE, BY REGIONAT CURRENT PRICES2017 - 2020(In Pesos)
Region 2017 2018 2019 2020
Philippines 114,725 125,290 133,177 123,915
NCR National Capital Region 210,168 228,147 244,668 225,643CAR Cordillera Administrative Region 115,653 124,841 131,679 123,371
I Ilocos Region 103,761 114,290 121,262 113,170II Cagayan Valley 78,936 87,647 94,126 88,143
III Central Luzon 139,842 151,004 160,106 149,736IV A CALABARZON 131,837 142,974 151,565 139,906
MIMAROPA 90,822 101,036 106,393 100,660V Bicol Region 84,357 93,461 99,509 93,777
VI Western Visayas 91,196 100,662 106,977 99,969VII Central Visayas 96,360 106,346 112,211 103,883
VIII Eastern Visayas 75,921 83,419 88,395 82,371IX Zamboanga Peninsula 69,000 76,601 81,779 76,423X Northern Mindanao 86,949 94,351 100,097 93,777
XI Davao Region 98,495 109,264 114,796 106,707XII SOCCKSARGEN 80,830 88,756 93,776 87,914
XIII Caraga 74,503 81,543 85,471 81,017BARMM Bangsamoro Autonomous Region
in Muslim Mindanao 58,251 62,688 66,551 62,843
Source: Philippine Statistics Authority
Table 3.8BPER CAPITA HOUSEHOLD FINAL CONSUMPTION EXPENDITURE, BY REGIONAT CONSTANT 2018 PRICES2017 - 2020(In Pesos)
Region 2017 2018 2019 2020
Philippines 120,264 125,290 130,746 118,723
NCR National Capital Region 221,045 228,147 239,835 216,824CAR Cordillera Administrative Region 119,584 124,841 129,731 118,236
I Ilocos Region 109,551 114,290 119,069 108,577II Cagayan Valley 83,004 87,647 92,788 84,082
III Central Luzon 143,765 151,004 156,501 142,950IV A CALABARZON 137,683 142,974 148,586 133,986
MIMAROPA 95,156 101,036 104,960 95,469V Bicol Region 89,883 93,461 98,056 88,818
VI Western Visayas 96,258 100,662 105,099 95,370VII Central Visayas 101,456 106,346 110,259 100,409
VIII Eastern Visayas 79,833 83,419 87,033 79,116IX Zamboanga Peninsula 73,031 76,601 81,520 74,665X Northern Mindanao 91,220 94,351 97,941 89,612
XI Davao Region 103,680 109,264 113,693 103,541XII SOCCKSARGEN 85,515 88,756 91,779 83,340
XIII Caraga 77,285 81,543 84,486 77,040BARMM Bangsamoro Autonomous Region
in Muslim Mindanao 62,160 62,688 65,210 59,783
Source: Philippine Statistics Authority
3 - 11

Figure 3.3 GROSS REGIONAL DOMESTIC PRODUCT, GROWTH RATESBY REGION, AT CONSTANT 2018 PRICES
PHILIPPINES, 2020
Figure 3.4 PER CAPITA GROSS REGIONAL DOMESTIC PRODUCTBY REGION, AT CONSTANT 2018 PRICES
PHILIPPINES, 2020
0
40,000
80,000
120,000
160,000
200,000
240,000
280,000
320,000
360,000
400,000
440,000
In P
es
os
-14.0
-13.0
-12.0
-11.0
-10.0
-9.0
-8.0
-7.0
-6.0
-5.0
-4.0
-3.0
-2.0
-1.0
0.0
In P
erc
en
t
3 - 12

4 - 1
Data on the region's natural resources and some indicators of its environmental condition are necessary in the formulation of policies and programs designed to bring about a more effective environmental protection and resource utilization. A growing awareness and national concern on the country's natural resources and environmental condition have been demonstrated during the past years. This resulted from the development vision long espoused by national and local leaders and the worldwide goal towards sustainable development. The said goal, now a global advocacy, implies a balance between resource utilization and development, protection and conservation of the country's environment and natural resources. In this fashion, development will benefit not only today's generation but the future ones as well. All these concerns underscore the need for more reliable, timely, and comprehensive data. The data are critical to the government, private sector, and even international community in their formulation of measures to safeguard the environment and natural resources and to remedy destruction and degradation in these areas. This chapter presents data on existing/available land, forest, mineral, and watershed areas of the region and/or its provinces. Meanwhile, environmental statistics pertain to the results of resource extraction and climatological occurrences. The data sources include the Department of Environment and Natural Resources, Mines and Geo-Sciences Bureau and Forest Management Bureau. Sector Highlights Certified Alienable and Disposal Lands comprised 69.3 percent of the total land area of the Bicol
Region in 2020. Classified Forest lands made up 29.0 percent while Unclassified Forest Lands accounted for 1.7 percent.
Volume of gold production reported by the Mines and Geosciences Bureau (MGB) of the Department of Environment and Natural Resources (DENR) declined by 5.8 percent from 6,760.6 kilograms in 2019 to 6,367.1 kilograms in 2020. While silver production likewise decreased by 13.4 percent in 2020.
As of 2017, the fourteen proclaimed major watersheds in the region covered an area of 98,755.95
hectares. Log production in the Bicol Region declined by 49.26 metric tons in 2020 from 757.18 metric tons
in 2019, down by 6.5 percent.
Chapter 4 ENVIRONMENT AND NATURAL RESOURCES

Table 4.1 Status of Land Classification by Province, 2011 - 2020 4 - 4
Table 4.2 Land Use Status by Province, 2019 and 2020 4 - 8
Table 4.3 Production of Selected Non-Timber Forest Products, Region V,2015 - 2020 4 - 9
Table 4.4 Volume and Estimated Value of Mineral Production, Metallic andNon-metallic, Region V, 2015 - 2020 4 - 10
Table 4.5 Monthly Log Production by Province, Region V, 2016 - 2020 4 - 12
Table 4.6 Major Proclaimed Watershed Areas by Province, As of 2017 4 - 14
Figure 4.1 Status of Land Classification, Region V, 2016 - 2020 4 - 3
Figure 4.2 Land Distribution by Province, Region V, 2020 4 - 3
4 - 2

Figure 4.1 STATUS OF LAND CLASSIFICATIONREGION V, 2016 - 2020
Figure 4.2 LAND DISTRIBUTION BY PROVINCEREGION V, 2020
Albay14.5%
Camarines Norte12.0%
Camarines Sur29.9%
Catanduanes8.6%
Masbate23.0%
Sorsogon12.1%
Unclassified Forest Lands
Classified Forest Lands
Certified A & D
0
200,000
400,000
600,000
800,000
1,000,000
1,200,000
1,400,000
20162017
20182019
2020
In Hectares
4 - 3

Table 4.1STATUS OF LAND CLASSIFICATION BY PROVINCE2011 - 2020(In Hectares)
Province / Land Classification 2011 2012 2013 2014
Region V
Total Land Area 1,763,250 1,763,250 1,763,249 1,763,250
Certified Alienable and Disposable 1,238,091 1,238,091 1,222,060 1,238,091 Unclassified Forest Lands 18,367 18,367 29,873 18,367 Classified Forest Lands 506,792 506,792 511,316 506,792
Established Forest Reserve 63,172 63,172 69,939 63,172 Established Timber Land 380,141 380,141 412,996 380,141National Parks, GRBS & Wildlife Areas 27,289 27,289 25,276 27,289Communal Forest 11,707 11,707 - 11,707 Civil Reservation 135 135 63 135Fishpond 2,553 2,553 3,042 2,553Mangrove 21,795 21,795 - 21,795
Albay
Total Land Area 255,260 255,260 255,257 255,260
Certified Alienable and Disposable 217,062 217,062 206,205 217,062 Unclassified Forest Lands - - - - Classified Forest Lands 38,198 38,198 49,052 38,198
Established Forest Reserve 7,603 7,603 5,026 7,603Established Timber Land 21,751 21,751 38,517 21,751National Parks, GRBS & Wildlife Areas 8,132 8,132 5,459 8,132Communal Forest - - - - Civil Reservation - - - - Fishpond 18 18 50 18Mangrove 694 694 - 694
Camarines Norte
Total Land Area 211,250 211,250 211,249 211,250
Certified Alienable and Disposable 124,319 124,319 140,030 124,319 Unclassified Forest Lands 2,629 2,629 12,872 2,629 Classified Forest Lands 84,302 84,302 58,347 84,302
Established Forest Reserve 7,379 7,379 796 7,379Established Timber Land 67,772 67,772 54,638 67,772National Parks, GRBS & Wildlife Areas 4,255 4,255 2,840 4,255Communal Forest 818 818 - 818Civil Reservation - - - - Fishpond 25 25 73 25Mangrove 4,053 4,053 - 4,053
Camarines Sur
Total Land Area 526,680 526,680 526,682 526,680
Certified Alienable and Disposable 375,498 375,498 365,551 375,498 Unclassified Forest Lands 4,542 4,542 4,354 4,542 Classified Forest Lands 146,640 146,640 156,777 146,640
Established Forest Reserve 4,516 4,516 15,027 4,516Established Timber Land 117,141 117,141 127,471 117,141National Parks, GRBS & Wildlife Areas 11,559 11,559 13,145 11,559
Source: Department of Environment and Natural Resources, Regional Office V
4 - 4

2015 2016 2017 2018 2019 2020
1,763,250 1,763,250 1,763,250 1,763,250 1,763,249 1,763,249
1,238,091 1,238,091 1,238,091 1,238,091 1,222,060 1,222,06018,367 18,367 18,367 18,367 29,873 29,873
506,792 506,792 506,792 506,792 511,316 511,31663,172 63,172 63,172 63,172 69,939 69,939
380,141 380,141 380,141 380,141 412,996 412,99627,289 27,289 27,289 27,289 25,276 25,27611,707 11,707 11,707 11,707 - -
135 135 135 135 63 632,553 2,553 2,553 2,553 3,042 3,042
21,795 21,795 21,795 21,795 - -
255,260 255,260 255,260 255,260 255,257 255,257
217,062 217,062 217,062 217,062 206,205 206,205- - - -
38,198 38,198 38,198 38,198 49,052 49,0527,603 7,603 7,603 7,603 5,026 5,026
21,751 21,751 21,751 21,751 38,517 38,5178,132 8,132 8,132 8,132 5,459 5,459
- - - - - -- - - - - -
18 18 18 18 50 50694 694 694 694 - -
211,250 211,250 211,250 211,250 211,249 211,249
124,319 124,319 124,319 124,319 140,030 140,0302,629 2,629 2,629 2,629 12,872 12,872
84,302 84,302 84,302 84,302 58,347 58,3477,379 7,379 7,379 7,379 796 796
67,772 67,772 67,772 67,772 54,638 54,6384,255 4,255 4,255 4,255 2,840 2,840
818 818 818 818 - -- - - - - -
25 25 25 25 73 734,053 4,053 4,053 4,053 - -
526,680 526,680 526,680 526,680 526,682 526,682
375,498 375,498 375,498 375,498 365,551 365,5514,542 4,542 4,542 4,542 4,354 4,354
146,640 146,640 146,640 146,640 156,777 156,7774,516 4,516 4,516 4,516 15,027 15,027
117,141 117,141 117,141 117,141 127,471 127,47111,559 11,559 11,559 11,559 13,145 13,145
4 - 5

Table 4.1 - ContinuedSTATUS OF LAND CLASSIFICATION BY PROVINCE2011 - 2020(In Hectares)
Province / Land Classification 2011 2012 2013 2014
Communal Forest 6,659 6,659 - 6,659Civil Reservation 72 72 - 72Fishpond 432 432 1,134 432Mangrove 6,261 6,261 - 6,261
Catanduanes
Total Land Area 151,150 151,150 151,148 151,150
Certified Alienable and Disposable 82,392 82,392 73,325 82,392 Unclassified Forest Lands 127 127 549 127 Classified Forest Lands 68,631 68,631 77,274 68,631
Established Forest Reserve 31,785 31,785 6,725 31,785Established Timber Land 34,324 34,324 70,486 34,324National Parks, GRBS & Wildlife Areas 209 209 - 209Communal Forest 1,657 1,657 - 1,657Civil Reservation 63 63 63 63Fishpond - - - - Mangrove 593 593 - 593
Masbate
Total Land Area 404,770 404,770 404,769 404,770
Certified Alienable and Disposable 260,244 260,244 263,384 260,244 Unclassified Forest Lands 1,603 1,603 1,846 1,603 Classified Forest Lands 142,923 142,923 139,539 142,923
Established Forest Reserve 663 663 34,298 663Established Timber Land 133,468 133,468 104,121 133,468National Parks, GRBS & Wildlife Areas 596 596 159 596Communal Forest 760 760 - 760Civil Reservation - - - - Fishpond 1,076 1,076 961 1,076Mangrove 6,360 6,360 - 6,360
Sorsogon
Total Land Area 214,140 214,140 214,144 214,140
Certified Alienable and Disposable 178,576 178,576 173,565 178,576 Unclassified Forest Lands 9,466 9,466 10,252 9,466 Classified Forest Lands 26,098 26,098 30,327 26,098
Established Forest Reserve 11,226 11,226 8,067 11,226Established Timber Land 5,685 5,685 17,763 5,685National Parks, GRBS & Wildlife Areas 2,538 2,538 3,673 2,538Communal Forest 1,813 1,813 - 1,813Civil Reservation - - - - Fishpond 1,002 1,002 824 1,002Mangrove 3,834 3,834 - 3,834
4 - 6

2015 2016 2017 2018 2019 2020
6,659 6,659 6,659 6,659 - -72 72 72 72 - -
432 432 432 432 1,134 1,1346,261 6,261 6,261 6,261 - -
151,150 151,150 151,150 151,150 151,148 151,148
82,392 82,392 82,392 82,392 73,325 73,325127 127 127 127 549 549
68,631 68,631 68,631 68,631 77,274 77,27431,785 31,785 31,785 31,785 6,725 6,72534,324 34,324 34,324 34,324 70,486 70,486
209 209 209 209 - -1,657 1,657 1,657 1,657 - -
63 63 63 63 63 63- - - - - -
593 593 593 593 - -
404,770 404,770 404,770 404,770 404,769 404,769
260,244 260,244 260,244 260,244 263,384 263,3841,603 1,603 1,603 1,603 1,846 1,846
142,923 142,923 142,923 142,923 139,539 139,539663 663 663 663 34,298 34,298
133,468 133,468 133,468 133,468 104,121 104,121596 596 596 596 159 159760 760 760 760 - -
- - - - - -1,076 1,076 1,076 1,076 961 9616,360 6,360 6,360 6,360 - -
214,140 214,140 214,140 214,140 214,144 214,144
178,576 178,576 178,576 178,576 173,565 173,5659,466 9,466 9,466 9,466 10,252 10,252
26,098 26,098 26,098 26,098 30,327 30,32711,226 11,226 11,226 11,226 8,067 8,067
5,685 5,685 5,685 5,685 17,763 17,7632,538 2,538 2,538 2,538 3,673 3,6731,813 1,813 1,813 1,813 - -
- - - - - -1,002 1,002 1,002 1,002 824 8243,834 3,834 3,834 3,834 - -
4 - 7

Table 4.2 LAND USE STATUS BY PROVINCE2019 and 2020(In Hectares)
Region V Albay Camarines Camarines Catan- Masbate SorsogonNorte Sur duanes
2019
T o t a l 1,763,250 255,260 211,250 526,680 151,150 404,770 214,140
Forest 163,409 26,425 27,880 52,056 39,507 2,465 15,076Closed Broad Leaved 24,771 1,811 6,377 4,527 12,056 - - Mixed - - - - - - - Open Forest Broad Leaved 123,638 23,751 17,813 44,594 25,900 - 11,580 Mixed - - - - - - - Mangrove Forest 15,000 863 3,690 2,935 1,551 2,465 3,496
Other Land 1,599,841 228,835 183,370 474,624 111,643 402,305 199,064Wooded Shrubs 143,690 52,197 - 7,005 10 43,890 40,588 Wooded Grassland 103,114 14,307 39,367 29,132 21 3,951 16,336Natural Barren Land 1,695 1,695 - - - - - Grassland 188,282 27,425 1,663 36,624 486 109,685 12,399Cultivated Annual Crop 447,088 78,138 27,546 190,624 21,961 97,985 30,834 Perennial 676,180 52,471 107,475 198,295 86,964 136,015 94,960Fishpond 20,963 212 5,100 4,348 527 8,487 2,289Built-up Area 6,347 1,990 840 1,581 837 564 535
Inland Water 12,482 400 1,379 7,015 837 1,728 1,123
2020
T o t a l 1,763,250 255,260 211,250 526,680 151,150 404,770 214,140
Forest 163,409 26,425 27,880 52,056 39,507 2,465 15,076Closed Broad Leaved 24,771 1,811 6,377 4,527 12,056 - - Mixed - - - - - - - Open Forest Broad Leaved 123,638 23,751 17,813 44,594 25,900 - 11,580 Mixed - - - - - - - Mangrove Forest 15,000 863 3,690 2,935 1,551 2,465 3,496
Other Land 1,599,841 228,835 183,370 474,624 111,643 402,305 199,064Wooded Shrubs 143,690 52,197 - 7,005 10 43,890 40,588 Wooded Grassland 103,114 14,307 39,367 29,132 21 3,951 16,336Natural Barren Land 1,695 1,695 - - - - - Grassland 188,282 27,425 1,663 36,624 486 109,685 12,399Cultivated Annual Crop 447,088 78,138 27,546 190,624 21,961 97,985 30,834 Perennial 676,180 52,471 107,475 198,295 86,964 136,015 94,960Fishpond 20,963 212 5,100 4,348 527 8,487 2,289Built-up Area 6,347 1,990 840 1,581 837 564 535
Inland Water 12,482 400 1,379 7,015 837 1,728 1,123
Note: Generated from 2015 Land Cover Maps based on digitally classified LANDSAT 8 imageries with 30m resolution taken from 2014-2016 with ground validation for LC 2015.
Source: NAMRIA, Department of Environment and Natural Resources
Land Use
4 - 8

Table 4.3PRODUCTION OF SELECTED NON-TIMBER FOREST PRODUCTS, REGION V2015 - 2020
Forest Products Unit 2015 2016 2017 2018 2019 2020
Anahaw Leaves piece 113,330 60,650 103,236 49,145 38,300 36,572 Anahaw Poles piece 13,912 6,952 2,508 10,091 6,488 16,263 Anahaw Poles cubic meter - 21 - - - - Anahaw Palm Leaves piece - - - - - - Anahaw Palm Poles piece - - - - - - Bamboo piece - 1,230 - - - - Bamboo Craft piece - - - - - - Bamboo Culm piece 11,370 - - - - - Bamboo Poles piece 16,107 2,265 500 5,350 2,524 4,581 Bamboo Split bundle 61,107 - - - 30,000 Bamboo Split piece - 32,133 - 14,895 - 66,600 Bamboo Taps piece 325 - - - - - Bamboo Sawali piece - 279 2,250 1,075 25,868 1,500 Bamboo Sawali Rolls piece - 720 - 3,390 - 10,830 Bamboo (marurugi) piece - 130 - - - - Betelnut Poles piece - - - - - 20 Boho piece - 110 - - - - Brushlands piece - - 50 - - - Charcoal cubic meter - - - - 774.82 1,283.10 Charcoal sack - - - 60 - - Daso Poles piece 1,000 - - - - - Furniture piece - - 24 - - - Gugo Vines kilo - 7,000 - - - - Kakawate Bamboo Poles piece - 100 - - - - Kawayan Tinik Sawali rolls - - - 1,070 - - Kawayan Tinik Sawali piece - - - 9,180 - - Kawayan Tinik Split piece - 31,600 4,500 22,450 - - Kawayan Tinik Poles piece - 4,000 21,906 22,075 5,834 13,835 Kawayan Tinik Bamboo Poles piece - 5,270 - - - - Kawayan Tinik Leaves piece - 7,000 - - - - Madre de Cacao piece 3,500 300 - - - - Mahogany cubic meter - 4 - - - - Mahogany/Gmelina cubic meter - 5 - - - - Mahogany/Gmelina, Langka Posts piece - - - 250 - - Nipa piece - 10,000 - - - - Nipa Shingles piece 565,500 984,200 480,000 497,000 261,000 232,000 Nipa and Bamboo Split piece - - - - - - Pili Resin gms - - - 120 - - Pili, Santol, Gumihan Posts piece - - - 200 - - Rattan Poles lineal meter - - - - - - Rattan Poles piece - - - - 6,000 34,250 Sawali piece 540 - 7,800 - - - Slabs piece 35 - - - - - Split Rattan lineal meter - - - - 10,000 Taldok (Madri de Cacao) piece 700 - - - - - Taguisi Poles piece - - - - - - Unsplit Rattan lineal meter - - - - - - Vines (Black vines) bundle 300 - - - - - Vines (Lamon) piece 45,000 - - - - -
Source: Forest Management Bureau, Department of Environment and Natural Resources, Regional Office V
4 - 9

Table 4.4VOLUME AND ESTIMATED VALUE OF MINERAL PRODUCTION, METALLIC AND NON-METALLIC,REGION V2015 - 2020(Value in Thousand Pesos)
2015 2016Volume Value Volume Value
Metallics
Copper Concentrate DMT - - - - Gold Kg. 5,469.8 9,169,501.5 6,414.3 13,566,213.1Gold by-product troy oz - - - - Gold (Tailings) M.T. - - - - Iron Ore M.T. - - - - Silver Kg. 4,308.8 97,906.3 7,430.0 198,129.0Silver by-product troy oz - - - - Zinc Concentrate DMT - - - -
Non-Metallics
Aggregates Cu.M. 2,900.0 100.3 5,400.0 182.8Armor Rock Cu.M. - - - - Bentonite Cu.M. 2,100.0 418.0 2,200.0 439.6Bentonite M.T. - - - - Boulder Cu.M. 87,900.0 3,945.2 163,100.0 6,990.7Clay for ceramics Cu.M. - - - - Clay M.T. - - - - Decorative Stone M.T. - - - - Diatomaceous Earth M.T. - - - - Earthfill Cu.M. 219,136.0 7,941.1 331,854.0 12,289.9Guano M.T. - - - - Limestone Cu.M. 340,000.0 15,640.0 300,000.0 13,800.0Limestone M.T. - - - - Marble M.T. - - - - Perlite Cu.M. - - - - Perlite M.T. 15,830.5 9,891.7 6,903.2 4,460.6Low Grade Perlite M.T. - - 7,319.4 966.2Pumice Cu.M. 2,955.0 1,891.2 13,270.0 2,392.8Pumicites Cu.M. - - - - Sand and Gravel Cu.M. 921,162.5 59,115.9 1,632,587.5 100,098.6Sand and Gravel/Boulder Cu.M. - - - - Selected Stone Cu.M. - - - - Shale Clay M.T. 6,340.0 63.4 - - Silica Quartz M.T. - - - - Silica Sand Cu.M. - - - - Silica Sand M.T. - - - - White Clay (Siruma) M.T. - - - - White Clay/Kaolin Clay M.T. - - - - White Clay/Kaolin/Silica Sand/Quartz M.T. - - - - White Sand Cu.M. 47,000.0 1,391.5 27,800.0 824.1Zeolite Cu.M. - - - -
Source: Mines and Geo-Sciences Bureau, Regional Office V
Mineral Unit
4 - 10

2017 2018 2019 2020Volume Value Volume Value Volume Value Volume Value
- - - - - - - - 6,295.0 12,813,835.3 6,733.8 14,452,717.4 6,760.6 15,605,957.4 6,367.1 17,923,808.9
- - - - - - - - - - - - - - - - - - - - - - - -
6,623.4 183,185.0 4,925.1 130,928.9 5,135.9 137,889.7 4,446.8 142,719.6 - - - - - - - - - - - - - - - -
18,950.0 1,439.1 22,050.0 3,234.8 3,150.0 465.10 1,500.0 257.30 - - 11,400.0 1,661.3 9,350.0 1,350.27 8,564.0 1,425.90
3,500.0 409.1 2,600.0 663.0 - - - - - - - - 4,200.0 600.00 2,575.0 471.00
350,260.0 37,306.8 546,050.0 79,618.1 385,550.0 56,326.88 304,551.0 52,560.11 - - - - - - 15,459.0 6,166.08
7,340.0 2,860.0 13,000.0 5,200.0 - - - - - - - - - - - - - - - - - - - -
365,739.0 29,512.5 481,169.0 58,493.7 402,273.0 47,952.66 258,610.3 35,129.10 - - - - - - - -
300,000.0 13,800.0 - - - - - - - - 380,418.0 24,987.2 681,455.0 52,277.60 357,015.0 34,248.90 - - 2,000.0 800.0 - - - - - - - - - - - -
13,769.2 9,550.1 7,208.0 4,384.8 6,608.0 3,964.80 - - 20,579.4 1,728.7 2,488.8 209.1 - - - -
3,780.0 2,419.2 3,120.0 1,996.6 450.0 300.80 15,774.4 4,267.20 40,000.0 1,200.0 - - - - - -
2,840,769.0 271,533.4 4,310,316.7 601,433.9 2,963,813.7 398,877.48 2,485,945.0 398,759.53 - - - - - - - - - - - - - - - - - - 936.0 93.6 - - 2,484.0 124.20 - - - - - - - - - - - - 36,000.0 4,704.00 10,000.0 1,206.00
340.0 68.0 20,100.0 2,205.0 - - - - - - - - - - - - - - - - - - - - - - - - - - - -
20,100.0 1,658.6 - - - - - - - - - - 100.0 24.00 - -
4 - 11

Table 4.5MONTHLY LOG PRODUCTION BY PROVINCE, REGION V2016 - 2020(In cubic meter)
Province Total January February March April May
2016Region V 1,320.14 94.31 - 20.57 35.24 62.49
Albay 164.63 53.60 - 20.57 1.09 - Camarines Norte 319.00 40.71 - - - 33.72 Camarines Sur 215.46 - - - - 13.58Catanduanes - - - - - - Masbate 233.01 - - - 34.15 15.19 Sorsogon 388.04 - - - - -
2017Region V 690.84 16.10 135.48 31.42 192.88 92.33
Albay 93.56 - 6 - 3.38 23 Camarines Norte 5.88 - - - 6 - Camarines Sur 41.10 - - - - - Catanduanes - - - - - - Masbate 12.30 - - - - - Sorsogon 538.00 16 129 31 184 69
2018Region V 975.54 72.04 113.98 172.41 158.24 89.59
Albay 35.63 23.56 3.63 - - - Camarines Norte 341.08 20.77 9.75 70.11 31.94 29.47 Camarines Sur 342.59 17.30 30.25 46.52 62.78 50.00 Catanduanes 52.29 - - - 52.29 - Masbate 14.65 0.64 - 2.78 11.23 - Sorsogon 189.30 9.77 70.35 53.00 - 10.12
2019Region V 757.18 143.66 103.41 27.57 94.38 91.17
Albay 172.61 - - 25 15 10 Camarines Norte 188.15 20.03 11.17 - 71.68 50.43 Camarines Sur 0.64 - - - - - Catanduanes 0.00 - - - - - Masbate 0.00 - - - - - Sorsogon 395.77 123.63 92.24 2.09 8 30.81
2020Region V 707.92 118.41 63.93 0.65 39.49 27.53
Albay 268.50 34.58 63.93 0.65 - - Camarines Norte 35.97 33.25 - - - - Camarines Sur 241.26 45.49 - - - - Catanduanes 0.00 - - - - - Masbate 1.77 - - - - - Sorsogon 160.42 5.09 - - 39.49 27.53
Notes: Details may not add up to totals due to rounding.
Source: Forest Management Bureau, Department of Environment and Natural Resources, Regional Office V
4 - 12

June July August September October November December
52.34 86.70 112.69 88.02 349.22 261.78 156.80
10.69 48.84 14.49 1.06 3.01 0.91 10.388.32 - 24.80 40.08 25.81 107.69 37.87 6.09 14.40 9.00 28.90 35.61 - 107.89
- - - - - - - 27.24 23.46 64.40 - 12.13 56.44 -
- - - 17.98 272.66 96.74 0.66
2.07 30.80 48.02 30.81 11.46 99.47 0.00
- 16.74 27.59 11.03 4.70 0.68 - - - - - - - - - 5.16 16.38 16.38 - 3 - - - - - - - - - 8.90 - 3 - - - 2 - 4 - 6.76 95.61 -
95.47 2.50 3.38 39.39 42.40 106.99 79.16
- 2.50 3.23 2.71 - - - 28.07 - - 25.13 11.64 71.48 42.72 45.73 - 0.15 30.00 29.90 29.96
- - - - - - - - - - - - - -
21.67 - - 11.55 0.76 5.61 6.48
35.96 32.88 97.08 15.86 48.66 48.93 17.62
23 14.17 8.91 - 45 29 2 - - 32 2.59 - - - - - 0.64 - - - - - - - - - - - - - - - - - -
13.40 19 55 13.27 3.60 19.57 15.57
9.43 60.62 34.08 64.09 57.41 203.14 29.14
6.00 39.47 8.70 36.73 40.78 37.66 - - 2.72 - - - - - - 4.57 0.93 16.31 8.96 136.46 28.54 - - - - - - -
1.77 - - - - - - 1.66 13.86 24.45 11.05 7.67 29.02 0.60
4 - 13

Table 4.6MAJOR PROCLAIMED PROTECTED AREAS BY PROVINCEAs of 2017(Area Covered in Hectares)
Name of Municipalities Total Area ProclamationWatershed Covered Covered No. Date
Region V 98,755.95
Albay 43,471.00Bacon Manito Watershed Geothermal Bacon, Manito 25,000.00 2036 A 11/11/80
(Amd. EO 837) (10/14/82)
Mt. Masaraga Watershed Forest Reserve Ligao, Oas, 810.00 84 10/27/92Polangui, Tabaco
Tiwi Watershed Forest Reserve Malinao, Tiwi 17,661.00 739 08/14/70
Camarines Norte 7,501.00Abasig-Matogdon-Mananap Watershed Labo 5,545.00 836 11/18/91 Forest Reserve San Lorenzo Ruiz
San Vicente
Capalonga Watershed Forest Reserve Capalonga 752.00 128 11/25/66
Dahican Watershed Forest Reserve Mambulao 44.00 592 06/23/33
Jose Panganiban Watershed Jose Panganiban 1,160.00 1151 01/09/98 Forest Reserve
Camarines Sur 18,840.00Buhi-Barit Watershed Reservation Buhi 18,370.00 573 06/26/69
SagñayIriga
Lagonoy Watershed Forest Reserve Lagonoy 470.00 500 09/26/32
Catanduanes 26,010.00Catanduanes Watershed Forest Reserve Virac, Bato, 26,010.00 123 06/23/87
San Miguel,Pandan, Calolbon,Baras
Masbate 1,901.95Diwata Watershed Forest Reserve San Fernando 350.00 370 05/02/94
Matang-Tubig Watershed Forest Reserve Monreal 1,305.00 368 05/22/94
Tugbo Watershed Forest Reserve Mobo 246.95 369 05/02/94
Sorsogon 1,032.00Magallanes and Juban Watershed Magallanes 1,032.00 108 11/23/92 Forest Reserve Juban
Source: Forest Management Bureau - Department of Environment and Natural Resources
Province
4 - 14

5 - 1
`
Data on agriculture and agrarian reform are vital in guiding our decision makers, administrators and lawmakers. Agriculture plays a major role in the growth and stability of the region's economy with a sizeable portion of the population dependent on it for livelihood. Furthermore, the sector is a major source of food needed for the survival of the population. These factors then mandate the key players in government to give priority to agricultural development. This also means focusing on the agrarian reform program in order to promote social justice, sound rural development and industrialization. Specifically, the data provide objective bases for redirecting the focus of legislation and development plans for agriculture and fishery and the implementation of the agrarian reform agenda. The data also provide indicators of the successes and impacts of strategies/programs/projects in the lives of farmers and fisherfolks in the countryside. The status and trends portrayed by the data are used in redefining the beneficiaries of interventions in this sector. In this manner, the systems of monitoring and assessment of programs/projects can be refocused to give greater attention to problems and potential areas.
This chapter presents regional and provincial data on crops, livestock, poultry, fishery, number and area of farms by size, and status of the Comprehensive Agrarian Reform Program (CARP) and number of registered and confirmed cooperatives. The statistics on crops, livestock, poultry, and fishery are sourced from the Philippine Statistics Authority (PSA) resulting from its various surveys. Also, the PSA is the source of farm data compiled using the results of the Census of Agriculture and Fisheries undertaken nationwide in 1971, 1980, 1991, 2002, and 2012. The data on the implementation of the CARP were gathered from the Department of Agrarian Reform based on its administrative reporting systems while the data on cooperatives were taken from the Cooperative Development Authority. Sector Highlights
Palay production grew by 8.56 percent between 2019 and 2020. The increase in production was due to the 1.43 percent increment in area harvested and 7.02 percent improvement in farm yield. Similarly, corn production went up by 13.6 percent in 2020 on account of a 1.8 percent increase in cropped area and 11.6 percent increase in average yield.
Production of major crops in the region was generally on a downward trend between 2019 and
2020 with the exception of calamansi and pineapple. Coconut production decreased by 7.67 percent.
The stock of large animals slightly grew by 1.57 percent in January 1, 2021 with carabao stock increasing by 2.7 percent. On the other hand, cattle population decreased by 1.6 percent. Swine population decreased by 14.3 percent between the two inventory periods while goat stock increased by 2.8 percent. Meanwhile, chicken population increased by 1.5 percent while duck stock grew by 18.8 percent.
Slaughter of hogs in the region’s slaughterhouses increased by 9.7 percent while cattle slaughtered in 2020 declined by 12.1 percent over the 2019 volume. There were 20.9 percent less chicken processed in dressing plants in 2020 than in 2019.
Total fishery production slightly increased by 0.6 percent between 2019 and 2020. Municipal
fishery production, which accounts for more than half of the fishery sector’s total output, increased by 1.0 percent.
The Comprehensive Agrarian Reform Program has covered a total area of 664,113 hectares benefiting 393,491 farmers as of 2020.
As of 2020, there were 1,340 registered cooperatives in the region with Multi-Purpose
Cooperatives making up 43.9 percent of total number.
Chapter 5 AGRICULTURE AND AGRARIAN REFORM

Table 5.1A Number and Area of Farm Parcels by Location of Parcels,Main Use and Province, 2012 5 - 4
Table 5.1B Number and Area of Farm Parcels by Location of Parcels, Land Tenureand Province, 2012 5 - 8
Table 5.2A Number and Area of Farms by Legal Status of the Holder/Farm Operatorand Province, 2012 5 - 12
Table 5.2B Number and Area of Farm by Size, Number of Parcels and Province,2012 5 - 14
Table 5.3A Palay Production, Area Harvested, Average Yield and Utilizationby Province, 2011 - 2020 5 - 22
Table 5.3B Palay Production and Area Harvested by Type of Farm and Province,2016 - 2020 5 - 26
Table 5.4A Corn Production, Area Harvested, Average Yield and Utilizationby Province, 2011 - 2020 5 - 30
Table 5.4B Corn Production and Area Harvested by Type of Farm and Province,2016 - 2020 5 - 34
Table 5.5A Production and Area Harvested of Major Crops by Province, 2013 - 2020 5 - 38
Table 5.5B Production and Area Harvested of Major Temporary Crops by Province,2013 - 2020 5 - 44
Table 5.6 Inventory of Livestock and Poultry by Kind and Province,As of January 1, 2014 - 2021 5 - 52
Table 5.7 Animals Slaughtered/Dressed in Slaughterhouses/Dressing Plants by Kind and Province, 2013 - 2020 5 - 54
Table 5.8 Fish Production by Type of Production and Province, 2011 - 2020 5 - 55
Table 5.9 Aquaculture Production by Type of Culture and Province, 2013 - 2020 5 - 58
Table 5.10 Status of the Comprehensive Agrarian Reform Program (CARP) by Phaseand Province, 1972 - 2020 5 - 60
Table 5.11 Number of Registered/Confirmed Cooperatives by Type, Region V, 2011 - 2020 5 - 62
Figure 5.1 Distribution of Total Farm Area, Region V, 2012 5 - 3
Figure 5.2 Total Area of Farms by Province, 1991, 2002, and 2012 5 - 3
Figure 5.3 Palay Production and Area Harvested, Region V, 2016 - 2020 5 - 24
Figure 5.4 Palay Production and Area Harvested by Province, 2020 5 - 25
Figure 5.5 Palay Production by Type of Farm, Region V, 2016 - 2020 5 - 28
Figure 5.6 Palay Production by Type of Farm, by Province, 2020 5 - 29
Figure 5.7 Corn Production and Area Harvested, Region V, 2016 - 2020 5 - 32
Figure 5.8 Corn Production and Area Harvested by Province, 2020 5 - 33
Figure 5.9 Corn Production by Cropping Season, Region V, 2016 - 2020 5 - 36
Figure 5.10 Corn Production by Cropping Season, by Province, 2020 5 - 37
Figure 5.11 Production of Major Crops by Type of Crop, Region V, 2015 - 2020 5 - 42
Figure 5.12 Fish Production by Type of Production, Region V, 2011-2020 5 - 57
Figure 5.13 Fish Production by Type of Production and Province, 2020 5 - 57
Figure 5.14 Distribution of Registered/Confirmed Cooperatives by Type, Region V, 2020 5 - 62
5 - 2

Figure 5.1 DISTRIBUTION OF TOTAL FARM AREAREGION V, 2012
Figure 5.2 TOTAL AREA OF FARMS BY PROVINCE1991, 2002, and 2012
0
50,000
100,000
150,000
200,000
250,000
300,000
Albay CamarinesNorte
Camarines Sur Catanduanes Masbate Sorsogon
In H
ec
tare
s
1991
2002
2012
Camarines Sur30.5%
Masbate22.5%
Albay14.4%
Camarines Norte13.8%
Sorsogon13.6%
Catanduanes5.3%
5 - 3

Table 5.1ANUMBER AND AREA OF FARM PARCELS BY LOCATION OF PARCELS, MAIN USE AND PROVINCE2012(Area in Hectares)
Number of Holding/Farm Parcels
Area of Holding/Farm Parcels
Region V - Bicol RegionAll Parcels 663,400 774,225
Under temporary crops 246,519 214,239Under permanent crops 221,915 497,398Temporarily fallow 631 1,167Under temporary meadows and pastures 595 3,541Under permanent meadows and pastures 585 25,496Covered with wood and forest 326 1,276Under livestock and poultry raising 6,561 6,080Under aquaculture 91 93Homelot 185,829 24,563Others 348 372
AlbayAll Parcels 141,537 107,637
Under temporary crops 49,250 32,558Under permanent crops 41,114 69,014Temporarily fallow 116 84Under temporary meadows and pastures 106 99Under permanent meadows and pastures 76 191Covered with wood and forest 44 110Under livestock and poultry raising 1,354 239Under aquaculture 20 12Homelot 49,305 5,272Others 152 58
Camarines NorteAll Parcels 63,346 103,536
Under temporary crops 14,919 14,025Under permanent crops 24,851 85,636Temporarily fallow 19 19Under temporary meadows and pastures 19 15Under permanent meadows and pastures 20 71Covered with wood and forest 46 314Under livestock and poultry raising 1,161 217Under aquaculture 25 16Homelot 22,262 3,157Others 24 67
Note: Data are tabulated by residence of Holder/Operator. Details may not add up to totals due to rounding. - Denotes zero value. * Denotes <0.5 hectare.
Source: 2012 Census of Agriculture and Fisheries, Philippine Statistics Authority
Region, Province and Main Use
Total
5 - 4

Located Within the
Province and Region
Number of Holding/Farm
Parcels
Area of Holding/Farm
Parcels
Number of Holding/Farm
Parcels
Area of Holding/Farm
Parcels
Number of Holding/Farm
Parcels
Area of Holding/Farm
Parcels
661,995 770,485 1,138 2,733 267 1,007245,865 213,197 586 914 68 128221,201 494,749 530 1,804 184 845
629 1,163 1 * 1 4593 3,537 2 4 - -584 25,495 1 * - -323 1,275 1 * 2 2
6,545 6,053 11 7 5 2091 93 - - - -
185,816 24,551 6 3 7 8348 372 - - - -
141,003 106,609 512 987 22 4148,966 32,223 273 325 11 1040,876 68,338 231 655 7 22
115 84 1 * - -105 98 1 1 - -76 191 - - - -44 110 - - - -
1,348 225 4 5 2 820 12 - - - -
49,301 5,271 2 * 2 2152 58 - - - -
63,097 102,407 166 659 83 47014,852 13,872 55 107 12 4724,672 84,664 108 550 71 423
19 19 - - - -18 12 1 3 - -20 71 - - - -46 314 - - - -
1,159 217 2 * - -25 16 - - - -
22,262 3,157 - - - -24 67 - - - -
Located Outside Province But Within the Region
Located Outside the Region
5 - 5

Table 5.1A - ContinuedNUMBER AND AREA OF FARM PARCELS BY LOCATION OF PARCELS, MAIN USE AND PROVINCE2012(Area in Hectares)
Number of Holding/Farm Parcels
Area of Holding/Farm Parcels
Region, Province and Main Use
Total
Camarines SurAll Parcels 207,651 243,182
Under temporary crops 94,743 89,351Under permanent crops 53,016 137,613Temporarily fallow 247 411Under temporary meadows and pastures 247 443Under permanent meadows and pastures 185 438Covered with wood and forest 180 641Under livestock and poultry raising 2,056 743Under aquaculture 33 28Homelot 56,808 13,333Others 136 182
CatanduanesAll Parcels 53,376 38,056
Under temporary crops 14,446 6,676Under permanent crops 21,669 30,735Temporarily fallow 39 30Under temporary meadows and pastures 67 38Under permanent meadows and pastures 30 39Covered with wood and forest 24 62Under livestock and poultry raising 522 75Under aquaculture - -Homelot 16,579 401Others - -
MasbateAll Parcels 108,988 179,844
Under temporary crops 45,966 54,587Under permanent crops 39,458 90,484Temporarily fallow 193 600Under temporary meadows and pastures 141 2,941Under permanent meadows and pastures 267 24,748Covered with wood and forest 28 136Under livestock and poultry raising 1,207 4,738Under aquaculture 13 37Homelot 21,681 1,510Others 34 62
SorsogonAll Parcels 88,502 101,968
Under temporary crops 27,195 17,042Under permanent crops 41,807 83,916Temporarily fallow 17 22Under temporary meadows and pastures 15 5Under permanent meadows and pastures 7 9Covered with wood and forest 4 13Under livestock and poultry raising 261 68Under aquaculture - -Homelot 19,194 890Others 2 3
5 - 6

Located Within the
Province and Region
Number of Holding/Farm
Parcels
Area of Holding/Farm
Parcels
Number of Holding/Farm
Parcels
Area of Holding/Farm
Parcels
Number of Holding/Farm
Parcels
Area of Holding/Farm
Parcels
Located Outside Province But Within the Region
Located Outside the Region
207,187 241,925 335 817 129 44094,497 88,885 218 407 28 5952,817 136,843 107 406 92 364
246 407 - - 1 4247 443 - - - -185 438 - - - -177 639 1 * 2 2
2,049 731 5 1 2 1133 28 - - - -
56,800 13,329 4 3 4 1136 182 - - - -
53,367 38,033 6 20 3 314,441 6,664 3 11 2 221,665 30,725 3 9 1 1
39 30 - - - -67 38 - - - -30 39 - - - -24 62 - - - -
522 75 - - - -- - - - - -
16,579 401 - - - -- - - - - -
108,972 179,787 4 30 12 2845,960 54,567 2 17 4 339,449 90,453 2 13 7 19
193 600 - - - -141 2,941 - - - -267 24,748 - - - -28 136 - - - -
1,207 4,738 - - - -13 37 - - - -
21,680 1,504 - - 1 634 62 - - - -
88,369 101,723 115 219 18 2627,149 16,987 35 47 11 941,722 83,728 79 172 6 17
17 22 - - - -15 5 - - - -6 8 1 * - -4 13 - - - -
260 67 - - 1 1- - - - - -
19,194 890 - - - -2 3 - - - -
5 - 7

Table 5.1B NUMBER AND AREA OF FARM PARCELS BY LOCATION OF PARCELS,LAND TENURE, AND PROVINCE2012(Area in Hectares)
Number of Holding/Farm Parcels
Area of Holding/Farm Parcels
Region V - Bicol RegionAll Parcels 663,400 774,225
Fully owned 273,873 334,612Ownerlike possession 126,067 131,307Tenanted 150,699 224,156Leased/Rented 27,938 29,826Rent free 65,288 25,338Held under CLT or CLOA 12,912 19,490Held under CADT/CALT 685 1,131Held under CBFMA/Stewardship 1,494 3,762Others 4,444 4,603
AlbayAll Parcels 141,537 107,637
Fully owned 60,029 44,994Ownerlike possession 26,952 17,937Tenanted 30,720 33,334Leased/Rented 5,523 3,555Rent free 15,480 4,691Held under CLT or CLOA 2,317 2,613Held under CADT/CALT 74 81Held under CBFMA/Stewardship 91 181Others 351 250
Camarines NorteAll Parcels 63,346 103,536
Fully owned 24,469 42,267Ownerlike possession 14,709 25,108Tenanted 6,871 21,107Leased/Rented 2,563 2,506Rent free 11,392 5,203Held under CLT or CLOA 2,408 5,154Held under CADT/CALT 40 102Held under CBFMA/Stewardship 307 1,355Others 587 735
Camarines SurAll Parcels 207,651 243,182
Fully owned 93,241 112,061Ownerlike possession 40,969 44,452Tenanted 44,536 60,782Leased/Rented 11,594 11,539Rent free 10,262 5,409Held under CLT or CLOA 4,790 5,963Held under CADT/CALT 386 608Held under CBFMA/Stewardship 438 1,086Others 1,435 1,282
Note: Data are tabulated by residence of Holder/Operator. Details may not add up to totals due to rounding.
Source: 2012 Census of Agriculture and Fisheries, Philippine Statistics Authority
Region, Province and Land Tenure
Total
5 - 8

Located Within the
Province and Region
Number of Holding/Farm
Parcels
Area of Holding/Farm
Parcels
Number of Holding/Farm
Parcels
Area of Holding/Farm
Parcels
Number of Holding/Farm
Parcels
Area of Holding/Farm
Parcels
661,995 770,485 1,138 2,733 267 1,007273,134 332,678 626 1,546 113 388125,760 130,428 249 653 58 226150,520 223,607 128 309 51 23927,853 29,681 79 137 6 865,232 25,194 25 26 31 11812,897 19,471 13 13 2 7
679 1,117 6 14 - -1,490 3,746 3 11 1 54,430 4,563 9 24 5 16
141,003 106,609 512 987 22 4159,739 44,394 275 580 15 2126,849 17,758 101 178 2 230,653 33,175 64 142 3 175,479 3,497 43 57 1 1
15,465 4,679 14 12 1 *2,306 2,603 11 11 - -
73 78 1 3 - -91 181 - - - -
348 245 3 5 - -
63,097 102,407 166 659 83 47024,331 41,753 104 344 34 17014,638 24,686 41 264 30 1586,852 20,966 4 13 15 1282,559 2,499 3 5 1 3
11,384 5,192 7 11 1 *2,407 5,148 - - 1 6
38 97 2 5 - -304 1,344 2 6 1 5584 723 3 12 - -
207,187 241,925 335 817 129 44093,004 111,416 192 483 45 16240,876 44,236 70 155 23 6144,471 60,601 39 100 26 8111,566 11,472 25 64 3 410,233 5,293 2 * 27 1164,789 5,962 1 1 - -
384 605 2 3 - -437 1,081 1 5 - -
1,427 1,259 3 8 5 16
Located Outside Province But Within the Region
Located Outside the Region
5 - 9

Table 5.1B - ContinuedNUMBER AND AREA OF FARM PARCELS BY LOCATION OF PARCELS,LAND TENURE, AND PROVINCE2012(Area in Hectares)
Number of Holding/Farm Parcels
Area of Holding/Farm Parcels
Region, Province and Land Tenure
Total
CatanduanesAll Parcels 53,376 38,056
Fully owned 20,705 14,659Ownerlike possession 12,903 9,496Tenanted 12,792 9,967Leased/Rented 392 173Rent free 4,917 1,348Held under CLT or CLOA 32 87Held under CADT/CALT 17 22Held under CBFMA/Stewardship 600 1,035Others 1,018 1,268
MasbateAll Parcels 108,988 179,844
Fully owned 42,327 87,582Ownerlike possession 13,735 17,833Tenanted 31,185 55,255Leased/Rented 4,448 9,702Rent free 15,949 6,820Held under CLT or CLOA 1,097 2,146Held under CADT/CALT 63 165Held under CBFMA/Stewardship 15 22Others 169 318
SorsogonAll Parcels 88,502 101,968
Fully owned 33,102 33,049Ownerlike possession 16,799 16,481Tenanted 24,595 43,710Leased/Rented 3,418 2,350Rent free 7,288 1,865Held under CLT or CLOA 2,268 3,527Held under CADT/CALT 105 153Held under CBFMA/Stewardship 43 83Others 884 750
5 - 10

Located Within the
Province and Region
Number of Holding/Farm
Parcels
Area of Holding/Farm
Parcels
Number of Holding/Farm
Parcels
Area of Holding/Farm
Parcels
Number of Holding/Farm
Parcels
Area of Holding/Farm
Parcels
Located Outside Province But Within the Region
Located Outside the Region
53,367 38,033 6 20 3 320,699 14,645 4 13 2 212,901 9,488 2 8 - -12,792 9,967 - - - -
392 173 - - - -4,916 1,347 - - 1 1
32 87 - - - -17 22 - - - -
600 1,035 - - - -1,018 1,268 - - - -
108,972 179,787 4 30 12 2842,315 87,540 3 18 9 2313,735 17,833 - - - -31,182 55,241 1 12 2 34,448 9,702 - - - -
15,948 6,819 - - 1 11,097 2,146 - - - -
63 165 - - - -15 22 - - - -
169 318 - - - -
88,369 101,723 115 219 18 2633,046 32,930 48 109 8 1016,761 16,427 35 49 3 524,570 43,658 20 43 5 103,409 2,338 8 12 1 17,286 1,863 2 2 - -2,266 3,525 1 1 1 1
104 150 1 3 - -43 83 - - - -
884 750 - - - -
5 - 11

Table 5.2ANUMBER AND AREA OF FARMS BY LEGAL STATUS OF THE HOLDER/FARM OPERATORAND PROVINCE2012(Area and average area are in hectares)
Region, Province and City/Municipality
Number of Holdings/Farms
Area of Holdings/Farms
Average Area of Holding/Farm
Region V - Bicol RegionTotal 486,312 774,225 1.6Household Sector 485,757 767,050 1.6
Individual Proprietor 482,330 758,588 1.6Partnership 3,427 8,462 2.5
Non-Household Sector 555 7,174 12.9Corporation 252 6,026 23.9Cooperative 109 210 1.9Other Private Institution 109 744 6.8Government Corporation/Institution 32 75 2.3Others 53 120 2.3
AlbayTotal 106,722 107,637 1.0Household Sector 106,687 107,577 1.0
Individual Proprietor 106,312 107,060 1.0Partnership 375 518 1.4
Non-Household Sector 35 60 1.7Corporation 5 13 2.6Cooperative 8 16 2.0Other Private Institution 12 7 0.6Government Corporation/Institution 1 1 1.0Others 9 23 2.5
Camarines NorteTotal 51,501 103,536 2.0Household Sector 51,478 103,220 2.0
Individual Proprietor 51,189 102,199 2.0Partnership 289 1,021 3.5
Non-Household Sector 23 316 13.7Corporation 10 75 7.5Cooperative 4 7 1.6Other Private Institution 6 219 36.5Government Corporation/Institution 1 11 11.0Others 2 5 2.3
Camarines SurTotal 144,149 243,182 1.7Household Sector 143,835 241,888 1.7
Individual Proprietor 141,709 236,435 1.7Partnership 2,126 5,453 2.6
Non-Household Sector 314 1,294 4.1Corporation 147 873 5.9Cooperative 47 100 2.1Other Private Institution 65 197 3.0Government Corporation/Institution 27 58 2.1Others 28 66 2.4
Note: Data are tabulated by residence of Holder/Operator. Details may not add up to totals due to rounding. - Denotes zero value.
Source: 2012 Census of Agriculture and Fisheries, Philippine Statistics Authority
5 - 12

Table 5.2A - ContinuedNUMBER AND AREA OF FARMS BY LEGAL STATUS OF THE HOLDER/FARM OPERATORAND PROVINCE2012(Area and average area are in hectares)
Region, Province and City/Municipality
Number of Holdings/Farms
Area of Holdings/Farms
Average Area of Holding/Farm
CatanduanesTotal 30,965 38,056 1.2Household Sector 30,964 38,055 1.2
Individual Proprietor 30,913 37,970 1.2Partnership 51 85 1.7
Non-Household Sector 1 1 1.0Corporation 1 1 1.0Cooperative - - -Other Private Institution - - -Government Corporation/Institution - - -Others - - -
MasbateTotal 88,061 179,844 2.0Household Sector 87,918 174,434 2.0
Individual Proprietor 87,781 173,877 2.0Partnership 137 557 4.1
Non-Household Sector 143 5,411 37.8Corporation 75 5,014 66.8Cooperative 38 73 1.9Other Private Institution 24 318 13.2Government Corporation/Institution 2 2 1.1Others 4 4 1.1
SorsogonTotal 64,914 101,968 1.6Household Sector 64,875 101,876 1.6
Individual Proprietor 64,426 101,048 1.6Partnership 449 828 1.8
Non-Household Sector 39 92 2.4Corporation 14 49 3.5Cooperative 12 15 1.2Other Private Institution 2 3 1.6Government Corporation/Institution 1 3 3.0Others 10 22 2.2
5 - 13

Table 5.2B NUMBER AND AREA OF FARM BY SIZE, NUMBER OF PARCELS, AND PROVINCE, 2012(Area and size of holding/farm are in hectares.)
Total Under 0.5000.500
to 0.9991.000
to 2.999
Region V - Bicol Region
Number of Farms 486,312 184,036 75,330 147,3661 parcel 350,675 161,351 51,438 94,0102 parcels 106,543 21,147 20,773 41,7383 parcels 21,260 1,339 2,683 8,9624 parcels 5,194 159 361 1,9525 parcels 1,540 26 52 4696 parcels 791 14 21 1817 parcels 116 - 1 258 parcels 90 - 1 189 parcels 40 - - 710 parcels and over 63 - - 4
Area of Farms 774,225 22,408 44,725 220,5191 parcel 428,427 17,106 29,195 134,1852 parcels 223,554 4,891 13,309 65,6433 parcels 74,932 359 1,896 15,7004 parcels 26,649 43 269 3,6075 parcels 10,239 6 39 9086 parcels 6,869 4 16 3647 parcels 1,031 - 1 508 parcels 918 - 1 369 parcels 406 - - 1710 parcels and over 1,201 - - 10
Albay
Number of Farms 106,722 51,703 17,689 27,2401 parcel 78,548 44,811 11,817 16,7252 parcels 23,239 6,528 5,236 8,3763 parcels 3,788 321 576 1,7254 parcels 818 34 51 3265 parcels 198 5 9 606 parcels 87 4 - 217 parcels 21 - - 38 parcels 13 - - 49 parcels 2 - - -10 parcels and over 8 - - -
Area of Farms 107,637 6,219 10,370 39,6401 parcel 59,086 4,714 6,646 23,0632 parcels 33,147 1,409 3,276 12,8073 parcels 10,137 86 405 2,9924 parcels 3,337 8 37 6035 parcels 1,017 1 6 1206 parcels 524 1 - 437 parcels 142 - - 58 parcels 101 - - 89 parcels 11 - - -10 parcels and over 135 - - -
Note: Data are tabulated by residence of Holder/Operator. Details may not add up to totals due to rounding.
Source: 2012 Census of Agriculture and Fisheries, Philippine Statistics Authority
Region, Province,Number and Area of
Holdings/Farms
5 - 14

3.000 to 7.000
7.001 to 9.999
10.000 to 24.999
25.000 to 49.999
50.000 to 99.999
100.000 to 499.999
500.000 and Over
63,987 6,762 8,038 555 122 99 1737,160 2,819 3,647 156 36 47 1118,154 2,204 2,307 160 31 24 56,011 998 1,127 107 18 15 -1,738 412 494 57 13 8 -
534 184 232 27 15 1 -290 104 152 21 4 3 142 18 22 7 1 - -28 12 23 8 - - -15 4 10 4 - - -15 7 24 8 4 1 -
265,338 55,724 106,781 17,657 7,702 18,427 14,943150,839 23,448 46,867 4,965 2,257 8,969 10,59676,361 17,989 30,427 5,127 1,998 4,090 3,72026,057 8,173 15,491 3,301 1,071 2,884 -7,790 3,388 7,166 1,765 851 1,770 -2,446 1,522 3,386 902 929 102 -1,353 862 2,241 668 260 475 627
208 154 298 229 90 - -136 94 364 287 - - -77 35 149 128 - - -71 60 391 285 246 138 -
8,602 736 726 23 3 - -4,608 283 298 5 1 - -2,652 233 208 6 - - -
924 127 110 4 1 - -289 58 55 4 1 - -74 22 28 - - - -38 6 17 1 - - -10 4 4 - - - -4 2 2 1 - - -2 - - - - - -1 1 4 2 - - -
34,908 6,067 9,570 705 159 - -18,216 2,360 3,859 174 53 - -10,829 1,903 2,757 167 - - -3,995 1,049 1,448 110 52 - -1,268 471 761 136 54 - -
332 176 382 - - - -175 49 227 29 - - -52 35 51 - - - -23 17 26 28 - - -11 - - - - - -6 8 60 62 - - -
Size of the Holding/Farm
5 - 15

Table 5.2B - ContinuedNUMBER AND AREA OF FARM BY SIZE, NUMBER OF PARCELS, AND PROVINCE, 2012(Area and size of holding/farm are in hectares.)
Total Under 0.5000.500
to 0.9991.000
to 2.999
Region, Province,Number and Area of
Holdings/Farms
Camarines Norte
Number of Farms 51,501 22,529 4,118 11,7081 parcel 41,800 21,267 3,299 8,7122 parcels 8,081 1,190 758 2,6313 parcels 1,245 66 56 3174 parcels 277 6 3 415 parcels 63 - 1 36 parcels 28 - 1 47 parcels 3 - - -8 parcels 2 - - -9 parcels 1 - - -10 parcels and over 1 - - -
Area of Farms 103,536 1,764 2,421 18,7641 parcel 64,364 1,560 1,894 13,6412 parcels 27,550 192 485 4,4593 parcels 7,517 12 39 5694 parcels 2,623 1 2 805 parcels 878 - 1 66 parcels 439 - 1 97 parcels 70 - - -8 parcels 56 - - -9 parcels 32 - - -10 parcels and over 7 - - -
Camarines Sur
Number of Farms 144,149 46,096 25,764 47,3411 parcel 95,736 37,833 16,332 28,1952 parcels 37,678 7,602 8,138 14,7633 parcels 7,936 558 1,107 3,4334 parcels 1,881 80 159 6935 parcels 541 15 17 1706 parcels 279 8 10 667 parcels 36 - - 88 parcels 29 - 1 89 parcels 10 - - 410 parcels and over 23 - - 1
Area of Farms 243,182 7,308 15,695 70,7271 parcel 128,113 5,189 9,458 40,0542 parcels 73,333 1,937 5,313 22,9063 parcels 25,959 152 785 6,0144 parcels 8,575 24 117 1,2665 parcels 3,689 4 13 3186 parcels 2,174 2 8 1297 parcels 353 - - 148 parcels 337 - 1 159 parcels 127 - - 910 parcels and over 522 - - 2
5 - 16

3.000 to 7.000
7.001 to 9.999
10.000 to 24.999
25.000 to 49.999
50.000 to 99.999
100.000 to 499.999
500.000 and Over
Size of the Holding/Farm
9,915 1,323 1,804 95 7 2 -6,890 665 937 28 1 1 -2,492 461 520 28 1 - -
434 141 215 15 - 1 -79 43 92 12 1 - -15 11 28 1 4 - -5 1 10 7 - - -- - 1 2 - - -- - 1 1 - - -- - - 1 - - -- 1 - - - - -
42,088 10,976 23,882 2,951 393 297 -28,724 5,574 11,992 825 50 105 -10,883 3,758 6,834 875 64 - -2,019 1,166 3,034 486 - 192 -
367 363 1,388 350 72 - -72 98 469 26 207 - -23 10 141 255 - - -
- - 13 57 - - -- - 10 46 - - -- - - 32 - - -- 7 - - - - -
19,516 2,217 2,939 233 39 4 -10,961 966 1,380 60 9 - -5,553 696 853 62 9 2 -2,073 311 396 49 9 - -
628 139 153 26 3 - -179 60 79 17 4 - -97 31 56 8 2 1 -9 11 4 4 - - -8 1 6 5 - - -1 - 3 2 - - -7 2 9 - 3 1 -
81,305 18,280 39,657 7,293 2,423 494 -44,802 8,015 18,195 1,871 528 - -23,415 5,720 11,360 1,877 560 245 -8,895 2,547 5,570 1,480 517 - -2,781 1,137 2,186 841 224 - -
837 491 1,152 601 273 - -465 253 849 231 127 111 -42 93 66 138 - - -33 8 94 187 - - -5 - 46 68 - - -
30 18 140 - 195 138 -
5 - 17

Table 5.2B - ContinuedNUMBER AND AREA OF FARM BY SIZE, NUMBER OF PARCELS, AND PROVINCE, 2012(Area and size of holding/farm are in hectares.)
Total Under 0.5000.500
to 0.9991.000
to 2.999
Region, Province,Number and Area of
Holdings/Farms
Catanduanes
Number of Farms 30,965 12,604 4,852 9,5411 parcel 16,774 10,072 2,128 3,6062 parcels 9,120 2,229 2,031 3,6073 parcels 3,244 268 544 1,5114 parcels 1,085 28 118 5475 parcels 408 5 20 1746 parcels 241 2 10 737 parcels 32 - 1 118 parcels 22 - - 69 parcels 20 - - 310 parcels and over 19 - - 3
Area of Farms 38,056 1,119 2,857 14,2731 parcel 10,775 611 1,176 4,9102 parcels 12,809 422 1,192 5,3133 parcels 7,695 76 377 2,5204 parcels 3,286 8 89 1,0025 parcels 1,655 1 15 3276 parcels 1,168 1 7 1467 parcels 154 - 1 258 parcels 132 - - 139 parcels 140 - - 810 parcels and over 243 - - 8
Masbate
Number of Farms 88,061 27,510 13,121 31,8851 parcel 71,395 26,220 11,220 24,5212 parcels 13,510 1,220 1,779 6,3863 parcels 2,397 62 108 8454 parcels 535 7 11 1145 parcels 139 1 3 176 parcels 68 - - 27 parcels 7 - - -8 parcels 4 - - -9 parcels 4 - - -10 parcels and over 2 - - -
Area of Farms 179,844 2,857 7,268 46,6741 parcel 111,340 2,596 6,084 34,5022 parcels 44,683 246 1,097 10,3503 parcels 14,201 13 76 1,5634 parcels 5,781 1 9 2155 parcels 1,666 * 2 386 parcels 1,824 - - 47 parcels 168 - - -8 parcels 72 - - -9 parcels 75 - - -10 parcels and over 35 - - -
5 - 18

3.000 to 7.000
7.001 to 9.999
10.000 to 24.999
25.000 to 49.999
50.000 to 99.999
100.000 to 499.999
500.000 and Over
Size of the Holding/Farm
3,386 333 245 4 - - -913 25 30 - - - -
1,108 85 60 - - - -775 84 61 1 - - -309 52 31 - - - -143 37 29 - - - -102 37 17 - - - -14 2 4 - - - -7 6 3 - - - -
10 2 5 - - - -5 3 5 3 - - -
13,866 2,701 3,099 140 - - -3,507 208 364 - - - -4,474 673 735 - - - -3,291 665 740 26 - - -1,341 432 413 - - - -
630 306 375 - - - -448 310 255 - - - -65 16 47 - - - -36 47 36 - - - -50 17 65 - - - -25 27 69 115 - - -
12,702 1,008 1,483 170 72 93 178,176 434 683 59 25 46 113,264 335 418 60 21 22 5
971 151 206 32 8 14 -217 61 98 11 8 8 -53 17 35 5 7 1 -19 9 31 2 2 2 12 - 4 - 1 - -- - 4 - - - -- 1 2 1 - - -- - 2 - - - -
52,072 8,324 19,790 5,604 4,676 17,636 14,94332,871 3,612 8,636 1,952 1,626 8,864 10,59613,637 2,735 5,580 2,098 1,374 3,845 3,7204,177 1,245 2,914 1,018 502 2,692 -1,027 501 1,453 303 502 1,770 -
252 144 530 148 449 102 -96 77 467 56 133 364 62712 - 66 - 90 - -
- - 72 - - - -- 9 38 28 - - -- - 35 - - - -
5 - 19

Table 5.2B - ContinuedNUMBER AND AREA OF FARM BY SIZE, NUMBER OF PARCELS, AND PROVINCE, 2012(Area and size of holding/farm are in hectares.)
Total Under 0.5000.500
to 0.9991.000
to 2.999
Region, Province,Number and Area of
Holdings/Farms
Sorsogon
Number of Farms 64,914 23,594 9,786 19,6511 parcel 46,422 21,148 6,642 12,2512 parcels 14,915 2,378 2,831 5,9753 parcels 2,650 64 292 1,1314 parcels 598 4 19 2315 parcels 191 - 2 456 parcels 88 - - 157 parcels 17 - - 38 parcels 20 - - -9 parcels 3 - - -10 parcels and over 10 - - -
Area of Farms 101,968 3,141 6,114 30,4411 parcel 54,749 2,435 3,937 18,0152 parcels 32,033 685 1,945 9,8083 parcels 9,423 20 215 2,0414 parcels 3,047 1 15 4405 parcels 1,335 - 2 986 parcels 740 - - 337 parcels 144 - - 78 parcels 219 - - -9 parcels 21 - - -10 parcels and over 258 - - -
5 - 20

3.000 to 7.000
7.001 to 9.999
10.000 to 24.999
25.000 to 49.999
50.000 to 99.999
100.000 to 499.999
500.000 and Over
Size of the Holding/Farm
9,866 1,145 841 30 1 - -5,612 446 319 4 - - -3,085 394 248 4 - - -
834 184 139 6 - - -216 59 65 4 - - -70 37 33 4 - - -29 20 21 3 - - -7 1 5 1 - - -9 3 7 1 - - -2 1 - - - - -2 - 4 3 1 - -
41,100 9,376 10,782 964 52 - -22,719 3,680 3,821 143 - - -13,123 3,201 3,162 110 - - -3,680 1,499 1,785 182 - - -1,007 484 966 135 - - -
323 308 478 127 - - -145 163 301 98 - - -38 9 56 34 - - -43 23 127 26 - - -11 9 - - - - -11 - 87 109 52 - -
5 - 21

Table 5.3A PALAY PRODUCTION, AREA HARVESTED, AVERAGE YIELD AND UTILIZATION BY PROVINCE2011 - 2020(Production in Metric Tons; Area Harvested in Hectares)
Province 2011 2012 2013 2014
Region V
Production 1,070,917 1,173,307 1,243,241 1,258,147Area Harvested 318,361 334,275 343,199 329,573Average Yield Per Hectare 3.36 3.51 3.62 3.82Utilization Seeds 23,877 25,071 25,740 24,718 Feeds and Wastes 69,610 76,265 80,811 81,780 Processed 977,430 1,071,971 1,136,690 1,151,649
Albay
Production 201,037 206,808 220,980 225,700Area Harvested 55,269 55,494 55,964 53,488Average Yield Per Hectare 3.64 3.73 3.95 4.22Utilization Seeds 4,145 4,162 4,197 4,012 Feeds and Wastes 13,067 13,443 14,364 14,671 Processed 183,824 189,203 202,419 207,018
Camarines Norte
Production 77,188 85,526 92,411 95,784Area Harvested 21,428 23,521 25,369 25,493Average Yield Per Hectare 3.60 3.64 3.64 3.76Utilization Seeds 1,607 1,764 1,903 1,912 Feeds and Wastes 5,017 5,559 6,007 6,226 Processed 70,564 78,203 84,502 87,646
Camarines Sur
Production 520,322 563,749 601,479 583,797Area Harvested 150,652 156,312 159,105 145,973Average Yield Per Hectare 3.45 3.61 3.78 4.00Utilization Seeds 11,299 11,723 11,933 10,948 Feeds and Wastes 33,821 36,644 39,096 37,947 Processed 475,202 515,382 550,450 534,902
Catanduanes
Production 43,947 32,330 29,488 35,452Area Harvested 15,152 10,924 10,339 11,498Average Yield Per Hectare 2.90 2.96 2.85 3.08Utilization Seeds 1,136 819 775 862 Feeds and Wastes 2,857 2,101 1,917 2,304 Processed 39,954 29,409 26,796 32,285
Source: Philippine Statistics Authority
5 - 22

2015 2016 2017 2018 2019 2020
1,264,448 1,275,492 1,335,077 1,350,438 1,192,904 1,294,991342,307 354,089 363,823 357,654 341,731 346,629
3.69 3.60 3.67 3.78 3.49 3.74
25,673 26,557 27,287 26,824 25,630 25,99782,189 82,907 86,780 87,778 77,539 84,174
1,156,586 1,166,028 1,221,010 1,235,836 1,089,735 1,184,820
204,345 201,811 204,824 206,019 188,013 216,00751,883 52,095 54,184 53,589 53,387 53,893
3.94 3.87 3.78 3.84 3.52 4.01
3,891 3,907 4,064 4,019 4,004 4,04213,282 13,118 13,314 13,391 12,221 14,040
187,171 184,786 187,447 188,609 171,788 197,925
89,615 89,909 107,099 110,850 93,458 108,51223,016 23,867 26,653 25,444 22,433 24,593
3.89 3.77 4.02 4.36 4.17 4.41
1,726 1,790 1,999 1,908 1,682 1,8445,825 5,844 6,961 7,205 6,075 7,053
82,064 82,275 98,139 101,736 85,701 99,614
658,548 666,413 683,385 689,722 612,987 650,406171,244 180,583 182,831 179,100 174,420 173,024
3.85 3.69 3.74 3.85 3.51 3.76
12,843 13,544 13,712 13,433 13,082 12,97742,806 43,317 44,420 44,832 39,844 42,276
602,899 609,552 625,253 631,458 560,061 595,153
35,741 34,065 37,789 39,945 27,331 27,01910,663 11,635 12,349 12,133 9,945 8,915
3.35 2.93 3.06 3.29 2.75 3.03
800 873 926 910 746 6692,323 2,214 2,456 2,596 1,776 1,756
32,618 30,978 34,407 36,438 24,808 24,594
5 - 23

Table 5.3A - Continued
PALAY PRODUCTION, AREA HARVESTED, AVERAGE YIELD AND UTILIZATION BY PROVINCE2011 - 2020(Production in Metric Tons; Area Harvested in Hectares)
Province 2011 2012 2013 2014
Masbate
Production 113,441 154,463 168,653 180,173Area Harvested 41,091 51,807 57,401 57,441Average Yield Per Hectare 2.76 2.98 2.94 3.14Utilization Seeds 3,082 3,886 4,305 4,308 Feeds and Wastes 7,374 10,040 10,962 11,711 Processed 102,986 140,537 153,385 164,154
Sorsogon
Production 114,982 130,431 130,230 137,241Area Harvested 34,769 36,217 35,021 35,680Average Yield Per Hectare 3.31 3.60 3.72 3.85Utilization Seeds 2,608 2,716 2,627 2,676 Feeds and Wastes 7,474 8,478 8,465 8,921 Processed 104,900 119,237 119,138 125,644
Figure 5.3 PALAY PRODUCTION AND AREA HARVESTEDREGION V, 2016 - 2020
0
200,000
400,000
600,000
800,000
1,000,000
1,200,000
1,400,000
1,600,000
2016 2017 2018 2019 2020
Production (MT) Area Harvested (Has)
5 - 24

2015 2016 2017 2018 2019 2020
147,754 149,871 158,832 156,032 147,660 148,01052,039 52,264 53,233 52,410 52,247 52,661
2.84 2.87 2.98 2.98 2.83 2.81
3,903 3,920 3,992 3,931 3,919 3,9509,604 9,742 10,324 10,142 9,598 9,621
134,247 136,210 144,515 141,959 134,143 134,440
128,445 133,423 143,148 147,870 123,456 145,03733,462 33,645 34,573 34,978 29,300 33,543
3.84 3.97 4.14 4.23 4.21 4.32
2,510 2,523 2,593 2,623 2,198 2,5168,349 8,672 9,305 9,612 8,025 9,427
117,586 122,227 131,250 135,635 113,234 133,094
Figure 5.4 PALAY PRODUCTION AND AREA HARVESTEDBY PROVINCE, 2020
0
100,000
200,000
300,000
400,000
500,000
600,000
700,000
Albay CamarinesNorte
Camarines Sur Catanduanes Masbate Sorsogon
Production (MT) Area Harvested (Has)
5 - 25

Table 5.3BPALAY PRODUCTION AND AREA HARVESTED BY TYPE OF FARM AND PROVINCE2016 - 2020(Production in Metric Tons; Area Harvested in Hectares)
Province / 2016Farm Type Total 1st Sem 2nd Sem Total 1st Sem 2nd Sem
Region V
Production 1,275,492 641,262 634,230 1,335,077 654,822 680,255 Irrigated 918,904 448,662 470,242 955,709 460,613 495,096 Rainfed 356,588 192,600 163,988 379,368 194,209 185,159
Area Harvested 354,089 173,556 180,533 363,823 177,949 185,874 Irrigated 236,205 110,987 125,218 242,155 115,637 126,518 Rainfed 117,884 62,569 55,315 121,668 62,312 59,356
Albay
Production 201,811 105,071 96,740 204,824 104,389 100,435 Irrigated 170,595 86,973 83,622 175,189 90,314 84,875 Rainfed 31,216 18,098 13,118 29,635 14,075 15,560
Area Harvested 52,095 25,636 26,459 54,184 27,476 26,708 Irrigated 41,677 20,376 21,301 43,788 22,607 21,181 Rainfed 10,418 5,260 5,158 10,396 4,869 5,527
Camarines Norte
Production 89,909 41,970 47,939 107,099 53,289 53,810 Irrigated 60,298 27,692 32,606 69,631 30,415 39,216 Rainfed 29,611 14,278 15,333 37,468 22,874 14,594
Area Harvested 23,867 11,689 12,178 26,653 13,639 13,014 Irrigated 15,024 7,075 7,949 16,372 7,197 9,175 Rainfed 8,843 4,614 4,229 10,281 6,442 3,839
Camarines Sur
Production 666,413 325,330 341,083 683,385 317,446 365,939 Irrigated 521,988 246,431 275,557 539,115 248,472 290,643 Rainfed 144,425 78,899 65,526 144,270 68,974 75,296
Area Harvested 180,583 84,375 96,208 182,831 83,730 99,101 Irrigated 136,486 61,131 75,355 138,713 62,698 76,015 Rainfed 44,097 23,244 20,853 44,118 21,032 23,086
Catanduanes
Production 34,065 19,089 14,976 37,789 18,659 19,130 Irrigated 19,938 10,369 9,569 19,519 9,913 9,606 Rainfed 14,127 8,720 5,407 18,270 8,746 9,524
Area Harvested 11,635 5,877 5,758 12,349 6,071 6,278 Irrigated 6,011 2,865 3,146 5,635 2,865 2,770 Rainfed 5,624 3,012 2,612 6,714 3,206 3,508
Source: Philippine Statistics Authority
2017
5 - 26

Total 1st Sem 2nd Sem Total 1st Sem 2nd Sem Total 1st Sem 2nd Sem
1,350,438 668,098 682,340 1,192,904 570,386 622,517 1,294,991 631,672 663,319971,551 471,626 499,925 869,719 416,693 453,026 907,068 436,654 470,415378,887 196,472 182,415 323,185 153,693 169,492 387,923 195,018 192,905
357,654 178,418 179,236 341,731 172,365 169,367 346,629 170,186 176,443237,232 114,761 122,471 227,832 114,670 113,163 223,308 106,584 116,724120,422 63,657 56,765 113,899 57,695 56,204 123,321 63,602 59,719
206,019 104,072 101,947 188,013 85,259 102,754 216,007 97,615 118,392177,659 90,282 87,377 168,769 78,592 90,177 186,440 86,103 100,337
28,361 13,790 14,571 19,244 6,667 12,577 29,567 11,512 18,055
53,589 27,017 26,572 53,387 26,506 26,881 53,893 26,644 27,24942,582 21,392 21,190 43,507 21,981 21,526 43,920 22,110 21,81011,007 5,625 5,382 9,880 4,525 5,355 9,973 4,534 5,439
110,850 59,302 51,548 93,458 46,825 46,633 108,512 54,907 53,60572,594 35,043 37,551 63,315 31,238 32,077 70,972 33,617 37,35538,256 24,259 13,997 30,143 15,587 14,556 37,540 21,290 16,250
25,444 13,996 11,448 22,433 11,983 10,450 24,593 12,336 12,25715,529 7,544 7,985 14,123 7,260 6,863 14,773 6,703 8,070
9,915 6,452 3,463 8,310 4,723 3,587 9,820 5,633 4,187
689,722 326,286 363,436 612,987 277,519 335,468 650,406 317,290 333,116546,469 255,259 291,210 488,526 222,060 266,466 483,608 230,338 253,270143,253 71,027 72,226 124,461 55,459 69,002 166,798 86,952 79,846
179,100 84,723 94,377 174,420 84,098 90,322 173,024 81,923 91,101136,249 63,172 73,077 131,880 63,873 68,007 123,556 56,186 67,370
42,851 21,551 21,300 42,540 20,225 22,315 49,468 25,737 23,731
39,945 21,000 18,945 27,331 14,851 12,480 27,019 13,598 13,42122,159 10,815 11,344 14,348 7,528 6,820 13,970 7,404 6,56617,785 10,185 7,600 12,983 7,323 5,660 13,050 6,194 6,855
12,133 6,377 5,756 9,945 5,098 4,847 8,915 4,226 4,6895,758 2,869 2,889 4,678 2,224 2,454 3,894 1,934 1,9606,375 3,508 2,867 5,267 2,874 2,393 5,021 2,292 2,729
202020192018
5 - 27

Table 5.3B - Continued
PALAY PRODUCTION AND AREA HARVESTED BY TYPE OF FARM AND PROVINCE2016 - 2020(Production in Metric Tons; Area Harvested in Hectares)
Province / 2016Farm Type Total 1st Sem 2nd Sem Total 1st Sem 2nd Sem
2017
Masbate
Production 149,871 77,830 72,041 158,832 84,625 74,207 Irrigated 40,080 23,234 16,846 44,796 26,542 18,254 Rainfed 109,791 54,596 55,195 114,036 58,083 55,953
Area Harvested 52,264 27,769 24,495 53,233 28,632 24,601 Irrigated 11,808 6,850 4,958 12,794 7,610 5,184 Rainfed 40,456 20,919 19,537 40,439 21,022 19,417
Sorsogon
Production 133,423 71,972 61,451 143,148 76,414 66,734 Irrigated 106,005 53,963 52,042 107,459 54,957 52,502 Rainfed 27,418 18,009 9,409 35,689 21,457 14,232
Area Harvested 33,645 18,210 15,435 34,573 18,401 16,172 Irrigated 25,199 12,690 12,509 24,853 12,660 12,193 Rainfed 8,446 5,520 2,926 9,720 5,741 3,979
Figure 5.5 PALAY PRODUCTION BY TYPE OF FARMREGION V, 2016 - 2020
-
200,000
400,000
600,000
800,000
1,000,000
1,200,000
2016 2017 2018 2019 2020
Me
tric
To
ns
Irrigated Rainfed
5 - 28

Total 1st Sem 2nd Sem Total 1st Sem 2nd Sem Total 1st Sem 2nd Sem202020192018
156,032 80,847 75,185 147,660 76,566 71,093 148,010 77,402 70,60842,905 25,241 17,664 40,681 24,032 16,649 41,589 24,799 16,790
113,127 55,606 57,521 106,978 52,534 54,444 106,421 52,603 53,818
52,410 28,057 24,353 52,247 27,997 24,250 52,661 28,229 24,43212,338 7,272 5,066 12,289 7,215 5,074 12,474 7,366 5,10840,072 20,785 19,287 39,958 20,782 19,176 40,187 20,863 19,324
147,870 76,591 71,279 123,456 69,366 54,090 145,037 70,860 74,177109,765 54,986 54,779 94,080 53,243 40,837 110,490 54,393 56,097
38,105 21,605 16,500 29,376 16,123 13,253 34,547 16,467 18,080
34,978 18,248 16,730 29,300 16,683 12,617 33,543 16,828 16,71524,776 12,512 12,264 21,356 12,117 9,239 24,691 12,285 12,40610,202 5,736 4,466 7,944 4,566 3,378 8,852 4,543 4,309
Figure 5.6 PALAY PRODUCTION BY TYPE OF FARMBY PROVINCE, 2020
0
100000
200000
300000
400000
500000
Albay CamarinesNorte
CamarinesSur
Catanduanes Masbate Sorsogon
Me
tric
To
ns
Irrigated Rainfed
5 - 29

Table 5.4A CORN PRODUCTION, AREA HARVESTED, AVERAGE YIELD AND UTILIZATION BY PROVINCE2011 - 2020(Production in Metric Tons; Area Harvested in Hectares)
Province 2011 2012 2013 2014
Region V
Production 215,025 230,545 258,115 285,647Area Harvested 108,243 112,964 109,582 113,596Average Yield Per Hectare 1.99 2.04 2.36 2.51Utilization Seeds 2,165 2,259 2,192 2,272 Feeds & Waste 184,176 197,531 221,491 245,270 Processed 28,684 30,755 34,433 38,105
Albay
Production 51,500 57,556 59,436 60,665Area Harvested 21,750 23,035 22,454 21,487Average Yield Per Hectare 2.37 2.50 2.65 2.82Utilization Seeds 435 461 449 430 Feeds & Waste 44,195 49,417 51,058 52,143 Processed 6,870 7,678 7,929 8,093
Camarines Norte
Production 1,446 1,617 1,800 1,558Area Harvested 1,021 1,056 1,134 844Average Yield Per Hectare 1.42 1.53 1.59 1.85Utilization Seeds 20 21 23 17 Feeds & Waste 1,233 1,380 1,537 1,333 Processed 193 216 240 208
Camarines Sur
Production 125,730 136,233 161,863 187,260Area Harvested 36,891 38,479 43,766 48,012Average Yield Per Hectare 3.41 3.54 3.70 3.90Utilization Seeds 738 770 875 960 Feeds & Waste 108,220 117,290 139,395 161,319 Processed 16,772 18,173 21,593 24,980
Catanduanes
Production 243 261 322 373Area Harvested 289 296 355 371Average Yield Per Hectare 0.84 0.88 0.91 1.01Utilization Seeds 6 6 7 7 Feeds & Waste 205 220 272 316 Processed 32 35 43 50
Source: Philippine Statistics Authority
5 - 30

2015 2016 2017 2018 2019 2020
243,908 259,375 287,005 279,732 248,243 282,001103,025 107,544 114,616 111,900 105,067 106,985
2.37 2.41 2.50 2.50 2.36 2.64
2,061 2,151 2,292 2,238 2,101 2,140209,310 222,623 246,426 240,178 213,026 242,242
32,537 34,601 38,286 37,316 33,116 37,619
53,469 58,775 56,130 51,895 40,038 46,04319,500 21,052 21,091 20,470 20,757 20,313
2.74 2.79 2.66 2.54 1.93 2.27
390 421 422 409 415 40645,946 50,513 48,220 44,563 34,281 39,495
7,133 7,841 7,488 6,923 5,341 6,142
2,048 2,138 2,297 2,416 1,681 2,4521,076 1,078 1,088 1,103 938 1,052
1.90 1.98 2.11 2.19 1.79 2.33
22 22 22 22 19 211,753 1,831 1,969 2,072 1,438 2,104
273 285 306 322 224 327
153,320 161,904 187,432 187,143 167,260 187,04839,350 44,646 47,645 47,233 46,414 46,590
3.90 3.63 3.93 3.96 3.60 4.01
787 893 953 945 928 932132,080 139,413 161,476 161,233 144,019 161,164
20,453 21,598 25,003 24,965 22,312 24,952
555 538 1,658 1,282 879 823453 459 1,124 923 708 674
1.23 1.17 1.48 1.39 1.24 1.22
9 9 22 18 14 13472 457 1,414 1,092 747 700
74 72 221 171 117 110
5 - 31

Table 5.4A - Continued
CORN PRODUCTION, AREA HARVESTED, AVERAGE YIELD AND UTILIZATION BY PROVINCE2011 - 2020(Production in Metric Tons; Area Harvested in Hectares)
Province 2011 2012 2013 2014
Masbate
Production 36,056 34,692 34,470 35,397Area Harvested 48,252 50,010 41,770 42,697Average Yield Per Hectare 0.75 0.69 0.83 0.83Utilization Seeds 965 1,000 835 854 Feeds & Waste 30,281 29,064 29,036 29,821 Processed 4,810 4,628 4,598 4,722
Sorsogon
Production 50 186 224 394Area Harvested 40 88 103 185Average Yield Per Hectare 1.25 2.11 2.17 2.13Utilization Seeds 1 2 2 4 Feeds & Waste 43 159 192 338 Processed 7 25 30 53
Figure 5.7 CORN PRODUCTION AND AREA HARVESTEDREGION V, 2016 - 2020
0
40,000
80,000
120,000
160,000
200,000
240,000
280,000
320,000
2016 2017 2018 2019 2020
Production (MT) Area Harvested (Has)
5 - 32

2015 2016 2017 2018 2019 2020
33,987 35,440 39,086 36,524 37,885 45,15042,413 40,047 43,483 41,962 36,034 38,132
0.80 0.88 0.90 0.87 1.05 1.18
848 801 870 839 721 76328,605 29,911 33,002 30,812 32,110 38,364
4,534 4,728 5,214 4,872 5,054 6,023
529 580 402 472 501 484233 262 185 209 216 224
2.27 2.21 2.17 2.26 2.32 2.16
5 5 4 4 4 4454 497 345 405 430 415
71 77 54 63 67 65
Figure 5.8 CORN PRODUCTION AND AREA HARVESTEDBY PROVINCE, 2020
0
20,000
40,000
60,000
80,000
100,000
120,000
140,000
160,000
180,000
200,000
Albay CamarinesNorte
Camarines Sur Catanduanes Masbate Sorsogon
Production (MT) Area Harvested (Has)
5 - 33

Table 5.4B
CORN PRODUCTION AND AREA HARVESTED BY TYPE OF FARM AND PROVINCE2016 - 2020(Production in Metric Tons; Area Harvested in Hectares)
Province / 2016Farm Type Total 1st Sem 2nd Sem Total 1st Sem 2nd Sem
Region V
Production 259,375 132,983 126,392 287,005 153,011 133,994 White 57,685 27,926 29,759 64,960 34,091 30,869 Yellow 201,690 105,057 96,633 222,045 118,920 103,125
Area Harvested 107,544 55,957 51,587 114,616 60,103 54,513 White 50,371 24,378 25,993 55,715 28,975 26,740 Yellow 57,173 31,579 25,594 58,901 31,128 27,773
Albay
Production 58,775 38,952 19,823 56,130 35,104 21,026 White 5,788 2,818 2,970 4,698 1,760 2,938 Yellow 52,987 36,134 16,853 51,432 33,344 18,088
Area Harvested 21,052 13,377 7,675 21,091 12,649 8,442 White 4,181 1,718 2,463 4,169 1,460 2,709 Yellow 16,871 11,659 5,212 16,922 11,189 5,733
Camarines Norte
Production 2,138 1,221 917 2,297 1,271 1,026 White 1,475 870 605 1,557 895 662 Yellow 663 351 312 740 376 364
Area Harvested 1,078 635 443 1,088 643 445 White 905 540 365 914 544 370 Yellow 173 95 78 174 99 75
Camarines Sur
Production 161,904 77,083 84,821 187,432 97,938 89,494 White 15,842 9,305 6,537 20,144 13,513 6,631 Yellow 146,062 67,778 78,284 167,288 84,425 82,863
Area Harvested 44,646 22,419 22,227 47,645 24,057 23,588 White 5,321 2,933 2,388 6,906 4,545 2,361 Yellow 39,325 19,486 19,839 40,739 19,512 21,227
Catanduanes
Production 538 234 304 1,658 291 1,367 White 312 117 195 939 165 774 Yellow 226 117 109 719 126 593
Area Harvested 459 210 249 1,124 214 910 White 299 125 174 739 129 610 Yellow 160 85 75 385 85 300
Source: Philippine Statistics Authority
2017
5 - 34

Total 1st Sem 2nd Sem Total 1st Sem 2nd Sem Total 1st Sem 2nd Sem
279,732 150,275 129,457 248,243 115,815 132,427 282,001 143,521 138,47965,026 33,681 31,345 62,221 28,006 34,215 70,668 32,399 38,269
214,706 116,594 98,112 186,021 87,810 98,212 211,332 111,122 100,210
111,900 59,255 52,645 105,067 57,171 47,896 106,985 56,865 50,12054,499 27,081 27,418 48,034 25,572 22,462 49,556 25,537 24,01957,401 32,174 25,227 57,033 31,599 25,434 57,429 31,328 26,101
51,895 33,979 17,916 40,038 23,371 16,667 46,043 26,924 19,1194,577 1,985 2,592 3,963 1,575 2,388 5,603 1,848 3,755
47,318 31,994 15,324 36,074 21,796 14,279 40,440 25,076 15,364
20,470 12,949 7,521 20,757 12,909 7,848 20,313 12,441 7,8723,941 1,560 2,381 4,075 1,557 2,518 3,915 1,419 2,496
16,529 11,389 5,140 16,682 11,352 5,330 16,398 11,022 5,376
2,416 1,351 1,065 1,681 1,113 568 2,452 1,508 9441,650 968 682 1,140 793 347 1,708 1,092 616
766 383 383 541 320 221 745 416 328
1,103 647 456 938 656 282 1,052 657 395928 550 378 764 557 207 874 555 319175 97 78 174 99 75 178 102 76
187,143 97,267 89,876 167,260 75,505 91,755 187,048 96,718 90,33022,715 13,818 8,897 19,992 10,647 9,345 19,807 11,792 8,015
164,428 83,449 80,979 147,268 64,858 82,410 167,241 84,926 82,315
47,233 24,911 22,322 46,414 23,353 23,061 46,590 23,845 22,7457,480 4,545 2,935 7,135 3,560 3,575 6,890 3,943 2,947
39,753 20,366 19,387 39,279 19,793 19,486 39,700 19,902 19,798
1,282 300 982 879 239 640 823 224 599812 170 642 565 116 449 636 182 454470 130 340 314 123 191 187 42 145
923 219 704 708 195 513 674 154 520613 134 479 489 110 379 517 102 415310 85 225 219 85 134 157 52 105
202020192018
5 - 35

Table 5.4B - Continued
CORN PRODUCTION AND AREA HARVESTED BY TYPE OF FARM AND PROVINCE2016 - 2020(Production in Metric Tons; Area Harvested in Hectares)
Province / 2016Farm Type Total 1st Sem 2nd Sem Total 1st Sem 2nd Sem
2017
Masbate
Production 35,440 15,291 20,149 39,086 18,266 20,820 White 33,908 14,716 19,192 37,358 17,667 19,691 Yellow 1,532 575 957 1,728 599 1,129
Area Harvested 40,047 19,224 20,823 43,483 22,473 21,010 White 39,495 19,012 20,483 42,862 22,252 20,610 Yellow 552 212 340 621 221 400
Sorsogon
Production 580 202 378 402 141 261 White 360 100 260 264 91 173 Yellow 220 102 118 138 50 88
Area Harvested 262 92 170 185 67 118 White 170 50 120 125 45 80 Yellow 92 42 50 60 22 38
Figure 5.9 CORN PRODUCTION BY CROPPING SEASONREGION V, 2016 - 2020
0
20,000
40,000
60,000
80,000
100,000
120,000
140,000
160,000
180,000
2016 2017 2018 2019 2020
In M
etr
ic T
on
s
1st Cropping 2nd Cropping
5 - 36

Total 1st Sem 2nd Sem Total 1st Sem 2nd Sem Total 1st Sem 2nd Sem202020192018
36,524 17,182 19,342 37,885 15,410 22,475 45,150 17,971 27,17934,989 16,634 18,355 36,248 14,774 21,474 42,604 17,379 25,225
1,535 548 987 1,637 636 1,001 2,546 592 1,954
41,962 20,442 21,520 36,034 19,978 16,056 38,132 19,684 18,44841,406 20,241 21,165 35,433 19,742 15,691 37,210 19,465 17,745
556 201 355 601 236 365 922 219 703
472 196 276 501 178 323 484 176 308283 106 177 313 101 212 310 106 204189 90 99 188 77 111 174 70 104
209 87 122 216 80 136 224 84 140131 51 80 138 46 92 150 53 97
78 36 42 78 34 44 74 31 43
Figure 5.10 CORN PRODUCTION BY CROPPING SEASONBY PROVINCE, 2020
0
10,000
20,000
30,000
40,000
50,000
60,000
70,000
80,000
90,000
100,000
110,000
Albay CamarinesNorte
Camarines Sur Catanduanes Masbate Sorsogon
In M
etr
ic T
on
s
1st Cropping 2nd Cropping
5 - 37

Table 5.5A PRODUCTION AND AREA HARVESTED OF MAJOR CROPS BY PROVINCE2013 - 2020(Production in Metric Tons; Area Harvested in Hectares)
Province / 2013 2014 2015 2016Type of Crop Production Area Production Area Production Area Production
Harvested Harvested Harvested
Region V
Abaca 24,078.0 44,509 28,950.6 45,254 29,561.1 45,254 30,016.5Banana 83,352.6 18,824 74,510.7 18,522 76,451.7 18,288 76,841.2Cacao 34.2 287 34.8 287 35.8 272 38.0Calamansi 2,111.9 952 1,845.3 947 1,825.5 885 1,925.0Coconut 1,255,507.5 452,967 1,124,411.5 453,704 1,105,743.4 454,013 1,081,111.8
Coffee 325.5 793 299.0 793 295.7 737 266.8Lanzones 8.1 35 7.7 35 8.0 33 20.2Mandarin 844.0 1,720 819.9 1,720 843.4 1,713 877.6Mango 1,532.4 2,851 1,592.0 2,859 1,684.2 2,840 1,887.7Papaya 9,628.0 543 9,073.7 536 9,187.8 503 9,117.8
Pili Nut with shell 7,080.9 1,910 6,183.0 1,910 6,258.4 1,911 6,283.1Pineapple 124,960.8 3,083 123,411.5 3,078 130,594.9 3,079 137,991.4Rambutan 28.0 15 22.5 15 23.6 14 24.2
Albay
Abaca 1,617.3 5,500 1,368.1 5,500 1,365.2 5,500 1,478.3Banana 14,718.4 932 11,573.7 778 11,234.7 599 11,695.9Cacao 14.8 85 14.4 85 14.2 85 15.3Calamansi 123.6 130 90.2 125 87.4 70 81.3Coconut 180,333.1 41,000 105,420.1 41,000 102,844.4 41,000 109,462.1
Coffee 113.7 335 97.9 335 100.5 300 93.9Lanzones 0.0 2 0.0 2 0.0 0 12.3Mandarin 10.9 55 8.6 55 9.0 50 8.5Mango 9.0 59 10.3 67 10.0 59 10.6Papaya 716.2 81 510.8 81 537.0 76 578.1
Pili Nut with shell 2,132.5 345 1,743.3 345 1,760.2 345 1,854.8Pineapple 782.0 60 637.0 55 622.4 55 560.1Rambutan 17.5 5 13.3 5 13.9 4 14.5
Camarines Norte
Abaca 119.9 1,025 123.0 1,025 127.1 1,025 139.2Banana 8,456.8 4,507 7,839.8 4,507 8,085.0 4,507 8,849.3Cacao 1.1 10 1.1 10 1.2 10 1.4Calamansi 445.4 85 453.9 85 464.4 85 619.3Coconut 244,048.0 85,405 242,368.5 85,405 247,011.7 85,405 249,454.5
Coffee 25.8 43 26.0 43 26.5 43 27.5Lanzones 1.6 8 1.6 8 1.6 8 1.8Mandarin 529.7 900 540.1 900 555.4 900 624.5Mango 675.8 830 646.5 830 679.5 830 932.9Papaya 2,692.1 122 2,654.5 115 2,735.1 102 2,716.8
Pili Nut with shell 49.3 68 49.8 68 50.5 68 49.8Pineapple 119,834.2 2,525 118,492.3 2,525 125,629.8 2,528 133,113.8Rambutan - - - - - - -
Note: 0 means less than 1 metric ton or hectare.
Source: Philippine Statistics Authority
5 - 38

Area Production Area Production Area Production Area Production AreaHarvested Harvested Harvested Harvested Harvested
45,254 26,196.2 43,225 28,811.6 43,280 28,939.2 43,160 28,088.8 43,13018,277 73,342.6 18,510 79,062.9 18,699 78,178.7 19,247 64,349.5 19,017
273 37.1 275 37.7 276 39.1 281 36.1 278827 1,904.9 827 1,967.0 827 2,041.1 821 2,396.0 814
454,349 1,076,257.3 454,020 1,186,963.6 453,994 1,246,478.6 453,994 1,150,857.4 453,995
694 250.8 606 226.4 475 205.9 471 160.3 40836 13.0 36 12.9 36 17.6 36 12.9 35
1,713 821.9 1,723 674.5 1,723 676.3 1,723 598.4 1,7222,836 1,879.4 2,837 2,346.6 2,837 2,105.6 2,841 1,840.0 2,810
504 8,754.6 492 8,802.5 531 8,437.2 547 5,903.1 540
1,908 6,438.9 1,928 6,679.4 1,929 6,224.3 1,932 5,412.0 1,7974,773 127,489.3 4,778 151,216.8 4,773 163,274.7 4,612 164,162.5 4,609
15 24.5 15 25.5 25 26.9 15 22.9 15
5,500 1,354.5 4,815 1,408.1 4,815 1,523.1 4,850 1,213.0 4,815571 11,098.4 571 11,863.3 588 11,754.4 588 9,971.7 588
85 15.3 85 16.7 85 18.1 90 15.2 9068 68.8 68 67.6 68 67.7 68 61.9 68
41,007 112,264.1 41,007 121,271.2 41,007 132,755.2 41,007 105,257.5 41,007
300 84.9 230 69.4 108 71.8 109 55.3 803 5.2 3 4.8 3 9.9 3 8.1 3
50 8.1 50 7.3 50 6.5 50 5.8 5059 9.6 59 10.0 59 10.0 63 9.0 6375 565.7 75 600.2 75 622.8 75 521.5 75
345 1,882.3 345 2,028.2 345 2,076.5 350 1,681.8 35045 455.1 45 418.0 40 424.1 40 414.9 40
5 14.4 5 15.2 5 16.8 5 14.3 5
1,025 143.0 1,025 133.7 1,092 153.2 1,132 127.9 1,1324,524 10,496.0 4,757 12,196.4 4,916 13,180.3 5,446 10,098.1 5,462
10 1.4 10 1.2 10 1.0 10 0.7 1094 643.8 94 697.0 94 807.2 89 1,251.8 89
85,405 261,449.8 85,405 288,476.6 85,405 302,734.6 85,405 273,847.6 85,405
43 29.3 43 28.8 43 24.7 43 18.2 438 1.6 8 1.7 8 2.3 8 0.1 8
900 585.4 910 428.9 910 459.6 910 428.8 910830 948.1 831 1,355.4 831 1,048.2 831 864.0 831104 3,126.9 105 3,358.9 135 3,068.6 150 1,548.7 150
68 57.9 82 55.0 82 61.2 82 49.7 824,231 122,606.0 4,231 146,052.0 4,231 158,315.0 4,070 159,173.0 4,067
- - - - 10 - - - 0
2020201920182017
5 - 39

Table 5.5A - ContinuedPRODUCTION AND AREA HARVESTED OF MAJOR CROPS BY PROVINCE2013 - 2020(Production in Metric Tons; Area Harvested in Hectares)
Province / 2013 2014 2015 2016Type of Crop Production Area Production Area Production Area Production
Harvested Harvested Harvested
Camarines Sur
Abaca 911.9 6,712 856.4 6,712 841.2 6,712 897.4Banana 35,353.1 9,335 33,533.8 9,335 33,938.8 9,322 34,539.0Cacao 9.8 42 10.8 42 11.5 42 12.8Calamansi 454.5 479 437.2 479 468.1 475 475.8Coconut 340,451.8 119,045 323,599.4 119,045 322,705.6 119,045 328,927.0
Coffee 27.0 213 26.2 213 25.6 210 23.5Lanzones 1.0 15 0.9 15 1.0 15 1.1Mandarin 152.7 744 135.6 744 142.0 744 118.6Mango 98.3 318 116.3 318 124.4 318 132.3Papaya 4,465.6 166 4,293.5 166 4,260.3 163 4,323.7
Pili Nut with shell 368.3 111 372.6 111 381.5 112 386.0Pineapple 2,783.6 335 2,736.0 335 2,724.1 333 2,824.7Rambutan 1.1 1 1.0 1 1.2 1 1.4
Catanduanes
Abaca 20,092.3 24,622 25,434.6 25,367 26,419.0 25,367 26,864.2Banana 1,320.9 407 1,290.9 407 1,338.6 407 1,384.9Cacao 1.0 3 1.0 3 1.0 3 1.1Calamansi 12.6 11 12.3 11 12.5 11 12.1Coconut 4,398.1 14,735 4,738.8 15,472 4,966.5 15,781 5,130.7
Coffee 2.0 11 2.0 11 2.0 11 2.0Lanzones - - - - - - - Mandarin 0.1 1 0.1 1 0.1 1 0.1Mango 5.4 18 5.2 18 5.3 18 5.1Papaya 40.0 14 39.7 14 39.0 14 40.0
Pili Nut with shell 11.1 11 11.2 11 12.1 11 11.9Pineapple 13.2 4 12.9 4 13.3 4 13.3Rambutan - - - - - - -
Masbate
Abaca - - - - - - - Banana 3,561.1 1,150 3,582.6 1,150 3,645.2 1,108 3,594.2Cacao - - - - - - - Calamansi 126.7 47 135.1 47 140.1 44 134.4Coconut 316,654.9 95,629 300,424.4 95,629 277,812.3 95,629 270,439.1
Coffee - - - - - - - Lanzones - - - - - - - Mandarin - - - - - - - Mango 498.1 1,328 544.8 1,328 567.8 1,317 539.4Papaya 106.1 21 111.3 21 113.1 9 111.8
Pili Nut with shell 1.8 2 1.9 2 1.9 2 1.9Pineapple 105.0 6 109.8 6 106.6 6 102.2Rambutan - - - - - - -
Note: 0 means less than 1 metric ton or hectare.
5 - 40

Area Production Area Production Area Production Area Production AreaHarvested Harvested Harvested Harvested Harvested
2020201920182017
6,712 809.7 6,712 794.1 6,700 760.8 6,698 662.7 6,6989,322 29,377.8 9,322 31,882.0 9,322 30,171.1 9,322 25,168.8 9,322
43 11.7 42 10.9 43 11.3 43 12.4 43475 435.4 475 443.3 475 432.1 475 411.9 475
119,045 292,177.2 119,045 334,413.2 119,044 340,132.1 119,044 316,238.9 119,044
210 21.4 192 19.1 192 17.1 187 14.2 18715 1.0 15 1.0 15 0.9 15 0.8 15
744 99.9 744 108.5 744 93.4 744 76.0 744318 112.8 318 177.2 318 227.0 318 253.1 318163 3,504.6 163 3,246.7 163 3,180.1 163 2,484.7 163
112 358.1 112 385.7 113 388.3 113 341.1 113334 2,911.5 339 3,209.5 339 3,109.5 339 3,356.6 339
1 1.3 1 1.2 1 1.5 1 1.3 1
25,367 23,271.8 24,023 25,846.9 24,023 25,940.7 25,113 25,581.0 25,118407 1,126.3 407 1,230.0 407 1,251.2 425 1,194.5 425
3 0.9 3 0.8 3 0.9 3 0.8 311 9.8 11 9.1 11 9.2 12 8.0 12
16,110 3,817.6 15,781 4,140.6 15,756 4,596.9 15,756 4,260.3 15,757
9 0.6 9 - 9 - 9 - -- - - - - - - - -1 0.1 1 0.1 1 0.1 1 0.1 1
18 3.8 18 4.0 18 4.0 18 3.8 1814 35.0 14 45.9 14 48.7 14 44.9 14
11 10.5 11 10.1 11 10.2 12 9.5 124 10.0 4 8.3 4 8.4 4 8.0 4- - - - - - - - -
- - - - - - - - -1,108 3,813.2 1,108 3,953.0 1,108 4,352.2 1,108 4,167.4 1,098
- - - - - - - - -44 131.5 44 130.4 44 141.8 44 146.7 43
95,629 285,080.1 95,629 313,022.7 95,629 344,434.1 95,629 346,771.5 95,629
- - - - - - - - -- - - - - - - - -- - - - - - - - -
1,317 520.5 1,317 509.0 1,317 527.0 1,317 488.6 1,3019 115.4 9 118.8 9 124.2 9 122.3 9
2 1.9 5 1.8 5 1.7 5 1.7 56 104.4 6 101.0 6 108.4 6 102.6 6
- - - - - - - - -
5 - 41

Table 5.5A - ContinuedPRODUCTION AND AREA HARVESTED OF MAJOR CROPS BY PROVINCE2013 - 2020(Production in Metric Tons; Area Harvested in Hectares)
Province / 2013 2014 2015 2016Type of Crop Production Area Production Area Production Area Production
Harvested Harvested Harvested
Sorsogon
Abaca 1,336.6 6,650 1,168.6 6,650 808.6 6,650 637.4Banana 19,942.3 2,493 16,689.8 2,345 18,209.5 2,345 16,778.0Cacao 7.5 147 7.4 147 7.9 132 7.5Calamansi 949.1 200 716.5 200 653.1 200 602.2Coconut 169,621.7 97,153 147,860.3 97,153 150,402.9 97,153 117,698.5
Coffee 157.0 191 146.8 191 141.1 173 119.9Lanzones 5.5 10 5.2 10 5.4 10 5.1Mandarin 150.6 20 135.5 20 136.9 18 125.9Mango 245.9 298 268.9 298 297.2 298 267.3Papaya 1,608.0 139 1,463.9 139 1,503.4 139 1,347.5
Pili Nut with shell 4,518.0 1,373 4,004.2 1,373 4,052.1 1,373 3,978.6Pineapple 1,442.8 153 1,423.4 153 1,498.8 153 1,377.2Rambutan 9.4 9 8.2 9 8.63 9 8.39
Note: 0 means less than 1 metric ton or hectare.
Figure 5.11 PRODUCTION OF MAJOR CROPS BY TYPE OF CROPREGION V, 2015 - 2020
(In Metric Tons)
20,000
22,000
24,000
26,000
28,000
30,000
32,000
2015 2016 2017 2018 2019 2020
ABACA
62,000
66,000
70,000
74,000
78,000
2015 2016 2017 2018 2019 2020
BANANA
1,600
1,800
2,000
2,200
2,400
2,600
2015 2016 2017 2018 2019 2020
CALAMANSI
1,000,000
1,050,000
1,100,000
1,150,000
1,200,000
1,250,000
1,300,000
2015 2016 2017 2018 2019 2020
COCONUT
5 - 42

Area Production Area Production Area Production Area Production AreaHarvested Harvested Harvested Harvested Harvested
2020201920182017
6,650 617.3 6,650 628.9 6,650 561.6 5,367 504.2 5,3672,345 17,430.8 2,345 17,938.1 2,358 17,469.5 2,358 13,748.9 2,123
132 7.8 135 8.1 135 7.8 135 7.0 132135 615.5 135 619.6 135 583.2 134 515.7 128
97,153 121,468.5 97,153 125,639.3 97,153 121,825.7 97,153 104,481.6 97,153
132 114.6 132 109.1 123 92.2 123 72.6 9810 5.3 10 5.4 10 4.6 10 3.9 918 128.5 18 129.7 18 116.8 18 87.6 17
294 284.6 294 291.2 294 289.4 294 221.6 279139 1,407.1 126 1,431.9 135 1,392.8 135 1,181.1 128
1,370 4,128.3 1,373 4,198.6 1,373 3,686.5 1,370 3,328.3 1,235153 1,402.3 153 1,428.0 153 1,309.4 153 1,107.3 153
9 8.76 9 9.1 9 8.7 9 7.3 9
Figure 5.11 PRODUCTION OF MAJOR CROPS BY TYPE OF CROPREGION V, 2015 - 2020
(In Metric Tons)
1,600
1,800
2,000
2,200
2,400
2015 2016 2017 2018 2019 2020
MANGO
5,500
6,500
7,500
8,500
9,500
2015 2016 2017 2018 2019 2020
PAPAYA
5,200
5,600
6,000
6,400
6,800
2015 2016 2017 2018 2019 2020
PILI NUT WITH SHELL
120,000
130,000
140,000
150,000
160,000
170,000
2015 2016 2017 2018 2019 2020
PINEAPPLE
5 - 43

Table 5.5B PRODUCTION AND AREA HARVESTED OF MAJOR TEMPORARY CROPS BY PROVINCE2013 - 2020(Production in Metric Tons; Area Harvested in Hectares)
Province / 2013 2014 2015 2016Type of Crop Production Area Production Area Production Area Production
Harvested Harvested Harvested
Region V
Ampalaya 3,095.1 423 2,746.2 422 2,695.4 424 2,798.2Cabbage 239.1 24 186.8 21 112.4 10 113.6Camote 94,880.7 18,978 87,911.4 18,039 90,415.2 17,583 89,249.8Carrots 21.5 5 22.0 5 22.3 5 18.0Cassava 113,789.7 22,825 109,020.9 22,254 108,629.5 22,396 105,855.2Eggplant 7,882.2 1,359.0 7,114.6 1,359.0 6,746.3 1,363.3 6,636.1Gabi 11,685.3 1,427 10,539.4 1,377 10,801.3 1,322 10,158.1Gabi leaves 16,774.8 0 16,832.2 0 17,166.7 0 18,630.3Ginger 327.0 81.5 317.5 82.0 319.4 81.5 328.5Gourd 3,416.7 258 3,322.5 259 3,331.1 263 3,226.5Habitchuelas 871.5 227 682.7 222 702.9 223 758.0Mongo 180.7 244 165.5 232 161.5 233 157.8Okra 1,870.1 176 1,808.7 176 1,795.8 177 1,779.4Peanut 868.5 1,276 884.0 1,214 852.1 1,214 882.1Pechay 13,987.9 2,240.0 12,783.9 2,238.0 13,464.0 2,246.0 13,542.4Pepper, Finger 820.5 197 805.7 200 820.7 199 787.3Squash Fruit 34,300.3 1,088.3 33,948.7 1,079.3 33,001.8 1,102.0 33,179.3Stringbeans 12,342.6 1,320 11,188.3 1,331 11,321.8 1,335 11,526.6Sugarcane 259,311.4 5,533.1 259,238.9 5,530.1 239,010.1 5,030.1 264,095.3Tomato 3,482.6 552 3,372.0 546 3,665.3 550 3,890.9Ubi 589.0 91 534.7 88 528.3 88 467.8Watermelon 5,421.3 165 5,423.8 159 5,597.7 164 5,756.4
Albay
Ampalaya 944.5 78 663.7 78 626.1 78 648.4Cabbage 165.0 8 116.7 5 105.1 5 105.4Camote 38,042.3 5,700 33,581.7 5,150 37,502.3 5,150 39,394.0Carrots - - - - - - - Cassava 14,135.9 1,725 13,773.7 1,700 15,912.1 1,710 17,000.1Eggplant 3,368.5 363 2,712.0 363 2,464.5 363 2,627.7Gabi 6,253.7 725 5,176.6 675 5,485.8 665 4,946.2Gabi leaves 15,280 .. 15,332 .. 15,663 .. 16,837Ginger 104.4 22 94.9 23 93.4 23 97.6Gourd 729.2 34 650.7 34 646.9 34 645.3Habitchuelas 430.0 88 255.4 85 270.8 85 285.2Mongo 53.8 55 40.6 43 34.2 36 30.7Okra 49.6 16 44.6 16 44.2 16 46.9Peanut 598.6 760 618.6 700 580.0 640 611.4Pechay 6,875 549 5,735 549 5,997 549 6,237Pepper, Finger 143.3 70 139.1 73 145.1 73 155.1Squash Fruit 27,393 655 27,198 645 26,174 665 26,431Stringbeans 5,158.2 395 4,202.5 405 4,227.6 405 4,301.3Sugarcane 74,225 1,060 69,412 1,030 67,096 1,030 70,584Tomato 1,016.5 225 923.7 220 1,027.9 220 1,095.2Ubi 493.8 61 439.2 58 429.4 58 373.0Watermelon 105.3 20 94.7 10 98.0 10 88.2
Note: .. means data is not available, 0 means less than 1 hectare.Source: Philippine Statistics Authority
5 - 44

2017 2018 2019 2020Area Production Area Production Area Production Area Production Area
Harvested Harvested Harvested Harvested Harvested
422 2,900.0 421 3,002.2 423 3,146.4 421 2,932.8 4219 111.9 9 106.7 8 102.6 7 89.6 6
17,402 87,377.8 17,405 85,609.7 17,399 84,308.2 17,209 91,495.5 17,0185 16.6 5 13.3 5 11.3 5 5.0 4
22,330 96,708.0 21,485 87,256.1 21,409 83,382.3 20,661 80,650.9 20,4061,353.3 6,885.0 1,388.0 6,819.9 1,368.5 7,010.4 1,362.4 7,030.2 1,362.4
1,288 9,726.0 1,283 10,026.3 1,280 9,943.1 1,259 9,387.0 1,2600 19,520.7 0 20,875.0 0 21,606.1 0 18,051.4 0
81.5 349.9 85.0 367.3 88.5 360.5 87.9 359.0 87.9263 3,279.5 284 3,420.7 289 3,141.0 278 2,597.5 277224 784.9 224 700.6 222 749.9 238 667.6 238224 158.2 220 150.8 218 150.2 213 154.4 211175 1,859.2 175 1,876.1 175 1,774.9 168 1,778.5 169
1,203 865.6 1,182 899.4 1,189 914.3 1,175 968.7 1,1632,250.9 13,962.4 2,207.4 13,975.2 2,215.8 13,398.7 2,212.5 13,652.6 2,212.6
192 875.1 197 837.8 198 783.4 191 745.5 1941,102.1 31,660.8 1,098.7 31,761.6 1,094.4 26,609.4 1,003.3 25,285.3 1,003.3
1,327 11,615.8 1,312 11,477.6 1,324 10,550.0 1,299 9,441.5 1,3005,030.1 245,886.5 5,030.2 224,385.7 4,905.1 181,898.4 3,910.1 205,028.6 3,937.1
550 3,718.3 550 3,703.5 550 3,687.0 549 3,755.9 54982 434.8 82 418.4 77 413.5 77 417.9 77
163 5,685.6 177 6,513.7 981 6,424.8 1,204 5,198.7 1,193
78 679.8 78 697.4 78 682.5 78 648.6 785 99.7 5 97.1 5 94.5 5 84.4 4
5,150 40,560.4 5,150 42,279.6 5,150 43,819.1 5,150 47,410.4 5,050- - - - - - - - -
1,910 15,545.4 1,910 15,253.4 1,810 11,945.0 1,690 11,936.9 1,650363 2,680.7 363 2,677.3 363 2,726.2 363 2,644.9 363654 4,573.9 652 4,607.1 644 4,792.6 644 4,696.5 644
.. 17,537 .. 18,789 .. 19,189.0 .. 16,200.1 ..23 107.2 25 118.0 28 123.5 28 129.1 2834 650.7 34 660.6 34 609.9 34 471.3 3585 306.7 85 320.4 85 319.7 100 277.1 10031 27.4 28 26.1 27 25.0 27 22.0 2416 43.7 16 43.7 16 46.8 16 48.3 17
640 600.4 640 633.9 640 666.3 640 717.4 630555 6,710 555 6,719 555 6,807.2 555.0 6,845.6 555.0
73 156.2 73 150.0 73 157.8 73 158.8 76665 25,356 665 25,231 665 20,962.9 600.0 20,018.0 600.0410 4,480.8 410 4,564.6 410 4,311.0 410 3,786.7 412
1,030 65,818 1,030 70,473 1,030 74,894.9 1,080.0 71,605.8 1,080.0220 1,101.1 220 1,080.9 220 1,081.0 220 1,017.8 220
53 340.6 53 325.2 48 322.9 48 330.2 487 95.6 10 99.5 10 95.2 10 97.8 10
5 - 45

Table 5.5B - ContinuedPRODUCTION AND AREA HARVESTED OF MAJOR TEMPORARY CROPS BY PROVINCE2013 - 2020(Production in Metric Tons; Area Harvested in Hectares)
Province / 2013 2014 2015 2016Type of Crop Production Area Production Area Production Area Production
Harvested Harvested Harvested
Camarines Norte
Ampalaya 325.0 43 300.7 43 311.1 43 314.4Cabbage - - - - - - - Camote 752.1 220 762.2 220 774.9 220 697.0Carrots 21.5 5 22.0 5 22.3 5 18.0Cassava 4,102.5 705 4,149.6 705 4,448.6 730 4,872.2Eggplant 296.8 45 283.7 45 289.8 45 237.4Gabi 226.3 43 228.1 43 231.5 43 292.3Gabi leaves 925.7 .. 933.9 .. 935.8 .. 1,225.9Ginger 22.0 6 21.5 6 20.4 6 20.5Gourd 1,267.0 54 1,280.6 55 1,328.7 55 1,242.0Habitchuelas - - - - - - - Mongo 0.6 1 0.6 1 0.6 1 0.6Okra 206.5 17 197.2 17 196.0 17 185.8Peanut 27.1 22 27.9 22 28.7 22 29.8Pechay 294.8 49 287.4 49 297.9 48 249.7Pepper, Finger 82.0 5 79.4 5 81.0 5 77.1Squash Fruit 2,904.5 131 2,838.8 132 2,930.1 133 2,840.9Stringbeans 821.7 106 809.7 107 834.7 108 912.9Sugarcane - - - - - - - Tomato 12.8 7 12.5 7 12.8 7 11.8Ubi - - - - - - - Watermelon 5,252.2 126 5,248.0 126 5,408.7 131 5,583.3
Camarines Sur
Ampalaya 918.7 176 906.9 175 920.1 177 1,012.1Cabbage 67.4 12 63.9 12 0.5 1 2.0Camote 42,154.9 8,588 40,618.8 8,555 39,761.7 8,550 37,193.8Carrots - - - - - - - Cassava 81,259.9 16,677 76,518.5 16,665 73,726.3 16,665 69,862.1Eggplant 2,390.8 673 2,390.1 673 2,341.6 672 2,239.2Gabi 2,755.5 282 2,683.5 282 2,630.5 281 2,570.3Gabi leaves 178.9 .. 175.3 .. 177.1 .. 182.6Ginger 89.4 33 87.1 32 85.3 32 89.9Gourd 76.0 15 75.4 15 76.0 16 78.4Habitchuelas 440.9 139 426.8 137 431.6 137 472.3Mongo 28.7 90 28.0 89 27.7 82 29.4Okra 53.8 13 53.8 13 54.3 13 50.8Peanut 130.3 295 129.1 293 128.6 293 131.4Pechay 6,413.5 1,517 6,364.9 1,515 6,774.8 1,518 6,670.6Pepper, Finger 505.2 33 499.9 33 509.3 34 473.0Squash Fruit 1,784.9 162 1,763.2 162 1,793.3 164 1,811.9Stringbeans 4,218.9 475 4,105.5 475 4,251.4 477 4,355.9Sugarcane 185,084.0 4,473 189,824.0 4,500 171,911.0 4,000 193,508.0Tomato 2,353.1 296 2,338.0 295 2,526.2 298 2,685.6Ubi 4.2 3 4.2 3 4.1 3 3.9Watermelon 3.2 4 12.4 8 11.4 8 11.9
Note: .. means data is not available, 0 means less than 1 hectare.
5 - 46

2017 2018 2019 2020Area Production Area Production Area Production Area Production Area
Harvested Harvested Harvested Harvested Harvested
43 298.8 40 300.0 42 310.2 42 224.0 42- - - - - - - - -
220 825.4 220 848.6 219 903.1 201 916.9 2025 16.6 5 13.3 5 11.3 5 5.0 4
730 4,215.3 732 4,548.5 786 4,746.8 761 4,998.4 69341 225.6 33 235.5 14 201.2 14 172.4 1443 310.0 40 308.1 45 376.5 46 236.0 47
.. 1,407.3 .. 1,508.1 .. 1,853.0 .. 1,296.8 ..6 23.8 6 26.1 6 28.8 6 34.7 6
55 1,290.1 76 1,431.7 80 1,212.5 69 776.0 68- - - - - - - - -
1 0.7 1 0.7 1 0.6 1 0.5 117 194.3 17 198.0 17 185.4 15 200.7 1522 31.7 22 32.6 29 31.4 29 36.6 2948 305.8 49 294.5 56 285.1 59 311.7 59
5 83.1 5 96.2 5 94.4 5 75.1 5133 2,396.4 126 2,534.4 122 2,000.4 102 1,838.5 102108 960.3 107 992.8 119 925.1 116 522.0 115- - - - - - - - -
7 12.5 7 14.0 6 15.1 6 13.0 6- - - - - - - - -
133 5,503.3 143 6,321.2 947 6,233.9 1,171 5,007.4 1,159
177 1,080.3 179 1,155.2 179 1,255.5 179 1,123.8 1791 6.4 1 4.3 1 4.1 1 2.3 1
8,536 34,597.8 8,536 30,414.4 8,531 28,058.2 8,530 31,833.8 8,530- - - - - - - - -
16,657 62,050.3 15,810 52,754.0 15,765 51,237.0 15,371 49,653.6 15,368674 2,379.6 717 2,309.6 717 2,442.4 714 2,464.5 714281 2,456.3 281 2,591.7 282 2,507.2 281 2,433.5 281
.. 182.6 .. 182.8 .. 186.8 .. 185.9 ..32 98.0 34 102.5 34 88.8 33 77.4 3317 82.6 18 84.4 18 83.0 18 81.6 18
138 477.8 138 379.8 136 429.9 138 390.3 13881 29.3 81 31.8 81 31.2 80 36.9 8013 56.1 13 54.4 13 59.5 14 60.5 14
294 124.7 279 124.6 279 105.9 272 101.3 2691,519 6,566.9 1,504 6,574.7 1,505 5,920.7 1,501 6,073.8 1,501
32 549.6 32 502.4 32 444.7 31 411.2 31164 1,824.8 168 1,863.5 168 1,643.6 166 1,554.6 166477 4,176.0 462 3,922.5 462 3,486.5 461 3,327.1 461
4,000 180,066.0 4,000 153,910.0 3,875 107,001.0 2,830 133,421.0 2,857299 2,500.5 299 2,506.3 299 2,484.5 298 2,619.2 298
3 3.5 3 3.2 3 3.0 3 2.6 38 6.0 8 10.2 8 10.7 8 12.3 8
5 - 47

Table 5.5B - ContinuedPRODUCTION AND AREA HARVESTED OF MAJOR TEMPORARY CROPS BY PROVINCE2013 - 2020(Production in Metric Tons; Area Harvested in Hectares)
Province / 2013 2014 2015 2016Type of Crop Production Area Production Area Production Area Production
Harvested Harvested Harvested
Catanduanes
Ampalaya 16.0 2 15.7 2 14.9 2 14.4Cabbage - - - - - - - Camote 5,394.4 1,684 5,349.0 1,684 5,118.9 1,260 5,204.2Carrots - - - - - - - Cassava 403.8 90 389.9 90 432.0 156 475.8Eggplant 23.5 11 22.6 11 23.8 18 25.3Gabi 551.8 91 534.5 91 515.5 48 492.5Gabi leaves 23.6 .. 23.6 .. 23.8 .. 23.8Ginger 19.9 4 20.2 4 19.5 4 18.8Gourd 271.7 7 259.6 7 251.7 10 246.4Habitchuelas 0.5 0 0.5 0 0.5 1 0.5Mongo 7.4 18 7.3 18 7.6 34 5.1Okra 16.9 5 16.6 5 16.4 6 15.9Peanut 28.8 84 27.4 84 29.8 144 26.6Pechay 69.9 22 68.8 22 71.3 28 72.8Pepper, Finger 2.4 2 2.4 2 2.3 2 2.3Squash Fruit 1,035.6 34 1,014.0 34 976.0 34 963.6Stringbeans 85.8 9 82.1 9 81.9 12 84.1Sugarcane 0.3 0 0.4 0 0.4 0 0.4Tomato 10.1 3 10.0 3 10.0 4 9.9Ubi 1.8 2 1.8 2 1.8 2 1.7Watermelon 7.4 3 7.5 3 7.3 3 7.7
Masbate
Ampalaya 769.2 112 740.5 112 701.9 112 695.7Cabbage - - - - - - - Camote 1,555.0 1,012 1,600.5 1,012 1,688.7 1,012 1,710.5Carrots - - - - - - - Cassava 5,669.0 1,120 6,627.0 1,120 7,223.1 1,185 7,793.4Eggplant 1,642.8 214 1,548.0 214 1,473.1 214 1,359.9Gabi 33.4 16 32.1 16 33.0 16 32.5Gabi leaves 118.0 .. 120.5 .. 122.1 .. 120.2Ginger 75.0 10 78.0 10 85.0 10 86.0Gourd 839.2 131 822.0 131 789.8 131 782.2Habitchuelas - - - - - - - Mongo 57.4 46 55.6 46 54.6 46 57.6Okra 1,008.2 90 956.3 90 938.7 90 948.3Peanut 58.1 59 54.4 59 55.3 59 57.2Pechay 298.7 93 292.0 93 286.1 93 276.8Pepper, Finger 60.2 55 57.6 55 55.4 55 53.9Squash Fruit 713.0 76 682.7 76 680.7 76 678.9Stringbeans 732.5 160 763.5 160 720.4 160 723.5Sugarcane 0.0 0 0.0 0 0.0 0 0.0Tomato 73.6 16 71.4 16 69.9 16 71.5Ubi 73.7 21 73.7 21 76.0 21 73.9Watermelon 4.8 4 5.5 4 5.4 4 5.2
Note: .. means data is not available, 0 means less than 1 hectare.
5 - 48

2017 2018 2019 2020Area Production Area Production Area Production Area Production Area
Harvested Harvested Harvested Harvested Harvested
2 9.7 2 12.5 2 12.1 2 11.1 2- - - - - - - - -
1,255 4,567.2 1,255 5,232.9 1,255 5,094.3 1,211 5,322.1 1,212- - - - - - - - -
154 425.9 154 409.7 154 429.4 159 439.5 15918 22.7 18 21.0 18 19.7 18 20.1 1747 486.9 47 605.0 47 532.6 47 480.5 47
.. 23.3 .. 23.3 .. 23.2 .. 23.0 ..4 17.1 4 17.0 4 14.6 4 13.9 4
10 241.2 10 224.0 10 217.0 10 232.2 101 0.4 1 0.3 1 0.3 1 0.3 1
34 6.9 33 3.5 33 5.8 33 5.8 336 14.7 6 14.6 6 13.6 6 14.3 6
138 26.0 132 27.3 132 26.5 129 28.5 13027 67.5 27 63.9 27 61.2 27 66.7 27
2 2.2 2 2.1 2 2.0 2 2.0 234 913.5 34 958.6 34 853.7 33 759.1 3312 82.6 12 82.5 12 82.0 12 83.9 12
0 0.3 0 0.0 0 0.0 0 0.0 04 9.0 4 7.5 4 7.1 4 7.3 42 1.6 2 1.6 2 1.5 2 1.5 23 7.5 3 7.6 3 7.4 3 9.9 3
110 715.6 110 719.5 110 786.6 110 840.5 110- - - - - - - - -
982 1,736.9 982 1,747.0 982 1,967.3 982 1,934.8 982- - - - - - - - -
1,185 8,675.7 1,185 8,573.4 1,185 9,857.4 1,192 9,268.4 1,187209 1,417.9 209 1,415.1 209 1,469.9 209 1,582.5 209
16 27.1 16 26.1 16 26.8 16 25.9 16.. 121.0 .. 119.5 .. 120.5 .. 123.0 ..
10 87.3 10 87.0 10 89.0 10 87.8 10130 778.5 130 780.6 130 810.9 130 850.3 130- - - - - - - - - 46 58.6 46 54.6 46 57.8 46 59.6 4689 1,012.5 89 1,028.3 89 1,048.7 89 1,087.0 8959 56.7 59 54.7 59 60.1 59 60.1 5993 275.6 63 286.2 63 291.5 63 322.8 6352 57.3 57 60.1 57 62.6 57 79.4 5776 705.2 76 705.0 76 736.1 76 730.2 76
160 752.7 160 742.8 160 760.9 160 821.6 1600 0.0 0 0.0 0 0.0 0 0.0 0
16 77.1 16 76.4 16 82.0 16 81.1 1621 73.5 21 72.3 21 71.1 21 69.3 21
4 5.8 4 5.8 4 6.2 4 7.0 4
5 - 49

Table 5.5B - ContinuedPRODUCTION AND AREA HARVESTED OF MAJOR TEMPORARY CROPS BY PROVINCE2013 - 2020(Production in Metric Tons; Area Harvested in Hectares)
Province / 2013 2014 2015 2016Type of Crop Production Area Production Area Production Area Production
Harvested Harvested Harvested
Sorsogon
Ampalaya 121.7 12 118.8 12 121.4 12 113.3Cabbage 6.7 4 6.1 4 6.8 4 6.2Camote 6,981.9 1,774 5,999.1 1,418 5,568.8 1,391 5,050.3Carrots - - - - - - - Cassava 8,218.7 2,508 7,562.1 1,974 6,887.4 1,950 5,851.4Eggplant 159.8 53 158.2 53 153.4 51 146.7Gabi 1,864.8 270 1,884.7 270 1,905.0 269 1,824.3Gabi leaves 248.7 .. 246.4 .. 244.8 .. 240.6Ginger 16.2 7 15.8 7 15.8 7 15.8Gourd 233.6 17 234.2 17 238.0 17 232.2Habitchuelas - - - - - - - Mongo 32.8 34 33.4 35 36.9 34 34.5Okra 535.0 35 540.2 35 546.2 35 531.6Peanut 25.7 56 26.6 56 29.7 56 25.7Pechay 36.4 10 36.2 10 36.8 10 35.8Pepper, Finger 27.4 32 27.4 32 27.6 30 25.9Squash Fruit 469.2 30 452.0 30 447.5 30 453.1Stringbeans 1,325.4 175 1,225.1 175 1,205.9 173 1,149.0Sugarcane 2.5 0 2.2 0 2.3 0 2.4Tomato 16.5 5 16.5 5 18.5 5 17.0Ubi 15.5 4 15.8 4 17.1 4 15.2Watermelon 48.4 8 55.7 8 66.9 9 60.2
Note: .. means data is not available, 0 means less than 1 hectare.
5 - 50

2017 2018 2019 2020Area Production Area Production Area Production Area Production Area
Harvested Harvested Harvested Harvested Harvested
12 115.8 12 117.7 12 99.4 11 84.9 113 5.8 3 5.4 2 4.1 2 3.0 1
1,259 5,090.2 1,262 5,087.3 1,262 4,466.1 1,135 4,077.4 1,042- - - - - - - - -
1,694 5,795.4 1,694 5,717.2 1,709 5,166.7 1,488 4,354.1 1,34948 158.5 48 161.4 48 151.0 45 145.8 45
247 1,871.9 247 1,888.3 247 1,707.5 225 1,514.6 225.. 249.4 .. 251.8 .. 233.7 .. 222.5 ..7 16.6 7 16.7 7 15.8 7 16.1 7
17 236.4 17 239.4 18 207.7 16 186.1 16- - - - - - - - - 31 35.3 31 34.2 30 29.8 27 29.6 2734 538.0 34 537.1 34 421.0 28 367.6 2850 26.2 50 26.4 50 24.1 46 24.7 46
9 36.9 10 37.0 10 33.0 8 32.0 828 26.7 28 27.1 28 22.0 23 18.9 2330 464.8 30 469.5 30 412.6 27 384.8 27
160 1,163.4 161 1,172.5 161 984.5 140 900.3 1390 2.6 0 2.7 0 2.5 0 1.8 05 18.1 5 18.5 5 17.4 5 17.6 53 15.7 3 16.1 3 14.9 3 14.3 38 67.4 9 69.4 9 71.5 9 64.3 9
5 - 51

Table 5.6
INVENTORY OF LIVESTOCK AND POULTRY BY KIND AND PROVINCEAs of January 1, 2014 - 2021(Number of Heads)
Province / Kind 2014 2015 2016 2017 2018 2019 2020 2021
Region V
Livestock Carabao 269,100 278,331 288,641 302,610 311,988 313,757 316,528 325,063 Cattle 96,300 102,659 108,043 111,792 112,950 114,996 112,581 110,802 Goat 127,710 136,237 145,460 153,081 156,430 154,713 159,631 164,053 Swine 858,408 863,382 857,119 909,474 959,017 974,864 891,457 763,640Poultry Chicken 8,282,457 8,201,612 9,992,146 10,388,300 10,434,560 10,342,812 8,751,535 8,884,399 Duck 362,274 390,837 425,889 488,903 523,395 533,681 578,444 687,240
Albay
Livestock Carabao 62,139 68,026 72,794 80,300 85,641 84,682 85,562 87,760 Cattle 4,939 5,916 6,792 7,320 7,652 8,180 8,089 8,014 Goat 25,312 29,013 35,609 44,150 49,717 49,621 52,159 52,883 Swine 195,249 184,379 166,489 202,673 221,880 238,830 181,136 81,767Poultry Chicken 1,374,036 1,319,326 2,345,837 1,546,977 1,583,585 1,730,547 1,741,647 1,729,179 Duck 150,001 167,653 186,884 204,371 217,118 216,799 225,890 227,538
Camarines Norte
Livestock Carabao 39,065 41,359 43,842 46,165 48,864 50,311 49,295 49,053 Cattle 6,050 6,175 6,270 6,372 6,618 6,611 6,238 5,331 Goat 6,970 7,408 7,671 8,287 8,580 8,611 8,788 9,168 Swine 116,430 121,367 125,698 135,538 146,756 163,195 154,413 145,029Poultry Chicken 399,676 436,578 615,468 728,099 794,475 776,892 780,880 766,293 Duck 27,620 34,923 37,504 38,224 41,177 42,134 42,598 43,840
Camarines Sur
Livestock Carabao 63,238 65,019 67,010 69,330 71,627 73,923 78,796 84,792 Cattle 22,133 25,385 25,387 25,787 25,666 25,325 23,455 21,917 Goat 39,895 43,148 44,715 43,812 41,759 41,551 42,218 45,754 Swine 284,010 296,956 299,797 304,181 311,941 303,781 289,819 317,215Poultry Chicken 4,736,980 4,741,480 5,260,177 6,290,545 6,057,011 5,888,465 4,575,399 4,415,667 Duck 124,131 128,844 141,223 177,112 194,794 205,001 239,266 330,815
Source: Philippine Statistics Authority
5 - 52

Table 5.6 - Continued
INVENTORY OF LIVESTOCK AND POULTRY BY KIND AND PROVINCEAs of January 1, 2014 - 2021(Number of Heads)
Province / Kind 2014 2015 2016 2017 2018 2019 2020 2021
Catanduanes
Livestock Carabao 7,732 6,865 6,412 6,092 5,812 6,340 6,078 5,195 Cattle 1,362 1,401 1,541 1,685 1,731 1,807 1,676 1,525 Goat 1,790 1,929 1,981 1,919 1,670 1,540 1,662 1,450 Swine 72,463 77,431 83,974 83,081 84,595 78,374 68,371 22,353Poultry Chicken 60,677 64,081 71,080 73,585 76,136 76,663 89,586 123,444 Duck 3,275 2,345 2,112 2,260 2,397 2,197 2,442 7,715
Masbate
Livestock Carabao 63,690 64,076 64,368 66,740 66,204 65,271 64,083 65,554 Cattle 45,021 48,032 51,650 54,741 55,376 57,500 57,473 58,077 Goat 47,496 48,575 49,149 47,994 48,280 47,067 49,287 49,236 Swine 101,400 101,910 98,706 98,174 107,570 105,701 108,483 119,580Poultry Chicken 869,991 812,719 833,670 864,624 943,536 944,293 941,703 951,760 Duck 8,698 8,734 8,906 9,277 9,454 9,489 9,378 9,750
Sorsogon
Livestock Carabao 33,236 32,986 34,215 33,983 33,840 33,230 32,714 32,709 Cattle 16,795 15,750 16,403 15,887 15,907 15,573 15,650 15,938 Goat 6,247 6,164 6,335 6,919 6,424 6,323 5,517 5,562 Swine 88,856 81,339 82,455 85,827 86,275 84,983 89,235 77,696Poultry Chicken 841,097 827,428 865,914 884,470 979,817 925,952 622,320 898,056 Duck 48,549 48,338 49,260 57,659 58,455 58,061 58,870 67,582
5 - 53

Table 5.7ANIMALS SLAUGHTERED/DRESSED IN SLAUGHTERHOUSES/DRESSING PLANTS BY KIND AND PROVINCE, 2013 - 2020(Number of Heads)
Province/Kind 2013 2014 2015 2016 2017 2018 2019 2020
Region VCarabao 8,145 7,916 7,404 6,779 6,787 6,413 6,592 4,991Cattle 31,805 31,216 30,736 27,316 23,223 21,914 21,480 18,882Goat 1,006 963 1,205 1,104 1,319 933 992 566Swine 493,287 496,434 524,918 563,285 616,554 589,818 646,397 709,403Chicken 22,219,974 25,662,577 29,627,767 32,305,809 30,268,699 35,491,819 35,798,706 28,301,734
AlbayCarabao 1,806 1,830 1,463 1,472 1,354 1,414 1,569 1,222Cattle 4,883 4,792 4,960 4,537 4,870 4,994 5,203 4,359Goat - - - 66 43 39 151 38Swine 142,437 143,316 150,591 166,699 174,582 169,085 187,928 219,411Chicken 10,038,446 9,851,749 9,179,080 9,259,443 8,205,848 9,231,550 9,015,697 7,550,499
Camarines NorteCarabao 354 303 241 268 237 270 223 202Cattle 2,706 2,542 2,229 2,111 2,114 1,914 1,958 1,747Goat 9 5 39 22 31 19 3 - Swine 56,266 56,086 57,259 63,357 72,107 67,376 73,665 92,693Chicken 1,613,825 3,126,356 2,271,861 2,408,048 2,691,239 3,161,771 3,186,975 2,008,316
Camarines SurCarabao 2,018 1,922 1,918 1,580 1,620 1,699 1,523 1,182Cattle 9,276 9,456 9,971 8,838 9,331 8,956 8,511 7,844Goat 997 958 1,166 1,016 1,245 875 820 518Swine 165,467 167,111 181,907 191,949 216,439 201,574 215,738 210,118Chicken 10,567,703 12,684,472 18,176,826 20,638,318 19,371,612 23,098,498 23,596,034 18,742,919
CatanduanesCarabao 1,771 1,725 1,623 1,531 1,724 1,332 1,506 1,125Cattle 247 178 176 182 178 211 290 173Goat - - - - - - - - Swine 10,766 11,698 14,008 13,622 14,082 13,286 18,433 17,181Chicken - - - - - - - -
MasbateCarabao 1,586 1,509 1,440 1,195 1,111 908 975 601Cattle 12,926 12,444 11,504 9,717 4,770 3,818 3,600 3,118Goat - - - - - - 18 - Swine 30,506 29,721 28,551 30,755 39,666 38,550 39,150 47,691Chicken - - - - - - - -
SorsogonCarabao 610 627 719 733 741 790 796 659Cattle 1,767 1,804 1,896 1,931 1,960 2,021 1,918 1,641Goat - - - - - - - 10Swine 87,845 88,502 92,602 96,903 99,678 99,947 111,483 122,309Chicken - - - - - - - -
Source: Philippine Statistics Authority
5 - 54

Table 5.8 FISH PRODUCTION BY TYPE OF PRODUCTION AND PROVINCE2011 - 2020(In Metric Tons)
Commercial MunicipalFishing Fishing
Region V2011 289,007 68,973 143,712 76,3232012 295,312 70,169 145,111 80,0332013 300,317 70,566 149,695 80,0572014 294,954 70,093 145,623 79,2382015 268,188 63,430 131,821 72,937
2016 234,396 59,655 124,053 50,6892017 238,846 58,236 125,133 55,4762018 256,590 58,543 126,771 71,2752019 237,513 41,364 125,083 71,0662020 238,848 57,880 126,392 54,576
Albay2011 22,459 8,979 9,867 3,6122012 23,256 9,425 10,212 3,6182013 23,647 9,535 10,484 3,6292014 23,860 9,616 10,567 3,6772015 21,940 9,272 10,368 2,300
2016 22,053 9,129 10,480 2,4442017 22,813 9,882 10,721 2,2102018 21,602 9,082 10,339 2,1812019 20,975 8,638 9,829 2,5082020 20,165 8,593 9,457 2,114
Camarines Norte2011 63,263 5,395 21,804 36,0642012 68,214 5,462 23,799 38,9532013 72,534 5,746 26,160 40,6282014 71,939 5,827 25,799 40,3142015 66,275 5,212 22,074 38,989
2016 47,432 6,218 18,112 23,1032017 44,344 4,453 15,919 23,9732018 56,232 3,422 13,256 39,5552019 54,591 1,867 11,335 41,3892020 35,957 2,366 7,561 26,031
Camarines Sur2011 100,992 34,917 33,785 32,2912012 101,133 34,754 33,528 32,8512013 97,017 33,522 32,249 31,2462014 95,176 32,624 31,962 30,5902015 86,957 29,565 30,147 27,245
2016 71,032 24,896 25,254 20,8812017 69,371 22,147 22,640 24,5842018 63,780 19,191 19,397 25,1932019 53,613 11,982 17,267 24,3642020 50,669 10,715 15,733 24,221
Source: Philippine Statistics Authority
Province / Year Total Aquaculture
5 - 55

Table 5.8 - ContinuedFISH PRODUCTION BY TYPE OF PRODUCTION AND PROVINCE2010 - 2019(In Metric Tons)
Commercial MunicipalFishing Fishing
Catanduanes2011 10,576 312 10,212 522012 9,600 294 9,177 1282013 10,147 335 9,630 1822014 8,251 342 7,755 1542015 6,812 311 6,312 189
2016 5,728 311 5,275 1432017 5,339 276 5,011 522018 4,751 250 4,479 212019 4,300 200 4,075 262020 3,895 144 3,723 28
Masbate2011 62,317 14,636 45,055 2,6272012 64,615 15,315 46,540 2,7602013 67,183 16,258 48,273 2,6522014 66,060 16,274 47,283 2,5032015 58,462 14,636 41,419 2,407
2016 60,960 14,069 44,600 2,2902017 65,495 14,964 48,087 2,4442018 63,620 12,809 48,484 2,3282019 59,371 8,260 49,355 1,7552020 44,739 2,316 40,741 1,681
Sorsogon2011 29,400 4,734 22,989 1,6772012 28,495 4,918 21,856 1,7212013 29,790 5,171 22,899 1,7202014 29,668 5,410 22,257 2,0012015 27,742 4,433 21,502 1,807
2016 27,192 5,032 20,332 1,8282017 31,484 6,515 22,755 2,2142018 46,604 13,790 30,817 1,9982019 44,663 10,417 33,222 1,0242020 83,424 33,747 49,177 500
Note: Detail may not add up to totals due to rounding.
Province / Year Total Aquaculture
5 - 56

AND PROVINCE, 2020
Figure 5.12 FISH PRODUCTION BY TYPE OF PRODUCTIONREGION V, 2011 - 2020
Figure 5.13 FISH PRODUCTION BY TYPE OF PRODUCTION
0
50,000
100,000
150,000
200,000
250,000
300,000
350,000
2011 2012 2013 2014 2015 2016 2017 2018 2019 2020
(In
Me
tric
To
ns
)
Total Commercial Fishing Municipal Fishing Aquaculture
0 10,000 20,000 30,000 40,000 50,000 60,000
Sorsogon
Masbate
Catanduanes
Camarines Sur
CamarinesNorte
Albay
(In Metric Tons)
Commercial Fishing Municipal Fishing Aquaculture
5 - 57

Table 5.9
AQUACULTURE PRODUCTION BY TYPE OF CULTURE AND PROVINCE2013 - 2020(In Metric Tons)
Province / Culture Type 2013 2014 2015 2016 2017 2018 2019 2020
Region V 80,056.7 79,237.8 72,936.9 50,688.6 55,476.3 71,275.5 71,065.8 54,575.8
Brackishwater Fishpond 8,838.3 9,381.2 8,497.9 8,044.1 8,097.8 8,048.4 8,623.0 5,803.4Brackishwater Pen - - - - - - - 6.9Brackishwater Cage - - - - - - - 1.0Freshwater Fishpond 1,872.4 1,839.9 1,762.1 1,391.4 3,449.2 3,570.7 3,424.4 3,507.2Freshwater Pen - - - - - - - 0.6Freshwater Cage 7,818.4 7,839.7 6,946.8 6,578.1 6,323.8 6,353.6 6,592.0 6,127.0Marine Pen 122.2 - - 36.0 162.1 245.1 348.6 86.1Marine Cage 31.8 28.8 25.8 34.7 18.5 15.5 18.9 10.2Oyster - - - - - - - 7.2Mussel 283.8 284.5 322.2 404.9 439.6 435.1 411.7 96.5Seaweed 61,089.9 59,863.8 55,382.1 34,199.5 36,985.5 52,607.1 51,647.1 38,929.7
Albay 3,628.9 3,676.8 2,300.1 2,443.6 2,210.3 2,181.5 2,508.2 2,114.3
Brackishwater Fishpond 819.7 811.1 291.2 300.0 300.6 312.5 302.2 125.3Brackishwater Pen - - - - - - - 6.3Brackishwater Cage - - - - - - - 0.0Freshwater Fishpond 67.8 71.0 104.9 131.1 104.1 120.0 153.1 108.5Freshwater Pen - - - - - - - 0.5Freshwater Cage 2,149.5 2,198.5 1,688.9 1,816.0 1,610.7 1,529.0 1,844.1 1,661.9Marine Pen - - - - - - - 0.4Marine Cage - - - - - - - 0.3Oyster - - - - - - - - Mussel - - - - - - - - Seaweed 591.9 596.1 215.1 196.6 194.8 220.0 208.8 211.1
Camarines Norte 40,627.9 40,313.7 38,989.1 23,102.5 23,972.6 39,554.9 41,389.3 26,030.8
Brackishwater Fishpond 3,349.1 3,614.4 3,890.9 3,606.8 3,266.2 3,880.9 5,674.4 3,296.1Brackishwater Pen - - - - - - - - Brackishwater Cage - - - - - - - 0.8Freshwater Fishpond 406.5 465.3 525.6 381.1 227.9 226.4 218.8 196.7Freshwater Pen - - - - - - - - Freshwater Cage - - - - - - - 0.1Marine Pen - - - - - - - - Marine Cage 30.6 28.7 25.5 34.7 18.5 15.5 18.2 7.9Oyster - - - - - - - - Mussel - - - - - - - - Seaweed 36,841.7 36,205.2 34,547.2 19,080.0 20,460.0 35,432.2 35,477.9 22,529.2
Note: 0 means less than 0.05 metric ton
Source: Philippine Statistics Authority
5 - 58

Table 5.9 - Continued
AQUACULTURE PRODUCTION BY TYPE OF CULTURE AND PROVINCE2013 - 2020(In Metric Tons)
Province / Culture Type 2013 2014 2015 2016 2017 2018 2019 2020
Camarines Sur 31,245.9 30,589.7 27,245.0 20,881.4 24,583.7 25,192.6 24,363.7 24,220.5
Brackishwater Fishpond 1,978.0 2,035.4 1,958.9 1,875.9 2,183.2 1,587.6 1,517.6 1,413.0Brackishwater Pen - - - - - - - Brackishwater Cage - - - - - - - Freshwater Fishpond 1,204.9 1,112.1 1,011.7 864.4 3,109.3 3,215.9 3,043.2 3,196.0Freshwater Pen - - - - - - - Freshwater Cage 5,668.9 5,641.2 5,257.9 4,762.2 4,713.0 4,824.5 4,748.0 4,465.0Marine Pen - - - - - - - - Marine Cage - - - - - - - 1.9Oyster - - - - - - - - Mussel - - - - - - - - Seaweed 22,394.2 21,800.9 19,016.4 13,379.0 14,578.3 15,564.6 15,054.9 15,144.6
Catanduanes 181.9 154.0 189.4 142.7 51.7 21.3 25.6 28.3
Brackishwater Fishpond 178.4 148.0 179.3 141.0 51.7 21.3 25.6 28.2Brackishwater Pen - - - - - - - - Brackishwater Cage - - - - - - - - Freshwater Fishpond 2.5 3.1 3.5 1.7 - - - 0.1Freshwater Pen - - - - - - - - Freshwater Cage - - - - - - - 0.0Marine Pen - - - - - - - 0.1Marine Cage - - - - - - - - Oyster - - - - - - - - Mussel - - - - - - - - Seaweed 1.1 2.9 6.6 - - - - -
Masbate 2,651.8 2,503.2 2,406.6 2,290.3 2,443.8 2,327.5 1,755.4 1,681.5
Brackishwater Fishpond 1,168.8 1,207.1 1,116.3 1,084.2 1,080.4 980.4 604.5 567.8Brackishwater Pen - - - - - - - - Brackishwater Cage - - - - - - - - Freshwater Fishpond 139.0 134.4 71.0 - - - - - Freshwater Pen - - - - - - - - Freshwater Cage - - - - - - - - Marine Pen 122.2 - - 36.0 162.1 245.1 348.6 85.7Marine Cage - - - - - - - - Oyster - - - - - - - - Mussel - - - - - - - - Seaweed 1,221.8 1,161.7 1,219.4 1,170.1 1,201.4 1,102.1 802.3 1,028.1
Sorsogon 1,720.3 2,000.6 1,806.8 1,828.1 2,214.2 1,997.7 1,023.6 500.4
Brackishwater Fishpond 1,344.3 1,565.2 1,061.4 1,036.3 1,215.7 1,265.8 498.8 373.0Brackishwater Pen - - - - - - - 0.6Brackishwater Cage - - - - - - - 0.2Freshwater Fishpond 51.7 53.9 45.5 13.2 7.9 8.4 9.3 5.9Freshwater Pen - - - - - - - 0.0Freshwater Cage - - - - - - - - Marine Pen - - - - - - - - Marine Cage 1.1 0.1 0.3 - - - 0.8 0.2Oyster - - - - - - - 7.2Mussel 283.8 284.5 322.2 404.9 439.6 435.1 411.7 96.5Seaweed 39.3 96.9 377.4 373.7 551.0 288.3 103.1 16.8
5 - 59

Table 5.10STATUS OF THE COMPREHENSIVE AGRARIAN REFORM PROGRAM (CARP)BY PHASE AND PROVINCE1972 - 2020(Area in Hectares)
Province / TOTAL PHASE I PHASE II PHASE IIIYear Area Beneficiaries Area Beneficiaries Area Beneficiaries Area Beneficiaries
Region V
1972-2011 316,625.5 188,511 249,961.0 155,566 51,900.9 24,640 14,763.8 8,3062012 2,827.0 1,452 2,250.0 1,181 275.0 166 302.0 1052013 6,219.0 2,977 5,653.0 2,757 106.0 41 460.0 1792014 4,757.8 2,581 3,097.4 1,760 381.5 225 1,278.9 5962015 2,517.9 1,519 1,095.7 835 418.8 251 1,003.4 433
2016 2,411.8 1,325 845.6 545 559.1 344 1,007.1 4362017 2,714.0 1,639 1,118.4 902 388.2 266 1,207.5 4712018 2,025.8 1,249 1,177.2 888 220.1 125 628.5 2362019 4,505.7 2,231 2,870.2 1,547 425.2 225 1,210.3 4592020 2,883.2 1,496 1,658.9 885 225.5 179 998.8 432
Albay
1972-2011 53,437.4 39,161 45,038.4 33,484 5,896.1 3,935 2,502.7 1,7422012 398.0 176 304.0 130 32.0 22 62.0 242013 704.0 465 680.0 443 16.0 14 8.0 82014 655.0 136 481.0 116 115.0 13 59.0 72015 127.0 76 30.0 21 27.0 18 70.0 37
2016 247.4 120 22.8 22 76.0 36 148.6 622017 276.9 161 41.4 30 76.7 59 158.8 722018 336.0 122 259.0 81 31.0 14 46.0 272019 424.7 195 284.4 118 7.5 5 132.9 722020 195.4 142 120.8 100 13.6 8 60.9 34
Camarines Norte
1972-2011 34,024.7 16,200 23,998.6 11,501 4,060.0 1,935 5,966.1 2,7652012 277.0 131 184.0 94 53.0 27 40.0 102013 377.0 163 105.0 76 20.0 3 252.0 842014 547.6 259 134.0 74 45.0 39 368.6 1462015 505.7 195 55.7 17 40.1 29 409.9 149
2016 433.4 199 69.1 47 129.1 75 235.3 772017 335.6 113 51.5 19 - - 284.1 942018 208.2 61 7.1 4 - - 201.2 572019 476.8 136 19.3 8 3.2 1 454.4 1272020 407.6 143 7.9 2 36.7 19 362.9 122
Camarines Sur
1972-2011 114,996.9 71,686 84,472.7 56,740 26,948.8 12,661 3,575.5 2,2862012 1,306.0 701 1,165.0 627 57.0 48 84.0 262013 3,130.0 1,825 2,982.0 1,751 46.0 17 102.0 572014 2,221.0 1,504 1,751.1 1,192 161.2 144 308.7 1682015 1,415.6 1,022 719.5 667 297.5 175 398.6 180
2016 1,162.1 679 566.1 359 230.2 144 365.8 1762017 1,376.5 1,031 825.0 742 230.2 149 321.4 1402018 788.1 530 526.0 390 118.3 74 143.8 662019 2,317.4 1,181 1,886.1 970 187.4 91 243.9 1202020 994.1 684 607.2 440 146.8 140 240.2 104
Source: Department of Agrarian Reform
5 - 60

Table 5.10 - ContinuedSTATUS OF THE COMPREHENSIVE AGRARIAN REFORM PROGRAM (CARP)BY PHASE AND PROVINCE1972 - 2020(Area in Hectares)
Province / TOTAL PHASE I PHASE II PHASE IIIYear Area Beneficiaries Area Beneficiaries Area Beneficiaries Area Beneficiaries
Catanduanes
1972-2011 13,976.9 10,179 13,819.0 10,059 140.2 77 17.6 422012 165.0 118 165.0 118 - - - - 2013 220.0 142 220.0 142 - - - - 2014 159.5 66 159.5 66 - - - - 2015 105.0 24 66.0 1 32.0 19 7.0 4
2016 124.2 68 102.6 50 - - 21.6 182017 - - - - - - - -2018 - - - - - - - -2019 - - - - - - - -2020 - - - - - - - -
Masbate
1972-2011 69,361.3 31,442 56,141.2 26,564 12,060.3 4,288 1,159.8 5902012 493.0 235 250.0 131 127.0 59 116.0 452013 1,357.0 158 1,343.0 156 - - 14.0 22014 702.4 401 358.9 204 - - 343.5 1972015 115.4 84 115.4 84 - - - -
2016 179.7 96 15.5 8 33.5 22 130.6 662017 359.4 155 166.9 76 39.6 34 152.9 452018 383.8 414 242.2 344 59.6 31 82.1 392019 1,011.6 579 597.1 384 170.3 102 244.3 932020 948.0 357 832.4 301 4.2 3 111.3 53
Sorsogon
1972-2011 30,828.2 19,843 26,490.9 17,218 2,795.3 1,744 1,541.9 8812012 189.0 91 182.0 81 6.0 10 - - 2013 431.0 224 323.0 189 24.0 7 84.0 282014 472.3 215 212.9 108 60.3 29 199.1 782015 248.9 118 109.6 45 21.7 10 117.6 63
2016 265.0 163 69.5 59 90.2 67 105.3 372017 365.6 179 33.6 35 41.7 24 290.3 1202018 309.6 122 142.9 69 11.2 6 155.5 472019 275.1 140 83.5 67 56.8 26 134.8 472020 338.2 170 90.6 42 24.1 9 223.5 119
5 - 61

Table 5.11
NUMBER OF REGISTERED/CONFIRMED COOPERATIVES BY TYPE, REGION V2011 - 2020
Type 2011 2012 2013 2014 2015 2016 2017 2018 2019 2020
Region V 793 847 892 935 974 1,024 1,091 1,158 1,243 1,340
Advocacy - - 1 3 3 3 5 4 4 4Agrarian Reform 1 3 3 8 9 11 33 21 26 28Agriculture - - - - - 15 239 60 85 102Consumers 18 24 32 37 43 50 62 66 74 85Cooperative Bank - - - - - - 3 3 3 3Credit 100 123 131 134 142 155 166 176 189 200Dairy 2 2 2 4 5 5 5 5 5 6Electric - - - 1 1 1 1 1 1 1Federation-Secondary 7 7 8 8 8 8 8 8 9 9Fishermen - - - - - - - - 1 2Health Service - - - - - - 9 3 3 3Housing 1 1 2 2 2 2 2 2 3 3Labor Service - - - - - - 2 1 1 1Marketing 11 14 16 16 16 18 9 20 20 21Multipurpose 536 547 559 570 578 576 433 582 585 588Producers 60 66 74 84 95 107 43 126 127 134Service 51 53 55 56 58 58 44 51 50 51Small Scale Mining - - - - - - 8 1 1 1Transport 1 2 3 6 8 8 12 21 49 91Union-Secondary 3 3 4 4 4 4 4 5 5 5Water Service - - - - - 1 1 1 1 1Workers 2 2 2 2 2 2 2 1 1 1
Source: Cooperative Development Authority
Note: Other coops include Consumers, Service, Agrarian Reform, Marketing, Federation, Dairy, Union, Advocacy,Cooperative Bank, Health Service, Housing, Fishermen, Electric, Labor Service, Small Scale Mining,Water Service, and Workers.
Figure 5.14 DISTRIBUTION OF REGISTERED/CONFIRMED COOPERATIVES BY TYPEREGION V, 2020
Multipurpose43.9%
Credit14.9%
Producers10.0%
Agriculture7.6%
Transport6.8%
Other coops16.8%
5 - 62

6 - 1
Data on the industries obtaining in the region and investments serve as gauge of the extent of the area's attractiveness and capability to absorb entrepreneurial ventures. An analysis of the data on the size and growth of industries and the stock and flow of investments shows the enabling factors that provide or enhance the comparative advantages enjoyed by industries and investors in the area. On the other hand, the data can give indications of the limiting factors that hinder the entry, growth and movement of industries and investments. With the data providing signals, the concerned governmental instrumentalities can formulate policies, enforce regulations and undertake infrastructure programs and other forms of assistance to business and prospective investors. Armed with the data, key decision makers in the government and the private sectors can also forge alliances to improve the business climate and environment. Ultimately, the policies and measures implemented as well as the alliances can serve as instruments for achieving growth and providing employment opportunities, among others, to the region's labor force. This chapter presents regional and provincial data where available, on the number of establishments by major industry division, the number, floor area and value of private building construction and the value of investments generated in the region. The data sources are the Philippine Statistics Authority for the establishments and building construction data and the Department of Trade and Industry and Securities and Exchange Commission for the investment statistics. Sector Highlights The total number of establishments in Bicol Region reached 36,214 in 2016 generating an
employment of 180,348. Wholesale and Retail Trade, Repair of Motor Vehicles and Motorcycles accounted for 47.3% of the establishments in the region. In terms of employment generated, micro businesses had the majority share at 52.9% while Medium businesses had the least at 7.9%.
The number of approved building permit applications decreased by 50.7% between 2019 and 2020. On the other hand, the number of floor area covered by the building permit applications decreased by 57.2% with the value of construction decreased by 55.7 percent.
Residential building construction accounted for 68.5% of total floor area and 32.9% of value
of construction covered by building permit applications in 2020. Meanwhile, floor area of non-residential building construction covered by building permit applications in 2020 decreased by 50.1% with the value of construction dropped by 64.1%.
There were 36,549 approved business names registered with the Department of Trade and Industry
in 2020 in the Bicol Region, 58.6% more than registrations in the past year. The province of Camarines Sur accounted for the highest number of approved business names in the region with 32.0% and Catanduanes with the least at 6.4% .
Stock/non-stock corporations and partnerships registered with the Securities and Exchange
Commission in the region generated a total Paid-up Capital of PhP684.3 million in 2019, lower by 20.1% from the value generated in 2018.
Chapter 6 ESTABLISHMENT CHARACTERISTICS: INDUSTRIAL SECTOR

Table 6.1 Number of Establishments and Total Employment by Province, Industryand Employment Size (MSME), Region V, 2016 6 - 4
Table 6.2 Number, Floor Area and Value of Private Building Construction by Typeof Construction and Province, 2011 - 2020 6 - 10
Table 6.3 Annual Business Name RegistrationRegion V, 2017 - 2020 6 - 14
Table 6.4 Number and Investments of Registered Stock/Non-stock Corporationsand Partnerships, Region V, 2017 - 2019 6 - 15
Figure 6.1 Number of Establishments and Total Employment by Province,Region V: 2016 6 - 3
Figure 6.2 Floor Area of Private Building Construction by Type of Construction, 6 - 3Region V: 2016 - 2020
Figure 6.3 Annual Business Name RegistrationRegion V: 2017 - 2020 6 - 14
Figure 6.4 Generated Paid-Up Capital of Stock/Non-Stock Corporations andPartnerships, Region V: 2015 - 2019 6 - 16
Figure 6.5 Number, Floor and Value of Private Building Construction, 6 - 16Region V: 2020
6 - 2

Figure 6.1 NUMBER OF ESTABLISHMENTS AND TOTAL EMPLOYMENTBY PROVINCE, REGION V: 2016
Figure 6.2 FLOOR AREA OF PRIVATE BUILDING CONSRUCTION BY TYPEOF CONSTRUCTION, REGION V: 2016 - 2020
0
100
200
300
400
500
600
700
2016 2017 2018 2019 2020
In S
qu
are
Me
ters
Th
ou
sa
nd
s
Residential Non-residential
-
10,000
20,000
30,000
40,000
50,000
60,000
70,000
80,000
90,000
0
2,000
4,000
6,000
8,000
10,000
12,000
14,000
16,000
Albay CamarinesNorte
Camarines Sur Catanduanes Masbate Sorsogon
Es
tab
lis
hm
en
ts
Number of Establishments
Total Employment
6 - 3

Table 6.1 NUMBER OF ESTABLISHMENT AND TOTAL EMPLOYMENT BY PROVINCE, INDUSTRY ANDEMPLOYMENT SIZE (MSME), REGION V2016
Total Establishments Micro
Bicol Region 36,214 33,501
A - Agriculture, Forestry, and Fishing 481 420 B - Mining and Quarrying 34 19 C - Manufacturing 5,830 5,561 D - Electricity, Gas, Steam, and Air Conditioning Supply 57 18 E - Water Supply; Sewerage, Waste Management and Remediation Activities 61 23 F - Construction 75 32 G - Wholesale and Retail Trade; Repair of Motor Vehicles and Motorcycles 17,147 16,263 H - Transportation and Storage 299 233 I - Accommodation and Food Service Activities 3,908 3,562 J - Information and Communication 1,345 1,300 K - Financial and Insurance Activities 1,506 1,202 L - Real Estate Activities 194 156 M - Professional, Scientific and Technical Activities 581 577 N - Administrative and Support Service Activities 431 398 P - Education 663 319 Q - Human Health and Social Work Activities 926 841 R - Arts, Entertainment, and Recreation 731 674 S - Other Service Activities 1,945 1,903
Albay 8,680 7,878
A - Agriculture, Forestry, and Fishing 108 90 B - Mining and Quarrying 9 4 C - Manufacturing 1,486 1,397 D - Electricity, Gas, Steam, and Air Conditioning Supply 12 3 E - Water Supply; Sewerage, Waste Management and Remediation Activities 11 3 F - Construction 30 8 G - Wholesale and Retail Trade; Repair of Motor Vehicles and Motorcycles 3,681 3,467 H - Transportation and Storage 125 100 I - Accommodation and Food Service Activities 945 833 J - Information and Communication 353 337 K - Financial and Insurance Activities 387 294 L - Real Estate Activities 57 47 M - Professional, Scientific and Technical Activities 147 145 N - Administrative and Support Service Activities 168 154 P - Education 182 93 Q - Human Health and Social Work Activities 279 239 R - Arts, Entertainment, and Recreation 167 151 S - Other Service Activities 533 513
Camarines Norte 4,748 4,517
A - Agriculture, Forestry, and Fishing 49 45 B - Mining and Quarrying 10 7 C - Manufacturing 708 690 D - Electricity, Gas, Steam, and Air Conditioning Supply 3 2 E - Water Supply; Sewerage, Waste Management and Remediation Activities 4 1 F - Construction 6 3 G - Wholesale and Retail Trade; Repair of Motor Vehicles and Motorcycles 2,301 2,221 H - Transportation and Storage 28 22
Province / Industry
6 - 4

Number of Establishments Total Total EmploymentSmall Medium Large Employment Micro Small Medium Large
2,570 102 41 180,348 95,468 53,860 14,332 16,688
60 1 - 2,972 1,582 1,290 100 - 13 1 1 997 82 229 192 494
254 10 5 24,684 15,690 5,225 1,438 2,331 26 7 6 3,371 87 636 1,108 1,540 35 3 - 1,778 121 1,155 502 - 37 5 1 2,777 135 1,375 819 448
846 35 3 68,828 45,417 16,923 4,741 1,747 56 6 4 4,032 827 1,501 707 997
341 5 - 19,467 11,615 7,226 626 - 44 - 1 3,792 2,748 740 - 304
298 5 1 10,474 4,475 5,087 567 345 38 - - 1,325 441 884 - - 4 - - 1,503 1,398 105 - -
23 3 7 5,891 1,084 442 425 3,940 324 12 8 14,019 1,388 7,731 1,747 3,153 73 9 3 6,226 1,864 1,917 1,360 1,085 56 - 1 3,114 2,036 774 - 304 42 - - 5,098 4,478 620 - -
762 28 12 47,394 22,260 17,165 4,033 3,936
18 - - 758 351 407 - - 5 - - 111 18 93 - -
85 2 2 6,775 3,935 1,994 296 550 5 2 2 1,000 11 183 273 533 8 - - 356 10 346 - -
18 3 1 1,718 24 743 503 448 204 9 1 15,430 9,449 4,313 1,270 398 22 1 2 1,428 350 477 101 500
112 - - 5,380 2,785 2,595 - - 15 - 1 1,276 682 290 - 304 90 3 - 3,005 1,122 1,544 339 - 10 - - 412 104 308 - - 2 - - 391 361 30 - -
11 2 1 1,470 416 224 274 556 84 3 2 3,703 403 2,137 516 647 37 3 - 1,947 563 923 461 - 16 - - 700 450 250 - - 20 - - 1,534 1,226 308 - -
222 9 - 16,138 10,522 4,284 1,332 -
4 - - 219 159 60 - - 3 - - 100 30 70 - -
17 1 - 2,021 1,677 241 103 - - 1 - 204 5 - 199 -
3 - - 131 2 129 - - 3 - - 142 12 130 - -
76 4 - 6,697 4,867 1,283 547 - 6 - - 229 77 152 - -
6 - 5

Table 6.1 - ContinuedNUMBER OF ESTABLISHMENT AND TOTAL EMPLOYMENT BY PROVINCE, INDUSTRY ANDEMPLOYMENT SIZE (MSME), REGION V2016
Total Establishments Micro
Province / Industry
I - Accommodation and Food Service Activities 555 521 J - Information and Communication 188 187 K - Financial and Insurance Activities 210 177 L - Real Estate Activities 28 26 M - Professional, Scientific and Technical Activities 65 65 N - Administrative and Support Service Activities 43 42 P - Education 63 38 Q - Human Health and Social Work Activities 115 106 R - Arts, Entertainment, and Recreation 156 152 S - Other Service Activities 216 212
Camarines Sur 14,560 13,436
A - Agriculture, Forestry, and Fishing 259 231 B - Mining and Quarrying 8 6 C - Manufacturing 2,291 2,181 D - Electricity, Gas, Steam, and Air Conditioning Supply 24 6 E - Water Supply; Sewerage, Waste Management and Remediation Activities 27 13 F - Construction 21 11 G - Wholesale and Retail Trade; Repair of Motor Vehicles and Motorcycles 7,190 6,787 H - Transportation and Storage 84 60 I - Accommodation and Food Service Activities 1,521 1,370 J - Information and Communication 471 454 K - Financial and Insurance Activities 520 419 L - Real Estate Activities 83 60 M - Professional, Scientific and Technical Activities 255 253 N - Administrative and Support Service Activities 171 154 P - Education 261 117 Q - Human Health and Social Work Activities 370 351 R - Arts, Entertainment, and Recreation 223 199 S - Other Service Activities 781 764
Catanduanes 1,696 1,573
A - Agriculture, Forestry, and Fishing 1 1 B - Mining and Quarrying 1 - C - Manufacturing 335 325 D - Electricity, Gas, Steam, and Air Conditioning Supply 12 7 E - Water Supply; Sewerage, Waste Management and Remediation Activities 6 5 F - Construction 8 6 G - Wholesale and Retail Trade; Repair of Motor Vehicles and Motorcycles 699 653 H - Transportation and Storage 15 12 I - Accommodation and Food Service Activities 194 183 J - Information and Communication 83 79 K - Financial and Insurance Activities 63 40 L - Real Estate Activities 12 11 M - Professional, Scientific and Technical Activities 28 28 N - Administrative and Support Service Activities 9 9 P - Education 28 18 Q - Human Health and Social Work Activities 37 33 R - Arts, Entertainment, and Recreation 56 55 S - Other Service Activities 109 108
6 - 6

Number of Establishments Total Total EmploymentSmall Medium Large Employment Micro Small Medium Large
34 - - 1,991 1,422 569 - - 1 - - 369 359 10 - -
33 - - 1,225 593 632 - - 2 - - 109 67 42 - -
- - - 141 141 - - - 1 - - 144 91 53 - -
23 2 - 996 160 500 336 - 8 1 - 618 173 298 147 - 4 - - 347 278 69 - - 4 - - 455 409 46 - -
1,057 44 23 77,113 39,216 21,761 6,032 10,104
27 1 - 1,647 887 660 100 - 2 - - 47 27 20 - -
103 5 2 9,644 6,043 2,100 742 759 14 2 2 1,042 44 224 279 495 12 2 - 803 70 398 335 - 9 1 - 445 34 266 145 -
383 18 2 30,592 19,425 7,437 2,381 1,349 19 3 2 1,673 195 622 359 497
146 5 - 8,530 4,779 3,125 626 - 17 - - 1,297 990 307 - -
100 1 - 3,351 1,608 1,616 127 - 23 - - 684 187 497 - - 2 - - 693 618 75 - -
10 1 6 4,147 458 154 151 3,384 136 2 6 6,545 523 3,258 258 2,506 14 3 2 2,528 739 450 529 810 23 - 1 1,276 675 297 - 304 17 - - 2,169 1,914 255 - -
117 5 1 8,064 4,533 2,497 689 345
- - - 7 7 - - - 1 - - 15 - 15 - -
10 - - 1,153 1,029 124 - - 4 1 - 330 27 112 191 - 1 - - 81 37 44 - - 2 - - 143 32 111 - -
45 1 - 3,050 1,819 1,096 135 - 1 2 - 376 38 91 247 -
11 - - 761 552 209 - - 4 - - 192 141 51 - -
22 - 1 844 156 343 - 345 1 - - 58 43 15 - -
- - - 62 62 - - - - - - 20 20 - - -
9 1 - 359 62 181 116 - 4 - - 158 78 80 - - 1 - - 216 202 14 - - 1 - - 239 228 11 - -
6 - 7

Table 6.1 - ContinuedNUMBER OF ESTABLISHMENT AND TOTAL EMPLOYMENT BY PROVINCE, INDUSTRY ANDEMPLOYMENT SIZE (MSME), REGION V2016
Total Establishments Micro
Province / Industry
Masbate 3,035 2,837
A - Agriculture, Forestry, and Fishing 29 19
B - Mining and Quarrying 6 2
C - Manufacturing 390 374
D - Electricity, Gas, Steam, and Air Conditioning Supply 4 -
E - Water Supply; Sewerage, Waste Management and Remediation Activities 2 -
F - Construction 6 4
G - Wholesale and Retail Trade; Repair of Motor Vehicles and Motorcycles 1,689 1,619
H - Transportation and Storage 34 28
I - Accommodation and Food Service Activities 241 227
J - Information and Communication 103 101
K - Financial and Insurance Activities 158 138
L - Real Estate Activities 6 4
M - Professional, Scientific and Technical Activities 26 26
N - Administrative and Support Service Activities 22 21
P - Education 61 27
Q - Human Health and Social Work Activities 44 40
R - Arts, Entertainment, and Recreation 72 65
S - Other Service Activities 142 142
Sorsogon 3,495 3,260
A - Agriculture, Forestry, and Fishing 35 34 C - Manufacturing 620 594 D - Electricity, Gas, Steam, and Air Conditioning Supply 2 - E - Water Supply; Sewerage, Waste Management and Remediation Activities 11 1 F - Construction 4 - G - Wholesale and Retail Trade; Repair of Motor Vehicles and Motorcycles 1,587 1,516 H - Transportation and Storage 13 11 I - Accommodation and Food Service Activities 452 428 J - Information and Communication 147 142 K - Financial and Insurance Activities 168 134 L - Real Estate Activities 8 8 M - Professional, Scientific and Technical Activities 60 60 N - Administrative and Support Service Activities 18 18 P - Education 68 26 Q - Human Health and Social Work Activities 81 72 R - Arts, Entertainment, and Recreation 57 52 S - Other Service Activities 164 164
Note: Data suppressed for confidentiality reasons (under Commonwealth Act 591 of 1940)s0 - combined with employment size "micro"
s1 - combined with employment size "small"
s2 - combined with employment size "medium"* Branches of banks ( K - Financial and Insurance Activities) total employment included in
Main Offices' total employmentsc - included in Manufacturing
Details may not add up to total due to statistical disclosure control.
Source: Philippine Statistics Authority
6 - 8

Number of Establishments Total Total EmploymentSmall Medium Large Employment Micro Small Medium Large
188 9 1 14,394 8,840 3,825 1,235 494
10 - - 236 83 153 - -
2 1 1 724 7 31 192 494
15 1 - 1,699 1,175 382 142 -
3 1 - 283 - 117 166 -
2 - - 92 - 92 - -
2 - - 81 33 48 - -
68 2 - 6,644 5,084 1,293 267 -
6 - - 263 134 129 - -
14 - - 1,016 737 279 - -
2 - - 263 239 24 - -
19 1 - 958 470 387 101 -
2 - - 38 16 22 - -
- - - 65 65 - - -
1 - - 65 54 11 - -
32 2 - 1,056 95 700 261 -
3 1 - 287 109 72 106 -
7 - - 326 241 85 - -
- - - 298 298 - - -
224 7 4 17,245 10,097 4,328 1,011 1,809
1 - - 105 95 10 - - 24 1 1 3,392 1,831 384 155 1,022
- - 2 512 - - - 512 9 1 - 315 2 146 167 - 3 1 - 248 - 77 171 -
70 1 - 6,415 4,773 1,501 141 - 2 - - 63 33 30 - -
24 - - 1,789 1,340 449 - - 5 - - 395 337 58 - -
34 - - 1,091 526 565 - - - - - 24 24 - - - - - - 151 151 - - - - - - 45 45 - - - 40 2 - 1,360 145 955 260 - 7 1 1 688 202 94 117 275 5 - - 249 190 59 - -
- - - 403 403 - - -
Establishment Size based on Employment
Micro 1 - 9Small 10 - 99
Medium 100 - 199Large 200 - over
Employment Size
6 - 9

Table 6.2 NUMBER, FLOOR AREA AND VALUE OF PRIVATE BUILDING CONSTRUCTION BY TYPE OF CONSTRUCTION AND PROVINCE2011 - 2020(Floor Area in Square Meters; Value in Thousand Pesos)
Total ResidentialNumber 1/ Floor Area Value Number Floor Area Value
2011 Region V 2,505 458,648 3,388,233 1,934 234,020 1,377,127
Albay 502 184,883 817,594 330 98,975 372,319 Camarines Norte 234 34,649 364,670 180 17,406 135,182 Camarines Sur 1,538 153,715 1,542,314 1,316 102,448 734,986 Catanduanes 68 10,747 110,555 37 4,752 36,972 Masbate 18 2,325 19,958 13 1,755 14,864 Sorsogon 145 72,329 533,133 58 8,684 82,797
2012 Region V 2,932 502,275 3,403,676 2,299 266,263 1,499,011
Albay 539 216,420 965,045 356 113,727 424,874 Camarines Norte 259 37,549 324,627 213 20,410 178,054 Camarines Sur 1,779 157,078 1,206,829 1,551 106,965 674,266 Catanduanes 99 19,837 189,775 68 9,290 76,388 Masbate 85 29,443 325,901 28 4,278 37,336 Sorsogon 171 41,948 391,491 83 11,593 108,083
2013 Region V 3,013 475,346 3,263,209 2,441 251,018 1,563,834
Albay 486 187,713 794,297 289 87,158 307,734 Camarines Norte 221 31,082 260,161 178 16,724 146,915 Camarines Sur 1,994 187,937 1,583,132 1,799 123,765 901,910 Catanduanes 80 12,919 112,999 51 7,141 64,489 Masbate 49 24,202 209,676 29 4,512 41,513 Sorsogon 183 31,493 302,933 95 11,718 101,263
2014 Region V 2,715 446,206 3,399,930 2,017 237,839 1,618,522
Albay 509 172,623 850,451 312 89,706 377,633 Camarines Norte 287 42,838 372,289 228 24,025 233,926 Camarines Sur 1,538 162,913 1,434,388 1,261 94,194 713,759 Catanduanes 89 18,130 232,361 51 7,825 69,557 Masbate 128 18,075 204,992 74 9,439 97,666 Sorsogon 164 31,627 305,438 91 12,650 125,969
2015 Region V 2,972 523,628 4,168,654 2,237 266,124 1,839,640
Albay 498 155,926 688,918 304 87,474 331,356 Camarines Norte 233 42,145 378,572 173 19,342 187,733 Camarines Sur 1,677 214,459 1,706,924 1,382 103,191 850,356 Catanduanes 85 17,026 190,083 58 8,847 72,092 Masbate 302 58,412 795,092 229 35,205 274,427 Sorsogon 177 35,660 409,061 91 12,065 123,671
1/ Refers to the number of building construction permits issued.Note: Details may not add up to totals due to rounding.
Source: Philippine Statistics Authority
Year Province
6 - 10

Non-Residential Additions/Alterations & RepairsNumber Floor Area Value Number Floor Area Value
371 218,354 1,755,496 200 6,274 255,606
128 84,903 388,474 44 1,005 56,79743 16,188 213,235 11 1,055 16,250
119 50,900 715,949 103 367 91,37520 5,537 48,006 11 458 25,570
4 570 4,143 1 - 95057 60,256 385,678 30 3,389 64,652
402 229,934 1,579,586 231 6,078 325,073
134 102,393 482,239 49 300 57,92933 14,604 118,357 13 2,535 28,211
116 49,650 355,182 112 463 177,37421 9,888 98,710 10 659 14,67439 24,905 264,986 18 260 23,57359 28,494 260,103 29 1,861 23,301
388 221,990 1,505,947 184 2,338 193,422
150 100,555 447,771 37 - 48,79031 13,372 101,179 12 986 12,064
115 63,922 575,170 80 250 106,04718 5,476 37,673 11 302 10,83216 19,577 165,392 4 113 2,76958 19,088 178,751 30 687 22,913
448 204,799 1,454,510 250 3,568 326,892
141 82,917 379,266 56 - 93,54744 17,496 106,687 15 1,317 31,672
157 68,709 594,875 120 10 125,75025 8,617 125,532 13 1,688 37,26636 8,636 93,665 18 - 13,65745 18,424 154,475 28 553 24,988
531 252,332 2,111,144 204 5,172 217,866
152 67,932 317,187 42 520 40,37344 21,571 173,384 16 1,232 17,453
195 108,709 747,603 100 2,559 108,96315 8,081 103,414 12 98 14,57364 23,207 517,144 9 - 3,51861 22,832 252,409 25 763 32,980
6 - 11

Table 6.2 - ContinuedNUMBER, FLOOR AREA AND VALUE OF PRIVATE BUILDING CONSTRUCTION BY TYPE OF CONSTRUCTION AND PROVINCE2011 - 2020(Floor Area in Square Meters; Value in Thousand Pesos)
Total ResidentialNumber 1/ Floor Area Value Number Floor Area Value
Year Province
2016 Region V 3,402 509,728 4,542,474 2,627 245,965 1,937,434
Albay 607 119,835 900,681 422 58,640 378,185 Camarines Norte 308 45,797 501,777 254 26,962 243,456 Camarines Sur 2,053 234,914 1,913,043 1,713 127,033 993,851 Catanduanes 117 21,273 194,192 79 9,183 89,873 Masbate 157 39,625 604,276 79 11,813 113,961 Sorsogon 177 35,660 409,061 91 12,065 123,671
2017 Region V 3,179 528,550 5,442,205 2,168 235,282 2,216,992
Albay 567 120,669 1,297,413 358 47,468 457,785 Camarines Norte 301 54,387 540,846 235 33,776 289,824 Camarines Sur 1,690 223,821 2,189,115 1,189 102,054 976,778 Catanduanes 191 33,987 431,975 147 18,896 188,638 Masbate 189 39,367 452,746 121 15,739 131,464 Sorsogon 241 56,319 530,111 118 17,349 172,502
2018 Region V 4,170 872,327 9,050,446 2,909 328,682 3,173,583
Albay 902 190,996 1,835,396 585 88,425 819,168 Camarines Norte 259 117,421 1,429,955 187 26,543 247,607 Camarines Sur 2,099 386,930 3,771,227 1,644 140,786 1,335,367 Catanduanes 220 42,249 462,250 167 24,390 248,038 Masbate 310 50,400 675,667 114 15,527 164,503 Sorsogon 380 84,331 875,952 212 33,011 358,900
2019 Region V 3,130 774,567 11,541,822 2,688 354,033 3,797,469
Original Renewal Total 2,509,055 538 78,197 886,584 Camarines Norte 343 64,145 784,587 269 36,149 391,683 Camarines Sur 1,944 410,510 5,207,288 1,366 170,728 1,797,454 Catanduanes 245 75,068 656,813 184 20,474 197,429 Masbate 237 39,899 430,732 127 15,285 197,484 Sorsogon 361 184,945 1,953,346 204 33,200 326,835
2020 Region V 1,979 415,254 5,113,782 1,356 192,797 2,200,142
Albay 670 142,341 1,791,128 462 74,759 808,922 Camarines Norte 60 12,500 157,429 42 6,232 68,629 Camarines Sur 391 75,024 773,675 274 30,076 364,663 Catanduanes 294 52,345 759,738 221 26,420 287,931 Masbate 162 35,090 427,386 86 13,658 184,476 Sorsogon 402 97,954 1,204,425 271 41,652 485,522
1/ Refers to the number of building construction permits issued.
6 - 12

Non-Residential Additions/Alterations & RepairsNumber Floor Area Value Number Floor Area Value
547 258,608 2,403,453 228 5,155 201,584
139 60,270 491,455 46 925 31,04343 18,141 250,448 11 694 7,873
200 106,306 806,643 140 1,575 112,54828 11,895 92,365 10 195 11,95374 27,812 486,213 4 - 4,10361 22,832 252,409 25 763 32,980
675 286,003 2,985,533 336 7,265 239,680
119 72,274 797,030 90 927 42,59848 19,985 239,241 18 626 11,781
306 118,029 1,066,438 195 3,738 145,89936 14,718 234,303 8 373 9,03468 23,628 321,282 - - - 98 37,369 327,240 25 1,601 30,369
908 534,853 5,518,961 43 310 279,847
217 102,571 923,933 - 100 92,295 53 88,016 1,133,546 7 12 17,493
333 243,936 2,350,924 16 106 65,632 47 17,439 200,625 1 5 11,426
141 34,010 470,420 7 48 34,595 117 48,881 439,513 12 39 58,407
1,027 606,823 7,009,792 57 9,779 81,053
309 117,866 1,563,311 1 5 5 56 26,781 371,439 8 1,215 13,731
404 235,287 2,864,266 33 4,495 45,305 53 53,927 453,735 4 667 3,563 88 24,614 213,924 - - -
117 148,348 1,543,117 11 3,397 18,449
511 218,941 2,516,857 22 3,516 36,761
186 67,582 869,721 - - - 4 5,785 69,096 2 483 2,830
85 42,760 367,804 12 2,188 25,075 51 25,750 310,371 3 175 2,239 72 21,432 238,459 - - -
113 55,632 661,405 5 670 6,616
6 - 13

Original Renewal Total Original Renewal Total Original Renewal Total
Region V 19,895 3,075 22,970 19,955 3,354 23,309 32,703 3,846 36,549
Albay 4,354 852 5,206 4,234 956 5,190 7,283 949 8,232 Camarines Sur 6,108 924 7,032 6,676 994 7,670 10,483 1,213 11,696 Camarines Norte 2,336 366 2,702 2,484 363 2,847 3,550 477 4,027 Catanduanes 2,224 194 2,418 1,772 211 1,983 2,059 262 2,321 Masbate 2,702 327 3,029 2,476 375 2,851 4,343 367 4,710 Sorsogon 2,171 412 2,583 2,313 455 2,768 4,985 578 5,563
Source: Department of Trade and Industry
Table 6.3
ANNUAL BUSINESS NAME REGISTRATION PER PROVINCEREGION V, 2018-2020
2019Province
2018
REGION V, 2017 - 2020
2020
Figure 6.3 ANNUAL BUSINESS NAME REGISTRATION
0
5,000
10,000
15,000
20,000
25,000
30,000
35,000
2017 2018 2019 2020
Ap
pro
ved
Bu
sin
es
s N
am
e
Original Renewal
6 - 14

Table 6.4NUMBER AND INVESTMENTS OF REGISTERED STOCK/NON-STOCK CORPORATIONSAND PARTNERSHIPS, REGION V2017 - 2019(Investments in Thousand Pesos)
Entity 2017 2018a/ 2019a/
Registered Corporations 724 349 335
Stock Corporations 306 181 185
Increase in Capital Stock - - -
Partnership 61 29 36
Non-stock Corporations 357 139 114
Subscribed Capital - - -
Stock Corporations - - -
Increase in Capital Stock - - -
Partnership - - -
Non-stock Corporations - - -
Paid-up Capital/Contributions 972,010.8 856,580.8 684,313.4
Stock Corporations 888,557.9 716,536.0 605,616.7
Increase in Capital Stock -
Partnership 56,025.0 26,096.0 51,086.0
Non-stock Corporations 27,427.9 113,948.8 27,610.7
Source: Securities and Exchange Commission
a/ Preliminaryb/ Initial paid-up capitalc/ Initial contribution
6 - 15

Figure 6.4 GENERATED PAID-UP CAPITAL OF STOCK/NON-STOCK CORPORATIONSAND PARTNERSHIPS, REGION V: 2015 - 2019
Figure 6.5 VALUE OF PRIVATE BUILDING CONSTRUCTION BY CONSTRUCTION TYPE AND BY PROVINCE, REGION V: 2020
0
100,000
200,000
300,000
400,000
500,000
600,000
700,000
800,000
900,000
1,000,000
2015 2016 2017 2018 2019
In T
ho
us
an
d P
es
os
Stock Corporations Increase in Capital Stock
Partnerships Non-stock Corporations
0
100
200
300
400
500
600
700
800
900
1,000
Albay CamarinesNorte
CamarinesSur
Catanduanes Masbate Sorsogon
In T
ho
us
an
d P
es
os
Residential Non-Residential
6 - 16

7 - 1
Data on trade reflect the extent of the inward and outward flow of commodities in an area. The data likewise indicate the commodities that go into the export and import markets or are used for domestic or foreign consumption. Proprietors and the managers and executives of private businesses can use the data in identifying markets with high potentials and in making decisions on which commodities to produce and what markets to penetrate. Leaders and implementors in the government, on the other hand, can conceptualize and initiate programs, projects, services, and facilities designed to further stimulate trading activities in high yielding areas and/or in those sectors where a demand and supply gap exists. The data are also useful in identifying areas and products that can be improved/promoted for global competitiveness. This chapter presents data on the volume and value of commodities handled by the different mode of transports in the region including water, air and rail transports. The chapter also presents the value and direction of imports and exports handle by the major ports in the region. The Philippine Statistics Authority is the source of the data that are processed from administrative reporting forms by agencies in government involved in the collection of customs and tariff charges or administration of ports. Sector Highlights Value of commodity outflow from the region through air transport increased by 54.6 percent
between 2013 and 2014 with a 163 percent increase in volume. On the other hand, value of commodity inflow to the region dropped by 84.1 percent with a 38.9 percent decrease in volume.
Bicol Region registered a net outflow of about PhP1.36 Billion worth of commodities in 2014
through its various water transport facilities. Intraregional coastwise trade amounted to Php 6.07 Billion.
The Bicol Region posted a net outflow of goods valued at PhP1.39 Billion from all modes of transport in 2014.
Bicol Region generated a trade balance of US$372.5 Million in 2020. Exports topped imports by 1,863.6 percent. European countries were the major destinations of the region’s exports while ASEAN countries were the major origins of Bicol’s imports.
Chapter 7 TRADE

Table 7.1 Volume and Value of Air Trade by Commodity (1 Digit Level Classification)Region V, 2010 - 2014 7 - 3
Table 7.2 Volume and Value of Rail Trade by Commodity (1 Digit Level Classification)Region V, 2002 - 2006 7 - 6
Table 7.3 Value of Commodity Flow in Region V by Mode of Transport, 2010 - 2014 7 - 9
Table 7.4 Volume of Commodity Flow in Region V by Mode of Transport, 2010 - 2014 7 - 13
Table 7.5 Value of Exports and Imports by Port, Region V, 2014 - 2020 7 - 18
Table 7.6 Direction of Trade by Country, Region V, 2014 - 2020 7 - 20
Figure 7.1 Volume of Air Trade in Region V, 2010 - 2014 7 - 5
Figure 7.2 Value of Commodity Flow in Region V, 2010 - 2014 7 - 8
Figure 7.3 Volume of Commodity Flow in Region V, 2010 - 2014 7 - 17
Figure 7.4 Value of Exports and Imports, Region V, 2014 - 2020 7 - 17
Figure 7.5 Distribution of Exports by Continent, Region V, 2020 7 - 18
Figure 7.6 Distribution of Imports by Continent, Region V, 2020 7 - 19
7 - 2

Table 7.1 VOLUME AND VALUE OF AIR TRADE BY COMMODITY (1 DIGIT LEVEL CLASSIFICATION)REGION V2010 - 2014(Volume in Kilograms; Value in Pesos)
Commodity Inflow OutflowCode Volume Value Volume Value
2010All Commodities 334,000 22,958,000 227,000 9,536,000
0 Food and Live Animals 31,000 2,921,000 206,000 7,981,0001 Beverages and Tobacco 0 29,000 - - 2 Crude Materials, Inedible
except Fuels 1,000 107,000 - - 3 Mineral Fuels, Lubricants and
Related Materials - - - - 4 Animal and Vegetable Oils, Fats
and Waxes - - - - 5 Chemicals and Related
Products, (NES) 69,000 3,850,000 0 1,0006 Manufactured Goods
Classified Chiefly by Materials 5,000 412,000 - - 7 Machinery and Transport
Equipment 85,000 9,138,000 1,000 116,0008 Miscellaneous Manufactured
Articles 124,000 5,114,000 16,000 1,291,0009 Commodities and Transactions
NES in the PSCC 18,000 1,386,000 4,000 147,000
2011All Commodities 406,000 97,663,000 191,000 6,095,000
0 Food and Live Animals 53,000 3,887,000 176,000 5,402,0001 Beverages and Tobacco 1,000 32,000 - - 2 Crude Materials, Inedible
except Fuels 1,000 110,000 - - 3 Mineral Fuels, Lubricants and
Related Materials 0 2,000 - - 4 Animal and Vegetable Oils, Fats
and Waxes - - - - 5 Chemicals and Related
Products, (NES) 73,000 4,929,000 0 2,0006 Manufactured Goods
Classified Chiefly by Materials 3,000 392,000 0 5,0007 Machinery and Transport
Equipment 135,000 10,597,000 0 16,0008 Miscellaneous Manufactured
Articles 121,000 5,110,000 11,000 467,0009 Commodities and Transactions
NES in the PSCC 20,000 72,603,000 4,000 203,000
Note: Details may not add up to totals due to rounding. PSCC - Philippine Standard Commodity Classification
Source: Commodity Flow in the Philippines, Philippine Statistics Authority
Commodity Item
7 - 3
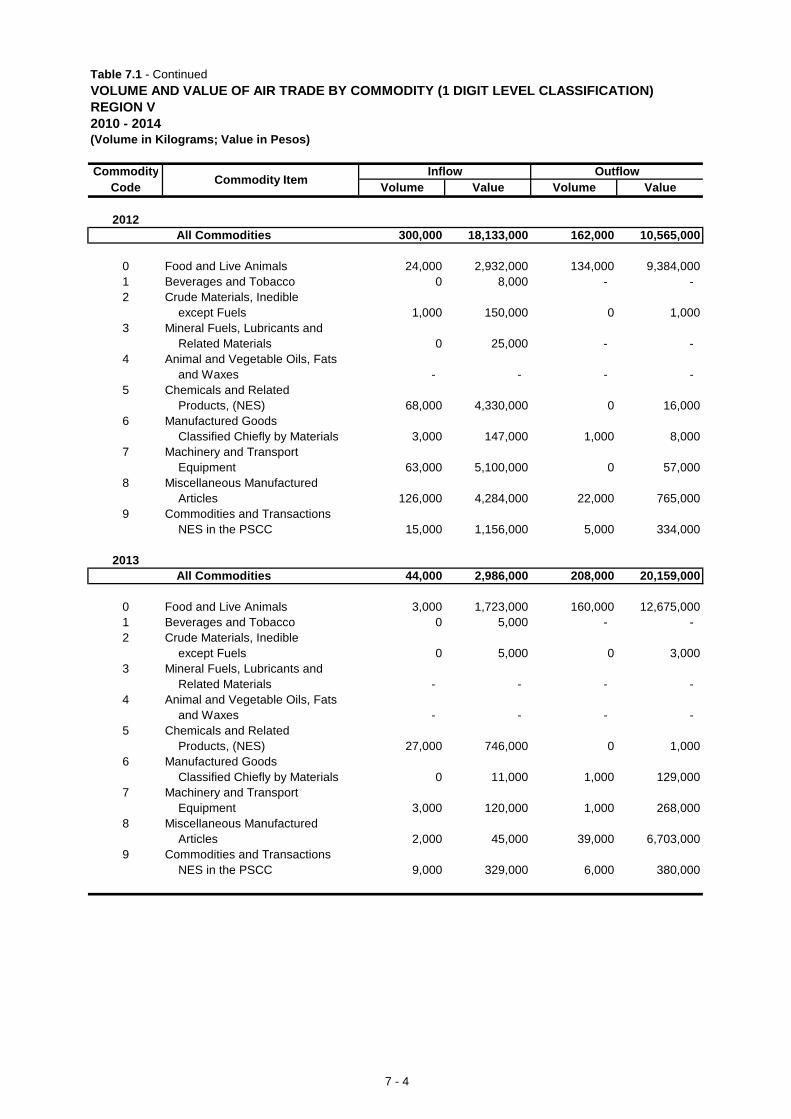
Table 7.1 - Continued
VOLUME AND VALUE OF AIR TRADE BY COMMODITY (1 DIGIT LEVEL CLASSIFICATION)REGION V2010 - 2014(Volume in Kilograms; Value in Pesos)
Commodity Inflow OutflowCode Volume Value Volume ValueCommodity Item
2012All Commodities 300,000 18,133,000 162,000 10,565,000
0 Food and Live Animals 24,000 2,932,000 134,000 9,384,0001 Beverages and Tobacco 0 8,000 - - 2 Crude Materials, Inedible
except Fuels 1,000 150,000 0 1,0003 Mineral Fuels, Lubricants and
Related Materials 0 25,000 - - 4 Animal and Vegetable Oils, Fats
and Waxes - - - - 5 Chemicals and Related
Products, (NES) 68,000 4,330,000 0 16,0006 Manufactured Goods
Classified Chiefly by Materials 3,000 147,000 1,000 8,0007 Machinery and Transport
Equipment 63,000 5,100,000 0 57,0008 Miscellaneous Manufactured
Articles 126,000 4,284,000 22,000 765,0009 Commodities and Transactions
NES in the PSCC 15,000 1,156,000 5,000 334,000
2013All Commodities 44,000 2,986,000 208,000 20,159,000
0 Food and Live Animals 3,000 1,723,000 160,000 12,675,0001 Beverages and Tobacco 0 5,000 - - 2 Crude Materials, Inedible
except Fuels 0 5,000 0 3,0003 Mineral Fuels, Lubricants and
Related Materials - - - - 4 Animal and Vegetable Oils, Fats
and Waxes - - - - 5 Chemicals and Related
Products, (NES) 27,000 746,000 0 1,0006 Manufactured Goods
Classified Chiefly by Materials 0 11,000 1,000 129,0007 Machinery and Transport
Equipment 3,000 120,000 1,000 268,0008 Miscellaneous Manufactured
Articles 2,000 45,000 39,000 6,703,0009 Commodities and Transactions
NES in the PSCC 9,000 329,000 6,000 380,000
7 - 4

Table 7.1 - Continued
VOLUME AND VALUE OF AIR TRADE BY COMMODITY (1 DIGIT LEVEL CLASSIFICATION)REGION V2010 - 2014(Volume in Kilograms; Value in Pesos)
Commodity Inflow OutflowCode Volume Value Volume ValueCommodity Item
2014All Commodities 7,000 1,823,000 547,000 31,163,000
0 Food and Live Animals 4,000 1,623,000 519,000 29,565,0001 Beverages and Tobacco - - - - 2 Crude Materials, Inedible
except Fuels 0 9,000 - - 3 Mineral Fuels, Lubricants and
Related Materials - - - - 4 Animal and Vegetable Oils, Fats
and Waxes - - - - 5 Chemicals and Related
Products, (NES) 0 26,000 0 1,0006 Manufactured Goods
Classified Chiefly by Materials 0 16,000 1,000 28,0007 Machinery and Transport
Equipment 1,000 57,000 0 19,0008 Miscellaneous Manufactured
Articles 0 8,000 17,000 1,118,0009 Commodities and Transactions
NES in the PSCC 1,000 84,000 10,000 433,000
Figure 7.1 VOLUME OF AIR TRADE IN REGION V2010 - 2014
0
100,000
200,000
300,000
400,000
500,000
600,000
2010 2011 2012 2013 2014
In K
ilogr
ams
Inflow Outflow
7 - 5

Table 7.2 VOLUME AND VALUE OF RAIL TRADE BY COMMODITY ( 1 DIGIT LEVEL CLASSIFICATION)REGION V2002 - 2006(Volume in Kilograms; Value in Pesos)
Commodity Inflow OutflowCode Volume Value Volume Value
2002All Commodities 1,061,398 39,044,045 934,806 19,727,693
0 Food and Live Animals 102,920 2,781,629 770,804 13,756,9411 Beverages and Tobacco 716 17,900 80 3002 Crude Materials, Inedible
except Fuels 88,543 2,210,756 15,549 271,9153 Mineral Fuels, Lubricants and
Related Materials 557 31,693 984 30,0004 Animal and Vegetable Oils, Fats
and Waxes - - 803 9,0005 Chemicals and Related
Products, (NES) 125,721 2,893,342 2,888 108,8206 Manufactured Goods
Classified Chiefly by Materials 255,495 7,852,735 25,248 411,7907 Machinery and Transport
Equipment 101,997 8,196,769 19,406 2,375,6258 Miscellaneous Manufactured
Articles 250,476 10,005,579 30,264 1,140,3589 Commodities and Transactions
NES in the PSCC 134,973 5,053,642 68,780 1,622,944
2003All Commodities 1,043,000 39,360,999 881,002 17,108,000
0 Food and Live Animals 97,000 2,729,000 719,000 11,790,0001 Beverages and Tobacco 2,000 55,000 - - 2 Crude Materials, Inedible
except Fuels 87,000 2,317,000 12,000 153,0003 Mineral Fuels, Lubricants and
Related Materials 2,000 22,000 0 1,0004 Animal and Vegetable Oils, Fats
and Waxes 1,000 18,000 0 2,0005 Chemicals and Related
Products, (NES) 121,000 3,043,000 1,000 72,0006 Manufactured Goods
Classified Chiefly by Materials 238,000 7,639,000 21,000 263,0007 Machinery and Transport
Equipment 92,000 8,266,000 15,000 1,983,0008 Miscellaneous Manufactured
Articles 244,000 9,046,000 25,000 677,0009 Commodities and Transactions
NES in the PSCC 159,000 6,226,000 88,000 2,167,000
Note: Details may not add up to totals due to rounding.PSCC - Philippine Standard Commodity Classification
Source: Commodity Flow in the Philippines, Philippine Statistics Authority
Commodity Item
7 - 6

Table 7.2 - Continued
VOLUME AND VALUE OF RAIL TRADE BY COMMODITY ( 1 DIGIT LEVEL CLASSIFICATION)REGION V2002 - 2006(Volume in Kilograms; Value in Pesos)
Commodity Inflow OutflowCode Volume Value Volume ValueCommodity Item
2004All Commodities 992,000 38,267,000 698,000 13,100,000
0 Food and Live Animals 108,000 3,424,000 572,000 8,600,0001 Beverages and Tobacco 1,000 28,000 - - 2 Crude Materials, Inedible
except Fuels 101,000 2,442,000 9,000 186,0003 Mineral Fuels, Lubricants and
Related Materials 0 15,000 - - 4 Animal and Vegetable Oils, Fats
and Waxes - - - - 5 Chemicals and Related
Products, (NES) 94,000 2,266,000 2,000 47,0006 Manufactured Goods
Classified Chiefly by Materials 241,000 6,538,000 28,000 247,0007 Machinery and Transport
Equipment 107,000 8,918,000 14,000 1,935,0008 Miscellaneous Manufactured
Articles 208,000 9,061,000 18,000 435,0009 Commodities and Transactions
NES in the PSCC 134,000 5,575,000 56,000 1,649,000
2005All Commodities 335,000 14,294,000 296,000 6,849,000
0 Food and Live Animals 24,000 909,000 225,000 3,839,0001 Beverages and Tobacco 2,000 50,000 - - 2 Crude Materials, Inedible
except Fuels 14,000 453,000 4,000 90,0003 Mineral Fuels, Lubricants and
Related Materials 1,000 32,000 - - 4 Animal and Vegetable Oils, Fats
and Waxes - - 0 1,0005 Chemicals and Related
Products, (NES) 5,000 135,000 1,000 37,0006 Manufactured Goods
Classified Chiefly by Materials 112,000 3,189,000 33,000 235,0007 Machinery and Transport
Equipment 37,000 4,044,000 9,000 1,818,0008 Miscellaneous Manufactured
Articles 83,000 3,181,000 7,000 251,0009 Commodities and Transactions
NES in the PSCC 58,000 2,301,000 17,000 579,000
7 - 7

Table 7.2 - Continued
VOLUME AND VALUE OF RAIL TRADE BY COMMODITY ( 1 DIGIT LEVEL CLASSIFICATION)REGION V2002 - 2006(Volume in Kilograms; Value in Pesos)
Commodity Inflow OutflowCode Volume Value Volume ValueCommodity Item
2006All Commodities 198,000 9,119,000 354,000 9,740,000
0 Food and Live Animals 22,000 591,000 261,000 5,073,0001 Beverages and Tobacco 0 8,000 - - 2 Crude Materials, Inedible
except Fuels 17,000 262,000 25,000 189,0003 Mineral Fuels, Lubricants and
Related Materials 0 4,000 - - 4 Animal and Vegetable Oils, Fats
and Waxes - - - - 5 Chemicals and Related
Products, (NES) 3,000 175,000 1,000 11,0006 Manufactured Goods
Classified Chiefly by Materials 56,000 2,086,000 21,000 124,0007 Machinery and Transport
Equipment 19,000 2,535,000 14,000 3,170,0008 Miscellaneous Manufactured
Articles 47,000 1,987,000 9,000 323,0009 Commodities and Transactions
NES in the PSCC 34,000 1,472,000 22,000 850,000
Figure 7.2 VALUE OF COMMODITY FLOW IN REGION V2010 - 2014
8,000
10,000
12,000
14,000
16,000
18,000
20,000
22,000
24,000
2010 2011 2012 2013 2014
In M
illio
n Pe
sos
Region V to Other Regions Other Regions to Region V
7 - 8

Table 7.3 VALUE OF COMMODITY FLOW IN REGION V BY MODE OF TRANSPORT2010 - 2014(In Thousand Pesos)
Region of Originand Destination
2010 Region V toother regions 14,580,869 14,571,334 9,536 -
NCR 154,149 145,748 8,401 - CAR - - - - Region I - - - - Region II 119,015 119,015 - - Region III - - - - Region IV-A 958,145 958,145 - - Region IV-B 484,227 484,003 224 - Region V 5,363,676 5,363,676 - - Region VI 1,075,240 1,075,160 80 - Region VII 1,482,843 1,482,333 510 - Region VIII 2,107,099 2,107,099 - - Region IX 601,627 601,458 169 - Region X 1,687,629 1,687,618 12 - Region XI 115 - 115 - Region XII 22 - 22 - Caraga 19,203 19,200 3 - ARMM 527,880 527,880 - -
2011 Region V toother regions 10,886,318 10,880,223 6,095 -
NCR 62,566 56,924 5,641 - CAR - - - - Region I 3 - 3 - Region II - - - - Region III - - - - Region IV-A 214,009 214,009 - - Region IV-B 816,363 816,312 51 - Region V 3,229,957 3,229,957 - - Region VI 2,940,050 2,939,996 54 - Region VII 951,957 951,759 198 - Region VIII 1,241,592 1,241,592 - - Region IX 47,468 47,439 28 - Region X 1,195,346 1,195,341 5 - Region XI 18,569 18,469 100 - Region XII 58,435 58,422 13 - Caraga - - - - ARMM 110,004 110,004 1 -
2012 Region V toother regions 16,640,364 17,603,429 10,565 -
NCR 183,755 175,640 8,115 - CAR - - - - Region I 10 - 10 - Region II 3 3 - - Region III - - - - Region IV-A 304,475 304,475 - - Region IV-B 1,266,837 1,266,799 38 -
Note: Details may not add up to totals due to rounding
Source: Commodity Flow in the Philippines, Philippine Statistics Authority
Year Air RailWaterTotal
7 - 9

Table 7.3 - ContinuedVALUE OF COMMODITY FLOW IN REGION V BY MODE OF TRANSPORT2010 - 2014(In Thousand Pesos)
Region of Originand DestinationYear Air RailWaterTotal
Region V 2,832,662 2,832,662 - - Region VI 5,246,180 5,245,851 329 - Region VII 971,847 1,783 - Region VIII 5,286,184 5,286,168 17 - Region IX 87,049 87,020 28 - Region X 777,572 777,524 49 - Region XI 101,086 100,909 176 - Region XII 187,346 187,328 18 - Caraga 38,836 38,833 3 - ARMM 328,369 328,369 - -
2013 Region V toother regions 21,642,222 21,622,063 20,159 -
NCR 297,885 278,510 19,375 - CAR - - - - Region I 2,186 2,185 1 - Region II 100 100 - - Region III - - - - Region IV-A 717,830 717,830 - - Region IV-B 1,593,361 1,593,289 72 - Region V 4,640,290 4,640,290 - - Region VI 1,368,889 1,368,677 212 - Region VII 640,836 640,405 431 - Region VIII 10,395,825 10,395,825 - - Region IX 101,235 101,229 6 - Region X 859,264 859,249 15 - Region XI 324,160 324,113 47 - Region XII 210,536 210,535 1 - Caraga 86,211 86,211 - - ARMM 403,616 403,616 - -
2014 Region V toother regions 12,099,007 12,067,844 31,163 -
NCR 81,214 56,380 24,834 - CAR - - - - Region I 22 - 22 - Region II 18,026 18,016 10 - Region III - - - - Region IV-A 28,923 28,923 - - Region IV-B 1,326,895 1,326,875 20 - Region V 6,070,481 6,070,481 - - Region VI 852,849 846,909 5,940 - Region VII 777,283 777,084 199 - Region VIII 1,198,982 1,198,979 3 - Region IX 28,602 28,599 3 - Region X 1,089,080 1,089,074 6 - Region XI 141,507 141,395 112 - Region XII 183,840 183,825 15 - Caraga 36,801 36,801 - - ARMM 264,503 264,502 1 -
Note: No rail transactions from 2010 to 2014.
7 - 10

Table 7.3 - ContinuedVALUE OF COMMODITY FLOW IN REGION V BY MODE OF TRANSPORT2010 - 2014(In Thousand Pesos)
Region of Originand Destination
2010 Other regionsto Region V 10,903,341 10,880,383 22,958 -
NCR 281,267 258,889 22,378 - CAR - - - - Region I - - - - Region II - - - - Region III 310,629 310,629 - - Region IV-A 97,469 97,469 - - Region IV-B - - - - Region V 5,363,676 5,363,676 - - Region VI 1,255,976 1,255,683 292 - Region VII 2,281,412 2,281,364 48 - Region VIII 531,051 531,051 - - Region IX 5 - 5 - Region X 689,366 689,366 - - Region XI 220 - 220 - Region XII 22,128 22,116 12 - Caraga 70,142 70,139 3 - ARMM - - - -
2011 Other regionsto Region V 8,969,373 8,871,710 97,663 -
NCR 405,905 309,324 96,581 - CAR - - - - Region I - - - - Region II - - - - Region III 167,621 167,621 - - Region IV-A 91,295 91,295 - - Region IV-B - - - - Region V 3,229,957 3,229,957 - - Region VI 519,585 518,606 978 - Region VII 3,153,420 3,153,369 51 - Region VIII 440,852 440,852 - - Region IX - - - - Region X 883,719 883,719 - - Region XI 47 - 47 - Region XII 22,551 22,546 5 - Caraga 54,421 54,421 - - ARMM - - - -
2012 Other regionsto Region V 9,653,606 9,635,474 18,133 -
NCR 436,500 419,588 16,912 - CAR - - - - Region I - - - - Region II - - - - Region III 137,932 137,932 - - Region IV-A 13,694 13,694 - - Region IV-B 59 59 - -
Year Air RailWaterTotal
7 - 11

Table 7.3 - ContinuedVALUE OF COMMODITY FLOW IN REGION V BY MODE OF TRANSPORT2010 - 2014(In Thousand Pesos)
Region of Originand DestinationYear Air RailWaterTotal
Region V 2,832,662 2,832,662 - - Region VI 891,152 890,105 1,047 - Region VII 3,508,690 3,508,651 39 - Region VIII 338,125 338,125 - - Region IX 32 - 32 - Region X 1,392,825 1,392,825 - - Region XI 93 - 93 - Region XII 21,354 21,345 9 - Caraga 80,488 80,488 - - ARMM - - - -
2013 Other regionsto Region V 9,362,336 9,359,349 2,986 -
NCR 522,242 521,143 1,099 - CAR - - - - Region I - - - - Region II - - - - Region III 58,681 58,681 - - Region IV-A 977 977 - - Region IV-B 2 - 2 - Region V 4,640,290 4,640,290 - - Region VI 395,220 393,516 1,704 - Region VII 2,754,208 2,754,106 102 - Region VIII 84,444 84,444 - - Region IX 15 - 15 - Region X 744,899 744,899 - - Region XI 62 - 62 - Region XII 47,120 47,119 1 - Caraga 114,176 114,174 2 - ARMM - - - -
2014 Other regionsto Region V 10,709,565 10,707,743 1,823 -
NCR 819,127 819,069 58 - CAR - - - - Region I - - - - Region II - - - - Region III 178,599 178,599 - - Region IV-A 71 71 - - Region IV-B - - - - Region V 6,070,481 6,070,481 - - Region VI 1,120,392 1,118,786 1,606 - Region VII 1,506,342 1,506,306 36 - Region VIII 76,325 76,325 - - Region IX 23 - 23 - Region X 654,242 654,242 - - Region XI 56 - 56 - Region XII 50,931 50,890 41 - Caraga 232,976 232,974 2 - ARMM - - - -
Note: No rail transactions from 2010 to 2014.
7 - 12

Table 7.4 VOLUME OF COMMODITY FLOW IN REGION V BY MODE OF TRANSPORT2010 - 2014(In Kilograms)
Region of Originand Destination
2010 Region V toother regions 227,000 227,000 -
NCR 213,000 213,000 - CAR - - - Region I - - - Region II - - - Region III - - - Region IV-A - - - Region IV-B 1,000 1,000 - Region V - - - Region VI 1,000 1,000 - Region VII 8,000 8,000 - Region VIII - - - Region IX 1,000 1,000 - Region X - - - Region XI 3,000 3,000 - Region XII - - - Caraga - - - ARMM - - -
2011 Region V toother regions 191,000 191,000 -
NCR 184,000 184,000 - CAR - - - Region I - - - Region II - - - Region III - - - Region IV-A - - - Region IV-B - - - Region V - - - Region VI 1,000 1,000 - Region VII 3,000 3,000 - Region VIII - - - Region IX - - - Region X - - - Region XI 3,000 3,000 - Region XII - - - Caraga - - - ARMM - - -
2012 Region V toother regions 162,000 162,000 -
NCR 122,000 122,000 - CAR - - - Region I - - - Region II - - - Region III - - - Region IV-A - - - Region IV-B 1,000 1,000 -
Note: Details may not add up to totals due to rounding
Source: Commodity Flow in the Philippines, Philippine Statistics Authority
Year Total Air Rail
7 - 13

Table 7.4 - ContinuedVOLUME OF COMMODITY FLOW IN REGION V BY MODE OF TRANSPORT2010 - 2014(In Kilograms)
Region of Originand DestinationYear Total Air Rail
Region V - - - Region VI 5,000 5,000 - Region VII 31,000 31,000 - Region VIII - - - Region IX - - - Region X - - - Region XI 3,000 3,000 - Region XII 1,000 1,000 - Caraga - - - ARMM - - -
2013 Region V toother regions 208,000 208,000 -
NCR 194,000 194,000 - CAR - - - Region I - - - Region II - - - Region III - - - Region IV-A - - - Region IV-B 1,000 1,000 - Region V - - - Region VI 3,000 3,000 - Region VII 8,000 8,000 - Region VIII - - - Region IX - - - Region X - - - Region XI 2,000 2,000 - Region XII - - - Caraga - - - ARMM - - -
2014 Region V toother regions 547,000 547,000 -
NCR 314,000 314,000 - CAR - - - Region I 1,000 1,000 - Region II - - - Region III - - - Region IV-A - - - Region IV-B 1,000 1,000 - Region V - - - Region VI 226,000 226,000 - Region VII 2,000 2,000 - Region VIII - - - Region IX - - - Region X - - - Region XI 3,000 3,000 - Region XII - - - Caraga - - - ARMM - - -
Note: No rail transactions from 2010 to 2014.
7 - 14

Table 7.4 - ContinuedVOLUME OF COMMODITY FLOW IN REGION V BY MODE OF TRANSPORT2010 - 2014(In Kilograms)
Region of Originand Destination
2010 Other regionsto Region V 334,000 334,000 -
NCR 328,000 328,000 - CAR - - - Region I - - - Region II - - - Region III - - - Region IV-A - - - Region IV-B - - - Region V - - - Region VI 2,000 2,000 - Region VII 1,000 1,000 - Region VIII - - - Region IX - - - Region X - - - Region XI 3,000 3,000 - Region XII - - - Caraga - - - ARMM - - -
2011 Other regionsto Region V 406,000 406,000 -
NCR 396,000 396,000 - CAR - - - Region I - - - Region II - - - Region III - - - Region IV-A - - - Region IV-B - - - Region V - - - Region VI 8,000 8,000 - Region VII 1,000 1,000 - Region VIII - - - Region IX - - - Region X - - - Region XI 1,000 1,000 - Region XII - - - Caraga - - - ARMM - - -
2012 Other regionsto Region V 300,000 300,000 -
NCR 295,000 295,000 - CAR - - - Region I - - - Region II - - - Region III - - - Region IV-A - - - Region IV-B - - -
Year Total Air Rail
7 - 15

Table 7.4 - ContinuedVOLUME OF COMMODITY FLOW IN REGION V BY MODE OF TRANSPORT2010 - 2014(In Kilograms)
Region of Originand DestinationYear Total Air Rail
Region V - - - Region VI 3,000 3,000 - Region VII 1,000 1,000 - Region VIII - - - Region IX - - - Region X - - - Region XI 1,000 1,000 - Region XII - - - Caraga - - - ARMM - - -
2013 Other regionsto Region V 44,000 44,000 -
NCR 39,000 39,000 - CAR - - - Region I - - - Region II - - - Region III - - - Region IV-A - - - Region IV-B - - - Region V - - - Region VI 2,000 2,000 - Region VII 1,000 1,000 - Region VIII - - - Region IX - - - Region X - - - Region XI 1,000 1,000 - Region XII - - - Caraga - - - ARMM - - -
2014 Other regionsto Region V 7,000 7,000 -
NCR 1,000 1,000 - CAR - - - Region I - - - Region II - - - Region III - - - Region IV-A - - - Region IV-B - - - Region V - - - Region VI 3,000 3,000 - Region VII - - - Region VIII - - - Region IX 1,000 1,000 - Region X - - - Region XI 2,000 2,000 - Region XII - - - Caraga - - - ARMM - - -
Note: No rail transactions from 2010 to 2014.
7 - 16

Figure 7.3 VOLUME OF COMMODITY FLOW IN REGION V2010 - 2014
Figure 7.4 VALUE OF EXPORTS AND IMPORTSREGION V, 2014 - 2020
0
100,000
200,000
300,000
400,000
500,000
600,000
2010 2011 2012 2013 2014
In K
ilog
ram
s
Region V to Other Regions
Other Regions to Region V
0
50,000
100,000
150,000
200,000
250,000
300,000
350,000
400,000
450,000
2014 2015 2016 2017 2018 2019 2020
in T
ho
usa
nd
US
Do
llar
s
Exports
Imports
7 - 17

Table 7.5VALUE OF EXPORTS AND IMPORTS BY PORTREGION V, 2014 - 2020(F.O.B. Value in US Dollars)
2014 2015 2016Exports Imports Exports Imports Exports Imports
Region V 190,305,200 66,374,031 222,270,246 37,173,667 100,163,221 23,970,227
Albay 161,198,033 66,260,521 221,802,246 32,886,583 94,485,461 23,134,329Legazpi City 91,905,995 39,760,063 152,841,951 32,182,132 84,411,461 23,134,329Legazpi Oil Company 5,945,000 - 6,510,000 - 9,885,000 - Rapu-rapu Bicol Export
Processing 5,221,312 - 4,691,136 - - - Tabaco, Albay 58,125,726 26,500,458 57,759,159 704,451 189,000 -
Gernarine Info Tech Center - - - - - -
Camarines Norte 116 113,510 - 4,245,900 - 835,898Jose Panganiban 116 113,510 - 4,245,900 - 835,898
Camarines Sur - - - 1,746 - - Naga City Tech Park - - - - - - Camarines Sur Info Tech Park - - - - - - Lagonoy - - - - - - Pasacao - - - 1,746 - -
Catanduanes - - - - - - Virac, Catanduanes - - - - - -
Masbate 29,107,051 - 468,000 39,438 5,551,760 - Masbate, Masbate 29,107,051 - 468,000 39,438 5,551,760 - Atlas Consolidated Mining
and Development - - - - - -
Sorsogon - - - - 126,000 - Bulan, Sorsogon - - - - - - Sorsogon, Sorsogon - - - - 126,000 -
Note: Imports and exports data presented include only those transported thru the region's major sea ports.
Source: Philippine Statistics Authority
Figure 7.5 DISTRIBUTION OF EXPORTS BY CONTINENTREGION V, 2020
Province / Port
Europe96.92%
America2.77%
Asia0.23%
Africa0.08%Exports
7 - 18

2017Exports Imports Exports Imports Exports Imports Exports Imports
323,026,102 22,498,320 218,334,521 34,426,795 315,895,654 35,548,628 393,653,354 21,123,256
323,026,102 22,498,320 218,271,352 34,426,795 315,712,506 34,236,522 393,470,206 9,785,784323,026,102 22,498,320 218,271,352 34,426,795 315,712,506 34,236,522 393,470,206 9,773,875
- - - - - - - -
- - - - - - - - - - - - - - - - - - - - - - - 11,909
- - - - - 1,277,509 - 10,343,694- - - 1,277,509 - 10,343,694
- - - - - 34,597 - 993,778- - - - - 34,597 160,878- - - - - - - 832,900- - - - - - - - - - - - - - - -
- - - - - - - - - - - - - - - -
- - 63,169 - 183,148 - 183,148 - - - 63,169 - 183,148 - 183,148 -
- - - - - - - -
- - - - - - - - - - - - - - - - - - - - - - - -
REGION V, 2020
20202018 2019
Figure 7.6 DISTRIBUTION OF IMPORTS BY CONTINENT
ASEAN 69.53%
East Asia 25.98%
OCEANIA 2.52%
America 1.38%
Europe 0.59%Imports
7 - 19

Table 7.6DIRECTION OF TRADE BY COUNTRY, REGION V2014 - 2020(F.O.B. Value in US Dollars)
2014 2015 2016
Exports Imports Exports Imports Exports Imports
Total 190,305,200 66,374,031 37,173,667 222,270,246 100,163,221 23,970,227
Asia 19,923,205 66,033,755 34,352,861 1,040,799 1,790,950 23,837,084ASEAN 11,297,840 53,545,318 31,804,291 936,000 456,000 19,435,686
Cambodia - 13,350,000 367,421 - - 85,539Indonesia - 4,879,167 11,847,161 - - 8,425,484Malaysia 9,820,340 - - - - - Singapore 742,500 - 93 - - - Thailand - 99,734 10,205,428 - - 6,210,602Vietnam 735,000 35,216,417 9,384,188 936,000 456,000 4,714,061Myanmar, Union of Burma
East Asia 8,625,365 12,488,437 2,548,570 104,799 830,950 4,395,665China, People's Republic of 8,086,900 6,522,189 1,569,237 - 541,500 3,501,318Hong Kong - 248 - 287,290 - Japan 114,921 3,134,941 841,719 - 660 235,026Korea, Republic of 423,544 2,824,310 43,125 104,799 - - Taiwan - 6,997 94,241 - 1,500 659,321
South Asia - - - - 504,000 5,733Bangladesh - - - - - - India - - - - 504,000 5,733Sri Lanka - - - - - - Pakistan, Islamic Rep. Of -
Middle East - - - - - - Kuwait - - - - - - Israel - - - - - - Saudi Arabia - - - - - - United Arab Emirates - - - - - -
America 33,855,226 77 71 10,733,136 26,390,074 - United States of America 33,855,226 77 - 10,733,136 26,390,074 - Guam - - 71 - - - Argentina - - - - - - Canada - - - - - - Dominican Republic - - - - - - Mexico - - - - - -
Europe 136,526,769 - 2,007 210,496,311 71,982,197 133,143Belgium - - - - - - Czech Republic - - - - - - France - - - - - - Germany - - - 3,523,701 - 133,143Italy 6,650,636 - - - 7,356,250 - Latvia - - - - - Netherlands 22,265,707 - - 4,731,250 - - Norway - - - - - - Russian Federation - - - - - - Spain 12,156,011 - - - - - Sweden - - - - - - Switzerland 95,454,299 - - 202,241,360 64,625,947 - Turkey - - - - - - United Kingdom and N. Ireland 116 - 2,007 - - -
Oceania - 340,199 2,818,728 - - - Australia - 340,199 2,818,728 - - - New Zealand (excl. Western Sam - - - - - - Papua New Guinea - - - - - -
Africa - - - - - - Nigeria - - - - - - South Africa, Republic of - - - - - -
Note: Imports and exports data presented include only those transported thru the region's major sea ports.
Source: Philippine Statistics Authority
Country
7 - 20

2017
Exports Imports Exports Imports Exports Imports Exports Imports
323,026,102 22,498,320 218,334,521 33,476,675 315,895,654 35,548,628 381,331,106 21,123,256
- 22,498,320 1,124,919 33,476,675 1,558,980 34,503,985 0 20,174,262- 21,648,101 32,046 25,975,355 0 22,965,312 0 14,686,411- - - - - - - - - 11,633,373 - 9,788,595 - 10,294,141 - 2,572,934- - - 984,179 - 250,098 - 149,561- - 32,046 - - - - 554,014- 4,489,529 - 11,325,000 - 200,947 - 199,500- 5,525,199 - 3,877,581 - 9,721,126 - 4,311,050
2,499,000 6,899,352- 850,219 1,092,873 7,501,320 796,208 11,538,673 0 5,475,942- 458,481 1,061,750 6,763,463 796,208 11,345,623 2,700,372- - 31,123 - - - - 1,151,751- 160,163 - 272,312 193,050 251,264- - - 99,520 - - 1,317,455- 231,575 - 366,025 - - 55,100- - - - 732,400 - 0 - - - - - - - - - - - - - 657,400 - - - - - - - - - - - - 75,000 - - - - - - 30,372 - 0 11,909- - - - - - - - - - - - - - - 11,909- - - - - - - - - - - - 30,372 - -
12,120,000 - - - 7,007,768 1,037,198 0 291,20512,120,000 - - - 7,007,768 1,037,198 291,205
- - - - - - - - - - - - - - - - - - - - - - - - - - - - - - - - - - - - - - - -
310,906,102 - 217,209,602 - 307,328,906 7,445 381,331,106 125,200- - - - 7,445- - - - - - - - - - - - - - - 17,930- - - - - 28,033- - 5,245,000 - - - - - - - - - - - -
45,161,880 - 9,842,500 - 8,259,200 - - 17,922- - - - - - - - - - - - - - - -
4,443,120 - 12,110,000 - 10,613,650 - 3,840,000 37,153- - - - - - - 6,238
261,301,102 - 190,012,102 - 288,456,056 - 377,491,106 6,514- - - - - - - - - - - - - - - 11,410
- - - 0 - - - 532,589- - - - - 532,589- - - - - - - - - - - - - - - -
- - - - - - - - - - - - - - - - - - - - - - - -
2018 2019 2020
7 - 21
8 - 1
Data on tourism provide a panorama of the region as a tourist destination. The significance of the picture presented by the data manifests the importance accorded to the tourism industry by both national and local leaders. Specifically, tourism has become a twin source of foreign exchange receipts and livelihood and employment opportunities for communities. Data on the industry are therefore essential in providing vital links in the development and orchestration of campaigns aimed at promoting the potentials of the region as a tourist hideaway. Local leaders can put up infrastructure programs and institute policies and regulations that will boost the inflow of visitors. Investors, on the other hand, can take the signals by developing tourist and recreational sites and putting up establishments and amenities. In concrete terms, the data likewise provide a quantitative measure of the results of programs that promote the area as a traveler's destination and the industry's contributions to the economic performance of the area. This chapter presents regional and/or provincial/city data on the visitor arrivals and their countries of residence/origin, number of hotel and hotel rooms and other accommodation establishments and hotel occupancy rate. The data source is the Department of Tourism. Sector Highlights Preliminary tourist arrivals data in the region reached 3.5 million in 2019, down by 42.4 percent
from 2018. Local tourist arrivals declined by 38.7 percent. Domestic tourists made up 88.6 percent of guests in
the region in 2019. Influx of foreign tourists, on the other hand, declined by 60.9 percent in 2019. Nationals of the United States of America remain the biggest group of foreign tourists visiting the
region accounting for 14.8 percent of foreign guests in 2019. Available hotel/accommodation rooms was the same in 2019 to 2020.
Chapter 8 TOURISM

Table 8.1 Visitor Arrivals by Country of Residence, Domestic and Foreign2013 - 2019 8 - 3
Table 8.2 Distribution of Travelers by Country of Residence and Province2013 - 2019 8 - 5
Table 8.3 Number of Hotels/Accommodation Establishments and Hotel/AccommodationRooms by Province, 2013 - 2020 8 - 11
Table 8.4 Monthly Hotel Occupancy Rate by Province, Region V2017 - 2020 8 - 12
Figure 8.1 Distribution of Visitor Arrivals, Domestic and Foreign by Country ofResidence, Region V, 2019 8 - 4
Figure 8.2 Visitor Arrivals by Province, Domestic and Foreign, Region V, 2019 8 - 4
Figure 8.3 Visitor Arrivals, Domestic and Foreign, Region V, 2011 - 2019 8 - 14
Figure 8.4 Number of Hotels/Accommodation Establishments and Hotel/AccommodationRooms by Province, Region V, 2020 8 - 14
8 - 2

Table 8.1VISITOR ARRIVALS BY COUNTRY OF RESIDENCE, DOMESTIC AND FOREIGN2013 - 2019
Country of Residence 2013 2014 2015 2016 2017 2018 2019 p
Region V 3,251,764 3,724,073 4,526,007 5,409,333 6,039,897 6,117,600 3,524,389
Domestic 2,558,216 2,970,744 3,658,125 4,366,780 4,853,990 5,091,441 3,123,389
Residents of the Philippines Of Filipino Nationality 2,482,051 2,944,287 3,656,034 4,366,780 4,853,990 5,091,441 3,123,389 Of Foreign Nationality 23,980 25,909 2,091 - - - - Overseas Filipinos 52,185 548 - - - - -
Foreign 693,548 753,329 867,882 1,042,553 1,185,907 1,026,159 401,000
AsiaChina 44,805 41,264 29,574 73,457 37,301 71,961 15,853Hongkong 5,687 9,617 5,097 7,569 5,142 6,588 4,667Indonesia 4,499 3,601 3,843 4,929 2,843 3,773 863Japan 16,802 19,326 18,817 41,714 23,488 46,370 7,076Malaysia 5,951 12,225 6,557 10,851 5,193 8,222 2,122Singapore 10,769 6,321 9,448 27,634 5,762 30,320 6,679South Korea 26,248 31,750 62,545 80,373 64,823 103,317 20,737Taiwan 7,909 6,609 4,145 4,889 10,159 7,414 1,873Thailand 4,878 4,833 4,869 7,089 5,049 11,796 2,633
Middle EastSaudi Arabia 6,130 3,526 2,467 4,986 4,663 3,341 2,810
AmericaCanada 23,863 27,338 35,790 56,140 42,592 59,287 17,509United States of America 104,381 104,981 103,672 205,543 168,517 182,625 59,351
EuropeFrance 10,836 12,798 16,651 53,337 38,943 40,785 4,225Germany 34,814 16,562 28,671 41,969 28,433 40,664 4,162Italy 5,741 5,450 3,529 7,026 2,445 3,047 1,506Switzerland 6,395 4,605 3,009 8,236 6,175 9,187 644United Kingdom 12,402 11,854 41,500 44,685 64,799 54,033 8,650
OceaniaAustralia 23,879 22,741 40,228 48,935 54,425 59,459 12,582
Balikbayan - 11,412 a/ 22,104 b/ 16,438 b/ 20,148 b/ 22,674 b/ 28,783 b/
Others 337,559 407,928 425,366 296,753 595,007 261,296 198,275
Notes:p - preliminarya/ - Philippine passport holders permanently residing abroad; exclude overseas Filipino workers; excluded in the total.b/ - Total Overseas Filipinos.
Source: Department of Tourism, Regional Office V
8 - 3

Figure 8.1 DISTRIBUTION OF VISITOR ARRIVALS, DOMESTIC AND FOREIGNBY COUNTRY OF RESIDENCE, REGION V, 2019
Figure 8.2 VISITOR ARRIVALS BY PROVINCE, DOMESTIC AND FOREIGN REGION V, 2019
Domestic88.6%
Foreign11.4%
Asia16.8%
Middle East0.8%
America20.6%
Europe5.2%
Oceania7.2%
Others53.3%
Foreign
0
200,000
400,000
600,000
800,000
1,000,000
1,200,000
1,400,000
1,600,000
Num
ber o
f Vis
itors
Domestic Foreign
8 - 4

Table 8.2DISTRIBUTION OF TRAVELERS BY COUNTRY OF RESIDENCE AND PROVINCE2013 - 2019
Country of Residence 2013 2014 2015 2016 2017 2018 2019 p
Albay 874,458 958,931 1,417,595 1,816,044 1,776,670 1,829,768 1,836,373
Domestic 535,013 634,599 1,042,646 1,376,881 1,298,313 1,434,338 1,553,358
Residents of the PhilippinesOf Filipino Nationality 535,013 634,599 1,042,646 1,376,881 1,298,313 1,434,338 1,553,358Of Foreign Nationality - - - - - - -
Foreign 339,445 324,332 374,949 439,163 478,578 395,430 283,015
AsiaChina 7,333 6,678 3,307 34,062 840 37,231 7,392Hongkong 3,985 2,533 3,154 3,951 332 557 2,315Indonesia 3,467 1,767 2,196 3,617 95 1,924 382Japan 4,581 3,538 3,182 13,662 391 24,867 4,424Malaysia 3,994 1,756 2,842 3,619 184 3,587 1,042Singapore 8,666 2,795 3,913 21,458 380 12,065 4,049South Korea 9,589 4,217 3,640 20,601 700 36,366 7,322Taiwan 4,549 2,088 2,154 3,006 170 3,532 957Thailand 3,466 2,113 2,272 4,454 305 3,657 2,073
Middle EastSaudi Arabia 3,715 1,613 2,032 2,159 211 2,023 2,564
AmericaCanada 10,006 4,732 3,856 18,984 564 21,427 13,231United States of America 19,789 9,501 9,474 70,209 1,429 38,851 39,970
EuropeFrance 3,837 2,161 2,779 22,647 386 14,128 4,054Germany 11,529 2,379 2,820 9,371 375 17,656 2,561Italy 3,184 1,776 2,279 2,223 104 97 1,198Switzerland 3,110 1,089 1,504 4,967 67 1,617 532United Kingdom 8,095 1,676 1,529 10,483 312 25,907 7,873
OceaniaAustralia 5,831 2,079 2,713 10,472 582 22,762 10,997
Balikbayan - - - - 221 a/ 205 a/ 301 a/
Others 220,719 269,841 319,303 179,218 470,930 126,971 169,778
Notes:p - preliminarya/ - Total Overseas Filipinos.b/ - Philippine passport holders permanently residing abroad; exclude overseas Filipino workers; excluded in the total.
Source: Department of Tourism, Regional Office V
8 - 5

Table 8.2 - ContinuedDISTRIBUTION OF TRAVELERS BY COUNTRY OF RESIDENCE AND PROVINCE2013 - 2019
Country of Residence 2013 2014 2015 2016 2017 2018 2019 p
Camarines Norte 230,157 211,013 289,660 412,836 518,855 561,645 933,476
Domestic 188,269 196,647 239,189 355,561 455,935 499,113 854,904
Residents of the PhilippinesOf Filipino Nationality 128,547 177,951 239,189 355,561 455,935 499,113 854,904Of Foreign Nationality 18,277 18,696 - - - - -Overseas Filipinos 41,445 - - - - - -
Foreign 41,888 14,366 50,471 57,275 62,920 62,532 78,572
AsiaChina 2,604 783 840 995 1,065 1,568 3,014Hongkong 752 312 138 250 317 547 613Indonesia - 19 192 377 448 399 430Japan 922 611 947 1,720 1,379 1,598 2,007Malaysia 434 240 276 395 720 692 1,011Singapore 716 314 971 1,445 1,417 1,123 1,593South Korea 4,935 3,170 7,021 9,817 11,135 11,031 12,959Taiwan 722 188 330 337 474 767 687Thailand 38 137 204 312 341 381 450
Middle EastSaudi Arabia 323 59 12 25 42 27 52
AmericaCanada 1,127 254 324 860 512 1,772 1,776United States of America 12,776 3,507 11,343 14,822 15,580 12,443 15,105
EuropeFrance 385 252 23 24 24 10 15Germany 3,307 343 252 306 298 393 1,111Italy 745 78 4 4 8 - 9Switzerland 330 28 9 108 124 57 62United Kingdom 656 224 253 348 388 433 478
OceaniaAustralia 1,582 477 137 272 413 576 724
Balikbayan - 7,005 b/ 17,499 a/ 16,438 a/ 19,927 a/ 21,066 a/ 28,482 a/
Others 9,534 3,370 9,696 8,420 8,308 7,649 7,994
8 - 6

Table 8.2 - ContinuedDISTRIBUTION OF TRAVELERS BY COUNTRY OF RESIDENCE AND PROVINCE2013 - 2019
Country of Residence 2013 2014 2015 2016 2017 2018 2019 p
Camarines Sur 1,562,877 1,861,010 2,062,469 2,411,143 2,944,552 3,083,284 51,542
Domestic 1,279,870 1,489,943 1,668,223 1,915,148 2,344,701 2,568,371 37,885
Residents of the PhilippinesOf Filipino Nationality 1,279,870 1,489,943 1,668,223 1,915,148 2,344,701 2,568,371 37,885Of Foreign Nationality - - - - - - -
Foreign 283,007 371,067 394,246 495,995 599,851 514,913 13,657
AsiaChina 31,333 30,477 19,679 31,779 32,004 28,241 4,515Hongkong 820 6,483 1,347 3,133 3,757 4,122 1,706Indonesia 872 1,536 965 727 1,828 808 12Japan 9,704 13,434 11,412 21,463 18,858 16,751 270Malaysia 1,396 9,993 2,823 6,386 3,524 2,928 27Singapore 1,013 2,445 2,888 2,773 2,663 15,111 920South Korea 10,659 23,250 48,320 44,730 50,097 52,582 350Taiwan 2,436 3,338 913 1,132 8,691 1,554 100Thailand 1,283 2,407 1,564 - 3,190 4,179 68
Middle EastSaudi Arabia 1,912 1,642 228 2,738 3,950 412 183
AmericaCanada 10,758 19,803 27,862 32,993 38,541 31,711 1,687United States of America 64,843 77,761 72,894 112,131 146,578 122,797 2,138
EuropeFrance 6,300 8,737 13,087 30,232 37,284 25,236 24Germany 19,470 12,454 24,457 30,291 25,223 20,934 103Italy 1,439 3,206 584 3,930 1,968 2,571 209Switzerland 2,597 3,013 1,348 2,624 5,151 7,311 14United Kingdom 3,223 5,566 38,391 30,331 61,868 26,140 125
OceaniaAustralia 13,128 17,353 35,440 34,789 50,583 34,028 119
Balikbayan - - 1,232 a/ - - - -
Others 99,821 128,169 88,812 103,813 104,093 117,497 997
8 - 7

Table 8.2 - ContinuedDISTRIBUTION OF TRAVELERS BY COUNTRY OF RESIDENCE AND PROVINCE2013 - 2019
Country of Residence 2013 2014 2015 2016 2017 2018 2019 p
Catanduanes 131,028 151,534 176,905 199,997 222,623 229,222 242,414
Domestic 124,578 138,420 164,825 193,325 215,216 221,463 235,326
Residents of the PhilippinesOf Filipino Nationality 108,135 131,301 162,734 193,325 215,216 221,305 235,326Of Foreign Nationality 5,703 7,119 2,091 - - 158 -Overseas Filipinos 10,740 - - - - - -
Foreign 6,450 13,114 12,080 6,672 7,407 7,759 7,088
AsiaChina 685 1,054 1,035 500 586 1,048 926Hongkong 3 46 - 66 - 87 31Indonesia 10 - 13 7 18 55 39Japan 832 942 586 542 749 569 363Malaysia - 2 - 11 - 17 36Singapore 108 201 125 234 282 355 102South Korea 74 199 245 59 25 28 96Taiwan 6 451 270 284 - 12 122Thailand - - - 76 - 21 39
Middle EastSaudi Arabia - - - 53 76 5 10
AmericaCanada 78 1,376 1,357 613 803 547 784United States of America 1,939 4,287 3,010 803 1,138 2,547 2,019
EuropeFrance 76 35 173 38 176 190 121Germany 291 384 350 609 629 349 286Italy 142 9 15 206 148 195 80Switzerland 155 10 8 21 89 6 30United Kingdom 193 454 263 285 465 140 163
OceaniaAustralia 829 1,378 444 590 866 864 715
Balikbayan - 4,407 b/ 2,193 a/ - - - -
Others 1,029 2,286 1,993 1,675 1,357 724 1126
8 - 8

Table 8.2 - ContinuedDISTRIBUTION OF TRAVELERS BY COUNTRY OF RESIDENCE AND PROVINCE2013 - 2019
Country of Residence 2013 2014 2015 2016 2017 2018 2019 p
Masbate 199,263 248,838 262,850 282,701 344,318 159,503 172,593
Domestic 194,980 243,659 255,777 269,934 336,540 151,072 168,796
Residents of the PhilippinesOf Filipino Nationality 194,980 243,565 255,777 269,934 336,540 151,072 168,796Of Foreign Nationality - 94 - - - - -
Foreign 4,283 5,179 7,073 12,767 7,778 8,431 3,797
AsiaChina 456 712 1,054 1,648 635 875 6Hongkong 4 72 72 60 3 43 2Indonesia 42 35 68 69 13 - -Japan 169 179 615 1101 537 602 12Malaysia 34 27 81 314 67 - 6Singapore 81 68 358 769 222 370 15South Korea 208 312 672 1203 524 841 10Taiwan 47 57 40 23 233 80 7Thailand 12 12 80 106 211 122 3
Middle EastSaudi Arabia 56 19 8 11 45 46 1
AmericaCanada 309 203 642 987 453 782 31United States of America 824 1,022 1,514 2,250 1,114 1,158 119
EuropeFrance 81 118 76 238 622 593 11Germany 59 64 74 170 624 664 101Italy 42 46 - 10 41 2 10Switzerland 74 99 39 256 226 3 6United Kingdom 84 113 267 781 343 576 11
OceaniaAustralia 507 413 525 980 436 562 27
Balikbayan - - 435 a/ - - 6 a/ -
Others 1,194 1,608 453 1,791 1,429 1,106 3,419
8 - 9

Table 8.2 - ContinuedDISTRIBUTION OF TRAVELERS BY COUNTRY OF RESIDENCE AND PROVINCE2013 - 2019
Country of Residence 2013 2014 2015 2016 2017 2018 2019 p
Sorsogon 253,981 292,747 316,528 286,612 232,658 254,178 287,991
Domestic 235,506 267,476 287,465 255,931 203,285 217,084 273,120
Residents of the PhilippinesOf Filipino Nationality 235,506 267,476 287,465 255,931 203,285 217,084 273,120Of Foreign Nationality - - - - - - -
Foreign 18,475 25,271 29,063 30,681 29,373 37,094 14,871
AsiaChina 2,394 1,560 3,659 4,473 2,171 2,998 -Hongkong 123 171 386 109 733 1,232 -Indonesia 108 244 409 132 441 587 -Japan 594 622 2,075 3,226 1,574 1,983 -Malaysia 93 207 535 126 698 998 -Singapore 185 498 1,193 955 798 1,296 -South Korea 783 602 2,647 3,963 2,342 2,469 -Taiwan 149 487 438 107 591 1,469 -Thailand 79 164 749 576 1,002 - -
Middle EastSaudi Arabia 124 193 187 - 339 828 -
AmericaCanada 1,585 970 1,749 987 1,719 3,048 -United States of America 4,210 8,903 5,437 2,250 2,678 4,829 -
EuropeFrance 157 1,495 513 158 451 628 -Germany 158 938 718 1,222 1,284 668 -Italy 189 335 624 653 176 182 -Switzerland 129 366 101 260 518 193 -United Kingdom 151 3,821 797 2,457 1,423 837 -
OceaniaAustralia 2,002 1,041 969 1,832 1,545 667 -
Balikbayan - - 745 a/ - - 1,397 a/ -
Others 5,262 2,654 5,132 7,195 8,890 10,785 14,871
8 - 10

Table 8.3NUMBER OF HOTELS/ACCOMMODATION ESTABLISHMENTS AND HOTEL/ACCOMMODATIONROOMS BY PROVINCE2013 - 2020
Province 2013 2014 2015 2016 2017 2018 2019 2020
Region V
Hotels/Accommodation Establishments 556 585 605 616 771 837 912 912
Hotel/Accommodation Rooms 9,497 10,262 10,471 10,643 12,646 13,649 14,612 14,612
Albay
Hotels/Accommodation Establishments 130 154 169 174 217 223 237 237
Hotel/Accommodation Rooms 2,914 2,903 2,982 3,016 3,689 4,111 4,481 4,481
Camarines Norte
Hotels/Accommodation Establishments 49 62 62 62 76 101 87 87
Hotel/Accommodation Rooms 714 999 999 999 1,176 1,506 1,278 1,278
Camarines Sur
Hotels/Accommodation Establishments 226 162 168 174 217 229 269 269
Hotel/Accommodation Rooms 3,739 3,796 3,796 3,934 4,573 4,719 5,460 5,460
Catanduanes
Hotels/Accommodation Establishments 17 29 29 29 40 63 48 48
Hotel/Accommodation Rooms 279 368 376 376 474 586 496 496
Masbate
Hotels/Accommodation Establishments 58 80 79 79 107 107 133 133
Hotel/Accommodation Rooms 757 1,080 1,202 1,202 1,426 1,426 1,387 1,387
Sorsogon
Hotels/Accommodation Establishments 76 98 98 98 114 114 138 138
Hotel/Accommodation Rooms 1,094 1,116 1,116 1,116 1,308 1,301 1,510 1,510
Note: Figures include rooms of Homestay Sites.
Source: Department of Tourism, Regional Office V
8 - 11

Table 8.4MONTHLY HOTEL OCCUPANCY RATE BY PROVINCE, REGION V2017 - 2020
Province January February March April May
2017
Albay 57.42 62.09 56.01 63.61 61.06
Camarines Norte 59.22 65.78 78.80 98.43 95.18
Camarines Sur 44.85 51.27 68.19 88.75 93.06
Catanduanes 73.68 87.79 83.80 99.09 100.00
Masbate 24.31 37.13 39.16 66.72 69.27
Sorsogon 39.65 58.10 78.34 85.01 68.18
2018
Albay 54.28 65.37 71.95 83.90 77.88
Camarines Norte 73.92 84.51 89.10 99.83 92.35
Camarines Sur … … … … …
Catanduanes 62.68 71.67 72.11 77.36 91.23
Masbate 19.10 20.20 22.09 36.38 20.90
Sorsogon 26.61 38.79 53.71 43.15 59.97
2019
Albay 53.05 58.21 54.59 84.20 80.87
Camarines Norte 55.71 70.54 80.82 96.45 96.12
Camarines Sur … … … … …
Catanduanes 67.48 66.43 68.52 76.84 75.45
Masbate 14.55 23.25 20.29 32.84 25.98
Sorsogon 21.95 23.15 30.21 47.77 41.90
2020
Albay 22.42 19.67 6.12 0.00 0.05
Camarines Norte … … … … …
Camarines Sur 41.86 44.99 26.23 0.13 0.11
Catanduanes 67.35 71.50 28.10 0.00 0.00
Masbate … … … … …
Sorsogon … … … … …
Notes: Figures are based on reports submitted by hotel/accommodation establishments.
Source: Department of Tourism, Regional Office V 8 - 12

June July August September October November December
57.38 65.28 65.02 60.43 66.19 66.00 62.43
91.26 83.27 78.08 76.31 77.62 81.57 80.90
70.33 54.10 66.67 86.95 68.37 74.52 84.09
97.75 72.00 80.50 85.94 80.67 82.66 86.44
44.65 12.91 16.67 23.94 22.18 29.94 48.15
62.12 71.25 51.10 41.59 65.60 54.87 57.78
69.80 76.98 75.05 69.38 68.43 70.96 70.50
87.11 90.48 90.80 88.06 84.40 80.40 85.75
… … … … … … …
76.26 63.25 64.34 71.11 70.36 66.41 70.76
15.36 12.95 12.28 15.15
44.17 37.26 28.27 24.74 47.66 42.87 44.56
72.96 66.46 68.38 68.76 68.39 69.26 69.63
77.67 69.03 59.24 54.61 50.69 52.42 55.83
… … … … … … …
73.61 65.59 66.73 74.66 70.29 67.54 70.46
20.74 14.92 17.80 17.56 24.38 27.63 32.49
27.69 26.13 24.43 22.79 27.60 27.36 24.97
1.30 5.71 5.63 6.28 7.65 11.08 11.63
… … … … … … …
0.56 2.52 2.73 4.02 7.45 8.92 15.76
3.06 4.74 3.91 4.76 5.34 15.27 12.15
… … … … … … …
… … … … … … …
8 - 13

Figure 8.3 VISITOR ARRIVALS, DOMESTIC AND FOREIGNREGION V, 2011 - 2019
Figure 8.4 NUMBER OF HOTELS/ACCOMMODATION ESTABLISHMENTS AND HOTEL/ACCOMMODATION ROOMS BY PROVINCE, REGION V, 2020
0
1,000
2,000
3,000
4,000
5,000
6,000
0
50
100
150
200
250
300
Albay CamarinesNorte
CamarinesSur
Catanduanes Masbate Sorsogon
Num
ber o
f Hot
el/A
ccom
mod
atio
n Ro
oms
Num
ber o
f Hot
els/
Acco
mm
odat
ion
Esta
blis
hmen
ts
Hotels/AccommodationEstablishmentsHotel/AccommodationRooms
0
1,000,000
2,000,000
3,000,000
4,000,000
5,000,000
6,000,000
2011 2012 2013 2014 2015 2016 2017 2018 2019
Num
ber o
f Vis
itors
Domestic Foreign
8 - 14

9 - 1
,
Data on vital events, health, and nutrition are key inputs to programs aimed at providing the basic minimum services to the citizenry. The data provide a profile of the health status and the level, causes and patterns of the mortality and morbidity of the population. The health and nutrition status of the people are an utmost concern of local governance. The focus of current development efforts is towards extending better services and expanding the delivery system even to the remotest rural communities. This is anchored on the concept that no individual should be deprived of the right to health care. Furthermore, the strength and well-being of the people influence their capabilities to engage in various economic endeavors. A cross analysis of the data with the demographic and socioeconomic information of the target population shows the existing and potential problems in an area. The health and nutrition status of the population should therefore be a priority in public service to truly empower the people, an objective of growth and development. These concerns and objectives necessitate the provision of data as bases in the delivery of services catering to the health and nutritional requirements of individuals.
This chapter presents statistics for the region and its provinces/cities on the registration of vital events such as number of births, deaths and marriages, including infant, foetal and maternal deaths, and the leading causes of mortality. This chapter likewise contains data on health facilities and the coverage of immunization programs. Meanwhile, the data on health and nutrition presented include the nutritional status of children, the leading causes of morbidity and notifiable diseases. The source of data is the Philippine Statistics Authority (PSA) for vital statistics that were processed using the certificates of births, deaths and marriages under the country’s Civil Registration System. The data on mortality, morbidity, health facilities, and immunization programs are sourced from the Department of Health compiled from its reporting systems. Sector Highlights The rate of registered marriages in the region was estimated at 3.7 marriages per 1,000 population
in 2020. Data from the Civil Registration System showed a slight decrease in the region’s registered live
birth rate from 16.6 births per 1,000 population in 2019 to 14.4 in 2020. Qualified health professionals attended 95.2 percent of registered births in 2019. While 42.1 percent of deaths that occurred in the region in 2019 were not attended by qualified medical practitioners.
Diseases of the Heart is the top cause of mortality in the region in 2018. Meanwhile, Pneumonia is the leading cause of infant mortality in the region.
The increase in the combined bed capacity of government and private hospitals in the Bicol
Region in 2018 still could not cope up with the growth in population. Bed-to-population ratio in 2018 stood at 1:1,913, albeit improved than the 1:2,038 ratio achieved the previous year.
The municipality of Garchitora had the highest prevalence of underweight and stunted children, among the cities/municipalities in the Bicol Region in 2018. Gainza and Baao in Camarines Sur registered the highest prevalence rate for wasting and overweight-obese, respectively.
Only about 65 percent of the target number of children for immunization in 2018 had been fully
immunized.
Chapter 9 VITAL, HEALTH, AND NUTRITION STATISTICS

Table 9.1 Number and Rate of Registered Marriages by Province/City, 2013 - 2020 9 - 3
Table 9.2A Number and Rate of Registered Live Births by Province/City, 2013 - 2020 9 - 4
Table 9.2B Number of Registered Live Births by Type of Attendance and Province/City2013 - 2019 9 - 5
Table 9.2C Number of Registered Live Births by Sex and Province/City, 2013 - 2019 9 - 7
Table 9.3A Number and Rate of Registered Deaths by Province/City, 2013 - 2020 9 - 9
Table 9.3B Number of Registered Deaths by Attendance and Province/City, 2013 - 2019 9 - 10
Table 9.4A Leading Causes of Mortality, Number and Rate, 2009 - 2018 9 - 12
Table 9.4B Leading Causes of Infant Mortality, Number and Rate, 2007 - 2015 9 - 12
Table 9.4C Leading Causes of Maternal Mortality, Number and Rate, 2008 - 2017 9 - 14
Table 9.5 Leading Causes of Morbidity, Number and Rate, 2008 - 2017 9 - 14
Table 9.6 Number and Bed Capacity of Government and Private Hospitals andBed-to-Population Ratio, by Province, 2009 - 2018 9 - 16
Table 9.7A Nutritional Status of Pre-Schoolers by Province/CityUsing Weight for Age, 2013 - 2018 9 - 18
Table 9.7B Nutritional Status of Pre-Schoolers by Province/CityUsing Length/Height for Age, 2017 - 2018 9 - 21
Table 9.7C Nutritional Status of Pre-Schoolers by Province/CityUsing Weight for Length/Height, 2017 - 2018 9 - 22
Table 9.8 Ranking of Cities/Municipalities According to Prevalence of Malnutrition2017 - 2018 9 - 23
Table 9.9 Coverage of Fully Immunized Children by Province/City, 2013 - 2018 9 - 27
Figure 9.1 Nutritional Status of Pre-Schoolers by Province, 2018 9 - 20
Figure 9.2 Coverage of Fully Immunized Children by Province/City, 2018 9 - 28
9 - 2

Table 9.1NUMBER AND RATE OF REGISTERED MARRIAGES BY PROVINCE/CITY 1/
2013- 2020(Rate per 1,000 Population)
Number Rate Number Rate Number Rate Number Rate
Region V 25,671 8.8 22,602 7.6 24,309 8.1 24,309 7.9
Albay 4,181 9.6 3,744 8.4 3,853 8.5 3,853 5.8 Camarines Norte 2,370 8.2 2,233 7.5 2,114 7.0 2,114 7.5 Camarines Sur 7,798 9.4 6,212 7.4 7,043 8.2 7,043 6.9 Catanduanes 757 5.7 906 6.7 1,055 7.7 1,055 7.6 Masbate 3,493 8.7 2,722 6.7 3,201 7.8 3,201 6.5 Sorsogon 2,526 8.0 2,204 6.8 2,336 7.1 2,336 5.8
Iriga City 472 8.3 493 8.5 493 8.5 493 7.7 Legazpi City 942 9.7 919 9.3 927 9.1 927 7.6 Ligao City 529 9.5 478 8.4 427 7.4 427 7.3 Masbate City 407 8.9 562 12.1 549 11.1 549 9.1 Naga City 1,016 10.8 1,135 11.8 1,145 11.2 1,145 10.3 Sorsogon City 663 7.9 542 6.3 702 8.0 702 7.4 Tabaco City 517 7.8 452 6.7 464 6.7 464 5.7
Number Rate Number Rate Number Rate Number Rate
Region V 24,993 8.0 27,044 8.5 26,125 8.0 12,209 3.7
Albay 4,048 5.8 6,190 8.7 6,355 8.8 3,192 4.3 Camarines Norte 2,732 8.7 2,496 7.8 2,376 7.2 1,139 3.4 Camarines Sur 6,699 6.3 10,185 9.4 9,767 8.9 4,290 3.8 Catanduanes 911 6.3 926 6.3 976 6.5 318 2.1 Masbate 3,145 6.6 3,693 7.6 3,795 7.6 1,844 3.6 Sorsogon 2,683 6.2 3,554 8.0 2,856 6.3 1,426 3.1
Iriga City 484 8.0 554 0.6 540 8.6 272 4.2 Legazpi City 873 8.3 1,022 1.4 1,040 9.6 566 5.1 Ligao City 473 8.0 479 1.0 497 8.1 258 4.1 Masbate City 498 9.7 539 1.1 436 8.2 240 4.4 Naga City 1,282 12.0 1,404 1.3 1,281 11.6 688 6.1 Sorsogon City 660 7.2 703 1.6 542 5.7 257 2.6 Tabaco City 505 7.1 597 5.6 586 7.9 253 3.4
Notes: 1/ Province/City refers to the place of occurrence. Rates were computed using the 2010 Census-Based Population Projections.p - preliminary counts
Source: Philippine Statistics Authority
2014
2018
2015
2019
2013
2017
2016
2020 p
Province/City
Province/City
9 - 3

Table 9.2ANUMBER AND RATE OF REGISTERED LIVE BIRTHS BY PROVINCE/CITY 1/
2013-2020(Rate per 1,000 Population)
2013 2014 2015 2016Number Rate Number Rate Number Rate Number Rate
Region V 119,727 20.6 115,772 19.6 94,681 15.7 116,092 18.9
Albay 18,097 20.7 17,380 19.5 16,812 12.4 16,839 12.2 Camarines Norte 12,823 22.1 12,641 21.3 13,017 21.5 13,004 21.1 Camarines Sur 37,057 22.4 35,171 20.8 34,681 17.0 34,133 16.4 Catanduanes 5,684 21.5 5,502 20.4 5,271 19.2 5,776 20.5 Masbate 13,024 16.3 12,807 15.7 13,024 14.1 13,745 14.6 Sorsogon 12,081 19.1 11,671 18.1 11,876 14.3 12,262 14.4
Iriga City 2,292 20.1 2,261 19.5 2,207 18.9 2,193 18.4 Legazpi City 3,864 19.9 3,855 19.5 3,715 18.3 3,713 18.0 Ligao City 2,557 13.2 2,440 21.5 2,503 21.8 2,317 19.8 Masbate City 1,910 21.0 1,862 20.1 1,988 20.1 2,076 20.6 Naga City 4,271 22.7 4,249 22.2 4,135 20.2 3,877 18.6 Sorsogon City 3,300 19.7 3,216 18.8 3,267 18.5 3,400 18.9 Tabaco City 2,767 20.8 2,717 20.1 2,714 19.6 2,757 19.6
2017 2018 2019 2020Number Rate Number Rate Number Rate Number Rate
Region V 108,338 17.3 109,223 17.1 107,819 16.6 95,827 14.4
Albay 15,628 11.1 24,115 16.9 24,082 16.6 21,446 14.5 Camarines Norte 12,330 19.6 12,205 19.0 12,266 18.7 11,061 16.5 Camarines Sur 32,217 15.2 37,729 17.4 37,067 16.8 33,151 14.7 Catanduanes 5,421 18.9 5,180 17.7 4,980 16.6 4,271 13.9 Masbate 12,090 12.6 15,691 16.1 15,172 15.3 13,081 12.9 Sorsogon 11,211 12.9 14,303 16.2 14,252 15.8 12,817 13.9
Iriga City 1,972 16.3 1,965 15.9 1,999 15.8 1,652 12.8 Legazpi City 3,770 18.0 3,666 17.2 3,919 18.0 3,373 15.3 Ligao City 2,253 18.9 2,132 17.6 2,093 17.0 1,941 15.5 Masbate City 1,758 17.2 2,155 20.6 2,304 21.7 1,926 17.8 Naga City 3,961 18.6 3,756 17.3 3,857 17.4 3,467 15.4 Sorsogon City 3,116 16.9 3,073 16.4 3,064 16.0 2,727 13.9 Tabaco City 2,611 18.3 2,592 17.8 2,494 16.9 2,194 14.6
Notes: 1/ Province/City refers to the usual residence of the mother. Rates were computed using the 2010 Census-Based Population Projections.
Source: Philippine Statistics Authority
Province/City
Province/City 1/
9 - 4

Table 9.2B NUMBER OF REGISTERED LIVE BIRTHS BY TYPE OF ATTENDANCE AND PROVINCE/CITY 1/
2013 - 2019
Province/City/ YearAttendance 2013 2014 2015 2016 2017 2018 2019
Region V
Total Births 119,120 115,320 114,718 115,623 112,317 108,856 107,423Health Professional 91,759 92,062 97,256 102,146 102,598 101,917 102,304Traditional Birth Attendants 27,003 22,660 16,767 12,982 9,493 6,850 4,952Others 344 366 370 268 152 88 156Not Stated 14 232 325 227 74 1 11
Albay
Total Births 16,196 15,752 14,805 14,709 25,400 24,723 24,760Health Professional 13,583 13,331 12,958 13,247 24,027 23,676 24,173Traditional Birth Attendants 2,572 2,300 1,691 1,387 1,271 1,024 561Others 32 53 41 9 57 23 19Not Stated 9 68 116 66 45 - 7
Camarines Norte
Total Births 12,696 12,465 12,896 12,881 12,467 12,090 12,109Health Professional 9,475 10,415 11,688 11,966 11,779 11,594 11,720Traditional Birth Attendants 3,174 2,003 1,174 872 670 490 381Others 47 21 19 37 13 6 8Not Stated - 26 15 6 5 - -
Camarines Sur
Total Births 28,591 26,632 25,271 24,929 39,533 37,910 37,276Health Professional 15,250 14,831 16,228 17,874 34,178 34,127 34,360Traditional Birth Attendants 13,241 11,707 8,827 6,930 5,316 3,772 2,891Others 99 64 134 71 35 11 25Not Stated 1 30 82 54 4 - -
Catanduanes
Total Births 5,643 5,503 5,281 5,795 5,615 5,194 4,985Health Professional 4,971 4,892 4,818 5,449 5,330 5,031 4,872Traditional Birth Attendants 667 598 453 340 285 162 113Others 5 7 4 6 - 1 -Not Stated - 6 6 - - - -
Masbate
Total Births 11,884 11,377 11,268 11,548 14,935 15,349 14,809Health Professional 8,041 8,224 8,858 9,632 13,343 14,170 13,920Traditional Birth Attendants 3,812 2,997 2,356 1,877 1,561 1,175 865Others 31 85 28 9 14 3 22Not Stated - 71 26 30 17 1 2
Sorsogon
Total Births 9,944 9,309 9,353 9,351 14,367 13,590 13,484Health Professional 8,734 8,335 8,586 8,766 13,941 13,319 13,259Traditional Birth Attendants 1,091 866 655 504 390 227 141Others 115 96 100 72 33 44 82Not Stated 4 12 12 9 3 - 2
Note: 1/ Province/City refers to the place of occurrence.
Source: Philippine Statistics Authority
9 - 5

Table 9.2B - ContinuedNUMBER OF REGISTERED LIVE BIRTHS BY TYPE OF ATTENDANCE AND PROVINCE/CITY 1/
2013 - 2019
Province/City/ YearAttendance 2013 2014 2015 2016 2017 2018 2019
Iriga City
Total Births 2,242 2,228 1,994 2,047 2,001 2,013 2,074Health Professional 1,795 1,818 1,673 1,865 1,884 1,902 1,974Traditional Birth Attendants 447 406 321 181 116 111 99Others - 4 - 1 1 - 1Not Stated - - - - - - -
Legazpi City
Total Births 5,635 5,721 5,836 5,754 6,515 6,955 7,365Health Professional 5,288 5,418 5,694 5,711 6,476 6,921 7,338Traditional Birth Attendants 346 297 137 32 36 33 25Others 1 5 - 7 1 1 1Not Stated - 1 5 4 2 - 1
Ligao City
Total Births 3,087 2,824 2,868 2,836 2,746 2,762 2,600Health Professional 2,846 2,592 2,714 2,679 2,645 2,717 2,574Traditional Birth Attendants 234 209 110 92 41 32 16Others 7 17 36 49 50 13 10Not Stated - 6 8 16 10 - -
Masbate City
Total Births 2,908 3,091 3,505 4,021 4,004 4,642 5,528Health Professional 2,797 2,949 3,384 3,898 3,925 4,587 5,480Traditional Birth Attendants 111 136 118 113 79 55 48Others - 5 2 - - - -Not Stated - 1 1 10 - - -
Naga City
Total Births 12,769 12,906 13,898 13,341 14,174 14,174 16,328Health Professional 11,985 12,215 13,345 12,951 13,924 13,924 16,096Traditional Birth Attendants 780 686 539 387 249 249 232Others 4 3 1 2 - - -Not Stated - 2 13 1 1 1 -
Sorsogon City
Total Births 4,976 5,095 5,120 5,670 5,736 5,736 5,777Health Professional 4,906 5,052 5,055 5,658 5,728 5,728 5,769Traditional Birth Attendants 68 38 57 10 7 7 5Others 2 5 5 1 - - 3Not Stated - - 3 1 1 1 -
Tabaco City
Total Births 2,549 2,417 2,623 2,741 2,424 2,424 2,005Health Professional 2,088 1,990 2,255 2,450 2,219 2,219 1,915Traditional Birth Attendants 460 417 329 257 191 191 90Others 1 1 1 4 - - -Not Stated - 9 38 30 14 14 -
9 - 6

Table 9.2C NUMBER OF REGISTERED LIVE BIRTHS BY SEX AND PROVINCE/CITY 1/
2013 - 2019
Province/City/ YearSex 2013 2014 2015 2016 2017 r 2018 2019
Region V Both Sexes 119,727 115,772 115,210 116,092 112,512 109,223 107,802 Male 62,471 60,631 60,250 60,145 58,563 57,115 56,160 Female 57,256 55,141 54,960 55,947 53,949 52,108 51,642
Albay Both Sexes 18,097 17,380 16,812 16,839 24,836 24,115 24,079 Male 9,352 9,112 8,725 8,671 13,002 12,596 12,511 Female 8,745 8,268 8,087 8,168 11,834 11,519 11,568
Camarines Norte Both Sexes 12,823 12,641 13,017 13,004 12,533 12,205 12,266 Male 6,600 6,648 6,968 6,846 6,548 6,419 6,429 Female 6,223 5,993 6,049 6,158 5,985 5,786 5,837
Camarines Sur Both Sexes 37,057 35,171 34,681 34,133 39,368 37,729 37,063 Male 19,446 18,380 18,088 17,663 20,466 19,748 19,345 Female 17,611 16,791 16,593 16,470 18,902 17,981 17,718
Catanduanes Both Sexes 5,684 5,502 5,271 5,776 5,567 5,180 4,980 Male 2,981 2,829 2,748 2,947 2,882 2,707 2,590 Female 2,703 2,673 2,523 2,829 2,685 2,473 2,390
Masbate Both Sexes 13,024 12,807 13,024 13,745 15,169 15,691 15,162 Male 6,650 6,723 6,786 7,098 7,885 8,179 7,864 Female 6,374 6,084 6,238 6,647 7,284 7,512 7,298
Sorsogon Both Sexes 12,081 11,671 11,876 12,262 15,039 14,303 14,252 Male 6,394 6,176 6,204 6,382 7,780 7,466 7,421 Female 5,687 5,495 5,672 5,880 7,259 6,837 6,831
Iriga City Both Sexes 2,292 2,261 2,207 2,193 2,029 1,965 1,999 Male 1,181 1,185 1,124 1,118 1,001 1,016 1,067 Female 1,111 1,076 1,083 1,075 1,028 949 932
Legazpi City Both Sexes 3,864 3,855 3,715 3,713 3,831 3,666 3,919 Male 2,002 2,034 1,998 1,964 2,023 1,881 2,077 Female 1,862 1,821 1,717 1,749 1,808 1,785 1,842
Note: 1/ Province/City refers to the usual residence of the mother.r - revised
Source: Philippine Statistics Authority
9 - 7

Table 9.2C - ContinuedNUMBER OF REGISTERED LIVE BIRTHS BY SEX AND PROVINCE/CITY 1/
2013 - 2019
Province/City/ YearSex 2013 2014 2015 2016 2017 r 2018 2019
Ligao City Both Sexes 2,557 2,440 2,503 2,317 2,294 2,132 2,093 Male 1,370 1,299 1,261 1,201 1,194 1,127 1,116 Female 1,187 1,141 1,242 1,116 1,100 1,005 977
Masbate City Both Sexes 1,910 1,862 1,988 2,076 1,897 2,155 2,304 Male 1,025 983 1,023 1,074 1,013 1,129 1,183 Female 885 879 965 1,002 884 1,026 1,121
Naga City Both Sexes 4,271 4,249 4,135 3,877 3,995 3,756 3,855 Male 2,290 2,188 2,150 1,969 2,080 1,936 2,062 Female 1,981 2,061 1,985 1,908 1,915 1,820 1,793
Sorsogon City Both Sexes 3,300 3,216 3,267 3,400 3,342 3,073 3,064 Male 1,765 1,667 1,721 1,752 1,732 1,644 1,569 Female 1,535 1,549 1,546 1,648 1,610 1,429 1,495
Tabaco City Both Sexes 2,767 2,717 2,714 2,757 2,673 2,592 2,493 Male 1,415 1,407 1,454 1,460 1,433 1,367 1,316 Female 1,352 1,310 1,260 1,297 1,240 1,225 1,177
9 - 8

Table 9.3ANUMBER AND RATE OF REGISTERED DEATHS BY PROVINCE/CITY 1/
2013 - 2020(Rate per 1,000 Population)
2013 2014 r 2015 2016Number Rate Number Rate Number Rate Number Rate
Region V 33,751 5.8 35,253 6.0 35,086 5.8 36,228 5.9
Albay 5,422 6.2 5,636 6.3 5,464 4.0 5,738 4.2 Camarines Norte 3,554 6.1 3,741 6.3 3,747 6.2 3,682 6.0 Camarines Sur 9,112 5.5 9,240 5.5 9,643 4.7 10,067 4.8 Catanduanes 1,717 6.5 1,758 6.5 1,782 6.5 1,777 6.3 Masbate 3,166 4.0 3,170 3.9 3,499 3.8 3,670 3.9 Sorsogon 3,889 6.2 3,986 6.2 3,890 4.7 4,052 4.8
Iriga City 779 6.8 803 6.9 757 6.5 862 7.2 Legazpi City 1,291 6.7 1,371 7.0 1,502 7.4 1,472 7.1 Ligao City 763 6.8 829 7.3 728 6.3 793 6.8 Masbate City 639 7.0 630 6.8 650 6.6 615 6.1 Naga City 1,414 7.5 1,899 9.9 1,345 6.6 1,369 6.6 Sorsogon City 1,171 7.0 1,223 7.2 1,190 6.7 1,175 6.5 Tabaco City 834 6.3 967 7.1 889 6.4 956 6.8
2017 2018 2019 2020pNumber Rate Number Rate Number Rate Number Rate
Region V 37,052 5.9 47,019 7.4 38,213 5.9 34,782 5.2
Albay 6,011 4.3 8,895 6.2 9,170 6.3 6,743 4.6 Camarines Norte 3,921 6.2 3,844 6.0 3,982 6.1 3,958 5.9 Camarines Sur 10,479 4.9 12,268 5.7 13,038 5.9 12,602 5.6 Catanduanes 1,817 6.3 1,746 6.0 1,826 6.1 1,738 5.7 Masbate 3,707 3.9 4,451 4.6 4,805 4.8 4,476 4.4 Sorsogon 3,988 4.6 5,127 5.8 5,392 6.0 5,265 5.7
Iriga City 816 6.7 841 6.8 853 6.8 893 6.9 Legazpi City 1,315 6.3 1,268 5.9 1,422 6.5 970 4.4 Ligao City 825 6.9 802 6.6 797 6.5 675 5.4 Masbate City 629 6.1 4,451 42.6 859 8.1 606 5.6 Naga City 1,475 6.9 1,236 5.7 1,464 6.6 1,399 6.2 Sorsogon City 1,117 6.1 1,214 6.5 1,257 6.6 1,162 5.9 Tabaco City 952 6.7 876 6.0 883 6.0 716 4.8
Notes: 1/ Province/City refers to the usual residence of the deceased. Rates were computed using the 2010 Census-Based Population Projections. r - revised p - preliminarySource: Philippine Statistics Authority
Province/City
Province/City
9 - 9

Table 9.3BNUMBER OF REGISTERED DEATHS BY ATTENDANCE AND PROVINCE/CITY 1/
2013 - 2019
Province/City/ YearAttendance 2013 2014 2015 2016 2017 2018 2019
Region VTotal Deaths 33,275 34,828 35,086 36,228 36,465 35,782 38,213Attended 11,471 11,463 12,857 13,224 15,238 17,715 19,207Not Attended 21,769 23,284 22,155 22,884 21,227 18,067 16,093Not Stated 35 81 74 93 - - 2,913
AlbayTotal Deaths 5,148 5,308 8,583 8,959 9,454 9,325 9,170Attended 1,416 1,574 4,284 3,932 4,709 5,210 5,056Not Attended 3,731 3,734 4,250 4,974 4,745 4,115 2,610Not Stated 1 - 49 47 - - 1,504
Camarines NorteTotal Deaths 3,429 3,608 3,747 3,682 3,735 3,671 3,982Attended 1,189 1,188 1,302 1,609 1,597 1,835 1,944Not Attended 2,240 2,420 2,443 2,058 2,138 1,836 1,687Not Stated - - 2 11 - - 351
Camarines SurTotal Deaths 7,202 7,712 11,745 12,298 12,748 12,280 13,038Attended 838 745 3,824 3,989 5,077 5,746 6,132Not Attended 6,363 6,967 7,905 8,293 7,671 6,534 6,863Not Stated 1 - 16 3 - - 43
CatanduanesTotal Deaths 1,691 1,731 1,782 1,777 1,757 1,705 1,826Attended 581 594 668 708 687 776 923Not Attended 1,101 1,096 1,113 1,069 1,070 929 850Not Stated 9 41 1 - - - 53
MasbateTotal Deaths 2,717 2,707 4,149 4,285 4,126 4,215 4,805Attended 665 447 1,127 1,194 1,646 2,230 2,417Not Attended 2,038 2,252 3,017 3,060 2,480 1,985 1,466Not Stated 14 8 5 30 - - 922
SorsogonTotal Deaths 3,155 3,252 5,080 5,227 4,645 4,586 5,392Attended 563 465 1,652 1,792 1,522 1,918 2,735Not Attended 2,592 2,787 3,427 3,430 3,123 2,668 2,617Not Stated - - 1 2 - - 40
Iriga CityTotal Deaths 892 874 … … … … …Attended 313 332 … … … … …Not Attended 579 542 … … … … …Not Stated - - … … … … …
… … … … …Legazpi City … … … … …
Total Deaths 1,937 2,082 … … … … …Attended 1,359 1,492 … … … … …Not Attended 578 590 … … … … …Not Stated - - … … … … …
Note: 1/ Province/City refers to the place of occurrence.
Source: Philippine Statistics Authority
9 - 10

Table 9.3B - ContinuedNUMBER OF REGISTERED DEATHS BY ATTENDANCE AND PROVINCE/CITY 1/
2013 - 2019
Province/City/ YearAttendance 2013 2014 2015 2016 2017 2018 2019
Ligao CityTotal Deaths 624 738 … … … … …Attended 232 249 … … … … …Not Attended 392 489 … … … … …Not Stated - - … … … … …
Masbate CityTotal Deaths 953 964 … … … … …Attended 675 587 … … … … …Not Attended 268 345 … … … … …Not Stated 10 32 … … … … …
Naga CityTotal Deaths 3,151 3,250 … … … … …Attended 2,485 2,492 … … … … …Not Attended 666 758 … … … … …Not Stated - - … … … … …
Sorsogon CityTotal Deaths 1,531 1,648 … … … … …Attended 850 946 … … … … …Not Attended 681 702 … … … … …Not Stated - - … … … … …
Tabaco CityTotal Deaths 845 954 … … … … …Attended 305 352 … … … … …Not Attended 540 602 … … … … …Not Stated - - … … … … …
9 - 11

Table 9.4ALEADING CAUSES OF MORTALITY, NUMBER AND RATE2009 - 2018(Rate per 100,000 Population)
2009 2010 2011 2012Number Rate Number Rate Number Rate Number Rate
Diseases of the Heart 1,455 26.0 2,882 50.5 4,307 77.5 4,178 74.3Respiratory Diseases 3,937 70.3 2,971 52.0 3,483 62.7 3,995 71.0Pneumonia … … … … … … … …Cerebrovascular Accidents … … 1,427 25.0 791 14.2 1,976 35.1Cerebrovascular Diseases … … … … … … … …Trauma / Injuries 829 14.8 1,221 21.4 1,353 24.4 1,383 24.6Hypertension 1,130 20.2 1,680 29.4 2,354 42.4 1,341 23.8Neoplasms, all forms 1,369 24.4 1,457 25.5 1,513 27.2 1,243 22.1Tuberculosis, all forms 1,206 21.6 1,544 27.0 1,357 24.4 1,176 20.9Kidney Diseases 548 9.6 803 14.1 953 17.2 648 11.5Diabetes Mellitus 506 10.8 804 14.1 757 13.6 647 11.5Septicemia 634 9.6 … … 595 10.7 647 11.5Asthma, all forms … … … … … … 568 10.1Cardiovascular Diseases … … … … … … … …Chronic Obstructive Pulmonary Dis. (COPD) … … … … … … …Diarrheal Diseases … … … … … … … …Ischemic Heart Diseases 1,539 27.5 1,682 29.5 … … … …
Note: Until 2012, Respiratory Diseases include Pneumonia.
Source: Department of Health, Regional Office V
Table 9.4BLEADING CAUSES OF INFANT MORTALITY, NUMBER AND RATE2007 - 2015(Rate per 1,000 Live Births)
2007 2008 2009Number Rate Number Rate Number Rate
Respiratory Diseases 294 2.5 289 2.4 259 2.2Prematurity / Post Maturity 57 0.5 110 0.9 89 0.8Septicemia 140 1.2 148 1.3 105 0.9Congenital Anomalies 99 0.9 145 1.2 76 0.7Diarrheal Diseases 52 0.5 40 0.3 74 0.6Seizure Disorder 32 0.3 40 0.3 29 0.3Diseases of the Heart … … 13 0.1 43 0.4Asphyxia (etiology unknown) … … 18 0.2 28 0.2Asthma … … … … 16 0.1Nutritional Deficiencies 19 0.2 10 0.1 … …Neoplasms, all forms … … … … … …Pneumonias … … … … … …Bronchitis … … … … … …Anemia … … … … … …Tetanus Neonatorum … … … … … …Trauma 26 0.2 … … … …Asphyxia 64 0.6 14 0.1 55 4.5Meningitis 17 0.1 8 0.1 … …Hyaline Membrane Disease … … … … … …Congenital Heart Disease … … … … … …
Note: Until 2012, Respiratory Diseases include Pneumonia.
Source: Department of Health, Regional Office V
Leading Causes
Leading Causes
9 - 12

2013 2014 2015 2016 2017 2018Number Rate Number Rate Number Rate Number Rate Number Rate Number Rate
5,860 103.0 3,571 62.1 6,427 1.1 5,221 0.9 6,379 1.0 2,473 0.4… … … … … … … … … … … …
3,564 62.6 4,049 70.4 3,611 0.6 3,659 0.6 4,372 0.7 1,874 0.3… … … … … … … … … … … …
705 12.4 3,356 58.3 1,229 0.2 2,046 0.4 2,116 0.3 962 0.2721 12.7 1,045 18.2 950 0.2 1,227 0.2 1,576 0.3 675 0.1
1,363 24.0 407 7.1 1,470 0.3 2,025 0.3 1,833 0.3 492 0.11,853 32.6 1,544 26.8 1,658 0.3 1,635 0.3 1,764 0.3 1,030 0.2
961 16.9 1,027 17.9 1,245 0.2 1,059 0.2 968 0.2 397 0.1787 13.8 871 15.1 1,033 0.2 1,016 0.2 1,195 0.2 515 0.1628 11.0 548 9.5 … … … … 781 0.1 326 0.1
… … … … 814 0.1 632 0.1 … … … …… … … … … … … … … … … …… … 3,356 58.4 … … … … … … … …
552 10.0 674 11.7 812 0.1 474 0.1 608 0.1 236 0.0… … 548 9.5 … … … … … … … …… … … … … … … … … … … …
2010 2011 2012 2013 2014 2015Number Rate Number Rate Number Rate Number Rate Number Rate Number Rate
371 3.1 336 2.8 … … … … … … … …74 0.6 157 1.3 99 0.8 104 0.9 55 0.5 103 0.998 0.8 123 1.0 144 1.2 66 0.5 133 1.2 127 1.166 0.6 88 0.7 66 0.6 85 0.7 32 0.3 25 0.265 0.5 32 0.3 60 0.5 62 0.5 23 0.2 30 0.324 0.2 25 0.2 23 0.2 17 0.1 … … … …… … 25 0.2 35 0.3 26 0.2 34 0.3 33 0.3… … 23 0.2 33 0.3 33 0.3 34 0.3 … …15 0.1 16 0.1 28 0.2 10 0.1 17 0.2 … …22 0.2 9 0.1 … … … … … … … …11 0.1 9 0.1 … … … … … … … …… … … … 267 2.2 246 2.0 242 2.1 212 1.9… … … … 47 0.4 … … … … … …… … … … … … 8 0.1 … … … …13 0.1 … … … … … … … … … …… … … … … … … … 11 0.1 … …… … … … … … … … … … 41 0.4… … … … … … … … … … … …… … … … … … … … 38 0.3 50 0.4… … … … … … … … 29 0.3 18 0.2
9 - 13
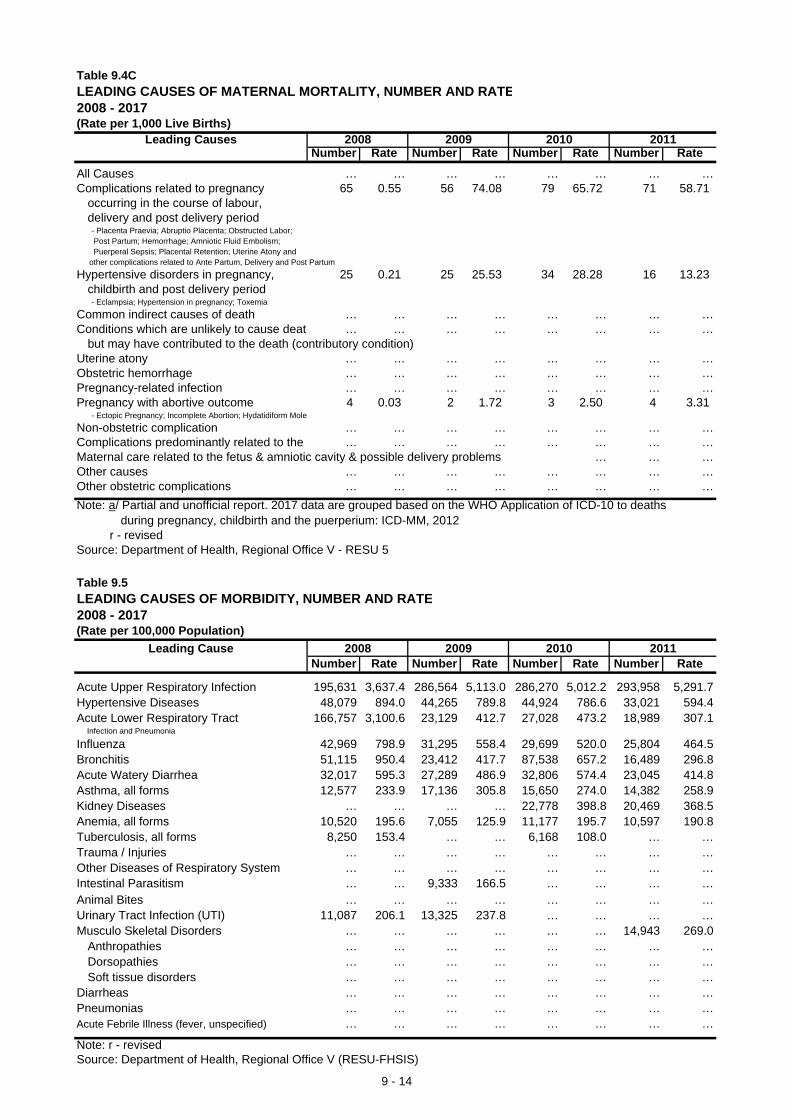
Table 9.4CLEADING CAUSES OF MATERNAL MORTALITY, NUMBER AND RATE2008 - 2017(Rate per 1,000 Live Births)
Leading Causes 2008 2009 2010 2011Number Rate Number Rate Number Rate Number Rate
All Causes … … … … … … … …Complications related to pregnancy 65 0.55 56 74.08 79 65.72 71 58.71
occurring in the course of labour,delivery and post delivery period - Placenta Praevia; Abruptio Placenta; Obstructed Labor; Post Partum; Hemorrhage; Amniotic Fluid Embolism; Puerperal Sepsis; Placental Retention; Uterine Atony and other complications related to Ante Partum, Delivery and Post Partum
Hypertensive disorders in pregnancy, 25 0.21 25 25.53 34 28.28 16 13.23childbirth and post delivery period - Eclampsia; Hypertension in pregnancy; Toxemia
Common indirect causes of death … … … … … … … …Conditions which are unlikely to cause deat … … … … … … … …
but may have contributed to the death (contributory condition)Uterine atony … … … … … … … …Obstetric hemorrhage … … … … … … … …Pregnancy-related infection … … … … … … … …Pregnancy with abortive outcome 4 0.03 2 1.72 3 2.50 4 3.31
- Ectopic Pregnancy; Incomplete Abortion; Hydatidiform Mole
Non-obstetric complication … … … … … … … …Complications predominantly related to the … … … … … … … …Maternal care related to the fetus & amniotic cavity & possible delivery problems … … …Other causes … … … … … … … …Other obstetric complications … … … … … … … …
Note: a/ Partial and unofficial report. 2017 data are grouped based on the WHO Application of ICD-10 to deaths during pregnancy, childbirth and the puerperium: ICD-MM, 2012
r - revisedSource: Department of Health, Regional Office V - RESU 5
Table 9.5LEADING CAUSES OF MORBIDITY, NUMBER AND RATE2008 - 2017(Rate per 100,000 Population)
Leading Cause 2008 2009 2010 2011Number Rate Number Rate Number Rate Number Rate
Acute Upper Respiratory Infection 195,631 3,637.4 286,564 5,113.0 286,270 5,012.2 293,958 5,291.7Hypertensive Diseases 48,079 894.0 44,265 789.8 44,924 786.6 33,021 594.4Acute Lower Respiratory Tract 166,757 3,100.6 23,129 412.7 27,028 473.2 18,989 307.1
Infection and Pneumonia
Influenza 42,969 798.9 31,295 558.4 29,699 520.0 25,804 464.5Bronchitis 51,115 950.4 23,412 417.7 87,538 657.2 16,489 296.8Acute Watery Diarrhea 32,017 595.3 27,289 486.9 32,806 574.4 23,045 414.8Asthma, all forms 12,577 233.9 17,136 305.8 15,650 274.0 14,382 258.9Kidney Diseases … … … … 22,778 398.8 20,469 368.5Anemia, all forms 10,520 195.6 7,055 125.9 11,177 195.7 10,597 190.8Tuberculosis, all forms 8,250 153.4 … … 6,168 108.0 … …Trauma / Injuries … … … … … … … …Other Diseases of Respiratory System … … … … … … … …Intestinal Parasitism … … 9,333 166.5 … … … …Animal Bites … … … … … … … …Urinary Tract Infection (UTI) 11,087 206.1 13,325 237.8 … … … …Musculo Skeletal Disorders … … … … … … 14,943 269.0
Anthropathies … … … … … … … …Dorsopathies … … … … … … … …Soft tissue disorders … … … … … … … …
Diarrheas … … … … … … … …Pneumonias … … … … … … … …Acute Febrile Illness (fever, unspecified) … … … … … … … …
Note: r - revisedSource: Department of Health, Regional Office V (RESU-FHSIS)
9 - 14
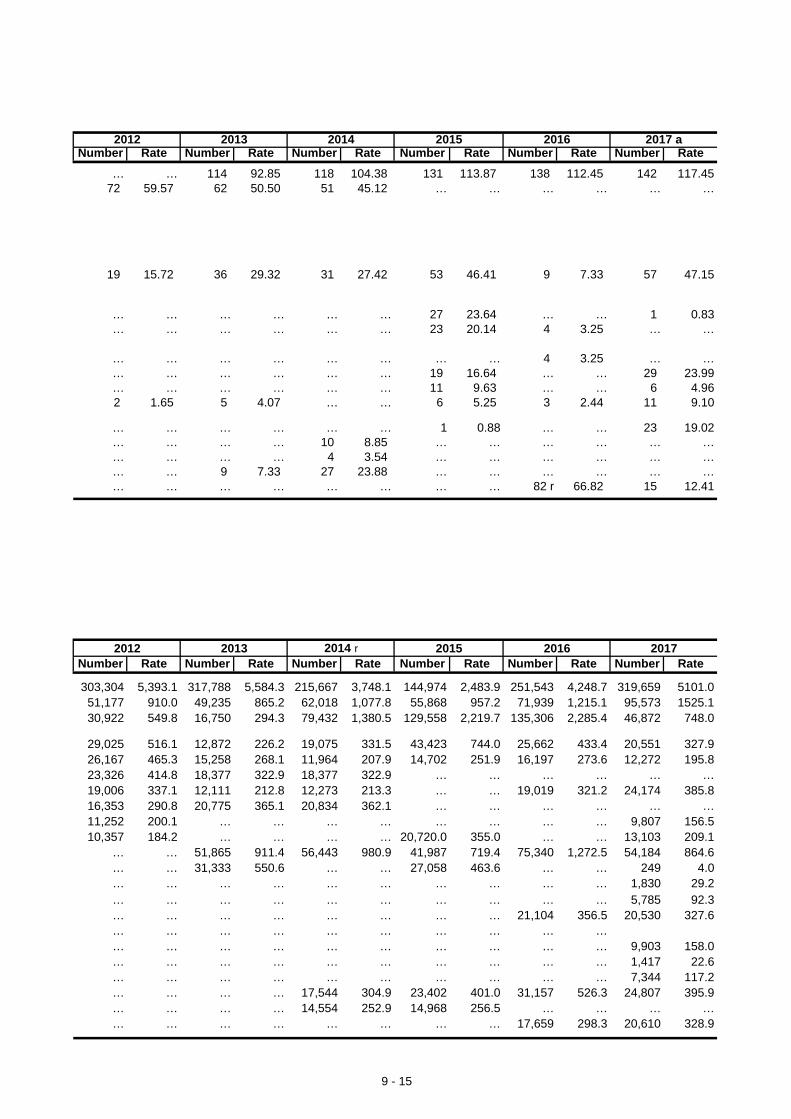
2012 2013 2014 2015 2016 2017 aNumber Rate Number Rate Number Rate Number Rate Number Rate Number Rate
… … 114 92.85 118 104.38 131 113.87 138 112.45 142 117.4572 59.57 62 50.50 51 45.12 … … … … … …
19 15.72 36 29.32 31 27.42 53 46.41 9 7.33 57 47.15
… … … … … … 27 23.64 … … 1 0.83… … … … … … 23 20.14 4 3.25 … …
… … … … … … … … 4 3.25 … …… … … … … … 19 16.64 … … 29 23.99… … … … … … 11 9.63 … … 6 4.962 1.65 5 4.07 … … 6 5.25 3 2.44 11 9.10
… … … … … … 1 0.88 … … 23 19.02… … … … 10 8.85 … … … … … …… … … … 4 3.54 … … … … … …… … 9 7.33 27 23.88 … … … … … …… … … … … … … … 82 r 66.82 15 12.41
2012 2013 2014 r 2015 2016 2017Number Rate Number Rate Number Rate Number Rate Number Rate Number Rate
303,304 5,393.1 317,788 5,584.3 215,667 3,748.1 144,974 2,483.9 251,543 4,248.7 319,659 5101.051,177 910.0 49,235 865.2 62,018 1,077.8 55,868 957.2 71,939 1,215.1 95,573 1525.130,922 549.8 16,750 294.3 79,432 1,380.5 129,558 2,219.7 135,306 2,285.4 46,872 748.0
29,025 516.1 12,872 226.2 19,075 331.5 43,423 744.0 25,662 433.4 20,551 327.926,167 465.3 15,258 268.1 11,964 207.9 14,702 251.9 16,197 273.6 12,272 195.823,326 414.8 18,377 322.9 18,377 322.9 … … … … … …19,006 337.1 12,111 212.8 12,273 213.3 … … 19,019 321.2 24,174 385.816,353 290.8 20,775 365.1 20,834 362.1 … … … … … …11,252 200.1 … … … … … … … … 9,807 156.510,357 184.2 … … … … 20,720.0 355.0 … … 13,103 209.1
… … 51,865 911.4 56,443 980.9 41,987 719.4 75,340 1,272.5 54,184 864.6… … 31,333 550.6 … … 27,058 463.6 … … 249 4.0… … … … … … … … … … 1,830 29.2… … … … … … … … … … 5,785 92.3… … … … … … … … 21,104 356.5 20,530 327.6… … … … … … … … … …… … … … … … … … … … 9,903 158.0… … … … … … … … … … 1,417 22.6… … … … … … … … … … 7,344 117.2… … … … 17,544 304.9 23,402 401.0 31,157 526.3 24,807 395.9… … … … 14,554 252.9 14,968 256.5 … … … …… … … … … … … … 17,659 298.3 20,610 328.9
9 - 15

Table 9.6 NUMBER AND BED CAPACITY OF GOVERNMENT AND PRIVATE HOSPITALSAND BED-TO-POPULATION RATIO BY PROVINCE2009 - 2018
Total Government Private Bed-to-Province Number Bed Number Bed Number Bed Population
Capacity Capacity Capacity Ratio
Region V
2009 115 3,737 48 1,931 67 1,806 1 : 1,5002010 109 3,631 48 1,896 61 1,735 1 : 1,5122011 110 3,696 49 1,946 61 1,750 1 : 1,5132012 110 3,726 51 1,950 59 1,776 1 : 1,5302013 111 3,789 51 1,950 60 1,839 1 : 1,533
2014 111 3,818 51 1,973 60 1,845 1 : 1,5502015 113 3,826 54 2,026 59 1,800 1 : 1,5772016 50 3,381 21 1,916 29 1,465 1 : 1,8192017 50 3,075 20 1,466 30 1,609 1 : 2,0382018 55 3,340 22 1,366 33 1,749 1 : 1,913
Albay
2009 36 1,174 9 445 27 729 1 : 1,1002010 33 1,149 8 435 25 714 1 : 1,0862011 33 1,164 8 435 25 729 1 : 1,0902012 34 1,205 9 447 25 758 1 : 1,0712013 34 1,185 9 447 25 738 1 : 1,108
2014 34 1,196 9 457 25 739 1 : 1,1162015 34 1,186 9 447 25 739 1 : 1,1452016 15 874 4 350 11 524 1 : 1,5802017 16 942 4 350 12 592 1 : 1,4912018 17 967 5 375 12 212 1 : 1,477
Camarines Norte
2009 11 384 2 125 9 259 1 : 1,4442010 11 384 2 125 9 259 1 : 1,4262011 12 399 3 140 9 259 1 : 1,4002012 12 414 3 140 9 274 1 : 1,3762013 12 414 3 140 9 274 1 : 1,404
2014 12 399 3 140 9 259 1 : 1,4862015 12 399 3 187 9 212 1 : 1,5172016 6 322 2 125 4 197 1 : 1,9172017 6 386 2 125 4 261 1 : 1,6322018 8 521 3 225 5 296 1 : 1,234
Camarines Sur 1/
2009 26 1,169 12 646 14 523 1 : 1,5972010 26 1,120 13 621 13 499 1 : 1,6482011 26 1,155 13 656 13 499 1 : 1,6302012 26 1,157 14 648 12 509 1 : 1,6602013 28 1,240 14 648 14 592 1 : 1,549
Notes: 1/ Camarines Sur excludes Bicol Sanitarium (450 bed capacity) being a special hospital.2. Ratios for 2008-2009 were computed using the 2000 Census-Based Population Projections while ratios from 2010 onwards (revised) were computed using the 2010 Census-Based Population Projections.3. 2016 data adopted AO No. 2012-0012 - Rules and Regulations Governing the New Classification of Hospitalsand Other Health Facilities in the Philippines.
Source: Department of Health, Regional Office V
9 - 16

Table 9.6 - Continued
NUMBER AND BED CAPACITY OF GOVERNMENT AND PRIVATE HOSPITALSAND BED-TO-POPULATION RATIO BY PROVINCE2009 - 2018
Total Government Private Bed-to-Province Number Bed Number Bed Number Bed Population
Capacity Capacity Capacity Ratio
2014 28 1,255 14 656 14 599 1 : 1,5922015 29 1,267 16 666 13 601 1 : 1,6092016 14 1,516 4 941 10 575 1 : 1,3712017 13 1,066 3 491 10 575 1 : 1,9892018 14 1,111 3 491 11 620 1 : 1,946
Catanduanes
2009 10 289 7 235 3 54 1 : 8702010 10 289 7 235 3 54 1 : 8622011 10 289 7 235 3 54 1 : 8802012 10 264 7 210 3 54 1 : 9822013 10 289 7 235 3 54 1 : 915
2014 10 294 7 240 3 54 1 : 9182015 10 289 7 235 3 54 1 : 9522016 5 199 4 175 1 24 1 : 1,4132017 5 211 4 175 1 36 1 : 1,3612018 6 271 4 175 2 96 1 : 1,082
Masbate
2009 17 320 9 230 8 90 1 : 2,6672010 15 300 9 230 6 70 1 : 2,8232011 15 300 9 230 6 70 1 : 2,8722012 13 305 9 255 4 50 1 : 2,8752013 13 280 9 230 4 50 1 : 3,186
2014 13 285 9 230 4 55 1 : 3,1852015 13 285 9 230 4 55 1 : 3,2402016 3 145 2 125 1 20 1 : 6,4872017 3 145 2 125 1 20 1 : 6,6102018 3 145 2 125 1 20 1 : 6,734
Sorsogon
2009 15 401 9 250 6 151 1 : 1,9642010 14 389 9 250 5 139 1 : 1,9322011 14 389 9 250 5 139 1 : 1,9712012 15 381 9 250 6 131 1 : 2,0542013 14 381 9 250 5 131 1 : 2,096
2014 14 389 9 250 5 139 1 : 2,0962015 15 400 10 261 5 139 1 : 2,0812016 7 325 5 200 2 125 1 : 2,6142017 7 325 5 200 2 125 1 : 2,6692018 7 325 5 200 2 125 1 : 2,724
9 - 17

Table 9.7A NUTRITIONAL STATUS OF PRE-SCHOOLERS BY PROVINCE/CITY USING WEIGHT FOR AGE 1/
2013 - 2018
Number ofchildrenweighed Number Prevalence Number Prevalence Number Prevalence Number Prevalence
2013 r Region V 752,567 635,204 … 80,156 … 25,624 … 11,583 …
Albay 105,349 84,075 … 13,108 … 5,113 … 3,053 … Camarines Norte 77,562 67,258 … 7,234 … 2,299 … 771 … Camarines Sur 208,960 171,135 … 25,784 … 8,331 … 3,710 … Catanduanes 30,584 24,501 … 3,997 … 1,587 … 499 … Masbate 117,244 97,741 … 14,352 … 4,274 … 877 … Sorsogon 76,100 64,991 … 7,903 … 2,111 … 1,095 … Iriga City 15,401 14,265 … 711 … 179 … 246 … Legazpi City 25,299 23,270 … 1,408 … 347 … 274 … Ligao City 14,337 12,543 … 1,219 … 359 … 216 … Masbate City 13,510 11,674 … 1,336 … 333 … 167 … Naga City 27,944 26,635 … 918 … 215 … 176 … Sorsogon City 22,364 20,629 … 1,197 … 193 … 345 … Tabaco City 17,913 16,487 … 989 … 283 … 154 …
2014 Region V 1,813,342 1,562,317 … ####### … 58,014 … 31,171 …
Albay 107,314 91,379 … 9,160 … 3,826 … 2,949 … Camarines Norte 81,432 70,898 … 7,248 … 2,426 … 860 … Camarines Sur 209,157 172,152 … 24,221 … 8,639 … 4,145 … Catanduanes 30,403 24,477 … 3,961 … 1,429 … 536 … Masbate 113,780 95,719 … 12,470 … 4,559 … 1,032 … Sorsogon 77,220 66,389 … 7,506 … 2,162 … 1,163 … Iriga City 15,872 15,180 … 493 … 94 … 105 … Legazpi City 22,614 20,249 … 1,456 … 432 … 477 … Ligao City 14,734 12,895 … 1,247 … 360 … 232 … Masbate City 16,666 13,356 … 1,573 … 705 … 1,032 … Naga City 30,197 28,919 … 936 … 186 … 156 … Sorsogon City 23,113 21,487 … 1,065 … 244 … 317 … Tabaco City 17,130 15,929 … 772 … 296 … 133 …
2015 Region V 526,855 456,644 … 44,866 … 16,328 … 9,017 …
Albay 91,153 78,930 … 7,309 … 2,773 … 2,141 … Camarines Norte 69,153 61,785 … 5,047 … 1,665 … 656 … Camarines Sur 181,671 156,891 … 15,134 … 6,076 … 3,570 … Catanduanes 25,716 21,189 … 2,960 … 1,048 … 519 … Masbate 94,390 81,242 … 8,905 … 3,221 … 1,022 … Sorsogon 64,772 56,607 … 5,511 … 1,545 … 1,109 …
Notes: 1. Data is based on Operation Timbang results among 0-59 months old pre-school children received from LGUs and processed by the National Nutrition Council.2. Reference format: WHO-CGS (Child Growth Standard)3. r - revised
Source: Department of Health - National Nutrition Council, Region V
Underweight 3/Underweight 4/
Overweight 5/Province/CitySeverely Normal 2/
9 - 18

Table 9.7A - ContinuedNUTRITIONAL STATUS OF PRE-SCHOOLERS BY PROVINCE/CITY USING WEIGHT FOR AGE 1/
2013 - 2018
Number ofchildrenweighed Number Prevalence Number Prevalence Number Prevalence Number Prevalence
Underweight 3/Underweight 4/
Overweight 5/Province/CitySeverely Normal 2/
Iriga City 13,651 13,133 … 374 … 75 … 69 … Legazpi City 19,706 17,963 … 1,015 … 288 … 440 … Ligao City 12,863 11,274 … 1,045 … 323 … 221 … Masbate City 10,530 8,016 … 1,345 … 768 … 401 … Naga City 23,027 22,026 … 694 … 178 … 129 … Sorsogon City 19,247 17,829 … 890 … 194 … 334 … Tabaco City 13,895 13,092 … 482 … 224 … 97 …
2016 Region V 623,614 546,330 87.61 49,739 7.97 17,351 2.78 10,194 1.63
Albay 89,159 78,939 88.54 6,112 6.86 2,350 2.64 1,758 1.97 Camarines Norte 68,562 62,356 90.95 4,475 6.53 1,200 1.75 531 0.77 Camarines Sur 174,746 146,368 83.76 17,942 10.27 6,543 3.74 3,893 2.23 Catanduanes 25,321 21,010 82.97 2,800 11.06 1,052 4.15 459 1.81 Masbate 90,196 77,649 86.09 8,381 9.29 3,206 3.55 960 1.06 Sorsogon 65,334 57,368 87.81 5,382 8.24 1,505 2.30 1,079 1.65 Iriga City 12,571 12,098 96.24 359 2.86 50 0.40 64 0.51 Legazpi City 19,332 17,911 92.65 782 4.05 223 1.15 416 2.15 Ligao City 12,730 11,370 89.32 821 6.45 332 2.61 207 1.63 Masbate City 10,766 8,795 81.69 1,177 10.93 472 4.38 322 2.99 Naga City 25,038 24,402 97.46 448 1.79 115 0.46 73 0.29 Sorsogon City 19,312 18,025 93.34 740 3.83 204 1.06 343 1.78 Tabaco City 10,547 10,039 95.18 320 3.03 99 0.94 89 0.84
2017 Region V 614,972 542,268 88.16 47,031 7.65 15,109 2.46 10,564 1.72
Albay 91,640 82,182 89.68 5,829 6.36 1,941 2.12 1,688 1.84 Camarines Norte 63,258 57,021 90.14 4,222 6.67 1,184 1.87 831 1.31 Camarines Sur 172,314 145,718 84.57 16,955 9.84 5,975 3.47 3,666 2.13 Catanduanes 24,209 19,940 82.37 2,715 11.21 1,059 4.37 495 2.04 Masbate 88,730 76,617 86.35 8,318 9.37 2,740 3.09 1,055 1.19 Sorsogon 65,728 58,521 89.04 4,809 7.32 1,203 1.83 1,195 1.82 Iriga City 11,106 10,644 95.84 425 3.83 24 0.22 13 0.12 Legazpi City 19,698 18,698 94.92 431 2.19 115 0.58 454 2.30 Ligao City 12,069 10,847 89.87 809 6.70 219 1.81 194 1.61 Masbate City 9,465 7,865 83.10 1,002 10.59 352 3.72 246 2.60 Naga City 26,326 25,739 97.77 422 1.60 102 0.39 63 0.24 Sorsogon City 19,464 18,149 93.24 710 3.65 174 0.89 431 2.21 Tabaco City 10,965 10,327 94.18 384 3.50 21 0.19 233 2.12
Notes: 1/ Weight-for-Age reflects body weight relative to the child’s age. This indicator is used to assess whether a child is underweight or severely underweight for his/her age.2/ Normal – has ±2SD (plus or minus 2 standard deviation) value, meaning the child’s weight is within the normal limits3/ Underweight – has a <-2SD (less than minus 2 standard deviation) value, meaning the child’s weight is lower or below the normal weight for his/her age.4/ Severely Underweight – has a <3SD (less than minus 3 standard deviation) value, meaning he child’s weight is very much lower than normal for his/her age.5/ Overweight – has a >+2SD (more than plus 2 standard deviation) value,meaning the child’s weight is higher or above the normal weight for his/her age.
9 - 19

Table 9.7A - ContinuedNUTRITIONAL STATUS OF PRE-SCHOOLERS BY PROVINCE/CITY USING WEIGHT FOR AGE 1/
2013 - 2018
Number ofchildrenweighed Number Prevalence Number Prevalence Number Prevalence Number Prevalence
Underweight 3/Underweight 4/
Overweight 5/Province/CitySeverely Normal 2/
2018 Region V 598,538 534,578 89.31 41,573 6.95 12,113 2.02 10,274 1.72
Albay 84,218 76,773 91.16 4,569 5.43 1,440 1.71 1,436 1.71 Camarines Norte 63,296 57,504 90.85 3,899 6.16 1,082 1.71 811 1.28 Camarines Sur 170,158 146,035 85.82 15,423 9.06 4,912 2.89 3,788 2.23 Catanduanes 24,237 20,423 84.26 2,569 10.60 748 3.09 497 2.05 Masbate 82,726 73,160 88.44 6,659 8.05 1,848 2.23 1,059 1.28 Sorsogon 64,010 57,028 89.09 4,648 7.26 1,157 1.81 1,177 1.84 Iriga City 11,193 10,768 96.20 411 3.67 6 0.05 8 0.07 Legazpi City 22,221 21,327 95.98 427 1.92 112 0.50 355 1.60 Ligao City 11,815 10,790 91.32 686 5.81 182 1.54 157 1.33 Masbate City 9,744 8,204 84.20 883 9.06 335 3.44 322 3.30 Naga City 25,134 24,620 97.95 375 1.49 78 0.31 61 0.24 Sorsogon City 18,638 17,497 93.88 676 3.63 133 0.71 332 1.78 Tabaco City 11,148 10,449 93.73 348 3.12 80 0.72 271 2.43
Figure 9.1 NUTRITIONAL STATUS OF 0-59 MONTHS PRESCHOOLERSBY PROVINCE, 2018
0%
10%
20%
30%
40%
50%
60%
70%
80%
90%
100%
Albay CamarinesNorte
CamarinesSur
Catanduanes Masbate Sorsogon
Overweight
Normal
SeverelyUnderweight
Underweight
9 - 20

Table 9.7BNUTRITIONAL STATUS OF PRE-SCHOOLERS BY PROVINCE/CITYUSING LENGTH/HEIGHT FOR AGE 1/
2017 - 2018
Number Prevalence Number Prevalence Number Prevalence Number Prevalence
2017 Region V 613,390 464,562 75.74 84,968 13.85 43,072 7.02 20,788 3.39
Albay 90,340 71,235 78.85 11,398 12.62 4,743 5.25 2,964 3.28 Camarines Norte 63,258 49,229 77.82 8,412 13.30 3,901 6.17 1,716 2.71 Camarines Sur 172,228 117,679 68.33 29,617 17.20 17,574 10.20 7,358 4.27 Catanduanes 24,152 15,886 65.78 4,749 19.66 2,740 11.34 777 3.22 Masbate 88,583 65,285 73.70 13,610 15.36 7,207 8.14 2,481 2.80 Sorsogon 65,843 50,304 76.40 9,283 14.10 3,959 6.01 2,297 3.49 Iriga City 11,106 10,432 93.93 542 4.88 54 0.49 78 0.70 Legazpi City 19,736 18,306 92.75 343 1.74 243 1.23 844 4.28 Ligao City 12,069 9,203 76.25 1,805 14.96 707 5.86 354 2.93 Masbate City 9,465 6,350 67.09 1,556 16.44 969 10.24 590 6.23 Naga City 26,175 24,630 94.10 897 3.43 324 1.24 324 1.24 Sorsogon City 19,470 16,542 84.96 1,647 8.46 603 3.10 678 3.48 Tabaco City 10,965 9,481 86.47 1,109 10.11 48 0.44 327 2.98
2018 Region V 598,730 468,052 78.17 75,398 12.59 36,732 6.13 18,548 3.10
Albay 84,077 69,147 82.24 8,657 10.30 3,961 4.71 2,312 2.75 Camarines Norte 63,295 50,864 80.36 7,589 11.99 3,407 5.38 1,435 2.27 Camarines Sur 170,279 119,615 70.25 27,885 16.38 15,984 9.39 6,795 3.99 Catanduanes 24,237 17,568 72.48 4,017 16.57 1,981 8.17 671 2.77 Masbate 82,636 62,706 75.88 11,957 14.47 5,498 6.65 2,475 3.00 Sorsogon 64,083 50,019 78.05 8,434 13.16 3,564 5.56 2,066 3.22 Iriga City 11,193 10,422 93.11 634 5.66 5 0.04 132 1.18 Legazpi City 22,216 20,904 94.09 436 1.96 243 1.09 633 2.85 Ligao City 11,815 9,748 82.51 1,370 11.60 455 3.85 242 2.05 Masbate City 9,744 6,911 70.93 1,416 14.53 780 8.00 637 6.54 Naga City 25,369 24,621 97.05 407 1.60 140 0.55 201 0.79 Sorsogon City 18,638 16,036 86.04 1,618 8.68 520 2.79 464 2.49 Tabaco City 11,148 9,491 85.14 978 8.77 194 1.74 485 4.35
Notes: Data is based on Operation Timbang results among 0-59 months old pre-school children received from LGUs and processed by the National Nutrition Council.1/ Length/Height-for-Age – reflects attained growth in length or height at the child’s age at a given time. This indicator can help identify children who are stunted (short) due to prolonged undernutrition or repeated illness. Children who are tall for their age can also be identified.2/ Normal – has a ±2SD (plus or minus 2 standard deviation) value, meaning the child’s height is within the normal limits.3/ Stunted/short – has a <-2SD (less than minus 2 standard deviation) value, meaning the child’s height is lower or below the normal height for his/her age.4/ Severely Stunted/short – has <-3SD (less than minus 3 standard deviation) value, meaning the child’s weight is very much lower the normal height for his/her age.5/ Tall – has a >+2SD (more than plus 2 standard deviation) value, meaning the child’s weight is higher than the normal height for his/her age.
Source: Department of Health - National Nutrition Council, Region V
Province/City Normal 2/ Stunted 3/Severely Tall 5/Stunted 4/
Number of children height
measured
9 - 21

Table 9.7CNUTRITIONAL STATUS OF PRE-SCHOOLERS BY PROVINCE/CITY USING WEIGHT FOR LENGTH/HEIGHT 1/
2017- 2018
Number Prevalence Number Prevalence Number Prevalence Number Prevalence Number Prevalence
2017 Region V 610,360 545,244 89.35 24,524 4.02 13,164 2.16 15,887 2.60 11,441 1.87
Albay 89,697 80,590 89.85 3,370 3.76 1,810 2.02 2,361 2.63 1,566 1.75 Camarines Norte 63,258 57,398 90.74 2,217 3.50 987 1.56 1,666 2.63 990 1.57 Camarines Sur 171,380 149,211 87.06 8,059 4.70 4,606 2.69 5,223 3.05 4,281 2.50 Catanduanes 24,021 21,077 87.74 1,147 4.77 611 2.54 686 2.86 500 2.08 Masbate 88,640 78,504 88.56 4,359 4.92 2,399 2.71 1,938 2.19 1,440 1.62 Sorsogon 64,504 57,187 88.66 3,020 4.68 1,367 2.12 1,636 2.54 1,294 2.01 Iriga City 11,106 10,907 98.21 167 1.50 4 0.04 19 0.17 9 0.08 Legazpi City 19,637 18,354 93.47 170 0.87 223 1.14 561 2.86 329 1.68 Ligao City 12,072 10,957 90.76 380 3.15 168 1.39 388 3.21 179 1.48 Masbate City 9,465 8,030 84.84 553 5.84 320 3.38 312 3.30 250 2.64 Naga City 26,121 25,480 97.55 344 1.32 128 0.49 120 0.46 49 0.19 Sorsogon City 19,394 17,558 90.53 371 1.91 436 2.25 640 3.30 389 2.01 Tabaco City 10,965 9,991 91.12 367 3.35 105 0.96 337 3.07 165 1.50
2018 Region V 598,303 544,443 91.00 20,701 3.46 8,640 1.44 14,646 2.45 9,873 1.65
Albay 83,981 77,038 91.73 2,571 3.06 1,119 1.33 1,961 2.34 1,292 1.54 Camarines Norte 63,296 59,049 93.29 1,589 2.51 595 0.94 1,198 1.89 865 1.37 Camarines Sur 170,025 151,094 88.87 6,883 4.05 3,006 1.77 5,234 3.08 3,808 2.24 Catanduanes 24,237 22,158 91.42 881 3.63 292 1.20 527 2.17 379 1.56 Masbate 82,630 74,409 90.05 3,594 4.35 1,625 1.97 1,813 2.19 1,189 1.44 Sorsogon 64,048 57,221 89.34 2,662 4.16 1,033 1.61 1,967 3.07 1,165 1.82 Iriga City 11,193 11,011 98.37 163 1.46 0 0.00 16 0.14 3 0.03 Legazpi City 22,219 21,006 94.54 305 1.37 174 0.78 474 2.13 260 1.17 Ligao City 11,815 10,922 92.44 360 3.05 117 0.99 304 2.57 112 0.95 Masbate City 9,744 8,197 84.12 594 6.10 383 3.93 289 2.97 281 2.88 Naga City 25,329 24,922 98.39 237 0.94 50 0.20 70 0.28 50 0.20 Sorsogon City 18,638 17,125 91.88 512 2.75 150 0.80 533 2.86 318 1.71 Tabaco City 11,148 10,291 92.31 350 3.14 96 0.86 260 2.33 151 1.35
Notes: Data is based on Operation Timbang results among 0-59 months old pre-school children received from LGUs and processed by the National Nutrition Council.1/ Weight-for-Length/Height - reflects body weight in proportion to attained growth in length or height. Weight-for-length/height help identify children with low weight-for-height who may be wasted/thin or severely wasted/thin.2/ Normal - has a ±2SD (plus or minus 2 standard deviation) value, meaning the child’s body weight in proportion to length/height or thinness is within the normal limits compared to the standard for children his/her weight-for-length/height.3/ Wasted/thin - has a <-2SD (less than minus 2 standard deviation) value, meaning the child’s body weight in proportion to length/height or thinness is low relative to the standard weight-for-length/height.4/ Severely wasted/thin - has a <-3SD (less than minus 3 standard deviation) value, meaning the child’s body weight in proportion to length/height or thinness is very low relative to the standard weight-for-length/height.5/ Overweight - has a >+2SD (more than plus 2 standard deviation) value, meaning the child’s body weight in proportion to length/height or fatness is high relative to the standard weight for his/her weight-for-length/height.6/ Obese - has a >+3SD (more than plus 3 standard deviation) value, meaning the child’s weight in proportion to length/height or fatness is very high relative to the normal weight-for-length/for his/her weight-for-length/height.
Source: Department of Health - National Nutrition Council, Region V
Province/City Normal 2/ Wasted 3/Severely Obese 6/Wasted 4/
Overweight 5/Number of
children weight and height measured
9 - 22

Table 9.8 RANKING OF CITIES/MUNICIPALITIES ACCORDING TO PREVALENCE OF MALNUTRITION2017
Underweight Wasting
AlbayBacacay 13.6 42 25.6 53 7.1 53 2.6 101Camalig 6.1 99 7.5 109 4.0 97 2.6 102Daraga 5.6 100 10.5 105 4.4 90 3.4 85Guinobatan 4.9 103 13.4 95 6.1 66 4.7 55Jovellar 20.3 5 34.8 11 10.6 9 5.4 36Legazpi City 2.8 111 3.0 113 2.0 111 4.5 62Libon 8.8 80 22.3 74 6.2 64 5.1 46Ligao City 8.5 83 20.8 79 4.5 89 4.7 56Malilipot 12.9 50 24.2 64 8.4 27 7.1 12Malinao 12 62 24.5 59 6.7 59 5.8 29Manito 14.4 34 28.9 31 11.7 5 8.5 7Oas 8.9 78 16.4 90 4.5 88 3.0 91Pioduran 6.6 96 18.9 85 4.0 96 3.0 89Polangui 4.6 105 17.8 89 3.3 104 6.2 23Rapu-Rapu 16.6 24 25.7 51 11.1 7 3.3 87Sto. Domingo 12.3 58 20.4 82 7.2 51 5.4 35Tabaco City 3.7 109 10.6 104 4.3 91 4.6 61Tiwi 2 113 8.2 108 2.0 110 2.8 97
Camarines NorteBasud 13.7 40 23.5 68 8.1 33 3.8 78Capalonga 10.1 73 25.3 56 5.9 71 5.1 45Daet 5.1 102 12.2 97 3.4 100 4.4 64Jose Panganiban 9.8 74 23.3 69 5.6 76 7.2 10Labo 2.7 112 6.7 110 3.1 105 1.7 107Mercedes 9.5 75 27.9 41 5.1 83 3.8 75Paracale 13.9 39 27.1 44 7.3 47 6.0 25San Lorenzo Ruiz 12.4 57 20.8 80 7.2 52 4.1 70San Vicente 13.9 38 28.1 39 4.6 86 4.0 74Sta. Elena 6.4 98 25.2 57 5.0 84 5.3 39Talisay 12.7 52 25.3 55 6.0 68 4.8 52Vinzons 13.3 45 23.8 67 5.6 75 2.9 92
Camarines SurBaao 11.8 64 27.8 42 8.1 36 7.2 11Balatan 22.3 2 43.3 3 11.1 8 9.2 5Bato 20.0 7 40.1 5 9.7 15 9.1 6Bombon 13.1 47 22.1 75 8.0 37 3.3 88Buhi 10.3 72 26.7 46 7.9 40 6.5 20Bula 10.3 71 18.3 87 6.8 58 6.6 16Cabusao 14.3 36 28.5 35 9.2 20 6.3 21Calabanga 19.6 8 34.2 13 7.4 46 4.6 58Camaligan 7.8 91 12.7 96 5.9 70 4.0 73Canaman 14.8 32 26.7 45 10.6 11 5.1 47Caramoan 18.9 10 34.3 12 14.3 3 4.9 50Del Gallego 14.2 37 29.5 27 7.0 54 5.5 32Gainza 17.9 12 38.4 6 6.4 61 6.3 22Garchitorena 17.1 19 35.7 8 5.3 80 3.8 77Goa 5.1 101 10.8 102 3.1 106 1.3 109Iriga City 4.0 108 5.4 111 1.5 113 0.3 114Lagonoy 10.6 69 33.8 15 8.6 25 6.8 13Libmanan 14.7 33 28.6 33 6.9 56 5.3 41Lupi 17.5 15 33.5 17 9.8 13 5.0 48Magarao 16.9 21 28.3 38 5.6 77 4.1 71Milaor 8.4 85 24.3 63 4.1 94 7.5 9Minalabac 17.4 16 32.1 20 8.1 34 5.7 31Nabua 12.3 59 28.5 36 7.5 45 10.8 2Naga City 2.0 114 4.6 112 1.8 112 0.6 112Ocampo 15.2 29 31.1 23 6.1 65 4.9 49Pamplona 12.6 56 24.7 58 8.0 38 5.8 28Pasacao 16.8 22 35.3 9 7.8 41 6.2 24
Note: Data is based on Operation Timbang results among 0-59 months old preschool children.
Source: Department of Health - National Nutrition Council, Region V
Rank Prevalence Rank Prevalence Rank Prevalence RankCity / MunicipalityStunting Overweight-Obese
Prevalence
9 - 23

Table 9.8 - Continued
RANKING OF CITIES/MUNICIPALITIES ACCORDING TO PREVALENCE OF MALNUTRITION2017
Underweight WastingRank Prevalence Rank Prevalence Rank Prevalence RankCity / Municipality
Stunting Overweight-Obese
Prevalence
Pili 4.8 104 10.0 106 3.0 108 2.3 104Presentacion 18.8 11 36.9 7 9.6 19 3.6 84Ragay 15.9 26 31.9 21 8.7 24 5.3 38Sagñay 7.5 92 16.4 91 5.3 81 2.2 105San Fernando 8.7 82 24.4 61 6.4 60 5.9 27San Jose 21.4 3 44.1 2 11.1 6 9.6 4Sipocot 13.4 43 29.2 29 7.6 43 7.5 8Siruma 13.0 49 11.1 100 8.2 32 4.2 67Tigaon 11.2 68 26.4 49 6.9 55 4.5 63Tinambac 16.7 23 34.1 14 8.3 29 5.3 37
CatanduanesBagamanoc 12.6 55 45.0 1 4.5 87 6.5 19Baras 9.3 76 42.6 4 3.4 102 1.3 108Bato 11.5 65 35.1 10 7.3 48 5.8 30Caramoran 22.9 1 33.7 16 8.2 31 3.8 76Gigmoto 19.3 9 31.5 22 15.9 1 3.4 86Pandan 12.2 60 28.4 37 5.7 73 2.9 93Panganiban 17.7 13 28.0 40 4.8 85 4.4 65San Andres 17.3 17 24.4 62 9.7 18 5.1 44San Miguel 20.2 6 24.0 66 7.3 50 10.0 3Viga 17.2 18 21.4 78 9.8 14 6.5 18Virac 12.2 61 18.7 86 5.5 79 4.6 60
MasbateAroroy 14.9 30 30.5 25 10.2 12 6.5 17Baleno 16.3 25 25.6 52 12.9 4 3.7 80Balud 14.9 31 24.4 60 6.9 57 2.9 94Batuan 8.8 81 20.5 81 5.3 82 4.6 57Cataingan 12.6 53 23.1 72 8.2 30 4.7 54Cawayan 12.9 51 24.1 65 7.3 49 2.9 95Claveria 15.8 27 25.4 54 8.8 23 4.6 59Dimasalang 17.1 20 30.6 24 9.7 16 3.7 81Esperanza 13.0 48 28.8 32 3.7 99 0.7 111Mandaon 8.5 84 11.8 98 7.6 44 1.0 110Masbate City 14.3 35 26.7 47 9.2 21 5.9 26Milagros 8.0 89 19.5 84 4.2 92 4.1 69Mobo 8.9 79 19.8 83 5.5 78 2.6 100Monreal 20.8 4 32.1 19 14.4 2 3.7 83Palanas 3.7 110 10.6 103 3.4 101 2.4 103Pio V. Corpuz 15.6 28 28.9 30 6.0 67 4.3 66Placer 17.6 14 32.6 18 9.7 17 5.3 42San Fernando 13.3 44 30.1 26 3.1 107 2.1 106San Jacinto 11.3 67 26.2 50 7.9 39 6.6 15San Pascual 4.3 107 0.7 114 0.8 114 0.3 113Uson 11.8 63 27.2 43 9.1 22 4.7 53
SorsogonBarcelona 8.1 88 14.1 94 2.2 109 11.1 1Bulan 7.3 93 14.6 93 7.7 42 3.7 79Bulusan 8.2 86 23.2 70 5.8 72 5.2 43Casiguran 8.1 87 17.8 88 8.5 26 6.7 14Castilla 9.1 77 26.6 48 8.1 35 4.0 72Donsol 12.6 54 29.3 28 6.3 62 2.9 96Gubat 6.6 97 14.8 92 4.0 98 3.7 82Irosin 10.5 70 23.2 71 5.6 74 4.2 68Juban 11.4 66 21.7 77 8.3 28 4.8 51Magallanes 13.7 41 22.8 73 6.2 63 3.0 90Matnog 6.7 95 8.6 107 10.6 10 5.5 33Pilar 8.0 90 21.8 76 6.0 69 5.5 34Prieto Diaz 13.2 46 28.5 34 3.3 103 2.8 98Sta. Magdalena 6.8 94 11.0 101 4.1 95 2.7 99Sorsogon City 4.5 106 11.6 99 4.1 93 5.3 40
9 - 24

Table 9.8 - Continued
RANKING OF CITIES/MUNICIPALITIES ACCORDING TO PREVALENCE OF MALNUTRITION2018
Underweight Wasting
AlbayBacacay 11.4 52 16.9 86 4.5 79 1.6 98Camalig 4.3 101 11.4 97 3.5 90 1.9 94Daraga 3.8 104 8.7 105 3.0 95 1.2 103Guinobatan 4.4 99 10.6 100 5.3 59 1.5 100Jovellar 15.0 17 30.5 18 6.1 38 1.9 94Legazpi City 2.4 109 3.1 111 2.2 103 1.6 98Libon 8.7 77 21.2 66 5.3 58 2.1 92Ligao City 7.4 87 15.5 88 4.0 84 1.3 101Malilipot 15.4 15 25.6 38 9.9 6 3.0 75Malinao 10.1 66 21.0 67 5.1 63 2.7 81Manito 5.2 97 7.2 106 2.3 102 0.6 109Oas 7.3 89 13.0 93 4.2 81 1.9 94Pioduran 5.7 94 20.2 74 2.4 100 0.3 111Polangui 3.7 105 12.5 94 1.4 109 1.2 103Rapu-Rapu 14.6 23 19.9 76 9.2 9 0.9 106Sto. Domingo 11.9 46 26.9 28 6.1 39 3.3 71Tabaco City 3.8 103 10.5 101 4.0 86 2.4 88Tiwi 2.4 110 3.1 110 1.5 108 1.9 94
Camarines NorteBasud 12.1 43 22.5 63 5.0 65 4.2 53Capalonga 12.8 34 32.3 13 4.7 72 4.0 59Daet 3.7 107 9.1 103 2.1 105 2.5 87Jose Panganiban 9.2 73 23.8 51 4.0 84 3.4 68Labo 2.1 111 3.2 109 0.6 113 1.0 105Mercedes 11.3 53 25.4 40 5.6 51 4.8 40Paracale 15.0 19 29.0 21 6.2 35 5.4 27San Lorenzo Ruiz 6.4 92 18.8 78 2.1 104 3.0 75San Vicente 10.0 68 22.7 58 2.8 98 4.3 51Sta. Elena 5.3 96 18.4 80 2.8 96 2.3 89Talisay 13.1 31 26.0 35 5.9 44 3.1 73Vinzons 12.0 44 22.5 62 5.9 45 5.5 25
Camarines SurBaao 10.6 57 23.9 50 7.1 21 8.2 1Balatan 14.6 24 36.1 4 5.5 55 7.7 2Bato 17.1 8 34.1 8 7.1 20 7.6 4Bombon 14.0 27 25.7 37 10.2 3 7.5 5Buhi 11.7 48 30.9 15 6.7 30 7.3 7Bula 5.7 93 17.2 85 6.3 33 7.2 9Cabusao 12.1 41 26.4 30 8.5 13 7.1 10Calabanga 15.9 10 32.9 10 5.9 43 6.8 12Camaligan 9.2 74 21.9 64 6.3 32 6.5 13Canaman 12.4 40 23.2 54 6.8 27 6.5 13Caramoan 17.0 9 36.7 3 9.9 6 7.7 2Del Gallego 10.5 60 24.4 48 7.1 22 5.6 22Gainza 20.1 2 34.1 7 12.6 1 7.3 7Garchitorena 25.6 1 46.2 1 9.6 8 5.8 19Goa 3.3 108 2.5 112 1.6 106 5.7 21Iriga City 3.7 105 5.7 108 1.5 107 5.6 22Lagonoy 18.5 5 34.5 5 5.2 62 5.4 27Libmanan 14.0 28 26.3 31 7.1 22 5.4 27Lupi 15.9 12 32.7 11 6.0 41 5.3 31Magarao 14.8 21 27.0 27 7.3 17 5.2 32Milaor 9.7 71 24.9 44 4.7 72 5.1 35Minalabac 14.6 24 30.5 17 6.1 40 4.9 39Nabua 5.3 95 12.2 95 3.1 94 4.8 40Naga City 1.8 112 2.2 113 1.1 111 4.7 43Ocampo 12.7 35 28.2 22 4.7 74 4.5 46Pamplona 11.7 47 23.2 53 4.7 71 4.5 46Pasacao 14.2 26 32.5 12 3.8 88 4.4 49
Note: Data is based on Operation Timbang results among 0-59 months old preschool children.
Source: Department of Health - National Nutrition Council, Region V
Prevalence Rank Prevalence Rank Prevalence Rank Prevalence RankCity / MunicipalityStunting Overweight-Obese
9 - 25

Table 9.8 - Continued
RANKING OF CITIES/MUNICIPALITIES ACCORDING TO PREVALENCE OF MALNUTRITION2018
Underweight WastingPrevalence Rank Prevalence Rank Prevalence Rank Prevalence RankCity / Municipality
Stunting Overweight-Obese
Pili 3.9 102 10.9 99 2.5 99 4.2 53Presentacion 18.9 3 37.1 2 6.7 28 4.1 56Ragay 12.9 32 31.6 14 3.4 91 4.1 56Sagñay 10.5 58 21.4 65 5.8 47 3.6 64San Fernando 8.3 79 20.3 72 6.4 31 3.6 64San Jose 11.1 54 28.0 24 4.1 82 3.1 73Sipocot 12.8 33 25.9 36 8.0 16 2.6 85Siruma 18.6 4 30.6 16 8.7 11 2.0 93Tigaon 10.9 55 22.8 57 5.8 49 0.5 110Tinambac 13.3 30 33.6 9 5.0 66 0.2 113
CatanduanesBagamanoc 12.1 41 24.4 47 4.8 70 5.2 32Baras 8.5 78 8.8 104 2.8 96 1.3 101Bato 9.9 70 17.3 84 4.9 68 3.8 62Caramoran 17.2 7 34.2 6 5.3 57 2.9 78Gigmoto 15.5 14 25.6 39 5.5 54 2.7 81Pandan 12.6 38 17.7 81 2.4 101 2.3 89Panganiban 10.3 63 23.1 55 5.1 63 6.3 17San Andres 18.0 6 30.0 19 3.2 93 3.9 61San Miguel 14.8 22 28.1 23 8.2 15 4.5 46Viga 15.6 13 27.4 26 6.2 35 3.0 75Virac 11.5 51 23.3 52 5.3 61 4.8 40
MasbateAroroy 12.6 37 27.7 25 8.3 14 6.4 15Baleno 11.7 48 20.3 71 11.0 2 4.6 44Balud 15.2 16 26.1 32 7.0 24 2.6 85Batuan 10.3 65 24.1 49 6.7 29 7.0 11Cataingan 13.8 29 24.5 45 8.5 12 5.2 32Cawayan 12.7 35 26.0 34 7.0 25 4.0 59Claveria 15.0 17 26.1 32 9.1 10 3.4 68Dimasalang 8.8 76 25.4 41 4.1 83 3.5 67Esperanza 4.8 98 9.4 102 1.4 110 0.3 111Mandaon 7.6 81 11.2 98 5.8 46 0.7 108Masbate City 12.5 39 22.5 61 10.0 4 5.8 19Milagros 7.6 83 24.5 46 7.1 19 5.4 27Mobo 9.1 75 20.3 73 5.6 51 2.7 81Monreal 11.6 50 25.1 42 5.8 48 4.1 56Palanas 1.4 114 6.6 107 1.0 112 0.8 107Pio V. Corpuz 10.0 67 22.7 60 4.9 67 2.8 80Placer 10.9 56 18.9 77 6.0 42 2.7 81San Fernando 15.9 11 29.8 20 4.9 68 3.7 63San Jacinto 10.5 59 25.1 43 5.4 56 5.1 35San Pascual 1.4 113 0.2 114 0.3 114 0.1 114Uson 9.4 72 20.6 70 5.7 50 2.3 89
SorsogonBarcelona 7.6 81 14.2 91 4.5 80 5.1 35Bulan 7.5 84 14.6 89 5.3 59 6.3 17Bulusan 7.3 88 15.9 87 4.6 78 5.1 35Casiguran 7.4 86 17.7 82 6.9 26 7.5 5Castilla 6.7 91 20.2 74 5.6 53 3.6 64Donsol 9.9 69 20.9 68 4.6 75 3.3 71Gubat 7.5 85 13.3 92 4.6 77 4.2 53Irosin 11.9 45 22.7 59 6.3 34 4.4 49Juban 10.4 61 18.5 79 6.2 37 5.5 25Magallanes 10.3 64 22.8 56 3.2 92 2.9 78Matnog 14.9 20 26.6 29 10.0 5 6.4 15Pilar 8.2 80 17.4 83 7.2 18 5.6 22Prieto Diaz 10.4 62 20.8 69 4.6 76 3.4 68Sta. Magdalena 7.1 90 14.3 90 4.0 87 4.3 51Sorsogon City 4.3 100 11.5 96 3.6 89 4.6 44
9 - 26

Table 9.9COVERAGE OF FULLY IMMUNIZED CHILDREN BY PROVINCE/CITY2013 - 2018
Province/City Target Number Percent Target Number PercentPopulation Covered Population Covered
Region V 153,649 126,877 82.6 155,360 123,490 79.5
Albay 29,282 24,198 82.6 29,791 24,246 81.4 Camarines Norte 15,636 12,322 78.8 15,543 12,360 79.5 Camarines Sur 44,442 35,542 80.0 44,285 33,497 75.6 Catanduanes 6,969 5,712 82.0 7,026 5,357 76.2 Masbate 23,420 20,513 87.6 24,117 19,198 79.6 Sorsogon 20,787 16,554 79.6 21,092 17,094 81.0 Iriga City 3,043 2,372 77.9 3,072 2,416 78.6 Legazpi City 5,241 4,970 94.8 5,226 4,371 83.6 Naga City 4,830 4,694 97.2 5,209 4,951 95.0
Province/City Target Number Percent Target Number PercentPopulation Covered Population Covered
Region V 157,590 93,909 59.6 159,854 82,382 51.5
Albay 30,137 17,109 56.8 30,487 14,402 47.2 Camarines Norte 15,761 12,427 78.8 15,983 10,655 66.7 Camarines Sur 44,944 23,119 51.4 45,614 18,187 39.9 Catanduanes 7,119 5,137 72.2 7,213 4,809 66.7 Masbate 24,510 15,288 62.4 24,910 14,672 58.9 Sorsogon 21,361 12,003 56.2 21,633 12,100 55.9 Iriga City 3,125 2,007 64.2 3,178 1,668 52.5 Legazpi City 5,301 3,552 67.0 5,378 3,454 64.2 Naga City 5,332 3,267 61.3 5,458 2,435 44.6
Note: Fully Immunized Child - refers to the child who received 3 doses of OPV, 3 doses of DPT, one dose of BCG and one dose of measles vaccines before reaching one year old.
Source: Department of Health, Regional Office V
2014
2016 r2015
2013
9 - 27

Table 9.9 - Continued
COVERAGE OF FULLY IMMUNIZED CHILDREN BY PROVINCE/CITY2013 - 2018
Province/City Target Number Percent Target Number PercentPopulation Covered Population Covered
Region V 169,200 98,688 58.3 162,459 104,853 64.5
Albay 32,250 16,603 51.5 31,280 17,886 57.2 Camarines Norte 17,007 9,510 55.9 16,389 12,876 78.6 Camarines Sur 48,225 26,408 54.8 46,141 26,937 58.4 Catanduanes 7,750 5,288 68.2 7,276 5,178 71.2 Masbate 25,866 17,028 65.8 25,005 16,613 66.4 Sorsogon 23,407 15,183 64.9 22,234 15,732 70.8 Iriga City 3,277 1,605 49.0 3,135 1,721 54.9 Legazpi City 5,671 3,500 61.7 5,501 4,213 76.6 Naga City 5,747 3,563 62.0 5,498 3,697 67.2
r - revised
Figure 9.2 COVERAGE OF FULLY IMMUNIZED CHILDRENBY PROVINCE/CITY, 2018
20182017
0 50 100 150 200 250 300 350 400 450 500
Naga City
Legazpi City
Iriga City
Sorsogon
Masbate
Catanduanes
Camarines Sur
Camarines Norte
Albay
Hundreds
Target Population
Actual Coverage
9 - 28

10 - 1
Data on the country's educational system are essential in the planning, implementation and supervision of programs in this field. The primary goal of programs is to develop a meaningful and efficient educational system in the country. This is a priority thrust of the government today. A specific objective of programs and systems put in place is to update the quality of our educational system at all levels. Education is indispensable in bringing about the desired behavioral and attitudinal changes in the population to effect socioeconomic development. The far-reaching and enduring effects of a literate citizenry on individual and societal growth and progress call for serious efforts to continuously improve and promote accessibility of our educational facilities and services to the people. More so, the responsiveness of our educational system to changes in the socioeconomic spheres and the demands of development initiatives pose a challenge to our decision makers and educators. To address these challenges in the most efficient and effective fashion, an adequate and timely supply of data focusing on the levels and state of resources and facilities and the accomplishments of our educational system is indeed vital. This chapter presents data on important aspects of the educational system at the regional down to the division level. The statistics presented include enrolment and number of schools and teachers and graduates by level and government or private. The chapter contains several derived indicators, such as student-teacher ratio and performance indicators, such as enrolment, retention, survival, completion, dropout, transition, and graduation rates. This chapter also shows data on the simple and functional literacy rates and highest grade completed of the population and the school-going age population. The basic sources of data are the Department of Education (DepEd), the Commission on Higher Education (CHED) and the Philippine Statistics Authority (PSA). The DepEd and CHED compile, tabulate, analyze and release data pertaining to the educational system by level and derived performance indicators based on the administrative reporting systems of these agencies. The PSA, on the other hand, generates the data on literacy, school-going age population and the educational attainment of household population using the results of its household surveys, census of population and the Functional Literacy, Education and Mass Media Survey. Sector Highlights
Total enrolment in elementary schools in the thirteen schools divisions of the region declined by
5.7 percent between SY 2019-2020 and SY 2020-2021. A decrease of 29 percent was noted in private schools.
Between SY 2019-2020 and SY 2020-2021, enrolment in the secondary schools across the region declined by 7.8 percent with enrolment in public schools decreasing by 7.7 percent while enrolment in private schools declined by 8.1 percent.
On the average, there were 24 pupils per teacher in government elementary schools in SY 2019-
2020, and 24 students for every teacher in public junior high schools. Ratio in government elementary schools improved over the previous school year’s figures with all thirteen school divisions posting lower ratios. The City Schools Division of Naga City, Legazpi City and Tabaco City were most deficient in public elementary school teachers at a ratio of 1:30 and 1:28 while Ligao City schools division was the most wanting in junior high school teachers at a ratio of 1:27.
Eighty seven in every 100 elementary school aged children were enrolled in the region’s
elementary schools in SY 2020-2021, lower than the 92.68 percent participation rate registered in the previous school year.
Chapter 10 EDUCATION

10 - 2
Sector Highlights (Continued) Of the first grade entrants to the elementary schools in the region five years before, 96.44 percent
were able to reach sixth grade in SY 2019-2020, a deceleration from the 97.1 percent cohort survival rate registered a year ago.
About 75.1 percent of the junior high school age population in the Bicol Region was enrolled in
SY 2020-2021, a deceleration from the 82.3 percent participation rate in SY 2019-2020. Enrolment in the tertiary institutions in the Bicol Region increased by 13.4 percent between SY
2018-2019 and SY 2019-2020. More students were enrolled in Teacher Training and Education. Less were enrolled in Medical and Health Related Programs and Maritime Education. Teacher Training and Education accounted for 30.1 percent of the total enrolment in the region.
More graduates were noted in Teacher Training and Education accounting for 30.4 percent of the total graduates in the region.
The proportion of functionally literate Bicolanos aged 10 to 64 years old increased substantially from 87.1 percent in 2013 to 88.9 percent in 2019.

Table 10.1 Number of Government and Private Schools by Level of Education andSchools Division, SY 2014-2015 to SY 2020-2021 10 - 4
Table 10.2 Number of Teachers in Government Schools by Level of Education andSchools Division, SY 2013-2014 to SY 2020-2021 10 - 8
Table 10.3 Enrolment in Government and Private Schools by Level of Education andSchools Division, SY 2014-2015 to SY 2020-2021 10 - 10
Table 10.4 Teacher-Student Ratio in Government Elementary and Secondary Schoolsby Schools Division, SY 2012-2013 to SY 2019-2020 10 - 22
Table 10.5A Performance Indicators in Elementary Schools by SchoolsDivision, SY 2017-2018 to SY 2020-2021 10 - 23
Table 10.5B Performance Indicators in Junior High Schools by SchoolsDivision, SY 2017-2018 to SY 2020-2021 10 - 26
Table 10.6A Enrolment in Tertiary Education by Program, SY 2013-2014 toSY 2019-2020 10 - 28
Table 10.6B Graduates in Tertiary Education by Program, SY 2012-2013 toSY 2018-2019 10 - 28
Table 10.7A Simple Literacy and Functional Literacy of the Household Populationby Sex, Urban-Rural, Region V, 2008, 2013 and 2019 10 - 29
Table 10.7B Functional Literacy Rate of Population 10-64 Years Oldby Highest Educational Attainment, Region V, 2008, 2013 and 2019 10 - 29
Table 10.8 School-Going Age Population by Age Group and ProvinceCensus Years 1970 - 2000 10 - 30
Table 10.9 Highest Grade Completed of Private Household Population 5 Years Oldand Over by Province/City, Census Years 2000 - 2015 10 - 31
Figure 10.1 Number of Teachers in Public Junior High Schools by Schools Division,Region V, SY 2019-2020 to SY 2020-2021 10 - 9
10 - 3
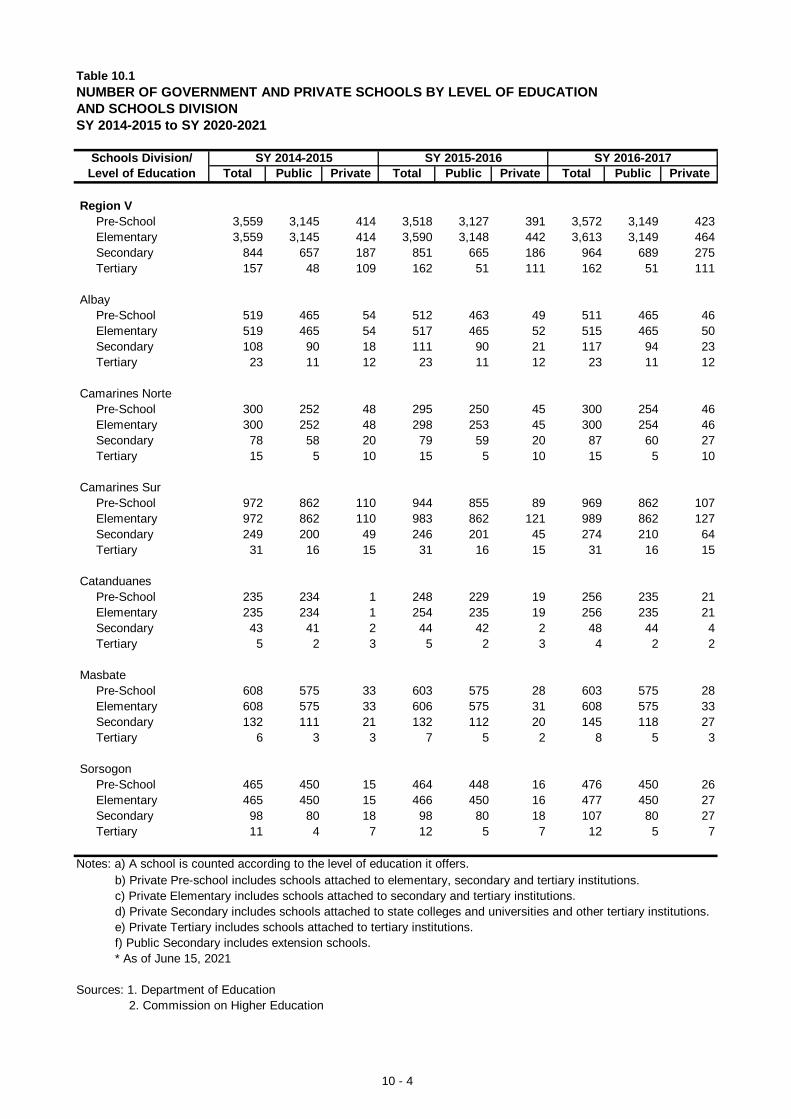
Table 10.1 NUMBER OF GOVERNMENT AND PRIVATE SCHOOLS BY LEVEL OF EDUCATIONAND SCHOOLS DIVISIONSY 2014-2015 to SY 2020-2021
Schools Division/ SY 2014-2015 SY 2015-2016 SY 2016-2017Level of Education Total Public Private Total Public Private Total Public Private
Region VPre-School 3,559 3,145 414 3,518 3,127 391 3,572 3,149 423Elementary 3,559 3,145 414 3,590 3,148 442 3,613 3,149 464Secondary 844 657 187 851 665 186 964 689 275Tertiary 157 48 109 162 51 111 162 51 111
AlbayPre-School 519 465 54 512 463 49 511 465 46Elementary 519 465 54 517 465 52 515 465 50Secondary 108 90 18 111 90 21 117 94 23Tertiary 23 11 12 23 11 12 23 11 12
Camarines NortePre-School 300 252 48 295 250 45 300 254 46Elementary 300 252 48 298 253 45 300 254 46Secondary 78 58 20 79 59 20 87 60 27Tertiary 15 5 10 15 5 10 15 5 10
Camarines SurPre-School 972 862 110 944 855 89 969 862 107Elementary 972 862 110 983 862 121 989 862 127Secondary 249 200 49 246 201 45 274 210 64Tertiary 31 16 15 31 16 15 31 16 15
CatanduanesPre-School 235 234 1 248 229 19 256 235 21Elementary 235 234 1 254 235 19 256 235 21Secondary 43 41 2 44 42 2 48 44 4Tertiary 5 2 3 5 2 3 4 2 2
MasbatePre-School 608 575 33 603 575 28 603 575 28Elementary 608 575 33 606 575 31 608 575 33Secondary 132 111 21 132 112 20 145 118 27Tertiary 6 3 3 7 5 2 8 5 3
SorsogonPre-School 465 450 15 464 448 16 476 450 26Elementary 465 450 15 466 450 16 477 450 27Secondary 98 80 18 98 80 18 107 80 27Tertiary 11 4 7 12 5 7 12 5 7
Notes: a) A school is counted according to the level of education it offers. b) Private Pre-school includes schools attached to elementary, secondary and tertiary institutions. c) Private Elementary includes schools attached to secondary and tertiary institutions. d) Private Secondary includes schools attached to state colleges and universities and other tertiary institutions. e) Private Tertiary includes schools attached to tertiary institutions. f) Public Secondary includes extension schools. * As of June 15, 2021
Sources: 1. Department of Education 2. Commission on Higher Education
10 - 4

SY 2017-2018 SY 2018-2019 SY 2019-2020 SY 2020-2021Total Public Private Total Public Private Total Public Private Total Public* Private
3,637 3,165 472 3,623 3,150 473 3,604 3,154 450 3,566 3,156 4103,637 3,165 472 3,623 3,150 473 3,481 3,158 323 3,474 3,161 313
889 688 201 904 699 205 1,024 729 295 1,057 746 311163 51 112 169 55 114 170 56 114 … … …
514 465 49 514 465 49 511 465 46 503 465 38514 465 49 514 465 49 502 465 37 500 465 35108 90 18 108 90 18 121 94 27 123 95 2823 11 12 24 11 13 24 11 13 … … …
305 258 47 300 253 47 298 254 44 288 253 35305 258 47 300 253 47 281 254 27 280 254 2682 62 20 88 64 24 105 67 38 108 70 3815 5 10 17 6 11 18 6 12 … … …
1,000 867 133 995 864 131 989 863 126 991 863 1281,000 867 133 995 864 131 970 865 105 971 865 106
270 214 56 275 219 56 296 225 71 310 229 8131 16 15 35 19 16 36 20 16 … … …
259 238 21 255 234 21 256 234 22 252 234 18259 238 21 255 234 21 241 235 6 240 235 543 42 1 44 42 2 47 43 4 48 43 54 2 2 4 2 2 4 2 2 … … …
608 575 33 609 575 34 607 576 31 612 579 33608 575 33 609 575 34 598 576 22 602 579 23141 120 21 147 123 24 160 130 30 167 134 33
9 5 4 9 5 4 9 5 4 … … …
480 450 30 483 450 33 482 450 32 479 450 29480 450 30 483 450 33 466 450 16 466 450 16102 81 21 102 81 21 108 83 25 110 85 2512 5 7 12 5 7 11 5 6 … … …
10 - 5

Table 10.1 - ContinuedNUMBER OF GOVERNMENT AND PRIVATE SCHOOLS BY LEVEL OF EDUCATIONAND SCHOOLS DIVISIONSY 2014-2015 to SY 2020-2021
Schools Division/ SY 2014-2015 SY 2015-2016 SY 2016-2017Level of Education Total Public Private Total Public Private Total Public Private
Iriga CityPre-School 61 40 21 62 40 22 62 40 22Elementary 61 40 21 65 40 25 64 40 24Secondary 20 12 8 20 12 8 26 13 13Tertiary 8 - 8 8 0 8 7 0 7
Legazpi CityPre-School 70 43 27 69 43 26 71 44 27Elementary 70 43 27 71 44 27 71 44 27Secondary 29 13 16 31 14 17 38 14 24Tertiary 14 1 13 14 1 13 15 1 14
Ligao City Pre-School 68 55 13 67 55 12 68 55 13Elementary 68 55 13 68 55 13 68 55 13Secondary 13 10 3 14 11 3 18 12 6Tertiary 3 1 2 3 1 2 3 1 2
Masbate City Pre-School 45 34 11 45 34 11 45 34 11Elementary 45 34 11 45 34 11 45 34 11Secondary 14 8 6 14 8 6 16 8 8Tertiary 5 - 5 6 0 6 6 0 6
Naga CityPre-School 73 29 44 73 29 44 72 29 43Elementary 73 29 44 76 29 47 76 29 47Secondary 20 8 12 21 9 12 30 9 21Tertiary 16 2 14 18 2 16 18 2 16
Sorsogon City Pre-School 84 67 17 81 67 14 81 67 14Elementary 84 67 17 82 67 15 82 67 15Secondary 27 17 10 28 18 10 34 18 16Tertiary 13 2 11 13 2 11 13 2 11
Tabaco CityPre-School 59 39 20 55 39 16 58 39 19Elementary 59 39 20 59 39 20 62 39 23Secondary 13 9 4 13 9 4 24 9 15Tertiary 7 1 6 7 1 6 7 1 6
10 - 6

SY 2017-2018 SY 2018-2019 SY 2019-2020 SY 2020-2021Total Public Private Total Public Private Total Public Private Total Public* Private
64 40 24 64 40 24 62 40 22 56 40 1664 40 24 64 40 24 58 40 18 57 40 1720 12 8 20 12 8 27 13 14 28 14 147 0 7 7 0 7 7 0 7 … … …
71 45 26 70 44 26 69 44 25 69 44 2571 45 26 70 44 26 67 45 22 67 45 2230 13 17 28 13 15 37 14 23 39 14 2515 1 14 15 1 14 15 1 14 … … …
68 55 13 68 55 13 68 55 13 65 55 1068 55 13 68 55 13 64 55 9 63 55 816 12 4 16 12 4 19 12 7 19 12 73 1 2 3 1 2 3 1 2 … … …
44 34 10 44 34 10 46 36 10 46 36 1044 34 10 44 34 10 44 36 8 44 36 815 8 7 14 8 6 15 8 7 15 8 76 0 6 5 0 5 5 0 5 … … …
77 29 48 77 29 48 73 29 44 71 29 4277 29 48 77 29 48 59 29 30 57 29 2820 8 12 21 9 12 31 9 22 32 9 2318 2 16 18 2 16 18 2 16 … … …
86 70 16 84 68 16 83 68 15 76 68 886 70 16 84 68 16 81 68 13 77 68 928 17 11 27 17 10 37 22 15 36 23 1313 2 11 13 2 11 13 2 11 … … …
61 39 22 60 39 21 60 40 20 58 40 1861 39 22 60 39 21 50 40 10 50 40 1014 9 5 14 9 5 21 9 12 22 10 127 1 6 7 1 6 7 1 6 … … …
10 - 7

Table 10.2 NUMBER OF TEACHERS IN GOVERNMENT SCHOOLS BY LEVEL OF EDUCATIONAND SCHOOLS DIVISIONSY 2013-2014 to SY 2020-2021
Schools Division/ SY 2013- SY 2014- SY 2015- SY 2016- SY 2017- SY 2018- SY 2019- SY 2020-Level of Education 2014 2015 2016 2017 2018 2019 2020 2021
Region VKinder 882 1,439 1,545 981 3,263 38,812 39,039 39,089Elementary 27,538 28,193 34,292 31,573 32,437 20,606 20,655 20,810Secondary 12,166 15,268 16,624 16,327 17,150 6,171 6,638 6,811
AlbayKinder 218 404 361 240 400 5,512 5,534 5,542Elementary 3,696 3,794 4,866 4,474 4,587 3,112 3,124 3,143Secondary 2,056 2,390 2,514 2,514 2,616 955 1,013 1,032
Camarines NorteKinder 82 132 36 66 295 3,588 3,612 3,635Elementary 2,474 2,655 2,936 2,725 2,835 1,968 1,972 1,979Secondary 1,091 1,477 1,592 1,591 1,641 496 529 540
Camarines SurKinder 195 306 568 244 914 10,805 10,853 10,858Elementary 7,464 7,561 9,556 8,964 9,215 5,651 5,651 5,744Secondary 3,170 4,083 4,437 4,437 4,655 1,714 1,880 1,928
CatanduanesKinder 17 121 … 23 220 2,159 2,163 2,165Elementary 1,824 1,739 2,047 1,751 1,775 1,077 1,086 1,089Secondary 733 849 920 919 951 380 415 428
MasbateKinder 150 173 147 147 594 6,663 6,743 6,748Elementary 4,639 4,859 5,903 5,611 5,789 2,766 2,780 2,786Secondary 1,429 1,977 2,224 2,224 2,362 853 894 895
SorsogonKinder 51 110 162 105 418 4,414 4,435 4,437Elementary 3,294 3,311 4,004 3,699 3,804 2,481 2,485 2,489Secondary 1,525 1,816 2,073 1,925 1,998 715 787 819
Iriga CityKinder 20 21 14 14 44 600 602 603Elementary 484 490 558 430 433 355 356 357Secondary 226 268 293 293 301 77 88 92
Legazpi CityKinder 18 37 54 28 80 976 978 978Elementary 726 740 838 726 747 543 545 549Secondary 290 385 440 293 425 156 161 171
Notes: a) A school is counted according to the level of education it offers. b) Kinder includes schools attached to elementary, secondary and tertiary institutions. c) Elementary includes schools attached to secondary and tertiary institutions. d) Secondary includes schools attached to state colleges and universities and other tertiary institutions. e) SY 2018-2019 onwards, kinder includes elementary teachers; elementary refers to JHS teachers and secondary refers to SHS teachers.
Source: Department of Education
10 - 8

Table 10.2 - ContinuedNUMBER OF TEACHERS IN GOVERNMENT SCHOOLS BY LEVEL OF EDUCATIONAND SCHOOLS DIVISIONSY 2013-2014 to SY 2020-2021
Schools Division/ SY 2013- SY 2014- SY 2015- SY 2016- SY 2017- SY 2018- SY 2019- SY 2020-Level of Education 2014 2015 2016 2017 2018 2019 2020 2021
Ligao City Kinder 24 37 47 28 64 747 751 751Elementary 516 501 624 558 568 430 432 434Secondary 263 334 350 350 370 141 145 149
Masbate City Kinder 21 15 17 15 50 662 664 665Elementary 482 493 612 546 564 367 367 368Secondary 205 254 286 286 287 107 107 111
Naga CityKinder 34 25 29 18 71 934 945 948Elementary 688 691 807 675 688 625 625 636Secondary 411 519 531 531 540 206 216 227
Sorsogon City Kinder 27 28 52 28 62 987 991 991Elementary 767 777 884 800 814 611 612 611Secondary 386 459 489 489 507 190 206 213
Tabaco City Kinder 25 30 58 25 51 765 768 768Elementary 484 582 657 614 618 620 620 625Secondary 381 457 475 475 497 181 197 206
Figure 10.1 NUMBER OF TEACHERS IN PUBLIC JUNIOR HIGH SCHOOLSBY SCHOOLS DIVISION, REGION V, SY 2019-2020 to SY 2020-2021
0 1,000 2,000 3,000 4,000 5,000 6,000 7,000
Tabaco City
Sorsogon City
Naga City
Masbate City
Ligao City
Legazpi City
Iriga City
Sorsogon
Masbate
Catanduanes
Camarines Sur
Camarines Norte
Albay
Number of Teachers
Scho
ols
Div
isio
n
SY 2019-2020
SY 2020-2021
10 - 9

Table 10.3 ENROLMENT IN GOVERNMENT AND PRIVATE SCHOOLS BY LEVEL OF EDUCATIONAND SCHOOLS DIVISIONSY 2014-2015 to SY 2020-2021
Schools Division/ SY 2014-2015 SY 2015-2016 SY 2016-2017Grade Level Total Public Private Total Public Private Total Public Private
Region V
Pre-School 145,909 130,093 15,816 147,370 131,324 16,046 122,944 114,726 8,218
Elementary 996,280 962,205 34,075 975,130 941,557 33,573 949,170 914,407 34,763Grade I 157,731 151,271 6,460 145,562 139,641 5,921 146,462 140,356 6,106Grade II 162,481 156,415 6,066 152,714 146,910 5,804 141,637 135,756 5,881Grade III 193,643 187,744 5,899 160,370 154,716 5,654 151,060 145,142 5,918Grade IV 173,724 168,240 5,484 188,369 182,907 5,462 157,832 152,163 5,669Grade V 159,361 154,328 5,033 170,500 165,261 5,239 183,471 178,026 5,445Grade VI 149,340 144,207 5,133 155,212 150,450 4,762 166,253 161,045 5,208Grade VII - - - 391 - 391 - - -Non-Graded - - - 2,012 1,672 340 2,455 1,919 536
Secondary 488,411 426,547 61,864 497,592 437,533 60,059 505,356 452,526 52,830First Year 142,232 125,088 17,144 144,557 127,813 16,744 148,589 134,194 14,395Second Year 128,223 112,114 16,109 132,003 116,400 15,603 133,128 119,331 13,797Third Year 113,472 98,920 14,552 118,180 103,700 14,480 119,165 106,410 12,755Fourth Year 104,312 90,276 14,036 102,137 89,054 13,083 104,452 92,569 11,883Non-Graded - - - - - - - - -Grade 11 23 - 23 637 488 149 22 22 -Grade 12 - - - 78 78 - - - -
Albay
Pre-School 19,853 17,769 2,084 21,276 19,416 1,860 14,905 14,179 726
Elementary 142,802 139,845 2,957 137,053 134,069 2,984 133,549 130,520 3,029Grade I 23,035 22,516 519 20,058 19,487 571 21,424 20,875 549Grade II 21,912 21,316 596 21,828 21,356 472 19,455 18,923 532Grade III 27,931 27,388 543 21,701 21,144 557 21,582 21,102 480Grade IV 24,729 24,275 454 26,719 26,188 531 21,237 20,717 520Grade V 23,070 22,669 401 24,087 23,648 439 25,883 25,365 518Grade VI 22,125 21,681 444 22,335 21,934 401 23,546 23,116 430Non-Graded - - - 325 312 13 422 422 -
Secondary 71,147 65,388 5,759 72,259 66,608 5,651 73,481 67,806 5,675First Year 20,575 19,014 1,561 20,408 18,870 1,538 20,796 19,318 1,478Second Year 18,200 16,718 1,482 19,405 17,939 1,466 19,390 17,922 1,468Third Year 16,730 15,334 1,396 17,019 15,662 1,357 17,811 16,403 1,408Fourth Year 15,642 14,322 1,320 15,326 14,036 1,290 15,484 14,163 1,321Grade 11 - - - 101 101 - - - -Grade 12 - - - - - - - - -
Camarines Norte
Pre-School 16,311 14,104 2,207 15,459 13,339 2,120 12,271 11,295 976
Elementary 94,915 92,691 2,224 94,531 92,331 2,200 92,669 90,529 2,140Grade I 15,186 14,759 427 15,426 15,042 384 14,559 14,156 403Grade II 15,834 15,438 396 14,787 14,388 399 14,981 14,625 356Grade III 17,222 16,840 382 15,533 15,155 378 14,630 14,276 354Grade IV 17,204 16,817 387 16,918 16,559 359 15,318 14,984 334Grade V 15,290 14,995 295 16,816 16,426 390 16,572 16,239 333Grade VI 14,179 13,842 337 14,827 14,540 287 16,343 15,984 359Non-Graded - - - 224 221 3 266 265 1
Source: Department of Education
10 - 10

SY 2017-2018 SY 2018-2019 SY 2019-2020 SY 2020-2021Total Public Private Total Public Private Total Public Private Total Public Private
150,200 141,310 8,890 153,441 142,250 11,191 135,879 126,336 9,543 128,188 123,345 4,843
897,031 860,839 36,192 864,166 826,058 38,108 858,022 819,043 38,979 808,903 781,246 27,657130,512 124,497 6,015 156,447 149,116 7,331 158,465 150,739 7,726 137,337 133,100 4,237141,036 134,886 6,150 127,393 121,203 6,190 150,987 143,829 7,158 145,514 140,555 4,959140,076 134,202 5,874 139,303 133,046 6,257 126,209 120,171 6,038 142,405 137,464 4,941148,716 142,884 5,832 138,540 132,589 5,951 137,486 131,415 6,071 119,266 115,061 4,205154,941 149,198 5,743 147,051 141,094 5,957 137,273 131,353 5,920 130,912 126,495 4,417178,395 172,918 5,477 152,482 146,670 5,812 145,046 139,073 5,973 131,419 126,528 4,891
- - - - - - - - - - - -3,355 2,254 1,101 2,950 2,340 610 2,556 2,463 93 2,050 2,043 7
540,853 478,451 62,402 587,858 514,971 72,887 791,849 675,601 116,248 730,297 623,410 106,887159,016 141,475 17,541 173,731 154,898 18,833 150,277 132,673 17,604 124,125 109,910 14,215142,295 126,483 15,812 154,501 137,243 17,258 163,232 145,100 18,132 133,476 117,747 15,729126,884 111,874 15,010 134,059 118,582 15,477 145,252 128,579 16,673 143,126 127,182 15,944112,493 98,505 13,988 118,708 104,248 14,460 124,722 109,919 14,803 127,679 112,820 14,859
- - - - - - 335 298 37 85 69 1661 61 - - - - 109,877 83,682 26,195 105,970 83,847 22,123
- - - 6,859 - 6,859 91,652 72,773 18,879 89,058 69,157 19,901
20,516 19,687 829 21,162 20,149 1,013 18,478 17,739 739 16,334 16,047 287
123,580 120,628 2,952 118,626 115,580 3,046 119,188 116,058 3,130 109,033 107,040 1,99316,534 16,050 484 21,512 20,927 585 22,612 21,930 682 19,100 18,791 30920,408 19,888 520 16,253 15,752 501 20,800 20,247 553 19,778 19,424 35419,187 18,700 487 20,142 19,613 529 16,253 15,795 458 19,225 18,894 33121,126 20,683 443 18,984 18,500 484 19,798 19,299 499 14,843 14,565 27820,819 20,347 472 20,881 20,442 439 18,799 18,303 496 18,252 17,919 33325,114 24,589 525 20,439 19,965 474 20,520 20,080 440 17,569 17,181 388
392 371 21 415 381 34 406 404 2 266 266 -
76,653 71,073 5,580 80,690 74,941 5,749 108,381 98,862 9,519 87,399 79,028 8,37121,725 20,284 1,441 23,382 21,713 1,669 19,076 17,617 1,459 14,321 13,131 1,19019,851 18,434 1,417 21,130 19,661 1,469 22,464 20,853 1,611 15,485 14,170 1,31518,386 16,977 1,409 18,934 17,649 1,285 20,139 18,766 1,373 18,220 16,968 1,25216,691 15,378 1,313 17,244 15,918 1,326 17,852 16,615 1,237 16,007 14,932 1,075
- - - - - - 15,012 12,955 2,057 11,728 10,077 1,651- - - - - - 13,838 12,056 1,782 11,638 9,750 1,888
16,365 15,291 1,074 15,708 14,472 1,236 14,254 13,150 1,104 13,898 13,453 445
88,245 86,234 2,011 88,054 85,516 2,538 88,371 85,592 2,779 86,852 84,860 1,99212,969 12,584 385 16,727 16,178 549 16,027 15,453 574 14,543 14,255 28814,373 14,008 365 12,787 12,349 438 16,546 16,001 545 15,617 15,245 37214,746 14,441 305 14,270 13,860 410 12,709 12,249 460 16,114 15,767 34714,497 14,173 324 14,664 14,286 378 14,070 13,655 415 12,309 11,980 32915,111 14,780 331 14,413 14,027 386 14,571 14,175 396 13,765 13,440 32516,243 15,943 300 14,910 14,541 369 14,211 13,825 386 14,280 13,949 331
306 305 1 283 275 8 237 234 3 224 224 -
10 - 11

Table 10.3 - ContinuedENROLMENT IN GOVERNMENT AND PRIVATE SCHOOLS BY LEVEL OF EDUCATIONAND SCHOOLS DIVISIONSY 2014-2015 to SY 2020-2021
Schools Division/ SY 2014-2015 SY 2015-2016 SY 2016-2017Grade Level Total Public Private Total Public Private Total Public Private
Secondary 46,711 40,714 5,997 47,190 41,077 6,113 47,101 42,084 5,017First Year 13,562 11,885 1,677 13,800 12,057 1,743 14,177 12,716 1,461Second Year 12,267 10,731 1,536 12,436 10,835 1,601 12,383 11,077 1,306Third Year 11,010 9,529 1,481 11,205 9,777 1,428 11,020 9,853 1,167Fourth Year 9,872 8,569 1,303 9,747 8,408 1,339 9,521 8,438 1,083Grade 11 - - - 2 - 2 - - -Grade 12 - - - - - - - - -
Camarines Sur
Pre-School 38,298 36,113 2,185 41,984 39,399 2,585 37,298 35,479 1,819
Elementary 294,485 284,734 9,751 281,554 272,829 8,725 274,283 264,184 10,099Grade I 46,162 44,180 1,982 40,393 38,802 1,591 42,681 40,883 1,798Grade II 46,771 45,045 1,726 43,727 42,200 1,527 39,550 37,848 1,702Grade III 58,582 56,845 1,737 45,565 44,154 1,411 43,326 41,560 1,766Grade IV 52,031 50,504 1,527 55,583 54,182 1,401 45,042 43,458 1,584Grade V 47,426 45,973 1,453 50,288 48,987 1,301 54,157 52,590 1,567Grade VI 43,513 42,187 1,326 45,440 44,196 1,244 48,976 47,533 1,443Grade VII - - - 88 - 88 - - -Non-Graded - - - 470 308 162 551 312 239
Secondary 130,781 113,850 16,931 132,152 117,405 14,747 139,830 123,776 16,054First Year 38,470 33,759 4,711 39,760 35,698 4,062 42,394 37,916 4,478Second Year 34,241 29,891 4,350 34,999 31,151 3,848 37,150 32,924 4,226Third Year 29,986 25,947 4,039 30,902 27,360 3,542 32,357 28,507 3,850Fourth Year 28,084 24,253 3,831 26,409 23,114 3,295 27,929 24,429 3,500Grade 11 - - - 82 82 - - - -Grade 12 - - - - - - - - -
Catanduanes
Pre-School 5,689 5,650 39 5,828 5,422 406 5,283 4,954 329
Elementary 40,868 40,722 146 41,169 40,862 307 40,153 39,820 333Grade I 6,115 6,088 27 6,150 6,083 67 5,869 5,788 81Grade II 6,412 6,390 22 6,198 6,141 57 6,156 6,097 59Grade III 7,965 7,939 26 6,544 6,495 49 6,235 6,176 59Grade IV 7,124 7,106 18 8,048 7,989 59 6,563 6,514 49Grade V 6,717 6,693 24 7,223 7,185 38 7,972 7,922 50Grade VI 6,535 6,506 29 6,809 6,775 34 7,167 7,132 35Non-Graded - - - 197 194 3 191 191 -
Secondary 22,388 21,760 628 22,619 22,034 585 23,827 23,586 241First Year 6,104 5,944 160 6,188 6,041 147 6,650 6,586 64Second Year 6,032 5,871 161 5,931 5,779 152 6,100 6,041 59Third Year 5,507 5,353 154 5,629 5,481 148 5,825 5,768 57Fourth Year 4,745 4,592 153 4,755 4,617 138 5,230 5,169 61Non-Graded - - - - - - - - -Grade 11 - - - 116 116 - 22 22 -Grade 12
10 - 12

SY 2017-2018 SY 2018-2019 SY 2019-2020 SY 2020-2021Total Public Private Total Public Private Total Public Private Total Public Private
51,595 45,610 5,985 62,011 48,293 13,718 75,073 61,300 13,773 75,161 61,900 13,26115,890 14,092 1,798 16,144 14,277 1,867 15,069 13,244 1,825 13,429 11,875 1,55413,497 12,077 1,420 15,195 13,334 1,861 15,128 13,270 1,858 14,017 12,348 1,66911,822 10,400 1,422 12,697 11,082 1,615 14,308 12,513 1,795 14,071 12,384 1,68710,356 9,011 1,345 11,116 9,600 1,516 11,818 10,255 1,563 13,097 11,468 1,629
30 30 - 6,859 - 6,859 10,100 6,481 3,619 10,914 7,564 3,350- - - - - - 8,650 5,537 3,113 9,633 6,261 3,372
43,196 41,283 1,913 44,541 41,850 2,691 40,623 38,279 2,344 36,133 34,964 1,169
258,896 248,409 10,487 247,628 236,585 11,043 245,549 234,370 11,179 225,472 218,126 7,34638,944 37,100 1,844 44,650 42,531 2,119 45,155 42,847 2,308 38,828 37,640 1,18840,858 39,063 1,795 37,742 35,838 1,904 43,008 40,950 2,058 40,466 39,087 1,37939,198 37,541 1,657 40,258 38,488 1,770 37,383 35,583 1,800 39,168 37,835 1,33342,486 40,785 1,701 38,754 37,076 1,678 39,667 37,947 1,720 34,077 32,970 1,10744,127 42,537 1,590 41,983 40,267 1,716 38,385 36,775 1,610 36,751 35,627 1,12452,481 50,965 1,516 43,507 41,920 1,587 41,393 39,716 1,677 35,748 34,537 1,211
- - - - - -802 418 384 734 465 269 558 552 6 434 430 4
148,896 131,975 16,921 163,445 145,203 18,242 216,170 189,924 26,246 184,239 158,946 25,29344,180 39,435 4,745 48,975 43,700 5,275 41,633 36,868 4,765 29,805 25,861 3,94439,918 35,504 4,414 43,808 39,053 4,755 46,725 41,697 5,028 34,099 29,856 4,24334,734 30,729 4,005 37,920 33,580 4,340 41,239 36,769 4,470 38,053 33,562 4,49130,021 26,277 3,744 32,742 28,870 3,872 35,340 31,287 4,053 34,114 30,115 3,999
- 30 13 - - - 27,471 23,063 4,408 26,544 21,825 4,719- - - - - - 23,762 20,240 3,522 21,624 17,727 3,897
6,642 6,286 356 6,868 6,349 519 5,996 5,568 428 6,137 5,869 268
38,169 37,798 371 36,881 36,458 423 37,197 36,713 484 36,766 36,441 3255,395 5,327 68 6,798 6,695 103 6,943 6,821 122 6,158 6,112 465,831 5,745 86 5,317 5,254 63 6,631 6,538 93 6,754 6,689 656,104 6,045 59 5,796 5,715 81 5,306 5,246 60 6,587 6,525 626,243 6,186 57 6,028 5,964 64 5,786 5,703 83 5,240 5,200 406,560 6,508 52 6,191 6,131 60 6,033 5,972 61 5,764 5,699 657,830 7,781 49 6,507 6,455 52 6,211 6,146 65 6,043 5,996 47
206 206 - 244 244 - 287 287 - 220 220 -
24,355 24,136 219 26,284 25,717 567 36,771 35,558 1,213 36,179 35,111 1,0686,791 6,746 45 7,758 7,606 152 6,639 6,518 121 6,021 5,909 1126,326 6,265 61 6,762 6,631 131 7,344 7,199 145 6,440 6,333 1075,738 5,676 62 6,236 6,091 145 6,568 6,443 125 7,083 6,963 1205,500 5,449 51 5,528 5,389 139 5,767 5,633 134 6,252 6,134 118
- - - - - - 202 202 - 13 13 -- - - - - - 5,236 4,857 379 5,443 5,151 292
5,015 4,706 309 4,927 4,608 319
10 - 13

Table 10.3 - ContinuedENROLMENT IN GOVERNMENT AND PRIVATE SCHOOLS BY LEVEL OF EDUCATIONAND SCHOOLS DIVISIONSY 2014-2015 to SY 2020-2021
Schools Division/ SY 2014-2015 SY 2015-2016 SY 2016-2017Grade Level Total Public Private Total Public Private Total Public Private
Masbate
Pre-School 23,636 22,602 1,034 21,790 20,839 951 19,400 19,135 265
Elementary 154,458 153,260 1,198 151,260 150,054 1,206 145,700 145,155 545Grade I 23,683 23,462 221 22,637 22,389 248 21,832 21,720 112Grade II 27,517 27,270 247 22,999 22,792 207 21,819 21,709 110Grade III 30,849 30,641 208 26,893 26,668 225 22,812 22,732 80Grade IV 26,177 25,977 200 30,108 29,922 186 25,955 25,859 96Grade V 24,161 24,004 157 25,349 25,156 193 28,898 28,817 81Grade VI 22,071 21,906 165 23,216 23,076 140 24,336 24,270 66Non-Graded - - - 58 51 7 48 48 -
Secondary 67,467 58,917 8,550 68,767 60,163 8,604 63,953 62,684 1,269First Year 20,750 18,103 2,647 20,722 18,233 2,489 19,754 19,407 347Second Year 18,322 15,975 2,347 18,588 16,215 2,373 17,105 16,782 323Third Year 14,987 13,084 1,903 16,282 14,199 2,083 14,536 14,226 310Fourth Year 13,408 11,755 1,653 13,175 11,516 1,659 12,558 12,269 289Grade 11 - - - - - - - - -Grade 12 - - - - - - - - -
Sorsogon
Pre-School 14,404 13,865 539 13,347 12,757 590 12,804 12,291 513
Elementary 104,282 103,344 938 103,528 102,541 987 99,503 98,471 1,032Grade I 16,402 16,233 169 15,519 15,338 181 14,750 14,561 189Grade II 16,393 16,235 158 16,168 16,010 158 14,884 14,704 180Grade III 19,818 19,651 167 16,389 16,232 157 15,881 15,702 179Grade IV 18,719 18,559 160 19,774 19,612 162 16,155 15,985 170Grade V 16,792 16,667 125 18,708 18,560 148 19,295 19,131 164Grade VI 16,158 15,999 159 16,711 16,586 125 18,309 18,159 150Grade VII - - - 56 - 56 - - -Non-Graded - - - 203 203 - 229 229 -
Secondary 55,279 51,109 4,170 57,509 53,237 4,272 57,736 53,630 4,106First Year 15,936 14,857 1,079 16,277 15,018 1,259 16,424 15,303 1,121Second Year 14,381 13,279 1,102 15,268 14,215 1,053 15,146 14,074 1,072Third Year 12,957 11,959 998 13,672 12,657 1,015 13,981 12,985 996Fourth Year 11,856 10,865 991 12,112 11,167 945 12,185 11,268 917Non-Graded - - - - - - - - -Grade 11 149 149 - 102 102 - - - -Grade 12 - - - 78 78 - - - -
Iriga City
Pre-School 2,891 1,925 966 3,028 1,922 1,106 2,247 1,689 558
Elementary 18,767 15,716 3,051 18,344 15,286 3,058 17,645 14,531 3,114Grade I 2,995 2,402 593 2,781 2,272 509 2,612 2,038 574Grade II 2,974 2,474 500 2,944 2,399 545 2,762 2,249 513Grade III 3,315 2,792 523 2,950 2,451 499 2,896 2,368 528Grade IV 3,257 2,771 486 3,255 2,753 502 2,945 2,433 512Grade V 3,196 2,685 511 3,227 2,730 497 3,216 2,725 491Grade VI 3,030 2,592 438 3,161 2,655 506 3,185 2,689 496Non-Graded - - - 26 26 - 29 29 -
10 - 14

SY 2017-2018 SY 2018-2019 SY 2019-2020 SY 2020-2021Total Public Private Total Public Private Total Public Private Total Public Private
21,959 21,586 373 22,599 22,074 525 20,122 19,662 460 19,571 19,320 251
139,197 137,943 1,254 131,001 129,656 1,345 126,555 125,170 1,385 121,834 120,807 1,02720,467 20,246 221 22,616 22,330 286 23,287 22,970 317 20,659 20,472 18721,105 20,884 221 19,788 19,572 216 21,531 21,273 258 21,906 21,706 20021,657 21,431 226 20,705 20,481 224 19,297 19,095 202 20,806 20,619 18722,628 22,451 177 21,153 20,927 226 20,210 20,009 201 18,704 18,569 13525,259 25,062 197 22,166 21,976 190 20,634 20,407 227 19,714 19,575 13927,997 27,833 164 24,539 24,336 203 21,563 21,383 180 19,998 19,819 179
84 36 48 34 34 - 33 33 - 47 47 -
74,368 65,979 8,389 81,910 73,092 8,818 105,154 93,414 11,740 106,264 94,934 11,33022,588 20,158 2,430 26,335 23,686 2,649 22,929 20,563 2,366 20,080 17,990 2,09020,039 17,835 2,204 21,661 19,347 2,314 23,519 21,098 2,421 21,367 19,207 2,16017,172 15,263 1,909 18,363 16,328 2,035 19,468 17,306 2,162 21,500 19,286 2,21414,508 12,700 1,808 15,551 13,731 1,820 16,246 14,424 1,822 17,745 15,865 1,880
61 23 38 - - - 12,379 10,871 1,508 14,184 12,585 1,599- - - - - - 10,613 9,152 1,461 11,388 10,001 1,387
15,548 14,971 577 16,266 15,468 798 13,561 12,973 588 14,187 13,843 344
93,271 92,178 1,093 89,553 88,389 1,164 90,185 88,971 1,214 87,016 86,156 86013,815 13,615 200 16,300 16,039 261 17,164 16,887 277 14,756 14,552 20414,018 13,838 180 13,462 13,259 203 15,696 15,456 240 15,951 15,793 15814,716 14,533 183 13,804 13,626 178 13,344 13,148 196 15,125 14,985 14015,554 15,389 165 14,500 14,317 183 13,860 13,694 166 13,095 12,972 12315,942 15,763 179 15,429 15,271 158 14,428 14,253 175 13,579 13,467 11218,930 18,755 175 15,731 15,550 181 15,318 15,159 159 14,152 14,031 121
- - - - - - - - - - - -296 285 11 327 327 - 375 374 1 358 356 2
60,844 56,612 4,232 63,594 59,243 4,351 85,169 78,713 6,456 80,364 74,334 6,03017,715 16,474 1,241 18,713 17,499 1,214 15,568 14,349 1,219 14,063 13,006 1,05715,711 14,649 1,062 17,147 15,923 1,224 17,530 16,416 1,114 14,612 13,460 1,15214,311 13,321 990 14,415 13,440 975 16,013 14,821 1,192 15,851 14,884 96713,076 12,137 939 13,319 12,381 938 13,517 12,553 964 14,582 13,480 1,102
- - - - - - 59 59 - 25 25 -- 31 - - - - 11,716 10,700 1,016 11,204 10,349 855- - - - - - 10,766 9,815 951 10,027 9,130 897
2,708 2,043 665 2,903 2,220 683 2,489 1,825 664 2,505 2,238 267
16,720 13,447 3,273 16,118 12,916 3,202 16,167 12,796 3,371 15,347 13,072 2,2752,265 1,759 506 2,722 2,147 575 2,922 2,295 627 2,415 2,113 3022,620 2,050 570 2,272 1,777 495 2,734 2,139 595 2,774 2,415 3592,744 2,217 527 2,626 2,064 562 2,290 1,789 501 2,641 2,259 3822,859 2,310 549 2,736 2,214 522 2,641 2,080 561 2,233 1,892 3412,899 2,381 518 2,838 2,301 537 2,735 2,201 534 2,581 2,149 4323,187 2,695 492 2,875 2,364 511 2,796 2,243 553 2,651 2,192 459
146 35 111 49 49 - 49 49 - 52 52 -
10 - 15

Table 10.3 - ContinuedENROLMENT IN GOVERNMENT AND PRIVATE SCHOOLS BY LEVEL OF EDUCATIONAND SCHOOLS DIVISIONSY 2014-2015 to SY 2020-2021
Schools Division/ SY 2014-2015 SY 2015-2016 SY 2016-2017Grade Level Total Public Private Total Public Private Total Public Private
Secondary 10,839 7,062 3,777 11,179 7,257 3,922 11,611 7,480 4,131First Year 3,140 2,072 1,068 3,187 2,097 1,090 3,305 2,100 1,205Second Year 2,791 1,798 993 2,998 1,946 1,052 3,033 1,991 1,042Third Year 2,521 1,670 851 2,634 1,685 949 2,825 1,846 979Fourth Year 2,364 1,522 842 2,360 1,529 831 2,448 1,543 905Non-Graded - - - - - - - - -Grade 11 23 - 23 - - - - - -Grade 12 - - - - - - - - -
Legazpi City
Pre-School 4,777 3,562 1,215 4,782 3,553 1,229 3,733 3,158 575
Elementary 29,665 25,894 3,771 29,437 25,802 3,635 29,026 25,463 3,563Grade I 4,919 4,309 610 4,619 4,030 589 4,502 3,917 585Grade II 4,729 4,077 652 4,805 4,226 579 4,477 3,897 580Grade III 5,776 5,150 626 4,671 4,034 637 4,779 4,197 582Grade IV 5,058 4,429 629 5,722 5,115 607 4,625 4,004 621Grade V 4,611 4,012 599 5,039 4,402 637 5,608 5,042 566Grade VI 4,572 3,917 655 4,544 3,958 586 4,999 4,370 629Non-Graded - - - 37 37 - 36 36 -
Secondary 15,158 10,404 4,754 16,149 11,259 4,890 16,427 11,531 4,896First Year 4,213 2,942 1,271 4,475 3,118 1,357 4,598 3,350 1,248Second Year 3,879 2,710 1,169 4,273 3,014 1,259 4,294 2,985 1,309Third Year 3,681 2,518 1,163 3,862 2,707 1,155 3,935 2,713 1,222Fourth Year 3,385 2,234 1,151 3,489 2,370 1,119 3,600 2,483 1,117Non-Graded - - - - - - - - -Grade 11 - - - 50 50 - - - -Grade 12 - - - - - - - - -
Ligao City
Pre-School 3,047 2,394 653 3,129 2,549 580 2,343 2,112 231
Elementary 18,758 17,824 934 18,865 17,937 928 18,698 17,594 1,104Grade I 3,133 2,928 205 2,886 2,685 201 2,887 2,672 215Grade II 3,110 2,929 181 3,138 2,950 188 2,838 2,623 215Grade III 3,731 3,564 167 3,108 2,950 158 3,075 2,875 200Grade IV 3,099 2,956 143 3,713 3,560 153 3,083 2,920 163Grade V 2,869 2,749 120 3,089 2,961 128 3,697 3,526 171Grade VI 2,816 2,698 118 2,862 2,763 99 3,042 2,902 140Non-Graded - - - 69 68 1 76 76 -
Secondary 10,057 9,421 636 10,524 9,910 614 10,726 10,152 574First Year 2,850 2,680 170 3,001 2,836 165 3,060 2,915 145Second Year 2,648 2,495 153 2,699 2,539 160 2,878 2,728 150Third Year 2,410 2,247 163 2,496 2,355 141 2,503 2,359 144Fourth Year 2,149 1,999 150 2,302 2,154 148 2,285 2,150 135Grade 11 - - - 26 26 - - - -Grade 12 - - - - - - - - -
10 - 16

SY 2017-2018 SY 2018-2019 SY 2019-2020 SY 2020-2021Total Public Private Total Public Private Total Public Private Total Public Private
12,215 7,868 4,347 12,570 8,100 4,470 18,347 10,215 8,132 17,781 10,498 7,2833,376 2,142 1,234 3,416 2,186 1,230 3,115 1,943 1,172 2,827 1,969 8583,206 2,046 1,160 3,319 2,143 1,176 3,305 2,120 1,185 3,015 1,978 1,0372,966 1,952 1,014 3,018 1,922 1,096 3,131 2,013 1,118 3,082 2,041 1,0412,667 1,728 939 2,817 1,849 968 2,906 1,850 1,056 3,010 1,988 1,022
- - - - - - 7 7 - - - -- - - - - - 3,145 1,136 2,009 2,933 1,407 1,526- - - - - - 2,738 1,146 1,592 2,914 1,115 1,799
4,744 4,125 619 4,324 3,598 726 4,065 3,440 625 3,882 3,549 333
27,493 24,021 3,472 27,354 23,770 3,584 27,200 23,615 3,585 25,967 23,186 2,7813,966 3,433 533 5,321 4,674 647 4,650 4,024 626 4,274 3,888 3864,335 3,736 599 3,862 3,320 542 5,058 4,413 645 4,379 3,916 4634,398 3,802 596 4,345 3,740 605 3,841 3,291 550 4,826 4,329 4974,670 4,116 554 4,414 3,825 589 4,323 3,734 589 3,734 3,312 4224,504 3,891 613 4,671 4,108 563 4,441 3,842 599 4,258 3,780 4785,444 4,883 561 4,557 3,932 625 4,723 4,152 571 4,354 3,819 535
176 160 16 184 171 13 164 159 5 142 142 -
17,177 12,130 5,047 18,019 13,243 4,776 28,188 17,283 10,905 26,879 17,771 9,1084,898 3,538 1,360 5,446 4,102 1,344 4,723 3,391 1,332 4,416 3,488 9284,401 3,180 1,221 4,640 3,473 1,167 5,240 3,890 1,350 4,350 3,300 1,0504,119 2,827 1,292 4,251 3,032 1,219 4,647 3,343 1,304 4,935 3,792 1,1433,759 2,585 1,174 3,682 2,636 1,046 4,070 2,873 1,197 4,340 3,169 1,171
- - - - - - 16 16 16 16 -- - - - - - 4,897 1,921 2,976 4,122 2,080 2,042- - - - - - 4,595 1,849 2,746 4,700 1,926 2,774
2,971 2,725 246 3,122 2,844 278 2,637 2,399 238 2,479 2,367 112
17,674 16,510 1,164 17,367 16,069 1,298 17,319 15,983 1,336 16,171 15,153 1,0182,457 2,266 191 3,110 2,860 250 3,203 2,954 249 2,729 2,590 1392,760 2,546 214 2,482 2,288 194 2,991 2,744 247 2,886 2,715 1712,776 2,558 218 2,716 2,489 227 2,492 2,293 199 2,839 2,653 1863,001 2,800 201 2,808 2,600 208 2,705 2,484 221 2,403 2,250 1533,031 2,867 164 3,037 2,833 204 2,828 2,616 212 2,555 2,383 1723,555 3,383 172 3,061 2,901 160 3,000 2,792 208 2,673 2,476 197
94 90 4 153 98 55 100 100 - 86 86 -
11,429 10,839 590 12,516 11,920 596 17,183 15,684 1,499 16,466 15,227 1,2393,355 3,186 169 3,859 3,666 193 3,204 3,068 136 3,028 2,929 992,938 2,804 134 3,264 3,115 149 3,584 3,410 174 2,898 2,773 1252,730 2,591 139 2,805 2,685 120 3,094 2,953 141 3,317 3,149 1682,406 2,258 148 2,588 2,454 134 2,635 2,519 116 2,717 2,579 138
- - - - - - 2,391 1,901 490 2,333 2,057 276- - - - - - 2,275 1,833 442 2,173 1,740 433
10 - 17

Table 10.3 - ContinuedENROLMENT IN GOVERNMENT AND PRIVATE SCHOOLS BY LEVEL OF EDUCATIONAND SCHOOLS DIVISIONSY 2014-2015 to SY 2020-2021
Schools Division/ SY 2014-2015 SY 2015-2016 SY 2016-2017Grade Level Total Public Private Total Public Private Total Public Private
Masbate City
Pre-School 3,429 2,687 742 2,933 2,271 662 2,477 2,118 359
Elementary 18,067 17,070 997 17,894 16,814 1,080 17,827 16,755 1,072Grade I 3,050 2,858 192 2,793 2,640 153 2,772 2,606 166Grade II 3,250 3,080 170 2,946 2,749 197 2,703 2,521 182Grade III 3,596 3,423 173 3,182 3,008 174 2,889 2,684 205Grade IV 3,028 2,862 166 3,446 3,279 167 3,164 2,985 179Grade V 2,648 2,507 141 2,878 2,718 160 3,405 3,233 172Grade VI 2,495 2,340 155 2,509 2,358 151 2,830 2,662 168Grade VII - - - 78 - 78 - - -Non-Graded - - - 62 62 - 64 64 -
Secondary 9,814 7,975 1,839 9,708 7,906 1,802 9,674 7,855 1,819First Year 2,814 2,352 462 2,700 2,223 477 2,773 2,275 498Second Year 2,607 2,117 490 2,531 2,095 436 2,445 1,976 469Third Year 2,257 1,902 355 2,347 1,899 448 2,359 1,924 435Fourth Year 2,136 1,604 532 2,020 1,689 331 2,097 1,680 417Grade 11 - - - 110 - 110 - - -Grade 12 - - - - - - - - -
Naga City
Pre-School 5,535 3,194 2,341 6,129 3,820 2,309 4,318 3,325 993
Elementary 29,331 23,555 5,776 32,659 26,573 6,086 32,752 26,393 6,359Grade I 5,497 4,411 1,086 4,930 3,942 988 5,209 4,190 1,019Grade II 5,181 4,190 991 5,703 4,628 1,075 4,832 3,808 1,024Grade III 5,309 4,345 964 5,592 4,594 998 5,606 4,505 1,101Grade IV 4,752 3,812 940 5,828 4,859 969 5,632 4,592 1,040Grade V 4,385 3,543 842 5,437 4,493 944 5,739 4,753 986Grade VI 4,207 3,254 953 4,778 3,945 833 5,308 4,373 935Grade VII - - - 161 - 161 - - -Non-Graded - - - 230 112 118 426 172 254
Secondary 19,684 13,719 5,965 19,868 13,870 5,998 20,234 14,097 6,137First Year 5,536 3,985 1,551 5,617 3,977 1,640 5,854 4,296 1,558Second Year 5,236 3,624 1,612 5,087 3,637 1,450 5,191 3,564 1,627Third Year 4,581 3,210 1,371 4,932 3,400 1,532 4,775 3,305 1,470Fourth Year 4,331 2,900 1,431 4,195 2,856 1,339 4,414 2,932 1,482Non-Graded - - - - - - - - -Grade 11 - - - 37 - 37 - - -Grade 12 - - - - - - - - -
Sorsogon City
Pre-School 4,243 3,327 916 4,084 3,294 790 3,312 2,824 488
Elementary 27,447 25,999 1,448 26,550 25,090 1,460 25,795 24,330 1,465Grade I 4,163 3,880 283 3,801 3,509 292 3,912 3,655 257Grade II 4,886 4,619 267 4,086 3,833 253 3,760 3,487 273Grade III 5,092 4,856 236 4,795 4,544 251 4,068 3,832 236Grade IV 4,557 4,323 234 5,022 4,790 232 4,740 4,488 252Grade V 4,480 4,264 216 4,430 4,206 224 4,883 4,657 226Grade VI 4,269 4,057 212 4,351 4,143 208 4,375 4,154 221Non-Graded - - - 65 65 - 57 57 -
10 - 18

SY 2017-2018 SY 2018-2019 SY 2019-2020 SY 2020-2021Total Public Private Total Public Private Total Public Private Total Public Private
2,791 2,458 333 2,919 2,531 388 2,568 2,208 360 2,136 1,953 183
17,195 16,103 1,092 16,801 15,654 1,147 16,283 15,156 1,127 15,189 14,318 8712,581 2,397 184 2,948 2,705 243 2,937 2,725 212 2,634 2,504 1302,643 2,473 170 2,489 2,313 176 2,783 2,556 227 2,705 2,543 1622,647 2,468 179 2,664 2,500 164 2,454 2,297 157 2,594 2,425 1692,850 2,658 192 2,681 2,500 181 2,584 2,423 161 2,287 2,163 1243,163 2,979 184 2,860 2,666 194 2,662 2,492 170 2,445 2,317 1283,253 3,070 183 3,097 2,908 189 2,793 2,593 200 2,481 2,323 158
- - - - - - - - - - - -58 58 - 62 62 - 70 70 - 43 43 -
10,151 8,311 1,840 10,861 8,844 2,017 15,769 11,547 4,222 15,301 11,187 4,1143,018 2,471 547 3,462 2,816 646 3,166 2,456 710 2,685 2,135 5502,603 2,160 443 2,835 2,295 540 3,126 2,489 637 2,855 2,195 6602,317 1,875 442 2,365 1,948 417 2,617 2,082 535 2,693 2,109 5842,213 1,805 408 2,199 1,785 414 2,182 1,740 442 2,376 1,865 511
- - - - - - 2,481 1,468 1,013 2,355 1,516 839- - - - - - 2,197 1,312 885 2,337 1,367 970
4,931 3,924 1,007 5,285 3,935 1,350 4,423 3,305 1,118 4,259 3,479 780
31,779 25,309 6,470 30,977 24,420 6,557 30,570 24,097 6,473 28,315 22,813 5,5024,700 3,782 918 5,462 4,324 1,138 5,516 4,362 1,154 4,457 3,639 8184,929 3,947 982 4,567 3,588 979 5,230 4,102 1,128 5,092 4,115 9774,779 3,763 1,016 4,920 3,873 1,047 4,548 3,560 988 5,040 4,054 9865,528 4,456 1,072 4,780 3,750 1,030 4,922 3,897 1,025 4,316 3,430 8865,547 4,506 1,041 5,411 4,295 1,116 4,764 3,738 1,026 4,651 3,794 8575,637 4,652 985 5,483 4,421 1,062 5,417 4,293 1,124 4,638 3,661 977
- - - - - - - - - - - -659 203 456 354 169 185 173 145 28 121 120 1
21,196 14,928 6,268 22,421 15,903 6,518 36,848 21,897 14,951 36,236 22,788 13,4486,334 4,627 1,707 6,611 4,872 1,739 6,507 4,807 1,700 5,935 4,634 1,3015,415 3,892 1,523 5,998 4,321 1,677 6,112 4,370 1,742 6,038 4,500 1,5385,010 3,409 1,601 5,089 3,579 1,510 5,745 4,073 1,672 5,805 4,209 1,5964,437 3,000 1,437 4,723 3,131 1,592 4,791 3,300 1,491 5,462 3,904 1,558
- - - - - - 37 - 37 16 - 16- - - - - - 7,154 2,770 4,384 6,202 2,863 3,339- - - - - - 6,502 2,577 3,925 6,778 2,678 4,100
4,281 3,783 498 4,487 3,969 518 3,591 3,147 444 3,790 3,607 183
24,652 23,040 1,612 24,136 22,400 1,736 24,003 22,199 1,804 23,325 22,208 1,1173,601 3,270 331 4,527 4,149 378 4,666 4,304 362 3,820 3,644 1763,768 3,500 268 3,490 3,179 311 4,364 4,007 357 4,329 4,133 1963,814 3,541 273 3,835 3,554 281 3,496 3,191 305 4,279 4,059 2204,045 3,800 245 3,750 3,482 268 3,766 3,505 261 3,443 3,264 1794,626 4,365 261 3,969 3,730 239 3,730 3,460 270 3,679 3,521 1584,732 4,498 234 4,500 4,241 259 3,925 3,676 249 3,718 3,530 188
66 66 - 65 65 - 56 56 - 57 57 -
10 - 19

Table 10.3 - ContinuedENROLMENT IN GOVERNMENT AND PRIVATE SCHOOLS BY LEVEL OF EDUCATIONAND SCHOOLS DIVISIONSY 2014-2015 to SY 2020-2021
Schools Division/ SY 2014-2015 SY 2015-2016 SY 2016-2017Grade Level Total Public Private Total Public Private Total Public Private
Secondary 15,366 13,222 2,144 15,564 13,423 2,141 16,089 13,908 2,181First Year 4,259 3,655 604 4,433 3,848 585 4,506 3,921 585Second Year 4,048 3,519 529 4,014 3,434 580 4,231 3,660 571Third Year 3,637 3,139 498 3,826 3,331 495 3,762 3,212 550Fourth Year 3,422 2,909 513 3,291 2,810 481 3,590 3,115 475Grade 11 - - - - - - - - -Grade 12 - - - - - - - - -
Tabaco City
Pre-School 3,796 2,901 895 3,601 2,743 858 2,553 2,167 386
Elementary 22,435 21,551 884 22,286 21,369 917 21,570 20,662 908Grade I 3,391 3,245 146 3,569 3,422 147 3,453 3,295 158Grade II 3,512 3,352 160 3,385 3,238 147 3,420 3,265 155Grade III 4,457 4,310 147 3,447 3,287 160 3,281 3,133 148Grade IV 3,989 3,849 140 4,233 4,099 134 3,373 3,224 149Grade V 3,716 3,567 149 3,929 3,789 140 4,146 4,026 120Grade VI 3,370 3,228 142 3,669 3,521 148 3,837 3,701 136Grade VII - - - 8 - 8 - - -Non-Graded - - - 46 13 33 60 18 42
Secondary 13,720 13,006 714 14,104 13,384 720 14,667 13,937 730First Year 4,023 3,840 183 3,989 3,797 192 4,298 4,091 207Second Year 3,571 3,386 185 3,774 3,601 173 3,782 3,607 175Third Year 3,208 3,028 180 3,374 3,187 187 3,476 3,309 167Fourth Year 2,918 2,752 166 2,956 2,788 168 3,111 2,930 181Non-Graded - - - - - - - - -Grade 11 - - - 11 11 - - - -Grade 12 - - - - - - - - -
10 - 20
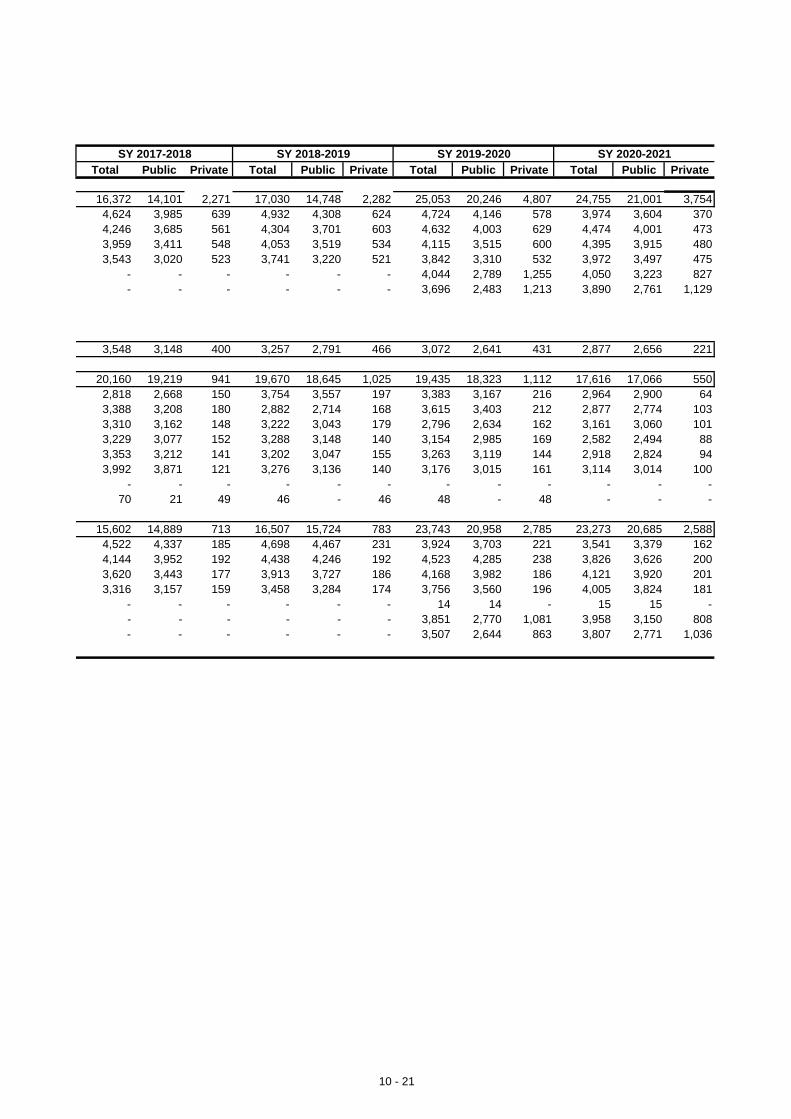
SY 2017-2018 SY 2018-2019 SY 2019-2020 SY 2020-2021Total Public Private Total Public Private Total Public Private Total Public Private
16,372 14,101 2,271 17,030 14,748 2,282 25,053 20,246 4,807 24,755 21,001 3,7544,624 3,985 639 4,932 4,308 624 4,724 4,146 578 3,974 3,604 3704,246 3,685 561 4,304 3,701 603 4,632 4,003 629 4,474 4,001 4733,959 3,411 548 4,053 3,519 534 4,115 3,515 600 4,395 3,915 4803,543 3,020 523 3,741 3,220 521 3,842 3,310 532 3,972 3,497 475
- - - - - - 4,044 2,789 1,255 4,050 3,223 827- - - - - - 3,696 2,483 1,213 3,890 2,761 1,129
3,548 3,148 400 3,257 2,791 466 3,072 2,641 431 2,877 2,656 221
20,160 19,219 941 19,670 18,645 1,025 19,435 18,323 1,112 17,616 17,066 5502,818 2,668 150 3,754 3,557 197 3,383 3,167 216 2,964 2,900 643,388 3,208 180 2,882 2,714 168 3,615 3,403 212 2,877 2,774 1033,310 3,162 148 3,222 3,043 179 2,796 2,634 162 3,161 3,060 1013,229 3,077 152 3,288 3,148 140 3,154 2,985 169 2,582 2,494 883,353 3,212 141 3,202 3,047 155 3,263 3,119 144 2,918 2,824 943,992 3,871 121 3,276 3,136 140 3,176 3,015 161 3,114 3,014 100
- - - - - - - - - - - -70 21 49 46 - 46 48 - 48 - - -
15,602 14,889 713 16,507 15,724 783 23,743 20,958 2,785 23,273 20,685 2,5884,522 4,337 185 4,698 4,467 231 3,924 3,703 221 3,541 3,379 1624,144 3,952 192 4,438 4,246 192 4,523 4,285 238 3,826 3,626 2003,620 3,443 177 3,913 3,727 186 4,168 3,982 186 4,121 3,920 2013,316 3,157 159 3,458 3,284 174 3,756 3,560 196 4,005 3,824 181
- - - - - - 14 14 - 15 15 -- - - - - - 3,851 2,770 1,081 3,958 3,150 808- - - - - - 3,507 2,644 863 3,807 2,771 1,036
10 - 21
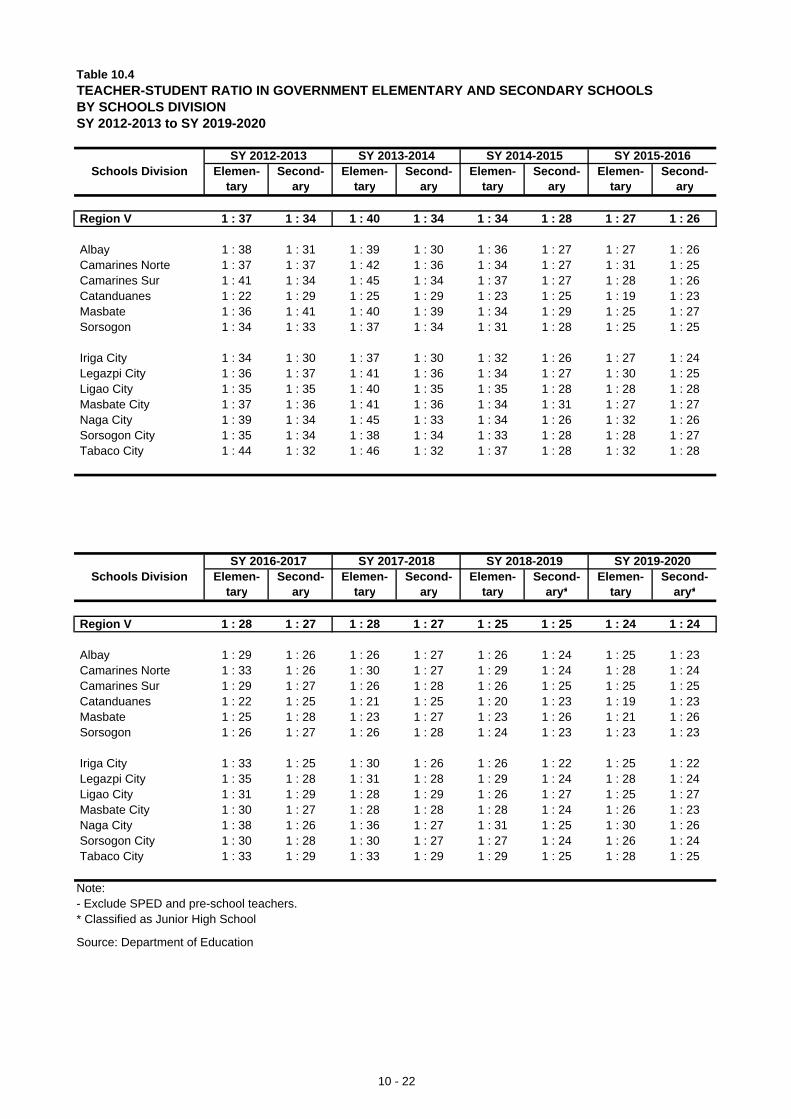
Table 10.4TEACHER-STUDENT RATIO IN GOVERNMENT ELEMENTARY AND SECONDARY SCHOOLSBY SCHOOLS DIVISIONSY 2012-2013 to SY 2019-2020
SY 2012-2013 SY 2013-2014 SY 2014-2015 SY 2015-2016Schools Division Elemen- Second- Elemen- Second- Elemen- Second- Elemen- Second-
tary ary tary ary tary ary tary ary
Region V 1 : 37 1 : 34 1 : 40 1 : 34 1 : 34 1 : 28 1 : 27 1 : 26
Albay 1 : 38 1 : 31 1 : 39 1 : 30 1 : 36 1 : 27 1 : 27 1 : 26 Camarines Norte 1 : 37 1 : 37 1 : 42 1 : 36 1 : 34 1 : 27 1 : 31 1 : 25 Camarines Sur 1 : 41 1 : 34 1 : 45 1 : 34 1 : 37 1 : 27 1 : 28 1 : 26 Catanduanes 1 : 22 1 : 29 1 : 25 1 : 29 1 : 23 1 : 25 1 : 19 1 : 23 Masbate 1 : 36 1 : 41 1 : 40 1 : 39 1 : 34 1 : 29 1 : 25 1 : 27 Sorsogon 1 : 34 1 : 33 1 : 37 1 : 34 1 : 31 1 : 28 1 : 25 1 : 25
Iriga City 1 : 34 1 : 30 1 : 37 1 : 30 1 : 32 1 : 26 1 : 27 1 : 24 Legazpi City 1 : 36 1 : 37 1 : 41 1 : 36 1 : 34 1 : 27 1 : 30 1 : 25 Ligao City 1 : 35 1 : 35 1 : 40 1 : 35 1 : 35 1 : 28 1 : 28 1 : 28 Masbate City 1 : 37 1 : 36 1 : 41 1 : 36 1 : 34 1 : 31 1 : 27 1 : 27 Naga City 1 : 39 1 : 34 1 : 45 1 : 33 1 : 34 1 : 26 1 : 32 1 : 26 Sorsogon City 1 : 35 1 : 34 1 : 38 1 : 34 1 : 33 1 : 28 1 : 28 1 : 27 Tabaco City 1 : 44 1 : 32 1 : 46 1 : 32 1 : 37 1 : 28 1 : 32 1 : 28
SY 2016-2017 SY 2017-2018 SY 2018-2019 SY 2019-2020Schools Division Elemen- Second- Elemen- Second- Elemen- Second- Elemen- Second-
tary ary tary ary tary ary* tary ary*
Region V 1 : 28 1 : 27 1 : 28 1 : 27 1 : 25 1 : 25 1 : 24 1 : 24
Albay 1 : 29 1 : 26 1 : 26 1 : 27 1 : 26 1 : 24 1 : 25 1 : 23 Camarines Norte 1 : 33 1 : 26 1 : 30 1 : 27 1 : 29 1 : 24 1 : 28 1 : 24 Camarines Sur 1 : 29 1 : 27 1 : 26 1 : 28 1 : 26 1 : 25 1 : 25 1 : 25 Catanduanes 1 : 22 1 : 25 1 : 21 1 : 25 1 : 20 1 : 23 1 : 19 1 : 23 Masbate 1 : 25 1 : 28 1 : 23 1 : 27 1 : 23 1 : 26 1 : 21 1 : 26 Sorsogon 1 : 26 1 : 27 1 : 26 1 : 28 1 : 24 1 : 23 1 : 23 1 : 23
Iriga City 1 : 33 1 : 25 1 : 30 1 : 26 1 : 26 1 : 22 1 : 25 1 : 22 Legazpi City 1 : 35 1 : 28 1 : 31 1 : 28 1 : 29 1 : 24 1 : 28 1 : 24 Ligao City 1 : 31 1 : 29 1 : 28 1 : 29 1 : 26 1 : 27 1 : 25 1 : 27 Masbate City 1 : 30 1 : 27 1 : 28 1 : 28 1 : 28 1 : 24 1 : 26 1 : 23 Naga City 1 : 38 1 : 26 1 : 36 1 : 27 1 : 31 1 : 25 1 : 30 1 : 26 Sorsogon City 1 : 30 1 : 28 1 : 30 1 : 27 1 : 27 1 : 24 1 : 26 1 : 24 Tabaco City 1 : 33 1 : 29 1 : 33 1 : 29 1 : 29 1 : 25 1 : 28 1 : 25
Note:- Exclude SPED and pre-school teachers.* Classified as Junior High School
Source: Department of Education
10 - 22

Table 10.5A PERFORMANCE INDICATORS IN ELEMENTARY SCHOOLSBY SCHOOLS DIVISIONSY 2017-2018 to SY 2020-2021
Schools Cohort Average Ave. SchoolDivision/ Survival Repetition Leaver
School Year Rate Rate Rate
Region VSY 2017-2018 93.56% 98.10% 94.48% 1.62% 93.22%SY 2018-2019 93.12% 98.53% 98.90% 97.11% 3.28% 0.59% 97.84% 96.43%SY 2019-2020 92.68% 98.29% 99.01% 96.44% 3.65% 0.58% 97.28% 95.60%SY 2020-2021 87.26% 94.24% 92.83%
AlbaySY 2017-2018 91.20% 98.03% 94.08% 1.80% 93.57%SY 2018-2019 90.38% 98.60% 98.84% 97.71% 3.44% 0.45% 98.46% 97.29%SY 2019-2020 91.21% 98.36% 99.03% 97.34% 3.88% 0.43% 97.30% 96.70%SY 2020-2021 83.34% 91.25% 90.05%
Camarines NorteSY 2017-2018 96.96% 98.65% 96.09% 1.09% 93.51%SY 2018-2019 97.62% 99.10% 99.66% 97.70% 1.84% 0.49% 98.34% 97.03%SY 2019-2020 97.86% 98.82% 99.34% 96.36% 1.77% 0.61% 98.57% 95.81%SY 2020-2021 95.07% 97.51% 96.34%
Camarines SurSY 2017-2018 91.13% 97.97% 93.64% 1.82% 92.21%SY 2018-2019 90.35% 98.36% 98.82% 96.75% 3.36% 0.70% 97.42% 95.77%SY 2019-2020 89.31% 98.25% 99.05% 95.73% 3.51% 0.89% 97.56% 95.07%SY 2020-2021 81.88% 91.46% 90.40%
CatanduanesSY 2017-2018 91.96% 100.00% 98.26% 0.62% 96.31%SY 2018-2019 89.86% 99.02% 99.08% 97.64% 1.83% 0.44% 98.84% 97.32%SY 2019-2020 89.22% 98.93% 99.47% 98.55% 2.79% 0.24% 97.95% 97.87%SY 2020-2021 86.42% 98.99% 97.56%
MasbateSY 2017-2018 92.51% 96.89% 92.36% 2.06% 91.52%SY 2018-2019 92.73% 97.51% 97.96% 92.48% 4.28% 2.07% 96.70% 91.32%SY 2019-2020 91.87% 97.00% 97.55% 88.62% 5.11% 2.02% 95.03% 87.09%SY 2020-2021 89.81% 96.35% 94.04%
SorsogonSY 2017-2018 89.82% 98.68% 95.56% 1.43% 95.13%SY 2018-2019 87.73% 98.49% 99.20% 96.92% 3.28% 0.57% 96.54%SY 2019-2020 87.48% 98.84% 99.50% 99.81% 4.06% 0.03% 99.28%SY 2020-2021 83.42% 96.52% 95.07%
Iriga CitySY 2017-2018 98.17% 98.44% 95.91% 0.69% 95.91%SY 2018-2019 96.18% 99.70% 99.27% 98.42% 0.79% 0.32% 98.07% 98.05%SY 2019-2020 96.53% 100.02% 99.96% 98.83% 1.02% 0.19% 97.72% 98.76%SY 2020-2021 92.44% 96.68% 96.90%
Transition Rate
Graduation Rate
Completion Rate
Participation Rate
Retention Rate
10 - 23

Table 10.5A - ContinuedPERFORMANCE INDICATORS IN ELEMENTARY SCHOOLSBY SCHOOLS DIVISIONSY 2017-2018 to SY 2020-2021
Schools Cohort Average Ave. SchoolDivision/ Survival Repetition Leaver
School Year Rate Rate Rate
Transition Rate
Graduation Rate
Completion Rate
Participation Rate
Retention Rate
Legazpi CitySY 2017-2018 104.11% 97.42% 92.82% 2.00% 92.46%SY 2018-2019 106.74% 99.88% 100.02% 100.00% 2.53% 0.00% 99.40% 100.00%SY 2019-2020 105.75% 98.34% 99.28% 98.07% 2.61% 0.31% 97.62% 96.49%SY 2020-2021 101.43% 96.58% 96.62%
Ligao City SY 2017-2018 96.31% 98.31% 91.52% 2.17% 91.22%SY 2018-2019 98.87% 100.56% 101.20% 100.00% 2.78% 0.00% 98.68% 100.00%SY 2019-2020 99.07% 99.03% 100.71% 99.33% 3.42% 0.11% 98.27% 98.45%SY 2020-2021 93.21% 93.93% 91.87%
Masbate City SY 2017-2018 109.38% 99.97% 93.65% 1.74% 92.20%SY 2018-2019 112.78% 99.33% 100.35% 97.98% 5.29% 0.32% 95.97% 97.98%SY 2019-2020 111.20% 97.32% 99.29% 91.49% 5.76% 1.63% 94.67% 89.63%SY 2020-2021 105.46% 93.23% 90.83%
Naga CitySY 2017-2018 114.16% 98.49% 95.11% 0.94% 94.26%SY 2018-2019 114.99% 98.74% 97.88% 98.17% 2.94% 0.37% 98.70% 97.78%SY 2019-2020 113.78% 98.97% 99.67% 99.66% 3.67% 0.05% 97.94% 98.87%SY 2020-2021 106.05% 95.02% 92.52%
Sorsogon City SY 2017-2018 92.96% 97.59% 97.38% 1.65% 90.15%SY 2018-2019 91.88% 98.44% 98.12% 96.75% 4.45% 0.67% 97.23% 95.94%SY 2019-2020 92.11% 98.52% 99.47% 98.12% 4.66% 0.30% 97.04% 97.16%SY 2020-2021 87.97% 97.13% 94.29%
Tabaco City SY 2017-2018 98.55% 99.41% 96.90% 0.55% 96.59%SY 2018-2019 99.11% 98.58% 99.16% 97.23% 4.28% 0.50% 98.70% 96.91%SY 2019-2020 98.66% 97.90% 99.24% 95.25% 3.57% 1.31% 98.96% 94.90%SY 2020-2021 89.45% 90.38% 91.25%
Source: Department of Education, Regional Office V
10 - 24

Table 10.5B PERFORMANCE INDICATORS IN JUNIOR HIGH SCHOOLSBY SCHOOLS DIVISIONSY 2017-2018 to SY 2020-2021
Schools Cohort Average Ave. SchoolDivision/ Survival Repetition Leaver
School Year Rate Rate Rate
Region VSY 2017-2018 75.88% 91.87% 85.02% 5.43% 83.19%SY 2018-2019 82.97% 95.06% 93.84% 87.73% 3.57% 4.37% 86.43%SY 2019-2020 82.27% 93.49% 93.20% 84.11% 3.95% 5.78% 98.48% 82.52%SY 2020-2021 75.09% 88.12% 81.60%
AlbaySY 2017-2018 74.19% 89.07% 86.36% 4.94% 84.38%SY 2018-2019 79.89% 95.57% 90.16% 88.79% 3.11% 4.06% 96.60% 87.35%SY 2019-2020 79.02% 95.29% 89.40% 88.11% 3.13% 4.30% 96.22% 86.46%SY 2020-2021 64.66% 80.60% 67.31%
Camarines NorteSY 2017-2018 77.36% 92.43% 88.80% 4.20% 87.86%SY 2018-2019 82.63% 94.67% 93.97% 88.01% 4.76% 4.41% 95.82% 86.80%SY 2019-2020 83.24% 93.60% 95.02% 84.73% 4.78% 5.56% 95.71% 83.68%SY 2020-2021 81.15% 92.54% 89.65%
Camarines SurSY 2017-2018 71.23% 87.53% 83.49% 5.90% 81.74%SY 2018-2019 79.17% 96.33% 90.70% 90.66% 3.21% 3.22% 96.54% 89.45%SY 2019-2020 78.02% 93.99% 90.94% 85.00% 3.79% 5.39% 95.63% 83.22%SY 2020-2021 64.99% 82.00% 69.29%
CatanduanesSY 2017-2018 80.31% 92.77% 85.68% 5.04% 82.88%SY 2018-2019 86.46% 96.87% 95.65% 92.51% 3.77% 2.68% 96.89% 92.16%SY 2019-2020 87.35% 93.91% 94.99% 85.38% 4.76% 5.36% 94.55% 83.11%SY 2020-2021 85.74% 96.22% 91.00%
MasbateSY 2017-2018 65.60% 88.08% 77.50% 8.18% 75.26%SY 2018-2019 74.25% 92.94% 90.16% 82.10% 4.24% 6.27% 94.80% 79.93%SY 2019-2020 73.19% 89.26% 87.23% 74.06% 4.60% 9.52% 95.37% 72.44%SY 2020-2021 71.64% 91.95% 87.27%
SorsogonSY 2017-2018 77.18% 91.97% 87.53% 4.61% 85.87%SY 2018-2019 83.64% 94.02% 94.16% 85.28% 4.06% 5.24% 95.88% 83.85%SY 2019-2020 82.87% 93.61% 92.57% 85.73% 4.57% 5.27% 95.77% 84.51%SY 2020-2021 79.50% 91.72% 87.11%
Source: Department of Education
Participation Rate
Retention Rate
Transition Rate
Graduation Rate
Completion Rate
10 - 26

Table 10.5B - ContinuedPERFORMANCE INDICATORS IN JUNIOR HIGH SCHOOLSBY SCHOOLS DIVISIONSY 2017-2018 to SY 2020-2021
Schools Cohort Average Ave. SchoolDivision/ Survival Repetition Leaver
School Year Rate Rate Rate
Participation Rate
Retention Rate
Transition Rate
Graduation Rate
Completion Rate
Iriga CitySY 2017-2018 97.90% 103.30% 91.24% 3.12% 90.18%SY 2018-2019 102.89% 95.87% 104.96% 89.34% 1.71% 3.86% 97.34% 87.52%SY 2019-2020 101.47% 95.79% 105.63% 88.45% 2.30% 4.08% 95.92% 86.37%SY 2020-2021 97.97% 95.35% 98.14%
Legazpi CitySY 2017-2018 87.19% 92.00% 91.30% 3.32% 89.67%SY 2018-2019 92.76% 93.78% 95.94% 84.21% 3.21% 4.01% 98.02% 84.21%SY 2019-2020 93.64% 96.14% 96.41% 92.27% 3.63% 1.90% 98.11% 92.27%SY 2020-2021 90.81% 93.26% 89.31%
Ligao City SY 2017-2018 87.33% 108.09% 88.72% 4.01% 87.89%SY 2018-2019 98.06% 95.94% 107.14% 89.10% 1.43% 3.88% 98.92% 88.65%SY 2019-2020 94.65% 93.81% 102.68% 83.77% 1.20% 5.89% 98.34% 82.83%SY 2020-2021 91.47% 90.39% 98.67%
Masbate City SY 2017-2018 85.04% 101.45% 86.05% 5.05% 83.73%SY 2018-2019 93.83% 93.21% 102.00% 83.36% 3.98% 6.09% 95.71% 81.78%SY 2019-2020 93.02% 91.49% 97.42% 79.49% 3.98% 7.80% 94.77% 76.84%SY 2020-2021 87.92% 88.94% 92.84%
Naga CitySY 2017-2018 104.00% 111.66% 88.11% 4.75% 87.07%SY 2018-2019 111.43% 94.34% 111.74% 87.49% 3.84% 4.84% 96.96% 86.05%SY 2019-2020 111.24% 94.07% 111.47% 87.65% 4.47% 4.89% 95.98% 85.67%SY 2020-2021 110.12% 94.23% 103.90%
Sorsogon City SY 2017-2018 86.11% 102.01% 85.37% 5.30% 82.60%SY 2018-2019 91.92% 94.38% 100.32% 86.23% 3.89% 4.98% 95.76% 84.86%SY 2019-2020 92.90% 93.55% 99.00% 81.40% 4.01% 6.83% 96.58% 80.36%SY 2020-2021 91.22% 95.32% 94.68%
Tabaco City SY 2017-2018 98.48% 115.35% 88.59% 4.05% 86.20%SY 2018-2019 106.97% 96.12% 115.31% 89.04% 2.47% 3.78% 97.38% 88.49%SY 2019-2020 105.75% 95.39% 115.81% 88.02% 2.74% 4.34% 95.26% 85.35%SY 2020-2021 102.54% 94.74% 108.75%
10 - 27

Table 10.6AENROLMENT IN TERTIARY EDUCATION BY PROGRAMSY 2013-2014 to SY 2019-2020
SY 2013- SY 2014- SY 2015- SY 2016- SY 2017- SY 2018- SY 2019-2014 2015 2016 2017 2018 2019 2020
Region V 167,021 111,972 179,204 166,108 141,075 152,482 172,941
Arts and Sciences 13,337 11,953 16,990 10,287 8,450 8,330 7,321 Teacher Training and Education 45,939 26,075 45,305 49,220 44,106 43,345 52,002 Engineering and Architecture 12,322 11,038 13,943 12,231 17,653 12,452 12,741 Medical and Health Related Programs 4,542 3,130 4,686 3,429 3,809 6,240 6,924 Commerce/Business Management 33,548 23,047 33,373 32,441 24,402 30,386 31,993 Agriculture, Forestry and Fisheries 7,725 7,164 11,021 8,105 8,060 7,655 7,064 Law and Criminology Education 9,103 4,448 9,702 9,949 7,857 11,196 14,421 Information Technology 15,050 7,767 14,164 13,430 9,409 11,145 11,211 Maritime Education 5,931 5,642 6,906 5,229 2,418 2,987 3,864 Graduate Education 6,837 4,438 7,995 9,545 11,479 11,374 13,773 Trades, Crafts and Industrial Technology 12,687 7,270 15,119 12,242 3,432 7,372 11,627
Note: Partial data for SY 2014-2015 covering 74 HEIs only out of 157 HEIs.
Source: Commission on Higher Education, Regional Office V
Table 10.6BGRADUATES IN TERTIARY EDUCATION BY PROGRAMSY 2012-2013 to SY 2018-2019
SY 2012- SY 2013- SY 2014- SY 2015- SY 2016- SY 2017- SY 2018-2013 2014 2015 2016 2017 2018 2019
Region V 29,071 20,601 28,858 30,395 30,431 41,699 44,777
Arts and Sciences 4,197 1,798 2,115 2,111 2,187 2,754 3,552 Teacher Training and Education 5,501 5,221 7,319 8,977 8,894 12,420 13,591 Engineering and Architecture 1,423 1,188 1,619 1,782 1,782 3,151 2578Medical and Health Related Programs 1,750 1,022 1,001 949 949 1,272 1,494 Commerce/Business Management 5,897 4,762 6,390 6,364 6,364 9,393 9,451 Agriculture, Forestry and Fisheries 987 865 1,158 1,378 1,378 2,571 2,112 Law and Criminology Education 1,299 717 1,389 1,538 1,538 1,996 2,732 Information Technology 3,529 1,603 2,371 2,369 2,369 3,331 3,419 Maritime Education 1,244 1,201 1,386 1,548 1,548 1,236 856 Graduate Education 1,046 623 1,116 975 1,018 1,234 1,508 Trades, Crafts and Industrial Technology 2,198 1,601 2,994 2,404 2,404 2,341 3,484
Note: Data for SY 2013-2014 covers 74 HEIs only.
Source: Commission on Higher Education, Regional Office V
Program
Program
10 - 28

Table 10.7ASIMPLE LITERACY AND FUNCTIONAL LITERACY OF THE HOUSEHOLD POPULATION BY SEXREGION V2008, 2013 and 2019(Household Population in Thousands; Rates in Percent)
2008 2013 2019
Simple Literacy Household Population 10 Years Old and Over 4,205 4,281 4,665
By SexBoth Sexes 96.6 96.0 95.2Male 96.1 94.7 93.9Female 97.1 97.4 96.6
Functional Literacy Household Population 10 - 64 Years Old 3,953 3,984 4,322
By SexBoth Sexes 79.9 87.1 88.9Male 76.2 83.9 86.7Female 83.8 90.5 91.2
Source: Functional Literacy, Education and Mass Media Survey, Philippine Statistics Authority
Table 10.7BFUNCTIONAL LITERACY RATE OF POPULATION 10-64 YEARS OLDBY HIGHEST EDUCATIONAL ATTAINMENT, REGION V2008, 2013 and 2019(Rates in Percent)
2008 2013 2019
Population 10-64 Years Old 79.9 87.1 88.9
No Grade Completed 9.1 2.9 -
Elementary Level 55.7 62.4 65.5
Elementary Graduate 71.5 81.9 79.4
High School Level 85.7 91.4 92.5
High School Graduate or Higher 100.0 100.0 100.0
Note: Persons who graduated from high school or completed higher level of education are, in this tabulation, considered functionally literate.
Source: Functional Literacy, Education and Mass Media Survey, Philippine Statistics Authority
Sex / Area
Highest Educational Attainment
10 - 29
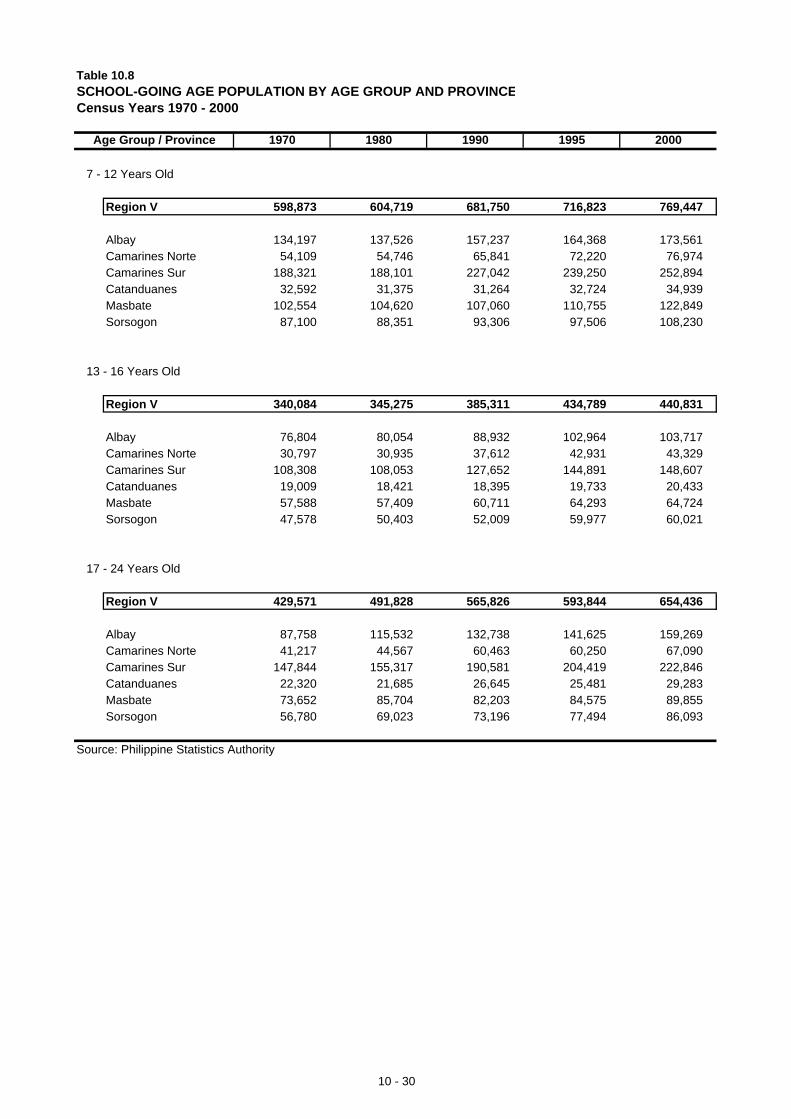
Table 10.8SCHOOL-GOING AGE POPULATION BY AGE GROUP AND PROVINCECensus Years 1970 - 2000
Age Group / Province 1970 1980 1990 1995 2000
7 - 12 Years Old
Region V 598,873 604,719 681,750 716,823 769,447
Albay 134,197 137,526 157,237 164,368 173,561Camarines Norte 54,109 54,746 65,841 72,220 76,974Camarines Sur 188,321 188,101 227,042 239,250 252,894Catanduanes 32,592 31,375 31,264 32,724 34,939Masbate 102,554 104,620 107,060 110,755 122,849Sorsogon 87,100 88,351 93,306 97,506 108,230
13 - 16 Years Old
Region V 340,084 345,275 385,311 434,789 440,831
Albay 76,804 80,054 88,932 102,964 103,717Camarines Norte 30,797 30,935 37,612 42,931 43,329Camarines Sur 108,308 108,053 127,652 144,891 148,607Catanduanes 19,009 18,421 18,395 19,733 20,433Masbate 57,588 57,409 60,711 64,293 64,724Sorsogon 47,578 50,403 52,009 59,977 60,021
17 - 24 Years Old
Region V 429,571 491,828 565,826 593,844 654,436
Albay 87,758 115,532 132,738 141,625 159,269Camarines Norte 41,217 44,567 60,463 60,250 67,090Camarines Sur 147,844 155,317 190,581 204,419 222,846Catanduanes 22,320 21,685 26,645 25,481 29,283Masbate 73,652 85,704 82,203 84,575 89,855Sorsogon 56,780 69,023 73,196 77,494 86,093
Source: Philippine Statistics Authority
10 - 30

Table 10.9 HIGHEST GRADE COMPLETED OF PRIVATE HOUSEHOLD POPULATION 5 YEARS OLDAND OVER BY PROVINCE/CITYCensus Years 2000 - 2015
Province / Grade Completed 2000 2007 a/ 2010 2015 a/
Region V 4,024,621 4,406,754 4,748,440 5,110,359
No Grade Completed 215,002 304,212 175,800 147,608Pre-School 103,104 133,605 171,156 160,108Special Education … … … 2,511
Elementary 2,054,862 2,008,527 2,116,177 2,117,4501st - 4th Grade 876,727 853,505 … 935,7345th - 7th Grade 1,178,135 266,276 … 313,752Graduate - 888,746 … 867,964
High School 1,026,067 1,298,750 1,496,160 1,768,796Undergraduate 627,009 647,741 … 819,955Graduate 399,058 651,009 … 948,841
Post Secondary 101,286 105,251 122,615 99,828Undergraduate 37,907 12,176 … 6,673Graduate 63,379 93,075 … 93,155
College Undergraduate 292,015 242,769 314,379 387,515Academic Degree Holder 124,194 273,278 328,623 412,539Post-Baccalaureate 12,468 7,617 16,294 10,138Not Stated 95,623 32,745 7,236 3,866
Albay 809,046 881,841 1,091,150 995,117
No Grade Completed 41,529 55,217 37,254 27,209Pre-School 19 801 27 478 34 889 28 944Pre School 19,801 27,478 34,889 28,944Special Education … … … 642
Elementary 410,581 393,957 458,321 396,3321st - 4th Grade 161,263 155,789 … 161,7985th - 7th Grade 249,318 47,852 … 50,811Graduate - 190,316 … 183,723
High School 212,307 264,172 346,883 345,045Undergraduate 124,792 126,043 … 148,545Graduate 87,515 138,129 … 196,500
Post Secondary 21,816 25,928 36,937 24,805Undergraduate 7,678 2,785 … 1,798Graduate 14,138 23,143 … 23,007
College Undergraduate 58,846 50,209 79,281 78,737Academic Degree Holder 23,883 57,475 91,808 90,759Post-Baccalaureate 2,044 1,381 4,462 1,732Not Stated 18,239 6,024 1,315 912
Camarines Norte 404,785 445,500 475,257 511,273
No Grade Completed 19,473 25,486 16,630 15,050Pre-School 9,952 13,666 15,428 16,442Special Education … … … 203
Elementary 202,110 197,875 203,147 204,6811st - 4th Grade 72,358 73,537 … 80,6555th - 7th Grade 129,752 22,454 … 26,025Graduate - 101,884 … 98,001
a/ Elementary covers 5th-6th grade only
Source: Philippine Statistics Authority
10 - 31

Table 10.9 - Continued
HIGHEST GRADE COMPLETED OF PRIVATE HOUSEHOLD POPULATION 5 YEARS OLDAND OVER BY PROVINCE/CITYCensus Years 2000 - 2015
Province / Grade Completed 2000 2007 a/ 2010 2015 a/
High School 115,777 145,714 163,913 195,359Undergraduate 66,480 71,259 … 87,911Graduate 49,297 74,455 … 107,448
Post Secondary 9,706 9,654 10,817 6,473Undergraduate 4,049 609 … 865Graduate 5,657 9,045 … 5,608
College Undergraduate 29,461 23,575 31,390 35,348Academic Degree Holder 11,502 25,809 29,294 36,713Post-Baccalaureate 1,027 525 1,277 923Not Stated 5,777 3,196 3,361 81
Camarines Sur 1,136,726 1,238,613 1,594,416 1,444,960
No Grade Completed 59,955 84,032 59,689 39,387Pre-School 30,481 44,522 62,248 47,463Special Education … … … 645
Elementary 583,487 566,505 679,557 615,8571st - 4th Grade 246,539 238,708 … 272,8875th - 7th Grade 336,948 76,307 … 101,515Graduate - 251,490 … 241,455
High School 298,071 378,495 513,892 511,704Undergraduate 184,812 184,695 … 235,175Graduate 113,259 193,800 … 276,5290
Post Secondary 26 413 26 870 45 209 25 885Post Secondary 26,413 26,870 45,209 25,885Undergraduate 11,773 4,190 … 1,453Graduate 14,640 22,680 … 24,432
College Undergraduate 79,757 67,278 114,631 108,009Academic Degree Holder 24,713 59,595 112,489 92,943Post-Baccalaureate 2,737 1,680 5,091 2,020Not Stated 31,112 9,636 1,610 1,047
Catanduanes 186,069 201,033 216,776 230,621
No Grade Completed 10,751 17,758 10,782 6,252Pre-School 3,871 910 3,821 6,909Special Education … … … 112
Elementary 86,736 83,728 86,286 85,3951st - 4th Grade 39,198 36,860 … 39,4445th - 7th Grade 47,538 12,962 … 13,384Graduate - 33,906 … 32,567
High School 48,670 59,458 68,470 78,604Undergraduate 29,138 31,884 … 39,281Graduate 19,532 27,574 … 39,323
Post Secondary 6,049 8,226 9,738 8,463Undergraduate 2,414 1,010 … 386Graduate 3,635 7,216 … 8,077
College Undergraduate 16,072 13,077 17,173 20,231Academic Degree Holder 9,780 15,803 18,315 22,653Post-Baccalaureate 1,165 782 2,140 1,791Not Stated 2,975 1,291 51 211
10 - 32

Table 10.9 - Continued
HIGHEST GRADE COMPLETED OF PRIVATE HOUSEHOLD POPULATION 5 YEARS OLDAND OVER BY PROVINCE/CITYCensus Years 2000 - 2015
Province / Grade Completed 2000 2007 a/ 2010 2015 a/
Masbate 596,773 646,112 717,377 772,315
No Grade Completed 44,951 67,188 31,325 30,647Pre-School 14,128 13,083 29,863 27,283Special Education … … … 73
Elementary 356,804 360,663 399,062 398,4441st - 4th Grade 186,850 183,224 … 199,4495th - 7th Grade 169,954 55,500 … 63,630Graduate - 121,939 … 135,365
High School 110,220 143,502 181,730 223,687Undergraduate 80,435 88,749 … 129,668Graduate 29,785 54,753 … 94,019
Post Secondary 8,593 5,962 7,084 8,681Undergraduate 2,496 469 … 608Graduate 6,097 5,493 … 8,073
College Undergraduate 27,786 20,783 30,789 40,736Academic Degree Holder 13,514 29,858 35,256 41,600Post-Baccalaureate 1,984 636 1,753 514Not Stated 18,793 4,437 515 650
Sorsogon 556,786 611,302 653,464 702,594
No Grade Completed 26,478 35,385 20,120 19,127Pre-School 15,858 22,424 24,907 20,109Special Education … … … 383
Elementary 290,613 283,018 289,804 284,8671st - 4th Grade 116,670 112,472 … 119,9375th - 7th Grade 173,943 35,681 … 39,087Graduate - 134,865 … 125,843
High School 146,875 188,226 221,272 263,020Undergraduate 88,409 92,056 … 116,436Graduate 58,466 96,170 … 146,584
Post Secondary 12,093 13,803 12,830 9,683Undergraduate 5,449 1,475 … 783Graduate 6,644 12,328 … 8,900
College Undergraduate 39,410 30,045 41,115 50,350Academic Degree Holder 12,596 33,089 41,461 53,424Post-Baccalaureate 1,666 669 1,571 1,085Not Stated 11,197 4,643 384 546
Iriga City 77,538 85,438 … 99,917
No Grade Completed 3,132 4,824 … 2,197Pre-School 2,696 2,687 … 3,005Special Education … … … 74
Elementary 28,913 28,372 … 30,3751st - 4th Grade 12,802 12,409 … 14,0285th - 7th Grade 16,111 3,546 … 5,164Graduate - 12,417 … 11,183
High School 23,755 28,854 … 36,292Undergraduate 12,588 12,060 … 14,019Graduate 11,167 16,794 … 22,273
10 - 33

Table 10.9 - Continued
HIGHEST GRADE COMPLETED OF PRIVATE HOUSEHOLD POPULATION 5 YEARS OLDAND OVER BY PROVINCE/CITYCensus Years 2000 - 2015
Province / Grade Completed 2000 2007 a/ 2010 2015 a/
Post Secondary 3,987 3,328 … 3,422Undergraduate 1,329 423 … 128Graduate 2,658 2,905 … 3,294
College Undergraduate 7,130 6,958 … 10,311Academic Degree Holder 6,082 9,652 … 13,805Post-Baccalaureate 410 235 … 263Not Stated 1,433 528 … 173
Legazpi City 137,245 155,646 … 177,059
No Grade Completed 5,426 7,362 … 3,917Pre-School 2,906 4,650 … 4,974Special Education … … … 165
Elementary 56,046 53,743 … 55,7541st - 4th Grade 23,139 21,700 … 24,5015th - 7th Grade 32,907 6,705 … 7,019Graduate - 25,338 … 24,234
High School 36,120 46,803 … 56,653Undergraduate 21,603 21,949 … 24,568Graduate 14,517 24,854 … 32,085
Post Secondary 7,044 5,851 … 6,346Undergraduate 1,484 299 … 338Graduate 5 560 5 552 6 008Graduate 5,560 5,552 … 6,008
College Undergraduate 15,013 14,890 … 19,720Academic Degree Holder 10,430 20,437 … 28,622Post-Baccalaureate 607 748 … 797Not Stated 3,653 1,162 … 111
Naga City 119,653 141,269 … 176,503
No Grade Completed 3,307 6,960 … 3,822Pre-School 3,411 4,185 … 4,979Special Education … … … 214
Elementary 39,572 40,666 … 45,7451st - 4th Grade 17,908 18,806 … 23,0355th - 7th Grade 21,664 5,269 … 7,117Graduate - 16,591 … 15,593
High School 34,272 43,526 … 58,432Undergraduate 18,752 19,046 … 24,352Graduate 15,520 24,480 … 34,080
Post Secondary 5,585 5,629 … 6,070Undergraduate 1,235 916 … 314Graduate 4,350 4,713 … 5,756
College Undergraduate 18,540 15,954 … 24,073Academic Degree Holder 11,694 21,560 … 32,020Post-Baccalaureate 828 961 … 1,013Not Stated 2,444 1,828 … 135
10 - 34

11 - 1
Data on labor and employment are critical inputs in the formulation of policies aimed at providing adequate employment opportunities and productive activities to the country's labor force. The labor force is the backbone of the economy. This single factor alone speaks of a vital sector that plays a crucial role in the development of the nation and the upliftment of the economic well being of the people. Data on the situation obtaining in the workplace are also necessary in enhancing policies and programs of government towards promoting harmonious labor relations and productivity. The generation of adequate, timely and reliable data is an imperative need of the formulators and implementors of our laws, policies and decisions. This chapter presents data on the number and employment status of the labor force at the regional and provincial/city levels. On employed persons, the data presented include the number of hours worked, the major industry and occupation group, and class of worker. On unemployed persons, on the other hand, the data contained in this chapter include the highest grade completed. The chapter also presents data on labor relations and workers' welfare. The data include labor turnover rates, number and membership of unions/labor organizations and collective bargaining agreements. The basic sources of data are the Philippine Statistics Authority (PSA) and the Department of Labor and Employment (DOLE). The PSA generates the data on the labor force and its employment status using the results of its quarterly Labor Force Surveys. Meanwhile, DOLE is the source of data on labor relations and welfare using the various publications released regularly by the office. Sector Highlights Labor Force Participation Rate (LFPR) in the region decreased to 59.1% in October 2020
from 61.6% in October 2019. Employment rate in October 2020 slightly decreased to 91.8% from 95.2% in October 2019. Underemployment rate in the region also decreased to 17.6% in October 2020 from 26.1% in October 2019.
Wage and salary workers accounted for 51.1% of total employed persons in October 2020.
Meanwhile, self-employed persons comprised 33.3% and unpaid family workers in own family-operated farm or business made up 8.9% of total employed persons for the same period.
The Services sector absorbed 49.5% of total employment in October 2020 displacing the
Agriculture, Hunting, Forestry and Fishery sector (AHFF) as the biggest employer of the regional economy. AHFF accounted for 32.5% of total employment. Elementary occupations accounted for 31.3% of total employed persons for the same period. About 30.4% of total employed persons in October 2020 had elementary education only.
The region contributed 3.7 percent of the total number of Overseas Filipino Workers (OFWs) in
2018. Similarly, Bicolano Overseas Contract Workers (OCW’s) constituted 3.8 percent of the total Filipino OCW’s in 2018.
A total of 49 establishments resorted to closure/retrenchment in 2019 displacing 827 workers. Of the total displaced workers, about 97.1 percent (803 workers) came from the service sector.
There were 637 Workers’ Associations in the region in 2018 with about 15,810 members. Only 7 Collective Bargaining Agreements (CBAs) covering 359 workers were filed in 2018.
No strike/lockout notice involving workers were filed and settled by the National Conciliation and
Mediation Board (NCMB) in the region in 2018.
Chapter 11 LABOR AND EMPLOYMENT

Table 11.1 Labor Force and Employment Status of Household Population 15 Yearsand Over by Sex, Region V, October 2011 - 2020 11 - 4
Table 11.2 Labor Force and Employment Status of Household Population 15 Yearsand Over, Number and Rate by Sex, October 2011 - 2020 11 - 6
Table 11.3 Employed Persons by Class of Worker and Sex, Region V, 2016 - 2020 11 - 8
Table 11.4 Employed Persons by Sex and Major Industry Group, Region V, 2017 - 2020 11 - 14
Table 11.5A Employed Persons by Sex and Major Occupation Group, Region V, 2017 11 - 18
Table 11.5B Employed Persons by Sex and Major Occupation Group, Region V, 2018- 2020 11 - 20
Table 11.6A Employed Persons by Highest Grade Completed by Sex, October 2018 11 - 22
Table 11.6B Employed Persons by Highest Grade Completed by Sex, October 2019 - 2020 11 - 23
Table 11.7A Percentage Distribution of Overseas Filipino Workers by Sex and Region2014 - 2018 11 - 24
Table 11.7B Percentage Distribution of Overseas Contract Workers by Sex and Region2014 - 2018 11 - 24
Table 11.8 Establishments Resorting to Permanent Closure/Retrenchment and WorkersDisplaced by Industry, Region V, 2009 - 2019 11 - 26
Table 11.9 Number and Membership of Labor Unions/Organizations by Sector, Region V,2009 - 2019 11 - 27
Table 11.10 Number and Membership of Existing Worker's Associations and CollectiveBargaining Agreements Filed and Workers Covered, Region V, 2007 - 2018 11 - 28
Table 11.11 Strike/Lockout Notices Handled, Filed, Disposed, Rate of Disposition andWorkers Involved, 2008 - 2018 11 - 28
Figure 11.1 Labor Force and Employment Status, Region V, October 2016 - 2020 11 - 3
Figure 11.2 Labor Force Participation Rate, Employment Rate and Unemployment Rate,Region V, October 2016 - 2020 11 - 3
Figure 11.3 Distribution of Employed Persons by Major Industry Group and Sex,Region V, October 2020 11 - 13
Figure 11.4 Employed Persons by Class of Worker and Sex, Region V, October 2020 11 - 13
Figure 11.5 Distribution of Employed Persons by Major Occupation Group and Sex,Region V, October 2020 11 - 19
Figure 11.6 Percentage Distribution of Overseas Filipino Workers by Sex, Region V,2014 - 2018 11 - 19
Figure 11.7 Distribution of Employed Persons by Highest Grade Completed and Sex,Region V, October 2018 11 - 22
Figure 11.8 Distribution of Employed Persons by Highest Grade Completed and Sex,Region V, October 2020 11 - 23
Figure 11.9 Number and Membership of Existing Labor Unions/Organizations,Region V, 2015 - 2019 11 - 27
11 - 2

Figure 11.1 LABOR FORCE AND EMPLOYMENT STATUSREGION V, OCTOBER 2016 - 2020
Figure 11.2 LABOR FORCE PARTICIPATION RATE, EMPLOYMENT RATE ANDUNEMPLOYMENT RATE, REGION V, OCTOBER 2016 - 2020
0
500
1,000
1,500
2,000
2,500
3,000
2016 2017 2018 2019 2020
In T
ho
us
an
ds
In the Labor Force Employed
95.7 95.4 95.6 95.291.8
4.3 4.6 4.4 4.88.2
62.2 62.5 61.3 61.659.1
0.0
10.0
20.0
30.0
40.0
50.0
60.0
70.0
80.0
90.0
100.0
2016 2017 2018 2019 2020
In P
erc
en
t
Employment Rate Unemployment Rate Participation Rate
11 - 3

Table 11.1
LABOR FORCE AND EMPLOYMENT STATUS OF HOUSEHOLD POPULATION15 YEARS AND OVER BY SEX, REGION VOctober 2011 - 2020(In Thousands)
Employment Status 2011 a/ 2012 2013 2014
Region V
Total Population 15 Years Old and Over 3,435 3,774 3,850 3,919
In the Labor Force 2,308 2,470 2,475 2,446
Employed 2,186 2,349 2,322 2,325
Employed working less than 40 hours a week 1/ … … 1,189 1,118
Underemployed 785 812 875 706 Visibly … … 566 454 Invisibly … … 309 252
Unemployed 122 121 153 120
Female
Total Population 15 Years Old and Over … 1,847 1,879 1,918
In the Labor Force … 927 911 881
Employed … 880 855 844
Employed working less than 40 hours a week 1/ … … 427 409
Underemployed … … 253 205 Visibly … … 157 135 Invisibly … … 95 70
Unemployed … 47 54 36
Male
Total Population 15 Years Old and Over … 1,927 1,971 2,001
In the Labor Force … 1,544 1,564 1,565
Employed … 1,469 1,467 1,481
Employed working less than 40 hours a week 1/ … … 762 708
Underemployed … … 622 501 Visibly … … 409 319 Invisibly … … 214 182
Unemployed … 74 99 84
Notes: Details may not add up to totals due to rounding.1/ Includes those with jobs but not at work during the reference week.a/ No available disaggregation by sex.
Source: Labor Force Survey, Philippine Statistics Authority
11 - 4

2015 2016 2017 2018 2019 2020
3,999 3,912 4,039 4,145 4,246 3,950
2,534 2,432 2,525 2,540 2,616 2,335
2,395 2,327 2,410 2,428 2,492 2,144
1,119 1,154 1,053 1,003 1,096 981
843 698 790 540 650 378520 450 449 340 398 260323 248 341 200 253 118
140 105 115 112 124 191
1,956 1,919 2,060 2,037 2,087 1,947
967 901 965 930 1,000 853
907 871 925 892 965 767
425 421 420 397 446 333
260 216 259 152 192 112178 145 158 103 119 78
82 72 101 49 74 34
61 30 39 38 35 86
2,043 1,993 1,979 2,108 2,160 2,003
1,567 1,531 1,560 1,610 1,616 1,482
1,488 1,456 1,485 1,536 1,527 1,377
694 733 632 605 650 649
584 482 531 388 458 266342 306 291 237 279 182242 176 240 152 179 84
79 75 76 74 89 105
11 - 5

Table 11.2LABOR FORCE AND EMPLOYMENT STATUS OF HOUSEHOLD POPULATION 15 YEARSAND OVER, NUMBER AND RATE BY SEXOctober 2011 - 2020(Number in Thousands; Rate in Percent)
Province/ 2011 a/ 2012 2013 2014Sex and Employment Status Number Rate Number Rate Number Rate Number Rate
Region V
Population 15 Years Old and Over 3,435 3,774 3,850 3,919
In the Labor Force 2,308 67.2 2,470 65.4 2,475 64.3 2,446 62.4 Employed 2,186 94.7 2,349 95.1 2,322 93.8 2,325 95.1 Unemployed 122 5.3 121 4.9 153 6.2 120 4.9
Not in the Labor Force 1,127 32.8 1,304 34.6 1,375 35.7 1,473 37.6
Female
Population 15 Years Old and Over … 1,847 1,879 1,918
In the Labor Force … … 927 50.2 911 48.5 881 45.9 Employed … … 880 94.9 855 93.9 844 95.8 Unemployed … … 47 5.1 54 5.9 36 4.1
Not in the Labor Force … … 921 49.9 971 51.7 1,037 54.1
Male
Population 15 Years Old and Over … 1,927 1,971 2,001
In the Labor Force … … 1,544 80.1 1,564 79.4 1,565 78.2 Employed … … 1,469 95.1 1,467 93.8 1,481 94.6 Unemployed … … 74 4.8 99 6.3 84 5.4
Not in the Labor Force … … 383 19.9 404 20.5 437 21.8
Notes: Details may not add up to totals due to rounding.a/ No available disaggregation by sex.
Source: Labor Force Survey, Philippine Statistics Authority
11 - 6
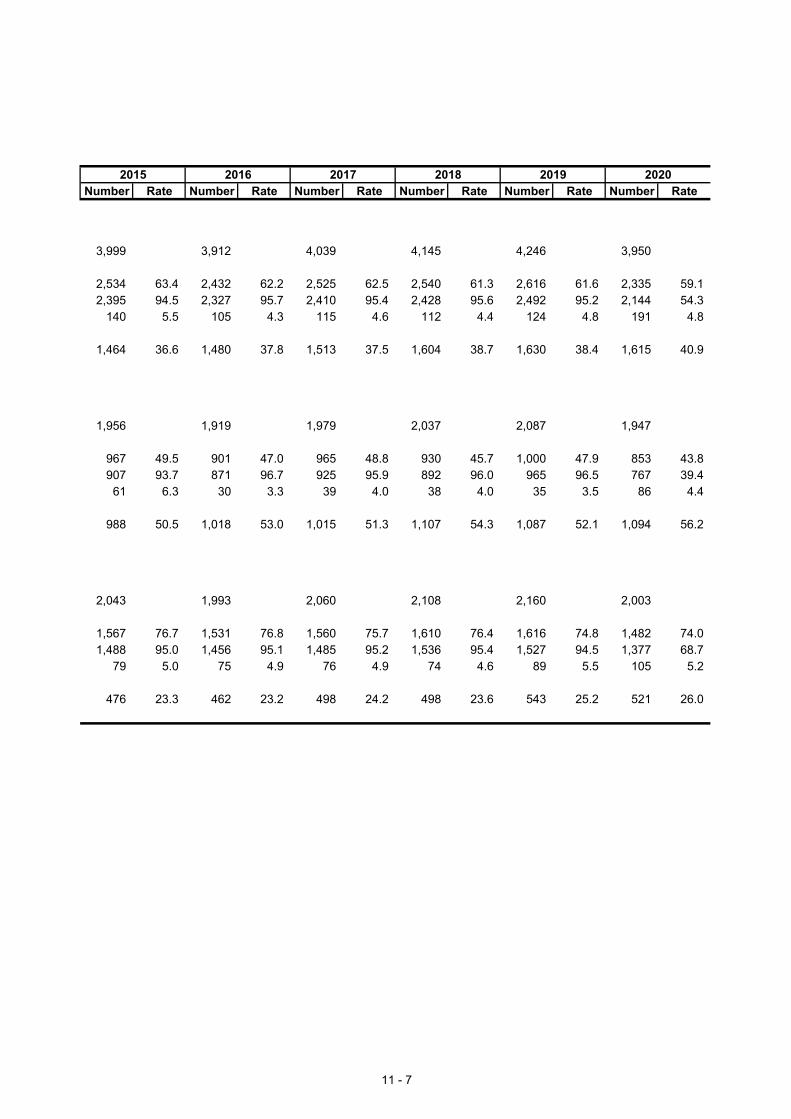
2015 2016 2017 2018 2019 2020Number Rate Number Rate Number Rate Number Rate Number Rate Number Rate
3,999 3,912 4,039 4,145 4,246 3,950
2,534 63.4 2,432 62.2 2,525 62.5 2,540 61.3 2,616 61.6 2,335 59.1 2,395 94.5 2,327 95.7 2,410 95.4 2,428 95.6 2,492 95.2 2,144 54.3
140 5.5 105 4.3 115 4.6 112 4.4 124 4.8 191 4.8
1,464 36.6 1,480 37.8 1,513 37.5 1,604 38.7 1,630 38.4 1,615 40.9
1,956 1,919 1,979 2,037 2,087 1,947
967 49.5 901 47.0 965 48.8 930 45.7 1,000 47.9 853 43.8 907 93.7 871 96.7 925 95.9 892 96.0 965 96.5 767 39.4
61 6.3 30 3.3 39 4.0 38 4.0 35 3.5 86 4.4
988 50.5 1,018 53.0 1,015 51.3 1,107 54.3 1,087 52.1 1,094 56.2
2,043 1,993 2,060 2,108 2,160 2,003
1,567 76.7 1,531 76.8 1,560 75.7 1,610 76.4 1,616 74.8 1,482 74.0 1,488 95.0 1,456 95.1 1,485 95.2 1,536 95.4 1,527 94.5 1,377 68.7
79 5.0 75 4.9 76 4.9 74 4.6 89 5.5 105 5.2
476 23.3 462 23.2 498 24.2 498 23.6 543 25.2 521 26.0
11 - 7

Table 11.3
EMPLOYED PERSONS BY CLASS OF WORKER AND SEX, REGION V2016 - 2020(In Thousands)
Sex / Class of Worker January April July October
2016Both SexesIn the Labor Force 2,509 2,522 2,397 2,432Total Employed 2,375 2,397 2,301 2,327
Wage and Salary Workers 1,306 1,233 1,205 1,227Worked for private household 121 95 101 110Worked for private establishment 941 945 901 903Worked for government or government-
controlled corporation 239 188 195 210Worked with pay in own family-operated
farm or business 5 4 7 4
Self employed without any paid employee 743 764 771 744Employer in own family-operated farm or
business 66 83 59 75Worked without pay in own family-operated
farm or business 261 317 266 280
FemaleIn the Labor Force 957 929 872 901Total Employed 901 881 834 871
Wage and Salary Workers 442 367 369 429Worked for private household 104 84 88 96Worked for private establishment 191 180 181 202Worked for government or government-
controlled corporation 145 103 100 130Worked with pay in own family-operated
farm or business 2 - * 1
Self employed without any paid employee 312 316 311 280Employer in own family-operated farm or
business 22 30 18 23Worked without pay in own family-operated
farm or business 125 169 135 138
MaleIn the Labor Force 1,552 1,593 1,525 1,531Total Employed 1,474 1,515 1,467 1,456
Wage and Salary Workers 864 867 836 798Worked for private household 17 12 13 14Worked for private establishment 751 766 720 701Worked for government or government-
controlled corporation 94 86 95 81Worked with pay in own family-operated
farm or business 4 4 7 3
Self employed without any paid employee 430 448 460 464Employer in own family-operated farm or
business 44 53 41 52Worked without pay in own family-operated
farm or business 136 148 131 142
11 - 8

Table 11.3 - Continued
EMPLOYED PERSONS BY CLASS OF WORKER AND SEX, REGION V2016 - 2020(In Thousands)
Sex / Class of Worker January April July October
2017Both SexesIn the Labor Force 2,359 2,369 2,401 2,525Total Employed 2,238 2,272 2,294 2,410
Wage and Salary Workers 1,278 1,200 1,331 1,244Worked for private household 103 102 112 101Worked for private establishment 958 884 931 928Worked for government or government-
controlled corporation 215 211 282 212Worked with pay in own family-operated
farm or business 4 2 5 5
Self employed without any paid employee 685 766 734 831Employer in own family-operated farm or
business 83 73 76 70Worked without pay in own family-operated
farm or business 192 234 156 263
FemaleIn the Labor Force 845 853 874 965Total Employed 812 820 845 925
Wage and Salary Workers 415 377 433 437Worked for private household 91 91 95 93Worked for private establishment 189 161 181 211Worked for government or government- 133 125 158 131
controlled corporation 133 125 158 131Worked with pay in own family-operated
farm or business 2 - 1 3
Self employed without any paid employee 283 301 302 330Employer in own family-operated farm or
business 24 21 24 22Worked without pay in own family-operated
farm or business 92 122 85 136
MaleIn the Labor Force 1,514 1,516 1,527 1,560Total Employed 1,425 1,452 1,449 1,485
Wage and Salary Workers 864 823 897 808Worked for private household 11 10 17 9Worked for private establishment 768 725 749 716Worked for government or government-
controlled corporation 81 87 125 82Worked with pay in own family-operated
farm or business 3 1 4 1
Self employed without any paid employee 403 465 432 502Employer in own family-operated farm or
business 58 52 51 48Worked without pay in own family-operated
farm or business 100 112 70 128
11 - 9

Table 11.3 - Continued
EMPLOYED PERSONS BY CLASS OF WORKER AND SEX, REGION V2016 - 2020(In Thousands)
Sex / Class of Worker January April July October
2018Both SexesIn the Labor Force 2,528 2,552 2,393 2,540Total Employed 2,427 2,427 2,241 2,428
Wage and Salary Workers 1,304 1,320 1,271 1,351Worked for private household 111 110 115 104Worked for private establishment 948 961 918 999Worked for government or government-
controlled corporation 237 240 234 241Worked with pay in own family-operated
farm or business 8 8 5 7
Self employed without any paid employee 750 812 735 756Employer in own family-operated farm or
business 83 86 85 70Worked without pay in own family-operated
farm or business 290 209 149 251
FemaleIn the Labor Force 928 952 852 930Total Employed 892 896 798 892
Wage and Salary Workers 411 442 410 447Worked for private household 98 100 106 95Worked for private establishment 189 207 175 199Worked for government or government-
controlled corporation 123 135 129 153Worked with pay in own family-operated
farm or business 1 2 - -
Self employed without any paid employee 299 322 283 293Employer in own family-operated farm or
business 24 23 25 24Worked without pay in own family-operated
farm or business 156 109 80 128
MaleIn the Labor Force 1,600 1,600 1,542 1,610Total Employed 1,535 1,531 1,443 1,536
Wage and Salary Workers 893 878 861 903Worked for private household 13 10 9 9Worked for private establishment 759 755 743 800Worked for government or government-
controlled corporation 113 106 105 88Worked with pay in own family-operated
farm or business 7 7 5 7
Self employed without any paid employee 450 491 452 463Employer in own family-operated farm or
business 59 63 61 46Worked without pay in own family-operated
farm or business 133 100 69 123
11 - 10

Table 11.3 - Continued
EMPLOYED PERSONS BY CLASS OF WORKER AND SEX, REGION V2016 - 2020(In Thousands)
Sex / Class of Worker January April July October
2019Both SexesIn the Labor Force 2,348 2,548 2,637 2,616Total Employed 2,220 2,399 2,506 2,492
Wage and Salary Workers 1,309 1,359 1,377 1,362Worked for private household 94 88 124 108Worked for private establishment 942 1,016 994 999Worked for government or government-
controlled corporation 259 249 247 246Worked with pay in own family-operated
farm or business 13 6 12 9
Self employed without any paid employee 699 748 758 840Employer in own family-operated farm or
business 76 46 75 53Worked without pay in own family-operated
farm or business 136 246 296 237
FemaleIn the Labor Force 881 956 993 1,000Total Employed 846 901 936 965
Wage and Salary Workers 465 440 457 468Worked for private household 87 81 112 99Worked for private establishment 230 221 205 221Worked for government or government-
controlled corporation 146 138 137 144Worked with pay in own family-operated
farm or business 2 1 3 4
Self employed without any paid employee 280 312 315 361Employer in own family-operated farm or
business 27 12 20 21Worked without pay in own family-operated
farm or business 74 137 144 115
MaleIn the Labor Force 1,467 1,592 1,644 1,616Total Employed 1,374 1,498 1,570 1,527
Wage and Salary Workers 845 918 920 894Worked for private household 8 7 12 9Worked for private establishment 713 795 789 778Worked for government or government-
controlled corporation 113 112 110 103Worked with pay in own family-operated
farm or business 11 5 9 5
Self employed without any paid employee 419 436 443 478Employer in own family-operated farm or
business 48 35 56 33Worked without pay in own family-operated
farm or business 62 108 151 122
11 - 11

Table 11.3 - Continued
EMPLOYED PERSONS BY CLASS OF WORKER AND SEX, REGION V2016 - 2020(In Thousands)
Sex / Class of Worker January April July October
2020Both SexesIn the Labor Force 2,409 2,193 2,468 2,335Total Employed 2,276 1,847 2,242 2,144
Wage and Salary Workers 1,316 970 1,216 1,182Worked for private household 91 74 93 83Worked for private establishment 945 671 849 858Worked for government or government-
controlled corporation 277 221 272 239Worked with pay in own family-operated
farm or business 3 3 3 3
Self employed without any paid employee 672 629 759 714Employer in own family-operated farm or
business 56 32 31 57Worked without pay in own family-operated
farm or business 232 217 236 192
FemaleIn the Labor Force 939 764 910 853Total Employed 896 680 820 767
Wage and Salary Workers 447 327 397 387Worked for private household 84 67 83 71Worked for private establishment 200 129 158 171Worked for government or government-
controlled corporation 163 130 155 144Worked with pay in own family-operated
farm or business 1 1 - 0
Self employed without any paid employee 301 240 289 273Employer in own family-operated farm or
business 19 7 13 10Worked without pay in own family-operated
farm or business 129 106 121 97
MaleIn the Labor Force 1,470 1,428 1,558 1,482Total Employed 1,380 1,167 1,422 1,377
Wage and Salary Workers 869 643 819 795Worked for private household 8 8 10 12Worked for private establishment 744 542 690 686Worked for government or government-
controlled corporation 114 91 116 95Worked with pay in own family-operated
farm or business 2 2 3 2
Self employed without any paid employee 371 388 470 440Employer in own family-operated farm or
business 37 25 18 46Worked without pay in own family-operated
farm or business 103 111 115 95
Note: * Less than 500
11 - 12
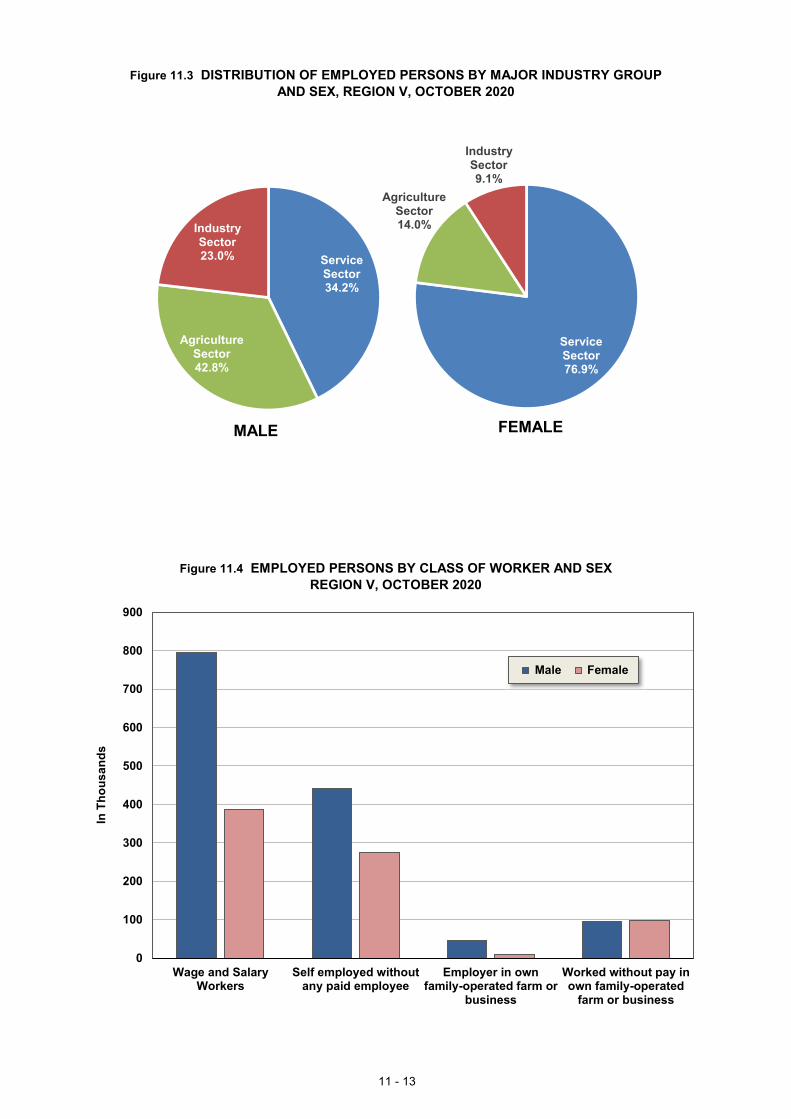
Figure 11.3 DISTRIBUTION OF EMPLOYED PERSONS BY MAJOR INDUSTRY GROUPAND SEX, REGION V, OCTOBER 2020
Figure 11.4 EMPLOYED PERSONS BY CLASS OF WORKER AND SEXREGION V, OCTOBER 2020
0
100
200
300
400
500
600
700
800
900
Wage and SalaryWorkers
Self employed withoutany paid employee
Employer in ownfamily-operated farm or
business
Worked without pay inown family-operated
farm or business
In T
ho
us
an
ds
Male Female
Service Sector 76.9%
Agriculture Sector14.0%
Industry Sector9.1%
Service Sector34.2%
Agriculture Sector42.8%
Industry Sector23.0%
MALE FEMALE
11 - 13

Table 11.4EMPLOYED PERSONS BY SEX AND MAJOR INDUSTRY GROUP, REGION V2017 - 2020(In Thousands)
2017January April July October
Region V
Both Sexes 2,238 2,272 2,294 2,410
Agriculture 742 761 616 674Agriculture and forestry 630 623 521 551Fishing and aquaculture 112 138 95 123
Industry 375 374 429 471Mining and quarrying 23 25 19 24Manufacturing 147 136 130 196Electricity, gas, steam, and air conditioning supply 4 0 3 8Water supply; sewerage, waste management and
remediation activities 3 1 5 0Construction 198 213 272 242
Services 1,121 1,137 1,249 1,265Wholesale and retail trade; repair of motor vehicles and
motorcycles 445 476 467 541Transportation and storage 154 154 142 147Accommodation and food service activities 62 54 66 95Information and communication 14 14 8 10Financial and insurance activities 15 13 32 16Real estate activities 5 3 6 6Professional, scientific and technical activities 9 5 9 5Administrative and support service activities 27 31 36 34Public administration and defense; compulsory
social security 162 158 202 150Education 55 61 82 77Human health and social work activities 18 12 29 13Arts, entertainment and recreation 23 11 18 18Other service activities 135 145 155 153Activities of households as employees; undifferentiated goods
and services-producing activities of households for own use - - - - Activities of extraterritorial organizations and bodies - - - -
Female 812 821 845 925
Agriculture 151 160 127 133Agriculture and forestry 145 158 122 124Fishing and aquaculture 6 2 5 9
Industry 56 63 61 96Mining and quarrying 1 2 1 1Manufacturing 54 61 53 92Electricity, gas, steam, and air conditioning supply - - 0 2Water supply; sewerage, waste management and
remediation activities 0 0 3 0Construction 1 - 3 1
Notes: Details may not add up to totals due to rounding.
Source: Labor Force Survey, Philippine Statistics Authority
Sex / Major Industry Group
11 - 14

2018 2019 2020January April July October January April July October January April July October
2,427 2,427 2,241 2,428 2,220 2,399 2,506 2,492 2,276 1,847 2,242 2,144
745 774 639 807 650 660 760 762 600 696 714 696623 674 518 699 524 548 599 607 484 563 597 550122 100 120 108 125 112 161 155 116 133 117 146
426 423 428 455 361 456 429 426 405 298 399 38731 10 16 26 19 33 12 14 12 11 29 18
156 159 136 139 122 146 143 141 147 124 122 1238 9 7 5 7 6 10 2 6 3 8 5
1 4 1 2 5 1 3 4 1 2 3 2230 241 268 283 208 269 261 266 238 159 237 240
1,256 1,231 1,174 1,166 1,209 1,284 1,317 1,304 1,271 853 1,129 1,061
533 470 473 467 484 546 592 514 510 332 482 441155 160 149 152 146 177 157 177 134 89 128 110
83 77 60 80 76 66 78 81 95 33 42 5410 13 4 8 18 13 8 16 12 5 8 1322 17 19 16 24 24 18 26 34 16 21 14
4 5 5 2 4 2 3 8 2 0 2 46 15 8 6 14 3 3 10 6 9 3 6
26 35 31 21 28 39 19 40 32 26 29 37
170 174 155 160 190 180 168 163 191 154 181 13169 76 89 75 68 67 84 87 81 68 77 11027 15 19 20 22 19 14 28 21 19 24 2310 16 14 14 9 17 15 11 15 4 5 9
141 158 148 145 127 129 157 6 140 98 126 109
- - - - - - - - - 0 - - - - - - - - - - - - - 0
892 896 798 892 846 901 936 965 896 680 820 767
137 170 108 167 112 136 162 177 129 152 145 107130 169 105 162 103 129 146 157 118 142 142 98
8 2 2 5 9 7 16 20 11 10 3 9
80 70 60 68 67 72 71 79 71 51 50 702 0 1 3 2 2 2 1 - 1 2 1
75 66 53 58 57 68 61 74 66 48 44 621 - 1 1 2 - 2 0 2 0 2 2
- - 1 0 2 - 1 1 0 0 - 03 3 4 5 5 2 5 4 2 2 1 5
11 - 15

Table 11.4 - Continued
EMPLOYED PERSONS BY SEX AND MAJOR INDUSTRY GROUP, REGION V2017 - 2020(In Thousands)
2017January April July October
Sex / Major Industry Group
Services 606 598 657 697Wholesale and retail trade; repair of motor vehicles and
motorcycles 276 292 279 334Transportation and storage 1 1 2 2Accommodation and food service activities 37 25 38 57Information and communication 6 9 2 5Financial and insurance activities 8 4 17 9Real estate activities 2 1 2 1Professional, scientific and technical activities 5 1 5 3Administrative and support service activities 10 5 7 7Public administration and defense; compulsory
social security 95 84 110 81Education 39 49 53 61Human health and social work activities 13 8 18 10Arts, entertainment and recreation 6 5 7 6Other service activities 109 114 117 119Activities of households as employees; undifferentiated goods
and services-producing activities of households for own use - - - - Activities of extraterritorial organizations and bodies - - - -
Male 1,425 1,452 1,449 1,485
Agriculture 591 602 489 541Agriculture and forestry 484 466 399 427Fishing and aquaculture 106 136 90 114
Industry 319 311 368 375Mining and quarrying 22 23 18 23Manufacturing 93 74 77 104Electricity, gas, steam, and air conditioning supply 4 0 2 6Water supply; sewerage, waste management and
remediation activities 3 1 2 - Construction 197 213 269 242
Services 515 539 592 569Wholesale and retail trade; repair of motor vehicles and
motorcycles 170 184 187 207Transportation and storage 153 153 140 145Accommodation and food service activities 25 29 28 38Information and communication 7 5 6 5Financial and insurance activities 7 9 14 7Real estate activities 2 2 3 4Professional, scientific and technical activities 4 4 3 2Administrative and support service activities 17 26 29 27Public administration and defense; compulsory
social security 67 74 93 69Education 17 12 29 15Human health and social work activities 5 4 11 3Arts, entertainment and recreation 16 6 11 11Other service activities 26 31 37 34Activities of households as employees; undifferentiated goods
and services-producing activities of households for own use - - - - Activities of extraterritorial organizations and bodies - - - -
11 - 16

2018 2019 2020January April July October January April July October January April July October
674 656 630 658 667 694 703 708 696 477 626 590
339 302 302 304 316 365 361 327 333 215 311 2803 5 1 2 4 5 4 4 1 2 2 3
50 41 33 48 42 37 38 44 48 18 24 282 4 1 2 9 5 4 8 1 1 4 38 10 6 11 10 12 7 14 18 11 11 91 2 3 1 2 1 1 3 1 0 2 21 6 3 4 6 1 0 5 1 3 2 25 10 5 8 9 10 5 11 3 6 8 9
81 89 70 96 96 91 84 82 105 81 89 6748 50 68 55 49 48 58 67 57 50 59 7816 10 13 11 16 16 10 20 15 11 18 19
3 6 5 6 1 3 3 3 6 1 2 3118 121 119 110 106 99 127 121 108 78 92 86
- - - - - - - - - 0 - 0- - - - - - - - - - - -
1,535 1,531 1,443 1,536 1,374 1,498 1,570 1,527 1,380 1,167 1,422 1,377
608 603 531 640 537 524 598 584 471 544 570 589493 505 413 537 422 419 453 450 366 422 455 452114 98 118 103 116 105 145 135 105 122 114 137
346 353 368 388 294 384 358 346 334 247 350 31730 9 15 23 17 31 9 13 12 9 27 1781 92 83 80 66 79 82 67 81 76 78 61
7 9 6 5 5 6 9 2 4 3 6 3
1 4 1 1 3 1 2 2 1 2 3 2227 238 264 278 203 267 256 262 236 157 235 234
581 575 544 508 542 590 614 596 575 376 503 471
195 169 171 164 168 181 230 187 177 117 171 161153 155 148 150 142 172 153 172 134 88 126 107
33 36 26 32 33 28 40 38 48 14 18 267 9 3 6 9 8 4 8 10 3 4 10
14 7 13 6 14 12 12 11 16 5 10 52 2 3 0 2 0 2 5 1 0 0 25 9 4 1 8 2 3 5 5 5 2 4
20 25 26 13 19 29 14 29 28 19 21 28
90 85 85 64 94 90 84 80 85 74 92 6420 26 21 21 18 20 27 20 24 18 18 3111 6 6 10 6 3 4 8 6 8 6 4
7 10 9 8 8 14 11 8 9 4 3 523 37 29 34 21 30 31 24 32 20 34 24
- - - - - - - - - 0 - 0- - - - - - - - - - - -
11 - 17
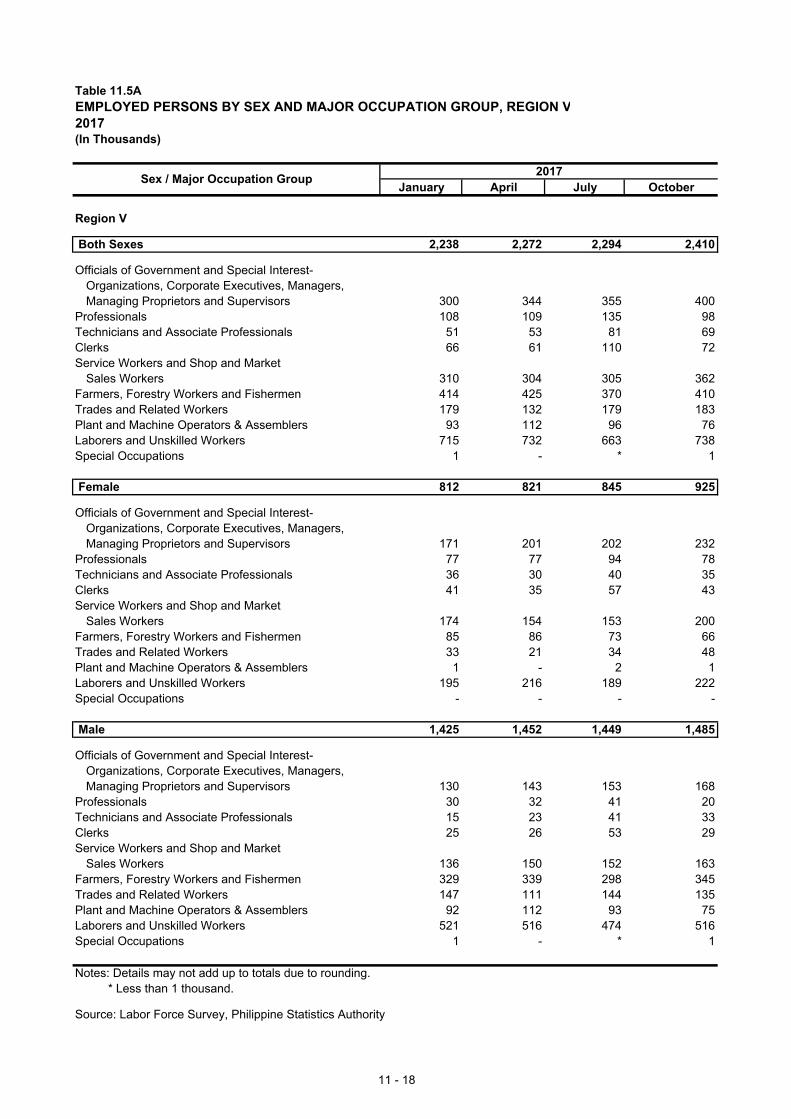
Table 11.5AEMPLOYED PERSONS BY SEX AND MAJOR OCCUPATION GROUP, REGION V2017(In Thousands)
2017January April July October
Region V
Both Sexes 2,238 2,272 2,294 2,410
Officials of Government and Special Interest-Organizations, Corporate Executives, Managers,Managing Proprietors and Supervisors 300 344 355 400
Professionals 108 109 135 98Technicians and Associate Professionals 51 53 81 69Clerks 66 61 110 72Service Workers and Shop and Market
Sales Workers 310 304 305 362Farmers, Forestry Workers and Fishermen 414 425 370 410Trades and Related Workers 179 132 179 183Plant and Machine Operators & Assemblers 93 112 96 76Laborers and Unskilled Workers 715 732 663 738Special Occupations 1 - * 1
Female 812 821 845 925
Officials of Government and Special Interest-Organizations, Corporate Executives, Managers,Managing Proprietors and Supervisors 171 201 202 232
Professionals 77 77 94 78Technicians and Associate Professionals 36 30 40 35Clerks 41 35 57 43Service Workers and Shop and Market
Sales Workers 174 154 153 200Farmers, Forestry Workers and Fishermen 85 86 73 66Trades and Related Workers 33 21 34 48Plant and Machine Operators & Assemblers 1 - 2 1Laborers and Unskilled Workers 195 216 189 222Special Occupations - - - -
Male 1,425 1,452 1,449 1,485
Officials of Government and Special Interest-Organizations, Corporate Executives, Managers,Managing Proprietors and Supervisors 130 143 153 168
Professionals 30 32 41 20Technicians and Associate Professionals 15 23 41 33Clerks 25 26 53 29Service Workers and Shop and Market
Sales Workers 136 150 152 163Farmers, Forestry Workers and Fishermen 329 339 298 345Trades and Related Workers 147 111 144 135Plant and Machine Operators & Assemblers 92 112 93 75Laborers and Unskilled Workers 521 516 474 516Special Occupations 1 - * 1
Notes: Details may not add up to totals due to rounding.* Less than 1 thousand.
Source: Labor Force Survey, Philippine Statistics Authority
Sex / Major Occupation Group
11 - 18

Figure 11.5 DISTRIBUTION OF EMPLOYED PERSONS BY MAJOR OCCUPATION GROUPAND SEX, REGION V, OCTOBER 2020
Figure 11.6 PERCENTAGE DISTRIBUTION OF OVERSEAS FILIPINO WORKERSBY SEX, REGION V: 2014 - 2018
0% 25% 50% 75% 100%
Armed forces occupations
Elementary occupations
Plant and machine operators andassemblers
Craft and related trades workers
Skilled agricultural, forestry, andfishery workers
Service and sales workers
Clerical support workers
Technicians and associateprofessionals
Professionals
Managers
Male Female
0.0
0.5
1.0
1.5
2.0
2.5
3.0
3.5
4.0
4.5
5.0
2014 2015 2016 2017 2018
In P
erc
en
t
Male Female
11 - 19

Table 11.5BEMPLOYED PERSONS BY SEX AND MAJOR OCCUPATION GROUP, REGION V2018 - 2020(In Thousands)
2018January April July October
Region V
Both Sexes 2,427 2,427 2,241 2,428
Managers 408 394 350 411Professionals 104 110 114 115Technicians and associate professionals 67 83 66 47Clerical support workers 72 82 63 67Service and sales workers 339 306 317 327Skilled agricultural, forestry, and fishery workers 358 428 386 369Craft and related trades workers 140 173 165 174Plant and machine operators and assemblers 127 106 91 96Elementary occupations 805 742 679 821Armed forces occupations 6 3 10 2
Female 892 896 798 892
Managers 229 225 204 228Professionals 72 76 87 84Technicians and associate professionals 30 45 36 30Clerical support workers 35 46 30 47Service and sales workers 188 155 170 181Skilled agricultural, forestry, and fishery workers 60 89 72 67Craft and related trades workers 25 33 25 33Plant and machine operators and assemblers 3 7 2 1Elementary occupations 250 221 170 221Armed forces occupations - - 2 -
Male 1,535 1,531 1,443 1,536
Managers 180 168 146 183Professionals 33 35 27 31Technicians and associate professionals 37 38 30 17Clerical support workers 37 37 33 21Service and sales workers 151 151 147 145Skilled agricultural, forestry, and fishery workers 298 338 314 301Craft and related trades workers 115 140 140 141Plant and machine operators and assemblers 124 99 89 95Elementary occupations 555 521 508 600Armed forces occupations 6 3 8 2
Notes: Details may not add up to totals due to rounding.* Less than 1 thousand.
Source: Labor Force Survey, Philippine Statistics Authority
Sex / Major Occupation Group
11 - 20

2019 2020January April July October January April July October
2,220 2,399 2,241 2,492 2,276 1,847 2,260 2,144
246 200 176 224 205 179 159 180120 112 110 133 119 91 118 137
80 72 54 69 63 52 63 6779 82 71 79 103 58 67 63
421 489 481 502 503 302 434 377351 352 349 413 313 366 415 396153 191 155 182 172 105 154 141119 146 90 154 122 70 116 110647 753 746 734 674 623 733 671
6 1 8 3 4 2 2 3
846 901 936 965 896 680 820 767
129 104 92 116 109 101 92 11691 68 88 103 83 67 79 9248 41 32 34 31 28 43 3845 44 37 46 53 33 39 30
273 323 338 317 320 172 271 23759 65 80 105 71 78 77 5332 48 33 46 43 27 20 38
2 3 1 4 0 0 0 2169 207 234 193 186 174 199 162
- - - - - - - -
1,374 1,498 1,570 1,527 1,380 1,167 1,422 1,377
117 96 105 108 95 77 65 6429 44 35 30 35 24 38 4532 31 28 34 31 24 20 2935 39 42 33 50 25 28 32
148 166 201 185 184 130 159 141292 287 310 308 242 288 335 343121 143 140 136 129 79 133 103117 143 100 150 121 70 115 108478 547 599 540 488 449 528 509
6 1 9 3 4 2 2 3
11 - 21

Table 11.6A
EMPLOYED PERSONS BY HIGHEST GRADE COMPLETED AND SEXOctober 2018(In Thousands)
Total Male Female
Region V
Total 2,428 1536 892
No Grade Completed 12 6 6
Elementary 859 597 262 Undergraduate 312 239 73 Graduate 547 358 189
Junior High School 947 637 311 Undergraduate 412 288 124 Graduate 535 349 187
Senior High School 40 20 20 Undergraduate 19 11 8 Graduate 21 9 12
Post Secondary 92 55 37 Undergraduate 9 7 2 Graduate 82 48 34
College 478 220 257 Undergraduate 181 109 72 Graduate 296 111 185
Note: Details may not add up to totals due to rounding. Source: Labor Force Survey, Philippine Statistics Authority
Highest Grade Completed2018
Figure 11.7 DISTRIBUTION OF EMPLOYED PERSONS BY HIGHEST GRADE COMPLETEDAND SEX, REGION V, OCTOBER 2018
0% 20% 40% 60% 80% 100%
No Grade Completed
Elementary Undergraduate
Elementary Graduate
Junior High School Undergraduate
Junior High School Graduate
Senior High School Undergraduate
Senior High School Graduate
Post Secondary Undergraduate
Post Secondary Graduate
College Undergraduate
College Graduate
Male Female
11 -22

Table 11.6B
EMPLOYED PERSONS BY HIGHEST GRADE COMPLETED AND SEXOctober 2019 - 2020(In Thousands)
Total Male Female Total Male Female
Region V
Total 2,492 1527 965 2,144 1314 830
No Grade Completed 11 7 4 8 5 3
Elementary 824 586 238 651 465 186 Undergraduate 294 222 72 269 203 66 Graduate 530 364 166 382 263 120
Junior High School 988 608 380 838 515 323 Undergraduate 385 251 134 319 208 111 Graduate 603 357 246 518 306 212
Senior High School 47 28 19 53 31 22 Undergraduate 21 11 10 24 13 11 Graduate 27 17 10 29 18 11
Post Secondary 99 59 41 88 52 36 Undergraduate 28 17 12 30 17 12 Graduate 71 42 29 59 35 24
College 522 240 283 506 230 276 Undergraduate 160 92 68 141 81 60
Graduate** 362 148 215 365 149 216
Note: Details may not add up to totals due to rounding. ** Includes post baccalaureate undergraduates and graduates(October 2020, Labor Force Survey)
Source: Labor Force Survey, Philippine Statistics Authority
AND SEX, REGION V, OCTOBER 2020Figure 11.8 DISTRIBUTION OF EMPLOYED PERSONS BY HIGHEST GRADE COMPLETED
Highest Grade Completed
2019 2020
0% 20% 40% 60% 80% 100%
No Grade Completed
Elementary Undergraduate
Elementary Graduate
Junior High School Undergraduate
Junior High School Graduate
Senior High School Undergraduate
Senior High School Graduate
Post Secondary Undergraduate
Post Secondary Graduate
College Undergraduate
College Graduate
Male Female
11-23

Table 11.7APERCENTAGE DISTRIBUTION OF OVERSEAS FILIPINO WORKERS BY SEX AND REGION2014 - 2018(In Percent)
2014 2015Both
Sexes Male Female Both Sexes Male Female
Philippines (In Thousands) 2,320 1,149 1,170 2,447 1,197 1,250
Total 100.0 100.0 100.0 100.0 100.0 100.0National Capital Region 10.5 12.5 8.6 11.0 13.0 9.0Cordillera Administrative Region 2.2 1.6 2.9 2.3 1.4 3.1I - Ilocos Region 8.2 6.4 9.9 9.5 7.9 10.9II - Cagayan Valley 6.7 3.9 9.5 6.0 3.6 8.3III - Central Luzon 15.5 18.6 12.4 15.1 17.5 12.7IVA - CALABARZON 17.9 20.7 15.1 17.9 20.4 15.5IVB - MIMAROPA 2.1 2.5 1.6 1.8 2.2 1.5V - Bicol Region 3.4 3.3 3.6 3.1 2.9 3.3VI - Western Visayas 8.6 8.4 8.7 8.7 8.0 9.4VII - Central Visayas 6.5 8.8 4.4 6.3 8.0 4.7VIII - Eastern Visayas 1.1 1.2 1.1 2.6 3.1 2.1IX - Zamboanga Peninsula 2.6 2.3 2.9 2.3 2.1 2.5X - Northern Mindanao 3.4 3.3 3.6 2.8 2.8 2.8XI - Davao Region 2.7 1.5 3.9 3.1 2.0 4.1XII - SOCCSKSARGEN 4.6 2.3 6.9 4.4 2.5 6.2XIII - Caraga 2.0 1.8 2.1 1.7 1.7 1.8Autonomous Region in Muslim Mindanao 1.8 1.0 2.7 1.5 0.9 2.1Negros Island Region
Source: Survey on Overseas Filipinos, Philippine Statistics Authority
Table 11.7BPERCENTAGE DISTRIBUTION OF OVERSEAS CONTRACT WORKERS BY SEX AND REGION2014 - 2018(In Percent)
2014 2015Both
Sexes Male Female Both Sexes Male Female
Philippines (In Thousands) 2,228 1,107 1,121 2,377 1,168 1,209
Total 100.0 100.0 100.0 100.0 100.0 100.0National Capital Region 10.6 12.8 8.6 10.9 13.1 8.8Cordillera Administrative Region 2.3 1.6 2.9 2.3 1.4 3.1I - Ilocos Region 8.3 6.4 10.2 9.6 8.0 11.2II - Cagayan Valley 7.0 3.9 9.9 6.1 3.6 8.5III - Central Luzon 15.3 18.5 12.2 15.3 17.9 12.9IVA - CALABARZON 17.7 20.9 14.6 17.8 20.3 15.4IVB - MIMAROPA 2.1 2.5 1.7 1.9 2.3 1.5V - Bicol Region 3.5 3.3 3.8 3.2 2.9 3.4VI - Western Visayas 8.8 8.6 9.0 8.8 8.2 9.4VII - Central Visayas 6.7 9.0 4.5 6.2 7.9 4.5VIII - Eastern Visayas 1.2 1.2 1.1 2.6 3.1 2.1IX - Zamboanga Peninsula 2.2 1.7 2.6 2.0 1.7 2.4X - Northern Mindanao 3.4 3.2 3.5 2.7 2.7 2.8XI - Davao Region 2.7 1.5 4.0 3.0 1.9 4.1XII - SOCCSKSARGEN 4.5 2.2 6.7 4.4 2.5 6.3XIII - Caraga 2.0 1.9 2.2 1.8 1.7 1.8Autonomous Region in Muslim Mindanao 1.6 0.7 2.6 1.4 0.7 2.0Negros Island Region
Source: Survey on Overseas Filipinos, Philippine Statistics Authority
Region
Region
11 - 24

2016 2017 2018
Both Sexes Male Female Both Sexes Male Female Both Sexes Male Female
2,240 1,040 1,200 2,240 1,040 1,200 2,299 1,016 1,284
100.0 100.0 100.0 100.0 100.0 100.0 100.0 100.0 100.012.9 16.5 9.8 12.9 16.5 9.8 9.7 10.6 9.0
1.8 1.4 2.2 1.8 1.4 2.2 1.8 1.0 2.48.4 6.6 9.9 8.4 6.6 9.9 9.7 7.4 11.65.3 3.1 7.2 5.3 3.1 7.2 6.5 3.8 8.7
12.7 14.5 11.1 12.7 14.5 11.1 14.3 17.6 11.721.0 23.4 19.0 21.0 23.4 19.0 17.9 22.3 14.4
1.9 2.0 1.7 1.9 2.0 1.7 1.8 1.9 1.74.0 3.4 4.5 4.0 3.4 4.5 3.7 3.8 3.74.9 4.5 5.1 4.9 4.5 5.1 8.9 9.6 8.34.9 6.8 3.2 4.9 6.8 3.2 5.6 6.8 4.62.1 2.3 1.9 2.1 2.3 1.9 2.2 2.3 2.02.3 2.1 2.5 2.3 2.1 2.5 2.5 2.1 2.82.6 2.6 2.5 2.6 2.6 2.5 3.5 3.6 3.43.0 2.4 3.5 3.0 2.4 3.5 3.3 2.0 4.44.3 2.4 6.0 4.3 2.4 6.0 4.6 2.3 6.51.9 1.4 2.4 1.9 1.4 2.4 1.8 1.7 1.91.9 1.0 2.8 1.9 1.0 2.8 2.1 1.2 2.94.2 3.6 4.6 4.2 3.6 4.6
2016 2017 2018
Both Sexes Male Female Both Sexes Male Female Both Sexes Male Female
2,185 1,013 1,171 2,339 1,084 1,255 2,211 973 1,239
100.0 100.0 100.0 100.0 100.0 100.0 100.0 100.0 100.013.0 16.8 9.7 9.5 11.3 7.9 9.8 10.7 9.1
1.7 1.3 2.1 2.3 1.6 3.0 1.8 1.0 2.48.6 6.8 10.1 9.0 7.4 10.4 10.0 7.6 11.85.4 3.1 7.4 6.8 4.1 9.2 6.8 3.8 9.0
12.8 14.7 11.1 12.9 14.9 11.1 14.5 18.3 11.521.2 23.6 19.1 20.7 24.2 17.8 17.6 22.0 14.1
1.9 2.0 1.7 1.8 1.7 1.9 1.5 1.8 1.34.0 3.3 4.6 3.8 3.4 4.2 3.8 3.9 3.85.0 4.7 5.2 9.5 10.0 9.1 9.0 9.9 8.44.8 6.8 3.1 6.1 9.1 3.5 5.5 6.8 4.42.1 2.3 1.9 2.1 2.6 1.6 2.3 2.4 2.12.1 1.9 2.3 2.1 1.5 2.6 2.4 2.1 2.72.6 2.7 2.6 2.5 2.4 2.6 3.5 3.5 3.52.9 2.2 3.6 3.0 1.7 4.2 3.1 1.4 4.44.4 2.4 6.1 4.2 2.0 6.2 4.8 2.4 6.71.9 1.3 2.4 1.7 1.2 2.1 1.7 1.7 1.81.5 0.5 2.4 1.9 0.9 2.7 1.9 0.6 2.94.1 3.6 4.6
11 - 25

Table 11.8ESTABLISHMENTS RESORTING TO PERMANENT CLOSURE/RETRENCHMENT ANDWORKERS DISPLACED BY INDUSTRY, REGION V2009 - 2019
Industry 2009 2010 2011 2013 2014 2015 2016 2017 2018 2019
Establishments Reporting
Total 60 78 59 48 25 54 20 54 78 49
Agriculture, Fishery and Forestry … - - - - - - - - -
Industry … 27 23 11 8 14 5 13 12 7Mining and Quarrying … 4 2 3 2 5 - 3 1 0Manufacturing … 5 3 2 2 4 1 4 0 3Construction … 13 16 3 2 3 2 1 8 1Electricity, Gas and Water … 5 2 3 2 2 2 5 3 3
Services … 51 36 37 17 40 15 41 66 42Wholesale and Retail Trade … 11 5 14 1 7 6 3 22 19Transportation, Communication
and Storage … 4 4 3 3 6 1 6 3 4Financing, Insurance, Real Estate
and Business Services … 20 16 9 3 9 2 18 40 12Community, Social and Personal
Services … 16 11 11 10 18 6 14 1 7
Displaced Workers
Total 2,489 2,945 2,521 2,078 933 1,646 197 1,544 2,017 827
Agriculture, Fishery and Forestry … - - - - - - - - -
Industry … 1,117 1,030 1,008 439 779 65 508 621 24Mining and Quarrying … 81 19 357 34 301 - 9 1 0Manufacturing … 56 3 47 70 76 8 357 0 17Construction … 929 1,000 69 171 162 27 12 608 2Electricity, Gas and Water … 51 8 535 164 240 30 130 12 5
Services … 1,828 1,491 1,070 494 867 132 1,036 1,396 803Wholesale and Retail Trade … 637 504 446 11 61 108 82 184 392Transportation, Communication
and Storage … 536 93 10 10 23 2 145 74 9Financing, Insurance, Real Estate
and Business Services … 237 714 230 225 227 3 484 1,137 83Community, Social and Personal
Services … 418 180 384 248 556 19 325 1 319
Note: No data available for 2012. 2018 Data based on the 2018 Job Displacement Monitoring System Report
Source: Department of Labor and Employment
11 - 26

Table 11.9NUMBER AND MEMBERSHIP OF LABOR UNIONS/ORGANIZATIONS BY SECTOR, REGION V2009 - 2019
Total Private Sector Unions Public Sector Unions
Number Membership Number Membership Number Membership
Region V
2009 5 216 2 48 3 168
2010 3 557 0 0 3 557
2011 11 476 7 199 4 277
2012 9 1,416 3 89 6 1,327
2013 8 402 4 166 4 236
2014 11 8,310 4 139 7 8,171
2015 4 32 4 32 0 0
2016 5 583 0 0 5 583
2017 11 1,033 1 28 10 1,005
2018 17 2,166 0 0 17 2,1662019 3 408 3 408 0 0
Notes: 1. Details on membership may not add up to totals due to rounding
2. Membership of private sector unions includes membership of federations/labor centers.
Source: Department of Labor and Employment, Bureau of Labor Relations
Figure 11.9 NUMBER AND MEMBERSHIP OF EXISTING LABOR UNIONS/ORGANIZATIONS, REGION V, 2015 - 2019
Year
32
583
1,033
2166
408 45
11
17
3
0
500
1,000
1,500
2,000
2,500
0
5
10
15
20
25
30
2015 2016 2017 2018 2019
Me
mb
ers
hip
La
bo
r U
nio
ns
Membership Labor Unions
11 - 27

Table 11.10NUMBER AND MEMBERSHIP OF EXISTING WORKERS' ASSOCIATIONS ANDCOLLECTIVE BARGAINING AGREEMENTS FILED AND WORKERS COVERED, REGION V2007 - 2018
Workers' Association Collective Bargaining Agreements Filed
Number Number
Region V
2007 87 9
2008 92 5
2009 160 5
2010 124 4
2011 232 6
2012 378 6
2013 305 7
2014 412 4
2015 373 6
2016 390 6
2017 494 7
2018 637 7
Note: Membership of workers' associations from the Online Union Registration System are not yet included
Source: Department of Labor and Employment, Bureau of Labor Relations
Table 11.11STRIKE/LOCKOUT NOTICES HANDLED, FILED, DISPOSED, RATE OF DISPOSITION ANDWORKERS INVOLVED2008 - 2018
Year
Strike/ Lockout Notices Handled
New Strike/ Lockout
Notices Filed
Cases Disposed
Settlement Rate (%)
Rate of Disposition
(%)
Workers Involved
Region V
2008 2 2 2 100.0 100.0 3962009 4 4 4 100.0 100.0 4832010 4 4 4 100.0 100.0 4322011 3 3 3 100.0 100.0 7112012 1 1 1 - 100.0 542013 2 2 - - - 5072014 2 2 2 50.0 100.0 4052015 1 1 1 100.0 100.0 292016 0 0 0 0 0 02017 0 0 0 0 0 02018 0 0 0 0 0 0
Source: Department of Labor and Employment, National Conciliation and Mediation Board
15,810 359
15,272 588
18,874 561
15,982 400
14,994 454
13,908 797
10,708 684
6,444 533
7,133 469
5,050 554
4,019 541
4,032 614
YearMembership Workers Covered
11 - 28

12 - 1
Data on social welfare serve as indicators of the results and impacts of goals, policies and programs on human development. This universal concern emphasizes people's empowerment and the care, protection and rehabilitation of the disadvantaged and special sectors of society. These sectors are the primary target clienteles of our social welfare policies and programs. The objective is to place the disadvantaged sectors of society in the mainstream of productive and economic processes. Specifically, this entails converting the disadvantaged groups into active agents and partners in development. In this manner, the fruits of growth and progress will pervade all sectors of society and the disadvantaged sectors will become beneficiaries of development. The government's Social Reform Agenda (SRA) redirects the thrusts and focus and widens the target beneficiaries of the package of programs and other interventions implemented by government, private and non-governmental institutions. In contributing to the goals of social welfare and development, the generation of data and relevant indicators is therefore of utmost necessity. The SRA, for one, underscores the need to strengthen and improve existing systems for generating data. This chapter presents data at the regional and/or provincial/city levels on the number of clients served by the various outreach and service programs of the Department of Social Welfare and Development (DSWD), number of day care centers and workers, women in especially difficult circumstances, and the number of children in need of special protection served by the DSWD. The Department, which is the source of data, compiles the information based on its administrative reporting systems. This chapter also contains data on the number of disabled persons by type of disability. The Philippine Statistics Authority processed the data based on the results of the census of population and housing. Sector Highlights Family-beneficiaries of the Pantawid Pamilyang Pilipino Program (Conditional Cash Transfer
Program) of the Department of Social Welfare and Development increased by 4.5 percent between 2019 and 2020. Meanwhile, an increase of about 59,424 households to the beneficiaries of the agency’s KALAHI-CIDSS Program in 2020 was observed.
Around 191 thousand Bicolano children were direct beneficiaries of the Pantawid Pamilyang
Pilipino Program (4Ps) of the government in 2020.
The number of women in especially difficult circumstances served by the DSWD in Region V in 2020 decreased by 23.6 percent from the 2019 level. About 29.5 percent of the cases were psychologically disturbed women.
Children in need of special protection served by the DSWD decreased by 81.2 percent between
2019 and 2020. In 2020, all barangays in the Bicol Region had been provided with Day Care Centers. The 4,580
Day Care Centers established in the barangays across the region were manned by 4,580 Day Care Workers.
Chapter 12 SOCIAL SERVICES

Table 12.1 Unduplicated Number of Clients Served by the Department of SocialWelfare and Development by Clientele Category and Sex, 2019 - 2020 12 - 3
Table 12.2 Women in Especially Difficult Circumstances (WEDC) Served by theDepartment of Social Welfare and Development, 2013 - 2020 12 - 4
Table 12.3A Number of Reported Cases of Child Sexual Abuse Served by theDepartment of Social Welfare and DevelopmentBy Type and Province, 2016 - 2020 12 - 5
Table 12.3B Number of Children in Need of Special Protection Served by theDSWD by Case Category and Sex, Region V, 2017 - 2020 12 - 6
Table 12.4 Number of Day Care Centers and Workers by Province, Region V, 2011 - 2020 12 - 8
Table 12.5A Number of Disabled Persons by Sex, Type of Disability and ProvinceCensus Year 2000 12 - 10
Table 12.5B Household Population 5 Years Old and Over by Sex,Type of Functional Difficulty and ProvinceCensus Year 2010 12 - 13
Figure 12.1 Women in Especially Difficult Circumstances, Region V, 2020 12 - 7
Figure 12.2 Children Sexually Abused, Region V, 2020 12 - 7
Figure 12.3 Household Population 5 Years Old and Over with at Least One Type of 12 - 14Functional Disability by Sex and Province, 2010
12 - 2

Table 12.1UNDUPLICATED NUMBER OF CLIENTS SERVED BY THE DEPARTMENT OF SOCIAL WELFAREAND DEVELOPMENT BY CLIENTELE CATEGORY AND SEX2019 - 2020
2019 2020Female Male Total Female Male Total
Region V FamiliesNo. of families served thru community-based services 68 23 29 52No. of HHs served under Pantawid Pamilya Pilipino Program 349,034 364,778No. of HHs served under KC NCDDP 41,529 100,953No. of COMPRE families served 84 50No. of HHs served under SLP 21,390 8,492No. of families served thru AICS 24,167 7,219 31,386 28,044No. of beneficiaries served thru UCT- UCT Listahanan 81,496 13,737- UCT Pantawid 365,082 351,729Families served under Alternative Family Care Program 13 6No. of families provided with Disaster Relief Assistance 309,946- internally displaced HH provided with disaster response services 144,601- provided with food for work 34,383- provided with Emergency Shelter Assistance 9 ESA) 9,874- provided with Cash for Work 7,314
ChildrenNo. of CNSP provided with direct services 105 81 186 13 18 31- center-based services 72 118 190 46 38 84No. of children provided with Supplemental Feeding Program 18,341 145,448No. of children served under Pantawid Pamilya Pilipino Program 384,284 88,341 103,037 191,378No. of Street children served thru COMPRE 70 50 120 120No. of children served thru Alternative Family Care Program 53 39 31 70No. of children served thru Minors Traveling abroad 219 106 99 205
YouthYouths served under the Pantawid Pamilyang Pilipino Program (4Ps) 218,305 218,536 214,728 433,264Youths served thru the Expanded Government Internship Program 77 0No. of youth served thru AICS (YNSP) 12,839 7,398 20,237 5,270 3,213 8,483No. of youth served thru Community-based Services 5 2 1 3No. of youth served thru Immersion Outreach Program 73 0No. of youth served thru Minors Travelling Abroad 83 0
WomenNo. of women served thru Community-based Services 78 78 54 54No. of women served under SLP 29,978 29,978 58 58Women beneficiaries who are leaders of SLP Associations (SLPAs) 673 673No. of women volunters trained on CDD 31,508 31,508 32,736 32,736No. of women served in center-based services 36 36No. of women served thru AICS (WEDC) 20 20
Persons with DisabilityNo. of beneficiaries served thru AICS 57 2 59 0No. of PWD served under SLP 1 4 4 8No. of PWD served thru AICS 212 213 425 156 120 276No. of PWDs served thru community-based services 3No. of PWDs provided with assistive devices 39 22 71
Senior CitizenProvided with stipend re: Social Pension for Indigent Senior Citizens 246, 142 93,386 149,313 242,699No. of Centenarians provided with cash gifts 44 38 5 43No. of SCs served thru AICS 3,918 1,247 5,165 3,430 1,315 4,745No. of SCs served under UCT Socpen 249 65,512No. of SCs served thru community-based services 27 3 8 11
Source: Department of Social Welfare and Development, Field Office V
Clientele Category
12 - 3

Table 12.2WOMEN IN ESPECIALLY DIFFICULT CIRCUMSTANCES (WEDC) SERVED BYTHE DEPARTMENT OF SOCIAL WELFARE AND DEVELOPMENT2013 - 2020
2013 2014 2015 2016
Region V 86 105 98 108
Victims of Involuntary Prostitution - - - - Victims of Illegal Recruitment - - - - Physically Abused/Maltreated/
Battered Women 2 10 3 2 Victims of Sexual Abuse 1 3 1 3
Incest - - - -Rape 1 3 1 3Acts of Lasciviousness/Attempted Rape - - - -
Victims of Trafficking 2 - - - Women in Detention - - - - Economically Abused 5 - - - Psychologically Disturbed - - Others 1/ 76 91 83 103
2017 2018 2019 2020
Region V 118 229 195 149
Victims of Involuntary Prostitution - - - - Victims of Illegal Recruitment - - - - Physically Abused/Maltreated/
Battered Women 7 6 2 Victims of Sexual Abuse 3 2 1 1
Incest - - - -Rape - - 1 1Acts of Lasciviousness/Attempted Rape - - - -
Victims of Trafficking 16 b/ 25 b/ 62 b/ 36 b/ Women in Detention - - - - Economically Abused - - - - Psychologically Disturbed - 130 73 44 Medical, Transportation, Technical Assistance 66 59 57 Others 1/ 92 - - 9
Notes:b/ Served by Recovery and Reintegration Program of Traficked Persons (RRPTP)1/ Include referrals, single parents and emotionally distressed women.Data for 2016 is as of 1st Semester.
Source: Department of Social Welfare and Development, Field Office V
Clientele Category
Clientele Category
12 - 4

Table 12.3ANUMBER OF REPORTED CASES OF CHILD SEXUAL ABUSE SERVED BY THE DSWDBY TYPE AND PROVINCE (Community-based)2016 - 2020
Attempted Acts of Victims of Victims ofRape Lasciviousness Prostitution Child Pornography
Region V 38 12 20 - 2 - 4
Albay - - - - -Camarines Norte 9 8 1 - - - -Camarines Sur 19 4 10 - 1 - 4 Catanduanes 3 - 2 - 1 - -Masbate - - - - - - -Sorsogon 7 - 7 - - - -
Region V 23 13 8 - 2 - -
Albay 1 1 - - - - -Camarines Norte 3 2 - - 1 - -Camarines Sur 15 9 6 - - -Catanduanes 1 - 1 - - - -Masbate 1 - 1 - - - -Sorsogon 2 1 - - 1 - -
Region V 11 10 1 - - - -
Albay - - - - - -Camarines Norte 1 1 - - - - -Camarines Sur 9 8 1 - - - -Catanduanes - - - - - - -Masbate - - - - - - -Sorsogon 1 1 - - - - -
Region V 8 4 3 - 1 - -
Albay 2 - 2 - - - -Camarines Norte - - - - - - -Camarines Sur 6 4 1 - 1 - -Catanduanes - - - - - - -Masbate - - - - - - -Sorsogon - - - - - - -
Region V 4 3 1 - - - -
Albay - - - - - - -Camarines Norte - - - - - - -Camarines Sur 4 3 1 - - - -Catanduanes - - - - - - -Masbate - - - - - - -Sorsogon - - - - - - -
Source: Department of Social Welfare and Development, Field Office V
IncestProvince/City Total Rape
2020
2018
2017
2016
2019
12 - 5

Table 12.3BNUMBER OF CHILDREN IN NEED OF SPECIAL PROTECTION SERVED BY THE DSWDBY CASE CATEGORY AND SEX, REGION V (Community-based)2017 - 2020
Both Sexes Female Male Both Sexes Female Male
Region V 94 50 44 137 54 83
Abandoned 2 1 1 - - -
Neglected 27 16 11 53 33 20
Voluntary Committed/Surrendered - - - - - -
Physically Abused/Maltreated 11 10 1 7 4 3
Sexually Abused 23 23 - 11 11 -
Sexually Exploited - - - - - -
Victims of Child Labor - - - - - -
Victims of Armed Conflict - - - - - -
Victims of Child Trafficking 1 - 1 - - -
Children with Disabilities - - - - - -
Children in Conflict with the Law 30 - 30 16 1 15
Child at Risk - - - 4 2 2
Others - - - 46 3 43
Both Sexes Female Male Both Sexes Female Male
Region V 245 140 105 46 29 17
Abandoned - - - - - -
Neglected 37 23 14 9 6 3
Voluntary Committed/Surrendered - - - - - -
Physically Abused/Maltreated - - - 2 1 1
Sexually Abused 13 10 3 4 4 -
Sexually Exploited - - - - - -
Victims of Child Labor - - - - - -
Victims of Armed Conflict - - - - - -
Victims of Child Trafficking - - - - - -
Children with Disabilities - - - - - -
Children in Conflict with the Law 2 - 2 - - -
Child at Risk 7 2 5 - - -
Others 186 105 81 31 18 13
Notes: Number served include new and old cases.Others: CNSP provided with services; referral, counselling, case conference, financial and medical assistance, jail visit and technical assistance, psychological evaluation, advice giving.
Source: Department of Social Welfare and Development, Field Office V
2017
2019
2018
2020Case Category
Case Category
12 - 6

Figure 12.1 WOMEN IN ESPECIALLY DIFFICULT CIRCUMSTANCES,REGION V, 2020
Figure 12.2 CHILDREN SEXUALLY ABUSED, REGION V, 2020
Rape75%
Incest25%
Psychologically Disturbed
32%
Medical, Transportation,
Technical Assistance
41%
Victims of Trafficking
26%
Victims of Sexual Abuse
1%
12 - 7

Table 12.4NUMBER OF DAY CARE CENTERS AND WORKERS BY PROVINCE, REGION V2011 - 2020
Number of Number of Barangays Percent Day Care Day Care Children Barangays with Day Care Centers Covered Centers Workers Served
2011Region V 3,471 3,086 88.9 3,914 3,958 143,704
Albay 720 634 88.1 741 760 26,243Camarines Norte 282 116 41.1 146 146 15,550Camarines Sur 1,063 1,014 95.4 1,106 1,124 33,961Catanduanes 315 252 80.0 259 260 7,112Masbate 550 549 99.8 1,009 1,012 41,379Sorsogon 541 521 96.3 653 656 19,459
2012Region V 3,471 3,236 93.2 4,633 4,723 158,994
Albay 720 634 88.1 805 821 28,366Camarines Norte 282 269 95.4 411 409 14,677Camarines Sur 1,063 1,011 95.1 1,465 1,489 47,585Catanduanes 315 252 80.0 276 276 7,966Masbate 550 549 99.8 1,037 1,041 39,799Sorsogon 541 521 96.3 639 687 20,601
2013Region V 3,471 3,270 94.2 4,648 4,723 160,277
Albay 720 644 89.4 813 813 29,956Camarines Norte 282 269 95.4 404 407 14,497Camarines Sur 1,063 1,033 97.2 1,467 1,488 47,473Catanduanes 315 254 80.6 276 276 8,354Masbate 550 549 99.8 1,050 1,054 39,361Sorsogon 541 521 96.3 638 685 20,636
2014Region V 3,471 3,471 100.0 4,775 4,793 151,555
Albay 720 720 100.0 835 835 31,381Camarines Norte 282 282 100.0 426 419 14,836Camarines Sur 1,063 1,063 100.0 1,467 1,488 47,473Catanduanes 315 315 100.0 290 290 8,665Masbate 550 550 100.0 1,050 1,054 29,016Sorsogon 541 541 100.0 707 707 20,184
2015Region V 3,471 3,471 100.0 4,775 4,793 151,555
Albay 720 720 100.0 835 835 31,381Camarines Norte 282 282 100.0 426 419 14,836Camarines Sur 1,063 1,063 100.0 1,467 1,488 47,473Catanduanes 315 315 100.0 290 290 8,665Masbate 550 550 100.0 1,050 1,054 29,016Sorsogon 541 541 100.0 707 707 20,184
Source: Department of Social Welfare and Development, Field Office V
Province
12 - 8

Table 12.4 - ContinuedNUMBER OF DAY CARE CENTERS AND WORKERS BY PROVINCE, REGION V2011 - 2020
Number of Number of Barangays Percent Day Care Day Care Children Barangays with Day Care Centers Covered Centers Workers ServedProvince
2016Region V 3,471 3,471 100.0 4,775 4,793 146,148
Albay 720 720 100.0 835 835 30,736Camarines Norte 282 282 100.0 426 419 14,646Camarines Sur 1,063 1,063 100.0 1,467 1,488 43,803Catanduanes 315 315 100.0 290 290 8,741Masbate 550 550 100.0 1,050 1,054 27,414Sorsogon 541 541 100.0 707 707 20,808
2017Region V 3,471 3,471 100.0 4,775 4,793 146,148
Albay 720 720 100.0 835 835 30,736Camarines Norte 282 282 100.0 426 419 14,646Camarines Sur 1,063 1,063 100.0 1,467 1,488 43,803Catanduanes 315 315 100.0 290 290 8,741Masbate 550 550 100.0 1,050 1,054 27,414Sorsogon 541 541 100.0 707 707 20,808
2018Region V 3,471 3,471 100.0 4,447 4,793 146,026
Albay 720 720 100.0 843 835 31,710Camarines Norte 282 282 100.0 310 419 10,523Camarines Sur 1,063 1,063 100.0 1,397 1,488 43,044Catanduanes 315 315 100.0 297 290 9,488Masbate 550 550 100.0 896 1,054 30,891Sorsogon 541 541 100.0 704 707 20,370
2019Region V 3,471 3,471 100.0 4,447 4,793 149,773
Albay 720 720 100.0 843 835 31,488Camarines Norte 282 282 100.0 310 419 14,056Camarines Sur 1,063 1,063 100.0 1,397 1,488 41,491Catanduanes 315 315 100.0 297 290 8,755Masbate 550 550 100.0 896 1,054 33,706Sorsogon 541 541 100.0 704 707 20,277
2020Region V 3,471 3,471 100.0 4,580 4,580 145,448
Albay 720 720 100.0 843 843 31,488Camarines Norte 282 282 100.0 427 427 14,420Camarines Sur 1,063 1,063 100.0 1,443 1,443 40,444Catanduanes 315 315 100.0 297 297 8,755Masbate 550 550 100.0 867 867 30,064Sorsogon 541 541 100.0 703 703 20,277
12 - 9

Table 12.5A NUMBER OF DISABLED PERSONS BY SEX, TYPE OF DISABILITY AND PROVINCECensus Year 2000
Province / Type of Disability Both Sexes Female Male
Philippines 942,098 473,332 468,766
Total Blindness 44,014 22,063 21,951Partial Blindness 76,731 38,574 38,157Low Vision 352,398 198,345 154,053Total Deafness 35,890 17,068 18,822Partial Deafness 40,983 20,003 20,980Hard of Hearing 44,725 22,474 22,251Oral Defect 50,862 23,762 27,100Loss of one or both arms/hands 36,313 14,929 21,384Loss of one or both legs/feet 43,367 16,120 27,247Quadriplegic 55,889 24,592 31,297Mentally retarded 66,113 30,919 35,194Mentally Ill 67,294 32,476 34,818Multiple Impairment 27,519 12,007 15,512
Region V 75,772 37,602 38,170
Total Blindness 3,392 1,634 1,758Partial Blindness 9,429 4,623 4,806Low Vision 25,927 14,585 11,342Total Deafness 2,744 1,224 1,520Partial Deafness 3,753 1,824 1,929Hard of Hearing 4,744 2,357 2,387Oral Defect 3,769 1,707 2,062Loss of one or both arms/hands 2,296 827 1,469Loss of one or both legs/feet 3,675 1,287 2,388Quadriplegic 4,944 2,219 2,725Mentally retarded 5,008 2,413 2,595Mentally Ill 4,104 2,071 2,033Multiple Impairment 1,987 831 1,156
Albay 17,700 8,801 8,899
Total Blindness 770 371 399Partial Blindness 2,213 1,089 1,124Low Vision 5,895 3,308 2,587Total Deafness 656 309 347Partial Deafness 855 427 428Hard of Hearing 1,153 552 601Oral Defect 913 424 489Loss of one or both arms/hands 556 220 336Loss of one or both legs/feet 845 310 535Quadriplegic 1,181 537 644Mentally retarded 1,160 571 589Mentally Ill 980 469 511Multiple Impairment 523 214 309
Source: Philippine Statistics Authority
12 - 10

Table 12.5A - Continued
NUMBER OF DISABLED PERSONS BY SEX, TYPE OF DISABILITY AND PROVINCECensus Year 2000
Province / Type of Disability Both Sexes Female Male
Camarines Norte 8,534 4,318 4,216
Total Blindness 331 167 164Partial Blindness 1,023 504 519Low Vision 3,437 1,954 1,483Total Deafness 279 122 157Partial Deafness 331 164 167Hard of Hearing 462 244 218Oral Defect 373 148 225Loss of one or both arms/hands 219 70 149Loss of one or both legs/feet 427 153 274Quadriplegic 446 211 235Mentally retarded 450 213 237Mentally Ill 563 281 282Multiple Impairment 193 87 106
Camarines Sur 27,268 13,712 13,556
Total Blindness 1,054 524 530Partial Blindness 4,006 2,006 2,000Low Vision 10,223 5,740 4,483Total Deafness 912 405 507Partial Deafness 1,277 602 675Hard of Hearing 1,710 859 851Oral Defect 1,147 550 597Loss of one or both arms/hands 630 234 396Loss of one or both legs/feet 1,226 441 785Quadriplegic 1,495 645 850Mentally retarded 1,839 868 971Mentally Ill 1,130 584 546Multiple Impairment 619 254 365
Catanduanes 3,710 1,758 1,952
Total Blindness 142 55 87Partial Blindness 360 159 201Low Vision 1,029 569 460Total Deafness 134 58 76Partial Deafness 221 101 120Hard of Hearing 254 122 132Oral Defect 222 94 128Loss of one or both arms/hands 68 25 43Loss of one or both legs/feet 262 83 179Quadriplegic 296 138 158Mentally retarded 293 145 148Mentally Ill 290 155 135Multiple Impairment 139 54 85
12 - 11

Table 12.5A - Continued
NUMBER OF DISABLED PERSONS BY SEX, TYPE OF DISABILITY AND PROVINCECensus Year 2000
Province / Type of Disability Both Sexes Female Male
Masbate 8,644 4,202 4,442
Total Blindness 570 294 276Partial Blindness 674 331 343Low Vision 2,470 1,373 1,097Total Deafness 331 137 194Partial Deafness 474 231 243Hard of Hearing 540 275 265Oral Defect 547 249 298Loss of one or both arms/hands 472 158 314Loss of one or both legs/feet 375 126 249Quadriplegic 935 415 520Mentally retarded 554 253 301Mentally Ill 509 276 233Multiple Impairment 193 84 109
Sorsogon 9,916 4,811 5,105
Total Blindness 525 223 302Partial Blindness 1,153 534 619Low Vision 2,873 1,641 1,232Total Deafness 432 193 239Partial Deafness 595 299 296Hard of Hearing 625 305 320Oral Defect 567 242 325Loss of one or both arms/hands 351 120 231Loss of one or both legs/feet 540 174 366Quadriplegic 591 273 318Mentally retarded 712 363 349Mentally Ill 632 306 326Multiple Impairment 320 138 182
12 - 12

Table 12.5B HOUSEHOLD POPULATION 5 YEARS OLD AND OVER BY SEX,TYPE OF FUNCTIONAL DIFFICULTY AND PROVINCECensus Year 2010
Province / Type of Disability Both Sexes Male Female
Region VHousehold population 5 years old and over with at least one type 198,949 94,238 104,711of functional difficulty Difficulty in seeing, even if wearing eyeglasses 136,061 60,874 75,187 Difficulty in hearing, even if using a hearing aid 43,958 21,733 22,225 Difficulty in walking or climbing steps 47,013 23,475 23,538 Difficulty in remembering or concentrating 27,214 12,226 14,988 Difficulty in self-caring (bathing or dressing) 17,581 8,437 9,144 Difficulty in communicating 23,084 12,076 11,008
AlbayHousehold population 5 years old and over with at least one type 45,436 21,189 24,247of functional difficulty Difficulty in seeing, even if wearing eyeglasses 31,012 13,553 17,459 Difficulty in hearing, even if using a hearing aid 10,050 4,888 5,162 Difficulty in walking or climbing steps 11,058 5,488 5,570 Difficulty in remembering or concentrating 5,844 2,634 3,210 Difficulty in self-caring (bathing or dressing) 4,099 1,992 2,107 Difficulty in communicating 5,145 2,703 2,442
Camarines NorteHousehold population 5 years old and over with at least one type 16,016 7,804 8,212of functional difficulty Difficulty in seeing, even if wearing eyeglasses 10,222 4,655 5,567 Difficulty in hearing, even if using a hearing aid 3,300 1,616 1,684 Difficulty in walking or climbing steps 4,029 2,029 2,000 Difficulty in remembering or concentrating 2,408 1,034 1,374 Difficulty in self-caring (bathing or dressing) 1,558 740 818 Difficulty in communicating 2,119 1,151 968
Camarines SurHousehold population 5 years old and over with at least one type 80,811 38,227 42,584of functional difficulty Difficulty in seeing, even if wearing eyeglasses 58,235 26,190 32,045 Difficulty in hearing, even if using a hearing aid 17,906 8,978 8,928 Difficulty in walking or climbing steps 17,016 8,468 8,548 Difficulty in remembering or concentrating 10,837 4,851 5,986 Difficulty in self-caring (bathing or dressing) 6,397 3,045 3,352 Difficulty in communicating 8,353 4,294 4,059
CatanduanesHousehold population 5 years old and over with at least one type 3,876 1,944 1,932of functional difficulty Difficulty in seeing, even if wearing eyeglasses 1,351 638 713 Difficulty in hearing, even if using a hearing aid 940 461 479 Difficulty in walking or climbing steps 1,350 688 662 Difficulty in remembering or concentrating 1,041 456 585 Difficulty in self-caring (bathing or dressing) 784 388 396 Difficulty in communicating 1,087 579 508
Source: Philippine Statistics Authority
12 - 13

Table 12.5B - Continued
HOUSEHOLD POPULATION 5 YEARS OLD AND OVER BY SEX,TYPE OF FUNCTIONAL DIFFICULTY AND PROVINCECensus Year 2010
Province / Type of Disability Both Sexes Male Female
MasbateHousehold population 5 years old and over with at least one type 23,386 11,252 12,134of functional difficulty Difficulty in seeing, even if wearing eyeglasses 15,456 7,059 8,397 Difficulty in hearing, even if using a hearing aid 5,035 2,552 2,483 Difficulty in walking or climbing steps 6,527 3,289 3,238 Difficulty in remembering or concentrating 3,256 1,525 1,731 Difficulty in self-caring (bathing or dressing) 2,076 1,049 1,027 Difficulty in communicating 2,840 1,499 1,341
SorsogonHousehold population 5 years old and over with at least one type 29,424 13,822 15,602of functional difficulty Difficulty in seeing, even if wearing eyeglasses 19,785 8,779 11,006 Difficulty in hearing, even if using a hearing aid 6,727 3,238 3,489 Difficulty in walking or climbing steps 7,033 3,513 3,520 Difficulty in remembering or concentrating 3,828 1,726 2,102 Difficulty in self-caring (bathing or dressing) 2,667 1,223 1,444 Difficulty in communicating 3,540 1,850 1,690
Figure 12.3 HOUSEHOLD POPULATION 5 YEARS OLD AND OVER
BY SEX AND PROVINCE, 2010WITH AT LEAST ONE TYPE OF FUNCTIONAL DISABILITY
0
5,000
10,000
15,000
20,000
25,000
30,000
35,000
40,000
45,000
Albay CamarinesNorte
Camarines Sur Catanduanes Masbate Sorsogon
Male Female
12 - 14

13 - 1
Data on the extent and coverage of the transportation and communication networks of an area are essential. The data provide the planners and decision makers in the government and in entrepreneurial ventures with a sound basis to improve the state of their infrastructures. Specifically, planners use the data in the formulation of strategies that will link the locality with its neighbors within and outside the country. The different modes of transportation and channels and media for communication are vital in the economic, social and cultural lives of peoples and institutions in the community. A well-developed transportation system ensures fast and efficient transfer of goods and services between traders, households and other institutions within and outside the geographical limits of the community. Similarly, breakthrough in the communication system accelerates the flow of information. This era of information technology enables a faster access to and dissemination of news, events and developments in the domestic and international scene. The business community receives vital information that can expand the market for their products and services. The continuous provision of data on the transportation and communication systems of an area therefore becomes indispensable in charting the course towards socioeconomic development and cultural upliftment of the area. This chapter presents data on all modes of transportation at the regional and provincial levels. On the land transport, the data presented include the registration of motor vehicles and permits/licenses issued by the Land Transportation Office and franchise applications approved by the Land Transportation Franchising and Regulatory Board. The data presented also include road length and the number and length of bridges. The Department of Public Works and Highways is the source of data. On the air mode of transport, this chapter also shows data covering the movement of aircraft and the volume of passengers and cargo handled. The Civil Aviation Authority of the Philippines is the source of data. Shipping statistics from the Philippine Ports Authority are likewise presented. For the communication sector, the chapter provides data on the number of telecommunication facilities, licensed radio stations, telegraph stations, telephone distribution, existing cell sites and households with internet access. The sources of data are the National Telecommunications Commission, the Telecommunications Office, and the Philippine Statistics Authority. Sector Highlights Registration of motor vehicles decline by -7.98 percent between 2019 and 2020. Registration of
Utility Vehicles recorded a decrease with -.44 percent growth. Provinces recorded an increased in motor vehicle registration were Masbate Province having the highest with 9.35 percent growth in registration, followed by Camarines Sur with 4.04 percent and Sorsogon with 4.23 percent , while the other three provinces (Camarines Norte -55.56 percent, Albay -8.07 percent and Catanduanes 29.12 percent) registered a decreased brought about by the Pandemic. Motorcycles/tricycles comprised 76.2 percent of the total vehicle registered. About 89.4 percent of vehicles registered in 2020 were private vehicles. New registrations accounted for 18.2 percent of total registrations.
1,409.52 kilometers of the 2,389.23-kilometer national roads in the Bicol Region were concrete paved in 2019 bringing the proportion of concrete national roads in the region to 59.0 percent.
The Land Transportation Franchising and Regulatory Board (LTFRB) in the region approved
1,236 franchise applications in 2016 covering 1,568 units of for hire vehicles, 8.4 percent lower than approvals in 2015. Nearly half of the approved franchises were for public utility jeepneys.
Chapter 13 TRANSPORTATION AND COMMUNICATION

13 - 2
Sector Highlights (Continued)
Aircraft movement in the operating airports in the region decreased by 22.6 percent. Total
passenger traffic down by 80.7 percent, with both incoming and outgoing traffic decreasing by 81.31 percent and 80.07 percent respectively. Volume of incoming cargo also decreased by 68.56 percent.
Total cargo throughput in the various ports within the region decreased by 26.9 percent
between 2019 and 2020. Exports and imports had a remarkable decreased by 53.4 percent and 49.6 percent for 2020 respectively. Disembarking passengers in the various seaports within the region also decreased by 70.0 percent.
A 2.1 percent increase was recorded in the number of licensed radio stations between 2019
and 2020. Transactions in the operational telegraph stations in the region continued to drop with volume
decreasing by 9.3 percent and value by 22.0 percent between 2011 and 2012. Around 3.7 percent of the 1,111,753 households in 2010 had internet access from their homes
while 8.1 percent access the internet from elsewhere. In 2020, the two major mobile phone service providers, Globe and Smart (Sun Cellular
merged with Smart) had a total of 875 cell sites in the region.

Table 13.1A Number of Motor Vehicles Registered by Classification and Province2013 - 2020 13 - 4
Table 13.1B Number of Motor Vehicles Registered by Type of Vehicle and Province2013 - 2020 13 - 5
Table 13.2 Number of Motor Vehicles Registered, New and Renewal, by Classification,2011 - 2020 13 - 7
Table 13.3 Number of Permits/Licenses Issued by Province, 2011 - 2020 13 - 7
Table 13.4 Number of Motor Vehicles Registered by Classification, Type of FuelUsed and Province, 2013 - 2020 13 - 8
Table 13.5 Number of Franchise Applications Approved by Type of Vehicleand Province, 2014 - 2016 13 - 12
Table 13.6 Existing National Road Length by Surface Type and Province/City2011 - 2019 13 - 14
Table 13.7 Number and Length of Existing National Bridges by Province/City2011 - 2019 13 - 16
Table 13.8 Aircraft Movement, Passengers Carried and Volume of Cargo by Airport2011 - 2020 13 - 18
Table 13.9 Total Shipping Statistics by Port, 2017 - 2020 13 - 20
Table 13.10 Number of Licensed Radio Stations by Type of Station, 2017 - 2020 13 - 29
Table 13.11 Telephone Distribution by Province, 2016 - 2020 13 - 30
Table 13.12 Number of Public Telegraph Stations by Province, 2003 - 2012 13 - 31
Table 13.13 Volume and Value of Telegraphic Messages Sent by Province, 2006 - 2012 13 - 32
Table 13.14 Households with Internet Access by Province/City: 2010 13 - 34
Table 13.15 Number of Existing Cell Sites in Bicol Region: As of December 2020 13 - 35
Figure 13.1 Registered Motor Vehicles by Classification, Region V, 2019 - 2020 13 - 6
Figure 13.2 Existing National Road Length by Surface Type, Region V, 2015 - 2019 13 - 15
Figure 13.3 Total Cargo Throughput, Region V, 2020 13 - 28
Figure 13.4 Total Passenger Traffic, Region V, 2017 - 2020 13 - 28
Figure 13.5 Number of Existing Cell Sites by Province, 2020 13 - 37
Figure 13.6 Distribution of Telephone Lines by Province, 2019 13 - 36
Figure 13.7 Number of Licensed Radio Stations by Type of Station, Region V2017 - 2020 13 - 36
13 - 3

Table 13.1ANUMBER OF MOTOR VEHICLES REGISTERED BY CLASSIFICATION AND PROVINCE2013 - 2020
Province/Classification 2013 2014 2015 2016 2017 2018 2019 2020
Region V 259,714 282,284 314,437 350,819 396,367 460,370 495,019 455,474
Private 219,974 242,051 271,089 306,143 345,903 409,672 439,874 407,244Government 2,131 2,210 2,371 2,499 2,579 2,785 3,179 2,687 Diplomatic - - - - - - - - For Hire 37,609 38,023 40,977 42,177 47,885 47,913 51,966 45,543 Exempt - - - - - - - -
Albay 84,875 126,640 151,565 173,879 197,292 230,449 231,757 213,058
Private 73,070 113,679 137,505 159,369 183,095 215,585 215,893 196,618Government 769 822 1,028 1,007 955 1,204 1,219 1,069 Diplomatic - - - - - - - - For Hire 11,036 12,139 13,032 13,503 13,242 13,660 14,645 15,371
Camarines Norte 31,336 27,601 31,764 31,382 34,442 34,842 44,253 19,665
Private 24,911 20,899 24,295 24,552 25,797 27,131 35,734 15,271 Government 212 234 190 215 274 269 317 227 Diplomatic - - - - - - - - For Hire 6,213 6,468 7,279 6,615 8,371 7,442 8,202 4,167
Camarines Sur 89,746 86,830 88,490 95,766 106,490 129,154 141,918 147,649
Private 77,940 75,261 75,761 83,175 93,416 114,891 127,101 134,315Government 720 690 749 805 808 815 1,083 909 Diplomatic - - - - - - - - For Hire 11,086 10,879 11,980 11,786 12,266 13,448 13,734 12,425
Catanduanes 10,507 9,369 8,230 8,812 10,255 13,353 16,766 11,884
Private 8,866 7,619 6,664 7,177 8,395 11,122 14,283 10,369 Government 61 94 59 107 96 113 143 37 Diplomatic - - - - - - - - For Hire 1,580 1,656 1,507 1,528 1,764 2,118 2,340 1,478
Masbate 18,024 11,549 11,860 15,101 15,956 16,661 20,652 22,583
Private 15,398 9,419 9,942 12,642 12,418 13,610 17,011 18,833 Government 95 54 63 62 110 77 134 180 Diplomatic - - - - - - - - For Hire 2,531 2,076 1,855 2,397 3,428 2,974 3,507 3,570
Sorsogon 25,226 20,295 22,528 25,879 31,932 35,911 39,673 40,635
Private 19,789 15,174 16,922 19,228 22,782 27,333 29,852 31,838 Government 274 316 282 303 336 307 283 265 Diplomatic - - - - - - - - For Hire 5,163 4,805 5,324 6,348 8,814 8,271 9,538 8,532
Source: Land Transportation Office, Regional Office V
13 - 4

Table 13.1B NUMBER OF MOTOR VEHICLES REGISTERED BY TYPE OF VEHICLE AND PROVINCE2013 - 2020
Province/Type of Vehicle 2013 2014 2015 2016 2017 2018 2019 2020
Region V 259,714 282,284 314,437 350,819 396,367 460,370 495,019 455,474
Cars 10,592 12,188 13,711 15,776 17,546 20,069 23,239 25,618Utility Vehicles 39,017 39,976 42,263 44,927 49,771 51,336 55,360 55,114Buses 867 1,045 1,168 1,126 1,157 1,242 1,315 1,076Trucks 9,850 9,418 10,487 10,974 11,747 12,570 12,811 12,738Motorcycles/Tricycles 195,308 214,011 240,735 270,759 306,905 364,112 389,306 347,118Trailers 396 847 516 535 600 671 727 695Sports Utility Vehicles 3,684 4,799 5,557 6,722 8,641 10,370 12,261 13,115
Albay 83,493 126,640 151,565 173,879 197,292 230,449 231,757 213,058
Cars 4,290 5,355 6,474 7,726 8,533 9,204 10,429 12,070 Utility Vehicles 12,733 13,845 15,468 16,593 18,034 18,941 20,220 22,103 Buses 414 350 455 482 355 415 403 392 Trucks 3,086 2,984 3,367 3,550 3,679 4,024 4,052 4,578 Motorcycles/Tricycles 61,483 102,011 123,072 142,241 162,472 193,131 191,436 167,911 Trailers 183 213 268 248 252 264 297 281 Sports Utility Vehicles 1,304 1,882 2,461 3,039 3,967 4,470 4,920 5,723
Camarines Norte 31,336 27,601 31,764 31,382 34,442 34,842 44,253 19,665
Cars 711 763 824 851 1,027 1,196 1,560 832 Utility Vehicles 3,613 3,954 3,897 3,839 4,477 4,154 4,873 2,368 Buses 178 204 202 122 211 220 135 102 Trucks 921 940 1,116 917 1,038 1,094 1,208 653 Motorcycles/Tricycles 25,535 21,331 25,242 25,080 26,951 27,390 35,538 15,128 Trailers 35 16 16 30 52 39 45 63 Sports Utility Vehicles 343 393 467 543 686 749 894 519
Camarines Sur 91,128 86,830 88,490 95,766 106,490 129,154 141,918 147,649
Cars 4,480 4,946 5,203 5,820 6,329 7,720 9,010 10,038 Utility Vehicles 16,854 16,487 17,004 17,921 19,302 21,156 22,196 22,378 Buses 203 419 453 467 512 556 710 529 Trucks 4,092 3,809 4,334 4,610 4,992 5,438 5,257 5,081 Motorcycles/Tricycles 63,848 58,695 59,386 64,465 72,266 90,086 99,533 104,381 Trailers 168 604 204 217 226 290 323 311 Sports Utility Vehicles 1,483 1,870 1,906 2,266 2,863 3,908 4,889 4,931
Catanduanes 10,507 9,369 8,230 8,812 10,255 13,353 16,766 11,884
Cars 95 152 149 173 189 320 400 353 Utility Vehicles 989 975 852 842 948 1,158 1,371 1,220 Buses 10 25 9 11 12 18 16 2 Trucks 299 306 266 220 236 367 451 364 Motorcycles/Tricycles 9,012 7,756 6,809 7,385 8,667 11,220 14,199 9,590 Trailers - 1 2 2 4 9 11 9 Sports Utility Vehicles 102 154 143 179 199 261 318 346
Source: Land Transportation Office, Regional Office V
13 - 5

Table 13.1B - ContinuedNUMBER OF MOTOR VEHICLES REGISTERED BY TYPE OF VEHICLE AND PROVINCE2013 - 2020
Province/Type of Vehicle 2013 2014 2015 2016 2017 2018 2019 2020
Masbate 18,024 11,549 11,860 15,101 15,956 16,661 20,652 22,583
Cars 173 156 180 223 282 302 335 477 Utility Vehicles 1,705 1,590 1,717 2,081 2,247 1,901 2,362 2,634 Buses 62 43 35 26 44 18 45 46 Trucks 764 669 661 821 789 737 805 916 Motorcycles/Tricycles 15,121 8,865 9,015 11,653 12,187 13,337 16,575 17,826 Trailers 2 2 2 4 19 3 14 15 Sports Utility Vehicles 197 224 250 293 388 363 516 669
Sorsogon 25,226 20,295 22,528 25,879 31,932 35,901 39,673 40,635
Cars 843 816 881 983 1,186 1,327 1,505 1,848 Utility Vehicles 3,123 3,125 3,325 3,651 4,763 4,026 4,338 4,411 Buses - 4 14 18 23 15 6 5 Trucks 688 710 743 856 1,013 910 1,038 1,146 Motorcycles/Tricycles 20,309 15,353 17,211 19,935 24,362 28,948 32,025 32,282 Trailers 8 11 24 34 47 56 37 16 Sports Utility Vehicles 255 276 330 402 538 619 724 927
Figure 13.1 REGISTERED MOTOR VEHICLES BY CLASSIFICATION REGION V, 2019 - 2020
0
50
100
150
200
250
300
350
400
450
500
2019 2020
Nu
mb
er
of
Re
gis
tere
d M
oto
r V
eh
icle
s Th
ou
sa
nd
s
Private For Hire Government
13 - 6

Table 13.2NUMBER OF MOTOR VEHICLES REGISTERED, NEW AND RENEWAL, BY CLASSIFICATION2011 - 2020
Classification 2011 2012 2013 2014 2015 2016 2017 2018 2019 2020
Region V
Total 224,365 244,386 259,714 282,284 314,437 350,819 396,367 460,370 495,019 455,474
Private 185,829 203,245 219,974 242,051 271,089 306,143 345,901 409,672 439,874 407,244 Government 1,954 2,105 2,131 2,210 2,371 2,499 2,581 2,785 3,179 2,687 Diplomatic - - - - - - - - - - For Hire 36,582 39,036 37,609 38,023 40,977 42,177 47,885 47,913 51,966 45,543 Exempt - - - - - - - - - -
New 41,246 40,070 52,590 60,705 71,120 83,895 100,533 118,272 106,329 82,740
Private 40,098 39,031 51,498 60,094 70,858 83,612 100,261 117,854 105,933 82,502 Government 77 127 134 66 220 283 272 418 396 238 Diplomatic - - - - - - - - - - For Hire 1,071 912 958 545 42 - - - - - Exempt - - - - - - - - - -
Renewal 183,119 204,316 207,124 221,579 243,317 266,924 295,834 342,098 388,690 372,734
Private 145,731 164,214 168,476 181,957 200,231 222,531 245,640 291,818 333,941 324,742 Government 1,877 1,978 1,997 2,144 2,151 2,216 2,309 2,367 2,783 2,449 Diplomatic - - - - - - - - - - For Hire 35,511 38,124 36,651 37,478 40,935 42,177 47,885 47,913 51,966 45,543 Exempt - - - - - - - - - -
Source: Land Transportation Office, Regional Office V
Table 13.3NUMBER OF PERMITS/LICENSES ISSUED BY PROVINCE2011 - 2020
Province 2011 2012 2013 2014 2015 2016 2017 2018 2019 2020
Region V 145,326 162,698 160,606 194,407 239,297 214,664 247,268 284,739 272,285 124,492
Albay 44,629 52,153 49,676 64,432 89,576 69,040 92,689 61,767 85,074 38,637
Camarines Norte 18,895 20,241 19,137 22,810 24,256 21,339 26,427 38,856 30,487 16,035
Camarines Sur 50,098 56,142 55,869 70,665 81,515 80,671 73,337 120,497 98,076 43,503
Catanduanes 5,931 5,219 6,244 8,184 6,979 5,687 7,691 16,208 11,187 6,195
Masbate 10,854 13,591 13,202 11,078 16,763 16,125 19,490 31,203 21,761 8,241
Sorsogon 14,919 15,352 16,478 17,238 20,208 21,802 27,634 16,208 25,700 11,881
Source: Land Transportation Office, Regional Office V
13 - 7

Table 13.4NUMBER OF MOTOR VEHICLES REGISTERED BY CLASSIFICATION, TYPE OF FUEL USEDAND PROVINCE2013 - 2020
Year / Total PrivateProvince Gas Diesel CNG LPG LEV Others Gas Diesel CNG LPG LEV Others
2013
Region V 213,494 45,824 - - - - 185,530 34,134 - - -
Albay 67,553 15,757 - - - - 59,851 11,903 - - -Camarines Norte 27,014 4,287 - - - - 21,570 3,315 - - -Camarines Sur 71,961 18,999 - - - - 65,516 13,466 - - -Catanduanes 9,344 1,163 - - - - 7,790 1,076 - - -Masbate 15,814 2,208 - - - - 13,463 1,933 - - -Sorsogon 21,808 3,410 - - - - 17,340 2,441 - - -
2014
Region V 236,864 44,573 - - - - 206,007 35,289 - - -
Albay 110,323 16,104 - - - - 101,066 12,440 - - -Camarines Norte 22,998 4,587 - - - - 17,363 3,524 - - -Camarines Sur 69,066 17,160 - - - - 60,820 13,884 - - -Catanduanes 8,175 1,193 - - - - 6,549 1,069 - - -Masbate 9,500 2,047 - - - - 7,576 1,841 - - -Sorsogon 16,802 3,482 - - - - 12,633 2,531 - - -
2015
Region V 265,006 48,915 - - - - 236,645 39,017 - - -
Albay 133,142 18,155 - - - - 123,201 14,083 - - -Camarines Norte 27,146 4,602 - - - - 20,603 3,678 - - -Camarines Sur 70,549 17,737 - - - - 66,507 14,088 - - -Catanduanes 5,610 2,618 - - - - 4,121 2,541 - - -Masbate 9,715 2,143 - - - - 8,007 1,933 - - -Sorsogon 18,844 3,660 - - - - 14,206 2,694 - - -2016
Region V 297,038 53,196 - 38 12 - 261,791 43,934 - - -
Albay 153,241 20,352 - 38 12 - 142,005 17,160 - - -Camarines Norte 27,205 4,147 - - - - 21,161 3,382 - - -Camarines Sur 74,584 20,953 - - - - 65,547 17,462 - - -Catanduanes 7,496 1,314 - - - - 6,320 855 - - -Masbate 12,824 2,273 - - - - 10,677 1,961 - - -Sorsogon 21,688 4,157 - - - - 16,081 3,114 - - -
Note: CNG - Compressed Natural Gas; LPG - Liquified Petroleum Gas; LEV - Light Electric Vehicle
Source: Land Transportation Office, Regional Office V
13 - 8

For Hire Government DiplomaticGas Diesel CNG LPG LEV Others Gas Diesel CNG LPG Others Gas Diesel
26,891 10,632 - - - - 1,073 1,058 - - - - - 396
7,399 3,388 - - - - 303 466 - - - - - 1835,329 875 - - - - 115 97 - - - - - 356,023 5,235 - - - - 422 298 - - - - - 1681,530 50 - - - - 24 37 - - - - - -2,306 225 - - - - 45 50 - - - - - 24,304 859 - - - - 164 110 - - - - - 8
29,880 8,059 - - - - 977 1,225 - - - - - 847
8,930 3,172 - - - - 327 492 - - - - - 2135,522 942 - - - - 113 121 - - - - - 167,934 2,903 - - - - 312 373 - - - - - 6041,599 57 - - - - 27 67 - - - - - 11,910 166 - - - - 14 40 - - - - - 23,985 819 - - - - 184 132 - - - - - 11
27,308 8,586 - - - - 1,053 1,312 - - - - - 516
9,473 3,512 - - - - 468 560 - - - - - 2686,456 823 - - - - 87 101 - - - - - 163,731 3,215 - - - - 311 434 - - - - - 2041,465 42 - - - - 24 35 - - - - - 21,691 164 - - - - 17 46 - - - - - 24,492 830 - - - - 146 136 - - - - - 24
34,208 7,831 - 38 12 - 1,039 1,431 - - - - - 535
10,812 2,616 - 38 12 - 424 576 - - - - - 2485,953 652 - - - - 91 113 - - - - - 308,728 3,006 - - - - 309 485 - - - - - 2171,144 384 - - - - 32 75 - - - - - 22,114 283 - - - - 33 29 - - - - - 45,457 890 - - - - 150 153 - - - - - 34
Trailer
13 - 9

Table 13.4 - Continued
NUMBER OF MOTOR VEHICLES REGISTERED BY CLASSIFICATION, TYPE OF FUEL USEDAND PROVINCE2013 - 2020
Year / Total PrivateProvince Gas Diesel CNG LPG LEV Others Gas Diesel CNG LPG LEV Others
2017
Region V 336,319 59,425 - - - - 296,556 48,875 - - -
Albay 175,746 21,283 - - - - 164,825 18,076 - - -Camarines Norte 29,337 5,044 - - - - 21,757 4,014 - - -Camarines Sur 82,753 23,488 - - - - 73,366 19,850 - - -Catanduanes 8,983 1,266 - - - - 7,413 976 - - -Masbate 13,021 2,929 - - - - 10,017 2,395 - - -Sorsogon 26,479 5,415 - - - - 19,178 3,564 - - -
2018
Region V 396,292 63,345 - - - - 355,342 53,737 - - -
Albay 207,182 23,003 - - - - 195,957 19,408 - - -Camarines Norte 29,589 5,214 - - - - 22,898 4,199 - - -Camarines Sur 102,411 26,391 - - - - 91,795 22,815 - - -Catanduanes 11,849 1,495 - - - - 9,756 1,357 - - -Masbate 14,020 2,638 - - - - 11,233 2,374 - - -Sorsogon 31,241 4,604 - - - - 23,703 3,584 - - -
2019
Region V 425,551 68,831 - - 4 - 380,128 59,177 - - 4 -
Albay 207,518 23,959 - - 2 - 195,303 20,346 - - 2 -Camarines Norte 38,193 6,015 - - - - 30,583 5,106 - - - -Camarines Sur 112,915 28,749 - - 2 - 101,759 25,106 - - 2 -Catanduanes 15,002 1,753 - - - - 12,668 1,604 - - - -Masbate 17,461 3,181 - - - - 14,161 2,840 - - - -Sorsogon 34,462 5,174 - - - - 25,654 4,175 - - - -
2020
Region V 387,492 67,281 - - 14 - 347,588 59,041 - - 8 -
Albay 186,241 26,536 - - - - 173,140 23,208 - - - -Camarines Norte 16,518 3,084 - - - - 12,709 2,500 - - - -Camarines Sur 120,482 26,845 - - 14 - 110,210 23,856 - - 8 -Catanduanes 10,245 1,630 - - - - 8,790 1,571 - - - -Masbate 18,871 3,702 - - - - 15,531 3,292 - - - -Sorsogon 35,135 5,484 - - - - 27,208 4,614 - - - -
Note: CNG - Compressed Natural Gas; LPG - Liquified Petroleum Gas; LEV - Light Electric Vehicle
Source: Land Transportation Office, Regional Office V
13 - 10

For Hire Government DiplomaticGas Diesel CNG LPG LEV Others Gas Diesel CNG LPG Others Gas Diesel
Trailer
38,723 9,062 - 0 23 - 1,040 1,488 - - - - - 600
10,548 2,643 - - - - 373 564 - - - - - 2637,466 903 - - - - 114 127 - - - - - 539,079 3,140 - - 23 - 308 498 - - - - - 2281,543 221 - - - - 27 69 - - - - - 62,967 461 - - - - 37 73 - - - - - 67,120 1,694 - - - - 181 157 - - - - - 44
39,866 7,915 - 0 59 - 1,084 1,693 - - - - - 671
10,745 2,871 - - - - 480 724 - - - - - 2646,567 875 - - - - 124 140 - - - - - 39
10,347 3,033 - - 59 - 269 543 - - - - - 2902,059 59 - - - - 34 79 - - - - - 92,762 212 - - - - 25 52 - - - - - 37,386 865 - - - - 152 155 - - - - - 66
44,051 7,849 - - - - 1,372 1,805 - - - - - 633
11,715 2,896 - - - - 500 717 - - - - - 2787,476 726 - - - - 134 183 - - - - - 45
10,691 3,025 - - - - 465 618 - - - - - 2522,280 60 - - - - 54 89 - - - - - 113,234 273 - - - - 66 68 - - - - - 108,655 869 - - - - 153 130 - - - - - 37
38,851 6,606 - - - - 1,053 1,634 - - - - - 687
12,679 2,681 - - - - 422 647 - - - - - 2813,730 436 - - - - 79 148 - - - - - 639,904 2,448 - - 6 - 368 541 - - - - - 3081,448 29 - - - - 7 30 - - - - - 93,258 312 - - - - 82 98 - - - - - 107,832 700 - - - - 95 170 - - - - - 16
13 - 11

Table 13.5 NUMBER OF FRANCHISE APPLICATIONS APPROVED BY TYPE OF VEHICLE AND PROVINCE2014 - 2016
2014 2015 2016Application Units Application Units Application Units
Region V 1,287 1,497 1,350 1,585 1,236 1,568
Public Utility Bus 46 77 54 106 94 154Public Utility Bus - Air Conditioned 6 15 6 14 2 9Public Utility Jeepney 301 340 270 294 164 178Public Utility Jeepney - Dual 696 764 690 729 592 621Taxi - Air Conditioned - - 28 41 35 43 Shuttle Transportation 1 3 - - - - School Transportation 7 7 6 6 9 10 Trucks For Hire 11 53 54 124 79 243Filcab 57 60 58 60 38 47Utility Vehicle Express 153 158 171 180 96 116 Tourist Transport Service 5 13 8 22 26 41 Mini-Bus 4 7 5 9 101 106
Albay 455 553 457 520 419 532
Public Utility Bus 18 26 15 23 21 40Public Utility Bus - Air Conditioned 5 14 2 2 - - Public Utility Jeepney 133 157 96 98 81 92Public Utility Jeepney - Dual 255 273 258 270 209 220Taxi - Air Conditioned - - 9 17 11 13 Shuttle Transportation 1 3 - - - - School Transportation - - - - 1 1 Trucks For Hire 5 40 14 27 13 52Filcab - - 1 2 4 6 Utility Vehicle Express 35 35 53 57 39 57Tourist Transport Service 3 5 7 18 6 15Mini-Bus - - 2 6 34 36
Camarines Norte 108 132 130 154 160 238
Public Utility Bus 11 29 14 27 27 42Public Utility Bus - Air Conditioned - - 3 8 1 7 Public Utility Jeepney 25 26 22 24 16 18Public Utility Jeepney - Dual 33 37 48 50 63 70Taxi - Air Conditioned - - - - 3 4 Shuttle Transportation - - - - - - School Transportation - - - - - - Trucks For Hire - - 3 5 11 58 Filcab 12 13 16 16 11 11Utility Vehicle Express 27 27 23 23 12 12 Tourist Transport Service - - - - 10 10 Mini-Bus - - 1 1 6 6
Source: Land Transportation Franchising and Regulatory Board, Regional Office V
Province / Type of Vehicle
13 - 12

Table 13.5 - Continued
NUMBER OF FRANCHISE APPLICATIONS APPROVED BY TYPE OF VEHICLE AND PROVINCE2014 - 2016
2014 2015 2016Application Units Application Units Application Units
Province / Type of Vehicle
Camarines Sur 493 549 514 642 408 527
Public Utility Bus 13 18 22 53 39 65Public Utility Bus - Air Conditioned 1 1 1 4 1 2Public Utility Jeepney 110 114 119 139 55 56Public Utility Jeepney - Dual 275 306 251 268 184 188Taxi - Air Conditioned - - 19 24 21 26 Shuttle Transportation - - - - - - School Transportation 7 7 6 6 8 9 Trucks For Hire 5 12 33 81 31 100Filcab 35 36 32 33 15 20Utility Vehicle Express 42 42 29 29 11 12 Tourist Transport Service 1 6 1 4 8 14 Mini-Bus 4 7 1 1 35 35
Catanduanes 25 28 18 18 16 20
Public Utility Bus 2 2 1 1 4 4Public Utility Bus - Air Conditioned - - - - - - Public Utility Jeepney 4 4 8 8 2 2Public Utility Jeepney - Dual 12 14 3 3 4 4 Taxi - Air Conditioned - - - - - - Shuttle Transportation - - - - - - School Transportation - - - - - - Trucks For Hire - - - - 2 6 Filcab 2 3 2 2 - - Utility Vehicle Express 5 5 4 4 2 2 Tourist Transport Service - - - - - - Mini-Bus - - - - 2 2
Masbate 47 52 49 53 68 75
Public Utility Bus 2 2 2 2 3 3Public Utility Bus - Air Conditioned - - - - - - Public Utility Jeepney 4 4 3 3 1 1Public Utility Jeepney - Dual 10 13 11 12 14 14Taxi - Air Conditioned - - - - - - Shuttle Transportation - - - - - - School Transportation - - - - - - Trucks For Hire 1 1 - - 9 10 Filcab 8 8 7 7 6 8Utility Vehicle Express 22 24 25 28 19 20 Tourist Transport Service - - - - 1 1 Mini-Bus - - 1 1 15 18
Sorsogon 159 183 182 198 165 176
Public Utility Bus - - - - - - Public Utility Bus - Air Conditioned - - - - - - Public Utility Jeepney 25 35 22 22 9 9Public Utility Jeepney - Dual 111 121 119 126 118 125Taxi - Air Conditioned - - - - - - Shuttle Transportation - - - - - - School Transportation - - - - - - Trucks For Hire - - 4 11 13 17 Filcab - - - - 2 2 Utility Vehicle Express 22 25 37 39 13 13 Tourist Transport Service 1 2 - - 1 1 Mini-Bus - - - - 9 9
13 - 13

Table 13.6 EXISTING NATIONAL ROAD LENGTH BY SURFACE TYPE AND PROVINCE/CITY2011 - 2019(In Kilometers)
Province/City /
SurfaceType 2011 2012 a/ 2013 b/ 2014 c/ 2015 2016 2017 2018 2019
Region V 2,312.45 2,312.50 2,344.08 2,344.41 2,347.30 2,385.66 2,389.24 2,389.25 2,389.23
Concrete 1,140.20 1,165.16 1,252.34 1,310.51 1,391.89 1,439.61 1,459.37 1,464.48 1,409.52
Asphalt 764.68 770.41 795.01 813.64 789.45 808.27 833.29 857.89 918.71
Gravel 405.63 376.92 293.50 217.04 162.73 134.55 93.35 63.65 57.77
Earth 1.94 - 3.23 3.23 3.23 3.23 3.23 3.23 3.23
Albay 383.29 383.29 383.29 383.23 383.23 407.43 407.43 407.43 407.43
Concrete 227.34 226.94 212.48 191.78 208.59 217.34 207.19 206.04 174.19
Asphalt 118.39 119.86 140.52 170.26 169.40 184.85 196.13 199.76 233.25
Gravel 37.56 36.50 30.29 21.19 5.25 5.24 4.11 1.63 -
Earth - - - - - - - - -
Camarines Norte 203.00 203.00 234.44 235.14 235.14 235.14 235.14 235.14 235.14
Concrete 61.05 63.99 76.15 77.53 79.70 83.74 83.83 81.09 70.93
Asphalt 133.50 133.17 133.78 133.42 132.98 132.62 132.53 135.27 145.42
Gravel 8.44 5.84 21.28 20.95 19.22 15.55 15.55 15.55 15.55
Earth - - 3.23 3.23 3.23 3.23 3.23 3.23 3.23
Camarines Sur 651.73 651.73 651.73 651.00 651.01 665.16 665.20 665.20 665.20
Concrete 263.15 256.02 302.21 343.92 376.49 394.60 387.26 385.16 379.11
Asphalt 257.36 269.15 269.25 259.04 243.31 251.31 269.92 276.32 284.17
Gravel 129.56 126.56 80.27 48.04 31.21 19.25 8.02 3.72 1.92
Earth 1.66 - - - - - - - -
Catanduanes 315.01 315.00 315.00 314.56 314.56 314.55 314.56 314.56 314.56
Concrete 160.76 162.68 199.24 217.17 222.25 231.12 258.64 276.47 277.67
Asphalt - - - - - - - - -
Gravel 154.25 152.33 115.77 97.39 92.31 83.43 55.92 38.09 36.89
Earth - - - - - - - - -
Masbate 422.84 422.89 423.04 423.89 423.89 423.89 423.89 423.89 423.89
Concrete 238.54 259.55 271.98 288.64 311.77 331.20 345.49 356.51 360.16
Asphalt 116.56 110.86 107.71 105.79 97.66 81.62 72.16 66.22 63.50
Gravel 67.74 52.49 43.35 29.47 14.47 11.07 6.24 1.16 0.24
Earth - - - - - - - - -
Source: Department of Public Works and Highways, Regional Office V
13 - 14

Table 13.6 - Continued
EXISTING NATIONAL ROAD LENGTH BY SURFACE TYPE AND PROVINCE/CITY2011 - 2019(In Kilometers)
Province/City /
SurfaceType 2011 2012 a/ 2013 b/ 2014 c/ 2015 2016 2017 2018 2019
Sorsogon 336.58 336.59 336.59 336.59 339.48 339.48 343.02 343.03 343.02
Concrete 189.36 195.99 190.30 191.47 193.10 181.60 176.96 159.21 147.47
Asphalt 138.87 137.38 143.75 145.12 146.11 157.87 162.55 180.32 192.38
Gravel 8.08 3.22 2.54 - 0.28 0.01 3.51 3.50 3.17
Earth 0.28 - - - - - - - -
Notes: a/ - As of October 31, 2012 b/ - As of August 2013 c/ - As of October 2014 Provincial data include cities. Details may not add up to totals due to rounding.
Source: Department of Public Works and Highways, Regional Office V
Figure 13.2 EXISTING NATIONAL ROAD LENGTH BY SURFACE TYPEREGION V, 2015 - 2019
0
100
200
300
400
500
600
700
800
900
1,000
1,100
1,200
1,300
1,400
1,500
2015 2016 2016 2017 2018 2019
In K
ilo
met
ers
Concrete Asphalt Gravel
13 - 15

Table 13.7 NUMBER AND LENGTH OF EXISTING NATIONAL BRIDGES BY PROVINCE/CITY2011 - 2019(Length In Lineal Meters)
Province / City Number Number of Span Total Length
2011 b/
Region V 612 … 19,375.01
Albay 139 … 3,735.01 Camarines Norte 69 … 2,420.00 Camarines Sur 169 … 5,466.63 Catanduanes 65 … 2,838.51 Masbate 76 … 1,974.16 Sorsogon 94 … 2,940.70
2012 c/
Region V 613 … 19,585.51
Albay 139 … 3,921.32 Camarines Norte 70 … 2,432.00 Camarines Sur 169 … 5,466.63 Catanduanes 65 … 2,848.45 Masbate 76 … 1,976.41 Sorsogon 94 … 2,940.70
2013 d/
Region V 623 … 20,143.82
Albay 140 … 4,028.75 Camarines Norte 69 … 2,474.34 Camarines Sur 172 … 5,779.67 Catanduanes 65 … 2,815.77 Masbate 80 … 2,028.70 Sorsogon 97 … 3,016.59
2014 e/
Region V 623 … 20,052.00
Albay 142 … 3,947.00 Camarines Norte 69 … 2,444.00 Camarines Sur 172 … 5,832.00 Catanduanes 65 … 2,817.00 Masbate 78 … 2,017.00 Sorsogon 97 … 2,995.00
2015 Region V 636 … 20,110.73
Albay 143 … 4,040.44 Camarines Norte 70 … 2,522.76 Camarines Sur 173 … 5,827.12 Catanduanes 67 … 2,362.41 Masbate 86 … 2,363.00 Sorsogon 97 … 2,995.00
Note: Permanent and temporary bridges along arterial and secondary roads only.b/ As of February 2012c/ As of October 2012
Source: Department of Public Works and Highways, Regional Office V
13 - 16

Table 13.7 - Continued
NUMBER AND LENGTH OF EXISTING NATIONAL BRIDGES BY PROVINCE/CITY2011 - 2019(Length In Lineal Meters)
Province / City Number Number of Span Total Length
2016 Region V 666 … 21,808.00
Albay 147 … 4,347.00 Camarines Norte 71 … 2,627.00 Camarines Sur 179 … 6,054.00 Catanduanes 83 … 3,542.00 Masbate 84 … 2,115.00 Sorsogon 102 … 3,123.00
2017 Region V 666 … 21,779.00
Albay 147 … 4,356.00 Camarines Norte 71 … 2,649.00 Camarines Sur 179 … 6,042.00 Catanduanes 83 … 3,510.00 Masbate 84 … 2,107.00 Sorsogon 102 … 3,115.00
2018 Region V 661 … 22,094.00
Albay 147 … 4,381.00 Camarines Norte 70 … 2,521.00 Camarines Sur 174 … 5,911.00 Catanduanes 83 … 3,531.00 Masbate 85 … 2,140.00 Sorsogon 102 … 3,610.00
2019 Region V 670 … 21,916.00
Albay 149 … 4,457.00 Camarines Norte 70 … 2,521.00 Camarines Sur 174 … 5,933.00 Catanduanes 87 … 3,639.00 Masbate 87 … 2,244.00 Sorsogon 103 … 3,122.00
d/ As of December 2013e/ As of January 2014
13 - 17

Table 13.8AIRCRAFT MOVEMENT, PASSENGERS CARRIED AND VOLUME OF CARGO BY AIRPORT2011 - 2020(Volume in Kilograms)
Aircraft Movement Passenger Traffic Volume of CargoAirport Total Com- General Aero- Military Total Out- In- In- Out- In-
mercial Aviation lift Planes going Transit Coming going Coming
Legazpi City, Albay
2011 2,386 2,182 198 - 6 527,235 265,654 164 261,417 396,337 1,142,242
2012 2,533 2,318 199 - 16 533,104 270,849 186 262,069 423,482 1,201,3802013 2,672 1,959 229 - 484 489,457 246,226 189 243,042 502,491 1,528,7032014 2,571 1,933 189 - 449 483,745 243,878 272 239,595 1,161,385 1,456,9822015 2,677 2,243 207 - 227 550,792 279,325 263 271,204 803,502 1,557,2552016 3,047 2,142 293 - 612 564,406 284,928 343 279,135 612,000 1,852,6472017 3,465 2,577 526 - 362 621,374 314,364 290 306,720 838,379 1,737,7622018 3,190 2,629 331 - 230 566,535 281,992 413 284,130 568,007 1,733,0632019 4,064 3,301 359 - 404 680,699 336,609 527 343,563 738,811 1,661,2882020 3,103 1,596 620 8 879 131,232 66,943 392 63,897 144,474 486,619
Daet, Camarines Norte
2011 11 - 10 - 1 - - - - - -
2012 17 - 17 - - - - - - - -2013 15 - 15 - - 3 3 - - - -2014 33 - 31 - 2 - - - - - -2015 20 - 18 - 2 5 - - 5 - -2016 81 - 81 - - 21 - 9 12 - -2017 11 - 11 - - 9 5 - 4 - -2018 19 - 18 - 1 35 6 6 23 - -2019 60 - 59 - 1 28 - - 28 - -2020 38 - 10 - 28 - - - - - -
Naga City, Camarines Sur
2011 2,056 1,898 135 - 23 210,536 105,706 - 104,830 86,422 299,9842012 1,945 1,785 132 - 28 200,688 101,175 - 99,513 108,074 292,8042013 1,445 1,248 136 - 61 144,745 71,822 - 72,923 42,151 173,5372014 1,331 1,251 54 - 26 148,295 74,212 - 74,083 114,522 342,1492015 1,371 1,246 89 - 36 140,250 70,584 - 69,666 200,368 380,6312016 1,629 1,304 237 - 88 137,329 68,138 - 69,191 70,325 388,1042017 1,462 1,346 95 - 21 143,605 71,504 - 72,101 14,019 296,7172018 1,010 811 146 - 53 94,443 47,578 - 46,865 43,457 108,9322019 1,099 856 174 - 69 114,044 56,458 - 57,586 7,899 177,0172020 834 412 328 - 94 20,676 10,576 - 10,100 2,682 92,561
Virac, Catanduanes
2011 456 399 52 - 5 43,190 21,541 31 21,618 27,306 61,16020122013 254 230 15 - 9 32,837 16,381 30 16,426 18,374 74,6702014 216 193 10 - 13 49,304 24,140 36 25,128 15,912 69,5252015 218 201 13 - 4 52,029 25,103 99 26,827 27,022 82,478
r - revised
Source: Civil Aviation Authority of the Philippines
13 - 18

Table 13.8 - Continued
AIRCRAFT MOVEMENT, PASSENGERS CARRIED AND VOLUME OF CARGO BY AIRPORT2011 - 2020(Volume in Kilograms)
Aircraft Movement Passenger Traffic Volume of CargoAirport Total Com- General Aero- Military Total Out- In- In- Out- In-
mercial Aviation lift Planes going Transit Coming going Coming
2016 306 218 48 - 40 56,149 28,046 85 28,018 34,773 99,2352017 330 297 22 - 11 53,483 26,807 62 26,614 32,724 50,1642018 388 356 13 - 19 70,584 35,310 70 35,204 15,808 30,4892019 285 270 12 - 3 70,016 34,969 4 35,076 1,075 7,0092020 388 132 92 164 14,421 7,152 135 7,134 391 1,029
Masbate, Masbate
2011 584 537 38 - 9 47,011 22,827 - 24,184 136,262 114,7342012 897 709 122 - 66 61,247 29,906 - 31,341 159,770 152,6132013 639 567 38 - 34 50,118 24,865 - 25,253 44,749 110,9342014 420 349 68 - 3 31,448 14,932 - 16,516 3,309 96,8322015 403 359 31 - 13 31,042 15,017 - 16,025 - 70,6892016 432 361 57 - 14 30,078 14,518 - 15,560 - 83,2282017 771 704 60 - 7 65,627 31,651 - 33,976 - 62,2662018 778 688 69 - 21 72,415 34,122 - 38,293 - 23,1572019 471 356 68 - 47 50,617 23,989 - 26,628 - -2020 264 150 86 - 28 10,811 5,408 - 5,403 - -
Sorsogon, Sorsogon
2011 4 - 4 - - 4 - 4 - - -2012 2 - 2 - - - - - - - -2013 - - - - - - - - - - -2014 1 - 1 - - 9 9 - - - -2015 - - - - - - - - -2016 - - - - - - - - - - -2017 - - - - - - - - - - -2018 - - - - - - - - - - -2019 5 - 5 - - 3 3 - - - -2020 6 - 6 - - 6 - - 6 - -
Bulan, Sorsogon
2010 5 - 5 - - 9 - 9 - - -2011 - - - - - - - - - - -2012 - - - - - - - - - - -2013 2 - 2 - - - - - - - -2014 - - - - - - - - - - -2015 - - - - - - - - - - -2016 - - - - - - - - - - -2017 - - - - - - - - - - -2018 - - - - - - - - - - -2019 - - - - - - - - - - -2020 - - - - - - - - - - -
13 - 19

Table 13.9 TOTAL SHIPPING STATISTICS BY PORT2017 - 2020(Cargo Throughput in Metric Tons)
Cargo ThroughputDomestic Foreign
Inbound Outbound Import Export
2017
Total, All Ports 2,314,546 1,050,008 900,257 328,450 35,830
Baseport 796,535 113,094 423,091 260,350 -
Baseport Legazpi 796,535 113,094 423,091 260,350 -
Terminal Ports 740,579 378,644 302,112 59,823 -
Bulan 213,995 34,751 179,244 - - J. Panganiban - - - - - Masbate - - - - - Matnog 2,120 2,120 - - - Pasacao 225,912 208,853 3,978 13,080 - Pioduran 11,718 - 11,718 - - Tabaco 205,799 56,425 102,631 46,743 - Virac 81,035 76,495 4,540 - -
Other Government Ports 261,378 124,521 136,857 - -
Aroroy, Masbate - - - - - Bacacay 0 - - - - Cabugao, Catanduanes - - - - - Calpi, Masbate - - - - - Caramoan, Camarines Sur - - - - - Castilla 84,614 43,067 41,547 - - Cataingan - - - - - Cawayan, Masbate - - - - - Claveria - - - - - Larap, J. Panganiban - - - - - Lidong 30,919 2,285 28,634 - - Malobago, Rapu-Rapu 314 157 157 - - Pantao, Albay 27,547 - 27,547 - - Pioduran, Albay - - - - - Rapu-Rapu, Albay 960 960 - - - San Andres 13,074 13,010 64 - - San Jacinto - - - - - San Pascual - - - - - Sorsogon 98,304 63,591 34,713 - - Sula, Bacacay, Albay 5,646 1,450 4,196 - -
Private Ports 516,054 433,749 38,198 8,278 35,830
Algimar - MAP 2000 (Masbate) - - - - - Bescom 81,616 81,616 - - - Bilbao - Batan 1,700 - 1,700 - - Powerzone (Virac) 11,581 11,581 - - - Filminera - - - - - Globe Coco 41,366 12,669 12,788 - 15,908 Legazpi Oil 36,099 680 7,220 8,278 19,922 Liguan-Batan 2,200 2,200 - - - NFH / Camangui 522 156 366 - - Pan Century - - - - - Shell (Masbate) - - - - - Shell (Pasacao) 324,846 324,846 - - - Horizon Cargo Services 16,124 - 16,124 - -
Note: Details may not add up to totals due to rounding.
Source: Philippine Ports Authority, Regional Office V
Year / PortTotal
13 - 20

Shipping Tonnage Shipcalls Passenger TrafficRORO
Inbound Outbound
212,604 245,633 12,547,735 400,873 22,108 62 2,218,576 2,249,594
- - 266,115 159,358 2,302 38 23,464 40,205
- - 266,115 159,358 2,302 38 23,464 40,205
191,324 226,133 10,972,262 41,713 17,782 10 1,942,690 1,978,364
- - 239,805 - 4,117 - 79,161 89,849- - - - - - - - - - - - - - - -
140,688 172,036 8,333,799 - 9,585 - 1,285,959 1,314,222 - - 85,299 8,513 172 3 - -
16,891 18,677 903,378 - 1,105 - 242,223 254,362 27,310 28,753 1,087,946 33,200 2,182 7 301,501 284,435
6,435 6,667 322,034 - 621 - 33,846 35,496
21,280 19,500 927,177 - 1,762 - 252,422 231,025
- - - - - - - - 1,691 1,267 52,070 - 104 - - -
- - - - - - - - - - - - - - - - - - - - - - - - - - 34,187 - 49 - - - - - - - - - - - - - - - - - - - - - - - - - - - - - - - - - - - - - 20,417 - 15 - - - - - 349 - 1 - - - - - 25,213 - 18 - - - - - - - - - - - - - 1,329 - 3 - - -
19,589 18,233 735,339 1,505 - 252,422 231,025 - - - - - - - - - - - - - - - - - - 44,868 - 50 - - - - - 13,406 - 17 - - -
- - 382,181 199,802 262 14 - -
- - - - - - - - - - 56,491 - 66 - - - - - 498 - 1 - - - - - 24,120 - 25 - - - - - - - - - - - - - 10,009 73,262 26 3 - - - - 3,494 126,540 8 11 - - - - 4,578 - 7 - - - - - 4,941 - 28 - - - - - - - - - - - - - - - - - - - - - 278,050 - 96 - - - - - 5,220 - 5 - - -
Disembarking EmbarkingDomestic Foreign Domestic Foreign
13 - 21

Table 13.9 - Continued
TOTAL SHIPPING STATISTICS BY PORT2017 - 2020(Cargo Throughput in Metric Tons)
Cargo ThroughputDomestic Foreign
Inbound Outbound Import ExportYear / Port
Total
201812.72
Total, All Ports 2,608,862 1,110,489 922,923 542,158 33,291
Baseport 848,080 136,299 291,385 420,396 -
Baseport Legazpi 848,080 136,298.85 291,384.93 420,396.46 -
Terminal Ports 751,666 397,738 233,681 120,247 0
Bulan 42,165 24,543.34 17,621.73 - - J. Pangiban, Camarines Norte 244,446 220,061.76 9,151.45 15,232.57 - Masbate - - - - - Matnog - - - - - Pasacao - - - - - Pioduran - - - - - Tabaco 315,031 36,452.45 173,564.38 105,014.50 - Virac, Catanduanes 150,023 116,679.95 33,343.44 - -
Other Government Ports 209,443 118,745 90,698 0 0
Aroroy, Masbate - - - - - Bacacay 3,106 - 3,105.93 - - Cabugao, Catanduanes 7,770 7,770.00 - - - Calpi, Masbate - - - - - Caramoan, Camarines Sur 9,525 9,525.04 - - - Castilla 90,376 47,579.28 42,796.83 - - Cataingan - - - - - Cawayan, Masbate - - - - - Claveria - - - - - Larap, J.Panganiban - - - - - Lidong - - - - - Malobago, Rapu-Rapu - - - - - Pantao, Albay - - - - - Pioduran, Albay - - - - - Rapu-Rapu, Albay 15,110 13,372.05 1,738.29 - - San Andres 12,352 12,159.14 193.10 - - San Jacinto - - - - - San Pascual - - - - - Sorsogon 50,800 27,470.10 23,329.87 - - Sula, Bacacay, Albay 20,404 869.20 19,534.32 - -
- - Private Ports 799,673 457,708 307,159 1,515 33,291
Algimar - MAP 2000 (Masbate) - - - - - Bescom 114,702 114,701.86 - - - Bilbao - Batan - - - - - Powerzone (Virac) 3,671 3,670.79 - - - Filminera - - - - - Globe Coco 17,520 7,529.87 3,990.00 0.00 6,000.06 Legazpi Oil 38,727 3,921.50 5,999.85 1,514.75 27,291.21 Liguan-Batan 15,370 13,659.42 1,710.51 0.00 0.00 NFH / Camangui 271 117.12 154.10 0.00 0.00 Pan Century - - - - - Shell (Masbate) - - - - - Shell (Pasacao) 307,713 307,713.46 - - - New Horizon Cargo Services 301,699 6,394.17 295,304.72 - -
13 - 22

Shipping Tonnage Shipcalls Passenger TrafficRORO
Inbound OutboundDisembarking EmbarkingDomestic Foreign Domestic Foreign
244,833 284,364 15,613,405 504,629 23,226 78 2,366,705 2,517,446
- - 228,972 273,786 1,639 52 37,890 51,553
- - 228,971.74 273,786.00 1,639 52 37,890 51,553
215,204 256,916 13,444,083 104,239 18,905 18 2,019,511 2,182,301
- - 159,181.85 0.00 4,247 - 80,911 101,493- - 105,249.27 17,176.00 224 4 - - - - - - - - - -
152,855 190,526 10,273,177.87 - 10,191 - 1,340,513 1,460,662- - - - - - - -
24,680 26,936 1,161,177.90 - 1,447 - 253,003 271,61030,830 32,203 1,386,843.05 87,063.00 2,108 14 313,461 308,619
6,839 7,251 358,452.70 - 688 - 31,623 39,917
29,629 27,448 1,373,903 0 2,289 0 309,304 283,592
- - - - - - - - 2,564 1,808 130,825.64 - 177 - - -
- - 11,772.00 - 12 - - - - - - - - - - - - - 6,669.32 - 5 - - - - - 34,560.43 - 46 - - - - - - - - - - - - - - - - - - - - - - - - - - - - - - - - - - - - - - - - - - - - - - - - - - - - - - - - - - - - - - - - - - - - - 42,303.35 - 427 - 23,667 20,751
27,065 25,640 1,097,740.40 - 1,546 - 285,637 262,841- - - - - - - - - - - - - - - - - - 22,883.08 - 32 - - - - - 27,148.36 - 44 - - - - - 0 0 566,448 126,604 393 8 0 0
- - - - - - - - - - 84,646.78 - 96 - - - - - - - - - - - - - 2,379.03 - 7 - - - - - - - - - - - - - 4,772.73 26,218.00 14 1 - - - - 5,357.76 100,386.00 11 7 - - - - 18,180.00 - 27 - - - - - 3,651.22 - 15 - - - - - - - - - - - - - - - - - - - - - 330,865.00 - 107 - - - - - 116,595.93 - 116 - - -
13 - 23

Table 13.9 - Continued
TOTAL SHIPPING STATISTICS BY PORT2017 - 2020(Cargo Throughput in Metric Tons)
Cargo ThroughputDomestic Foreign
Inbound Outbound Import ExportYear / Port
Total
2019
Total, All Ports 3,738,573 1,250,701 1,951,921 471,557 64,394
Baseport 826,750 193,869 253,026 379,856 -
Baseport Legazpi 826,750 193,869 253,026 379,856
Terminal Ports 687,726 419,305 179,220 89,201 -
Bulan 45,658 20,243 25,415 - J. Pangiban, Camarines Norte 262,081 246,076 1,184 14,822 Masbate - Matnog - Pasacao - Pioduran 1,000 1,000 Tabaco 243,904 26,684 142,841 74,379 Virac, Catanduanes 135,083 126,302 8,781
Other Government Ports 1,238,466 185,192 1,044,601 - 8,673
Aroroy, Masbate - - - - - Bacacay 15,241 15,241 - - Bilbao (Rapu-Rapu) 8,305 5,905 2,400 - - Cabugao, Catanduanes - - - - - Calpi, Masbate - - - - - Caramoan, Camarines Sur - - - - - Castilla 154,024 76,418 77,605 - - J. Panganiban 8,673 - - - 8,673 Cataingan - - - - - Cawayan, Masbate - - - - - Claveria - - - - - Larap, J.Panganiban - - - - - Liguan (Rapu-Rapu) 27,219 26,048 1,171 - - Lidong 2,505 2,505 - - Malobago, Rapu-Rapu 1,141 569 572 - - Pantao, Albay - - - - Malilipot 37,961 - 37,961 - - Pioduran, Albay - - - - - Rapu-Rapu, Albay 62,408 56,677 5,731 - - San Andres 2,770 2,750 20 - - San Jacinto - - - - - San Pascual - - - - - Sorsogon 17,420 13,527 3,893 - - Sula, Bacacay, Albay 900,799 793 900,006 - -
Private Ports 985,631 452,336 475,075 2,500 55,720
Algimar - MAP 2000 (Masbate) - - - - - Bescom 107,226 107,226 - - - Bilbao - Batan - - - - - Powerzone (Virac) 15,111 15,111 - - - Filminera - - - - - Globe Coco 42,838 3,048 2,130 - 37,660 Legazpi Oil 29,492 1,332 7,600 2,500 18,060 Liguan-Batan - - - - - NFH / Camangui 628 352 277 - - Pan Century - - - - - Shell (Masbate) - - - - - Shell (Pasacao) 306,640 306,640 - - - New Horizon Cargo Services 483,695 18,627 465,068 - -
13 - 24

Shipping Tonnage Shipcalls Passenger TrafficRORO
Inbound OutboundDisembarking EmbarkingDomestic Foreign Domestic Foreign
242,284 273,356 15,308,681 537,334 24,794 73 2,563,335 2,821,723
- - 212,807 199,284 1,385 46 62,359 59,681
1,385 46 1,385 46 62,359 59,681
210,496 243,693 13,057,416 64,558 20,316 15 2,163,709 2,450,262
175,742 - 4,777 - 86,881 102,195 483 607 161,000 10,352 436 3 15,673 17,259
171,899 201,561 9,894,632 - 10,726 - 1,383,129 1,626,541
31,099 34,009 1,206,992 - 1,540 - 306,050 322,847 1,305,259 54,206 2,157 12 335,167 337,795
7,015 7,516 313,792 - 680 - 36,809 43,625
31,788 29,663 1,405,219 6,379 2,695 1 337,267 311,780
- - - - - - - - 2,716 1,854 87,183 - 180 - - -
- - 7,271 - 5 - - - - - - - - - - - - - - - - - - - - - - - - - - 69,021 - 90 - - - - - 760 6,379 1 1 - - - - - - - - - - - - - - - - - - - - - - - - - - - - - - - - 19,450 - 22 - - - - - 780 - 1 - - - - - 1,344 - 2 - - - - - - - - - - - - 29,682 - 26 - - - - - - - - - - - 106,223 - 679 - 42,106 37,515
29,072 27,809 986,389 - 1,583 - 295,161 274,265 - - - - - - - - - - - - - - - - - - 6,164 - 17 - - - - - 90,952 - 89 - - -
- - 633,240 267,113 398 11 - -
- - - - - - - - 98,194 - 89 - - - - - - - - - - - 8,910 - 18 - - - - - - - - - - - - - 1,967 157,430 6 6 - - - - 4,002 109,683 8 5 - - - - - - - - - - - - 5,863 - 18 - - - - - - - - - - - - - - - - - - - - - 308,275 - 97 - - - - - 206,029 - 162 - - -
13 - 25

Table 13.9 - Continued
TOTAL SHIPPING STATISTICS BY PORT2017 - 2020(Cargo Throughput in Metric Tons)
Cargo ThroughputDomestic Foreign
Inbound Outbound Import ExportYear / Port
Total
2020
Total, All Ports 2,731,369 1,253,541 1,209,889 237,921 30,018
Baseport 442,859 134,036 237,749 71,073 -
Baseport Legazpi 442,859 134,036 237,749 71,073 -
Terminal Ports 723,844 517,917 85,217 120,710 -
Bulan 110,198 56,150 54,048 - - J. Pangiban, Camarines Norte 270,345 266,912 3,433 - - Masbate - - - - - Matnog - - - - - Pasacao - - - - - Pioduran - - - - - Tabaco 209,673 66,975 21,988 120,710 - Virac, Catanduanes 133,628 127,880 5,748 - -
Other Government Ports 462,048 177,331 284,716 - -
Aroroy, Masbate - - - - - Bacacay 29,231 - 29,231 - - Bilbao (Rapu-Rapu) 16,489 16,489 - - - Cabugao, Catanduanes - - - - - Calpi, Masbate - - - - - Caramoan, Camarines Sur - - - - - Castilla 128,124 66,383 61,741 - - J. Panganiban - - - - Cataingan - - - - - Cawayan, Masbate - - - - - Claveria - - - - - Larap, J.Panganiban - - - - - Liguan (Rapu-Rapu) 1,399 1,399 - - - Lidong 3,960 - 3,960 - - Malobago, Rapu-Rapu 7,757 5,744 2,014 - - Pantao, Albay - - - - - Malilipot 107,740 - 107,740 - - Pioduran, Albay - - - - - Rapu-Rapu, Albay 76,319 71,838 4,481 - - San Andres 734 729 5 - - San Jacinto - - - - - San Pascual - - - - - Sorsogon 8,922 8,922 - - - Sula, Bacacay, Albay 81,373 5,829 75,545 - -
Private Ports 1,102,619 424,257 602,206 46,138 30,018
Algimar - MAP 2000 (Masbate) - - - - - Bescom 107,732 107,732 - - - Bilbao - Batan - - - Powerzone (Virac) 16,239 16,239 - - - Filminera - - - Globe Coco 24,180 5,020 1,860 - 17,300 Legazpi Oil 22,319 - 9,601 - 12,718 Liguan-Batan - - - NFH / Camangui 715 451 264 - - Pan Century - - - Shell (Masbate) - - - Shell (Pasacao) 271,283 271,283 - - - New Horizon Cargo Services 660,152 23,532 590,482 46,138 -
13 - 26

Shipping Tonnage Shipcalls Passenger TrafficRORO
Inbound OutboundDisembarking EmbarkingDomestic Foreign Domestic Foreign
183,472 199,814 10,543,002 443,695 16,396 38 769,674 914,505
- - 212,807 199,284 849 11 23,053 24,787
- - 146,028 45,960 849 11 23,053 24,787
164,749 182,440 8,589,703 128,689 13,434 16 654,308 802,704
- - 108,672 - 3,031 - 28,727 27,933 437 560 131,075 - 392 - 11,497 10,823
- - - - 121,408 137,230 6,483,418 - 6,985 - 428,424 565,454
- - - - 16,237 17,427 697,897 - 1,011 - 79,247 90,206 20,391 20,718 853,406 128,689 1,365 16 92,256 93,168
6,276 6,505 315,235 - 650 - 14,157 15,120
18,723 17,374 1,049,391 - 1,627 - 92,313 87,014
- - - - - - - - 2,659 1,751 100,874 - 214 - - -
- - 15,665 - 10 - - - - - - - - - - - - - - - - - - - - - - - - - - - - - 46,366 - 71 - - - - - - - - - - - - - - - - - - - - - - - - - - - - - - - - - - - - - - - - - - - - - 1,904 - 1 - - - - - 995 - 1 - - - - - 4,980 - 10 - - - - - 610 - 1 - - - - - 69,120 - 53 - - - - - - - - - - - - - 90,531 - 286 - 14,832 12,773
16,064 15,623 626,213 - 906 - 77,481 74,241 - - - - - - - - - - - - - - - - - - 5,248 - 14 - - - - - 86,884 - 60 - - -
- - 691,102 115,722 486 11 - -
- - - - - - - - - 79,402 - 95 - - - - - - - - - - 9,236 - 19 - - - - - - - - - - 2,652 57,103 6 3 - - - - 3,881 39,278 8 3 - - - - - - - - - - 8,116 - 45 - - - - - - - - - - - - - - - - 303,318 - 100 - - - - 284,497 19,341 213 5 - -
13 - 27

Figure 13.3 TOTAL CARGO THROUGHPUTREGION V, 2020
Figure 13.4 TOTAL PASSENGER TRAFFICREGION V, 2017 - 2020
0
200
400
600
800
1,000
1,200
1,400
1,600
1,800
2,000
2,200
2,400
2,600
2,800
2017 2018 2019 2020
Nu
mb
er
of
Pa
ss
en
ge
rsT
ho
us
an
ds
Disembarking Embarking
Domestic79%
RORO12%
Foreign9%
13 - 28

Table 13.10NUMBER OF LICENSED RADIO STATIONS BY TYPE OF STATION2017 - 2020
Type of Station 2017 r 2018 2019 2020
T o t a l 11,968 9,196 15,649 15,976
Government 2,645 6,101 6,628 Repeater (CO) 23 26 27 Fixed Station (CO) 166 613 387 Fixed/Land Base (FX/FB- CO) 47 49 9 Land Base Radio Station (CO) 226 431 591 Land Mobile Radio Station (CO) 78 168 101 Portable (CO) 2,105 4,814 5,513
Private 11,968 6,551 9,548 9,348
Broadcast Station 489 411 387 355 AM Broadcast 34 24 16 36 FM Broadcast 95 88 80 111 STL/Remote Control 6 6 6 17 TV Station 27 27 20 20 TV Relay/Translator 7 7 6 6 TV Receive Only 144 125 127 129 Cable TV 176 134 132 36
Fixed Point to Point Station (CV) - - - - Repeater Station 64 15 17 14 Fixed Station Private 283 399 402 362 Land Base Radio Station 544 73 159 161 Land Mobile Radio Station 513 61 168 185 Portable 4,596 2,105 4,814 5,499 Special Radio Authorization (SRRS) 92 92 21 Land Base Personal Radio Service 14 - - - Land Mobile Personal Radio Service 4 - - - Portable Personal Radio Service 40 14 14 46 Amateur Radio Station 1,356 357 864 958 Radio Training Station - - - - Fixed Aeronautical Station 2 2 2 2 Ship Station 228 86 96 209 Radio Navigation - - - - Fixed Station Public Carrier - - - - Fixed Point to Point Station (CP) 1,773 1,107 694 453 Land Base Public Carrier 1,240 1,133 1,227 1,080 Cellular Base 591 607 609 875 Special Station/Earth Station - - - - VSAT Subscriber - - - - VSAT Service Provider 3 3 3 3 PRS Base - - - - PRS Portable - - - -
Note: … - No data available. r - revisedSource: National Telecommunications Commission, Regional Office V
13 - 29

Table 13.11TELEPHONE DISTRIBUTION BY PROVINCE2016 - 2020(Telephone Density per 100 Population)
Telephone Capacity / Total TelephoneExchange Telephone Lines Connections Density
2016 Region V 76 84,626 32,334 1.376
Albay 26 26,042 10,176 1.886 Camarines Norte 9 6,290 2,012 1.019 Camarines Sur 35 46,344 16,741 2.229 Catanduanes 2 1,000 248 0.356 Masbate 1 3,000 2,420 0.319 Sorsogon 3 1,950 737 0.230
2017 Region V 76 84,626 32,334 1.350
Albay 26 26,042 10,176 1.854 Camarines Norte 9 6,290 2,012 0.998 Camarines Sur 35 46,344 16,741 2.186 Catanduanes 2 1,000 248 0.348 Masbate 1 3,000 2,420 0.313 Sorsogon 3 1,950 737 0.225
2018 Region V 76 130,364 56,529 2.041
Albay 26 40,539 16,424 2.839 Camarines Norte 9 11,010 4,945 1.713 Camarines Sur 35 61,401 27,462 2.840 Catanduanes 2 1,888 1,087 0.644 Masbate 1 8,544 4,023 0.875 Sorsogon 3 6,982 2,588 0.789
2019 Region V 76 135,538 64,930 2.082
Albay 26 39,607 19,061 2.728 Camarines Norte 9 10,229 5,475 1.560 Camarines Sur 35 64,376 30,522 2.919 Catanduanes 2 2,360 1,064 0.788 Masbate 1 10,656 5,012 1.071 Sorsogon 3 8,310 3,796 0.919
2020
Region V
Albay - - - - Camarines Norte - - - - Camarines Sur - - - - Catanduanes - - - - Masbate - - - - Sorsogon - - - -
Note: Densities were computed using the 2010 Census-Based Population Projections.
Source: National Telecommunications Commission, Regional Office V
Year / Province
13 - 30

Table 13.12NUMBER OF PUBLIC TELEGRAPH STATIONS BY PROVINCE2003 - 2012
Province 2003 2004 2005 2006 2007 2008 2009 2010 2011 2012
Region V
Telegraph Stations Operated 114 100 95 86 87 85 84 84 79 67Municipalities Covered 106 96 91 84 84 82 82 82 77 66
Albay
Telegraph Stations Operated 19 17 15 14 15 15 14 14 14 10Municipalities Covered 17 16 14 13 13 13 13 13 13 9
Camarines Norte
Telegraph Stations Operated 13 12 12 11 11 10 10 10 8 9Municipalities Covered 12 12 12 11 11 10 10 10 8 9
Camarines Sur
Telegraph Stations Operated 37 35 32 27 27 27 27 27 26 20Municipalities Covered 35 34 30 26 26 26 26 26 25 20
Catanduanes
Telegraph Stations Operated 11 7 7 7 7 6 5 6 6 4Municipalities Covered 11 7 7 7 7 6 5 6 6 4
Masbate
Telegraph Stations Operated 19 17 17 17 17 17 17 16 15 15Municipalities Covered 17 17 17 17 17 17 17 16 15 15
Sorsogon
Telegraph Stations Operated 15 12 12 10 10 10 11 11 10 9Municipalities Covered 14 10 11 10 10 10 11 11 10 9
Source: Telecommunications Office
13 - 31

Table 13.13VOLUME AND VALUE OF TELEGRAPHIC MESSAGES SENT BY PROVINCE2006 - 2012(Value in Pesos)
2006 2007 2008rVolume Value Volume Value Volume Value
Region V 79,018 4,714,977.0 45,329 2,625,597.9 34,609 2,141,711.4
Telegrams 4,002 285,176.9 2,783 195,192.8 1,921 100,727.9Telegraphic Transfer 4,562 340,108.4 1,729 130,177.2 904 66,764.2Social Telegrams 592 16,384.7 526 14,211.3 268 7,777.8Free Telegrams 69,862 4,073,307.1 40,291 2,286,016.6 25,517 1,835,297.7Internet Services - - - - 5,999 131,144
Albay 42,291 1,573,283.5 21,440 786,842.4 13,399 426,702.4
Telegrams 681 83,969.3 350 30,177.2 220 20,102.4Telegraphic Transfer 967 70,779.4 410 28,703.2 196 12,498.0Social Telegrams 97 2,647.5 83 2,182.8 47 1,332.4Free Telegrams 40,546 1,415,887.4 20,597 725,779.3 12,936 392,769.6Internet Services - - - - - -
Camarines Norte 8,295 653,942.3 6,732 72,591.8 5,084 433,899.1
Telegrams 1,392 52,240.2 1,088 38,785.3 1,122 33,359.8Telegraphic Transfer 364 22,328.5 199 10,506.0 93 5,811.0Social Telegrams 121 3,105.3 191 4,873.6 53 1,372.0Free Telegrams 6,418 576,268.3 5,254 18,426.9 3,816 393,356.3Internet Services - - - - 5,996 130,904.9
Camarines Sur 10,963 1,272,872.7 6,980 950,423.3 3,673 458,768.6
Telegrams 1,036 99,195.8 818 93,381.3 271 27,069.6Telegraphic Transfer 448 32,450.3 160 11,006.9 82 4,955.1Social Telegrams 158 4,522.0 150 4,287.9 83 2,625.5Free Telegrams 9,321 1,136,704.6 5,852 841,747.2 3,237 424,118.4
Catanduanes 4,618 289,721.8 2,600 160,218.9 1,144 67,153.0
Telegrams 135 6,474.0 65 3,606.0 30 1,367.2Telegraphic Transfer 1,495 110,762.0 639 53,888.1 287 22,945.0Social Telegrams 41 1,773.8 12 312.0 6 152.0Free Telegrams 2,947 170,712.0 1,884 102,412.8 821 42,688.8Internet Services - - - - - -
Masbate 4,359 370,127.8 4,517 435,565.6 3,268 422,615.2
Telegrams 408 24,084.7 377 23,797.9 225 15,173.5Telegraphic Transfer 358 28,592.6 241 21,089.4 135 11,265.9Social Telegrams 105 2,566.9 70 2,087.1 46 1,632.9Free Telegrams 3,488 314,883.7 3,829 388,591.2 2,862 394,543.0Internet Services - - - - - -
Sorsogon 8,492 555,029.1 3,060 219,956.0 2,042 201,429.2
Telegrams 350 19,212.9 85 5,445.2 53 3,655.4Telegraphic Transfer 930 75,195.7 80 4,983.6 111 9,289.2Social Telegrams 70 1,769.4 20 468.0 33 663.0Free Telegrams 7,142 458,851.2 2,875 209,059.2 1,845 187,821.6Internet Services - - - - 3 239.0
Notes: 1. Telegraphic transfer and social telegram services are no longer available nationwide effective July 1, 2008. 2. Provincial Message Centers in Daet, Legazpi, Virac, Masbate and Sorsogon provide fax and internet services in addition to telegram service.
Source: Telecommunications Office
Province
13 - 32

2009 2010 2011Volume Value Volume Value Volume Value Volume Value
27,567 2,089,980.3 36,143 1,952,166.3 31,847 1,464,813.5 28,885 1,142,692.0
1,655 68,557.5 1,595 77,008.3 1,122 44,204.1 895 32,065.8- - - - - - - -- - - - - - - -
16,085 1,843,711.2 17,107 1,591,910.6 12,845 1,113,318.0 10,552 806,404.89,827 177,712 17,441 283,247.4 17,880 307,291.5 17,438 304,221.4
3,364 182,786.4 7,950 322,597.7 9,398 281,449.0 7,837 177,215.6
63 4,197.6 47 2,987.9 26 1,667.4 7 598.4- - - - - - - -- - - - - - - -
3,301 178,588.8 5,145 291,086.4 4,842 216,211.2 3,832 119,546.4- - 2,758 28,523.4 4,530 63,570.4 3,998 57,070.8
6,366 813,861.9 19,401 697,751.6 16,735 522,236.0 15,665 494,685.6
1,198 34,473.9 1,138 29,704.2 915 25,445.7 714 19,086.6- - - - - - - -- - - - - - - -
5,168 779,388.0 3,580 413,563.4 2,914 263,659.2 2,604 247,406.49,827 177,711.6 14,683 254,484.0 12,906 233,131.1 12,347 228,192.6
3,073 334,160.6 5,582 524,735.2 1,941 250,058.0 1,379 126,216.4
19 4,839.8 233 31,052.8 15 2,538.8 5 816.4- - - - - - - -- - - - - - - -
3,054 329,320.8 5,349 493,682.4 1,926 247,519.2 1,374 125,400.0
- - 5 966.4 596 28,787.7 1,195 43,046.2
- - 2 546.4 4 331.7 2 78- - - - - - - -- - - - - - - -- - 3 180.0 228 20,208.0 284 29,143.2- - - 240.0 364 8,248.0 909 13,825.0
3,643 450,983.0 2,239 292,876.2 2,009 255,697.3 2,024 235,597.6
365 24,258.2 173 12,637.8 160 14,098.1 167 11,486.4- - - - - - - -- - - - - - - -
3,278 426,724.8 2,066 280,238.4 1,812 239,857.2 1,767 221,131.2- - - - 37 1,742.0 90 2,980.0
1,294 130,476.8 966 113,239.2 1,168 126,585.6 785 65,930.6
10 788.0 2 79.2 2 122.4 - -- - - - - - - -- - - - - - - -
1,284 129,688.8 964 113,160.0 1,123 125,863.2 691 63,777.6- - - - 43 600 94 2,153.0
2012
13 - 33

Table 13.14HOUSEHOLDS WITH INTERNET ACCESS BY PROVINCE/CITY2010
Internet Access
From Home From Elsewhere
Region V 1,111,753 41,163 90,253
Albay 170,805 6,158 14,332
Camarines Norte 116,728 3,566 6,778
Camarines Sur 306,784 9,390 24,302
Catanduanes 49,368 2,261 7,168
Masbate 154,586 937 2,670
Sorsogon 121,175 1,886 7,370
Iriga City 21,759 1,678 1,870
Legazpi City 38,398 4,194 8,002
Ligao City 21,140 781 2,679
Naga City 35,929 6,104 6,146
Masbate City 17,058 926 3,364
Sorsogon City 32,694 1,906 2,321
Tabaco City 25,329 1,376 3,251
Notes:1. Figures are based on 20-percent sample households.2. Details may not add up to total due to rounding off.3. Provincial figures are exclusive of city figures.
Source: Philippine Statistics Authority, 2010 Census of Population and Housing
Province/City Total Number of Households
13 - 34
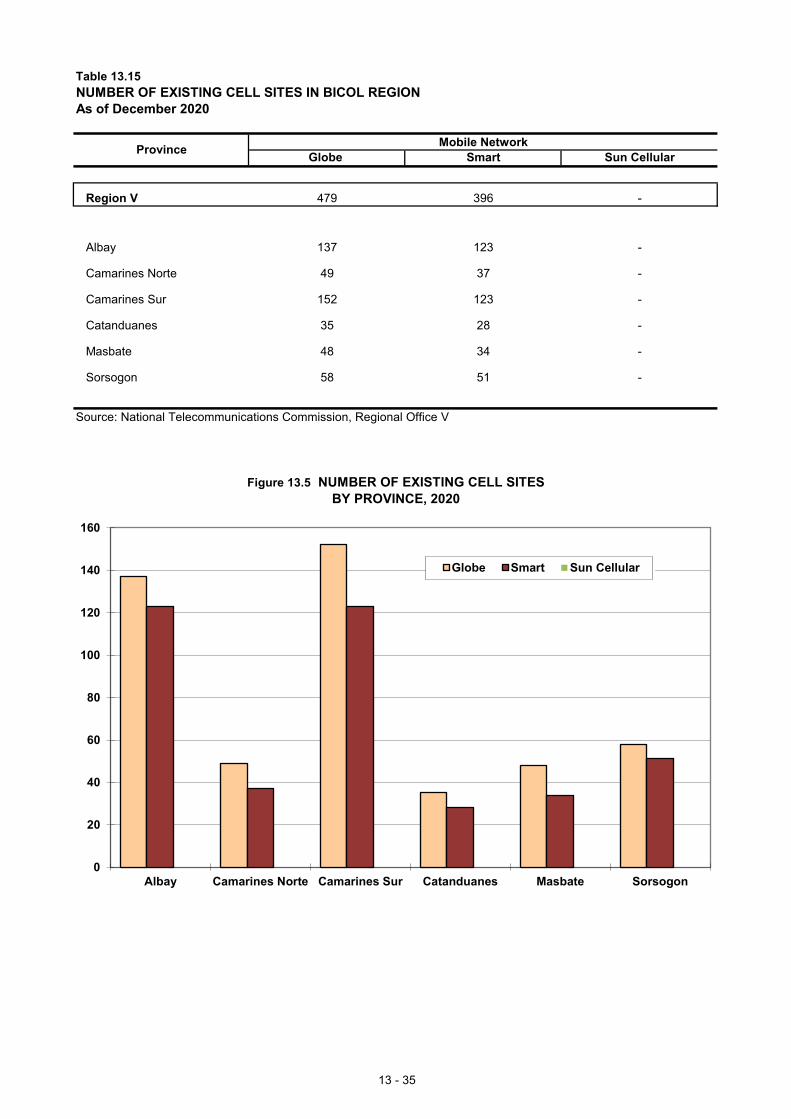
Table 13.15NUMBER OF EXISTING CELL SITES IN BICOL REGIONAs of December 2020
Mobile NetworkGlobe Smart Sun Cellular
Region V 479 396 -
Albay 137 123 -
Camarines Norte 49 37 -
Camarines Sur 152 123 -
Catanduanes 35 28 -
Masbate 48 34 -
Sorsogon 58 51 -
Source: National Telecommunications Commission, Regional Office V
Figure 13.5 NUMBER OF EXISTING CELL SITESBY PROVINCE, 2020
Province
0
20
40
60
80
100
120
140
160
Albay Camarines Norte Camarines Sur Catanduanes Masbate Sorsogon
Globe Smart Sun Cellular
13 - 35

Figure 13.6 DISTRIBUTION OF TELEPHONE LINESBY PROVINCE, 2019
Figure 13.7 NUMBER OF LICENSED RADIO STATIONS BY TYPE OF STATIONREGION V, 2017 - 2020
Camarines Sur47.5%
Albay29.2%
Masbate7.9%
Camarines Norte7.5%
Sorsogon6.1%
Catanduanes1.7%
0
2,000
4,000
6,000
8,000
10,000
12,000
14,000
2017 2018 2019 2020
Nu
mb
er o
f R
adio
Sta
tio
ns
Government Private
13 - 36

14 - 1
Data on energy and water resources are vital inputs to national and local programs of government. The business/industry sector also uses the data in the preparation of feasibility studies and in investment planning. The importance of these resources in countryside development is recognized in many ways. Energy and water are essential resources in stimulating the growth of businesses and other institutions operating in the locality. Industries and agriculture, the major contributors to the region's economy, are highly dependent on these resources. These resources are also vital in the day-to-day lives of individuals residing in the community. Considering the multifarious uses of these resources, the data on the level, extent, sources and utilization of energy and water provide signals on the potentials of the area to achieve growth and development. The data also serve as indicators of the standard of living of families comprising the community. This chapter presents regional and provincial data on power and irrigation. Specifically, the data on power include the number of municipalities/barangays energized, power distributed, power rates, and service connections by electric cooperatives. The data on irrigation include the number, service area, irrigators' associations, and farmer-beneficiaries of irrigation systems. The data sources for energy and irrigation are the National Power Corporation, National Electrification Administration and Local Electric Cooperatives and the National Irrigation Administration.
Sector Highlights Electric power production of generating plants in the Bicol Region increased by 11.7 percent from
1,998.8 giga watt-hours in 2019 to 2,231.1 giga watt-hours in 2020. All municipalities and all barangays under the coverage of the 11 electric cooperatives in the Bicol
Region had been energized as of December 31, 2020. Meanwhile, about 97.6 percent of potential subscribers had been provided with electricity.
Residential consumers remained the biggest users of electric power in the region utilizing about
62.1 percent of the total power distributed by local electric cooperatives in 2020. Commercial use of electric power account for 22.4 percent of total power distributed.
Residential consumers constitute close to 95.3 percent of the total number of subscribers of electric cooperatives in 2020. Commercial subscribers made up 3.1 percent while the number of industrial users remained the same.
In 2020, a total of 10 national irrigation systems were operational in the region. The service area of the total irrigated farmlands reached 24,105 hectares, an increase of 0.01 percent. A total of 35,034 farmer-members of 78 irrigators' associations benefitted from the irrigation facilities.
A total of 1,400 communal and private irrigation systems were operational in 2020 providing water to 101,937 hectares of palay farms.
Chapter 14 ENERGY AND WATER RESOURCES

Table 14.1 Energy Generation and Sales by Power Generating Plants in Region V2013 - 2020 14 - 3
Table 14.2 Status of Energization by Province, As of December 31, 2020 14 - 4
Table 14.3 Number of Municipalities and Barangays Energized by Electric Cooperative2013 - 2020 14 - 5
Table 14.4 Total Annual Power Distributed by Type of Consumer and ElectricCooperative, 2013 - 2020 14 - 6
Table 14.5 Service Connections by Type of Consumer and Electric Cooperative2013 - 2020 14 - 8
Table 14.6 Power Rates by Type of Consumer and Electric Cooperative, 2013 - 2020 14 - 10
Table 14.7 Number, Service Area, Irrigators' Association and Farmer-Beneficiariesof Existing National Irrigation Systems by Province, 2011 - 2020 14 - 12
Table 14.8 Number, Service Area, Irrigators' Association and Farmer-Beneficiariesof Existing Communal and Private Irrigation Systems by Province2011 - 2020 14 - 14
Figure 14.1 Energy Generation and Sales by Power Generating Plants, Region V2013 - 2020 14 - 3
Figure 14.2 Energization Coverage by Province, As of December 31, 2020 14 - 4
Figure 14.3 Percentage of Residential Service Connections by Electric Cooperative,Region V, 2020 14 - 9
Figure 14.4 Percentage of Residential Power Distribution by Electric Cooperative,Region V, 2020 14 - 16
Figure 14.5 Service Area of Existing Irrigation Systems, Region V, 2011 - 2020 14 - 16
14 - 2

Table 14.1ENERGY GENERATION, SALES AND CONSUMPTION BY POWER GENERATING PLANTS IN REGION V2013 - 2020(In Mega Watt-Hour)
Power Plant 2013 2014 2015 2016 2017 2018 2019 2020
Region V
Generation 1,580,570 1,915,867 2,250,726 2,341,095 2,288,688 2,192,070 1,998,212 2,231,124
Oil-Based 90,906 94,694 100,013 127,642 116,100 141,770 157,153 184,975
Geothermal 1,466,443 1,797,917 2,128,692 2,189,360 2,037,991 1,986,832 1,784,486 1,980,741
Hydro 23,221 23,256 22,021 22,550 21,608 22,974 15,407 23,549
Biomass - - - 1,543 112,989 40,494 41,165 41,859
Sales and Consumption 1,191,422 1,197,436 1,330,932 1,521,842 1,526,712 1,725,303 1,822,845 1,778,414
Purchased of Distribution Utilities 1,039,224 1,101,879 1,254,127 1,330,283 1,269,698 1,443,348 1,543,214 1,507,418
Source: Department of Energy
Figure 14.1 ENERGY GENERATION AND SALES BY POWER GENERATING PLANTSREGION V, 2013 - 2020
0
250,000
500,000
750,000
1,000,000
1,250,000
1,500,000
1,750,000
2,000,000
2,250,000
2,500,000
2013 2014 2015 2016 2017 2018 2019 2020
Me
ga
Wat
t-H
ou
r
Generation
Sales and Consumption
14 - 3

Table 14.2STATUS OF ENERGIZATION BY PROVINCEAs of December 31, 2020
Coverage Energized % Coverage Energized % Potential* Served %
Region V 112 112 100.0 3,427 3,427 100.0 1,197,412 1,168,662 97.6
Albay 18 18 100.0 720 720 100.0 277,127 273,668 98.8
Camarines Norte 12 12 100.0 282 282 100.0 129,999 128,730 99.0
Camarines Sur 37 37 100.0 1,063 1,063 100.0 400,615 406,977 101.6
Catanduanes 11 11 100.0 315 315 100.0 53,814 62,128 115.4
Masbate 19 19 100.0 506 506 100.0 169,004 112,521 66.6
Sorsogon 15 15 100.0 541 541 100.0 166,853 184,638 110.7
Source: National Electrification AdministrationWithin the Electric Cooperatives' coverage area*Potential Connections based on 2015 Census
Figure 14.2 ENERGIZATION COVERAGE BY PROVINCEAs of December 31, 2020
ProvinceMunicipalities Barangays Total Connections
0
50,000
100,000
150,000
200,000
250,000
300,000
350,000
400,000
450,000
Albay CamarinesNorte
Camarines Sur Catanduanes Masbate Sorsogon
Co
nn
ec
tio
ns
Potential Served
14 - 4

Table 14.3NUMBER OF MUNICIPALITIES AND BARANGAYS ENERGIZED BY ELECTRIC COOPERATIVE2013 – 2020
2013 2014 2015 2016 2017 2018 2019 2020
Region VMunicipalities 112 112 112 111 111 111 111 111Barangays 3,410 3,410 3,410 3,388 3,388 3,388 3,388 3,388
ALECO / APEC 1/
Municipalities 18 18 18 18 18 18 18 18Barangays 720 720 720 720 720 720 720 720
CANORECOMunicipalities 12 12 12 12 12 12 12 12Barangays 273 273 273 273 273 273 273 273
CASURECO I Municipalities 11 11 11 10 10 10 10 10Barangays 309 309 309 287 287 287 287 287
CASURECO IIMunicipalities 10 10 10 10 10 10 10 10Barangays 259 259 259 259 259 259 259 259
CASURECO IIIMunicipalities 7 7 7 7 7 7 7 7Barangays 229 229 229 229 229 229 229 229
CASURECO IVMunicipalities 9 9 9 9 9 9 9 9Barangays 258 258 258 258 258 258 258 258
FICELCOMunicipalities 11 11 11 11 11 11 11 11Barangays 315 315 315 315 315 315 315 315
MASELCOMunicipalities 15 15 15 15 15 15 15 15Barangays 434 434 434 434 434 434 434 434
SORECO IMunicipalities 8 8 8 8 8 8 8 8Barangays 253 253 253 253 253 253 253 253
SORECO IIMunicipalities 7 7 7 7 7 7 7 7Barangays 288 288 288 288 288 288 288 288
TISELCOMunicipalities 4 4 4 4 4 4 4 4Barangays 72 72 72 72 72 72 72 72
1/ San Miguel Corporation - Albay Power and Energy Corporation (SMC-APEC) took over the management of the
Albay Electric Cooperative, Inc. (ALECO) on February 2014.
Source: National Electrification Administration
Electric Cooperative
14 - 5

Table 14.4
TOTAL ANNUAL POWER DISTRIBUTED BY TYPE OF CONSUMER AND ELECTRIC COOPERATIVE2013 - 2020(In Thousand Kilowatt-Hours)
2013 2014 2015 2016 2017 2018 2019 2020
Region V … 956,276 1,102,187 1,229,109 1,278,552 1,453,750 1,502,753 1,504,296
Residential … 539,383 615,702 700,367 719,465 818,431 841,516 934,807Commercial … 261,757 300,149 337,693 357,662 409,815 404,180 337,340Industrial … 62,007 74,894 82,997 80,943 95,570 121,855 105,794Others … 93,129 111,442 108,052 120,482 129,934 135,202 126,355
ALECO / APEC 1/ … 242,106 299,922 326,999 340,197 394,463 363,466 381,026
Residential … 133,954 159,965 178,059 176,398 201,901 185,263 222,189Commercial … 70,670 87,605 106,224 111,406 129,283 110,567 95,792Industrial … 17,927 22,866 24,033 22,554 26,773 35,804 32,260Others … 19,555 29,486 18,683 29,839 36,506 31,832 30,785
CANORECO 120,071 121,816 132,966 148,453 156,579 168,079 178,543 181,017
Residential 74,214 74,951 81,807 91,365 95,706 108,083 112,226 123,156Commercial 27,304 30,346 31,850 33,792 35,750 37,465 42,618 37,275Industrial 6,832 4,676 5,622 9,077 9,877 7,575 7,223 5,992Others 11,721 11,843 13,687 14,219 15,246 14,956 16,477 14,594
CASURECO I 50,549 47,920 56,505 65,305 67,746 76,677 83,162 86,201
Residential 36,789 34,429 41,054 47,994 49,817 56,052 60,763 64,459Commercial 7,481 7,254 8,017 8,740 9,001 10,523 11,453 11,021Industrial 2,110 2,136 2,678 3,350 3,479 3,500 3,540 3,229Others 4,169 4,101 4,756 5,221 5,449 6,602 7,407 7,492
CASURECO II 224,684 228,754 257,764 287,594 289,391 330,268 362,061 334,327
Residential 96,145 98,034 111,328 128,018 126,709 142,591 155,278 171,155Commercial 87,828 89,772 101,248 110,179 117,413 126,764 122,853 91,211Industrial 16,906 17,398 19,489 21,396 19,061 33,524 50,849 41,955Others 23,805 23,550 25,699 28,001 26,208 27,389 33,082 30,006
CASURECO III 62,162 66,859 75,116 84,642 83,317 101,937 110,019 106,925
Residential 39,208 42,311 47,587 54,357 53,174 64,754 67,208 69,680Commercial 12,631 13,151 14,672 16,021 16,484 29,589 35,544 30,785Industrial 3,043 3,322 3,972 4,332 4,494 2,901 2,474 2,433Others 7,280 8,075 8,885 9,932 9,165 4,693 4,793 4,027
CASURECO IV 37,911 37,057 41,787 49,585 48,567 57,644 62,146 62,777
Residential 25,134 23,997 27,235 32,472 32,371 38,035 41,463 44,714Commercial 6,897 6,980 7,692 8,961 8,798 11,033 11,692 10,093Industrial 2,342 2,379 2,890 3,527 2,844 3,091 3,262 3,022Others 3,538 3,701 3,970 4,625 4,554 5,485 5,729 4,948
1/ San Miguel Corporation - Albay Power and Energy Corporation (SMC-APEC) took over the management of the
Albay Electric Cooperative, Inc. (ALECO) on February 2014.
Source: National Electrification Administration
Electric Cooperative
14 - 6

Table 14.4 - Continued
TOTAL ANNUAL POWER DISTRIBUTED BY TYPE OF CONSUMER AND ELECTRIC COOPERATIVE2013 - 2020(In Thousand Kilowatt-Hours)
2013 2014 2015 2016 2017 2018 2019 2020Electric Cooperative
FICELCO 34,212 35,316 39,972 45,414 44,784 51,582 57,838 54,228
Residential 22,036 22,660 25,575 28,973 28,698 33,003 36,925 36,624Commercial 7,083 7,622 8,697 10,218 10,259 11,847 13,351 10,403Industrial - - - - - - - - Others 5,093 5,034 5,700 6,223 5,827 6,732 7,561 7,201
MASELCO 59,039 63,943 67,353 74,830 83,281 96,787 105,182 108,389
Residential 38,626 40,371 42,318 48,777 55,955 65,912 72,114 78,873Commercial 10,646 13,238 14,183 14,961 15,494 17,268 18,259 15,338Industrial 4,385 4,685 4,728 4,556 4,221 3,696 4,202 3,643Others 5,382 5,649 6,124 6,536 7,611 9,911 10,608 10,535
SORECO I 35,885 35,993 40,383 43,377 49,521 53,250 55,768 60,265
Residential 25,233 25,056 28,070 30,784 35,113 37,286 38,993 43,518Commercial 4,962 4,903 5,282 5,400 6,345 7,712 8,420 7,840Industrial 2,645 2,871 3,693 3,863 3,952 3,708 3,789 4,462Others 3,045 3,163 3,338 3,330 4,111 4,544 4,567 4,445
SORECO II 66,213 71,250 84,565 96,002 107,143 113,931 117,715 118,409
Residential 39,436 39,460 46,073 53,937 58,991 63,338 65,640 71,574Commercial 15,702 17,146 20,197 22,445 25,909 27,430 28,741 26,506Industrial 3,216 6,613 8,956 8,863 10,462 10,801 10,713 8,798Others 7,859 8,031 9,339 10,757 11,781 12,362 12,621 11,531
TISELCO 4,819 5,262 5,854 6,908 8,027 9,132 6,852 10,736
Residential 3,785 4,160 4,690 5,631 6,532 7,476 5,644 8,865Commercial 653 675 706 752 804 901 682 1,077Industrial - - - - - - - - Others 381 427 458 525 691 755 526 794
14 - 7

Table 14.5 SERVICE CONNECTIONS BY TYPE OF CONSUMER AND ELECTRIC COOPERATIVE2013 - 2020
2013 2014 2015 2016 2017 2018 2019 2020
Region V … 893,831 939,946 974,128 953,539 990,286 1,118,669 1,163,846
Residential … 844,990 887,136 920,752 899,050 934,994 1,063,958 1,109,652Commercial … 30,468 33,497 33,817 34,664 35,862 36,205 36,082Industrial … 900 932 919 912 910 865 861Others … 17,473 18,381 18,640 18,913 18,520 17,641 17,251
ALECO / APEC 1/ … 221,511 235,235 233,279 182,697 190,303 269,200 273,668
Residential … 212,375 222,686 221,044 170,557 177,997 256,891 262,238Commercial … 6,790 9,350 9,112 9,133 9,337 9,486 9,048Industrial … 352 384 348 341 330 320 279Others … 1,994 2,815 2,775 2,666 2,639 2,503 2,103
CANORECO 100,769 105,007 108,911 113,113 116,133 119,454 122,400 128,730
Residential 95,092 99,136 102,827 106,822 109,632 113,326 116,149 122,332Commercial 3,880 3,955 4,073 4,153 4,269 4,383 4,466 4,577Industrial 35 36 34 39 36 33 29 27Others 1,762 1,880 1,977 2,099 2,196 1,712 1,756 1,794
CASURECO I 66,488 68,515 71,470 75,984 80,154 84,988 89,127 92,118
Residential 59,669 61,891 64,901 69,349 73,414 78,141 82,478 85,285Commercial 2,305 2,287 2,356 2,440 2,544 2,683 2,761 2,819Industrial 55 59 59 68 67 72 72 74Others 4,459 4,278 4,154 4,127 4,129 4,092 3,816 3,940
CASURECO II 105,839 110,092 113,339 117,538 121,381 124,734 128,793 132,394
Residential 99,173 103,421 106,513 110,594 114,388 117,698 121,500 125,113Commercial 5,177 5,171 5,297 5,390 5,430 5,453 5,562 5,681Industrial 85 83 83 87 84 93 104 101Others 1,404 1,417 1,446 1,467 1,479 1,490 1,627 1,499
CASURECO III 68,044 71,146 73,419 75,646 77,644 80,164 92,619 94,903
Residential 63,956 67,068 69,326 71,676 73,531 75,918 88,489 90,602Commercial 2,684 2,660 2,655 2,596 2,698 2,880 2,821 2,920Industrial 150 148 154 148 150 152 138 146Others 1,254 1,270 1,284 1,226 1,265 1,214 1,171 1,235
CASURECO IV 53,656 55,996 58,091 60,625 62,577 66,251 80,291 82,746
Residential 50,840 53,116 54,995 57,405 59,285 62,772 76,709 79,088Commercial 1,807 1,882 2,035 2,127 2,201 2,368 2,442 2,495Industrial 36 38 36 37 37 39 36 40Others 973 960 1,025 1,056 1,054 1,072 1,104 1,123
FICELCO 48,684 50,323 52,477 54,797 56,143 57,426 59,304 62,128
Residential 45,101 46,691 48,775 50,962 52,261 53,417 55,207 59,246Commercial 2,030 2,043 2,059 2,170 2,203 2,260 2,292 1,900Industrial - - - - - - - - Others 1,553 1,589 1,643 1,665 1,679 1,749 1,805 982
1/ San Miguel Corporation - Albay Power and Energy Corporation (SMC-APEC) took over the management of the
Albay Electric Cooperative, Inc. (ALECO) on February 2014.
Source: National Electrification Administration
Electric Cooperative
14 - 8

Table 14.5 - ContinuedSERVICE CONNECTIONS BY TYPE OF CONSUMER AND ELECTRIC COOPERATIVE2013 - 2020
2013 2014 2015 2016 2017 2018 2019 2020Electric Cooperative
MASELCO 53,546 56,353 59,255 68,644 73,150 76,428 79,547 93,685
Residential 50,932 53,700 56,550 65,842 70,206 73,397 76,648 90,638Commercial 1,569 1,568 1,571 1,611 1,648 1,668 1,628 1,656Industrial 112 120 124 126 134 129 115 130Others 933 965 1,010 1,065 1,162 1,234 1,156 1,261
SORECO I 62,473 68,732 76,843 77,869 79,572 81,198 83,059 85,167
Residential 59,714 65,955 74,263 75,102 76,616 78,241 80,726 82,182Commercial 1,497 1,501 1,414 1,545 1,705 1,778 1,665 1,831Industrial 52 52 44 52 50 48 35 50Others 1,210 1,224 1,122 1,170 1,201 1,131 633 1,104
SORECO II 74,421 77,277 80,236 83,902 90,210 93,652 96,331 99,471
Residential 70,323 73,261 76,120 79,745 85,816 88,958 91,743 94,638Commercial 2,369 2,278 2,349 2,344 2,493 2,702 2,727 2,822Industrial 12 12 14 14 13 14 16 14Others 1,717 1,726 1,753 1,799 1,888 1,978 1,845 1,997
TISELCO 7,377 8,879 10,670 12,731 13,878 15,688 17,998 18,836
Residential 6,875 8,376 10,180 12,211 13,344 15,129 17,418 18,290Commercial 345 333 338 329 340 350 355 333Industrial - - - - - - - - Others 157 170 152 191 194 209 225 213
Figure 14.3 PERCENTAGE OF RESIDENTIAL SERVICE CONNECTIONS BY ELECTRIC COOPERATIVE, REGION V, 2020
0
50,000
100,000
150,000
200,000
250,000
300,000
Total Residential
14 - 9

Table 14.6
POWER RATES BY TYPE OF CONSUMER AND ELECTRIC COOPERATIVE2013 - 2020(In Pesos per Kilowatt-Hour)
Electric Cooperative 2013 2014 2015 2016 2017 2018 2019 2020
ALECO / APEC 2/
Residential 10.79 10.77 9.46 9.13 9.11 7.94 9.38 10.37 Commercial 10.56 10.16 8.07 7.97 8.25 7.08 8.52 9.50 Industrial 9.25 10.16 8.07 7.97 8.25 7.08 8.52 9.50 Others 1/ 10.56 9.48 7.55 7.97 8.25 7.08 8.52 9.50
CANORECO
Residential 11.22 8.33 8.19 8.23 8.71 8.59 9.37 9.73 Commercial 9.10 7.33 7.29 7.38 7.86 7.74 8.52 8.88 Industrial 9.10 7.33 7.29 7.38 7.86 7.74 8.52 8.88 Others 1/ 9.10 6.42 6.41 7.38 7.86 7.74 8.52 8.88
CASURECO I
Residential 11.61 10.15 9.83 9.49 9.31 9.05 9.13 9.78 Commercial 10.46 9.02 8.07 7.71 7.59 7.88 7.96 7.92 Industrial 10.46 9.02 8.07 7.71 7.59 7.88 7.96 7.92 Others 1/ 10.46 9.02 8.07 7.71 7.59 7.88 7.96 7.92
CASURECO II
Residential 13.59 8.87 8.06 7.55 8.64 9.21 8.22 8.37 Commercial 8.39 7.98 7.21 6.68 7.77 8.40 7.38 7.54 Industrial 8.89 7.98 7.21 6.68 7.77 8.40 7.38 7.54 Others 1/ 8.39 7.28 6.58 6.68 7.77 8.40 7.38 7.54
CASURECO III
Residential 10.74 11.92 11.20 10.08 11.55 10.50 10.13 10.70 Commercial 9.56 9.56 9.86 8.89 10.36 9.31 8.94 9.51 Industrial 9.56 9.58 9.86 8.89 10.36 9.31 8.94 9.51 Others 1/ 9.20 9.20 9.86 8.89 10.36 9.31 8.94 9.51
CASURECO IV
Residential 12.21 10.80 10.44 10.48 11.29 10.74 11.03 10.66 Commercial 10.80 9.50 9.13 9.33 10.14 9.59 9.88 9.51 Industrial 9.64 9.50 9.13 9.33 10.14 9.59 9.88 9.51 Others 1/ 9.64 6.96 8.13 9.33 - 9.59 9.88 9.51
FICELCO
Residential 12.14 11.24 12.37 11.38 11.36 10.71 10.61 10.93 Commercial 10.58 9.83 10.84 10.01 8.17 7.51 7.39 7.69 Industrial - - - - - - - - Others 1/ 10.57 12.57 13.62 12.49 8.60 7.48 7.36 7.66
1/ average of several items2/ San Miguel Corporation - Albay Power and Energy Corporation (SMC-APEC) took over the management of the
Albay Electric Cooperative, Inc. (ALECO) on February 2014.
Source: National Electrification Administration
14 - 10

Table 14.6 - Continued
POWER RATES BY TYPE OF CONSUMER AND ELECTRIC COOPERATIVE2013 - 2020(In Pesos per Kilowatt-Hour)
Electric Cooperative 2013 2014 2015 2016 2017 2018 2019 2020
MASELCO
Residential 9.57 9.57 9.77 9.64 8.64 8.11 7.85 7.77 Commercial 8.53 10.58 8.75 8.58 7.69 7.03 6.91 6.82 Industrial 8.55 8.79 8.98 8.59 7.70 7.04 6.91 6.83 Others 1/ 8.61 8.86 8.82 8.67 7.76 7.20 6.89 6.80
SORECO I
Residential 12.11 15.79 9.36 10.01 9.07 9.79 10.28 9.15 Commercial 10.06 13.88 7.49 8.23 7.34 8.49 8.99 7.57 Industrial 9.17 12.49 6.70 7.45 6.63 7.84 8.34 6.66 Others 1/ 10.15 13.97 7.58 8.29 7.41 7.97 8.48 6.85
SORECO II
Residential … 12.29 9.35 9.97 9.09 11.00 10.68 11.37 Commercial … … 6.95 7.68 6.81 8.89 8.65 8.72 Industrial … … 6.95 7.68 6.81 8.89 8.65 8.72 Others 1/ … … 6.95 7.68 6.81 8.89 8.65 8.72
TISELCO
Residential … 11.64 11.28 11.28 9.82 9.82 9.82 9.82 Commercial … … 10.26 10.26 8.95 8.95 8.95 8.95 Industrial … … - - - - - - Others 1/ … … 11.53 11.53 10.08 11.87 11.87 11.87
1/ average of several items
14 - 11

Table 14.7 NUMBER, SERVICE AREA, IRRIGATORS' ASSOCIATION AND FARMER-BENEFICIARIESOF EXISTING NATIONAL IRRIGATION SYSTEMS BY PROVINCE2011 - 2020(Area in Hectares)
Service Number of Farmer-Year / Province Number Area Irrigators' Beneficiaries
Association
2011 Region V 8 20,807 83 34,268
Albay 1 3,807 8 4,426 Camarines Norte 2 2,841 10 4,008 Camarines Sur 4 13,218 60 24,350 Catanduanes - - - - Masbate - - - - Sorsogon 1 941 5 1,484
2012 Region V 8 23,575 81 32,969
Albay 1 3,530 8 3,800 Camarines Norte 2 3,455 10 3,562 Camarines Sur 4 15,640 58 24,123 Catanduanes - - - - Masbate - - - - Sorsogon 1 950 5 1,484
2013 Region V 8 23,189 81 33,969
Albay 1 3,608 8 4,428 Camarines Norte 2 3,539 10 3,826 Camarines Sur 4 15,040 58 24,203 Catanduanes - - - - Masbate - - - - Sorsogon 1 1,002 5 1,512
2014 Region V 8 23,147 81 33,992
Albay 1 3,608 8 4,428 Camarines Norte 2 3,497 10 3,826 Camarines Sur 4 15,040 58 24,203 Catanduanes - - - - Masbate - - - - Sorsogon 1 1,002 5 1,535
2015 Region V 10 23,147 80 34,288
Albay 3 3,608 8 4,465 Camarines Norte 2 3,497 10 3,908 Camarines Sur 4 15,040 57 24,303 Catanduanes - - - - Masbate - - - - Sorsogon 1 1,002 5 1,612
Source: National Irrigation Administration
14 - 12

Table 14.7 - Continued
NUMBER, SERVICE AREA, IRRIGATORS' ASSOCIATION AND FARMER-BENEFICIARIESOF EXISTING NATIONAL IRRIGATION SYSTEMS BY PROVINCE2011 - 2020(Area in Hectares)
Service Number of Farmer-Year / Province Number Area Irrigators' Beneficiaries
Association
2016 Region V 10 23,252 80 34,817
Albay 3 3,608 8 4,465 Camarines Norte 2 3,602 10 3,908 Camarines Sur 4 15,040 57 24,832 Catanduanes - - - - Masbate - - - - Sorsogon 1 1,002 5 1,612
2017 Region V 10 24,016 79 33,933
Albay 3 3,608 8 4,379 Camarines Norte 2 3,612 10 3,908 Camarines Sur 4 15,794 56 24,034 Catanduanes - - - - Masbate - - - - Sorsogon 1 1,002 5 1,612
2018 Region V 10 24,016 77 35,541
Albay 3 3,608 8 4,465 Camarines Norte 2 3,612 10 3,908 Camarines Sur 4 15,794 54 25,556 Catanduanes - - - - Masbate - - - - Sorsogon 1 1,002 5 1,612
2019 Region V 10 24,019 78 34,895
Albay 3 3,611 8 4,379 Camarines Norte 2 3,612 10 3,926 Camarines Sur 4 15,794 55 24,978 Catanduanes - - - - Masbate - - - - Sorsogon 1 1,002 5 1,612
2020 Region V 10 24,105 78 35,034
Albay 3 3,616 8 4,379 Camarines Norte 2 3,612 10 3,908 Camarines Sur 4 15,875 55 25,135 Catanduanes - - - - Masbate - - - - Sorsogon 1 1,002 5 1,612
14 - 13

Table 14.8NUMBER, SERVICE AREA, IRRIGATORS' ASSOCIATION AND FARMER-BENEFICIARIES OFEXISTING COMMUNAL AND PRIVATE IRRIGATION SYSTEMS BY PROVINCE2011 - 2020(Area in Hectares)
Irrigators' Association Irrigation SystemYear/Province Bene- Total Communal a/ Private
ficiaries No. Service Area No. Service Area No. Service AreaNo. Members
2011 b/
Region V 348 35,241 31,334 3,422 98,463 2,858 73,099 564 25,364
Albay 59 9,464 7,269 558 21,946 221 10,794 337 11,152 Camarines Norte 48 2,241 2,051 358 4,389 354 4,267 4 122 Camarines Sur 107 12,330 11,838 1,952 54,119 1,848 43,911 104 10,208 Catanduanes 37 2,085 2,351 117 2,577 117 2,577 - - Masbate 29 1,679 1,365 297 4,249 191 2,883 106 1,366 Sorsogon 68 7,442 6,460 140 11,183 127 8,667 13 2,516
2012 b/
Region V 392 40,378 36,477 3,440 101,297 2,868 75,015 572 26,282
Albay 66 10,199 8,232 562 22,455 225 11,303 337 11,152 Camarines Norte 47 2,272 2,082 365 4,620 361 4,498 4 122 Camarines Sur 145 16,345 14,355 1,974 55,892 1,862 44,766 112 11,126 Catanduanes 37 2,085 2,351 118 2,691 118 2,691 - - Masbate 27 1,769 1,749 277 4,269 171 2,903 106 1,366 Sorsogon 70 7,708 7,708 144 11,370 131 8,854 13 2,516
2013 b/
Region V 426 42,978 38,750 3,471 106,846 2,911 81,569 560 25,277
Albay 89 12,339 10,119 577 24,771 243 13,631 334 11,140 Camarines Norte 49 1,887 1,887 364 4,809 360 4,687 4 122 Camarines Sur 147 16,555 14,583 1,979 57,630 1,876 47,497 103 10,133 Catanduanes 37 2,351 2,351 120 2,733 120 2,733 - - Masbate 32 2,008 1,988 283 4,759 177 3,393 106 1,366 Sorsogon 72 7,838 7,822 148 12,144 135 9,628 13 2,516
2014 b/
Region V 455 44,218 40,087 3,557 113,085 2,999 88,026 558 25,059
Albay 99 12,616 10,326 607 26,336 273 15,196 334 11,140 Camarines Norte 46 1,970 1,802 364 5,000 360 4,878 4 122 Camarines Sur 152 16,590 14,937 2,004 60,934 1,903 51,019 101 9,915 Catanduanes 48 2,962 2,962 124 3,215 124 3,215 - - Masbate 32 1,956 1,936 289 5,510 183 4,144 106 1,366 Sorsogon 78 8,124 8,124 169 12,090 156 9,574 13 2,516
2015 b/
Region V 461 44,720 40,284 2,091 114,966 1,533 89,907 558 25,059
Albay 98 12,482 10,280 605 26,626 271 15,486 334 11,140 Camarines Norte 44 1,970 1,802 364 5,091 360 4,969 4 122 Camarines Sur 153 16,561 14,635 543 61,414 442 51,499 101 9,915 Catanduanes 49 3,320 3,320 121 3,195 121 3,195 - - Masbate 36 2,148 2,040 288 6,432 182 5,066 106 1,366 Sorsogon 81 8,239 8,207 170 12,208 157 9,692 13 2,516
Source: National Irrigation Administration
14 - 14

Table 14.8 - Continued
NUMBER, SERVICE AREA, IRRIGATORS' ASSOCIATION AND FARMER-BENEFICIARIES OFEXISTING COMMUNAL AND PRIVATE IRRIGATION SYSTEMS BY PROVINCE2011 - 2020(Area in Hectares)
Irrigators' Association Irrigation SystemYear/Province Bene- Total Communal a/ Private
ficiaries No. Service Area No. Service Area No. Service AreaNo. Members
2016 b/
Region V 484 46,244 37,795 1,388 99,465 830 74,406 558 25,059
Albay 103 12,906 8,465 469 23,722 135 12,582 334 11,140 Camarines Norte 47 2,139 1,552 65 3,487 61 3,365 4 122 Camarines Sur 166 17,256 14,492 470 55,140 369 45,225 101 9,915 Catanduanes 48 3,302 3,320 62 2,100 62 2,100 - - Masbate 37 2,148 2,025 199 5,019 93 3,653 106 1,366 Sorsogon 83 8,493 7,941 123 9,997 110 7,481 13 2,516
2017 b/
Region V 520 46,802 40,084 1,412 99,672 854 74,613 558 25,059
Albay 116 13,711 9,039 483 23,912 149 12,772 334 11,140 Camarines Norte 48 2,338 1,847 70 3,672 66 3,550 4 122 Camarines Sur 167 15,968 14,562 459 54,784 358 44,869 101 9,915 Catanduanes 53 3,414 3,414 71 2,146 71 2,146 - - Masbate 48 2,449 2,300 203 5,174 97 3,808 106 1,366 Sorsogon 88 8,922 8,922 126 9,984 113 7,468 13 2,516
2018 b/
Region V 529 49,463 39,631 1,382 101,121 829 76,189 553 24,932
Albay 124 14,979 9,835 491 24,821 162 13,777 329 11,044 Camarines Norte 48 2,384 1,564 69 3,969 65 3,847 4 122 Camarines Sur 170 17,525 14,576 464 55,007 363 45,124 101 9,883 Catanduanes 54 3,424 3,424 71 2,153 71 2,153 - - Masbate 50 2,503 2,331 182 5,210 76 3,843 106 1,367 Sorsogon 83 8,648 7,901 105 9,961 92 7,445 13 2,516
2019 b/
Region V 557 50,426 41,789 1,387 101,561 834 76,629 553 24,932
Albay 130 15,353 11,500 491 24,912 162 13,868 329 11,044 Camarines Norte 56 2,764 1,743 70 4,005 66 3,883 4 122 Camarines Sur 173 17,426 14,560 466 55,303 365 45,420 101 9,883 Catanduanes 62 3,579 3,579 73 2,165 73 2,165 - - Masbate 50 2,503 2,331 182 5,215 76 3,848 106 1,367 Sorsogon 86 8,801 8,076 105 9,961 92 7,445 13 2,516
2020 b/
Region V 567 50,389 42,838 1,400 101,937 847 77,005 553 24,932
Albay 132 15,400 11,580 491 25,024 162 13,980 329 11,044 Camarines Norte 56 2,634 1,742 75 4,154 71 4,032 4 122 Camarines Sur 177 17,397 15,485 464 55,278 363 45,395 101 9,883 Catanduanes 66 3,654 3,624 80 2,233 80 2,233 - - Masbate 50 2,503 2,331 183 5,230 77 3,863 106 1,367 Sorsogon 86 8,801 8,076 107 10,018 94 7,502 13 2,516
a/ includes systems constructed by Other Government Agency (OGA)b/ updated data based on approved inventory.
14 - 15

Figure 14.4 PERCENTAGE OF RESIDENTIAL POWER DISTRIBUTION BY ELECTRIC COOPERATIVE, REGION V, 2020
Figure 14.5 SERVICE AREA OF EXISTING IRRIGATION SYSTEMSREGION V, 2011 - 2020
0
50,000
100,000
150,000
200,000
250,000
300,000
350,000
400,000
450,000
(In
Th
ou
san
d K
ilo
wa
tt-H
ou
rs)
Total Residential
Private
Communal
National
0
20,000
40,000
60,000
80,000
100,000
120,000
140,000
160,000
2011 2012 2013 2014 2015 2016 2017 2018 2019 2020
In H
ec
tare
s
14 - 16

15 - 1
og
Data on the levels, patterns and distribution of the income and expenditures of local government units (LGUs) are essential in measuring their capabilities to provide public service to their constituents. Specifically, the level of income serves as a criterion in the classification of LGUs. The classification, on the other hand, provides a yardstick in the allocation of resources and other forms of assistance. Furthermore, the data provide a sound and logical basis in the choice of alternative options aimed at balancing the sources and disposition of resources. The data are also useful in identifying priority program areas and localities in the community. This chapter presents data on the average income of provincial, city and municipal LGUs and their income classification. The chapter also includes data on internal revenue collections of LGUs, and data pertaining to the annual statement of receipts and expenditures classified by level of government. The sources of data are the Bureau of Internal Revenue and the Bureau of Local Government Finance of the Department of Finance.
Sector Highlights The classifications of one city and 35 municipalities in the Bicol Region were upgraded one step
effective July 29, 2008. One municipality was however downgraded. Internal revenue collections in 2020 totaled 8.94 Billion pesos, 1.46 percent lower than the 9.07
Billion generated in 2019. Income taxes accounted for 61.40 percent of total internal revenue generated in the region for the year. Albay and Camarines Sur accounted for 68.55 percent of total internal revenue generated in the region.
The expenditure program of provincial and city governments in the region grew by 67.50 percent
between 2019 and 2018 with allocation for general public services recording the biggest percentage growth. Allocations for General Public Services and Social Services comprise the bulk of the LGU’s expenditure program.
Tax revenues of the municipal governments in Region V increased by 4.77 percent between 2018 and 2019 with Receipts from Loans and Borrowings providing the biggest source of the increase.
Chapter 15 PUBLIC ADMINISTRATION

Table 15.1 Average Income and Classification by Province/City/Municipality1996 - 1999, 2000 - 2003 and 2004 - 2007 15 - 3
Classification of Provinces, Cities and Municipalities 15 - 6
Table 15.2 Summary of Internal Revenue Collections by Province, 2011 - 2020 15 - 7
Table 15.3 Expenditure Program of Provincial and City Governments, 2013 - 2019 15 - 9
Table 15.4 Statement of Income of Municipal Governments by Province, 2015 - 2019 15 - 12
Figure 15.1 Expenditure Program of Provincial and City GovernmentsRegion V, 2019 15 - 11
Figure 15.2 Distribution of Income of Municipal Governments by Province, 2019 15 - 14
15 - 2

Table 15.1 AVERAGE INCOME AND CLASSIFICATION BY PROVINCE/CITY/MUNICIPALITY1996-1999, 2000-2003 and 2004-2007(Average Income in Pesos)
1996-1999 2000-2003 2004-2007Average Income Average Income Average IncomeIncome Classification 1/ Income Classification 2/ Income Classification 3/
Region V
Albay 309,012,456.55 1st 445,422,000 1st 603,855,000 1st
Bacacay 23,386,994.64 3rd 40,324,000 2nd 52,141,000 2ndCamalig 24,383,653.15 3rd 41,567,000 2nd 55,710,000 1stDaraga 48,546,240.06 1st 81,911,000 1st 110,018,000 1stGuinobatan 32,844,509.20 2nd 55,238,000 1st 71,249,000 1stJovellar 12,088,541.11 5th 19,974,000 5th 25,552,000 4th
LEGAZPI CITY 207,906,349.26 1st 268,988,000 2nd 347,803,000 2ndLibon 27,050,504.32 2nd 46,832,000 2nd 61,228,000 1stLigao City 4/ ... ... 126,152,000 4th 232,593,000 4thMalilipot 13,304,497.20 4th 22,982,000 4th 34,722,000 4thMalinao 17,115,420.71 4th 29,207,000 4th 38,563,000 3rd
Manito 13,883,328.63 4th 22,593,000 4th 28,861,000 4thOas 26,796,052.12 3rd 45,789,000 2nd 60,222,000 1stPio Duran 19,816,509.93 4th 32,391,000 3rd 43,508,000 3rdPolangui 32,795,134.73 2nd 52,949,000 1st 71,010,000 1stRapu-Rapu 15,648,534.05 4th 26,882,000 4th 39,318,000 3rd
Santo Domingo 15,665,464.51 4th 24,961,000 4th 32,621,000 4thTabaco City 5/ ... ... 124,210,000 4th 202,515,000 4thTiwi 36,028,104.64 1st 42,217,000 2nd 64,812,000 1st
Camarines Norte 186,644,236.49 2nd 299,722,000 2nd 385,447,000 2nd
Basud 18,028,859.86 4th 32,095,000 3rd 42,012,000 3rdCapalonga 18,295,449.45 4th 29,905,000 4th 39,603,000 3rdDAET 40,498,059.65 1st 67,929,000 1st ... ... Jose Panganiban 25,568,122.50 3rd 40,781,000 2nd 53,126,000 2ndLabo 41,225,647.70 1st 67,263,000 1st 91,100,000 1st
Mercedes 20,111,606.55 4th 34,965,000 3rd 47,097,000 2ndParacale 22,007,775.20 3rd 35,111,000 3rd 44,555,000 3rdSan Lorenzo Ruiz 10,793,188.25 5th 17,352,000 5th 22,638,000 5thSan Vicente 8,511,024.27 5th 13,811,000 5th 18,258,000 5thSanta Elena 18,196,943.14 4th 32,012,000 3rd 42,906,000 3rd
Talisay 10,973,390.64 5th 18,915,000 5th 25,098,000 4thVinzons 17,816,088.02 4th 31,995,000 3rd 40,853,000 3rd
Camarines Sur 365,079,295.83 1st 572,369,000 1st 770,956,000 1st
Baao 19,848,642.64 4th 33,944,000 3rd 43,946,000 3rdBalatan 12,701,760.89 5th 21,340,000 4th 27,055,000 4thBato 17,582,268.45 4th 30,924,000 3rd 40,584,000 3rdBombon 9,017,617.29 5th 14,925,000 5th 19,042,000 5th
1/ As of November 20, 20012/ As of July 29, 20053/ As of July 29, 20084/ Converted into a city under Republic Act (RA) No. 9008 ratified on March 24, 2001.5/ Converted into a city under Republic Act (RA) No. 9020 ratified on March 25, 2001.
Source: Bureau of Local Government Finance
Province / City / Municipality
15 - 3

Table 15.1 - ContinuedAVERAGE INCOME AND CLASSIFICATION BY PROVINCE/CITY/MUNICIPALITY1996-1999, 2000-2003 and 2004-2007(Average Income in Pesos)
1996-1999 2000-2003 2004-2007Average Income Average Income Average IncomeIncome Classification 1/ Income Classification 2/ Income Classification 3/
Province / City / Municipality
Buhi 27,949,632.10 2nd 47,673,000 2nd 63,039,000 1stBula 23,647,663.40 3rd 39,382,000 3rd 54,257,000 2ndCabusao 11,236,273.86 5th 18,002,000 5th 22,671,000 5thCalabanga 28,298,145.43 2nd 49,410,000 2nd 64,192,000 1stCamaligan 9,816,601.17 5th 16,616,000 5th 21,663,000 5th
Canaman 14,567,998.56 4th 22,021,000 4th 29,777,000 4thCaramoan 19,915,338.77 4th … … 45,671,000 2ndDel Gallego 15,312,998.53 4th 23,546,000 4th 31,467,000 4thGainza 7,002,415.64 5th 12,050,000 5th 14,716,000 6thGarchitorena 14,604,721.00 4th 24,940,000 4th 32,993,000 4th
Goa 23,613,897.68 3rd 41,205,000 2nd 52,686,000 2ndIriga City 132,073,462.41 3rd 173,024,000 4th 209,566,000 4thLagonoy 23,510,296.31 3rd 36,531,000 3rd 53,311,000 2ndLibmanan 37,486,440.30 1st 62,949,000 1st 81,753,000 1stLupi 16,340,093.88 4th 26,567,000 4th 36,234,000 3rd
Magarao 11,460,947.38 5th 19,631,000 5th 25,044,000 4thMilaor 11,460,504.14 5th 20,092,000 4th 28,276,000 4thMinalabac 18,167,747.04 4th 29,374,000 4th 39,610,000 3rdNabua 28,063,368.69 2nd 49,308,000 2nd 62,864,000 1stNaga City 213,224,234.97 1st 287,122,000 2nd 366,972,000 2nd
Ocampo 16,935,931.09 4th 28,103,000 4th 37,379,000 3rdPamplona 13,730,362.66 4th 23,583,000 4th 31,578,000 4thPasacao 19,063,429.49 4th 32,937,000 3rd 44,136,000 3rdPILI 34,243,152.77 2nd 54,023,000 1st 69,218,000 1stPresentacion 11,719,580.26 5th … … 25,738,000 4th
Ragay 24,901,831.06 3rd 43,826,000 2nd 57,383,000 1stSangay 14,585,788.31 4th 24,556,000 4th 32,549,000 4thSan Fernando 13,258,812.29 4th 22,330,000 4th 29,532,000 4thSan Jose 14,691,581.35 4th 24,896,000 4th 32,516,000 4thSipocot 27,073,703.28 2nd 44,945,000 2nd 60,027,000 1st
Siruma 11,245,899.68 5th 19,120,000 5th 25,836,000 4thTigaon 17,619,124.50 4th 29,269,000 4th 38,366,000 3rdTinambac 25,860,512.61 3rd 44,054,000 2nd 58,831,000 1st
Catanduanes 146,888,198.33 3rd 224,978,000 3rd 276,553,000 3rd
Bagamanoc 9,620,472.23 5th 15,509,000 5th 19,979,000 5thBaras 9,973,147.49 5th … … 21,683,000 5thBato 10,658,158.42 5th 17,711,000 5th 22,330,000 5thCaramoran 16,063,970.28 4th 27,331,000 4th 36,082,000 3rdGigmoto 10,163,187.86 5th 17,366,000 5th 18,784,000 5th
Pandan 11,883,489.48 5th 19,805,000 5th 25,864,000 4thPanganiban 9,105,552.11 5th 14,970,000 5th 19,525,000 5thSan Andres 17,560,796.02 4th 28,565,000 4th 37,228,000 3rdSan Miguel 10,946,538.40 5th 18,648,000 5th 23,851,000 5thViga 13,142,298.07 4th 22,081,000 4th 28,410,000 4th
VIRAC 31,508,241.18 2nd 51,508,000 1st 68,734,000 1st
15 - 4

Table 15.1 - ContinuedAVERAGE INCOME AND CLASSIFICATION BY PROVINCE/CITY/MUNICIPALITY1996-1999, 2000-2003 and 2004-2007(Average Income in Pesos)
1996-1999 2000-2003 2004-2007Average Income Average Income Average IncomeIncome Classification 1/ Income Classification 2/ Income Classification 3/
Province / City / Municipality
Masbate 232,814,931.75 2nd 375,831,000 1st 474,044,000 1st
Aroroy 31,112,487.31 2nd 52,371,000 1st 66,453,000 1stBaleno 13,276,588.89 4th 21,066,000 4th 30,537,000 4thBalud 16,752,916.49 4th 28,729,000 4th ... ... Batuan 9,181,341.89 5th ... ... 19,642,000 5thCataingan 21,625,598.10 3rd 38,896,000 3rd 51,959,000 2nd
Cawayan 22,526,554.70 3rd 39,902,000 3rd 50,747,000 2ndClaveria 18,440,139.86 4th ... ... 44,416,000 3rdDimasalang 12,789,558.35 5th 21,947,000 4th 29,539,000 4thEsperanza 10,416,239.42 5th 17,360,000 5th 22,379,000 5thMandaon 18,197,375.20 4th 30,887,000 3rd 40,608,000 3rd
MASBATE CITY 6/ … … 127,737,000 4th 210,246,000 4thMilagros 25,645,084.76 3rd 45,197,000 2nd 60,445,000 1stMobo 14,778,359.89 4th 24,892,000 4th 32,413,000 4thMonreal 12,202,369.37 5th 20,272,000 4th 26,909,000 4thPalanas 15,072,794.33 4th 24,811,000 4th 32,011,000 4th
Pio V. Corpuz 16,917,632.63 4th 20,222,000 4th 26,806,000 4thPlacer 15,623,516.99 4th ... 3rd 46,037,000 2ndSan Fernando ... ... ... ... ... ... San Jacinto 14,361,525.15 4th 23,142,000 4th 30,646,000 4thSan Pascual 19,555,527.67 4th 32,434,000 3rd 43,723,000 3rd
Uson 19,886,517.11 4th 32,420,000 3rd 44,391,000 3rd
Sorsogon 222,488,120.90 2nd 339,412,000 2nd 430,482,000 2nd
Bacon 7/ 18,807,062.77 4th ... ... ... …Barcelona 11,460,753.89 5th 18,991,000 5th 24,672,000 5thBulan 36,405,731.68 1st 58,787,000 1st 75,935,000 1stBulusan 12,711,108.58 5th 19,317,000 5th 27,165,000 4thCasiguran 14,539,437.17 4th 24,389,000 4th 32,485,000 4th
Castilla 19,779,682.30 4th 34,426,000 3rd 36,008,000 3rdDonsol 18,553,354.95 4th 31,965,000 3rd 42,876,000 3rdGubat 24,506,002.35 3rd 40,035,000 2nd 53,484,000 2ndIrosin 22,772,351.44 3rd 36,361,000 3rd 46,546,000 2ndJuban 14,103,913.18 4th 24,275,000 4th 33,021,000 4th
Magallanes 16,769,337.35 4th 28,554,000 4th 38,766,000 3rdMatnog 17,174,697.96 4th 29,580,000 4th 39,009,000 3rdPilar 25,030,229.26 3rd 44,342,000 2nd 57,980,000 1stPrieto Diaz 11,178,088.80 5th 18,810,000 5th 24,128,000 5thSanta Magdalena 9,943,371.02 5th 16,230,000 5th 21,437,000 5th
SORSOGON CITY … … 170,909,000 4th 285,595,000 3rd
6/ Converted into a city under Republic Act (RA) No. 8807 ratified on September 30, 2000.7/ Merged with the Municipality of Sorsogon to form Sorsogon City under Republic Act (RA) No. 8806 on December 16, 2000.
15 - 5

CLASSIFICATION OF PROVINCES, CITIES AND MUNICIPALITIES
2000-2003 2004-2007Average Income Average IncomeIncome Class 1/ Income Class 2/
Provinces P 350M or more First P 450M or more FirstP 280M or more but less than P 350M Second P 360M or more but less than P 450M SecondP 210M or more but less than P 280M Third P 270M or more but less than P 360M ThirdP 140M or more but less than P 210M Fourth P 180M or more but less than P 270M FourthP 70M or more but less than P 140M Fifth P 90M or more but less than P 180M FifthBelow P 70M Sixth Below P 90M Sixth
Cities P 300M or more First P 400M or more FirstP 240M or more but less than P 300M Second P 320M or more but less than P 400M SecondP 180M or more but less than P 240M Third P 240M or more but less than P 320M ThirdP 120M or more but less than P 180M Fourth P 160M or more but less than P 240M FourthP 60M or more but less than P 120M Fifth P 80M or more but less than P 160M FifthBelow P 60M Sixth Below P 80M Sixth
Municipalities P 50M or more First P 55M or more FirstP 40M or more but less than P 50M Second P 45M or more but less than P 55M SecondP 30M or more but less than P 40M Third P 35M or more but less than P 45M ThirdP 20M or more but less than P 30M Fourth P 25M or more but less than P 35M FourthP 10M or more but less than P 20M Fifth P 15M or more but less than P 25M FifthBelow P 10M Sixth Below P 15M Sixth
1/ Per Department of Finance Order No. 20-05 effective July 29, 2005.2/ Per Department of Finance Order No. 23-08 effective July 29, 2008.
Source: Bureau of Local Government Finance
Area
15 - 6

Table 15.2SUMMARY OF INTERNAL REVENUE COLLECTIONS BY PROVINCE2011 - 2020(In Pesos)
Province Total Business Taxes Income Taxes Other Taxes*
2011 Region V 4,642,055,504.78 1,374,001,257.74 3,072,746,373.76 195,307,873.28
Albay 1,570,194,984.08 421,135,784.86 1,096,261,949.90 52,797,249.32 Camarines Norte 441,615,987.55 150,469,828.03 266,628,617.10 24,517,542.42 Camarines Sur 1,577,651,504.30 487,153,093.12 1,016,329,591.47 74,168,819.71 Catanduanes 256,441,635.14 80,073,682.95 160,108,994.23 16,258,957.96 Masbate 390,836,635.69 120,980,712.98 261,365,492.38 8,490,430.33 Sorsogon 405,314,758.02 114,188,155.80 272,051,728.68 19,074,873.54
2012 Region V 5,532,128,593.73 1,675,449,927.87 3,633,197,926.55 223,480,739.31
Albay 1,884,695,766.13 568,576,356.03 1,247,810,458.68 68,308,951.42 Camarines Norte 482,834,872.04 160,203,177.23 295,454,997.53 27,176,697.28 Camarines Sur 1,911,639,242.54 571,861,297.49 1,250,918,868.56 88,859,076.49 Catanduanes 325,613,442.06 99,677,064.14 214,261,428.44 11,674,949.48 Masbate 419,459,690.42 121,784,548.07 288,807,385.44 8,867,756.91 Sorsogon 507,885,580.54 153,347,484.91 335,944,787.90 18,593,307.73
2013 Region V 6,397,081,001.20 1,972,159,482.95 4,140,004,370.14 284,917,148.11
Albay 2,163,120,409.00 674,425,201.81 1,408,033,936.52 80,661,270.67 Camarines Norte 541,443,862.62 180,122,244.72 324,946,673.60 36,374,944.30 Camarines Sur 2,223,871,350.80 696,752,930.38 1,402,068,066.82 125,050,353.60 Catanduanes 366,385,869.36 103,674,512.40 250,905,890.45 11,805,466.51 Masbate 491,425,794.78 145,406,753.85 337,750,602.22 8,268,438.71 Sorsogon 610,833,714.64 171,777,839.79 416,299,200.53 22,756,674.32
2014 Region V 6,970,524,764.75 1,993,715,224.91 4,663,168,787.44 313,640,752.40
Albay 2,358,236,496.92 700,513,245.40 1,563,606,925.40 94,116,326.12 Camarines Norte 593,253,560.44 189,123,644.25 356,932,516.51 47,197,399.68 Camarines Sur 2,396,861,082.02 665,438,279.12 1,607,402,278.34 124,020,524.56 Catanduanes 363,487,667.66 86,665,779.39 266,232,997.17 10,588,891.10 Masbate 551,241,470.88 158,617,703.17 380,854,634.66 11,769,133.05 Sorsogon 707,444,486.83 193,356,573.58 488,139,435.36 25,948,477.89
2015 Region V 7,768,270,264.18 2,460,040,474.02 5,004,247,877.11 303,981,913.05
Albay 2,632,917,312.08 860,060,229.36 1,684,526,582.95 88,330,499.77 Camarines Norte 728,882,830.73 272,445,075.58 425,292,494.47 31,145,260.68 Camarines Sur 2,596,736,371.84 785,668,385.36 1,681,956,844.12 129,111,142.36 Catanduanes 394,224,677.68 111,174,705.49 273,180,419.77 9,869,552.42 Masbate 637,879,495.32 192,805,889.89 426,924,197.08 18,149,408.35 Sorsogon 777,629,576.53 237,886,188.34 512,367,338.72 27,376,049.47
Notes: Per Collection Report * - Includes collection from Excise Tax.
Source: Bureau of Internal Revenue
15 - 7

Table 15.2 - ContinuedSUMMARY OF INTERNAL REVENUE COLLECTIONS BY PROVINCE2011 - 2020(In Pesos)
Province Total Business Taxes Income Taxes Other Taxes*
2016 Region V 9,190,509,949.16 3,075,549,478.85 5,726,779,585.66 388,180,884.65
Albay 3,090,035,504.31 1,077,660,552.57 1,895,080,279.75 117,294,671.99 Camarines Norte 790,297,357.33 275,222,688.27 477,059,341.84 38,015,327.22 Camarines Sur 3,148,816,679.56 1,008,493,435.85 1,966,301,182.14 174,022,061.57 Catanduanes 447,879,553.40 128,740,153.05 306,467,727.68 12,671,672.67 Masbate 735,507,178.53 248,565,518.83 472,564,272.32 14,377,387.38 Sorsogon 977,973,676.03 336,867,130.28 609,306,781.93 31,799,763.82
2017 Region V 10,750,262,499.51 3,633,238,024.03 6,707,585,838.11 409,438,637.37
Albay 3,740,987,173.00 1,402,091,094.20 2,212,986,161.04 125,909,917.76 Camarines Norte 873,712,049.19 295,710,328.10 537,442,920.70 40,558,800.39 Camarines Sur 3,563,438,972.61 1,106,745,652.70 2,271,913,254.31 184,780,065.60 Catanduanes 562,594,363.14 177,622,247.29 371,875,869.95 13,096,245.90 Masbate 879,637,540.19 284,208,879.07 578,317,859.71 17,110,801.41 Sorsogon 1,129,892,401.38 366,859,822.67 735,049,772.40 27,982,806.31
2018 Region V 7,637,507,640.46 2,713,113,724.89 3,936,806,991.09 987,586,924.48
Albay 2,467,690,545.26 786,126,989.41 1,209,481,909.88 472,081,645.97 Camarines Norte 649,132,052.61 256,216,186.54 326,070,920.06 66,844,946.01 Camarines Sur 2,842,484,342.46 1,055,559,879.47 1,453,178,759.38 333,745,703.61 Catanduanes 397,265,053.84 145,698,325.66 228,258,595.79 23,308,132.39 Masbate 590,711,373.54 248,096,552.09 307,950,230.45 34,664,591.00 Sorsogon 690,224,272.75 221,415,791.72 411,866,575.53 56,941,905.50
2019 Region V 9,071,087,863.55 3,169,848,590.71 5,244,271,677.87 656,967,594.97
Albay 3,084,502,607.17 928,589,485.97 1,941,693,196.60 214,219,924.60 Camarines Norte 835,688,134.72 295,462,315.32 455,186,385.36 85,039,434.04 Camarines Sur 3,185,105,618.31 1,216,947,612.76 1,722,547,112.39 245,610,893.16 Catanduanes 472,555,583.72 169,722,545.36 301,729,260.22 1,103,778.14 Masbate 704,680,516.81 303,741,398.68 365,414,971.45 35,524,146.68 Sorsogon 788,555,402.82 255,385,232.62 457,700,751.85 75,469,418.35
2020 Region V 8,938,766,376.50 2,760,232,488.41 5,488,128,939.94 690,404,948.15
Albay 2,965,049,770.68 831,567,999.02 1,893,800,985.04 239,680,786.62 Camarines Norte 799,452,707.29 273,360,333.77 443,485,296.51 82,607,077.01 Camarines Sur 3,162,116,502.56 1,038,294,700.42 1,885,571,022.63 238,250,779.51 Catanduanes 501,204,627.96 148,386,311.80 326,923,362.68 25,894,953.48 Masbate 649,366,945.66 225,216,526.65 381,816,788.88 42333630.13 Sorsogon 861,575,822.35 243,406,616.75 556,531,484.20 61,637,721.40
15 - 8

Table 15.3 EXPENDITURE PROGRAM OF PROVINCIAL AND CITY GOVERNMENTS2013 - 2019(In Million Pesos)
Economic Social General PublicServices Services Services
2013Region V 10,752.060 1,739.430 679.820 3,818.260 4,514.550
Albay 1,362.000 166.000 177.000 377.000 642.000Camarines Norte 830.640 79.000 21.000 413.000 317.640Camarines Sur 1,902.250 288.000 80.000 737.000 797.250Catanduanes 664.660 128.280 25.790 233.880 276.710Masbate 1,138.980 269.210 55.980 265.490 548.300Sorsogon 854.570 88.380 6.330 281.690 478.170
Iriga City 386.230 112.210 4.720 178.600 90.700Legazpi City 670.060 111.910 67.280 364.100 126.770Ligao City 634.620 56.040 26.210 144.760 407.610Masbate City 368.510 79.740 14.030 105.010 169.730Naga City 854.080 224.640 83.620 248.450 297.370Sorsogon City 523.360 73.450 97.370 259.180 93.360Tabaco City 562.100 62.570 20.490 210.100 268.940
2014Region V 11,361.558 1,775.998 821.220 4,013.460 4,750.880
Albay 1,699.050 196.700 226.910 453.530 821.910Camarines Norte 881.670 117.710 20.480 381.240 362.240Camarines Sur 1,748.010 245.950 89.770 733.090 679.200Catanduanes 766.728 135.778 2.530 255.370 373.050Masbate 1 136 320 273 160 45 920 270 120 547 120
Province / City Total Others
Masbate 1,136.320 273.160 45.920 270.120 547.120Sorsogon 1,033.410 90.910 27.860 298.970 615.670
Iriga City 406.530 106.630 6.000 202.120 91.780Legazpi City 758.880 142.380 99.170 351.250 166.080Ligao City 505.170 59.500 14.680 177.190 253.800Masbate City 388.840 86.630 15.300 126.450 160.460Naga City 922.840 220.500 104.660 276.720 320.960Sorsogon City 619.860 46.280 134.740 295.920 142.920Tabaco City 494.250 53.870 33.200 191.490 215.690
2015Region V 7,613.333 1,622.274 2,050.838 3,768.503 171.718
Albay 996.378 193.213 331.480 450.535 21.151Camarines Norte 837.857 174.082 181.551 455.169 27.055Camarines Sur 1,187.312 329.746 159.836 653.017 44.712Catanduanes 496.498 117.144 127.623 242.768 8.964Masbate 509.989 86.022 224.116 198.355 1.495Sorsogon 732.354 88.353 299.513 305.652 38.835
Iriga City 386.084 95.443 29.177 245.334 16.130Legazpi City 646.915 135.001 165.946 344.762 1.206Ligao City 255.199 51.559 88.139 115.501 - Masbate City 289.169 108.579 71.970 108.620 - Naga City 516.812 145.154 155.537 207.022 9.100Sorsogon City 558.256 72.611 188.951 293.623 3.071Tabaco City 200.509 25.366 26.999 148.145 -
Notes: 1. Inclusive of municipal reports.2. Details may not add up to totals due to rounding.
Source: Bureau of Local Government Finance, Regional Office V
15 - 9

Table 15.3 - ContinuedEXPENDITURE PROGRAM OF PROVINCIAL AND CITY GOVERNMENTS2013 - 2019(In Million Pesos)
Economic Social General PublicServices Services ServicesProvince / City Total Others
2016Region V 8,645.229 1,678.482 2,518.586 4,190.344 257.817
Albay 1,002.790 192.544 377.072 393.010 40.165Camarines Norte 783.081 136.441 212.548 409.052 25.039Camarines Sur 1,511.971 323.657 283.190 842.986 62.138Catanduanes 567.788 137.338 152.481 267.901 10.068Masbate 518.266 113.507 204.496 200.038 0.224Sorsogon 869.285 92.995 367.037 359.526 49.728
Iriga City 416.010 108.212 32.173 270.803 4.822Legazpi City 616.585 110.345 156.874 347.260 2.106Ligao City 286.599 52.014 94.335 140.249 - Masbate City 340.022 112.302 67.886 152.352 7.482Naga City 596.459 172.664 175.668 241.810 6.318Sorsogon City 869.285 92.995 367.037 359.526 49.728Tabaco City 267.090 33.470 27.791 205.829 -
2017Region V 9,340.336 1,988.246 2,778.768 4,382.145 191.176
Albay 998.006 213.552 339.605 404.480 40.369Camarines Norte 944.670 206.860 280.648 433.678 23.484Camarines Sur 1,600.521 325.473 415.819 858.732 0.496Catanduanes 571 272 135 345 160 559 267 593 7 775Catanduanes 571.272 135.345 160.559 267.593 7.775Masbate 719.192 281.949 239.461 197.782 - Sorsogon 949.877 104.354 400.387 394.909 50.228
Iriga City 420.995 106.303 32.842 278.060 3.790Legazpi City 635.361 111.565 133.296 388.194 2.306Ligao City 283.958 55.451 85.811 142.696 - Masbate City 340.022 112.302 67.886 152.352 7.482Naga City 614.143 170.946 190.445 247.734 5.019Sorsogon City 949.877 104.354 400.387 394.909 50.228Tabaco City 312.441 59.794 31.621 221.026 -
2018Region V 23,741.322 4,271.200 5,865.160 13,121.520 483.442
Albay 2,768.183 473.860 752.470 1,432.350 109.503Camarines Norte 3,433.648 346.260 680.330 2,375.670 31.388Camarines Sur 6,023.121 1,176.470 1,288.400 3,355.840 202.411Catanduanes 1,732.021 277.200 562.360 876.700 15.761Masbate 3,309.060 934.920 852.630 1,494.830 26.680Sorsogon 2,845.559 337.590 977.490 1,474.590 55.889
Iriga City 488.710 109.270 58.080 315.890 5.470Legazpi City 778.230 134.420 159.970 482.170 1.670Ligao City 319.980 71.250 94.120 154.610 - Masbate City 393.810 93.830 79.290 209.290 11.400Naga City 608.690 178.620 144.490 281.280 4.300Sorsogon City 681.730 56.930 160.640 445.190 18.970Tabaco City 358.580 80.580 54.890 223.110 -
15 - 10

Table 15.3 - ContinuedEXPENDITURE PROGRAM OF PROVINCIAL AND CITY GOVERNMENTS2013 - 2019(In Million Pesos)
Economic Social General PublicServices Services ServicesProvince / City Total Others
2019 pRegion V 39,766.656 7,017.411 8,744.111 23,148.607 856.527
Albay 5,556.538 1,083.092 1,295.472 3,033.546 144.428Camarines Norte 4,823.299 670.777 1,259.662 2,805.696 87.164Camarines Sur 10,697.138 1,973.716 1,829.794 6,680.089 213.539Catanduanes 2,877.030 469.723 638.261 1,730.952 38.094Masbate 3,367.990 736.464 768.291 1,805.386 57.850Sorsogon 4,742.448 577.314 1,397.688 2,647.078 120.368
Iriga City 991.493 224.110 120.651 628.377 18.355Legazpi City 1,624.910 265.538 387.540 968.856 2.976Ligao City 679.527 143.696 175.502 335.133 25.196Masbate City 883.473 204.527 176.007 476.036 26.903Naga City 1,307.612 367.645 238.213 622.342 79.412Sorsogon City 1,412.106 123.453 338.679 907.731 42.243Tabaco City 803.091 177.355 118.352 507.384 -
p - preliminary
Figure 15.1 EXPENDITURE PROGRAM OF PROVINCIAL AND CITY GOVERNMENTSREGION V 2019REGION V, 2019
0
1,000
2,000
3,000
4,000
5,000
6,000
7,000
8,000
9,000
Albay Camarines Norte
Camarines Sur Catanduanes Masbate Sorsogon
In M
illio
n Pe
sos
Economic ServicesSocial ServicesGeneral Public ServicesOthers
15 - 11

Table 15.4STATEMENT OF INCOME OF MUNICIPAL GOVERNMENTS BY PROVINCE2015 - 2019(In Million Pesos)
Camarines Camarines Catan-Norte Sur duanes
2015 Total 11,724.18 1,839.57 1,570.66 3,829.21 791.62 2,304.23 1,388.89
Total Tax Revenue 637.00 158.34 102.13 157.13 42.44 134.71 42.24 Real Property Taxes 257.70 76.11 32.47 58.15 16.15 55.01 19.81 Business Taxes & Other Local Taxes 379.31 82.23 69.66 98.98 26.29 79.70 22.43
Non-Tax Revenue 814.34 183.52 127.70 210.95 31.08 156.73 104.37 Fees & Charges 256.07 40.24 47.01 70.77 25.14 34.35 38.56 Receipts from Economic Enterprise 441.24 135.16 31.14 115.65 - 109.55 49.74 Other General Income 117.03 8.12 49.55 24.53 5.94 12.83 16.06
External Sources 9,875.12 1,497.57 1,191.17 3,340.50 718.10 1,885.49 1,242.27 Internal Revenue Allotment 9,650.15 1,471.68 1,186.65 3,243.74 717.69 1,798.22 1,232.17 Other Shares from National Tax Collections 85.62 9.41 0.11 17.91 0.41 52.11 5.67 Inter-Local Transfers 76.01 0.64 0.70 60.09 - 10.65 3.93 Extraordinary Receipts/ Grants/Donations/Aids 63.34 15.84 3.72 18.76 - 24.52 0.50
Capital/Investment Receipts 67.64 0.13 - 67.35 - 0.15 -
Receipts from Loansand Borrowings 330 08 149 66 53 28 127 15
SorsogonParticulars Region V Albay Masbate
and Borrowings 330.08 - 149.66 53.28 - 127.15 -
2016 Total 13,204.47 2,447.81 1,613.46 4,160.28 895.71 2,542.91 1,544.30
Total Tax Revenue 711.59 161.58 132.11 178.34 53.11 140.96 45.50 Real Property Taxes 292.25 65.60 57.75 63.33 26.91 58.02 20.64 Business Taxes & Other Local Taxes 419.34 95.98 74.36 115.01 26.20 82.93 24.86
Non-Tax Revenue 789.68 191.08 93.09 231.50 33.78 112.97 127.27 Fees & Charges 276.06 45.18 49.24 78.14 27.54 28.16 47.80 Receipts from Economic Enterprise 441.91 137.93 33.68 130.59 - 79.94 59.77 Other General Income 71.72 7.96 10.16 22.77 6.24 4.87 19.71
External Sources 11,290.87 2,070.15 1,307.95 3,661.32 790.10 2,089.82 1,371.53 Internal Revenue Allotment 10,727.51 1,723.77 1,306.65 3,570.57 789.63 1,979.67 1,357.22 Other Shares from National Tax Collections 78.12 3.90 0.49 15.96 0.47 48.87 8.43 Inter-Local Transfers 45.32 1.48 0.74 34.60 - 2.62 5.88 Extraordinary Receipts/ Grants/Donations/Aids 439.91 340.99 0.07 40.19 - 58.66 -
Capital/Investment Receipts 0.05 - 0.02 0.03 - 0.00 -
Receipts from Loansand Borrowings 412.27 25.00 80.29 89.09 18.73 199.16 -
Notes: 1. Inclusive of municipal reports.2. Details may not add up to totals due to rounding.
Source: Bureau of Local Government Finance, Regional Office V
15 - 12
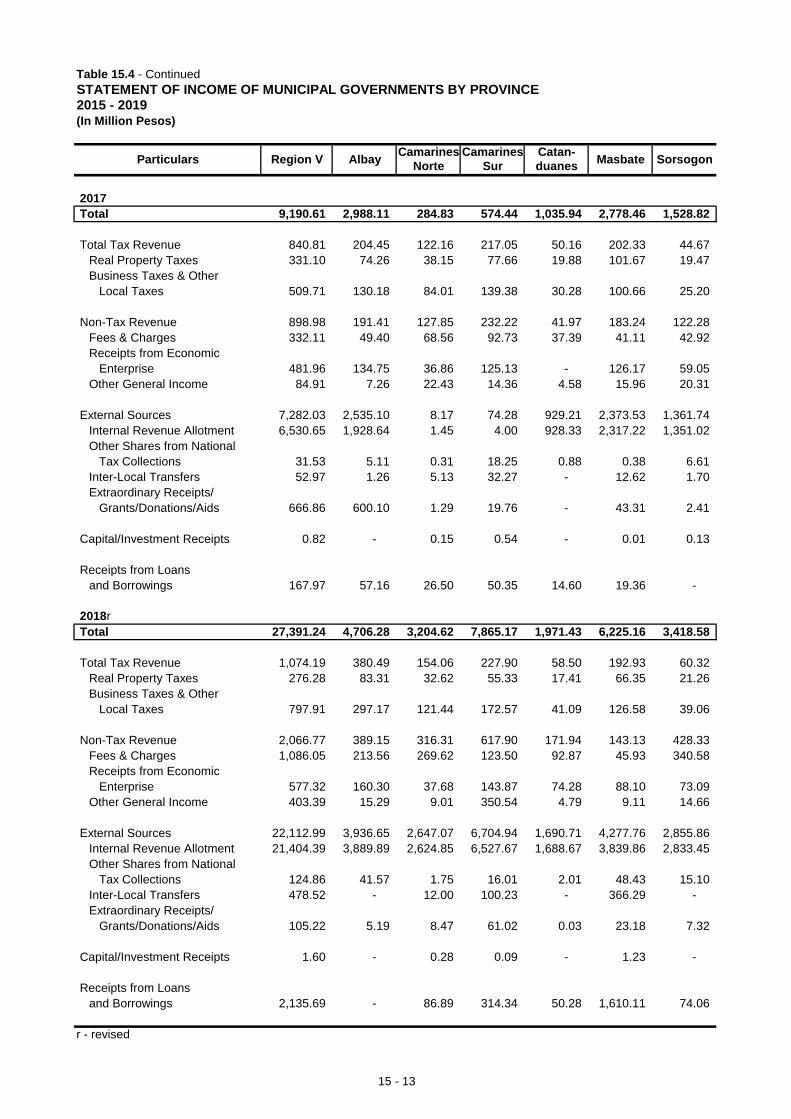
Table 15.4 - ContinuedSTATEMENT OF INCOME OF MUNICIPAL GOVERNMENTS BY PROVINCE2015 - 2019(In Million Pesos)
Camarines Camarines Catan-Norte Sur duanes SorsogonParticulars Region V Albay Masbate
2017 Total 9,190.61 2,988.11 284.83 574.44 1,035.94 2,778.46 1,528.82
Total Tax Revenue 840.81 204.45 122.16 217.05 50.16 202.33 44.67 Real Property Taxes 331.10 74.26 38.15 77.66 19.88 101.67 19.47 Business Taxes & Other Local Taxes 509.71 130.18 84.01 139.38 30.28 100.66 25.20
Non-Tax Revenue 898.98 191.41 127.85 232.22 41.97 183.24 122.28 Fees & Charges 332.11 49.40 68.56 92.73 37.39 41.11 42.92 Receipts from Economic Enterprise 481.96 134.75 36.86 125.13 - 126.17 59.05 Other General Income 84.91 7.26 22.43 14.36 4.58 15.96 20.31
External Sources 7,282.03 2,535.10 8.17 74.28 929.21 2,373.53 1,361.74 Internal Revenue Allotment 6,530.65 1,928.64 1.45 4.00 928.33 2,317.22 1,351.02 Other Shares from National Tax Collections 31.53 5.11 0.31 18.25 0.88 0.38 6.61 Inter-Local Transfers 52.97 1.26 5.13 32.27 - 12.62 1.70 Extraordinary Receipts/ Grants/Donations/Aids 666.86 600.10 1.29 19.76 - 43.31 2.41
Capital/Investment Receipts 0.82 - 0.15 0.54 - 0.01 0.13
Receipts from Loans Receipts from Loansand Borrowings 167.97 57.16 26.50 50.35 14.60 19.36 -
2018r Total 27,391.24 4,706.28 3,204.62 7,865.17 1,971.43 6,225.16 3,418.58
Total Tax Revenue 1,074.19 380.49 154.06 227.90 58.50 192.93 60.32 Real Property Taxes 276.28 83.31 32.62 55.33 17.41 66.35 21.26 Business Taxes & Other Local Taxes 797.91 297.17 121.44 172.57 41.09 126.58 39.06
Non-Tax Revenue 2,066.77 389.15 316.31 617.90 171.94 143.13 428.33 Fees & Charges 1,086.05 213.56 269.62 123.50 92.87 45.93 340.58 Receipts from Economic Enterprise 577.32 160.30 37.68 143.87 74.28 88.10 73.09 Other General Income 403.39 15.29 9.01 350.54 4.79 9.11 14.66
External Sources 22,112.99 3,936.65 2,647.07 6,704.94 1,690.71 4,277.76 2,855.86 Internal Revenue Allotment 21,404.39 3,889.89 2,624.85 6,527.67 1,688.67 3,839.86 2,833.45 Other Shares from National Tax Collections 124.86 41.57 1.75 16.01 2.01 48.43 15.10 Inter-Local Transfers 478.52 - 12.00 100.23 - 366.29 - Extraordinary Receipts/ Grants/Donations/Aids 105.22 5.19 8.47 61.02 0.03 23.18 7.32
Capital/Investment Receipts 1.60 - 0.28 0.09 - 1.23 -
Receipts from Loansand Borrowings 2,135.69 - 86.89 314.34 50.28 1,610.11 74.06
r - revised
15 - 13

Table 15.4 - ContinuedSTATEMENT OF INCOME OF MUNICIPAL GOVERNMENTS BY PROVINCE2015 - 2019(In Million Pesos)
Camarines Camarines Catan-Norte Sur duanes SorsogonParticulars Region V Albay Masbate
2019 Total 28,696.49 4,881.66 3,486.59 8,759.75 2,108.89 5,901.84 3,557.75
Total Tax Revenue 1,168.27 368.00 194.17 267.14 68.96 200.39 69.61 Real Property Taxes 286.86 85.70 35.66 56.76 19.74 65.27 23.73 Business Taxes & Other Local Taxes 881.40 282.30 158.51 210.39 49.21 135.12 45.88
Non-Tax Revenue 1,971.21 402.82 366.39 488.26 193.96 151.29 368.49 Fees & Charges 1,081.43 223.41 303.82 127.14 88.59 54.98 283.49 Receipts from Economic Enterprise 616.97 160.30 42.07 156.49 101.44 80.57 76.09 Other General Income 272.81 19.11 20.51 204.63 3.92 15.74 8.91
External Sources 23,208.32 4,077.63 2,864.39 7,049.58 1,814.56 4,310.61 3,091.55 Internal Revenue Allotment 22,920.44 4,034.13 2,863.23 6,962.55 1,810.94 4,173.91 3,075.68 Other Shares from National Tax Collections 146.08 38.38 0.48 21.99 1.24 78.73 5.26 Inter-Local Transfers 50.76 - - 25.87 0.33 14.65 9.90 Extraordinary Receipts/ Grants/Donations/Aids 91.04 5.12 0.68 39.17 2.05 43.32 0.70
Capital/Investment Receipts 0.53 - 0.29 0.05 - 0.19 -
Receipts from Loans Receipts from Loansand Borrowings 2,348.16 33.22 61.36 954.71 31.42 1,239.35 28.10
Figure 15.2 DISTRIBUTION OF INCOME OF MUNICIPAL GOVERNMENTSBY PROVINCE, 2019
Albay17.0%
Camarines Norte12.1%
Camarines Sur30.5%
Catanduanes7.3%
Masbate20.6%
Sorsogon12.4%
15 - 14

16 - 1
Data pertaining to the operations of financial institutions provide indicators of the area's economy. The growth in the number of banking institutions operating in a certain locality gives insights on the pace at which business and trade grow. Data on loans granted by banks provide a picture of the level and nature of investments put up over time. Statistics on loans outstanding of financial institutions, on the other hand, serve as signals of the rate of turnover of investments. The money and banking sector plays a vital role in the development of productive activities by proprietors or corporate institutions in the area. The presence and accessibility of establishments providing these services to existing and prospective investors contribute to the realization of programs and projects aimed at industrial and entrepreneurial advancement. This chapter presents data on the number of offices of the financial system in the region, deposit liabilities, and loan portfolio of banking offices. The source of data is the Bangko Sentral ng Pilipinas.
Sector Highlights As of the 2020, Bicol Region had 549 offices of the banking system, 17 offices more than the
number in 2019. All but one banking institutional groups saw increases in their number of offices with rural and cooperative banks registering the largest increase. The number of thrift banks decreased by 1.74 percent.
Total deposit liabilities of the banking system in the region reached 196.7 billion pesos as of end of
December 2020, 8.2 percent more than the level in 2019. Rural and cooperative banks exhibited the biggest growth at 16.6 percent.
The loan portfolio of banking offices in the region declined by 1.8 percent from 58.17 Billion pesos in 2019 to 57.12 Billion Pesos as of end of December 2020.
B A N K Chapter 16 MONEY AND BANKING

Table 16.1 Number of Offices of the Financial System by Institutional Group in Region V2012 - 2020 16 - 3
Table 16.2 Deposit Liabilities of Banking Offices by Province, 2017 - 2020 16 - 4
Table 16.3 Loan Portfolio of Banking Offices by Province, 2017 - 2020 16 - 5
Figure 16.1 Number and Type of Banking Institutions, Region V, 2016 - 2020 16 - 3
Figure 16.2 Distribution of Loan Portfolio of Banking Offices, Region V, 2020 16 - 6
Figure 16.3 Deposit Liabilities of Banking Offices, Region V, 2016 - 2020 16 - 6
16 - 2

Table 16.1NUMBER OF OFFICES OF THE FINANCIAL SYSTEM BY INSTITUTIONAL GROUP IN REGION V2012 - 2020
Institutional Group 2012 2013 2014 2015 2016 2017 2018 2019 2020
Total - Financial System 315 353 380 397 428 464 499 532 549
Banking Institutions 315 353 380 397 428 464 499 532 549
Universal and Commercial Banks 111 120 134 137 143 151 153 157 161Thrift Banks 48 56 64 76 84 97 109 115 113 Private Development Banks … … … … … … … … … Savings and Mortgage Banks … … … … … … … … … Stock Savings and Loan Associations … … … … … … … … …
Rural and Cooperative Banks 156 177 182 184 201 216 237 260 275Specialized Government Banks - - - - - - - - -
Non-Bank Financial Intermediaries - - - - - - - - -
Investment Houses - - - - - - - - - Financing Companies - - - - - - - - - Lending Investors - - - - - - - - - Pawnshop … … … … … … … … …
Non-Bank Thrift Institutions - - - - - - - - -
Non-Stock Savings and Loan Associations - - - - - - - - -
Note: Universal and Commercial Banks are inclusive of Specialized Government Banks.
Source: Bangko Sentral ng Pilipinas
Figure 16.1 NUMBER AND TYPE OF BANKING INSTITUTIONSREGION V, 2016 - 2020
0
50
100
150
200
250
300
2016 2017 2018 2019 2020
Universal and Commercial BanksRural and Cooperative BanksThrift Banks
16 - 3

Table 16.2DEPOSIT LIABILITIES OF BANKING OFFICES BY PROVINCE2017 - 2020(In Million Pesos)
Province/Institutional Group 2017 2018 2019 2020
Region V 140,314 154,653 181,742 196,660
Universal and Commercial Banks 127,199 139,708 163,755 179,653 Thrift Banks 8,209 8,918 11,868 9,875 Rural and Cooperative Banks 4,906 6,027 6,118 7,132
Albay 50,924 56,942 67,498 72,648 Universal and Commercial Banks 46,021 51,676 61,629 66,622 Thrift Banks 3,649 3,642 4,145 3,959 Rural and Cooperative Banks 1,254 1,624 1,724 2,066
Camarines Norte 12,283 13,313 14,727 16,348 Universal and Commercial Banks 11,294 12,230 13,375 14,991 Thrift Banks 207 223 410 324 Rural and Cooperative Banks 781 861 942 1,033
Camarines Sur 49,766 54,866 64,641 67,855 Universal and Commercial Banks 44,538 48,693 56,610 61,137 Thrift Banks 3,704 4,210 6,397 4,697 Rural and Cooperative Banks 1,524 1,962 1,635 2,022
Catanduanes 5,436 5,789 6,804 8,065 Universal and Commercial Banks * * 6,394 7,588 Thrift Banks * * 195 214 Rural and Cooperative Banks * * 214 264
Masbate 10,595 11,414 12,934 15,061 Universal and Commercial Banks 9,852 10,500 11,857 13,923 Thrift Banks 85 94 111 125 Rural and Cooperative Banks 658 820 966 1,014
Sorsogon 11,309 12,329 15,138 16,682 Universal and Commercial Banks 10,362 11,180 13,890 15,392 Thrift Banks 436 590 610 556 Rural and Cooperative Banks 511 560 637 734
Notes:1. Details may not add up to totals due to rounding.* In view of the prohibitions under Section 27(c) of Republic Act No. 7653 (The New Central Bank Act), which prohibits personnel of the Bangko Sentral ng Pilipinas (BSP) from disclosing or revealing information relating to the condition or business of any institution subject to BSP supervision or examination, related data cannot be provided as their disclosure will reveal the financial position of individual institutions.
Source: Bangko Sentral ng Pilipinas
16 - 4

Table 16.3LOAN PORTFOLIO OF BANKING OFFICES BY PROVINCE2017 - 2020(In Million Pesos)
Bank Group 2017 2018 2019 2020
Region V 46,551 53,648 58,171 57,115
Universal and Commercial Banks 29,878 35,007 40,477 37,917 Thrift Banks 11,606 11,981 10,849 11,204 Rural and Cooperative Banks 5,067 6,660 6,845 7,995
Albay 18,842 22,488 25,583 25,263 Universal and Commercial Banks 14,341 16,909 19,468 18,847 Thrift Banks 3,417 3,943 4,438 4,488 Rural and Cooperative Banks 1,084 1,637 1,677 1,928
Camarines Norte 2,698 3,114 2,889 2,870 Universal and Commercial Banks 1,475 1,749 1,484 1,363 Thrift Banks 403 439 508 559 Rural and Cooperative Banks 821 925 897 948
Camarines Sur 19,034 20,440 19,992 18,513 Universal and Commercial Banks 11,288 12,468 13,659 11,453 Thrift Banks 6,117 5,904 4,171 4,191 Rural and Cooperative Banks 1,628 2,069 2,162 2,868
Catanduanes 1,345 1,742 1,876 1,722 Universal and Commercial Banks * * 1,477 1,254 Thrift Banks * * 163 222 Rural and Cooperative Banks * * 236 246
Masbate 2,482 3,282 5,228 5,838 Universal and Commercial Banks 1,055 1,677 3,513 3,986 Thrift Banks 687 675 684 791 Rural and Cooperative Banks 740 930 1,032 1,061
Sorsogon 2,150 2,582 2,602 2,910 Universal and Commercial Banks 671 841 875 1,013 Thrift Banks 859 895 886 953 Rural and Cooperative Banks 620 846 840 944
Notes:1. Details may not add up to totals due to rounding.2. Loans and Receivables - Others, net of allowance for credit losses.* In view of the prohibitions under Section 27 (c) of Republic Act No. 7653 (The New Central Bank Act), which prohibits personnel of the Bangko Sentral ng Pilipinas (BSP) from disclosing or revealing information relating to the condition or business of any institution subject to BSP examination or supervision, related data cannot be provided as their disclosure will reveal the financial position of individual institutions.
Source: Bangko Sentral ng Pilipinas
16 - 5

Figure 16.2 DISTRIBUTION OF LOAN PORTFOLIO OF BANKING OFFICESREGION V, 2020
Figure 16.3 DEPOSIT LIABILITIES OF BANKING OFFICESREGION V, 2016 - 2020
Universal and Commercial Banks
66.4%
Thrift Banks19.6%
Rural and Cooperative Banks
14.0%
0
20,000
40,000
60,000
80,000
100,000
120,000
140,000
160,000
180,000
2016 2017 2018 2019 2020
In M
illio
n Pe
sos
Universal and Commercial Banks Thrift Banks Rural and Cooperative Banks
16 - 6

17 - 1
Data on public order, safety, and justice reflect the effectiveness, efficiency, and fairness in the administration and enforcement of laws. The basic goal of the government is to establish a peaceful, stable, and just environment conducive to national growth and development. A society where peace, order, and law prevail is not only a goal or a vision. It forms one of the pillars of man's basic rights. Development that is not coupled with order, safety, and justice contribute to the degradation of society. The effects of public order, safety, and justice in national well being and in every fiber of the social and economic lives of individuals are priority concerns of governance. In this light, an information system that generates timely and reliable data becomes necessary tool in the administration of justice and enforcement of laws as well as to aid legislation. This chapter presents regional/provincial/city data on crimes and number of policemen and firemen, fire incidences, including deaths and property damages, law enforcement cases handled, and legal assistance extended. The sources of data are the Philippine National Police for data on crimes and law enforcers; the Bureau of Fire Protection and the Bureau of Jail Management and Penology of the Department of the Interior and Local Government for fire incidences and jail population, respectively; and the Public Attorney's Office of the Department of Justice on cases handled and legal assistance services.
Sector Highlights Crime incidence in the region reached 9,912 cases in 2020 reflecting a crime rate of 161.6 crimes
per 100,000 population. These crimes include reported crimes taken from the barangay blotter. The culprits have been identified and appropriate cases had been filed (crimes cleared) for 90.1 percent of the crimes. Crime solution efficiency (the crime perpetrators have been identified, filed with cases and are already in custody) was placed at 63.6 percent.
Fire incidence in the Bicol Region decreased from 580 in 2019 to 476 in 2020. There were 14 recorded deaths and 14 injuries due to fire in 2020. Damage to properties was placed at about 108.3 Million pesos.
The 2020 police force was 7.6 percent more compared to the 9,478 men in 2019 translating to a policeman-to-population ratio of one per 601 population from 1:687 recorded the previous year.
There was one fireman for every 3,208 Bicolanos in 2020, an improvement from the 1:3,531 ratio
registered in 2019. Masbate remains the most wanting in fire fighting personnel in the region with a fireman for every 4,594 population in 2020, slightly lower from the 1:5,292 ratio in 2019.
The various penal facilities in the Bicol Region held an average of 3,068 inmates in 2020, about
90.2 percent of whom were detainees. Women inmates accounted for 7.2 percent. The Public Attorney’s Office in Region V served a total of 505,127 clients in 2020, about
8.5 percent of whom sought legal counseling.
About 46.9 percent of the cases handled by the Public Attorney’s Office in 2020 had been terminated.
Chapter 17 PUBLIC ORDER, SAFETY, AND JUSTICE

Table 17.1 Number and Rate of Crimes by Type of Crime and Province, 2011 - 2020 17 - 4
Table 17.2 Crime Incidence, Crime Clearance and Solution Efficiency Rates by Province2011 - 2020 17 - 6
Table 17.3 Fire Incidence, Deaths, Injuries and Damages by Province, 2011 - 2020 17 - 8
Table 17.4 Ratio of Policemen and Firemen to Population by Province, 2011 - 2020 17 - 10
Table 17.5 Jail Population by Sex and Classification, Region V, 2015 - 2020 17 - 12
Table 17.6 Clientele Assisted by the Public Attorney's Office by Province, 2013 - 2020 17 - 13
Table 17.7 Cases Handled, Terminated and Pending by Province/City, 2013 - 2020 17 - 14
Figure 17.1 Crime Incidence by Type of Crime and Province, Region V, 2020 17 - 3
Figure 17.2 Fire Incidence, Deaths and Injuries, Region V, 2011 - 2020 17 - 3
17 - 2

Figure 17.1 CRIME INCIDENCE BY TYPE OF CRIME AND PROVINCEREGION V, 2020
Figure 17.2 FIRE INCIDENCE, DEATHS AND INJURIESREGION V, 2011 - 2020
0
500
1,000
1,500
2,000
2,500
3,000
3,500
Albay CamarinesNorte
Camarines Sur Catanduanes Masbate Sorsogon
Cri
me
Inc
ide
nc
e
Index Non-index
0
50
100
150
200
250
300
350
400
450
500
550
600
650
2011 2012 2013 2014 2015 2016 2017 2018 2019 2020
Fire Incidence Deaths and Injuries
17 - 3

Table 17.1 NUMBER AND RATE OF CRIMES BY TYPE OF CRIME AND PROVINCE2011 - 2020(Rate per 100,000 Population)
T o t a l Index Crimes Non-Index CrimesIncidence Rate Incidence Rate Incidence Rate
Year / Province
2011 1/
Region V 11,630 199.8 6,452 110.8 5,178 89.0
Albay 3,061 228.9 1,649 123.3 1,412 105.6 Camarines Norte 1,473 256.7 825 143.8 648 112.9 Camarines Sur 3,224 166.0 1,860 95.8 1,364 70.2 Catanduanes 607 233.5 205 78.8 402 154.6 Masbate 2,325 262.0 1,402 158.0 923 104.0 Sorsogon 940 114.6 511 62.3 429 52.3
2012 1/
Region V 10,091 170.1 5,858 98.8 4,233 71.4
Albay 1,968 144.7 1,151 84.6 817 60.1 Camarines Norte 1,407 241.1 813 139.3 594 101.8 Camarines Sur 3,040 153.5 1,862 94.0 1,178 59.5 Catanduanes 470 177.8 157 59.4 313 118.4 Masbate 2,406 265.8 1,415 156.3 991 109.5 Sorsogon 800 95.6 460 55.0 340 40.6
2013 2/
Region V 68,074 1,126.1 28,035 463.8 40,039 662.4
Albay 18,257 1,318.8 7,080 511.4 11,177 807.3 Camarines Norte 5,114 861.4 2,336 393.5 2,778 467.9 Camarines Sur 27,956 1,383.5 12,226 605.1 15,730 778.5 Catanduanes 3,507 1,305.6 947 352.6 2,560 953.1 Masbate 9,009 975.7 3,691 399.7 5,318 575.9 Sorsogon 4,231 495.3 1,755 205.4 2,476 289.8
2014 2/
Region V 74,555 1,210.2 29,301 475.6 45,254 734.6
Albay 16,348 1,160.5 6,493 460.9 9,855 699.6 Camarines Norte 8,030 1,329.7 3,286 544.1 4,744 785.6 Camarines Sur 34,079 1,653.5 14,132 685.7 19,947 967.8 Catanduanes 3,836 1,405.0 678 248.3 3,158 1,156.7 Masbate 9,055 961.5 3,592 381.4 5,463 580.1 Sorsogon 3,207 367.8 1,120 128.5 2,087 239.4
2015 2/
Region V 42,020 669.3 11,651 185.6 30,369 483.7
Albay 9,687 675.8 2,177 151.9 7,510 523.9 Camarines Norte 3,866 629.3 1,022 166.4 2,844 463.0 Camarines Sur 20,547 977.4 5,900 280.7 14,647 696.7 Catanduanes 1,595 574.8 514 185.2 1,081 389.5 Masbate 4,377 455.7 1,441 150.0 2,936 305.6 Sorsogon 1,948 218.9 597 67.1 1,351 151.8
1/ Data starting 2009 are not comparable to the rest of the series due to a change in coverage effected under PNP Letter of Instruction 02-09 issued on April 22, 2009.
2/ Data starting 2013 are not comparable to the rest of the series due to a change in coverage which includesreported crimes taken from the barangay blotter.
Source: Philippine National Police
17 - 4

Table 17.1 - ContinuedNUMBER AND RATE OF CRIMES BY TYPE OF CRIME AND PROVINCE2011 - 2020(Rate per 100,000 Population)
T o t a l Index Crimes Non-Index CrimesIncidence Rate Incidence Rate Incidence Rate
Year / Province
2016 2/
Region V 38,042 618.7 9,614 156.4 28,428 462.4
Albay 8,330 603.2 1,447 104.8 6,883 498.4 Camarines Norte 2,863 463.7 812 131.5 2,051 332.2 Camarines Sur 20,795 1,000.4 5,639 271.3 15,156 729.1 Catanduanes 1,448 515.1 408 145.1 1,040 370.0 Masbate 3,074 326.8 946 100.6 2,128 226.2 Sorsogon 1,532 180.3 362 42.6 1,170 137.7
2017 2/
Region V 32,168 513.3 7,226 115.3 24,942 398.0
Albay 7,517 535.3 1,296 92.3 6,221 443.0 Camarines Norte 2,326 369.2 680 107.9 1,646 261.3 Camarines Sur 16,913 797.8 3,856 181.9 13,057 615.9 Catanduanes 1,424 495.9 310 108.0 1,114 388.0 Masbate 2,721 283.9 776 81.0 1,945 202.9 Sorsogon 1,267 146.1 308 35.5 959 110.6
2018 2/
Region V 33,691 527.4 6,235 97.6 27,456 429.8
Albay 7,313 512.1 1,475 103.3 5,838 408.8 Camarines Norte 2,530 393.6 279 43.4 2,251 350.2 Camarines Sur 16,903 781.8 3,117 144.2 13,786 637.6 Catanduanes 1,733 590.8 228 77.7 1,505 513.1 Masbate 2,201 225.4 590 60.4 1,611 165.0 Sorsogon 3,011 340.1 546 61.7 2,465 278.4
2019 2/
Region V 16,203 248.8 3,730 57.3 12,473 191.6
Albay 3,574 246.1 816 56.2 2,758 189.9 Camarines Norte 1,209 184.3 177 27.0 1,032 157.3 Camarines Sur 8,207 372.2 1,968 89.2 6,239 282.9 Catanduanes 831 277.4 120 40.1 711 237.3 Masbate 1,361 136.8 449 45.1 912 91.7 Sorsogon 1,021 113.0 200 22.1 821 90.8
2020 2/
Region V 9,912 161.6 2,303 37.5 7,609 124.0
Albay 1,589 113.8 450 32.2 1,139 81.6 Camarines Norte 865 139.0 128 20.6 737 118.4 Camarines Sur 3,849 186.9 1,156 56.1 2,693 130.8 Catanduanes 915 335.2 92 33.7 823 301.5 Masbate 1,373 146.5 327 34.9 1,046 111.6 Sorsogon 1,321 156.2 150 17.7 1,171 138.5
Note: Rates were computed using the 2000 Census-Based Population Projections from 2011 to 2015. Starting 2016 to 2019, rates were computed using the 2010 Census-Based Population Projections. Starting 2020, rates were computed using the 2015 Census-Based Population Projections.
17 - 5

Table 17.2 CRIME INCIDENCE, CRIME CLEARANCE AND SOLUTION EFFICIENCY RATES BY PROVINCE2011 - 2020
Total Clearance Total SolutionCrimes Efficiency Crimes Efficiency
Index Non-Index Total Cleared Rate Solved RateYear / Province
Crime Incidence
2011 1/
Region V 6,452 5,178 11,630 5,154 44.3 2,504 21.5
Albay 1,649 1,412 3,061 1,696 55.4 926 30.3 Camarines Norte 825 648 1,473 437 29.7 218 14.8 Camarines Sur 1,860 1,364 3,224 1,513 46.9 627 19.4 Catanduanes 205 402 607 243 40.0 130 21.4 Masbate 1,402 923 2,325 869 37.4 499 21.5 Sorsogon 511 429 940 396 42.1 104 11.1
2012 1/
Region V 5,858 4,233 10,091 5,110 50.6 2,610 25.9
Albay 1,151 817 1,968 1,088 55.3 333 16.9 Camarines Norte 813 594 1,407 406 28.9 234 16.6 Camarines Sur 1,862 1,178 3,040 1,638 53.9 1,179 38.8 Catanduanes 157 313 470 257 54.7 155 33.0 Masbate 1,415 991 2,406 1,268 52.7 556 23.1 Sorsogon 460 340 800 453 56.6 153 19.1
2013 2/
Region V 28,035 40,039 68,074 34,619 50.9 18,788 27.6
Albay 7,080 11,177 18,257 10,039 55.0 3,946 21.6 Camarines Norte 2,336 2,778 5,114 1,149 22.5 982 19.2 Camarines Sur 12,226 15,730 27,956 15,274 54.6 7,957 28.5 Catanduanes 947 2,560 3,507 2,303 65.7 2,098 59.8 Masbate 3,691 5,318 9,009 3,782 42.0 2,376 26.4 Sorsogon 1,755 2,476 4,231 2,072 49.0 1,429 33.8
2014 2/
Region V 29,301 45,254 74,555 38,773 52.0 21,921 29.4
Albay 6,493 9,855 16,348 9,950 60.9 4,432 27.1 Camarines Norte 3,286 4,744 8,030 1,969 24.5 1,631 20.3 Camarines Sur 14,132 19,947 34,079 18,755 55.0 10,333 30.3 Catanduanes 678 3,158 3,836 1,658 43.2 1,581 41.2 Masbate 3,592 5,463 9,055 4,557 50.3 3,522 38.9 Sorsogon 1,120 2,087 3,207 1,884 58.7 422 13.2
2015 2/
Region V 11,651 30,369 42,020 29,357 69.9 19,764 47.0
Albay 2,177 7,510 9,687 7,352 75.9 3,930 40.6 Camarines Norte 1,022 2,844 3,866 2,532 65.5 2,095 54.2 Camarines Sur 5,900 14,647 20,547 15,028 73.1 10,279 50.0 Catanduanes 514 1,081 1,595 428 26.8 370 23.2 Masbate 1,441 2,936 4,377 2,749 62.8 2,269 51.8 Sorsogon 597 1,351 1,948 1,268 65.1 821 42.1
1/ Data starting 2009 are not comparable to the rest of the series due to a change in coverage effected under PNP Letter of Instruction 02-09 issued on April 22, 2009.2/ Data starting 2013 are not comparable to the rest of the series due to a change in coverage which includes
reported crimes taken from the barangay blotter.
Source: Philippine National Police
17 - 6

Table 17.2 - ContinuedCRIME INCIDENCE, CRIME CLEARANCE AND SOLUTION EFFICIENCY RATES BY PROVINCE2011 - 2020
Total Clearance Total SolutionCrimes Efficiency Crimes Efficiency
Index Non-Index Total Cleared Rate Solved RateYear / Province
Crime Incidence
2016 2/
Region V 9,614 28,428 38,042 27,798 73.1 19,165 50.4
Albay 1,447 6,883 8,330 6,405 76.9 3,575 42.9 Camarines Norte 812 2,051 2,863 1,808 63.2 1,470 51.3 Camarines Sur 5,639 15,156 20,795 15,941 76.7 11,308 54.4 Catanduanes 408 1,040 1,448 469 32.4 423 29.2 Masbate 946 2,128 3,074 1,993 64.8 1,579 51.4 Sorsogon 362 1,170 1,532 1,182 77.2 810 52.9
2017 2/
Region V 7,226 24,942 32,168 24,669 76.7 17,526 54.5
Albay 1,296 6,221 7,517 5,888 78.3 3,547 47.2 Camarines Norte 680 1,646 2,326 1,474 63.4 1,255 54.0 Camarines Sur 3,856 13,057 16,913 13,681 80.9 10,041 59.4 Catanduanes 310 1,114 1,424 533 37.4 470 33.0 Masbate 776 1,945 2,721 2,118 77.8 1,596 58.7 Sorsogon 308 959 1,267 975 77.0 617 48.7
2018 2/
Region V 6,235 27,456 33,691 25,551 75.8 18,935 56.2
Albay 1,475 5,838 7,313 5,536 75.7 3,551 48.6 Camarines Norte 279 2,251 2,530 1,858 73.4 1,658 65.5 Camarines Sur 3,117 13,786 16,903 13,311 78.7 10,108 59.8 Catanduanes 228 1,505 1,733 573 33.1 489 28.2 Masbate 590 1,611 2,201 1,799 81.7 1,449 65.8 Sorsogon 546 2,465 3,011 2,474 82.2 1,680 55.8
2019 2/
Region V 3,730 12,473 16,203 13,279 82.0 10,940 67.5
Albay 816 2,758 3,574 2,907 81.3 2,450 68.6 Camarines Norte 177 1,032 1,209 1,139 94.2 1,005 83.1 Camarines Sur 1,968 6,239 8,207 6,302 76.8 5,390 65.7 Catanduanes 120 711 831 741 89.2 599 72.1 Masbate 449 912 1,361 1,258 92.4 879 64.6 Sorsogon 200 821 1,021 932 91.3 617 60.4
2020 2/
Region V 2,303 7,609 9,912 8,926 90.1 6,302 63.6
Albay 450 1,139 1,589 1,401 88.2 971 61.1 Camarines Norte 128 737 865 830 96.0 646 74.7 Camarines Sur 1,156 2,693 3,849 3,314 86.1 2,687 69.8 Catanduanes 92 823 915 842 92.0 560 61.2 Masbate 327 1,046 1,373 1,301 94.8 957 69.7 Sorsogon 150 1,171 1,321 1,238 93.7 481 36.4
17 - 7

Table 17.3 FIRE INCIDENCE, DEATHS, INJURIES AND DAMAGES BY PROVINCE2011 - 2020(Property Damages in Thousand Pesos)
Injuries Property(Slight / Serious) Damages
Year / Province Incidence Deaths
2011 Region V 157 5 9 33,173.5
Albay 44 2 3 3,932.1 Camarines Norte 30 - 4 19,612.2 Camarines Sur 39 3 2 5,158.7 Catanduanes 19 - - 398.5 Masbate 4 - - 1,532.0 Sorsogon 21 - - 2,540.0
2012 Region V 200 4 1 126,352.8
Albay 63 - - 89,272.6 Camarines Norte 25 - - 12,121.0 Camarines Sur 64 - 1 12,285.0 Catanduanes 21 - - 207.2 Masbate 20 3 - 12,420.0 Sorsogon 7 1 - 47.0
2013 Region V 233 - - 108,165.5
Albay 66 - - 7,912.3 Camarines Norte 37 - - 7,563.6 Camarines Sur 86 - - 63,371.7 Catanduanes 14 - - 10,663.5 Masbate 18 - - 18,614.5 Sorsogon 12 - - 40.0
2014 Region V 418 14 17 111,660.4
Albay 116 9 9 15,340.1 Camarines Norte 15 1 1 8,913.0 Camarines Sur 241 4 7 60,692.3 Catanduanes 22 - - 257.5 Masbate 20 - - 6,325.0 Sorsogon 4 - - 20,132.5
2015 Region V 469 11 31 92,956.8
Albay 110 4 9 3,437.2 Camarines Norte 51 1 2 4,253.2 Camarines Sur 225 2 15 76,940.7 Catanduanes 28 - - 1,462.0 Masbate 18 3 4 4,096.7 Sorsogon 37 1 1 2,767.0
Source: Bureau of Fire Protection
17 - 8

Table 17.3 - ContinuedFIRE INCIDENCE, DEATHS, INJURIES AND DAMAGES BY PROVINCE2011 - 2020(Property Damages in Thousand Pesos)
Injuries Property(Slight / Serious) Damages
Year / Province Incidence Deaths
2016 Region V 501 10 16 51,500.8
Albay 123 - 1 3,864.5 Camarines Norte 19 - 4 6,425.9 Camarines Sur 193 10 11 25,691.3 Catanduanes 32 - - 175.7 Masbate 52 - - 12,698.4 Sorsogon 82 - - 2,644.9
2017 Region V 429 5 6 74,670.3
Albay 136 2 3 28,640.9 Camarines Norte 32 2 1 6,239.7 Camarines Sur 170 1 1 15,950.6 Catanduanes 8 - - 632.4 Masbate 44 - - 22,250.5 Sorsogon 39 - 1 956.3
2018 Region V 469 11 8 250,735.2
Albay 122 3 1 180,292.3 Camarines Norte 41 2 1 2,288.1 Camarines Sur 155 2 4 20,094.4 Catanduanes 24 3 1 1,106.8 Masbate 86 0 0 40,656.6 Sorsogon 41 1 1 6,296.9
2019 Region V 580 7 19 52,012.9
Albay 130 4 5 8,599.6 Camarines Norte 62 0 0 4,621.9 Camarines Sur 252 1 8 20,554.8 Catanduanes 21 0 1 354.2 Masbate 49 0 4 14,885.2 Sorsogon 66 2 1 2,997.2
2020 Region V 476 14 14 108,338.4
Albay 138 3 4 68,981.3 Camarines Norte 84 3 3 4,851.7 Camarines Sur 161 7 5 24,108.2 Catanduanes 17 0 2 416.6 Masbate 35 0 0 9,761.3 Sorsogon 41 1 0 219.5
17 - 9

Table 17.4 RATIO OF POLICEMEN AND FIREMEN TO POPULATION BY PROVINCE2011 - 2020
Policemen FiremenNumber Ratio Number Ratio
Year / Province
2011 Region V 6,857 1 : 849 1,099 1 : 5,296
Albay 1/ 3,006 1: 445 351 1: 3,809 Camarines Norte 550 1: 1,043 81 1: 7,083 Camarines Sur 1,571 1: 1,236 418 1: 4,647 Catanduanes 358 1: 726 50 1: 5,200 Masbate 757 1: 1,172 66 1: 13,448 Sorsogon 615 1: 1,333 133 1: 6,165
2012 Region V 7,104 1 : 835 1,076 1 : 5,513
Albay 1/ 2,870 1: 474 361 1: 3,769 Camarines Norte 610 1: 957 69 1: 8,458 Camarines Sur 1,673 1: 1,184 405 1: 4,892 Catanduanes 443 1: 597 48 1: 5,506 Masbate 826 1: 1,096 62 1: 14,601 Sorsogon 682 1: 1,227 131 1: 6,389
2013 Region V 6,933 1 : 872 1,020 1 : 5,926
Albay 1/ 2,841 1: 487 341 1: 4,060 Camarines Norte 608 1: 976 64 1: 9,276 Camarines Sur 1,623 1: 1,245 380 1: 5,317 Catanduanes 415 1: 647 46 1: 5,839 Masbate 764 1: 1,209 66 1: 13,990 Sorsogon 682 1: 1,253 123 1: 6,945
2014 Region V 7,017 1 : 878 1,113 1 : 5,535
Albay 1/ 2,767 1: 509 351 1: 4,014 Camarines Norte 581 1: 1,039 83 1: 7,276 Camarines Sur 1,707 1: 1,207 412 1: 5,002 Catanduanes 439 1: 622 59 1: 4,627 Masbate 801 1: 1,176 81 1: 11,627 Sorsogon 722 1: 1,208 127 1: 6,865
2015 Region V 7,538 1 : 833 1,365 1 : 4,599
Albay 1/ 3,093 1: 463 431 1: 3,326 Camarines Norte 619 1: 992 120 1: 5,119 Camarines Sur 1,778 1: 1,182 451 1: 4,661 Catanduanes 465 1: 597 89 1: 3,118 Masbate 839 1: 1,145 110 1: 8,733 Sorsogon 744 1: 1,196 164 1: 5,426
Note: Ratios were computed using the 2000 Census-Based Population Projections. 1/ includes officers and men of the Regional Office/Headquarters and the 5th Regional Mobile Group.
Sources: Philippine National Police and Bureau of Fire Protection
17 - 10

Table 17.4 - ContinuedRATIO OF POLICEMEN AND FIREMEN TO POPULATION BY PROVINCE2011 - 2020
Policemen FiremenNumber Ratio Number Ratio
Year / Province
2016 Region V 8,897 1 : 691 1,458 1 : 4,217
Albay 1/ 3,802 1: 363 443 1: 3,117 Camarines Norte 722 1: 855 136 1: 4,540 Camarines Sur 2,012 1: 1,033 460 1: 4,519 Catanduanes 559 1: 503 98 1: 2,868 Masbate 958 1: 982 140 1: 6,719 Sorsogon 844 1: 1,007 181 1: 4,694
2017 Region V 8,581 1 : 730 1,640 1 : 3,821
Albay 1/ 3,289 1: 427 480 1: 2,926 Camarines Norte 819 1: 769 144 1: 4,375 Camarines Sur 1,955 1: 1,084 512 1: 4,141 Catanduanes 585 1: 491 119 1: 2,413 Masbate 988 1: 970 174 1: 5,508 Sorsogon 945 1: 918 211 1: 4,111
2018 Region V 8,999 1 : 710 1,708 1 : 3,740
Albay 1/ 3,714 1: 384 517 1: 2,762 Camarines Norte 817 1: 787 153 1: 4,201 Camarines Sur 2,017 1: 1,072 521 1: 4,150 Catanduanes 551 1: 532 123 1: 2,385 Masbate 992 1: 984 176 1: 5,548 Sorsogon 908 1: 975 218 1: 4,062
2019 Region V 9,478 1 : 687 1,844 1 : 3,531
Albay 1/ 4,344 1: 334 565 1: 2,570 Camarines Norte 774 1: 847 166 1: 3,951 Camarines Sur 1,948 1: 1,132 544 1: 4,054 Catanduanes 592 1: 506 134 1: 2,236 Masbate 976 1: 1,019 188 1: 5,292 Sorsogon 844 1: 1,071 247 1: 3,660
2020 Region V 10,199 1 : 601 1,912 1 : 3,208
Albay 1/ 4,557 1: 306 568 1: 2,458 Camarines Norte 833 1: 747 180 1: 3,458 Camarines Sur 2,181 1: 944 554 1: 3,718 Catanduanes 664 1: 411 145 1: 1,882 Masbate 1,065 1: 880 204 1: 4,594 Sorsogon 899 1: 941 261 1: 3,240
Note: From 2016 to 2019, ratios were computed using the 2010 Census-Based Population Projections.
17 - 11

Table 17.5JAIL POPULATION BY SEX AND CLASSIFICATION, REGION V2015 - 2020
2015 2016 2017Women Men Total Women Men Total Women Men Total
Region V
Sentenced 12 216 228 17 205 222 20 179 199
Adult 12 214 226 17 204 221 20 178 198Minor - 2 2 - 1 1 - 1 1
Detained 141 2,370 2,511 230 2,825 3,055 273 3,158 3,431
Adult 140 2,360 2,500 229 2,810 3,039 273 3,152 3,425Minor 1 10 11 1 15 16 - 6 6
Total 153 2,586 2,739 247 3,030 3,277 293 3,337 3,630
Adult 152 2,574 2,726 246 3,014 3,260 293 3,330 3,623Minor 1 12 13 1 16 17 - 7 7
2018 2019 2020Women Men Total Women Men Total Women Men Total
Region V
Sentenced 22 232 254 33 269 302 27 275 302
Adult 22 232 254 33 269 302 27 275 302Minor - - - - - - - - -
Detained 262 2,851 3,113 210 2,704 2,914 194 2,572 2,766
Adult 261 2,848 3,109 210 2,696 2,906 194 2,568 2,762Minor 1 3 4 - 8 8 - 4 4
Total 284 3,083 3,367 243 2,973 3,216 221 2,847 3,068
Adult 283 3,080 3,363 243 2,965 3,208 221 2,843 3,064Minor 1 3 4 - 8 8 - 4 4
Note: Data presented are monthly averages of annual jail population.
Source: Bureau of Jail Management and Penology
Classification
Classification
17 - 12

Table 17.6CLIENTELE ASSISTED BY THE PUBLIC ATTORNEY'S OFFICE BY PROVINCE2013 - 2020
Province / Clientele 2013 2014 2015 2016 2017 2018 2019 2020
Region V 319,952 312,862 329,910 388,268 624,523 746,514 760,545 505,127Indigent persons served 73,989 9,988 16,349 69,307 302,357 386,792 363,226 275,062Clients benefitted with
documentation 73,684 93,244 91,724 84,450 82,037 75,576 86,482 55,552Beneficiaries of legal counseling 89,385 113,079 107,484 104,008 95,567 91,252 79,318 43,010Clients benefitted with
administration of oath 82,894 96,551 114,353 130,503 144,562 192,894 231,519 131,503
Albay 79,491 102,613 118,241 140,864 182,414 206,845 260,221 159,810Indigent persons served 11,543 1,651 3,363 18,303 59,049 85,658 94,081 88,607Clients benefitted with
documentation 24,094 34,299 35,083 31,649 36,423 27,140 46,524 21,666Beneficiaries of legal counseling 16,591 23,014 27,547 37,458 27,038 21,678 24,065 12,712Clients benefitted with
administration of oath 27,263 43,649 52,248 53,454 59,904 72,369 95,551 36,825
Camarines Norte 31,063 38,267 19,487 23,235 30,774 34,103 33,065 24,552Indigent persons served 11,417 696 1,157 9,166 15,158 20,635 16,875 13,516Clients benefitted with
documentation 3,682 12,929 4,369 2,680 2,955 4,472 4,408 2,352Beneficiaries of legal counseling 13,697 19,678 9,715 8,713 10,061 5,546 8,394 5,626Clients benefitted with
administration of oath 2,267 4,964 4,246 2,676 2,600 3,450 3,388 3,058
Camarines Sur 121,630 92,457 107,115 117,584 201,751 236,623 225,215 164,069Indigent persons served 32,943 5,442 8,317 23,427 104,920 123,766 119,070 88,288Clients benefitted with
documentation 25,755 25,884 29,947 29,664 25,836 22,082 17,692 17,343Beneficiaries of legal counseling 37,055 36,364 40,407 25,418 20,875 21,495 14,177 7,732Clients benefitted with
administration of oath 25,877 24,767 28,444 39,075 50,120 69,280 74,276 50,706
Catanduanes 15,140 13,506 13,803 30,820 50,603 36,273 32,438 16,617Indigent persons served 3,898 424 762 10,429 36,339 26,408 22,009 7,745Clients benefitted with
documentation 3,459 3,702 4,106 5,800 3,371 1,803 2,279 2,132Beneficiaries of legal counseling 2,272 6,368 6,865 10,709 7,672 5,206 4,030 4,015Clients benefitted with
administration of oath 5,511 3,012 2,070 3,882 3,221 2,856 4,120 2,725
Masbate 39,855 35,974 36,086 39,033 98,392 131,098 125,642 81,016Indigent persons served 8,813 861 1,311 4,973 54,546 77,776 67,922 45,606Clients benefitted with
documentation 8,291 8,948 9,110 7,024 9,689 10,667 8,814 6,324Beneficiaries of legal counseling 12,569 12,599 13,597 13,450 16,415 18,706 14,609 7,853Clients benefitted with
administration of oath 10,182 13,566 12,068 13,586 17,742 23,949 34,297 21,233
Sorsogon 32,773 30,045 35,178 36,732 60,589 101,572 83,964 59,063Indigent persons served 5,375 914 1,439 3,009 32,345 52,549 43,269 31,300Clients benefitted with
documentation 8,403 7,482 9,109 7,633 3,763 9,412 6,765 5,735Beneficiaries of legal counseling 7,201 15,056 9,353 8,260 13,506 18,621 14,043 5,072Clients benefitted with
administration of oath 11,794 6,593 15,277 17,830 10,975 20,990 19,887 16,956
Source: Public Attorney's Office, Department of Justice
17 - 13

Table 17.7CASES HANDLED, TERMINATED AND PENDING BY PROVINCE/CITY2013 - 2020
2013 2014 2015 2016 2017 2018 2019 2020
Region V 22,203 24,277 27,403 26,826 32,209 31,678 31,947 29,053
Terminated 10,208 11,854 13,889 11,486 15,802 16,659 19,385 13,622Pending 11,995 12,423 13,514 15,340 16,407 15,019 12,562 15,431
Albay 2,142 2,344 2,790 2,671 3,056 2,861 2,986 3,503
Terminated 1,224 1,451 1,767 1,486 1,952 2,143 2,131 1,816Pending 918 893 1,023 1,185 1,104 718 855 1,687
Camarines Norte 2,159 2,430 2,555 3,272 3,363 3,337 3,113 2,829
Terminated 805 849 1,104 1,297 1,544 1,864 1,794 1,419Pending 1,354 1,581 1,451 1,975 1,819 1,473 1,319 1,410
Camarines Sur 3,451 3,977 4,292 4,578 4,320 5,069 4,936 5,119
Terminated 1,496 1,665 1,499 2,190 2,014 2,501 2,423 2,249Pending 1,955 2,312 2,793 2,388 2,306 2,568 2,513 2,870
Catanduanes 975 937 1,195 1,562 1,805 2,033 1,855 1,790
Terminated 492 504 594 704 758 640 1,358 925Pending 483 433 601 858 1,047 1,393 497 865
Masbate 1,737 1,731 2,469 3,012 2,954 3,789 3,825 3,102
Terminated 613 672 937 679 738 1,720 1,952 1,344Pending 1,124 1,059 1,532 2,333 2,216 2,069 1,873 1,758
Sorsogon 2,607 3,004 3,138 2,832 3,073 3,304 3,224 3,592
Terminated 968 1,266 1,390 1,018 1,338 1,608 1,701 1,790Pending 1,639 1,738 1,748 1,814 1,735 1,696 1,523 1,802
Iriga City 2,716 2,601 3,319 2,117 3,649 2,957 2,733 1,885
Terminated 1,144 1,360 2,392 901 1,706 1,466 2,302 631Pending 1,572 1,241 927 1,216 1,943 1,491 431 1,254
Legazpi City 2,690 2,556 2,901 2,788 5,757 3,982 4,547 3,308
Terminated 1,450 1,240 1,549 1,225 3,699 2,472 2,426 1,330Pending 1,240 1,316 1,352 1,563 2,058 1,510 2,121 1,978
Naga City 3,726 4,697 4,744 3,994 4,232 4,346 4,728 3,925
Terminated 2,016 2,847 2,657 1,986 2,053 2,245 3,298 2,118Pending 1,710 1,850 2,087 2,008 2,179 2,101 1,430 1,807
Note: Provincial data excludes City data.
Source: Public Attorney's Office, Department of Justice
Province / City
17 - 14

A P P E N D I X

Appendix - 1
APPENDIX TABLE OF CONTENTS GLOSSARY OF TERMS
Agriculture and Agrarian Reform Appendix – 2 Economic Accounts Appendix – 3 Education Appendix – 4 Energy and Water Resources Appendix – 6 Environment and Natural Resources Appendix – 7 Income and Prices Appendix – 9 Establishment Characteristics: Industrial Sector Appendix – 11 Labor and Employment Appendix – 11 Money and Banking Appendix – 13
Population and Housing Appendix – 14
Public Administration Appendix – 15 Public Order, Safety and Justice Appendix – 16 Social Services Appendix – 17 Tourism Appendix – 19 Trade Appendix – 20 Transportation and Communications Appendix – 20 Vital, Health and Nutrition Appendix – 21

Appendix - 2
Glossary of Terms AGRICULTURE AND AGRARIAN REFORM Agricultural Production - the growing of field crops, fruits, nuts, seeds, tree nurseries (except those of forest trees), bulb vegetables and flowers, both in the open and under glass; and the production of coffee, tea, cocoa, rubber; and the production of livestock and livestock products, honey, rabbits, fur-bearing animals, silkworm, cocoons, etc. Forestry and fishery activities carried out as an ancillary activity on an agricultural holding is also considered as agricultural production. (Philippine Statistics Authority) Animals, Slaughter – animals intended for meat production. (National Economic and Development Authority) Aquaculture – sector of fisheries that includes the rearing or raising under controlled conditions of aquatic products such as fish, oysters, mussels, sea weeds and other aquatic resources in sea, lakes and rivers. Examples are fishponds, fish pens and fish cages. (Philippine Statistics Authority) Area Harvested – refers to land used for agricultural operation reported as many times as it was planted and harvested to the same crop or different crops during the reference period. (Philippine Statistics Authority) Cooperative – a duly registered association of at least fifteen (15) persons with a common bond of interest who voluntarily join together to achieve a lawful common social and economic end. (Cooperative Development Authority) Kinds of cooperatives:
Consumers’ Cooperative – the primary purpose is to procure and distribute commodities to members and non-members. (Cooperative Development Authority) Cooperative Bank – organized by, the majority shares of which is owned and controlled by, cooperatives primarily to provide financial and credit services to cooperatives. (Cooperative Development Authority) Cooperative Federation – an organization of primary and/or secondary cooperatives with a single line or multi-purpose business activities. (Cooperative Development Authority) Cooperative Union – an organization of cooperatives and federations at appropriate levels to represent the interest and welfare of all types of cooperatives at the provincial, city, regional and national levels. (Cooperative Development Authority) Credit Cooperative – promotes thrift and savings among its members and creates funds in order to grant loans for productive and provident purposes. (Cooperative Development Authority) Laboratory Cooperative – a cooperative formed and managed principally by minors and which is affiliated with a registered cooperative. (Cooperative Development Authority) Marketing Cooperative – engages in the supply of production inputs to members, and markets their products. (Cooperative Development Authority) Multi-Purpose Cooperative – engages in two (2) or more types of business activities. (Cooperative Development Authority)
Producers’ Cooperative – undertakes joint production whether agricultural or industrial. (Cooperative Development Authority)

Appendix - 3
Service Cooperative – engages in medical and dental care, hospitalization, transportation, insurance, housing, labor, electric light and power, communication and other services. (Cooperative Development Authority)
Crop Production – the growing of staple food crops, fruits, nut and other food crops and commercial crops. (Philippine Statistics Authority) Crops, Permanent – crops which occupy the land for a long period of time and do not need to be replaced after each harvest such as fruit trees, shrubs, nuts, etc. These crops may be productive, which have already borne fruits or capable of bearing fruits, or non-productive. (Philippine Statistics Authority) Crops, Temporary – crops which are grown seasonally and whose growing cycle is less than one year and which must be sown or planted again for production after each harvest. (Philippine Statistics Authority) Farm – any piece or pieces of land having a total area of at least 1,000 square meters used wholly or partly for growing crops such as palay, corn, fruits, vegetables, nuts, etc., and/or tending of livestock and/or poultry, regardless of number; or any land regardless of area, used for the raising of at least 20 heads of livestock and/or poultry. (Philippine Statistics Authority) Farm Area – refers to the physical or actual measurement of the land, reported only once regardless of how many times it was used during the reference period. (Philippine Statistics Authority) Farmer Beneficiaries – landless residents of the same barangay or landless residents of the same municipality who are agricultural lessees and share tenants; regular farm workers; seasonal farm workers; other farm workers; actual tillers or occupants of public lands; collective or cooperatives of the above beneficiaries; and other directly working on the land. (Department of Agrarian Reform) Fishing, Commercial – sector of fisheries that includes the catching of fish in marine waters with the use of fishing boat of more than three (3) gross tons. (Philippine Statistics Authority) Fishing, Municipal – sector of fisheries that includes the catching of fish in marine and inland waters with the use of fishing boat of three (3) gross tons or less, or using gear not requiring the use of boats. (Philippine Statistics Authority) Livestock – domesticated animals with four legs and with hoofs. The different livestock are carabaos, cattles, goats, horses, rabbits, etc. (Philippine Statistics Authority) Parcel – one contiguous piece of land under one form of tenure without regard to land use. A piece of land is contiguous if it is not separated by natural or man-made boundaries that are not part of the farm/holding. (Philippine Statistics Authority) Poultry – are classified as chickens whether native or hybrid, ducks, quails, geese, etc. (Philippine Statistics Authority) ECONOMIC ACCOUNTS Constant Prices (at constant prices) – valuation of transactions, wherein the influence of price changes from the base year to the current year has been removed. Current Prices (at current prices) – the value based on prices during the reference year; nominal value. Expenditure on the GDP - Sum of the final uses of goods and services in the economy. Final uses refer to the values at purchaser’s prices of goods and services used for the final consumption of households and private non-profit institutions, general government both national and local government units, as well as those used for gross fixed capital formation by both public and private enterprises and for exports (net of imports) to the rest of the world. (Source: Analysis of the Revised PSNA and Manual on the Frameworks, Source and Methods)

Appendix - 4
Gross Domestic Capital Formation - Consists of two major components: gross fixed capital formation and change in stocks.
Gross fixed capital formation refers to outlays on construction, durable equipment and breeding stocks, orchard development and afforestation. Change in stocks refers to the difference between ending and beginning inventories. Inventories or stocks consist of finished goods, work-in-progress, and raw materials, which have been produced or purchased but not yet sold or consumed as intermediate inputs during the accounting period. (Source: Manual on the Philippine System of National Accounts: Framework, Sources and Methods)
Gross Domestic Product (GDP) – the value of all goods and services produced domestically; the sum of gross value added of all resident institutional units engaged in production (plus any taxes, and minus any subsidies, on products not included in the values of their outputs). Gross Regional Domestic Product (GRDP) – aggregate of the gross value added or income from each industry or economic activity of the regional economy. Gross Value Added – the difference between gross output and intermediate inputs. Gross outputs of a production unit during a given period is equal to the gross value of the goods and services produced during the period and recorded at the moment they are produced, regardless of whether or not there is a change of ownership. Intermediate inputs refer to the value of goods and services used in the production process during the accounting period. Per Capita – estimates expressed as the ratio of a particular transaction like GRDP over total population. This is referred to as per capita GRDP. Personal Consumption Expenditures - consist of actual and imputed expenditures of households for the purpose of acquiring individual consumption goods and services. Source: 1993 System of National Accounts developed by the Commission of the European Communities, International Monetary Fund, Organisation for Economic Cooperation and Development, United Nations and World Bank. EDUCATION Cohort Survival Rate ****** – the percentage of enrollees at the beginning grade or year in a given school year who reached the final grade or year of the elementary of secondary level. Completion Rate – the percentage of first year entrants in a cycle of education surviving to the end of the cycle. (Department of Education) Drop-out Rate – the proportion of pupils/students who leave school during the year as well as those who complete the grade/year level but fail to enroll to the next grade/year level the following school year to the total number of pupils/students enrolled during the previous school year. (Department of Education) Elementary Education - the first stage of free and compulsory, formal education primarily concerned with providing basic education and usually corresponding to six and seven grades. Elementary education can likewise be attained through alternative learning system. (Department of Education) Enrolment ****** – total number of pupils/students who register/enlist in a school year. Enrolment Ratio, Gross – the total enrolment in a given level of education as a percentage of the population which according to national regulations should be enrolled at this level. It is a measure of the “capacity” of a region’s elementary or secondary schools. (Department of Education)

Appendix - 5
Formal Education – the systematic and deliberate process of hierarchically structured and sequential learning corresponding to the general concept of elementary and secondary level of schooling. At the end of each level, the learner needs a certification in order to enter or advance to the next level. (Department of Education) Graduation Rate – the proportion of pupils/students who finished Grade VI/Fourth Year in the present year to the number of pupils/students who enrolled in Grade VI/Fourth Year in the present year. (Department of Education) Higher Education - the stage of formal education requiring secondary and post-secondary education covering the programs on: (a) all courses of study leading to bachelor’s degree and (b) all degree courses of study beyond bachelor’s degree level. (Commission on Higher Education) Highest Educational Attainment or Highest Grade Completed – refers to the highest grade or year completed in school, college or university, by person 5 years of age and over. (Philippine Statistics Authority) Literacy – the ability to read and write a simple message. (Philippine Statistics Authority) Literacy, Basic or Simple - the ability to read and write with understanding simple messages in any language or dialect. (Philippine Statistics Authority) Literacy, Functional - represents a significantly higher level literacy which includes not only reading and writing skills but also numeracy skills. This skill must be sufficiently advanced to enable the individual to participate fully and effectively in activities commonly occurring in his life situation that require a reasonable capability of communicating by written language. (Philippine Statistics Authority) Literacy Rate, Simple/Basic ****** - the percentage of the population 10 years old and over, who can read, write and understand simple messages in any language or dialect. Participation Rate ****** - the ratio of the enrolment for the age group corresponding to the official school age in the elementary/secondary level to the population of the same age group in a given year. Also known as Net Enrolment Ratio (NER). Literate – a person who can both read and write a simple message in any language or dialect. (Philippine Statistics Authority) Performance Indicators – refer to several key indicators that can be computed and utilized for evaluating the educational system’s performance at various levels, using the data available in the education statistics data bank. These indicators constitute an important component of a management information system. (Department of Education) Post Secondary/Non-Degree Education - the stage of formal education following the secondary level covering non-degree programs that have varying duration from three (3) months to three (3) years, concerned primarily with developing strong and appropriately trained middle-level skilled manpower possessing capabilities supportive of national development. (Department of Education) Pre-School - a school that admits students who are not old enough to enter the first level of education. These pupils are usually from 4 to 5 years of age. (Department of Education) Primary School - a school primarily concerned with providing basic education and usually corresponding to the first four grades of elementary education. (Department of Education) Private Institutions/Schools - educational institutions maintained and administered by private individuals or groups. (Department of Education) Public Institutions/Schools – educational institutions established by law and administered by the government. (Department of Education)

Appendix - 6
Repetition Rate – the proportion of pupils who enroll in the same grade/year more than once to the total number of pupils/students enrolled in that grade/year during the previous year. (Department of Education) Retention Rate – the proportion of the enrolment in any school year that continues to be in school the following year. (Department of Education) School – institution recognized by the state which undertakes educational operations. (National Economic and Development Authority) School Year – the period of time, of approximately 32 to 40 weeks, when schools offer daily instruction broken by short intermission periods (e.g., Christmas and summer vacations and holidays). (National Economic and Development Authority) Secondary School - an educational institution offering secondary education usually consisting of a four-year general secondary curricula. (Department of Education) Secondary Education - the stage of formal education following the elementary level concerned primarily with continuing basic education and expanding it to include the learning of employable gainful skills, usually corresponding to four years of high school. (Department of Education) School Year - the prescribed period of time, when schools offer daily instruction broken by short intermission periods (e.g., Christmas and summer vacations and holidays). (National Economic and Development Authority) Student – one who regularly attends an educational institution of secondary or higher level. (National Economic and Development Authority) Teacher – person engaged in actual teaching of a group of pupils/students on full-time or part-time basis. (National Economic and Development Authority) Tertiary Education – the level of education covering post-secondary and higher education. (Department of Education) Teacher-Pupil/Student Ratio – Gross – the proportion of the number of authorized positions for teachers at a certain level in a given year to the enrolment at the same level in the same year. (Department of Education) Teacher-Pupil/Student Ratio – Net – the proportion of the number of teachers actually teaching at a certain level in a given year to the enrolment at the same level in the same year. (Department of Education) Transition Rate – the percentage of pupils who graduate from one level of education and move on to the next higher level (from primary to intermediate; from intermediate to secondary). (Department of Education) ENERGY AND WATER RESOURCES Distribution of Electricity - Refers to the conveyance or delivery of electricity by a distribution utility to end-users. Electric Cooperative - Refers to a cooperative or corporation authorized to provide electric service pursuant to Presidential Decree No. 269, as amended, or Republic Act No. 6938. Electricity Sales - Refers to the sales proceeds derived by the power producer from the actual generation of the energy-generating facility net of station own use and losses. Generation of Electricity - Refers to the production of electricity by a generation or co-generation facility.

Appendix - 7
Irrigation - the practice of artificially providing land with water to increase its agricultural productivity. (Philippine Statistics Authority) Irrigation System, Communal - an irrigation system owned by the community, association, farmers' cooperative, etc. (Philippine Statistics Authority) Irrigation System, Individual - an irrigation means provided personally by the operator for his holding's/farm's irrigation needs. It could be rented borrowed, or owned by him or by any member of the household. (Philippine Statistics Authority) Irrigation System, National - a government owned irrigation system built or constructed to provide continuous supply of water for agricultural purposes to farmers in exchange for a fee. (Philippine Statistics Authority) National Electrification Administration (NEA) - Refers to the government agency created under Presidential Decree No. 269, to act as a catalyst for the development of electric distribution utilities (EDUs) by providing world-class financial intermediation institutional and technical services. National Power Corporation (NPC) - Refers to the government corporation created under Republic Act No. 6395, committed to the highest standards of customers satisfaction in providing quality and reliable electricity with due care for society and the environment. Potential Irrigable Service Area – the maximum area which an irrigation project can serve considering the extent of arable lands and the available water supply. In case of an existing irrigation system, the potential irrigable area is limited to the areas that can be commanded by the present operating level at the dimension point. (Philippine Statistics Authority) ENVIRONMENT AND NATURAL RESOURCES Agricultural Land – land devoted to or suitable for the cultivation of the soil, planting of crops, growing of trees, raising of livestock, poultry, fish or aquaculture production, including the harvesting of such farm products, and other farm activities and practices performed in conjuction with such farming operations by persons whether natural or judicial and not classified by laws as mineral land, forest land, commercial land, and industrial land. (NSCB Resolution No. 7 Series of 2010) Brushland – degraded or untimbered areas dominated by a discontinuous cover of shrubby vegetation. (National Mapping and Resource Information Authority) Fishpond – a body of water (artificial or natural) where fish and other aquatic products are cultured, raised or cultivated under controlled conditions. (National Mapping and Resource Information Authority) Forest* – refers to land with an area of more than 0.5 hectare and tree crown cover (or equivalent stocking level) of more than 10 percent. The trees should be able to reach a minimum height of 5 meters at maturity in situ. It consists either of closed forest formations where trees of various storeys and undergrowth cover a high proportion of the ground or open forest formations with a continuous vegetation cover in which tree crown cover exceeds 10 percent. Young natural stands and all plantations established for forestry purposes, which have yet to reach a crown density of more than 10 percent or tree height of 5 meters are included under forest.
These are normally forming part of the forest area, which are temporarily unstocked as a result of
human intervention or natural causes but which are expected to revert to forest. It includes forest nurseries and seed orchards that constitute an integral part of the forest; forest roads, cleared tracts, firebreaks and other small open areas; forest within protected areas; windbreaks and shelter belts of trees with an area of more than 0.5 hectare and width of more than 20 meter; plantations primarily used for forestry purposes, including rubber wood plantations. It also includes bamboo, palm and fern formations (except coconut and oil palm). (Reference: Food and Agriculture Organization, 2000)

Appendix - 8
Forest, Classified Land – includes the public forest, the permanent forest or forest reserves, and forest reservations. (Forest Management Bureau) Forest, Dipterocarp – a forest type dominated by trees of the dipterocarp species, such as red lauan, tanguile, tiaong, white lauan, almon, bagtikan, and mayapis of the Philippine mahogany group, apitong and the yakals. (National Mapping and Resource Information Authority) Forest, Mangrove – the type of forest occurring on tidal flats along the sea coast extending along the streams where the water is brackish and composed mainly of bakauan, potolan, langarai, api-api, nipa palm and the like. (National Mapping and Resource Information Authority) Forest, Mossy – a tropical rain forest of the high elevations dominated by Podocarpaceae, Myrtaceae and Fagaceae with trees of medium height and short boled, covered epiphytes. (National Mapping and Resource Information Authority) Forest, Old Growth – forest predominantly stocked with mature trees with less than 25 percent of the mature stand volume removed by cutting. (National Mapping and Resource Information Authority) Forest Product - all usable raw materials yielded by the forest including the associated water, fish, game, scenic, historical, recreational and geologic resources. (Forest Management Bureau) Forest, Unclassified Land – also known as public forest. Land of the public domain which has not been the subject of the present system of classification for the determination of which lands are needed for forest purposes and which are not. (National Mapping and Resource Information Authority) Game Refuge and Bird Sanctuary – refers to a forest land designated for the protection of game animals, birds and fish and closed to hunting and fishing in order that the excess population may flow and re-stock surrounding areas. (National Mapping and Resource Information Authority) Land, Alienable and Disposable – refers to those lands of the public domain which have been the subject of the present system of classification and declared as not needed for forest purposes. (National Mapping and Resource Information Authority) Land Classification – refers to the establishment of boundaries between alienable and disposable lands and forest lands. (National Mapping and Resource Information Authority) Land Use – the manner of utilizing the land, including its allocation, development and management. (NSCB Resolution No. 7 Series of 2010) Minerals, Metallic – minerals with a high specific gravity and metallic luster, such as titanium, rutile, tungsten, uranium, tin, lead, iron, etc. In general, the metallic minerals are good conductors of heat and electricity. (National Mapping and Resource Information Authority) Minerals, Non-Metallic – of or pertaining to a non-metal. In general, of mineral luster other than metallic. Non-metals are naturally occurring substances that do not have metallic properties such as high luster, conductivity, opaqueness and ductility. (National Mapping and Resource Information Authority) National Park – forest reservation essentially of natural wilderness character which has been withdrawn from settlement, occupancy or any form of exploitation except inconformity with approved management plan and set aside as such exclusively to conserve the area or preserve the scenery, the natural and historic objects, wild animals and plants therein to provide enjoyment of these features in such areas. (NSCB Resolution No. 7 Series of 2010) Ore – a mineral or aggregate of minerals which contain sufficient grade and quantity to be mined and beneficiated at a profit. The mineral or rock can be further described depending on the major element contained e.g., copper ore, gold ore, chromite ore, etc. (National Mapping and Resource Information Authority)

Appendix - 9
Non-Timber Forest Product - includes all forest products except timber; also known as minor forest product. (Forest Management Bureau) Poles and Piles – logs for use as electric post, pier piling, railroad ties, sleepers and the like. (Forest Management Bureau) Reservation – refers to any tracts(s) of the public domain proclaimed by the President of the Philippines for government use or any of its branches or instrumentalities or of the inhabitants thereof, for public or quasi-public uses or purposes. The different reservations are as follows: (a) Civil – refers to lands of public domain which have been proclaimed by the President of the Philippines for specific purposes such as townsites, resettlement areas, ancestral lands, etc.; (b) Forest – refers to forest lands which have been reserved by the President of the Philippines for any specific purpose or purposes; (c) Military – refers to land of the public domain which has been proclaimed by the President of the Philippines for military purposes such as Airbase, Campsite, Docks and Harbors. Firing Range, Naval Base, Target Range, Wharves, etc.; and (d) Watershed – a forest land reservation established to protect or improve the condition of the water yield thereof or reduce sedimentation. (National Mapping and Resource Information Authority) Timberland – refers to land of the public domain which has been the subject of the present system of land classification determined to be needed for forest purposes. Eventually, these lands will be proclaimed as forest reserves by the President. (Forest Management Bureau) Watershed – a land area drained by a stream or fixed body of water and its tributaries having a common outlet for surface runoff. (NSCB Resolution No. 7 Series of 2010) INCOME AND PRICES Consumer Price Index (CPI)*** – Indicator of the change in the average prices of a fixed basket of goods and services commonly purchased by households relative to a base year. Family – is a group of persons usually living together and composed of the head and other persons related to the head by blood, marriage and adoption. A single person living alone is considered a separate family. (2000 FIES, Philippine Statistics Authority) Family Expenditures – refers to the expenses or disbursements made by the family purely for personal consumption during the reference period. They exclude all expenses in relation to farm or business operations, investment ventures, purchase of real property and other disbursements which do not involve personal consumption. Gifts, support, assistance or relief in goods and services received by the family from friends, relatives, etc. and consumed during the reference period are included in the family expenditures. Value consumed from net share of crops, fruits and vegetables produced or livestock raised by other households, family sustenance and entrepreneurial activities are also considered as family expenditures. (2000 FIES, Philippine Statistics Authority) Family Income – includes primary income and receipts from other sources received by all family members during the calendar year as participants in any economic activity or as recipients of transfers, pensions, grants, etc. (2000 FIES, Philippine Statistics Authority)
Primary income includes: Salaries and wages from employment. Commissions, tips, bonuses, family and clothing allowance, transportation and representation
allowance and honoraria. Other forms of compensation and net receipts derived from the operation of family-operated
enterprises/activities and the practice of profession or trade. Income from other sources include:
Imputed rental values of owner-occupied dwelling units. Interests. Rentals including land owner’s share of agricultural products

Appendix - 10
Pensions Support and value of food and non-food items received as gifts by the family (as well as the
imputed value of services rendered free of charge to the family). Receipts from family sustenance activities, which are not considered as family operated enterprise.
Family Size – refers to the total number of family members enumerated. Included as family members are those whose relationship to the household head is a wife, son, daughter, father, mother, son-in-law, daughter-in-law, sister, brother, granddaughter and grandson or other relative. (Philippine Statistics Authority) Food Threshold (FT) ******* – the minimum income/expenditure required for a family/individual to meet the basic food needs, which satisfies the nutritional requirements for economically necessary and socially desirable physical activities. Gini Ratio ******* - the ratio of the area between the Lorenz curve and the diagonal (the line of perfect equality) to the area below the diagonal. It is a measure of the extent to which the distribution of income/ expenditure among families/individuals deviates from a perfectly equal distribution, with limits 0 for perfect equality and 1 for perfect inequality. Income Decile – Two levels of income deciles were utilized in the Family Income and Expenditures Survey (FIES) – national and regional. The national income decile is obtained by ranking the weighted total family income of all sample families in the Philippines from lowest to highest. Then these are grouped into tens. The first tenth, meaning those with the lowest income, is called the first decile, the second tenth, second decile and so on. A similar procedure is implemented for the regional decile, except that what is arrayed is the weighted total family income of sample families in a given region. (Philippine Statistics Authority) Inflation Rate - the annual rate of change or the year-on-year change in the Consumer Price Index. Magnitude of the Poor - the number of families or the population whose annual per capita income falls below the poverty threshold. Poverty Incidence (PI) ******* - the proportion of families/individuals with per capita income/ expenditure less than the per capita poverty threshold to the total number of families/individuals. Poverty Threshold (PT) ******* – the minimum income/expenditure required for a family/ individual to meet the basic food and non-food requirements. Basic food requirements are currently based on 100% adequacy for the Recommended Energy and Nutrient Intake (RENI) for protein and energy equivalent to an average of 2000 kilocalories per capita per day, and 80% adequacy for other nutrients. On the other hand, basic non-food requirements, indirectly estimated by obtaining the ratio of food to total basic expenditures from a reference group of families, cover expenditure on: 1) clothing and footwear; 2) housing; 3) fuel, light, water; 4) maintenance and minor repairs; 5) rental of occupied dwelling units; 6) medical care; 7) education; 8) transportation and communication; 9) non-durable furnishings; 10) household operations; and 11) personal care & effects. Purchasing Power of the Peso*** - a measure of the real value of the peso in a given period relative to a chosen reference period. It is computed by getting the reciprocal of the CPI and multiplying the result by 100. Source of Income, Main – refers to the source from which most of the income of the family is obtained. If the family has more than one source of income, the main source that would be considered is the source where the bulk of income is derived. Main sources of income could either be: (a) Salaries and Wages – includes all forms of compensation whether in cash or in kind received by family members who are regular or occasional/seasonal workers in agricultural and non-agricultural industries; (b) Entrepreneurial Activity – or a family-operated activity is any economic activity, business or enterprise whether in agricultural or in non-agricultural enterprises, engaged by any member of the family as an operator or as self-employed. Included as family-operated activities are those which are operated as single proprietorship or loose partnership (without formal organizations). Thus, partnerships, corporations, associations, etc. which are formally organized are excluded; or (c) Other Sources – refer to the sources of income other than work. Other sources of income include net share of crops, fruits and vegetables and livestock, poultry from other households; cash receipts, gifts and other forms of assistance from abroad; cash receipts, support, assistance

Appendix - 11
and relief from domestic source; rental from non-agricultural lands, buildings, spaces and other properties; interest from dividends and loans; pension and retirement, workmen’s compensation and social security benefits; imputed rental value of owner-occupied dwelling units; net receipts from family sustenance activities; dividends from investment; goods and services received as gifts; and other sources of income not elsewhere classified. (Philippine Statistics Authority) Subsistence Incidence (S) ******* - the proportion of families/individuals with per capita income/ expenditure less than the per capita food threshold to the total number of families/ individuals. ESTABLISHMENT CHARACTERISTICS: INDUSTRIAL SECTOR Capital Increase – the additional funds put into the capital stock of existing business firms. (Bangko Sentral ng Pilipinas) Capital Investment – the amount of capital invested by a newly registered organization whether a corporation, partnership or single proprietorship. (Bangko Sentral ng Pilipinas) Construction – this group includes construction, alteration, repair and demolition of building, highways, streets and culverts; construction of such projects as sewers and water, gas and electricity mains; railways, roadbeds, railroads, piers, tunnels, elevated highways, bridges, viaducts; dams, drainage projects, sanitation projects, aqueducts, irrigation and flood control projects; hydroelectric plants, water power projects; pipelines; marine construction such as dredging, underwater rock removal; pile driving, land reclamation; construction of harbors and waterways; water wells; airports and parking areas; athletic fields, golf courses, swimming pools, and tennis courts; communication systems such as telephone and telegraph lines; and other construction whether undertaken by private bodies or government authorities. Special trade contractors in the field of construction such as carpenters, plumbers, plasterers and electricians are also included in this group. (Philippine Statistics Authority) Establishment – an economic unit which engages in one or predominantly one kind of economic activity at a fixed single physical location. (Philippine Statistics Authority) Investments - amount of money or other resources measured in terms of money placed on activities or other forms of assets for the purpose of earning profits. (Board of Investment) Stocks - investments in shares of stock, common or preferred, traded, subsidiaries, and non-subsidiaries. (Securities and Exchange Commission) Subscription Capital – that portion of the authorized capital which has been underwritten by the stockholders. (Bangko Sentral ng Pilipinas) LABOR AND EMPLOYMENT Collective Bargaining Agreement (CBA) – the negotiated contract between a legitimate labor organization and the employer concerning wages, hours of work, and all other terms and conditions of employment in a bargaining unit, including mandatory provisions for grievance and arbitration machinery. (Philippine Statistics Authority) Employed - include all those who, during the reference period are 15 years old and over as of their last birthday and are reported either:
At work. Those who do any work even for one hour during the reference period for pay or profit, or work without pay on the farm or business enterprise operated by a member of the same household related by blood, marriage or adoption; or

Appendix - 12
With a job but not at work. Those who have a job or business but are not at work because of temporary illness/injury, vacation or other reasons. Likewise, persons who expect to report for work or to start operation of a farm or business enterprise within two weeks from the date of the enumerator’s visit, are considered employed. (Philippine Statistics Authority)
Employment Rate - proportion in percent of the total number of employed persons to the total number of persons in the labor force. (Philippine Statistics Authority) Labor Force – the population 15 years old and over whether employed or unemployed who contribute to the production of goods and services in the country. (Philippine Statistics Authority) Labor Force Participation Rate – proportion in percent of the total number of persons in the labor force to the total population 15 years old and over. (Philippine Statistics Authority) Overseas Contract Worker (OCW) - any individual who was or is presently engaged in gainful employment in a foreign country, covered by a specific “contract of employment” defining the terms and conditions of that employment and the employer-employee relationship, provided that the herein referred contract was approved for implementation/application by the Philippine Overseas Employment Administration (POEA) and the deployment/mobilization having been authorized by the POEA and provided further that the corresponding Welfare Fund Contribution having been paid at the time of employment processing at POEA or at any time thereafter as in the case of legitimized overseas contract worker, the latter gaining recognition thru the process of latent legitimacy in accordance with applicable rules and policies in applicable case/s. The OCW may be landbased or seabased Overseas Filipino Worker (OFW) – a Filipino worker who is to be engaged, is engaged, or has been engaged in a remunerated activity in a country of which he/she is not a legal resident. (Philippine Statistics Authority) Salaries and Wages - payments in cash or in kind prior to deductions for employees’ contribution to SSS/GSIS, withholding tax, etc. to all employees. Included are total basic pay, overtime pay and other benefits. (Philippine Statistics Authority) Underemployed – include all employed persons who express the desire to have additional hours of work in their present job or an additional job, or to have a new job with longer working hours. (Philippine Statistics Authority) Underemployed, Invisibly – persons employed at full-time jobs but who still want additional work. (Philippine Statistics Authority) Underemployed, Visibly - those who worked for less than 40 hours during the reference period and want additional hours of work. (Philippine Statistics Authority) Underemployment Rate – proportion in percent of the total number of underemployed persons to the total number of employed persons. (Philippine Statistics Authority) Unemployed**** - include all persons who are 15 years old and over as of their last birthday and are reported as:
without work, i.e., had no job or business during the basic survey reference period; AND currently available for work, i.e., were available and willing to take up work in paid employment or self employment during the basic survey reference period, and/or would be available and willing to take up work in paid employment or self employment within two weeks after the interview date; AND seeking work, i.e., had taken specific steps to look for a job or establish a business during the basic survey reference period; OR not seeking work due to the following reasons: (a) tired/believe no work available, i.e., the discouraged workers who looked for work within the last six months prior to the interview date; (b) awaiting results of previous job application; (c) temporary illness/disability; (d) bad weather; and (e) waiting for rehire/job recall.

Appendix - 13
Unemployment Rate – proportion in percent of the total number of unemployed persons to the total number of persons in the labor force. (Philippine Statistics Authority) Union – any registered group or association of employees that exist in whole or in part for the purpose of collective bargaining or of dealing with employers concerning terms and conditions of employment. A union may be formed in the private or public sector. (Philippine Statistics Authority) MONEY AND BANKING Banking Institutions – corporations, companies or associations which are engaged in the lending of funds obtained from the public through the receipt of deposits and the sale of bonds, securities or obligations of any kind. (Philippine Statistics Authority) Commercial Banks – any corporation which, in addition to the general powers incident to corporations, shall have all such powers as shall be necessary to carry on the business of commercial banking, by accepting drafts and issuing letters of credits, by discounting and negotiating promissory notes, drafts, bills of exchange, and other evidences of debts, by receiving deposits, by buying and selling foreign exchange and gold or silver bullion, and by lending money against securities consisting of personal property or first mortgage on improved real estates and the insured improvements thereon. (Bangko Sentral ng Pilipinas) Financial Institutions, Non-Bank – persons or entities whose principal functions include the lending, investing, or placement of funds or evidences of equity deposited with them, or otherwise coursed through them, either for their own account or for the account of others. (Philippine Statistics Authority) Financing - means by which a government provides financial resources to cover a budget deficit or allocated financial resources arising from a budget surplus. Investment House – an enterprise engaged in guaranteed underwriting of securities of another person or enterprise, including securities of government and its instrumentalities. (Philippine Statistics Authority) Non-Stock Savings and Loan Associations – a corporation whose capital stock is required or is permitted to be paid in by the stockholders in regular, equal periodic payments of its stockholders to repay to said stockholders their accumulated savings and profits upon surrender of their shares, to encourage industry, frugality, and home building among the stockholders on the security of unencumbered real estate and the pledge of shares of the capital stock owned by such stockholders as collateral security. (Philippine Statistics Authority) Pawnshop – a business establishment engaged in lending money on personal property delivered as security of pledge. (Philippine Statistics Authority) Private Development Banks - a group of quasi-private development banks promoted by the DBP to provide medium and long term credits to both the agricultural and industrial sectors. Designed to supplement the short-term credits of the Rural Banks and are able to accept only savings and time deposits. (Philippine Statistics Authority) Rural Banks - government-sponsored/assisted banks which are privately managed and largely privately owned that provide credit facilities to farmers and merchants, or to cooperatives of such farmers or merchants at reasonable terms and in general to the people of the rural community. (Philippine Statistics Authority) Savings and Mortgage Banks - any corporation organized for the purpose of accumulating the small savings of depositors and investing them, together with its capital, in bonds or in loans secured by bonds, real estate mortgage, and other forms of security, as hereinafter provided, or in loans for personal finance and long-term financing for home building and home development. (Philippine Statistics Authority)

Appendix - 14
Specialized Government Banks – these are completely government-owned institutions established mainly to provide medium and long-term credits to the industrial, agricultural and real estate sectors of the economy. (Philippine Statistics Authority) Stock Savings and Loan Associations – these are banks engaged in the accumulation of savings mainly of stockholders in specified undertakings. They are primarily concerned with servicing the needs of the household by providing personal finance and long term financing for home building and development. (Savings and Loan Association Act or RA No. 3779, as amended) (Bangko Sentral ng Pilipinas) POPULATION AND HOUSING Age Dependency Ratio – the percentage of persons in the ages defined as dependent (under 15 and over 65 years) to those in the ages defined as economically productive (15 to under 65 years) in the population. (Philippine Statistics Authority) Dwelling Unit – one or more habitable rooms which are occupied or which are intended or designated to be occupied by one family with facilities for living, sleeping, cooking and eating. (National Economic and Development Authority) Household*** - a social unit consisting of a person living alone or a group of persons who sleep in the same housing unit and have a common arrangement in the preparation and consumption of food. Household Head – the person responsible for the care and organization of the household. He/She usually provides the chief source of income for the household. In the case of a household consisting of two or more unrelated persons sharing the same cooking facilities and meals, the head is usually the eldest male or female in the group regarded as such by the other members. (Philippine Statistics Authority) Household Population – the aggregate of private household population. Compared to total population, this excludes population enumerated in institutional households such as national/provincial/municipal/city jails/detention centers, military camps, tuberculosis pavilions, mental hospitals, leprosaria/leper colonies or drug rehabilitation centers. (Philippine Statistics Authority) Household Size – number of usual members in a private household. (National Economic and Development Authority) Housing Unit - a structurally separate and independent place of abode which, by the way it has been constructed, converted or arranged is intended for habitation by one household. Structures or parts of structures which are not intended for habitation such as commercial, industrial, and cultural buildings or natural and man-made shelters such as caves, boats, abandoned trucks, culverts, and others, but which are used as living quarters by households. Human Development Index*** – a measure of how well a country has performed, not only in terms of real income growth, but also in terms of social indicators of people’s ability to lead a long and healthy life, to acquire knowledge and skills, and to have access to the resources needed to afford a decent standard of living. Marital Status*** – status of an individual in relation to marriage, classified as follows: a) Single - A person who has never been married; b) Married - A couple living together as husband and wife, legally or consensually; c) Divorced - A person whose bond of matrimony has been dissolved legally and who therefore can remarry; d) Separated - A person separated legally or not from his/her spouse because of marital discord or misunderstanding; and e) Widowed - A person whose bond of matrimony has been dissolved by death of his/her spouse. Medium Assumption - moderate fertility decline and moderate mortality decline Migration*** - the movement of people across a specific boundary for the purpose of establishing a new or semi-permanent residence. Two distinct types are international migration (migration between countries) and internal migration (migration within a country).

Appendix - 15
Mother Tongue – refers to the language/dialect spoken by a person at his earliest childhood or the language/dialect that person first learned to speak. Data on mother tongue are used primarily in the analysis of the ethnic origin of a person long after assimilation to the other customs of the majority population has taken place. (Philippine Statistics Authority) Population*** - total number of individuals in a territory at a specified time. It covers both nationals and aliens, native and foreign-born persons, internees, refugees and any other group physically present within the borders of a country at a specified time. In assembling national demographic statistics for publication, the basic aim has been to obtain data for the physically present (or “de facto”) population rather than for the legally established resident (or “de jure”) inhabitants. Population Density*** - refers to the number of persons per unit of land area (usually in square kilometers). This measure is more meaningful if given as population per unit of arable land. Population Distribution*** - the patterns of settlement and dispersal of a population. Population Growth Rate*** – indicates how fast a population increases or decreases as a result of the interplay of births, deaths, and migration during a given period of time. Where the population is closed, meaning no migration, the population growth rate is the same as the rate of natural increase, i.e., the difference between the number of births and the number of deaths during a specified period of time. The three methods for computing the rate of growth based on the assumption with respect to the change are: arithmetic change, geometric change and exponential change. Population Projections*** - computation of future changes in population numbers, given certain assumptions about future trends in the rates of fertility, mortality and migration. Demographers often publish high, medium, and low projections of the same population based on different assumptions of how these rates will change in the future. Population Pyramid – diagram depicting the age-sex structure of a given population. (National Economic and Development Authority) Sex Ratio*** - the number of males per 100 females in a population. PUBLIC ADMINISTRATION Barangay - the smallest political unit into which cities and municipalities in the Philippines are divided. It is the basic unit of the Philippine political system. It consists of less than 1,000 inhabitants residing within the territorial limit of a city or municipality and administered by a set of elective officials, headed by a barangay chairman (punong barangay). Capital Revenue - resources realized from the sale of fixed or capital assets, such as building, equipment, machine and intangibles City - there are three classes of cities in the Philippines: the highly urbanized, the independent component cities which are independent of the province, and the component cities which are part of the provinces where they are located and subject to their administrative supervision. Extraordinary Income - collections derived from the repayment of loans and advances made by the government as well as from other non-recurring sources. General Public Services - this covers expenditures for services which are indispensable to the existence of an organized state and cannot be allocated to specific sectors or subsectors. This includes executive and legislative services; overall financial and fiscal services; civil services; planning; conduct of foreign affairs; general research, public order and safety and centralized services.

Appendix - 16
Grants - all non-repayable transfers received from other levels of government or from private individuals, or institutions including reparations and gifts given for particular projects or programs, or for general budget support. Municipality – is a political corporate body which is endowed with the facilities of a municipal corporation, exercised by and through the municipal government in conformity with law. It is a subsidiary of the province which consists of a number of barangays within its territorial boundaries, one of which is the seat of government found at the town proper (poblacion). Non-Tax Revenue - revenue collected from sources other than compulsory tax levies. Includes those collected in exchange for direct services rendered by government agencies to the public, or those arising from the government’s regulatory and investment activities. Province - the largest unit in the political structure of the Philippines. It consists, in varying numbers, of municipalities and, in some cases, of component cities. Its functions and duties in relation to its component cities and municipalities are generally coordinative and supervisory. Revenue - a cash inflow which does not increase the liability of the government. Taxes on Income and Profit - taxes imposed on all taxable income earned or received by a taxpayer whether an individual, partnership, or corporation, during a particular period of time, usually lasting one year. Source: Department of Budget and Management PUBLIC ORDER, SAFETY AND JUSTICE Cases Handled - the summation of cases pending at the beginning of the period and new cases received during the reference period. (Philippine Statistics Authority) Cases Pending - cases which have not yet been disposed of at the beginning (or at the end) of the reference period. (Philippine Statistics Authority) Crime - is an act in violation of penal law. For statistical purposes, only crimes reported to authorities are covered. Crime Incidence – the number of crimes reported as to index or non-index crimes within a given period. Crime Rate – number of crimes committed per 100,000 population. (Philippine National Police) Fire Incidence – refers to the volume of incidents caused by fire and the deaths, injuries and total value of property loss due to this incident. Fireman-to-Population Ratio – is an indicator that measures the adequacy of the firefighting manpower to safeguard the people and property. It is computed by dividing the total population by the total number of firemen. Index Crimes – refer to those violations of the penal code considered to have socio-economic significance, and occur with sufficient regularity to be meaningful. These include crimes versus person (murder, homicide, physical injury and rape), and crimes versus property (robbery and theft). Non-Index Crimes - refer to all other crimes not classified as index crimes. These are mostly composed of victimless offenses (e.g., crimes against national security, crimes against the fundamental laws of the state, crimes against public order, crimes against public morals, and violations of special laws). Policeman-to-Population Ratio - is an indicator that measures the adequacy of the police force in its task of promoting peace and order, and of providing security to the people and property. It is computed by dividing the total population by the total number of policemen.

Appendix - 17
SOCIAL SERVICES Social Services - this covers expenditures for education, health, social security, labor and employment, housing and community development and other social activities. Battering – an act of inflicting physical harm on a woman resulting to physical and psychological/emotional distress preventing her from doing what she wishes or forcing her to behave in a manner that is unacceptable to her. Illegal Recruitment - refers to victims who were recruited usually for a fee for various forms of local or foreign employment but ended up being victimized, i.e., no job placement were effected or who were actually job-placed but under exploitative/oppressive conditions (low salaries, long hours of work, etc.) and have lost their jobs. Involuntary Prostitution - refers to victims who were recruited for various forms of employment such as receptionists, waitresses, entertainers, dancers, household help who are later on forced into prostitution. Sexual Abuse – an act, which is sexual in nature, committed against a woman without her consent. Sexual abuses include but are not limited to the following: rape, sexual harassment, acts of lasciviousness; treating a woman as a sex object; making demeaning and sexually suggestive remarks; physically attacking the sexual parts of her body; forcing her to watch pornographic video shows or see pornographic materials; catching the husband having sex with another woman in the marital bedroom; forcing the wife and mistress to sleep with the husband in the same room. Trafficking in Women - the act of recruiting and transporting a woman within and across national borders for work or services by means of violence or threat of violence, abuse of authority or dominant position, debt-bondage, deception or other forms of coercion. Acts of Lasciviousness - acts that are lascivious in nature, which include but are not limited to intentional touching, either direct or through clothing, of the genitalia, anus, groin, breast, inner thigh or buttocks; or the introduction of any object into the genitalia, anus or mouth of any child whether of the same or opposite sex with an intent to abuse, humiliate, harass, degrade, or arouse or gratify the sexual desire of any person; bestiality; masturbation; lascivious exhibition of the genital or pubic area of a person, etc. Child Labor - the illegal employment of children below 15 years old, or those below 18 years old in hazardous occupation. Child Prostitution - a practice where children, whether male or female, who for money, profit, or any other consideration, or due to the coercion or influence of any adult, syndicate or group, indulge in sexual intercourse or lascivious conduct. Child Sexual Abuse - the employment, use, persuasion, inducement, enticement, or coercion of a child to engage in or assist another person to engage in sexual intercourse or lascivious conduct, or the molestation, prostitution, or incest with children. Child Trafficking - the act of trading or dealing with children, including but not limited to, the buying and selling of children for money, or for any other consideration, or barter. Children in Situation of Armed Conflict (CSAC) - children who are: a) members of displaced families as a result of armed conflict; b) physically weakened, orphaned or disabled as a result of armed conflict; c) combatants and those mobilized for other armed conflict-related activities; and d) disrupted from schooling due to armed conflict. Day Care Service – an arrangement whereby substitute mothering is provided to disadvantaged pre-school children as well as street children during part of the day when the mother cannot attend to their children.

Appendix - 18
Disability - refers to any restriction or lack of ability to perform an activity in the manner or within the range considered normal for human being. A person considered physically or mentally disabled if he has any of the following impairments:
Blindness - if one eye or both eyes are reported totally blind and have no vision. Deafness - if one ear or both ears are reported to be incapable of hearing sounds or noises. Muteness - if the person is unable to speak or utter words. Speech Impairment - if the person can speak but not sufficiently clear to be understood. This also includes those people who can only make meaningless sounds. Mental Illness - if the person suffers from schizophrenia, manic depressive illness, psychosis , or severe depression characterized by strange behavior. Mental Retardation - if the person has disorder/damage of the brain resulting in mental retardation. Orthopedic Handicap - if the person suffers from bone deformities of has the following impairments: absence or deformity of one or both hands/arms, absence or deformity of one or both feet/legs, fractures, severe scoliosis, kyphosis, third degree burns, etc. Multiple Disability - if the person is reported to have combination of two or more disabilities. Others - if the disability does not fall in any of the the above categories, i.e. cancer, leprosy, paralysis, cerebral palsy, etc. (Philippine Statistics Authority)
Disadvantaged Children – children from 0-6 years old who are malnourished, orphaned, street children, victims of armed conflicts and children of poor families. Disadvantaged Communities - communities which have inadequate resources of facilities such as roads, water system, electricity and absence of natural resources. (Philippine Statistics Authority) Disadvantaged Families - families belonging to the disadvantaged group or families belonging to the bottom 30 percent of the income strata. (Philippine Statistics Authority) Disadvantaged Persons/Groups - individuals or group of individuals who are considered economically, physically, and socially disadvantaged. These include needy family heads and other needy adults, indigent children, out-of-school youths, physically and mentally disabled persons, distressed individuals and families, and disadvantaged children. (Philippine Statistics Authority) Disadvantaged Women - women from 18-59 years old who were deprived of literacy opportunities or those abused/exploited, and victims of involuntary prostitution or illegal recruitment. (Philippine Statistics Authority) Disadvantaged Youths - individuals 7-17 years old who due to poor parents, are out-of-school, sickly, alcoholic/drug addicts, youth offenders or have been sexually abused or exploited. (Philippine Statistics Authority) Distressed Individuals/Families/Groups - needy evacuees/squatters/cultural minorities/refugees and other persons who are victims of social conflicts, or other upheavals and disasters/calamities both natural and man-made. (Philippine Statistics Authority) Incest - sexual abuse committed against a child by a person who is related to her/him within fourth degree of consanguinity or affinity and who exercises influence, authority or moral ascendancy over her/him. Neglect - failure to provide, for reasons other than poverty, adequate food, clothing, shelter, basic education or medical care so as to seriously endanger the physical, mental, social and emotional growth and development of the child. Pedophilia – an act of psycho-sexual perversion deriving gratification from child sexual abuse. Rape - an act committed:
By a man who shall have carnal knowledge of a child under any of the following circumstances: through force, threat or intimidation; when the child is deprived of reason, or otherwise unconscious; by means of fraudulent machination or grave abuse of authority; and

Appendix - 19
when the offended party is under 12 years of age or is demented, even though none of the circumstances mentioned above be present.
By any person who, under any of the circumstances mentioned in par. 1 hereof, shall commit an act of sexual assault by inserting the penis into a child’s mouth or anal orifice, or any instrument, object, or any other part of the body such as fingers or toes into the genital or anal orifice of a child.
Social Welfare Services - include care of the aged, care of the disabled and mentally defective, childcare, and other welfare services. (Philippine Statistics Authority) TOURISM Accommodation Establishment* – any establishment, which on a regular basis, provides for a fee facilities for overnight stays as its main business. It includes not only hotels and similar traditional forms of accommodation but also non-traditional forms of accommodation such as resorts, tourist complexes, camping sites, youth hostels, private apartments, villas and furnished rooms in private houses, and the like. Balikbayan – refers to Philippine nationals who are permanently residing abroad including their spouses and children, regardless of nationality or country of birth. It also refers to those of Filipino descent who acquired foreign citizenship and permanent status abroad. (Department of Tourism) Country of Residence – consists of the country where she/he has lived for most of the past year (12 months), or for a shorter period if she/he intends to return within 12 months to live there. Domestic Tourism*** - tourism of resident visitors within the economic territory of the country of reference. Hotel – an establishment that usually provides lodging, food service, valet service and other types of guest services that may include meeting rooms and dining facilities for groups. (Philippine Statistics Authority) Occupancy* – the sale of an available room in an accommodation establishment in a given day. Occupancy Rate* – the proportion of occupancy to available rooms in an accommodation establishment over a period of time. Resident*** – an institutional unit is resident in a country when it has a center of economic interest in the economic territory of that country. Room Accommodation* - A room in an accommodation establishment available for occupancy by a visitor or guest for a specified period of time. Tourism*** - Comprises the activities of persons traveling to and staying in places outside their usual environment for not more than one consecutive year for leisure, business and other purposes not related to the exercise of an activity remunerated from within the place visited. Tourist*** - visitor who stays one or more nights in the place visited. Visitor*** - any person traveling to a place other than that of his/her usual environment for less than 12 months and whose main purpose of trip is other than the exercise of an activity remunerated from within the place visited. Visitor Arrivals – includes tourist, excursionists, aliens entering the country for a temporary stay not exceeding one year and for purposes other than immigration, permanent residence or employment for remuneration in the country and Filipino nationals residing permanently abroad on temporary stay in the Philippines not exceeding one year. This excludes the following: a) transit visitors and change-plan passengers who remain in the premises of the port of entry terminal; b) aliens with pre-arranged employment for remuneration in the Philippines, even if length of stay is less than 59 days; c) Filipinos living abroad, regardless of length of stay overseas who are not permanent residents abroad; d) immigrants

Appendix - 20
or aliens with permanent residence in the Philippines; e) Filipino overseas contract workers on home visits; and f) returning residents of the Philippines. Visitor, Foreign – a foreign national visiting the country as a tourist. (Department of Tourism) TRADE Balance of Trade – the difference between the export earnings and import payments of all goods or merchandise trade transacted by a country. (Philippine Statistics Authority) Commodity Flow – movement of commodities from point of origin to point of destination. (National Economic and Development Authority) Cargo – refers to any property carried/transported other than mail. Cargoes are categorized as follows: (a) Breakbulk – cargo that is handled in units, packages, crates, bags and the like; (b) Bulk – cargo that is unpacked or undivided into parts and handled in mass. It may come in any of the following forms: solid, pulverized, liquid, semi-liquid and gas; and (c) Containerized – cargo packed in vans or containers for easy handling and transporting of the same as a unit. (Philippine Ports Authority) Export – all goods leaving the country which are properly cleared through the Customs. (Philippine Statistics Authority) Free on Board (F.O.B.) Value – the value of the goods free on board the carrier at the frontier of the exporting country. It includes inland freight, export duty and other expenses. Ocean freight, insurance and consular fee are, however, excluded. (Philippine Statistics Authority) Import – all goods entering any of the seaports or airports of entry of the Philippines properly cleared through the Customs or remaining under Customs control, whether the goods are for direct consumption, for merchanting, for warehousing or for further processing. (Philippine Statistics Authority) TRANSPORTATION AND COMMUNICATIONS Aircraft Movement – an aircraft take-off or landing at an airport. For airport traffic purposes, one arrival and one departure are counted as two movements. (National Economic and Development Authority) Airport Traffic – this term is used to indicate one or both of the following: 1) aircraft movements; 2) passengers, freight and mail departing; and 3) transiting or arriving at airports. (National Economic and Development Authority) Bridge – a structure across a waterway or other opening servicing as a pathway and/or roadway with a minimum clear span of six (6) meters. (National Economic and Development Authority) Freight – the price paid to a ship owner for the transportation of goods or merchandise by sea from one specific port to another. The word "freight" is also used to denote goods which are in the process of being transported from one place to another. (National Economic and Development Authority) License – an authority issued by the Land Transportation Office (LTO) to a person who is qualified to operate a vehicle. (National Economic and Development Authority) Motor Vehicles, Diplomatic – motor vehicles owned by foreign governments or by their duly accredited diplomatic officials in the Philippines. The registration thereof must be supported by communications from the Department of Foreign Affairs. (National Economic and Development Authority)

Appendix - 21
Motor Vehicles, For Hire – motor vehicles registered and authorized to be operated as public utility by virtue of certificate of public convenience or provisional authority issued by the Land Transportation Franchising and Regulatory Board (LTFRB). (National Economic and Development Authority) Motor Vehicles, Government – motor vehicles owned by the Government of the Philippines or any of its political subdivisions. (National Economic and Development Authority) Motor Vehicles, Private – motor vehicles registered not to be used for hire under any circumstances. Private motor vehicles are subclassified into the same denominations as that of For-Hire Motor Vehicles except for taxicabs. (National Economic and Development Authority) Port - a sheltered harbor where marine terminal facilities are provided, consisting of piers or wharves at which ships berth/dock while loading or unloading cargo, transit sheds and other storage areas where ships may discharge incoming cargo, and warehouses where goods may be stored for longer periods while awaiting distribution or sailing. (Philippine Ports Authority) Port, Commercial Private – ports which are owned and operated by private entities, constructed primarily to serve the needs of the owners. (Philippine Statistics Authority) Port, Commercial Public – ports which are owned and operated by the government, constructed primarily to serve the needs of the general public, and generally cater to vessels of more than 30 tonnage. (Philippine Statistics Authority) Port, Feeder – a port constructed primarily to provide linkages among neighboring small islands and nearby urban centers. This port generally caters to small passenger and fishing vessels. (Philippine Statistics Authority) Port, Fishing – a port which primarily serves the fishing industry, either within the area, or may be regional in scope, servicing the main collection and distribution center for fish. (Philippine Statistics Authority) Radio Stations - one or more transmitters or receivers or a combination of transmitters and receivers including the accessory equipment, necessary at one location for carrying on a radio communication service. Each station shall be classified by the service in which it operates permanently or temporarily. (National Economic and Development Authority) Telephone Density – the ratio of the number of telephones to total population at a given date. It is expressed as the number of telephone main stations per 100 persons. (Department of Transportation and Communications) Telegraph Station – a telecommunication station which is concerned with the transmission/reception of messages by means of the Morse Code. (National Economic and Development Authority) Vessel – includes any ship or boat or any description of a vessel or boat, or any artificial contrivance used or capable of being used as a means of transportation on water. (National Economic and Development Authority) VITAL, HEALTH AND NUTRITION Bed Capacity – the number of beds permanently retained at the hospital for the treatment of in-patients. (National Economic and Development Authority) Birth – the act or process of delivering a child. It may either be a live birth or a stillbirth. (National Economic and Development Authority) Birth, Live – refers to the complete expulsion or extraction of a product of conception from its mother, irrespective of the duration of pregnancy, which after such separation, breathes or shows any other evidence of life, such as beating of the heart, pulsation of the umbilical cord, or definite movement of voluntary

Appendix - 22
muscles, whether or not the umbilical cord has been cut off or the placenta is still attached; each product of such births is considered alive. (Philippine Statistics Authority) Birth Rate, Crude – the ratio of the total number of live births in a given population during a year to the mid-year population during a given period expressed per 1,000 population. Sometimes it is referred to as simply as the birth rate and also live birth rate. (Philippine Statistics Authority) Death – refers to the permanent disappearance of all signs of life of a living person at any time. (Philippine Statistics Authority) Death Rate, Crude – the ratio of the number of deaths occurring within one year to the mid-year population expressed per 1,000 population. It is “crude” in the sense that all ages are represented in the rate and does not take into account the variations in risks of dying at particular ages. (Philippine Statistics Authority) Fetal Death Rate (FDR)***** – the ratio of the number of fetal deaths in a population occurring within a given period to the total number of live births and fetal deaths occurring within the same period, expressed per 1,000. Fetal Death (deadborn fetus) - death prior to the complete expulsion or extraction from its mother of a product of conception, irrespective of the duration of pregnancy. (WHO) Hospital Bed-Population Ratio***** – the ratio of hospital beds to the population, usually expressed as the number of available hospital beds for every 1,000 population. Immunization – process of introducing vaccine into the body to stimulate the formation of antibodies which fight disease-causing germs. Regular immunization programs of the government include: BCG – Bacillus Calmett Guerin to prevent Tuberculosis; DPT – Diphtheria, Pertussis and Tetanus; OPV – Oral Polio Vaccine. (National Economic and Development Authority) Infant Mortality Rate (IMR)***** – the probability of dying between birth and age one, expressed as the number of infant deaths or deaths occurring before reaching 12 months of life in a given period per 1,000 live births. Marriage – a special contract of permanent union between a man and a woman entered into in accordance with law for the establishment of conjugal and family life. It is the foundation of the family and an inviolable social institution whose nature, consequences and incidents are governed by law and not subject to stipulation, except that marriage settlements may fix the property relations during the marriage within the limits provided by the Family Code of the Philippines. Maternal Mortality Rate (MMR)***** – the ratio between the number of women who died (for reasons of pregnancy, childbirth and puerperium) to the number of reported livebirths in a given year, expressed as the number of maternal deaths per 100,000 live births Morbidity***** – the frequency of disease and illness, injuries, and disabilities in a population. Mortality – the intensity of death in a population. It is sometimes used to mean the frequency of deaths in a population. (National Economic and Development Authority) Mortality, Infant, Ten Leading Causes –Given the total number of infant deaths for every cause of death in the given year, the first ten causes with the most number of infant deaths are the ten leading causes of infant deaths for that year. (National Economic and Development Authority) Mortality, Maternal – refers to deaths of mothers owing to deliveries and complications arisingfrom pregnancy, childbirth and puerperium. (Philippine Statistics Authority) Mortality, Maternal, Ten Leading Causes – Given the total number of deaths among pregnant women for every cause of death in the given year, the first ten causes with the most number of deaths among pregnant women are the ten leading causes of maternal deaths for that year. (National Economic and Development Authority)

Appendix - 23
Mortality, Ten Leading Causes - Given the total number of deaths for every cause of death in the given year, the first ten causes with the most number of deaths are the ten leading causes of deaths for that year. (National Economic and Development Authority) Mortality Rate – generally expresses the chance that death will occur during a particular period to a person in particular population group alive at the beginning of the period. As such, those rates are true probabilities and describe precisely the risk of dying for any actual cohort. (National Economic and Development Authority) Mortality Rate, Child – the number of deaths among children aged 1-4 years old per 1,000 children in the same age group. (Philippine Statistics Authority) ____________ * NSCB Resolution No. 12 Series of 2004 - Approving and Adopting the Official Concepts and Definitions for Statistical Purposes of the Selected Sectors: Agriculture, Fishery and Forestry, Foreign Direct Investments, and Tourism ** NSCB Resolution No. 6 Series of 2003 - Official Definition of Core Inflation *** NSCB Resolution No. 11 Series of 2003 - Approving and Adopting the Official Concepts and Definitions for Statistical Purposes of the Selected Sectors: Prices, Population and Housing, and Tourism **** NSCB Resolution No. 15 Series of 2004 - Adoption of a New Official Definition of Unemployment ***** NSCB Resolution No. 8 Series of 2006 - Approving and Adopting the Official Concepts and Definitions for Statistical Purposes for the Health and Nutrition Sector ****** NSCB Resolution No. 15 Series of 2006 - Approving and Adopting Six Formulas on the Official Concepts and Definitions for Statistical Purposes for the Education Sector ******* NSCB Resolution No. 2 Series of 2007 - Approving and Adopting the Official Concepts and Definitions for Statistical Purposes for the Poverty Sector

The Regional Social and Economic Trends (RSET) in Bicol Region presents time-series statistical information on the various sectors of the region its componentprovinces, cities and municipalities. Statistics are disaggregated in differentdimensions useful in making decisions and setting policies as well as in theformulation and implementation of programs and projects towards effectivegovernance and public service delivery at the local level. The information isintended to meet the needs of a wide range of data users such as: governmentagencies, non-government organizations, business firms, entrepreneurs,students, international institutions, and the general public. The RSET includes aglossary of terms that provides the definition of selected statisticalterminologies not widely understood by the general public.
The 2021 edition of the RSET contains time-series and cross-sectional data on17 sectors/subject areas of general interest, such as:
• population and housing• income and prices• economic accounts• environment and natural resources• agriculture and agrarian reform• establishment characteristics:
industrial sector• trade• tourism
• vital, health and nutrition statistics • education• labor and employment• social services• transportation and communication• energy and water resources• public administration• money and banking• public order, safety and justice
For Inquiries:Philippine Statistics Authority
Regional Statistical Services Office VPSA V Building
Regional Center SiteRawis, Legazpi City 4500
Philippines 1200
Tel. Nos. +63(52) 4817479 +63(52) 7420337Telefax No. +63(52) 4817479
E-mail address: [email protected]: www.psa.gov.ph


