Embed Size (px)
Citation preview
August 2021Authors:
Amy Slack (Surfers Against Sewage) Sally Menna Turner (SaltHub)
2021 Citizen science
Brand Audit
Report
2021 citizen science
brand auditreport
01 Executive summary
03 Polluting brands
11 the conclusion
05 Polluting products
09 impact on the environment
07 getting polluters to pay
02 introduction
04 the dirty dozen
08 Unbranded pollution
10 region & area trends
12 our calls
06 The potential for a
Deposit return scheme
2 Surfers Against Sewage 2021 Citizen Science Brand Audit Report
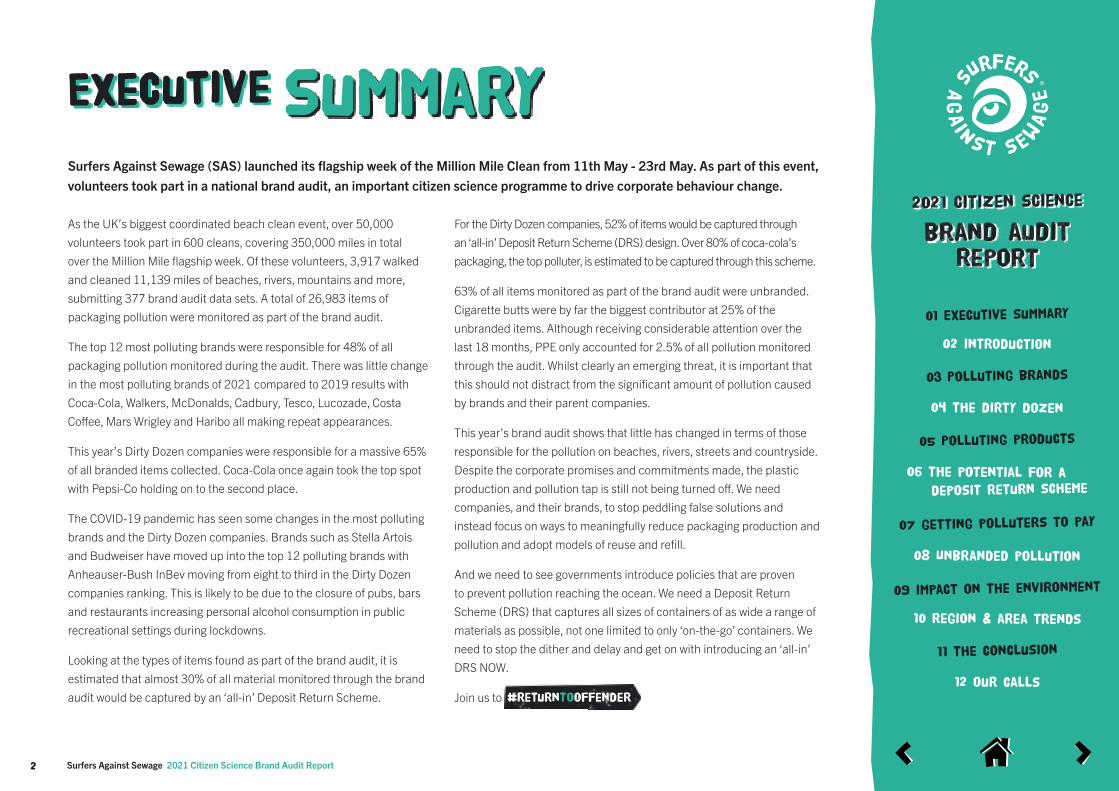
Surfers Against Sewage (SAS) launched its flagship week of the Million Mile Clean from 11th May - 23rd May. As part of this event, volunteers took part in a national brand audit, an important citizen science programme to drive corporate behaviour change.
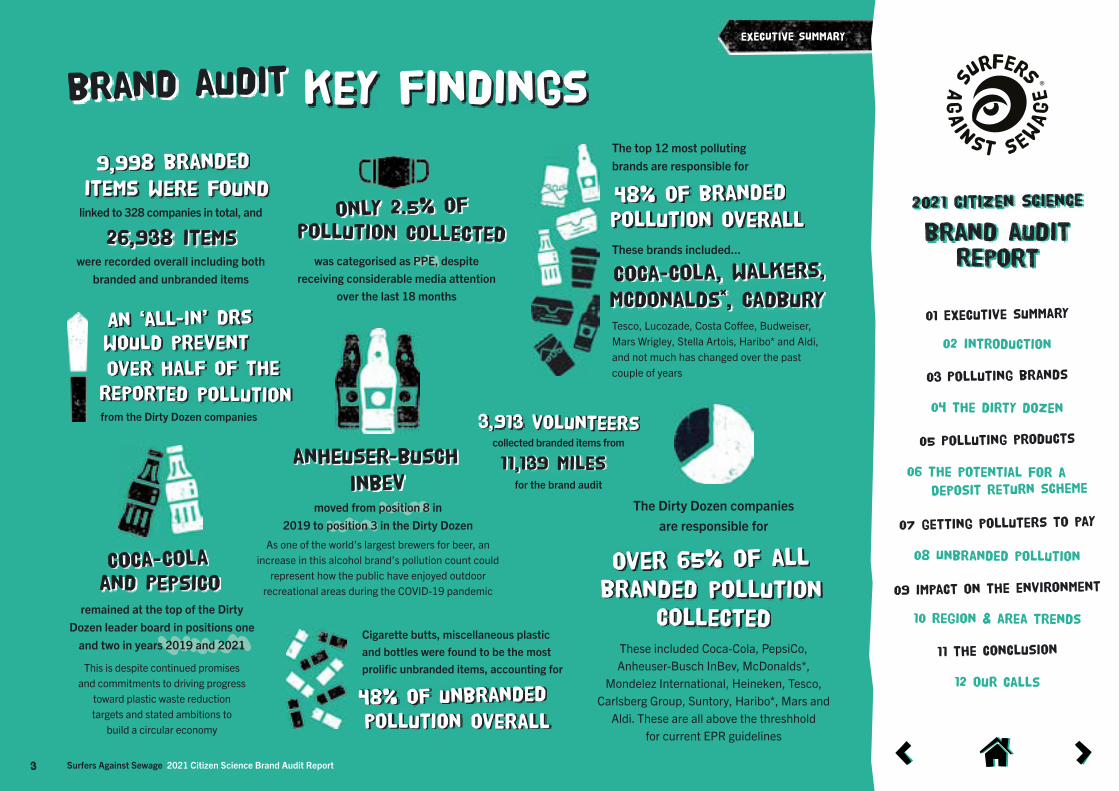
As the UK’s biggest coordinated beach clean event, over 50,000 volunteers took part in 600 cleans, covering 350,000 miles in total over the Million Mile flagship week. Of these volunteers, 3,917 walked and cleaned 11,139 miles of beaches, rivers, mountains and more, submitting 377 brand audit data sets. A total of 26,983 items of packaging pollution were monitored as part of the brand audit.
The top 12 most polluting brands were responsible for 48% of all packaging pollution monitored during the audit. There was little change in the most polluting brands of 2021 compared to 2019 results with Coca-Cola, Walkers, McDonalds, Cadbury, Tesco, Lucozade, Costa Coffee, Mars Wrigley and Haribo all making repeat appearances.
This year’s Dirty Dozen companies were responsible for a massive 65% of all branded items collected. Coca-Cola once again took the top spot with Pepsi-Co holding on to the second place.
The COVID-19 pandemic has seen some changes in the most polluting brands and the Dirty Dozen companies. Brands such as Stella Artois and Budweiser have moved up into the top 12 polluting brands with Anheauser-Bush InBev moving from eight to third in the Dirty Dozen companies ranking. This is likely to be due to the closure of pubs, bars and restaurants increasing personal alcohol consumption in public recreational settings during lockdowns.
Looking at the types of items found as part of the brand audit, it is estimated that almost 30% of all material monitored through the brand audit would be captured by an ‘all-in’ Deposit Return Scheme.
For the Dirty Dozen companies, 52% of items would be captured through an ‘all-in’ Deposit Return Scheme (DRS) design. Over 80% of coca-cola’s packaging, the top polluter, is estimated to be captured through this scheme.
63% of all items monitored as part of the brand audit were unbranded. Cigarette butts were by far the biggest contributor at 25% of the unbranded items. Although receiving considerable attention over the last 18 months, PPE only accounted for 2.5% of all pollution monitored through the audit. Whilst clearly an emerging threat, it is important that this should not distract from the significant amount of pollution caused by brands and their parent companies.
This year’s brand audit shows that little has changed in terms of those responsible for the pollution on beaches, rivers, streets and countryside. Despite the corporate promises and commitments made, the plastic production and pollution tap is still not being turned off. We need companies, and their brands, to stop peddling false solutions and instead focus on ways to meaningfully reduce packaging production and pollution and adopt models of reuse and refill.
And we need to see governments introduce policies that are proven to prevent pollution reaching the ocean. We need a Deposit Return Scheme (DRS) that captures all sizes of containers of as wide a range of materials as possible, not one limited to only ‘on-the-go’ containers. We need to stop the dither and delay and get on with introducing an ‘all-in’ DRS NOW.
Join us to #ReturnToOffender
Executive summary
EXECUTIVE SUMMARY
2021 citizen science
brand auditreport
01 Executive summary
03 Polluting brands
11 the conclusion
05 Polluting products
09 impact on the environment
07 getting polluters to pay
02 introduction
04 the dirty dozen
08 Unbranded pollution
10 region & area trends
12 our calls
06 The potential for a
Deposit return scheme
3 Surfers Against Sewage 2021 Citizen Science Brand Audit Report
brand audit key findings
coca-cola, walkers,
mcdonalds*, cadbury
48% of branded
pollution overall
The top 12 most polluting brands are responsible for
These brands included...
Tesco, Lucozade, Costa Coffee, Budweiser, Mars Wrigley, Stella Artois, Haribo* and Aldi, and not much has changed over the past couple of years
remained at the top of the Dirty Dozen leader board in positions one
and two in years 2019 and 2021
This is despite continued promises and commitments to driving progress
toward plastic waste reduction targets and stated ambitions to
build a circular economy
and PepsicoCoca-Cola
moved from position 8 in 2019 to position 3 in the Dirty Dozen
As one of the world’s largest brewers for beer, an increase in this alcohol brand’s pollution count could
represent how the public have enjoyed outdoor recreational areas during the COVID-19 pandemic
anheuser-busch
inbevThe Dirty Dozen companies
are responsible for
These included Coca-Cola, PepsiCo, Anheuser-Busch InBev, McDonalds*,
Mondelez International, Heineken, Tesco, Carlsberg Group, Suntory, Haribo*, Mars and
Aldi. These are all above the threshhold for current EPR guidelines
Over 65% of all
branded pollutioncollected
from the Dirty Dozen companies
An ‘all-in’ drs
reported pollution
over half of the
would prevent
was categorised as PPE, despite receiving considerable media attention
over the last 18 months
only 2.5% ofpollution collected
Cigarette butts, miscellaneous plastic and bottles were found to be the most prolific unbranded items, accounting for
48% of unbranded
pollution overall
linked to 328 companies in total, and
were recorded overall including both branded and unbranded items
9,998 branded
items were found
26,938 items
collected branded items from
for the brand audit
3,913 volunteers
11,139 miles
EXECUTIVE SUMMARY
2021 citizen science
brand auditreport
01 Executive summary
03 Polluting brands
11 the conclusion
05 Polluting products
09 impact on the environment
07 getting polluters to pay
02 introduction
04 the dirty dozen
08 Unbranded pollution
10 region & area trends
12 our calls
06 The potential for a
Deposit return scheme
4 Surfers Against Sewage 2021 Citizen Science Brand Audit Report
ductionintro
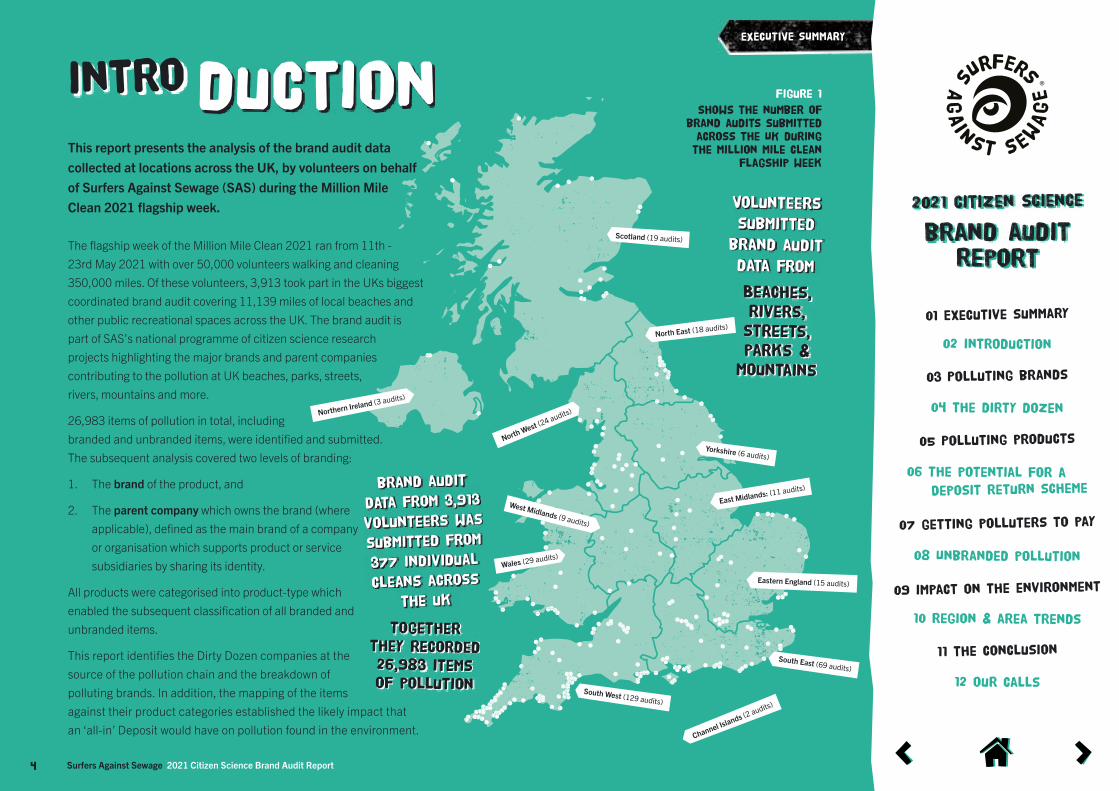
Eastern England (15 audits)
South East (69 audits)
South West (129 audits)
North East (18 audits)
North West (24 audits)
Yorkshire (6 audits)
West Midlands (9 audits)
Northern Ireland (3 audits)
Scotland (19 audits)
Channel Islands (2 audits)
Wales (29 audits)
East Midlands: (11 audits)brand audit
Data from 3,913
volunteers was
submitted from
377 individual
cleans across
the uk
Together they recorded 26,983 items of pollution
Volunteers submitted
brand audit data from
Beaches, rivers, streets, parks &
mountains
Figure 1
shows the number of brand audits submitted across the UK during the Million Mile clean
flagship week
This report presents the analysis of the brand audit data collected at locations across the UK, by volunteers on behalf of Surfers Against Sewage (SAS) during the Million Mile Clean 2021 flagship week.
The flagship week of the Million Mile Clean 2021 ran from 11th - 23rd May 2021 with over 50,000 volunteers walking and cleaning 350,000 miles. Of these volunteers, 3,913 took part in the UKs biggest coordinated brand audit covering 11,139 miles of local beaches and other public recreational spaces across the UK. The brand audit is part of SAS’s national programme of citizen science research projects highlighting the major brands and parent companies contributing to the pollution at UK beaches, parks, streets, rivers, mountains and more.
26,983 items of pollution in total, including branded and unbranded items, were identified and submitted. The subsequent analysis covered two levels of branding:
1. The brand of the product, and
2. The parent company which owns the brand (where applicable), defined as the main brand of a company or organisation which supports product or service subsidiaries by sharing its identity.
All products were categorised into product-type which enabled the subsequent classification of all branded and unbranded items.
This report identifies the Dirty Dozen companies at the source of the pollution chain and the breakdown of polluting brands. In addition, the mapping of the items against their product categories established the likely impact that an ‘all-in’ Deposit would have on pollution found in the environment.
2021 citizen science
brand auditreport
01 Executive summary
03 Polluting brands
11 the conclusion
05 Polluting products
09 impact on the environment
07 getting polluters to pay
02 introduction
04 the dirty dozen
08 Unbranded pollution
10 region & area trends
12 our calls
06 The potential for a
Deposit return scheme
5 Surfers Against Sewage 2021 Citizen Science Brand Audit Report
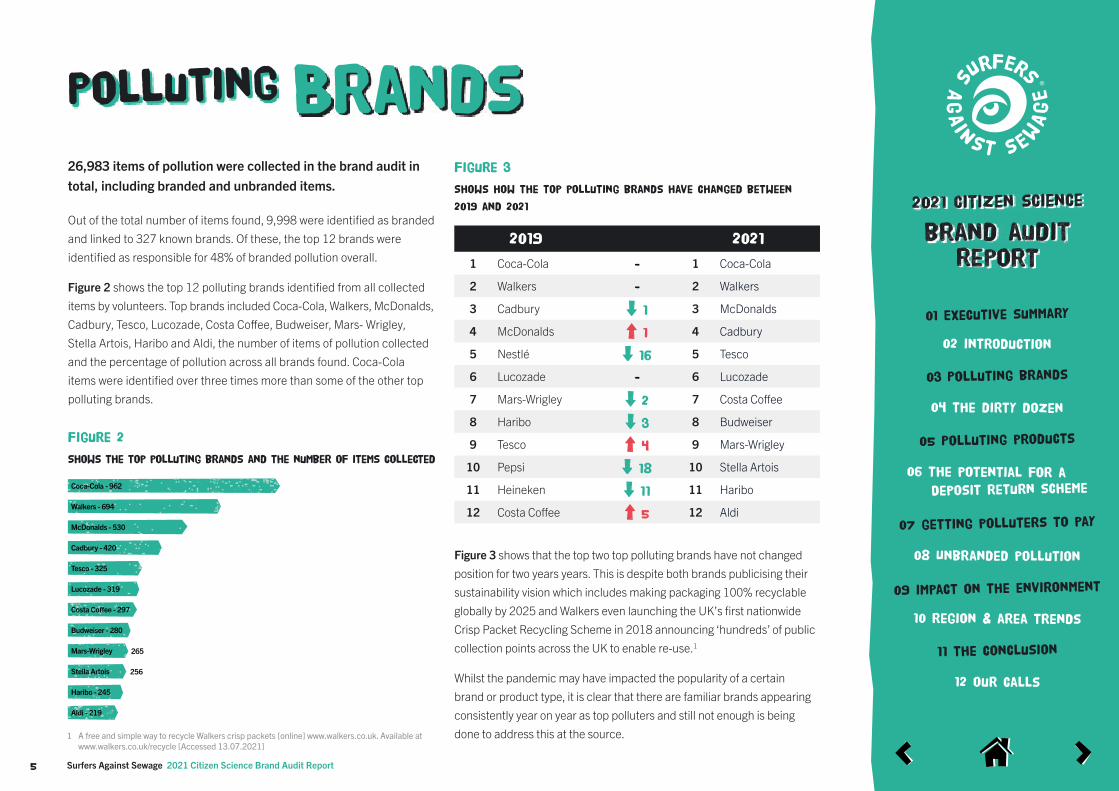
26,983 items of pollution were collected in the brand audit in total, including branded and unbranded items.
Out of the total number of items found, 9,998 were identified as branded and linked to 327 known brands. Of these, the top 12 brands were identified as responsible for 48% of branded pollution overall.
Figure 2 shows the top 12 polluting brands identified from all collected items by volunteers. Top brands included Coca-Cola, Walkers, McDonalds, Cadbury, Tesco, Lucozade, Costa Coffee, Budweiser, Mars- Wrigley, Stella Artois, Haribo and Aldi, the number of items of pollution collected and the percentage of pollution across all brands found. Coca-Cola items were identified over three times more than some of the other top polluting brands.
Figure 2
Shows the top polluting brands and the number of items collected
Figure 3 shows that the top two top polluting brands have not changed position for two years years. This is despite both brands publicising their sustainability vision which includes making packaging 100% recyclable globally by 2025 and Walkers even launching the UK’s first nationwide Crisp Packet Recycling Scheme in 2018 announcing ‘hundreds’ of public collection points across the UK to enable re-use.1
Whilst the pandemic may have impacted the popularity of a certain brand or product type, it is clear that there are familiar brands appearing consistently year on year as top polluters and still not enough is being done to address this at the source.1 A free and simple way to recycle Walkers crisp packets [online] www.walkers.co.uk. Available at
www.walkers.co.uk/recycle [Accessed 13.07.2021]
Figure 3
Shows how the top polluting brands have changed between
2019 and 2021
Brands
265
256
Coca-Cola - 962
Walkers - 694
McDonalds - 530
Cadbury - 420
Tesco - 325
Lucozade - 319
Costa Co�ee - 297
Budweiser - 280
Mars-Wrigley
Stella Artois
Haribo - 245
Aldi - 219
2019 2021
1 Coca-Cola - 1 Coca-Cola
2 Walkers - 2 Walkers
3 Cadbury 1 3 McDonalds
4 McDonalds 1 4 Cadbury
5 Nestlé 16 5 Tesco
6 Lucozade - 6 Lucozade
7 Mars-Wrigley 2 7 Costa Coffee
8 Haribo 3 8 Budweiser
9 Tesco 4 9 Mars-Wrigley
10 Pepsi 18 10 Stella Artois
11 Heineken 11 11 Haribo
12 Costa Coffee 5 12 Aldi
Polluting
2021 citizen science
brand auditreport
01 Executive summary
03 Polluting brands
11 the conclusion
05 Polluting products
09 impact on the environment
07 getting polluters to pay
02 introduction
04 the dirty dozen
08 Unbranded pollution
10 region & area trends
12 our calls
06 The potential for a
Deposit return scheme
6 Surfers Against Sewage 2021 Citizen Science Brand Audit Report
POLLUTING BRANDS
10%7%
5%
4%
3%
3%
3%3%
3%3%
2%2%
to
p 12
pollutin
g brands:
48%
other brands:
52%
@Co
ca-C
ola
@Walkers
@McDonalds
@Cadbury
@Tesco@Lucozade@Costa Co�ee
@Budweiser
@Mars W
rigley
@Stella Artois
@H
aribo
@A
ldi
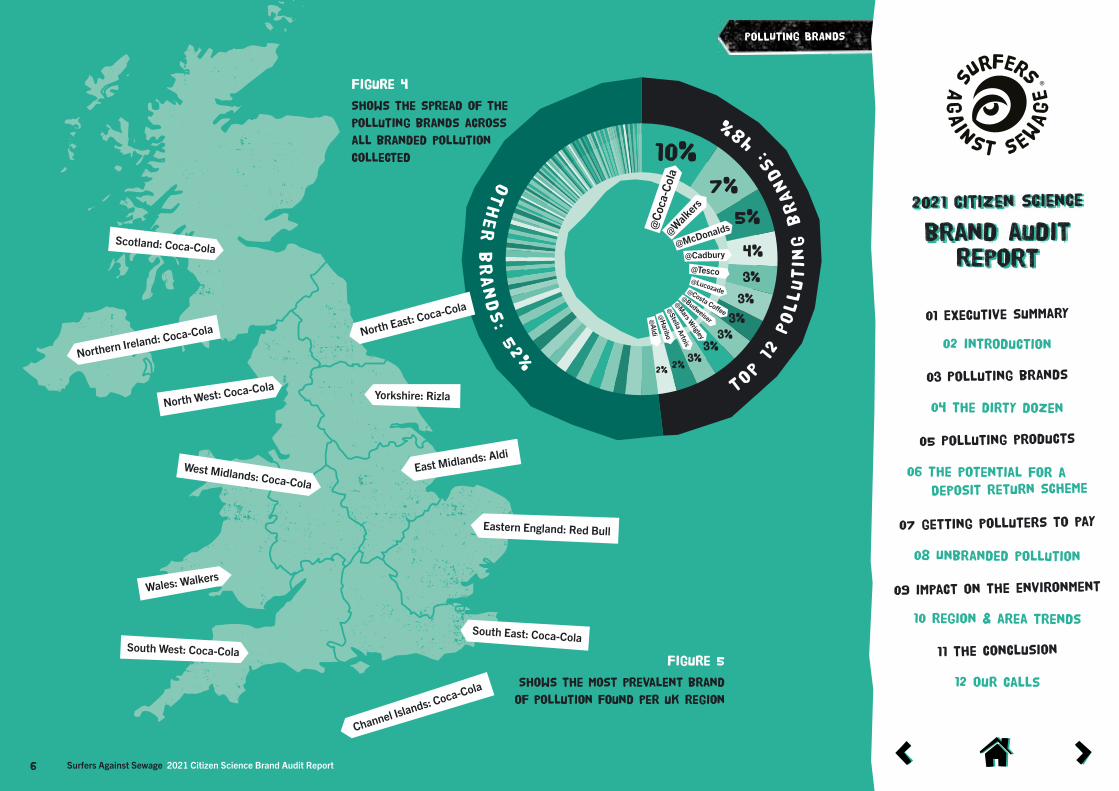
Figure 5
Shows the most prevalent brand
of pollution found per uk region
Eastern England: Red Bull
South East: Coca-ColaSouth West: Coca-Cola
North East: Coca-Cola
North West: Coca-ColaYorkshire: Rizla
West Midlands: Coca-Cola
Northern Ireland: Coca-Cola
Scotland: Coca-Cola
Wales: Walkers
East Midlands: Aldi
Channel Islands: Coca-Cola
Figure 4
Shows the spread of the
polluting brands across
all branded pollution
collected
2021 citizen science
brand auditreport
01 Executive summary
03 Polluting brands
11 the conclusion
05 Polluting products
09 impact on the environment
07 getting polluters to pay
02 introduction
04 the dirty dozen
08 Unbranded pollution
10 region & area trends
12 our calls
06 The potential for a
Deposit return scheme
7 Surfers Against Sewage 2021 Citizen Science Brand Audit Report
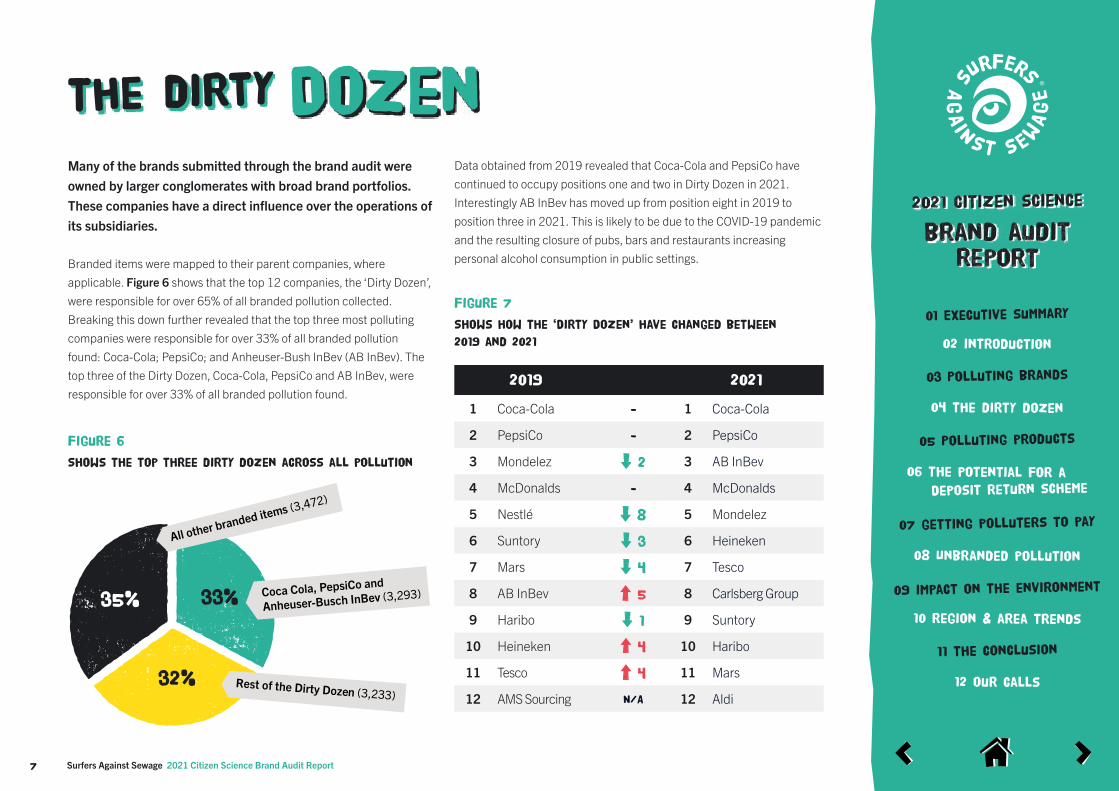
Many of the brands submitted through the brand audit were owned by larger conglomerates with broad brand portfolios. These companies have a direct influence over the operations of its subsidiaries.
Branded items were mapped to their parent companies, where applicable. Figure 6 shows that the top 12 companies, the ‘Dirty Dozen’, were responsible for over 65% of all branded pollution collected. Breaking this down further revealed that the top three most polluting companies were responsible for over 33% of all branded pollution found: Coca-Cola; PepsiCo; and Anheuser-Bush InBev (AB InBev). The top three of the Dirty Dozen, Coca-Cola, PepsiCo and AB InBev, were responsible for over 33% of all branded pollution found.
The dirty DozenData obtained from 2019 revealed that Coca-Cola and PepsiCo have continued to occupy positions one and two in Dirty Dozen in 2021. Interestingly AB InBev has moved up from position eight in 2019 to position three in 2021. This is likely to be due to the COVID-19 pandemic and the resulting closure of pubs, bars and restaurants increasing personal alcohol consumption in public settings.
33%
32%
35%Coca Cola, PepsiCo and
Anheuser-Busch InBev (3,293)
All other branded items (3,472)
Rest of the Dirty Dozen (3,233)
Figure 6
Shows the top three dirty dozen across all pollution
Figure 7
Shows how the ‘Dirty Dozen’ have changed between
2019 and 2021
2019 2021
1 Coca-Cola - 1 Coca-Cola
2 PepsiCo - 2 PepsiCo
3 Mondelez 2 3 AB InBev
4 McDonalds - 4 McDonalds
5 Nestlé 8 5 Mondelez
6 Suntory 3 6 Heineken
7 Mars 4 7 Tesco
8 AB InBev 5 8 Carlsberg Group
9 Haribo 1 9 Suntory
10 Heineken 4 10 Haribo
11 Tesco 4 11 Mars
12 AMS Sourcing N/A 12 Aldi
2021 citizen science
brand auditreport
01 Executive summary
03 Polluting brands
11 the conclusion
05 Polluting products
09 impact on the environment
07 getting polluters to pay
02 introduction
04 the dirty dozen
08 Unbranded pollution
10 region & area trends
12 our calls
06 The potential for a
Deposit return scheme
8 Surfers Against Sewage 2021 Citizen Science Brand Audit Report
THE DIRTY DOZEN
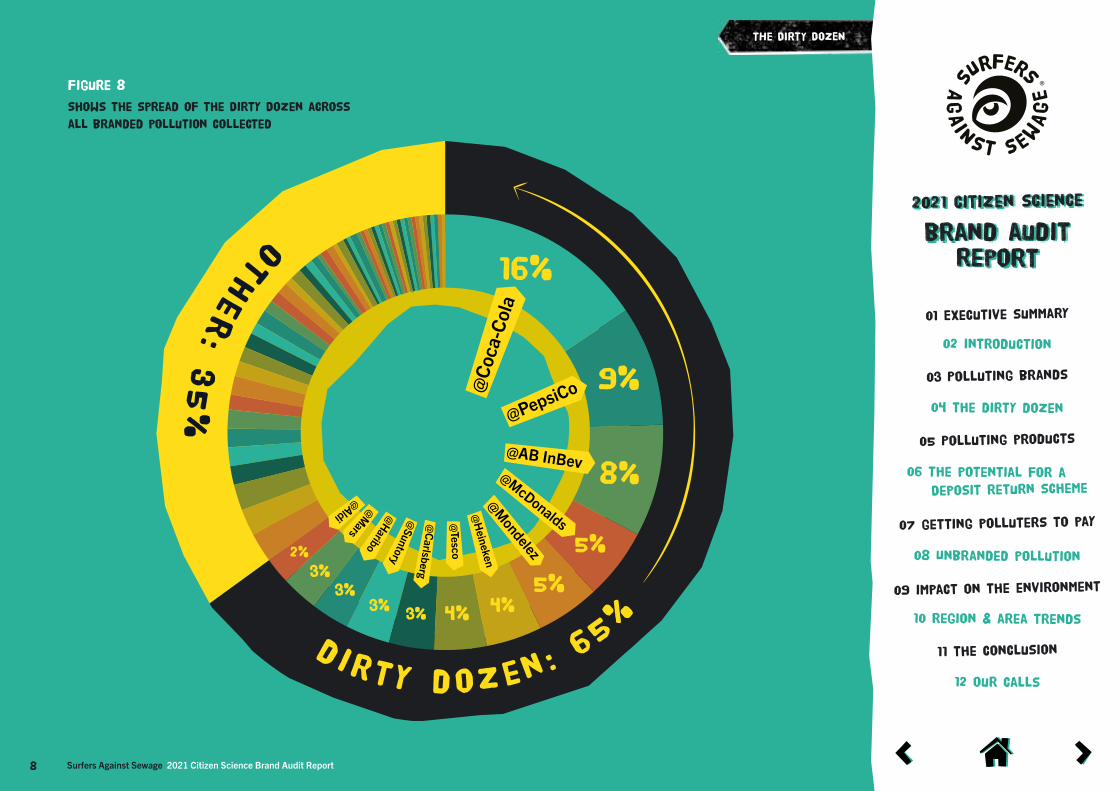
Figure 8
Shows the spread of the Dirty Dozen across
all branded pollution collected
16%
9%
8%
5%
5%4%4%3%
3%3%
3%2%
d irty dozen : 65%
@Co
ca-C
ola
@PepsiCo
@AB InBev@McDonalds
@Mondelez
@H
eineken
@Tesco
@C
arlsberg@
Suntory@
Haribo@M
ars
@Aldi
o
ther:
35%
2021 citizen science
brand auditreport
01 Executive summary
03 Polluting brands
11 the conclusion
05 Polluting products
09 impact on the environment
07 getting polluters to pay
02 introduction
04 the dirty dozen
08 Unbranded pollution
10 region & area trends
12 our calls
06 The potential for a
Deposit return scheme
9 Surfers Against Sewage 2021 Citizen Science Brand Audit Report
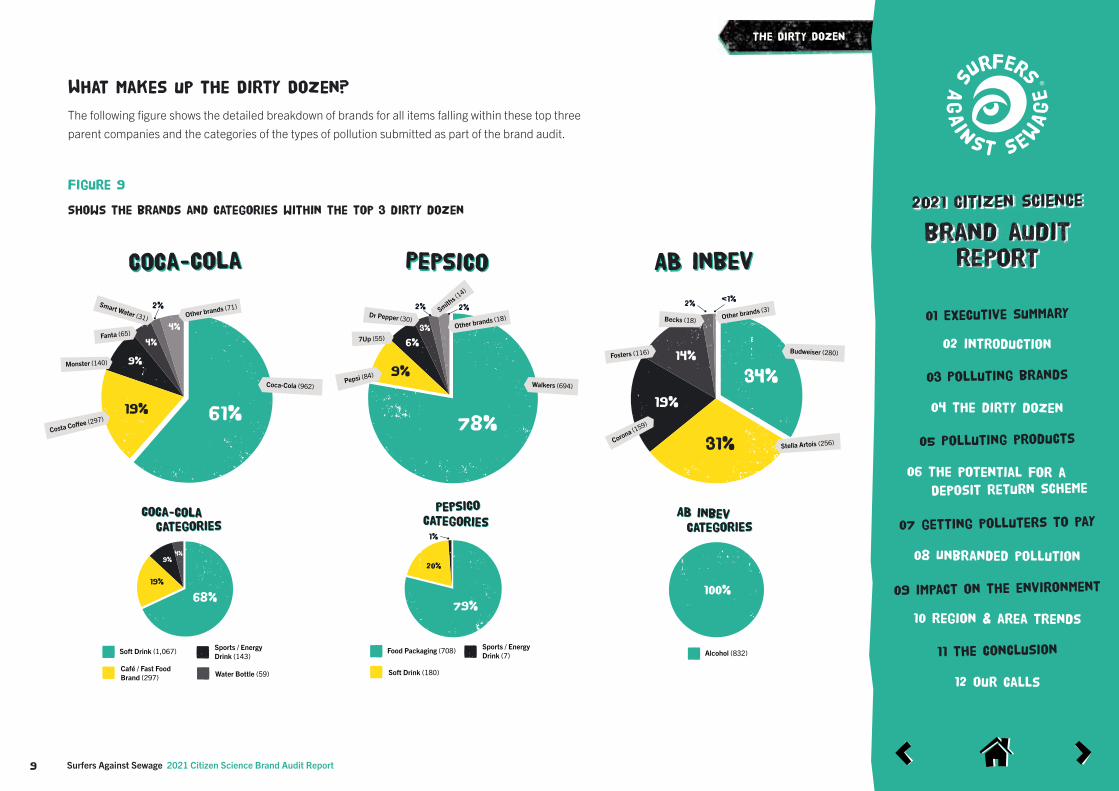
What makes up the Dirty Dozen?
The following figure shows the detailed breakdown of brands for all items falling within these top three parent companies and the categories of the types of pollution submitted as part of the brand audit.
Figure 9
Shows the brands and categories within the top 3 dirty dozen
78%
9%
6%
3%
2% 2%
Walkers (694)
Other brands (18)
Pepsi (84)
7Up (55)
Dr Pepper (30)Smith
s (14)
Categories
Coca-Cola
61%19%
9%
4%
2%
4%
68%
19%
9%4%
Coca-Cola (962)
Other brands (71)
Costa Co�ee (297)
Monster (140)
Fanta (65)
Smart Water (31)
Soft Drink (1,067)
Café / Fast Food Brand (297)
Sports / Energy Drink (143)
Water Bottle (59)
Coca-Cola
CategoriesCoca-Colacoca-Cola
CategoriesCategoriesAB inbevAB inbev
CategoriesCategoriesPepsicoPepsico
100%
Alcohol (832)
AB inbevAB inbevPepsicoPepsiCo
Food Packaging (708)
Soft Drink (180)
Sports / Energy Drink (7)
79%
20%
1%
34%
31%
19%
14%
2%<1%
Budweiser (280)
Other brands (3)
Stella Artois (256)Corona (159)
Fosters (116)
Becks (18)
THE DIRTY DOZEN
2021 citizen science
brand auditreport
01 Executive summary
03 Polluting brands
11 the conclusion
05 Polluting products
09 impact on the environment
07 getting polluters to pay
02 introduction
04 the dirty dozen
08 Unbranded pollution
10 region & area trends
12 our calls
06 The potential for a
Deposit return scheme
10 Surfers Against Sewage 2021 Citizen Science Brand Audit Report
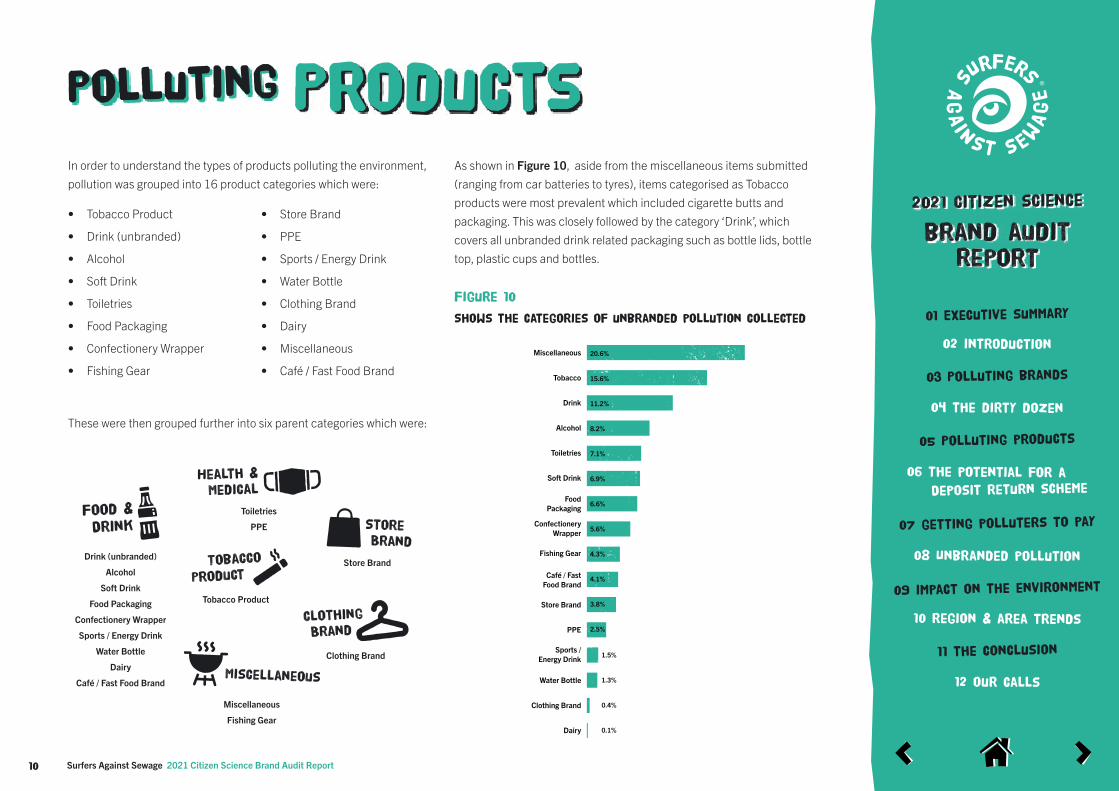
In order to understand the types of products polluting the environment, pollution was grouped into 16 product categories which were:
• Tobacco Product
• Drink (unbranded)
• Alcohol
• Soft Drink
• Toiletries
• Food Packaging
• Confectionery Wrapper
• Fishing Gear
• Store Brand
• PPE
• Sports / Energy Drink
• Water Bottle
• Clothing Brand
• Dairy
• Miscellaneous
• Café / Fast Food Brand
These were then grouped further into six parent categories which were:
As shown in Figure 10, aside from the miscellaneous items submitted (ranging from car batteries to tyres), items categorised as Tobacco products were most prevalent which included cigarette butts and packaging. This was closely followed by the category ‘Drink’, which covers all unbranded drink related packaging such as bottle lids, bottle top, plastic cups and bottles.
Figure 10
Shows the categories of unbranded pollution collected
ProductsPolluting
1.5%
1.3%
0.4%
0.1%
Miscellaneous
Tobacco
Drink
Alcohol
Toiletries
Soft Drink
FoodPackaging
ConfectioneryWrapper
Fishing Gear
Café / FastFood Brand
Store Brand
PPE
Sports /Energy Drink
Water Bottle
Clothing Brand
Dairy
20.6%
15.6%
11.2%
8.2%
7.1%
6.9%
6.6%
5.6%
4.3%
4.1%
3.8%
2.5%
Food &
Drink
Tobacco
Product
Health &Medical
Store Brand
Clothing
Brand
Miscellaneous
Drink (unbranded)
Alcohol
Soft Drink
Food Packaging
Confectionery Wrapper
Sports / Energy Drink
Water Bottle
Dairy
Café / Fast Food Brand
Food &
Drink
Tobacco
Product
Health &Medical
Store Brand
Clothing
Brand
Miscellaneous
Miscellaneous
Fishing Gear
Food &
Drink
Tobacco
Product
Health &Medical
Store Brand
Clothing
Brand
Miscellaneous
Toiletries
PPE
Food &
Drink
Tobacco
Product
Health &Medical
Store Brand
Clothing
Brand
Miscellaneous
Store Brand
Food &
Drink
Tobacco
Product
Health &Medical
Store Brand
Clothing
Brand
Miscellaneous
Clothing Brand
Food &
Drink
Tobacco
Product
Health &Medical
Store Brand
Clothing
Brand
Miscellaneous
Tobacco Product
2021 citizen science
brand auditreport
01 Executive summary
03 Polluting brands
11 the conclusion
05 Polluting products
09 impact on the environment
07 getting polluters to pay
02 introduction
04 the dirty dozen
08 Unbranded pollution
10 region & area trends
12 our calls
06 The potential for a
Deposit return scheme
Surfers Against Sewage 2021 Citizen Science Brand Audit Report11
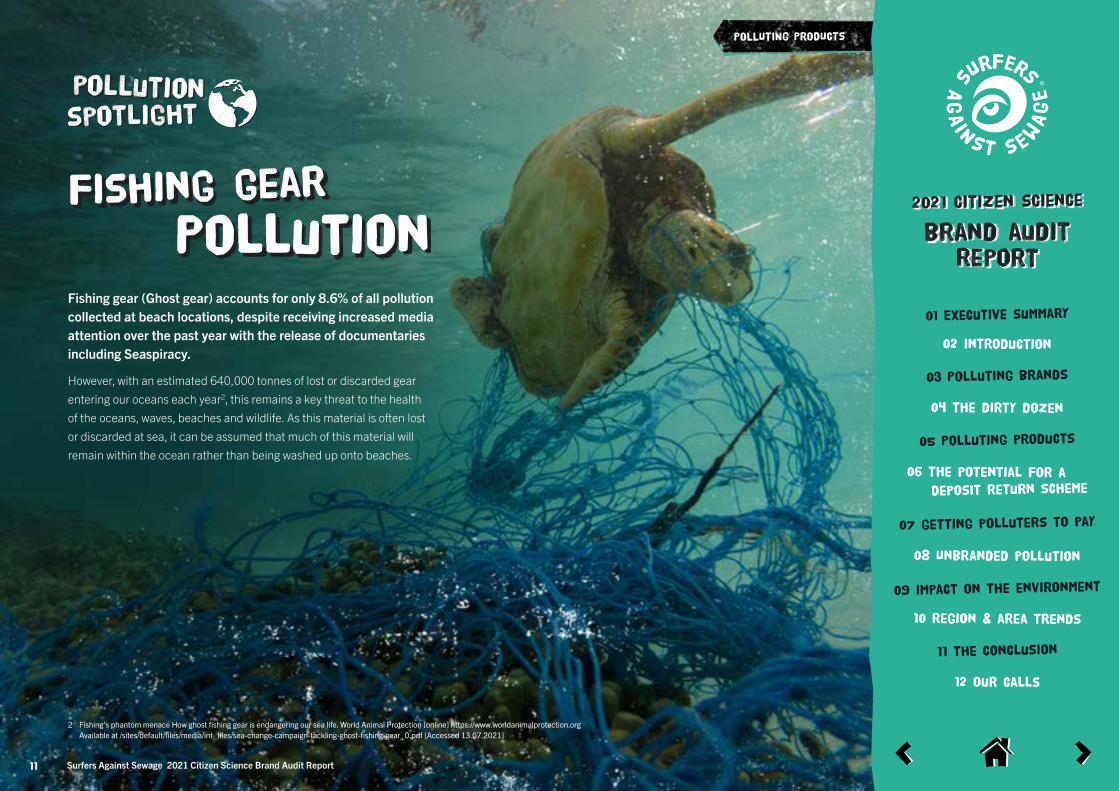
Fishing gear (Ghost gear) accounts for only 8.6% of all pollution collected at beach locations, despite receiving increased media attention over the past year with the release of documentaries including Seaspiracy.
However, with an estimated 640,000 tonnes of lost or discarded gear entering our oceans each year2, this remains a key threat to the health of the oceans, waves, beaches and wildlife. As this material is often lost or discarded at sea, it can be assumed that much of this material will remain within the ocean rather than being washed up onto beaches.
PollutionFishing gear
2 Fishing’s phantom menace How ghost fishing gear is endangering our sea life. World Animal Protection [online] https://www.worldanimalprotection.org Available at /sites/default/files/media/int_files/sea-change-campaign-tackling-ghost-fishing-gear_0.pdf [Accessed 13.07.2021]
POLLUTING PRODUCTS
EXECUTIVE SUMMARY
2021 citizen science
brand auditreport
01 Executive summary
03 Polluting brands
11 the conclusion
05 Polluting products
09 impact on the environment
07 getting polluters to pay
02 introduction
04 the dirty dozen
08 Unbranded pollution
10 region & area trends
12 our calls
06 The potential for a
Deposit return scheme
Surfers Against Sewage 2021 Citizen Science Brand Audit Report12
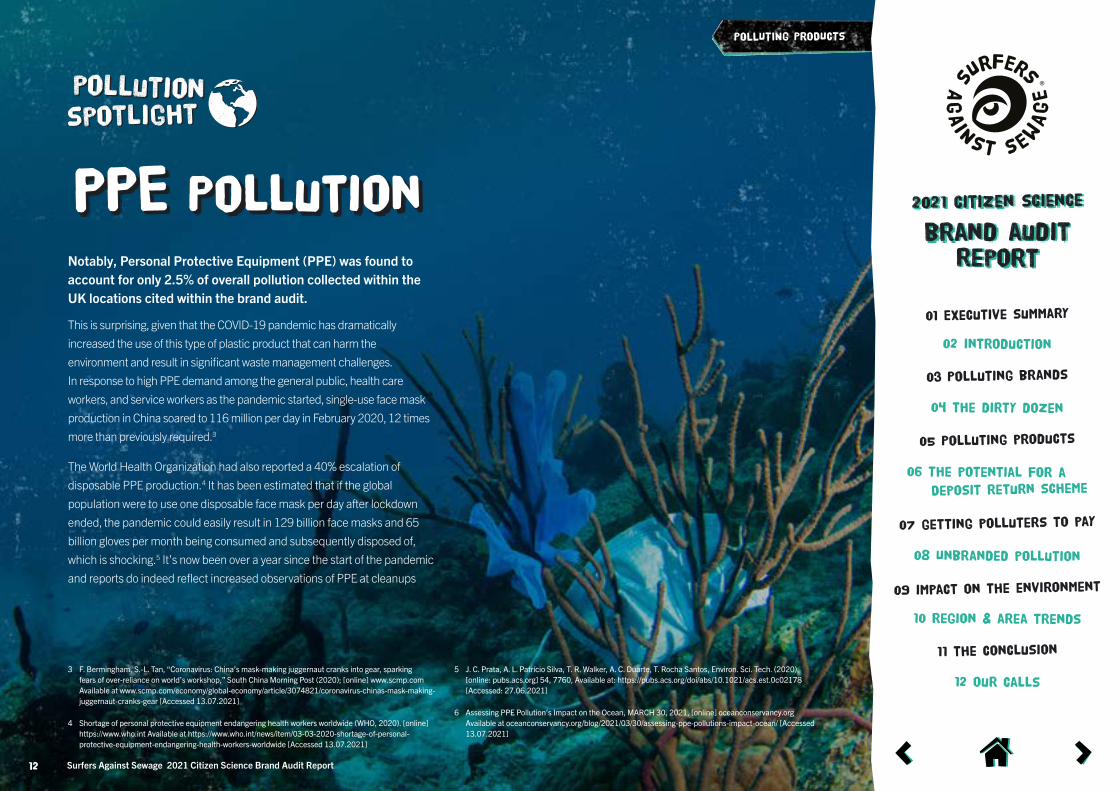
Notably, Personal Protective Equipment (PPE) was found to account for only 2.5% of overall pollution collected within the UK locations cited within the brand audit.
This is surprising, given that the COVID-19 pandemic has dramatically increased the use of this type of plastic product that can harm the environment and result in significant waste management challenges. In response to high PPE demand among the general public, health care workers, and service workers as the pandemic started, single-use face mask production in China soared to 116 million per day in February 2020, 12 times more than previously required.3
The World Health Organization had also reported a 40% escalation of disposable PPE production.4 It has been estimated that if the global population were to use one disposable face mask per day after lockdown ended, the pandemic could easily result in 129 billion face masks and 65 billion gloves per month being consumed and subsequently disposed of, which is shocking.5 It’s now been over a year since the start of the pandemic and reports do indeed reflect increased observations of PPE at cleanups
PollutionPPE
3 F. Bermingham, S.-L. Tan, “Coronavirus: China’s mask-making juggernaut cranks into gear, sparking fears of over-reliance on world’s workshop,” South China Morning Post (2020); [online] www.scmp.com Available at www.scmp.com/economy/global-economy/article/3074821/coronavirus-chinas-mask-making-juggernaut-cranks-gear [Accessed 13.07.2021]
4 Shortage of personal protective equipment endangering health workers worldwide (WHO, 2020). [online] https://www.who.int Available at https://www.who.int/news/item/03-03-2020-shortage-of-personal-protective-equipment-endangering-health-workers-worldwide [Accessed 13.07.2021]
5 J. C. Prata, A. L. Patrício Silva, T. R. Walker, A. C. Duarte, T. Rocha Santos, Environ. Sci. Tech. (2020), [online: pubs.acs.org] 54, 7760, Available at: https://pubs.acs.org/doi/abs/10.1021/acs.est.0c02178 [Accessed: 27.06.2021]
6 Assessing PPE Pollution’s Impact on the Ocean, MARCH 30, 2021, [online] oceanconservancy.org Available at oceanconservancy.org/blog/2021/03/30/assessing-ppe-pollutions-impact-ocean/ [Accessed 13.07.2021]
POLLUTING PRODUCTS
2021 citizen science
brand auditreport
01 Executive summary
03 Polluting brands
11 the conclusion
05 Polluting products
09 impact on the environment
07 getting polluters to pay
02 introduction
04 the dirty dozen
08 Unbranded pollution
10 region & area trends
12 our calls
06 The potential for a
Deposit return scheme
Surfers Against Sewage 2021 Citizen Science Brand Audit Report13
POLLUTING PRODUCTS
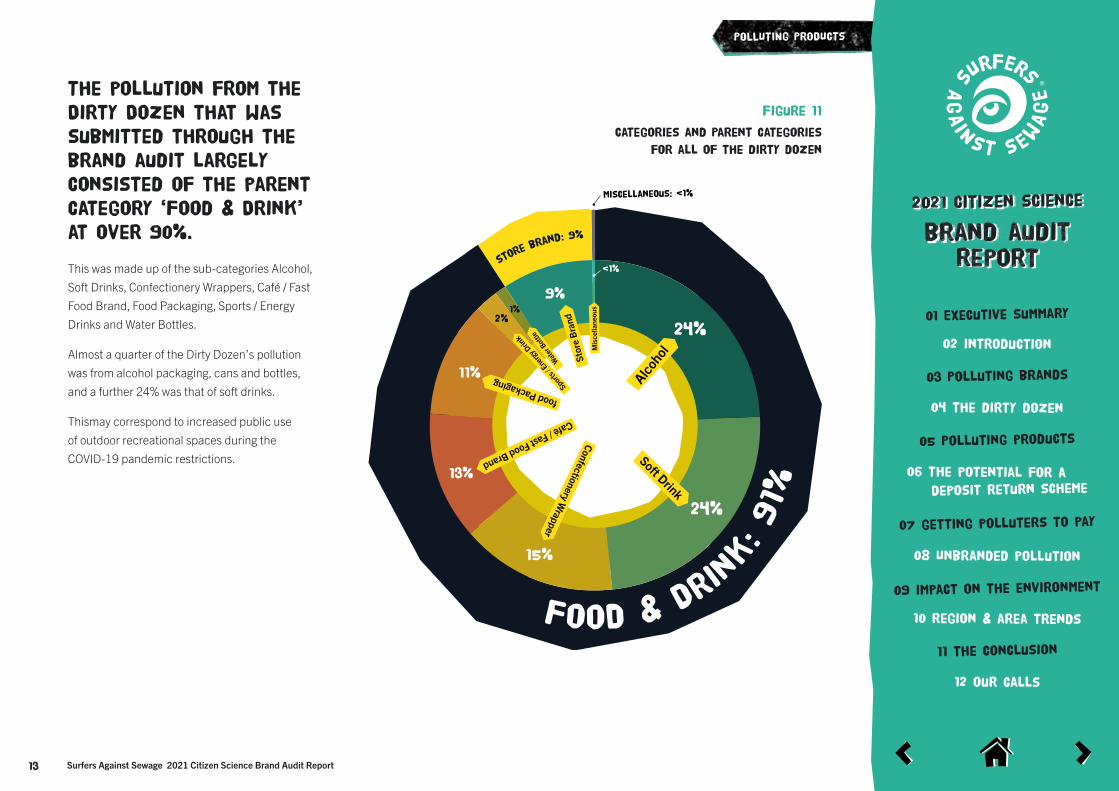
The pollution from the Dirty Dozen that was submitted through the brand audit largely consisted of the parent category ‘Food & Drink’ at over 90%.
This was made up of the sub-categories Alcohol, Soft Drinks, Confectionery Wrappers, Café / Fast Food Brand, Food Packaging, Sports / Energy Drinks and Water Bottles.
Almost a quarter of the Dirty Dozen’s pollution was from alcohol packaging, cans and bottles, and a further 24% was that of soft drinks.
Thismay correspond to increased public use of outdoor recreational spaces during the COVID-19 pandemic restrictions.
Figure 11
Categories and Parent categories
for all of the dirty dozen
Miscellaneous: <1%<1%
Food & Dr
in
k: 91%
store
brand: 9
%
Alcohol
Confectionery Wrapper
Café / Fast Food Brand
food Packaging
Sports / E
nergy D
rink
Stor
e B
rand
Wat
er B
ottle
Mis
cella
neou
s
Soft Drink
24%
24%
15%
13%
11%
9%
2%1%
<1%
EXECUTIVE SUMMARY
2021 citizen science
brand auditreport
01 Executive summary
03 Polluting brands
11 the conclusion
05 Polluting products
09 impact on the environment
07 getting polluters to pay
02 introduction
04 the dirty dozen
08 Unbranded pollution
10 region & area trends
12 our calls
06 The potential for a
Deposit return scheme
Surfers Against Sewage 2021 Citizen Science Brand Audit Report14
POLLUTING PRODUCTS
7 Brock, A. and Williams, I.D., LIFE CYCLE ASSESSMENT OF BEVERAGE PACKAGING (05 Oct 2020) [online: www.gov.uk/defra]. Available at: https://digital. detritusjournal.com/articles/in-press/life-cycle-assessment-of-beverage-packaging/368 [Accessed 13.07.2021]
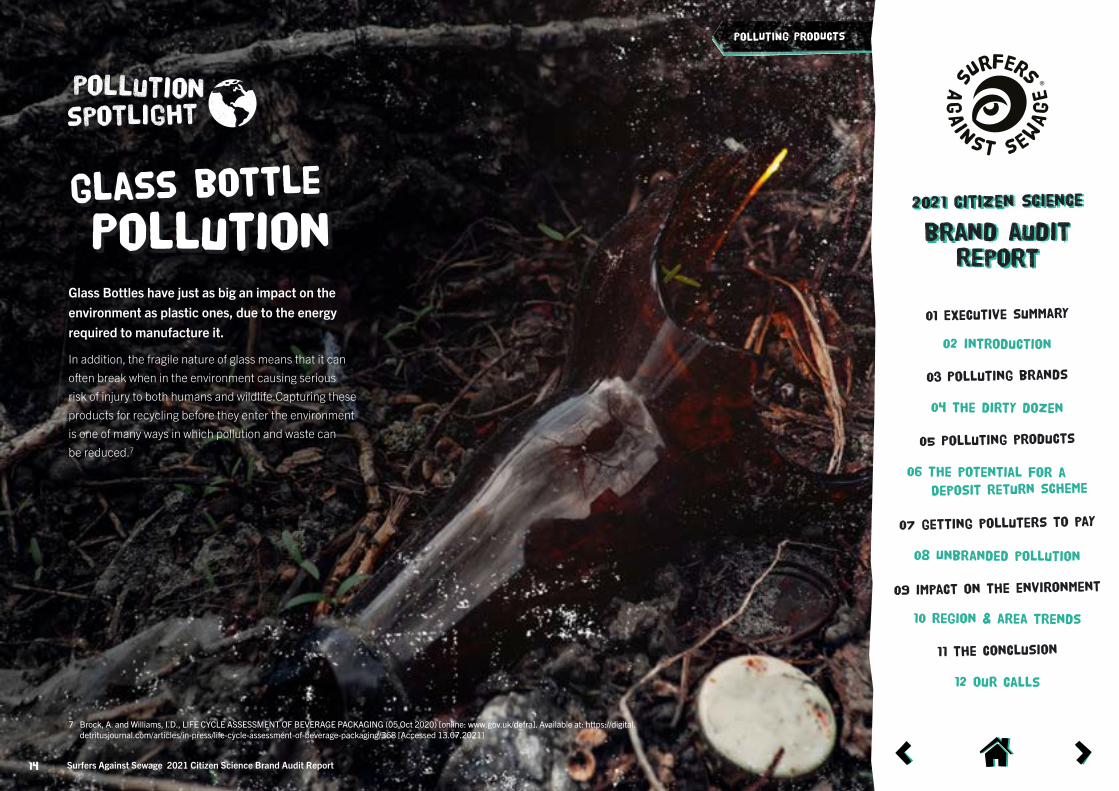
Glass Bottles have just as big an impact on the environment as plastic ones, due to the energy required to manufacture it.
In addition, the fragile nature of glass means that it can often break when in the environment causing serious risk of injury to both humans and wildlife.Capturing these products for recycling before they enter the environment is one of many ways in which pollution and waste can be reduced.7
Pollutionglass bottle
2021 citizen science
brand auditreport
01 Executive summary
03 Polluting brands
11 the conclusion
05 Polluting products
09 impact on the environment
07 getting polluters to pay
02 introduction
04 the dirty dozen
08 Unbranded pollution
10 region & area trends
12 our calls
06 The potential for a
Deposit return scheme
15 Surfers Against Sewage 2021 Citizen Science Brand Audit Report
POLLUTING PRODUCTS
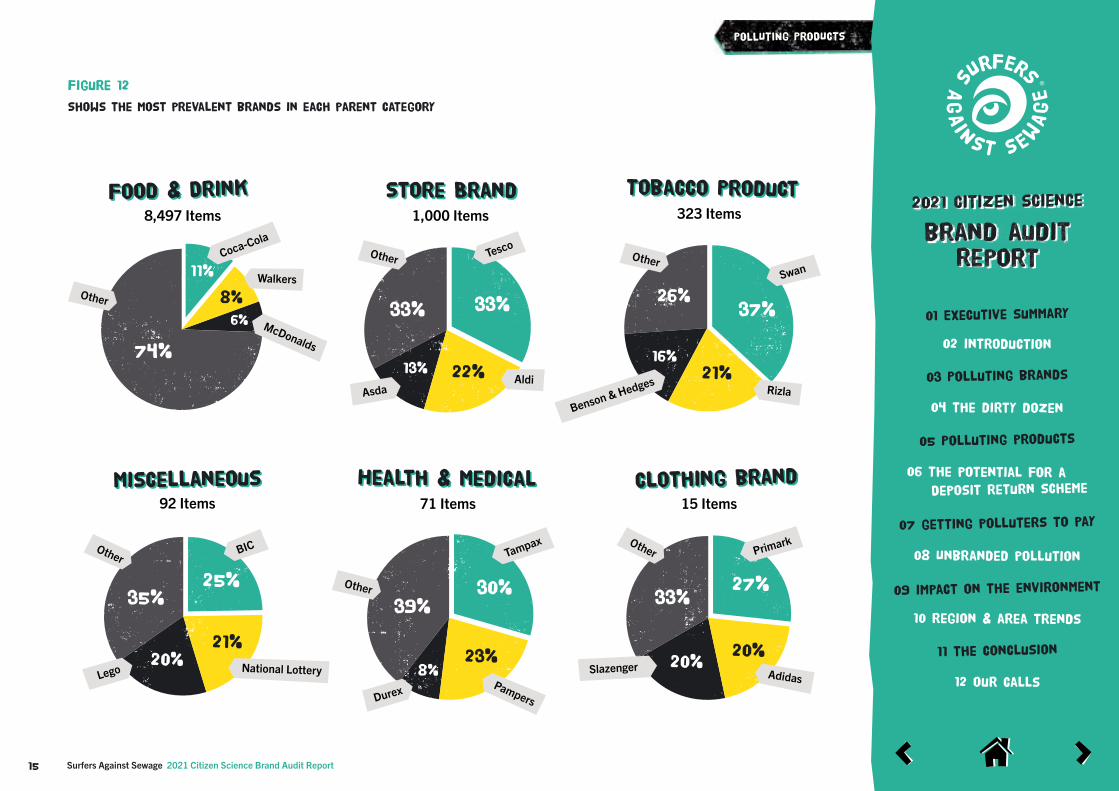
Figure 12
Shows the most prevalent brands in each parent category
Food & Drink
11%
8%
6%
74%
Food & Drink 8,497 Items
Coca-Cola
Walkers
McDonalds
Other
Store Brand
33%
22%13%
33%
Store Brand1,000 Items
Tesco
AldiAsda
Other
Tobacco Product
37%
21%16%
26%
Tobacco Product323 Items
Swan
Rizla
Other
Benson & Hedges
Miscellaneous
25%
21%20%
35%
Miscellaneous92 Items
BIC
National LotteryLego
Other
Health & Medical
30%
23%8%
39%
Health & Medical71 Items
Tampax
PampersDurex
Other
Clothing brandClothing brand15 Items
27%
20%20%
33%
Slazenger
Other Primark
Adidas
2021 citizen science
brand auditreport
01 Executive summary
03 Polluting brands
11 the conclusion
05 Polluting products
09 impact on the environment
07 getting polluters to pay
02 introduction
04 the dirty dozen
08 Unbranded pollution
10 region & area trends
12 our calls
06 The potential for a
Deposit return scheme
16 Surfers Against Sewage 2021 Citizen Science Brand Audit Report
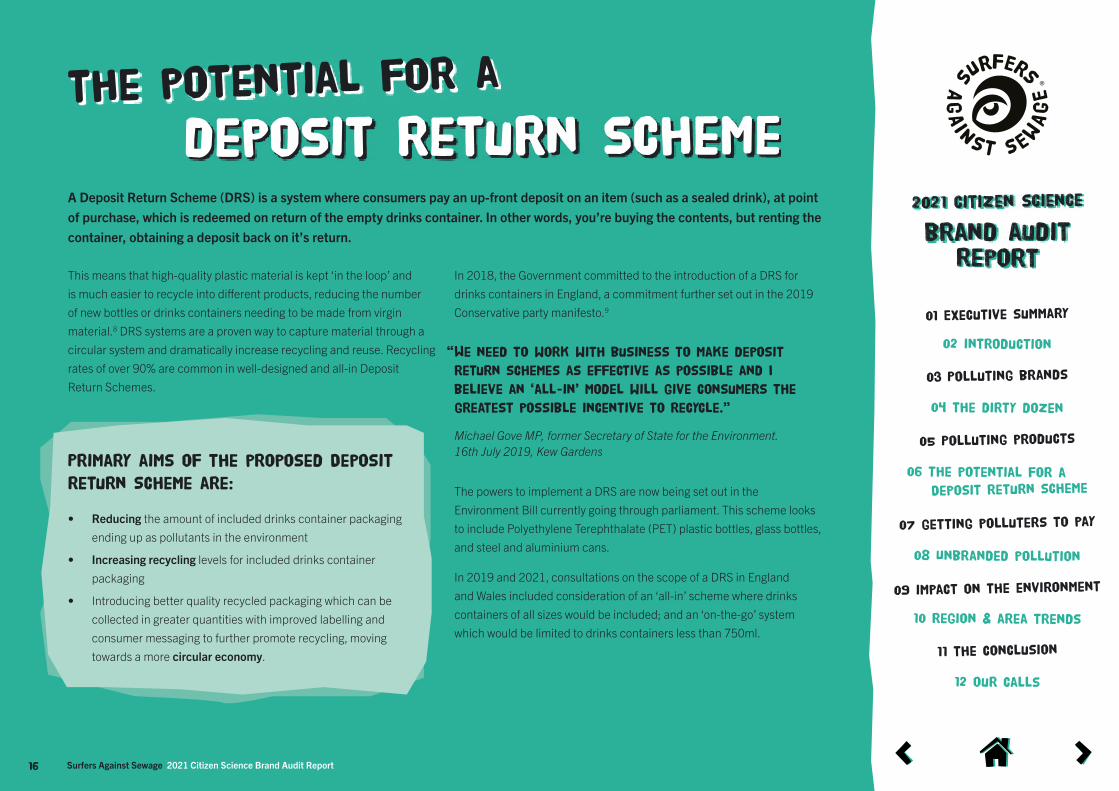
deposit return schemethe potential for a
A Deposit Return Scheme (DRS) is a system where consumers pay an up-front deposit on an item (such as a sealed drink), at point of purchase, which is redeemed on return of the empty drinks container. In other words, you’re buying the contents, but renting the container, obtaining a deposit back on it’s return.
This means that high-quality plastic material is kept ‘in the loop’ and is much easier to recycle into different products, reducing the number of new bottles or drinks containers needing to be made from virgin material.8 DRS systems are a proven way to capture material through a circular system and dramatically increase recycling and reuse. Recycling rates of over 90% are common in well-designed and all-in Deposit Return Schemes.
Primary aims of the proposed Deposit
Return Scheme are:
• Reducing the amount of included drinks container packaging ending up as pollutants in the environment
• Increasing recycling levels for included drinks container packaging
• Introducing better quality recycled packaging which can be collected in greater quantities with improved labelling and consumer messaging to further promote recycling, moving towards a more circular economy.
In 2018, the Government committed to the introduction of a DRS for drinks containers in England, a commitment further set out in the 2019 Conservative party manifesto.9
The powers to implement a DRS are now being set out in the Environment Bill currently going through parliament. This scheme looks to include Polyethylene Terephthalate (PET) plastic bottles, glass bottles, and steel and aluminium cans.
In 2019 and 2021, consultations on the scope of a DRS in England and Wales included consideration of an ‘all-in’ scheme where drinks containers of all sizes would be included; and an ‘on-the-go’ system which would be limited to drinks containers less than 750ml.
“We need to work with business to make deposit
return schemes as effective as possible and I
believe an ‘all-in’ model will give consumers the
greatest possible incentive to recycle.”
Michael Gove MP, former Secretary of State for the Environment. 16th July 2019, Kew Gardens
2021 citizen science
brand auditreport
01 Executive summary
03 Polluting brands
11 the conclusion
05 Polluting products
09 impact on the environment
07 getting polluters to pay
02 introduction
04 the dirty dozen
08 Unbranded pollution
10 region & area trends
12 our calls
06 The potential for a
Deposit return scheme
17
DEPOSIT RETURN SCHEME
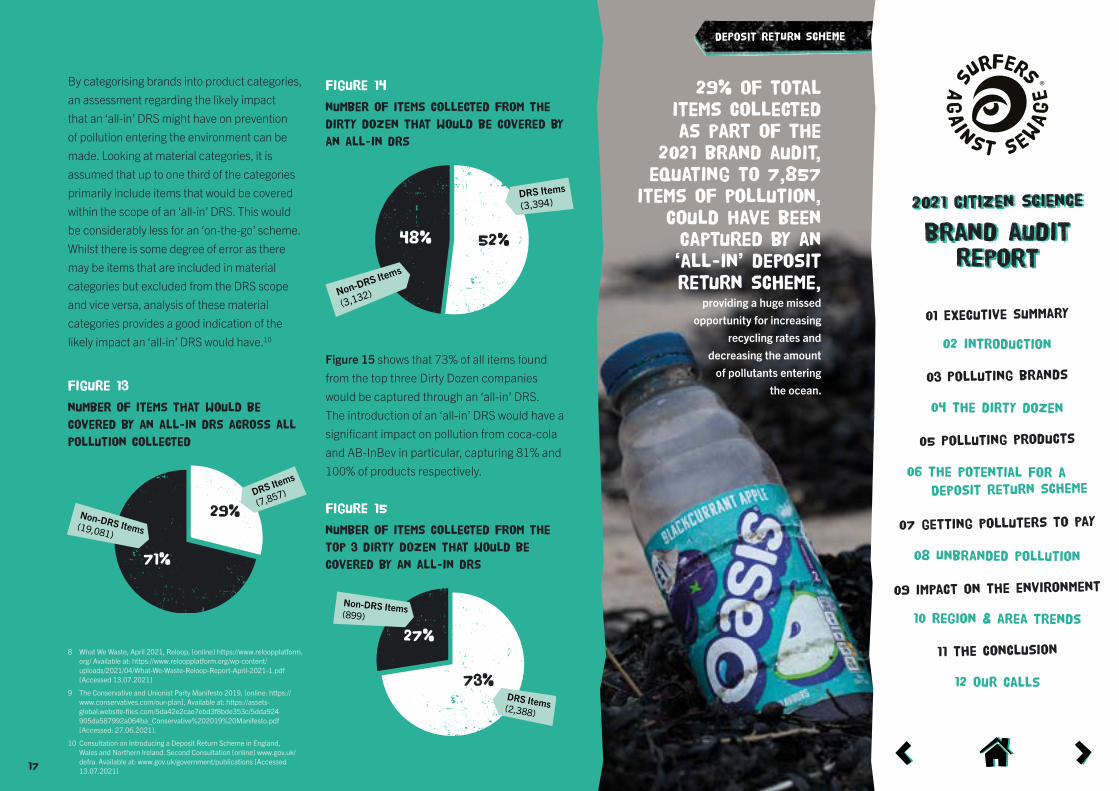
By categorising brands into product categories, an assessment regarding the likely impact that an ‘all-in’ DRS might have on prevention of pollution entering the environment can be made. Looking at material categories, it is assumed that up to one third of the categories primarily include items that would be covered within the scope of an ‘all-in’ DRS. This would be considerably less for an ‘on-the-go’ scheme. Whilst there is some degree of error as there may be items that are included in material categories but excluded from the DRS scope and vice versa, analysis of these material categories provides a good indication of the likely impact an ‘all-in’ DRS would have.10
figure 13
number of items that would be
covered by an all-in drs across all
pollution collected
29%
71%
DRS Items
(7,857)
Non-DRS Items (19,081)
figure 14
number of items collected from the
dirty dozen that would be covered by
an all-in drs
52%48%
DRS Items
(3,394)
Non-DRS Items
(3,132)
figure 15
number of items collected from the
top 3 dirty dozen that would be
covered by an all-in drs
73%
27%
DRS Items (2,388)
Non-DRS Items (899)
Figure 15 shows that 73% of all items found from the top three Dirty Dozen companies would be captured through an ‘all-in’ DRS. The introduction of an ‘all-in’ DRS would have a significant impact on pollution from coca-cola and AB-InBev in particular, capturing 81% and 100% of products respectively.
8 What We Waste, April 2021, Reloop, [online] https://www.reloopplatform.org/ Available at: https://www.reloopplatform.org/wp-content/uploads/2021/04/What-We-Waste-Reloop-Report-April-2021-1.pdf [Accessed 13.07.2021]
9 The Conservative and Unionist Party Manifesto 2019, [online: https://www.conservatives.com/our-plan], Available at: https://assets-global.website-files.com/5da42e2cae7ebd3f8bde353c/5dda924 905da587992a064ba_Conservative%202019%20Manifesto.pdf [Accessed: 27.06.2021].
10 Consultation on Introducing a Deposit Return Scheme in England, Wales and Northern Ireland. Second Consultation [online] www.gov.uk/defra. Available at: www.gov.uk/government/publications [Accessed 13.07.2021]
29% of total items collected as part of the
2021 brand audit, equating to 7,857
items of pollution, could have been captured by an ‘all-in’ deposit return scheme,
providing a huge missed opportunity for increasing
recycling rates and decreasing the amount
of pollutants entering the ocean.
2021 citizen science
brand auditreport
01 Executive summary
03 Polluting brands
11 the conclusion
05 Polluting products
09 impact on the environment
07 getting polluters to pay
02 introduction
04 the dirty dozen
08 Unbranded pollution
10 region & area trends
12 our calls
06 The potential for a
Deposit return scheme
18 Surfers Against Sewage 2021 Citizen Science Brand Audit Report
11 Policy paper- Environment Bill summer policy statement: (July 2019), [online: www.gov.uk]. Available at: https://www.gov.uk/government/publications/draft-environment-principles-and-governance-bill-2018/environment-bill-summer-policy-statement-july-2019 [Accessed 13.07.2021]
12 Producer responsibility regulations, (updated 16 February 2021), [online: www. gov.uk]. Available at: https://www.gov.uk/government/collections/producer-responsibility-regulations [Accessed 13.07.2021]
13 Dispose of business or commercial waste, (updated 16 February 2021), [online: www.gov.uk]. Available at: https://www.gov.uk/managing-your-waste-an-overview [Accessed 13.07.2021]
Currently, producers only pay for around 10% of the costs of disposing of their products. The Government is currently considering introducing an Extended Producer Responsibility (EPR) scheme in 2023 that will see producers take responsibility for 100% of the costs of managing, recycling, and disposal of their packaging waste, with higher fees being levied if packaging is harder to reuse or recycle.11
Current EPR guidelines state that packaging producers who have a turnover exceeding £2 million must register and meet their waste packaging recycling and recovery responsibilities which help to:
• Reduce the amount of packaging produced in the first place
• Reduce how much packaging waste goes to landfill
• Increase the amount of packaging waste that’s recycled and recovered12
These are in addition to waste duty of care rules all businesses must follow which include methods to:
• Keep waste to a minimum by doing everything you reasonably can to prevent, reuse, recycle or recover waste (in that order)
• Sort and store waste safely and securely
• Complete a waste transfer note for each load of waste that leaves your premises
• Check if your waste carrier is registered to dispose of waste
• Not allow the waste carrier to dispose of your waste illegally (and report them to Crimestoppers if this is the case)13
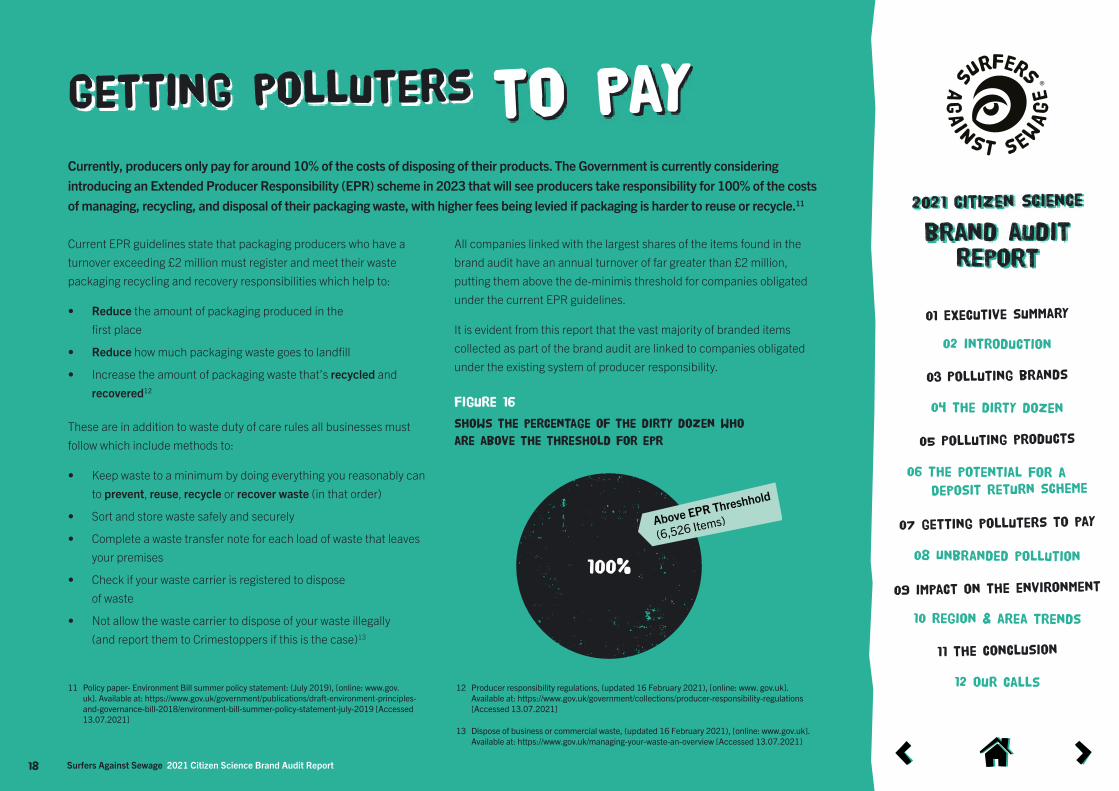
All companies linked with the largest shares of the items found in the brand audit have an annual turnover of far greater than £2 million, putting them above the de-minimis threshold for companies obligated under the current EPR guidelines.
It is evident from this report that the vast majority of branded items collected as part of the brand audit are linked to companies obligated under the existing system of producer responsibility.
Getting polluters to pay
figure 16
shows the percentage of the dirty dozen who
are above the threshold for epr
100%
Above EPR Threshhold
(6,526 Items)
2021 citizen science
brand auditreport
01 Executive summary
03 Polluting brands
11 the conclusion
05 Polluting products
09 impact on the environment
07 getting polluters to pay
02 introduction
04 the dirty dozen
08 Unbranded pollution
10 region & area trends
12 our calls
06 The potential for a
Deposit return scheme
19 Surfers Against Sewage 2021 Citizen Science Brand Audit Report
GETTING POLLUTERS TO PAY
14 Mondelez Revenue 2006-2021 | MDLZ, (2021), [online: www.macrotrends.net] Available at: https://www.macrotrends.net/stocks/charts/MDLZ/mondelez/revenue [Accessed 12.07.21]. Heineken N V reports 2020 full year results and shares updates on EverGreen strategic review, (2021) [online: www.globenewswire.com] Available at: https://www.globenewswire.com/news-release/2021/02/10/2172786/0/en/ Heineken-N-V-reports[…]ults-and-shares-updates-on-EverGreen-strategic-review. html [Accessed 12.07.21]. Tesco Net Income 2006- 2021 | TSCDY, (2021), [online: www.macrotrends.net] Available at: https://www.macrotrends.net/stocks/charts/ TSCDY/tesco/net-income [Accessed 12.07.21]. Global net revenue of Carlsberg from 2012 to 2020, (2021), [online: www.statista.com] Available at: https://www.statista. com/statistics/741358/carlsberg-net-revenue-worldwide/ [Accessed 12.07.21]. Suntory Holdings Limited Summary on FY2020
Earnings, (February 12, 2021), [online: www.suntory.com] Available at: https://www.suntory.com/about/financial/pdf/ comment_202012.pdf [Accessed 12.07.21]. HARIBO GmbH & Co. KG, (2021) ,[online: www.dnb.com] Available at: https://www.dnb.com/business-directory/company-profiles.haribo_gmbh__co_kg.113844e45499ea6f73c7df909b32db62.html [Accessed 12.07.21]. Net sales of the leading confectionery companies worldwide in 2020, (2021),[online: www.statista.com] Available at: https://www.statista.com/ statistics/252097/net-sales-of-the-leading-10-confectionery-companies-worldwide/ [Accessed 12.07.21]. Full Year Results (2021), [online: www.Nestlé.com] Available at: https://www.Nestlé.com/media/pressreleases/allpressreleases/full-year-results-2020 [Accessed 12.07.21]
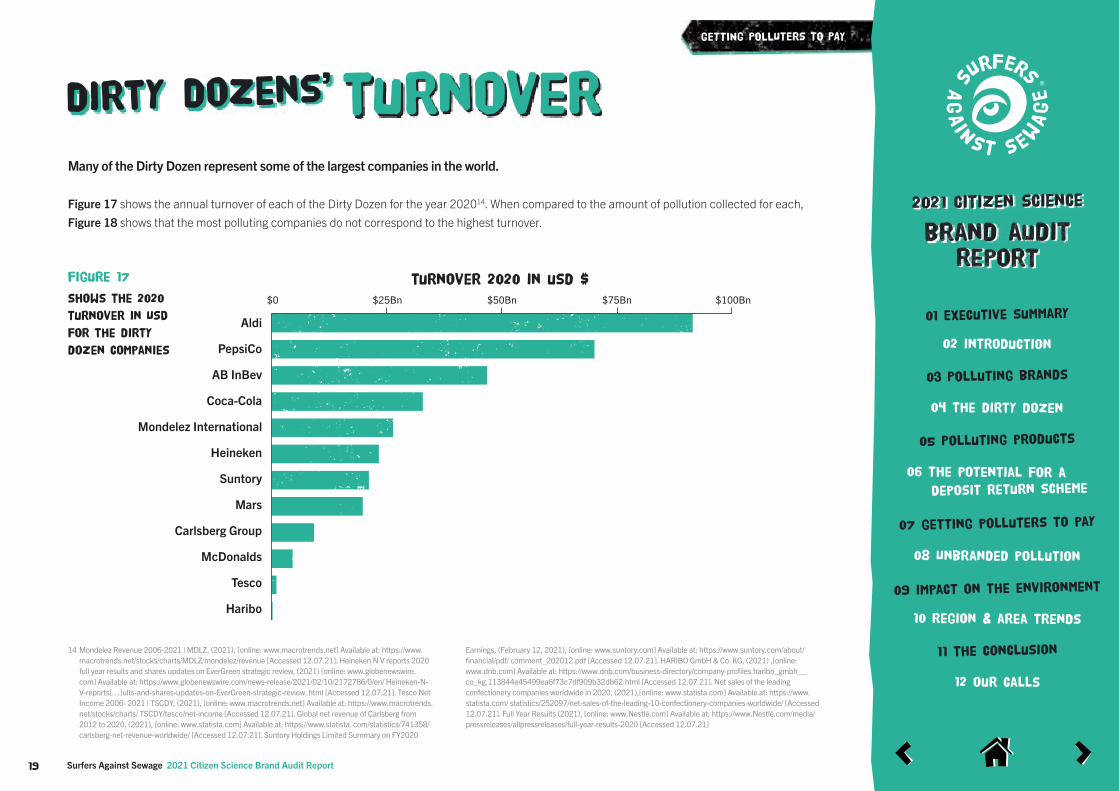
Many of the Dirty Dozen represent some of the largest companies in the world.
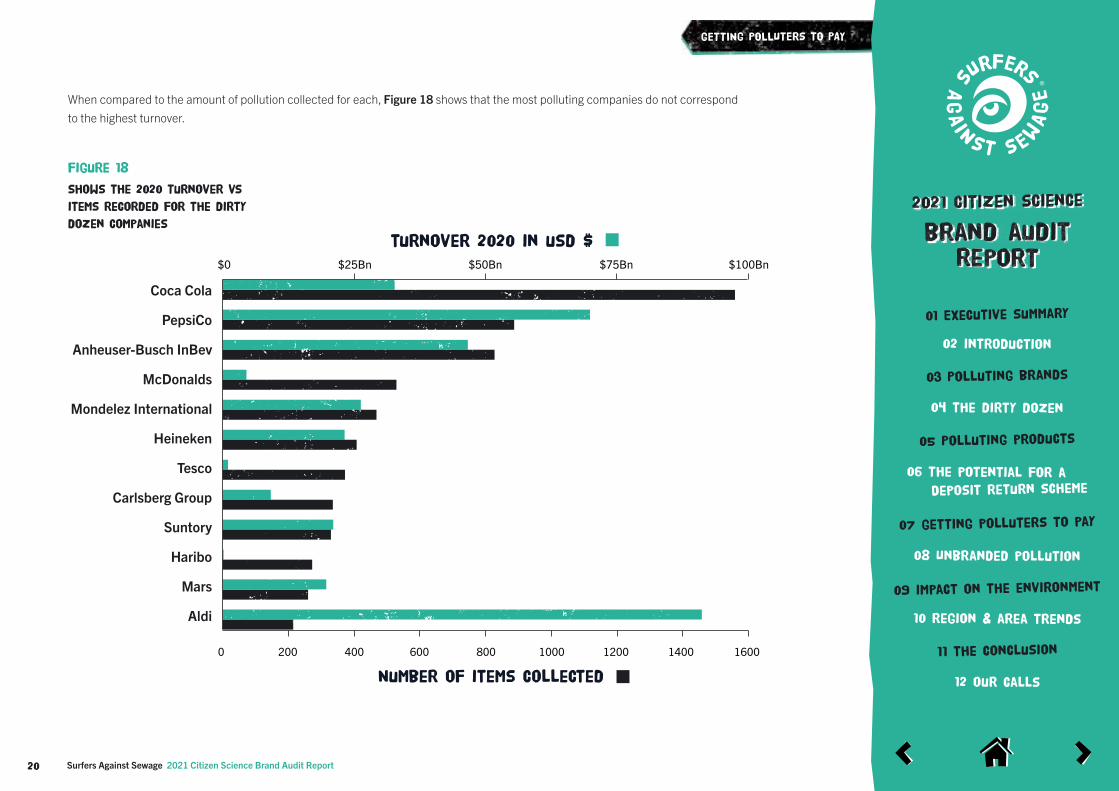
Figure 17 shows the annual turnover of each of the Dirty Dozen for the year 202014. When compared to the amount of pollution collected for each, Figure 18 shows that the most polluting companies do not correspond to the highest turnover.
dirty dozens’ turnover
Aldi
PepsiCo
AB InBev
Coca-Cola
Mondelez International
Heineken
Suntory
Mars
Carlsberg Group
McDonalds
Tesco
Haribo
turnover 2020 in usd $$0 $25Bn $50Bn $75Bn $100Bn
figure 17
shows the 2020
Turnover in USD
for the dirty
dozen companies
2021 citizen science
brand auditreport
01 Executive summary
03 Polluting brands
11 the conclusion
05 Polluting products
09 impact on the environment
07 getting polluters to pay
02 introduction
04 the dirty dozen
08 Unbranded pollution
10 region & area trends
12 our calls
06 The potential for a
Deposit return scheme
20 Surfers Against Sewage 2021 Citizen Science Brand Audit Report
GETTING POLLUTERS TO PAY
When compared to the amount of pollution collected for each, Figure 18 shows that the most polluting companies do not correspond to the highest turnover.
figure 18
shows the 2020 Turnover vs
items recorded for the dirty
dozen companies
Coca Cola
PepsiCo
Anheuser-Busch InBev
McDonalds
Mondelez International
Heineken
Tesco
Carlsberg Group
Suntory
Haribo
Mars
Aldi
$0 $25Bn $50Bn $75Bn $100Bn
turnover 2020 in usd $
Number of items collected
0 200 400 600 800 1000 1200 1400 1600
2021 citizen science
brand auditreport
01 Executive summary
03 Polluting brands
11 the conclusion
05 Polluting products
09 impact on the environment
07 getting polluters to pay
02 introduction
04 the dirty dozen
08 Unbranded pollution
10 region & area trends
12 our calls
06 The potential for a
Deposit return scheme
21 Surfers Against Sewage 2021 Citizen Science Brand Audit Report
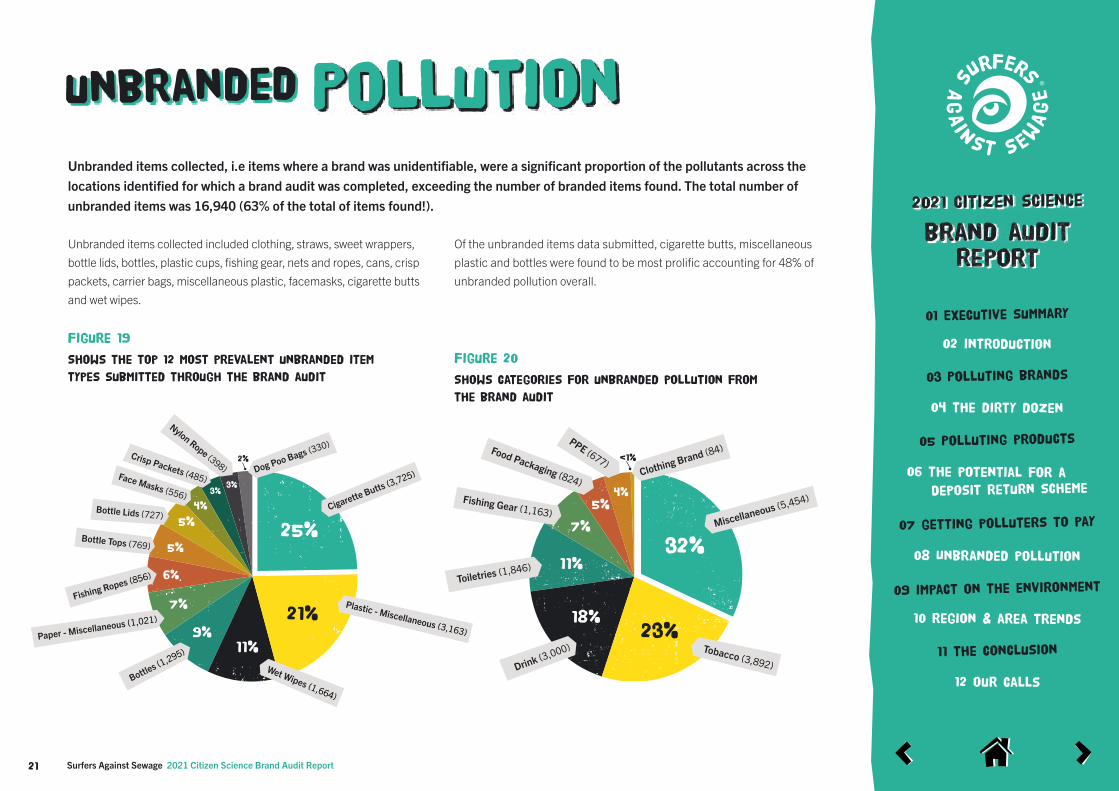
Unbranded items collected, i.e items where a brand was unidentifiable, were a significant proportion of the pollutants across the locations identified for which a brand audit was completed, exceeding the number of branded items found. The total number of unbranded items was 16,940 (63% of the total of items found!).
Unbranded items collected included clothing, straws, sweet wrappers, bottle lids, bottles, plastic cups, fishing gear, nets and ropes, cans, crisp packets, carrier bags, miscellaneous plastic, facemasks, cigarette butts and wet wipes.
Of the unbranded items data submitted, cigarette butts, miscellaneous plastic and bottles were found to be most prolific accounting for 48% of unbranded pollution overall.
Figure 19
Shows the top 12 most prevalent unbranded item
types submitted through the brand audit
unbranded Pollution
<1%
Clothing Brand (84)Food Packaging (824)
PPE (677)
Drink (3,000)
Miscellaneous (5,454)
Tobacco (3,892)
Toiletries (1,846)
Fishing Gear (1,163)
32%
23%18%
11%
7%
5%4%
Cigarette Butts (3,725)
25%
21%
11%9%
7%
6%
5%
5%
4%
3%3%
2%
Dog Poo Bags (330)
Plastic - Miscellaneous (3,163)
Wet Wipes (1,664)
Bottles (1,295)
Fishing Ropes (856)
Bottle Tops (769)
Nylon Rope (398)
Bottle Lids (727)
Face Masks (556)
Crisp Packets (485)
Paper - Miscellaneous (1,021)
Figure 20
Shows categories for unbranded pollution from
the brand audit
EXECUTIVE SUMMARY
2021 citizen science
brand auditreport
01 Executive summary
03 Polluting brands
11 the conclusion
05 Polluting products
09 impact on the environment
07 getting polluters to pay
02 introduction
04 the dirty dozen
08 Unbranded pollution
10 region & area trends
12 our calls
06 The potential for a
Deposit return scheme
Surfers Against Sewage 2021 Citizen Science Brand Audit Report22
UNBRANDED POLLUTION
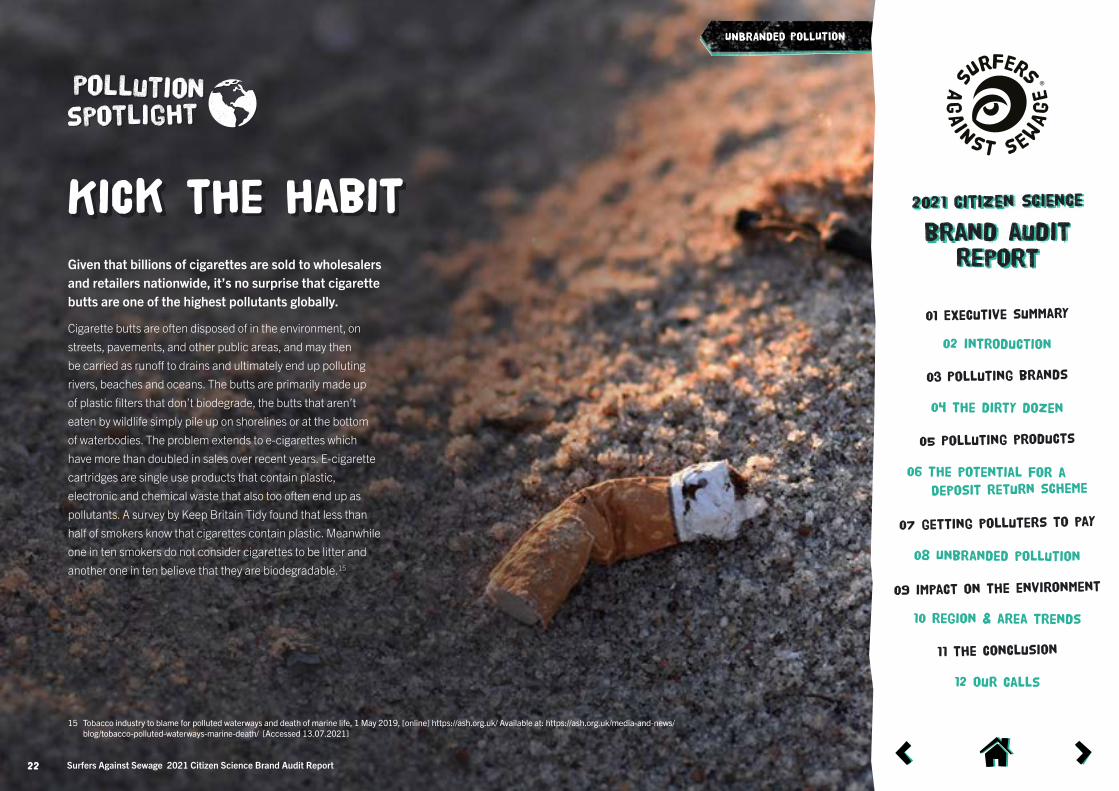
Kick the habitGiven that billions of cigarettes are sold to wholesalers and retailers nationwide, it’s no surprise that cigarette butts are one of the highest pollutants globally.
Cigarette butts are often disposed of in the environment, on streets, pavements, and other public areas, and may then be carried as runoff to drains and ultimately end up polluting rivers, beaches and oceans. The butts are primarily made up of plastic filters that don’t biodegrade, the butts that aren’t eaten by wildlife simply pile up on shorelines or at the bottom of waterbodies. The problem extends to e-cigarettes which have more than doubled in sales over recent years. E-cigarette cartridges are single use products that contain plastic, electronic and chemical waste that also too often end up as pollutants. A survey by Keep Britain Tidy found that less than half of smokers know that cigarettes contain plastic. Meanwhile one in ten smokers do not consider cigarettes to be litter and another one in ten believe that they are biodegradable.15
15 Tobacco industry to blame for polluted waterways and death of marine life, 1 May 2019, [online] https://ash.org.uk/ Available at: https://ash.org.uk/media-and-news/blog/tobacco-polluted-waterways-marine-death/ [Accessed 13.07.2021]

2021 citizen science
brand auditreport
01 Executive summary
03 Polluting brands
11 the conclusion
05 Polluting products
09 impact on the environment
07 getting polluters to pay
02 introduction
04 the dirty dozen
08 Unbranded pollution
10 region & area trends
12 our calls
06 The potential for a
Deposit return scheme
23 Surfers Against Sewage 2021 Citizen Science Brand Audit Report
When looking at branded and unbranded pollution as a whole, Figure 21 shows how it is distributed across parent categories.
Figure 21
Shows parent categories for unbranded and branded
pollution from the brand audit
<1%
Clothing Brand / Clothing (99)
Tobacco Product (4,215) Food & Drink (12,291)
Miscellaneous (6,709)
Health & Medical (2,594)
Store Brand (1,030)
46%
25%
16%
10%4%
UNBRANDED POLLUTION
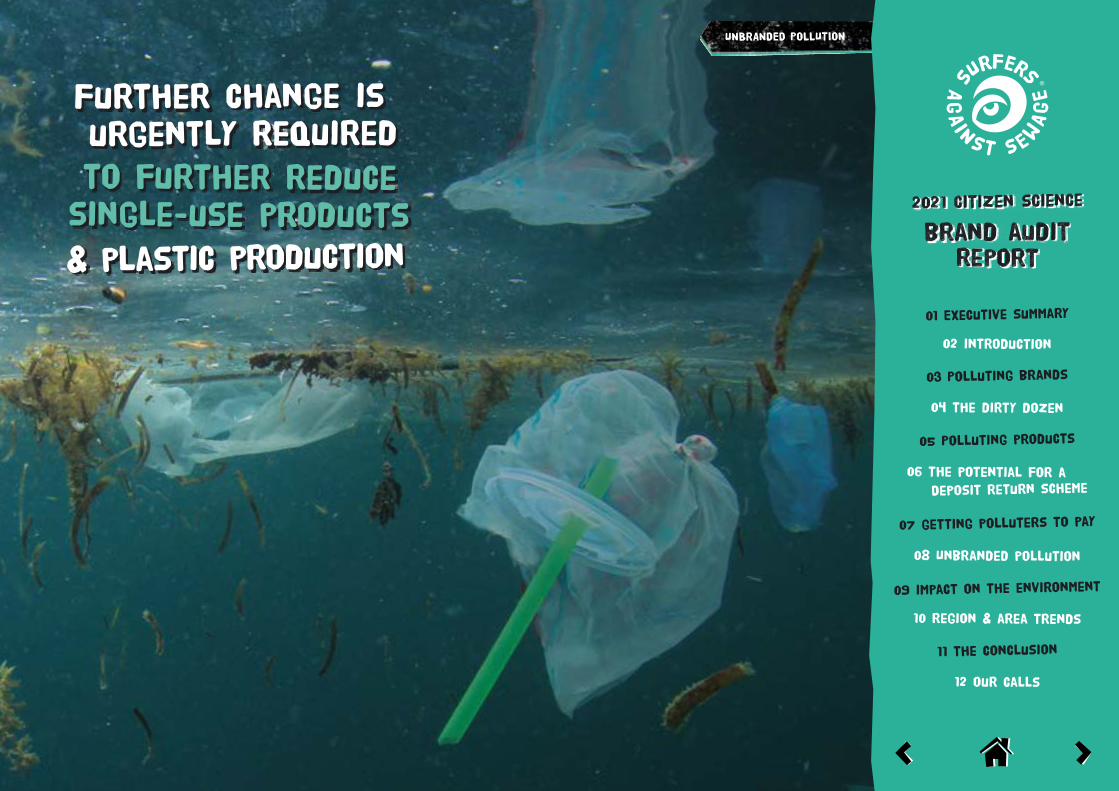
Steps have been taken to address single-use and pointless plastic over the last few years.
Bans have been introduced on microbeads; charges put in place on plastic bags have seen supermarket sales of single-use plastic bags by 95%; and most recently sale and supply of plastic straws, stirrers and cotton buds has been prohibited.16 So why can’t more be done? Further change is urgently required to further reduce single-use products and plastic production, models of reuse need to be adopted; and more of what is used needs to be effectively recyclable. Across Europe, more action is being taken on single-use plastics through the Single Use Plastics Directive which came into force in July 2021, and Wales and Scotland are taking the lead in the UK in adopting progressive policies that tackle single use. England risks being left behind if it does not take decisive action in adopting more progressive single use plastic policies.
happen now?what needs to
16 Consultations launched for major waste sector reforms, Defra Press Office, (25 March 2021) [online: deframedia.blog.gov.uk] Available at: deframedia.blog.gov. uk/2021/03/25/consultations-launched-for-major-waste-sector-reforms/ [Accessed 13.07.2021]
2021 citizen science
brand auditreport
01 Executive summary
03 Polluting brands
11 the conclusion
05 Polluting products
09 impact on the environment
07 getting polluters to pay
02 introduction
04 the dirty dozen
08 Unbranded pollution
10 region & area trends
12 our calls
06 The potential for a
Deposit return scheme
24 Surfers Against Sewage 2021 Citizen Science Brand Audit Report
Further change is urgently required
& plastic production
to further reduce single-use products
UNBRANDED POLLUTION
impact on the
Environment
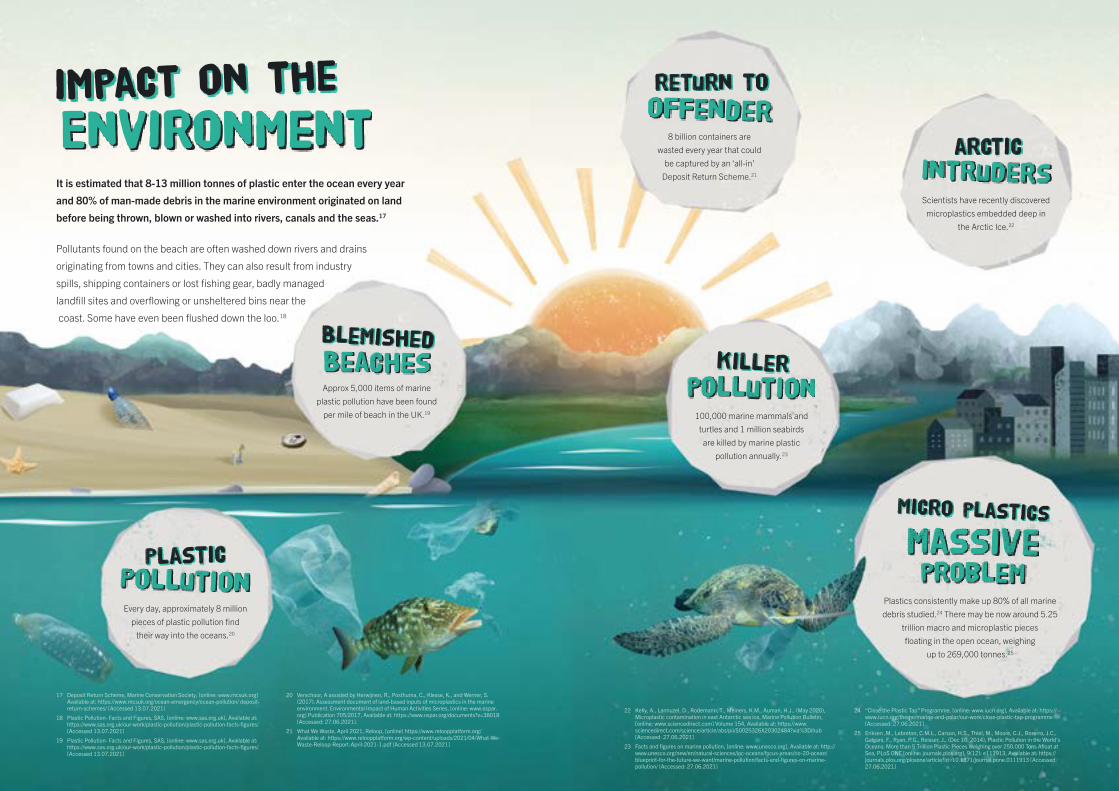
PlasticPollution
Every day, approximately 8 million pieces of plastic pollution find
their way into the oceans.20
return tooffender
8 billion containers are wasted every year that could
be captured by an ‘all-in’ Deposit Return Scheme.21
BlemishedBeachesApprox 5,000 items of marine
plastic pollution have been found per mile of beach in the UK.19
killerpollution
100,000 marine mammals and turtles and 1 million seabirds
are killed by marine plastic pollution annually.23
micro plastics
massive problem
Plastics consistently make up 80% of all marine debris studied.24 There may be now around 5.25
trillion macro and microplastic pieces floating in the open ocean, weighing
up to 269,000 tonnes.25
arcticintrudersScientists have recently discovered
microplastics embedded deep in the Arctic Ice.22
It is estimated that 8-13 million tonnes of plastic enter the ocean every year
and 80% of man-made debris in the marine environment originated on land
before being thrown, blown or washed into rivers, canals and the seas.17
Pollutants found on the beach are often washed down rivers and drains
originating from towns and cities. They can also result from industry
spills, shipping containers or lost fishing gear, badly managed
landfill sites and overflowing or unsheltered bins near the
coast. Some have even been flushed down the loo.18
22 Kelly, A., Lannuzel, D., Rodemann, T., Meiners, K.M., Auman, H.J., (May 2020), Microplastic contamination in east Antarctic sea ice, Marine Pollution Bulletin, [online: www.sciencedirect.com] Volume 154, Available at: https://www.sciencedirect.com/science/article/abs/pii/S0025326X20302484?via%3Dihub [Accessed: 27.06.2021]
23 Facts and figures on marine pollution, [online: www.unesco.org], Available at: http://www.unesco.org/new/en/natural-sciences/ioc-oceans/focus-areas/rio-20-ocean/blueprint-for-the-future-we-want/marine-pollution/facts-and-figures-on-marine-pollution/ [Accessed: 27.06.2021]
24 “Close the Plastic Tap” Programme, [online: www.iucn.org], Available at: https://www.iucn.org/theme/marine-and-polar/our-work/close-plastic-tap-programme [Accessed: 27.06.2021]
25 Eriksen ,M., Lebreton, C.M.L., Carson, H.S., Thiel, M., Moore, C.J., Borerro, J.C., Galgani, F., Ryan, P.G., Reisser, J., (Dec 10, 2014), Plastic Pollution in the World’s Oceans: More than 5 Trillion Plastic Pieces Weighing over 250,000 Tons Afloat at Sea, PLoS ONE [online: journals.plos.org], 9(12): e111913, Available at: https://journals.plos.org/plosone/article?id=10.1371/journal.pone.0111913 [Accessed: 27.06.2021]
17 Deposit Return Scheme, Marine Conservation Society, [online: www.mcsuk.org] Available at: https://www.mcsuk.org/ocean-emergency/ocean-pollution/ deposit-return-schemes/ [Accessed 13.07.2021]
18 Plastic Pollution- Facts and Figures, SAS, [online: www.sas.org.uk], Available at: https://www.sas.org.uk/our-work/plastic-pollution/plastic-pollution-facts-figures/ [Accessed 13.07.2021]
19 Plastic Pollution- Facts and Figures, SAS, [online: www.sas.org.uk], Available at: https://www.sas.org.uk/our-work/plastic-pollution/plastic-pollution-facts-figures/ [Accessed 13.07.2021]
20 Verschoor, A assisted by Herwijnen, R., Posthuma, C., Klesse, K., and Werner, S. (2017). Assessment document of land-based inputs of microplastics in the marine environment. Environmental Impact of Human Activities Series, [online: www.ospar.org] Publication 705/2017, Available at: https://www.ospar.org/documents?v=38018 [Accessed: 27.06.2021].
21 What We Waste, April 2021, Reloop, [online] https://www.reloopplatform.org/ Available at: https://www.reloopplatform.org/wp-content/uploads/2021/04/What-We-Waste-Reloop-Report-April-2021-1.pdf [Accessed 13.07.2021]
2021 citizen science
brand auditreport
01 Executive summary
03 Polluting brands
11 the conclusion
05 Polluting products
09 impact on the environment
07 getting polluters to pay
02 introduction
04 the dirty dozen
08 Unbranded pollution
10 region & area trends
12 our calls
06 The potential for a
Deposit return scheme
26 Surfers Against Sewage 2021 Citizen Science Brand Audit Report
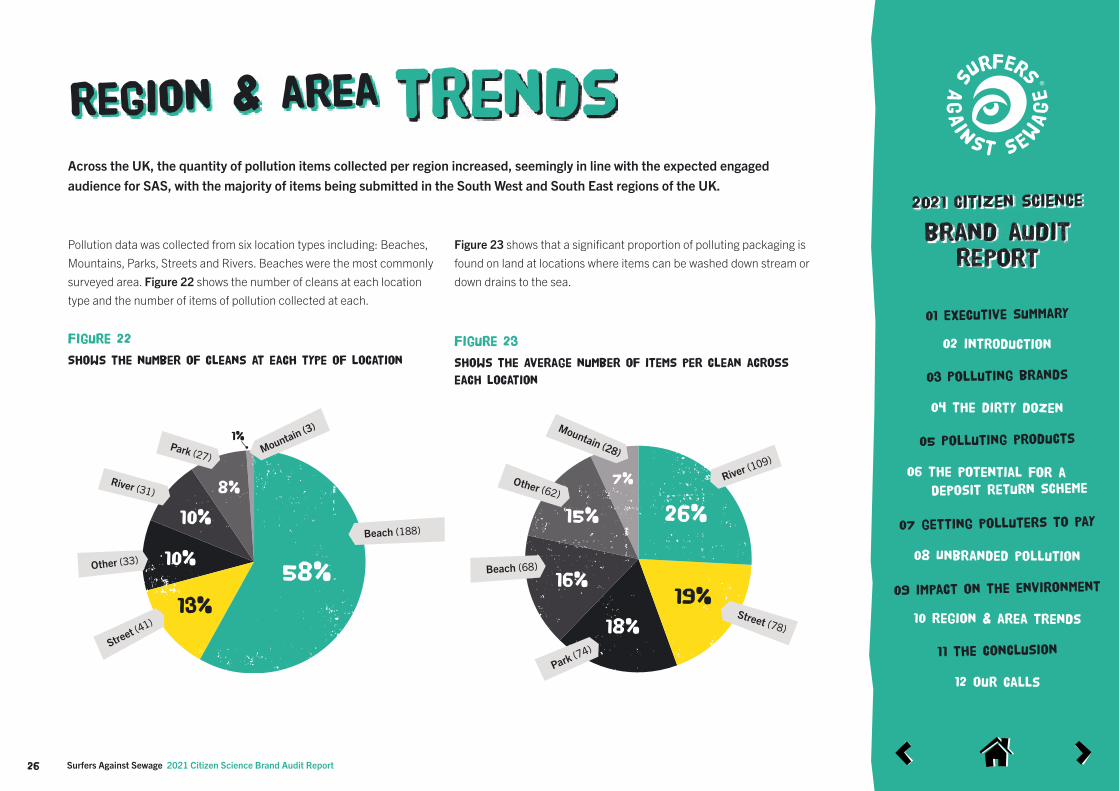
Across the UK, the quantity of pollution items collected per region increased, seemingly in line with the expected engaged audience for SAS, with the majority of items being submitted in the South West and South East regions of the UK.
Pollution data was collected from six location types including: Beaches, Mountains, Parks, Streets and Rivers. Beaches were the most commonly surveyed area. Figure 22 shows the number of cleans at each location type and the number of items of pollution collected at each.
Figure 22
Shows the number of cleans at each type of location
region & area trends
Mountain (3)
Park (27)
River (31)
Street (41)
Beach (188)
Other (33)
58%
13%
10%
10%
8%
1%
Figure 23 shows that a significant proportion of polluting packaging is found on land at locations where items can be washed down stream or down drains to the sea.
Figure 23
Shows the Average number of items per clean across
each location
Mountain (28)
Park (74)
River (109)
Street (78)
Beach (68)
Other (62)
26%
19%
18%
16%
15%
7%
2021 citizen science
brand auditreport
01 Executive summary
03 Polluting brands
11 the conclusion
05 Polluting products
09 impact on the environment
07 getting polluters to pay
02 introduction
04 the dirty dozen
08 Unbranded pollution
10 region & area trends
12 our calls
06 The potential for a
Deposit return scheme
27 Surfers Against Sewage 2021 Citizen Science Brand Audit Report
REGION & AREA TRENDS
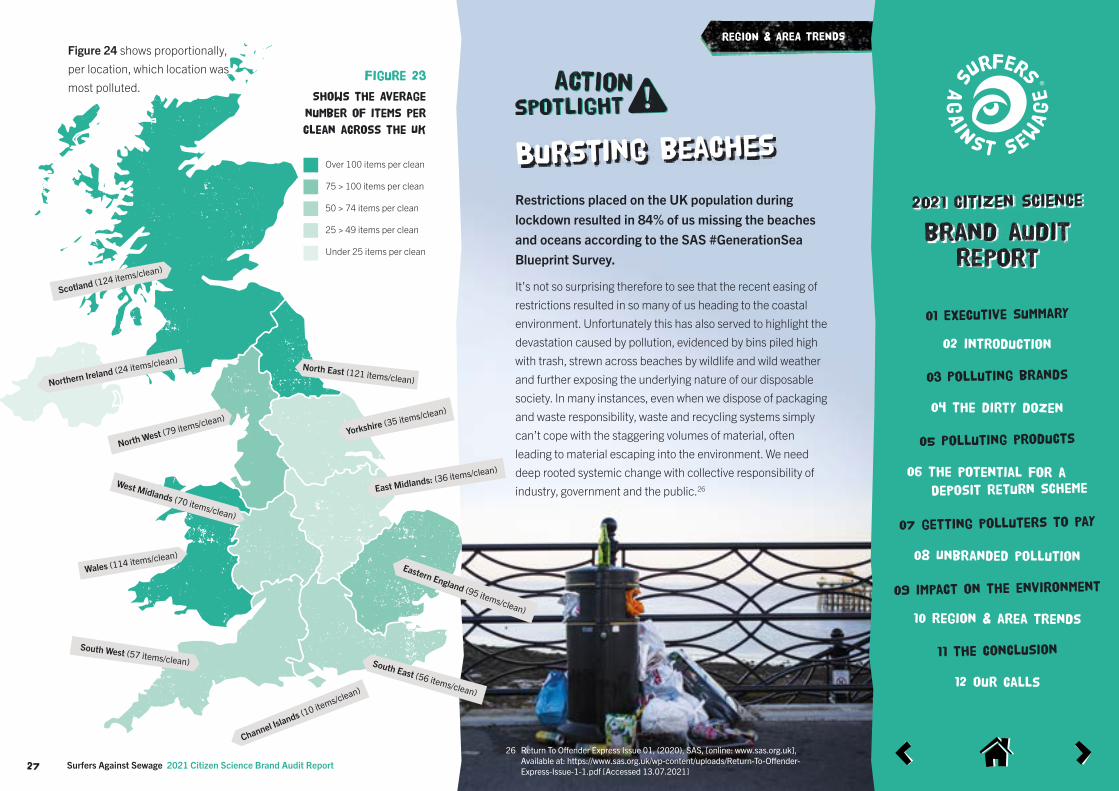
Restrictions placed on the UK population during lockdown resulted in 84% of us missing the beaches and oceans according to the SAS #GenerationSea Blueprint Survey.
It’s not so surprising therefore to see that the recent easing of restrictions resulted in so many of us heading to the coastal environment. Unfortunately this has also served to highlight the devastation caused by pollution, evidenced by bins piled high with trash, strewn across beaches by wildlife and wild weather and further exposing the underlying nature of our disposable society. In many instances, even when we dispose of packaging and waste responsibility, waste and recycling systems simply can’t cope with the staggering volumes of material, often leading to material escaping into the environment. We need deep rooted systemic change with collective responsibility of industry, government and the public.26
Bursting beaches
26 Return To Offender Express Issue 01, (2020), SAS, [online: www.sas.org.uk], Available at: https://www.sas.org.uk/wp-content/uploads/Return-To-Offender-Express-Issue-1-1.pdf [Accessed 13.07.2021]
South East (56 items/clean)
South West (57 items/clean)
North East (121 items/clean)
North West (79 items/clean)Yorkshire (35 items/clean)
West Midlands (70 items/clean)
Northern Ireland (24 items/clean)
Scotland (124 items/clean)
Channel Islands (10 items/clean)
Wales (114 items/clean)
East Midlands: (36 items/clean)
Eastern England (95 items/clean)
Figure 24 shows proportionally, per location, which location was most polluted.
Figure 23
Shows the Average
number of items per
clean across the UK
Over 100 items per clean
25 > 49 items per clean
75 > 100 items per clean
Under 25 items per clean
50 > 74 items per clean
2021 citizen science
brand auditreport
01 Executive summary
03 Polluting brands
11 the conclusion
05 Polluting products
09 impact on the environment
07 getting polluters to pay
02 introduction
04 the dirty dozen
08 Unbranded pollution
10 region & area trends
12 our calls
06 The potential for a
Deposit return scheme
28 Surfers Against Sewage 2021 Citizen Science Brand Audit Report
The findings presented in this report clearly highlight the systemic problem the UK faces in regards to plastic and packaging pollution. Brands, wider businesses and the government are still not doing enough to reduce packaging, switch to reuse models and enable recycling. Research on more environmentally friendly alternatives to plastic and glass bottles is progressing rapidly for a range of beverage types. Seemingly the government and producers are simply struggling to keep up in the work to mitigate the environmental harm caused by such plastic pollution.
Turning off the Tap
Despite the continued promises and commitments, we are still seeing staggering volumes of plastic and packaging pollution on beaches, rivers, streets and countryside. There is little change on the most polluting companies year on year with Coca-Cola and Pepsi-Co once again filling the top two spots on the Dirty Dozen leaderboard.
It is clear that the COVID-19 pandemic has had an impact this year with brands most associated with consumption of alcohol in outdoor recreational spaces particular influencing what is found in the environment. Whilst we have seen considerable attention on PPE in the last year, the evidence of this brand audit shows that, whilst an emerging pollution threat, by far the most plastic and packaging pollution is coming from big multinational companies. It is critical that the spotlight continue to shine a light on the pollution habits of companies and that the issue of newly visible polluting products isn’t used to deflect this attention or assign blame to individuals alone.
Reforming our Recycling & Waste System
Our recycling and waste systems simply can’t cope with the sheer scale of the pollution crisis we face and needs reform. The government has proposed a package of policies that, if designed well together, has the potential to overhaul how waste is managed.
In 2022, a tax will be introduced on all packaging that is not made of at least 30% recycled content. As has been highlighted in chapter 6, proposals are also being consulted on to introduce an extended producer responsibility scheme and implement a deposit return scheme (DRS) for drinks containers.
Alongside changes to create a more consistent collection system, these policies will fundamentally shift the burden of waste and its costs from the public to the companies who produce polluting products.
The findings of this brand audit show that the introduction of an ‘all-in’ DRS could have a significant impact in preventing a considerable amount of pollution in the environment.
Of the items monitored from this year’s dirty dozen, it is estimated that a massive 52% could be captured through a well designed ‘all-in’ DRS including a wide range of materials.
the Conclusion
2021 citizen science
brand auditreport
01 Executive summary
03 Polluting brands
11 the conclusion
05 Polluting products
09 impact on the environment
07 getting polluters to pay
02 introduction
04 the dirty dozen
08 Unbranded pollution
10 region & area trends
12 our calls
06 The potential for a
Deposit return scheme
29 Surfers Against Sewage 2021 Citizen Science Brand Audit Report
THE CONCLUSION
27 recycle-recover-reuse-an-update-on-our-ambition-for-a-sustainable-future, (2020), [online: www.coca-cola.co.uk], Available at: https://www.coca-cola.co.uk/sustainability/sustainability-in-great-britain/recycle-recover-reuse-an-update-on-our-ambition-for-a-sustainable-future [Accessed 12.07.21].
28 We Need an All-In Deposit Return Scheme Now, (2021), [online: www.sas.org.uk] Available at: https://www.sas.org.uk/depositreturnscheme/ [Accessed: 11.07.21]
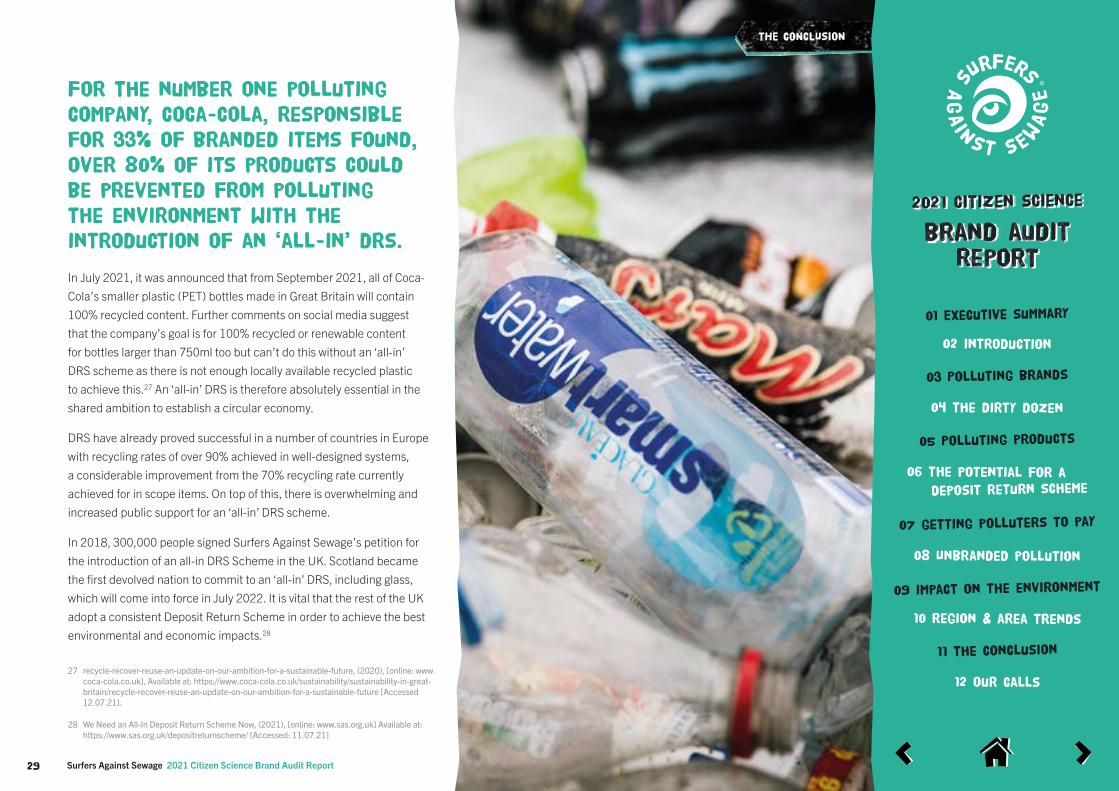
For the number one polluting company, coca-cola, responsible for 33% of branded items found, over 80% of its products could be prevented from polluting the environment with the introduction of an ‘all-in’ drs.
In July 2021, it was announced that from September 2021, all of Coca-Cola’s smaller plastic (PET) bottles made in Great Britain will contain 100% recycled content. Further comments on social media suggest that the company’s goal is for 100% recycled or renewable content for bottles larger than 750ml too but can’t do this without an ‘all-in’ DRS scheme as there is not enough locally available recycled plastic to achieve this.27 An ‘all-in’ DRS is therefore absolutely essential in the shared ambition to establish a circular economy.
DRS have already proved successful in a number of countries in Europe with recycling rates of over 90% achieved in well-designed systems, a considerable improvement from the 70% recycling rate currently achieved for in scope items. On top of this, there is overwhelming and increased public support for an ‘all-in’ DRS scheme.
In 2018, 300,000 people signed Surfers Against Sewage’s petition for the introduction of an all-in DRS Scheme in the UK. Scotland became the first devolved nation to commit to an ‘all-in’ DRS, including glass, which will come into force in July 2022. It is vital that the rest of the UK adopt a consistent Deposit Return Scheme in order to achieve the best environmental and economic impacts.28
2021 citizen science
brand auditreport
01 Executive summary
03 Polluting brands
11 the conclusion
05 Polluting products
09 impact on the environment
07 getting polluters to pay
02 introduction
04 the dirty dozen
08 Unbranded pollution
10 region & area trends
12 our calls
06 The potential for a
Deposit return scheme
30 Surfers Against Sewage 2021 Citizen Science Brand Audit Report
THE CONCLUSION
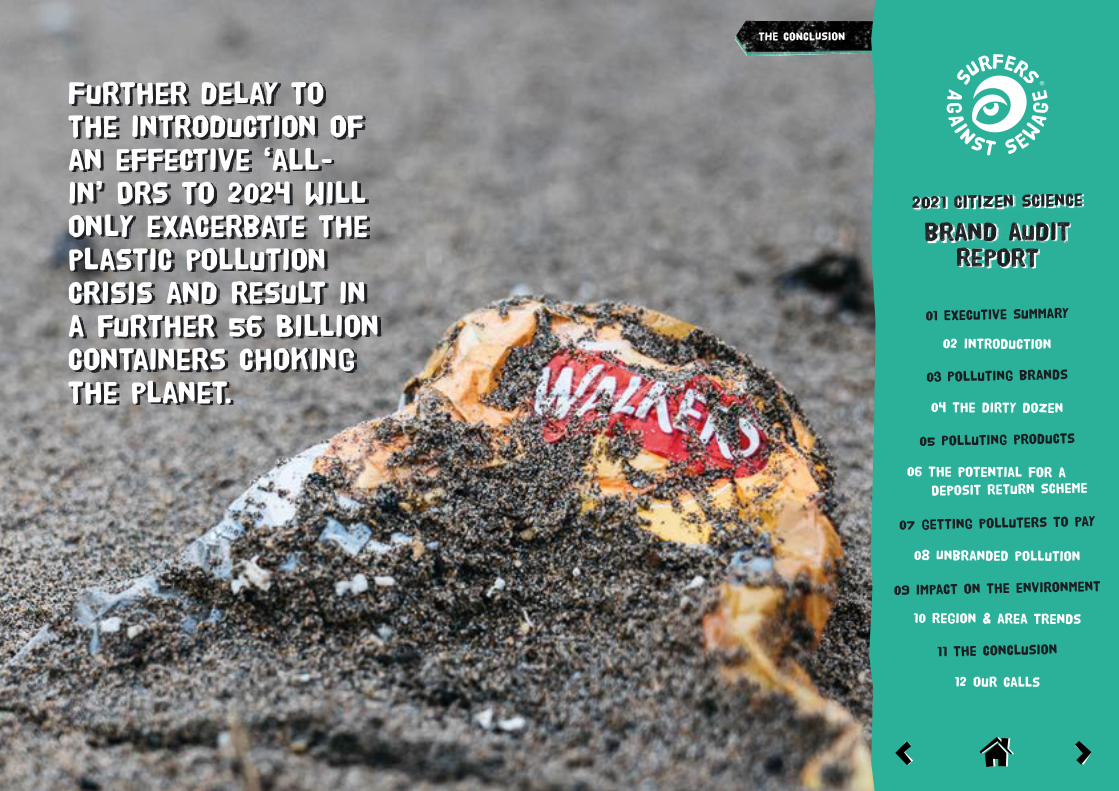
Further delay to the introduction of an effective ‘all-in’ DRS to 2024 will only exacerbate the plastic pollution crisis and result in a further 56 Billion containers choking the planet.
2021 citizen science
brand auditreport
01 Executive summary
03 Polluting brands
11 the conclusion
05 Polluting products
09 impact on the environment
07 getting polluters to pay
02 introduction
04 the dirty dozen
08 Unbranded pollution
10 region & area trends
12 our calls
06 The potential for a
Deposit return scheme
31
29 Tobacco industry to blame for polluted waterways and death of marine life, (1 May 2019), [online: https://ash.org.uk/], Available at: https://ash.org.uk/media-and-news/blog/tobacco-polluted-waterways-marine-death/ [Accessed 13.07.2021]
30, 31 Government explores next step to clean up tobacco litter in England- Press Release, DEFRA, Rebecca Pow MP and Jo Churchill MP, (30 March 2021), [online: www.gov.uk] Available at: www.gov.uk/government-explores-next-steps-to-clean-up-tobacco-litter-in-england [Accessed: 13.07.2021]
32 Landmark Reforms to Boost Recycling and Fight Plastic Pollution - Press Release, DEFRA, The Rt Ohn George Eustice MP and Rebecca Powl MP, (24th March 2021). [online: www.gov.uk], Available at: https://www.gov.uk/government/news/landmark-reforms-to-boost-recycling-and-fight-plastic-pollution [Accessed: 13.07.2021]
Addressing Unbranded Items
Unbranded items collected were a significant proportion of the pollutants across the locations identified as part of the Million Mile Clean flagship week, and at 63% of the total, exceeded the number of branded items found! Of the unbranded items, cigarette butts, miscellaneous plastic and bottles were found to be the most prolific, accounting for a massive 48% of unbranded pollution, with cigarette butts accounting for almost half of this, making tobacco products by far the biggest pollutant of unbranded items.
Cigarette butts are found across all beaches and public spaces, with many being washed down street drains into the rivers and oceans. Largely single-use plastic, the filters contain hundreds of toxic chemicals once smoked, persisting in the environment for many years, releasing chemicals to air, land and water and harming plant growth and wildlife.29
The Public Health Minister Jo Churchill acknowledged that although smoking rates were at an all time low, “the environmental impact of smoking due to cigarette butt and package littering is still a major issue”.30
New research published earlier this year
indicates that cleaning up cigarette butts
currently costs local authorities in the UK
around £40 million per year, rising to £46 million
when including those disposed of in public bins.31
The Government has recently announced their intention to explore regulatory options to ensure that the tobacco industry takes financial responsibility for the toxic pollutants resulting from all tobacco products. Supported by the Department of Health and Social Care, Defra is actively exploring the suitability of regulatory options to reduce tobacco litter, working closely with stakeholders and ensuring that policies are developed in accordance with the World Health Organisation Framework Convention on Tobacco Control (FCTC) and its guidelines. No timeframe has yet been provided however, despite the moves to address this type of pollution.
In March this year, Ministers considered extending and legislating for the EPR schemes within the Environment Bill to force the tobacco industry to pay the full costs of disposal of their products or materials placed on the market, including the cigarette butts. Cigarette and tobacco product packaging should to be covered by the reforms to the packaging producer responsibility scheme, which are currently open for consultation.32
Other unbranded items receiving considerable attention over the last 18 months due to the COVID-19 pandemic fell under the PPE product type, although surprisingly this accounted for only 2.5% of all pollution monitored through this year’s brand audit. Clearly an increase in this pollutant is an emerging threat but it remains key that this should not distract from the significant amount of pollution caused by companies and their brands.
What needs to change?
This year’s brand audit shows little change in the companies and brands responsible for the main items found consistently polluting over the past few years. It is crucial that a key focus remains on the meaningful reduction of packaging in addition to the continued adoption of reuse and refill models. This requires companies to adopt different business models that reduce the plastic and packaging, focusing on a model of refill and reuse. Government also needs to adopt policies that actually prevent pollution from entering the ocean including the introduction of an ‘all-in’ DRS now, that captures all sizes of container in a wide range of materials. Continued delay to the introduction of an effective ‘all-in’ DRS to 2024 will only further exacerbate the plastic and packaging pollution crisis and result in a further 56 billion containers including plastic bottles, metal cans and drink cartons choking the planet. It’s not too late to prevent this if the government acts now.
The plastic and packaging pollution crisis still
needs ambitious, urgent and faster action.
THE CONCLUSION
2021 citizen science
brand auditreport
01 Executive summary
03 Polluting brands
11 the conclusion
05 Polluting products
09 impact on the environment
07 getting polluters to pay
02 introduction
04 the dirty dozen
08 Unbranded pollution
10 region & area trends
12 our calls
06 The potential for a
Deposit return scheme
32 Surfers Against Sewage 2021 Citizen Science Brand Audit Report
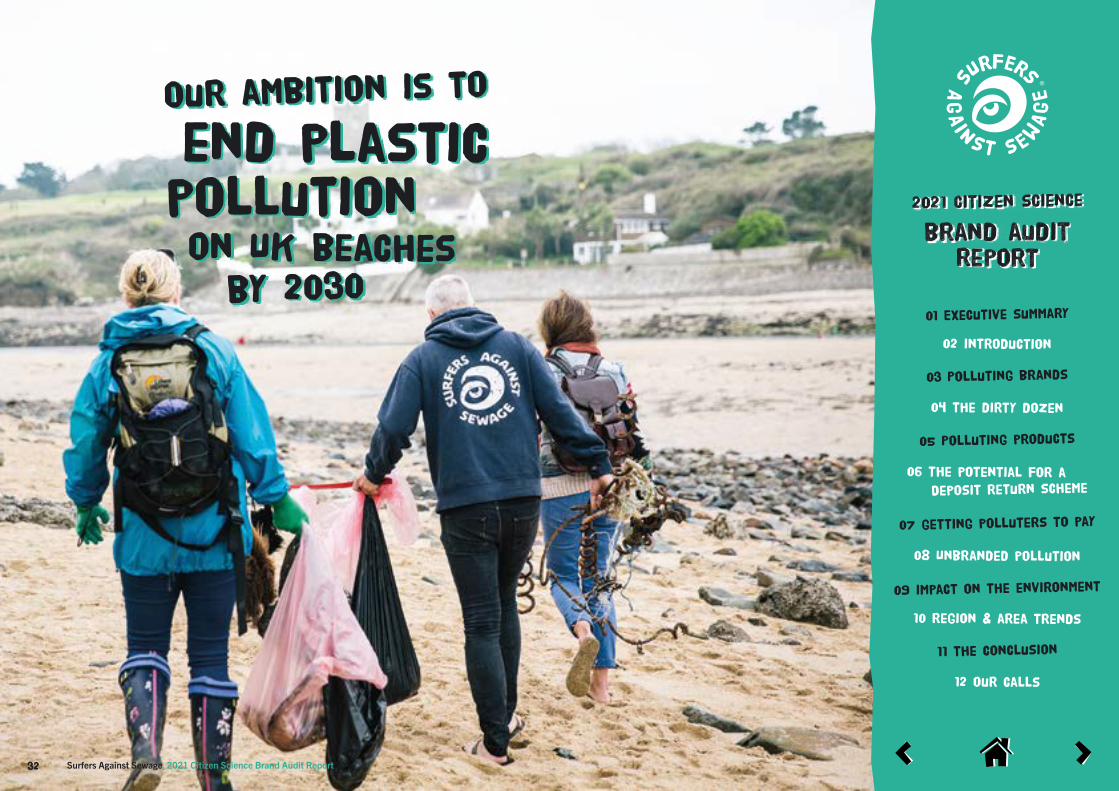
Our ambition is to
by 2030on UK beaches
end plasticpollution
2021 citizen science
brand auditreport
01 Executive summary
03 Polluting brands
11 the conclusion
05 Polluting products
09 impact on the environment
07 getting polluters to pay
02 introduction
04 the dirty dozen
08 Unbranded pollution
10 region & area trends
12 our calls
06 The potential for a
Deposit return scheme
33 Surfers Against Sewage 2021 Citizen Science Brand Audit Report
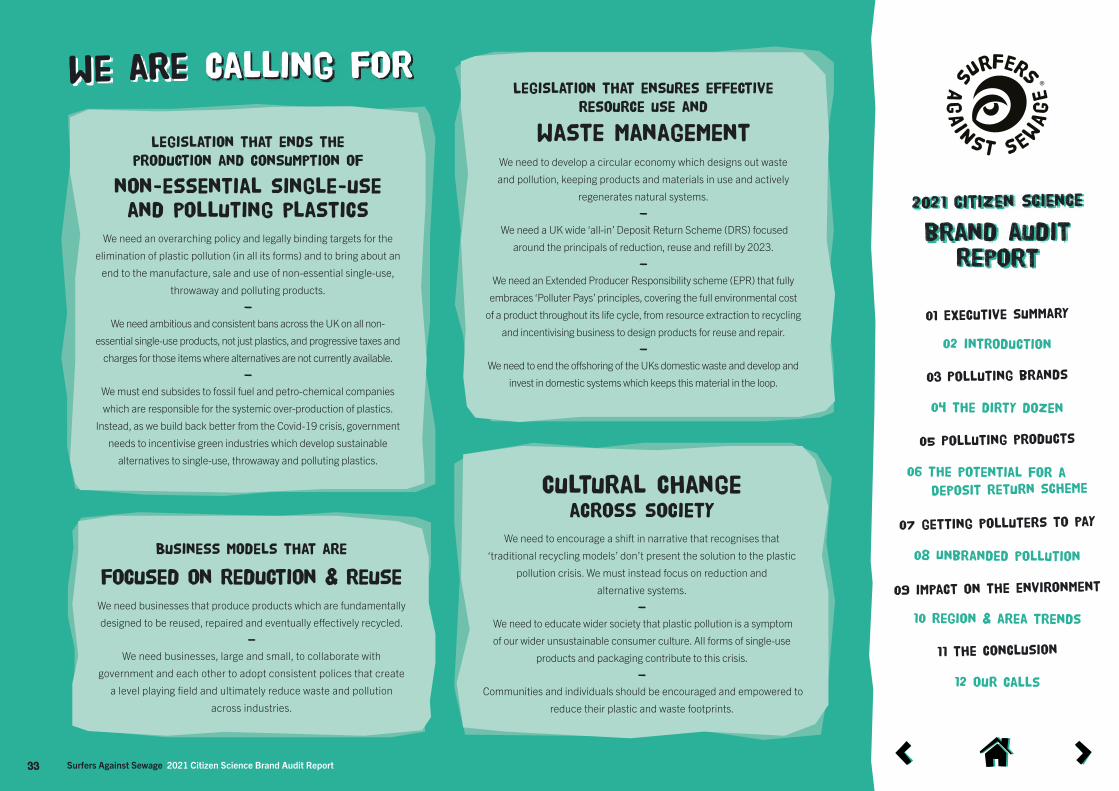
we are calling for
Legislation that ends the
production and consumption of
non-essential single-use and polluting plastics
We need an overarching policy and legally binding targets for the
elimination of plastic pollution (in all its forms) and to bring about an
end to the manufacture, sale and use of non-essential single-use,
throwaway and polluting products.
-
We need ambitious and consistent bans across the UK on all non-
essential single-use products, not just plastics, and progressive taxes and
charges for those items where alternatives are not currently available.
-
We must end subsides to fossil fuel and petro-chemical companies
which are responsible for the systemic over-production of plastics.
Instead, as we build back better from the Covid-19 crisis, government
needs to incentivise green industries which develop sustainable
alternatives to single-use, throwaway and polluting plastics.
Legislation that ensures effective
resource use and
waste managementWe need to develop a circular economy which designs out waste
and pollution, keeping products and materials in use and actively
regenerates natural systems.
-
We need a UK wide ‘all-in’ Deposit Return Scheme (DRS) focused
around the principals of reduction, reuse and refill by 2023.
-
We need an Extended Producer Responsibility scheme (EPR) that fully
embraces ‘Polluter Pays’ principles, covering the full environmental cost
of a product throughout its life cycle, from resource extraction to recycling
and incentivising business to design products for reuse and repair.
-
We need to end the offshoring of the UKs domestic waste and develop and
invest in domestic systems which keeps this material in the loop.
Business models that are
focused on reduction & reuse We need businesses that produce products which are fundamentally
designed to be reused, repaired and eventually effectively recycled.
-
We need businesses, large and small, to collaborate with
government and each other to adopt consistent polices that create
a level playing field and ultimately reduce waste and pollution
across industries.
Cultural Change across society
We need to encourage a shift in narrative that recognises that
‘traditional recycling models’ don’t present the solution to the plastic
pollution crisis. We must instead focus on reduction and
alternative systems.
-
We need to educate wider society that plastic pollution is a symptom
of our wider unsustainable consumer culture. All forms of single-use
products and packaging contribute to this crisis.
-
Communities and individuals should be encouraged and empowered to
reduce their plastic and waste footprints.
brand audit
2021 citizen science
volunteers
thank youthank you
volunteers
2021 citizen science
brand audit

Printed on 100% recycled paper and using vegetable inks for minimum impact on the environment.
COMPANY REGISTERED NUMBER: 02920815 | CHARITY REGISTERED NUMBER: 1145877
Surfers Against Sewage
Unit 2, Wheal Kitty Workshops, St Agnes, TR5 0RD
Email: [email protected] | Telephone: 01872 553 001 | www.sas.org.uk
facebook.com/SurfersAgainstSewage instagram.com/SurfersAgainstSewage twitter.com/sascampaigns


