Embed Size (px)
Citation preview

2018 Budget Page i Table of Contents
Table of ContentsCity Leadership/City CouncilElected Leaders & Key Personnel
Mayor’s Letter
City Organizational ChartExecutive & Legislative Branch
Springs at a Glance
Community Profile
GFOA Award
Strategic PlansCity Strategic PlanPerformance Measures
OverviewsResources and expenditures of all Fundswithin the City’s Budget
General Fund Financial ForecastExpenditure OverviewRevenue OverviewLevel of Effort OverviewEconomic OverviewAll Funds OverviewDebt OverviewGrants OverviewPersonnel Overview
Budget Detail by Appropriating DepartmentGoals and budgets by appropriating departments
City Attorney/City Clerk/Municipal CourtCity AttorneyCity ClerkMunicipal Court
City AuditorCity Auditor
City CouncilCity Council
Finance/Community Development/Economic Development/General Costs
Finance8-3 Finance
Community DevelopmentEconomic DevelopmentGeneral Costs
FireFireOffice of Emergency Management
Information TechnologyInformation Technology
Mayor and Support ServicesMayor’s OfficeCommunicationsHuman Resources
Employment ServicesRisk Management
Innovation & SustainabilityProcurement Services
Parks, Recreation and Cultural ServicesParks, Recreation and Cultural Services
Cultural ServicesDesign and DevelopmentForestryPark Operations and DevelopmentRecreation and Administration
Planning and DevelopmentPlanning and Development
Land Use ReviewNeighborhood ServicesReal Estate Services
PolicePolice
Public WorksPublic Works
City EngineeringPublic Works Operations & MaintenanceTraffic EngineeringTransitWater Resources Engineering
EnterprisesAirportCemetery EnterpriseDevelopment Review EnterpriseGolf EnterpriseMemorial Health SystemParking System EnterprisePikes Peak – America’s MountainStormwater Enterprise
Capital Improvements ProgramCapital Improvements Program
AppendicesAppendix A – Budget DevelopmentAppendix B – Financial PoliciesAppendix C – Revenue DetailAppendix D – GlossaryAppendix E – 2018 Salary ScheduleAppendix F – Appropriation OrdinanceAppendix G – Index
iii
v
ix
xi
xii
xiv
1-11-27
2-12-32-212-272-292-352-572-652-69
3-14-15-1
6-1
7-1
8-1
9-110-111-1
12-113-1
14-1
15-116-117-117-317-1318-119-1
20-120-320-1120-2120-2920-57
21-121-321-1121-19
22-1
23-123-323-1123-2123-2923-39
24-125-126-127-128-129-130-131-1
32-1
A-1B-1C-1D-1E-1F-1G-1

Table of Contents ii 2018 Budget
This page left blank intentionally.
2018 Budget Page iii City Leadership/City Council
City Leadership
Mayor’s Office
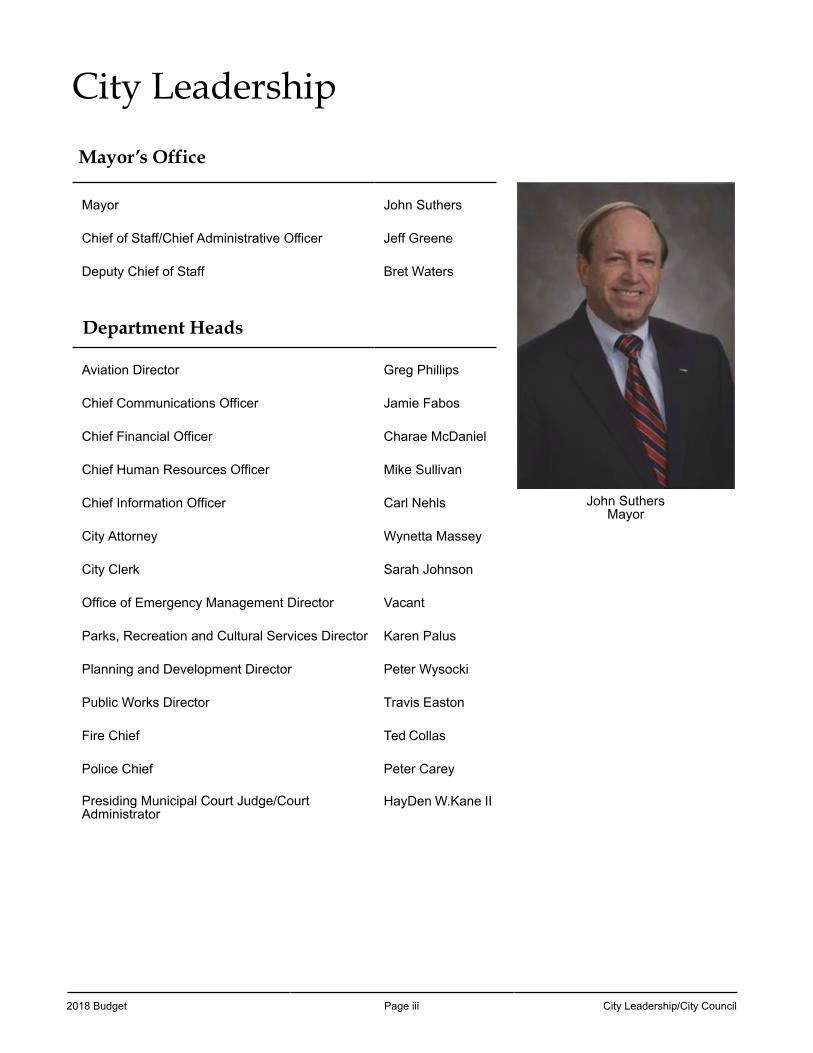
John SuthersMayor
Mayor John Suthers
Chief of Staff/Chief Administrative Officer Jeff Greene
Deputy Chief of Staff Bret Waters
Department Heads
Aviation Director Greg Phillips
Chief Communications Officer Jamie Fabos
Chief Financial Officer Charae McDaniel
Chief Human Resources Officer Mike Sullivan
Chief Information Officer Carl Nehls
City Attorney Wynetta Massey
City Clerk Sarah Johnson
Office of Emergency Management Director Vacant
Parks, Recreation and Cultural Services Director Karen Palus
Planning and Development Director Peter Wysocki
Public Works Director Travis Easton
Fire Chief Ted Collas
Police Chief Peter Carey
Presiding Municipal Court Judge/CourtAdministrator
HayDen W.Kane II
City Leadership/City Council Page iv 2018 Budget
City Council
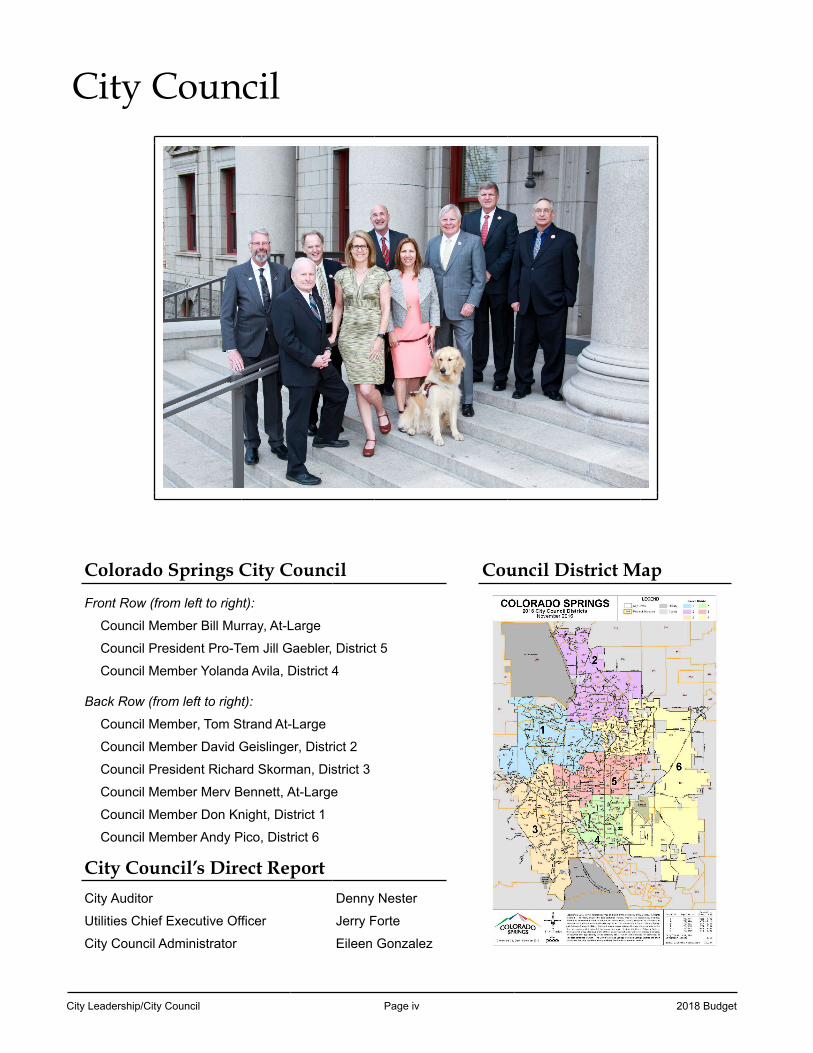
Colorado Springs City Council Council District Map
Front Row (from left to right):
Council Member Bill Murray, At-Large
Council President Pro-Tem Jill Gaebler, District 5
Council Member Yolanda Avila, District 4
Back Row (from left to right):
Council Member, Tom Strand At-Large
Council Member David Geislinger, District 2
Council President Richard Skorman, District 3
Council Member Merv Bennett, At-Large
Council Member Don Knight, District 1
Council Member Andy Pico, District 6
City Council’s Direct Report
City Auditor Denny Nester
Utilities Chief Executive Officer Jerry Forte
City Council Administrator Eileen Gonzalez
2018 Budget Page v Mayor's Letter
JOHN W. SUTHERSMAYOR
January 1, 2018
Honorable President Skorman, President Pro-tem Gaebler and City Council Members,
In accordance with the City Charter of Colorado Springs, I present to you a balanced budget that reflects an allocation of resources in line with our strategic plan goals: Promoting Job Creation, Investing in Infrastructure, Building Community and Collaborative Relationships, and Excelling in City Services.
2018 BUDGET OVERVIEW
The General Fund is the City’s main operating fund and the one over which the City has the most discretionary budget control. The 2018 General Fund expenditure budget is $286.7 million, $14.1 million or 5% more than the 2017 budget. The 2018 General Fund revenue budget is $288.9 million, $16.3 million or 6% more than the 2017 budget. The difference in revenue and expenditures results in a planned $2.2 million contribution to the fund balance. The increase in revenue is largely due to a projected increase in sales and use tax revenue of 7.5% over the 2017 budget (and 3.4% over the current 2017 end-of-year forecast). However, with this revenue growth, the City anticipates being over the 2017 TABOR revenue limit. In compliance with the ballot item that was voter-approved in April 2017, the City will retain and spend up to $6 million in revenue in excess of the TABOR limit exclusively for stormwater projects. As such, the 2018 General Fund budget accounts for $6 million in 2017 revenue in excess of the TABOR limit to be spent on stormwater projects.
We continue to make great strides in improving our critical infrastructure. On November 7, 2017 the voters passed Ballot Issue 2A, as set forth in Resolution 89-17, creating a dedicated stormwater fee for infrastructure and maintenance. The collection of Stormwater service fees begins July 1, 2018 and ends July 1, 2038. These fees will be used for the sole purpose of funding, through a City enterprise, the construction, improvement, operation and maintenance of public stormwater facilities and public stormwater system in the city.
With the General Fund expenditures savings created by the implementation of the stormwater fee for half of a year, and with revenue anticipated to increase for the 2018 budget, we were able to begin addressing one of our major tasks over the next decade - to ensure that our police and fire departments are adequately staffed and compensated.
Across all departments and functions, we have an obligation to our citizens to continue to provide quality and responsive services, and as such the 2018 General Fund Budget includes the following high priority items that allow us to enhance and improve our service delivery:
Mayor's Letter Page vi 2018 Budget
• $1.7 million increase to fund 20 new Police Officer positions and 10 new Fire positions• $900,000 in increased funding for park maintenance, recreational and cultural service needs• $1.4 million in increased funding for city facilities maintenance• $1.2 million in increased funding for city fleet replacement • $750,000 contribution to the I-25/Cimarron landscaping project• $480,000 increased funding to Mountain Metro Transit • $300,000 to improve the City’s online services relating to permitting, land use and licensing• $5.5 million to address police and fire compensation issues and civilian compensation
issues
While we focus on the City’s General Fund, it is important to acknowledge the City’s other funding sources which are available for City services, most significantly special revenue funds which have specific designated uses. Important special revenue funds include: 2C - Road tax fund, Public Safety Sales Tax (PSST) fund, Trails, Open Space and Parks (TOPS) fund, Conservation Trust Fund (CTF or Lottery Fund) for parks, and other federal, state and private grant funds. These designated revenue sources are critically important to the City’s ability to provide core municipal services.
STRATEGIC PLAN GOAL: PROMOTING JOB CREATION
Our first and primary strategic plan goal remains promoting job creation. After a decade of very little job growth, we have averaged about 8,000 new jobs per year for the past two years and are now beginning to experience significant wage growth. Our unemployment rate, which reached a high of about 10% in 2010, dropped to the lowest in recorded history, reaching 2.3% this past year. Colorado Springs now has approximately 13,160 job openings with a median salary for posted jobs of $69,600. Tourism is blooming, reflected in the fact that LART revenues, after growing 15% in 2016, were up another 14% in 2017.
While a lot of our economic success over the last year reflects an improving economy, the Chamber and EDC, the City’s Economic Development Office and many other groups have been creating an environment conducive to economic growth. This 2018 budget includes funding for an online permit, land use and licensing system, which will contribute to Colorado Springs becoming a more business friendly city.
Highlights of funding decisions included in this 2018 Budget related to the Job Creation strategic plan goal are the following:
• Continued funding for the Chamber/EDC and the Small Business Development Center• Increased funding for arts and cultural organizations and events, sporting events, festivals
and parades, and the Convention and Visitors Bureau for visitor promotion, provided with revenue from the LART Fund
• $700,000 in funding from the Parking Enterprise for downtown streetscapes, which increases the attractiveness and vibrancy of the core of our City
STRATEGIC PLAN GOAL: INVESTING IN INFRASTRUCTURE
Maintaining our City’s infrastructure and assets are a core responsibility of our City and essential to effective service delivery. In addition, the quality of our streets, sidewalks, stormwater drainage and
2018 Budget Page vii Mayor's Letter
other infrastructure is a priority as it affects our citizens’ quality of life and our ability to attract new business. One of our foremost challenges, sustainable stormwater funding, was addressed on November 7, 2017 when the voters passed Ballot Issue 2A, creating a dedicated stormwater fee for infrastructure and maintenance. These fees will be used for the sole purpose of funding, through a City enterprise, the construction, improvement, operation and maintenance of public stormwater facilities and public stormwater system in the city.
Improving our roads is a work in progress. With the passage of Issue 2C, we are able to raise, over a five-year period, approximately $250,000,000 for improvements to our deteriorating roads. Through October of 2017, we will have paved 468 lane miles with 371,000 tons of asphalt and completed 372,000 lineal feet of new curb and gutter.
Highlights of funding decisions included in this 2018 Budget related to the Investing in Infrastructure strategic plan goal are the following:
• $50.0 million 2C funding for road and street improvements which includes the replacement of deteriorated adjacent curb, gutter, and sidewalk and to bring adjacent pedestrian ramps into compliance with ADA requirements
• $1.2 million increase funding to implement the fleet replacement strategy to replace highest priority vehicles and equipment (based upon age, mileage/hours and maintenance history)
• $9 million of funding in the Stormwater Enterprise to assume administration of the stormwater program beginning July 1
• $75,000 increased funding for forestry needs• $268,000 increased for IT infrastructure needs• $250,000 to fund a Citywide Transportation Plan• $1.4 million increase for critical facility maintenance - spread across the City’s many facilities
including police and fire stations, parks facilities and public works facilities
STRATEGIC PLAN GOAL: BUILDING COMMUNITY & COLLABORATIVE RELATIONSHIPS
The 2018 budget was again the result of an open and collaborative process between City Council and Administration. In parallel, the City has worked to enhance and expand partnerships within our community, with local organizations, our business community, and non-profit sector to achieve more together. Much of what we do as the City, whether it is public safety, addressing homelessness or improving the walkability and bikeability of our City relies on strategic partnerships with others and the ability to align efforts and work together towards common goals.
Highlights of funding decisions included in this 2018 Budget related to the Building Community and Collaborative Relationships strategic plan goal are the following:
• Continued funding for the Council of Neighborhood Organizations (CONO)• Continued funding (General Fund and grants) for the Public Safety Community and Public
Health program that integrates Emergency Medical Services into the broader healthcare system and provides the proper level of response in a timely and cost-effective manner
• Continued staff support and participation in the community response to homelessness, including the Springs Rescue Mission campus
Mayor's Letter Page viii 2018 Budget
STRATEGIC PLAN GOAL: EXCELLING IN CITY SERVICES
Lastly, but certainly not least, it is imperative that the City, as a large organization and major employer, continues to seek efficiencies, improve effectiveness, and take steps to ensure long-term fiscal sustainability.
Highlights of funding decisions included in this 2018 Budget related to the Excelling in City Services strategic plan goal are the following:
• $5.5 million to address police and fire compensation issues and civilian compensation issues - our employees are the key to successful, effective delivery of programs and services
• Increased funding for rising healthcare and Workers’ Compensation costs • Increased funding of $337,500 for a modernized citizen issue reporting system
This 2018 budget is a reflection of our shared strategic goals and collaborative relationships between City Council and Administration and between our local government and our community. When building the annual budget there is always a tension between the need to invest in our facilities, infrastructure and services and the need to build reserves for emergencies and to withstand an economic downturn. We have built this 2018 budget with a planned contribution of $2.2 million to the fund balance. While the Government Finance Officers Association (GFOA) specifically recommended that the City of Colorado Springs have an unrestricted fund balance target of 25% of the following year’s expenditure budget, I have set a realistic goal of restoring the fund balance to 20%. As we close 2017, if revenue continues on budget and departments realize expenditure savings, we expect the unrestricted fund balance to be between 15% and 16%.
The 2018 budget document provides citizens an overview of the City’s resources and costs of providing core municipal services. The document also provides very specific line-item expenditure details so citizens can see the City’s specific spending plans. We acknowledge that we are accountable to the citizens and will provide the highest level of financial transparency. I would like to specifically thank all City department directors, their staff and the Fiscal and Strategic Planning Office - a great City team that worked collaboratively to develop the 2018 budget and produce the 2018 budget document before you.
It is my honor to serve as the Mayor of this great City and I look forward to working with all of you create a society that matches our scenery.
Very Respectfully,
John W. SuthersMayor, City of Colorado Springs
2018 Budget Page ix City Organizational Chart
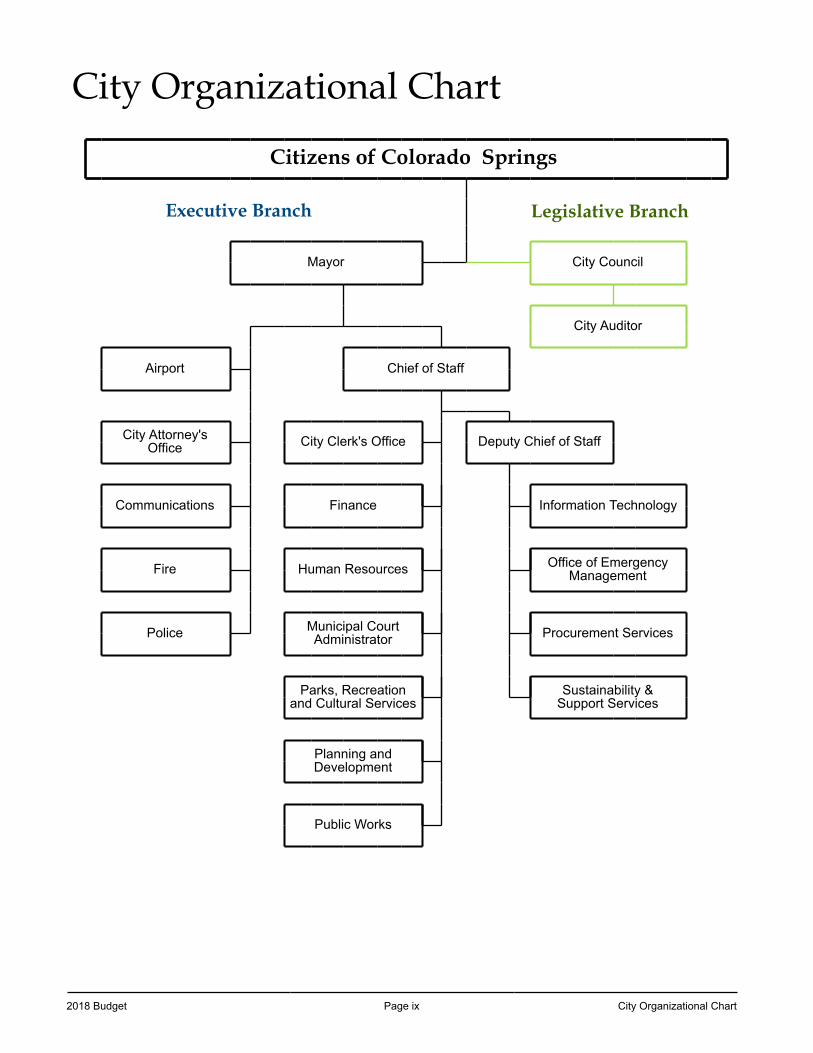
City Organizational Chart
Citizens of Colorado Springs
Executive Branch Legislative Branch
Mayor City Council
City Auditor
Airport Chief of Staff
City Attorney'sOffice City Clerk's Office Deputy Chief of Staff
Communications Finance Information Technology
Fire Human Resources Office of EmergencyManagement
Police Municipal CourtAdministrator Procurement Services
Parks, Recreationand Cultural Services
Sustainability & Support Services
Planning andDevelopment
Public Works

City Organizational Chart Page x 2018 Budget
This page left blank intentionally.
2018 Budget Page xi Springs at a Glance
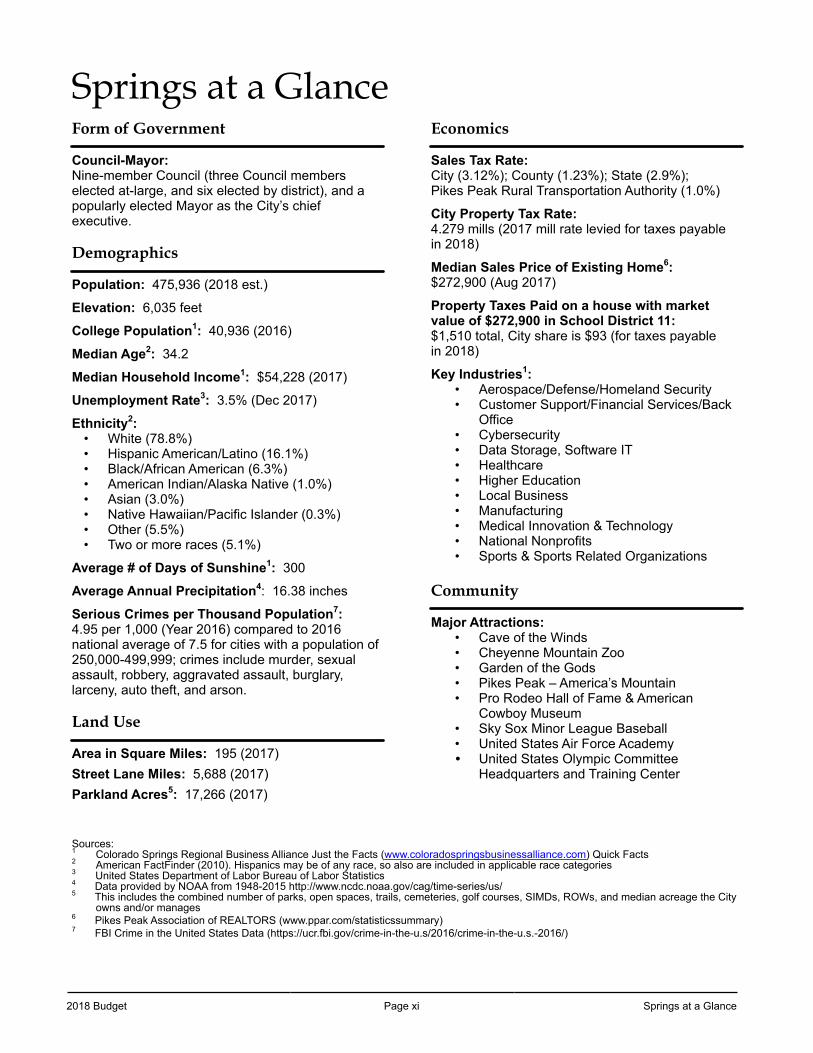
Springs at a GlanceForm of Government
Council-Mayor: Nine-member Council (three Council members elected at-large, and six elected by district), and a popularly elected Mayor as the City’s chief executive.
Demographics
Population: 475,936 (2018 est.)
Elevation: 6,035 feet
College Population1: 40,936 (2016)
Median Age2: 34.2
Median Household Income1: $54,228 (2017)
Unemployment Rate3: 3.5% (Dec 2017)
Ethnicity2:• White (78.8%)• Hispanic American/Latino (16.1%)• Black/African American (6.3%)• American Indian/Alaska Native (1.0%)• Asian (3.0%)• Native Hawaiian/Pacific Islander (0.3%)• Other (5.5%)• Two or more races (5.1%)
Average # of Days of Sunshine1: 300
Average Annual Precipitation4: 16.38 inches
Serious Crimes per Thousand Population7: 4.95 per 1,000 (Year 2016) compared to 2016 national average of 7.5 for cities with a population of 250,000-499,999; crimes include murder, sexual assault, robbery, aggravated assault, burglary, larceny, auto theft, and arson.
Land Use
Area in Square Miles: 195 (2017)Street Lane Miles: 5,688 (2017)Parkland Acres5: 17,266 (2017)
Economics
Sales Tax Rate:City (3.12%); County (1.23%); State (2.9%);Pikes Peak Rural Transportation Authority (1.0%)
City Property Tax Rate: 4.279 mills (2017 mill rate levied for taxes payablein 2018)
Median Sales Price of Existing Home6:$272,900 (Aug 2017)
Property Taxes Paid on a house with market value of $272,900 in School District 11: $1,510 total, City share is $93 (for taxes payablein 2018)
Key Industries1:• Aerospace/Defense/Homeland Security• Customer Support/Financial Services/Back
Office• Cybersecurity• Data Storage, Software IT• Healthcare• Higher Education• Local Business• Manufacturing• Medical Innovation & Technology• National Nonprofits• Sports & Sports Related Organizations
Community
Major Attractions:• Cave of the Winds• Cheyenne Mountain Zoo• Garden of the Gods• Pikes Peak – America’s Mountain• Pro Rodeo Hall of Fame & American
Cowboy Museum• Sky Sox Minor League Baseball• United States Air Force Academy• United States Olympic Committee
Headquarters and Training Center
Sources:1 Colorado Springs Regional Business Alliance Just the Facts (www.coloradospringsbusinessalliance.com) Quick Facts2 American FactFinder (2010). Hispanics may be of any race, so also are included in applicable race categories3 United States Department of Labor Bureau of Labor Statistics4 Data provided by NOAA from 1948-2015 http://www.ncdc.noaa.gov/cag/time-series/us/5 This includes the combined number of parks, open spaces, trails, cemeteries, golf courses, SIMDs, ROWs, and median acreage the City
owns and/or manages6 Pikes Peak Association of REALTORS (www.ppar.com/statisticssummary)7 FBI Crime in the United States Data (https://ucr.fbi.gov/crime-in-the-u.s/2016/crime-in-the-u.s.-2016/)
Community Profile Page xii 2018 Budget
Community Profile
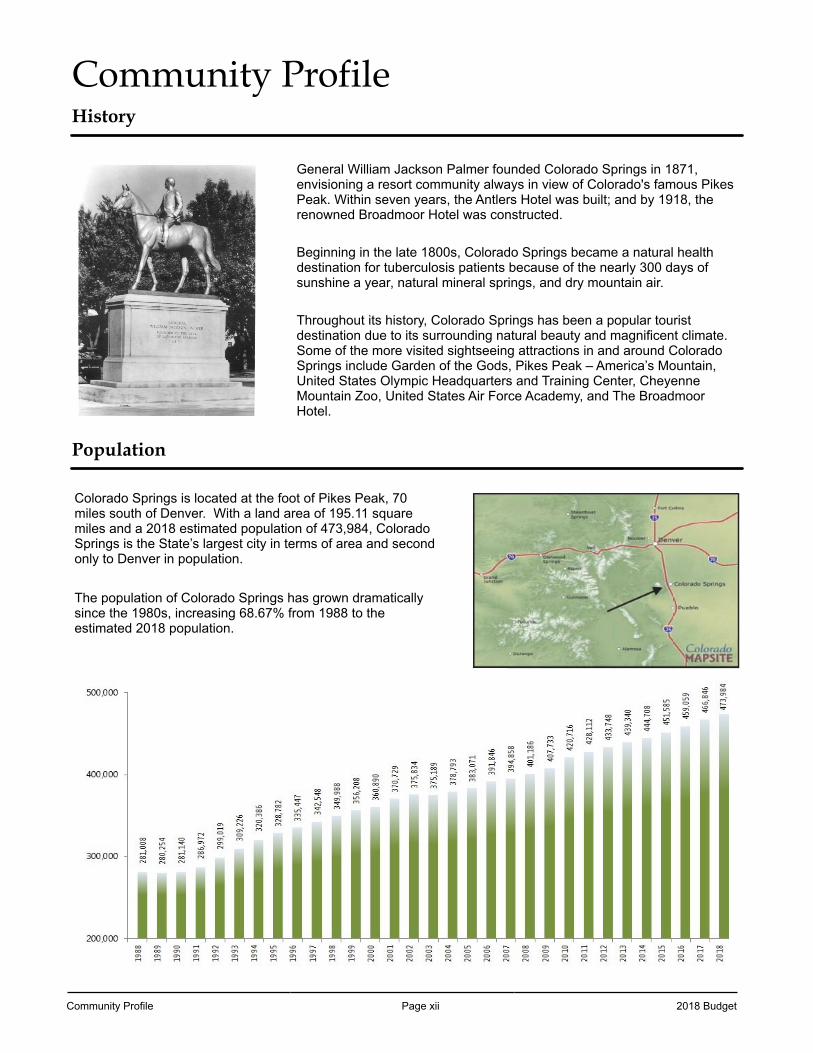
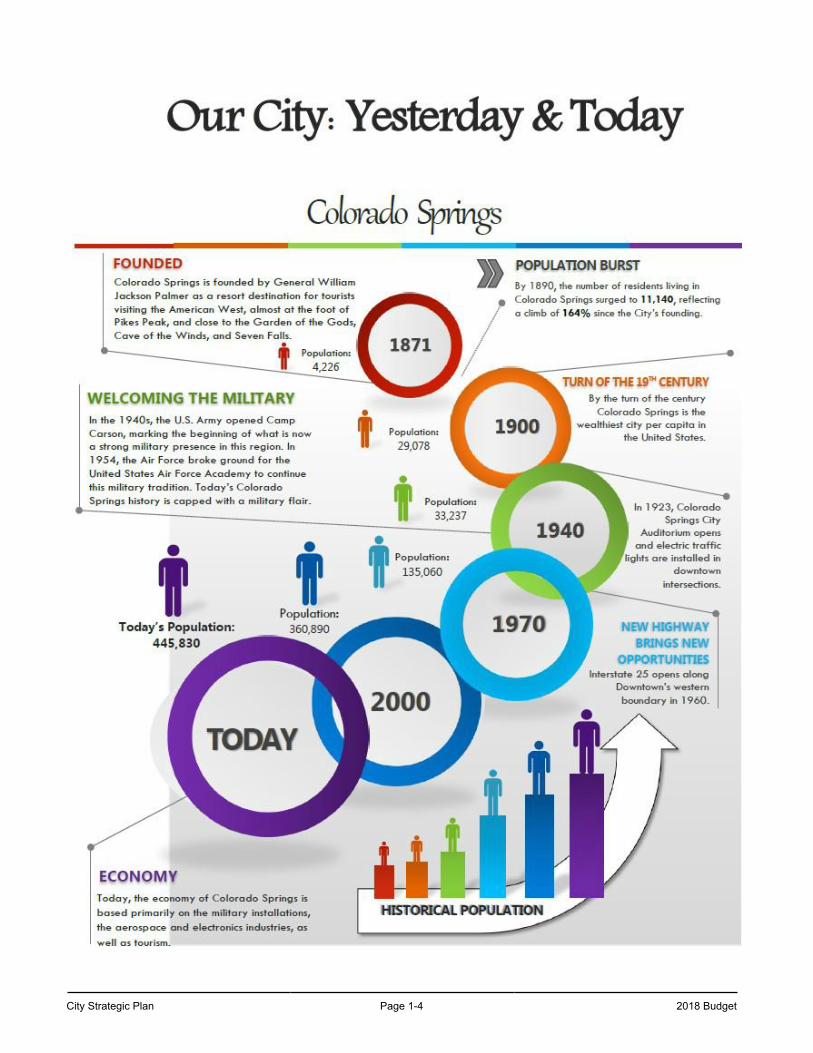
History
General William Jackson Palmer founded Colorado Springs in 1871,envisioning a resort community always in view of Colorado's famous PikesPeak. Within seven years, the Antlers Hotel was built; and by 1918, therenowned Broadmoor Hotel was constructed.
Beginning in the late 1800s, Colorado Springs became a natural healthdestination for tuberculosis patients because of the nearly 300 days ofsunshine a year, natural mineral springs, and dry mountain air.
Throughout its history, Colorado Springs has been a popular touristdestination due to its surrounding natural beauty and magnificent climate.Some of the more visited sightseeing attractions in and around ColoradoSprings include Garden of the Gods, Pikes Peak – America’s Mountain,United States Olympic Headquarters and Training Center, CheyenneMountain Zoo, United States Air Force Academy, and The BroadmoorHotel.
Population
Colorado Springs is located at the foot of Pikes Peak, 70miles south of Denver. With a land area of 195.11 squaremiles and a 2018 estimated population of 473,984, ColoradoSprings is the State’s largest city in terms of area and secondonly to Denver in population.
The population of Colorado Springs has grown dramaticallysince the 1980s, increasing 68.67% from 1988 to theestimated 2018 population.
2018 Budget Page xiii Community Profile
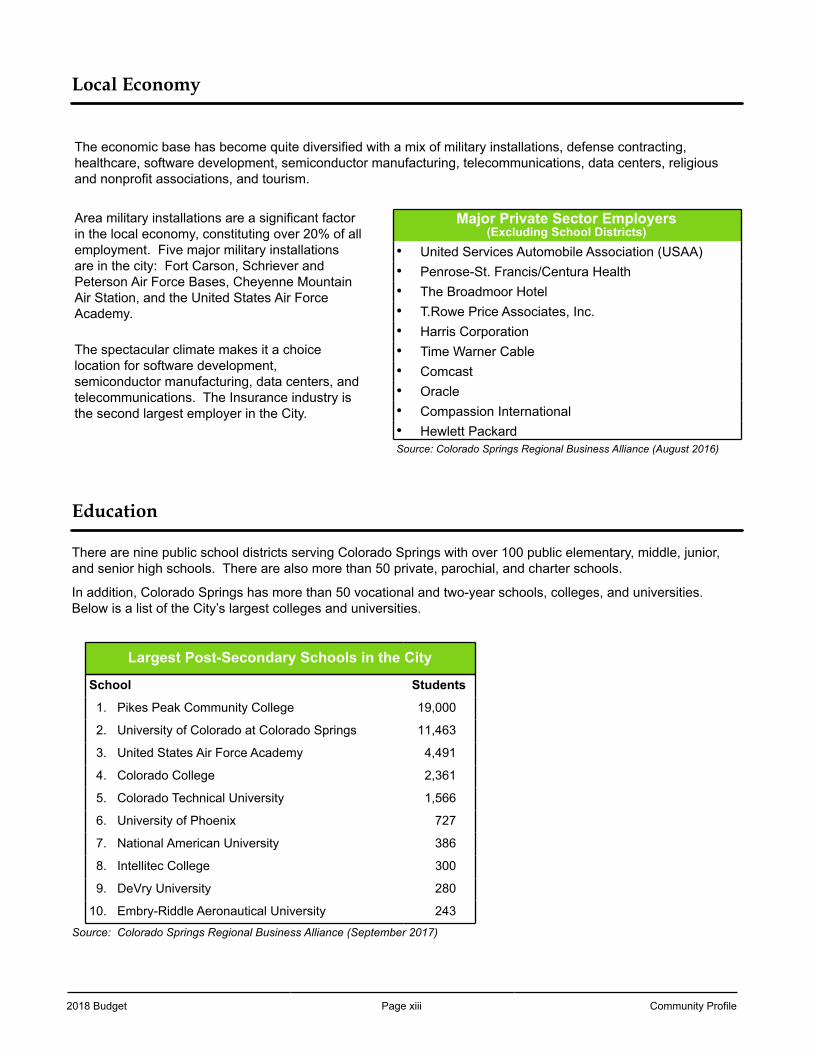
Local Economy
The economic base has become quite diversified with a mix of military installations, defense contracting,healthcare, software development, semiconductor manufacturing, telecommunications, data centers, religiousand nonprofit associations, and tourism.
Area military installations are a significant factorin the local economy, constituting over 20% of allemployment. Five major military installationsare in the city: Fort Carson, Schriever andPeterson Air Force Bases, Cheyenne MountainAir Station, and the United States Air ForceAcademy.
Major Private Sector Employers(Excluding School Districts)
• United Services Automobile Association (USAA)• Penrose-St. Francis/Centura Health• The Broadmoor Hotel• T.Rowe Price Associates, Inc.• Harris Corporation
The spectacular climate makes it a choicelocation for software development,semiconductor manufacturing, data centers, andtelecommunications. The Insurance industry isthe second largest employer in the City.
• Time Warner Cable• Comcast• Oracle• Compassion International• Hewlett PackardSource: Colorado Springs Regional Business Alliance (August 2016)
Education
There are nine public school districts serving Colorado Springs with over 100 public elementary, middle, junior, and senior high schools. There are also more than 50 private, parochial, and charter schools.
In addition, Colorado Springs has more than 50 vocational and two-year schools, colleges, and universities. Below is a list of the City’s largest colleges and universities.
Largest Post-Secondary Schools in the City
School Students
1. Pikes Peak Community College 19,000
2. University of Colorado at Colorado Springs 11,463
3. United States Air Force Academy 4,491
4. Colorado College 2,361
5. Colorado Technical University 1,566
6. University of Phoenix 727
7. National American University 386
8. Intellitec College 300
9. DeVry University 280
10. Embry-Riddle Aeronautical University 243Source: Colorado Springs Regional Business Alliance (September 2017)
GFOA Award Page xiv 2018 Budget
Government Finance OfficersAssociation Award
The Government Finance Officers Association of the United States and Canada (GFOA) presented an award of Distinguished Budget Presentation to the City of Colorado Springs, Colorado, for its annual budget for the fiscal year beginning January 1, 2017. In order to receive this award, a governmental unit must publish a budget document that meets program criteria as a policy document, as an operations guide, as a financial plan, and as a communications device.
The award is valid for a period of one year only. We believe our current budget continues to conform to program requirements and we are submitting it to GFOA to determine its eligibility for another award.
2018 Budget Page 1-1 City Strategic Plan
City Strategic Plan Page 1-2 2018 Budget
TABLE OF CONTENTS
Introduction ............................................................................................................ 1-3
Our City .................................................................................................................. 1-4
Our Future .............................................................................................................. 1-5
Platform Goals ....................................................................................................... 1-6
Promoting Job Creation ............................................................................ 1-7
Investing in Infrastructure .......................................................................... 1-11
Building Community & Collaborative Relationships .................................. 1-15
Excelling in City Services .......................................................................... 1-19
City Council Specific Initiatives ............................................................................... 1-22
Implementation ....................................................................................................... 1-24
2018 Budget Page 1-3 City Strategic Plan
INTRODUCTION FROM THE MAYORLike any organization with a mission, the City of Colorado Springsmust have a strategic vision to ensure that our programs, services,and initiatives are leading us toward a better future.
With our guiding goals of Promoting Job Creation, Investing in Infrastructure, Building Community and Collaborative Relationships, and Excelling in City Services, we can get Colorado Springs moving forward and provide quality streets, bridges, stormwater and parks that make Colorado Springs the gem of the Rockies.
We aim to reflect the vision our founding fathers developed, as one ofour founding fathers William J. Palmer said “My theory for this place isthat it should be made the most attractive--a place for schools,
colleges, literature, science, first class newspapers, and everything that the above imply.”
As the City continues to foster an environment that creates new jobs and partner withcommunity organizations and regional partners to accomplish more together, we are in midst ofdeveloping our Comprehensive Plan - a guide for physical development of the City - as acommunity. Our Comprehensive Plan Vision for 2036 is “Colorado Springs 2036 is a city thatreflects its majestic landscapes and champions its ideals through renowned culture, vibrantneighborhoods, strong connections, unique urban places, and a thriving economy.”
The City’s Strategic Plan was developed with significant input from the broader community; theimplementation of our plan must also be driven by collaboration and partnership with ourcommunity. The City plays a vital role in shaping Colorado Springs’ future; the resources,expertise, and community pride that are essential to accomplishing the strategies laid out in thisplan exist in this community beyond the walls of City government.
We look forward to working together as a community to create a society that matches ourscenery.
Sincerely,
John W. SuthersMayor
VISION MISSIONUpholding the vision our City’s founding
fathers developed, and carrying forward thespirit of Olympic City USA, Colorado Springs
will be a city that matches its scenery.
We serve the people of Colorado Springseffectively, efficiently and courteously, wisely
managing our limited resources.
CORE VALUESThe City of Colorado Springs will exhibit the values of integrity, accountability, transparency,
leadership, innovation and persistent community engagement.
City Strategic Plan Page 1-4 2018 Budget
2018 Budget Page 1-5 City Strategic Plan
Our FutureWhile this strategic plan focuses on the next five years (2016-2020), itis important to recognize and embrace trends that we will face as aCity in the next twenty years. These following trends will significantlyimpact the way local governments, including the City of ColoradoSprings operate. The City anticipates the following changes to thepresent model of local government in the next twenty years:
Distributed/Shared Governance
Contracting, privatization and regionalization have enabled governments to improveefficiency. As citizen engagement and community connectedness grows throughtechnology and urbanization, governments transition from service providers to solutionenablers. Innovators, community leaders, and technology-equipped citizens servethemselves and develop solutions to complicated problems together through open dataand participatory service delivery. Success in service delivery and solving problems aredriven by data, driving outcome-oriented services and programs based on communitypriorities.
Dynamic Pricing & Crowdsourcing
Implementing technology in conjunction with the economics of supply and demandallows governments to move from static pricing to dynamic pricing that responds totrue, clear costs of service, and that incentivizes prosocial behavior while discouragingwaste, fraud, and abuse. Real-time information driven by sensors allows transportationusers to choose between routes based on traffic and costs. Mobile pay systems allowcitizens to pay for services and programs that they need and want, receiving thoseservices when and how they want them. In conjunction with dynamic pricing,crowdsourcing enables citizens to decide as a community to invest in the efforts theyvalue. Additionally, crowdsourcing allows citizens the ability to provide immediate andspecific direction into government programs and services.
Peer-to-Peer, Community-Driven Cities
Collaborative consumption, solving problems and building neighborhoods as acommunity of citizens, rather than a group of stakeholders living day-to-day in differentsilos enables cities to use their infrastructure, services, and programs in a moreefficient, effective, and citizen-responsive way. Talent sharing across all sectors, ratherthan hosting employees within individual organizations, allows for more collaborationand wiser use of human capital.
City Strategic Plan Page 1-6 2018 Budget
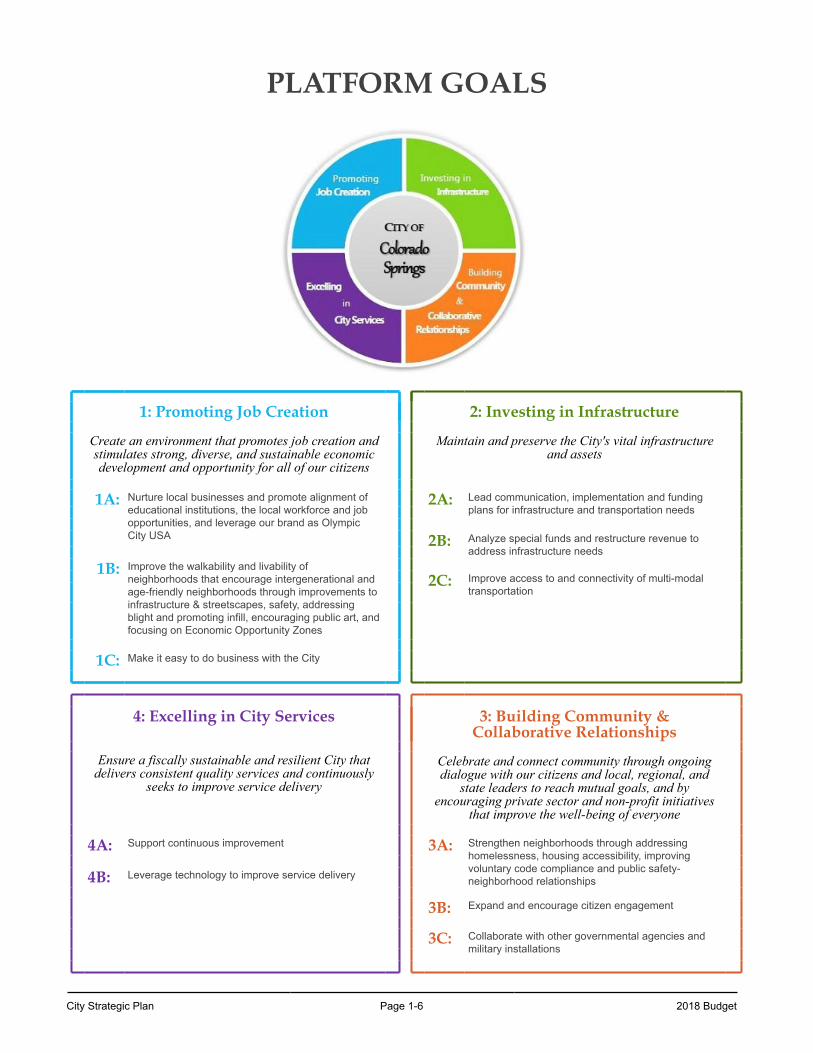
PLATFORM GOALS
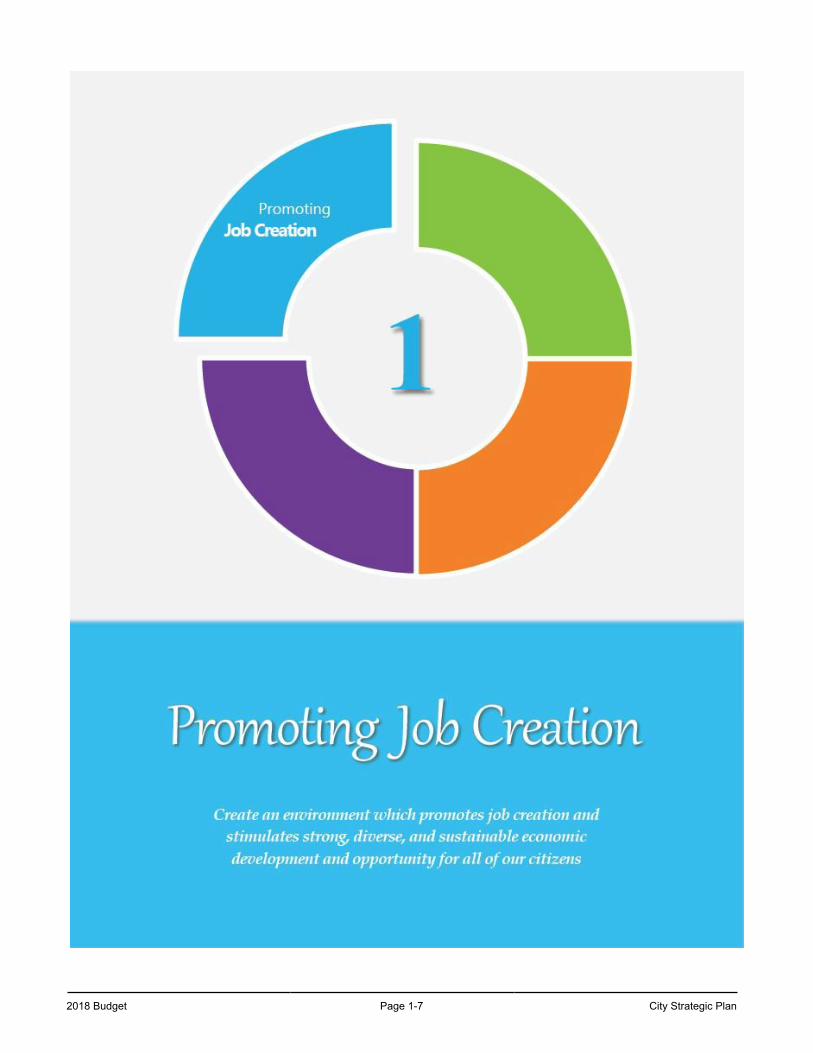
1: Promoting Job Creation 2: Investing in Infrastructure
Create an environment that promotes job creation andstimulates strong, diverse, and sustainable economicdevelopment and opportunity for all of our citizens
Maintain and preserve the City's vital infrastructureand assets
1A: Nurture local businesses and promote alignment of educational institutions, the local workforce and job opportunities, and leverage our brand as Olympic City USA
2A: Lead communication, implementation and funding plans for infrastructure and transportation needs
2B: Analyze special funds and restructure revenue to address infrastructure needs
1B: Improve the walkability and livability of neighborhoods that encourage intergenerational and age-friendly neighborhoods through improvements to infrastructure & streetscapes, safety, addressing blight and promoting infill, encouraging public art, and focusing on Economic Opportunity Zones
2C: Improve access to and connectivity of multi-modal transportation
1C: Make it easy to do business with the City
4: Excelling in City Services 3: Building Community &Collaborative Relationships
Ensure a fiscally sustainable and resilient City thatdelivers consistent quality services and continuously
seeks to improve service delivery
Celebrate and connect community through ongoingdialogue with our citizens and local, regional, and
state leaders to reach mutual goals, and byencouraging private sector and non-profit initiatives
that improve the well-being of everyone
4A: Support continuous improvement 3A: Strengthen neighborhoods through addressing homelessness, housing accessibility, improving voluntary code compliance and public safety-neighborhood relationships4B: Leverage technology to improve service delivery
3B: Expand and encourage citizen engagement
3C: Collaborate with other governmental agencies and military installations
2018 Budget Page 1-7 City Strategic Plan
City Strategic Plan Page 1-8 2018 Budget
PERSPECTIVE FROM 2020
Unemployment declined in recent years in Colorado Springs. Employers’ labor needs alignwith our local workforce and educational opportunities. Employers and professionals of allages move to Colorado Springs, local graduates stay, and businesses are expandingbecause of our reputation, quality of life and ease of doing business with the City. TheCity’s neighborhoods are vibrant, as a result of greater infill and urban development, andour downtown is thriving as a place to work, play, live and shop.
STRATEGIC OBJECTIVES
1A: Nurture local businesses and promote alignment of educationalinstitutions, the local workforce and job opportunities, and leverageour brand as Olympic City USA
1B: Improve the walkability and livability of neighborhoods thatencourage intergenerational and age-friendly neighborhoodsthrough improvements to infrastructure & streetscapes, safety,addressing blight and promoting infill, encouraging public art, andfocusing on Economic Opportunity Zones
1C: Make it easy to do business with the City
2018 Budget Page 1-9 City Strategic Plan
CITY ADMINISTRATION INITIATIVES
1A: Nurture local businesses and promote alignment of educational institutions, the local workforce and job opportunities, and leverage our brand as Olympic City USA
Support the community’s economic development goals, working with the Chamber/EDC, SBDC, BBB, CNE and small businesses and startups, nonprofits and other community organizations to identify and remove barriers to business growth and development
Promote the strengthening of skills and employment opportunities of Colorado Springs residents, alignment of ourpublic schools, higher education and promoting opportunities for education/training geared toward trades, thattogether attract and retain talent in the region
Support further development of the local cybersecurity industry through planning & infrastructure efforts, grantopportunities, and economic development incentives *
Recognizing the importance of a strong downtown to healthy and sustainable City, continue to support downtowndevelopment projects
Support the tourism industry through tourism related projects, and support a strong core of sport organizations andevents, advancing the Olympic City image locally and nationally
Encourage the attraction, retention and expansion of creative business enterprises within the Downtown CreativeDistrict, and other parts of the city, though innovative strategies and partnership *
Encourage local purchasing for City products and services to support our local economy
Secure public and private funding opportunities for the design, development and construction of a new SummitHouse, complete design and begin construction
1B: Improve the walkability and livability of neighborhoods that encourage intergenerational and age-friendly neighborhoods through improvements to infrastructure & streetscapes, safety, addressing blight and promoting infill, encouraging public art, and focusing on Economic Opportunity Zones
Address public safety issues that impact our image and attractiveness to new businesses and residents.
Address the aging population of the region by incorporating age-friendly elements into the City’s development &transportation planning *
Better define economic growth and development objectives as part of the City’s Comprehensive Plan update
Facilitate increased private sector investment in Economic Opportunity Zones through improving infrastructure,updating planning efforts, and changing related City policies
Engage City Council, City Planning Commission, and neighborhood groups on key land development issues,including implementing priorities of the Infill & Revitalization Steering Committee and educating the public on thebenefits of infill
Improve the city’s overall first impression and appearance by reducing blight and addressing aging, underutilizedbuildings through the strategic use of URA and state and federal grant funding
Implement Streetscape Solutions Team recommendations on improving the conditions of the city’s native rights-of-way, medians and Gateway Gems through partnerships, contracted services, and reducing resource-heavylandscaping
Partner with community organizations to develop and implement a public arts master plan
Support arts organizations and cultural programming to advance the city’s quality of life and national identity, image,and brand *
* New Initiatives added in 2017
City Strategic Plan Page 1-10 2018 Budget
1C: Make it easy to do business with the City
Review business-related City Code, expedite development-related processes, and eliminate barriers to doingbusiness in the City
Expand the number of services that can be completed online
PARTNERS
Citizens Local Businesses
El Paso County Military installations
Chamber/EDC Bicycle & healthy living advocates and groups
SBDC Garden of the Gods Foundation
BBB Colorado Springs Utilities
Downtown Partnership Colorado Springs Convention & Visitor's Bureau
Higher education institutions Development community
COPPeR and other arts & culture organizations Sister Cities Organization
Entrepreneurial resources Media
Pikes Peak Workforce Center Civic-minded professional associations
Sports and health organizations United States Olympic Committee ("USOC")
School districts CNE
Job-focused federal agencies
2018 Budget Page 1-11 City Strategic Plan
City Strategic Plan Page 1-12 2018 Budget
PERSPECTIVE FROM 2020
The quality of our City’s infrastructure is constantly improving, through implementation of along-term, community-supported approach. The City aligns infrastructure projects withthose of Colorado Springs Utilities and other regional partners. Connectivity, accessibilityand quality of our infrastructure is improving, as the City leverages technology andindustry-leading design tactics. Our citizens are well-informed and support our approachto addressing infrastructure. Funding for infrastructure reflects thorough analysis ofrevenue structures and the exploration of alternative funding mechanisms.
STRATEGIC OBJECTIVES
2A: Lead communication, implementation and funding plans forinfrastructure and transportation needs
2B: Analyze special funds and restructure revenue to addressinfrastructure needs
2C: Improve access to and connectivity of multi-modal transportation
2018 Budget Page 1-13 City Strategic Plan
CITY ADMINISTRATION INITIATIVES
2A: Lead communication, implementation and funding plans for infrastructure and transportation needs
Coordinate infrastructure improvements across City departments/functions and with CSU
Improve accessibility to and conditions of city facilities through a 10-year facilities master plan, and an annual CIPfacilities prioritization process that includes ADA accessibility projects
Develop a fleet replacement strategy for all City operations *
Improve City IT infrastructure to support City services, provide adequate security of data and information, and identifyand address maintenance needs for the City’s communications systems
Educate public and legislators on the critical need, as well as benefits, of investing in infrastructure
Improve environmental sustainability of City infrastructure and assets
Work with military installations to identify and take advantage of land use opportunities that serve mutual benefits toregional growth and vitality
Provide urban forest management practices that mitigate risk, and enhance public safety, stormwater retention andproperty value and address the aging urban forest through hazard tree removals
Successfully implement the 2C program
2B: Analyze special funds and restructure revenue to address infrastructure needsDevelop a long-term funding solution for a sustainable and resilient stormwater system
Collaborate with partners to identify potential local, state and federal grant opportunities for infrastructure andtransportation, and pursue appropriate opportunities
Complete a comprehensive user fee analysis of all City user fees to ensure alignment of fees with the User FeePolicy and implement consistent review periods *
2C: Improve access to and connectivity of multi-modal transportationSupport a long-term smart city plan that recognizes and embraces the future of rapidly changing technology intransportation, energy, and other aspects that improve the quality of life for our citizens *
Improve safety for all modes of travel include vehicular, pedestrian and bicycles throughout the city *
Enhance and preserve connectivity between trails, open spaces, parks, bike paths, historical sites and localattractions
Improve and expand transit services
Rethink and repurpose infrastructure/ utility corridors as multipurpose facilities that provide trail, open space, andpublic space amenities
* New Initiatives added in 2017
City Strategic Plan Page 1-14 2018 Budget
PARTNERS
Citizens School districts
El Paso County Sustainability-focused organizations
Infill & Revitalization Steering Committee Higher education institutions
Colorado Springs Utilities Special districts
Pikes Peak Area Council of Governments Media
Pikes Peak Rural Transportation Authority State government agencies
Federal agencies Development community
Local businesses Bicycling community
Regional Business Alliance Military installations
Downtown Partnership Civic-minded professional associations
Non-profit organizations Council of Neighbors and Organizations
2018 Budget Page 1-15 City Strategic Plan
City Strategic Plan Page 1-16 2018 Budget
PERSPECTIVE FROM 2020
Revitalized neighborhoods are walkable and bike-friendly. Our citizens have pride in theirneighborhoods, thanks to collaboration of the City’s active lifestyle community, our artsand culture organizations and the City. The City is a supportive and reliable partner to thecommunity, as we implement a comprehensive homelessness plan and improveemergency response times. Our City is accessible to all, as a result of an improvedaffordable housing stock and expansion of transit services. Citizen engagement andvolunteerism with the City fosters a collaborative environment and bolsters our communitypride.
STRATEGIC OBJECTIVES
3A: Strengthen neighborhoods through addressing homelessness,housing accessibility, improving voluntary code compliance andpublic safety-neighborhood relationships
3B: Expand and encourage citizen engagement
3C: Collaborate with other governmental agencies and militaryinstallations
2018 Budget Page 1-17 City Strategic Plan
CITY ADMINISTRATION INITIATIVES
3A: Strengthen neighborhoods through addressing homelessness, housing accessibility, improving voluntary code compliance and public safety-neighborhood relationships
Reduce homelessness through implementation of a community plan, and addressing the community need ofpermanent, supportive housing
Improve access to a broad range of quality housing that is safe, accessible and affordable *
Maintain and enhance attractive neighborhoods through City services, innovative enforcement techniques, andvoluntary compliance with City codes & regulations *
Continually build on a solid foundation of public trust and engage the community in public safety efforts
Maintain and enhance the City’s ability to prepare for, respond to, recover from, and mitigate against majoremergencies and disasters
Develop a neighborhood planning template as part of the Comprehensive Plan efforts and empower neighborhoods,in conjunction with CONO and other entities, to undertake neighborhood planning efforts
When feasible, adopt universal design principles that ensure accessibility for all for new and renovated publicfacilities, including recreational facilities and playgrounds *
3B: Expand and encourage citizen engagementUse technology to inform and engage the community
Establish a unified city-wide guideline for the public input process
Continue to enhance volunteerism within the Parks, Recreation and Cultural Services Department & Public SafetyDepartments
Work with Council to develop semi-annual educational events for boards and commissions members to learn aboutall City departments and functions
3C: Collaborate with other governmental agencies and military installationsSupport Council and work with CML on policies at the State and Federal level that impact our community
Maintain and enhance mutual aid relationships and improve interoperability among regional public safety agencies
Enhance the City’s environmental sustainability efforts in conjunction with other governmental entities
* New Initiatives added in 2017
City Strategic Plan Page 1-18 2018 Budget
PARTNERS
Citizens Higher education institutions
El Paso County Civic-minded professional associations
Council of Neighbors and Organizations Media
Pikes Peak United Way United States Olympic Committee
Non-profit organizations Sports and health organizations
Human services providers Military installations & their community organizations
Parks & trails friends groups and supporters Residential/housing associations
Downtown Partnership Religious associations/institutions
Arts & culture organizations Military installations
School districts Pikes Peak Area Council of Governments
Current City volunteers
2018 Budget Page 1-19 City Strategic Plan
City Strategic Plan Page 1-20 2018 Budget
Ensure a fiscally sustainable & resilient City that delivers consistent quality servicesand continuously seeks to improve service delivery
PERSPECTIVE FROM 2020
Citizens are able to find the information they need, find answers to questions they have,and conduct business easily with the City through improved use of the City’s website,development of a 311 system, modernization of processes, and improved accessibility toinformation and services for all. The City is efficient and effective, due to exploringcooperation and regionalism with our regional partners. Our dedicated City employeeswork cross-departmentally to ensure the City is maximizing the use of resources, and ouremployees continually seek to expand upon their skills and talents through careerdevelopment training.
STRATEGIC OBJECTIVES
4A: Support continuous improvement
4B: Leverage technology to improve service delivery
2018 Budget Page 1-21 City Strategic Plan
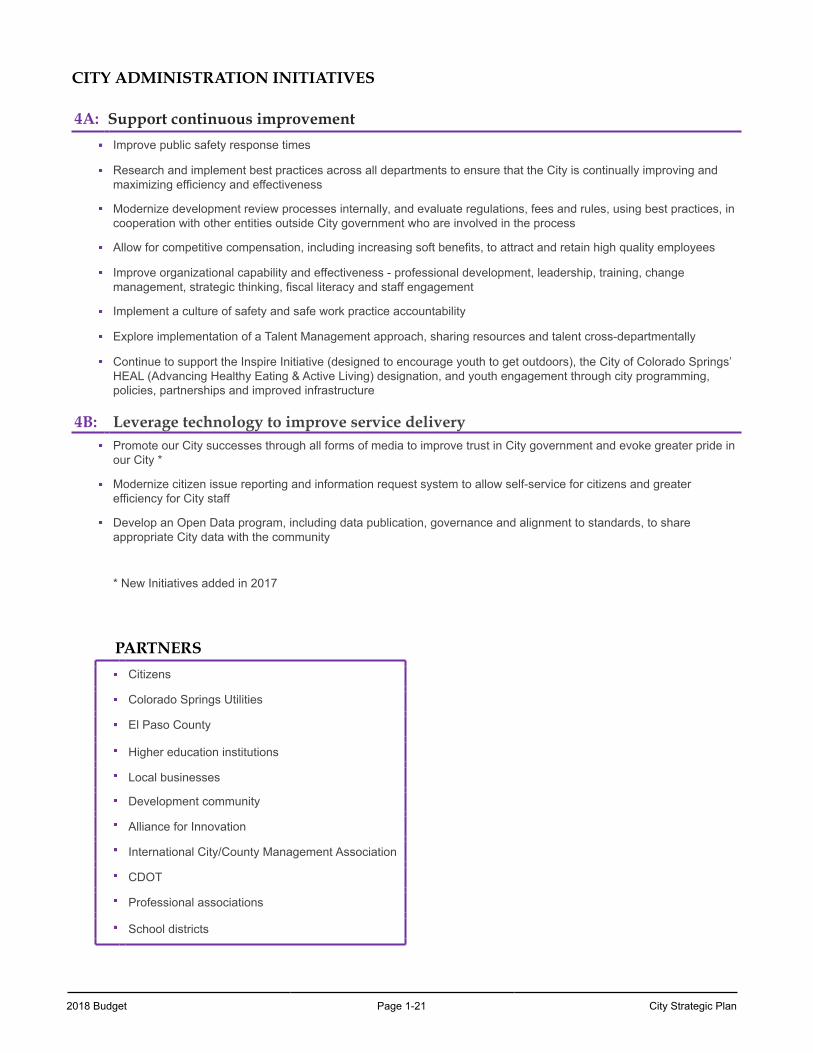
CITY ADMINISTRATION INITIATIVES
4A: Support continuous improvement
Improve public safety response times
Research and implement best practices across all departments to ensure that the City is continually improving andmaximizing efficiency and effectiveness
Modernize development review processes internally, and evaluate regulations, fees and rules, using best practices, incooperation with other entities outside City government who are involved in the process
Allow for competitive compensation, including increasing soft benefits, to attract and retain high quality employees
Improve organizational capability and effectiveness - professional development, leadership, training, changemanagement, strategic thinking, fiscal literacy and staff engagement
Implement a culture of safety and safe work practice accountability
Explore implementation of a Talent Management approach, sharing resources and talent cross-departmentally
Continue to support the Inspire Initiative (designed to encourage youth to get outdoors), the City of Colorado Springs’HEAL (Advancing Healthy Eating & Active Living) designation, and youth engagement through city programming,policies, partnerships and improved infrastructure
4B: Leverage technology to improve service deliveryPromote our City successes through all forms of media to improve trust in City government and evoke greater pride inour City *
Modernize citizen issue reporting and information request system to allow self-service for citizens and greaterefficiency for City staff
Develop an Open Data program, including data publication, governance and alignment to standards, to shareappropriate City data with the community
* New Initiatives added in 2017
PARTNERS
Citizens
Colorado Springs Utilities
El Paso County
Higher education institutions
Local businesses
Development community
Alliance for Innovation
International City/County Management Association
CDOT
Professional associations
School districts
City Strategic Plan Page 1-22 2018 Budget
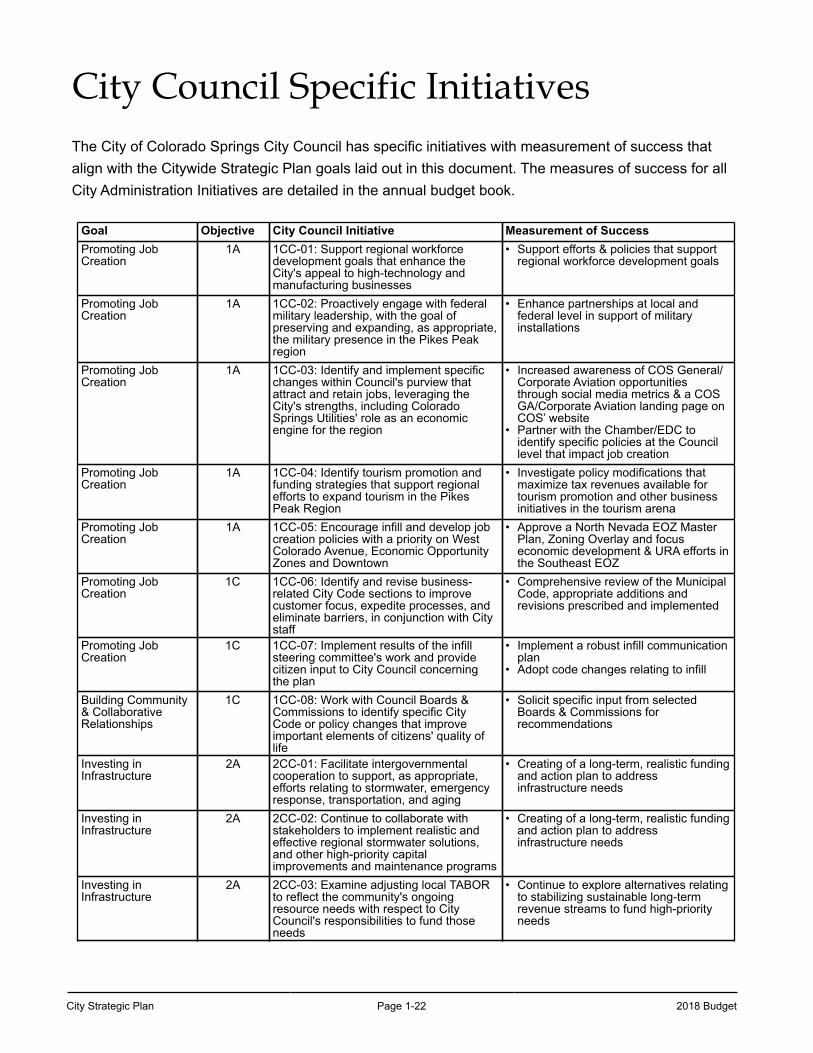
City Council Specific InitiativesThe City of Colorado Springs City Council has specific initiatives with measurement of success that align with the Citywide Strategic Plan goals laid out in this document. The measures of success for all City Administration Initiatives are detailed in the annual budget book.
Goal Objective City Council Initiative Measurement of SuccessPromoting JobCreation
1A 1CC-01: Support regional workforcedevelopment goals that enhance theCity's appeal to high-technology andmanufacturing businesses
• Support efforts & policies that support regional workforce development goals
Promoting JobCreation
1A 1CC-02: Proactively engage with federalmilitary leadership, with the goal ofpreserving and expanding, as appropriate,the military presence in the Pikes Peakregion
• Enhance partnerships at local and federal level in support of military installations
Promoting JobCreation
1A 1CC-03: Identify and implement specificchanges within Council's purview thatattract and retain jobs, leveraging theCity's strengths, including ColoradoSprings Utilities' role as an economicengine for the region
• Increased awareness of COS General/Corporate Aviation opportunities through social media metrics & a COS GA/Corporate Aviation landing page on COS’ website
• Partner with the Chamber/EDC to identify specific policies at the Council level that impact job creation
Promoting JobCreation
1A 1CC-04: Identify tourism promotion andfunding strategies that support regionalefforts to expand tourism in the PikesPeak Region
• Investigate policy modifications that maximize tax revenues available for tourism promotion and other business initiatives in the tourism arena
Promoting JobCreation
1A 1CC-05: Encourage infill and develop jobcreation policies with a priority on WestColorado Avenue, Economic OpportunityZones and Downtown
• Approve a North Nevada EOZ Master Plan, Zoning Overlay and focus economic development & URA efforts in the Southeast EOZ
Promoting JobCreation
1C 1CC-06: Identify and revise business-related City Code sections to improvecustomer focus, expedite processes, andeliminate barriers, in conjunction with Citystaff
• Comprehensive review of the Municipal Code, appropriate additions and revisions prescribed and implemented
Promoting JobCreation
1C 1CC-07: Implement results of the infillsteering committee's work and providecitizen input to City Council concerningthe plan
• Implement a robust infill communication plan
• Adopt code changes relating to infill
Building Community& CollaborativeRelationships
1C 1CC-08: Work with Council Boards &Commissions to identify specific CityCode or policy changes that improveimportant elements of citizens' quality oflife
• Solicit specific input from selected Boards & Commissions for recommendations
Investing inInfrastructure
2A 2CC-01: Facilitate intergovernmentalcooperation to support, as appropriate,efforts relating to stormwater, emergencyresponse, transportation, and aging
• Creating of a long-term, realistic funding and action plan to address infrastructure needs
Investing inInfrastructure
2A 2CC-02: Continue to collaborate withstakeholders to implement realistic andeffective regional stormwater solutions,and other high-priority capitalimprovements and maintenance programs
• Creating of a long-term, realistic funding and action plan to address infrastructure needs
Investing inInfrastructure
2A 2CC-03: Examine adjusting local TABORto reflect the community's ongoingresource needs with respect to CityCouncil's responsibilities to fund thoseneeds
• Continue to explore alternatives relating to stabilizing sustainable long-term revenue streams to fund high-priority needs
2018 Budget Page 1-23 City Strategic Plan
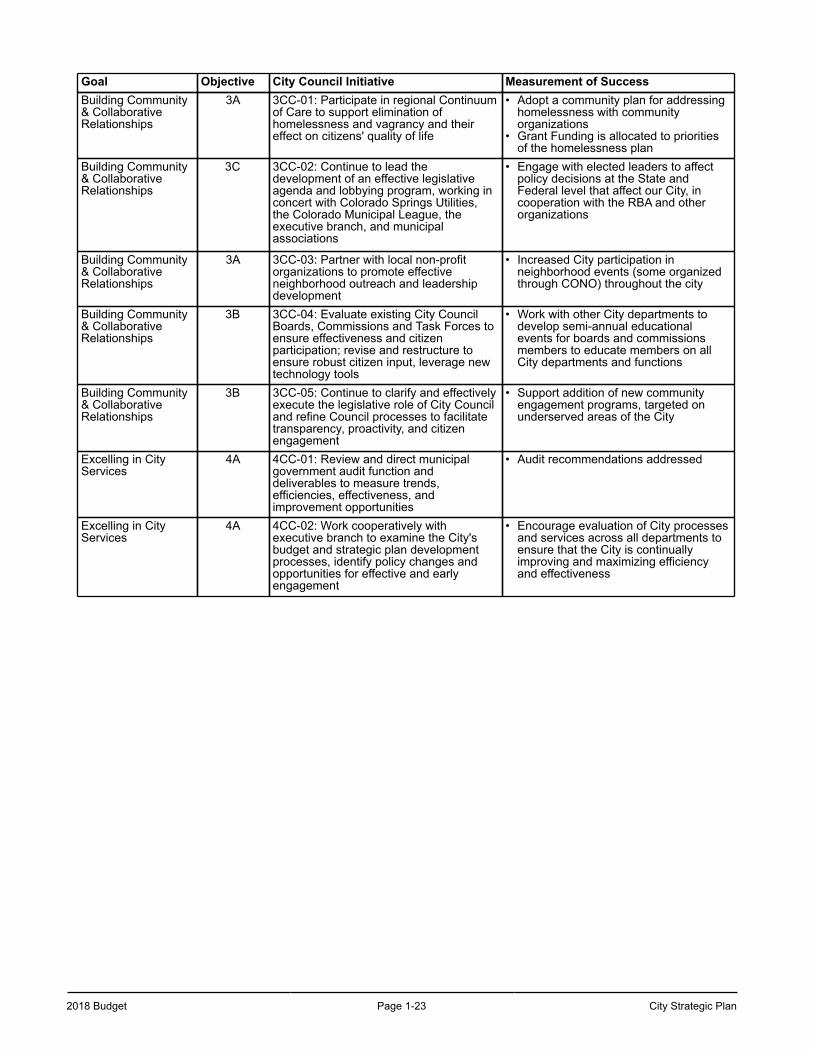
Goal Objective City Council Initiative Measurement of SuccessBuilding Community& CollaborativeRelationships
3A 3CC-01: Participate in regional Continuumof Care to support elimination ofhomelessness and vagrancy and theireffect on citizens' quality of life
• Adopt a community plan for addressing homelessness with community organizations
• Grant Funding is allocated to priorities of the homelessness plan
Building Community& CollaborativeRelationships
3C 3CC-02: Continue to lead thedevelopment of an effective legislativeagenda and lobbying program, working inconcert with Colorado Springs Utilities,the Colorado Municipal League, theexecutive branch, and municipalassociations
• Engage with elected leaders to affect policy decisions at the State and Federal level that affect our City, in cooperation with the RBA and other organizations
Building Community& CollaborativeRelationships
3A 3CC-03: Partner with local non-profitorganizations to promote effectiveneighborhood outreach and leadershipdevelopment
• Increased City participation in neighborhood events (some organized through CONO) throughout the city
Building Community& CollaborativeRelationships
3B 3CC-04: Evaluate existing City CouncilBoards, Commissions and Task Forces toensure effectiveness and citizenparticipation; revise and restructure toensure robust citizen input, leverage newtechnology tools
• Work with other City departments to develop semi-annual educational events for boards and commissions members to educate members on all City departments and functions
Building Community& CollaborativeRelationships
3B 3CC-05: Continue to clarify and effectivelyexecute the legislative role of City Counciland refine Council processes to facilitatetransparency, proactivity, and citizenengagement
• Support addition of new community engagement programs, targeted on underserved areas of the City
Excelling in CityServices
4A 4CC-01: Review and direct municipalgovernment audit function anddeliverables to measure trends,efficiencies, effectiveness, andimprovement opportunities
• Audit recommendations addressed
Excelling in CityServices
4A 4CC-02: Work cooperatively withexecutive branch to examine the City'sbudget and strategic plan developmentprocesses, identify policy changes andopportunities for effective and earlyengagement
• Encourage evaluation of City processes and services across all departments to ensure that the City is continually improving and maximizing efficiency and effectiveness
City Strategic Plan Page 1-24 2018 Budget
IMPLEMENTING OUR PLAN
The City’s Strategic Plan is a living plan that is continually refined through community input to makesure the City is meeting its overall strategic goals. You’ll see in this document an *asterisk next tonew initiatives that have been added in 2017, based on input from department managers andrepresentatives from partner agencies. Some objectives previously included have been removedas we work to refine our goals and strategies to become a world class city that matches ourmajestic scenery. Our overarching goals remain the same: Promoting Job Creation, Investing inInfrastructure, Building Community & Collaborative Relationships, and Excelling in City Services.
HOW TO GET INVOLVED
The City of Colorado Springs relies on our passionate and dedicated volunteers to help us get more done in the community. The resources below can help you get started if you want to get involved!
Community Advancing Public Safety (CAPS)
Parks, Recreation, and Cultural Services Volunteer Opportunities
Boards & Commissions
Adopt-A-Waterway
If none of these opportunities match you interest in getting involved, please email the Strategic Advisory Team at [email protected].
ACKNOWLEDGMENTS
The Strategic Plan was developed by the City’s Strategic Advisory Team, in conjunction with City Department Heads, Chiefs, and Managers, and in consultation with City Council, El Paso County, Colorado Springs Utilities and other regional governments, community organizations and stakeholders.
Strategic Advisory Team
Jay Anderson Dan SextonCheryl Callahan Andy SherwoodLieutenant Dave Edmondson Julie SmithEmily Evans Ryan TrujilloKatie Lally Nina VetterDan Lynch Jariah WalkerJacquelyn Puett Peter WysockiAndy Richter
2018 Budget Page 1-25 City Strategic Plan
City of Colorado Springs 2016-2020 Strategic PlanMayor John Suthers
Carey, Peter Police Chief
Collas, Ted Fire Chief
Waters, Bret Deputy Chief of Staff
Easton, Travis Director, Public Works
Fabos, Jamie Chief Communications Officer
Phillips, Greg Aviation Director
Johnson, Sarah City Clerk
Kane II, HayDen W. Presiding Municipal Court Judge
Massey, Wynetta City Attorney
Nehls, Carl Chief Information Officer
Palus, Karen Director, Parks, Recreation and Cultural Services
Vacant Chief Financial Officer
Sullivan, Mike Director, Human Resources
Vacant Director, Office of Emergency Management
Wysocki, Peter Director, Planning and Development

City Strategic Plan Page 1-26 2018 Budget
This page left blank intentionally.
2018 Budget Page 1-27 Performance Measures
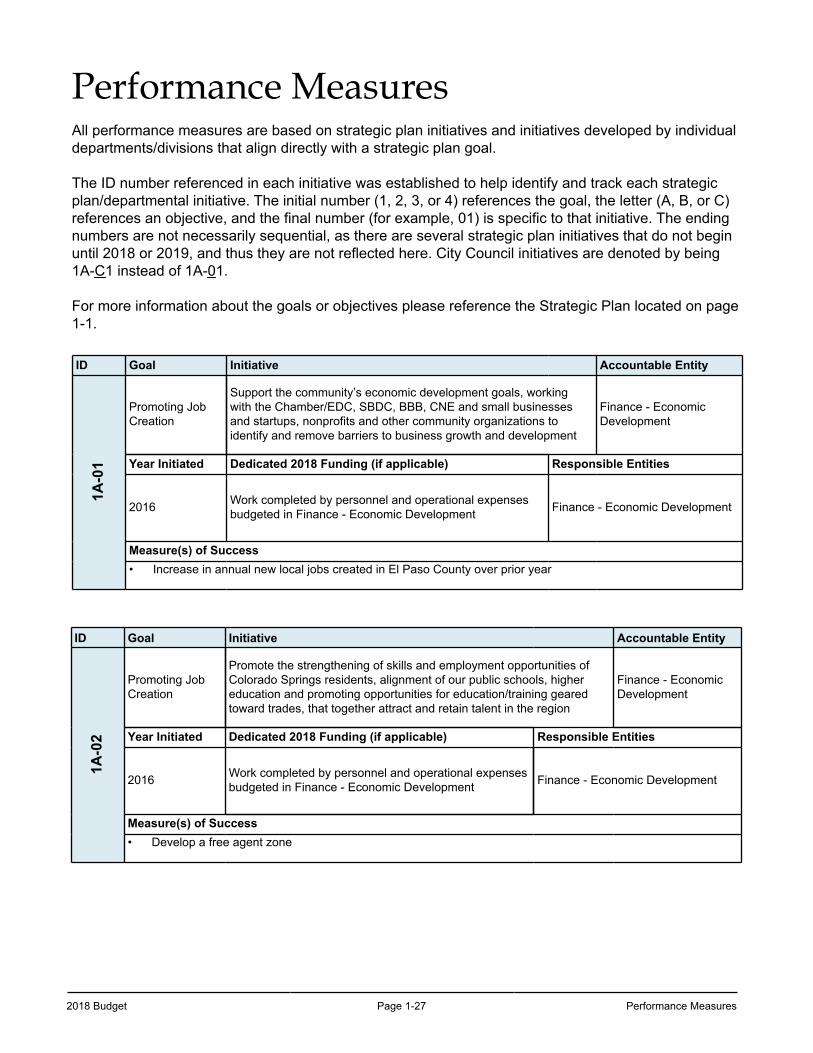
Performance MeasuresAll performance measures are based on strategic plan initiatives and initiatives developed by individual departments/divisions that align directly with a strategic plan goal.
The ID number referenced in each initiative was established to help identify and track each strategic plan/departmental initiative. The initial number (1, 2, 3, or 4) references the goal, the letter (A, B, or C) references an objective, and the final number (for example, 01) is specific to that initiative. The ending numbers are not necessarily sequential, as there are several strategic plan initiatives that do not begin until 2018 or 2019, and thus they are not reflected here. City Council initiatives are denoted by being 1A-C1 instead of 1A-01.
For more information about the goals or objectives please reference the Strategic Plan located on page 1-1.
ID Goal Initiative Accountable Entity
1A-0
1
Promoting JobCreation
Support the community’s economic development goals, workingwith the Chamber/EDC, SBDC, BBB, CNE and small businessesand startups, nonprofits and other community organizations toidentify and remove barriers to business growth and development
Finance - EconomicDevelopment
Year Initiated Dedicated 2018 Funding (if applicable) Responsible Entities
2016 Work completed by personnel and operational expensesbudgeted in Finance - Economic Development Finance - Economic Development
Measure(s) of Success• Increase in annual new local jobs created in El Paso County over prior year
ID Goal Initiative Accountable Entity
1A-0
2
Promoting JobCreation
Promote the strengthening of skills and employment opportunities ofColorado Springs residents, alignment of our public schools, highereducation and promoting opportunities for education/training gearedtoward trades, that together attract and retain talent in the region
Finance - EconomicDevelopment
Year Initiated Dedicated 2018 Funding (if applicable) Responsible Entities
2016 Work completed by personnel and operational expensesbudgeted in Finance - Economic Development Finance - Economic Development
Measure(s) of Success• Develop a free agent zone
Performance Measures Page 1-28 2018 Budget
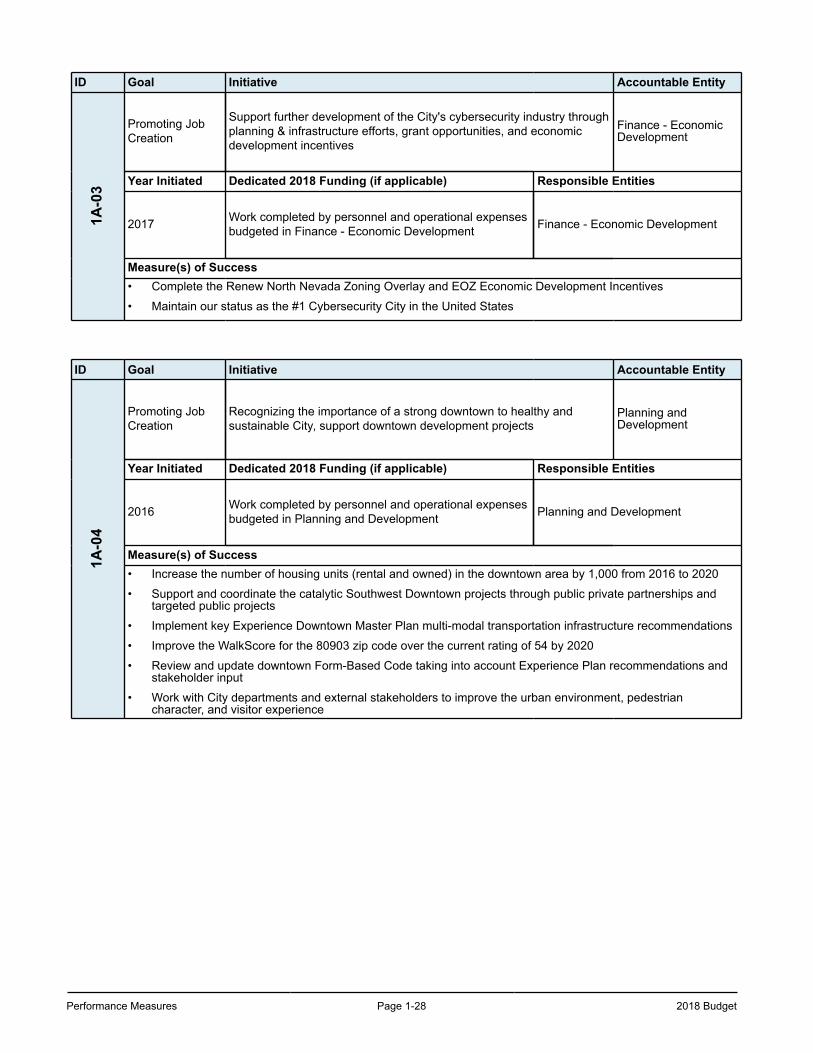
ID Goal Initiative Accountable Entity1A
-03
Promoting JobCreation
Support further development of the City's cybersecurity industry throughplanning & infrastructure efforts, grant opportunities, and economicdevelopment incentives
Finance - EconomicDevelopment
Year Initiated Dedicated 2018 Funding (if applicable) Responsible Entities
2017 Work completed by personnel and operational expensesbudgeted in Finance - Economic Development Finance - Economic Development
Measure(s) of Success• Complete the Renew North Nevada Zoning Overlay and EOZ Economic Development Incentives
• Maintain our status as the #1 Cybersecurity City in the United States
ID Goal Initiative Accountable Entity
1A-0
4
Promoting JobCreation
Recognizing the importance of a strong downtown to healthy andsustainable City, support downtown development projects
Planning andDevelopment
Year Initiated Dedicated 2018 Funding (if applicable) Responsible Entities
2016 Work completed by personnel and operational expensesbudgeted in Planning and Development Planning and Development
Measure(s) of Success• Increase the number of housing units (rental and owned) in the downtown area by 1,000 from 2016 to 2020
• Support and coordinate the catalytic Southwest Downtown projects through public private partnerships and targeted public projects
• Implement key Experience Downtown Master Plan multi-modal transportation infrastructure recommendations
• Improve the WalkScore for the 80903 zip code over the current rating of 54 by 2020
• Review and update downtown Form-Based Code taking into account Experience Plan recommendations and stakeholder input
• Work with City departments and external stakeholders to improve the urban environment, pedestrian character, and visitor experience
2018 Budget Page 1-29 Performance Measures
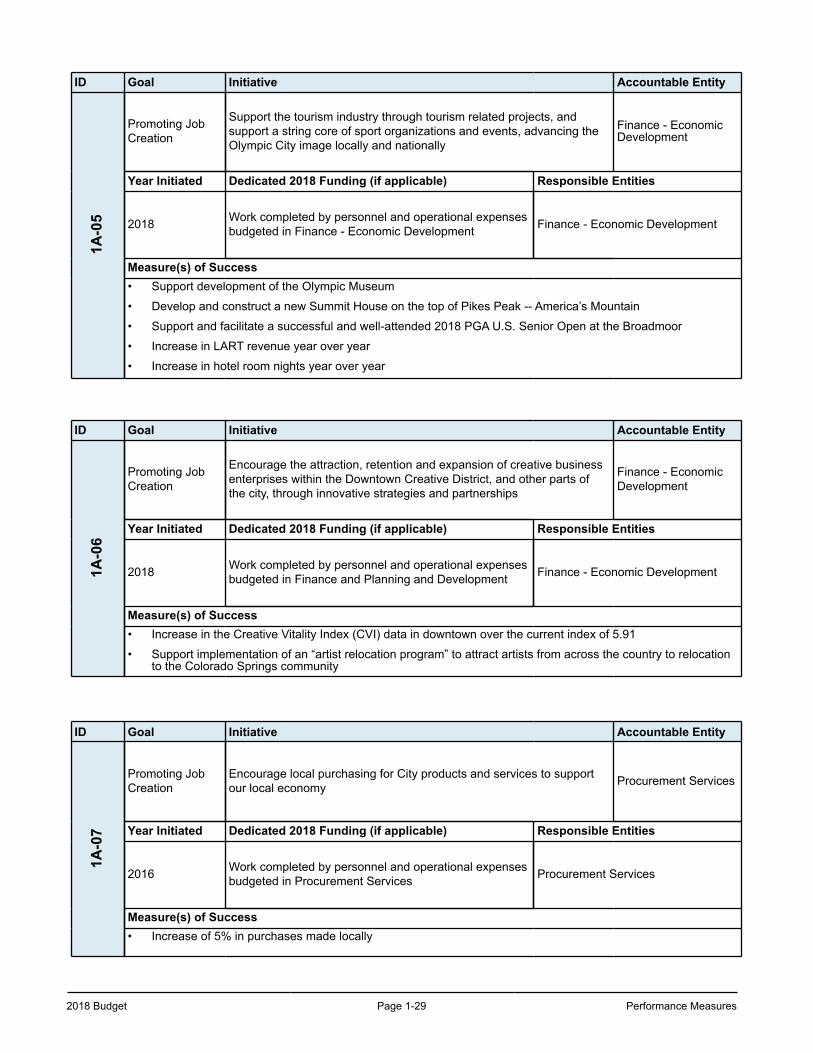
ID Goal Initiative Accountable Entity1A
-05
Promoting JobCreation
Support the tourism industry through tourism related projects, andsupport a string core of sport organizations and events, advancing theOlympic City image locally and nationally
Finance - EconomicDevelopment
Year Initiated Dedicated 2018 Funding (if applicable) Responsible Entities
2018 Work completed by personnel and operational expensesbudgeted in Finance - Economic Development Finance - Economic Development
Measure(s) of Success• Support development of the Olympic Museum
• Develop and construct a new Summit House on the top of Pikes Peak -- America’s Mountain
• Support and facilitate a successful and well-attended 2018 PGA U.S. Senior Open at the Broadmoor
• Increase in LART revenue year over year
• Increase in hotel room nights year over year
ID Goal Initiative Accountable Entity
1A-0
6
Promoting JobCreation
Encourage the attraction, retention and expansion of creative businessenterprises within the Downtown Creative District, and other parts ofthe city, through innovative strategies and partnerships
Finance - EconomicDevelopment
Year Initiated Dedicated 2018 Funding (if applicable) Responsible Entities
2018 Work completed by personnel and operational expensesbudgeted in Finance and Planning and Development Finance - Economic Development
Measure(s) of Success• Increase in the Creative Vitality Index (CVI) data in downtown over the current index of 5.91
• Support implementation of an “artist relocation program” to attract artists from across the country to relocation to the Colorado Springs community
ID Goal Initiative Accountable Entity
1A-0
7
Promoting JobCreation
Encourage local purchasing for City products and services to supportour local economy Procurement Services
Year Initiated Dedicated 2018 Funding (if applicable) Responsible Entities
2016 Work completed by personnel and operational expensesbudgeted in Procurement Services Procurement Services
Measure(s) of Success• Increase of 5% in purchases made locally
Performance Measures Page 1-30 2018 Budget
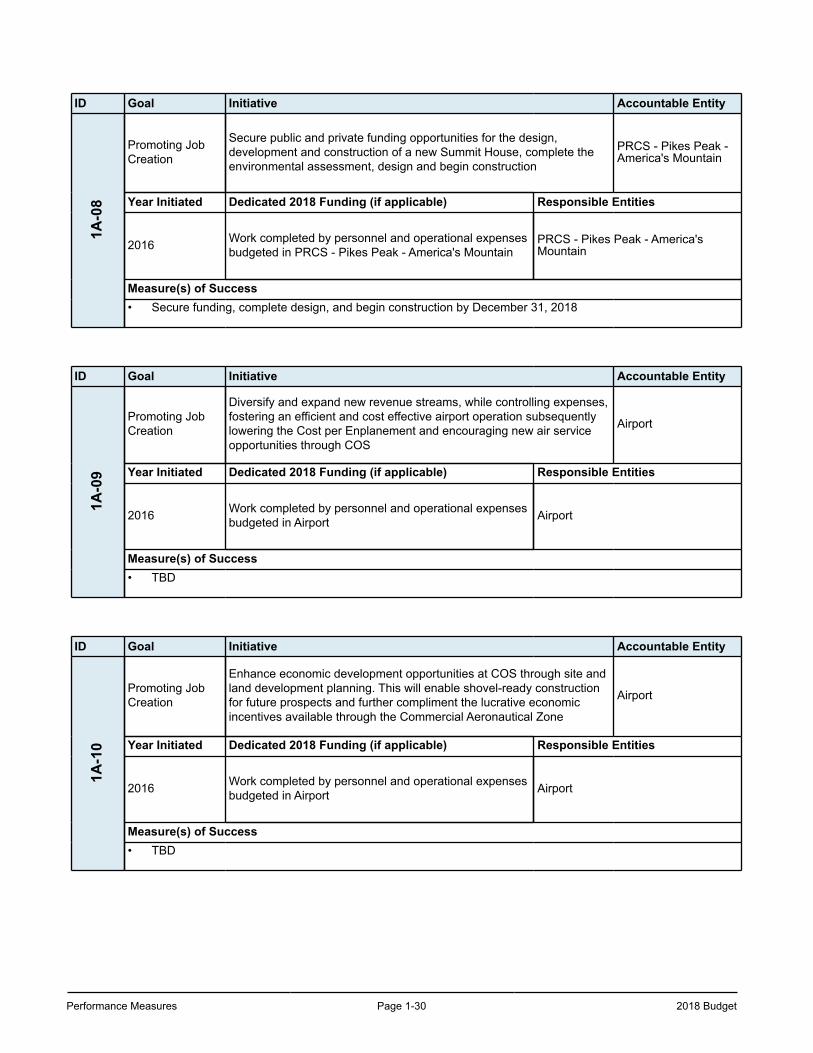
ID Goal Initiative Accountable Entity1A
-08
Promoting JobCreation
Secure public and private funding opportunities for the design,development and construction of a new Summit House, complete theenvironmental assessment, design and begin construction
PRCS - Pikes Peak -America's Mountain
Year Initiated Dedicated 2018 Funding (if applicable) Responsible Entities
2016 Work completed by personnel and operational expensesbudgeted in PRCS - Pikes Peak - America's Mountain
PRCS - Pikes Peak - America'sMountain
Measure(s) of Success• Secure funding, complete design, and begin construction by December 31, 2018
ID Goal Initiative Accountable Entity
1A-0
9
Promoting JobCreation
Diversify and expand new revenue streams, while controlling expenses,fostering an efficient and cost effective airport operation subsequentlylowering the Cost per Enplanement and encouraging new air serviceopportunities through COS
Airport
Year Initiated Dedicated 2018 Funding (if applicable) Responsible Entities
2016 Work completed by personnel and operational expensesbudgeted in Airport Airport
Measure(s) of Success• TBD
ID Goal Initiative Accountable Entity
1A-1
0
Promoting JobCreation
Enhance economic development opportunities at COS through site andland development planning. This will enable shovel-ready constructionfor future prospects and further compliment the lucrative economicincentives available through the Commercial Aeronautical Zone
Airport
Year Initiated Dedicated 2018 Funding (if applicable) Responsible Entities
2016 Work completed by personnel and operational expensesbudgeted in Airport Airport
Measure(s) of Success• TBD
2018 Budget Page 1-31 Performance Measures
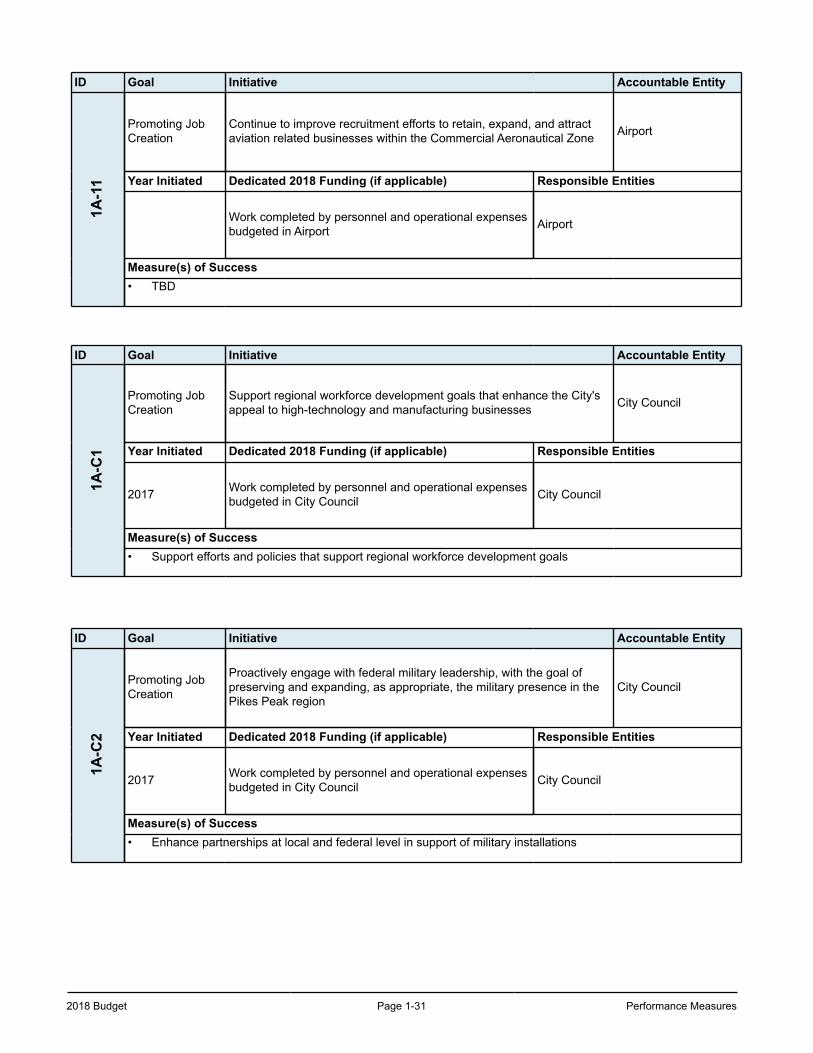
ID Goal Initiative Accountable Entity1A
-11
Promoting JobCreation
Continue to improve recruitment efforts to retain, expand, and attractaviation related businesses within the Commercial Aeronautical Zone Airport
Year Initiated Dedicated 2018 Funding (if applicable) Responsible Entities
Work completed by personnel and operational expensesbudgeted in Airport Airport
Measure(s) of Success• TBD
ID Goal Initiative Accountable Entity
1A-C
1
Promoting JobCreation
Support regional workforce development goals that enhance the City'sappeal to high-technology and manufacturing businesses City Council
Year Initiated Dedicated 2018 Funding (if applicable) Responsible Entities
2017 Work completed by personnel and operational expensesbudgeted in City Council City Council
Measure(s) of Success• Support efforts and policies that support regional workforce development goals
ID Goal Initiative Accountable Entity
1A-C
2
Promoting JobCreation
Proactively engage with federal military leadership, with the goal ofpreserving and expanding, as appropriate, the military presence in thePikes Peak region
City Council
Year Initiated Dedicated 2018 Funding (if applicable) Responsible Entities
2017 Work completed by personnel and operational expensesbudgeted in City Council City Council
Measure(s) of Success• Enhance partnerships at local and federal level in support of military installations
Performance Measures Page 1-32 2018 Budget
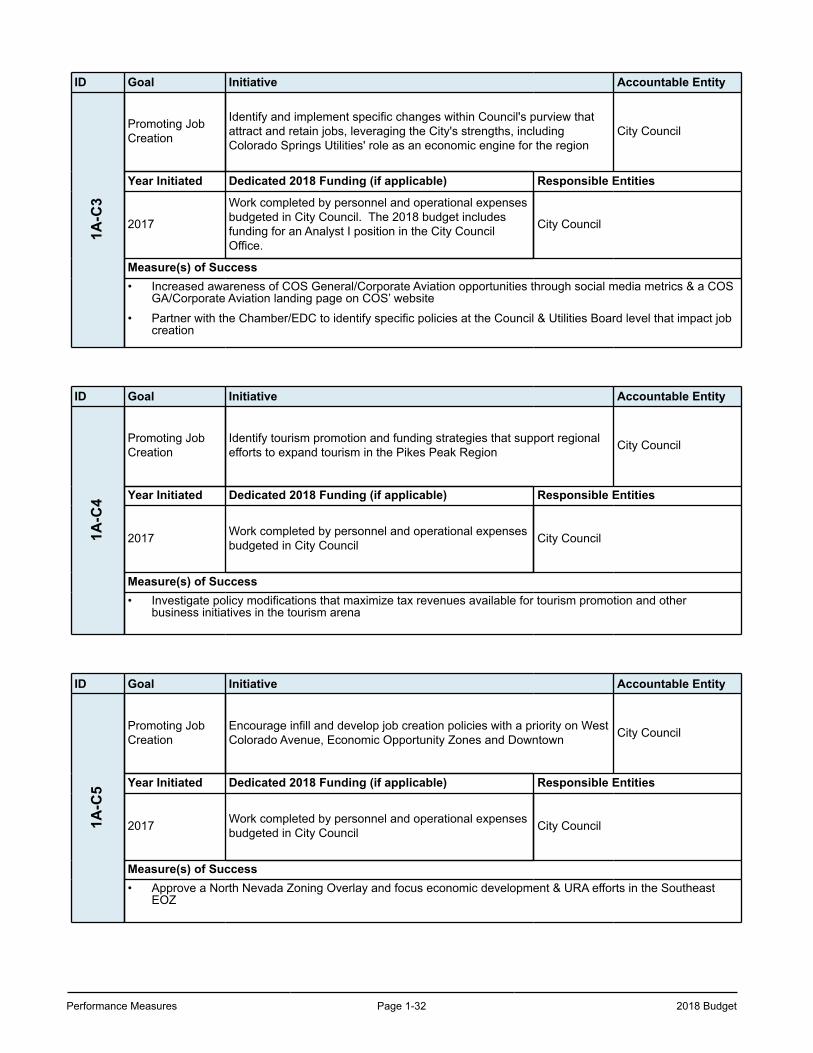
ID Goal Initiative Accountable Entity1A
-C3
Promoting JobCreation
Identify and implement specific changes within Council's purview thatattract and retain jobs, leveraging the City's strengths, includingColorado Springs Utilities' role as an economic engine for the region
City Council
Year Initiated Dedicated 2018 Funding (if applicable) Responsible Entities
2017
Work completed by personnel and operational expensesbudgeted in City Council. The 2018 budget includesfunding for an Analyst I position in the City CouncilOffice.
City Council
Measure(s) of Success• Increased awareness of COS General/Corporate Aviation opportunities through social media metrics & a COS
GA/Corporate Aviation landing page on COS’ website
• Partner with the Chamber/EDC to identify specific policies at the Council & Utilities Board level that impact job creation
ID Goal Initiative Accountable Entity
1A-C
4
Promoting JobCreation
Identify tourism promotion and funding strategies that support regionalefforts to expand tourism in the Pikes Peak Region City Council
Year Initiated Dedicated 2018 Funding (if applicable) Responsible Entities
2017 Work completed by personnel and operational expensesbudgeted in City Council City Council
Measure(s) of Success• Investigate policy modifications that maximize tax revenues available for tourism promotion and other
business initiatives in the tourism arena
ID Goal Initiative Accountable Entity
1A-C
5
Promoting JobCreation
Encourage infill and develop job creation policies with a priority on WestColorado Avenue, Economic Opportunity Zones and Downtown City Council
Year Initiated Dedicated 2018 Funding (if applicable) Responsible Entities
2017 Work completed by personnel and operational expensesbudgeted in City Council City Council
Measure(s) of Success• Approve a North Nevada Zoning Overlay and focus economic development & URA efforts in the Southeast
EOZ
2018 Budget Page 1-33 Performance Measures
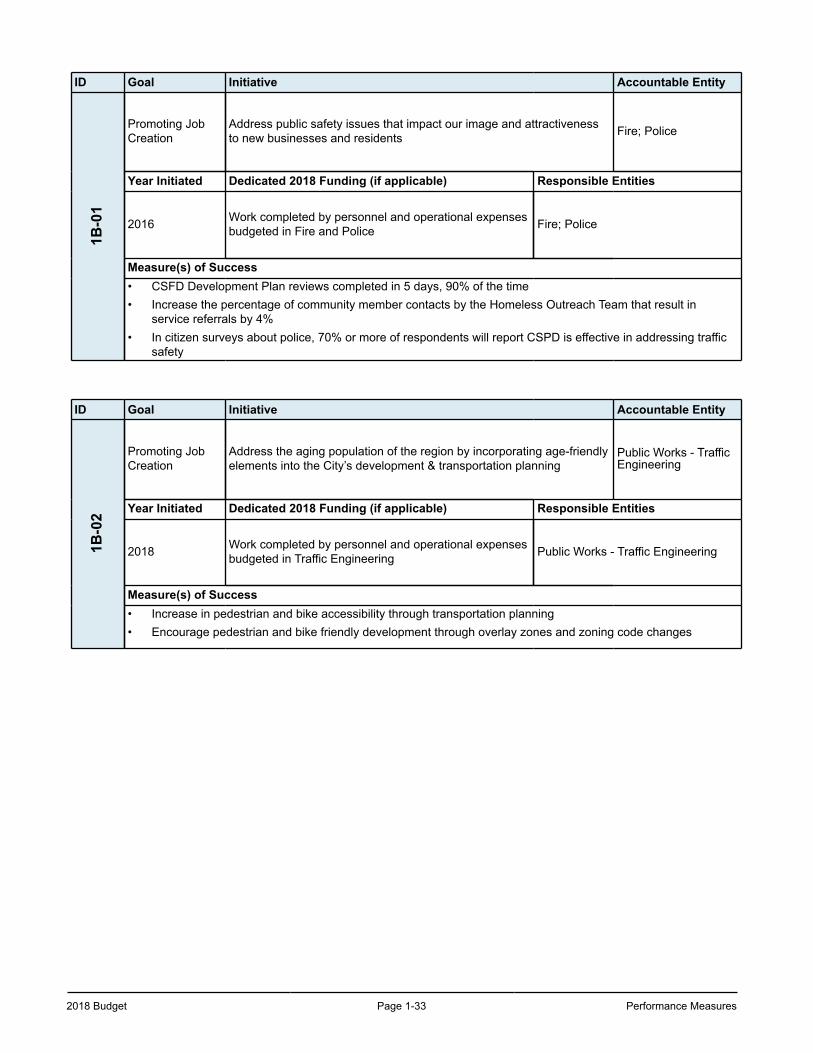
ID Goal Initiative Accountable Entity1B
-01
Promoting JobCreation
Address public safety issues that impact our image and attractivenessto new businesses and residents Fire; Police
Year Initiated Dedicated 2018 Funding (if applicable) Responsible Entities
2016 Work completed by personnel and operational expensesbudgeted in Fire and Police Fire; Police
Measure(s) of Success• CSFD Development Plan reviews completed in 5 days, 90% of the time• Increase the percentage of community member contacts by the Homeless Outreach Team that result in
service referrals by 4%• In citizen surveys about police, 70% or more of respondents will report CSPD is effective in addressing traffic
safety
ID Goal Initiative Accountable Entity
1B-0
2
Promoting JobCreation
Address the aging population of the region by incorporating age-friendlyelements into the City’s development & transportation planning
Public Works - TrafficEngineering
Year Initiated Dedicated 2018 Funding (if applicable) Responsible Entities
2018 Work completed by personnel and operational expensesbudgeted in Traffic Engineering Public Works - Traffic Engineering
Measure(s) of Success• Increase in pedestrian and bike accessibility through transportation planning • Encourage pedestrian and bike friendly development through overlay zones and zoning code changes
Performance Measures Page 1-34 2018 Budget
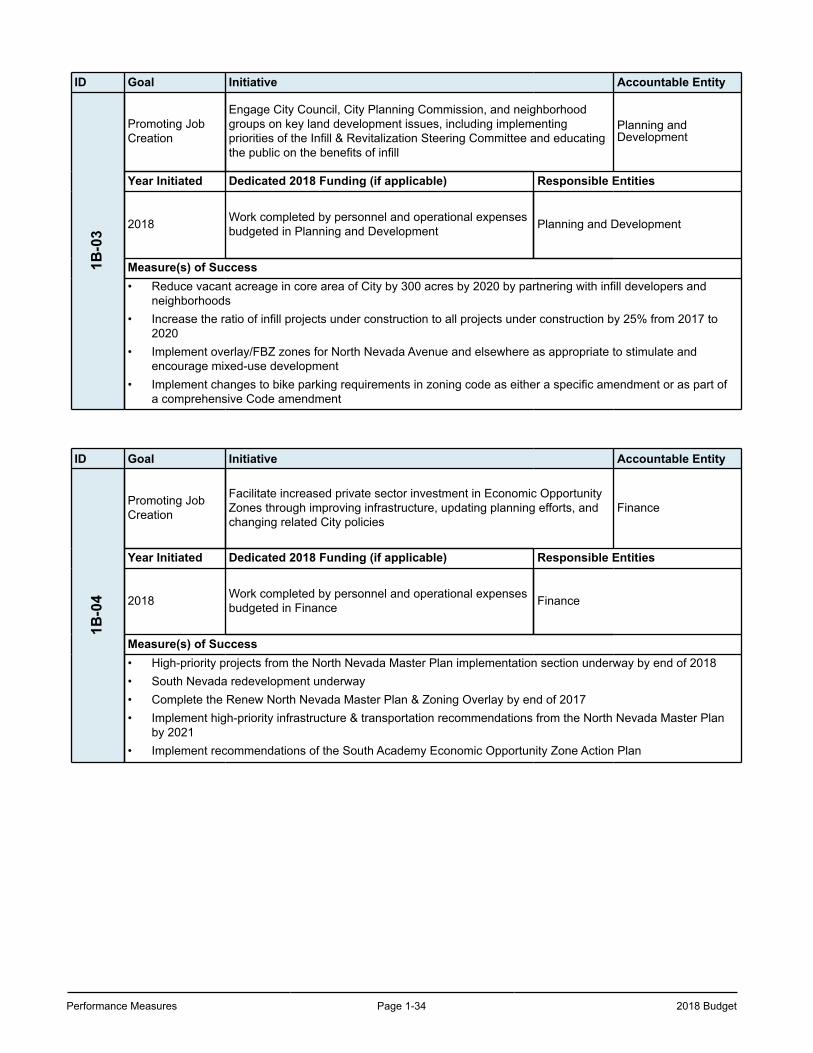
ID Goal Initiative Accountable Entity1B
-03
Promoting JobCreation
Engage City Council, City Planning Commission, and neighborhoodgroups on key land development issues, including implementingpriorities of the Infill & Revitalization Steering Committee and educatingthe public on the benefits of infill
Planning andDevelopment
Year Initiated Dedicated 2018 Funding (if applicable) Responsible Entities
2018 Work completed by personnel and operational expensesbudgeted in Planning and Development Planning and Development
Measure(s) of Success• Reduce vacant acreage in core area of City by 300 acres by 2020 by partnering with infill developers and
neighborhoods • Increase the ratio of infill projects under construction to all projects under construction by 25% from 2017 to
2020• Implement overlay/FBZ zones for North Nevada Avenue and elsewhere as appropriate to stimulate and
encourage mixed-use development • Implement changes to bike parking requirements in zoning code as either a specific amendment or as part of
a comprehensive Code amendment
ID Goal Initiative Accountable Entity
1B-0
4
Promoting JobCreation
Facilitate increased private sector investment in Economic OpportunityZones through improving infrastructure, updating planning efforts, andchanging related City policies
Finance
Year Initiated Dedicated 2018 Funding (if applicable) Responsible Entities
2018 Work completed by personnel and operational expensesbudgeted in Finance Finance
Measure(s) of Success• High-priority projects from the North Nevada Master Plan implementation section underway by end of 2018• South Nevada redevelopment underway• Complete the Renew North Nevada Master Plan & Zoning Overlay by end of 2017• Implement high-priority infrastructure & transportation recommendations from the North Nevada Master Plan
by 2021 • Implement recommendations of the South Academy Economic Opportunity Zone Action Plan
2018 Budget Page 1-35 Performance Measures
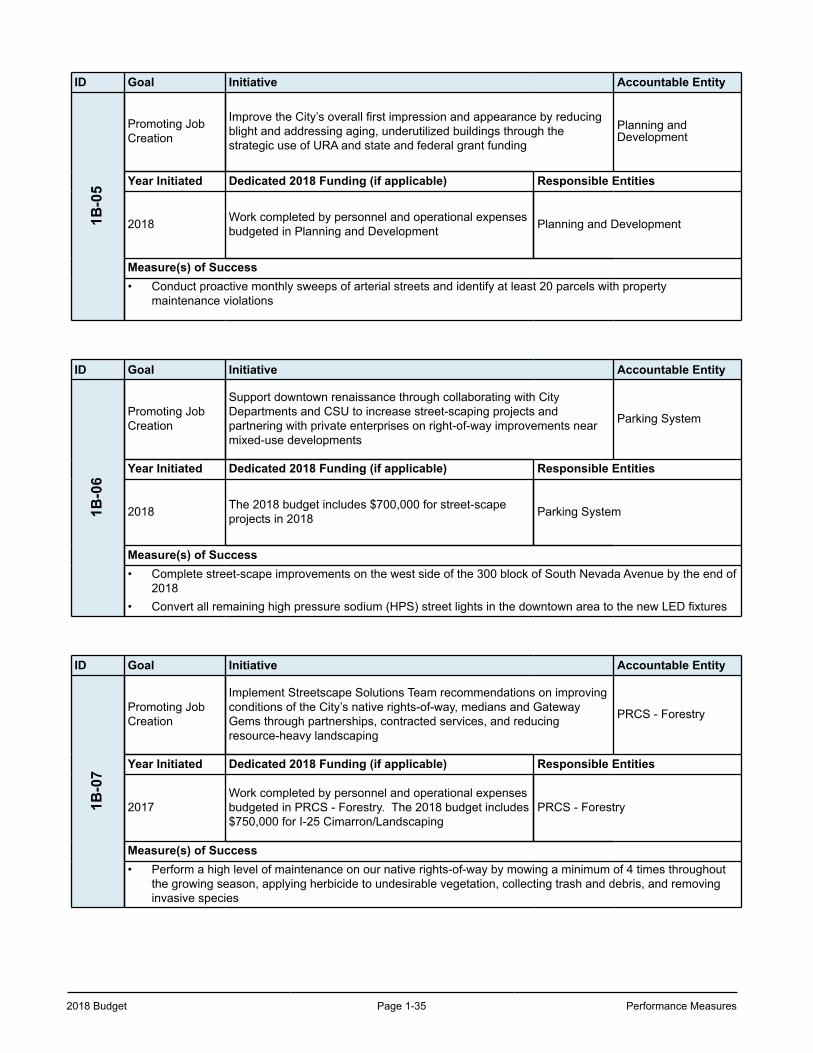
ID Goal Initiative Accountable Entity1B
-05
Promoting JobCreation
Improve the City’s overall first impression and appearance by reducingblight and addressing aging, underutilized buildings through thestrategic use of URA and state and federal grant funding
Planning andDevelopment
Year Initiated Dedicated 2018 Funding (if applicable) Responsible Entities
2018 Work completed by personnel and operational expensesbudgeted in Planning and Development Planning and Development
Measure(s) of Success• Conduct proactive monthly sweeps of arterial streets and identify at least 20 parcels with property
maintenance violations
ID Goal Initiative Accountable Entity
1B-0
6
Promoting JobCreation
Support downtown renaissance through collaborating with CityDepartments and CSU to increase street-scaping projects andpartnering with private enterprises on right-of-way improvements nearmixed-use developments
Parking System
Year Initiated Dedicated 2018 Funding (if applicable) Responsible Entities
2018 The 2018 budget includes $700,000 for street-scapeprojects in 2018 Parking System
Measure(s) of Success• Complete street-scape improvements on the west side of the 300 block of South Nevada Avenue by the end of
2018• Convert all remaining high pressure sodium (HPS) street lights in the downtown area to the new LED fixtures
ID Goal Initiative Accountable Entity
1B-0
7
Promoting JobCreation
Implement Streetscape Solutions Team recommendations on improvingconditions of the City’s native rights-of-way, medians and GatewayGems through partnerships, contracted services, and reducingresource-heavy landscaping
PRCS - Forestry
Year Initiated Dedicated 2018 Funding (if applicable) Responsible Entities
2017Work completed by personnel and operational expensesbudgeted in PRCS - Forestry. The 2018 budget includes$750,000 for I-25 Cimarron/Landscaping
PRCS - Forestry
Measure(s) of Success• Perform a high level of maintenance on our native rights-of-way by mowing a minimum of 4 times throughout
the growing season, applying herbicide to undesirable vegetation, collecting trash and debris, and removing invasive species
Performance Measures Page 1-36 2018 Budget
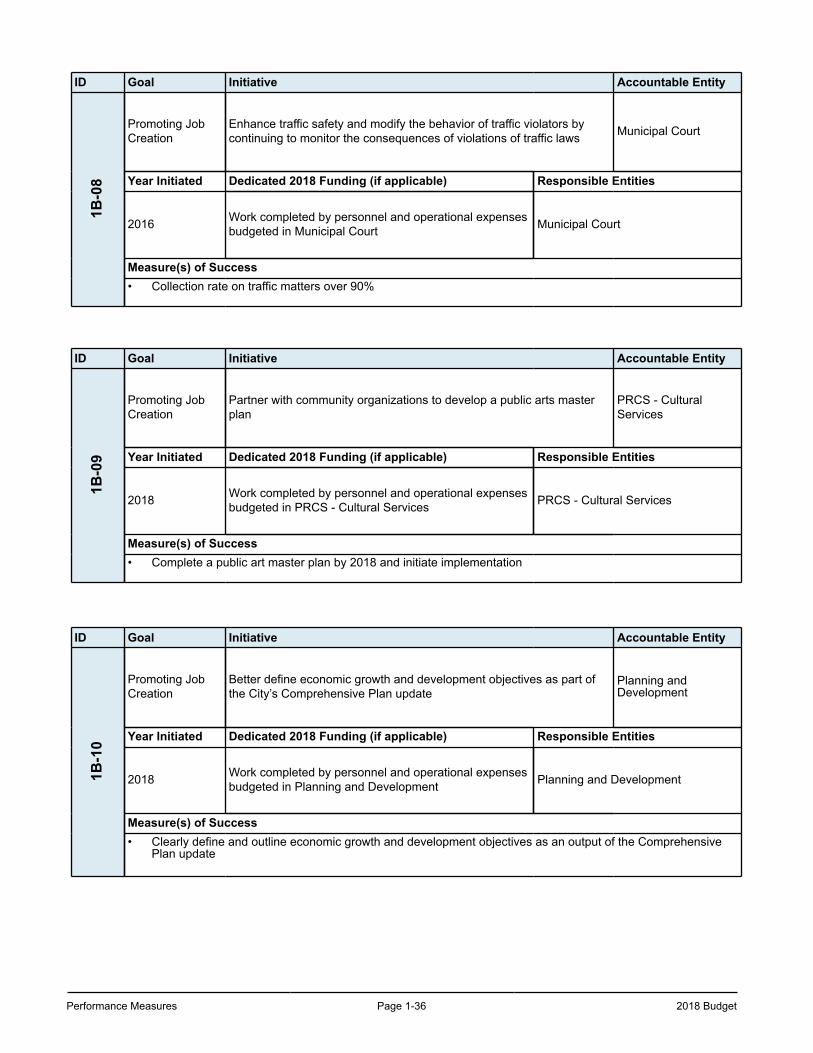
ID Goal Initiative Accountable Entity1B
-08
Promoting JobCreation
Enhance traffic safety and modify the behavior of traffic violators bycontinuing to monitor the consequences of violations of traffic laws Municipal Court
Year Initiated Dedicated 2018 Funding (if applicable) Responsible Entities
2016 Work completed by personnel and operational expensesbudgeted in Municipal Court Municipal Court
Measure(s) of Success• Collection rate on traffic matters over 90%
ID Goal Initiative Accountable Entity
1B-0
9
Promoting JobCreation
Partner with community organizations to develop a public arts masterplan
PRCS - CulturalServices
Year Initiated Dedicated 2018 Funding (if applicable) Responsible Entities
2018 Work completed by personnel and operational expensesbudgeted in PRCS - Cultural Services PRCS - Cultural Services
Measure(s) of Success• Complete a public art master plan by 2018 and initiate implementation
ID Goal Initiative Accountable Entity
1B-1
0
Promoting JobCreation
Better define economic growth and development objectives as part ofthe City’s Comprehensive Plan update
Planning andDevelopment
Year Initiated Dedicated 2018 Funding (if applicable) Responsible Entities
2018 Work completed by personnel and operational expensesbudgeted in Planning and Development Planning and Development
Measure(s) of Success• Clearly define and outline economic growth and development objectives as an output of the Comprehensive
Plan update
2018 Budget Page 1-37 Performance Measures
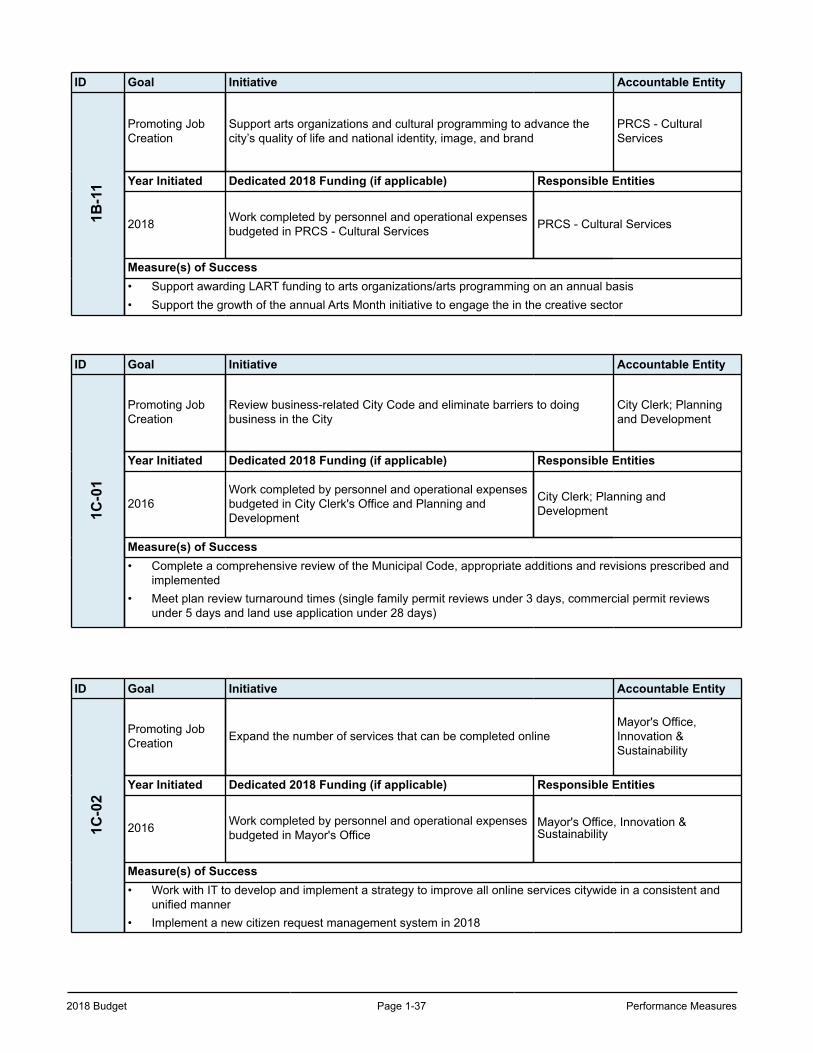
ID Goal Initiative Accountable Entity1B
-11
Promoting JobCreation
Support arts organizations and cultural programming to advance thecity’s quality of life and national identity, image, and brand
PRCS - CulturalServices
Year Initiated Dedicated 2018 Funding (if applicable) Responsible Entities
2018 Work completed by personnel and operational expensesbudgeted in PRCS - Cultural Services PRCS - Cultural Services
Measure(s) of Success• Support awarding LART funding to arts organizations/arts programming on an annual basis• Support the growth of the annual Arts Month initiative to engage the in the creative sector
ID Goal Initiative Accountable Entity
1C-0
1
Promoting JobCreation
Review business-related City Code and eliminate barriers to doingbusiness in the City
City Clerk; Planningand Development
Year Initiated Dedicated 2018 Funding (if applicable) Responsible Entities
2016Work completed by personnel and operational expensesbudgeted in City Clerk's Office and Planning andDevelopment
City Clerk; Planning andDevelopment
Measure(s) of Success• Complete a comprehensive review of the Municipal Code, appropriate additions and revisions prescribed and
implemented• Meet plan review turnaround times (single family permit reviews under 3 days, commercial permit reviews
under 5 days and land use application under 28 days)
ID Goal Initiative Accountable Entity
1C-0
2
Promoting JobCreation Expand the number of services that can be completed online
Mayor's Office,Innovation &Sustainability
Year Initiated Dedicated 2018 Funding (if applicable) Responsible Entities
2016 Work completed by personnel and operational expensesbudgeted in Mayor's Office
Mayor's Office, Innovation &Sustainability
Measure(s) of Success• Work with IT to develop and implement a strategy to improve all online services citywide in a consistent and
unified manner• Implement a new citizen request management system in 2018
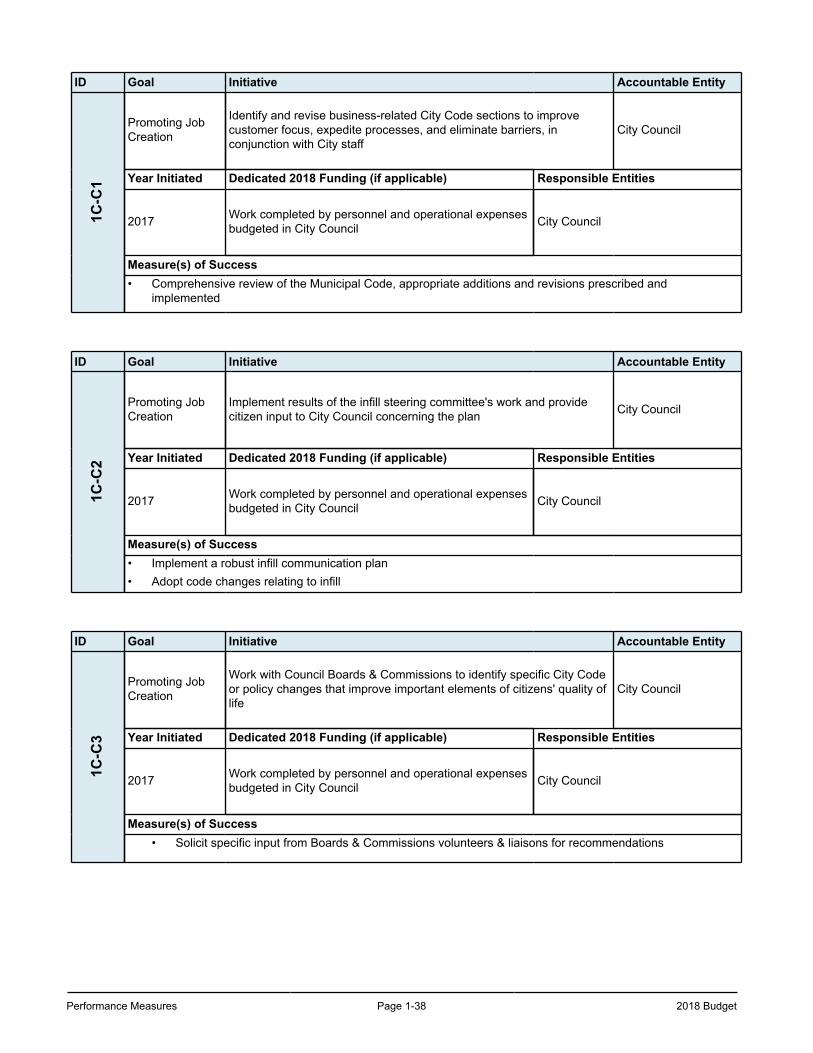
Performance Measures Page 1-38 2018 Budget
ID Goal Initiative Accountable Entity1C
-C1
Promoting JobCreation
Identify and revise business-related City Code sections to improvecustomer focus, expedite processes, and eliminate barriers, inconjunction with City staff
City Council
Year Initiated Dedicated 2018 Funding (if applicable) Responsible Entities
2017 Work completed by personnel and operational expensesbudgeted in City Council City Council
Measure(s) of Success• Comprehensive review of the Municipal Code, appropriate additions and revisions prescribed and
implemented
ID Goal Initiative Accountable Entity
1C-C
2
Promoting JobCreation
Implement results of the infill steering committee's work and providecitizen input to City Council concerning the plan City Council
Year Initiated Dedicated 2018 Funding (if applicable) Responsible Entities
2017 Work completed by personnel and operational expensesbudgeted in City Council City Council
Measure(s) of Success• Implement a robust infill communication plan • Adopt code changes relating to infill
ID Goal Initiative Accountable Entity
1C-C
3
Promoting JobCreation
Work with Council Boards & Commissions to identify specific City Codeor policy changes that improve important elements of citizens' quality oflife
City Council
Year Initiated Dedicated 2018 Funding (if applicable) Responsible Entities
2017 Work completed by personnel and operational expensesbudgeted in City Council City Council
Measure(s) of Success• Solicit specific input from Boards & Commissions volunteers & liaisons for recommendations
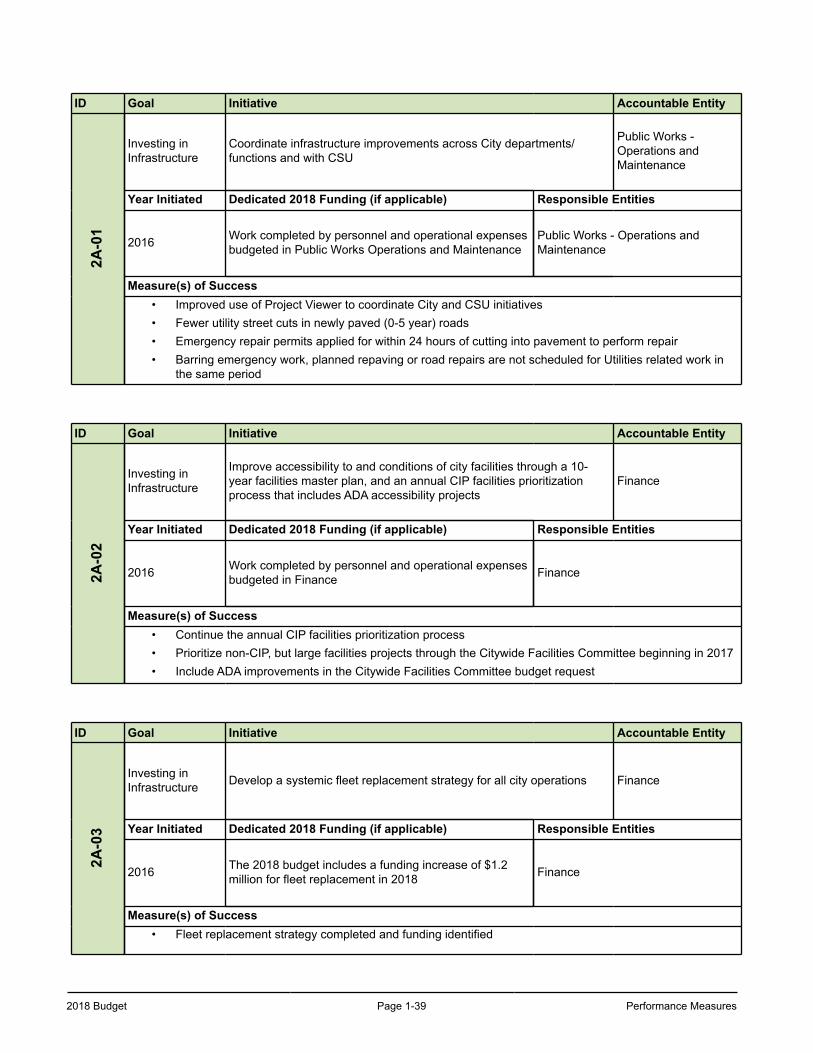
2018 Budget Page 1-39 Performance Measures
ID Goal Initiative Accountable Entity2A
-01
Investing inInfrastructure
Coordinate infrastructure improvements across City departments/functions and with CSU
Public Works -Operations andMaintenance
Year Initiated Dedicated 2018 Funding (if applicable) Responsible Entities
2016 Work completed by personnel and operational expensesbudgeted in Public Works Operations and Maintenance
Public Works - Operations andMaintenance
Measure(s) of Success• Improved use of Project Viewer to coordinate City and CSU initiatives• Fewer utility street cuts in newly paved (0-5 year) roads• Emergency repair permits applied for within 24 hours of cutting into pavement to perform repair• Barring emergency work, planned repaving or road repairs are not scheduled for Utilities related work in
the same period
ID Goal Initiative Accountable Entity
2A-0
2
Investing inInfrastructure
Improve accessibility to and conditions of city facilities through a 10-year facilities master plan, and an annual CIP facilities prioritizationprocess that includes ADA accessibility projects
Finance
Year Initiated Dedicated 2018 Funding (if applicable) Responsible Entities
2016 Work completed by personnel and operational expensesbudgeted in Finance Finance
Measure(s) of Success• Continue the annual CIP facilities prioritization process• Prioritize non-CIP, but large facilities projects through the Citywide Facilities Committee beginning in 2017• Include ADA improvements in the Citywide Facilities Committee budget request
ID Goal Initiative Accountable Entity
2A-0
3
Investing inInfrastructure Develop a systemic fleet replacement strategy for all city operations Finance
Year Initiated Dedicated 2018 Funding (if applicable) Responsible Entities
2016 The 2018 budget includes a funding increase of $1.2million for fleet replacement in 2018 Finance
Measure(s) of Success• Fleet replacement strategy completed and funding identified
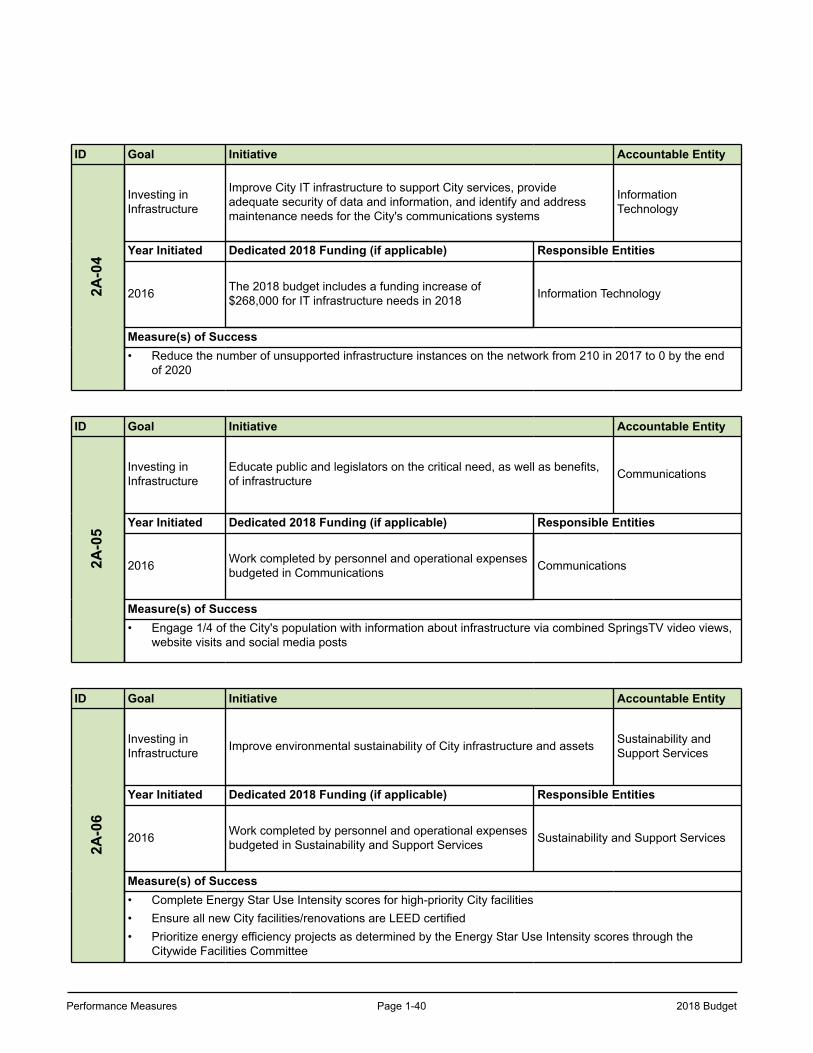
Performance Measures Page 1-40 2018 Budget
ID Goal Initiative Accountable Entity
2A-0
4
Investing inInfrastructure
Improve City IT infrastructure to support City services, provideadequate security of data and information, and identify and addressmaintenance needs for the City's communications systems
InformationTechnology
Year Initiated Dedicated 2018 Funding (if applicable) Responsible Entities
2016 The 2018 budget includes a funding increase of$268,000 for IT infrastructure needs in 2018 Information Technology
Measure(s) of Success• Reduce the number of unsupported infrastructure instances on the network from 210 in 2017 to 0 by the end
of 2020
ID Goal Initiative Accountable Entity
2A-0
5
Investing inInfrastructure
Educate public and legislators on the critical need, as well as benefits,of infrastructure Communications
Year Initiated Dedicated 2018 Funding (if applicable) Responsible Entities
2016 Work completed by personnel and operational expensesbudgeted in Communications Communications
Measure(s) of Success• Engage 1/4 of the City's population with information about infrastructure via combined SpringsTV video views,
website visits and social media posts
ID Goal Initiative Accountable Entity
2A-0
6
Investing inInfrastructure Improve environmental sustainability of City infrastructure and assets Sustainability and
Support Services
Year Initiated Dedicated 2018 Funding (if applicable) Responsible Entities
2016 Work completed by personnel and operational expensesbudgeted in Sustainability and Support Services Sustainability and Support Services
Measure(s) of Success• Complete Energy Star Use Intensity scores for high-priority City facilities• Ensure all new City facilities/renovations are LEED certified• Prioritize energy efficiency projects as determined by the Energy Star Use Intensity scores through the
Citywide Facilities Committee
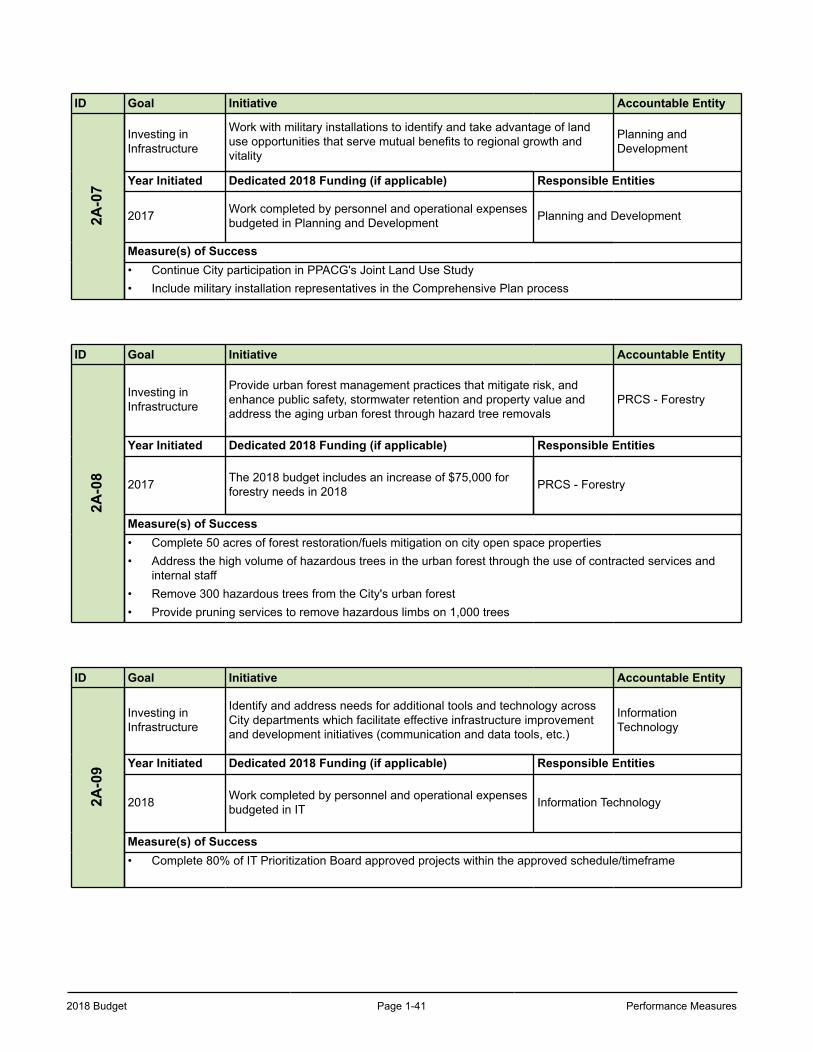
2018 Budget Page 1-41 Performance Measures
ID Goal Initiative Accountable Entity2A
-07
Investing inInfrastructure
Work with military installations to identify and take advantage of landuse opportunities that serve mutual benefits to regional growth andvitality
Planning andDevelopment
Year Initiated Dedicated 2018 Funding (if applicable) Responsible Entities
2017 Work completed by personnel and operational expensesbudgeted in Planning and Development Planning and Development
Measure(s) of Success• Continue City participation in PPACG's Joint Land Use Study• Include military installation representatives in the Comprehensive Plan process
ID Goal Initiative Accountable Entity
2A-0
8
Investing inInfrastructure
Provide urban forest management practices that mitigate risk, andenhance public safety, stormwater retention and property value andaddress the aging urban forest through hazard tree removals
PRCS - Forestry
Year Initiated Dedicated 2018 Funding (if applicable) Responsible Entities
2017 The 2018 budget includes an increase of $75,000 forforestry needs in 2018 PRCS - Forestry
Measure(s) of Success• Complete 50 acres of forest restoration/fuels mitigation on city open space properties• Address the high volume of hazardous trees in the urban forest through the use of contracted services and
internal staff• Remove 300 hazardous trees from the City's urban forest• Provide pruning services to remove hazardous limbs on 1,000 trees
ID Goal Initiative Accountable Entity
2A-0
9
Investing inInfrastructure
Identify and address needs for additional tools and technology acrossCity departments which facilitate effective infrastructure improvementand development initiatives (communication and data tools, etc.)
InformationTechnology
Year Initiated Dedicated 2018 Funding (if applicable) Responsible Entities
2018 Work completed by personnel and operational expensesbudgeted in IT Information Technology
Measure(s) of Success• Complete 80% of IT Prioritization Board approved projects within the approved schedule/timeframe
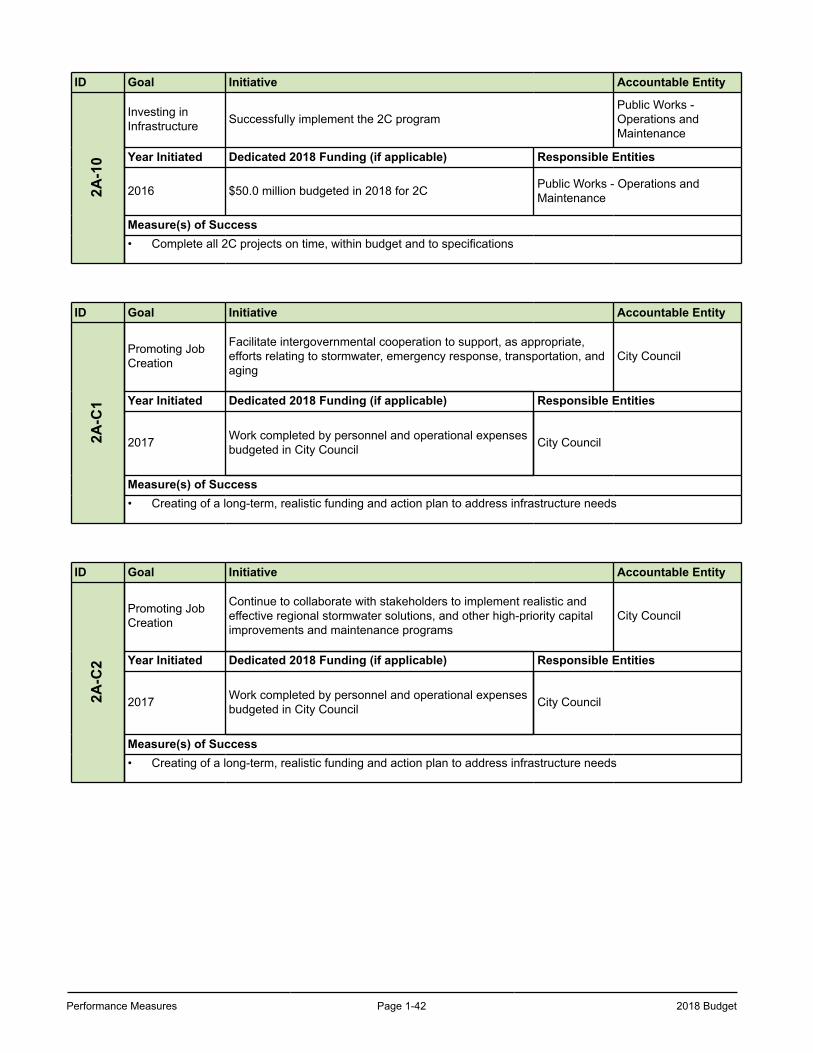
Performance Measures Page 1-42 2018 Budget
ID Goal Initiative Accountable Entity2A
-10
Investing inInfrastructure Successfully implement the 2C program
Public Works -Operations andMaintenance
Year Initiated Dedicated 2018 Funding (if applicable) Responsible Entities
2016 $50.0 million budgeted in 2018 for 2C Public Works - Operations andMaintenance
Measure(s) of Success• Complete all 2C projects on time, within budget and to specifications
ID Goal Initiative Accountable Entity
2A-C
1
Promoting JobCreation
Facilitate intergovernmental cooperation to support, as appropriate,efforts relating to stormwater, emergency response, transportation, andaging
City Council
Year Initiated Dedicated 2018 Funding (if applicable) Responsible Entities
2017 Work completed by personnel and operational expensesbudgeted in City Council City Council
Measure(s) of Success• Creating of a long-term, realistic funding and action plan to address infrastructure needs
ID Goal Initiative Accountable Entity
2A-C
2
Promoting JobCreation
Continue to collaborate with stakeholders to implement realistic andeffective regional stormwater solutions, and other high-priority capitalimprovements and maintenance programs
City Council
Year Initiated Dedicated 2018 Funding (if applicable) Responsible Entities
2017 Work completed by personnel and operational expensesbudgeted in City Council City Council
Measure(s) of Success• Creating of a long-term, realistic funding and action plan to address infrastructure needs
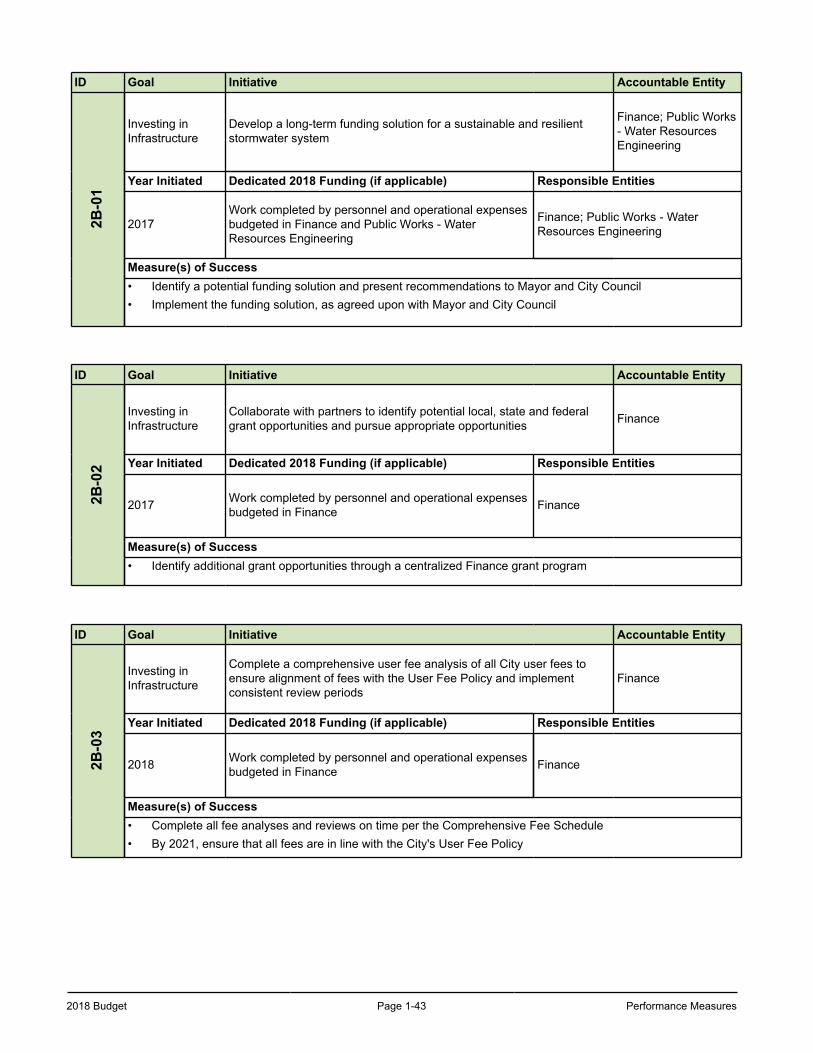
2018 Budget Page 1-43 Performance Measures
ID Goal Initiative Accountable Entity2B
-01
Investing inInfrastructure
Develop a long-term funding solution for a sustainable and resilientstormwater system
Finance; Public Works- Water ResourcesEngineering
Year Initiated Dedicated 2018 Funding (if applicable) Responsible Entities
2017Work completed by personnel and operational expensesbudgeted in Finance and Public Works - WaterResources Engineering
Finance; Public Works - WaterResources Engineering
Measure(s) of Success• Identify a potential funding solution and present recommendations to Mayor and City Council• Implement the funding solution, as agreed upon with Mayor and City Council
ID Goal Initiative Accountable Entity
2B-0
2
Investing inInfrastructure
Collaborate with partners to identify potential local, state and federalgrant opportunities and pursue appropriate opportunities Finance
Year Initiated Dedicated 2018 Funding (if applicable) Responsible Entities
2017 Work completed by personnel and operational expensesbudgeted in Finance Finance
Measure(s) of Success• Identify additional grant opportunities through a centralized Finance grant program
ID Goal Initiative Accountable Entity
2B-0
3
Investing inInfrastructure
Complete a comprehensive user fee analysis of all City user fees toensure alignment of fees with the User Fee Policy and implementconsistent review periods
Finance
Year Initiated Dedicated 2018 Funding (if applicable) Responsible Entities
2018 Work completed by personnel and operational expensesbudgeted in Finance Finance
Measure(s) of Success• Complete all fee analyses and reviews on time per the Comprehensive Fee Schedule• By 2021, ensure that all fees are in line with the City's User Fee Policy
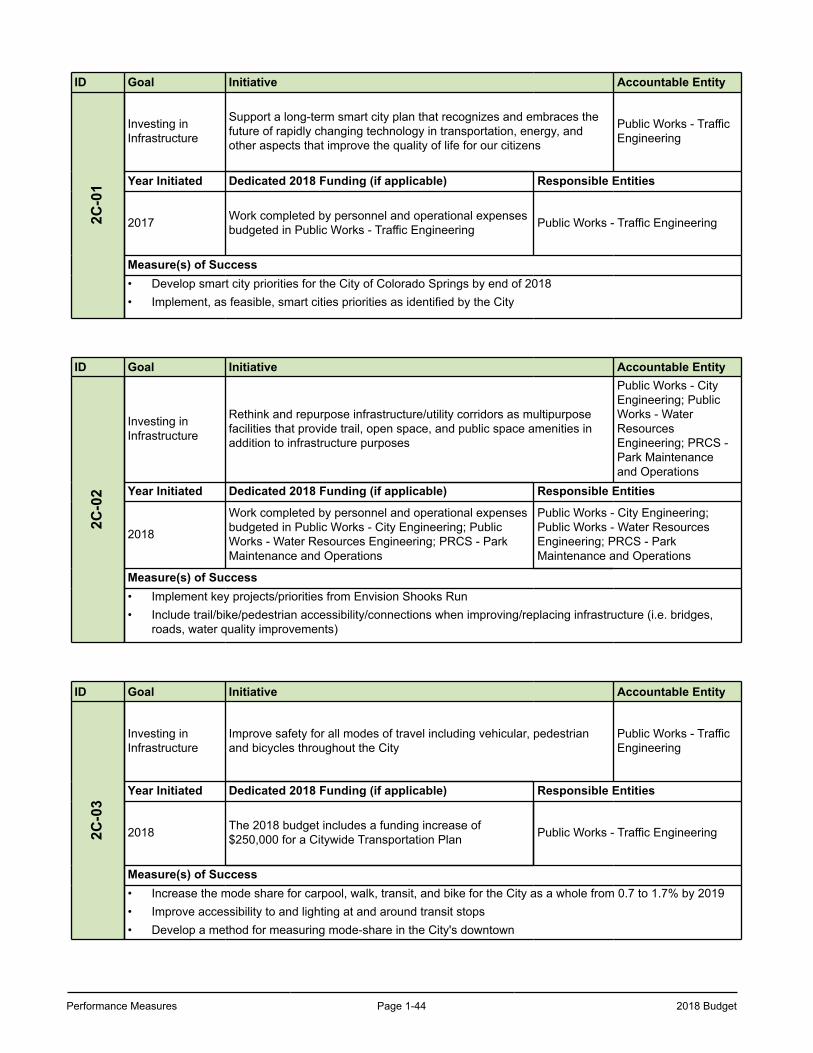
Performance Measures Page 1-44 2018 Budget
ID Goal Initiative Accountable Entity2C
-01
Investing inInfrastructure
Support a long-term smart city plan that recognizes and embraces thefuture of rapidly changing technology in transportation, energy, andother aspects that improve the quality of life for our citizens
Public Works - TrafficEngineering
Year Initiated Dedicated 2018 Funding (if applicable) Responsible Entities
2017 Work completed by personnel and operational expensesbudgeted in Public Works - Traffic Engineering Public Works - Traffic Engineering
Measure(s) of Success• Develop smart city priorities for the City of Colorado Springs by end of 2018• Implement, as feasible, smart cities priorities as identified by the City
ID Goal Initiative Accountable Entity
2C-0
2
Investing inInfrastructure
Rethink and repurpose infrastructure/utility corridors as multipurposefacilities that provide trail, open space, and public space amenities inaddition to infrastructure purposes
Public Works - CityEngineering; PublicWorks - WaterResourcesEngineering; PRCS -Park Maintenanceand Operations
Year Initiated Dedicated 2018 Funding (if applicable) Responsible Entities
2018
Work completed by personnel and operational expensesbudgeted in Public Works - City Engineering; PublicWorks - Water Resources Engineering; PRCS - ParkMaintenance and Operations
Public Works - City Engineering;Public Works - Water ResourcesEngineering; PRCS - ParkMaintenance and Operations
Measure(s) of Success• Implement key projects/priorities from Envision Shooks Run• Include trail/bike/pedestrian accessibility/connections when improving/replacing infrastructure (i.e. bridges,
roads, water quality improvements)
ID Goal Initiative Accountable Entity
2C-0
3
Investing inInfrastructure
Improve safety for all modes of travel including vehicular, pedestrianand bicycles throughout the City
Public Works - TrafficEngineering
Year Initiated Dedicated 2018 Funding (if applicable) Responsible Entities
2018 The 2018 budget includes a funding increase of$250,000 for a Citywide Transportation Plan Public Works - Traffic Engineering
Measure(s) of Success• Increase the mode share for carpool, walk, transit, and bike for the City as a whole from 0.7 to 1.7% by 2019• Improve accessibility to and lighting at and around transit stops• Develop a method for measuring mode-share in the City's downtown
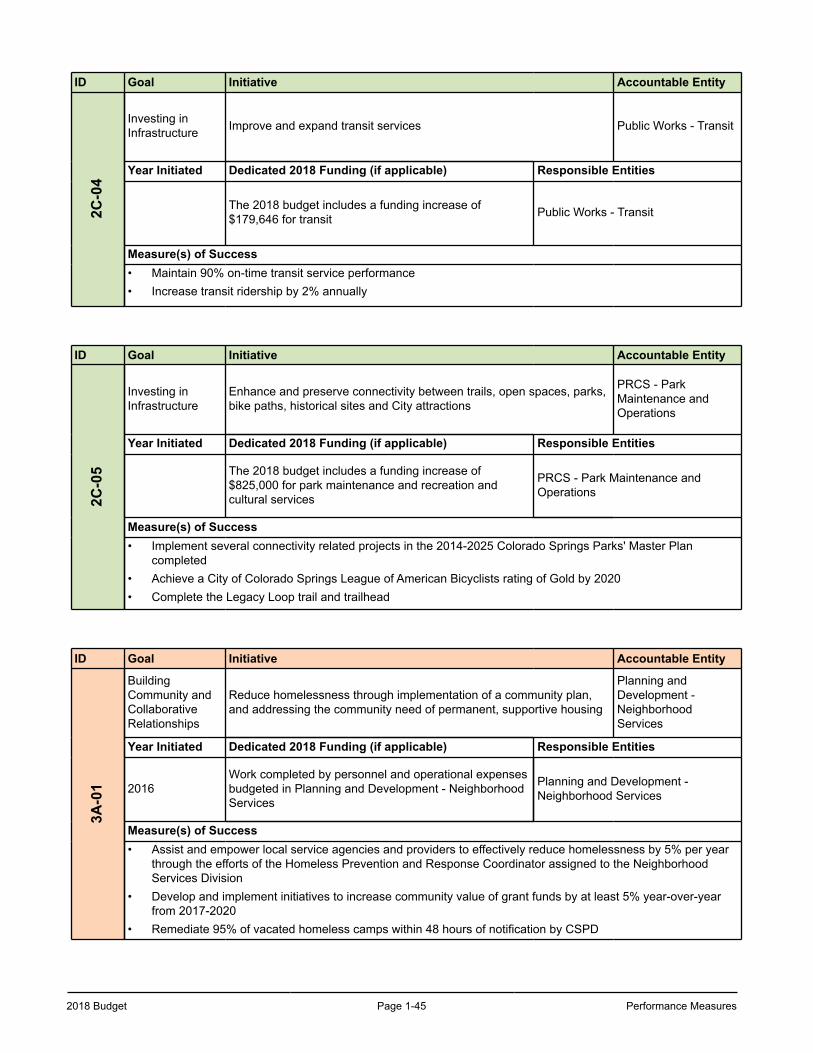
2018 Budget Page 1-45 Performance Measures
ID Goal Initiative Accountable Entity2C
-04
Investing inInfrastructure Improve and expand transit services Public Works - Transit
Year Initiated Dedicated 2018 Funding (if applicable) Responsible Entities
The 2018 budget includes a funding increase of$179,646 for transit Public Works - Transit
Measure(s) of Success• Maintain 90% on-time transit service performance• Increase transit ridership by 2% annually
ID Goal Initiative Accountable Entity
2C-0
5
Investing inInfrastructure
Enhance and preserve connectivity between trails, open spaces, parks,bike paths, historical sites and City attractions
PRCS - ParkMaintenance andOperations
Year Initiated Dedicated 2018 Funding (if applicable) Responsible Entities
The 2018 budget includes a funding increase of$825,000 for park maintenance and recreation andcultural services
PRCS - Park Maintenance andOperations
Measure(s) of Success• Implement several connectivity related projects in the 2014-2025 Colorado Springs Parks' Master Plan
completed• Achieve a City of Colorado Springs League of American Bicyclists rating of Gold by 2020 • Complete the Legacy Loop trail and trailhead
ID Goal Initiative Accountable Entity
3A-0
1
BuildingCommunity andCollaborativeRelationships
Reduce homelessness through implementation of a community plan,and addressing the community need of permanent, supportive housing
Planning andDevelopment -NeighborhoodServices
Year Initiated Dedicated 2018 Funding (if applicable) Responsible Entities
2016Work completed by personnel and operational expensesbudgeted in Planning and Development - NeighborhoodServices
Planning and Development -Neighborhood Services
Measure(s) of Success• Assist and empower local service agencies and providers to effectively reduce homelessness by 5% per year
through the efforts of the Homeless Prevention and Response Coordinator assigned to the Neighborhood Services Division
• Develop and implement initiatives to increase community value of grant funds by at least 5% year-over-year from 2017-2020
• Remediate 95% of vacated homeless camps within 48 hours of notification by CSPD
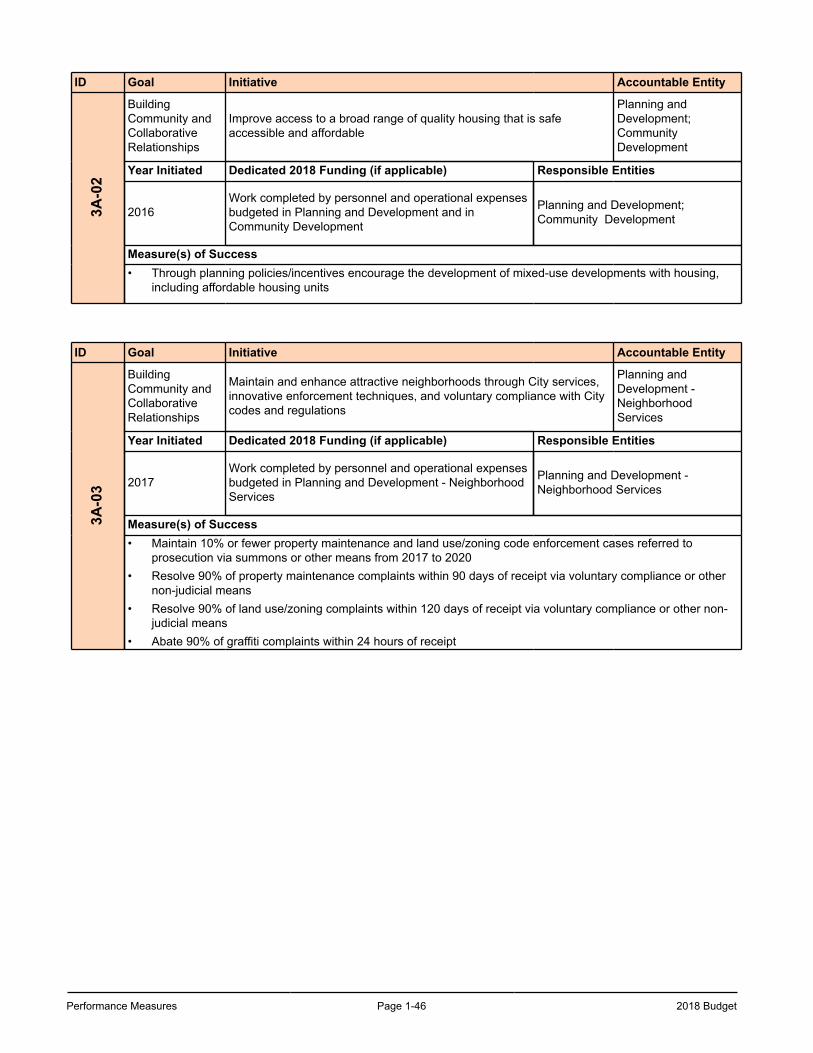
Performance Measures Page 1-46 2018 Budget
ID Goal Initiative Accountable Entity3A
-02
BuildingCommunity andCollaborativeRelationships
Improve access to a broad range of quality housing that is safeaccessible and affordable
Planning andDevelopment;CommunityDevelopment
Year Initiated Dedicated 2018 Funding (if applicable) Responsible Entities
2016Work completed by personnel and operational expensesbudgeted in Planning and Development and inCommunity Development
Planning and Development;Community Development
Measure(s) of Success• Through planning policies/incentives encourage the development of mixed-use developments with housing,
including affordable housing units
ID Goal Initiative Accountable Entity
3A-0
3
BuildingCommunity andCollaborativeRelationships
Maintain and enhance attractive neighborhoods through City services,innovative enforcement techniques, and voluntary compliance with Citycodes and regulations
Planning andDevelopment -NeighborhoodServices
Year Initiated Dedicated 2018 Funding (if applicable) Responsible Entities
2017Work completed by personnel and operational expensesbudgeted in Planning and Development - NeighborhoodServices
Planning and Development -Neighborhood Services
Measure(s) of Success• Maintain 10% or fewer property maintenance and land use/zoning code enforcement cases referred to
prosecution via summons or other means from 2017 to 2020• Resolve 90% of property maintenance complaints within 90 days of receipt via voluntary compliance or other
non-judicial means• Resolve 90% of land use/zoning complaints within 120 days of receipt via voluntary compliance or other non-
judicial means• Abate 90% of graffiti complaints within 24 hours of receipt
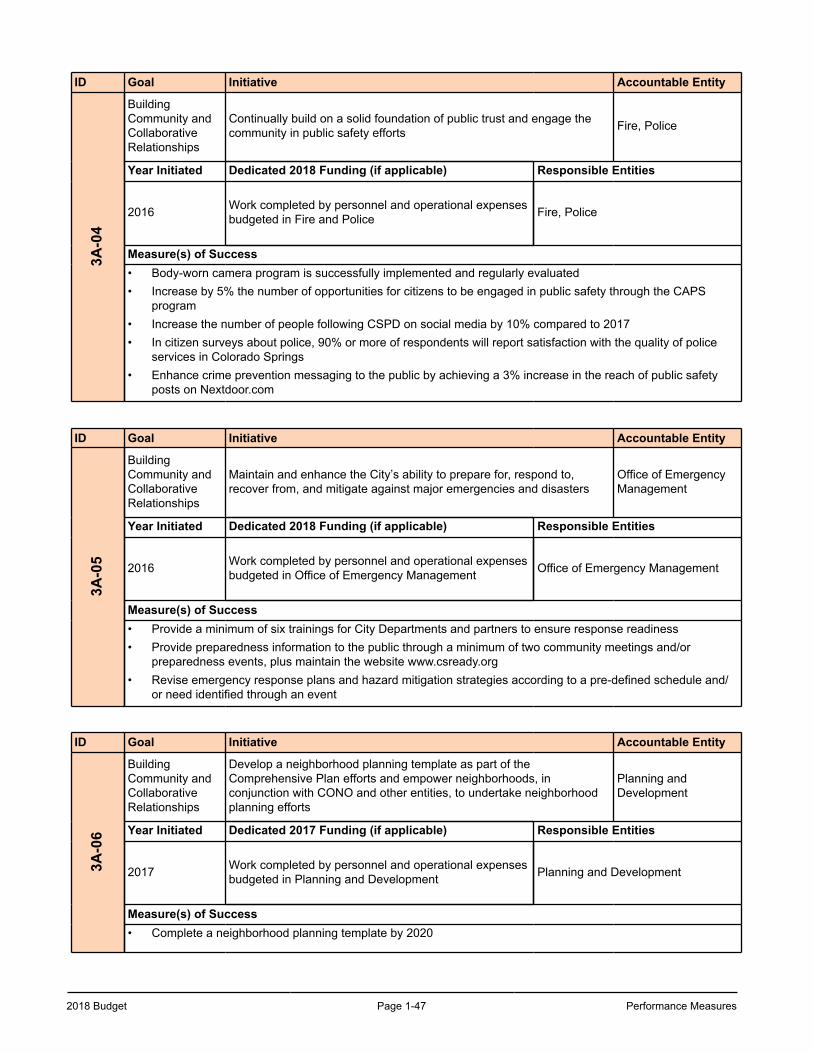
2018 Budget Page 1-47 Performance Measures
ID Goal Initiative Accountable Entity3A
-04
BuildingCommunity andCollaborativeRelationships
Continually build on a solid foundation of public trust and engage thecommunity in public safety efforts Fire, Police
Year Initiated Dedicated 2018 Funding (if applicable) Responsible Entities
2016 Work completed by personnel and operational expensesbudgeted in Fire and Police Fire, Police
Measure(s) of Success• Body-worn camera program is successfully implemented and regularly evaluated• Increase by 5% the number of opportunities for citizens to be engaged in public safety through the CAPS
program• Increase the number of people following CSPD on social media by 10% compared to 2017• In citizen surveys about police, 90% or more of respondents will report satisfaction with the quality of police
services in Colorado Springs• Enhance crime prevention messaging to the public by achieving a 3% increase in the reach of public safety
posts on Nextdoor.com
ID Goal Initiative Accountable Entity
3A-0
5
BuildingCommunity andCollaborativeRelationships
Maintain and enhance the City’s ability to prepare for, respond to,recover from, and mitigate against major emergencies and disasters
Office of EmergencyManagement
Year Initiated Dedicated 2018 Funding (if applicable) Responsible Entities
2016 Work completed by personnel and operational expensesbudgeted in Office of Emergency Management Office of Emergency Management
Measure(s) of Success• Provide a minimum of six trainings for City Departments and partners to ensure response readiness• Provide preparedness information to the public through a minimum of two community meetings and/or
preparedness events, plus maintain the website www.csready.org• Revise emergency response plans and hazard mitigation strategies according to a pre-defined schedule and/
or need identified through an event
ID Goal Initiative Accountable Entity
3A-0
6
BuildingCommunity andCollaborativeRelationships
Develop a neighborhood planning template as part of theComprehensive Plan efforts and empower neighborhoods, inconjunction with CONO and other entities, to undertake neighborhoodplanning efforts
Planning andDevelopment
Year Initiated Dedicated 2017 Funding (if applicable) Responsible Entities
2017 Work completed by personnel and operational expensesbudgeted in Planning and Development Planning and Development
Measure(s) of Success• Complete a neighborhood planning template by 2020
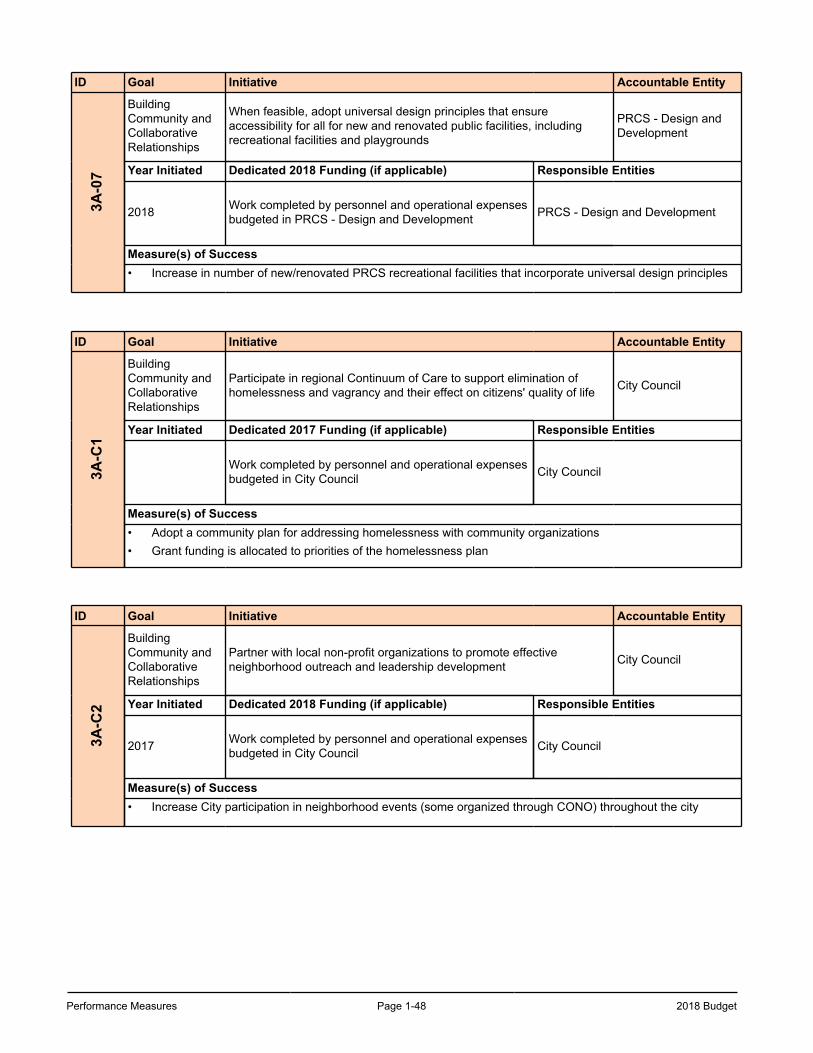
Performance Measures Page 1-48 2018 Budget
ID Goal Initiative Accountable Entity3A
-07
BuildingCommunity andCollaborativeRelationships
When feasible, adopt universal design principles that ensureaccessibility for all for new and renovated public facilities, includingrecreational facilities and playgrounds
PRCS - Design andDevelopment
Year Initiated Dedicated 2018 Funding (if applicable) Responsible Entities
2018 Work completed by personnel and operational expensesbudgeted in PRCS - Design and Development PRCS - Design and Development
Measure(s) of Success• Increase in number of new/renovated PRCS recreational facilities that incorporate universal design principles
ID Goal Initiative Accountable Entity
3A-C
1
BuildingCommunity andCollaborativeRelationships
Participate in regional Continuum of Care to support elimination ofhomelessness and vagrancy and their effect on citizens' quality of life City Council
Year Initiated Dedicated 2017 Funding (if applicable) Responsible Entities
Work completed by personnel and operational expensesbudgeted in City Council City Council
Measure(s) of Success• Adopt a community plan for addressing homelessness with community organizations • Grant funding is allocated to priorities of the homelessness plan
ID Goal Initiative Accountable Entity
3A-C
2
BuildingCommunity andCollaborativeRelationships
Partner with local non-profit organizations to promote effectiveneighborhood outreach and leadership development City Council
Year Initiated Dedicated 2018 Funding (if applicable) Responsible Entities
2017 Work completed by personnel and operational expensesbudgeted in City Council City Council
Measure(s) of Success• Increase City participation in neighborhood events (some organized through CONO) throughout the city
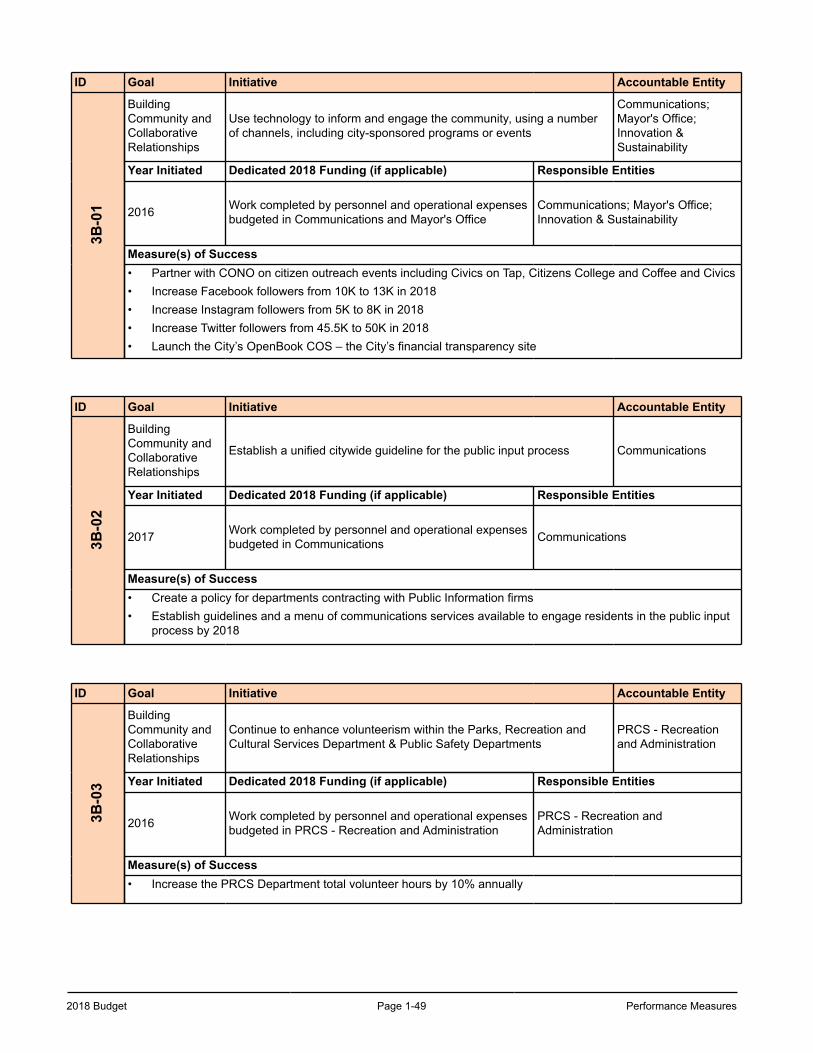
2018 Budget Page 1-49 Performance Measures
ID Goal Initiative Accountable Entity3B
-01
BuildingCommunity andCollaborativeRelationships
Use technology to inform and engage the community, using a numberof channels, including city-sponsored programs or events
Communications;Mayor's Office;Innovation &Sustainability
Year Initiated Dedicated 2018 Funding (if applicable) Responsible Entities
2016 Work completed by personnel and operational expensesbudgeted in Communications and Mayor's Office
Communications; Mayor's Office;Innovation & Sustainability
Measure(s) of Success• Partner with CONO on citizen outreach events including Civics on Tap, Citizens College and Coffee and Civics• Increase Facebook followers from 10K to 13K in 2018• Increase Instagram followers from 5K to 8K in 2018• Increase Twitter followers from 45.5K to 50K in 2018 • Launch the City’s OpenBook COS – the City’s financial transparency site
ID Goal Initiative Accountable Entity
3B-0
2
BuildingCommunity andCollaborativeRelationships
Establish a unified citywide guideline for the public input process Communications
Year Initiated Dedicated 2018 Funding (if applicable) Responsible Entities
2017 Work completed by personnel and operational expensesbudgeted in Communications Communications
Measure(s) of Success• Create a policy for departments contracting with Public Information firms• Establish guidelines and a menu of communications services available to engage residents in the public input
process by 2018
ID Goal Initiative Accountable Entity
3B-0
3
BuildingCommunity andCollaborativeRelationships
Continue to enhance volunteerism within the Parks, Recreation andCultural Services Department & Public Safety Departments
PRCS - Recreationand Administration
Year Initiated Dedicated 2018 Funding (if applicable) Responsible Entities
2016 Work completed by personnel and operational expensesbudgeted in PRCS - Recreation and Administration
PRCS - Recreation andAdministration
Measure(s) of Success• Increase the PRCS Department total volunteer hours by 10% annually
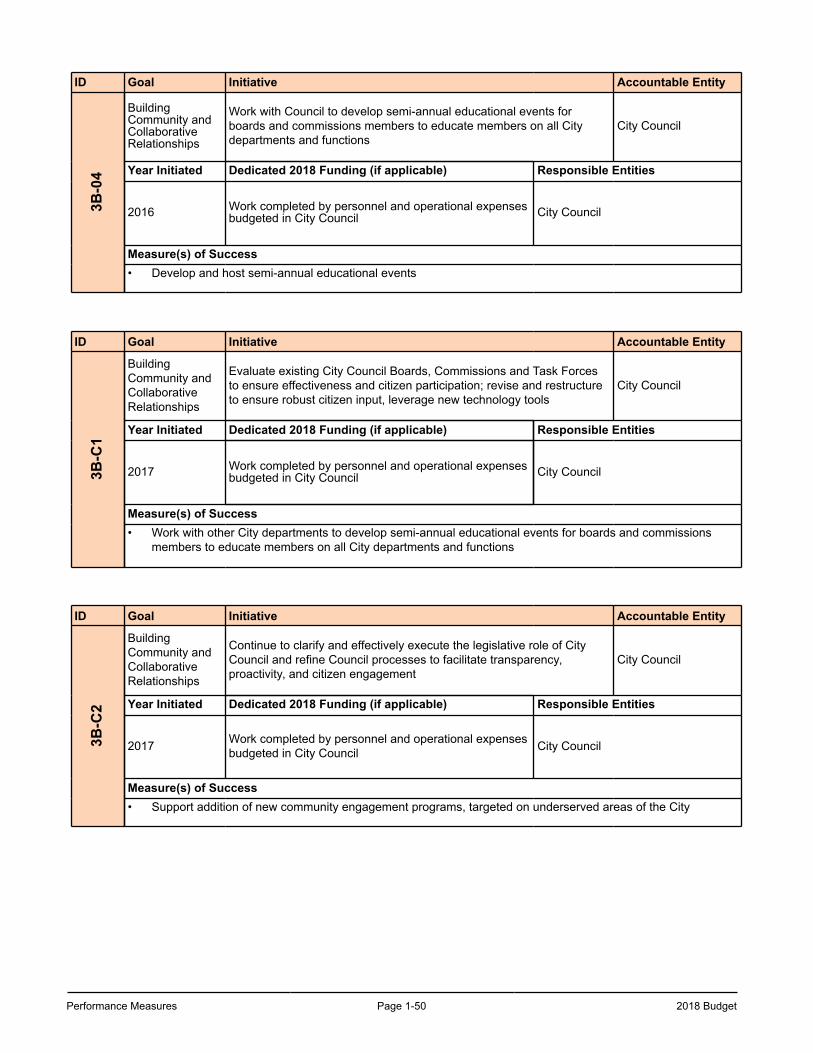
Performance Measures Page 1-50 2018 Budget
ID Goal Initiative Accountable Entity3B
-04
BuildingCommunity andCollaborativeRelationships
Work with Council to develop semi-annual educational events forboards and commissions members to educate members on all Citydepartments and functions
City Council
Year Initiated Dedicated 2018 Funding (if applicable) Responsible Entities
2016 Work completed by personnel and operational expensesbudgeted in City Council City Council
Measure(s) of Success• Develop and host semi-annual educational events
ID Goal Initiative Accountable Entity
3B-C
1
BuildingCommunity andCollaborativeRelationships
Evaluate existing City Council Boards, Commissions and Task Forcesto ensure effectiveness and citizen participation; revise and restructureto ensure robust citizen input, leverage new technology tools
City Council
Year Initiated Dedicated 2018 Funding (if applicable) Responsible Entities
2017 Work completed by personnel and operational expensesbudgeted in City Council City Council
Measure(s) of Success• Work with other City departments to develop semi-annual educational events for boards and commissions
members to educate members on all City departments and functions
ID Goal Initiative Accountable Entity
3B-C
2
BuildingCommunity andCollaborativeRelationships
Continue to clarify and effectively execute the legislative role of CityCouncil and refine Council processes to facilitate transparency,proactivity, and citizen engagement
City Council
Year Initiated Dedicated 2018 Funding (if applicable) Responsible Entities
2017 Work completed by personnel and operational expensesbudgeted in City Council City Council
Measure(s) of Success• Support addition of new community engagement programs, targeted on underserved areas of the City
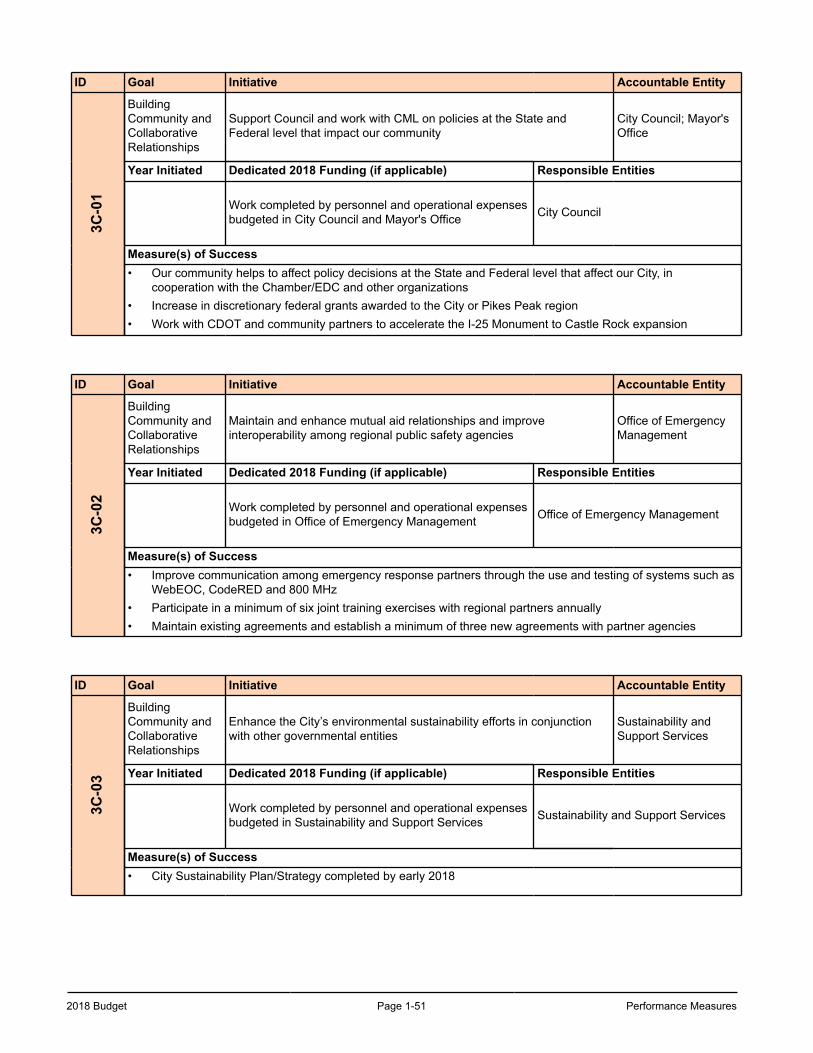
2018 Budget Page 1-51 Performance Measures
ID Goal Initiative Accountable Entity3C
-01
BuildingCommunity andCollaborativeRelationships
Support Council and work with CML on policies at the State andFederal level that impact our community
City Council; Mayor'sOffice
Year Initiated Dedicated 2018 Funding (if applicable) Responsible Entities
Work completed by personnel and operational expensesbudgeted in City Council and Mayor's Office City Council
Measure(s) of Success• Our community helps to affect policy decisions at the State and Federal level that affect our City, in
cooperation with the Chamber/EDC and other organizations• Increase in discretionary federal grants awarded to the City or Pikes Peak region• Work with CDOT and community partners to accelerate the I-25 Monument to Castle Rock expansion
ID Goal Initiative Accountable Entity
3C-0
2
BuildingCommunity andCollaborativeRelationships
Maintain and enhance mutual aid relationships and improveinteroperability among regional public safety agencies
Office of EmergencyManagement
Year Initiated Dedicated 2018 Funding (if applicable) Responsible Entities
Work completed by personnel and operational expensesbudgeted in Office of Emergency Management Office of Emergency Management
Measure(s) of Success• Improve communication among emergency response partners through the use and testing of systems such as
WebEOC, CodeRED and 800 MHz• Participate in a minimum of six joint training exercises with regional partners annually• Maintain existing agreements and establish a minimum of three new agreements with partner agencies
ID Goal Initiative Accountable Entity
3C-0
3
BuildingCommunity andCollaborativeRelationships
Enhance the City’s environmental sustainability efforts in conjunctionwith other governmental entities
Sustainability andSupport Services
Year Initiated Dedicated 2018 Funding (if applicable) Responsible Entities
Work completed by personnel and operational expensesbudgeted in Sustainability and Support Services Sustainability and Support Services
Measure(s) of Success• City Sustainability Plan/Strategy completed by early 2018
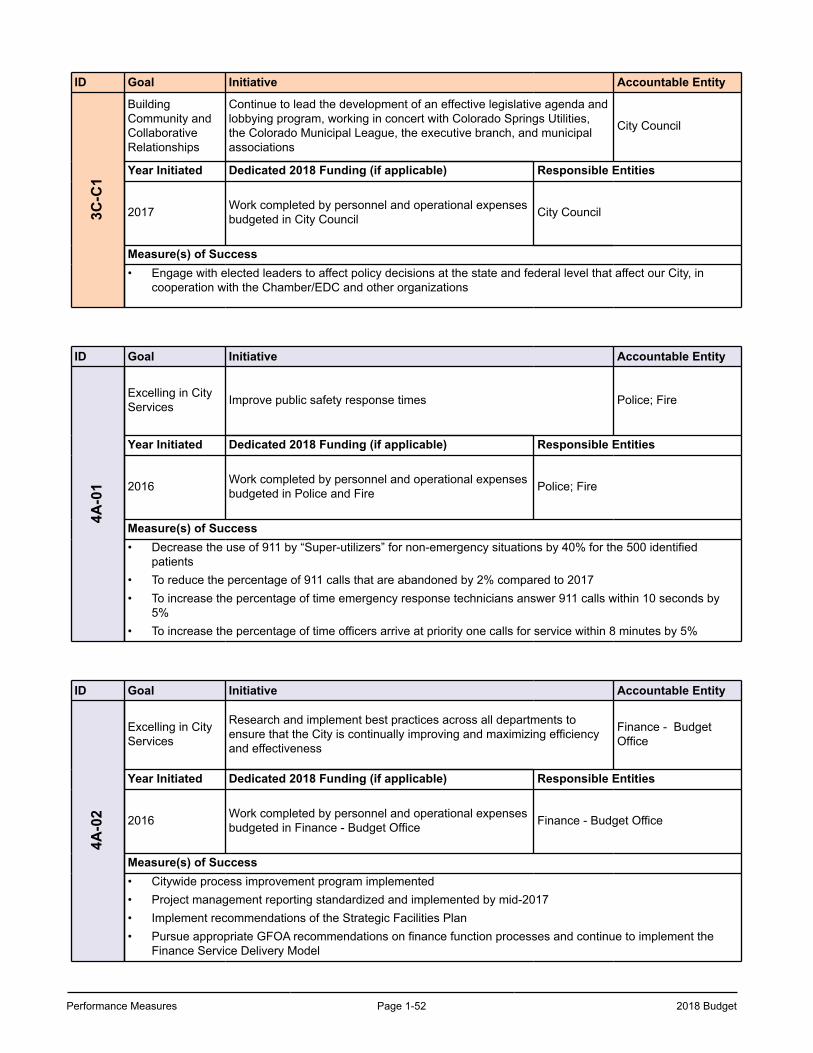
Performance Measures Page 1-52 2018 Budget
ID Goal Initiative Accountable Entity3C
-C1
BuildingCommunity andCollaborativeRelationships
Continue to lead the development of an effective legislative agenda andlobbying program, working in concert with Colorado Springs Utilities,the Colorado Municipal League, the executive branch, and municipalassociations
City Council
Year Initiated Dedicated 2018 Funding (if applicable) Responsible Entities
2017 Work completed by personnel and operational expensesbudgeted in City Council City Council
Measure(s) of Success• Engage with elected leaders to affect policy decisions at the state and federal level that affect our City, in
cooperation with the Chamber/EDC and other organizations
ID Goal Initiative Accountable Entity
4A-0
1
Excelling in CityServices Improve public safety response times Police; Fire
Year Initiated Dedicated 2018 Funding (if applicable) Responsible Entities
2016 Work completed by personnel and operational expensesbudgeted in Police and Fire Police; Fire
Measure(s) of Success• Decrease the use of 911 by “Super-utilizers” for non-emergency situations by 40% for the 500 identified
patients• To reduce the percentage of 911 calls that are abandoned by 2% compared to 2017• To increase the percentage of time emergency response technicians answer 911 calls within 10 seconds by
5%• To increase the percentage of time officers arrive at priority one calls for service within 8 minutes by 5%
ID Goal Initiative Accountable Entity
4A-0
2
Excelling in CityServices
Research and implement best practices across all departments toensure that the City is continually improving and maximizing efficiencyand effectiveness
Finance - BudgetOffice
Year Initiated Dedicated 2018 Funding (if applicable) Responsible Entities
2016 Work completed by personnel and operational expensesbudgeted in Finance - Budget Office Finance - Budget Office
Measure(s) of Success• Citywide process improvement program implemented• Project management reporting standardized and implemented by mid-2017• Implement recommendations of the Strategic Facilities Plan• Pursue appropriate GFOA recommendations on finance function processes and continue to implement the
Finance Service Delivery Model
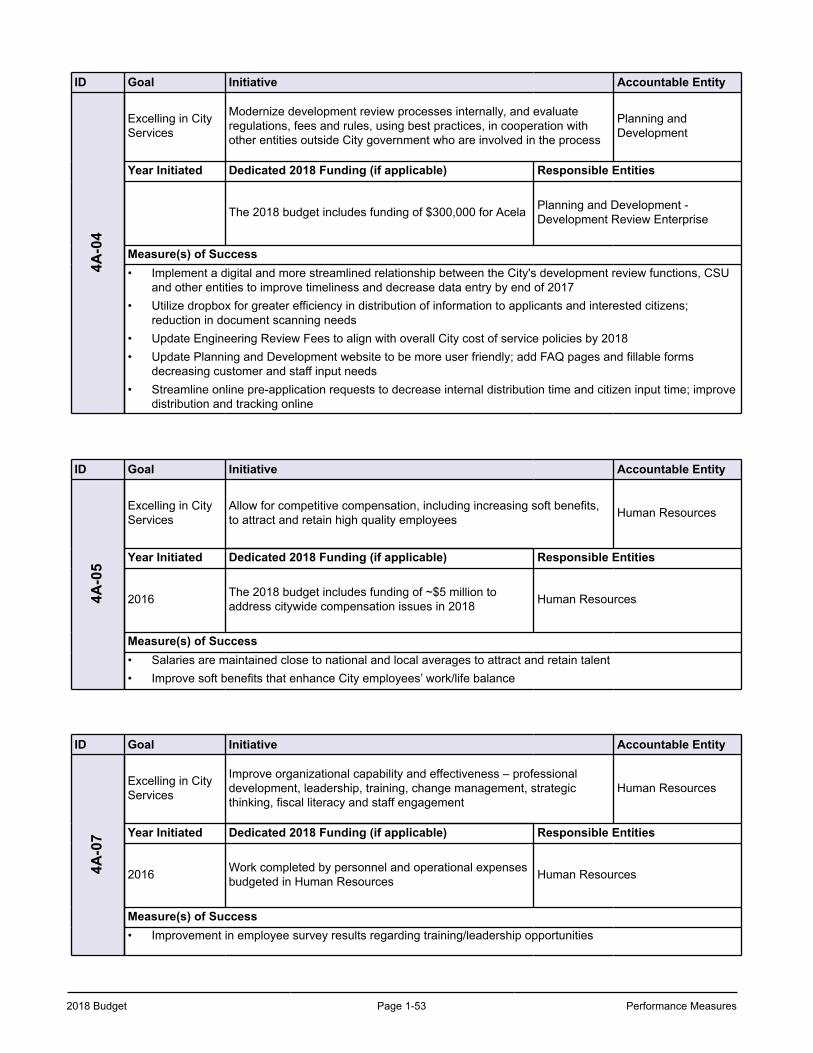
2018 Budget Page 1-53 Performance Measures
ID Goal Initiative Accountable Entity4A
-04
Excelling in CityServices
Modernize development review processes internally, and evaluateregulations, fees and rules, using best practices, in cooperation withother entities outside City government who are involved in the process
Planning andDevelopment
Year Initiated Dedicated 2018 Funding (if applicable) Responsible Entities
The 2018 budget includes funding of $300,000 for Acela Planning and Development -Development Review Enterprise
Measure(s) of Success• Implement a digital and more streamlined relationship between the City's development review functions, CSU
and other entities to improve timeliness and decrease data entry by end of 2017• Utilize dropbox for greater efficiency in distribution of information to applicants and interested citizens;
reduction in document scanning needs• Update Engineering Review Fees to align with overall City cost of service policies by 2018• Update Planning and Development website to be more user friendly; add FAQ pages and fillable forms
decreasing customer and staff input needs• Streamline online pre-application requests to decrease internal distribution time and citizen input time; improve
distribution and tracking online
ID Goal Initiative Accountable Entity
4A-0
5
Excelling in CityServices
Allow for competitive compensation, including increasing soft benefits,to attract and retain high quality employees Human Resources
Year Initiated Dedicated 2018 Funding (if applicable) Responsible Entities
2016 The 2018 budget includes funding of ~$5 million toaddress citywide compensation issues in 2018 Human Resources
Measure(s) of Success• Salaries are maintained close to national and local averages to attract and retain talent• Improve soft benefits that enhance City employees’ work/life balance
ID Goal Initiative Accountable Entity
4A-0
7
Excelling in CityServices
Improve organizational capability and effectiveness – professionaldevelopment, leadership, training, change management, strategicthinking, fiscal literacy and staff engagement
Human Resources
Year Initiated Dedicated 2018 Funding (if applicable) Responsible Entities
2016 Work completed by personnel and operational expensesbudgeted in Human Resources Human Resources
Measure(s) of Success• Improvement in employee survey results regarding training/leadership opportunities
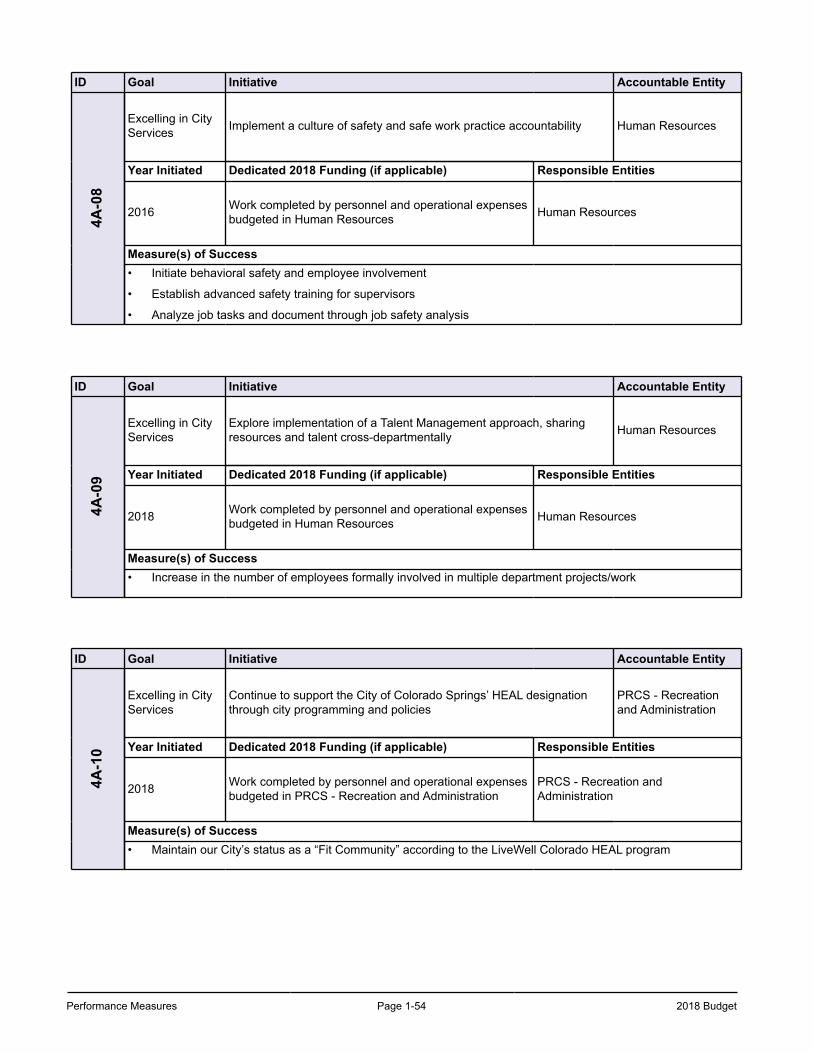
Performance Measures Page 1-54 2018 Budget
ID Goal Initiative Accountable Entity4A
-08
Excelling in CityServices Implement a culture of safety and safe work practice accountability Human Resources
Year Initiated Dedicated 2018 Funding (if applicable) Responsible Entities
2016 Work completed by personnel and operational expensesbudgeted in Human Resources Human Resources
Measure(s) of Success• Initiate behavioral safety and employee involvement
• Establish advanced safety training for supervisors
• Analyze job tasks and document through job safety analysis
ID Goal Initiative Accountable Entity
4A-0
9
Excelling in CityServices
Explore implementation of a Talent Management approach, sharingresources and talent cross-departmentally Human Resources
Year Initiated Dedicated 2018 Funding (if applicable) Responsible Entities
2018 Work completed by personnel and operational expensesbudgeted in Human Resources Human Resources
Measure(s) of Success• Increase in the number of employees formally involved in multiple department projects/work
ID Goal Initiative Accountable Entity
4A-1
0
Excelling in CityServices
Continue to support the City of Colorado Springs’ HEAL designationthrough city programming and policies
PRCS - Recreationand Administration
Year Initiated Dedicated 2018 Funding (if applicable) Responsible Entities
2018 Work completed by personnel and operational expensesbudgeted in PRCS - Recreation and Administration
PRCS - Recreation andAdministration
Measure(s) of Success• Maintain our City’s status as a “Fit Community” according to the LiveWell Colorado HEAL program
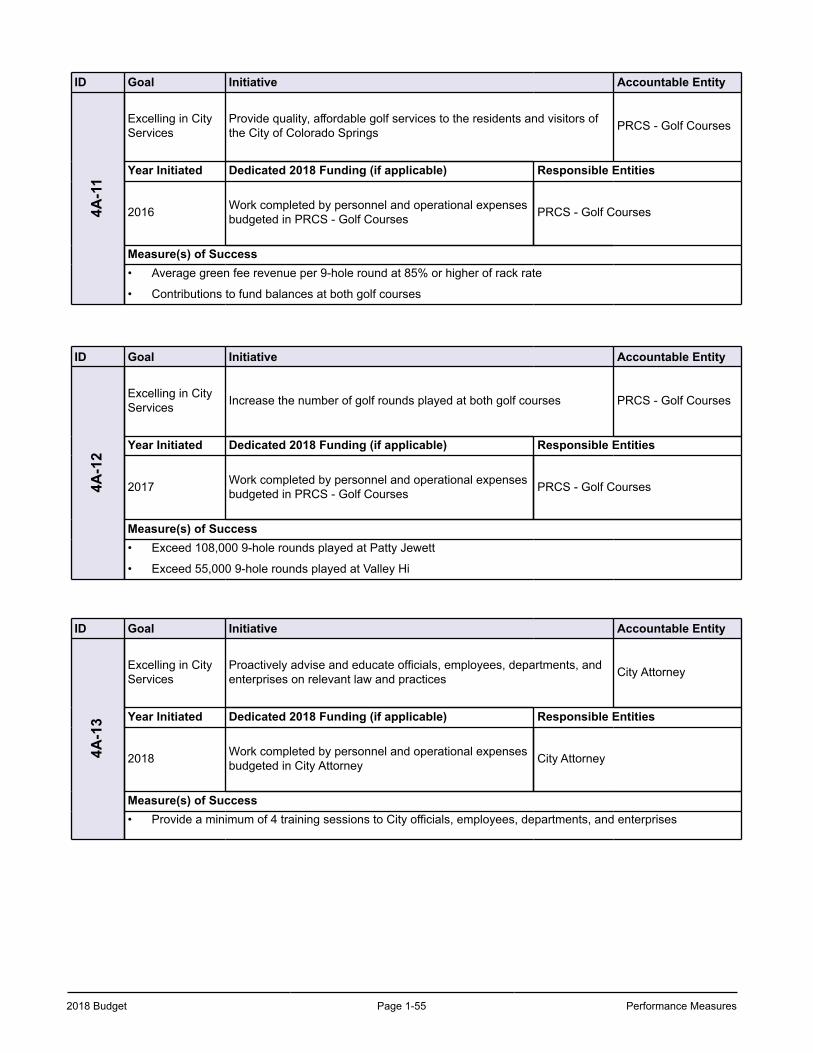
2018 Budget Page 1-55 Performance Measures
ID Goal Initiative Accountable Entity4A
-11
Excelling in CityServices
Provide quality, affordable golf services to the residents and visitors ofthe City of Colorado Springs PRCS - Golf Courses
Year Initiated Dedicated 2018 Funding (if applicable) Responsible Entities
2016 Work completed by personnel and operational expensesbudgeted in PRCS - Golf Courses PRCS - Golf Courses
Measure(s) of Success• Average green fee revenue per 9-hole round at 85% or higher of rack rate
• Contributions to fund balances at both golf courses
ID Goal Initiative Accountable Entity
4A-1
2
Excelling in CityServices Increase the number of golf rounds played at both golf courses PRCS - Golf Courses
Year Initiated Dedicated 2018 Funding (if applicable) Responsible Entities
2017 Work completed by personnel and operational expensesbudgeted in PRCS - Golf Courses PRCS - Golf Courses
Measure(s) of Success• Exceed 108,000 9-hole rounds played at Patty Jewett
• Exceed 55,000 9-hole rounds played at Valley Hi
ID Goal Initiative Accountable Entity
4A-1
3
Excelling in CityServices
Proactively advise and educate officials, employees, departments, andenterprises on relevant law and practices City Attorney
Year Initiated Dedicated 2018 Funding (if applicable) Responsible Entities
2018 Work completed by personnel and operational expensesbudgeted in City Attorney City Attorney
Measure(s) of Success• Provide a minimum of 4 training sessions to City officials, employees, departments, and enterprises
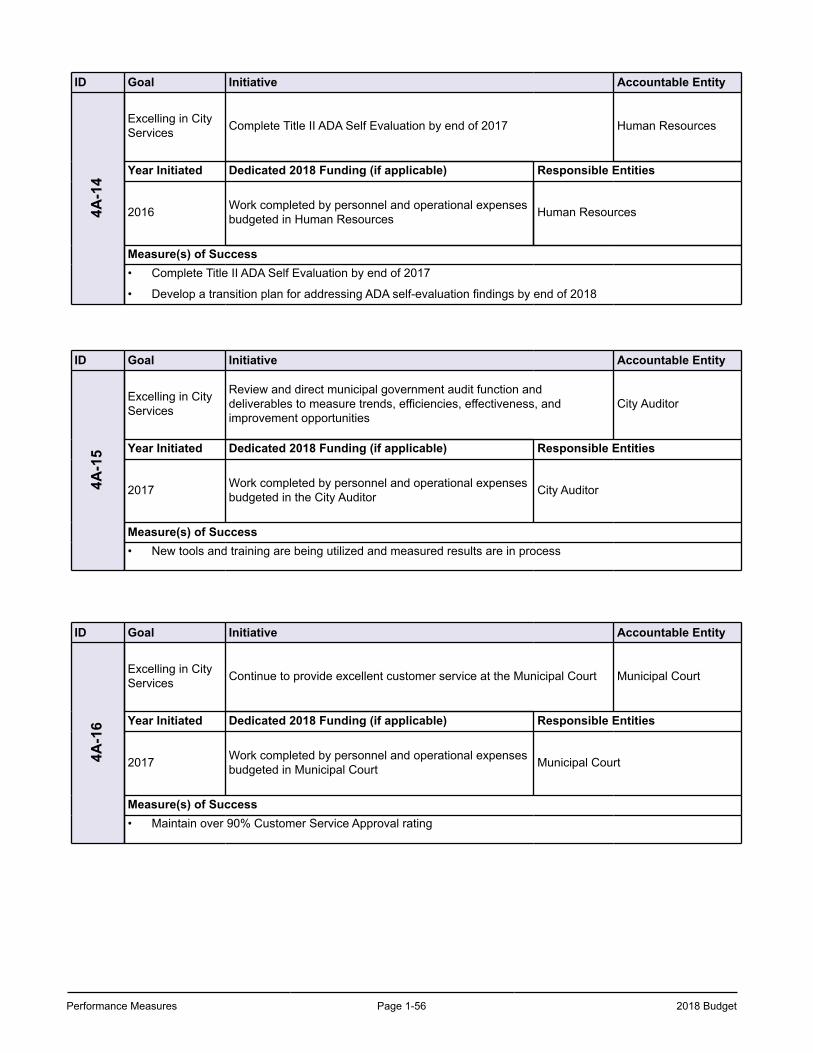
Performance Measures Page 1-56 2018 Budget
ID Goal Initiative Accountable Entity4A
-14
Excelling in CityServices Complete Title II ADA Self Evaluation by end of 2017 Human Resources
Year Initiated Dedicated 2018 Funding (if applicable) Responsible Entities
2016 Work completed by personnel and operational expensesbudgeted in Human Resources Human Resources
Measure(s) of Success• Complete Title II ADA Self Evaluation by end of 2017
• Develop a transition plan for addressing ADA self-evaluation findings by end of 2018
ID Goal Initiative Accountable Entity
4A-1
5
Excelling in CityServices
Review and direct municipal government audit function anddeliverables to measure trends, efficiencies, effectiveness, andimprovement opportunities
City Auditor
Year Initiated Dedicated 2018 Funding (if applicable) Responsible Entities
2017 Work completed by personnel and operational expensesbudgeted in the City Auditor City Auditor
Measure(s) of Success• New tools and training are being utilized and measured results are in process
ID Goal Initiative Accountable Entity
4A-1
6
Excelling in CityServices Continue to provide excellent customer service at the Municipal Court Municipal Court
Year Initiated Dedicated 2018 Funding (if applicable) Responsible Entities
2017 Work completed by personnel and operational expensesbudgeted in Municipal Court Municipal Court
Measure(s) of Success• Maintain over 90% Customer Service Approval rating
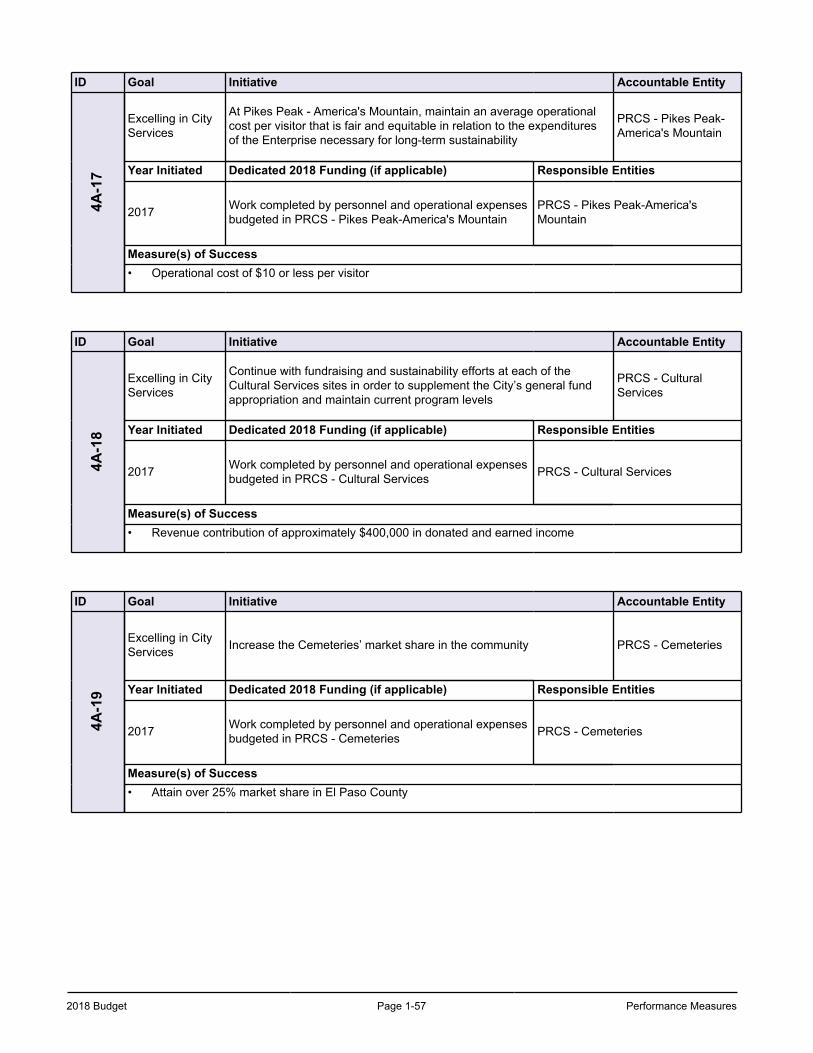
2018 Budget Page 1-57 Performance Measures
ID Goal Initiative Accountable Entity4A
-17
Excelling in CityServices
At Pikes Peak - America's Mountain, maintain an average operationalcost per visitor that is fair and equitable in relation to the expendituresof the Enterprise necessary for long-term sustainability
PRCS - Pikes Peak-America's Mountain
Year Initiated Dedicated 2018 Funding (if applicable) Responsible Entities
2017 Work completed by personnel and operational expensesbudgeted in PRCS - Pikes Peak-America's Mountain
PRCS - Pikes Peak-America'sMountain
Measure(s) of Success• Operational cost of $10 or less per visitor
ID Goal Initiative Accountable Entity
4A-1
8
Excelling in CityServices
Continue with fundraising and sustainability efforts at each of theCultural Services sites in order to supplement the City’s general fundappropriation and maintain current program levels
PRCS - CulturalServices
Year Initiated Dedicated 2018 Funding (if applicable) Responsible Entities
2017 Work completed by personnel and operational expensesbudgeted in PRCS - Cultural Services PRCS - Cultural Services
Measure(s) of Success• Revenue contribution of approximately $400,000 in donated and earned income
ID Goal Initiative Accountable Entity
4A-1
9
Excelling in CityServices Increase the Cemeteries’ market share in the community PRCS - Cemeteries
Year Initiated Dedicated 2018 Funding (if applicable) Responsible Entities
2017 Work completed by personnel and operational expensesbudgeted in PRCS - Cemeteries PRCS - Cemeteries
Measure(s) of Success• Attain over 25% market share in El Paso County
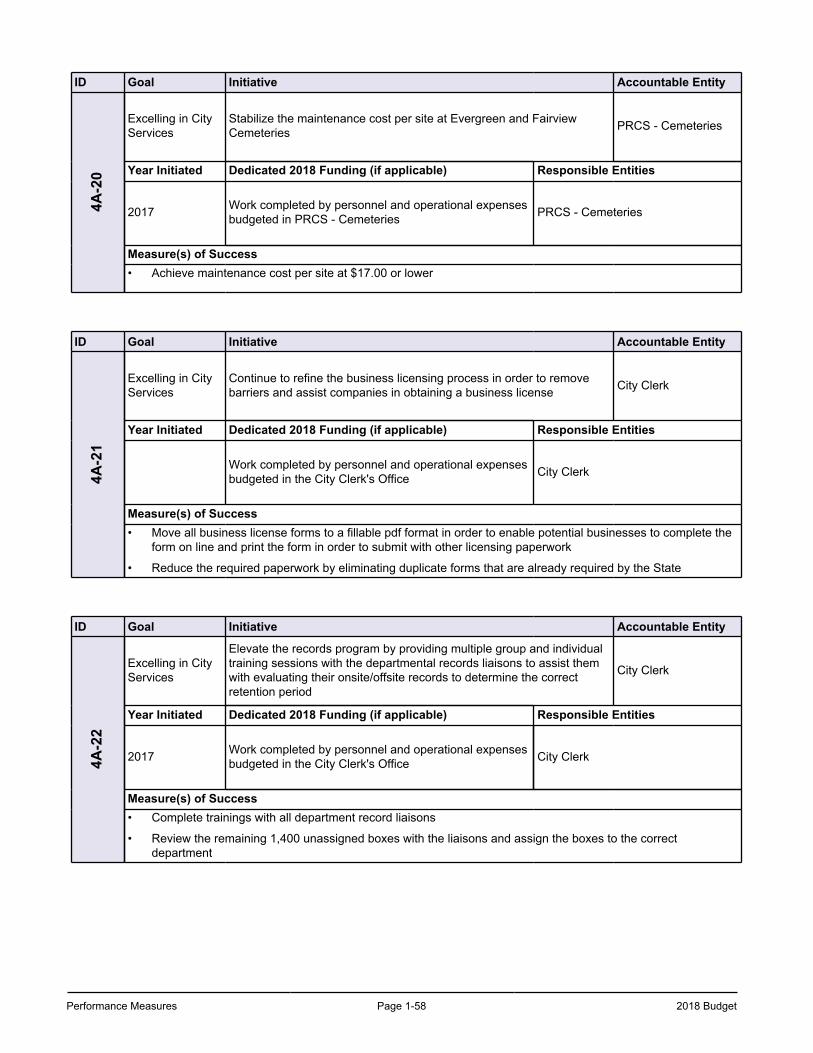
Performance Measures Page 1-58 2018 Budget
ID Goal Initiative Accountable Entity4A
-20
Excelling in CityServices
Stabilize the maintenance cost per site at Evergreen and FairviewCemeteries PRCS - Cemeteries
Year Initiated Dedicated 2018 Funding (if applicable) Responsible Entities
2017 Work completed by personnel and operational expensesbudgeted in PRCS - Cemeteries PRCS - Cemeteries
Measure(s) of Success• Achieve maintenance cost per site at $17.00 or lower
ID Goal Initiative Accountable Entity
4A-2
1
Excelling in CityServices
Continue to refine the business licensing process in order to removebarriers and assist companies in obtaining a business license City Clerk
Year Initiated Dedicated 2018 Funding (if applicable) Responsible Entities
Work completed by personnel and operational expensesbudgeted in the City Clerk's Office City Clerk
Measure(s) of Success• Move all business license forms to a fillable pdf format in order to enable potential businesses to complete the
form on line and print the form in order to submit with other licensing paperwork
• Reduce the required paperwork by eliminating duplicate forms that are already required by the State
ID Goal Initiative Accountable Entity
4A-2
2
Excelling in CityServices
Elevate the records program by providing multiple group and individualtraining sessions with the departmental records liaisons to assist themwith evaluating their onsite/offsite records to determine the correctretention period
City Clerk
Year Initiated Dedicated 2018 Funding (if applicable) Responsible Entities
2017 Work completed by personnel and operational expensesbudgeted in the City Clerk's Office City Clerk
Measure(s) of Success• Complete trainings with all department record liaisons
• Review the remaining 1,400 unassigned boxes with the liaisons and assign the boxes to the correct department
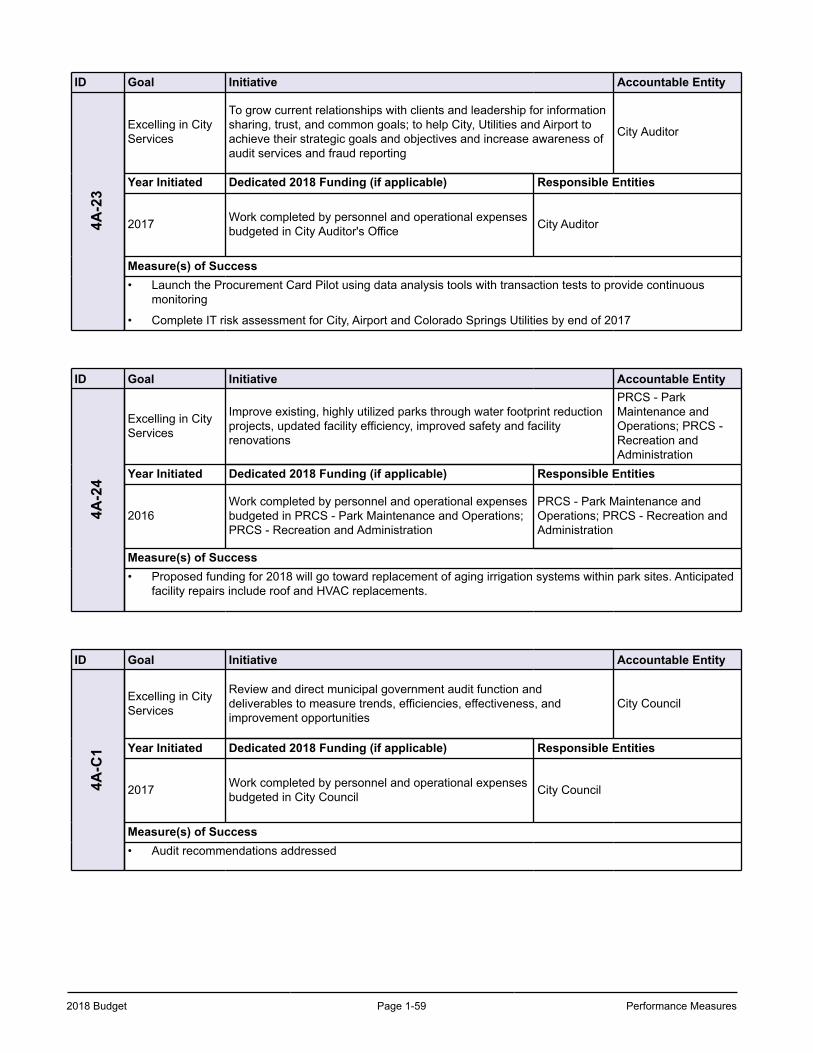
2018 Budget Page 1-59 Performance Measures
ID Goal Initiative Accountable Entity4A
-23
Excelling in CityServices
To grow current relationships with clients and leadership for informationsharing, trust, and common goals; to help City, Utilities and Airport toachieve their strategic goals and objectives and increase awareness ofaudit services and fraud reporting
City Auditor
Year Initiated Dedicated 2018 Funding (if applicable) Responsible Entities
2017 Work completed by personnel and operational expensesbudgeted in City Auditor's Office City Auditor
Measure(s) of Success• Launch the Procurement Card Pilot using data analysis tools with transaction tests to provide continuous
monitoring
• Complete IT risk assessment for City, Airport and Colorado Springs Utilities by end of 2017
ID Goal Initiative Accountable Entity
4A-2
4
Excelling in CityServices
Improve existing, highly utilized parks through water footprint reductionprojects, updated facility efficiency, improved safety and facilityrenovations
PRCS - ParkMaintenance andOperations; PRCS -Recreation andAdministration
Year Initiated Dedicated 2018 Funding (if applicable) Responsible Entities
2016Work completed by personnel and operational expensesbudgeted in PRCS - Park Maintenance and Operations;PRCS - Recreation and Administration
PRCS - Park Maintenance andOperations; PRCS - Recreation andAdministration
Measure(s) of Success• Proposed funding for 2018 will go toward replacement of aging irrigation systems within park sites. Anticipated
facility repairs include roof and HVAC replacements.
ID Goal Initiative Accountable Entity
4A-C
1
Excelling in CityServices
Review and direct municipal government audit function anddeliverables to measure trends, efficiencies, effectiveness, andimprovement opportunities
City Council
Year Initiated Dedicated 2018 Funding (if applicable) Responsible Entities
2017 Work completed by personnel and operational expensesbudgeted in City Council City Council
Measure(s) of Success• Audit recommendations addressed
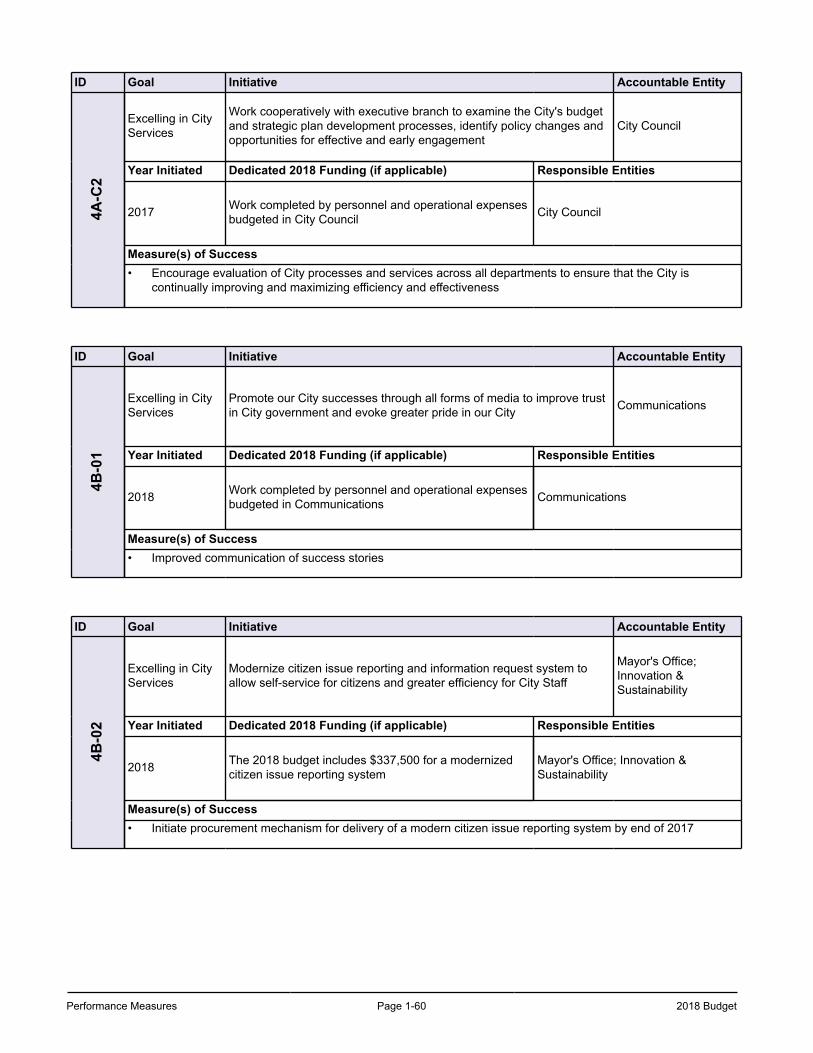
Performance Measures Page 1-60 2018 Budget
ID Goal Initiative Accountable Entity4A
-C2
Excelling in CityServices
Work cooperatively with executive branch to examine the City's budgetand strategic plan development processes, identify policy changes andopportunities for effective and early engagement
City Council
Year Initiated Dedicated 2018 Funding (if applicable) Responsible Entities
2017 Work completed by personnel and operational expensesbudgeted in City Council City Council
Measure(s) of Success• Encourage evaluation of City processes and services across all departments to ensure that the City is
continually improving and maximizing efficiency and effectiveness
ID Goal Initiative Accountable Entity
4B-0
1
Excelling in CityServices
Promote our City successes through all forms of media to improve trustin City government and evoke greater pride in our City Communications
Year Initiated Dedicated 2018 Funding (if applicable) Responsible Entities
2018 Work completed by personnel and operational expensesbudgeted in Communications Communications
Measure(s) of Success• Improved communication of success stories
ID Goal Initiative Accountable Entity
4B-0
2
Excelling in CityServices
Modernize citizen issue reporting and information request system toallow self-service for citizens and greater efficiency for City Staff
Mayor's Office;Innovation &Sustainability
Year Initiated Dedicated 2018 Funding (if applicable) Responsible Entities
2018 The 2018 budget includes $337,500 for a modernizedcitizen issue reporting system
Mayor's Office; Innovation &Sustainability
Measure(s) of Success• Initiate procurement mechanism for delivery of a modern citizen issue reporting system by end of 2017
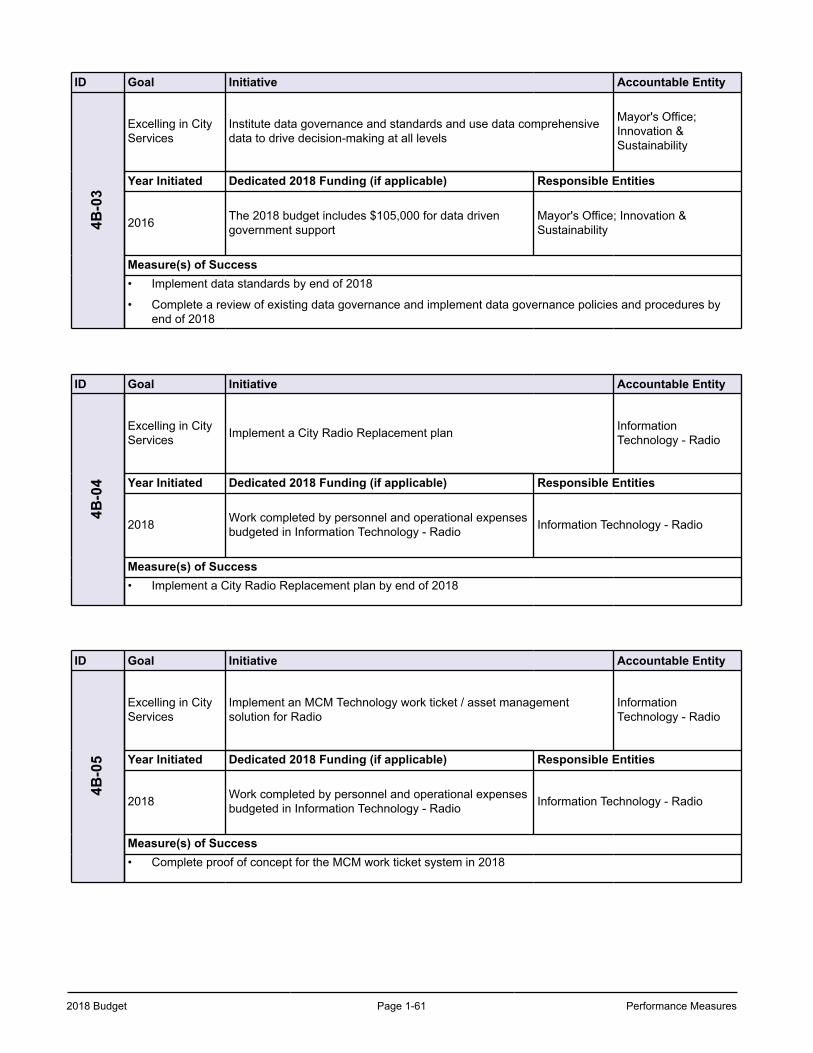
2018 Budget Page 1-61 Performance Measures
ID Goal Initiative Accountable Entity4B
-03
Excelling in CityServices
Institute data governance and standards and use data comprehensivedata to drive decision-making at all levels
Mayor's Office;Innovation &Sustainability
Year Initiated Dedicated 2018 Funding (if applicable) Responsible Entities
2016 The 2018 budget includes $105,000 for data drivengovernment support
Mayor's Office; Innovation &Sustainability
Measure(s) of Success• Implement data standards by end of 2018
• Complete a review of existing data governance and implement data governance policies and procedures by end of 2018
ID Goal Initiative Accountable Entity
4B-0
4
Excelling in CityServices Implement a City Radio Replacement plan Information
Technology - Radio
Year Initiated Dedicated 2018 Funding (if applicable) Responsible Entities
2018 Work completed by personnel and operational expensesbudgeted in Information Technology - Radio Information Technology - Radio
Measure(s) of Success• Implement a City Radio Replacement plan by end of 2018
ID Goal Initiative Accountable Entity
4B-0
5
Excelling in CityServices
Implement an MCM Technology work ticket / asset managementsolution for Radio
InformationTechnology - Radio
Year Initiated Dedicated 2018 Funding (if applicable) Responsible Entities
2018 Work completed by personnel and operational expensesbudgeted in Information Technology - Radio Information Technology - Radio
Measure(s) of Success• Complete proof of concept for the MCM work ticket system in 2018
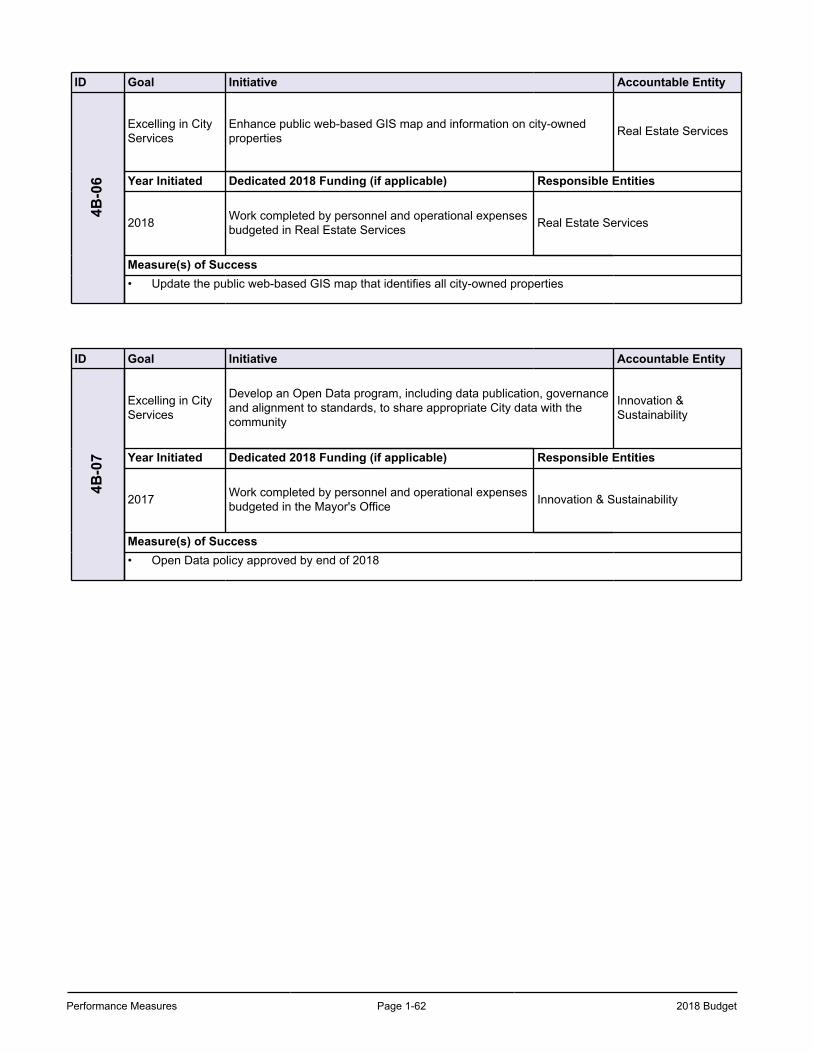
Performance Measures Page 1-62 2018 Budget
ID Goal Initiative Accountable Entity4B
-06
Excelling in CityServices
Enhance public web-based GIS map and information on city-ownedproperties Real Estate Services
Year Initiated Dedicated 2018 Funding (if applicable) Responsible Entities
2018 Work completed by personnel and operational expensesbudgeted in Real Estate Services Real Estate Services
Measure(s) of Success• Update the public web-based GIS map that identifies all city-owned properties
ID Goal Initiative Accountable Entity
4B-0
7
Excelling in CityServices
Develop an Open Data program, including data publication, governanceand alignment to standards, to share appropriate City data with thecommunity
Innovation &Sustainability
Year Initiated Dedicated 2018 Funding (if applicable) Responsible Entities
2017 Work completed by personnel and operational expensesbudgeted in the Mayor's Office Innovation & Sustainability
Measure(s) of Success• Open Data policy approved by end of 2018
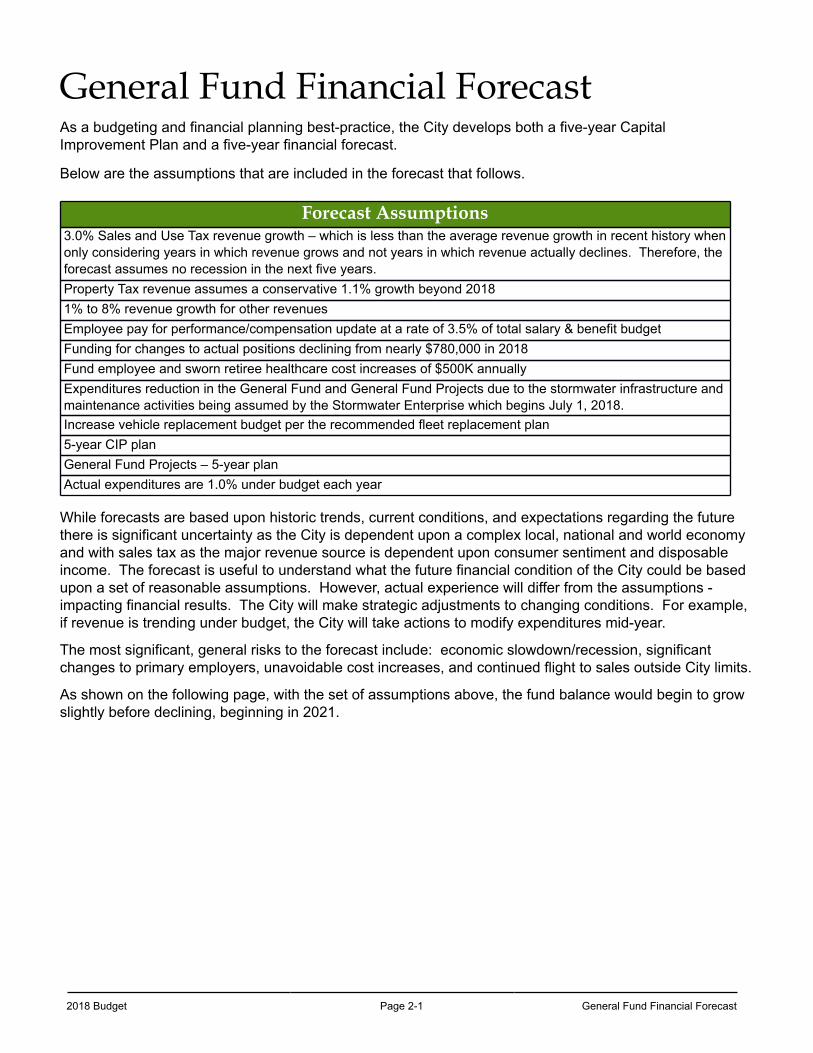
2018 Budget Page 2-1 General Fund Financial Forecast
General Fund Financial ForecastAs a budgeting and financial planning best-practice, the City develops both a five-year Capital Improvement Plan and a five-year financial forecast.
Below are the assumptions that are included in the forecast that follows.
Forecast Assumptions3.0% Sales and Use Tax revenue growth – which is less than the average revenue growth in recent history whenonly considering years in which revenue grows and not years in which revenue actually declines. Therefore, theforecast assumes no recession in the next five years.Property Tax revenue assumes a conservative 1.1% growth beyond 20181% to 8% revenue growth for other revenuesEmployee pay for performance/compensation update at a rate of 3.5% of total salary & benefit budgetFunding for changes to actual positions declining from nearly $780,000 in 2018Fund employee and sworn retiree healthcare cost increases of $500K annuallyExpenditures reduction in the General Fund and General Fund Projects due to the stormwater infrastructure and maintenance activities being assumed by the Stormwater Enterprise which begins July 1, 2018.Increase vehicle replacement budget per the recommended fleet replacement plan5-year CIP planGeneral Fund Projects – 5-year planActual expenditures are 1.0% under budget each year
While forecasts are based upon historic trends, current conditions, and expectations regarding the future there is significant uncertainty as the City is dependent upon a complex local, national and world economy and with sales tax as the major revenue source is dependent upon consumer sentiment and disposable income. The forecast is useful to understand what the future financial condition of the City could be based upon a set of reasonable assumptions. However, actual experience will differ from the assumptions - impacting financial results. The City will make strategic adjustments to changing conditions. For example, if revenue is trending under budget, the City will take actions to modify expenditures mid-year.
The most significant, general risks to the forecast include: economic slowdown/recession, significant changes to primary employers, unavoidable cost increases, and continued flight to sales outside City limits.
As shown on the following page, with the set of assumptions above, the fund balance would begin to grow slightly before declining, beginning in 2021.
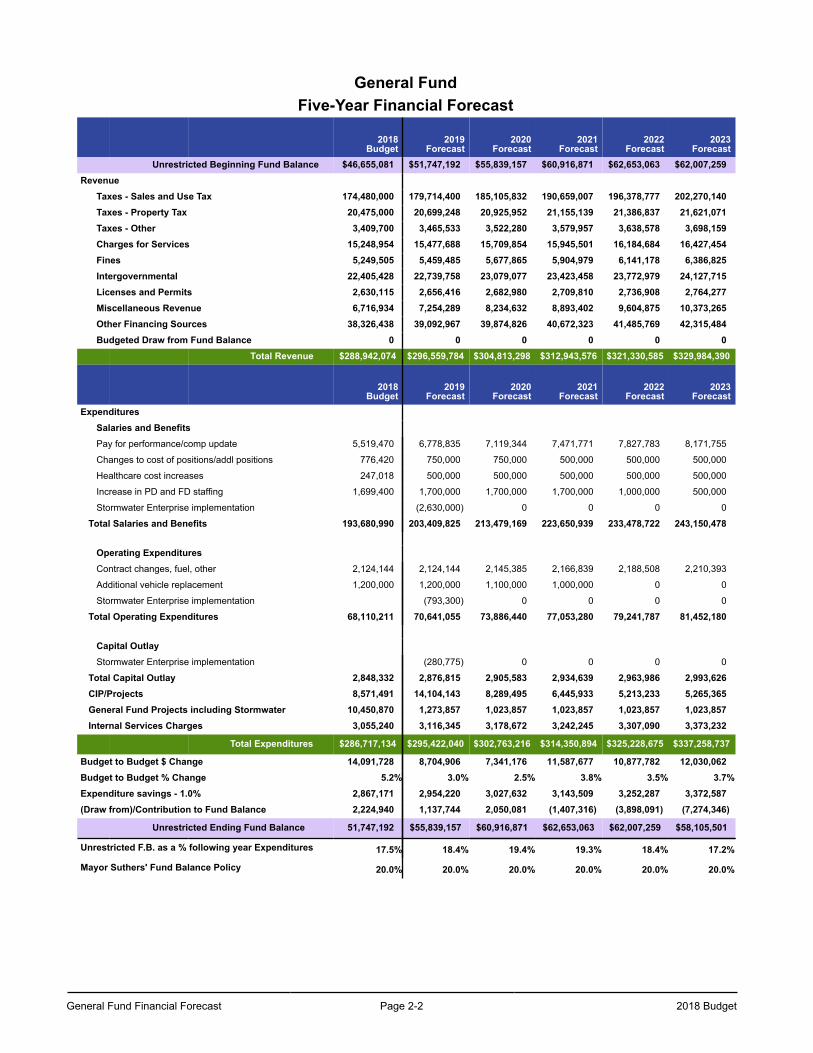
General Fund Financial Forecast Page 2-2 2018 Budget
General FundFive-Year Financial Forecast
2018Budget
2019Forecast
2020Forecast
2021Forecast
2022Forecast
2023Forecast
Unrestricted Beginning Fund Balance $46,655,081 $51,747,192 $55,839,157 $60,916,871 $62,653,063 $62,007,259Revenue
Taxes - Sales and Use Tax 174,480,000 179,714,400 185,105,832 190,659,007 196,378,777 202,270,140Taxes - Property Tax 20,475,000 20,699,248 20,925,952 21,155,139 21,386,837 21,621,071Taxes - Other 3,409,700 3,465,533 3,522,280 3,579,957 3,638,578 3,698,159Charges for Services 15,248,954 15,477,688 15,709,854 15,945,501 16,184,684 16,427,454Fines 5,249,505 5,459,485 5,677,865 5,904,979 6,141,178 6,386,825Intergovernmental 22,405,428 22,739,758 23,079,077 23,423,458 23,772,979 24,127,715Licenses and Permits 2,630,115 2,656,416 2,682,980 2,709,810 2,736,908 2,764,277Miscellaneous Revenue 6,716,934 7,254,289 8,234,632 8,893,402 9,604,875 10,373,265Other Financing Sources 38,326,438 39,092,967 39,874,826 40,672,323 41,485,769 42,315,484Budgeted Draw from Fund Balance 0 0 0 0 0 0
Total Revenue $288,942,074 $296,559,784 $304,813,298 $312,943,576 $321,330,585 $329,984,390
2018Budget
2019Forecast
2020Forecast
2021Forecast
2022Forecast
2023Forecast
ExpendituresSalaries and BenefitsPay for performance/comp update 5,519,470 6,778,835 7,119,344 7,471,771 7,827,783 8,171,755
Changes to cost of positions/addl positions 776,420 750,000 750,000 500,000 500,000 500,000
Healthcare cost increases 247,018 500,000 500,000 500,000 500,000 500,000
Increase in PD and FD staffing 1,699,400 1,700,000 1,700,000 1,700,000 1,000,000 500,000
Stormwater Enterprise implementation (2,630,000) 0 0 0 0
Total Salaries and Benefits 193,680,990 203,409,825 213,479,169 223,650,939 233,478,722 243,150,478
Operating ExpendituresContract changes, fuel, other 2,124,144 2,124,144 2,145,385 2,166,839 2,188,508 2,210,393
Additional vehicle replacement 1,200,000 1,200,000 1,100,000 1,000,000 0 0
Stormwater Enterprise implementation (793,300) 0 0 0 0
Total Operating Expenditures 68,110,211 70,641,055 73,886,440 77,053,280 79,241,787 81,452,180
Capital OutlayStormwater Enterprise implementation (280,775) 0 0 0 0
Total Capital Outlay 2,848,332 2,876,815 2,905,583 2,934,639 2,963,986 2,993,626CIP/Projects 8,571,491 14,104,143 8,289,495 6,445,933 5,213,233 5,265,365General Fund Projects including Stormwater 10,450,870 1,273,857 1,023,857 1,023,857 1,023,857 1,023,857Internal Services Charges 3,055,240 3,116,345 3,178,672 3,242,245 3,307,090 3,373,232
Total Expenditures $286,717,134 $295,422,040 $302,763,216 $314,350,894 $325,228,675 $337,258,737
Budget to Budget $ Change 14,091,728 8,704,906 7,341,176 11,587,677 10,877,782 12,030,062Budget to Budget % Change 5.2% 3.0% 2.5% 3.8% 3.5% 3.7%Expenditure savings - 1.0% 2,867,171 2,954,220 3,027,632 3,143,509 3,252,287 3,372,587(Draw from)/Contribution to Fund Balance 2,224,940 1,137,744 2,050,081 (1,407,316) (3,898,091) (7,274,346)
Unrestricted Ending Fund Balance 51,747,192 $55,839,157 $60,916,871 $62,653,063 $62,007,259 $58,105,501
Unrestricted F.B. as a % following year Expenditures 17.5% 18.4% 19.4% 19.3% 18.4% 17.2%
Mayor Suthers' Fund Balance Policy 20.0% 20.0% 20.0% 20.0% 20.0% 20.0%
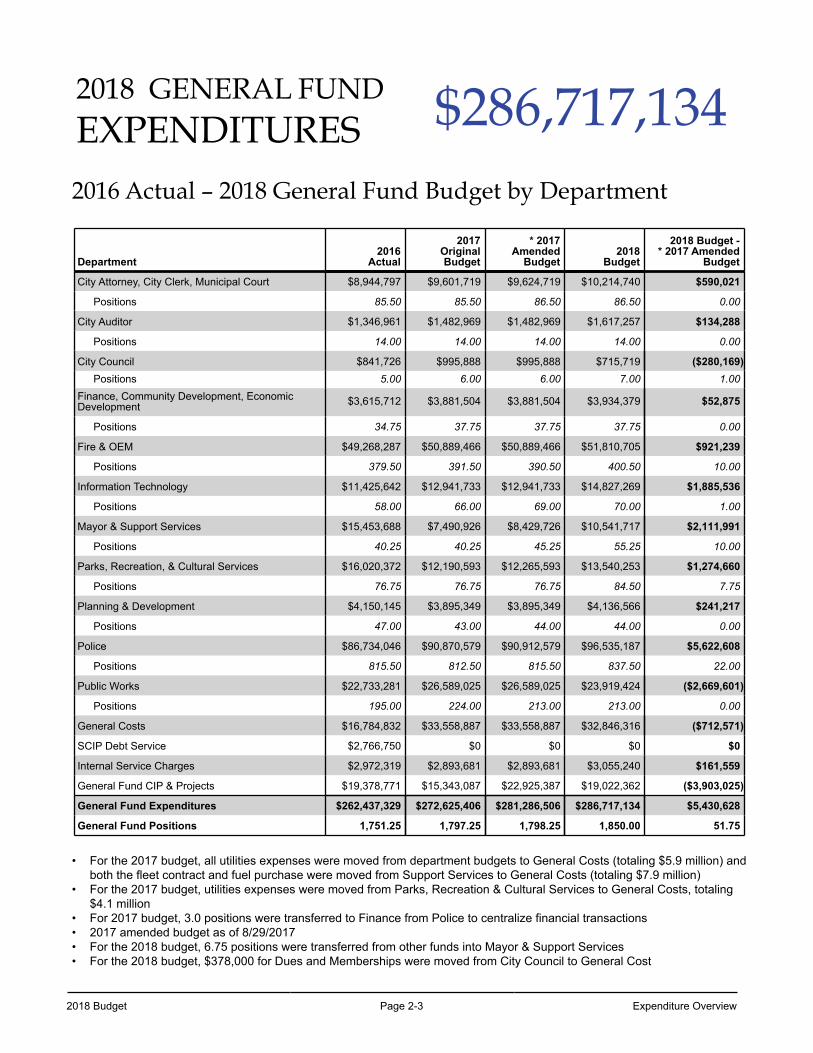
2018 Budget Page 2-3 Expenditure Overview
2018 GENERAL FUND $286,717,134EXPENDITURES2016 Actual – 2018 General Fund Budget by Department
Department2016
Actual
2017OriginalBudget
* 2017Amended
Budget2018
Budget
2018 Budget -* 2017 Amended
Budget
City Attorney, City Clerk, Municipal Court $8,944,797 $9,601,719 $9,624,719 $10,214,740 $590,021
Positions 85.50 85.50 86.50 86.50 0.00
City Auditor $1,346,961 $1,482,969 $1,482,969 $1,617,257 $134,288
Positions 14.00 14.00 14.00 14.00 0.00
City Council $841,726 $995,888 $995,888 $715,719 ($280,169)Positions 5.00 6.00 6.00 7.00 1.00
Finance, Community Development, EconomicDevelopment $3,615,712 $3,881,504 $3,881,504 $3,934,379 $52,875
Positions 34.75 37.75 37.75 37.75 0.00
Fire & OEM $49,268,287 $50,889,466 $50,889,466 $51,810,705 $921,239
Positions 379.50 391.50 390.50 400.50 10.00
Information Technology $11,425,642 $12,941,733 $12,941,733 $14,827,269 $1,885,536
Positions 58.00 66.00 69.00 70.00 1.00
Mayor & Support Services $15,453,688 $7,490,926 $8,429,726 $10,541,717 $2,111,991
Positions 40.25 40.25 45.25 55.25 10.00
Parks, Recreation, & Cultural Services $16,020,372 $12,190,593 $12,265,593 $13,540,253 $1,274,660
Positions 76.75 76.75 76.75 84.50 7.75
Planning & Development $4,150,145 $3,895,349 $3,895,349 $4,136,566 $241,217
Positions 47.00 43.00 44.00 44.00 0.00
Police $86,734,046 $90,870,579 $90,912,579 $96,535,187 $5,622,608
Positions 815.50 812.50 815.50 837.50 22.00
Public Works $22,733,281 $26,589,025 $26,589,025 $23,919,424 ($2,669,601)
Positions 195.00 224.00 213.00 213.00 0.00
General Costs $16,784,832 $33,558,887 $33,558,887 $32,846,316 ($712,571)
SCIP Debt Service $2,766,750 $0 $0 $0 $0
Internal Service Charges $2,972,319 $2,893,681 $2,893,681 $3,055,240 $161,559
General Fund CIP & Projects $19,378,771 $15,343,087 $22,925,387 $19,022,362 ($3,903,025)
General Fund Expenditures $262,437,329 $272,625,406 $281,286,506 $286,717,134 $5,430,628
General Fund Positions 1,751.25 1,797.25 1,798.25 1,850.00 51.75
• For the 2017 budget, all utilities expenses were moved from department budgets to General Costs (totaling $5.9 million) and both the fleet contract and fuel purchase were moved from Support Services to General Costs (totaling $7.9 million)
• For the 2017 budget, utilities expenses were moved from Parks, Recreation & Cultural Services to General Costs, totaling $4.1 million
• For 2017 budget, 3.0 positions were transferred to Finance from Police to centralize financial transactions• 2017 amended budget as of 8/29/2017 • For the 2018 budget, 6.75 positions were transferred from other funds into Mayor & Support Services• For the 2018 budget, $378,000 for Dues and Memberships were moved from City Council to General Cost
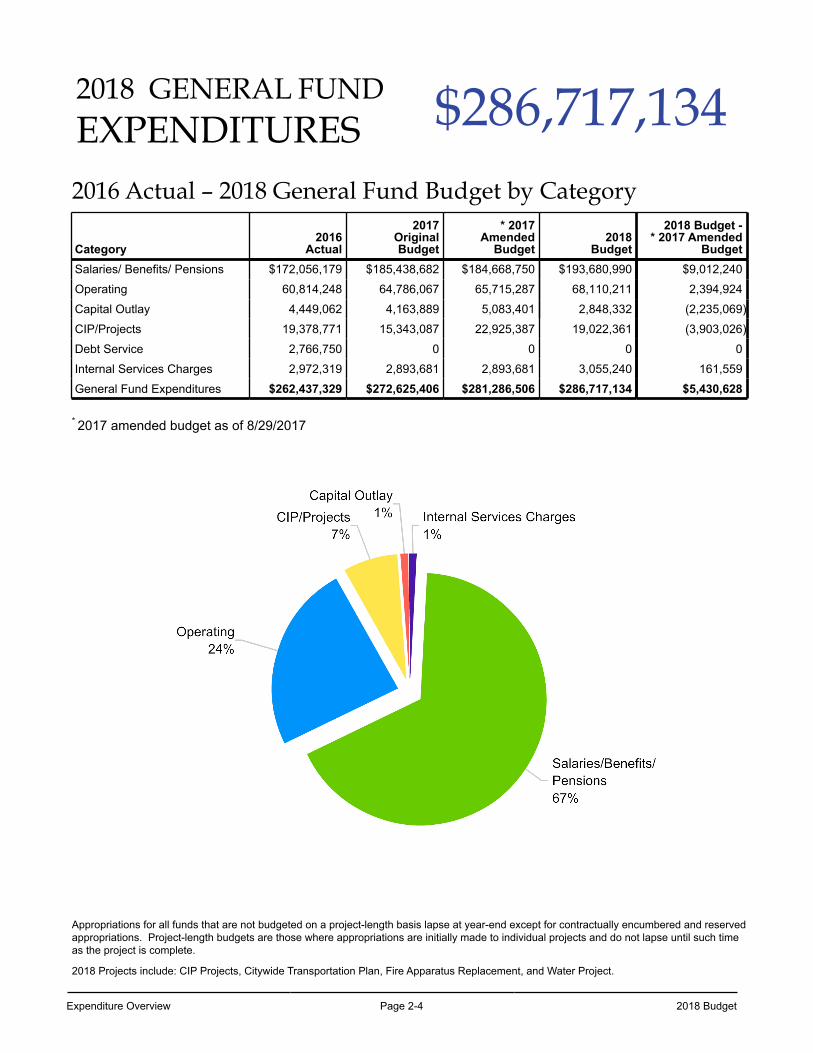
Expenditure Overview Page 2-4 2018 Budget
2018 GENERAL FUND $286,717,134EXPENDITURES2016 Actual – 2018 General Fund Budget by Category
Category2016
Actual
2017OriginalBudget
* 2017Amended
Budget2018
Budget
2018 Budget -* 2017 Amended
BudgetSalaries/ Benefits/ Pensions $172,056,179 $185,438,682 $184,668,750 $193,680,990 $9,012,240
Operating 60,814,248 64,786,067 65,715,287 68,110,211 2,394,924
Capital Outlay 4,449,062 4,163,889 5,083,401 2,848,332 (2,235,069)
CIP/Projects 19,378,771 15,343,087 22,925,387 19,022,361 (3,903,026)
Debt Service 2,766,750 0 0 0 0
Internal Services Charges 2,972,319 2,893,681 2,893,681 3,055,240 161,559
General Fund Expenditures $262,437,329 $272,625,406 $281,286,506 $286,717,134 $5,430,628
* 2017 amended budget as of 8/29/2017
Appropriations for all funds that are not budgeted on a project-length basis lapse at year-end except for contractually encumbered and reserved appropriations. Project-length budgets are those where appropriations are initially made to individual projects and do not lapse until such time as the project is complete.
2018 Projects include: CIP Projects, Citywide Transportation Plan, Fire Apparatus Replacement, and Water Project.
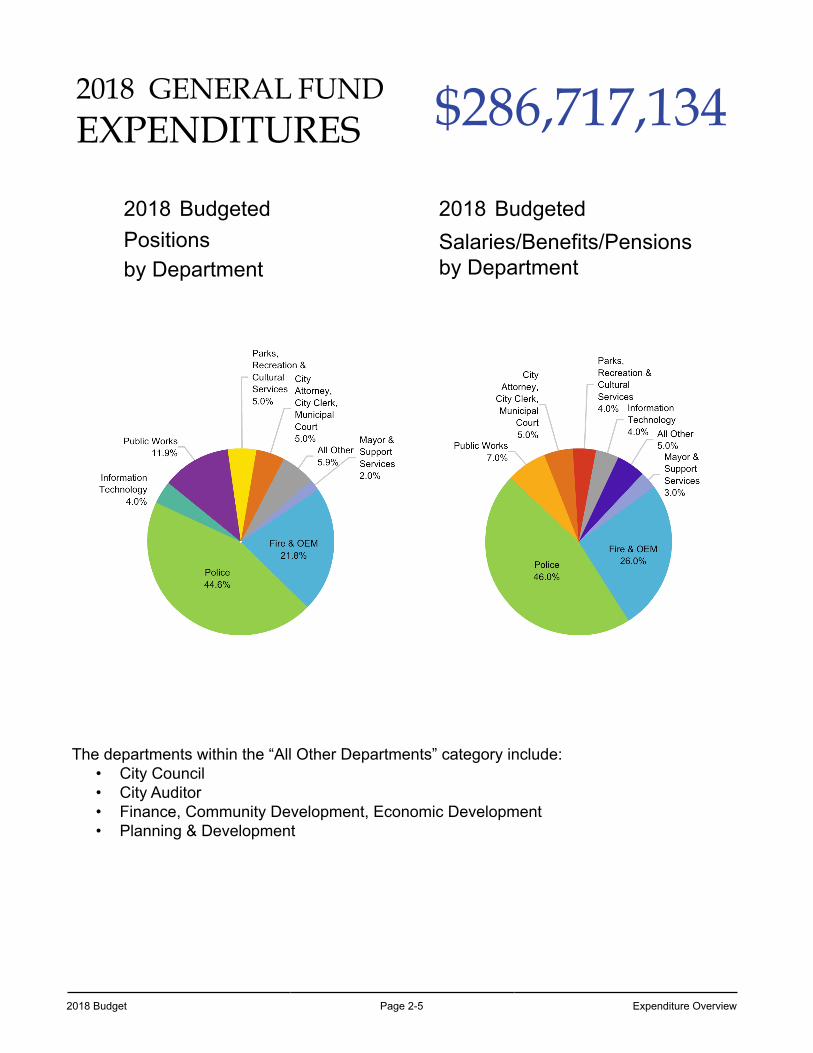
2018 Budget Page 2-5 Expenditure Overview
2018 GENERAL FUND $286,717,134EXPENDITURES
2018 Budgeted 2018 BudgetedPositions by Department
Salaries/Benefits/Pensionsby Department
The departments within the “All Other Departments” category include:• City Council• City Auditor• Finance, Community Development, Economic Development• Planning & Development
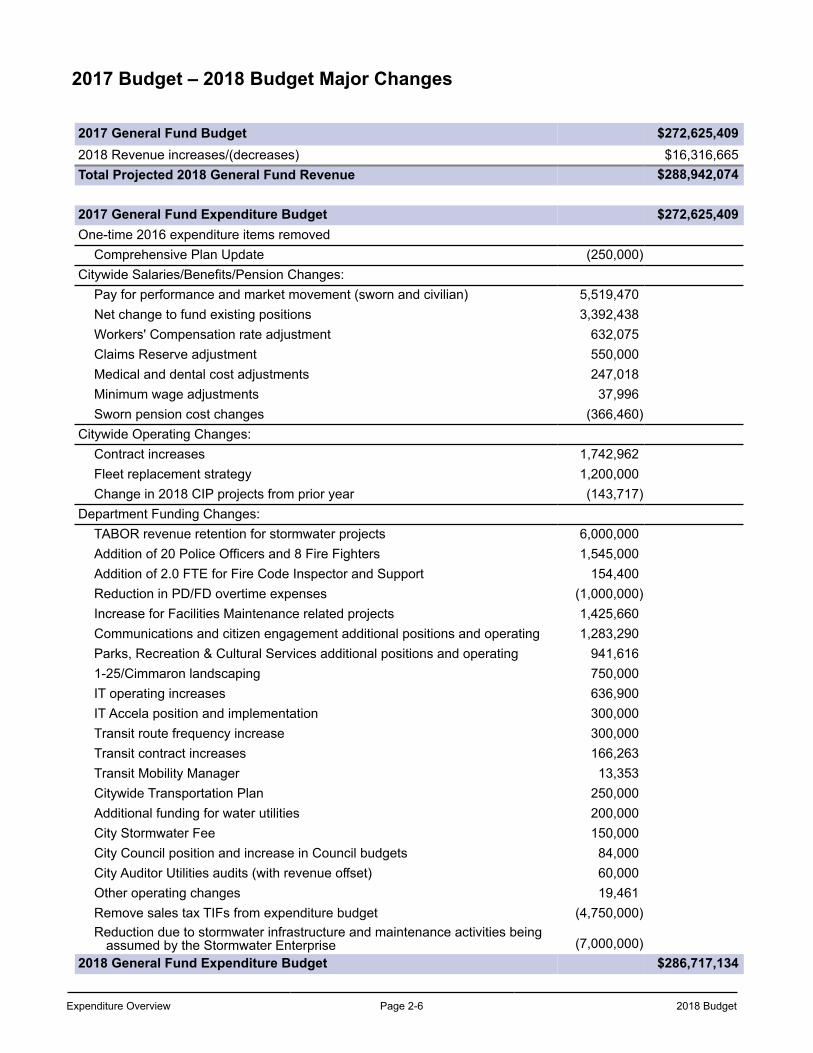
Expenditure Overview Page 2-6 2018 Budget
2017 Budget – 2018 Budget Major Changes
2017 General Fund Budget $272,625,4092018 Revenue increases/(decreases) $16,316,665Total Projected 2018 General Fund Revenue $288,942,074
2017 General Fund Expenditure Budget $272,625,409One-time 2016 expenditure items removed
Comprehensive Plan Update (250,000)Citywide Salaries/Benefits/Pension Changes:
Pay for performance and market movement (sworn and civilian) 5,519,470Net change to fund existing positions 3,392,438Workers' Compensation rate adjustment 632,075Claims Reserve adjustment 550,000Medical and dental cost adjustments 247,018Minimum wage adjustments 37,996Sworn pension cost changes (366,460)
Citywide Operating Changes:Contract increases 1,742,962Fleet replacement strategy 1,200,000Change in 2018 CIP projects from prior year (143,717)
Department Funding Changes:TABOR revenue retention for stormwater projects 6,000,000Addition of 20 Police Officers and 8 Fire Fighters 1,545,000Addition of 2.0 FTE for Fire Code Inspector and Support 154,400Reduction in PD/FD overtime expenses (1,000,000)Increase for Facilities Maintenance related projects 1,425,660Communications and citizen engagement additional positions and operating 1,283,290Parks, Recreation & Cultural Services additional positions and operating 941,6161-25/Cimmaron landscaping 750,000IT operating increases 636,900IT Accela position and implementation 300,000Transit route frequency increase 300,000Transit contract increases 166,263Transit Mobility Manager 13,353Citywide Transportation Plan 250,000Additional funding for water utilities 200,000City Stormwater Fee 150,000City Council position and increase in Council budgets 84,000City Auditor Utilities audits (with revenue offset) 60,000Other operating changes 19,461Remove sales tax TIFs from expenditure budget (4,750,000)Reduction due to stormwater infrastructure and maintenance activities being
assumed by the Stormwater Enterprise (7,000,000)2018 General Fund Expenditure Budget $286,717,134
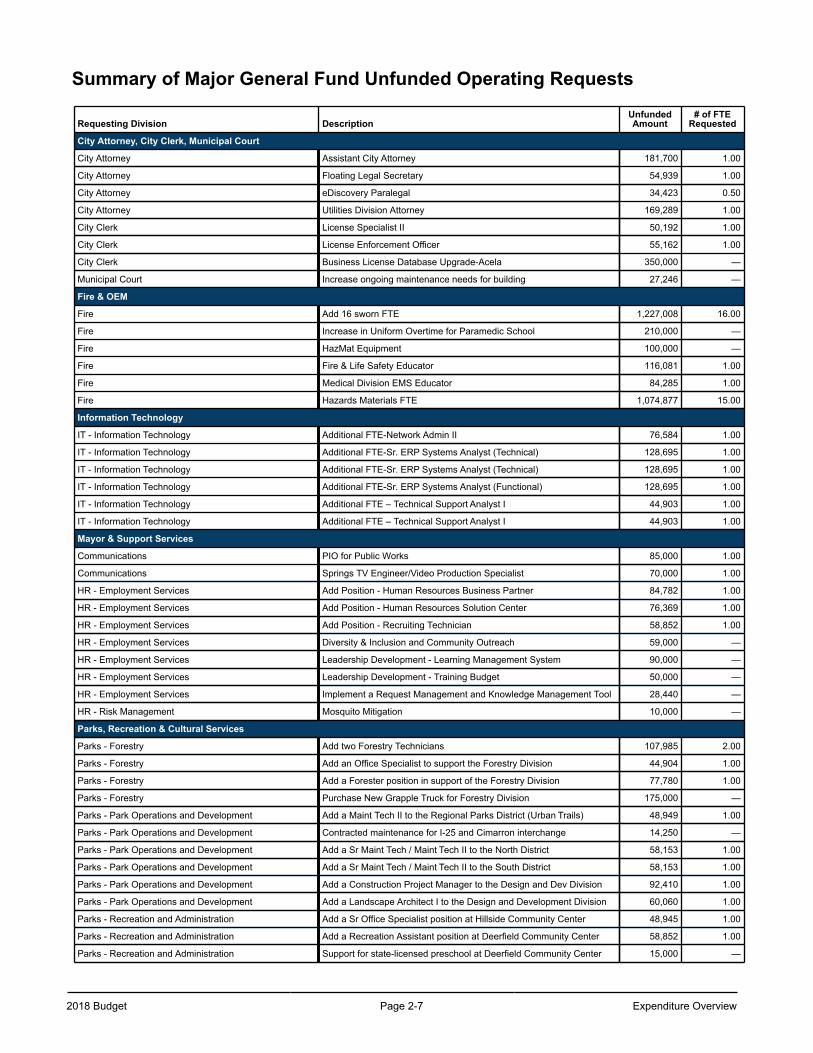
2018 Budget Page 2-7 Expenditure Overview
Summary of Major General Fund Unfunded Operating Requests
Requesting Division DescriptionUnfunded Amount
# of FTERequested
City Attorney, City Clerk, Municipal Court
City Attorney Assistant City Attorney 181,700 1.00
City Attorney Floating Legal Secretary 54,939 1.00
City Attorney eDiscovery Paralegal 34,423 0.50
City Attorney Utilities Division Attorney 169,289 1.00
City Clerk License Specialist II 50,192 1.00
City Clerk License Enforcement Officer 55,162 1.00
City Clerk Business License Database Upgrade-Acela 350,000 —
Municipal Court Increase ongoing maintenance needs for building 27,246 —
Fire & OEM
Fire Add 16 sworn FTE 1,227,008 16.00
Fire Increase in Uniform Overtime for Paramedic School 210,000 —
Fire HazMat Equipment 100,000 —
Fire Fire & Life Safety Educator 116,081 1.00
Fire Medical Division EMS Educator 84,285 1.00
Fire Hazards Materials FTE 1,074,877 15.00
Information Technology
IT - Information Technology Additional FTE-Network Admin II 76,584 1.00
IT - Information Technology Additional FTE-Sr. ERP Systems Analyst (Technical) 128,695 1.00
IT - Information Technology Additional FTE-Sr. ERP Systems Analyst (Technical) 128,695 1.00
IT - Information Technology Additional FTE-Sr. ERP Systems Analyst (Functional) 128,695 1.00
IT - Information Technology Additional FTE – Technical Support Analyst I 44,903 1.00
IT - Information Technology Additional FTE – Technical Support Analyst I 44,903 1.00
Mayor & Support Services
Communications PIO for Public Works 85,000 1.00
Communications Springs TV Engineer/Video Production Specialist 70,000 1.00
HR - Employment Services Add Position - Human Resources Business Partner 84,782 1.00
HR - Employment Services Add Position - Human Resources Solution Center 76,369 1.00
HR - Employment Services Add Position - Recruiting Technician 58,852 1.00
HR - Employment Services Diversity & Inclusion and Community Outreach 59,000 —
HR - Employment Services Leadership Development - Learning Management System 90,000 —
HR - Employment Services Leadership Development - Training Budget 50,000 —
HR - Employment Services Implement a Request Management and Knowledge Management Tool 28,440 —
HR - Risk Management Mosquito Mitigation 10,000 —
Parks, Recreation & Cultural Services
Parks - Forestry Add two Forestry Technicians 107,985 2.00
Parks - Forestry Add an Office Specialist to support the Forestry Division 44,904 1.00
Parks - Forestry Add a Forester position in support of the Forestry Division 77,780 1.00
Parks - Forestry Purchase New Grapple Truck for Forestry Division 175,000 —
Parks - Park Operations and Development Add a Maint Tech II to the Regional Parks District (Urban Trails) 48,949 1.00
Parks - Park Operations and Development Contracted maintenance for I-25 and Cimarron interchange 14,250 —
Parks - Park Operations and Development Add a Sr Maint Tech / Maint Tech II to the North District 58,153 1.00
Parks - Park Operations and Development Add a Sr Maint Tech / Maint Tech II to the South District 58,153 1.00
Parks - Park Operations and Development Add a Construction Project Manager to the Design and Dev Division 92,410 1.00
Parks - Park Operations and Development Add a Landscape Architect I to the Design and Development Division 60,060 1.00
Parks - Recreation and Administration Add a Sr Office Specialist position at Hillside Community Center 48,945 1.00
Parks - Recreation and Administration Add a Recreation Assistant position at Deerfield Community Center 58,852 1.00
Parks - Recreation and Administration Support for state-licensed preschool at Deerfield Community Center 15,000 —
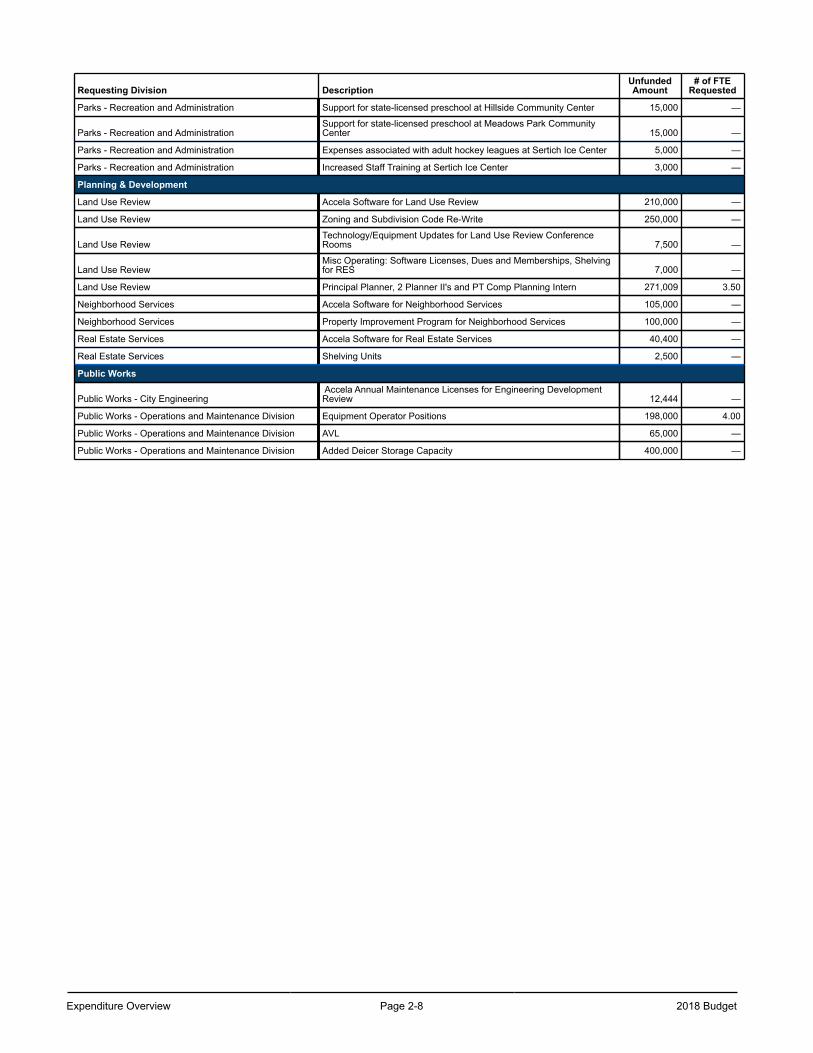
Expenditure Overview Page 2-8 2018 Budget
Requesting Division DescriptionUnfunded Amount
# of FTERequested
Parks - Recreation and Administration Support for state-licensed preschool at Hillside Community Center 15,000 —
Parks - Recreation and AdministrationSupport for state-licensed preschool at Meadows Park CommunityCenter 15,000 —
Parks - Recreation and Administration Expenses associated with adult hockey leagues at Sertich Ice Center 5,000 —
Parks - Recreation and Administration Increased Staff Training at Sertich Ice Center 3,000 —
Planning & Development
Land Use Review Accela Software for Land Use Review 210,000 —
Land Use Review Zoning and Subdivision Code Re-Write 250,000 —
Land Use ReviewTechnology/Equipment Updates for Land Use Review ConferenceRooms 7,500 —
Land Use ReviewMisc Operating: Software Licenses, Dues and Memberships, Shelvingfor RES 7,000 —
Land Use Review Principal Planner, 2 Planner II's and PT Comp Planning Intern 271,009 3.50
Neighborhood Services Accela Software for Neighborhood Services 105,000 —
Neighborhood Services Property Improvement Program for Neighborhood Services 100,000 —
Real Estate Services Accela Software for Real Estate Services 40,400 —
Real Estate Services Shelving Units 2,500 —
Public Works
Public Works - City Engineering Accela Annual Maintenance Licenses for Engineering DevelopmentReview 12,444 —
Public Works - Operations and Maintenance Division Equipment Operator Positions 198,000 4.00
Public Works - Operations and Maintenance Division AVL 65,000 —
Public Works - Operations and Maintenance Division Added Deicer Storage Capacity 400,000 —
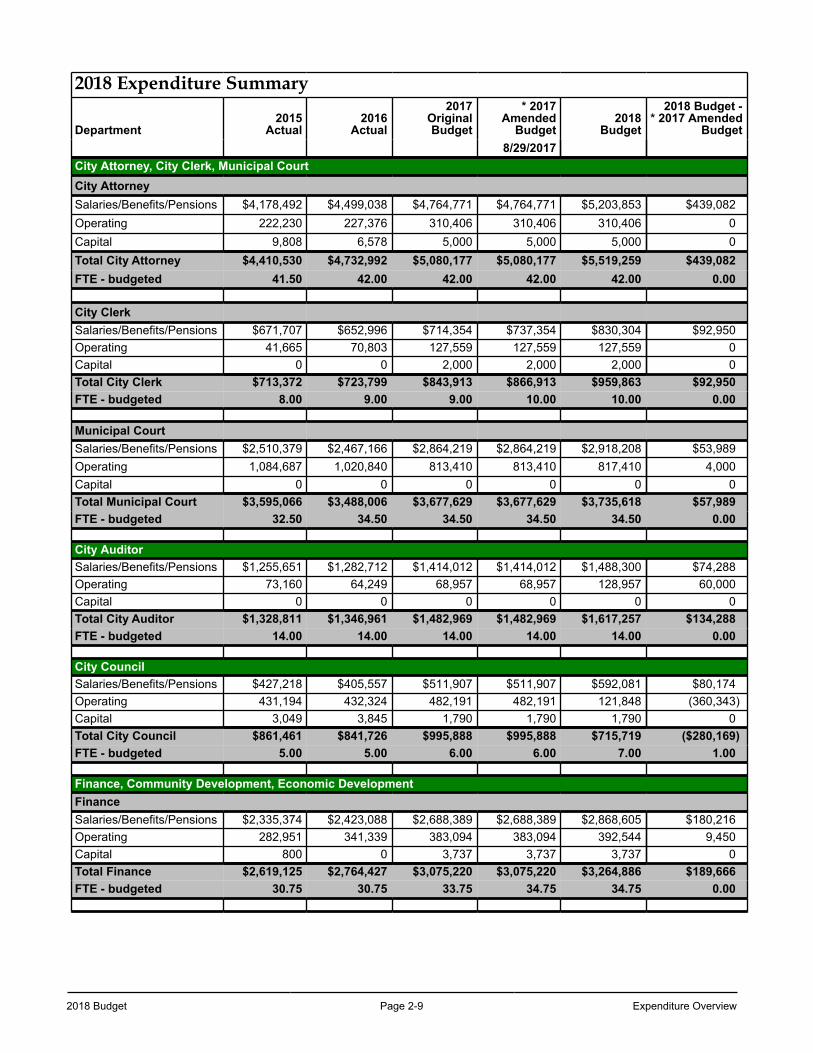
2018 Budget Page 2-9 Expenditure Overview
2018 Expenditure Summary
Department2015
Actual2016
Actual
2017OriginalBudget
* 2017Amended
Budget2018
Budget
2018 Budget -* 2017 Amended
Budget8/29/2017
City Attorney, City Clerk, Municipal CourtCity AttorneySalaries/Benefits/Pensions $4,178,492 $4,499,038 $4,764,771 $4,764,771 $5,203,853 $439,082Operating 222,230 227,376 310,406 310,406 310,406 0Capital 9,808 6,578 5,000 5,000 5,000 0Total City Attorney $4,410,530 $4,732,992 $5,080,177 $5,080,177 $5,519,259 $439,082FTE - budgeted 41.50 42.00 42.00 42.00 42.00 0.00
City ClerkSalaries/Benefits/Pensions $671,707 $652,996 $714,354 $737,354 $830,304 $92,950Operating 41,665 70,803 127,559 127,559 127,559 0Capital 0 0 2,000 2,000 2,000 0Total City Clerk $713,372 $723,799 $843,913 $866,913 $959,863 $92,950FTE - budgeted 8.00 9.00 9.00 10.00 10.00 0.00
Municipal CourtSalaries/Benefits/Pensions $2,510,379 $2,467,166 $2,864,219 $2,864,219 $2,918,208 $53,989Operating 1,084,687 1,020,840 813,410 813,410 817,410 4,000Capital 0 0 0 0 0 0Total Municipal Court $3,595,066 $3,488,006 $3,677,629 $3,677,629 $3,735,618 $57,989FTE - budgeted 32.50 34.50 34.50 34.50 34.50 0.00
City AuditorSalaries/Benefits/Pensions $1,255,651 $1,282,712 $1,414,012 $1,414,012 $1,488,300 $74,288Operating 73,160 64,249 68,957 68,957 128,957 60,000Capital 0 0 0 0 0 0Total City Auditor $1,328,811 $1,346,961 $1,482,969 $1,482,969 $1,617,257 $134,288FTE - budgeted 14.00 14.00 14.00 14.00 14.00 0.00
City CouncilSalaries/Benefits/Pensions $427,218 $405,557 $511,907 $511,907 $592,081 $80,174Operating 431,194 432,324 482,191 482,191 121,848 (360,343)Capital 3,049 3,845 1,790 1,790 1,790 0Total City Council $861,461 $841,726 $995,888 $995,888 $715,719 ($280,169)FTE - budgeted 5.00 5.00 6.00 6.00 7.00 1.00
Finance, Community Development, Economic DevelopmentFinanceSalaries/Benefits/Pensions $2,335,374 $2,423,088 $2,688,389 $2,688,389 $2,868,605 $180,216Operating 282,951 341,339 383,094 383,094 392,544 9,450Capital 800 0 3,737 3,737 3,737 0Total Finance $2,619,125 $2,764,427 $3,075,220 $3,075,220 $3,264,886 $189,666FTE - budgeted 30.75 30.75 33.75 34.75 34.75 0.00
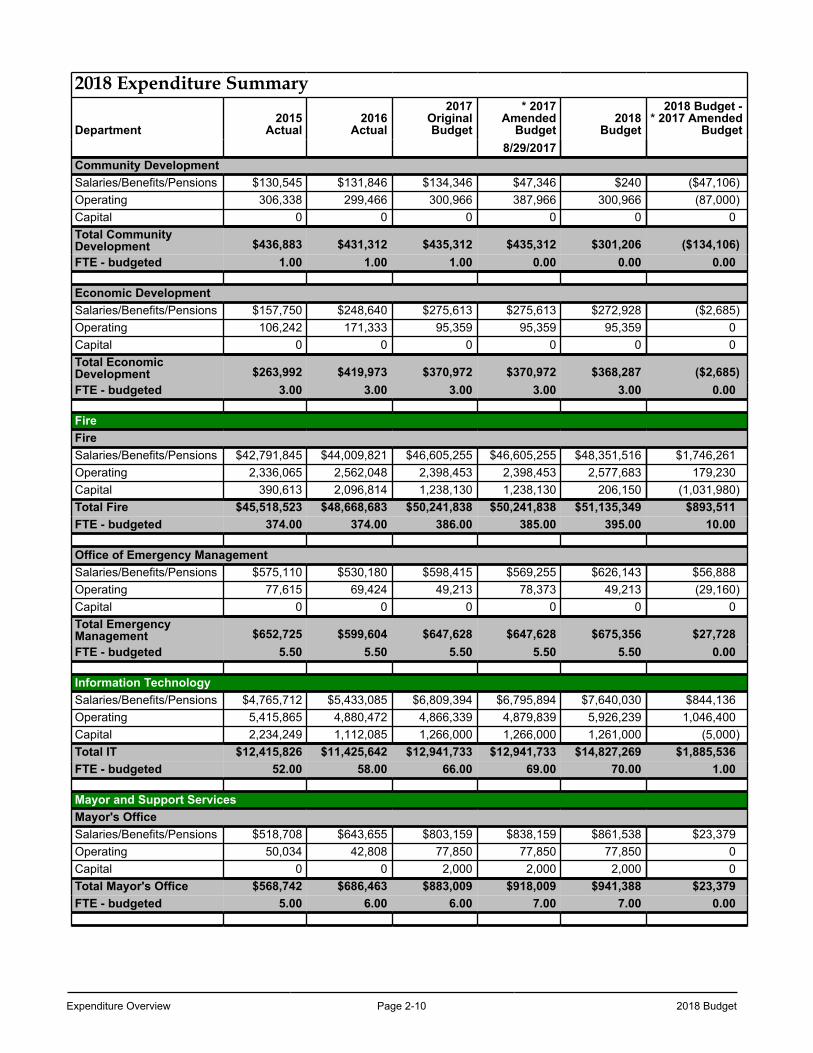
Expenditure Overview Page 2-10 2018 Budget
2018 Expenditure Summary
Department2015
Actual2016
Actual
2017OriginalBudget
* 2017Amended
Budget2018
Budget
2018 Budget -* 2017 Amended
Budget8/29/2017
Community DevelopmentSalaries/Benefits/Pensions $130,545 $131,846 $134,346 $47,346 $240 ($47,106)Operating 306,338 299,466 300,966 387,966 300,966 (87,000)Capital 0 0 0 0 0 0Total CommunityDevelopment $436,883 $431,312 $435,312 $435,312 $301,206 ($134,106)FTE - budgeted 1.00 1.00 1.00 0.00 0.00 0.00
Economic DevelopmentSalaries/Benefits/Pensions $157,750 $248,640 $275,613 $275,613 $272,928 ($2,685)Operating 106,242 171,333 95,359 95,359 95,359 0Capital 0 0 0 0 0 0Total EconomicDevelopment $263,992 $419,973 $370,972 $370,972 $368,287 ($2,685)FTE - budgeted 3.00 3.00 3.00 3.00 3.00 0.00
FireFireSalaries/Benefits/Pensions $42,791,845 $44,009,821 $46,605,255 $46,605,255 $48,351,516 $1,746,261Operating 2,336,065 2,562,048 2,398,453 2,398,453 2,577,683 179,230Capital 390,613 2,096,814 1,238,130 1,238,130 206,150 (1,031,980)Total Fire $45,518,523 $48,668,683 $50,241,838 $50,241,838 $51,135,349 $893,511FTE - budgeted 374.00 374.00 386.00 385.00 395.00 10.00
Office of Emergency ManagementSalaries/Benefits/Pensions $575,110 $530,180 $598,415 $569,255 $626,143 $56,888Operating 77,615 69,424 49,213 78,373 49,213 (29,160)Capital 0 0 0 0 0 0Total EmergencyManagement $652,725 $599,604 $647,628 $647,628 $675,356 $27,728FTE - budgeted 5.50 5.50 5.50 5.50 5.50 0.00
Information TechnologySalaries/Benefits/Pensions $4,765,712 $5,433,085 $6,809,394 $6,795,894 $7,640,030 $844,136Operating 5,415,865 4,880,472 4,866,339 4,879,839 5,926,239 1,046,400Capital 2,234,249 1,112,085 1,266,000 1,266,000 1,261,000 (5,000)Total IT $12,415,826 $11,425,642 $12,941,733 $12,941,733 $14,827,269 $1,885,536FTE - budgeted 52.00 58.00 66.00 69.00 70.00 1.00
Mayor and Support ServicesMayor's OfficeSalaries/Benefits/Pensions $518,708 $643,655 $803,159 $838,159 $861,538 $23,379Operating 50,034 42,808 77,850 77,850 77,850 0Capital 0 0 2,000 2,000 2,000 0Total Mayor's Office $568,742 $686,463 $883,009 $918,009 $941,388 $23,379FTE - budgeted 5.00 6.00 6.00 7.00 7.00 0.00
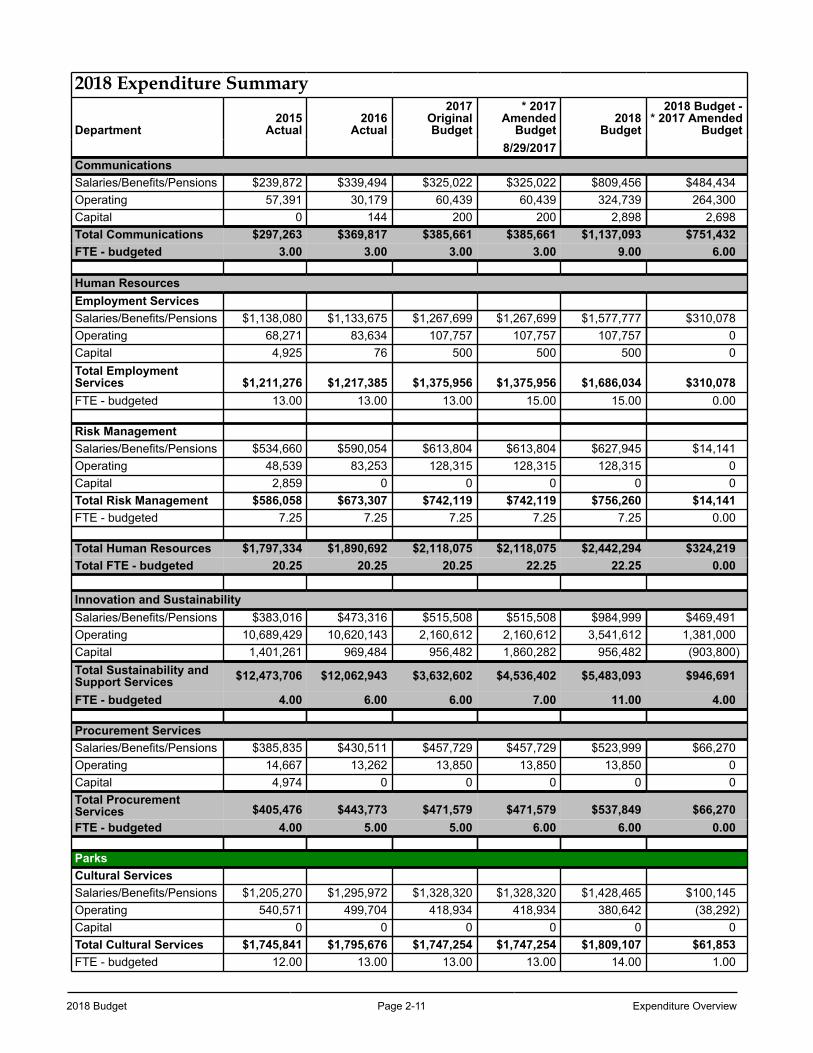
2018 Budget Page 2-11 Expenditure Overview
2018 Expenditure Summary
Department2015
Actual2016
Actual
2017OriginalBudget
* 2017Amended
Budget2018
Budget
2018 Budget -* 2017 Amended
Budget8/29/2017
CommunicationsSalaries/Benefits/Pensions $239,872 $339,494 $325,022 $325,022 $809,456 $484,434Operating 57,391 30,179 60,439 60,439 324,739 264,300Capital 0 144 200 200 2,898 2,698Total Communications $297,263 $369,817 $385,661 $385,661 $1,137,093 $751,432FTE - budgeted 3.00 3.00 3.00 3.00 9.00 6.00
Human ResourcesEmployment ServicesSalaries/Benefits/Pensions $1,138,080 $1,133,675 $1,267,699 $1,267,699 $1,577,777 $310,078Operating 68,271 83,634 107,757 107,757 107,757 0Capital 4,925 76 500 500 500 0Total EmploymentServices $1,211,276 $1,217,385 $1,375,956 $1,375,956 $1,686,034 $310,078FTE - budgeted 13.00 13.00 13.00 15.00 15.00 0.00
Risk ManagementSalaries/Benefits/Pensions $534,660 $590,054 $613,804 $613,804 $627,945 $14,141Operating 48,539 83,253 128,315 128,315 128,315 0Capital 2,859 0 0 0 0 0Total Risk Management $586,058 $673,307 $742,119 $742,119 $756,260 $14,141FTE - budgeted 7.25 7.25 7.25 7.25 7.25 0.00
Total Human Resources $1,797,334 $1,890,692 $2,118,075 $2,118,075 $2,442,294 $324,219Total FTE - budgeted 20.25 20.25 20.25 22.25 22.25 0.00
Innovation and SustainabilitySalaries/Benefits/Pensions $383,016 $473,316 $515,508 $515,508 $984,999 $469,491Operating 10,689,429 10,620,143 2,160,612 2,160,612 3,541,612 1,381,000Capital 1,401,261 969,484 956,482 1,860,282 956,482 (903,800)Total Sustainability andSupport Services $12,473,706 $12,062,943 $3,632,602 $4,536,402 $5,483,093 $946,691
FTE - budgeted 4.00 6.00 6.00 7.00 11.00 4.00
Procurement ServicesSalaries/Benefits/Pensions $385,835 $430,511 $457,729 $457,729 $523,999 $66,270Operating 14,667 13,262 13,850 13,850 13,850 0Capital 4,974 0 0 0 0 0Total ProcurementServices $405,476 $443,773 $471,579 $471,579 $537,849 $66,270FTE - budgeted 4.00 5.00 5.00 6.00 6.00 0.00
ParksCultural ServicesSalaries/Benefits/Pensions $1,205,270 $1,295,972 $1,328,320 $1,328,320 $1,428,465 $100,145Operating 540,571 499,704 418,934 418,934 380,642 (38,292)Capital 0 0 0 0 0 0Total Cultural Services $1,745,841 $1,795,676 $1,747,254 $1,747,254 $1,809,107 $61,853FTE - budgeted 12.00 13.00 13.00 13.00 14.00 1.00
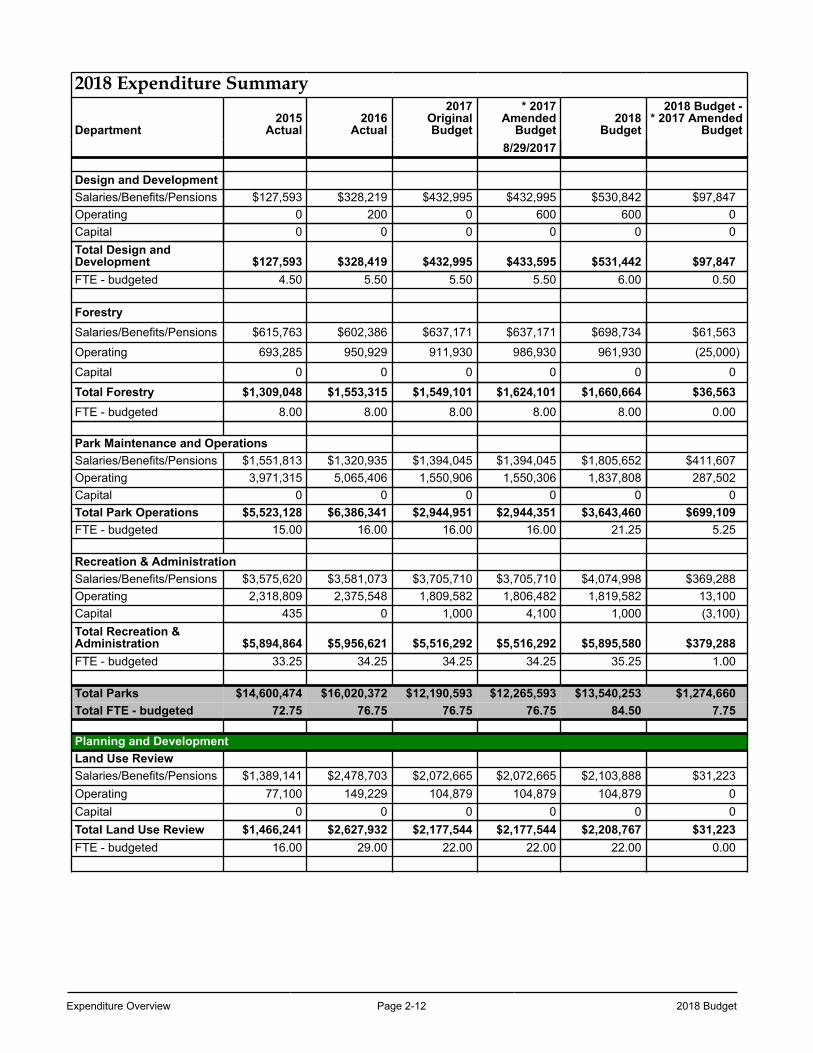
Expenditure Overview Page 2-12 2018 Budget
2018 Expenditure Summary
Department2015
Actual2016
Actual
2017OriginalBudget
* 2017Amended
Budget2018
Budget
2018 Budget -* 2017 Amended
Budget8/29/2017
Design and DevelopmentSalaries/Benefits/Pensions $127,593 $328,219 $432,995 $432,995 $530,842 $97,847Operating 0 200 0 600 600 0Capital 0 0 0 0 0 0Total Design andDevelopment $127,593 $328,419 $432,995 $433,595 $531,442 $97,847FTE - budgeted 4.50 5.50 5.50 5.50 6.00 0.50
ForestrySalaries/Benefits/Pensions $615,763 $602,386 $637,171 $637,171 $698,734 $61,563
Operating 693,285 950,929 911,930 986,930 961,930 (25,000)
Capital 0 0 0 0 0 0
Total Forestry $1,309,048 $1,553,315 $1,549,101 $1,624,101 $1,660,664 $36,563FTE - budgeted 8.00 8.00 8.00 8.00 8.00 0.00
Park Maintenance and OperationsSalaries/Benefits/Pensions $1,551,813 $1,320,935 $1,394,045 $1,394,045 $1,805,652 $411,607Operating 3,971,315 5,065,406 1,550,906 1,550,306 1,837,808 287,502Capital 0 0 0 0 0 0Total Park Operations $5,523,128 $6,386,341 $2,944,951 $2,944,351 $3,643,460 $699,109FTE - budgeted 15.00 16.00 16.00 16.00 21.25 5.25
Recreation & AdministrationSalaries/Benefits/Pensions $3,575,620 $3,581,073 $3,705,710 $3,705,710 $4,074,998 $369,288Operating 2,318,809 2,375,548 1,809,582 1,806,482 1,819,582 13,100Capital 435 0 1,000 4,100 1,000 (3,100)Total Recreation &Administration $5,894,864 $5,956,621 $5,516,292 $5,516,292 $5,895,580 $379,288FTE - budgeted 33.25 34.25 34.25 34.25 35.25 1.00
Total Parks $14,600,474 $16,020,372 $12,190,593 $12,265,593 $13,540,253 $1,274,660Total FTE - budgeted 72.75 76.75 76.75 76.75 84.50 7.75
Planning and DevelopmentLand Use ReviewSalaries/Benefits/Pensions $1,389,141 $2,478,703 $2,072,665 $2,072,665 $2,103,888 $31,223Operating 77,100 149,229 104,879 104,879 104,879 0Capital 0 0 0 0 0 0Total Land Use Review $1,466,241 $2,627,932 $2,177,544 $2,177,544 $2,208,767 $31,223FTE - budgeted 16.00 29.00 22.00 22.00 22.00 0.00
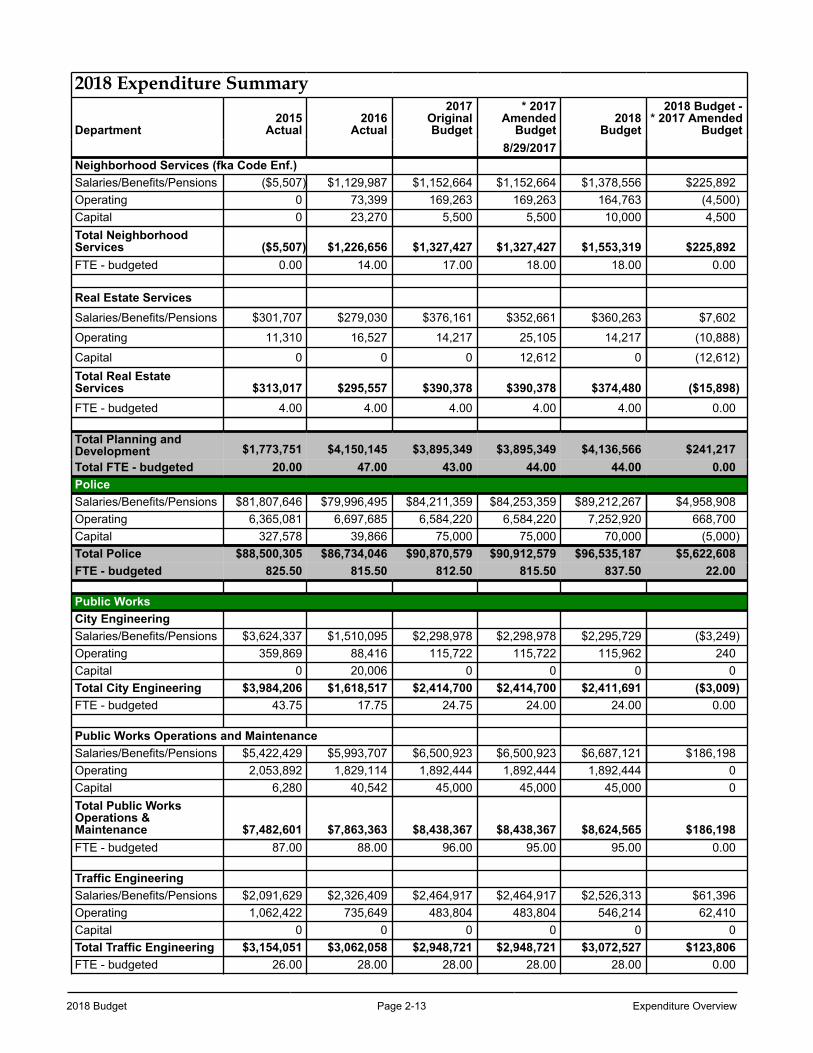
2018 Budget Page 2-13 Expenditure Overview
2018 Expenditure Summary
Department2015
Actual2016
Actual
2017OriginalBudget
* 2017Amended
Budget2018
Budget
2018 Budget -* 2017 Amended
Budget8/29/2017
Neighborhood Services (fka Code Enf.)Salaries/Benefits/Pensions ($5,507) $1,129,987 $1,152,664 $1,152,664 $1,378,556 $225,892Operating 0 73,399 169,263 169,263 164,763 (4,500)Capital 0 23,270 5,500 5,500 10,000 4,500Total NeighborhoodServices ($5,507) $1,226,656 $1,327,427 $1,327,427 $1,553,319 $225,892FTE - budgeted 0.00 14.00 17.00 18.00 18.00 0.00
Real Estate ServicesSalaries/Benefits/Pensions $301,707 $279,030 $376,161 $352,661 $360,263 $7,602
Operating 11,310 16,527 14,217 25,105 14,217 (10,888)
Capital 0 0 0 12,612 0 (12,612)Total Real EstateServices $313,017 $295,557 $390,378 $390,378 $374,480 ($15,898)FTE - budgeted 4.00 4.00 4.00 4.00 4.00 0.00
Total Planning andDevelopment $1,773,751 $4,150,145 $3,895,349 $3,895,349 $4,136,566 $241,217Total FTE - budgeted 20.00 47.00 43.00 44.00 44.00 0.00PoliceSalaries/Benefits/Pensions $81,807,646 $79,996,495 $84,211,359 $84,253,359 $89,212,267 $4,958,908Operating 6,365,081 6,697,685 6,584,220 6,584,220 7,252,920 668,700Capital 327,578 39,866 75,000 75,000 70,000 (5,000)Total Police $88,500,305 $86,734,046 $90,870,579 $90,912,579 $96,535,187 $5,622,608FTE - budgeted 825.50 815.50 812.50 815.50 837.50 22.00
Public WorksCity EngineeringSalaries/Benefits/Pensions $3,624,337 $1,510,095 $2,298,978 $2,298,978 $2,295,729 ($3,249)Operating 359,869 88,416 115,722 115,722 115,962 240Capital 0 20,006 0 0 0 0Total City Engineering $3,984,206 $1,618,517 $2,414,700 $2,414,700 $2,411,691 ($3,009)FTE - budgeted 43.75 17.75 24.75 24.00 24.00 0.00
Public Works Operations and MaintenanceSalaries/Benefits/Pensions $5,422,429 $5,993,707 $6,500,923 $6,500,923 $6,687,121 $186,198Operating 2,053,892 1,829,114 1,892,444 1,892,444 1,892,444 0Capital 6,280 40,542 45,000 45,000 45,000 0Total Public WorksOperations &Maintenance $7,482,601 $7,863,363 $8,438,367 $8,438,367 $8,624,565 $186,198FTE - budgeted 87.00 88.00 96.00 95.00 95.00 0.00
Traffic EngineeringSalaries/Benefits/Pensions $2,091,629 $2,326,409 $2,464,917 $2,464,917 $2,526,313 $61,396Operating 1,062,422 735,649 483,804 483,804 546,214 62,410Capital 0 0 0 0 0 0Total Traffic Engineering $3,154,051 $3,062,058 $2,948,721 $2,948,721 $3,072,527 $123,806FTE - budgeted 26.00 28.00 28.00 28.00 28.00 0.00
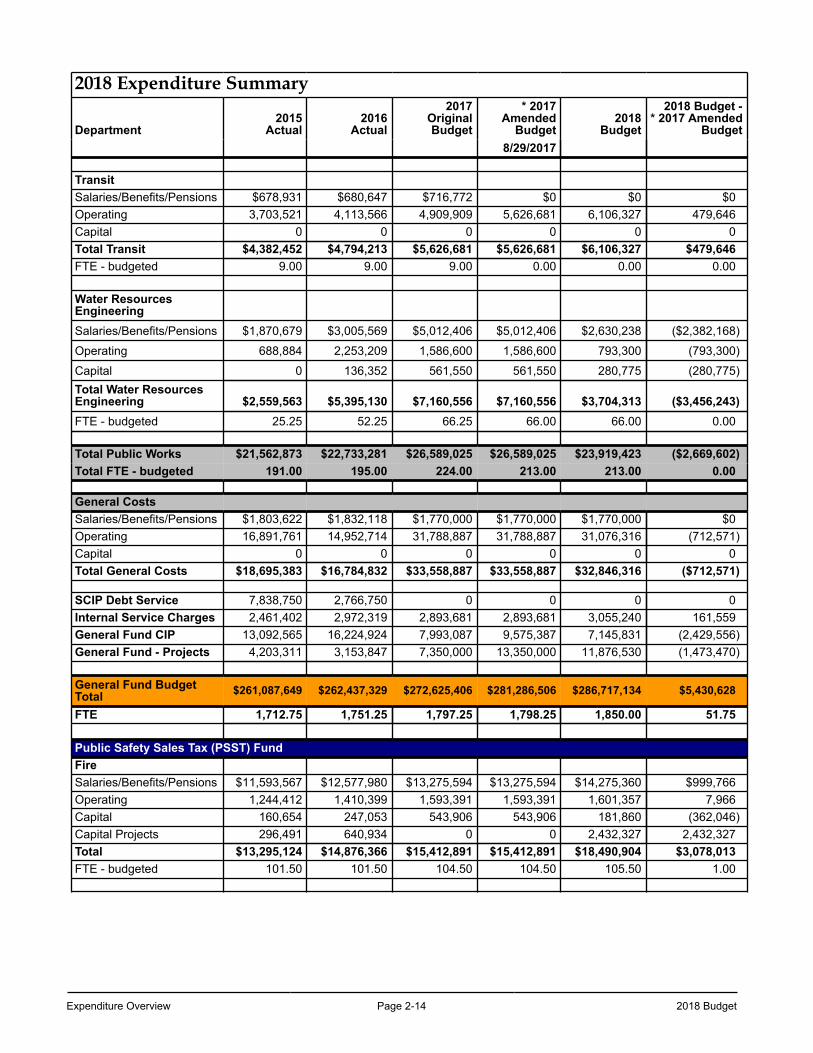
Expenditure Overview Page 2-14 2018 Budget
2018 Expenditure Summary
Department2015
Actual2016
Actual
2017OriginalBudget
* 2017Amended
Budget2018
Budget
2018 Budget -* 2017 Amended
Budget8/29/2017
TransitSalaries/Benefits/Pensions $678,931 $680,647 $716,772 $0 $0 $0Operating 3,703,521 4,113,566 4,909,909 5,626,681 6,106,327 479,646Capital 0 0 0 0 0 0Total Transit $4,382,452 $4,794,213 $5,626,681 $5,626,681 $6,106,327 $479,646FTE - budgeted 9.00 9.00 9.00 0.00 0.00 0.00
Water ResourcesEngineeringSalaries/Benefits/Pensions $1,870,679 $3,005,569 $5,012,406 $5,012,406 $2,630,238 ($2,382,168)
Operating 688,884 2,253,209 1,586,600 1,586,600 793,300 (793,300)
Capital 0 136,352 561,550 561,550 280,775 (280,775)Total Water ResourcesEngineering $2,559,563 $5,395,130 $7,160,556 $7,160,556 $3,704,313 ($3,456,243)FTE - budgeted 25.25 52.25 66.25 66.00 66.00 0.00
Total Public Works $21,562,873 $22,733,281 $26,589,025 $26,589,025 $23,919,423 ($2,669,602)Total FTE - budgeted 191.00 195.00 224.00 213.00 213.00 0.00
General CostsSalaries/Benefits/Pensions $1,803,622 $1,832,118 $1,770,000 $1,770,000 $1,770,000 $0Operating 16,891,761 14,952,714 31,788,887 31,788,887 31,076,316 (712,571)Capital 0 0 0 0 0 0Total General Costs $18,695,383 $16,784,832 $33,558,887 $33,558,887 $32,846,316 ($712,571)
SCIP Debt Service 7,838,750 2,766,750 0 0 0 0Internal Service Charges 2,461,402 2,972,319 2,893,681 2,893,681 3,055,240 161,559General Fund CIP 13,092,565 16,224,924 7,993,087 9,575,387 7,145,831 (2,429,556)General Fund - Projects 4,203,311 3,153,847 7,350,000 13,350,000 11,876,530 (1,473,470)
General Fund BudgetTotal $261,087,649 $262,437,329 $272,625,406 $281,286,506 $286,717,134 $5,430,628
FTE 1,712.75 1,751.25 1,797.25 1,798.25 1,850.00 51.75
Public Safety Sales Tax (PSST) FundFireSalaries/Benefits/Pensions $11,593,567 $12,577,980 $13,275,594 $13,275,594 $14,275,360 $999,766Operating 1,244,412 1,410,399 1,593,391 1,593,391 1,601,357 7,966Capital 160,654 247,053 543,906 543,906 181,860 (362,046)Capital Projects 296,491 640,934 0 0 2,432,327 2,432,327Total $13,295,124 $14,876,366 $15,412,891 $15,412,891 $18,490,904 $3,078,013FTE - budgeted 101.50 101.50 104.50 104.50 105.50 1.00
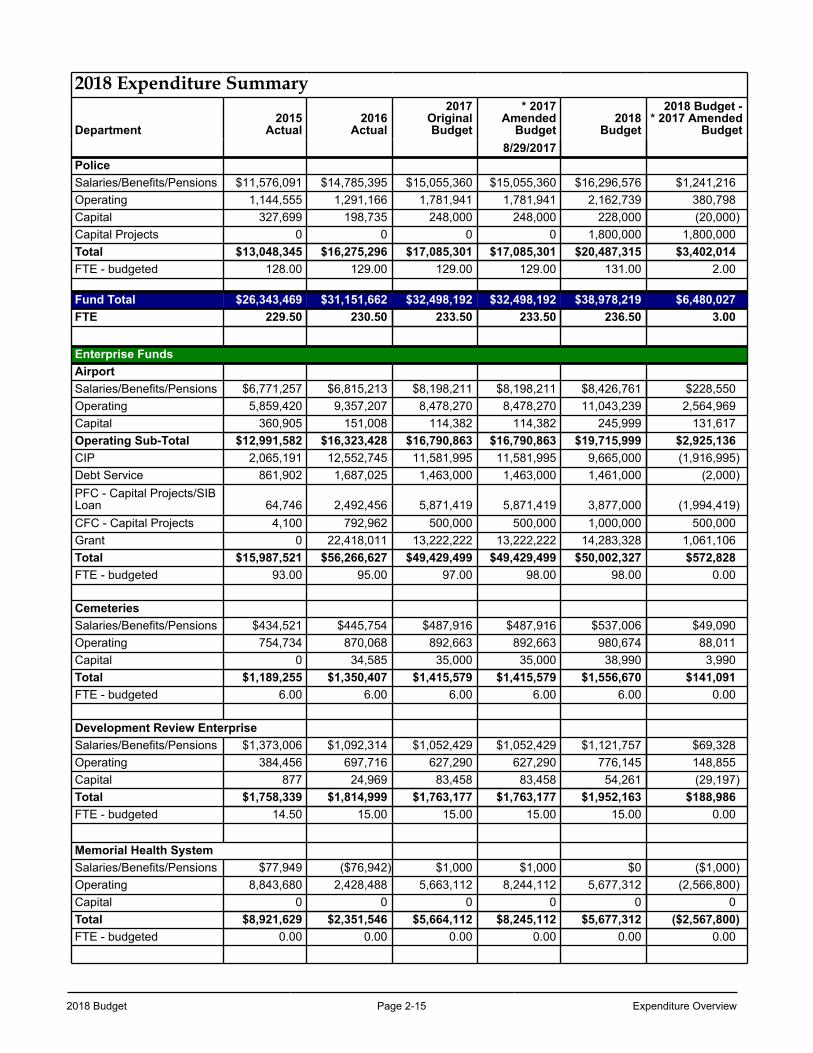
2018 Budget Page 2-15 Expenditure Overview
2018 Expenditure Summary
Department2015
Actual2016
Actual
2017OriginalBudget
* 2017Amended
Budget2018
Budget
2018 Budget -* 2017 Amended
Budget8/29/2017
PoliceSalaries/Benefits/Pensions $11,576,091 $14,785,395 $15,055,360 $15,055,360 $16,296,576 $1,241,216Operating 1,144,555 1,291,166 1,781,941 1,781,941 2,162,739 380,798Capital 327,699 198,735 248,000 248,000 228,000 (20,000)Capital Projects 0 0 0 0 1,800,000 1,800,000Total $13,048,345 $16,275,296 $17,085,301 $17,085,301 $20,487,315 $3,402,014FTE - budgeted 128.00 129.00 129.00 129.00 131.00 2.00
Fund Total $26,343,469 $31,151,662 $32,498,192 $32,498,192 $38,978,219 $6,480,027FTE 229.50 230.50 233.50 233.50 236.50 3.00
Enterprise FundsAirportSalaries/Benefits/Pensions $6,771,257 $6,815,213 $8,198,211 $8,198,211 $8,426,761 $228,550Operating 5,859,420 9,357,207 8,478,270 8,478,270 11,043,239 2,564,969Capital 360,905 151,008 114,382 114,382 245,999 131,617Operating Sub-Total $12,991,582 $16,323,428 $16,790,863 $16,790,863 $19,715,999 $2,925,136CIP 2,065,191 12,552,745 11,581,995 11,581,995 9,665,000 (1,916,995)Debt Service 861,902 1,687,025 1,463,000 1,463,000 1,461,000 (2,000)PFC - Capital Projects/SIBLoan 64,746 2,492,456 5,871,419 5,871,419 3,877,000 (1,994,419)CFC - Capital Projects 4,100 792,962 500,000 500,000 1,000,000 500,000Grant 0 22,418,011 13,222,222 13,222,222 14,283,328 1,061,106Total $15,987,521 $56,266,627 $49,429,499 $49,429,499 $50,002,327 $572,828FTE - budgeted 93.00 95.00 97.00 98.00 98.00 0.00
CemeteriesSalaries/Benefits/Pensions $434,521 $445,754 $487,916 $487,916 $537,006 $49,090Operating 754,734 870,068 892,663 892,663 980,674 88,011Capital 0 34,585 35,000 35,000 38,990 3,990Total $1,189,255 $1,350,407 $1,415,579 $1,415,579 $1,556,670 $141,091FTE - budgeted 6.00 6.00 6.00 6.00 6.00 0.00
Development Review EnterpriseSalaries/Benefits/Pensions $1,373,006 $1,092,314 $1,052,429 $1,052,429 $1,121,757 $69,328Operating 384,456 697,716 627,290 627,290 776,145 148,855Capital 877 24,969 83,458 83,458 54,261 (29,197)Total $1,758,339 $1,814,999 $1,763,177 $1,763,177 $1,952,163 $188,986FTE - budgeted 14.50 15.00 15.00 15.00 15.00 0.00
Memorial Health SystemSalaries/Benefits/Pensions $77,949 ($76,942) $1,000 $1,000 $0 ($1,000)Operating 8,843,680 2,428,488 5,663,112 8,244,112 5,677,312 (2,566,800)Capital 0 0 0 0 0 0Total $8,921,629 $2,351,546 $5,664,112 $8,245,112 $5,677,312 ($2,567,800)FTE - budgeted 0.00 0.00 0.00 0.00 0.00 0.00
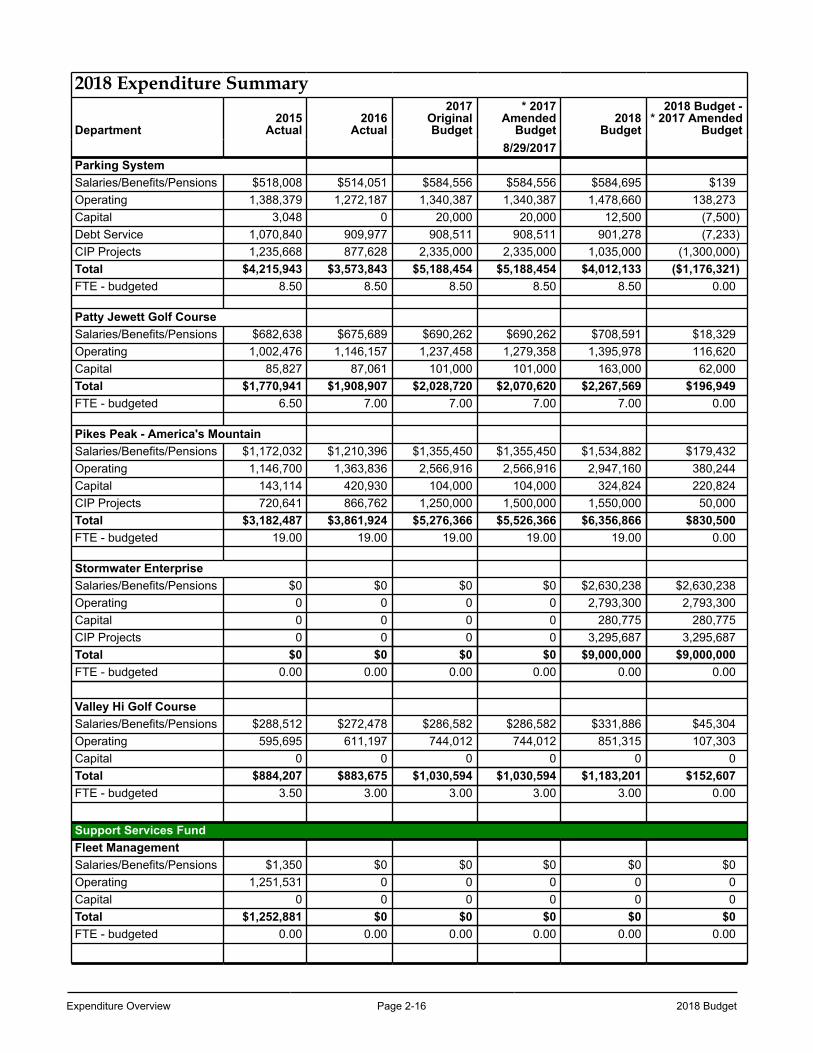
Expenditure Overview Page 2-16 2018 Budget
2018 Expenditure Summary
Department2015
Actual2016
Actual
2017OriginalBudget
* 2017Amended
Budget2018
Budget
2018 Budget -* 2017 Amended
Budget8/29/2017
Parking SystemSalaries/Benefits/Pensions $518,008 $514,051 $584,556 $584,556 $584,695 $139Operating 1,388,379 1,272,187 1,340,387 1,340,387 1,478,660 138,273Capital 3,048 0 20,000 20,000 12,500 (7,500)Debt Service 1,070,840 909,977 908,511 908,511 901,278 (7,233)CIP Projects 1,235,668 877,628 2,335,000 2,335,000 1,035,000 (1,300,000)Total $4,215,943 $3,573,843 $5,188,454 $5,188,454 $4,012,133 ($1,176,321)FTE - budgeted 8.50 8.50 8.50 8.50 8.50 0.00
Patty Jewett Golf CourseSalaries/Benefits/Pensions $682,638 $675,689 $690,262 $690,262 $708,591 $18,329Operating 1,002,476 1,146,157 1,237,458 1,279,358 1,395,978 116,620Capital 85,827 87,061 101,000 101,000 163,000 62,000Total $1,770,941 $1,908,907 $2,028,720 $2,070,620 $2,267,569 $196,949FTE - budgeted 6.50 7.00 7.00 7.00 7.00 0.00
Pikes Peak - America's MountainSalaries/Benefits/Pensions $1,172,032 $1,210,396 $1,355,450 $1,355,450 $1,534,882 $179,432Operating 1,146,700 1,363,836 2,566,916 2,566,916 2,947,160 380,244Capital 143,114 420,930 104,000 104,000 324,824 220,824CIP Projects 720,641 866,762 1,250,000 1,500,000 1,550,000 50,000Total $3,182,487 $3,861,924 $5,276,366 $5,526,366 $6,356,866 $830,500FTE - budgeted 19.00 19.00 19.00 19.00 19.00 0.00
Stormwater EnterpriseSalaries/Benefits/Pensions $0 $0 $0 $0 $2,630,238 $2,630,238Operating 0 0 0 0 2,793,300 2,793,300Capital 0 0 0 0 280,775 280,775CIP Projects 0 0 0 0 3,295,687 3,295,687Total $0 $0 $0 $0 $9,000,000 $9,000,000FTE - budgeted 0.00 0.00 0.00 0.00 0.00 0.00
Valley Hi Golf CourseSalaries/Benefits/Pensions $288,512 $272,478 $286,582 $286,582 $331,886 $45,304Operating 595,695 611,197 744,012 744,012 851,315 107,303Capital 0 0 0 0 0 0Total $884,207 $883,675 $1,030,594 $1,030,594 $1,183,201 $152,607FTE - budgeted 3.50 3.00 3.00 3.00 3.00 0.00
Support Services FundFleet ManagementSalaries/Benefits/Pensions $1,350 $0 $0 $0 $0 $0Operating 1,251,531 0 0 0 0 0Capital 0 0 0 0 0 0Total $1,252,881 $0 $0 $0 $0 $0FTE - budgeted 0.00 0.00 0.00 0.00 0.00 0.00
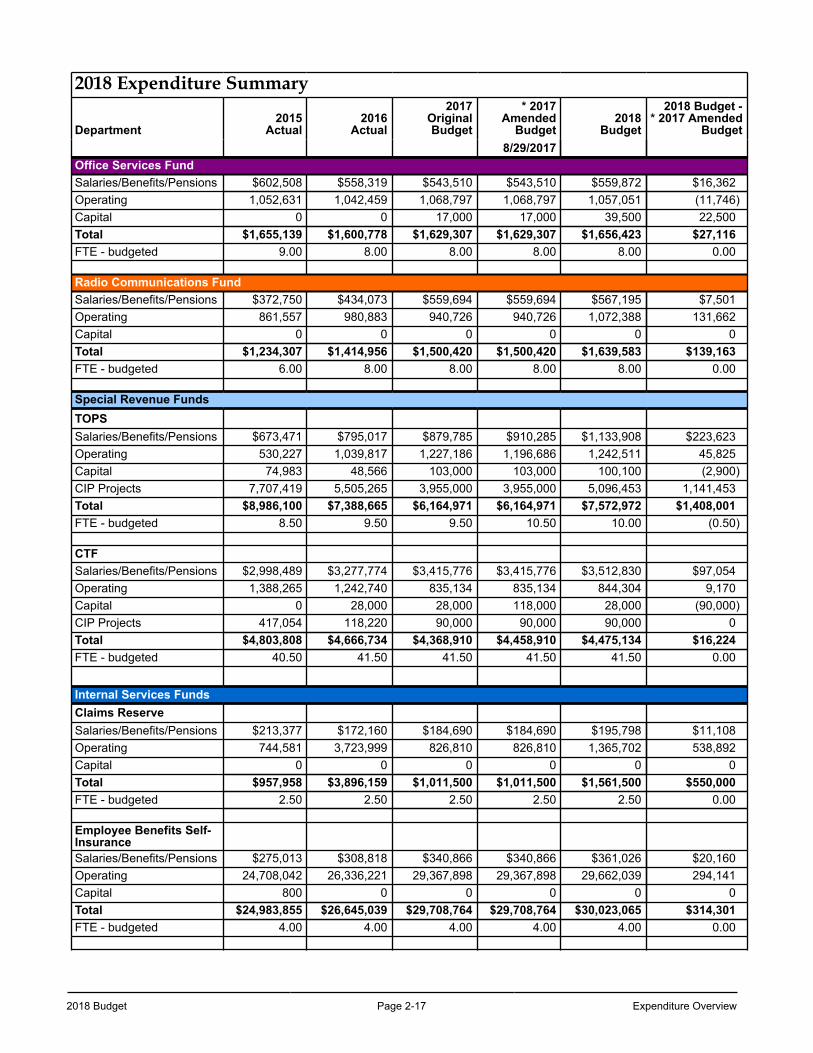
2018 Budget Page 2-17 Expenditure Overview
2018 Expenditure Summary
Department2015
Actual2016
Actual
2017OriginalBudget
* 2017Amended
Budget2018
Budget
2018 Budget -* 2017 Amended
Budget8/29/2017
Office Services FundSalaries/Benefits/Pensions $602,508 $558,319 $543,510 $543,510 $559,872 $16,362Operating 1,052,631 1,042,459 1,068,797 1,068,797 1,057,051 (11,746)Capital 0 0 17,000 17,000 39,500 22,500Total $1,655,139 $1,600,778 $1,629,307 $1,629,307 $1,656,423 $27,116FTE - budgeted 9.00 8.00 8.00 8.00 8.00 0.00
Radio Communications FundSalaries/Benefits/Pensions $372,750 $434,073 $559,694 $559,694 $567,195 $7,501Operating 861,557 980,883 940,726 940,726 1,072,388 131,662Capital 0 0 0 0 0 0Total $1,234,307 $1,414,956 $1,500,420 $1,500,420 $1,639,583 $139,163FTE - budgeted 6.00 8.00 8.00 8.00 8.00 0.00
Special Revenue FundsTOPSSalaries/Benefits/Pensions $673,471 $795,017 $879,785 $910,285 $1,133,908 $223,623Operating 530,227 1,039,817 1,227,186 1,196,686 1,242,511 45,825Capital 74,983 48,566 103,000 103,000 100,100 (2,900)CIP Projects 7,707,419 5,505,265 3,955,000 3,955,000 5,096,453 1,141,453Total $8,986,100 $7,388,665 $6,164,971 $6,164,971 $7,572,972 $1,408,001FTE - budgeted 8.50 9.50 9.50 10.50 10.00 (0.50)
CTFSalaries/Benefits/Pensions $2,998,489 $3,277,774 $3,415,776 $3,415,776 $3,512,830 $97,054Operating 1,388,265 1,242,740 835,134 835,134 844,304 9,170Capital 0 28,000 28,000 118,000 28,000 (90,000)CIP Projects 417,054 118,220 90,000 90,000 90,000 0Total $4,803,808 $4,666,734 $4,368,910 $4,458,910 $4,475,134 $16,224FTE - budgeted 40.50 41.50 41.50 41.50 41.50 0.00
Internal Services FundsClaims ReserveSalaries/Benefits/Pensions $213,377 $172,160 $184,690 $184,690 $195,798 $11,108Operating 744,581 3,723,999 826,810 826,810 1,365,702 538,892Capital 0 0 0 0 0 0Total $957,958 $3,896,159 $1,011,500 $1,011,500 $1,561,500 $550,000FTE - budgeted 2.50 2.50 2.50 2.50 2.50 0.00
Employee Benefits Self-InsuranceSalaries/Benefits/Pensions $275,013 $308,818 $340,866 $340,866 $361,026 $20,160Operating 24,708,042 26,336,221 29,367,898 29,367,898 29,662,039 294,141Capital 800 0 0 0 0 0Total $24,983,855 $26,645,039 $29,708,764 $29,708,764 $30,023,065 $314,301FTE - budgeted 4.00 4.00 4.00 4.00 4.00 0.00
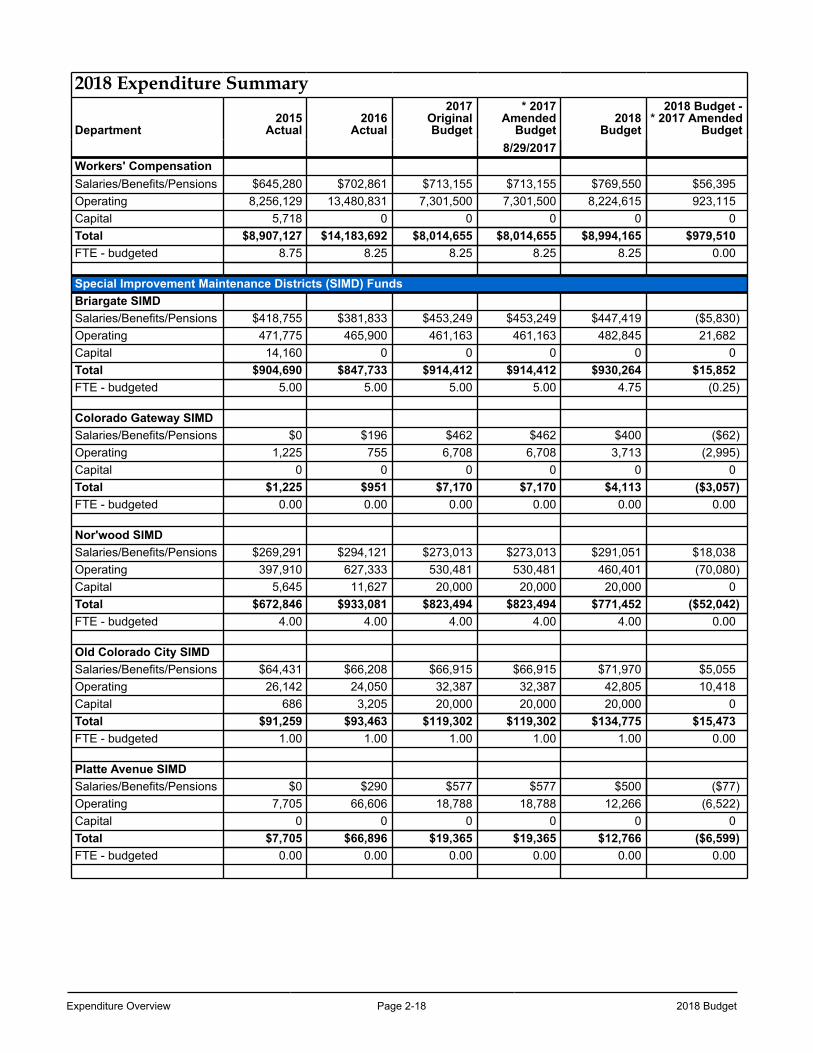
Expenditure Overview Page 2-18 2018 Budget
2018 Expenditure Summary
Department2015
Actual2016
Actual
2017OriginalBudget
* 2017Amended
Budget2018
Budget
2018 Budget -* 2017 Amended
Budget8/29/2017
Workers' CompensationSalaries/Benefits/Pensions $645,280 $702,861 $713,155 $713,155 $769,550 $56,395Operating 8,256,129 13,480,831 7,301,500 7,301,500 8,224,615 923,115Capital 5,718 0 0 0 0 0Total $8,907,127 $14,183,692 $8,014,655 $8,014,655 $8,994,165 $979,510FTE - budgeted 8.75 8.25 8.25 8.25 8.25 0.00
Special Improvement Maintenance Districts (SIMD) FundsBriargate SIMDSalaries/Benefits/Pensions $418,755 $381,833 $453,249 $453,249 $447,419 ($5,830)Operating 471,775 465,900 461,163 461,163 482,845 21,682Capital 14,160 0 0 0 0 0Total $904,690 $847,733 $914,412 $914,412 $930,264 $15,852FTE - budgeted 5.00 5.00 5.00 5.00 4.75 (0.25)
Colorado Gateway SIMDSalaries/Benefits/Pensions $0 $196 $462 $462 $400 ($62)Operating 1,225 755 6,708 6,708 3,713 (2,995)Capital 0 0 0 0 0 0Total $1,225 $951 $7,170 $7,170 $4,113 ($3,057)FTE - budgeted 0.00 0.00 0.00 0.00 0.00 0.00
Nor'wood SIMDSalaries/Benefits/Pensions $269,291 $294,121 $273,013 $273,013 $291,051 $18,038Operating 397,910 627,333 530,481 530,481 460,401 (70,080)Capital 5,645 11,627 20,000 20,000 20,000 0Total $672,846 $933,081 $823,494 $823,494 $771,452 ($52,042)FTE - budgeted 4.00 4.00 4.00 4.00 4.00 0.00
Old Colorado City SIMDSalaries/Benefits/Pensions $64,431 $66,208 $66,915 $66,915 $71,970 $5,055Operating 26,142 24,050 32,387 32,387 42,805 10,418Capital 686 3,205 20,000 20,000 20,000 0Total $91,259 $93,463 $119,302 $119,302 $134,775 $15,473FTE - budgeted 1.00 1.00 1.00 1.00 1.00 0.00
Platte Avenue SIMDSalaries/Benefits/Pensions $0 $290 $577 $577 $500 ($77)Operating 7,705 66,606 18,788 18,788 12,266 (6,522)Capital 0 0 0 0 0 0Total $7,705 $66,896 $19,365 $19,365 $12,766 ($6,599)FTE - budgeted 0.00 0.00 0.00 0.00 0.00 0.00
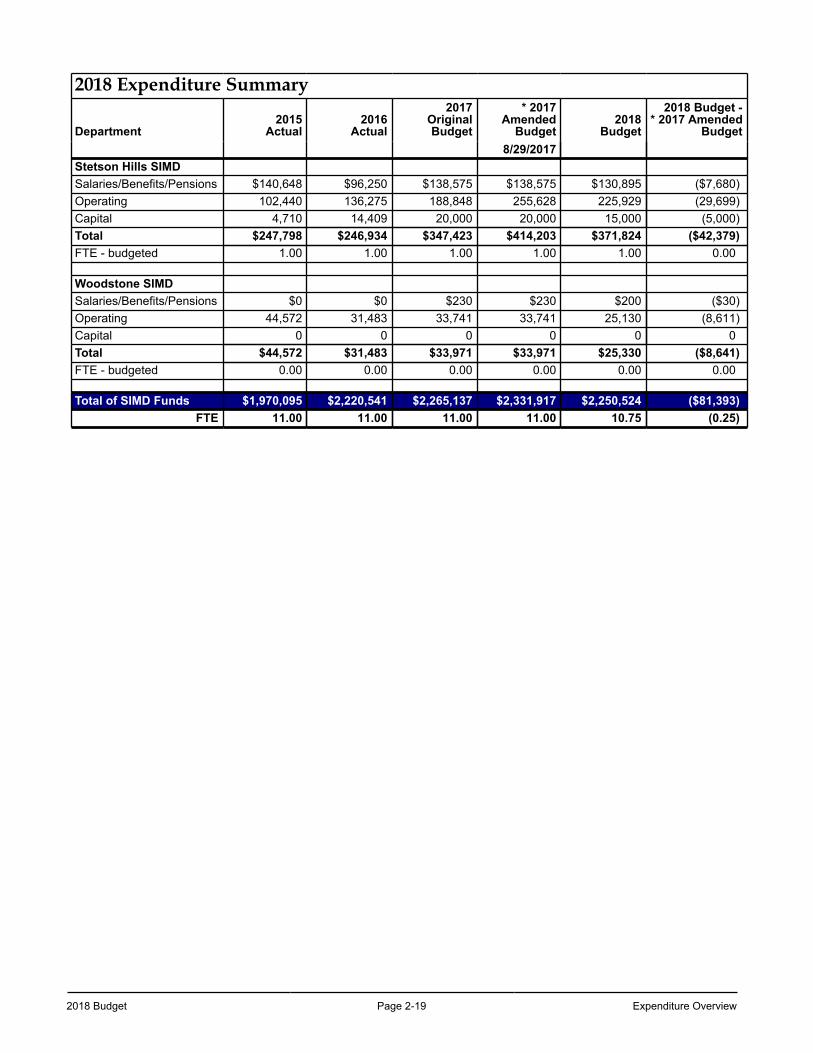
2018 Budget Page 2-19 Expenditure Overview
2018 Expenditure Summary
Department2015
Actual2016
Actual
2017OriginalBudget
* 2017Amended
Budget2018
Budget
2018 Budget -* 2017 Amended
Budget8/29/2017
Stetson Hills SIMDSalaries/Benefits/Pensions $140,648 $96,250 $138,575 $138,575 $130,895 ($7,680)Operating 102,440 136,275 188,848 255,628 225,929 (29,699)Capital 4,710 14,409 20,000 20,000 15,000 (5,000)Total $247,798 $246,934 $347,423 $414,203 $371,824 ($42,379)FTE - budgeted 1.00 1.00 1.00 1.00 1.00 0.00
Woodstone SIMDSalaries/Benefits/Pensions $0 $0 $230 $230 $200 ($30)Operating 44,572 31,483 33,741 33,741 25,130 (8,611)Capital 0 0 0 0 0 0Total $44,572 $31,483 $33,971 $33,971 $25,330 ($8,641)FTE - budgeted 0.00 0.00 0.00 0.00 0.00 0.00
Total of SIMD Funds $1,970,095 $2,220,541 $2,265,137 $2,331,917 $2,250,524 ($81,393)FTE 11.00 11.00 11.00 11.00 10.75 (0.25)

Expenditure Overview Page 2-20 2018 Budget
This page left blank intentionally.
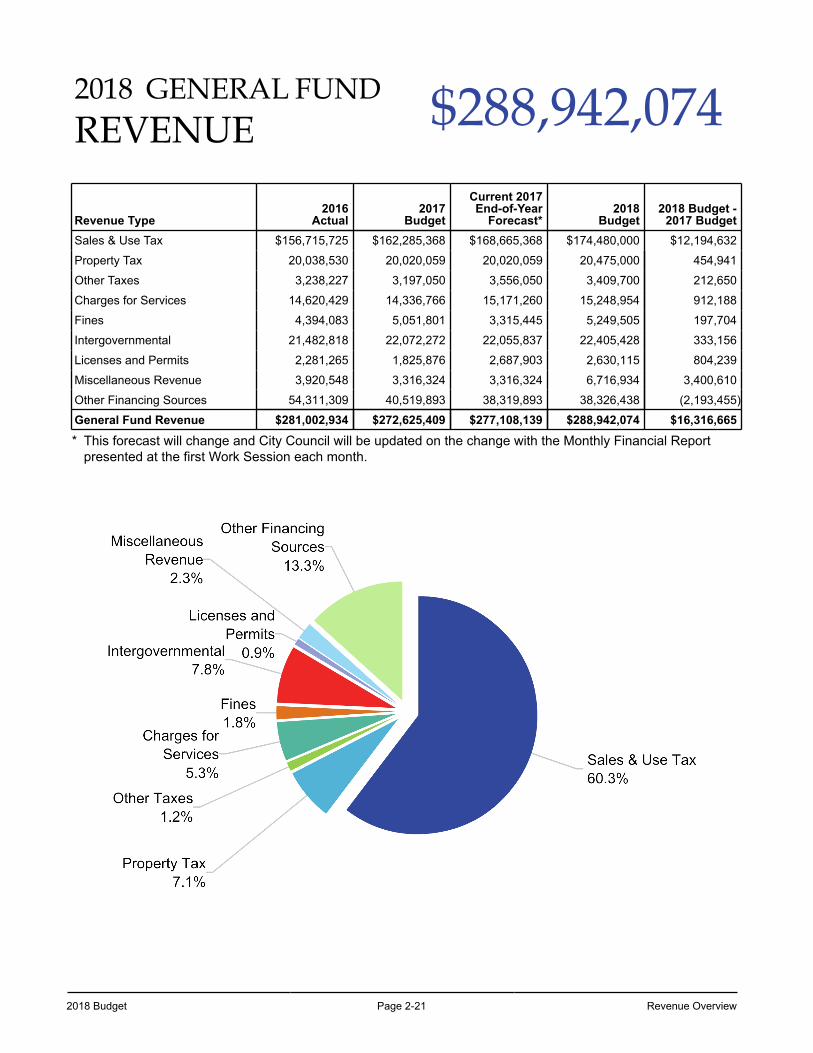
2018 Budget Page 2-21 Revenue Overview
2018 GENERAL FUND $288,942,074REVENUE
Revenue Type2016
Actual2017
Budget
Current 2017End-of-Year
Forecast*2018
Budget2018 Budget -
2017 BudgetSales & Use Tax $156,715,725 $162,285,368 $168,665,368 $174,480,000 $12,194,632
Property Tax 20,038,530 20,020,059 20,020,059 20,475,000 454,941
Other Taxes 3,238,227 3,197,050 3,556,050 3,409,700 212,650
Charges for Services 14,620,429 14,336,766 15,171,260 15,248,954 912,188
Fines 4,394,083 5,051,801 3,315,445 5,249,505 197,704
Intergovernmental 21,482,818 22,072,272 22,055,837 22,405,428 333,156
Licenses and Permits 2,281,265 1,825,876 2,687,903 2,630,115 804,239
Miscellaneous Revenue 3,920,548 3,316,324 3,316,324 6,716,934 3,400,610
Other Financing Sources 54,311,309 40,519,893 38,319,893 38,326,438 (2,193,455)
General Fund Revenue $281,002,934 $272,625,409 $277,108,139 $288,942,074 $16,316,665
* This forecast will change and City Council will be updated on the change with the Monthly Financial Report presented at the first Work Session each month.
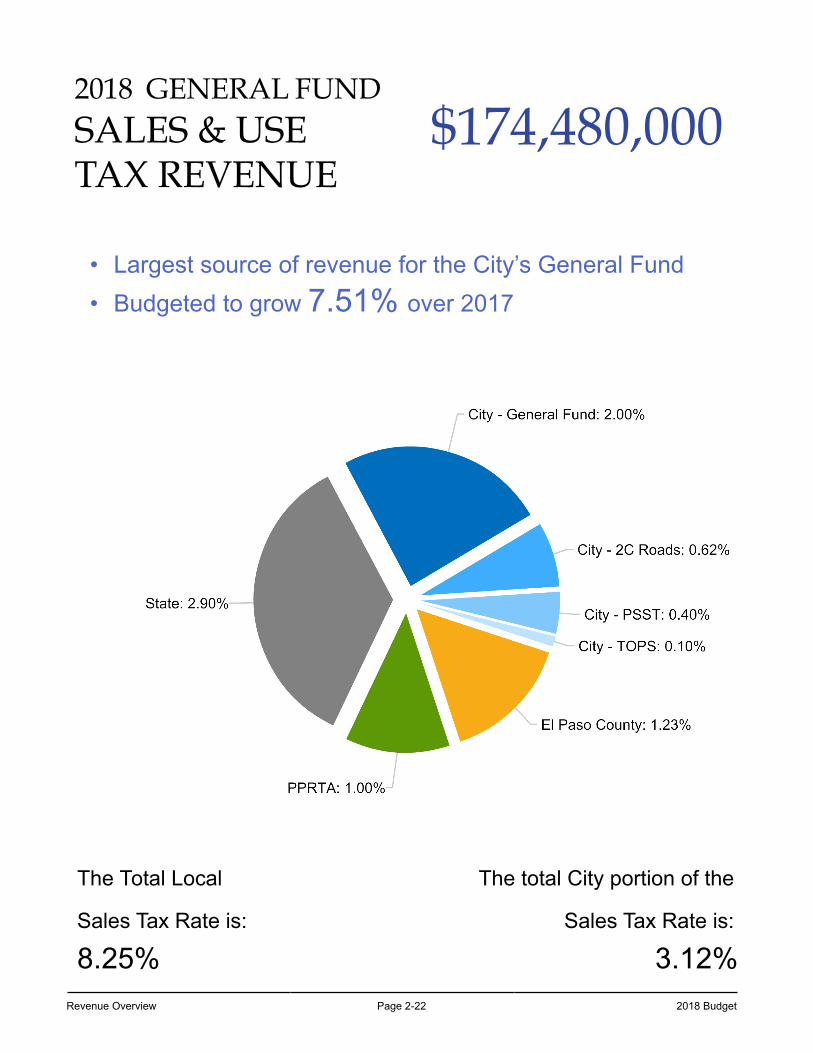
Revenue Overview Page 2-22 2018 Budget
2018 GENERAL FUND
$174,480,000SALES & USETAX REVENUE
• Largest source of revenue for the City’s General Fund• Budgeted to grow 7.51% over 2017
The Total Local The total City portion of the
Sales Tax Rate is: Sales Tax Rate is:
8.25% 3.12%
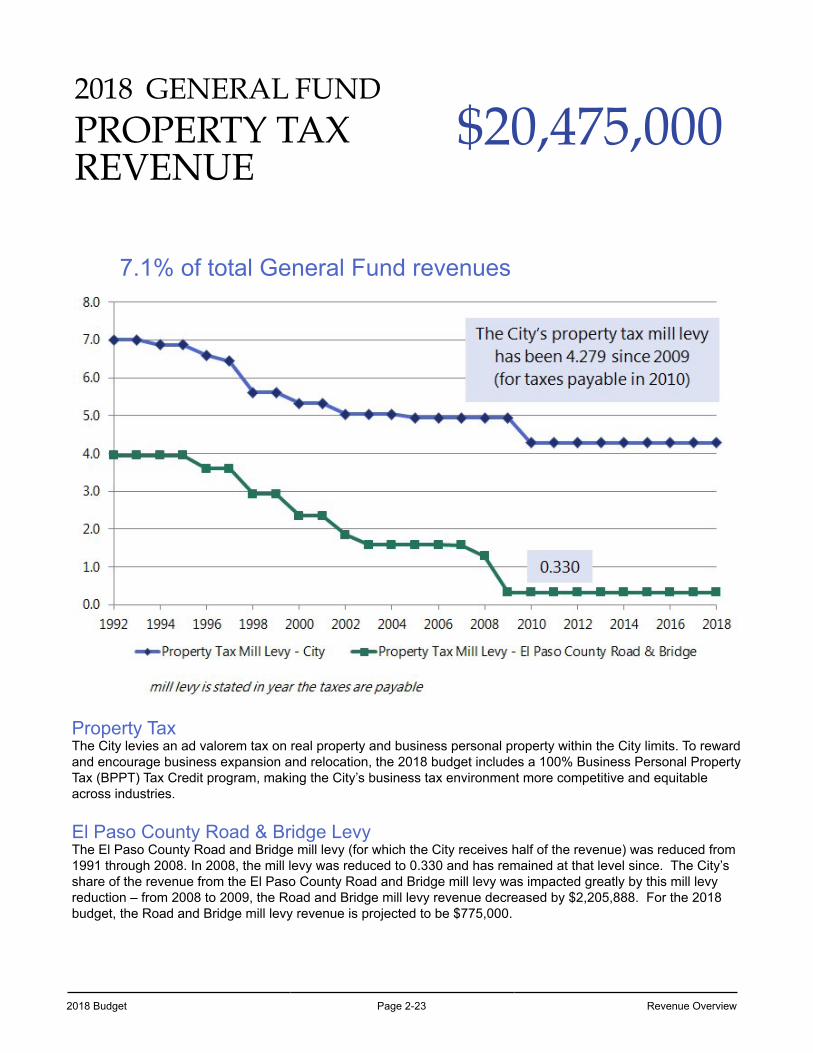
2018 Budget Page 2-23 Revenue Overview
2018 GENERAL FUND
$20,475,000PROPERTY TAXREVENUE
7.1% of total General Fund revenues
Property TaxThe City levies an ad valorem tax on real property and business personal property within the City limits. To reward and encourage business expansion and relocation, the 2018 budget includes a 100% Business Personal Property Tax (BPPT) Tax Credit program, making the City’s business tax environment more competitive and equitable across industries.
El Paso County Road & Bridge Levy The El Paso County Road and Bridge mill levy (for which the City receives half of the revenue) was reduced from 1991 through 2008. In 2008, the mill levy was reduced to 0.330 and has remained at that level since. The City’s share of the revenue from the El Paso County Road and Bridge mill levy was impacted greatly by this mill levy reduction – from 2008 to 2009, the Road and Bridge mill levy revenue decreased by $2,205,888. For the 2018 budget, the Road and Bridge mill levy revenue is projected to be $775,000.
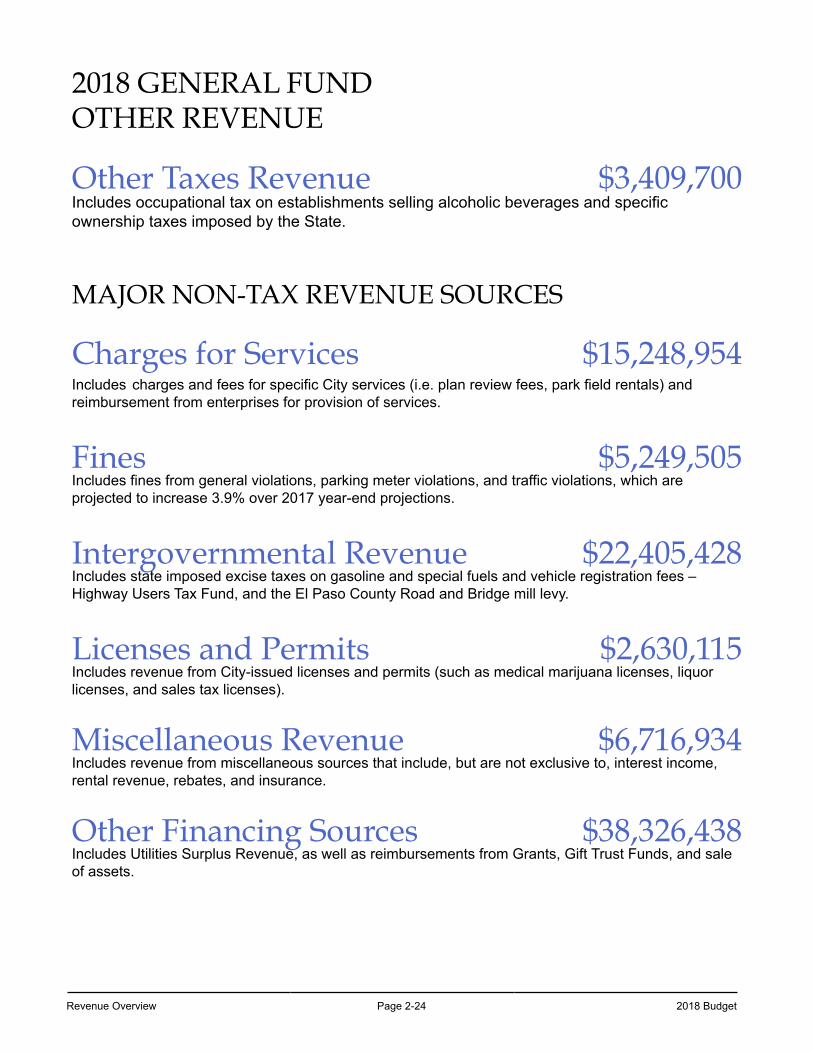
Revenue Overview Page 2-24 2018 Budget
2018 GENERAL FUND OTHER REVENUE
Other Taxes Revenue $3,409,700Includes occupational tax on establishments selling alcoholic beverages and specific ownership taxes imposed by the State.
MAJOR NON-TAX REVENUE SOURCES
Charges for Services $15,248,954Includes charges and fees for specific City services (i.e. plan review fees, park field rentals) and reimbursement from enterprises for provision of services.
Fines $5,249,505Includes fines from general violations, parking meter violations, and traffic violations, which are projected to increase 3.9% over 2017 year-end projections.
Intergovernmental Revenue $22,405,428Includes state imposed excise taxes on gasoline and special fuels and vehicle registration fees – Highway Users Tax Fund, and the El Paso County Road and Bridge mill levy.
Licenses and Permits $2,630,115Includes revenue from City-issued licenses and permits (such as medical marijuana licenses, liquor licenses, and sales tax licenses).
Miscellaneous Revenue $6,716,934Includes revenue from miscellaneous sources that include, but are not exclusive to, interest income, rental revenue, rebates, and insurance.
Other Financing Sources $38,326,438Includes Utilities Surplus Revenue, as well as reimbursements from Grants, Gift Trust Funds, and sale of assets.
2018 Budget Page 2-25 Revenue Overview
Taxpayer’s Bill of Rights (TABOR) CalculationThe revenue limitation provisions of the State TABOR and the City Charter continue to impact the City's fiscal condition. TABOR essentially establishes an annual City revenue cap. Any City revenue subject to the cap received above the annual revenue cap must be refunded to local taxpayers or can be retained upon voter approval.
Under TABOR, the annual growth formula is applied to either previous year’s actual revenue or to the previous year’s TABOR revenue limit, whichever is less. During periods of economic downturn and lagging City revenue collections, City revenue can fall below the TABOR revenue limit for that year. In that event, the TABOR growth formula for the next fiscal year is applied to the actual revenue amount, not the higher TABOR limit. Thus, the TABOR limit is ratcheted down. In subsequent years, when the economy and City revenue rebound, the TABOR formula increase is applied to the lower previous year’s actual revenue.
While the calculation of the annual TABOR revenue cap appears to be relatively straightforward, it is difficult as data for both of the growth components is not available until well after the start of the fiscal year in question. Specifically, the Denver/Boulder/Greeley Consumer Price Index (CPI) figure is not available until early spring of the fiscal year to which it is to be applied. Similarly, the data for the local growth component is not available from the County Assessor until August of the year to which it is to be applied. Thus, in preparing the budget for the next year, it is necessary to forecast the CPI and local growth. Generally, the annual TABOR revenue cap is calculated through the application of the percentage change in the CPI and local growth for the previous calendar year to actual City revenue for the previous year. Local growth is the net change in the market value of construction expressed as a percent of all taxable and nontaxable property on the assessment rolls plus the value of new annexations.
At the April 2017 general municipal election, the City requested, and the voters approved, the retention and spending of up to $6 million of revenues received by the City during each of fiscal years 2016 and 2017 which may exceed the amounts otherwise allowed in those years to be retained and spent under City Charter § 7-90 and Colorado Constitution Article X, § 20, known as the Taxpayers’ Bill of Rights or “TABOR”. That ballot item provided that the funds may only be used for stormwater improvements located within and benefiting the City of Colorado Springs.
For 2017, revenue is estimated to exceed the TABOR revenue cap by approximately $6 million.
For the 2018 growth formula, the percentage change in the CPI is projected to be 2.8% and local growth is expected to be 1.5%. Thus, the combined formula increase is projected to total 4.3%.

Revenue Overview Page 2-26 2018 Budget
This page left blank intentionally
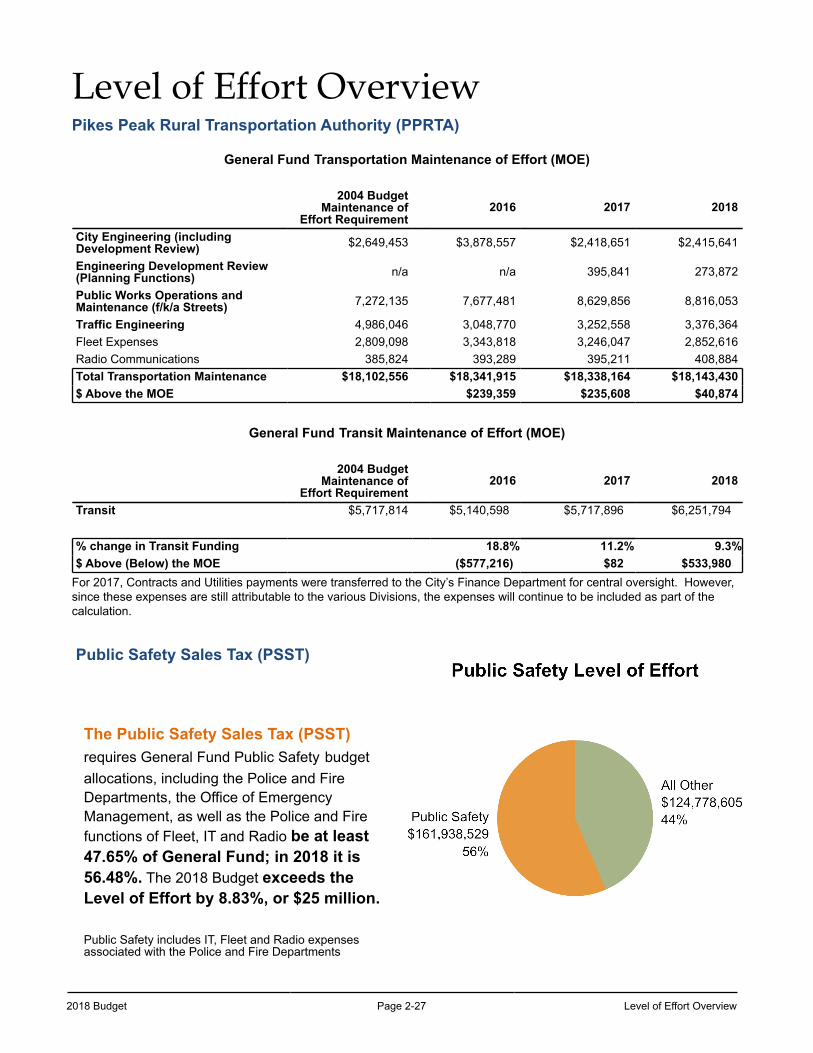
2018 Budget Page 2-27 Level of Effort Overview
Level of Effort OverviewPikes Peak Rural Transportation Authority (PPRTA)
General Fund Transportation Maintenance of Effort (MOE)
2004 BudgetMaintenance of
Effort Requirement2016 2017 2018
City Engineering (includingDevelopment Review) $2,649,453 $3,878,557 $2,418,651 $2,415,641
Engineering Development Review(Planning Functions) n/a n/a 395,841 273,872
Public Works Operations andMaintenance (f/k/a Streets) 7,272,135 7,677,481 8,629,856 8,816,053
Traffic Engineering 4,986,046 3,048,770 3,252,558 3,376,364Fleet Expenses 2,809,098 3,343,818 3,246,047 2,852,616Radio Communications 385,824 393,289 395,211 408,884Total Transportation Maintenance $18,102,556 $18,341,915 $18,338,164 $18,143,430$ Above the MOE $239,359 $235,608 $40,874
General Fund Transit Maintenance of Effort (MOE)
2004 BudgetMaintenance of
Effort Requirement2016 2017 2018
Transit $5,717,814 $5,140,598 $5,717,896 $6,251,794
% change in Transit Funding 18.8% 11.2% 9.3%$ Above (Below) the MOE ($577,216) $82 $533,980
For 2017, Contracts and Utilities payments were transferred to the City’s Finance Department for central oversight. However, since these expenses are still attributable to the various Divisions, the expenses will continue to be included as part of the calculation.
Public Safety Sales Tax (PSST)
The Public Safety Sales Tax (PSST) requires General Fund Public Safety budget allocations, including the Police and Fire Departments, the Office of Emergency Management, as well as the Police and Fire functions of Fleet, IT and Radio be at least 47.65% of General Fund; in 2018 it is 56.48%. The 2018 Budget exceeds the Level of Effort by 8.83%, or $25 million.
Public Safety includes IT, Fleet and Radio expensesassociated with the Police and Fire Departments
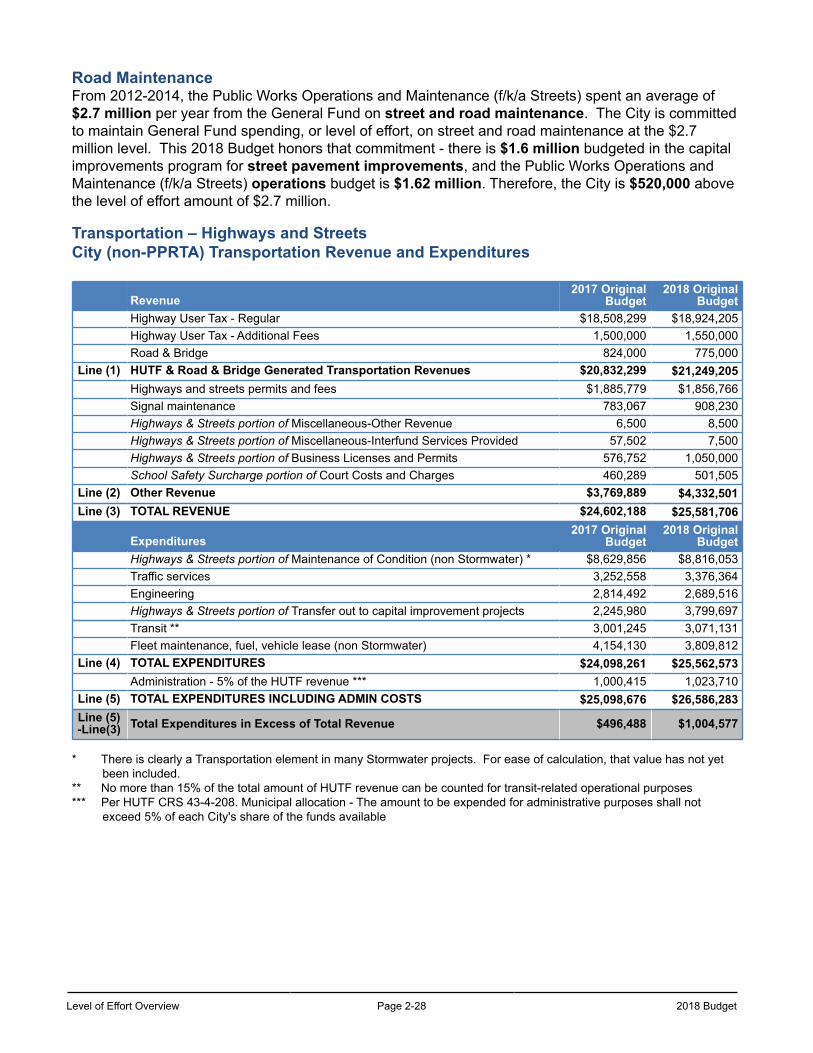
Level of Effort Overview Page 2-28 2018 Budget
Road MaintenanceFrom 2012-2014, the Public Works Operations and Maintenance (f/k/a Streets) spent an average of $2.7 million per year from the General Fund on street and road maintenance. The City is committed to maintain General Fund spending, or level of effort, on street and road maintenance at the $2.7 million level. This 2018 Budget honors that commitment - there is $1.6 million budgeted in the capital improvements program for street pavement improvements, and the Public Works Operations and Maintenance (f/k/a Streets) operations budget is $1.62 million. Therefore, the City is $520,000 above the level of effort amount of $2.7 million.
Transportation – Highways and StreetsCity (non-PPRTA) Transportation Revenue and Expenditures
Revenue2017 Original
Budget2018 Original
BudgetHighway User Tax - Regular $18,508,299 $18,924,205Highway User Tax - Additional Fees 1,500,000 1,550,000Road & Bridge 824,000 775,000
Line (1) HUTF & Road & Bridge Generated Transportation Revenues $20,832,299 $21,249,205Highways and streets permits and fees $1,885,779 $1,856,766Signal maintenance 783,067 908,230Highways & Streets portion of Miscellaneous-Other Revenue 6,500 8,500Highways & Streets portion of Miscellaneous-Interfund Services Provided 57,502 7,500Highways & Streets portion of Business Licenses and Permits 576,752 1,050,000School Safety Surcharge portion of Court Costs and Charges 460,289 501,505
Line (2) Other Revenue $3,769,889 $4,332,501Line (3) TOTAL REVENUE $24,602,188 $25,581,706
Expenditures2017 Original
Budget 2018 Original
BudgetHighways & Streets portion of Maintenance of Condition (non Stormwater) * $8,629,856 $8,816,053Traffic services 3,252,558 3,376,364Engineering 2,814,492 2,689,516Highways & Streets portion of Transfer out to capital improvement projects 2,245,980 3,799,697Transit ** 3,001,245 3,071,131Fleet maintenance, fuel, vehicle lease (non Stormwater) 4,154,130 3,809,812
Line (4) TOTAL EXPENDITURES $24,098,261 $25,562,573Administration - 5% of the HUTF revenue *** 1,000,415 1,023,710
Line (5) TOTAL EXPENDITURES INCLUDING ADMIN COSTS $25,098,676 $26,586,283Line (5)-Line(3) Total Expenditures in Excess of Total Revenue $496,488 $1,004,577
* There is clearly a Transportation element in many Stormwater projects. For ease of calculation, that value has not yet been included.
** No more than 15% of the total amount of HUTF revenue can be counted for transit-related operational purposes *** Per HUTF CRS 43-4-208. Municipal allocation - The amount to be expended for administrative purposes shall not
exceed 5% of each City's share of the funds available
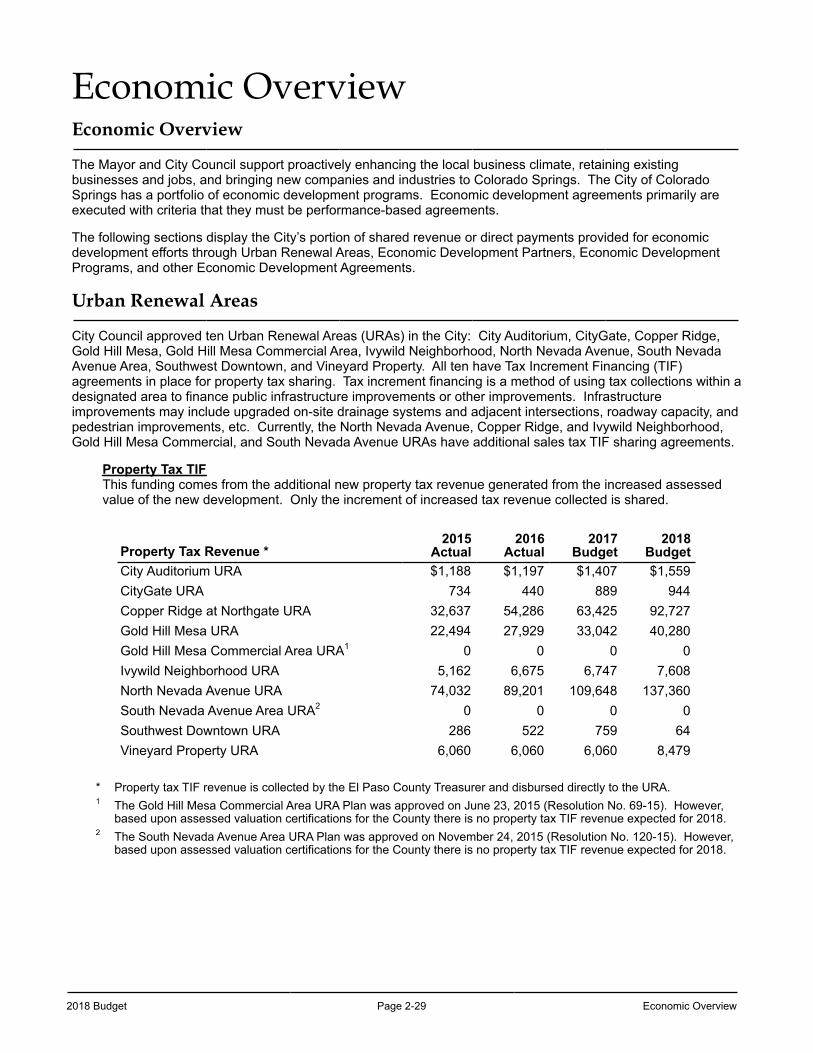
2018 Budget Page 2-29 Economic Overview
Economic Overview Economic Overview
The Mayor and City Council support proactively enhancing the local business climate, retaining existing businesses and jobs, and bringing new companies and industries to Colorado Springs. The City of Colorado Springs has a portfolio of economic development programs. Economic development agreements primarily are executed with criteria that they must be performance-based agreements.
The following sections display the City’s portion of shared revenue or direct payments provided for economic development efforts through Urban Renewal Areas, Economic Development Partners, Economic Development Programs, and other Economic Development Agreements.
Urban Renewal Areas
City Council approved ten Urban Renewal Areas (URAs) in the City: City Auditorium, CityGate, Copper Ridge, Gold Hill Mesa, Gold Hill Mesa Commercial Area, Ivywild Neighborhood, North Nevada Avenue, South Nevada Avenue Area, Southwest Downtown, and Vineyard Property. All ten have Tax Increment Financing (TIF) agreements in place for property tax sharing. Tax increment financing is a method of using tax collections within a designated area to finance public infrastructure improvements or other improvements. Infrastructure improvements may include upgraded on-site drainage systems and adjacent intersections, roadway capacity, and pedestrian improvements, etc. Currently, the North Nevada Avenue, Copper Ridge, and Ivywild Neighborhood, Gold Hill Mesa Commercial, and South Nevada Avenue URAs have additional sales tax TIF sharing agreements.
Property Tax TIF This funding comes from the additional new property tax revenue generated from the increased assessed value of the new development. Only the increment of increased tax revenue collected is shared.
Property Tax Revenue *2015
Actual2016
Actual2017
Budget2018
BudgetCity Auditorium URA $1,188 $1,197 $1,407 $1,559CityGate URA 734 440 889 944Copper Ridge at Northgate URA 32,637 54,286 63,425 92,727Gold Hill Mesa URA 22,494 27,929 33,042 40,280Gold Hill Mesa Commercial Area URA1 0 0 0 0Ivywild Neighborhood URA 5,162 6,675 6,747 7,608North Nevada Avenue URA 74,032 89,201 109,648 137,360South Nevada Avenue Area URA2 0 0 0 0Southwest Downtown URA 286 522 759 64Vineyard Property URA 6,060 6,060 6,060 8,479
* Property tax TIF revenue is collected by the El Paso County Treasurer and disbursed directly to the URA.1 The Gold Hill Mesa Commercial Area URA Plan was approved on June 23, 2015 (Resolution No. 69-15). However,
based upon assessed valuation certifications for the County there is no property tax TIF revenue expected for 2018.2 The South Nevada Avenue Area URA Plan was approved on November 24, 2015 (Resolution No. 120-15). However,
based upon assessed valuation certifications for the County there is no property tax TIF revenue expected for 2018.
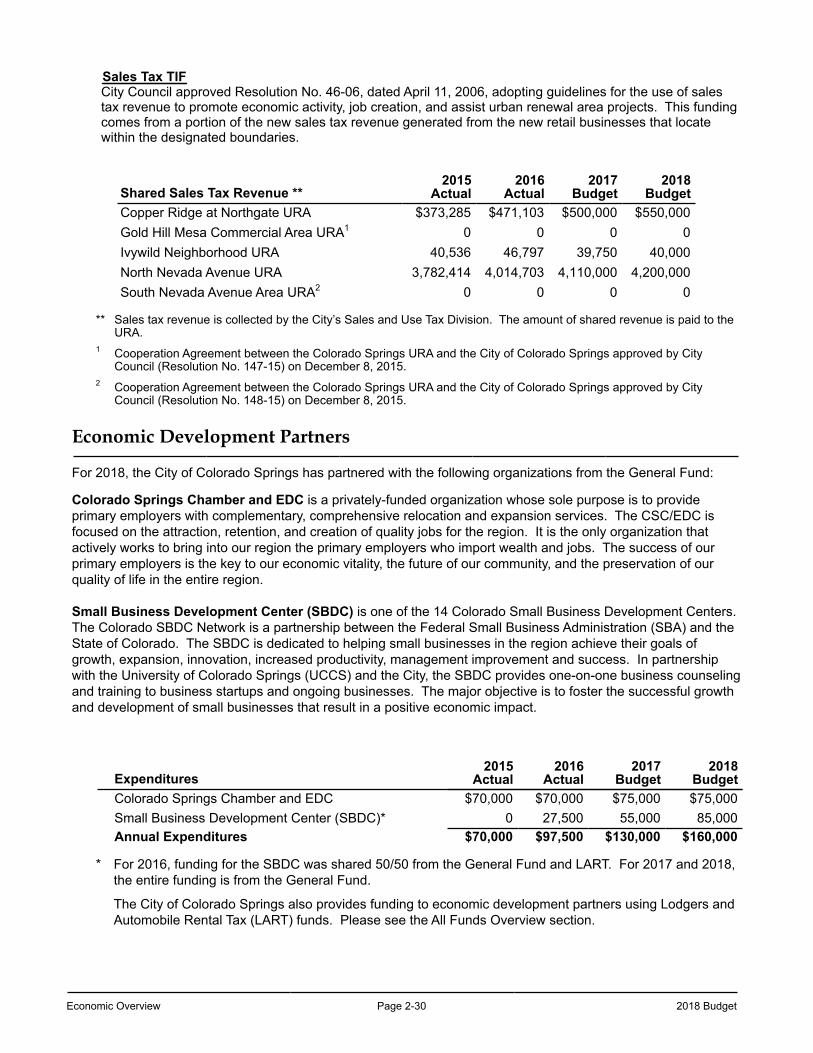
Economic Overview Page 2-30 2018 Budget
Sales Tax TIFCity Council approved Resolution No. 46-06, dated April 11, 2006, adopting guidelines for the use of sales tax revenue to promote economic activity, job creation, and assist urban renewal area projects. This funding comes from a portion of the new sales tax revenue generated from the new retail businesses that locate within the designated boundaries.
Shared Sales Tax Revenue **2015
Actual2016
Actual2017
Budget2018
BudgetCopper Ridge at Northgate URA $373,285 $471,103 $500,000 $550,000Gold Hill Mesa Commercial Area URA1 0 0 0 0Ivywild Neighborhood URA 40,536 46,797 39,750 40,000North Nevada Avenue URA 3,782,414 4,014,703 4,110,000 4,200,000South Nevada Avenue Area URA2 0 0 0 0
** Sales tax revenue is collected by the City’s Sales and Use Tax Division. The amount of shared revenue is paid to the URA.
1 Cooperation Agreement between the Colorado Springs URA and the City of Colorado Springs approved by City Council (Resolution No. 147-15) on December 8, 2015.
2 Cooperation Agreement between the Colorado Springs URA and the City of Colorado Springs approved by City Council (Resolution No. 148-15) on December 8, 2015.
Economic Development Partners
For 2018, the City of Colorado Springs has partnered with the following organizations from the General Fund:
Colorado Springs Chamber and EDC is a privately-funded organization whose sole purpose is to provide primary employers with complementary, comprehensive relocation and expansion services. The CSC/EDC is focused on the attraction, retention, and creation of quality jobs for the region. It is the only organization that actively works to bring into our region the primary employers who import wealth and jobs. The success of our primary employers is the key to our economic vitality, the future of our community, and the preservation of our quality of life in the entire region.
Small Business Development Center (SBDC) is one of the 14 Colorado Small Business Development Centers. The Colorado SBDC Network is a partnership between the Federal Small Business Administration (SBA) and the State of Colorado. The SBDC is dedicated to helping small businesses in the region achieve their goals of growth, expansion, innovation, increased productivity, management improvement and success. In partnership with the University of Colorado Springs (UCCS) and the City, the SBDC provides one-on-one business counseling and training to business startups and ongoing businesses. The major objective is to foster the successful growth and development of small businesses that result in a positive economic impact.
Expenditures2015
Actual2016
Actual2017
Budget2018
BudgetColorado Springs Chamber and EDC $70,000 $70,000 $75,000 $75,000Small Business Development Center (SBDC)* 0 27,500 55,000 85,000Annual Expenditures $70,000 $97,500 $130,000 $160,000
* For 2016, funding for the SBDC was shared 50/50 from the General Fund and LART. For 2017 and 2018, the entire funding is from the General Fund.
The City of Colorado Springs also provides funding to economic development partners using Lodgers and Automobile Rental Tax (LART) funds. Please see the All Funds Overview section.
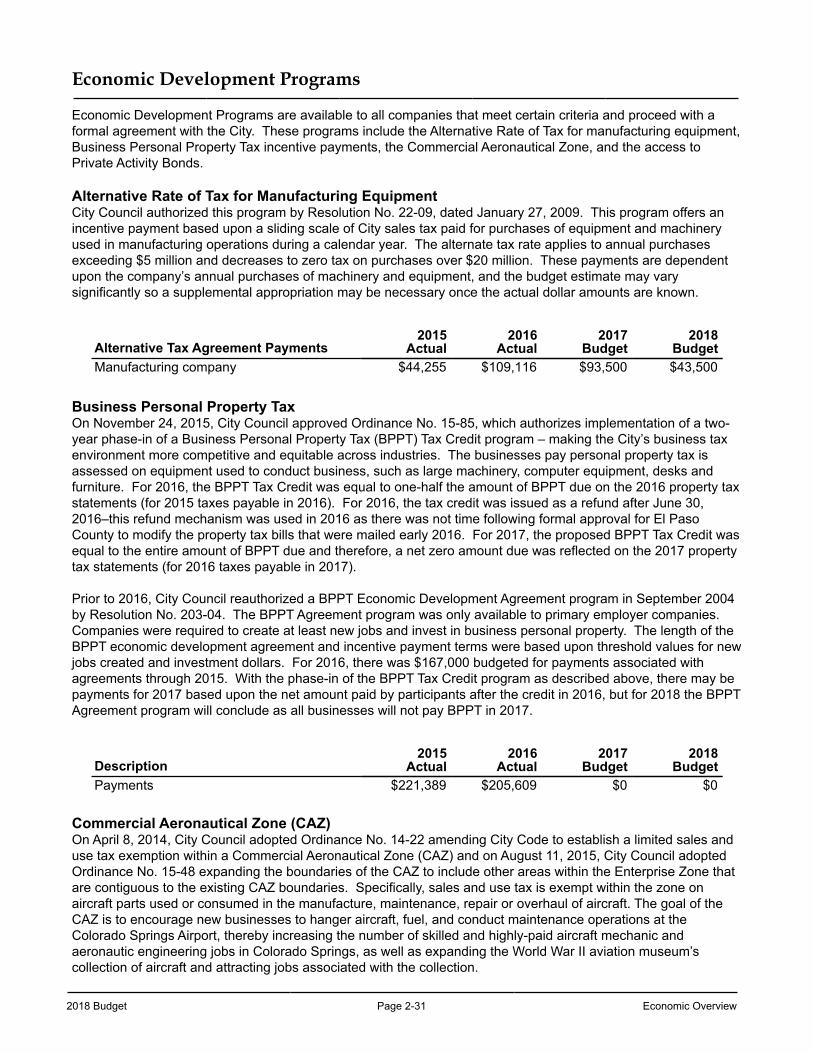
2018 Budget Page 2-31 Economic Overview
Economic Development Programs
Economic Development Programs are available to all companies that meet certain criteria and proceed with a formal agreement with the City. These programs include the Alternative Rate of Tax for manufacturing equipment, Business Personal Property Tax incentive payments, the Commercial Aeronautical Zone, and the access to Private Activity Bonds.
Alternative Rate of Tax for Manufacturing EquipmentCity Council authorized this program by Resolution No. 22-09, dated January 27, 2009. This program offers an incentive payment based upon a sliding scale of City sales tax paid for purchases of equipment and machinery used in manufacturing operations during a calendar year. The alternate tax rate applies to annual purchases exceeding $5 million and decreases to zero tax on purchases over $20 million. These payments are dependent upon the company’s annual purchases of machinery and equipment, and the budget estimate may vary significantly so a supplemental appropriation may be necessary once the actual dollar amounts are known.
Alternative Tax Agreement Payments2015
Actual2016
Actual2017
Budget2018
BudgetManufacturing company $44,255 $109,116 $93,500 $43,500
Business Personal Property Tax On November 24, 2015, City Council approved Ordinance No. 15-85, which authorizes implementation of a two-year phase-in of a Business Personal Property Tax (BPPT) Tax Credit program – making the City’s business tax environment more competitive and equitable across industries. The businesses pay personal property tax is assessed on equipment used to conduct business, such as large machinery, computer equipment, desks and furniture. For 2016, the BPPT Tax Credit was equal to one-half the amount of BPPT due on the 2016 property tax statements (for 2015 taxes payable in 2016). For 2016, the tax credit was issued as a refund after June 30, 2016–this refund mechanism was used in 2016 as there was not time following formal approval for El Paso County to modify the property tax bills that were mailed early 2016. For 2017, the proposed BPPT Tax Credit was equal to the entire amount of BPPT due and therefore, a net zero amount due was reflected on the 2017 property tax statements (for 2016 taxes payable in 2017).
Prior to 2016, City Council reauthorized a BPPT Economic Development Agreement program in September 2004 by Resolution No. 203-04. The BPPT Agreement program was only available to primary employer companies. Companies were required to create at least new jobs and invest in business personal property. The length of the BPPT economic development agreement and incentive payment terms were based upon threshold values for new jobs created and investment dollars. For 2016, there was $167,000 budgeted for payments associated with agreements through 2015. With the phase-in of the BPPT Tax Credit program as described above, there may be payments for 2017 based upon the net amount paid by participants after the credit in 2016, but for 2018 the BPPT Agreement program will conclude as all businesses will not pay BPPT in 2017.
Description2015
Actual2016
Actual2017
Budget2018
BudgetPayments $221,389 $205,609 $0 $0
Commercial Aeronautical Zone (CAZ)On April 8, 2014, City Council adopted Ordinance No. 14-22 amending City Code to establish a limited sales and use tax exemption within a Commercial Aeronautical Zone (CAZ) and on August 11, 2015, City Council adopted Ordinance No. 15-48 expanding the boundaries of the CAZ to include other areas within the Enterprise Zone that are contiguous to the existing CAZ boundaries. Specifically, sales and use tax is exempt within the zone on aircraft parts used or consumed in the manufacture, maintenance, repair or overhaul of aircraft. The goal of the CAZ is to encourage new businesses to hanger aircraft, fuel, and conduct maintenance operations at the Colorado Springs Airport, thereby increasing the number of skilled and highly-paid aircraft mechanic and aeronautic engineering jobs in Colorado Springs, as well as expanding the World War II aviation museum’s collection of aircraft and attracting jobs associated with the collection.
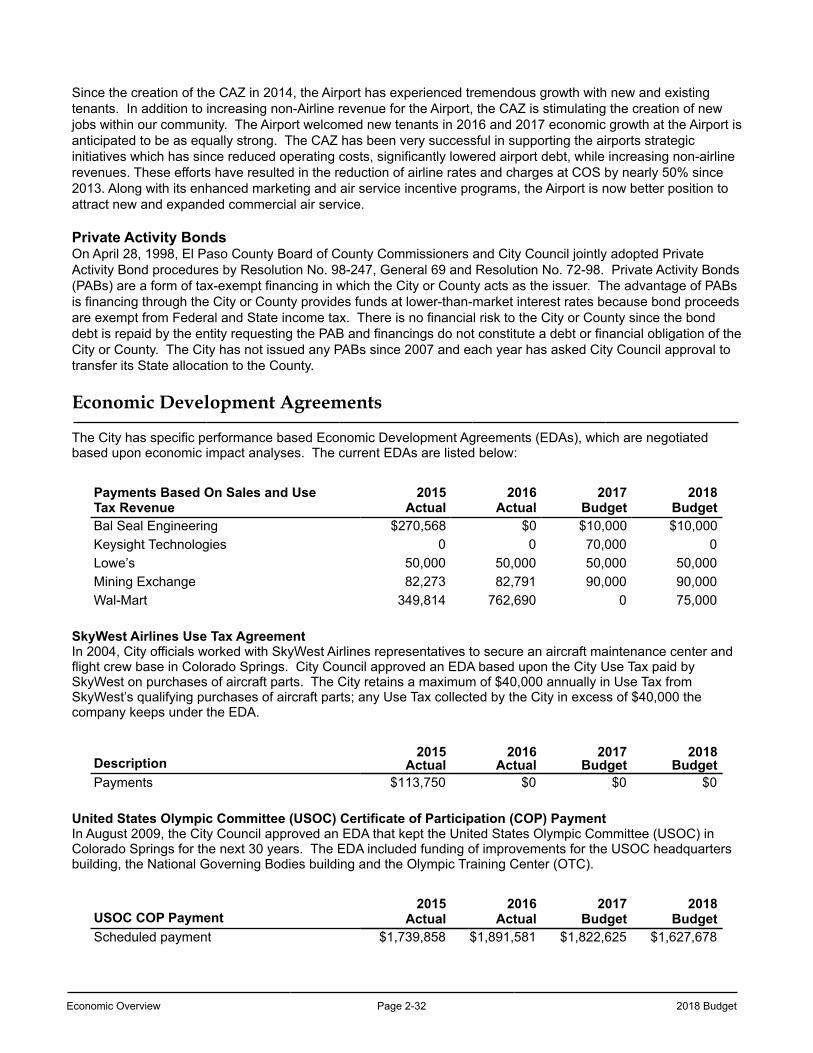
Economic Overview Page 2-32 2018 Budget
Since the creation of the CAZ in 2014, the Airport has experienced tremendous growth with new and existing tenants. In addition to increasing non-Airline revenue for the Airport, the CAZ is stimulating the creation of new jobs within our community. The Airport welcomed new tenants in 2016 and 2017 economic growth at the Airport is anticipated to be as equally strong. The CAZ has been very successful in supporting the airports strategic initiatives which has since reduced operating costs, significantly lowered airport debt, while increasing non-airline revenues. These efforts have resulted in the reduction of airline rates and charges at COS by nearly 50% since 2013. Along with its enhanced marketing and air service incentive programs, the Airport is now better position to attract new and expanded commercial air service.
Private Activity BondsOn April 28, 1998, El Paso County Board of County Commissioners and City Council jointly adopted Private Activity Bond procedures by Resolution No. 98-247, General 69 and Resolution No. 72-98. Private Activity Bonds (PABs) are a form of tax-exempt financing in which the City or County acts as the issuer. The advantage of PABs is financing through the City or County provides funds at lower-than-market interest rates because bond proceeds are exempt from Federal and State income tax. There is no financial risk to the City or County since the bond debt is repaid by the entity requesting the PAB and financings do not constitute a debt or financial obligation of the City or County. The City has not issued any PABs since 2007 and each year has asked City Council approval to transfer its State allocation to the County.
Economic Development Agreements
The City has specific performance based Economic Development Agreements (EDAs), which are negotiated based upon economic impact analyses. The current EDAs are listed below:
Payments Based On Sales and UseTax Revenue
2015Actual
2016Actual
2017Budget
2018Budget
Bal Seal Engineering $270,568 $0 $10,000 $10,000Keysight Technologies 0 0 70,000 0Lowe’s 50,000 50,000 50,000 50,000Mining Exchange 82,273 82,791 90,000 90,000Wal-Mart 349,814 762,690 0 75,000
SkyWest Airlines Use Tax AgreementIn 2004, City officials worked with SkyWest Airlines representatives to secure an aircraft maintenance center and flight crew base in Colorado Springs. City Council approved an EDA based upon the City Use Tax paid by SkyWest on purchases of aircraft parts. The City retains a maximum of $40,000 annually in Use Tax from SkyWest’s qualifying purchases of aircraft parts; any Use Tax collected by the City in excess of $40,000 the company keeps under the EDA.
Description2015
Actual2016
Actual2017
Budget2018
BudgetPayments $113,750 $0 $0 $0
United States Olympic Committee (USOC) Certificate of Participation (COP) PaymentIn August 2009, the City Council approved an EDA that kept the United States Olympic Committee (USOC) in Colorado Springs for the next 30 years. The EDA included funding of improvements for the USOC headquarters building, the National Governing Bodies building and the Olympic Training Center (OTC).
USOC COP Payment2015
Actual2016
Actual2017
Budget2018
BudgetScheduled payment $1,739,858 $1,891,581 $1,822,625 $1,627,678
2018 Budget Page 2-33 Economic Overview
Utility Usage Agreements
In 2006, City Council approved two 10-year EDAs with two companies (a medical imaging manufacturing company and an insurance company), which established local regional headquarters in Colorado Springs. Under these EDAs, the City provides a payment to the company based upon their electric and natural gas utility usage. These agreements:
• Do not involve any sharing of existing revenue;• Target new utility revenue generated directly from the company;• Establish the payment on a use and percentage basis, which therefore reduces the City’s risk (if revenue
collections underperform) since the payment is not tied to a specific annual amount; or• Minimize financial risk since the payment is strictly performance-based, and payments are made only
after revenue is collected.
Payments Based On Utility Usage *2015
Actual2016
Actual2017
Budget2018
BudgetManufacturing company $185,524 $169,466 $170,000 $180,000Insurance company regional headquarters 103,368 91,246 91,000 100,000Annual Payments $288,892 $260,712 $261,000 $280,000
* Actuals are for the previous year utility usage.
For information about the local economy and Southern Colorado Economic Forum’s Quarterly Updates and Estimates (QUE), please contact the:
College of Business and AdministrationUniversity of Colorado at Colorado Springs1420 Austin Bluffs Parkway, Colorado Springs, CO 80933-7150Office 719-255-3241 | Fax 719-255-3494http://www.SouthernColoradoEconomicForum.com/

Economic Overview Page 2-34 2018 Budget
This page left blank intentionally
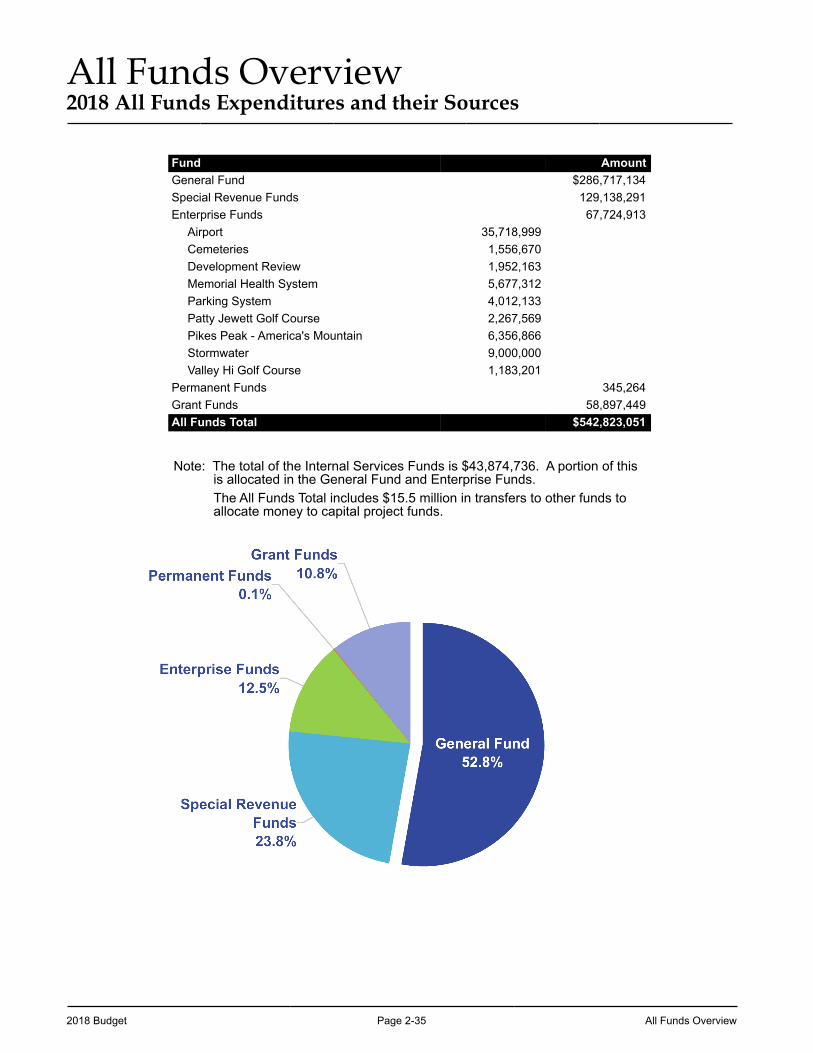
2018 Budget Page 2-35 All Funds Overview
All Funds Overview2018 All Funds Expenditures and their Sources
Fund AmountGeneral Fund $286,717,134Special Revenue Funds 129,138,291Enterprise Funds 67,724,913
Airport 35,718,999Cemeteries 1,556,670Development Review 1,952,163Memorial Health System 5,677,312Parking System 4,012,133Patty Jewett Golf Course 2,267,569Pikes Peak - America's Mountain 6,356,866Stormwater 9,000,000Valley Hi Golf Course 1,183,201
Permanent Funds 345,264Grant Funds 58,897,449All Funds Total $542,823,051
Note: The total of the Internal Services Funds is $43,874,736. A portion of this is allocated in the General Fund and Enterprise Funds.The All Funds Total includes $15.5 million in transfers to other funds toallocate money to capital project funds.
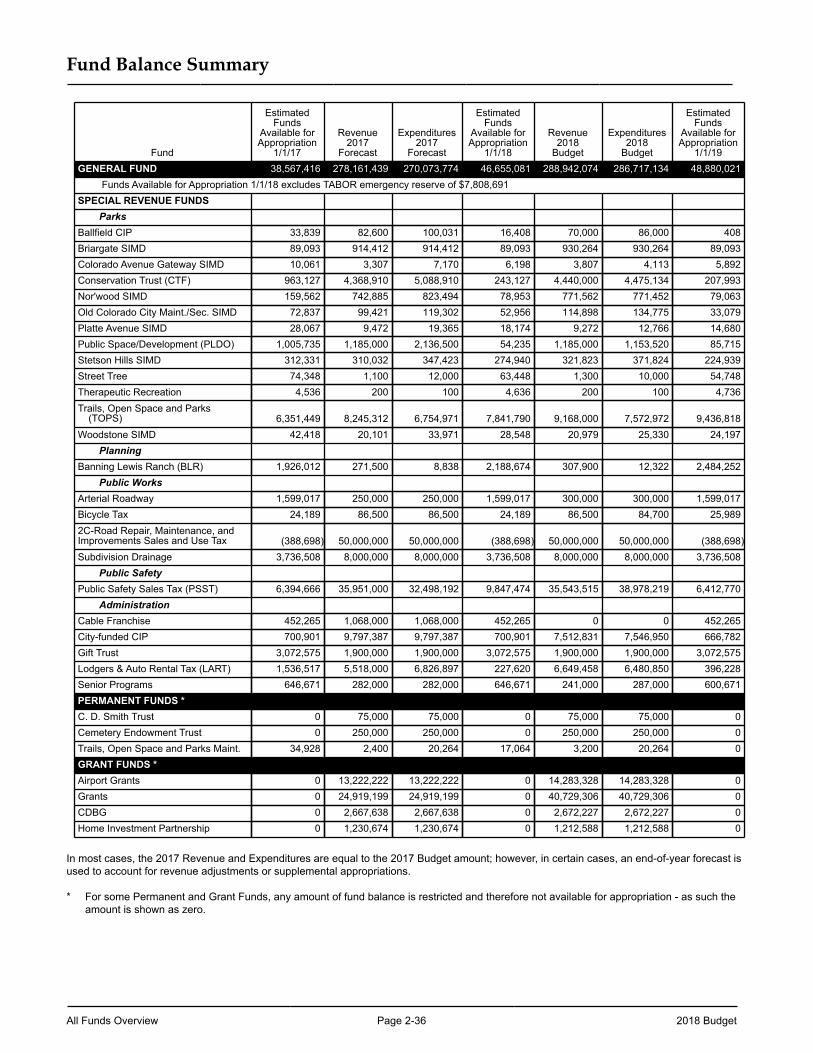
All Funds Overview Page 2-36 2018 Budget
Fund Balance Summary
Fund
EstimatedFunds
Available forAppropriation
1/1/17
Revenue2017
Forecast
Expenditures2017
Forecast
EstimatedFunds
Available forAppropriation
1/1/18
Revenue2018
Budget
Expenditures2018
Budget
EstimatedFunds
Available forAppropriation
1/1/19GENERAL FUND 38,567,416 278,161,439 270,073,774 46,655,081 288,942,074 286,717,134 48,880,021
Funds Available for Appropriation 1/1/18 excludes TABOR emergency reserve of $7,808,691SPECIAL REVENUE FUNDS
ParksBallfield CIP 33,839 82,600 100,031 16,408 70,000 86,000 408Briargate SIMD 89,093 914,412 914,412 89,093 930,264 930,264 89,093Colorado Avenue Gateway SIMD 10,061 3,307 7,170 6,198 3,807 4,113 5,892Conservation Trust (CTF) 963,127 4,368,910 5,088,910 243,127 4,440,000 4,475,134 207,993Nor'wood SIMD 159,562 742,885 823,494 78,953 771,562 771,452 79,063Old Colorado City Maint./Sec. SIMD 72,837 99,421 119,302 52,956 114,898 134,775 33,079Platte Avenue SIMD 28,067 9,472 19,365 18,174 9,272 12,766 14,680Public Space/Development (PLDO) 1,005,735 1,185,000 2,136,500 54,235 1,185,000 1,153,520 85,715Stetson Hills SIMD 312,331 310,032 347,423 274,940 321,823 371,824 224,939Street Tree 74,348 1,100 12,000 63,448 1,300 10,000 54,748Therapeutic Recreation 4,536 200 100 4,636 200 100 4,736Trails, Open Space and Parks
(TOPS) 6,351,449 8,245,312 6,754,971 7,841,790 9,168,000 7,572,972 9,436,818Woodstone SIMD 42,418 20,101 33,971 28,548 20,979 25,330 24,197
PlanningBanning Lewis Ranch (BLR) 1,926,012 271,500 8,838 2,188,674 307,900 12,322 2,484,252
Public WorksArterial Roadway 1,599,017 250,000 250,000 1,599,017 300,000 300,000 1,599,017Bicycle Tax 24,189 86,500 86,500 24,189 86,500 84,700 25,9892C-Road Repair, Maintenance, andImprovements Sales and Use Tax (388,698) 50,000,000 50,000,000 (388,698) 50,000,000 50,000,000 (388,698)Subdivision Drainage 3,736,508 8,000,000 8,000,000 3,736,508 8,000,000 8,000,000 3,736,508
Public SafetyPublic Safety Sales Tax (PSST) 6,394,666 35,951,000 32,498,192 9,847,474 35,543,515 38,978,219 6,412,770
AdministrationCable Franchise 452,265 1,068,000 1,068,000 452,265 0 0 452,265City-funded CIP 700,901 9,797,387 9,797,387 700,901 7,512,831 7,546,950 666,782Gift Trust 3,072,575 1,900,000 1,900,000 3,072,575 1,900,000 1,900,000 3,072,575Lodgers & Auto Rental Tax (LART) 1,536,517 5,518,000 6,826,897 227,620 6,649,458 6,480,850 396,228Senior Programs 646,671 282,000 282,000 646,671 241,000 287,000 600,671PERMANENT FUNDS *C. D. Smith Trust 0 75,000 75,000 0 75,000 75,000 0Cemetery Endowment Trust 0 250,000 250,000 0 250,000 250,000 0Trails, Open Space and Parks Maint. 34,928 2,400 20,264 17,064 3,200 20,264 0GRANT FUNDS *Airport Grants 0 13,222,222 13,222,222 0 14,283,328 14,283,328 0Grants 0 24,919,199 24,919,199 0 40,729,306 40,729,306 0CDBG 0 2,667,638 2,667,638 0 2,672,227 2,672,227 0Home Investment Partnership 0 1,230,674 1,230,674 0 1,212,588 1,212,588 0
In most cases, the 2017 Revenue and Expenditures are equal to the 2017 Budget amount; however, in certain cases, an end-of-year forecast is used to account for revenue adjustments or supplemental appropriations.
* For some Permanent and Grant Funds, any amount of fund balance is restricted and therefore not available for appropriation - as such the amount is shown as zero.
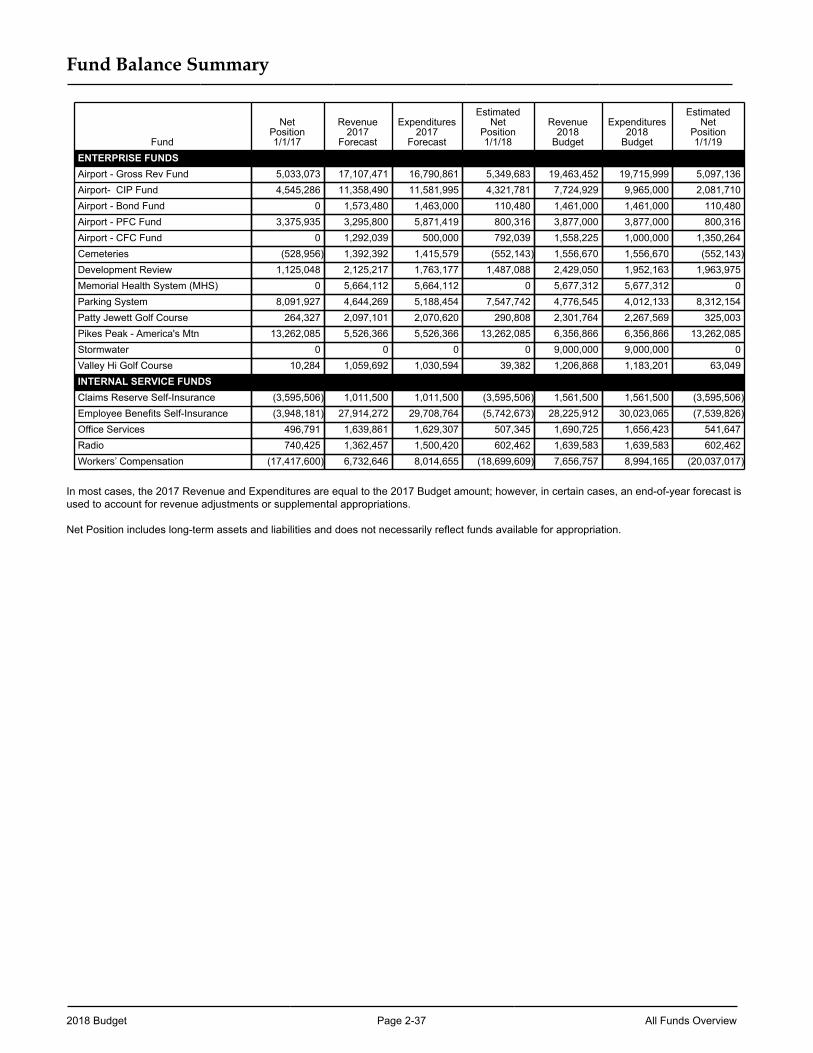
2018 Budget Page 2-37 All Funds Overview
Fund Balance Summary
Fund
NetPosition1/1/17
Revenue2017
Forecast
Expenditures2017
Forecast
Estimated Net
Position 1/1/18
Revenue2018
Budget
Expenditures2018
Budget
Estimated Net
Position 1/1/19
ENTERPRISE FUNDSAirport - Gross Rev Fund 5,033,073 17,107,471 16,790,861 5,349,683 19,463,452 19,715,999 5,097,136Airport- CIP Fund 4,545,286 11,358,490 11,581,995 4,321,781 7,724,929 9,965,000 2,081,710Airport - Bond Fund 0 1,573,480 1,463,000 110,480 1,461,000 1,461,000 110,480Airport - PFC Fund 3,375,935 3,295,800 5,871,419 800,316 3,877,000 3,877,000 800,316Airport - CFC Fund 0 1,292,039 500,000 792,039 1,558,225 1,000,000 1,350,264Cemeteries (528,956) 1,392,392 1,415,579 (552,143) 1,556,670 1,556,670 (552,143)Development Review 1,125,048 2,125,217 1,763,177 1,487,088 2,429,050 1,952,163 1,963,975Memorial Health System (MHS) 0 5,664,112 5,664,112 0 5,677,312 5,677,312 0Parking System 8,091,927 4,644,269 5,188,454 7,547,742 4,776,545 4,012,133 8,312,154Patty Jewett Golf Course 264,327 2,097,101 2,070,620 290,808 2,301,764 2,267,569 325,003Pikes Peak - America's Mtn 13,262,085 5,526,366 5,526,366 13,262,085 6,356,866 6,356,866 13,262,085Stormwater 0 0 0 0 9,000,000 9,000,000 0Valley Hi Golf Course 10,284 1,059,692 1,030,594 39,382 1,206,868 1,183,201 63,049INTERNAL SERVICE FUNDSClaims Reserve Self-Insurance (3,595,506) 1,011,500 1,011,500 (3,595,506) 1,561,500 1,561,500 (3,595,506)Employee Benefits Self-Insurance (3,948,181) 27,914,272 29,708,764 (5,742,673) 28,225,912 30,023,065 (7,539,826)Office Services 496,791 1,639,861 1,629,307 507,345 1,690,725 1,656,423 541,647Radio 740,425 1,362,457 1,500,420 602,462 1,639,583 1,639,583 602,462Workers’ Compensation (17,417,600) 6,732,646 8,014,655 (18,699,609) 7,656,757 8,994,165 (20,037,017)
In most cases, the 2017 Revenue and Expenditures are equal to the 2017 Budget amount; however, in certain cases, an end-of-year forecast is used to account for revenue adjustments or supplemental appropriations.
Net Position includes long-term assets and liabilities and does not necessarily reflect funds available for appropriation.
All Funds Overview Page 2-38 2018 Budget
Overview of 2018 Budgets for All Funds
The overview includes a fund balance summary and description of the City’s funds, how funds interact, basis of accounting, and changes to the adopted budget. The fund balance summary indicates the beginning and ending fund balances available for appropriation as well as 2018 budgets by specific fund.
The budget document focuses primarily on the General Fund because it is the largest fund. The 2018 General Fund Budget is $286,717,134, which is 52.8% of the total funds.
Another significant type of fund is the Special Revenue Funds. The 2018 Special Revenue Funds budgets total $129,138,291, which is 23.8% of the total funds.
The Grant Funds budget totals $58,897,449, which is 10.8% of the total funds for 2018.
For 2018, Enterprise Funds budgets total $67,724,913, which is 12.5% of the total funds. The balance of the total funds is comprised of the 2018 Permanent Funds budgets, which total $345,264.
The total of all these funds is $542,823,051.
City Services Overview
The City of Colorado Springs is a home-rule city, organized under provisions of the Colorado constitution. The City provides a full range of municipal government services to an estimated 2018 population of 473,984 residents. The services include:
• City Attorney, City Clerk, Municipal Court• City Auditor• City Council• Finance, Community Development, Economic Development, General Costs • Fire protection, Emergency Management• Information Technology• Mayor, Communications, Human Resources, Procurement, Innovation & Sustainability• Parks, Recreation and Cultural Services• Planning & Development, Neighborhood Services, Real Estate Services• Police protection • Public Works
Also, the City owns and operates enterprise activities including:
• Airport• Cemeteries• Development Review • Memorial Health System• Parking System• Patty Jewett Golf Course• Pikes Peak – America’s Mountain• Stormwater• Valley Hi Golf Course
2018 Budget Page 2-39 All Funds Overview
Fund Structure
City revenue is designated and set aside in funds. The funds of the City of Colorado Springs are organized according to Generally Accepted Accounting Principles (GAAP). For revenue and expenditure budgets for each fund, refer to the All Funds Summary table.
Basis of Accounting and Accounting Structure
Basis of AccountingThe General Fund, Special Revenue Funds, Capital Improvements Program Funds, and certain Trust Funds are maintained on a modified accrual basis, which records revenue when measurable and available. Expenditures are generally recorded when the liability is incurred. Enterprise Funds, Internal Services Funds, and certain Permanent Funds are maintained on an accrual basis, which records revenue at the time earned and expenses when incurred.
Basis of BudgetingThe budget is prepared in a manner consistent with the Colorado Revised Statutes. All funds are included within the budget along with the programs supported. The City's budget is prepared completely on a modified accrual basis, which is the same as the Basis of Accounting for all funds except Enterprise Funds, Internal Services Funds, and certain Permanent Funds.
Annual Budget Process and Budget ControlsIn accordance with City Charter, Section 4-40(i), the Mayor presents a balanced budget to City Council on or before the first Monday in October in each year.
In accordance with City Charter, Section 7-30(a), the City Council shall, upon receipt of the budget, adopt the budget with or without amendment. In amending the budget, the Council may add or increase programs or amounts and may delete or decrease any programs or amounts, except amounts required by law or for debt service obligations or for estimated cash deficit.
As part of the annual budget cycle, budgets are adopted for all funds of the City. Budgetary controls are maintained for all funds of the City in conformance with the City Charter and Code to assure fiscally sound management.
After the annual appropriations ordinance is approved, with approval from the Chief Financial Officer, budget can be transferred within an appropriating department; however, transfers between appropriating departments or funds require City Council approval. Also, after the annual appropriations ordinance is approved, the Mayor may propose amendments to the annual appropriations ordinance. Such supplemental appropriation requests are transmitted to City Council for approval.
An encumbrance accounting system is used to assist in accomplishing budgetary control.
General Fund
The General Fund includes all activities of the City supported by City taxes and other non-dedicated revenue. These other revenue sources include license and permit fees, user charges, intergovernmental revenue, fines, miscellaneous revenue, and transfers from other funds. The General Fund also includes all traditional municipal expenditures such as those for public safety, parks, and transportation. See the General Fund Summary tab.
All Funds Overview Page 2-40 2018 Budget
Special Revenue Funds – overseen by the Parks Department
BALLFIELD CAPITAL IMPROVEMENTS
2017 Budget: $100,031 2018 Budget: $86,000PurposeProvide for maintenance and improvements to baseball and softball fields throughout the city.Revenue source Fees paid by softball and baseball teams upon league registration.Designated expenditure Debt service payment on the Certificates of Participation (COPs) Series 1999 for the softball and recreation facility project.
BRIARGATE SPECIAL IMPROVEMENT MAINTENANCE DISTRICT (SIMD)
2017 Budget: $914,412 2018 Budget: $930,264Purpose Provide for the maintenance of certain public improvements of general benefit to the residents of the district.Revenue source Assessments against the real property in the district.Designated expenditure Maintenance expenses of specific improvements as identified by the advisory committee in consultation with the Parks, Recreation and Cultural Services staff. Council approves the budget for the district.
COLORADO AVENUE GATEWAY SPECIAL IMPROVEMENT MAINTENANCE DISTRICT (SIMD)
2017 Budget: $7,170 2018 Budget: $4,113Purpose Provide for the maintenance of numerous public improvements unique to the Gateway area.Revenue source Assessments against all real properties in the district collected by the County and remitted to the fund.Designated expenditure An advisory committee to advise City Council of the level, extent, and effectiveness of the maintenance needed in the district. Council approves the budget for the district.
CONSERVATION TRUST (CTF)MissionTo provide a means of acquiring, developing, and maintaining new conservation sites, and for capital improvements or maintenance for recreational purposes on any public sites.OverviewLocal governments receive 40% of the total revenue generated by the State Lottery, and the City share is distributed based on population. These funds are received and expended from the Conservation Trust Fund (CTF). A total of $4,440,000 is the amount of Lottery funds expected in 2018, of which $14,400 is interest. Additional information can be found in the Parks, Recreation and Cultural Services narratives.
2018 Budget Page 2-41 All Funds Overview
CTF Budget Summary2015
Actual2016
Actual2017
Budget2018
BudgetOperating $4,386,754 $4,548,514 $4,278,910 $4,385,134Projects 417,054 118,220 90,000 90,000Total $4,803,808 $4,666,734 $4,368,910 $4,475,134
CTF Operating Budget by District2018
BudgetNorth District $363,328South District 532,656Regional Parks & Trails 578,669North Athletic District 664,214South Athletic District 820,569Primary Parks 284,127Maintenance Operations 1,011,014Forestry 130,557Total CTF Operating $4,385,134
CTF Operating Budget by Project *2018
BudgetRed Rock Canyon Landfill Monitoring $75,000Outdoor Sculpture Preservation 15,000Total CTF Projects $90,000
* For budgeting purposes, COP payments are included in the operational department titled “Maintenance Operations”
NORWOOD SPECIAL IMPROVEMENT MAINTENANCE DISTRICT (SIMD)
2017 Budget: $823,494 2018 Budget: $771,452Purpose Provide for the maintenance of specified public improvements on and along certain roadways within the district.Revenue source Assessments against the real properties within the district.Designated expenditure Maintenance of specific improvements identified by the advisory committee in consultation with the Parks, Recreation and Cultural Services staff. Council approves the budget for the district.
OLD COLORADO CITY MAINTENANCE AND SECURITY DISTRICT
2017 Budget: $119,302 2018 Budget: $134,775Purpose Secure and maintain numerous public improvements unique to the Old Colorado City area.Revenue source Assessments against all real properties in the district collected by the County and remitted to the fund. Designated expenditure An advisory committee to advise City Council of the level, extent, and effectiveness of the security and maintenance needed in the district. Council approves the budget for the district.
All Funds Overview Page 2-42 2018 Budget
PLATTE AVENUE SPECIAL IMPROVEMENT MAINTENANCE DISTRICT (SIMD)
2017 Budget: $19,365 2018 Budget: $12,766Purpose Secure and maintain numerous public improvements unique to Platte Avenue.Revenue source Assessments against all real properties in the district collected by the County and remitted to the fund.Designated expenditure An advisory committee to advise City Council of the level, extent, and effectiveness of the maintenance needed in the district. Council approves the budget for the district.
PUBLIC SPACE AND DEVELOPMENT (commonly referred to as PLDO)
2017 Budget: $826,500 2018 Budget: $1,153,520Purpose Provide for the development of parks and open space in new subdivisions.Revenue source In lieu of land dedication, the developer may pay an amount equal to 4% of the land into this fund.Designated expenditureAcquisition or development of parks, recreational or similar purposes in the designated area.
STETSON HILLS SPECIAL IMPROVEMENT MAINTENANCE DISTRICT (SIMD)
2017 Budget: $347,423 2018 Budget: $371,824Purpose Provide for the maintenance of certain public improvements of general benefit to the residents of the district.Revenue source Assessments against the real property in the district.Designated expenditureMaintenance expenses of specific improvements as identified by the advisory committee in consultation with the Parks, Recreation and Cultural Services staff. Council approves the budget for the district.
STREET TREE
2017 Budget: $12,000 2018 Budget: $10,000PurposeAssure a regular program of planting and care of new trees in previously underdeveloped lots.Revenue sourceOwner and developer fees collected at the time a building permit is issued along with a City match.Designated expenditurePurchase and installation of good quality trees.
THERAPEUTIC RECREATION
2017 Budget: $100 2018 Budget: $100PurposeProvide therapeutic recreation events, program activities, and facilities within the Pikes Peak Region.Revenue sourceUndesignated giftsDesignated expenditureTherapeutic recreation events, programs, activities and facilities within the Pikes Peak Region.
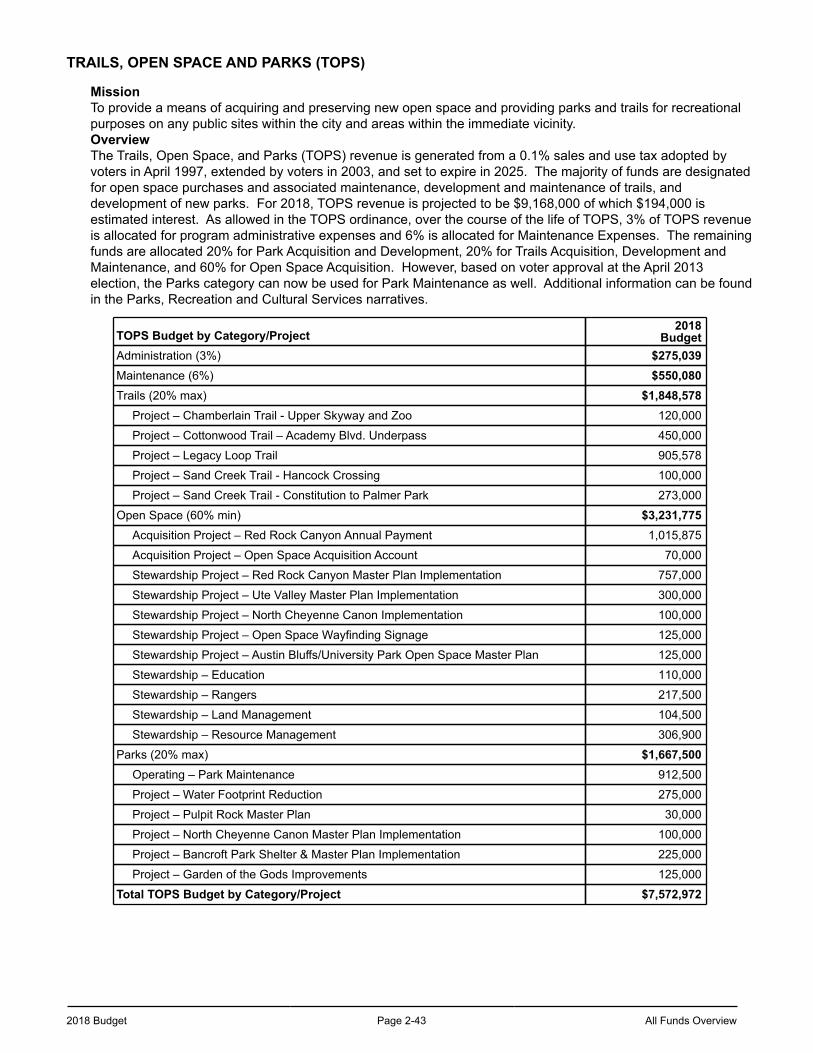
2018 Budget Page 2-43 All Funds Overview
TRAILS, OPEN SPACE AND PARKS (TOPS)
Mission To provide a means of acquiring and preserving new open space and providing parks and trails for recreational purposes on any public sites within the city and areas within the immediate vicinity.Overview The Trails, Open Space, and Parks (TOPS) revenue is generated from a 0.1% sales and use tax adopted by voters in April 1997, extended by voters in 2003, and set to expire in 2025. The majority of funds are designated for open space purchases and associated maintenance, development and maintenance of trails, and development of new parks. For 2018, TOPS revenue is projected to be $9,168,000 of which $194,000 is estimated interest. As allowed in the TOPS ordinance, over the course of the life of TOPS, 3% of TOPS revenue is allocated for program administrative expenses and 6% is allocated for Maintenance Expenses. The remaining funds are allocated 20% for Park Acquisition and Development, 20% for Trails Acquisition, Development and Maintenance, and 60% for Open Space Acquisition. However, based on voter approval at the April 2013 election, the Parks category can now be used for Park Maintenance as well. Additional information can be found in the Parks, Recreation and Cultural Services narratives.
TOPS Budget by Category/Project2018
BudgetAdministration (3%) $275,039Maintenance (6%) $550,080Trails (20% max) $1,848,578
Project – Chamberlain Trail - Upper Skyway and Zoo 120,000
Project – Cottonwood Trail – Academy Blvd. Underpass 450,000
Project – Legacy Loop Trail 905,578
Project – Sand Creek Trail - Hancock Crossing 100,000
Project – Sand Creek Trail - Constitution to Palmer Park 273,000
Open Space (60% min) $3,231,775Acquisition Project – Red Rock Canyon Annual Payment 1,015,875
Acquisition Project – Open Space Acquisition Account 70,000
Stewardship Project – Red Rock Canyon Master Plan Implementation 757,000
Stewardship Project – Ute Valley Master Plan Implementation 300,000
Stewardship Project – North Cheyenne Canon Implementation 100,000
Stewardship Project – Open Space Wayfinding Signage 125,000
Stewardship Project – Austin Bluffs/University Park Open Space Master Plan 125,000
Stewardship – Education 110,000
Stewardship – Rangers 217,500
Stewardship – Land Management 104,500
Stewardship – Resource Management 306,900
Parks (20% max) $1,667,500Operating – Park Maintenance 912,500
Project – Water Footprint Reduction 275,000
Project – Pulpit Rock Master Plan 30,000
Project – North Cheyenne Canon Master Plan Implementation 100,000
Project – Bancroft Park Shelter & Master Plan Implementation 225,000
Project – Garden of the Gods Improvements 125,000
Total TOPS Budget by Category/Project $7,572,972
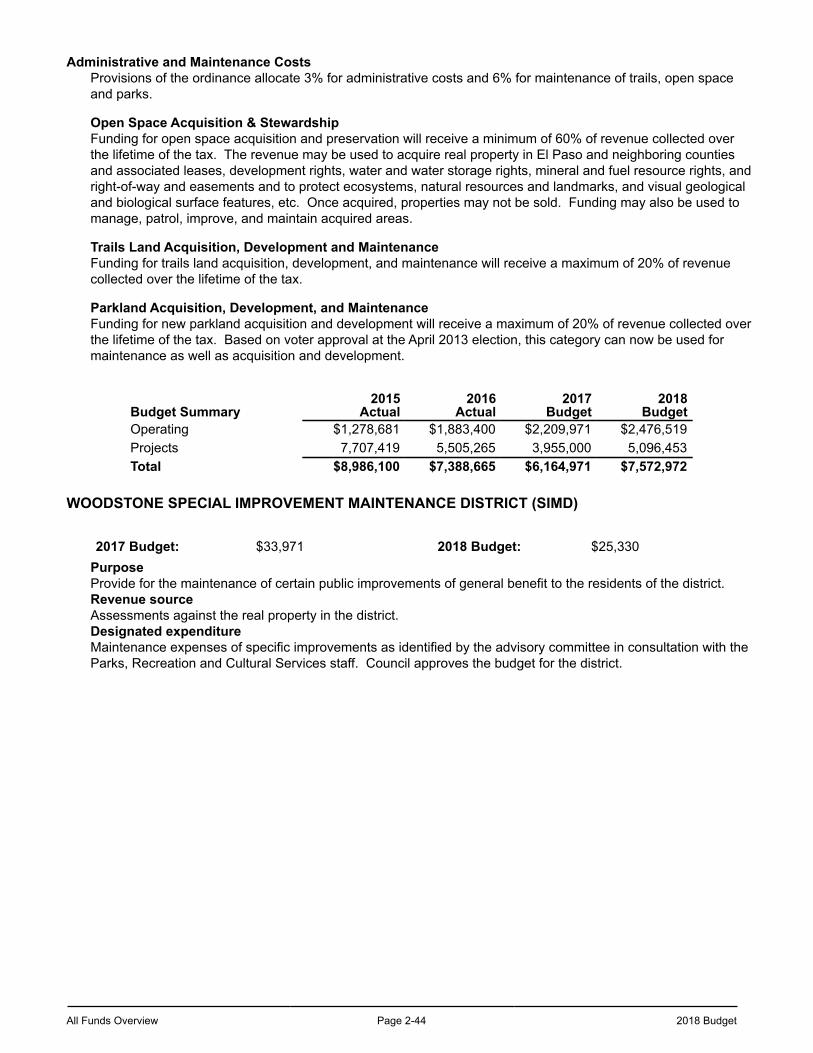
All Funds Overview Page 2-44 2018 Budget
Administrative and Maintenance Costs Provisions of the ordinance allocate 3% for administrative costs and 6% for maintenance of trails, open space and parks.
Open Space Acquisition & StewardshipFunding for open space acquisition and preservation will receive a minimum of 60% of revenue collected over the lifetime of the tax. The revenue may be used to acquire real property in El Paso and neighboring counties and associated leases, development rights, water and water storage rights, mineral and fuel resource rights, and right-of-way and easements and to protect ecosystems, natural resources and landmarks, and visual geological and biological surface features, etc. Once acquired, properties may not be sold. Funding may also be used to manage, patrol, improve, and maintain acquired areas.
Trails Land Acquisition, Development and MaintenanceFunding for trails land acquisition, development, and maintenance will receive a maximum of 20% of revenue collected over the lifetime of the tax.
Parkland Acquisition, Development, and Maintenance Funding for new parkland acquisition and development will receive a maximum of 20% of revenue collected over the lifetime of the tax. Based on voter approval at the April 2013 election, this category can now be used for maintenance as well as acquisition and development.
Budget Summary2015
Actual2016
Actual2017
Budget2018
BudgetOperating $1,278,681 $1,883,400 $2,209,971 $2,476,519Projects 7,707,419 5,505,265 3,955,000 5,096,453Total $8,986,100 $7,388,665 $6,164,971 $7,572,972
WOODSTONE SPECIAL IMPROVEMENT MAINTENANCE DISTRICT (SIMD)
2017 Budget: $33,971 2018 Budget: $25,330Purpose Provide for the maintenance of certain public improvements of general benefit to the residents of the district.Revenue source Assessments against the real property in the district.Designated expenditure Maintenance expenses of specific improvements as identified by the advisory committee in consultation with the Parks, Recreation and Cultural Services staff. Council approves the budget for the district.
2018 Budget Page 2-45 All Funds Overview
Special Revenue Funds – overseen by the Planning & Development Department
BANNING LEWIS RANCH
2017 Budget: $8,838 2018 Budget: $12,322Purpose Collect impact fees and manage reimbursements in a manner that allows the obligations under the BLR Annexation Agreement to be equitably and proportionally shared.Revenue source General Annexor Obligation Fee, BLR Parkway, or Interchange Fees.Designated expenditure Reimburse those annexors who construct shared infrastructure or who fulfill Annexation Agreement obligations identified as reimbursable shared obligations within the BLR Annexor Shared Infrastructure Study.
Special Revenue Funds – overseen by the Public Works Department
ARTERIAL ROADWAY
2017 Budget: $250,000 2018 Budget: $300,000Purpose Fund the cost of constructing/expanding freeway, expressway, and major or minor arterial roadway bridges.Revenue source Fees from landowners.Designated expenditure Capital construction costs or reimbursements to developers for arterial roadway bridges.
BICYCLE TAX
2017 Budget: $86,500 2018 Budget: $84,700PurposeProvide a funding source for bikeway improvements throughout the city.Revenue source A sales tax on the purchase of all new and used bicycles purchased in the city.Designated expenditure Maintenance repair and expansion of the City’s bikeway system.
2C-ROAD REPAIR, MAINTENANCE, AND IMPROVEMENTS SALES AND USE TAX
MissionProvide a dedicated source of revenue to fund road repair, maintenance, and improvements.Overview In November 2015, City voters approved Ballot Question 2C, authorizing the City to temporarily increase its sales and use tax by 0.62% (6.2 pennies on a $10 purchase) for five years to fund only road repairs and improvements, and be permitted to retain all such revenues generated and to expend the same only for road repairs and improvements, exempt from spending and revenue limitations. As approved, the existing sales and use tax rate of 2.5% established by the City Code is increased by 0.62% dedicated to road repairs and improvements to make an effective City tax rate of 3.12% as of January 1, 2016. This tax will sunset (expire) exactly five (5) years from the date of its implementation and will not affect or apply to purchases of food for domestic home consumption, prescriptions, residential utility bills or other items exempt from City sales and use tax under the City Code. This temporary increase in sales and use tax revenue will be placed in a dedicated fund to be used only for funding the cost to repair roads and streets throughout all areas of the City, including cost of road reconstruction where severe deterioration does not allow repair. None of the additional sales and use tax revenue will be used to hire additional City employees or purchase additional equipment for City road projects. The repair work will be contracted out to the private sector.
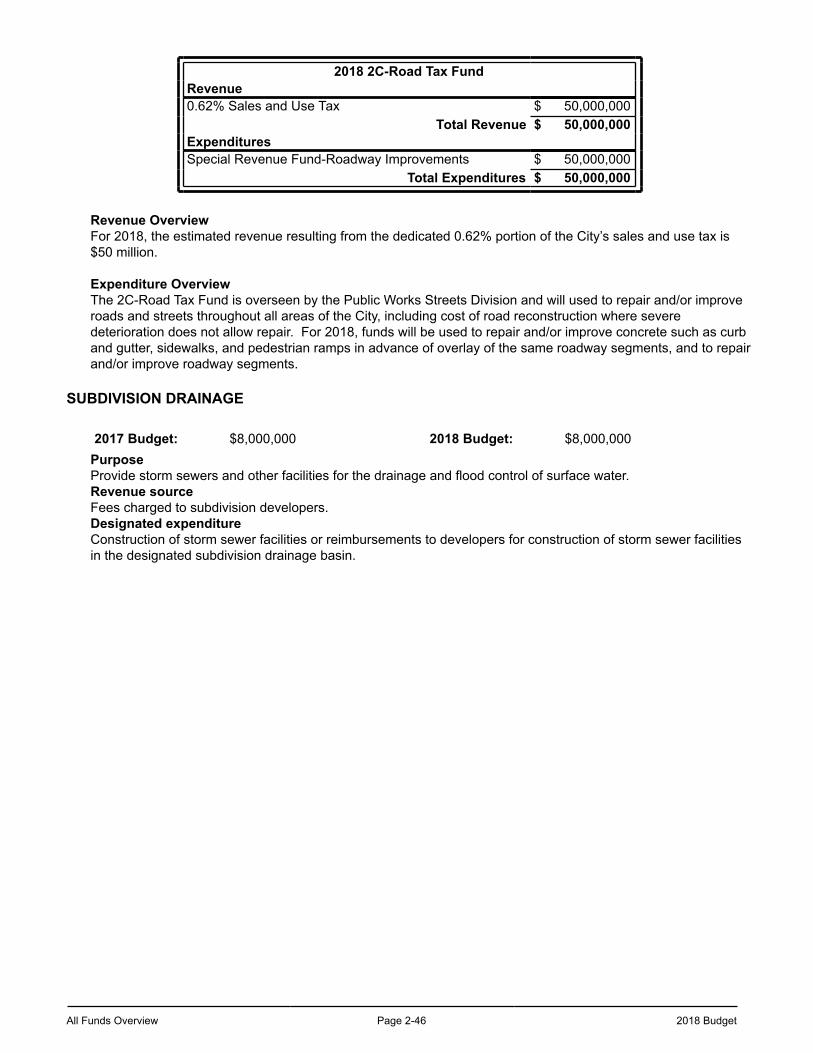
All Funds Overview Page 2-46 2018 Budget
2018 2C-Road Tax FundRevenue0.62% Sales and Use Tax $ 50,000,000
Total Revenue $ 50,000,000ExpendituresSpecial Revenue Fund-Roadway Improvements $ 50,000,000
Total Expenditures $ 50,000,000
Revenue OverviewFor 2018, the estimated revenue resulting from the dedicated 0.62% portion of the City’s sales and use tax is $50 million.
Expenditure OverviewThe 2C-Road Tax Fund is overseen by the Public Works Streets Division and will used to repair and/or improve roads and streets throughout all areas of the City, including cost of road reconstruction where severe deterioration does not allow repair. For 2018, funds will be used to repair and/or improve concrete such as curb and gutter, sidewalks, and pedestrian ramps in advance of overlay of the same roadway segments, and to repair and/or improve roadway segments.
SUBDIVISION DRAINAGE
2017 Budget: $8,000,000 2018 Budget: $8,000,000PurposeProvide storm sewers and other facilities for the drainage and flood control of surface water.Revenue sourceFees charged to subdivision developers.Designated expenditureConstruction of storm sewer facilities or reimbursements to developers for construction of storm sewer facilities in the designated subdivision drainage basin.
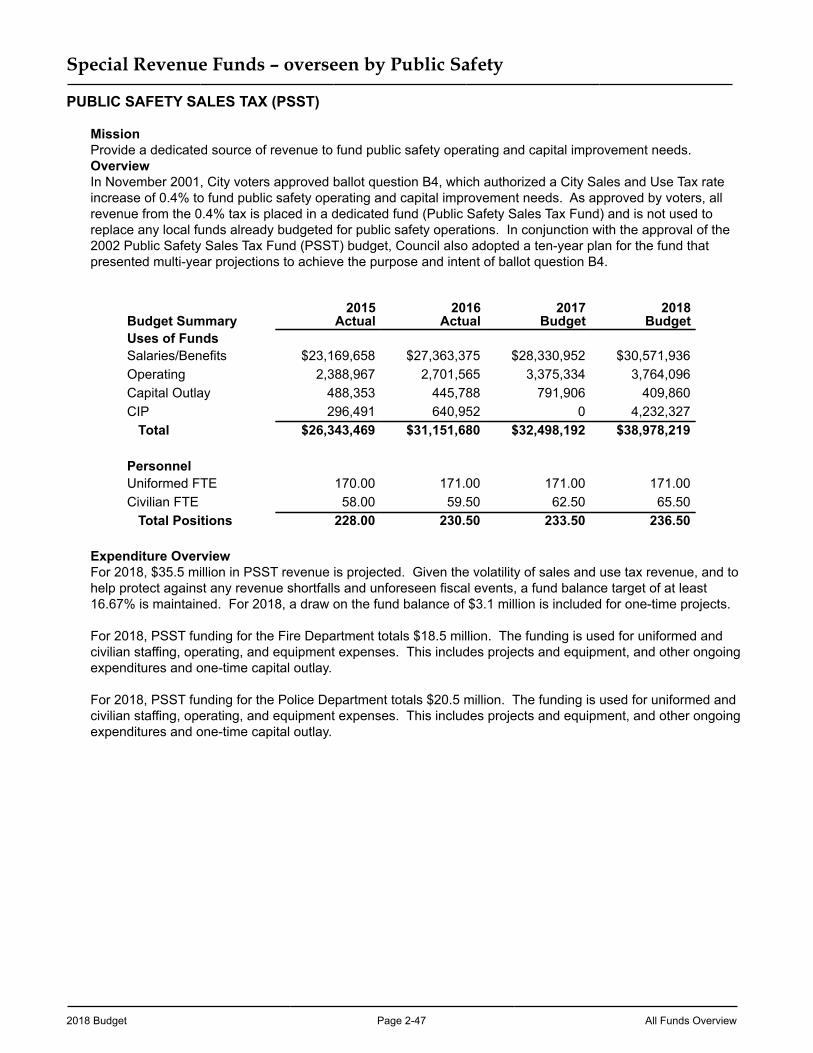
2018 Budget Page 2-47 All Funds Overview
Special Revenue Funds – overseen by Public Safety
PUBLIC SAFETY SALES TAX (PSST)
MissionProvide a dedicated source of revenue to fund public safety operating and capital improvement needs.Overview In November 2001, City voters approved ballot question B4, which authorized a City Sales and Use Tax rate increase of 0.4% to fund public safety operating and capital improvement needs. As approved by voters, all revenue from the 0.4% tax is placed in a dedicated fund (Public Safety Sales Tax Fund) and is not used to replace any local funds already budgeted for public safety operations. In conjunction with the approval of the 2002 Public Safety Sales Tax Fund (PSST) budget, Council also adopted a ten-year plan for the fund that presented multi-year projections to achieve the purpose and intent of ballot question B4.
Budget Summary2015
Actual2016
Actual2017
Budget2018
BudgetUses of FundsSalaries/Benefits $23,169,658 $27,363,375 $28,330,952 $30,571,936Operating 2,388,967 2,701,565 3,375,334 3,764,096Capital Outlay 488,353 445,788 791,906 409,860CIP 296,491 640,952 0 4,232,327 Total $26,343,469 $31,151,680 $32,498,192 $38,978,219
PersonnelUniformed FTE 170.00 171.00 171.00 171.00Civilian FTE 58.00 59.50 62.50 65.50 Total Positions 228.00 230.50 233.50 236.50
Expenditure OverviewFor 2018, $35.5 million in PSST revenue is projected. Given the volatility of sales and use tax revenue, and to help protect against any revenue shortfalls and unforeseen fiscal events, a fund balance target of at least 16.67% is maintained. For 2018, a draw on the fund balance of $3.1 million is included for one-time projects.
For 2018, PSST funding for the Fire Department totals $18.5 million. The funding is used for uniformed and civilian staffing, operating, and equipment expenses. This includes projects and equipment, and other ongoing expenditures and one-time capital outlay.
For 2018, PSST funding for the Police Department totals $20.5 million. The funding is used for uniformed and civilian staffing, operating, and equipment expenses. This includes projects and equipment, and other ongoing expenditures and one-time capital outlay.
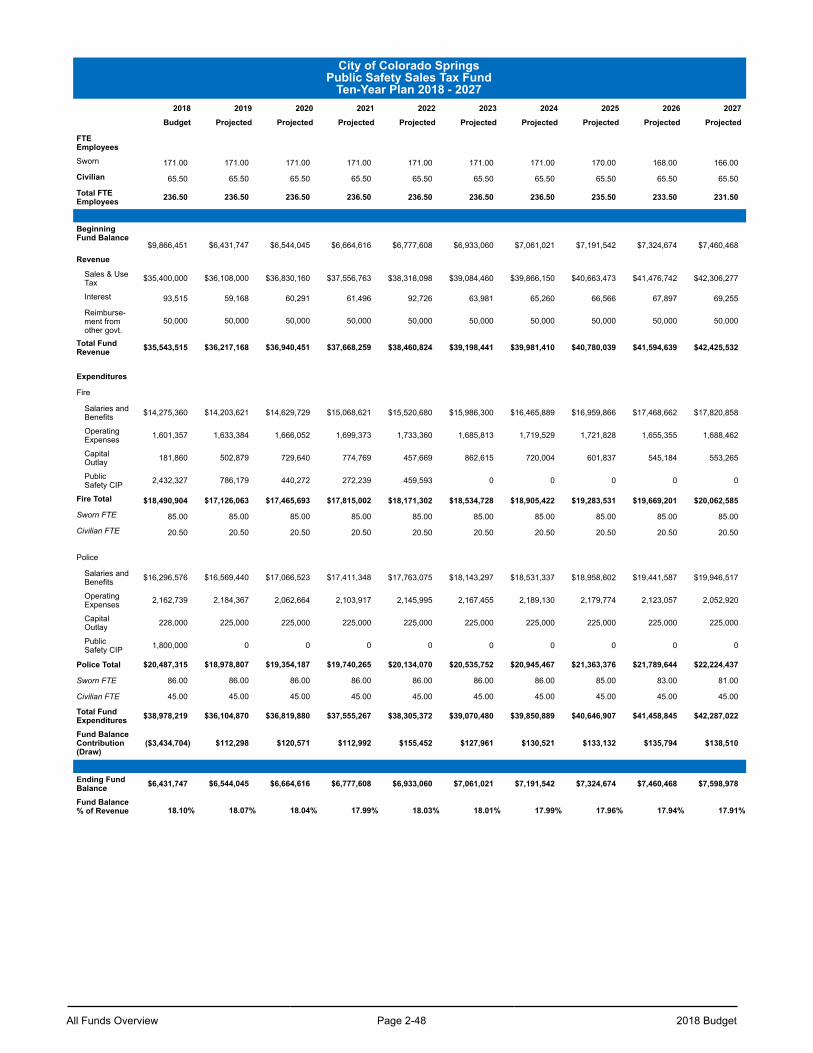
All Funds Overview Page 2-48 2018 Budget
City of Colorado SpringsPublic Safety Sales Tax Fund
Ten-Year Plan 2018 - 20272018 2019 2020 2021 2022 2023 2024 2025 2026 2027
Budget Projected Projected Projected Projected Projected Projected Projected Projected Projected
FTEEmployees
Sworn 171.00 171.00 171.00 171.00 171.00 171.00 171.00 170.00 168.00 166.00
Civilian 65.50 65.50 65.50 65.50 65.50 65.50 65.50 65.50 65.50 65.50
Total FTEEmployees 236.50 236.50 236.50 236.50 236.50 236.50 236.50 235.50 233.50 231.50
BeginningFund Balance
$9,866,451 $6,431,747 $6,544,045 $6,664,616 $6,777,608 $6,933,060 $7,061,021 $7,191,542 $7,324,674 $7,460,468
Revenue
Sales & UseTax $35,400,000 $36,108,000 $36,830,160 $37,556,763 $38,318,098 $39,084,460 $39,866,150 $40,663,473 $41,476,742 $42,306,277
Interest 93,515 59,168 60,291 61,496 92,726 63,981 65,260 66,566 67,897 69,255
Reimburse-ment fromother govt.
50,000 50,000 50,000 50,000 50,000 50,000 50,000 50,000 50,000 50,000
Total FundRevenue $35,543,515 $36,217,168 $36,940,451 $37,668,259 $38,460,824 $39,198,441 $39,981,410 $40,780,039 $41,594,639 $42,425,532
Expenditures
Fire
Salaries andBenefits $14,275,360 $14,203,621 $14,629,729 $15,068,621 $15,520,680 $15,986,300 $16,465,889 $16,959,866 $17,468,662 $17,820,858
OperatingExpenses 1,601,357 1,633,384 1,666,052 1,699,373 1,733,360 1,685,813 1,719,529 1,721,828 1,655,355 1,688,462
CapitalOutlay 181,860 502,879 729,640 774,769 457,669 862,615 720,004 601,837 545,184 553,265
PublicSafety CIP 2,432,327 786,179 440,272 272,239 459,593 0 0 0 0 0
Fire Total $18,490,904 $17,126,063 $17,465,693 $17,815,002 $18,171,302 $18,534,728 $18,905,422 $19,283,531 $19,669,201 $20,062,585
Sworn FTE 85.00 85.00 85.00 85.00 85.00 85.00 85.00 85.00 85.00 85.00
Civilian FTE 20.50 20.50 20.50 20.50 20.50 20.50 20.50 20.50 20.50 20.50
Police
Salaries andBenefits $16,296,576 $16,569,440 $17,066,523 $17,411,348 $17,763,075 $18,143,297 $18,531,337 $18,958,602 $19,441,587 $19,946,517
OperatingExpenses 2,162,739 2,184,367 2,062,664 2,103,917 2,145,995 2,167,455 2,189,130 2,179,774 2,123,057 2,052,920
CapitalOutlay 228,000 225,000 225,000 225,000 225,000 225,000 225,000 225,000 225,000 225,000
PublicSafety CIP 1,800,000 0 0 0 0 0 0 0 0 0
Police Total $20,487,315 $18,978,807 $19,354,187 $19,740,265 $20,134,070 $20,535,752 $20,945,467 $21,363,376 $21,789,644 $22,224,437
Sworn FTE 86.00 86.00 86.00 86.00 86.00 86.00 86.00 85.00 83.00 81.00
Civilian FTE 45.00 45.00 45.00 45.00 45.00 45.00 45.00 45.00 45.00 45.00
Total FundExpenditures $38,978,219 $36,104,870 $36,819,880 $37,555,267 $38,305,372 $39,070,480 $39,850,889 $40,646,907 $41,458,845 $42,287,022
Fund BalanceContribution(Draw)
($3,434,704) $112,298 $120,571 $112,992 $155,452 $127,961 $130,521 $133,132 $135,794 $138,510
Ending FundBalance $6,431,747 $6,544,045 $6,664,616 $6,777,608 $6,933,060 $7,061,021 $7,191,542 $7,324,674 $7,460,468 $7,598,978
Fund Balance% of Revenue 18.10% 18.07% 18.04% 17.99% 18.03% 18.01% 17.99% 17.96% 17.94% 17.91%
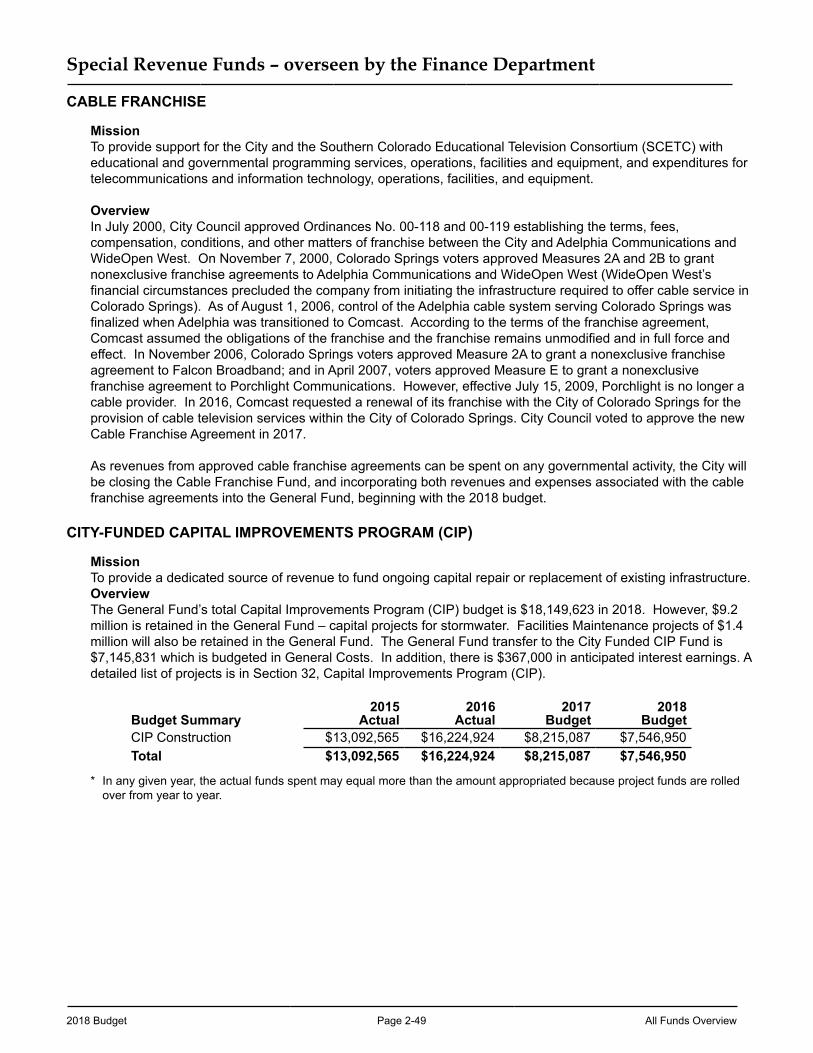
2018 Budget Page 2-49 All Funds Overview
Special Revenue Funds – overseen by the Finance Department
CABLE FRANCHISE
Mission To provide support for the City and the Southern Colorado Educational Television Consortium (SCETC) with educational and governmental programming services, operations, facilities and equipment, and expenditures for telecommunications and information technology, operations, facilities, and equipment.
Overview In July 2000, City Council approved Ordinances No. 00-118 and 00-119 establishing the terms, fees, compensation, conditions, and other matters of franchise between the City and Adelphia Communications and WideOpen West. On November 7, 2000, Colorado Springs voters approved Measures 2A and 2B to grant nonexclusive franchise agreements to Adelphia Communications and WideOpen West (WideOpen West’s financial circumstances precluded the company from initiating the infrastructure required to offer cable service in Colorado Springs). As of August 1, 2006, control of the Adelphia cable system serving Colorado Springs was finalized when Adelphia was transitioned to Comcast. According to the terms of the franchise agreement, Comcast assumed the obligations of the franchise and the franchise remains unmodified and in full force and effect. In November 2006, Colorado Springs voters approved Measure 2A to grant a nonexclusive franchise agreement to Falcon Broadband; and in April 2007, voters approved Measure E to grant a nonexclusive franchise agreement to Porchlight Communications. However, effective July 15, 2009, Porchlight is no longer a cable provider. In 2016, Comcast requested a renewal of its franchise with the City of Colorado Springs for the provision of cable television services within the City of Colorado Springs. City Council voted to approve the new Cable Franchise Agreement in 2017.
As revenues from approved cable franchise agreements can be spent on any governmental activity, the City will be closing the Cable Franchise Fund, and incorporating both revenues and expenses associated with the cable franchise agreements into the General Fund, beginning with the 2018 budget.
CITY-FUNDED CAPITAL IMPROVEMENTS PROGRAM (CIP)
MissionTo provide a dedicated source of revenue to fund ongoing capital repair or replacement of existing infrastructure.Overview The General Fund’s total Capital Improvements Program (CIP) budget is $18,149,623 in 2018. However, $9.2 million is retained in the General Fund – capital projects for stormwater. Facilities Maintenance projects of $1.4 million will also be retained in the General Fund. The General Fund transfer to the City Funded CIP Fund is $7,145,831 which is budgeted in General Costs. In addition, there is $367,000 in anticipated interest earnings. A detailed list of projects is in Section 32, Capital Improvements Program (CIP).
Budget Summary2015
Actual2016
Actual2017
Budget2018
BudgetCIP Construction $13,092,565 $16,224,924 $8,215,087 $7,546,950Total $13,092,565 $16,224,924 $8,215,087 $7,546,950
* In any given year, the actual funds spent may equal more than the amount appropriated because project funds are rolled over from year to year.
All Funds Overview Page 2-50 2018 Budget
GIFT TRUST
2017 Budget: $1,900,000 2018 Budget: $1,900,000PurposeProvide a fund for gifts received by the City during the year for specific purposes.Revenue source Donations from private individuals or businesses.Designated expenditure As designated by donor.
LODGERS AND AUTOMOBILE RENTAL TAX (LART)Total Anticipated Revenues from LART: $6,649,458
MissionTo attract visitors and enhance the economy of the City and the Pikes Peak Region. Revenue not otherwise obligated may be used for the acquisition, construction, maintenance, and operation of public infrastructure or public improvements; which constitute, in part, visitor or tourist attractions. Revenue may also be appropriated for economic development activities as determined by City Council.
Revenue OverviewRevenue resulting from the City’s 2% lodging and 1% automobile rental tax are deposited into the Lodgers and Automobile Rental Tax (LART) Fund. Uses of LART revenue is limited to tourism promotion and visitor attraction as well as for economic development activities.
LART revenue for 2018 is projected to be $6,649,458. This amount is based on a collaborative projection by the Colorado Springs Convention & Visitors Bureau (CVB) and City Finance staff.
Expenditure OverviewThe LART Fund is overseen by City Council and a City Council appointed committee called the LART Advisory Committee. The LART Advisory Committee reviews applications for funding each year for visitor attraction and economic development related events and programs. Pursuant to City Code 2.9.110, the LART Advisory Committee makes recommendations to the City concerning expenditures of the LART Fund.
See table on the following page for 2018 LART projects.
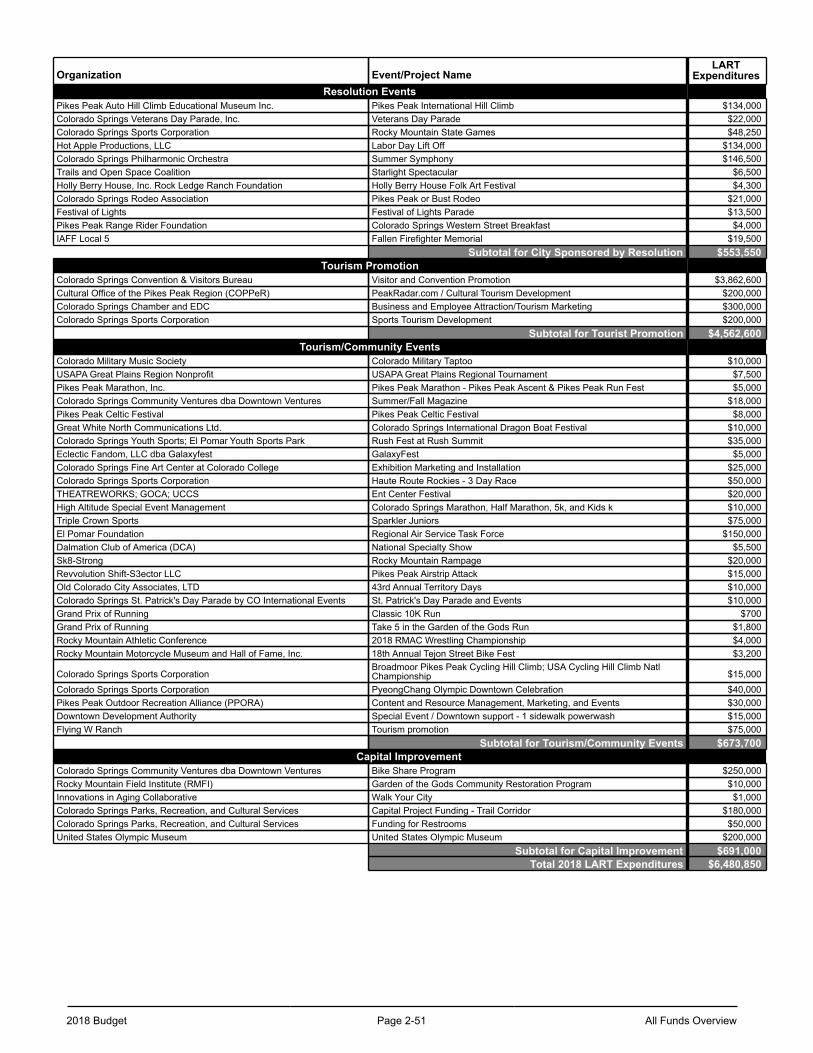
2018 Budget Page 2-51 All Funds Overview
Organization Event/Project NameLART
ExpendituresResolution Events
Pikes Peak Auto Hill Climb Educational Museum Inc. Pikes Peak International Hill Climb $134,000Colorado Springs Veterans Day Parade, Inc. Veterans Day Parade $22,000Colorado Springs Sports Corporation Rocky Mountain State Games $48,250Hot Apple Productions, LLC Labor Day Lift Off $134,000Colorado Springs Philharmonic Orchestra Summer Symphony $146,500Trails and Open Space Coalition Starlight Spectacular $6,500Holly Berry House, Inc. Rock Ledge Ranch Foundation Holly Berry House Folk Art Festival $4,300Colorado Springs Rodeo Association Pikes Peak or Bust Rodeo $21,000Festival of Lights Festival of Lights Parade $13,500Pikes Peak Range Rider Foundation Colorado Springs Western Street Breakfast $4,000IAFF Local 5 Fallen Firefighter Memorial $19,500
Subtotal for City Sponsored by Resolution $553,550Tourism Promotion
Colorado Springs Convention & Visitors Bureau Visitor and Convention Promotion $3,862,600Cultural Office of the Pikes Peak Region (COPPeR) PeakRadar.com / Cultural Tourism Development $200,000Colorado Springs Chamber and EDC Business and Employee Attraction/Tourism Marketing $300,000Colorado Springs Sports Corporation Sports Tourism Development $200,000
Subtotal for Tourist Promotion $4,562,600Tourism/Community Events
Colorado Military Music Society Colorado Military Taptoo $10,000USAPA Great Plains Region Nonprofit USAPA Great Plains Regional Tournament $7,500Pikes Peak Marathon, Inc. Pikes Peak Marathon - Pikes Peak Ascent & Pikes Peak Run Fest $5,000Colorado Springs Community Ventures dba Downtown Ventures Summer/Fall Magazine $18,000Pikes Peak Celtic Festival Pikes Peak Celtic Festival $8,000Great White North Communications Ltd. Colorado Springs International Dragon Boat Festival $10,000Colorado Springs Youth Sports; El Pomar Youth Sports Park Rush Fest at Rush Summit $35,000Eclectic Fandom, LLC dba Galaxyfest GalaxyFest $5,000Colorado Springs Fine Art Center at Colorado College Exhibition Marketing and Installation $25,000Colorado Springs Sports Corporation Haute Route Rockies - 3 Day Race $50,000THEATREWORKS; GOCA; UCCS Ent Center Festival $20,000High Altitude Special Event Management Colorado Springs Marathon, Half Marathon, 5k, and Kids k $10,000Triple Crown Sports Sparkler Juniors $75,000El Pomar Foundation Regional Air Service Task Force $150,000Dalmation Club of America (DCA) National Specialty Show $5,500Sk8-Strong Rocky Mountain Rampage $20,000Revvolution Shift-S3ector LLC Pikes Peak Airstrip Attack $15,000Old Colorado City Associates, LTD 43rd Annual Territory Days $10,000Colorado Springs St. Patrick's Day Parade by CO International Events St. Patrick's Day Parade and Events $10,000Grand Prix of Running Classic 10K Run $700Grand Prix of Running Take 5 in the Garden of the Gods Run $1,800Rocky Mountain Athletic Conference 2018 RMAC Wrestling Championship $4,000Rocky Mountain Motorcycle Museum and Hall of Fame, Inc. 18th Annual Tejon Street Bike Fest $3,200
Colorado Springs Sports CorporationBroadmoor Pikes Peak Cycling Hill Climb; USA Cycling Hill Climb NatlChampionship $15,000
Colorado Springs Sports Corporation PyeongChang Olympic Downtown Celebration $40,000Pikes Peak Outdoor Recreation Alliance (PPORA) Content and Resource Management, Marketing, and Events $30,000Downtown Development Authority Special Event / Downtown support - 1 sidewalk powerwash $15,000Flying W Ranch Tourism promotion $75,000
Subtotal for Tourism/Community Events $673,700Capital Improvement
Colorado Springs Community Ventures dba Downtown Ventures Bike Share Program $250,000Rocky Mountain Field Institute (RMFI) Garden of the Gods Community Restoration Program $10,000Innovations in Aging Collaborative Walk Your City $1,000Colorado Springs Parks, Recreation, and Cultural Services Capital Project Funding - Trail Corridor $180,000Colorado Springs Parks, Recreation, and Cultural Services Funding for Restrooms $50,000United States Olympic Museum United States Olympic Museum $200,000
Subtotal for Capital Improvement $691,000Total 2018 LART Expenditures $6,480,850
All Funds Overview Page 2-52 2018 Budget
SENIOR PROGRAMS
MissionTo provide support for the YMCA Senior Center contract and the operations of the Golf Acres Complex.
OverviewDue to significant budget reductions in 2010, the Parks, Recreation and Cultural Services Department explored alternative means to provide services to the community. In some instances, partnerships were formed. In other instances, operations were turned over to a non-profit or for-profit entity. In 2010, it was determined that the best long-term solution was to transfer ownership of the Golf Acres Complex to the Housing Authority with the understanding that senior services would continue and potentially be enhanced or expanded over time. The agreement with the Housing Authority provided that the Housing Authority would continue to operate the Golf Acres Complex conveyed for senior services consistent with the usage at the time of the agreement. In addition, the agreement provided that if the Housing Authority proposed to cease senior services operations on the Golf Acres Complex, the City had the first right to reacquire the Golf Acres Complex under the same general terms and conditions. In November 2010, City Council approved Resolution No. 208-10 authorizing the transfer of the Human Services Complex (HSC) to the Housing Authority. In January 2011, City Council approved a supplemental appropriation ordinance (Ordinance No. 11-1) for the Human Services Complex Fund in the amount of $1,200,000 and the Senior Center Fund in the amount of $800,000 to allow payment of funds associated with the transfer of the Golf Acres Complex (a.k.a. the Human Services Complex or “HSC”) and the Colorado Springs Senior Center to the Colorado Springs Housing Authority (“Housing Authority”). Actual cash transfers together were approximately $1.6 million.
In 2014, the Housing Authority notified the City that it could no longer operate the Golf Acres Complex including the Senior Center under the existing model. In October 2014, the City issued a Request for Qualifications (“RFQ”) to identify qualified firms capable of operating the Senior Center. The YMCA of the Pikes Peak Region (“YMCA”) was the only respondent to the RFQ and was determined to be highly qualified by the RFQ review team. After determining that the City could take over operations, with the assistance of the YMCA, the City agreed to exercise its first right to reacquire the property. City staff, in coordination with the Senior Center staff, Housing Authority and YMCA, held multiple meetings with stakeholders to gather public input about the Senior Center transition. In addition, City staff accepted comments on comment cards provided at the Senior Center, by email, and through many phone calls. In response to the input received, the City, Housing Authority and YMCA agreed to transfer the ownership and management of the complex on or about August 31, 2015, with a transition period between June 1 and August 31 to better ensure a seamless transition from Housing Authority ownership and management to City ownership and YMCA management. In order to accomplish that goal, the parties entered into three agreements.
1. Conveyance agreement – conveying from the Housing Authority to the City all real property at the Golf Acres Complex, all personal property related to the Senior Center and the remaining balances of the funds that were transferred to the Housing Authority in 2011.
2. Professional services agreement – between the City and the YMCA under which the YMCA served as the City’s agent during the transition period. The YMCA was responsible for evaluating the Senior Center operations, working with the City to create a transition plan, and implementing the transition plan.
3. Management agreement – under which the YMCA will operate and manage the Senior Center starting August 31, 2015.
In August 2015, City Council approved a supplemental appropriation ordinance (Ordinance No. 15-51) to adopt the 2015 budget and appropriate monies for the Senior Programs Fund to support all expenses incurred from September 1 through December 31, 2015 for the YMCA contract and operations of the Golf Acres Complex. The 2018 budget for the Senior Programs Fund is provided in the table below.
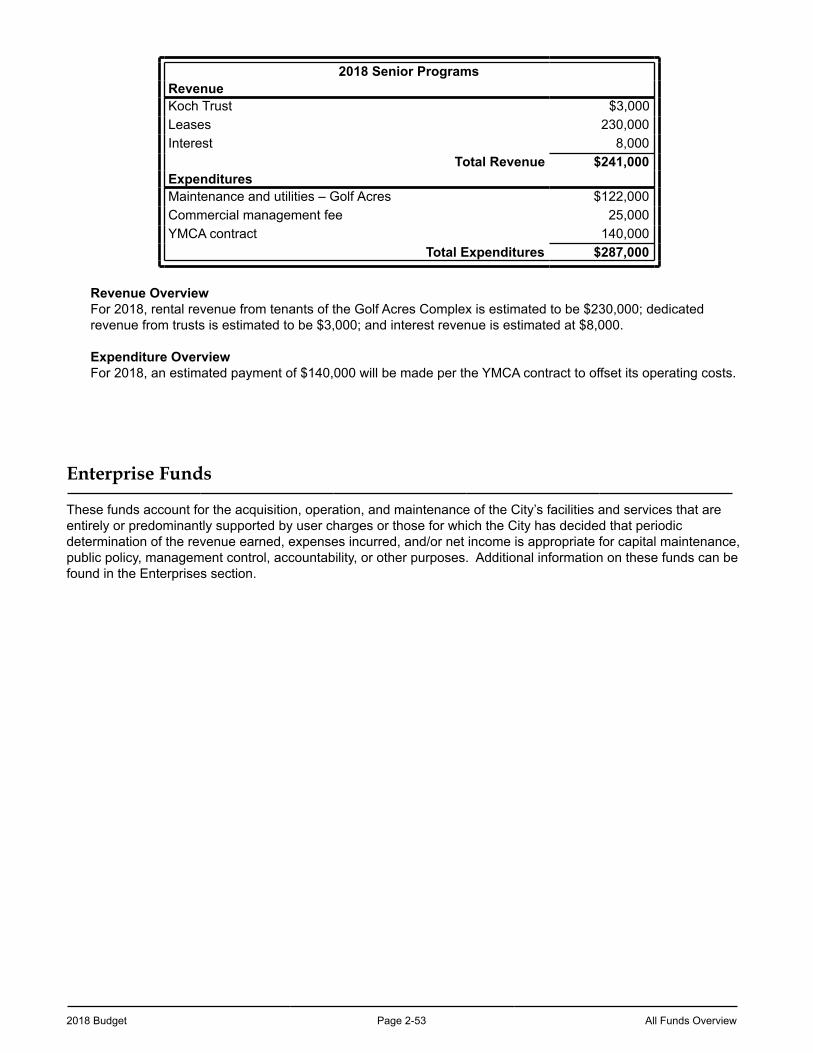
2018 Budget Page 2-53 All Funds Overview
2018 Senior ProgramsRevenueKoch Trust $3,000Leases 230,000Interest 8,000
Total Revenue $241,000ExpendituresMaintenance and utilities – Golf Acres $122,000Commercial management fee 25,000YMCA contract 140,000
Total Expenditures $287,000
Revenue OverviewFor 2018, rental revenue from tenants of the Golf Acres Complex is estimated to be $230,000; dedicated revenue from trusts is estimated to be $3,000; and interest revenue is estimated at $8,000.
Expenditure OverviewFor 2018, an estimated payment of $140,000 will be made per the YMCA contract to offset its operating costs.
Enterprise Funds
These funds account for the acquisition, operation, and maintenance of the City’s facilities and services that are entirely or predominantly supported by user charges or those for which the City has decided that periodic determination of the revenue earned, expenses incurred, and/or net income is appropriate for capital maintenance, public policy, management control, accountability, or other purposes. Additional information on these funds can be found in the Enterprises section.
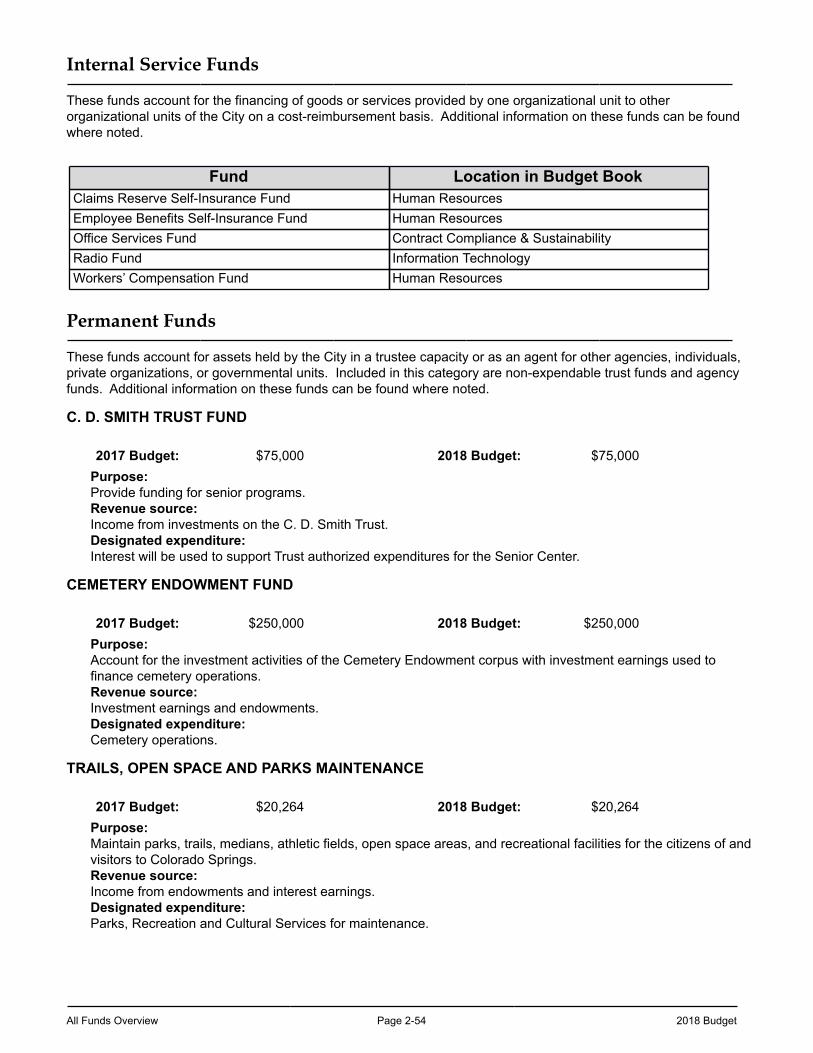
All Funds Overview Page 2-54 2018 Budget
Internal Service Funds
These funds account for the financing of goods or services provided by one organizational unit to other organizational units of the City on a cost-reimbursement basis. Additional information on these funds can be found where noted.
Fund Location in Budget BookClaims Reserve Self-Insurance Fund Human ResourcesEmployee Benefits Self-Insurance Fund Human ResourcesOffice Services Fund Contract Compliance & SustainabilityRadio Fund Information TechnologyWorkers’ Compensation Fund Human Resources
Permanent Funds
These funds account for assets held by the City in a trustee capacity or as an agent for other agencies, individuals, private organizations, or governmental units. Included in this category are non-expendable trust funds and agency funds. Additional information on these funds can be found where noted.
C. D. SMITH TRUST FUND
2017 Budget: $75,000 2018 Budget: $75,000Purpose: Provide funding for senior programs.Revenue source: Income from investments on the C. D. Smith Trust.Designated expenditure: Interest will be used to support Trust authorized expenditures for the Senior Center.
CEMETERY ENDOWMENT FUND
2017 Budget: $250,000 2018 Budget: $250,000Purpose: Account for the investment activities of the Cemetery Endowment corpus with investment earnings used to finance cemetery operations.Revenue source: Investment earnings and endowments.Designated expenditure: Cemetery operations.
TRAILS, OPEN SPACE AND PARKS MAINTENANCE
2017 Budget: $20,264 2018 Budget: $20,264Purpose: Maintain parks, trails, medians, athletic fields, open space areas, and recreational facilities for the citizens of and visitors to Colorado Springs.Revenue source: Income from endowments and interest earnings.Designated expenditure: Parks, Recreation and Cultural Services for maintenance.
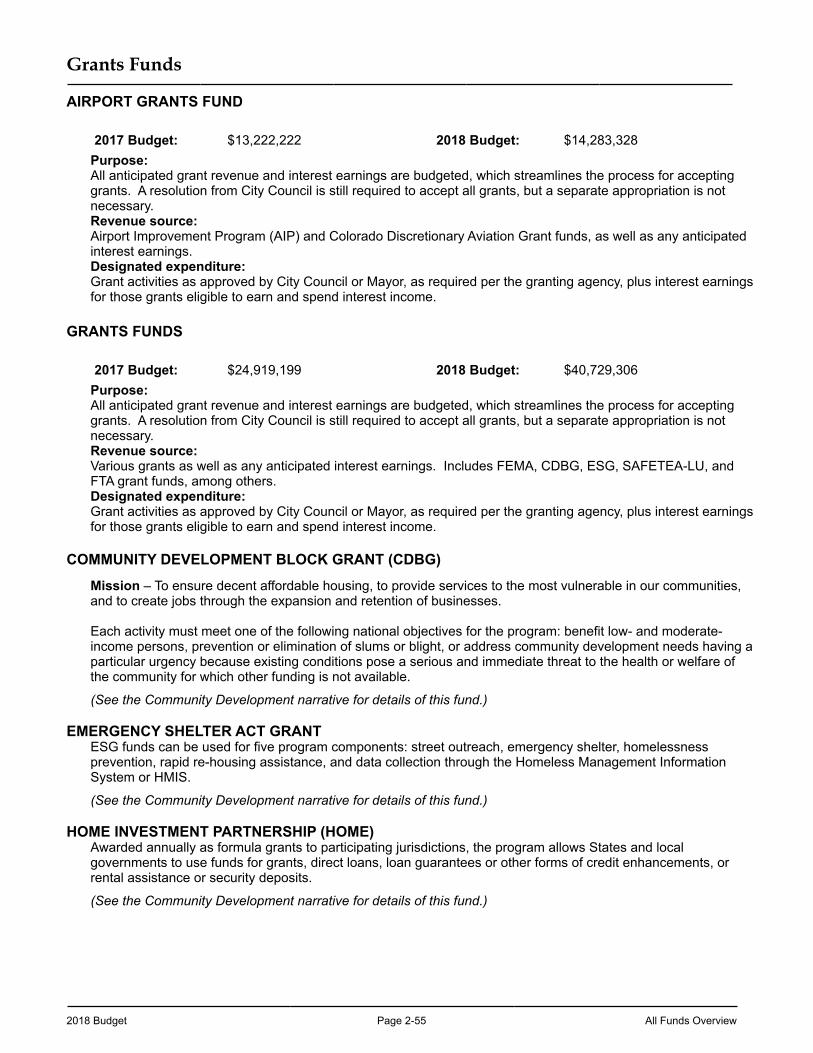
2018 Budget Page 2-55 All Funds Overview
Grants Funds
AIRPORT GRANTS FUND
2017 Budget: $13,222,222 2018 Budget: $14,283,328Purpose: All anticipated grant revenue and interest earnings are budgeted, which streamlines the process for accepting grants. A resolution from City Council is still required to accept all grants, but a separate appropriation is not necessary. Revenue source: Airport Improvement Program (AIP) and Colorado Discretionary Aviation Grant funds, as well as any anticipated interest earnings. Designated expenditure: Grant activities as approved by City Council or Mayor, as required per the granting agency, plus interest earnings for those grants eligible to earn and spend interest income.
GRANTS FUNDS
2017 Budget: $24,919,199 2018 Budget: $40,729,306Purpose: All anticipated grant revenue and interest earnings are budgeted, which streamlines the process for accepting grants. A resolution from City Council is still required to accept all grants, but a separate appropriation is not necessary. Revenue source: Various grants as well as any anticipated interest earnings. Includes FEMA, CDBG, ESG, SAFETEA-LU, and FTA grant funds, among others. Designated expenditure: Grant activities as approved by City Council or Mayor, as required per the granting agency, plus interest earnings for those grants eligible to earn and spend interest income.
COMMUNITY DEVELOPMENT BLOCK GRANT (CDBG)
Mission – To ensure decent affordable housing, to provide services to the most vulnerable in our communities, and to create jobs through the expansion and retention of businesses.
Each activity must meet one of the following national objectives for the program: benefit low- and moderate-income persons, prevention or elimination of slums or blight, or address community development needs having a particular urgency because existing conditions pose a serious and immediate threat to the health or welfare of the community for which other funding is not available.
(See the Community Development narrative for details of this fund.)
EMERGENCY SHELTER ACT GRANTESG funds can be used for five program components: street outreach, emergency shelter, homelessness prevention, rapid re-housing assistance, and data collection through the Homeless Management Information System or HMIS.
(See the Community Development narrative for details of this fund.)
HOME INVESTMENT PARTNERSHIP (HOME)Awarded annually as formula grants to participating jurisdictions, the program allows States and local governments to use funds for grants, direct loans, loan guarantees or other forms of credit enhancements, or rental assistance or security deposits.
(See the Community Development narrative for details of this fund.)

All Funds Overview Page 2-56 2018 Budget
This page left blank intentionally
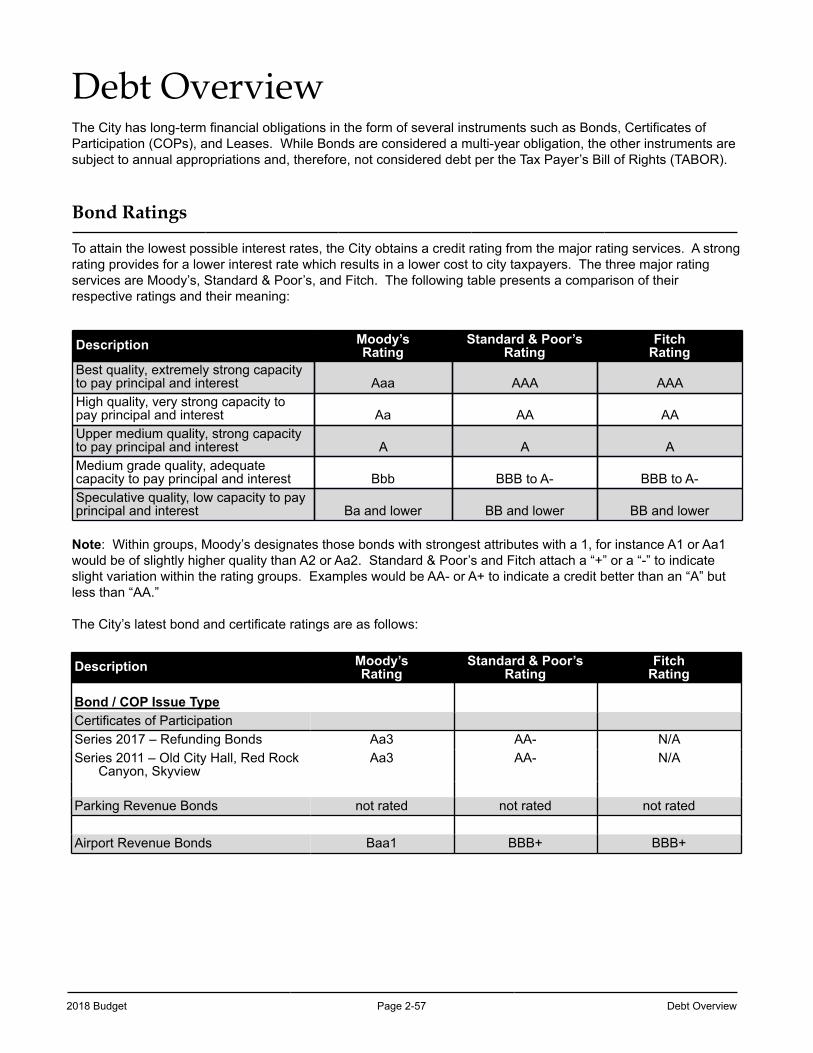
2018 Budget Page 2-57 Debt Overview
Debt OverviewThe City has long-term financial obligations in the form of several instruments such as Bonds, Certificates of Participation (COPs), and Leases. While Bonds are considered a multi-year obligation, the other instruments are subject to annual appropriations and, therefore, not considered debt per the Tax Payer’s Bill of Rights (TABOR).
Bond Ratings
To attain the lowest possible interest rates, the City obtains a credit rating from the major rating services. A strong rating provides for a lower interest rate which results in a lower cost to city taxpayers. The three major rating services are Moody’s, Standard & Poor’s, and Fitch. The following table presents a comparison of their respective ratings and their meaning:
Description Moody’sRating
Standard & Poor’sRating
FitchRating
Best quality, extremely strong capacityto pay principal and interest Aaa AAA AAAHigh quality, very strong capacity topay principal and interest Aa AA AAUpper medium quality, strong capacityto pay principal and interest A A AMedium grade quality, adequatecapacity to pay principal and interest Bbb BBB to A- BBB to A-Speculative quality, low capacity to payprincipal and interest Ba and lower BB and lower BB and lower
Note: Within groups, Moody’s designates those bonds with strongest attributes with a 1, for instance A1 or Aa1 would be of slightly higher quality than A2 or Aa2. Standard & Poor’s and Fitch attach a “+” or a “-” to indicate slight variation within the rating groups. Examples would be AA- or A+ to indicate a credit better than an “A” but less than “AA.”
The City’s latest bond and certificate ratings are as follows:
Description Moody’sRating
Standard & Poor’sRating
FitchRating
Bond / COP Issue TypeCertificates of ParticipationSeries 2017 – Refunding Bonds Aa3 AA- N/ASeries 2011 – Old City Hall, Red Rock
Canyon, SkyviewAa3 AA- N/A
Parking Revenue Bonds not rated not rated not rated
Airport Revenue Bonds Baa1 BBB+ BBB+
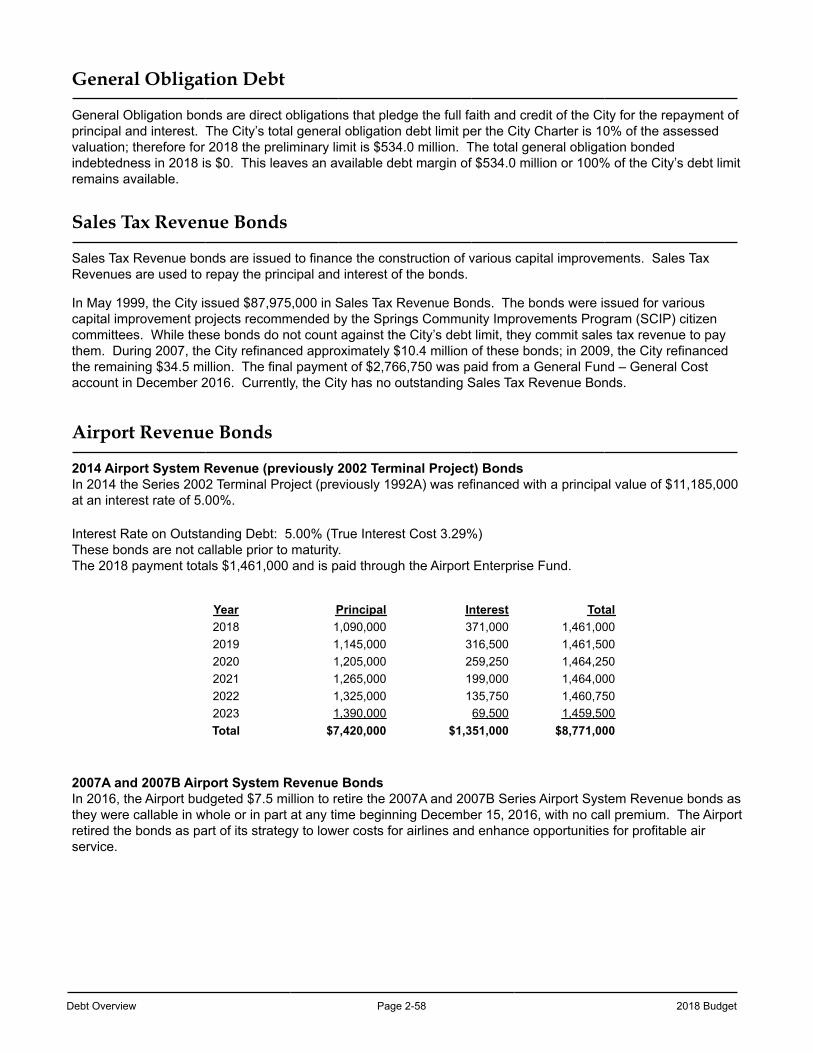
Debt Overview Page 2-58 2018 Budget
General Obligation Debt
General Obligation bonds are direct obligations that pledge the full faith and credit of the City for the repayment of principal and interest. The City’s total general obligation debt limit per the City Charter is 10% of the assessed valuation; therefore for 2018 the preliminary limit is $534.0 million. The total general obligation bonded indebtedness in 2018 is $0. This leaves an available debt margin of $534.0 million or 100% of the City’s debt limit remains available.
Sales Tax Revenue Bonds
Sales Tax Revenue bonds are issued to finance the construction of various capital improvements. Sales Tax Revenues are used to repay the principal and interest of the bonds.
In May 1999, the City issued $87,975,000 in Sales Tax Revenue Bonds. The bonds were issued for various capital improvement projects recommended by the Springs Community Improvements Program (SCIP) citizen committees. While these bonds do not count against the City’s debt limit, they commit sales tax revenue to pay them. During 2007, the City refinanced approximately $10.4 million of these bonds; in 2009, the City refinanced the remaining $34.5 million. The final payment of $2,766,750 was paid from a General Fund – General Cost account in December 2016. Currently, the City has no outstanding Sales Tax Revenue Bonds.
Airport Revenue Bonds
2014 Airport System Revenue (previously 2002 Terminal Project) BondsIn 2014 the Series 2002 Terminal Project (previously 1992A) was refinanced with a principal value of $11,185,000 at an interest rate of 5.00%.
Interest Rate on Outstanding Debt: 5.00% (True Interest Cost 3.29%)These bonds are not callable prior to maturity.The 2018 payment totals $1,461,000 and is paid through the Airport Enterprise Fund.
Year Principal Interest Total2018 1,090,000 371,000 1,461,0002019 1,145,000 316,500 1,461,5002020 1,205,000 259,250 1,464,2502021 1,265,000 199,000 1,464,0002022 1,325,000 135,750 1,460,7502023 1,390,000 69,500 1,459,500Total $7,420,000 $1,351,000 $8,771,000
2007A and 2007B Airport System Revenue BondsIn 2016, the Airport budgeted $7.5 million to retire the 2007A and 2007B Series Airport System Revenue bonds as they were callable in whole or in part at any time beginning December 15, 2016, with no call premium. The Airport retired the bonds as part of its strategy to lower costs for airlines and enhance opportunities for profitable air service.
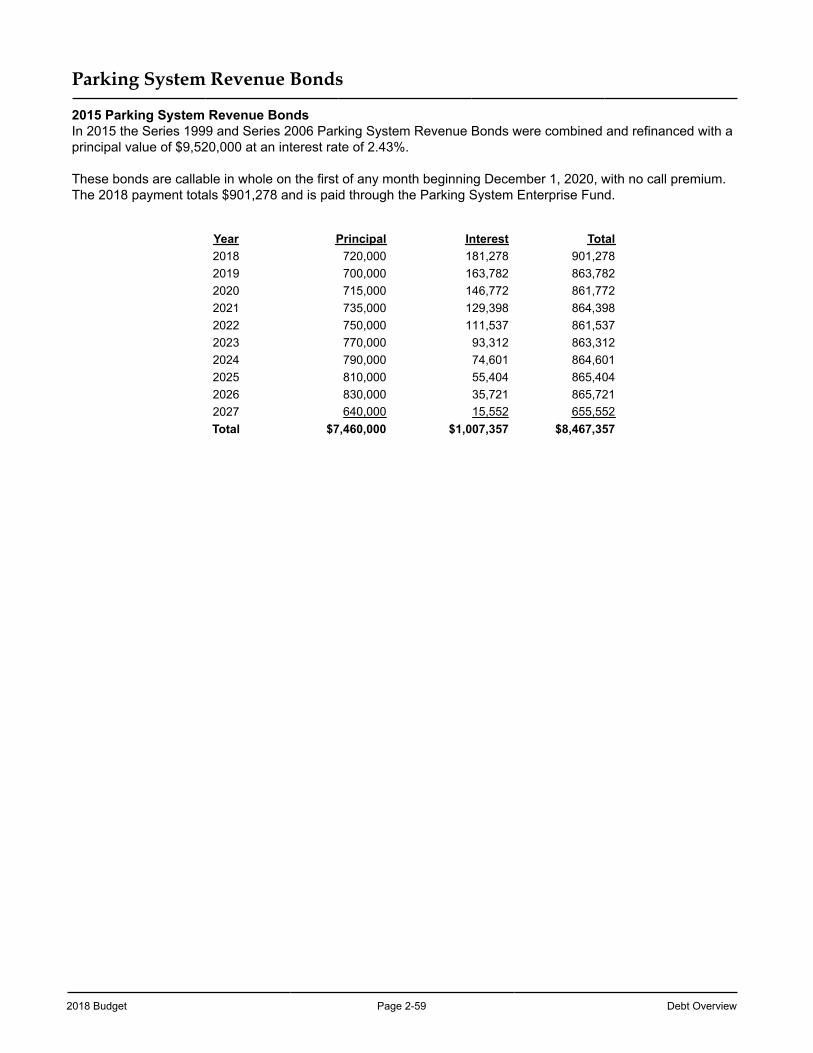
2018 Budget Page 2-59 Debt Overview
Parking System Revenue Bonds
2015 Parking System Revenue BondsIn 2015 the Series 1999 and Series 2006 Parking System Revenue Bonds were combined and refinanced with a principal value of $9,520,000 at an interest rate of 2.43%.
These bonds are callable in whole on the first of any month beginning December 1, 2020, with no call premium.The 2018 payment totals $901,278 and is paid through the Parking System Enterprise Fund.
Year Principal Interest Total2018 720,000 181,278 901,2782019 700,000 163,782 863,7822020 715,000 146,772 861,7722021 735,000 129,398 864,3982022 750,000 111,537 861,5372023 770,000 93,312 863,3122024 790,000 74,601 864,6012025 810,000 55,404 865,4042026 830,000 35,721 865,7212027 640,000 15,552 655,552Total $7,460,000 $1,007,357 $8,467,357
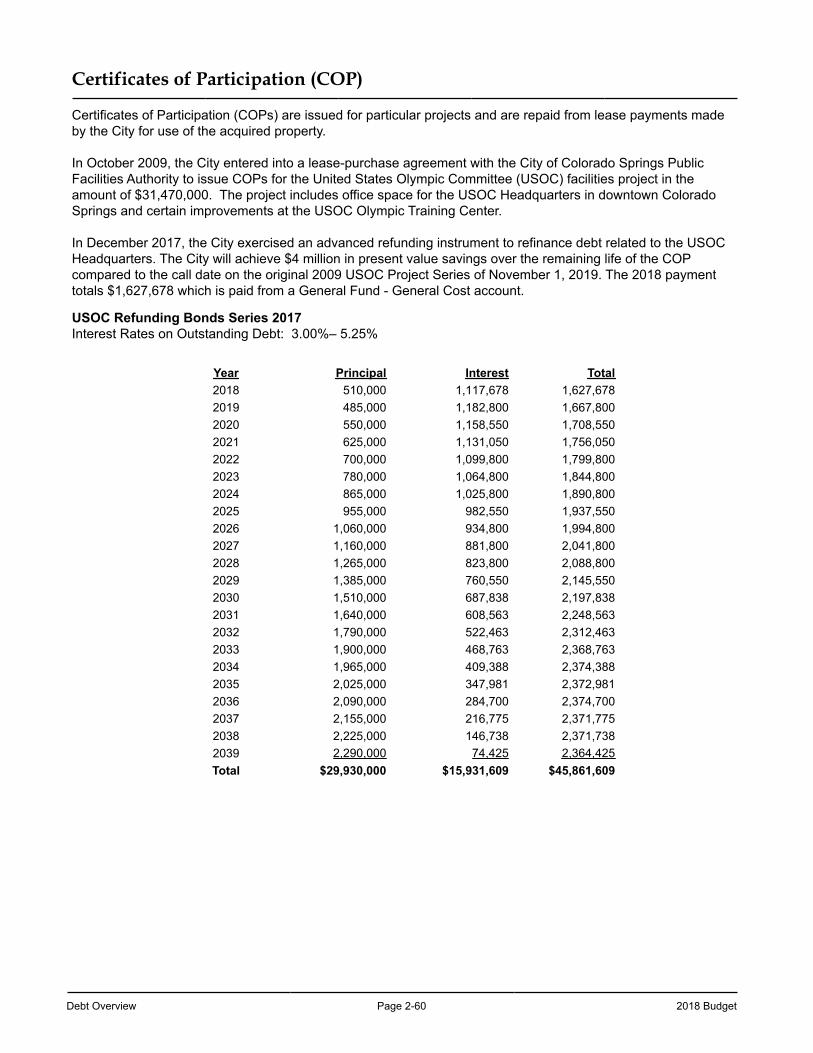
Debt Overview Page 2-60 2018 Budget
Certificates of Participation (COP)
Certificates of Participation (COPs) are issued for particular projects and are repaid from lease payments made by the City for use of the acquired property.
In October 2009, the City entered into a lease-purchase agreement with the City of Colorado Springs Public Facilities Authority to issue COPs for the United States Olympic Committee (USOC) facilities project in the amount of $31,470,000. The project includes office space for the USOC Headquarters in downtown Colorado Springs and certain improvements at the USOC Olympic Training Center.
In December 2017, the City exercised an advanced refunding instrument to refinance debt related to the USOC Headquarters. The City will achieve $4 million in present value savings over the remaining life of the COP compared to the call date on the original 2009 USOC Project Series of November 1, 2019. The 2018 payment totals $1,627,678 which is paid from a General Fund - General Cost account.
USOC Refunding Bonds Series 2017 Interest Rates on Outstanding Debt: 3.00%– 5.25%
Year Principal Interest Total2018 510,000 1,117,678 1,627,6782019 485,000 1,182,800 1,667,8002020 550,000 1,158,550 1,708,5502021 625,000 1,131,050 1,756,0502022 700,000 1,099,800 1,799,8002023 780,000 1,064,800 1,844,8002024 865,000 1,025,800 1,890,8002025 955,000 982,550 1,937,5502026 1,060,000 934,800 1,994,8002027 1,160,000 881,800 2,041,8002028 1,265,000 823,800 2,088,8002029 1,385,000 760,550 2,145,5502030 1,510,000 687,838 2,197,8382031 1,640,000 608,563 2,248,5632032 1,790,000 522,463 2,312,4632033 1,900,000 468,763 2,368,7632034 1,965,000 409,388 2,374,3882035 2,025,000 347,981 2,372,9812036 2,090,000 284,700 2,374,7002037 2,155,000 216,775 2,371,7752038 2,225,000 146,738 2,371,7382039 2,290,000 74,425 2,364,425Total $29,930,000 $15,931,609 $45,861,609
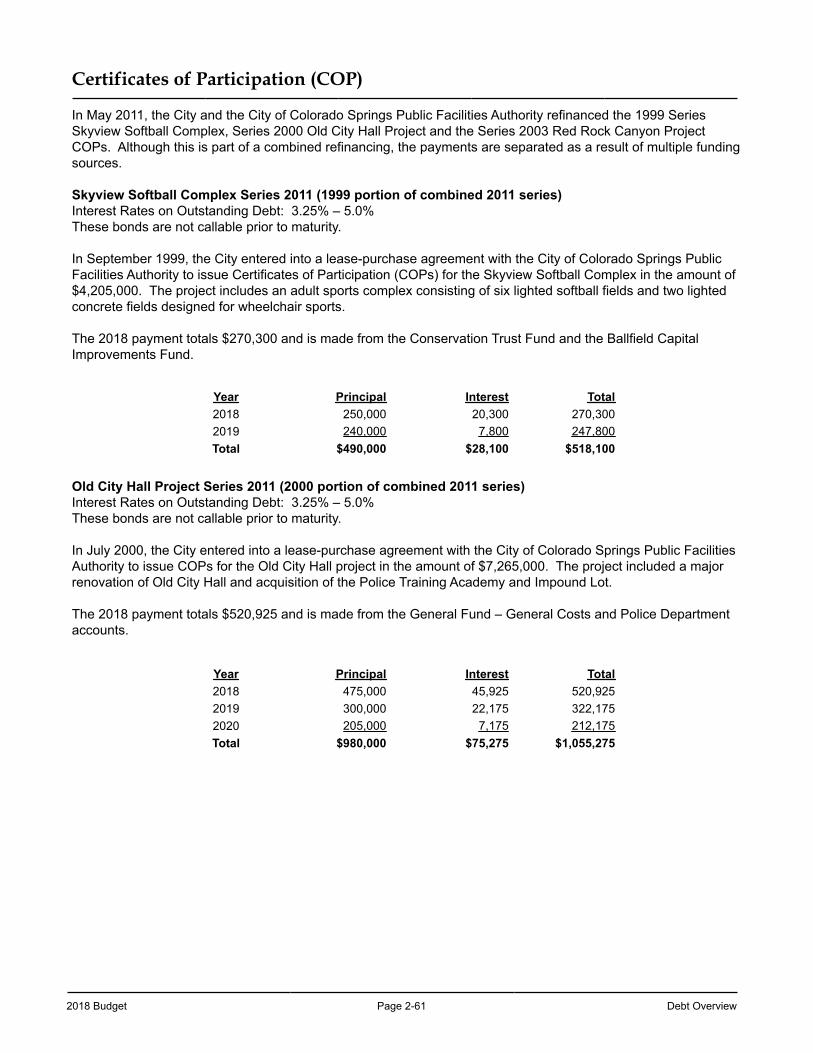
2018 Budget Page 2-61 Debt Overview
Certificates of Participation (COP)
In May 2011, the City and the City of Colorado Springs Public Facilities Authority refinanced the 1999 Series Skyview Softball Complex, Series 2000 Old City Hall Project and the Series 2003 Red Rock Canyon Project COPs. Although this is part of a combined refinancing, the payments are separated as a result of multiple funding sources.
Skyview Softball Complex Series 2011 (1999 portion of combined 2011 series) Interest Rates on Outstanding Debt: 3.25% – 5.0%These bonds are not callable prior to maturity.
In September 1999, the City entered into a lease-purchase agreement with the City of Colorado Springs Public Facilities Authority to issue Certificates of Participation (COPs) for the Skyview Softball Complex in the amount of $4,205,000. The project includes an adult sports complex consisting of six lighted softball fields and two lighted concrete fields designed for wheelchair sports.
The 2018 payment totals $270,300 and is made from the Conservation Trust Fund and the Ballfield Capital Improvements Fund.
Year Principal Interest Total2018 250,000 20,300 270,3002019 240,000 7,800 247,800Total $490,000 $28,100 $518,100
Old City Hall Project Series 2011 (2000 portion of combined 2011 series) Interest Rates on Outstanding Debt: 3.25% – 5.0%These bonds are not callable prior to maturity.
In July 2000, the City entered into a lease-purchase agreement with the City of Colorado Springs Public Facilities Authority to issue COPs for the Old City Hall project in the amount of $7,265,000. The project included a major renovation of Old City Hall and acquisition of the Police Training Academy and Impound Lot.
The 2018 payment totals $520,925 and is made from the General Fund – General Costs and Police Department accounts.
Year Principal Interest Total2018 475,000 45,925 520,9252019 300,000 22,175 322,1752020 205,000 7,175 212,175Total $980,000 $75,275 $1,055,275
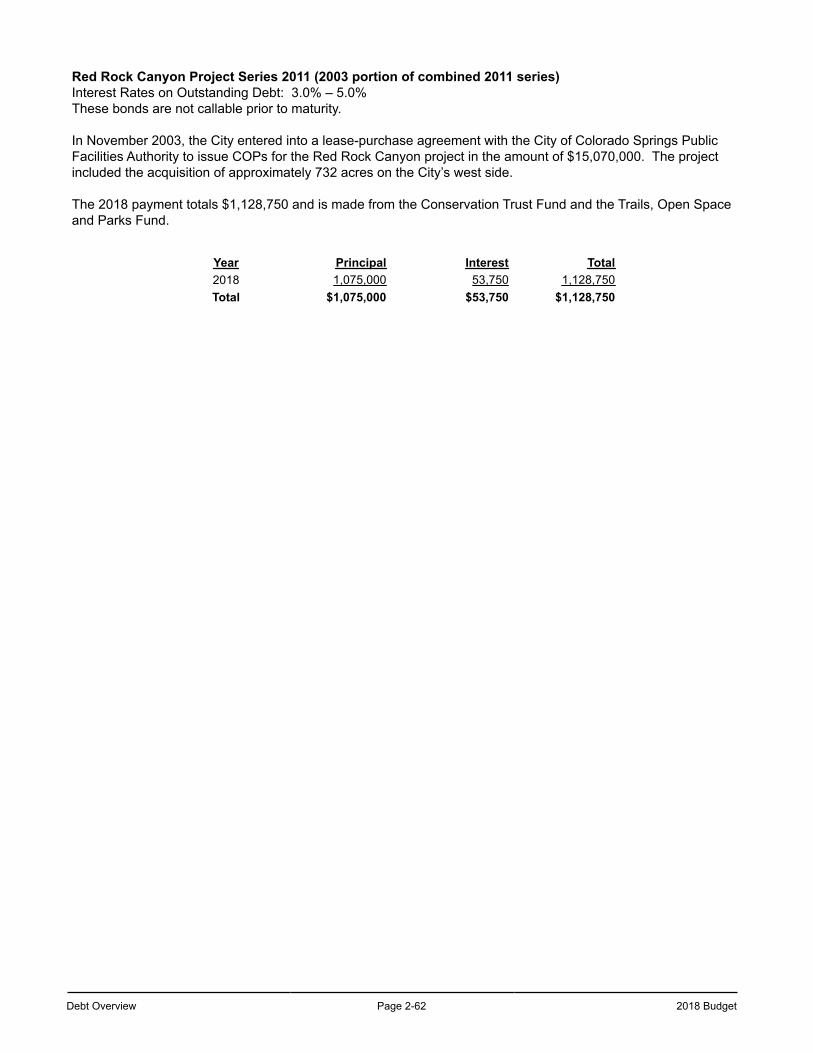
Debt Overview Page 2-62 2018 Budget
Red Rock Canyon Project Series 2011 (2003 portion of combined 2011 series) Interest Rates on Outstanding Debt: 3.0% – 5.0%These bonds are not callable prior to maturity.
In November 2003, the City entered into a lease-purchase agreement with the City of Colorado Springs Public Facilities Authority to issue COPs for the Red Rock Canyon project in the amount of $15,070,000. The project included the acquisition of approximately 732 acres on the City’s west side.
The 2018 payment totals $1,128,750 and is made from the Conservation Trust Fund and the Trails, Open Space and Parks Fund.
Year Principal Interest Total2018 1,075,000 53,750 1,128,750Total $1,075,000 $53,750 $1,128,750
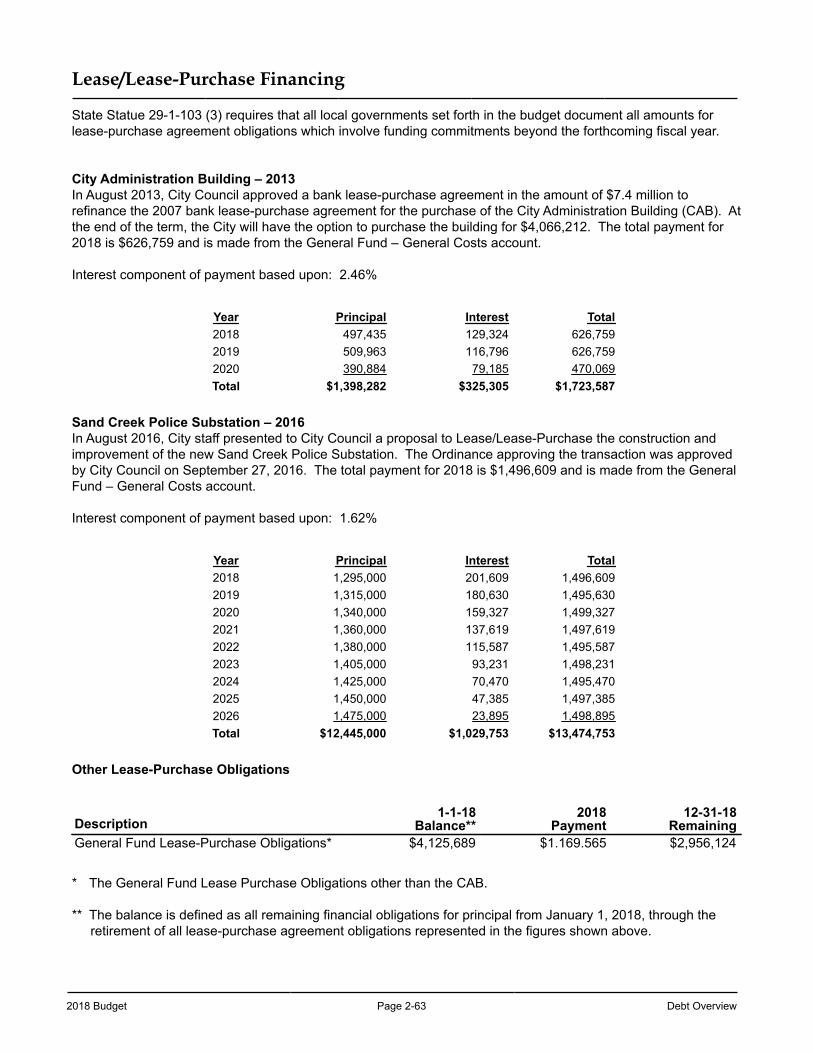
2018 Budget Page 2-63 Debt Overview
Lease/Lease-Purchase Financing
State Statue 29-1-103 (3) requires that all local governments set forth in the budget document all amounts for lease-purchase agreement obligations which involve funding commitments beyond the forthcoming fiscal year.
City Administration Building – 2013In August 2013, City Council approved a bank lease-purchase agreement in the amount of $7.4 million to refinance the 2007 bank lease-purchase agreement for the purchase of the City Administration Building (CAB). At the end of the term, the City will have the option to purchase the building for $4,066,212. The total payment for 2018 is $626,759 and is made from the General Fund – General Costs account.
Interest component of payment based upon: 2.46%
Year Principal Interest Total2018 497,435 129,324 626,7592019 509,963 116,796 626,7592020 390,884 79,185 470,069Total $1,398,282 $325,305 $1,723,587
Sand Creek Police Substation – 2016In August 2016, City staff presented to City Council a proposal to Lease/Lease-Purchase the construction and improvement of the new Sand Creek Police Substation. The Ordinance approving the transaction was approved by City Council on September 27, 2016. The total payment for 2018 is $1,496,609 and is made from the General Fund – General Costs account.
Interest component of payment based upon: 1.62%
Year Principal Interest Total2018 1,295,000 201,609 1,496,6092019 1,315,000 180,630 1,495,6302020 1,340,000 159,327 1,499,3272021 1,360,000 137,619 1,497,6192022 1,380,000 115,587 1,495,5872023 1,405,000 93,231 1,498,2312024 1,425,000 70,470 1,495,4702025 1,450,000 47,385 1,497,3852026 1,475,000 23,895 1,498,895Total $12,445,000 $1,029,753 $13,474,753
Other Lease-Purchase Obligations
Description1-1-18
Balance**2018
Payment12-31-18
RemainingGeneral Fund Lease-Purchase Obligations* $4,125,689 $1.169.565 $2,956,124
* The General Fund Lease Purchase Obligations other than the CAB.
** The balance is defined as all remaining financial obligations for principal from January 1, 2018, through the retirement of all lease-purchase agreement obligations represented in the figures shown above.

Debt Overview Page 2-64 2018 Budget
This page left blank intentionally.
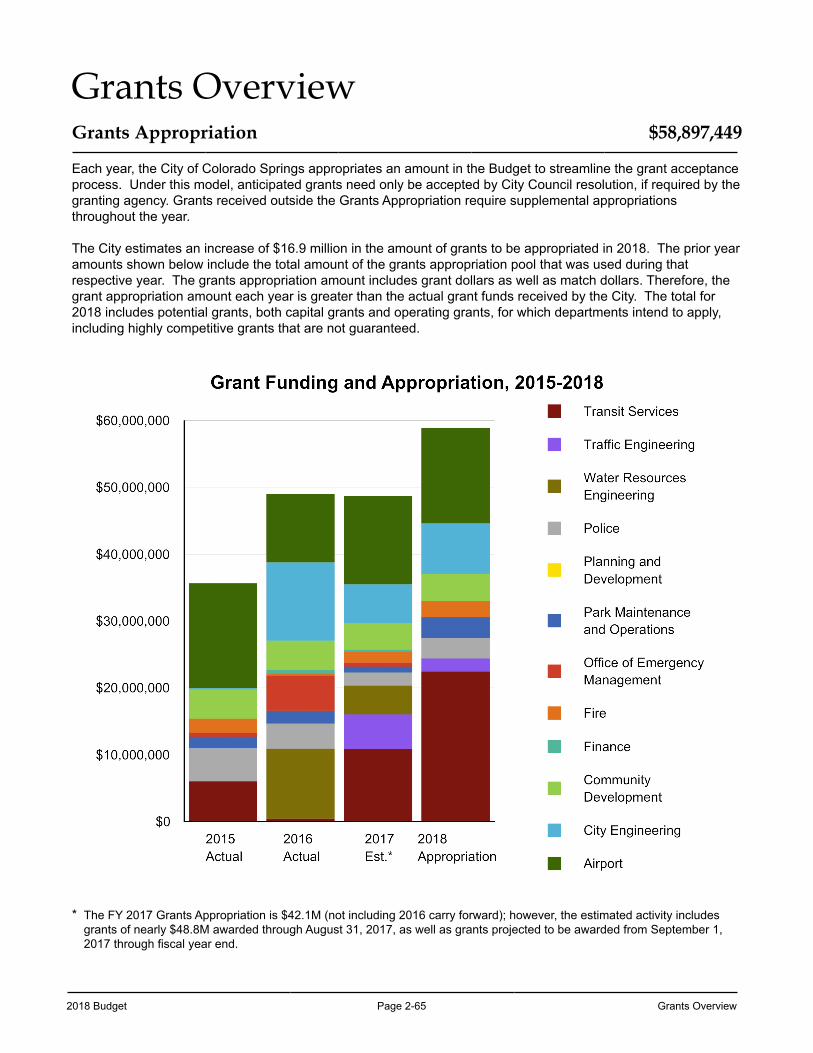
2018 Budget Page 2-65 Grants Overview
Grants OverviewGrants Appropriation $58,897,449
Each year, the City of Colorado Springs appropriates an amount in the Budget to streamline the grant acceptance process. Under this model, anticipated grants need only be accepted by City Council resolution, if required by the granting agency. Grants received outside the Grants Appropriation require supplemental appropriations throughout the year.
The City estimates an increase of $16.9 million in the amount of grants to be appropriated in 2018. The prior year amounts shown below include the total amount of the grants appropriation pool that was used during that respective year. The grants appropriation amount includes grant dollars as well as match dollars. Therefore, the grant appropriation amount each year is greater than the actual grant funds received by the City. The total for 2018 includes potential grants, both capital grants and operating grants, for which departments intend to apply, including highly competitive grants that are not guaranteed.
* The FY 2017 Grants Appropriation is $42.1M (not including 2016 carry forward); however, the estimated activity includes grants of nearly $48.8M awarded through August 31, 2017, as well as grants projected to be awarded from September 1, 2017 through fiscal year end.
Grants Overview Page 2-66 2018 Budget
Grants Appropriation ** 2017 2018 VarianceCapital Improvement Grants $27,970,087 $35,512,234 $7,542,147Operating Grants 14,069,646 23,385,215 9,315,569Total Grants Appropriation $42,039,733 $58,897,449 $16,857,716
** The Grants Appropriation includes the anticipated federal/state/private grant funding, and local grant match.
Grant Administration
Funds from federal, state and private sources are important resources that need to be included in the City's financial plan. The City is committed to a citywide coordination of grant activities among agencies and to determine the immediate and longer-term financial consequences of accepting funding. The City evaluates grant applications and awards to determine whether proposals are consistent with city priorities, ensures that proposals are coordinated with the City's existing programs, ensures that administrative, reporting and evaluation requirements are adequately addressed, assesses the need for a cash match, and evaluates the immediate and long-term financial consequences of the application. Agencies receiving the spending authority are responsible for complying with grant restrictions, applicability, and reporting. All grant funds will be expended for the purposes for which they were granted and in the time period for which they were granted.
Types of Grants
Grants facilitate capital investment and operational capacity that would otherwise be impossible for the City to accomplish due to financial constraints. Grant funding supports local capital improvement projects, local government operations, and disaster recovery efforts—these funds are designated specifically to projects and improvements in line with the intent of the grantor. Grant funding, therefore, is temporary assistance to accomplish policy or infrastructure goals on behalf of the grantor.
Capital Improvement grants fund projects involving infrastructure improvement projects, purchases of equipment or property, and renovation of City facilities creating a fixed asset and having a long life. Capital Improvement Grants are discussed in the Capital Improvement Section, starting on page 32-1.
Operating grants fund programs undertaken by the City to provide services such as transit services, DUI enforcement checkpoints, Office of Emergency Management efforts, and community development programs. Grant funding awarded for operations is listed in each relevant department narrative of the Budget document.
Matching Funds
Certain grants require matching funds as the recipient’s demonstration of financial commitment to the grant-funded project. Matching funds can be contributed by the General Fund and other City funds through the Budget process, or by in-kind third party contributions.
Matching funds leverage City dollars to accomplish projects that otherwise could not be undertaken due to lack of financial resources. The return on the City’s investment varies depending on the structure of the grant. Grantors may require differing levels of matching funds, some of which are required by federal, state, or other grantor statute. When possible, matching funds are sought from other entities.
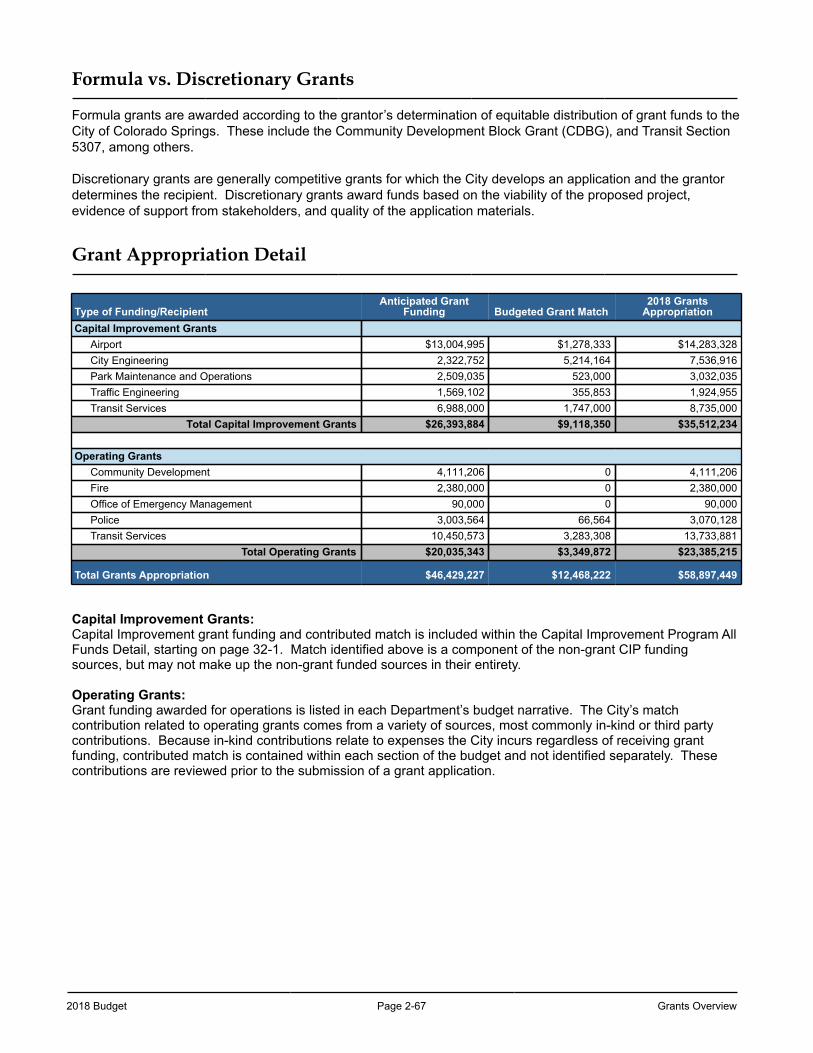
2018 Budget Page 2-67 Grants Overview
Formula vs. Discretionary Grants
Formula grants are awarded according to the grantor’s determination of equitable distribution of grant funds to the City of Colorado Springs. These include the Community Development Block Grant (CDBG), and Transit Section 5307, among others.
Discretionary grants are generally competitive grants for which the City develops an application and the grantor determines the recipient. Discretionary grants award funds based on the viability of the proposed project, evidence of support from stakeholders, and quality of the application materials.
Grant Appropriation Detail
Type of Funding/RecipientAnticipated Grant
Funding Budgeted Grant Match2018 Grants
AppropriationCapital Improvement Grants
Airport $13,004,995 $1,278,333 $14,283,328City Engineering 2,322,752 5,214,164 7,536,916Park Maintenance and Operations 2,509,035 523,000 3,032,035Traffic Engineering 1,569,102 355,853 1,924,955Transit Services 6,988,000 1,747,000 8,735,000
Total Capital Improvement Grants $26,393,884 $9,118,350 $35,512,234
Operating GrantsCommunity Development 4,111,206 0 4,111,206Fire 2,380,000 0 2,380,000Office of Emergency Management 90,000 0 90,000Police 3,003,564 66,564 3,070,128Transit Services 10,450,573 3,283,308 13,733,881
Total Operating Grants $20,035,343 $3,349,872 $23,385,215
Total Grants Appropriation $46,429,227 $12,468,222 $58,897,449
Capital Improvement Grants: Capital Improvement grant funding and contributed match is included within the Capital Improvement Program All Funds Detail, starting on page 32-1. Match identified above is a component of the non-grant CIP funding sources, but may not make up the non-grant funded sources in their entirety.
Operating Grants:Grant funding awarded for operations is listed in each Department’s budget narrative. The City’s match contribution related to operating grants comes from a variety of sources, most commonly in-kind or third party contributions. Because in-kind contributions relate to expenses the City incurs regardless of receiving grant funding, contributed match is contained within each section of the budget and not identified separately. These contributions are reviewed prior to the submission of a grant application.

Grants Overview Page 2-68 2018 Budget
This page left blank intentionally.
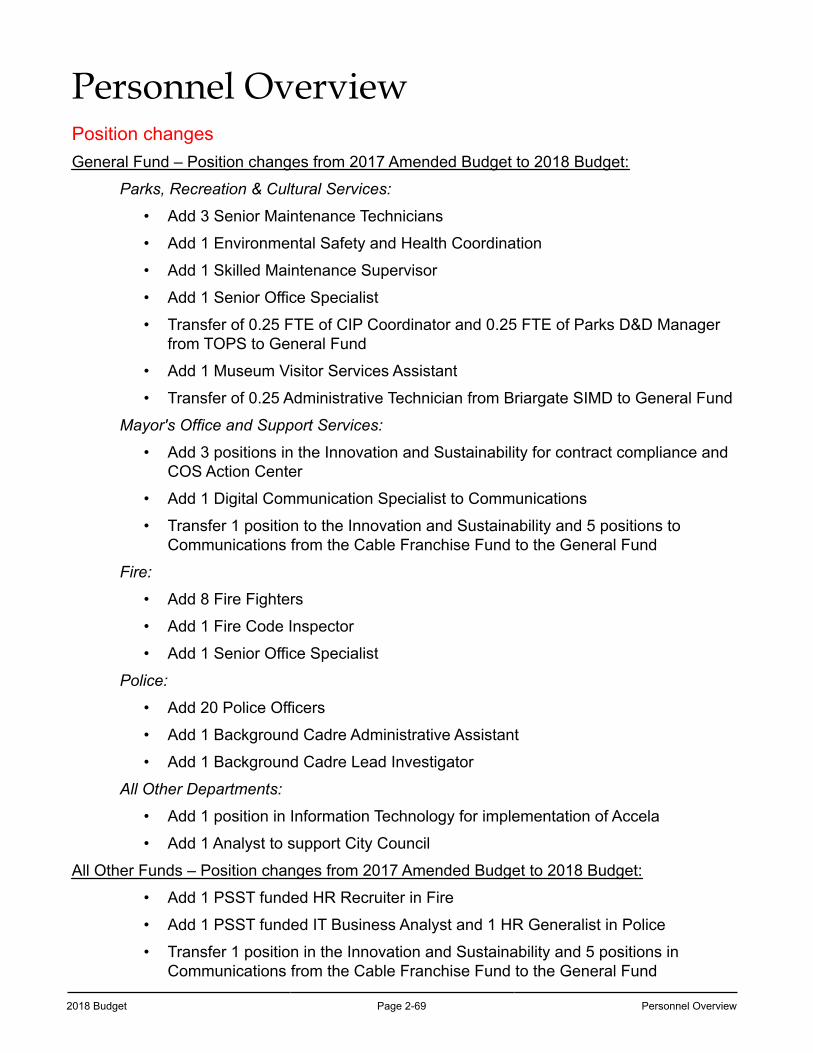
2018 Budget Page 2-69 Personnel Overview
Personnel OverviewPosition changesGeneral Fund – Position changes from 2017 Amended Budget to 2018 Budget:
Parks, Recreation & Cultural Services:
• Add 3 Senior Maintenance Technicians
• Add 1 Environmental Safety and Health Coordination
• Add 1 Skilled Maintenance Supervisor
• Add 1 Senior Office Specialist
• Transfer of 0.25 FTE of CIP Coordinator and 0.25 FTE of Parks D&D Manager from TOPS to General Fund
• Add 1 Museum Visitor Services Assistant
• Transfer of 0.25 Administrative Technician from Briargate SIMD to General Fund
Mayor's Office and Support Services:
• Add 3 positions in the Innovation and Sustainability for contract compliance and COS Action Center
• Add 1 Digital Communication Specialist to Communications
• Transfer 1 position to the Innovation and Sustainability and 5 positions to Communications from the Cable Franchise Fund to the General Fund
Fire:
• Add 8 Fire Fighters
• Add 1 Fire Code Inspector
• Add 1 Senior Office Specialist
Police:
• Add 20 Police Officers
• Add 1 Background Cadre Administrative Assistant
• Add 1 Background Cadre Lead Investigator
All Other Departments:
• Add 1 position in Information Technology for implementation of Accela
• Add 1 Analyst to support City Council
All Other Funds – Position changes from 2017 Amended Budget to 2018 Budget:
• Add 1 PSST funded HR Recruiter in Fire
• Add 1 PSST funded IT Business Analyst and 1 HR Generalist in Police
• Transfer 1 position in the Innovation and Sustainability and 5 positions in Communications from the Cable Franchise Fund to the General Fund
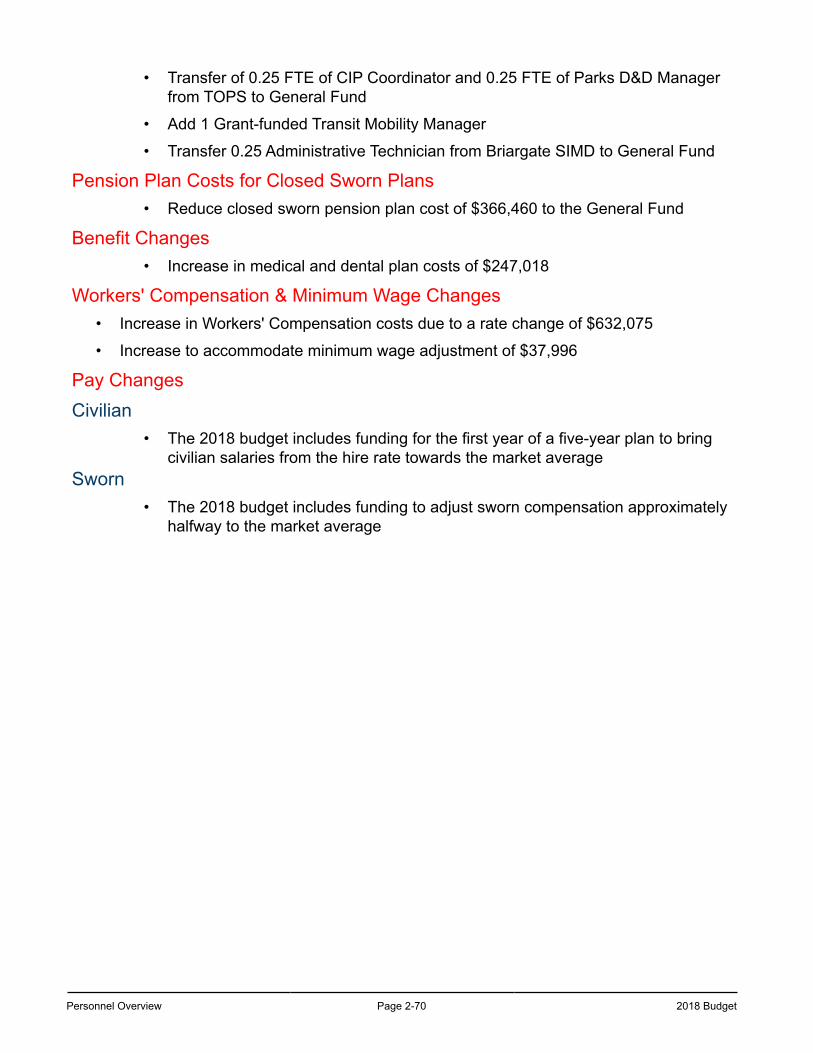
Personnel Overview Page 2-70 2018 Budget
• Transfer of 0.25 FTE of CIP Coordinator and 0.25 FTE of Parks D&D Manager from TOPS to General Fund
• Add 1 Grant-funded Transit Mobility Manager
• Transfer 0.25 Administrative Technician from Briargate SIMD to General Fund
Pension Plan Costs for Closed Sworn Plans• Reduce closed sworn pension plan cost of $366,460 to the General Fund
Benefit Changes• Increase in medical and dental plan costs of $247,018
Workers' Compensation & Minimum Wage Changes• Increase in Workers' Compensation costs due to a rate change of $632,075
• Increase to accommodate minimum wage adjustment of $37,996
Pay ChangesCivilian
• The 2018 budget includes funding for the first year of a five-year plan to bring civilian salaries from the hire rate towards the market average
Sworn• The 2018 budget includes funding to adjust sworn compensation approximately
halfway to the market average
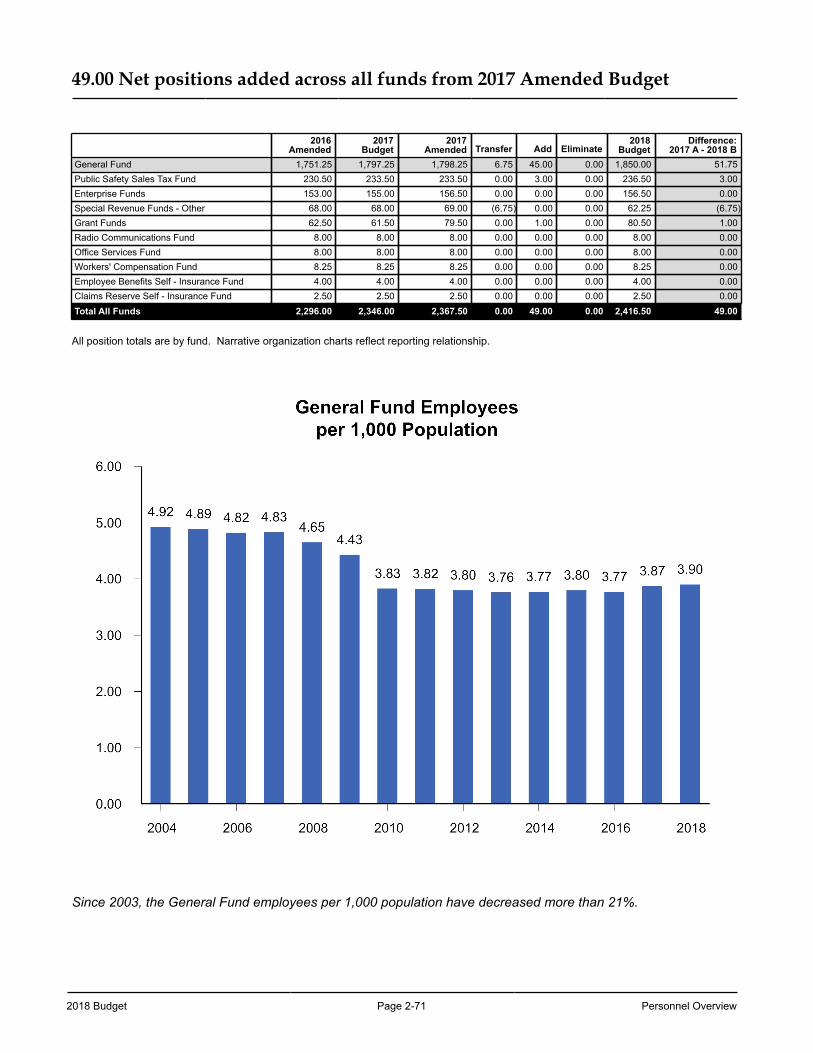
2018 Budget Page 2-71 Personnel Overview
49.00 Net positions added across all funds from 2017 Amended Budget
2016Amended
2017Budget
2017Amended Transfer Add Eliminate
2018Budget
Difference:2017 A - 2018 B
General Fund 1,751.25 1,797.25 1,798.25 6.75 45.00 0.00 1,850.00 51.75Public Safety Sales Tax Fund 230.50 233.50 233.50 0.00 3.00 0.00 236.50 3.00Enterprise Funds 153.00 155.00 156.50 0.00 0.00 0.00 156.50 0.00Special Revenue Funds - Other 68.00 68.00 69.00 (6.75) 0.00 0.00 62.25 (6.75)Grant Funds 62.50 61.50 79.50 0.00 1.00 0.00 80.50 1.00Radio Communications Fund 8.00 8.00 8.00 0.00 0.00 0.00 8.00 0.00Office Services Fund 8.00 8.00 8.00 0.00 0.00 0.00 8.00 0.00Workers' Compensation Fund 8.25 8.25 8.25 0.00 0.00 0.00 8.25 0.00Employee Benefits Self - Insurance Fund 4.00 4.00 4.00 0.00 0.00 0.00 4.00 0.00Claims Reserve Self - Insurance Fund 2.50 2.50 2.50 0.00 0.00 0.00 2.50 0.00Total All Funds 2,296.00 2,346.00 2,367.50 0.00 49.00 0.00 2,416.50 49.00
All position totals are by fund. Narrative organization charts reflect reporting relationship.
Since 2003, the General Fund employees per 1,000 population have decreased more than 21%.
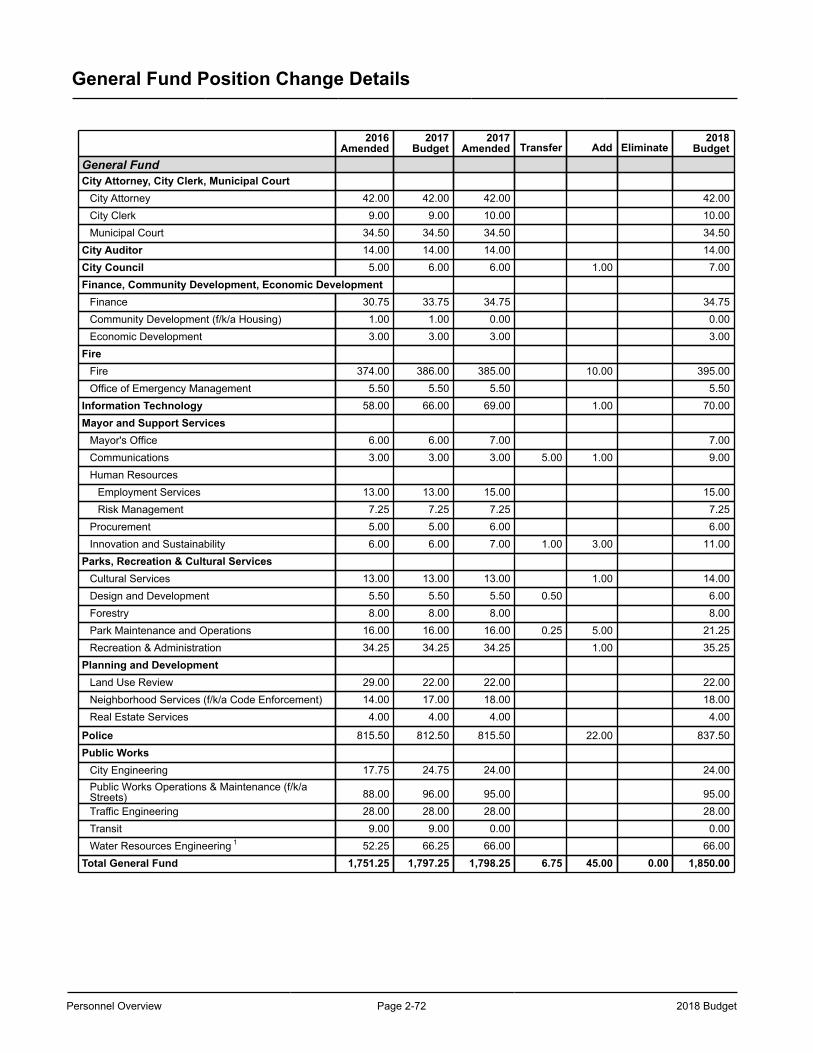
Personnel Overview Page 2-72 2018 Budget
General Fund Position Change Details
2016Amended
2017Budget
2017Amended Transfer Add Eliminate
2018Budget
General FundCity Attorney, City Clerk, Municipal Court
City Attorney 42.00 42.00 42.00 42.00City Clerk 9.00 9.00 10.00 10.00Municipal Court 34.50 34.50 34.50 34.50
City Auditor 14.00 14.00 14.00 14.00City Council 5.00 6.00 6.00 1.00 7.00Finance, Community Development, Economic Development
Finance 30.75 33.75 34.75 34.75Community Development (f/k/a Housing) 1.00 1.00 0.00 0.00Economic Development 3.00 3.00 3.00 3.00
FireFire 374.00 386.00 385.00 10.00 395.00Office of Emergency Management 5.50 5.50 5.50 5.50
Information Technology 58.00 66.00 69.00 1.00 70.00Mayor and Support Services
Mayor's Office 6.00 6.00 7.00 7.00Communications 3.00 3.00 3.00 5.00 1.00 9.00Human Resources
Employment Services 13.00 13.00 15.00 15.00Risk Management 7.25 7.25 7.25 7.25
Procurement 5.00 5.00 6.00 6.00Innovation and Sustainability 6.00 6.00 7.00 1.00 3.00 11.00
Parks, Recreation & Cultural ServicesCultural Services 13.00 13.00 13.00 1.00 14.00Design and Development 5.50 5.50 5.50 0.50 6.00Forestry 8.00 8.00 8.00 8.00Park Maintenance and Operations 16.00 16.00 16.00 0.25 5.00 21.25Recreation & Administration 34.25 34.25 34.25 1.00 35.25
Planning and DevelopmentLand Use Review 29.00 22.00 22.00 22.00Neighborhood Services (f/k/a Code Enforcement) 14.00 17.00 18.00 18.00Real Estate Services 4.00 4.00 4.00 4.00
Police 815.50 812.50 815.50 22.00 837.50Public Works
City Engineering 17.75 24.75 24.00 24.00Public Works Operations & Maintenance (f/k/aStreets) 88.00 96.00 95.00 95.00Traffic Engineering 28.00 28.00 28.00 28.00Transit 9.00 9.00 0.00 0.00Water Resources Engineering 1 52.25 66.25 66.00 66.00
Total General Fund 1,751.25 1,797.25 1,798.25 6.75 45.00 0.00 1,850.00
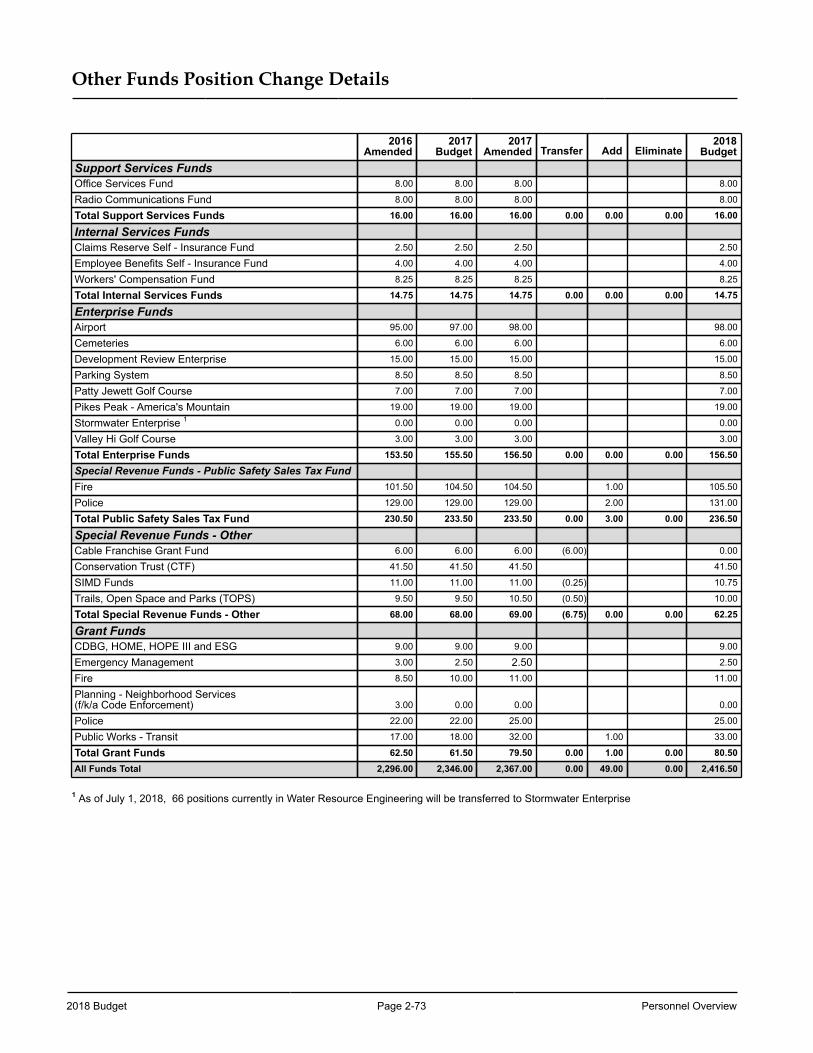
2018 Budget Page 2-73 Personnel Overview
Other Funds Position Change Details
2016Amended
2017Budget
2017Amended Transfer Add Eliminate
2018Budget
Support Services FundsOffice Services Fund 8.00 8.00 8.00 8.00
Radio Communications Fund 8.00 8.00 8.00 8.00
Total Support Services Funds 16.00 16.00 16.00 0.00 0.00 0.00 16.00
Internal Services FundsClaims Reserve Self - Insurance Fund 2.50 2.50 2.50 2.50
Employee Benefits Self - Insurance Fund 4.00 4.00 4.00 4.00
Workers' Compensation Fund 8.25 8.25 8.25 8.25
Total Internal Services Funds 14.75 14.75 14.75 0.00 0.00 0.00 14.75
Enterprise FundsAirport 95.00 97.00 98.00 98.00
Cemeteries 6.00 6.00 6.00 6.00
Development Review Enterprise 15.00 15.00 15.00 15.00
Parking System 8.50 8.50 8.50 8.50
Patty Jewett Golf Course 7.00 7.00 7.00 7.00
Pikes Peak - America's Mountain 19.00 19.00 19.00 19.00
Stormwater Enterprise 1 0.00 0.00 0.00 0.00
Valley Hi Golf Course 3.00 3.00 3.00 3.00
Total Enterprise Funds 153.50 155.50 156.50 0.00 0.00 0.00 156.50
Special Revenue Funds - Public Safety Sales Tax FundFire 101.50 104.50 104.50 1.00 105.50
Police 129.00 129.00 129.00 2.00 131.00
Total Public Safety Sales Tax Fund 230.50 233.50 233.50 0.00 3.00 0.00 236.50
Special Revenue Funds - OtherCable Franchise Grant Fund 6.00 6.00 6.00 (6.00) 0.00
Conservation Trust (CTF) 41.50 41.50 41.50 41.50
SIMD Funds 11.00 11.00 11.00 (0.25) 10.75
Trails, Open Space and Parks (TOPS) 9.50 9.50 10.50 (0.50) 10.00
Total Special Revenue Funds - Other 68.00 68.00 69.00 (6.75) 0.00 0.00 62.25
Grant FundsCDBG, HOME, HOPE III and ESG 9.00 9.00 9.00 9.00
Emergency Management 3.00 2.50 2.50 2.50
Fire 8.50 10.00 11.00 11.00
Planning - Neighborhood Services(f/k/a Code Enforcement) 3.00 0.00 0.00 0.00
Police 22.00 22.00 25.00 25.00
Public Works - Transit 17.00 18.00 32.00 1.00 33.00
Total Grant Funds 62.50 61.50 79.50 0.00 1.00 0.00 80.50All Funds Total 2,296.00 2,346.00 2,367.00 0.00 49.00 0.00 2,416.50
1 As of July 1, 2018, 66 positions currently in Water Resource Engineering will be transferred to Stormwater Enterprise

Personnel Overview Page 2-74 2018 Budget
This page left blank intentionally.
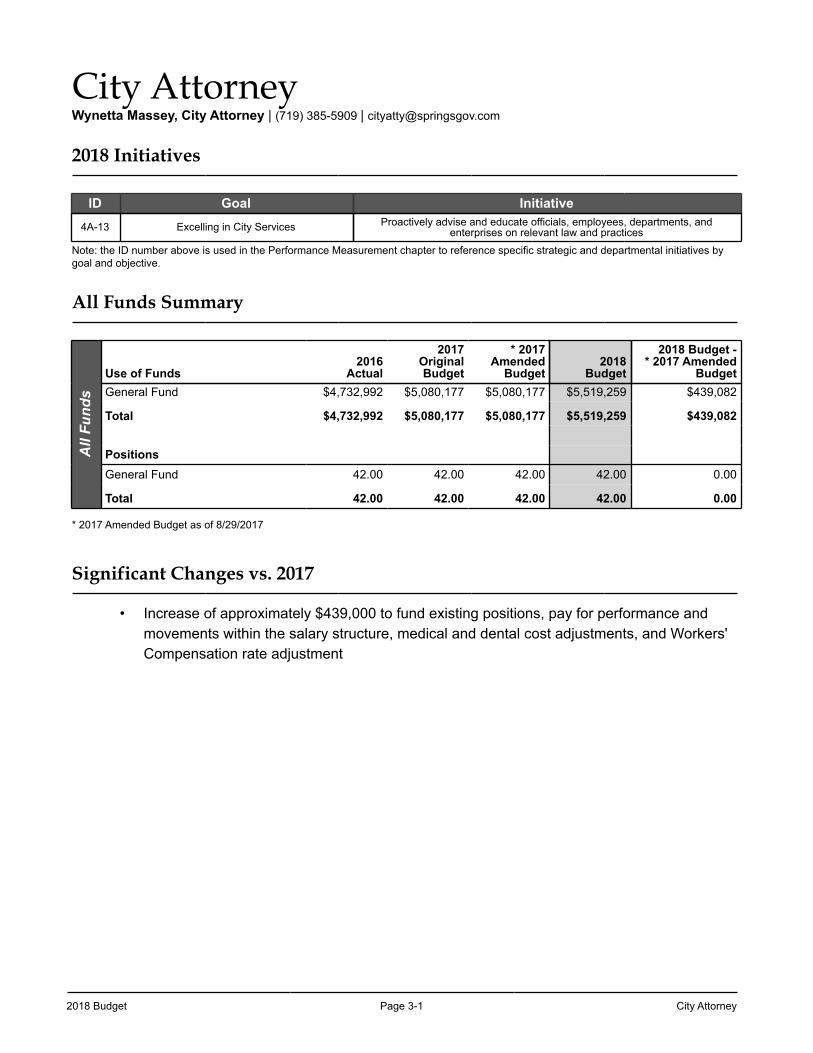
2018 Budget Page 3-1 City Attorney
City AttorneyWynetta Massey, City Attorney | (719) 385-5909 | [email protected]
2018 Initiatives
ID Goal Initiative4A-13 Excelling in City Services Proactively advise and educate officials, employees, departments, and
enterprises on relevant law and practices
Note: the ID number above is used in the Performance Measurement chapter to reference specific strategic and departmental initiatives by goal and objective.
All Funds Summary
All
Fund
s
Use of Funds2016
Actual
2017OriginalBudget
* 2017Amended
Budget2018
Budget
2018 Budget -* 2017 Amended
BudgetGeneral Fund $4,732,992 $5,080,177 $5,080,177 $5,519,259 $439,082
Total $4,732,992 $5,080,177 $5,080,177 $5,519,259 $439,082
PositionsGeneral Fund 42.00 42.00 42.00 42.00 0.00
Total 42.00 42.00 42.00 42.00 0.00
* 2017 Amended Budget as of 8/29/2017
Significant Changes vs. 2017
• Increase of approximately $439,000 to fund existing positions, pay for performance and movements within the salary structure, medical and dental cost adjustments, and Workers' Compensation rate adjustment
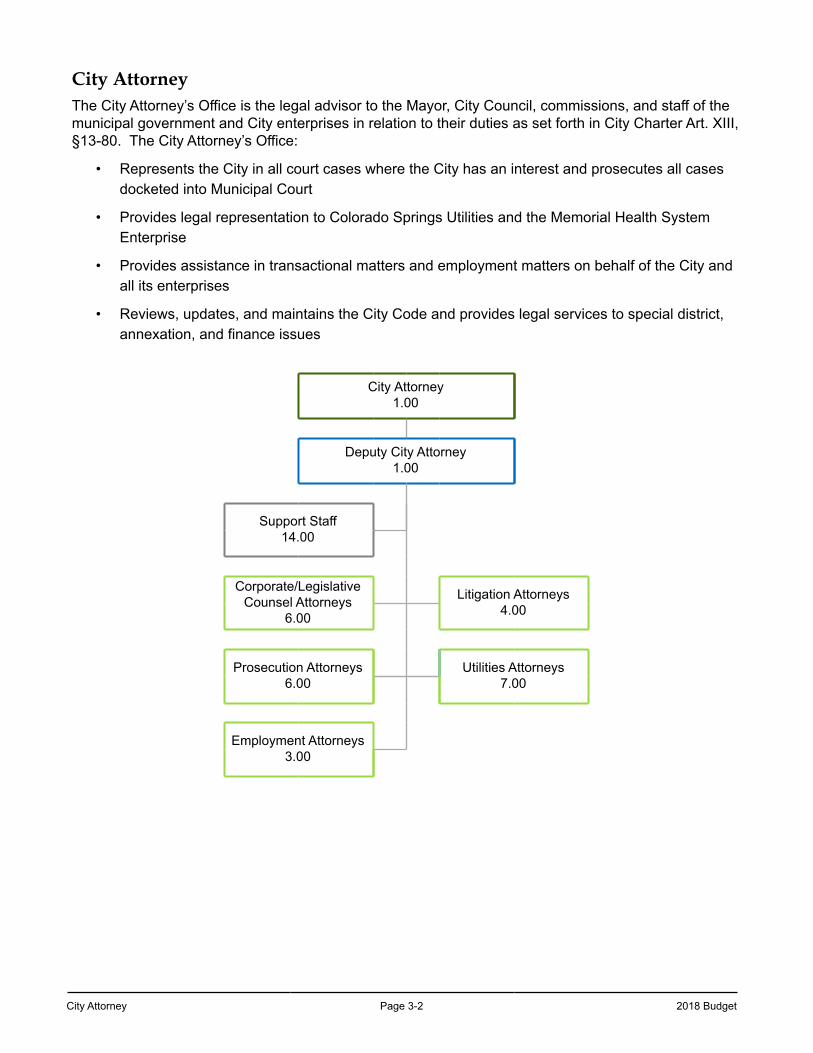
City Attorney Page 3-2 2018 Budget
City AttorneyThe City Attorney’s Office is the legal advisor to the Mayor, City Council, commissions, and staff of the municipal government and City enterprises in relation to their duties as set forth in City Charter Art. XIII, §13-80. The City Attorney’s Office:
• Represents the City in all court cases where the City has an interest and prosecutes all cases docketed into Municipal Court
• Provides legal representation to Colorado Springs Utilities and the Memorial Health System Enterprise
• Provides assistance in transactional matters and employment matters on behalf of the City and all its enterprises
• Reviews, updates, and maintains the City Code and provides legal services to special district, annexation, and finance issues
City Attorney1.00
Deputy City Attorney1.00
Support Staff14.00
Corporate/Legislative Counsel Attorneys
6.00
Litigation Attorneys4.00
Prosecution Attorneys6.00
Utilities Attorneys7.00
Employment Attorneys3.00
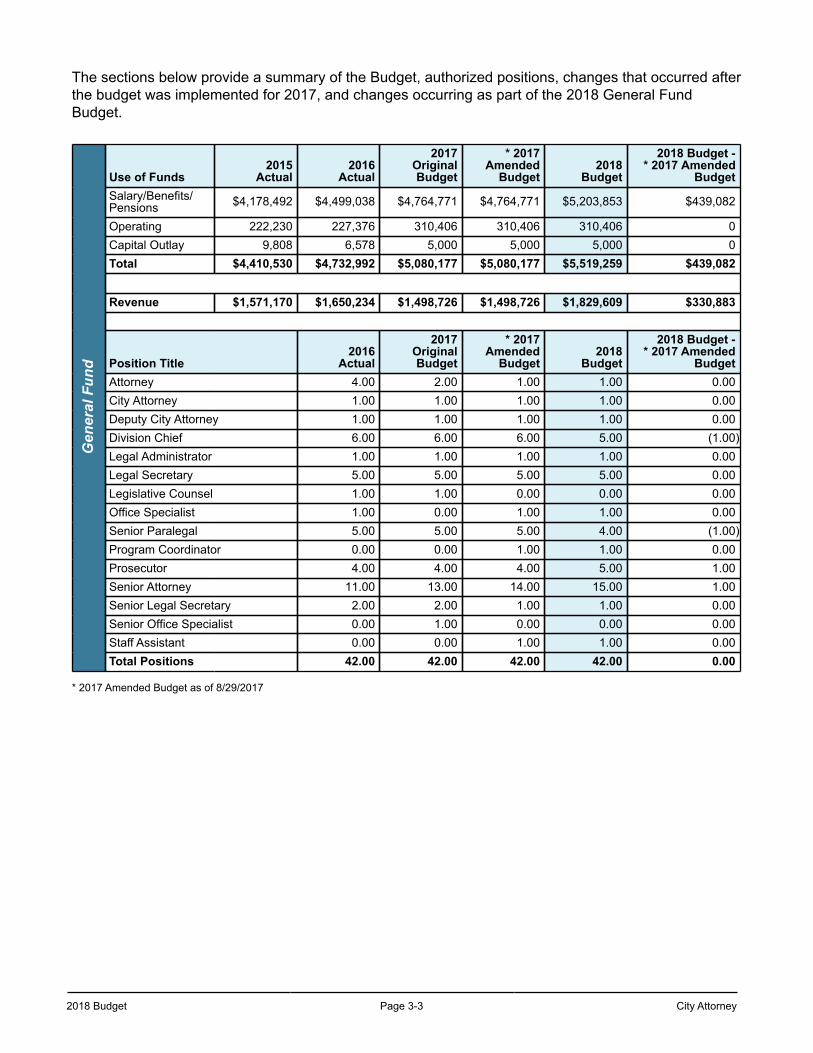
2018 Budget Page 3-3 City Attorney
The sections below provide a summary of the Budget, authorized positions, changes that occurred after the budget was implemented for 2017, and changes occurring as part of the 2018 General Fund Budget.
Gen
eral
Fun
d
Use of Funds2015
Actual2016
Actual
2017OriginalBudget
* 2017Amended
Budget2018
Budget
2018 Budget -* 2017 Amended
BudgetSalary/Benefits/Pensions $4,178,492 $4,499,038 $4,764,771 $4,764,771 $5,203,853 $439,082
Operating 222,230 227,376 310,406 310,406 310,406 0Capital Outlay 9,808 6,578 5,000 5,000 5,000 0Total $4,410,530 $4,732,992 $5,080,177 $5,080,177 $5,519,259 $439,082
Revenue $1,571,170 $1,650,234 $1,498,726 $1,498,726 $1,829,609 $330,883
Position Title2016
Actual
2017OriginalBudget
* 2017Amended
Budget2018
Budget
2018 Budget -* 2017 Amended
BudgetAttorney 4.00 2.00 1.00 1.00 0.00City Attorney 1.00 1.00 1.00 1.00 0.00Deputy City Attorney 1.00 1.00 1.00 1.00 0.00Division Chief 6.00 6.00 6.00 5.00 (1.00)Legal Administrator 1.00 1.00 1.00 1.00 0.00Legal Secretary 5.00 5.00 5.00 5.00 0.00Legislative Counsel 1.00 1.00 0.00 0.00 0.00Office Specialist 1.00 0.00 1.00 1.00 0.00Senior Paralegal 5.00 5.00 5.00 4.00 (1.00)Program Coordinator 0.00 0.00 1.00 1.00 0.00Prosecutor 4.00 4.00 4.00 5.00 1.00Senior Attorney 11.00 13.00 14.00 15.00 1.00Senior Legal Secretary 2.00 2.00 1.00 1.00 0.00Senior Office Specialist 0.00 1.00 0.00 0.00 0.00Staff Assistant 0.00 0.00 1.00 1.00 0.00Total Positions 42.00 42.00 42.00 42.00 0.00
* 2017 Amended Budget as of 8/29/2017
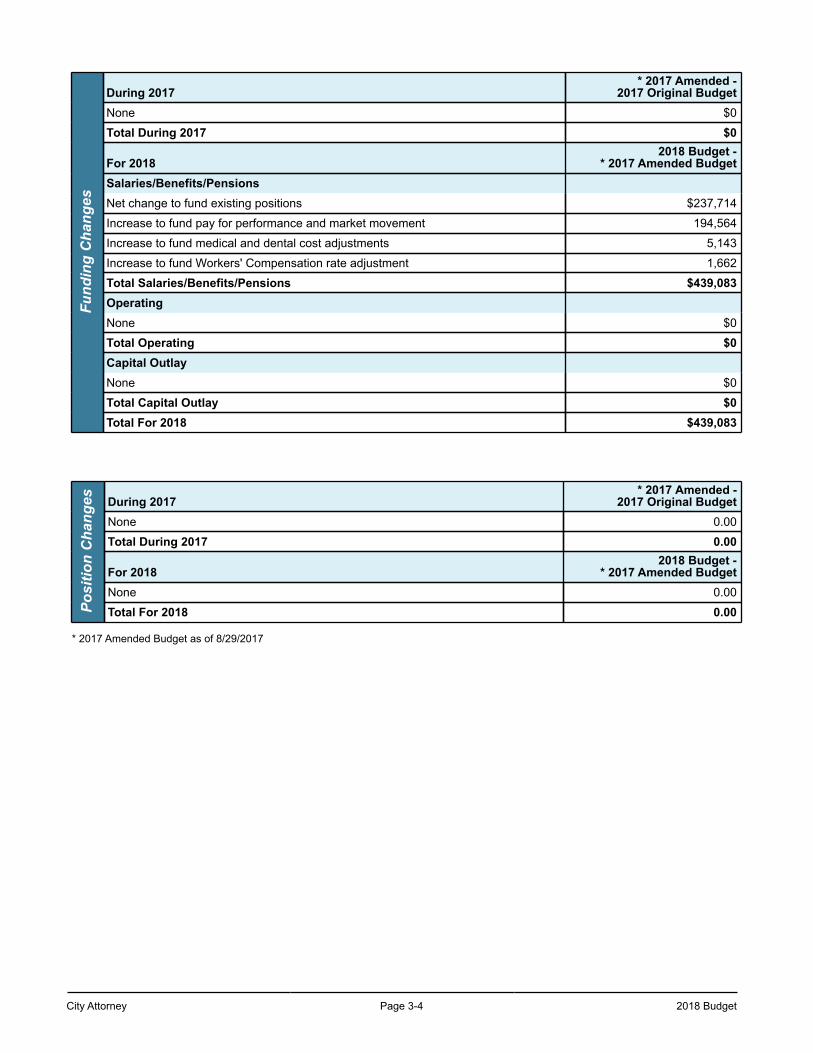
City Attorney Page 3-4 2018 Budget
Fund
ing
Cha
nges
During 2017* 2017 Amended -
2017 Original BudgetNone $0
Total During 2017 $0
For 20182018 Budget -
* 2017 Amended BudgetSalaries/Benefits/PensionsNet change to fund existing positions $237,714
Increase to fund pay for performance and market movement 194,564
Increase to fund medical and dental cost adjustments 5,143
Increase to fund Workers' Compensation rate adjustment 1,662
Total Salaries/Benefits/Pensions $439,083OperatingNone $0
Total Operating $0Capital OutlayNone $0
Total Capital Outlay $0Total For 2018 $439,083
Posi
tion
Cha
nges During 2017
* 2017 Amended -2017 Original Budget
None 0.00
Total During 2017 0.00
For 20182018 Budget -
* 2017 Amended BudgetNone 0.00
Total For 2018 0.00
* 2017 Amended Budget as of 8/29/2017
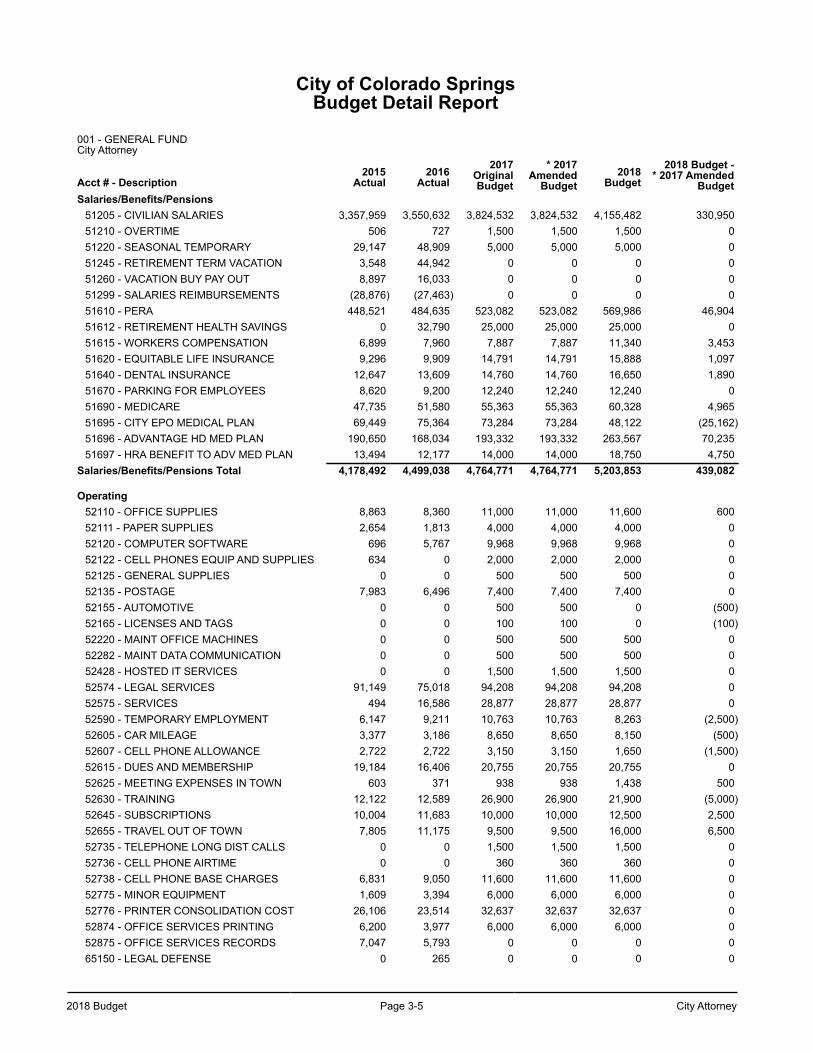
2018 Budget Page 3-5 City Attorney
City of Colorado SpringsBudget Detail Report
001 - GENERAL FUND City Attorney
Acct # - Description2015
Actual2016
Actual2017
OriginalBudget
* 2017Amended
Budget2018
Budget2018 Budget -
* 2017 AmendedBudget
Salaries/Benefits/Pensions51205 - CIVILIAN SALARIES 3,357,959 3,550,632 3,824,532 3,824,532 4,155,482 330,95051210 - OVERTIME 506 727 1,500 1,500 1,500 051220 - SEASONAL TEMPORARY 29,147 48,909 5,000 5,000 5,000 051245 - RETIREMENT TERM VACATION 3,548 44,942 0 0 0 051260 - VACATION BUY PAY OUT 8,897 16,033 0 0 0 051299 - SALARIES REIMBURSEMENTS (28,876) (27,463) 0 0 0 051610 - PERA 448,521 484,635 523,082 523,082 569,986 46,90451612 - RETIREMENT HEALTH SAVINGS 0 32,790 25,000 25,000 25,000 051615 - WORKERS COMPENSATION 6,899 7,960 7,887 7,887 11,340 3,45351620 - EQUITABLE LIFE INSURANCE 9,296 9,909 14,791 14,791 15,888 1,09751640 - DENTAL INSURANCE 12,647 13,609 14,760 14,760 16,650 1,89051670 - PARKING FOR EMPLOYEES 8,620 9,200 12,240 12,240 12,240 051690 - MEDICARE 47,735 51,580 55,363 55,363 60,328 4,96551695 - CITY EPO MEDICAL PLAN 69,449 75,364 73,284 73,284 48,122 (25,162)51696 - ADVANTAGE HD MED PLAN 190,650 168,034 193,332 193,332 263,567 70,23551697 - HRA BENEFIT TO ADV MED PLAN 13,494 12,177 14,000 14,000 18,750 4,750
Salaries/Benefits/Pensions Total 4,178,492 4,499,038 4,764,771 4,764,771 5,203,853 439,082
Operating52110 - OFFICE SUPPLIES 8,863 8,360 11,000 11,000 11,600 60052111 - PAPER SUPPLIES 2,654 1,813 4,000 4,000 4,000 052120 - COMPUTER SOFTWARE 696 5,767 9,968 9,968 9,968 052122 - CELL PHONES EQUIP AND SUPPLIES 634 0 2,000 2,000 2,000 052125 - GENERAL SUPPLIES 0 0 500 500 500 052135 - POSTAGE 7,983 6,496 7,400 7,400 7,400 052155 - AUTOMOTIVE 0 0 500 500 0 (500)52165 - LICENSES AND TAGS 0 0 100 100 0 (100)52220 - MAINT OFFICE MACHINES 0 0 500 500 500 052282 - MAINT DATA COMMUNICATION 0 0 500 500 500 052428 - HOSTED IT SERVICES 0 0 1,500 1,500 1,500 052574 - LEGAL SERVICES 91,149 75,018 94,208 94,208 94,208 052575 - SERVICES 494 16,586 28,877 28,877 28,877 052590 - TEMPORARY EMPLOYMENT 6,147 9,211 10,763 10,763 8,263 (2,500)52605 - CAR MILEAGE 3,377 3,186 8,650 8,650 8,150 (500)52607 - CELL PHONE ALLOWANCE 2,722 2,722 3,150 3,150 1,650 (1,500)52615 - DUES AND MEMBERSHIP 19,184 16,406 20,755 20,755 20,755 052625 - MEETING EXPENSES IN TOWN 603 371 938 938 1,438 50052630 - TRAINING 12,122 12,589 26,900 26,900 21,900 (5,000)52645 - SUBSCRIPTIONS 10,004 11,683 10,000 10,000 12,500 2,50052655 - TRAVEL OUT OF TOWN 7,805 11,175 9,500 9,500 16,000 6,50052735 - TELEPHONE LONG DIST CALLS 0 0 1,500 1,500 1,500 052736 - CELL PHONE AIRTIME 0 0 360 360 360 052738 - CELL PHONE BASE CHARGES 6,831 9,050 11,600 11,600 11,600 052775 - MINOR EQUIPMENT 1,609 3,394 6,000 6,000 6,000 052776 - PRINTER CONSOLIDATION COST 26,106 23,514 32,637 32,637 32,637 052874 - OFFICE SERVICES PRINTING 6,200 3,977 6,000 6,000 6,000 052875 - OFFICE SERVICES RECORDS 7,047 5,793 0 0 0 065150 - LEGAL DEFENSE 0 265 0 0 0 0
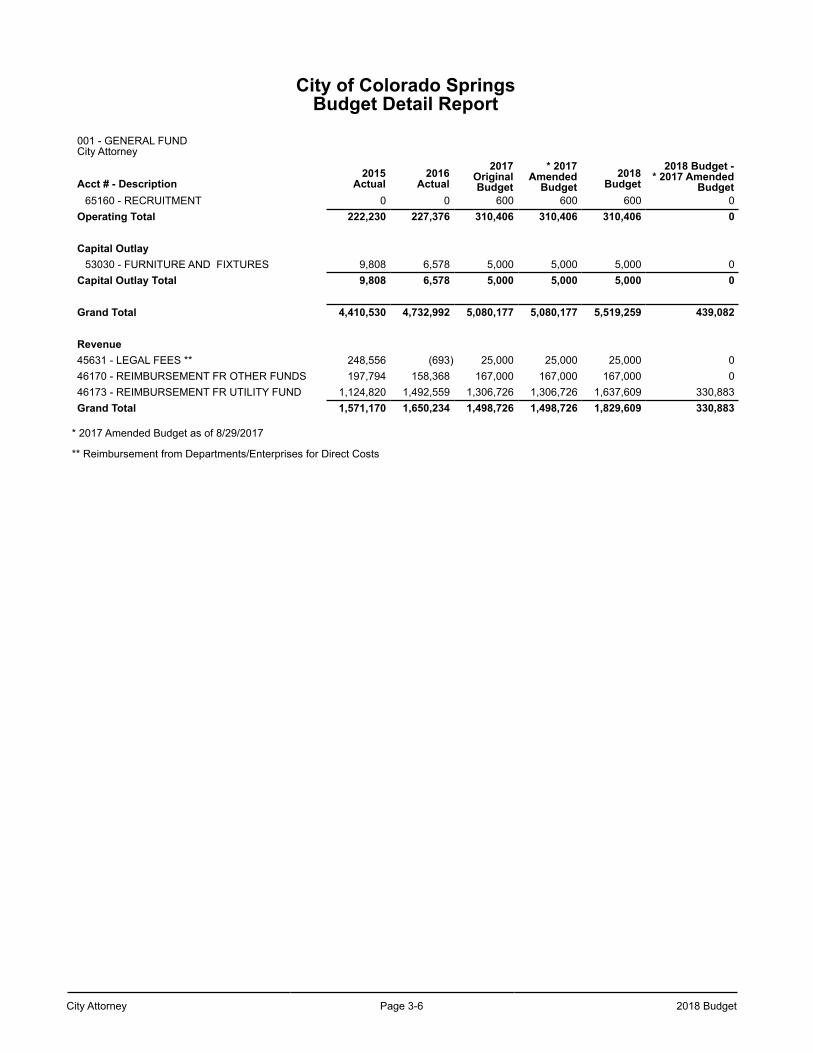
City Attorney Page 3-6 2018 Budget
City of Colorado SpringsBudget Detail Report
001 - GENERAL FUND City Attorney
Acct # - Description2015
Actual2016
Actual2017
OriginalBudget
* 2017Amended
Budget2018
Budget2018 Budget -
* 2017 AmendedBudget
65160 - RECRUITMENT 0 0 600 600 600 0Operating Total 222,230 227,376 310,406 310,406 310,406 0
Capital Outlay53030 - FURNITURE AND FIXTURES 9,808 6,578 5,000 5,000 5,000 0
Capital Outlay Total 9,808 6,578 5,000 5,000 5,000 0
Grand Total 4,410,530 4,732,992 5,080,177 5,080,177 5,519,259 439,082
Revenue45631 - LEGAL FEES ** 248,556 (693) 25,000 25,000 25,000 046170 - REIMBURSEMENT FR OTHER FUNDS 197,794 158,368 167,000 167,000 167,000 046173 - REIMBURSEMENT FR UTILITY FUND 1,124,820 1,492,559 1,306,726 1,306,726 1,637,609 330,883Grand Total 1,571,170 1,650,234 1,498,726 1,498,726 1,829,609 330,883
* 2017 Amended Budget as of 8/29/2017
** Reimbursement from Departments/Enterprises for Direct Costs
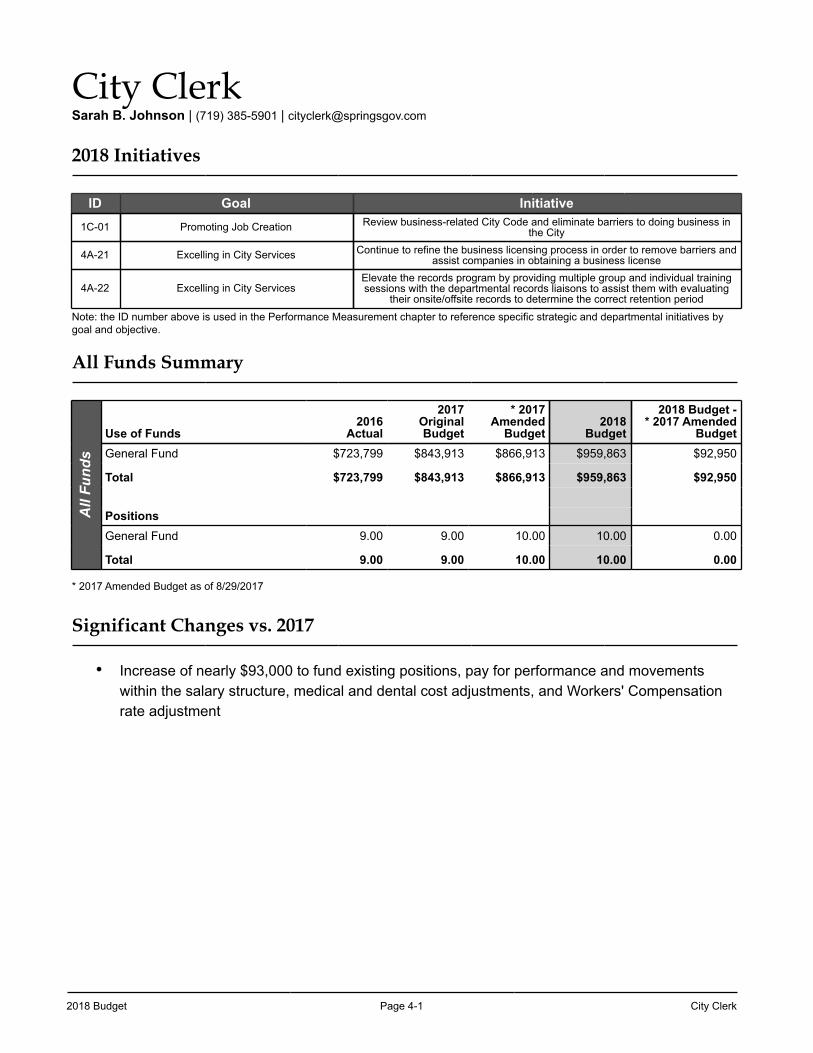
2018 Budget Page 4-1 City Clerk
City ClerkSarah B. Johnson | (719) 385-5901 | [email protected]
2018 Initiatives
ID Goal Initiative1C-01 Promoting Job Creation Review business-related City Code and eliminate barriers to doing business in
the City
4A-21 Excelling in City Services Continue to refine the business licensing process in order to remove barriers and assist companies in obtaining a business license
4A-22 Excelling in City ServicesElevate the records program by providing multiple group and individual training sessions with the departmental records liaisons to assist them with evaluating
their onsite/offsite records to determine the correct retention period
Note: the ID number above is used in the Performance Measurement chapter to reference specific strategic and departmental initiatives by goal and objective.
All Funds Summary
All
Fund
s
Use of Funds2016
Actual
2017OriginalBudget
* 2017Amended
Budget2018
Budget
2018 Budget -* 2017 Amended
BudgetGeneral Fund $723,799 $843,913 $866,913 $959,863 $92,950
Total $723,799 $843,913 $866,913 $959,863 $92,950
PositionsGeneral Fund 9.00 9.00 10.00 10.00 0.00
Total 9.00 9.00 10.00 10.00 0.00
* 2017 Amended Budget as of 8/29/2017
Significant Changes vs. 2017
• Increase of nearly $93,000 to fund existing positions, pay for performance and movements within the salary structure, medical and dental cost adjustments, and Workers' Compensation rate adjustment
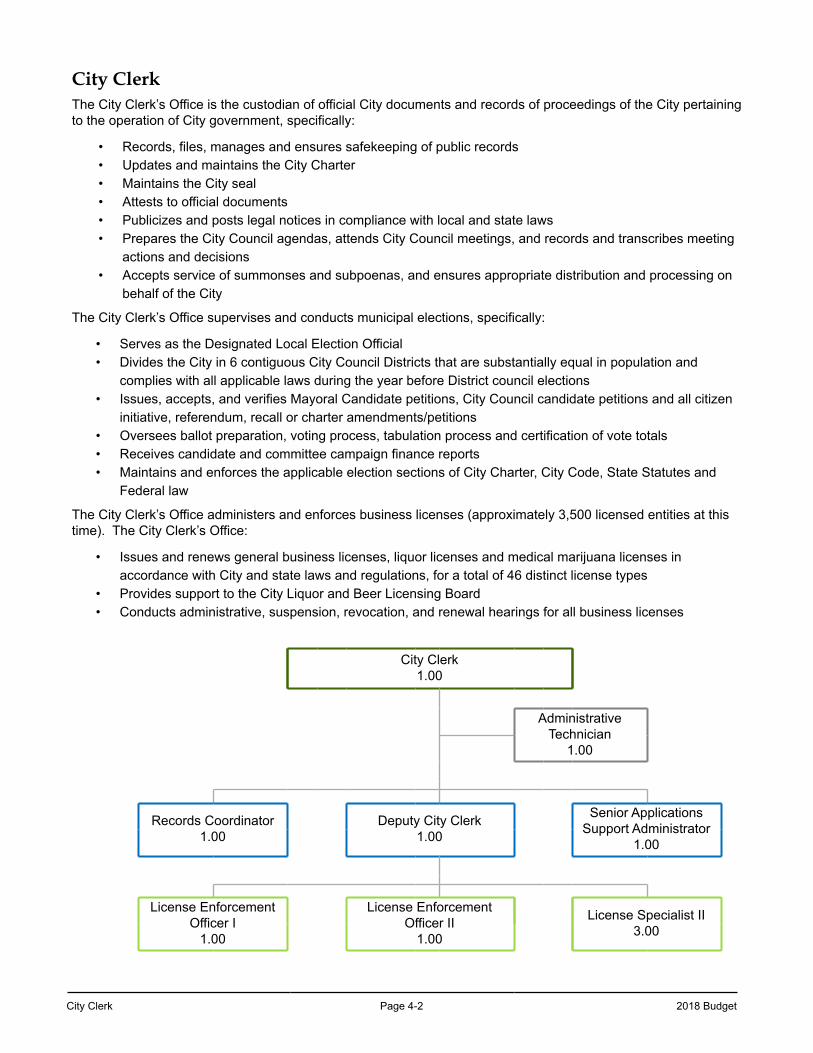
City Clerk Page 4-2 2018 Budget
City ClerkThe City Clerk’s Office is the custodian of official City documents and records of proceedings of the City pertaining to the operation of City government, specifically:
• Records, files, manages and ensures safekeeping of public records• Updates and maintains the City Charter• Maintains the City seal• Attests to official documents • Publicizes and posts legal notices in compliance with local and state laws• Prepares the City Council agendas, attends City Council meetings, and records and transcribes meeting
actions and decisions• Accepts service of summonses and subpoenas, and ensures appropriate distribution and processing on
behalf of the City
The City Clerk’s Office supervises and conducts municipal elections, specifically:
• Serves as the Designated Local Election Official• Divides the City in 6 contiguous City Council Districts that are substantially equal in population and
complies with all applicable laws during the year before District council elections• Issues, accepts, and verifies Mayoral Candidate petitions, City Council candidate petitions and all citizen
initiative, referendum, recall or charter amendments/petitions • Oversees ballot preparation, voting process, tabulation process and certification of vote totals• Receives candidate and committee campaign finance reports• Maintains and enforces the applicable election sections of City Charter, City Code, State Statutes and
Federal law
The City Clerk’s Office administers and enforces business licenses (approximately 3,500 licensed entities at this time). The City Clerk’s Office:
• Issues and renews general business licenses, liquor licenses and medical marijuana licenses in accordance with City and state laws and regulations, for a total of 46 distinct license types
• Provides support to the City Liquor and Beer Licensing Board• Conducts administrative, suspension, revocation, and renewal hearings for all business licenses
City Clerk1.00
AdministrativeTechnician
1.00
Records Coordinator1.00
Deputy City Clerk1.00
Senior Applications Support Administrator
1.00
License Enforcement Officer I
1.00
License Enforcement Officer II
1.00
License Specialist II3.00
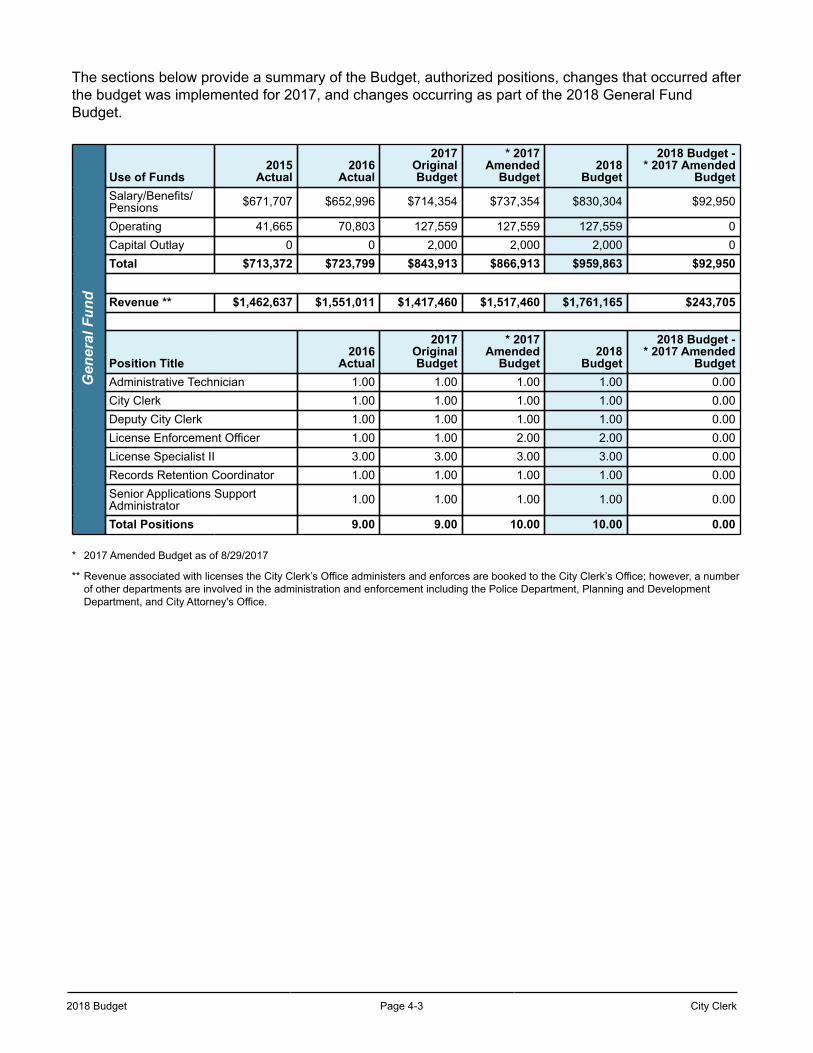
2018 Budget Page 4-3 City Clerk
The sections below provide a summary of the Budget, authorized positions, changes that occurred after the budget was implemented for 2017, and changes occurring as part of the 2018 General Fund Budget.
Gen
eral
Fun
d
Use of Funds2015
Actual2016
Actual
2017OriginalBudget
* 2017Amended
Budget2018
Budget
2018 Budget -* 2017 Amended
BudgetSalary/Benefits/Pensions $671,707 $652,996 $714,354 $737,354 $830,304 $92,950
Operating 41,665 70,803 127,559 127,559 127,559 0Capital Outlay 0 0 2,000 2,000 2,000 0Total $713,372 $723,799 $843,913 $866,913 $959,863 $92,950
Revenue ** $1,462,637 $1,551,011 $1,417,460 $1,517,460 $1,761,165 $243,705
Position Title2016
Actual
2017OriginalBudget
* 2017Amended
Budget2018
Budget
2018 Budget -* 2017 Amended
BudgetAdministrative Technician 1.00 1.00 1.00 1.00 0.00City Clerk 1.00 1.00 1.00 1.00 0.00Deputy City Clerk 1.00 1.00 1.00 1.00 0.00License Enforcement Officer 1.00 1.00 2.00 2.00 0.00License Specialist II 3.00 3.00 3.00 3.00 0.00Records Retention Coordinator 1.00 1.00 1.00 1.00 0.00Senior Applications SupportAdministrator 1.00 1.00 1.00 1.00 0.00
Total Positions 9.00 9.00 10.00 10.00 0.00
* 2017 Amended Budget as of 8/29/2017
** Revenue associated with licenses the City Clerk’s Office administers and enforces are booked to the City Clerk’s Office; however, a number of other departments are involved in the administration and enforcement including the Police Department, Planning and Development Department, and City Attorney's Office.
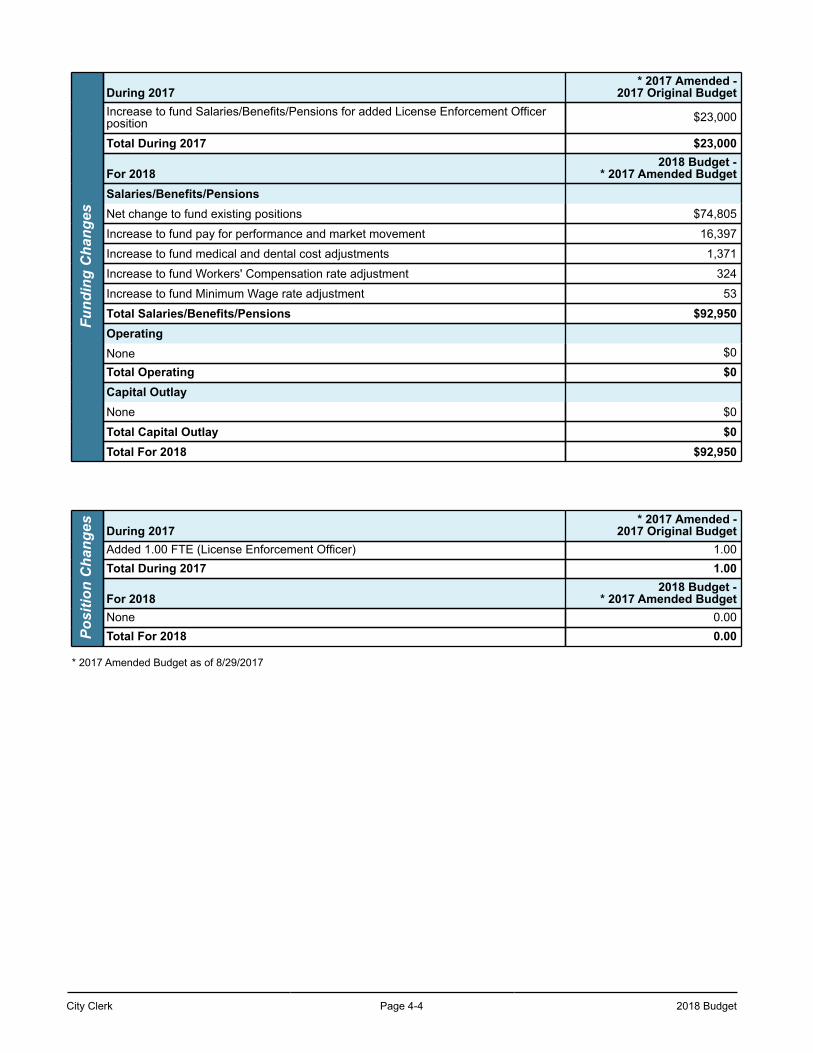
City Clerk Page 4-4 2018 Budget
Fund
ing
Cha
nges
During 2017* 2017 Amended -
2017 Original BudgetIncrease to fund Salaries/Benefits/Pensions for added License Enforcement Officerposition $23,000
Total During 2017 $23,000
For 20182018 Budget -
* 2017 Amended BudgetSalaries/Benefits/PensionsNet change to fund existing positions $74,805
Increase to fund pay for performance and market movement 16,397
Increase to fund medical and dental cost adjustments 1,371
Increase to fund Workers' Compensation rate adjustment 324
Increase to fund Minimum Wage rate adjustment 53
Total Salaries/Benefits/Pensions $92,950OperatingNone $0Total Operating $0Capital OutlayNone $0
Total Capital Outlay $0Total For 2018 $92,950
Posi
tion
Cha
nges During 2017
* 2017 Amended -2017 Original Budget
Added 1.00 FTE (License Enforcement Officer) 1.00Total During 2017 1.00
For 20182018 Budget -
* 2017 Amended BudgetNone 0.00Total For 2018 0.00
* 2017 Amended Budget as of 8/29/2017
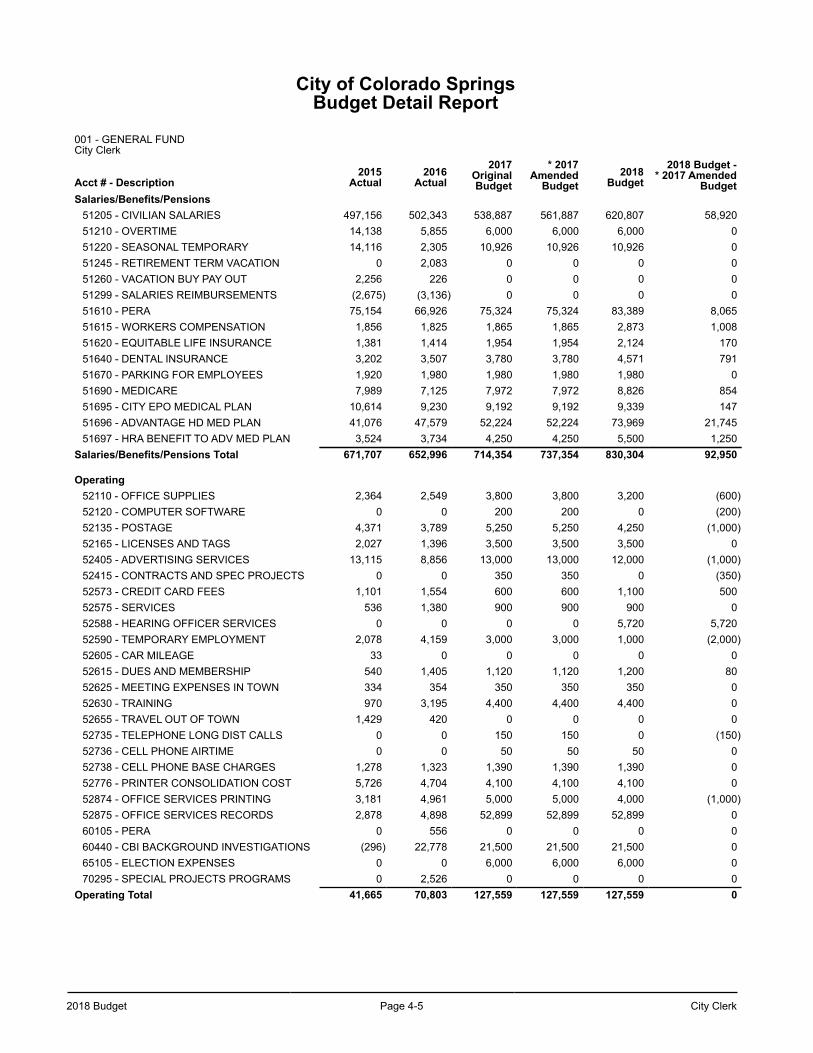
2018 Budget Page 4-5 City Clerk
City of Colorado SpringsBudget Detail Report
001 - GENERAL FUND City Clerk
Acct # - Description2015
Actual2016
Actual2017
OriginalBudget
* 2017Amended
Budget2018
Budget2018 Budget -
* 2017 AmendedBudget
Salaries/Benefits/Pensions51205 - CIVILIAN SALARIES 497,156 502,343 538,887 561,887 620,807 58,92051210 - OVERTIME 14,138 5,855 6,000 6,000 6,000 051220 - SEASONAL TEMPORARY 14,116 2,305 10,926 10,926 10,926 051245 - RETIREMENT TERM VACATION 0 2,083 0 0 0 051260 - VACATION BUY PAY OUT 2,256 226 0 0 0 051299 - SALARIES REIMBURSEMENTS (2,675) (3,136) 0 0 0 051610 - PERA 75,154 66,926 75,324 75,324 83,389 8,06551615 - WORKERS COMPENSATION 1,856 1,825 1,865 1,865 2,873 1,00851620 - EQUITABLE LIFE INSURANCE 1,381 1,414 1,954 1,954 2,124 17051640 - DENTAL INSURANCE 3,202 3,507 3,780 3,780 4,571 79151670 - PARKING FOR EMPLOYEES 1,920 1,980 1,980 1,980 1,980 051690 - MEDICARE 7,989 7,125 7,972 7,972 8,826 85451695 - CITY EPO MEDICAL PLAN 10,614 9,230 9,192 9,192 9,339 14751696 - ADVANTAGE HD MED PLAN 41,076 47,579 52,224 52,224 73,969 21,74551697 - HRA BENEFIT TO ADV MED PLAN 3,524 3,734 4,250 4,250 5,500 1,250
Salaries/Benefits/Pensions Total 671,707 652,996 714,354 737,354 830,304 92,950
Operating52110 - OFFICE SUPPLIES 2,364 2,549 3,800 3,800 3,200 (600)52120 - COMPUTER SOFTWARE 0 0 200 200 0 (200)52135 - POSTAGE 4,371 3,789 5,250 5,250 4,250 (1,000)52165 - LICENSES AND TAGS 2,027 1,396 3,500 3,500 3,500 052405 - ADVERTISING SERVICES 13,115 8,856 13,000 13,000 12,000 (1,000)52415 - CONTRACTS AND SPEC PROJECTS 0 0 350 350 0 (350)52573 - CREDIT CARD FEES 1,101 1,554 600 600 1,100 50052575 - SERVICES 536 1,380 900 900 900 052588 - HEARING OFFICER SERVICES 0 0 0 0 5,720 5,72052590 - TEMPORARY EMPLOYMENT 2,078 4,159 3,000 3,000 1,000 (2,000)52605 - CAR MILEAGE 33 0 0 0 0 052615 - DUES AND MEMBERSHIP 540 1,405 1,120 1,120 1,200 8052625 - MEETING EXPENSES IN TOWN 334 354 350 350 350 052630 - TRAINING 970 3,195 4,400 4,400 4,400 052655 - TRAVEL OUT OF TOWN 1,429 420 0 0 0 052735 - TELEPHONE LONG DIST CALLS 0 0 150 150 0 (150)52736 - CELL PHONE AIRTIME 0 0 50 50 50 052738 - CELL PHONE BASE CHARGES 1,278 1,323 1,390 1,390 1,390 052776 - PRINTER CONSOLIDATION COST 5,726 4,704 4,100 4,100 4,100 052874 - OFFICE SERVICES PRINTING 3,181 4,961 5,000 5,000 4,000 (1,000)52875 - OFFICE SERVICES RECORDS 2,878 4,898 52,899 52,899 52,899 060105 - PERA 0 556 0 0 0 060440 - CBI BACKGROUND INVESTIGATIONS (296) 22,778 21,500 21,500 21,500 065105 - ELECTION EXPENSES 0 0 6,000 6,000 6,000 070295 - SPECIAL PROJECTS PROGRAMS 0 2,526 0 0 0 0
Operating Total 41,665 70,803 127,559 127,559 127,559 0
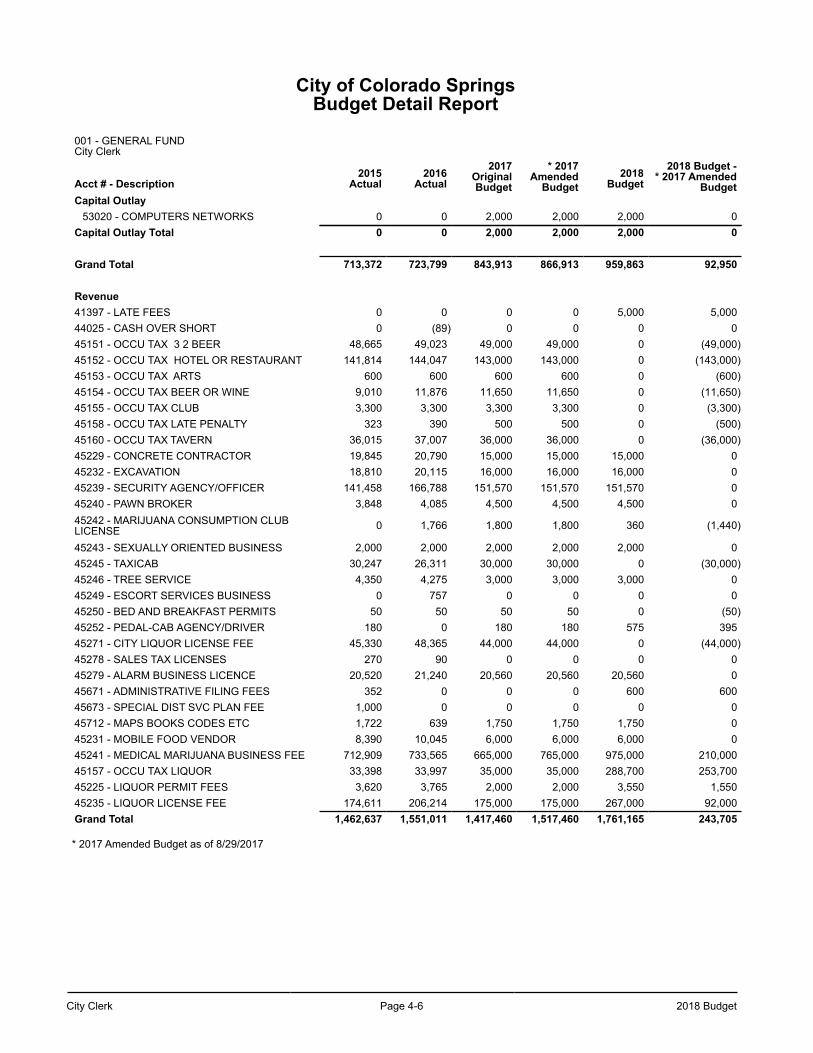
City Clerk Page 4-6 2018 Budget
City of Colorado SpringsBudget Detail Report
001 - GENERAL FUND City Clerk
Acct # - Description2015
Actual2016
Actual2017
OriginalBudget
* 2017Amended
Budget2018
Budget2018 Budget -
* 2017 AmendedBudget
Capital Outlay53020 - COMPUTERS NETWORKS 0 0 2,000 2,000 2,000 0
Capital Outlay Total 0 0 2,000 2,000 2,000 0
Grand Total 713,372 723,799 843,913 866,913 959,863 92,950
Revenue41397 - LATE FEES 0 0 0 0 5,000 5,00044025 - CASH OVER SHORT 0 (89) 0 0 0 045151 - OCCU TAX 3 2 BEER 48,665 49,023 49,000 49,000 0 (49,000)45152 - OCCU TAX HOTEL OR RESTAURANT 141,814 144,047 143,000 143,000 0 (143,000)45153 - OCCU TAX ARTS 600 600 600 600 0 (600)45154 - OCCU TAX BEER OR WINE 9,010 11,876 11,650 11,650 0 (11,650)45155 - OCCU TAX CLUB 3,300 3,300 3,300 3,300 0 (3,300)45158 - OCCU TAX LATE PENALTY 323 390 500 500 0 (500)45160 - OCCU TAX TAVERN 36,015 37,007 36,000 36,000 0 (36,000)45229 - CONCRETE CONTRACTOR 19,845 20,790 15,000 15,000 15,000 045232 - EXCAVATION 18,810 20,115 16,000 16,000 16,000 045239 - SECURITY AGENCY/OFFICER 141,458 166,788 151,570 151,570 151,570 045240 - PAWN BROKER 3,848 4,085 4,500 4,500 4,500 045242 - MARIJUANA CONSUMPTION CLUBLICENSE 0 1,766 1,800 1,800 360 (1,440)
45243 - SEXUALLY ORIENTED BUSINESS 2,000 2,000 2,000 2,000 2,000 045245 - TAXICAB 30,247 26,311 30,000 30,000 0 (30,000)45246 - TREE SERVICE 4,350 4,275 3,000 3,000 3,000 045249 - ESCORT SERVICES BUSINESS 0 757 0 0 0 045250 - BED AND BREAKFAST PERMITS 50 50 50 50 0 (50)45252 - PEDAL-CAB AGENCY/DRIVER 180 0 180 180 575 39545271 - CITY LIQUOR LICENSE FEE 45,330 48,365 44,000 44,000 0 (44,000)45278 - SALES TAX LICENSES 270 90 0 0 0 045279 - ALARM BUSINESS LICENCE 20,520 21,240 20,560 20,560 20,560 045671 - ADMINISTRATIVE FILING FEES 352 0 0 0 600 60045673 - SPECIAL DIST SVC PLAN FEE 1,000 0 0 0 0 045712 - MAPS BOOKS CODES ETC 1,722 639 1,750 1,750 1,750 045231 - MOBILE FOOD VENDOR 8,390 10,045 6,000 6,000 6,000 045241 - MEDICAL MARIJUANA BUSINESS FEE 712,909 733,565 665,000 765,000 975,000 210,00045157 - OCCU TAX LIQUOR 33,398 33,997 35,000 35,000 288,700 253,70045225 - LIQUOR PERMIT FEES 3,620 3,765 2,000 2,000 3,550 1,55045235 - LIQUOR LICENSE FEE 174,611 206,214 175,000 175,000 267,000 92,000Grand Total 1,462,637 1,551,011 1,417,460 1,517,460 1,761,165 243,705
* 2017 Amended Budget as of 8/29/2017
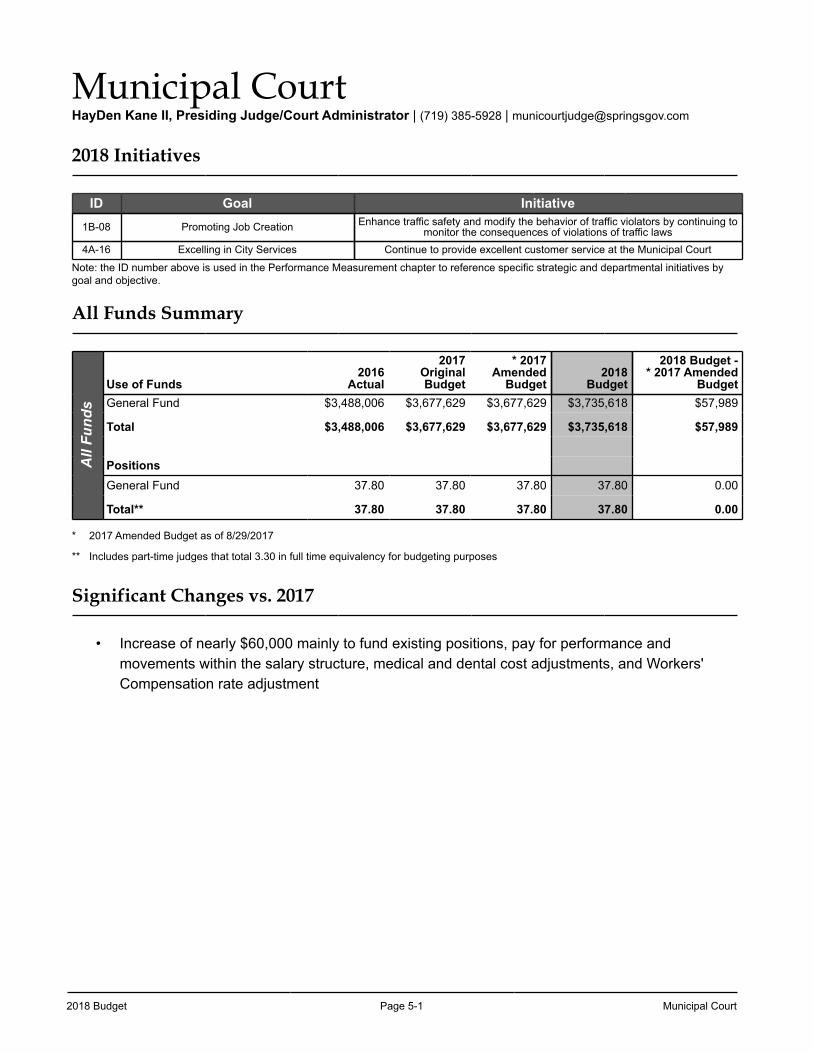
2018 Budget Page 5-1 Municipal Court
Municipal CourtHayDen Kane II, Presiding Judge/Court Administrator | (719) 385-5928 | [email protected]
2018 Initiatives
ID Goal Initiative1B-08 Promoting Job Creation Enhance traffic safety and modify the behavior of traffic violators by continuing to
monitor the consequences of violations of traffic laws 4A-16 Excelling in City Services Continue to provide excellent customer service at the Municipal Court
Note: the ID number above is used in the Performance Measurement chapter to reference specific strategic and departmental initiatives by goal and objective.
All Funds Summary
All
Fund
s
Use of Funds2016
Actual
2017OriginalBudget
* 2017Amended
Budget2018
Budget
2018 Budget -* 2017 Amended
BudgetGeneral Fund $3,488,006 $3,677,629 $3,677,629 $3,735,618 $57,989
Total $3,488,006 $3,677,629 $3,677,629 $3,735,618 $57,989
PositionsGeneral Fund 37.80 37.80 37.80 37.80 0.00
Total** 37.80 37.80 37.80 37.80 0.00
* 2017 Amended Budget as of 8/29/2017
** Includes part-time judges that total 3.30 in full time equivalency for budgeting purposes
Significant Changes vs. 2017
• Increase of nearly $60,000 mainly to fund existing positions, pay for performance and movements within the salary structure, medical and dental cost adjustments, and Workers' Compensation rate adjustment
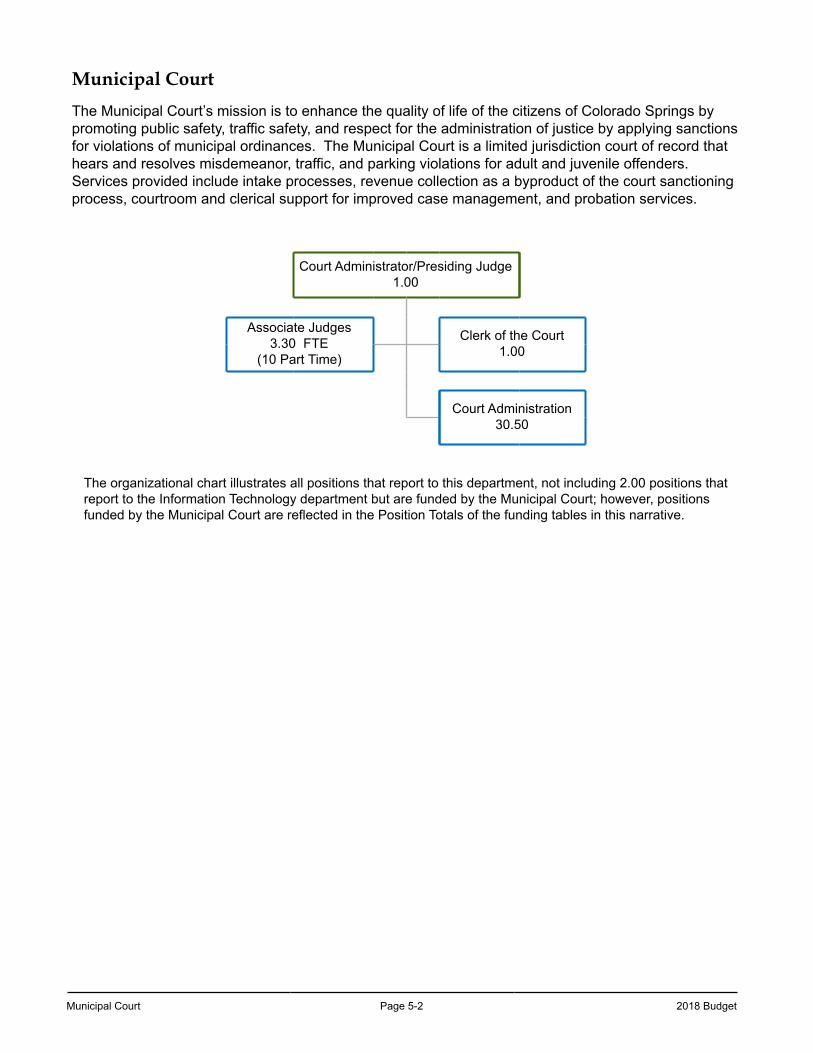
Municipal Court Page 5-2 2018 Budget
Municipal Court
The Municipal Court’s mission is to enhance the quality of life of the citizens of Colorado Springs by promoting public safety, traffic safety, and respect for the administration of justice by applying sanctions for violations of municipal ordinances. The Municipal Court is a limited jurisdiction court of record that hears and resolves misdemeanor, traffic, and parking violations for adult and juvenile offenders. Services provided include intake processes, revenue collection as a byproduct of the court sanctioning process, courtroom and clerical support for improved case management, and probation services.
Court Administrator/Presiding Judge1.00
Associate Judges3.30 FTE
(10 Part Time)
Clerk of the Court1.00
Court Administration30.50
The organizational chart illustrates all positions that report to this department, not including 2.00 positions that report to the Information Technology department but are funded by the Municipal Court; however, positions funded by the Municipal Court are reflected in the Position Totals of the funding tables in this narrative.
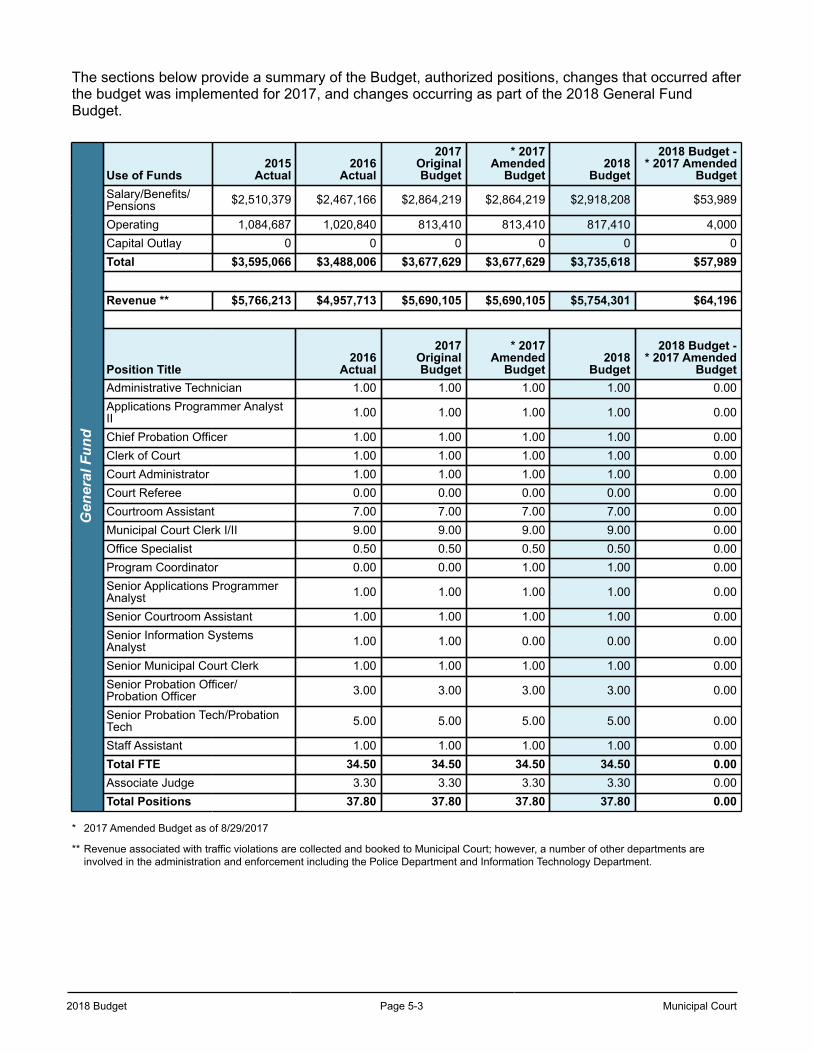
2018 Budget Page 5-3 Municipal Court
The sections below provide a summary of the Budget, authorized positions, changes that occurred after the budget was implemented for 2017, and changes occurring as part of the 2018 General Fund Budget.
Gen
eral
Fun
d
Use of Funds2015
Actual2016
Actual
2017OriginalBudget
* 2017Amended
Budget2018
Budget
2018 Budget -* 2017 Amended
BudgetSalary/Benefits/Pensions $2,510,379 $2,467,166 $2,864,219 $2,864,219 $2,918,208 $53,989
Operating 1,084,687 1,020,840 813,410 813,410 817,410 4,000Capital Outlay 0 0 0 0 0 0Total $3,595,066 $3,488,006 $3,677,629 $3,677,629 $3,735,618 $57,989
Revenue ** $5,766,213 $4,957,713 $5,690,105 $5,690,105 $5,754,301 $64,196
Position Title2016
Actual
2017OriginalBudget
* 2017Amended
Budget2018
Budget
2018 Budget -* 2017 Amended
BudgetAdministrative Technician 1.00 1.00 1.00 1.00 0.00Applications Programmer AnalystII 1.00 1.00 1.00 1.00 0.00
Chief Probation Officer 1.00 1.00 1.00 1.00 0.00Clerk of Court 1.00 1.00 1.00 1.00 0.00Court Administrator 1.00 1.00 1.00 1.00 0.00Court Referee 0.00 0.00 0.00 0.00 0.00Courtroom Assistant 7.00 7.00 7.00 7.00 0.00Municipal Court Clerk I/II 9.00 9.00 9.00 9.00 0.00Office Specialist 0.50 0.50 0.50 0.50 0.00Program Coordinator 0.00 0.00 1.00 1.00 0.00Senior Applications ProgrammerAnalyst 1.00 1.00 1.00 1.00 0.00
Senior Courtroom Assistant 1.00 1.00 1.00 1.00 0.00Senior Information SystemsAnalyst 1.00 1.00 0.00 0.00 0.00
Senior Municipal Court Clerk 1.00 1.00 1.00 1.00 0.00Senior Probation Officer/Probation Officer 3.00 3.00 3.00 3.00 0.00
Senior Probation Tech/ProbationTech 5.00 5.00 5.00 5.00 0.00
Staff Assistant 1.00 1.00 1.00 1.00 0.00Total FTE 34.50 34.50 34.50 34.50 0.00Associate Judge 3.30 3.30 3.30 3.30 0.00Total Positions 37.80 37.80 37.80 37.80 0.00
* 2017 Amended Budget as of 8/29/2017
** Revenue associated with traffic violations are collected and booked to Municipal Court; however, a number of other departments are involved in the administration and enforcement including the Police Department and Information Technology Department.
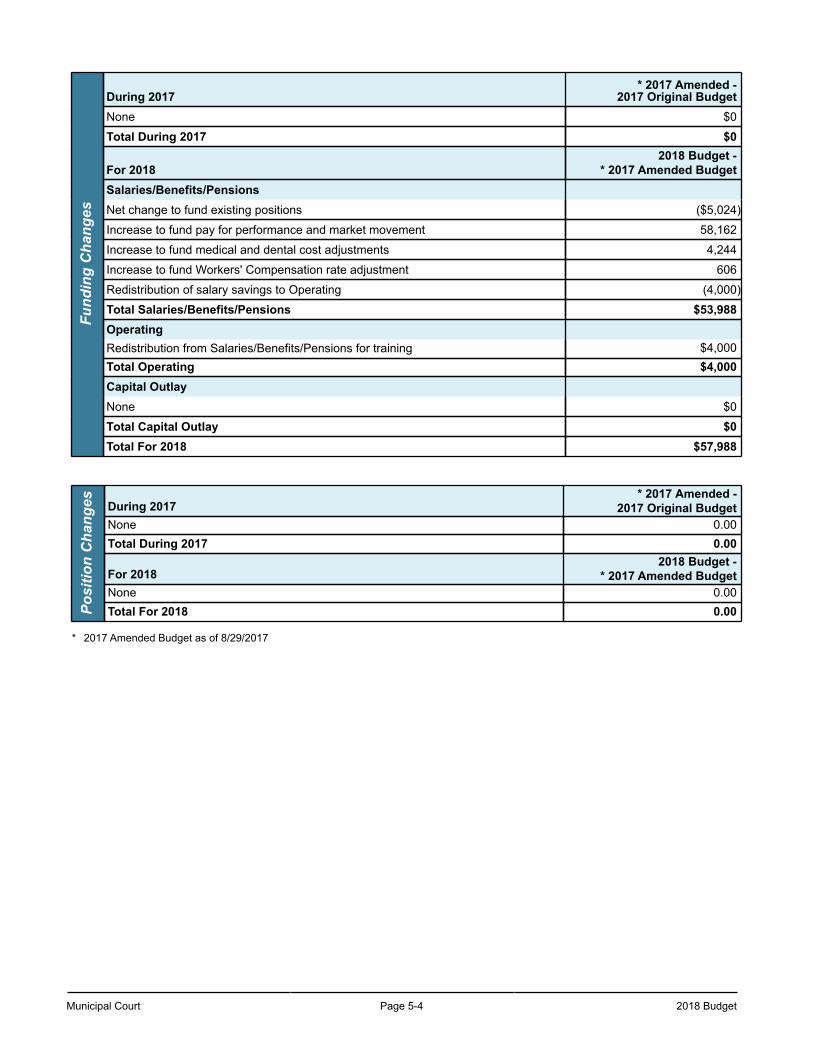
Municipal Court Page 5-4 2018 Budget
Fund
ing
Cha
nges
During 2017* 2017 Amended -
2017 Original BudgetNone $0
Total During 2017 $0
For 20182018 Budget -
* 2017 Amended BudgetSalaries/Benefits/PensionsNet change to fund existing positions ($5,024)
Increase to fund pay for performance and market movement 58,162
Increase to fund medical and dental cost adjustments 4,244
Increase to fund Workers' Compensation rate adjustment 606
Redistribution of salary savings to Operating (4,000)
Total Salaries/Benefits/Pensions $53,988OperatingRedistribution from Salaries/Benefits/Pensions for training $4,000Total Operating $4,000Capital OutlayNone $0
Total Capital Outlay $0Total For 2018 $57,988
Posi
tion
Cha
nges During 2017
* 2017 Amended -2017 Original Budget
None 0.00Total During 2017 0.00
For 20182018 Budget -
* 2017 Amended BudgetNone 0.00Total For 2018 0.00
* 2017 Amended Budget as of 8/29/2017
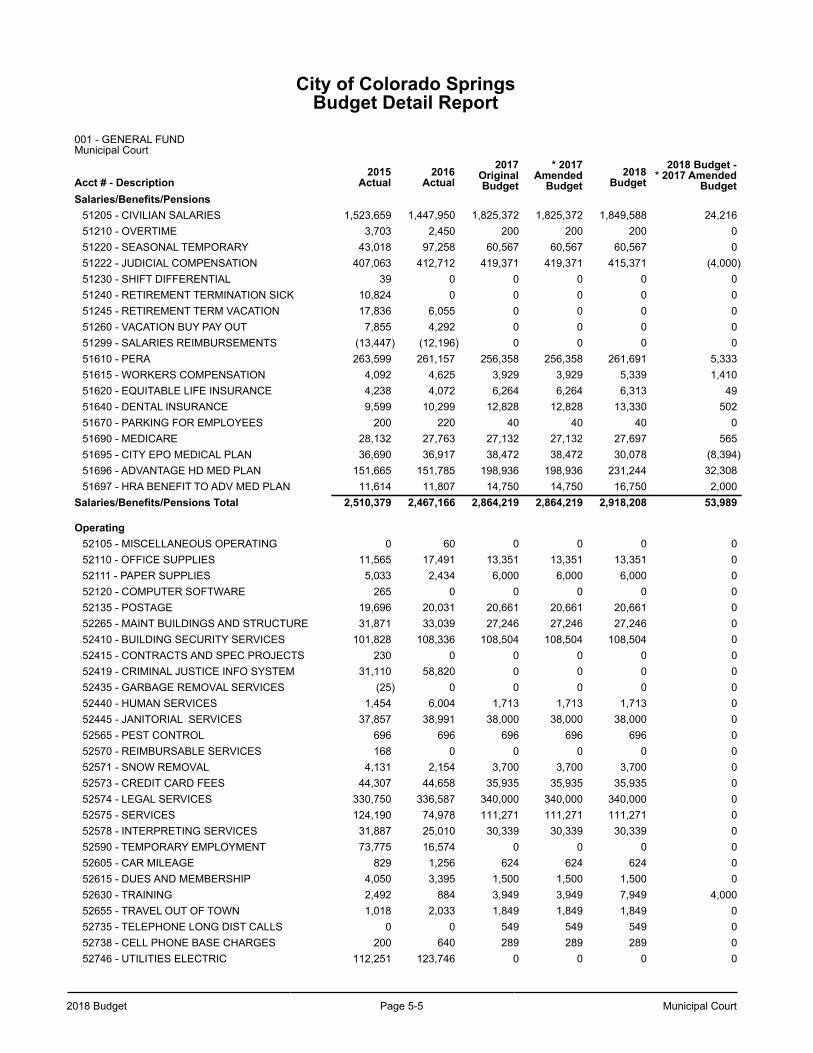
2018 Budget Page 5-5 Municipal Court
City of Colorado SpringsBudget Detail Report
001 - GENERAL FUND Municipal Court
Acct # - Description2015
Actual2016
Actual2017
OriginalBudget
* 2017Amended
Budget2018
Budget2018 Budget -
* 2017 AmendedBudget
Salaries/Benefits/Pensions51205 - CIVILIAN SALARIES 1,523,659 1,447,950 1,825,372 1,825,372 1,849,588 24,21651210 - OVERTIME 3,703 2,450 200 200 200 051220 - SEASONAL TEMPORARY 43,018 97,258 60,567 60,567 60,567 051222 - JUDICIAL COMPENSATION 407,063 412,712 419,371 419,371 415,371 (4,000)51230 - SHIFT DIFFERENTIAL 39 0 0 0 0 051240 - RETIREMENT TERMINATION SICK 10,824 0 0 0 0 051245 - RETIREMENT TERM VACATION 17,836 6,055 0 0 0 051260 - VACATION BUY PAY OUT 7,855 4,292 0 0 0 051299 - SALARIES REIMBURSEMENTS (13,447) (12,196) 0 0 0 051610 - PERA 263,599 261,157 256,358 256,358 261,691 5,33351615 - WORKERS COMPENSATION 4,092 4,625 3,929 3,929 5,339 1,41051620 - EQUITABLE LIFE INSURANCE 4,238 4,072 6,264 6,264 6,313 4951640 - DENTAL INSURANCE 9,599 10,299 12,828 12,828 13,330 50251670 - PARKING FOR EMPLOYEES 200 220 40 40 40 051690 - MEDICARE 28,132 27,763 27,132 27,132 27,697 56551695 - CITY EPO MEDICAL PLAN 36,690 36,917 38,472 38,472 30,078 (8,394)51696 - ADVANTAGE HD MED PLAN 151,665 151,785 198,936 198,936 231,244 32,30851697 - HRA BENEFIT TO ADV MED PLAN 11,614 11,807 14,750 14,750 16,750 2,000
Salaries/Benefits/Pensions Total 2,510,379 2,467,166 2,864,219 2,864,219 2,918,208 53,989
Operating52105 - MISCELLANEOUS OPERATING 0 60 0 0 0 052110 - OFFICE SUPPLIES 11,565 17,491 13,351 13,351 13,351 052111 - PAPER SUPPLIES 5,033 2,434 6,000 6,000 6,000 052120 - COMPUTER SOFTWARE 265 0 0 0 0 052135 - POSTAGE 19,696 20,031 20,661 20,661 20,661 052265 - MAINT BUILDINGS AND STRUCTURE 31,871 33,039 27,246 27,246 27,246 052410 - BUILDING SECURITY SERVICES 101,828 108,336 108,504 108,504 108,504 052415 - CONTRACTS AND SPEC PROJECTS 230 0 0 0 0 052419 - CRIMINAL JUSTICE INFO SYSTEM 31,110 58,820 0 0 0 052435 - GARBAGE REMOVAL SERVICES (25) 0 0 0 0 052440 - HUMAN SERVICES 1,454 6,004 1,713 1,713 1,713 052445 - JANITORIAL SERVICES 37,857 38,991 38,000 38,000 38,000 052565 - PEST CONTROL 696 696 696 696 696 052570 - REIMBURSABLE SERVICES 168 0 0 0 0 052571 - SNOW REMOVAL 4,131 2,154 3,700 3,700 3,700 052573 - CREDIT CARD FEES 44,307 44,658 35,935 35,935 35,935 052574 - LEGAL SERVICES 330,750 336,587 340,000 340,000 340,000 052575 - SERVICES 124,190 74,978 111,271 111,271 111,271 052578 - INTERPRETING SERVICES 31,887 25,010 30,339 30,339 30,339 052590 - TEMPORARY EMPLOYMENT 73,775 16,574 0 0 0 052605 - CAR MILEAGE 829 1,256 624 624 624 052615 - DUES AND MEMBERSHIP 4,050 3,395 1,500 1,500 1,500 052630 - TRAINING 2,492 884 3,949 3,949 7,949 4,00052655 - TRAVEL OUT OF TOWN 1,018 2,033 1,849 1,849 1,849 052735 - TELEPHONE LONG DIST CALLS 0 0 549 549 549 052738 - CELL PHONE BASE CHARGES 200 640 289 289 289 052746 - UTILITIES ELECTRIC 112,251 123,746 0 0 0 0
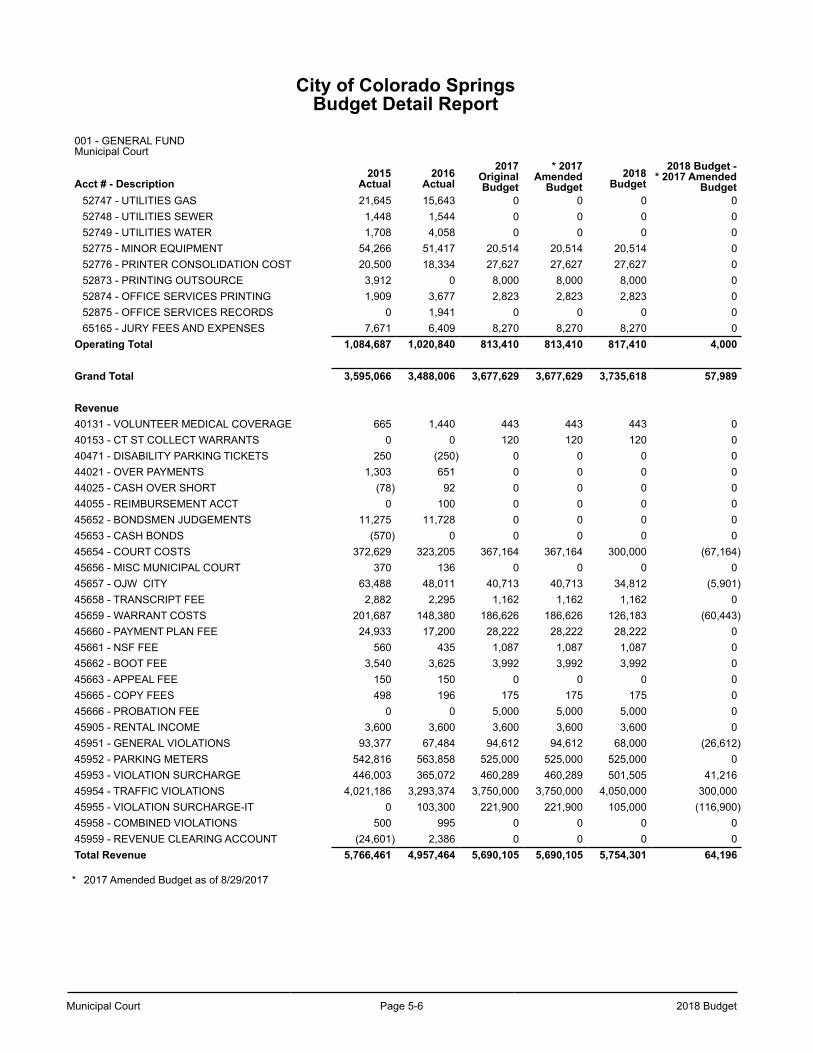
Municipal Court Page 5-6 2018 Budget
City of Colorado SpringsBudget Detail Report
001 - GENERAL FUND Municipal Court
Acct # - Description2015
Actual2016
Actual2017
OriginalBudget
* 2017Amended
Budget2018
Budget2018 Budget -
* 2017 AmendedBudget
52747 - UTILITIES GAS 21,645 15,643 0 0 0 052748 - UTILITIES SEWER 1,448 1,544 0 0 0 052749 - UTILITIES WATER 1,708 4,058 0 0 0 052775 - MINOR EQUIPMENT 54,266 51,417 20,514 20,514 20,514 052776 - PRINTER CONSOLIDATION COST 20,500 18,334 27,627 27,627 27,627 052873 - PRINTING OUTSOURCE 3,912 0 8,000 8,000 8,000 052874 - OFFICE SERVICES PRINTING 1,909 3,677 2,823 2,823 2,823 052875 - OFFICE SERVICES RECORDS 0 1,941 0 0 0 065165 - JURY FEES AND EXPENSES 7,671 6,409 8,270 8,270 8,270 0
Operating Total 1,084,687 1,020,840 813,410 813,410 817,410 4,000
Grand Total 3,595,066 3,488,006 3,677,629 3,677,629 3,735,618 57,989
Revenue40131 - VOLUNTEER MEDICAL COVERAGE 665 1,440 443 443 443 040153 - CT ST COLLECT WARRANTS 0 0 120 120 120 040471 - DISABILITY PARKING TICKETS 250 (250) 0 0 0 044021 - OVER PAYMENTS 1,303 651 0 0 0 044025 - CASH OVER SHORT (78) 92 0 0 0 044055 - REIMBURSEMENT ACCT 0 100 0 0 0 045652 - BONDSMEN JUDGEMENTS 11,275 11,728 0 0 0 045653 - CASH BONDS (570) 0 0 0 0 045654 - COURT COSTS 372,629 323,205 367,164 367,164 300,000 (67,164)45656 - MISC MUNICIPAL COURT 370 136 0 0 0 045657 - OJW CITY 63,488 48,011 40,713 40,713 34,812 (5,901)45658 - TRANSCRIPT FEE 2,882 2,295 1,162 1,162 1,162 045659 - WARRANT COSTS 201,687 148,380 186,626 186,626 126,183 (60,443)45660 - PAYMENT PLAN FEE 24,933 17,200 28,222 28,222 28,222 045661 - NSF FEE 560 435 1,087 1,087 1,087 045662 - BOOT FEE 3,540 3,625 3,992 3,992 3,992 045663 - APPEAL FEE 150 150 0 0 0 045665 - COPY FEES 498 196 175 175 175 045666 - PROBATION FEE 0 0 5,000 5,000 5,000 045905 - RENTAL INCOME 3,600 3,600 3,600 3,600 3,600 045951 - GENERAL VIOLATIONS 93,377 67,484 94,612 94,612 68,000 (26,612)45952 - PARKING METERS 542,816 563,858 525,000 525,000 525,000 045953 - VIOLATION SURCHARGE 446,003 365,072 460,289 460,289 501,505 41,21645954 - TRAFFIC VIOLATIONS 4,021,186 3,293,374 3,750,000 3,750,000 4,050,000 300,00045955 - VIOLATION SURCHARGE-IT 0 103,300 221,900 221,900 105,000 (116,900)45958 - COMBINED VIOLATIONS 500 995 0 0 0 045959 - REVENUE CLEARING ACCOUNT (24,601) 2,386 0 0 0 0Total Revenue 5,766,461 4,957,464 5,690,105 5,690,105 5,754,301 64,196
* 2017 Amended Budget as of 8/29/2017
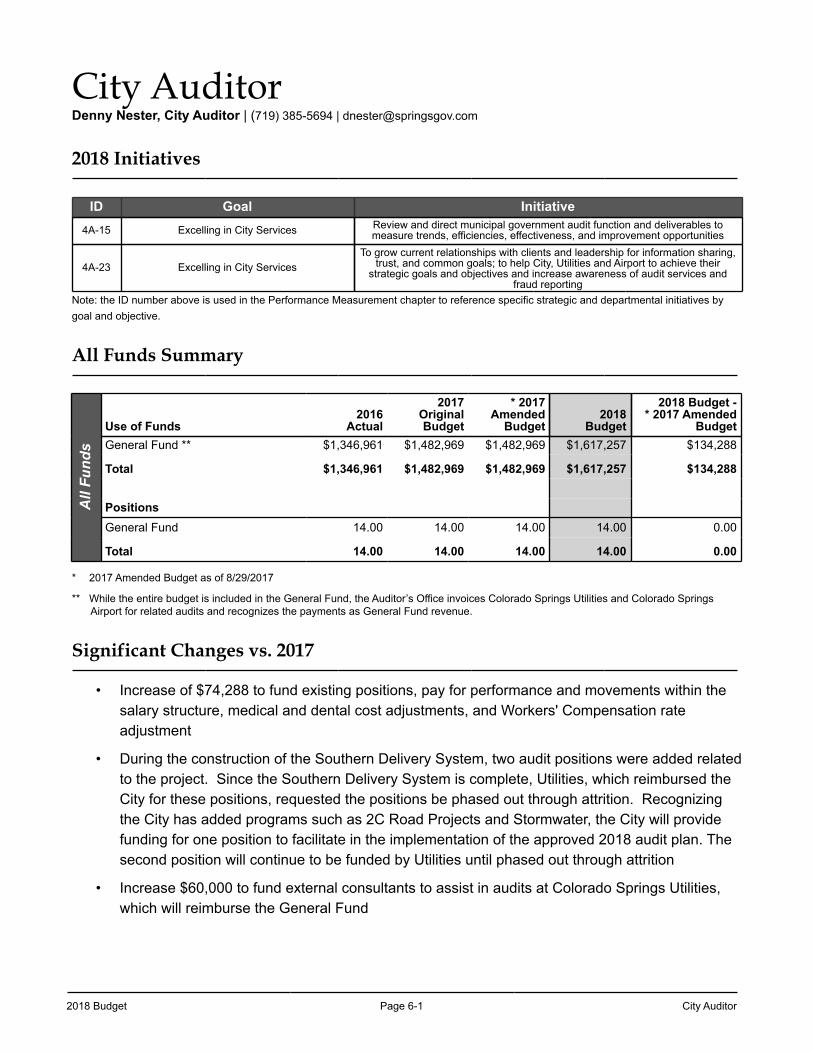
2018 Budget Page 6-1 City Auditor
City AuditorDenny Nester, City Auditor | (719) 385-5694 | [email protected]
2018 Initiatives
ID Goal Initiative4A-15 Excelling in City Services Review and direct municipal government audit function and deliverables to
measure trends, efficiencies, effectiveness, and improvement opportunities
4A-23 Excelling in City ServicesTo grow current relationships with clients and leadership for information sharing,
trust, and common goals; to help City, Utilities and Airport to achieve their strategic goals and objectives and increase awareness of audit services and
fraud reportingNote: the ID number above is used in the Performance Measurement chapter to reference specific strategic and departmental initiatives by goal and objective.
All Funds Summary
All
Fund
s
Use of Funds2016
Actual
2017OriginalBudget
* 2017Amended
Budget2018
Budget
2018 Budget -* 2017 Amended
BudgetGeneral Fund ** $1,346,961 $1,482,969 $1,482,969 $1,617,257 $134,288
Total $1,346,961 $1,482,969 $1,482,969 $1,617,257 $134,288
PositionsGeneral Fund 14.00 14.00 14.00 14.00 0.00
Total 14.00 14.00 14.00 14.00 0.00
* 2017 Amended Budget as of 8/29/2017
** While the entire budget is included in the General Fund, the Auditor’s Office invoices Colorado Springs Utilities and Colorado Springs Airport for related audits and recognizes the payments as General Fund revenue.
Significant Changes vs. 2017
• Increase of $74,288 to fund existing positions, pay for performance and movements within the salary structure, medical and dental cost adjustments, and Workers' Compensation rate adjustment
• During the construction of the Southern Delivery System, two audit positions were added related to the project. Since the Southern Delivery System is complete, Utilities, which reimbursed the City for these positions, requested the positions be phased out through attrition. Recognizing the City has added programs such as 2C Road Projects and Stormwater, the City will provide funding for one position to facilitate in the implementation of the approved 2018 audit plan. The second position will continue to be funded by Utilities until phased out through attrition
• Increase $60,000 to fund external consultants to assist in audits at Colorado Springs Utilities, which will reimburse the General Fund
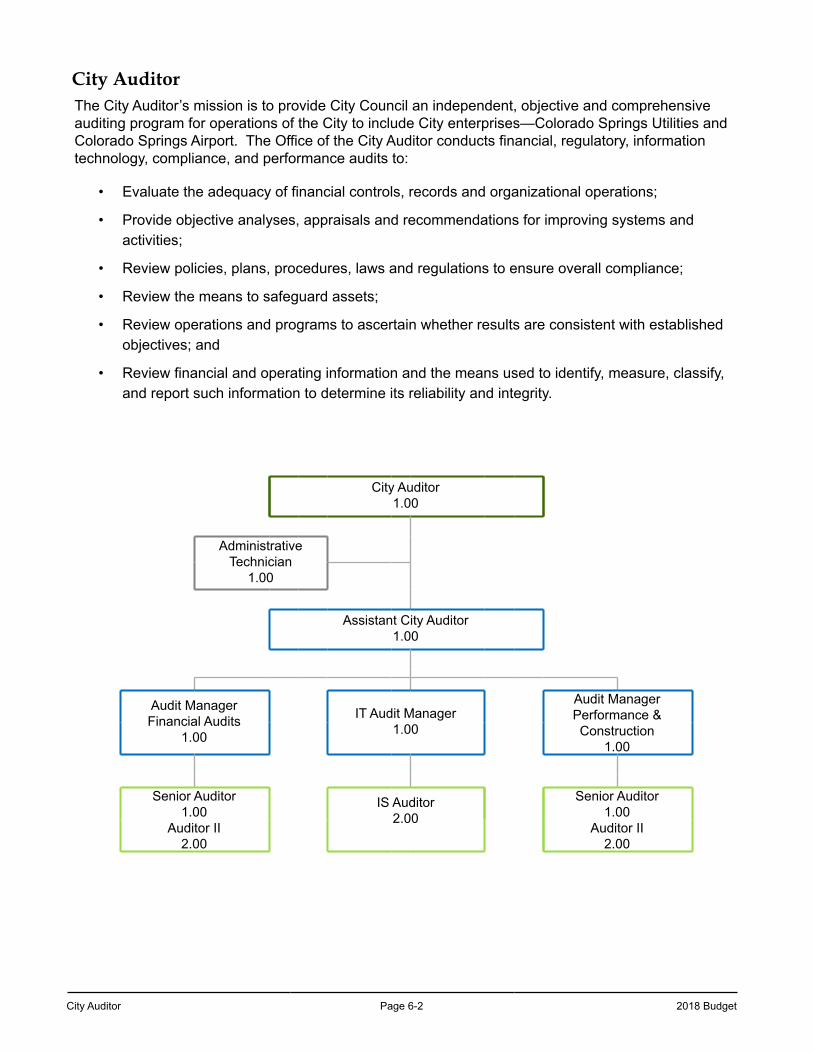
City Auditor Page 6-2 2018 Budget
City AuditorThe City Auditor’s mission is to provide City Council an independent, objective and comprehensive auditing program for operations of the City to include City enterprises—Colorado Springs Utilities and Colorado Springs Airport. The Office of the City Auditor conducts financial, regulatory, information technology, compliance, and performance audits to:
• Evaluate the adequacy of financial controls, records and organizational operations;
• Provide objective analyses, appraisals and recommendations for improving systems and activities;
• Review policies, plans, procedures, laws and regulations to ensure overall compliance;
• Review the means to safeguard assets;
• Review operations and programs to ascertain whether results are consistent with established objectives; and
• Review financial and operating information and the means used to identify, measure, classify, and report such information to determine its reliability and integrity.
City Auditor1.00
AdministrativeTechnician
1.00
Assistant City Auditor1.00
Audit ManagerFinancial Audits
1.00
IT Audit Manager1.00
Audit Manager Performance & Construction
1.00
Senior Auditor1.00
Auditor II2.00
IS Auditor2.00
Senior Auditor1.00
Auditor II2.00
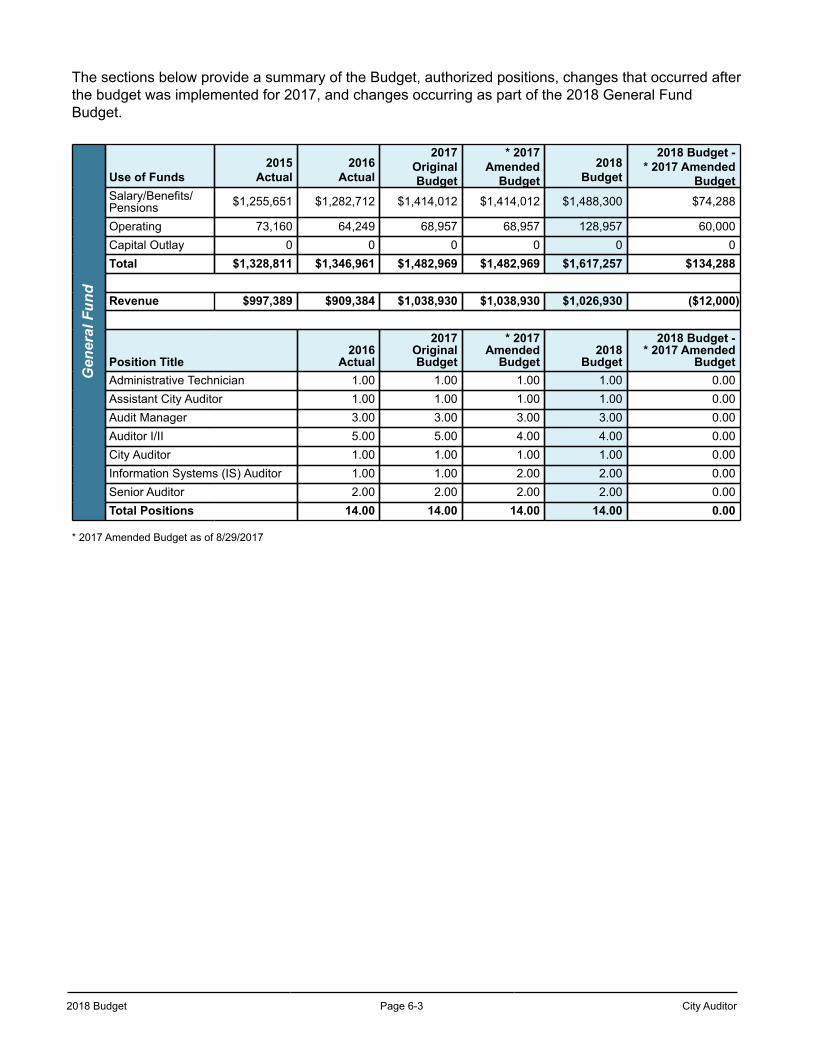
2018 Budget Page 6-3 City Auditor
The sections below provide a summary of the Budget, authorized positions, changes that occurred after the budget was implemented for 2017, and changes occurring as part of the 2018 General Fund Budget.
Gen
eral
Fun
d
Use of Funds2015
Actual2016
Actual
2017OriginalBudget
* 2017Amended
Budget2018
Budget
2018 Budget -* 2017 Amended
BudgetSalary/Benefits/Pensions $1,255,651 $1,282,712 $1,414,012 $1,414,012 $1,488,300 $74,288
Operating 73,160 64,249 68,957 68,957 128,957 60,000Capital Outlay 0 0 0 0 0 0Total $1,328,811 $1,346,961 $1,482,969 $1,482,969 $1,617,257 $134,288
Revenue $997,389 $909,384 $1,038,930 $1,038,930 $1,026,930 ($12,000)
Position Title2016
Actual
2017OriginalBudget
* 2017Amended
Budget2018
Budget
2018 Budget -* 2017 Amended
BudgetAdministrative Technician 1.00 1.00 1.00 1.00 0.00Assistant City Auditor 1.00 1.00 1.00 1.00 0.00Audit Manager 3.00 3.00 3.00 3.00 0.00Auditor I/II 5.00 5.00 4.00 4.00 0.00City Auditor 1.00 1.00 1.00 1.00 0.00Information Systems (IS) Auditor 1.00 1.00 2.00 2.00 0.00Senior Auditor 2.00 2.00 2.00 2.00 0.00Total Positions 14.00 14.00 14.00 14.00 0.00
* 2017 Amended Budget as of 8/29/2017
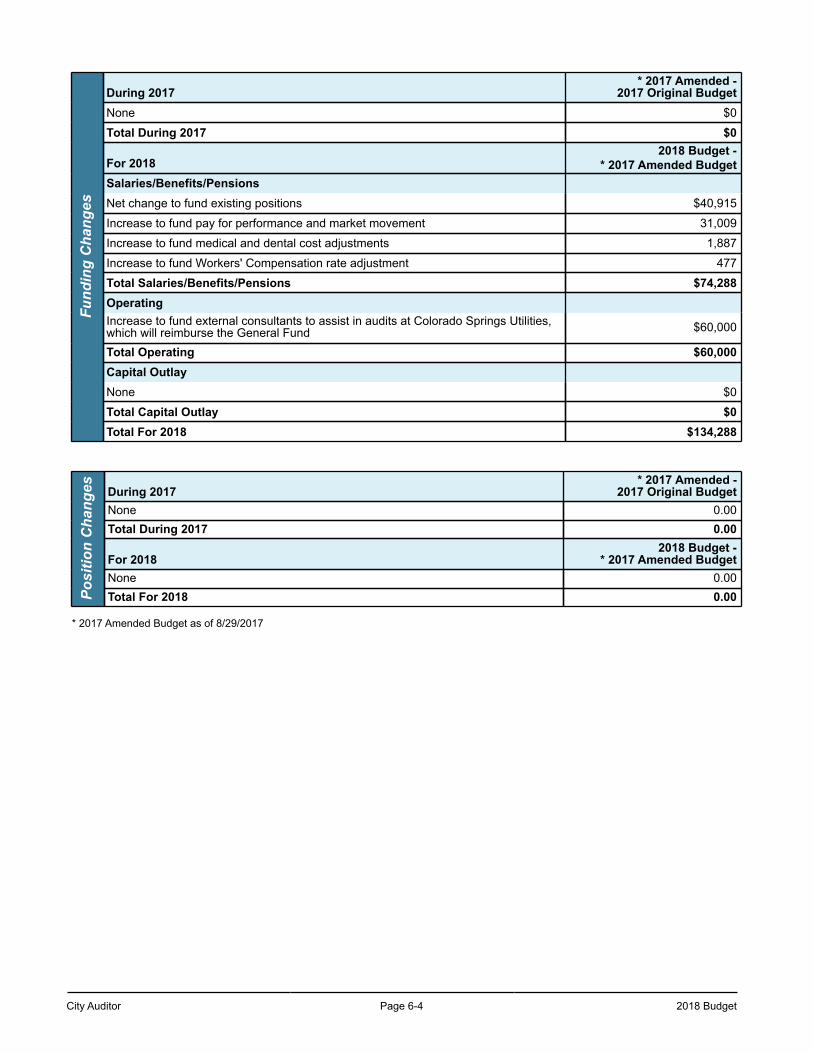
City Auditor Page 6-4 2018 Budget
Fund
ing
Cha
nges
During 2017* 2017 Amended -
2017 Original BudgetNone $0
Total During 2017 $0
For 20182018 Budget -
* 2017 Amended BudgetSalaries/Benefits/PensionsNet change to fund existing positions $40,915
Increase to fund pay for performance and market movement 31,009
Increase to fund medical and dental cost adjustments 1,887
Increase to fund Workers' Compensation rate adjustment 477
Total Salaries/Benefits/Pensions $74,288OperatingIncrease to fund external consultants to assist in audits at Colorado Springs Utilities, which will reimburse the General Fund $60,000
Total Operating $60,000Capital OutlayNone $0
Total Capital Outlay $0Total For 2018 $134,288
Posi
tion
Cha
nges During 2017
* 2017 Amended -2017 Original Budget
None 0.00Total During 2017 0.00
For 20182018 Budget -
* 2017 Amended BudgetNone 0.00Total For 2018 0.00
* 2017 Amended Budget as of 8/29/2017
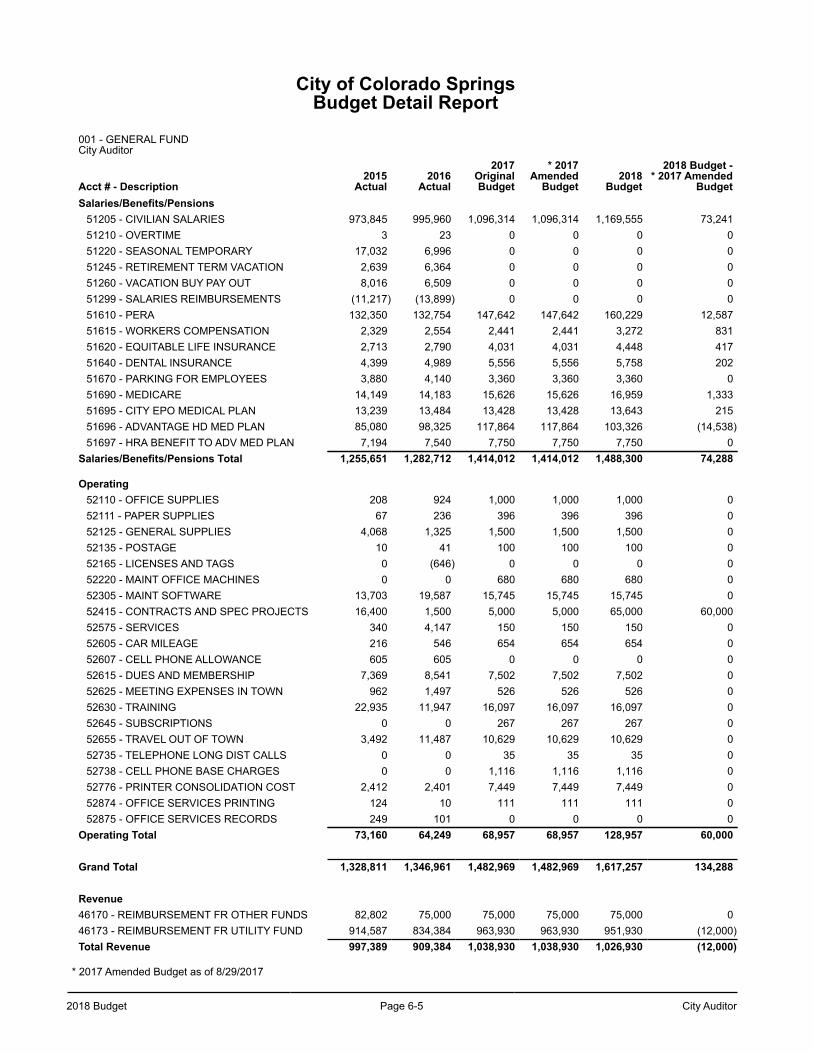
2018 Budget Page 6-5 City Auditor
City of Colorado SpringsBudget Detail Report
001 - GENERAL FUND City Auditor
Acct # - Description2015
Actual2016
Actual
2017OriginalBudget
* 2017Amended
Budget2018
Budget
2018 Budget -* 2017 Amended
BudgetSalaries/Benefits/Pensions
51205 - CIVILIAN SALARIES 973,845 995,960 1,096,314 1,096,314 1,169,555 73,24151210 - OVERTIME 3 23 0 0 0 051220 - SEASONAL TEMPORARY 17,032 6,996 0 0 0 051245 - RETIREMENT TERM VACATION 2,639 6,364 0 0 0 051260 - VACATION BUY PAY OUT 8,016 6,509 0 0 0 051299 - SALARIES REIMBURSEMENTS (11,217) (13,899) 0 0 0 051610 - PERA 132,350 132,754 147,642 147,642 160,229 12,58751615 - WORKERS COMPENSATION 2,329 2,554 2,441 2,441 3,272 83151620 - EQUITABLE LIFE INSURANCE 2,713 2,790 4,031 4,031 4,448 41751640 - DENTAL INSURANCE 4,399 4,989 5,556 5,556 5,758 20251670 - PARKING FOR EMPLOYEES 3,880 4,140 3,360 3,360 3,360 051690 - MEDICARE 14,149 14,183 15,626 15,626 16,959 1,33351695 - CITY EPO MEDICAL PLAN 13,239 13,484 13,428 13,428 13,643 21551696 - ADVANTAGE HD MED PLAN 85,080 98,325 117,864 117,864 103,326 (14,538)51697 - HRA BENEFIT TO ADV MED PLAN 7,194 7,540 7,750 7,750 7,750 0
Salaries/Benefits/Pensions Total 1,255,651 1,282,712 1,414,012 1,414,012 1,488,300 74,288
Operating52110 - OFFICE SUPPLIES 208 924 1,000 1,000 1,000 052111 - PAPER SUPPLIES 67 236 396 396 396 052125 - GENERAL SUPPLIES 4,068 1,325 1,500 1,500 1,500 052135 - POSTAGE 10 41 100 100 100 052165 - LICENSES AND TAGS 0 (646) 0 0 0 052220 - MAINT OFFICE MACHINES 0 0 680 680 680 052305 - MAINT SOFTWARE 13,703 19,587 15,745 15,745 15,745 052415 - CONTRACTS AND SPEC PROJECTS 16,400 1,500 5,000 5,000 65,000 60,00052575 - SERVICES 340 4,147 150 150 150 052605 - CAR MILEAGE 216 546 654 654 654 052607 - CELL PHONE ALLOWANCE 605 605 0 0 0 052615 - DUES AND MEMBERSHIP 7,369 8,541 7,502 7,502 7,502 052625 - MEETING EXPENSES IN TOWN 962 1,497 526 526 526 052630 - TRAINING 22,935 11,947 16,097 16,097 16,097 052645 - SUBSCRIPTIONS 0 0 267 267 267 052655 - TRAVEL OUT OF TOWN 3,492 11,487 10,629 10,629 10,629 052735 - TELEPHONE LONG DIST CALLS 0 0 35 35 35 052738 - CELL PHONE BASE CHARGES 0 0 1,116 1,116 1,116 052776 - PRINTER CONSOLIDATION COST 2,412 2,401 7,449 7,449 7,449 052874 - OFFICE SERVICES PRINTING 124 10 111 111 111 052875 - OFFICE SERVICES RECORDS 249 101 0 0 0 0
Operating Total 73,160 64,249 68,957 68,957 128,957 60,000
Grand Total 1,328,811 1,346,961 1,482,969 1,482,969 1,617,257 134,288
Revenue46170 - REIMBURSEMENT FR OTHER FUNDS 82,802 75,000 75,000 75,000 75,000 046173 - REIMBURSEMENT FR UTILITY FUND 914,587 834,384 963,930 963,930 951,930 (12,000)Total Revenue 997,389 909,384 1,038,930 1,038,930 1,026,930 (12,000)
* 2017 Amended Budget as of 8/29/2017

City Auditor Page 6-6 2018 Budget
This page left intentionally blank.
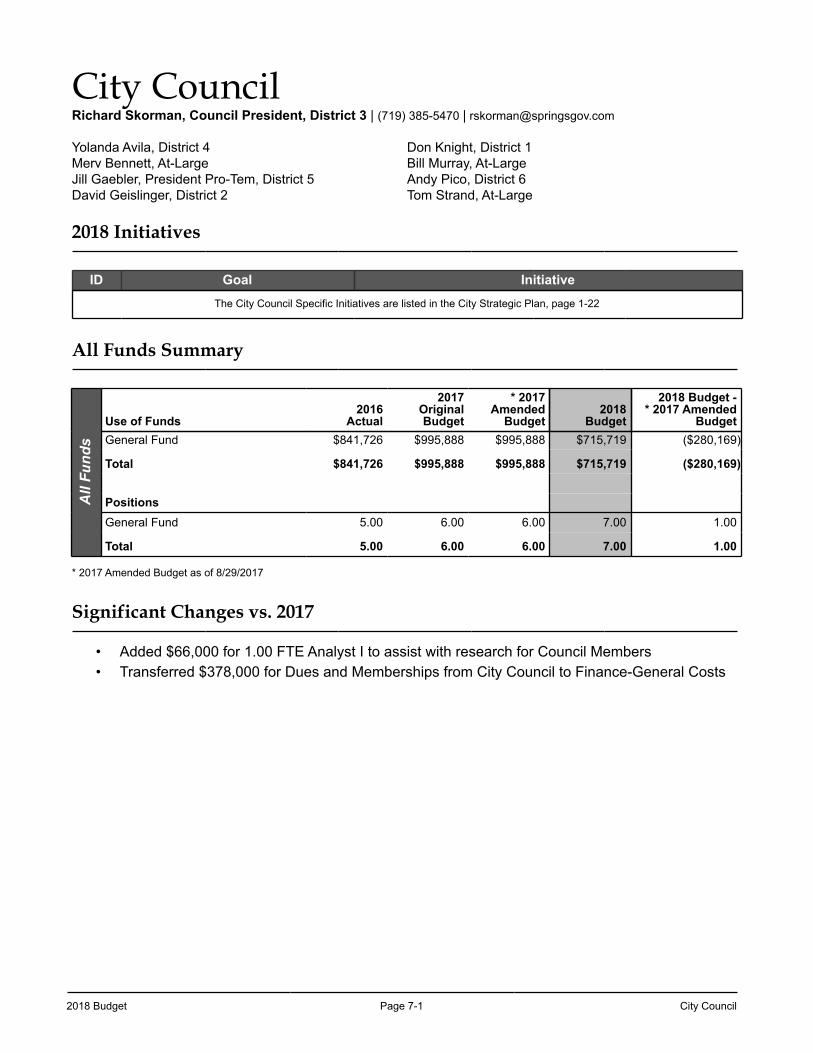
2018 Budget Page 7-1 City Council
City CouncilRichard Skorman, Council President, District 3 | (719) 385-5470 | [email protected]
Yolanda Avila, District 4 Don Knight, District 1Merv Bennett, At-Large Bill Murray, At-LargeJill Gaebler, President Pro-Tem, District 5 Andy Pico, District 6David Geislinger, District 2 Tom Strand, At-Large
2018 Initiatives
ID Goal InitiativeThe City Council Specific Initiatives are listed in the City Strategic Plan, page 1-22
All Funds Summary
All
Fund
s
Use of Funds2016
Actual
2017OriginalBudget
* 2017Amended
Budget2018
Budget
2018 Budget -* 2017 Amended
BudgetGeneral Fund $841,726 $995,888 $995,888 $715,719 ($280,169)
Total $841,726 $995,888 $995,888 $715,719 ($280,169)
PositionsGeneral Fund 5.00 6.00 6.00 7.00 1.00
Total 5.00 6.00 6.00 7.00 1.00
* 2017 Amended Budget as of 8/29/2017
Significant Changes vs. 2017
• Added $66,000 for 1.00 FTE Analyst I to assist with research for Council Members• Transferred $378,000 for Dues and Memberships from City Council to Finance-General Costs
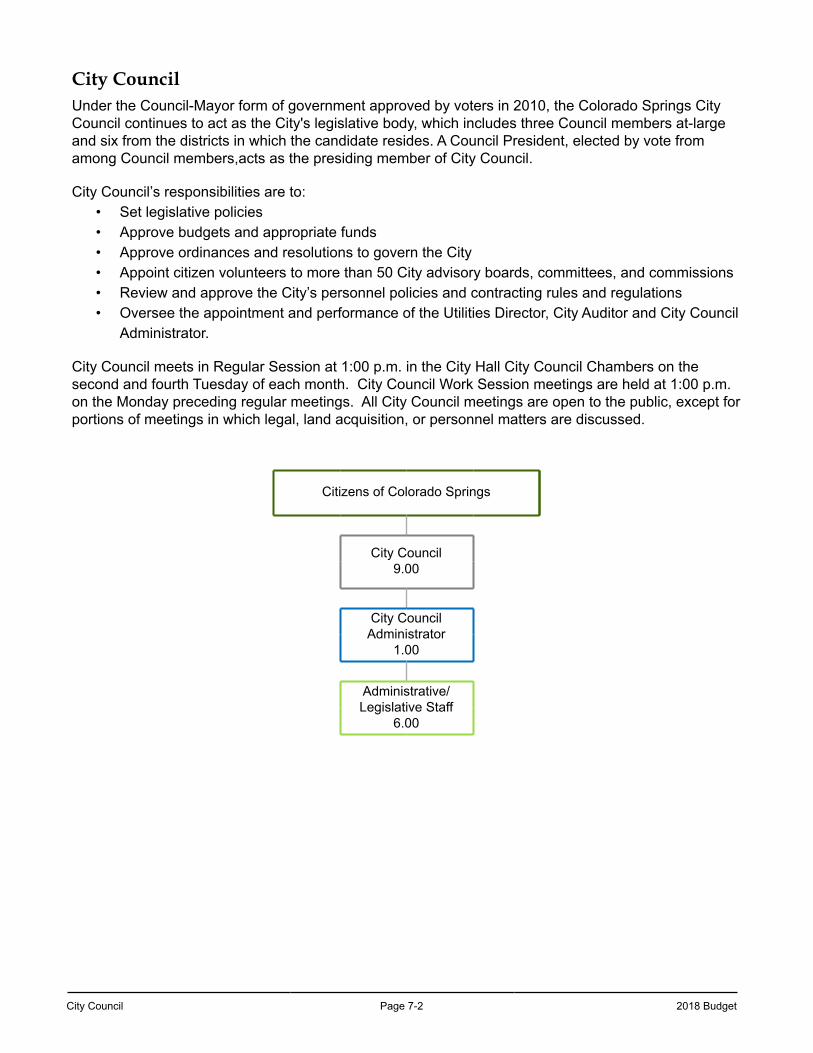
City Council Page 7-2 2018 Budget
City CouncilUnder the Council-Mayor form of government approved by voters in 2010, the Colorado Springs City Council continues to act as the City's legislative body, which includes three Council members at-large and six from the districts in which the candidate resides. A Council President, elected by vote from among Council members,acts as the presiding member of City Council.
City Council’s responsibilities are to:• Set legislative policies • Approve budgets and appropriate funds• Approve ordinances and resolutions to govern the City • Appoint citizen volunteers to more than 50 City advisory boards, committees, and commissions • Review and approve the City’s personnel policies and contracting rules and regulations• Oversee the appointment and performance of the Utilities Director, City Auditor and City Council
Administrator.
City Council meets in Regular Session at 1:00 p.m. in the City Hall City Council Chambers on the second and fourth Tuesday of each month. City Council Work Session meetings are held at 1:00 p.m. on the Monday preceding regular meetings. All City Council meetings are open to the public, except for portions of meetings in which legal, land acquisition, or personnel matters are discussed.
Citizens of Colorado Springs
City Council9.00
City CouncilAdministrator
1.00
Administrative/Legislative Staff
6.00
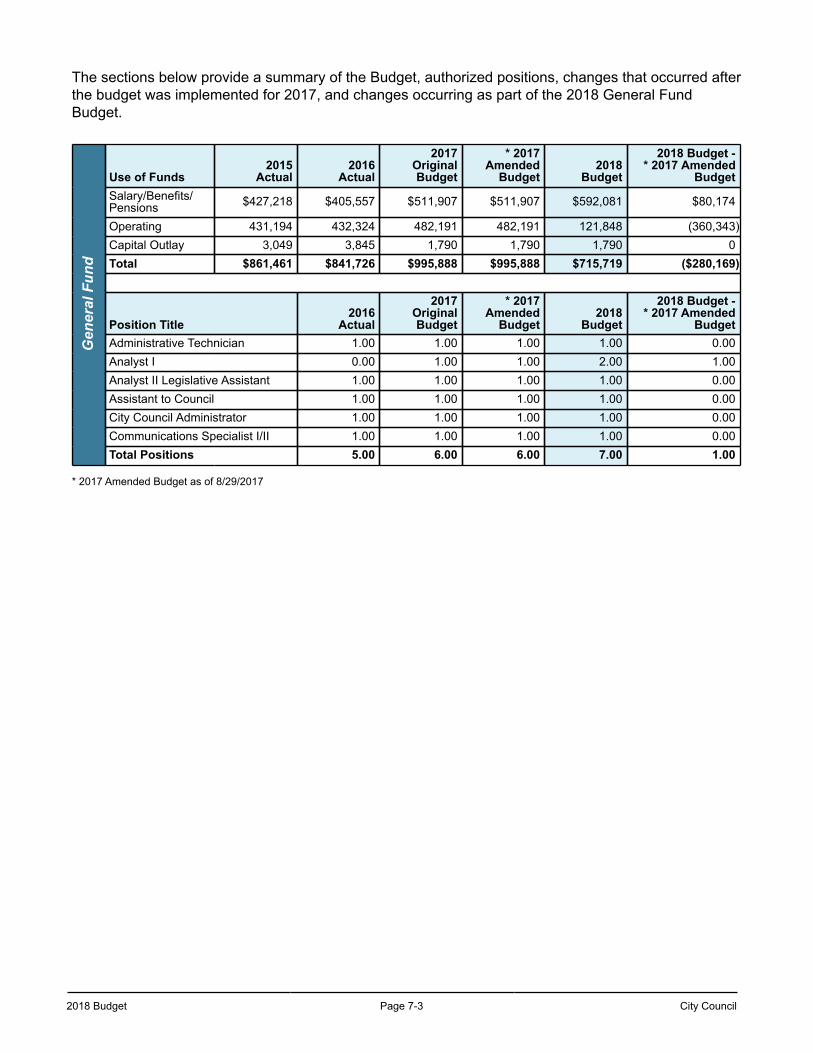
2018 Budget Page 7-3 City Council
The sections below provide a summary of the Budget, authorized positions, changes that occurred after the budget was implemented for 2017, and changes occurring as part of the 2018 General Fund Budget.
Gen
eral
Fun
d
Use of Funds2015
Actual2016
Actual
2017OriginalBudget
* 2017Amended
Budget2018
Budget
2018 Budget -* 2017 Amended
BudgetSalary/Benefits/Pensions $427,218 $405,557 $511,907 $511,907 $592,081 $80,174
Operating 431,194 432,324 482,191 482,191 121,848 (360,343)Capital Outlay 3,049 3,845 1,790 1,790 1,790 0Total $861,461 $841,726 $995,888 $995,888 $715,719 ($280,169)
Position Title2016
Actual
2017OriginalBudget
* 2017Amended
Budget2018
Budget
2018 Budget -* 2017 Amended
BudgetAdministrative Technician 1.00 1.00 1.00 1.00 0.00Analyst I 0.00 1.00 1.00 2.00 1.00Analyst II Legislative Assistant 1.00 1.00 1.00 1.00 0.00Assistant to Council 1.00 1.00 1.00 1.00 0.00City Council Administrator 1.00 1.00 1.00 1.00 0.00Communications Specialist I/II 1.00 1.00 1.00 1.00 0.00Total Positions 5.00 6.00 6.00 7.00 1.00
* 2017 Amended Budget as of 8/29/2017
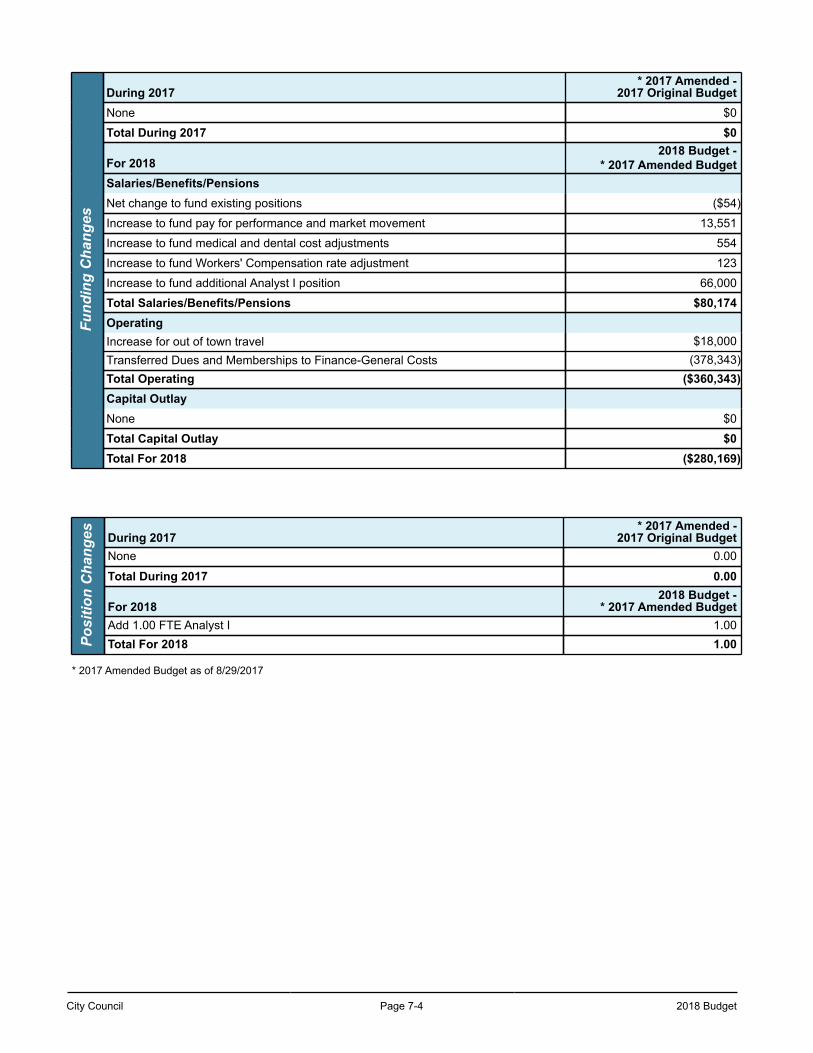
City Council Page 7-4 2018 Budget
Fund
ing
Cha
nges
During 2017* 2017 Amended -
2017 Original BudgetNone $0
Total During 2017 $0
For 20182018 Budget -
* 2017 Amended BudgetSalaries/Benefits/PensionsNet change to fund existing positions ($54)
Increase to fund pay for performance and market movement 13,551
Increase to fund medical and dental cost adjustments 554
Increase to fund Workers' Compensation rate adjustment 123
Increase to fund additional Analyst I position 66,000
Total Salaries/Benefits/Pensions $80,174OperatingIncrease for out of town travel $18,000Transferred Dues and Memberships to Finance-General Costs (378,343)Total Operating ($360,343)Capital OutlayNone $0
Total Capital Outlay $0Total For 2018 ($280,169)
Posi
tion
Cha
nges During 2017
* 2017 Amended -2017 Original Budget
None 0.00
Total During 2017 0.00
For 20182018 Budget -
* 2017 Amended BudgetAdd 1.00 FTE Analyst I 1.00Total For 2018 1.00
* 2017 Amended Budget as of 8/29/2017
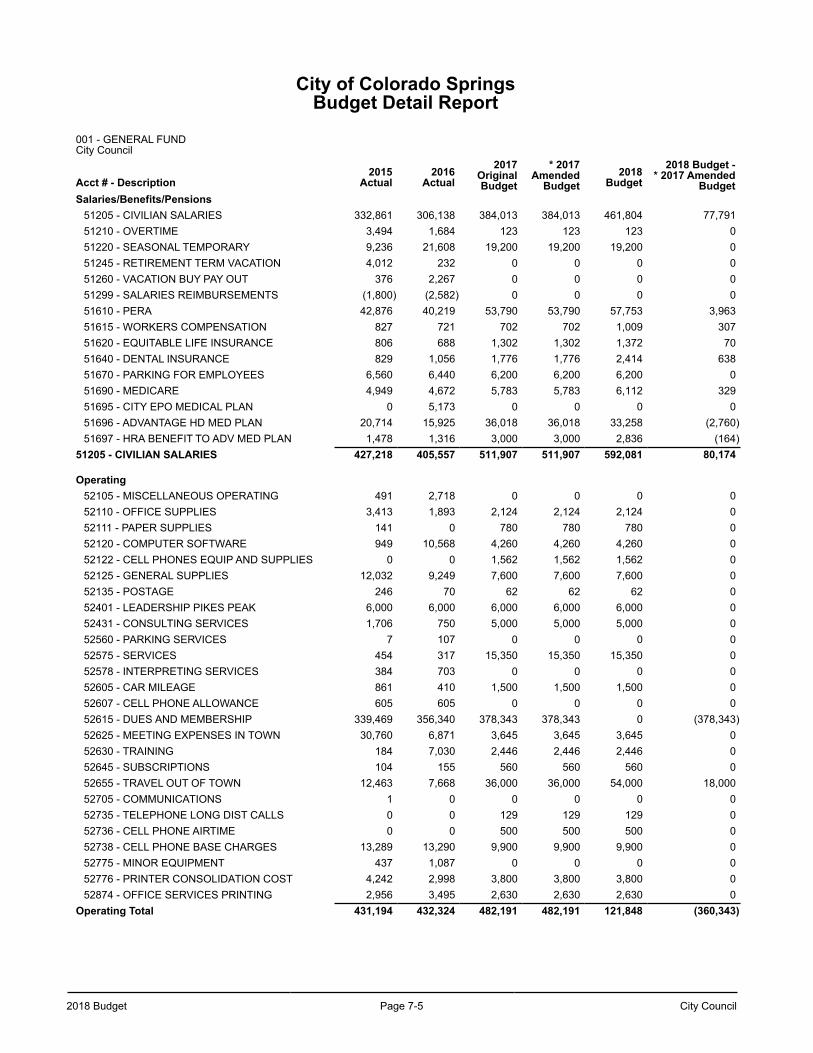
2018 Budget Page 7-5 City Council
City of Colorado SpringsBudget Detail Report
001 - GENERAL FUND City Council
Acct # - Description2015
Actual2016
Actual2017
OriginalBudget
* 2017Amended
Budget2018
Budget2018 Budget -
* 2017 AmendedBudget
Salaries/Benefits/Pensions51205 - CIVILIAN SALARIES 332,861 306,138 384,013 384,013 461,804 77,79151210 - OVERTIME 3,494 1,684 123 123 123 051220 - SEASONAL TEMPORARY 9,236 21,608 19,200 19,200 19,200 051245 - RETIREMENT TERM VACATION 4,012 232 0 0 0 051260 - VACATION BUY PAY OUT 376 2,267 0 0 0 051299 - SALARIES REIMBURSEMENTS (1,800) (2,582) 0 0 0 051610 - PERA 42,876 40,219 53,790 53,790 57,753 3,96351615 - WORKERS COMPENSATION 827 721 702 702 1,009 30751620 - EQUITABLE LIFE INSURANCE 806 688 1,302 1,302 1,372 7051640 - DENTAL INSURANCE 829 1,056 1,776 1,776 2,414 63851670 - PARKING FOR EMPLOYEES 6,560 6,440 6,200 6,200 6,200 051690 - MEDICARE 4,949 4,672 5,783 5,783 6,112 32951695 - CITY EPO MEDICAL PLAN 0 5,173 0 0 0 051696 - ADVANTAGE HD MED PLAN 20,714 15,925 36,018 36,018 33,258 (2,760)51697 - HRA BENEFIT TO ADV MED PLAN 1,478 1,316 3,000 3,000 2,836 (164)
51205 - CIVILIAN SALARIES 427,218 405,557 511,907 511,907 592,081 80,174
Operating52105 - MISCELLANEOUS OPERATING 491 2,718 0 0 0 052110 - OFFICE SUPPLIES 3,413 1,893 2,124 2,124 2,124 052111 - PAPER SUPPLIES 141 0 780 780 780 052120 - COMPUTER SOFTWARE 949 10,568 4,260 4,260 4,260 052122 - CELL PHONES EQUIP AND SUPPLIES 0 0 1,562 1,562 1,562 052125 - GENERAL SUPPLIES 12,032 9,249 7,600 7,600 7,600 052135 - POSTAGE 246 70 62 62 62 052401 - LEADERSHIP PIKES PEAK 6,000 6,000 6,000 6,000 6,000 052431 - CONSULTING SERVICES 1,706 750 5,000 5,000 5,000 052560 - PARKING SERVICES 7 107 0 0 0 052575 - SERVICES 454 317 15,350 15,350 15,350 052578 - INTERPRETING SERVICES 384 703 0 0 0 052605 - CAR MILEAGE 861 410 1,500 1,500 1,500 052607 - CELL PHONE ALLOWANCE 605 605 0 0 0 052615 - DUES AND MEMBERSHIP 339,469 356,340 378,343 378,343 0 (378,343)52625 - MEETING EXPENSES IN TOWN 30,760 6,871 3,645 3,645 3,645 052630 - TRAINING 184 7,030 2,446 2,446 2,446 052645 - SUBSCRIPTIONS 104 155 560 560 560 052655 - TRAVEL OUT OF TOWN 12,463 7,668 36,000 36,000 54,000 18,00052705 - COMMUNICATIONS 1 0 0 0 0 052735 - TELEPHONE LONG DIST CALLS 0 0 129 129 129 052736 - CELL PHONE AIRTIME 0 0 500 500 500 052738 - CELL PHONE BASE CHARGES 13,289 13,290 9,900 9,900 9,900 052775 - MINOR EQUIPMENT 437 1,087 0 0 0 052776 - PRINTER CONSOLIDATION COST 4,242 2,998 3,800 3,800 3,800 052874 - OFFICE SERVICES PRINTING 2,956 3,495 2,630 2,630 2,630 0
Operating Total 431,194 432,324 482,191 482,191 121,848 (360,343)
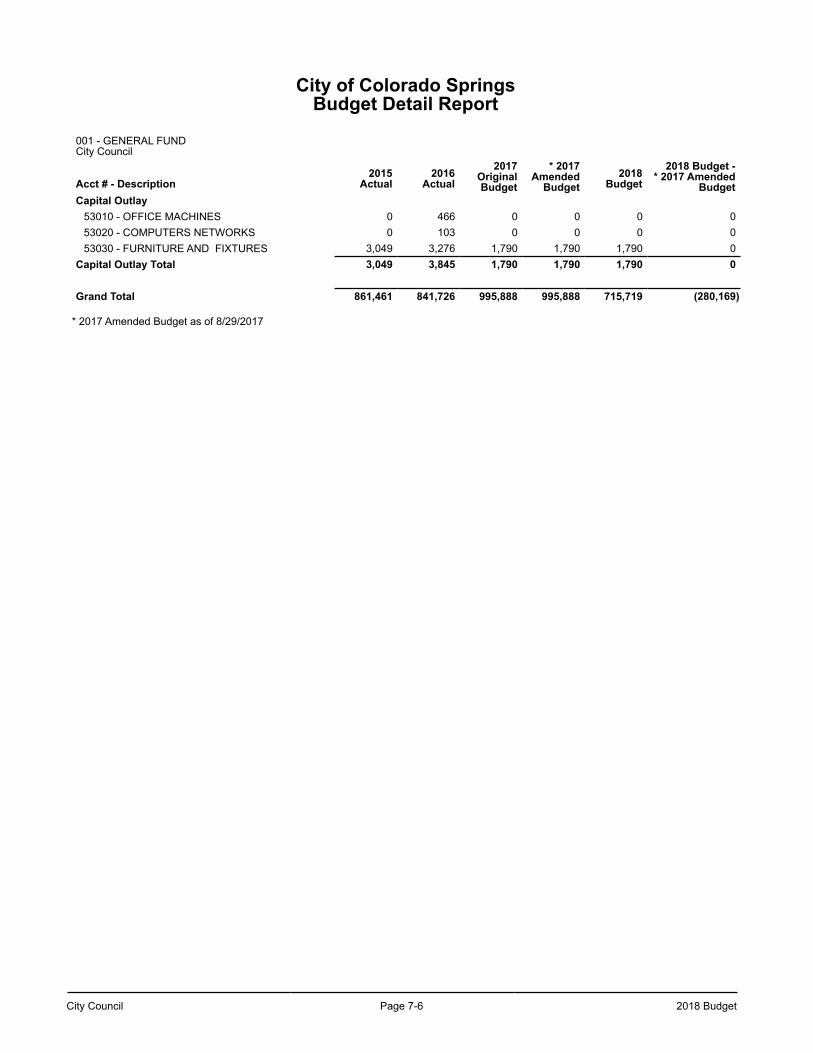
City Council Page 7-6 2018 Budget
City of Colorado SpringsBudget Detail Report
001 - GENERAL FUND City Council
Acct # - Description2015
Actual2016
Actual2017
OriginalBudget
* 2017Amended
Budget2018
Budget2018 Budget -
* 2017 AmendedBudget
Capital Outlay53010 - OFFICE MACHINES 0 466 0 0 0 053020 - COMPUTERS NETWORKS 0 103 0 0 0 053030 - FURNITURE AND FIXTURES 3,049 3,276 1,790 1,790 1,790 0
Capital Outlay Total 3,049 3,845 1,790 1,790 1,790 0
Grand Total 861,461 841,726 995,888 995,888 715,719 (280,169)
* 2017 Amended Budget as of 8/29/2017
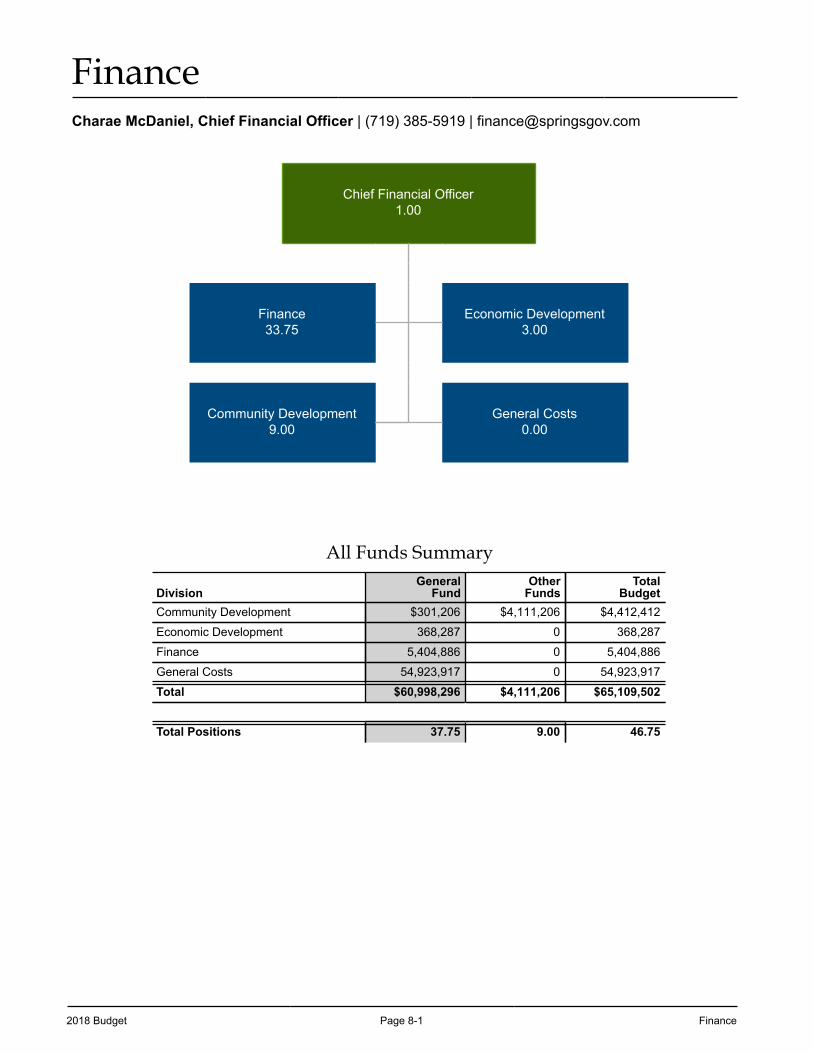
2018 Budget Page 8-1 Finance
FinanceCharae McDaniel, Chief Financial Officer | (719) 385-5919 | [email protected]
Chief Financial Officer1.00
Finance33.75
Economic Development3.00
Community Development9.00
General Costs0.00
All Funds Summary
DivisionGeneral
FundOther
FundsTotal
BudgetCommunity Development $301,206 $4,111,206 $4,412,412
Economic Development 368,287 0 368,287
Finance 5,404,886 0 5,404,886
General Costs 54,923,917 0 54,923,917
Total $60,998,296 $4,111,206 $65,109,502
Total Positions 37.75 9.00 46.75
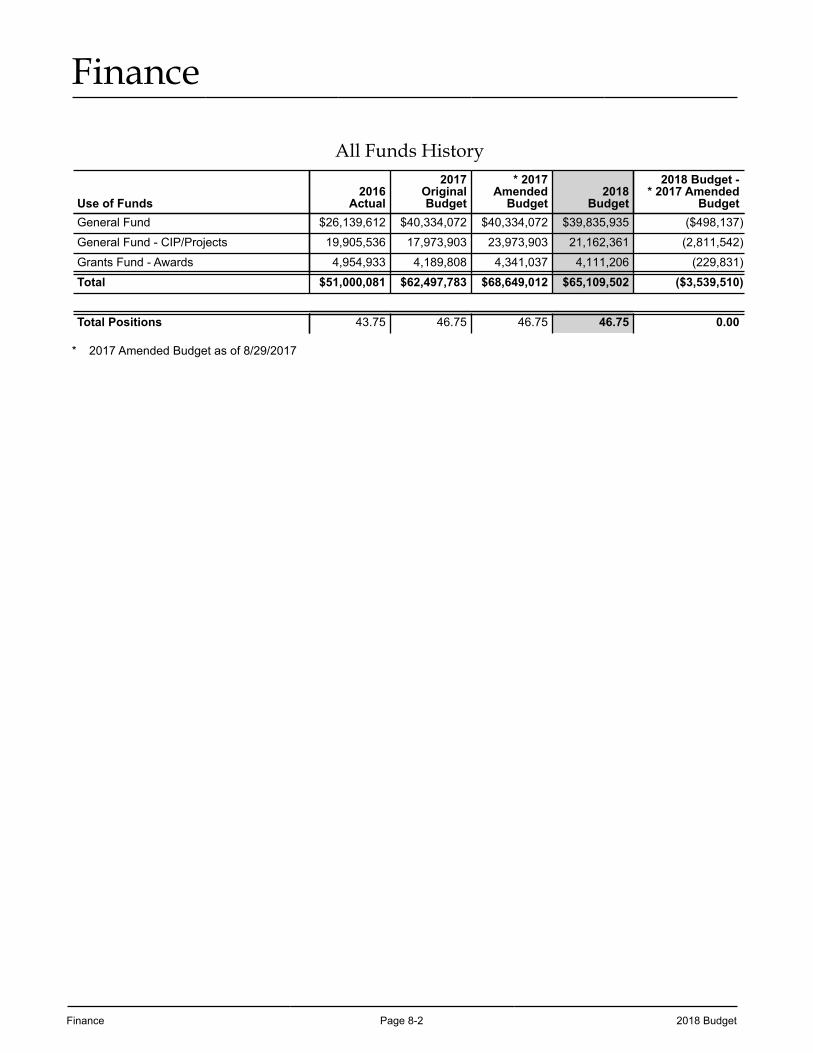
Finance Page 8-2 2018 Budget
Finance
All Funds History
Use of Funds2016
Actual
2017OriginalBudget
* 2017Amended
Budget2018
Budget
2018 Budget -* 2017 Amended
BudgetGeneral Fund $26,139,612 $40,334,072 $40,334,072 $39,835,935 ($498,137)
General Fund - CIP/Projects 19,905,536 17,973,903 23,973,903 21,162,361 (2,811,542)
Grants Fund - Awards 4,954,933 4,189,808 4,341,037 4,111,206 (229,831)
Total $51,000,081 $62,497,783 $68,649,012 $65,109,502 ($3,539,510)
Total Positions 43.75 46.75 46.75 46.75 0.00
* 2017 Amended Budget as of 8/29/2017
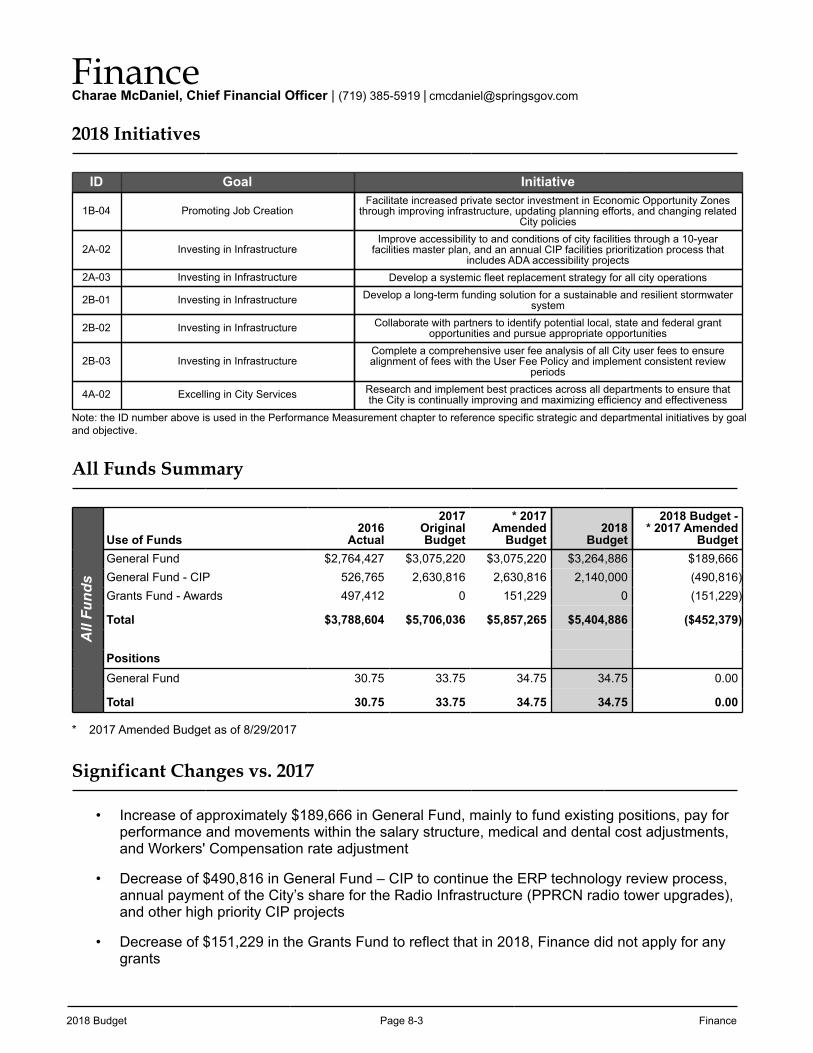
2018 Budget Page 8-3 Finance
FinanceCharae McDaniel, Chief Financial Officer | (719) 385-5919 | [email protected]
2018 Initiatives
ID Goal Initiative
1B-04 Promoting Job CreationFacilitate increased private sector investment in Economic Opportunity Zones
through improving infrastructure, updating planning efforts, and changing related City policies
2A-02 Investing in InfrastructureImprove accessibility to and conditions of city facilities through a 10-year
facilities master plan, and an annual CIP facilities prioritization process that includes ADA accessibility projects
2A-03 Investing in Infrastructure Develop a systemic fleet replacement strategy for all city operations
2B-01 Investing in Infrastructure Develop a long-term funding solution for a sustainable and resilient stormwater system
2B-02 Investing in Infrastructure Collaborate with partners to identify potential local, state and federal grant opportunities and pursue appropriate opportunities
2B-03 Investing in InfrastructureComplete a comprehensive user fee analysis of all City user fees to ensure alignment of fees with the User Fee Policy and implement consistent review
periods
4A-02 Excelling in City Services Research and implement best practices across all departments to ensure that the City is continually improving and maximizing efficiency and effectiveness
Note: the ID number above is used in the Performance Measurement chapter to reference specific strategic and departmental initiatives by goal and objective.
All Funds Summary
All
Fund
s
Use of Funds2016
Actual
2017OriginalBudget
* 2017Amended
Budget2018
Budget
2018 Budget -* 2017 Amended
BudgetGeneral Fund $2,764,427 $3,075,220 $3,075,220 $3,264,886 $189,666General Fund - CIP 526,765 2,630,816 2,630,816 2,140,000 (490,816)Grants Fund - Awards 497,412 0 151,229 0 (151,229)
Total $3,788,604 $5,706,036 $5,857,265 $5,404,886 ($452,379)
PositionsGeneral Fund 30.75 33.75 34.75 34.75 0.00
Total 30.75 33.75 34.75 34.75 0.00
* 2017 Amended Budget as of 8/29/2017
Significant Changes vs. 2017
• Increase of approximately $189,666 in General Fund, mainly to fund existing positions, pay for performance and movements within the salary structure, medical and dental cost adjustments, and Workers' Compensation rate adjustment
• Decrease of $490,816 in General Fund – CIP to continue the ERP technology review process, annual payment of the City’s share for the Radio Infrastructure (PPRCN radio tower upgrades), and other high priority CIP projects
• Decrease of $151,229 in the Grants Fund to reflect that in 2018, Finance did not apply for any grants
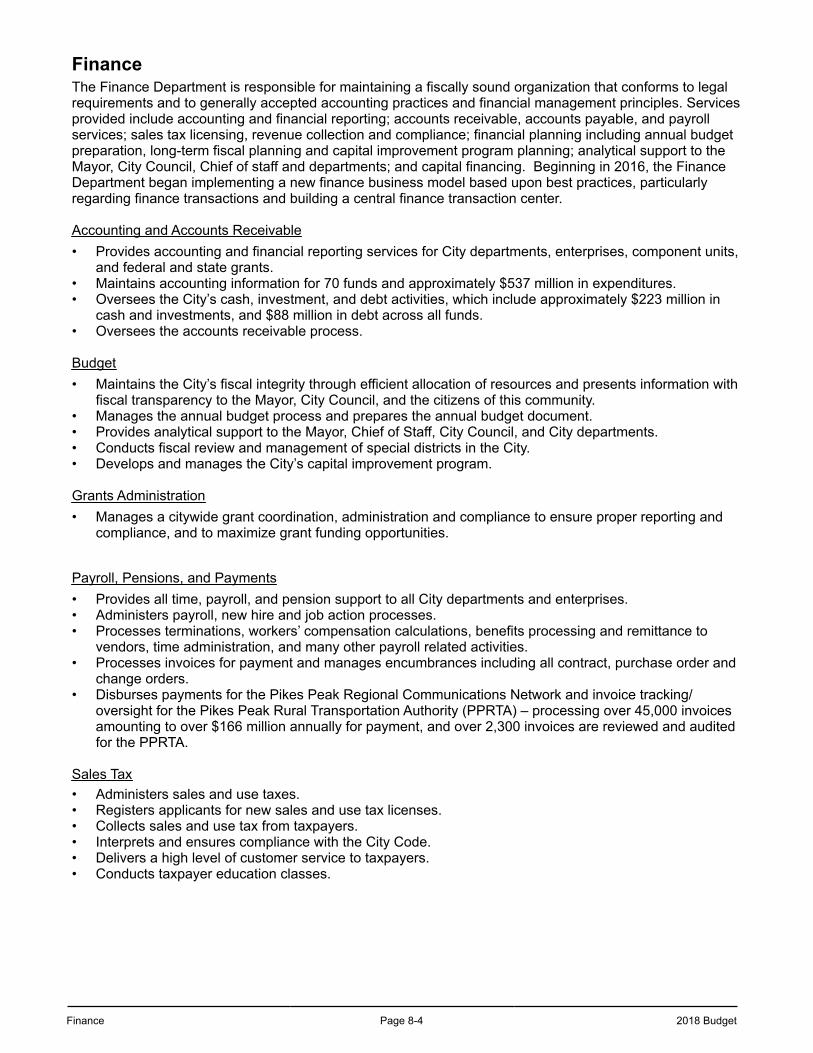
Finance Page 8-4 2018 Budget
FinanceThe Finance Department is responsible for maintaining a fiscally sound organization that conforms to legal requirements and to generally accepted accounting practices and financial management principles. Services provided include accounting and financial reporting; accounts receivable, accounts payable, and payroll services; sales tax licensing, revenue collection and compliance; financial planning including annual budget preparation, long-term fiscal planning and capital improvement program planning; analytical support to the Mayor, City Council, Chief of staff and departments; and capital financing. Beginning in 2016, the Finance Department began implementing a new finance business model based upon best practices, particularly regarding finance transactions and building a central finance transaction center.
Accounting and Accounts Receivable• Provides accounting and financial reporting services for City departments, enterprises, component units,
and federal and state grants. • Maintains accounting information for 70 funds and approximately $537 million in expenditures.• Oversees the City’s cash, investment, and debt activities, which include approximately $223 million in
cash and investments, and $88 million in debt across all funds.• Oversees the accounts receivable process.
Budget • Maintains the City’s fiscal integrity through efficient allocation of resources and presents information with
fiscal transparency to the Mayor, City Council, and the citizens of this community.• Manages the annual budget process and prepares the annual budget document.• Provides analytical support to the Mayor, Chief of Staff, City Council, and City departments.• Conducts fiscal review and management of special districts in the City.• Develops and manages the City’s capital improvement program.
Grants Administration• Manages a citywide grant coordination, administration and compliance to ensure proper reporting and
compliance, and to maximize grant funding opportunities.
Payroll, Pensions, and Payments• Provides all time, payroll, and pension support to all City departments and enterprises.• Administers payroll, new hire and job action processes.• Processes terminations, workers’ compensation calculations, benefits processing and remittance to
vendors, time administration, and many other payroll related activities.• Processes invoices for payment and manages encumbrances including all contract, purchase order and
change orders.• Disburses payments for the Pikes Peak Regional Communications Network and invoice tracking/
oversight for the Pikes Peak Rural Transportation Authority (PPRTA) – processing over 45,000 invoices amounting to over $166 million annually for payment, and over 2,300 invoices are reviewed and audited for the PPRTA.
Sales Tax• Administers sales and use taxes.• Registers applicants for new sales and use tax licenses.• Collects sales and use tax from taxpayers.• Interprets and ensures compliance with the City Code.• Delivers a high level of customer service to taxpayers.• Conducts taxpayer education classes.
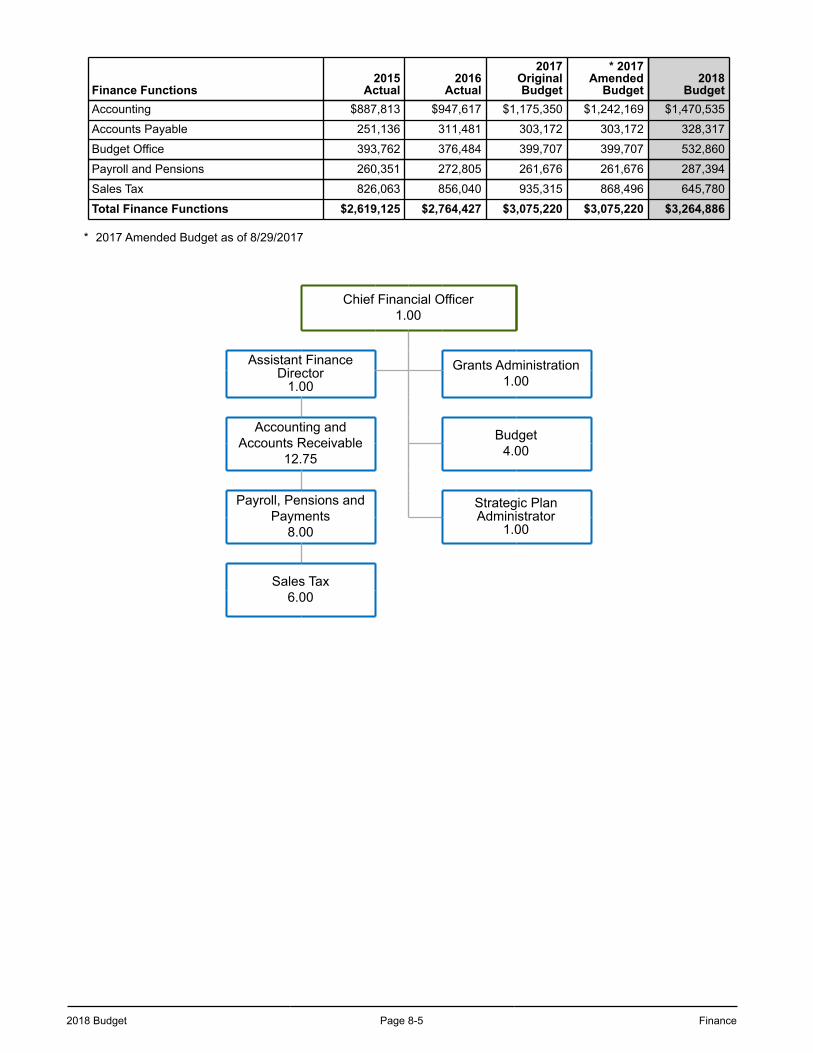
2018 Budget Page 8-5 Finance
Finance Functions2015
Actual2016
Actual
2017OriginalBudget
* 2017Amended
Budget2018
BudgetAccounting $887,813 $947,617 $1,175,350 $1,242,169 $1,470,535
Accounts Payable 251,136 311,481 303,172 303,172 328,317
Budget Office 393,762 376,484 399,707 399,707 532,860
Payroll and Pensions 260,351 272,805 261,676 261,676 287,394
Sales Tax 826,063 856,040 935,315 868,496 645,780
Total Finance Functions $2,619,125 $2,764,427 $3,075,220 $3,075,220 $3,264,886
* 2017 Amended Budget as of 8/29/2017
Chief Financial Officer1.00
Assistant Finance Director
1.00Grants Administration
1.00
Accounting and Accounts Receivable
12.75
Budget4.00
Payroll, Pensions and Payments
8.00
Strategic Plan Administrator
1.00
Sales Tax6.00
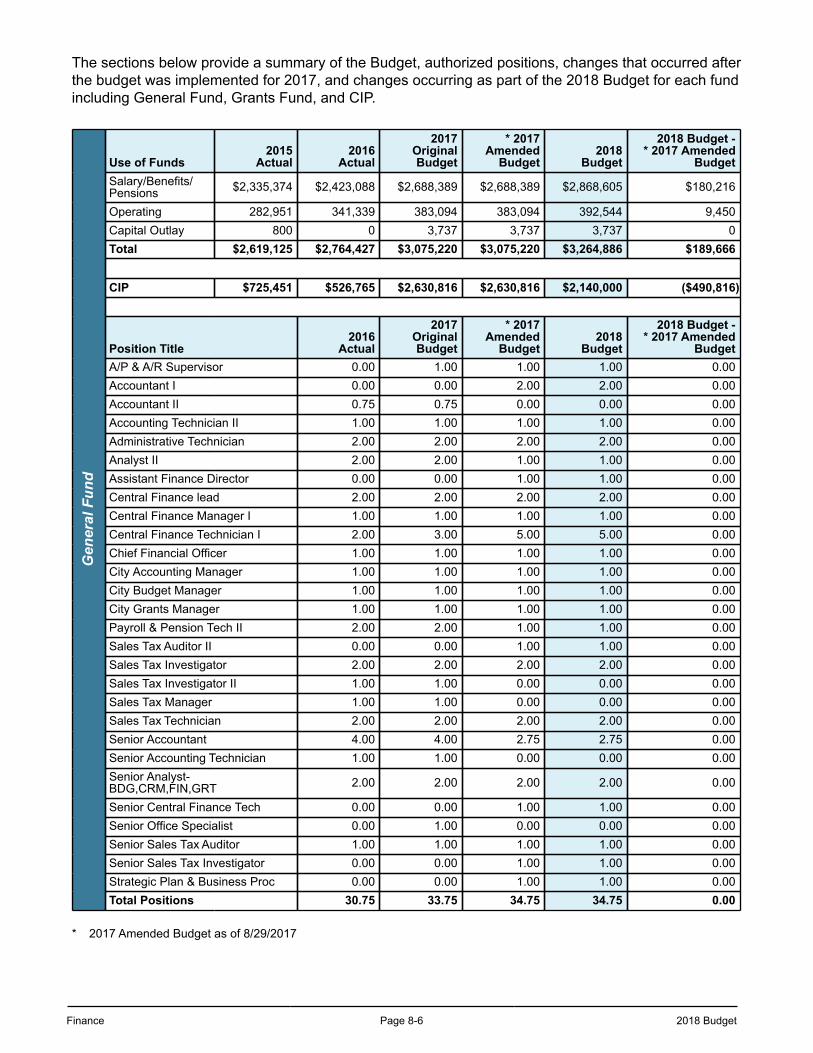
Finance Page 8-6 2018 Budget
The sections below provide a summary of the Budget, authorized positions, changes that occurred after the budget was implemented for 2017, and changes occurring as part of the 2018 Budget for each fund including General Fund, Grants Fund, and CIP.
Gen
eral
Fun
d
Use of Funds2015
Actual2016
Actual
2017OriginalBudget
* 2017Amended
Budget2018
Budget
2018 Budget -* 2017 Amended
BudgetSalary/Benefits/Pensions $2,335,374 $2,423,088 $2,688,389 $2,688,389 $2,868,605 $180,216
Operating 282,951 341,339 383,094 383,094 392,544 9,450Capital Outlay 800 0 3,737 3,737 3,737 0Total $2,619,125 $2,764,427 $3,075,220 $3,075,220 $3,264,886 $189,666
CIP $725,451 $526,765 $2,630,816 $2,630,816 $2,140,000 ($490,816)
Position Title2016
Actual
2017OriginalBudget
* 2017Amended
Budget2018
Budget
2018 Budget -* 2017 Amended
BudgetA/P & A/R Supervisor 0.00 1.00 1.00 1.00 0.00Accountant I 0.00 0.00 2.00 2.00 0.00Accountant II 0.75 0.75 0.00 0.00 0.00Accounting Technician II 1.00 1.00 1.00 1.00 0.00Administrative Technician 2.00 2.00 2.00 2.00 0.00Analyst II 2.00 2.00 1.00 1.00 0.00Assistant Finance Director 0.00 0.00 1.00 1.00 0.00Central Finance lead 2.00 2.00 2.00 2.00 0.00Central Finance Manager I 1.00 1.00 1.00 1.00 0.00Central Finance Technician I 2.00 3.00 5.00 5.00 0.00Chief Financial Officer 1.00 1.00 1.00 1.00 0.00City Accounting Manager 1.00 1.00 1.00 1.00 0.00City Budget Manager 1.00 1.00 1.00 1.00 0.00City Grants Manager 1.00 1.00 1.00 1.00 0.00Payroll & Pension Tech II 2.00 2.00 1.00 1.00 0.00Sales Tax Auditor II 0.00 0.00 1.00 1.00 0.00Sales Tax Investigator 2.00 2.00 2.00 2.00 0.00Sales Tax Investigator II 1.00 1.00 0.00 0.00 0.00Sales Tax Manager 1.00 1.00 0.00 0.00 0.00Sales Tax Technician 2.00 2.00 2.00 2.00 0.00Senior Accountant 4.00 4.00 2.75 2.75 0.00Senior Accounting Technician 1.00 1.00 0.00 0.00 0.00Senior Analyst-BDG,CRM,FIN,GRT 2.00 2.00 2.00 2.00 0.00
Senior Central Finance Tech 0.00 0.00 1.00 1.00 0.00Senior Office Specialist 0.00 1.00 0.00 0.00 0.00Senior Sales Tax Auditor 1.00 1.00 1.00 1.00 0.00Senior Sales Tax Investigator 0.00 0.00 1.00 1.00 0.00Strategic Plan & Business Proc 0.00 0.00 1.00 1.00 0.00Total Positions 30.75 33.75 34.75 34.75 0.00
* 2017 Amended Budget as of 8/29/2017
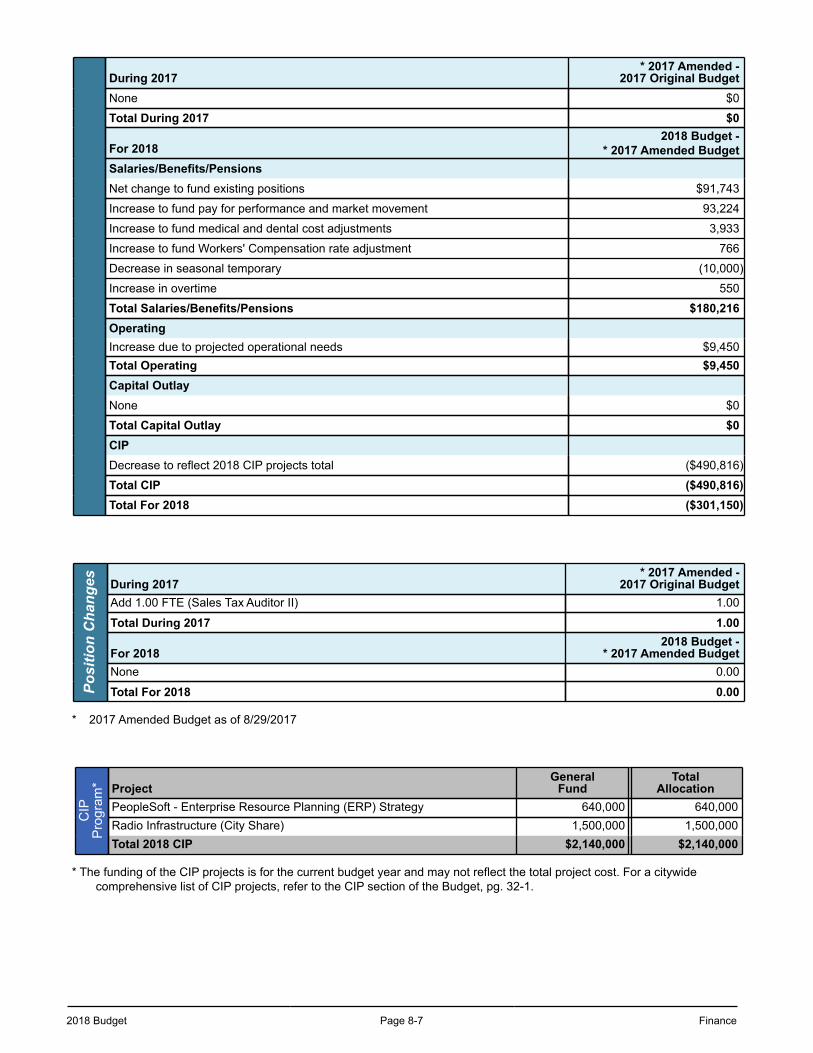
2018 Budget Page 8-7 Finance
During 2017* 2017 Amended -
2017 Original BudgetNone $0
Total During 2017 $0
For 20182018 Budget -
* 2017 Amended BudgetSalaries/Benefits/PensionsNet change to fund existing positions $91,743
Increase to fund pay for performance and market movement 93,224
Increase to fund medical and dental cost adjustments 3,933
Increase to fund Workers' Compensation rate adjustment 766
Decrease in seasonal temporary (10,000)
Increase in overtime 550
Total Salaries/Benefits/Pensions $180,216OperatingIncrease due to projected operational needs $9,450Total Operating $9,450Capital OutlayNone $0
Total Capital Outlay $0CIPDecrease to reflect 2018 CIP projects total ($490,816)
Total CIP ($490,816)Total For 2018 ($301,150)
Posi
tion
Cha
nges During 2017
* 2017 Amended -2017 Original Budget
Add 1.00 FTE (Sales Tax Auditor II) 1.00
Total During 2017 1.00
For 20182018 Budget -
* 2017 Amended BudgetNone 0.00
Total For 2018 0.00
* 2017 Amended Budget as of 8/29/2017
CIP
Pro
gram
* ProjectGeneral
FundTotal
AllocationPeopleSoft - Enterprise Resource Planning (ERP) Strategy 640,000 640,000Radio Infrastructure (City Share) 1,500,000 1,500,000Total 2018 CIP $2,140,000 $2,140,000
* The funding of the CIP projects is for the current budget year and may not reflect the total project cost. For a citywide comprehensive list of CIP projects, refer to the CIP section of the Budget, pg. 32-1.
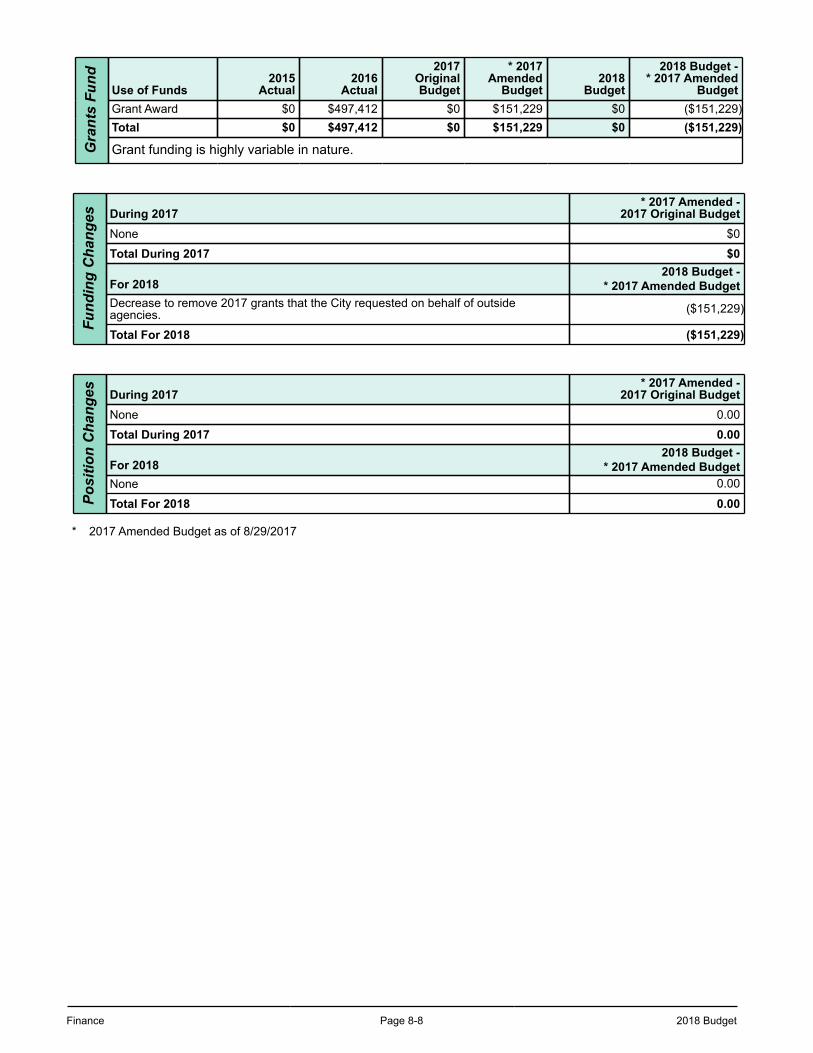
Finance Page 8-8 2018 Budget
Gra
nts
Fund
Use of Funds2015
Actual2016
Actual
2017OriginalBudget
* 2017Amended
Budget2018
Budget
2018 Budget -* 2017 Amended
BudgetGrant Award $0 $497,412 $0 $151,229 $0 ($151,229)Total $0 $497,412 $0 $151,229 $0 ($151,229)
Grant funding is highly variable in nature.
Fund
ing
Cha
nges During 2017
* 2017 Amended -2017 Original Budget
None $0
Total During 2017 $0
For 20182018 Budget -
* 2017 Amended BudgetDecrease to remove 2017 grants that the City requested on behalf of outsideagencies. ($151,229)
Total For 2018 ($151,229)
Posi
tion
Cha
nges During 2017
* 2017 Amended -2017 Original Budget
None 0.00
Total During 2017 0.00
For 20182018 Budget -
* 2017 Amended BudgetNone 0.00
Total For 2018 0.00
* 2017 Amended Budget as of 8/29/2017
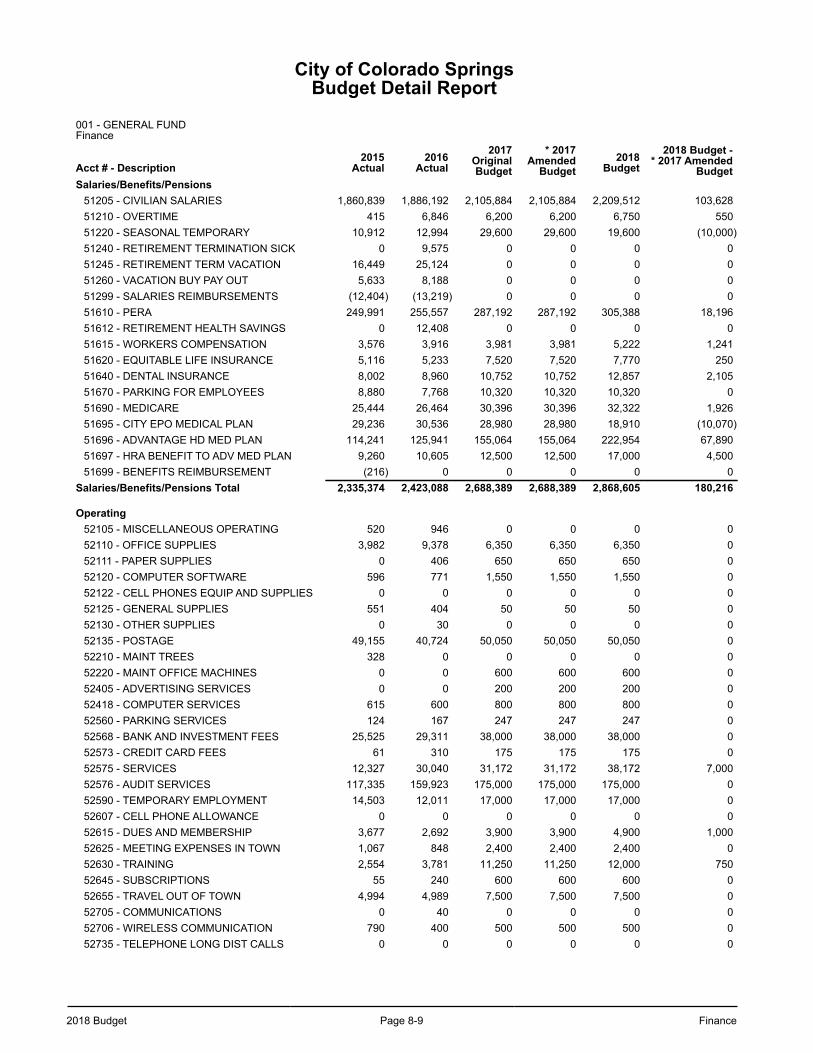
2018 Budget Page 8-9 Finance
City of Colorado SpringsBudget Detail Report
001 - GENERAL FUND Finance
Acct # - Description2015
Actual2016
Actual2017
OriginalBudget
* 2017Amended
Budget2018
Budget2018 Budget -
* 2017 AmendedBudget
Salaries/Benefits/Pensions51205 - CIVILIAN SALARIES 1,860,839 1,886,192 2,105,884 2,105,884 2,209,512 103,62851210 - OVERTIME 415 6,846 6,200 6,200 6,750 55051220 - SEASONAL TEMPORARY 10,912 12,994 29,600 29,600 19,600 (10,000)51240 - RETIREMENT TERMINATION SICK 0 9,575 0 0 0 051245 - RETIREMENT TERM VACATION 16,449 25,124 0 0 0 051260 - VACATION BUY PAY OUT 5,633 8,188 0 0 0 051299 - SALARIES REIMBURSEMENTS (12,404) (13,219) 0 0 0 051610 - PERA 249,991 255,557 287,192 287,192 305,388 18,19651612 - RETIREMENT HEALTH SAVINGS 0 12,408 0 0 0 051615 - WORKERS COMPENSATION 3,576 3,916 3,981 3,981 5,222 1,24151620 - EQUITABLE LIFE INSURANCE 5,116 5,233 7,520 7,520 7,770 25051640 - DENTAL INSURANCE 8,002 8,960 10,752 10,752 12,857 2,10551670 - PARKING FOR EMPLOYEES 8,880 7,768 10,320 10,320 10,320 051690 - MEDICARE 25,444 26,464 30,396 30,396 32,322 1,92651695 - CITY EPO MEDICAL PLAN 29,236 30,536 28,980 28,980 18,910 (10,070)51696 - ADVANTAGE HD MED PLAN 114,241 125,941 155,064 155,064 222,954 67,89051697 - HRA BENEFIT TO ADV MED PLAN 9,260 10,605 12,500 12,500 17,000 4,50051699 - BENEFITS REIMBURSEMENT (216) 0 0 0 0 0
Salaries/Benefits/Pensions Total 2,335,374 2,423,088 2,688,389 2,688,389 2,868,605 180,216
Operating52105 - MISCELLANEOUS OPERATING 520 946 0 0 0 052110 - OFFICE SUPPLIES 3,982 9,378 6,350 6,350 6,350 052111 - PAPER SUPPLIES 0 406 650 650 650 052120 - COMPUTER SOFTWARE 596 771 1,550 1,550 1,550 052122 - CELL PHONES EQUIP AND SUPPLIES 0 0 0 0 0 052125 - GENERAL SUPPLIES 551 404 50 50 50 052130 - OTHER SUPPLIES 0 30 0 0 0 052135 - POSTAGE 49,155 40,724 50,050 50,050 50,050 052210 - MAINT TREES 328 0 0 0 0 052220 - MAINT OFFICE MACHINES 0 0 600 600 600 052405 - ADVERTISING SERVICES 0 0 200 200 200 052418 - COMPUTER SERVICES 615 600 800 800 800 052560 - PARKING SERVICES 124 167 247 247 247 052568 - BANK AND INVESTMENT FEES 25,525 29,311 38,000 38,000 38,000 052573 - CREDIT CARD FEES 61 310 175 175 175 052575 - SERVICES 12,327 30,040 31,172 31,172 38,172 7,00052576 - AUDIT SERVICES 117,335 159,923 175,000 175,000 175,000 052590 - TEMPORARY EMPLOYMENT 14,503 12,011 17,000 17,000 17,000 052607 - CELL PHONE ALLOWANCE 0 0 0 0 0 052615 - DUES AND MEMBERSHIP 3,677 2,692 3,900 3,900 4,900 1,00052625 - MEETING EXPENSES IN TOWN 1,067 848 2,400 2,400 2,400 052630 - TRAINING 2,554 3,781 11,250 11,250 12,000 75052645 - SUBSCRIPTIONS 55 240 600 600 600 052655 - TRAVEL OUT OF TOWN 4,994 4,989 7,500 7,500 7,500 052705 - COMMUNICATIONS 0 40 0 0 0 052706 - WIRELESS COMMUNICATION 790 400 500 500 500 052735 - TELEPHONE LONG DIST CALLS 0 0 0 0 0 0
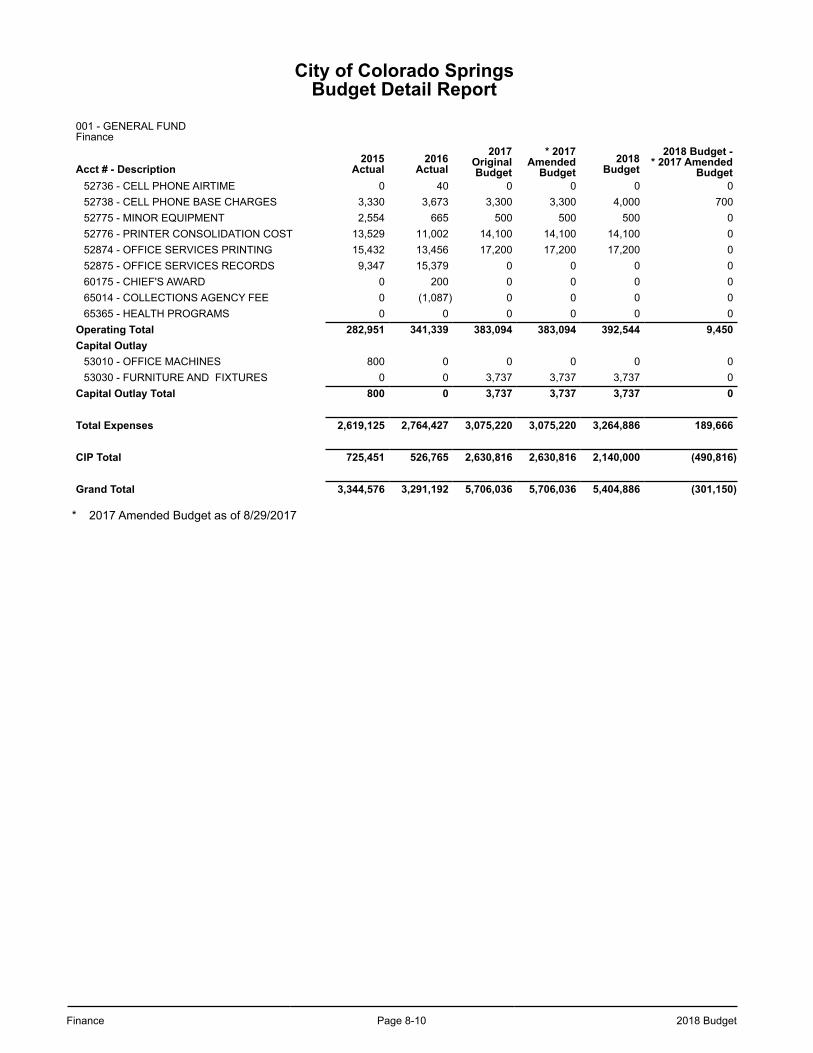
Finance Page 8-10 2018 Budget
City of Colorado SpringsBudget Detail Report
001 - GENERAL FUND Finance
Acct # - Description2015
Actual2016
Actual2017
OriginalBudget
* 2017Amended
Budget2018
Budget2018 Budget -
* 2017 AmendedBudget
52736 - CELL PHONE AIRTIME 0 40 0 0 0 052738 - CELL PHONE BASE CHARGES 3,330 3,673 3,300 3,300 4,000 70052775 - MINOR EQUIPMENT 2,554 665 500 500 500 052776 - PRINTER CONSOLIDATION COST 13,529 11,002 14,100 14,100 14,100 052874 - OFFICE SERVICES PRINTING 15,432 13,456 17,200 17,200 17,200 052875 - OFFICE SERVICES RECORDS 9,347 15,379 0 0 0 060175 - CHIEF'S AWARD 0 200 0 0 0 065014 - COLLECTIONS AGENCY FEE 0 (1,087) 0 0 0 065365 - HEALTH PROGRAMS 0 0 0 0 0 0
Operating Total 282,951 341,339 383,094 383,094 392,544 9,450Capital Outlay
53010 - OFFICE MACHINES 800 0 0 0 0 053030 - FURNITURE AND FIXTURES 0 0 3,737 3,737 3,737 0
Capital Outlay Total 800 0 3,737 3,737 3,737 0
Total Expenses 2,619,125 2,764,427 3,075,220 3,075,220 3,264,886 189,666
CIP Total 725,451 526,765 2,630,816 2,630,816 2,140,000 (490,816)
Grand Total 3,344,576 3,291,192 5,706,036 5,706,036 5,404,886 (301,150)
* 2017 Amended Budget as of 8/29/2017
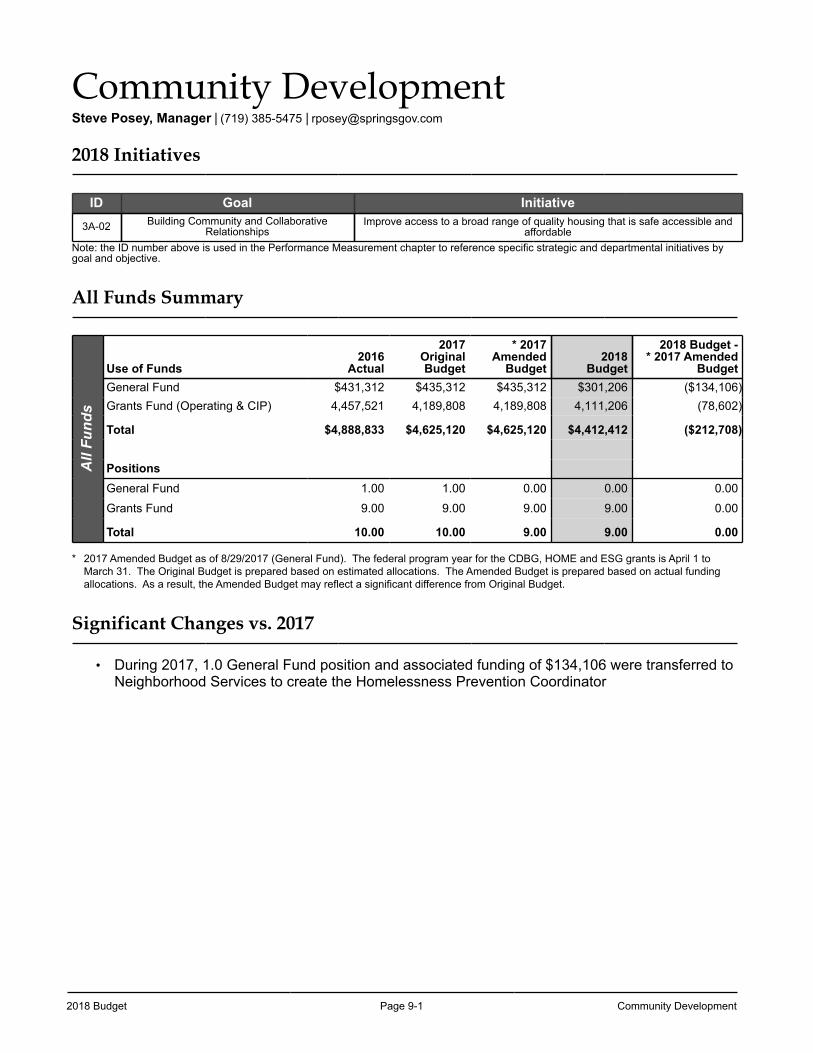
2018 Budget Page 9-1 Community Development
Community Development Steve Posey, Manager | (719) 385-5475 | [email protected]
2018 Initiatives
ID Goal Initiative3A-02 Building Community and Collaborative
RelationshipsImprove access to a broad range of quality housing that is safe accessible and
affordable Note: the ID number above is used in the Performance Measurement chapter to reference specific strategic and departmental initiatives by goal and objective.
All Funds Summary
All
Fund
s
Use of Funds2016
Actual
2017OriginalBudget
* 2017Amended
Budget2018
Budget
2018 Budget -* 2017 Amended
BudgetGeneral Fund $431,312 $435,312 $435,312 $301,206 ($134,106)Grants Fund (Operating & CIP) 4,457,521 4,189,808 4,189,808 4,111,206 (78,602)
Total $4,888,833 $4,625,120 $4,625,120 $4,412,412 ($212,708)
PositionsGeneral Fund 1.00 1.00 0.00 0.00 0.00
Grants Fund 9.00 9.00 9.00 9.00 0.00
Total 10.00 10.00 9.00 9.00 0.00
* 2017 Amended Budget as of 8/29/2017 (General Fund). The federal program year for the CDBG, HOME and ESG grants is April 1 to March 31. The Original Budget is prepared based on estimated allocations. The Amended Budget is prepared based on actual funding allocations. As a result, the Amended Budget may reflect a significant difference from Original Budget.
Significant Changes vs. 2017
• During 2017, 1.0 General Fund position and associated funding of $134,106 were transferred to Neighborhood Services to create the Homelessness Prevention Coordinator
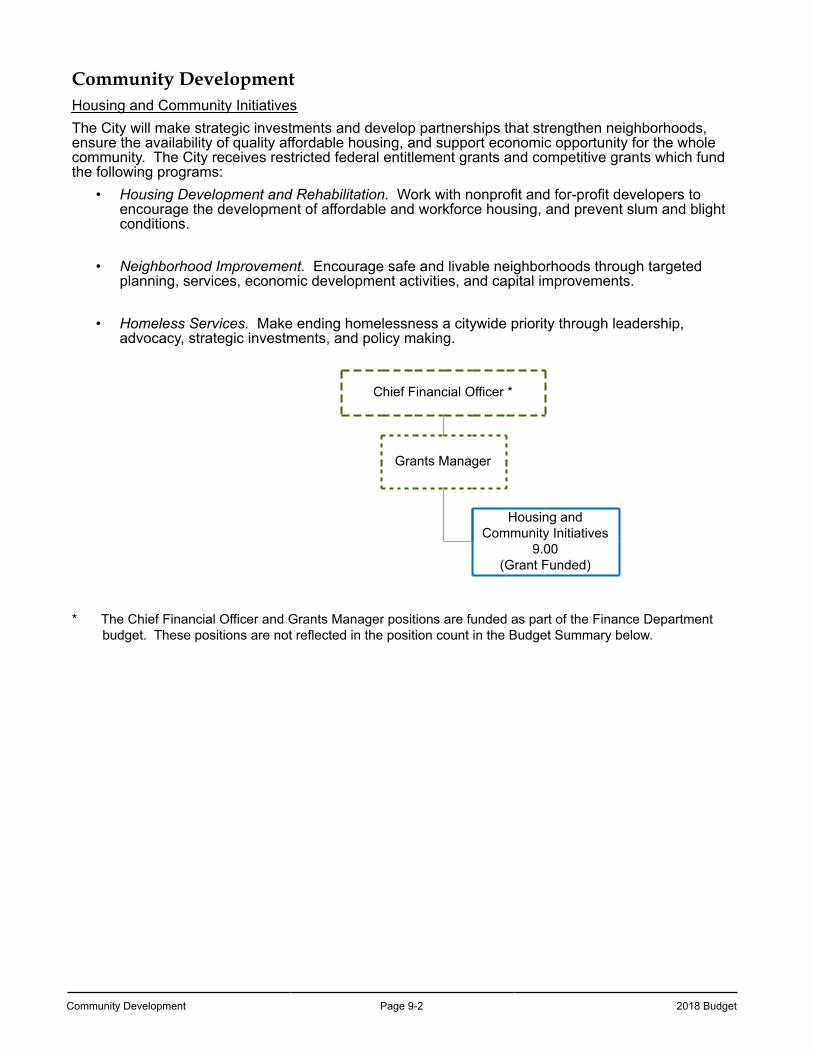
Community Development Page 9-2 2018 Budget
Community Development Housing and Community InitiativesThe City will make strategic investments and develop partnerships that strengthen neighborhoods, ensure the availability of quality affordable housing, and support economic opportunity for the whole community. The City receives restricted federal entitlement grants and competitive grants which fund the following programs:
• Housing Development and Rehabilitation. Work with nonprofit and for-profit developers to encourage the development of affordable and workforce housing, and prevent slum and blight conditions.
• Neighborhood Improvement. Encourage safe and livable neighborhoods through targeted planning, services, economic development activities, and capital improvements.
• Homeless Services. Make ending homelessness a citywide priority through leadership, advocacy, strategic investments, and policy making.
Chief Financial Officer *
Grants Manager
Housing and Community Initiatives
9.00(Grant Funded)
* The Chief Financial Officer and Grants Manager positions are funded as part of the Finance Department budget. These positions are not reflected in the position count in the Budget Summary below.
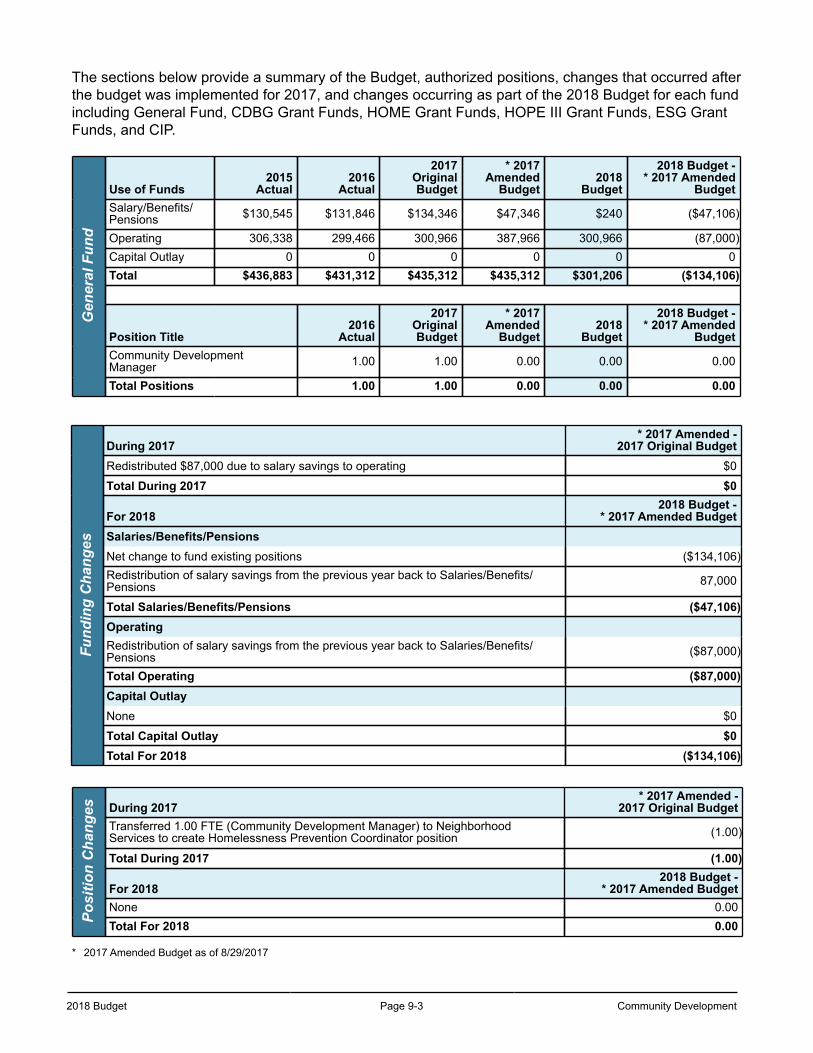
2018 Budget Page 9-3 Community Development
The sections below provide a summary of the Budget, authorized positions, changes that occurred after the budget was implemented for 2017, and changes occurring as part of the 2018 Budget for each fund including General Fund, CDBG Grant Funds, HOME Grant Funds, HOPE III Grant Funds, ESG Grant Funds, and CIP.
Gen
eral
Fun
d
Use of Funds2015
Actual2016
Actual
2017OriginalBudget
* 2017Amended
Budget2018
Budget
2018 Budget -* 2017 Amended
BudgetSalary/Benefits/Pensions $130,545 $131,846 $134,346 $47,346 $240 ($47,106)
Operating 306,338 299,466 300,966 387,966 300,966 (87,000)Capital Outlay 0 0 0 0 0 0Total $436,883 $431,312 $435,312 $435,312 $301,206 ($134,106)
Position Title2016
Actual
2017OriginalBudget
* 2017Amended
Budget2018
Budget
2018 Budget -* 2017 Amended
BudgetCommunity DevelopmentManager 1.00 1.00 0.00 0.00 0.00
Total Positions 1.00 1.00 0.00 0.00 0.00
Fund
ing
Cha
nges
During 2017* 2017 Amended -
2017 Original BudgetRedistributed $87,000 due to salary savings to operating $0
Total During 2017 $0
For 20182018 Budget -
* 2017 Amended BudgetSalaries/Benefits/PensionsNet change to fund existing positions ($134,106)Redistribution of salary savings from the previous year back to Salaries/Benefits/Pensions 87,000
Total Salaries/Benefits/Pensions ($47,106)OperatingRedistribution of salary savings from the previous year back to Salaries/Benefits/Pensions ($87,000)
Total Operating ($87,000)Capital OutlayNone $0
Total Capital Outlay $0Total For 2018 ($134,106)
Posi
tion
Cha
nges During 2017
* 2017 Amended -2017 Original Budget
Transferred 1.00 FTE (Community Development Manager) to NeighborhoodServices to create Homelessness Prevention Coordinator position (1.00)
Total During 2017 (1.00)
For 20182018 Budget -
* 2017 Amended BudgetNone 0.00Total For 2018 0.00
* 2017 Amended Budget as of 8/29/2017
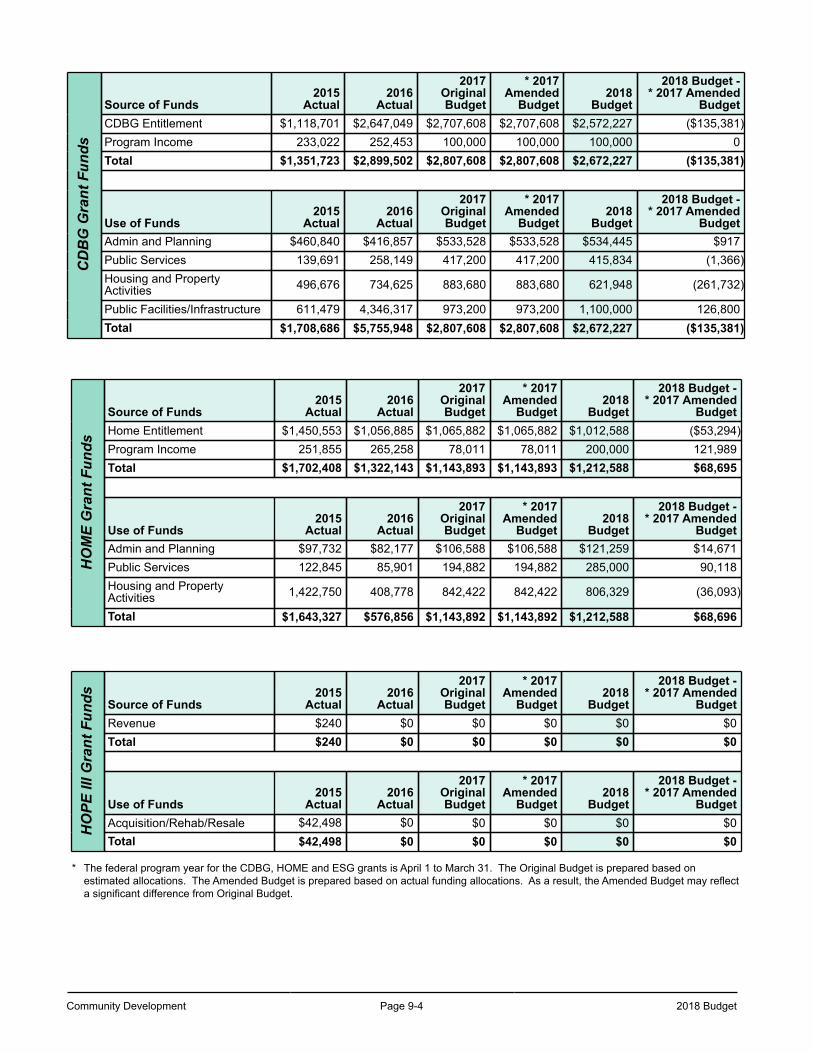
Community Development Page 9-4 2018 Budget
CD
BG
Gra
nt F
unds
Source of Funds2015
Actual2016
Actual
2017OriginalBudget
* 2017Amended
Budget2018
Budget
2018 Budget -* 2017 Amended
BudgetCDBG Entitlement $1,118,701 $2,647,049 $2,707,608 $2,707,608 $2,572,227 ($135,381)Program Income 233,022 252,453 100,000 100,000 100,000 0Total $1,351,723 $2,899,502 $2,807,608 $2,807,608 $2,672,227 ($135,381)
Use of Funds2015
Actual2016
Actual
2017OriginalBudget
* 2017Amended
Budget2018
Budget
2018 Budget -* 2017 Amended
BudgetAdmin and Planning $460,840 $416,857 $533,528 $533,528 $534,445 $917Public Services 139,691 258,149 417,200 417,200 415,834 (1,366)Housing and PropertyActivities 496,676 734,625 883,680 883,680 621,948 (261,732)
Public Facilities/Infrastructure 611,479 4,346,317 973,200 973,200 1,100,000 126,800Total $1,708,686 $5,755,948 $2,807,608 $2,807,608 $2,672,227 ($135,381)
HO
ME
Gra
nt F
unds
Source of Funds2015
Actual2016
Actual
2017OriginalBudget
* 2017Amended
Budget2018
Budget
2018 Budget -* 2017 Amended
BudgetHome Entitlement $1,450,553 $1,056,885 $1,065,882 $1,065,882 $1,012,588 ($53,294)Program Income 251,855 265,258 78,011 78,011 200,000 121,989Total $1,702,408 $1,322,143 $1,143,893 $1,143,893 $1,212,588 $68,695
Use of Funds2015
Actual2016
Actual
2017OriginalBudget
* 2017Amended
Budget2018
Budget
2018 Budget -* 2017 Amended
BudgetAdmin and Planning $97,732 $82,177 $106,588 $106,588 $121,259 $14,671Public Services 122,845 85,901 194,882 194,882 285,000 90,118Housing and PropertyActivities 1,422,750 408,778 842,422 842,422 806,329 (36,093)
Total $1,643,327 $576,856 $1,143,892 $1,143,892 $1,212,588 $68,696
HO
PE II
I Gra
nt F
unds Source of Funds
2015Actual
2016Actual
2017OriginalBudget
* 2017Amended
Budget2018
Budget
2018 Budget -* 2017 Amended
BudgetRevenue $240 $0 $0 $0 $0 $0Total $240 $0 $0 $0 $0 $0
Use of Funds2015
Actual2016
Actual
2017OriginalBudget
* 2017Amended
Budget2018
Budget
2018 Budget -* 2017 Amended
BudgetAcquisition/Rehab/Resale $42,498 $0 $0 $0 $0 $0Total $42,498 $0 $0 $0 $0 $0
* The federal program year for the CDBG, HOME and ESG grants is April 1 to March 31. The Original Budget is prepared based on estimated allocations. The Amended Budget is prepared based on actual funding allocations. As a result, the Amended Budget may reflect a significant difference from Original Budget.
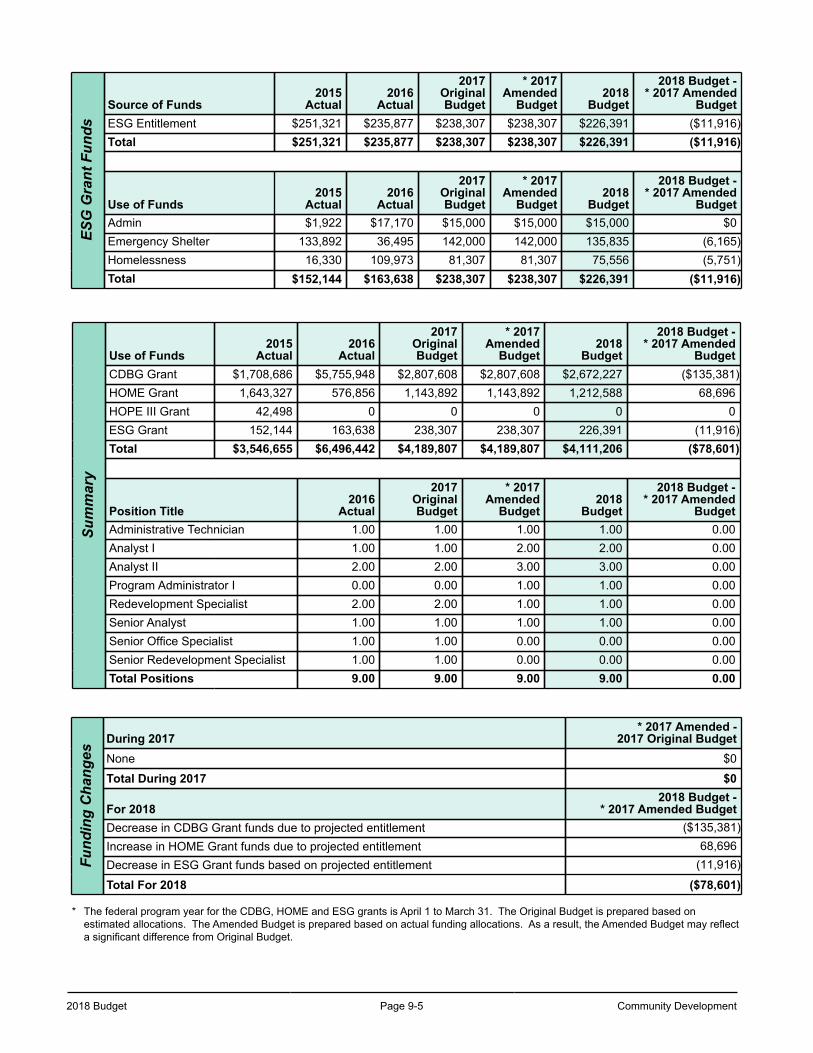
2018 Budget Page 9-5 Community Development
ESG
Gra
nt F
unds
Source of Funds2015
Actual2016
Actual
2017OriginalBudget
* 2017Amended
Budget2018
Budget
2018 Budget -* 2017 Amended
BudgetESG Entitlement $251,321 $235,877 $238,307 $238,307 $226,391 ($11,916)Total $251,321 $235,877 $238,307 $238,307 $226,391 ($11,916)
Use of Funds2015
Actual2016
Actual
2017OriginalBudget
* 2017Amended
Budget2018
Budget
2018 Budget -* 2017 Amended
BudgetAdmin $1,922 $17,170 $15,000 $15,000 $15,000 $0Emergency Shelter 133,892 36,495 142,000 142,000 135,835 (6,165)Homelessness 16,330 109,973 81,307 81,307 75,556 (5,751)Total $152,144 $163,638 $238,307 $238,307 $226,391 ($11,916)
Sum
mar
y
Use of Funds2015
Actual2016
Actual
2017OriginalBudget
* 2017Amended
Budget2018
Budget
2018 Budget -* 2017 Amended
BudgetCDBG Grant $1,708,686 $5,755,948 $2,807,608 $2,807,608 $2,672,227 ($135,381)HOME Grant 1,643,327 576,856 1,143,892 1,143,892 1,212,588 68,696HOPE III Grant 42,498 0 0 0 0 0ESG Grant 152,144 163,638 238,307 238,307 226,391 (11,916)Total $3,546,655 $6,496,442 $4,189,807 $4,189,807 $4,111,206 ($78,601)
Position Title2016
Actual
2017OriginalBudget
* 2017Amended
Budget2018
Budget
2018 Budget -* 2017 Amended
BudgetAdministrative Technician 1.00 1.00 1.00 1.00 0.00Analyst I 1.00 1.00 2.00 2.00 0.00Analyst II 2.00 2.00 3.00 3.00 0.00Program Administrator I 0.00 0.00 1.00 1.00 0.00Redevelopment Specialist 2.00 2.00 1.00 1.00 0.00Senior Analyst 1.00 1.00 1.00 1.00 0.00Senior Office Specialist 1.00 1.00 0.00 0.00 0.00Senior Redevelopment Specialist 1.00 1.00 0.00 0.00 0.00Total Positions 9.00 9.00 9.00 9.00 0.00
Fund
ing
Cha
nges
During 2017* 2017 Amended -
2017 Original BudgetNone $0
Total During 2017 $0
For 20182018 Budget -
* 2017 Amended BudgetDecrease in CDBG Grant funds due to projected entitlement ($135,381)Increase in HOME Grant funds due to projected entitlement 68,696Decrease in ESG Grant funds based on projected entitlement (11,916)
Total For 2018 ($78,601)
* The federal program year for the CDBG, HOME and ESG grants is April 1 to March 31. The Original Budget is prepared based on estimated allocations. The Amended Budget is prepared based on actual funding allocations. As a result, the Amended Budget may reflect a significant difference from Original Budget.
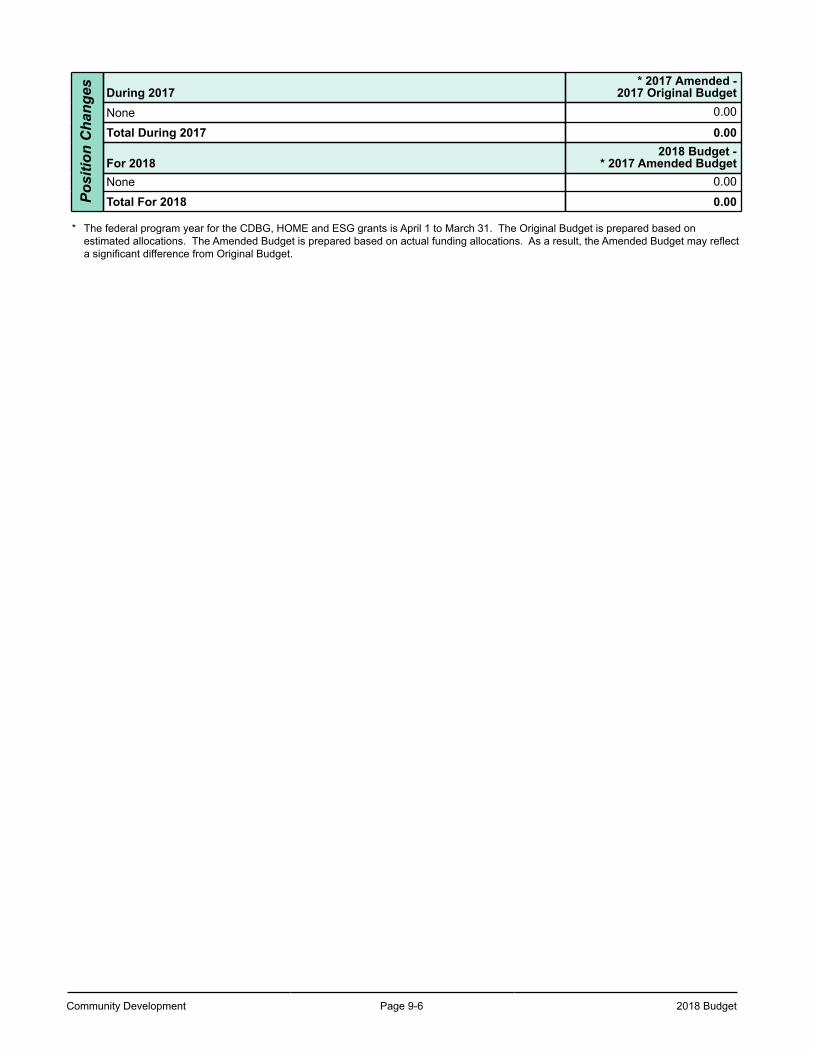
Community Development Page 9-6 2018 Budget
Posi
tion
Cha
nges During 2017
* 2017 Amended -2017 Original Budget
None 0.00
Total During 2017 0.00
For 20182018 Budget -
* 2017 Amended BudgetNone 0.00
Total For 2018 0.00
* The federal program year for the CDBG, HOME and ESG grants is April 1 to March 31. The Original Budget is prepared based on estimated allocations. The Amended Budget is prepared based on actual funding allocations. As a result, the Amended Budget may reflect a significant difference from Original Budget.
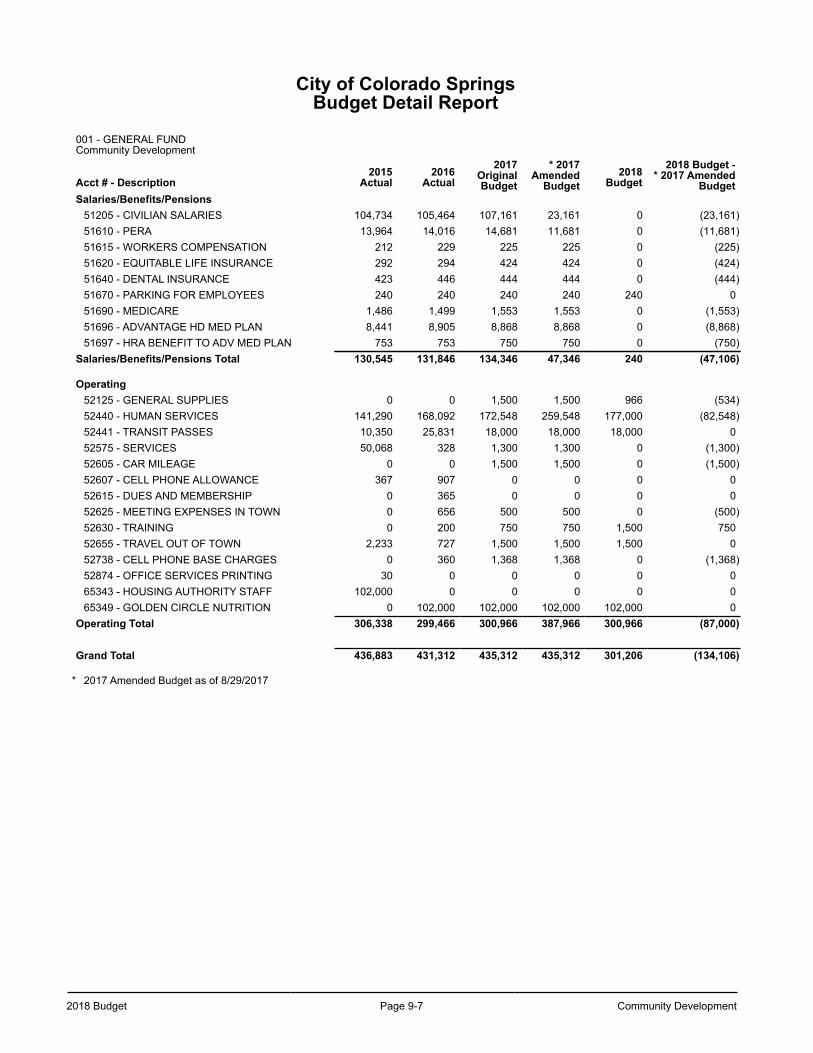
2018 Budget Page 9-7 Community Development
City of Colorado SpringsBudget Detail Report
001 - GENERAL FUND Community Development
Acct # - Description2015
Actual2016
Actual2017
OriginalBudget
* 2017Amended
Budget2018
Budget2018 Budget -
* 2017 AmendedBudget
Salaries/Benefits/Pensions51205 - CIVILIAN SALARIES 104,734 105,464 107,161 23,161 0 (23,161)51610 - PERA 13,964 14,016 14,681 11,681 0 (11,681)51615 - WORKERS COMPENSATION 212 229 225 225 0 (225)51620 - EQUITABLE LIFE INSURANCE 292 294 424 424 0 (424)51640 - DENTAL INSURANCE 423 446 444 444 0 (444)51670 - PARKING FOR EMPLOYEES 240 240 240 240 240 051690 - MEDICARE 1,486 1,499 1,553 1,553 0 (1,553)51696 - ADVANTAGE HD MED PLAN 8,441 8,905 8,868 8,868 0 (8,868)51697 - HRA BENEFIT TO ADV MED PLAN 753 753 750 750 0 (750)
Salaries/Benefits/Pensions Total 130,545 131,846 134,346 47,346 240 (47,106)
Operating52125 - GENERAL SUPPLIES 0 0 1,500 1,500 966 (534)52440 - HUMAN SERVICES 141,290 168,092 172,548 259,548 177,000 (82,548)52441 - TRANSIT PASSES 10,350 25,831 18,000 18,000 18,000 052575 - SERVICES 50,068 328 1,300 1,300 0 (1,300)52605 - CAR MILEAGE 0 0 1,500 1,500 0 (1,500)52607 - CELL PHONE ALLOWANCE 367 907 0 0 0 052615 - DUES AND MEMBERSHIP 0 365 0 0 0 052625 - MEETING EXPENSES IN TOWN 0 656 500 500 0 (500)52630 - TRAINING 0 200 750 750 1,500 75052655 - TRAVEL OUT OF TOWN 2,233 727 1,500 1,500 1,500 052738 - CELL PHONE BASE CHARGES 0 360 1,368 1,368 0 (1,368)52874 - OFFICE SERVICES PRINTING 30 0 0 0 0 065343 - HOUSING AUTHORITY STAFF 102,000 0 0 0 0 065349 - GOLDEN CIRCLE NUTRITION 0 102,000 102,000 102,000 102,000 0
Operating Total 306,338 299,466 300,966 387,966 300,966 (87,000)
Grand Total 436,883 431,312 435,312 435,312 301,206 (134,106)
* 2017 Amended Budget as of 8/29/2017

Community Development Page 9-8 2018 Budget
This page left blank intentionally.
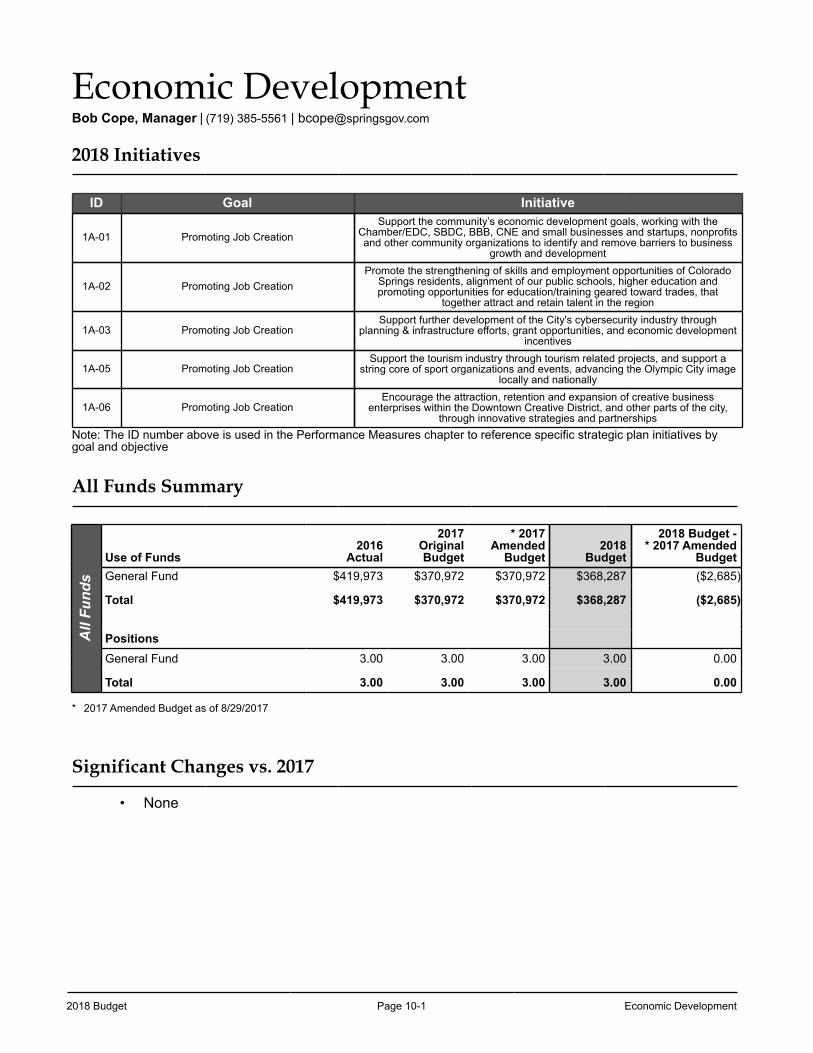
2018 Budget Page 10-1 Economic Development
Economic DevelopmentBob Cope, Manager | (719) 385-5561 | [email protected]
2018 Initiatives
ID Goal Initiative
1A-01 Promoting Job CreationSupport the community’s economic development goals, working with the
Chamber/EDC, SBDC, BBB, CNE and small businesses and startups, nonprofits and other community organizations to identify and remove barriers to business
growth and development
1A-02 Promoting Job CreationPromote the strengthening of skills and employment opportunities of Colorado
Springs residents, alignment of our public schools, higher education and promoting opportunities for education/training geared toward trades, that
together attract and retain talent in the region
1A-03 Promoting Job CreationSupport further development of the City's cybersecurity industry through
planning & infrastructure efforts, grant opportunities, and economic development incentives
1A-05 Promoting Job CreationSupport the tourism industry through tourism related projects, and support a
string core of sport organizations and events, advancing the Olympic City image locally and nationally
1A-06 Promoting Job CreationEncourage the attraction, retention and expansion of creative business
enterprises within the Downtown Creative District, and other parts of the city, through innovative strategies and partnerships
Note: The ID number above is used in the Performance Measures chapter to reference specific strategic plan initiatives by goal and objective
All Funds Summary
All
Fund
s
Use of Funds2016
Actual
2017OriginalBudget
* 2017Amended
Budget2018
Budget
2018 Budget -* 2017 Amended
BudgetGeneral Fund $419,973 $370,972 $370,972 $368,287 ($2,685)
Total $419,973 $370,972 $370,972 $368,287 ($2,685)
PositionsGeneral Fund 3.00 3.00 3.00 3.00 0.00
Total 3.00 3.00 3.00 3.00 0.00
* 2017 Amended Budget as of 8/29/2017
Significant Changes vs. 2017
• None
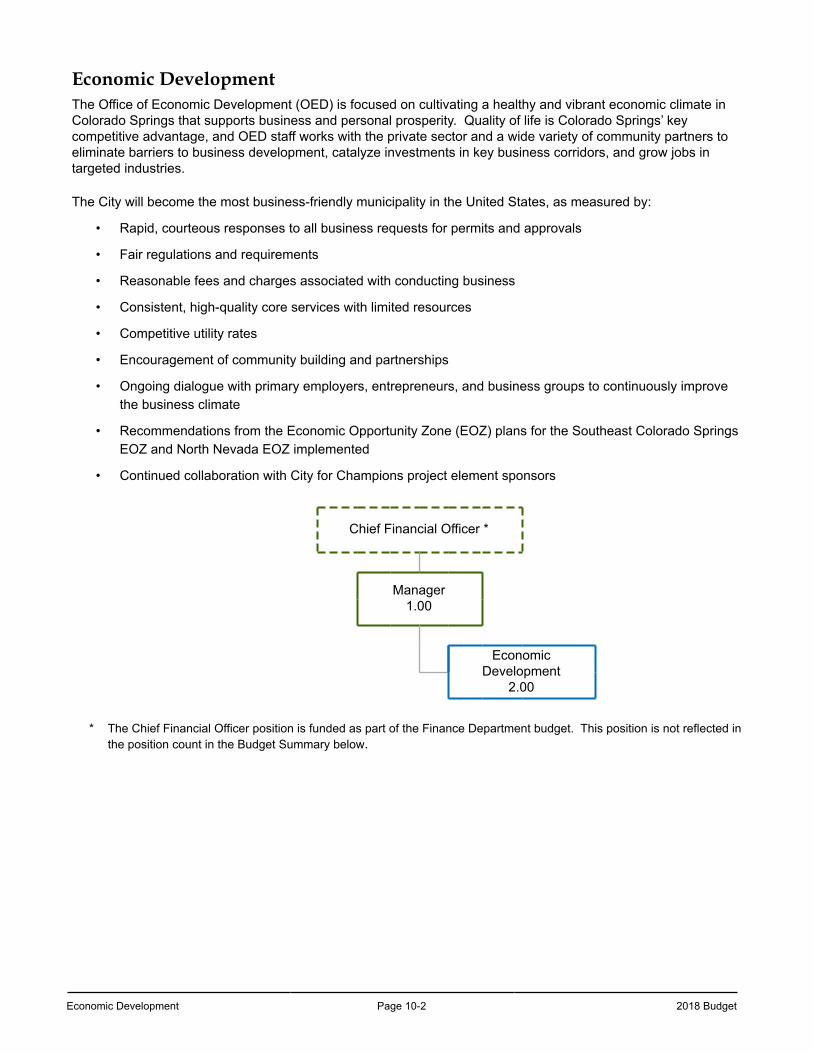
Economic Development Page 10-2 2018 Budget
Economic DevelopmentThe Office of Economic Development (OED) is focused on cultivating a healthy and vibrant economic climate in Colorado Springs that supports business and personal prosperity. Quality of life is Colorado Springs’ key competitive advantage, and OED staff works with the private sector and a wide variety of community partners to eliminate barriers to business development, catalyze investments in key business corridors, and grow jobs in targeted industries.
The City will become the most business-friendly municipality in the United States, as measured by:
• Rapid, courteous responses to all business requests for permits and approvals
• Fair regulations and requirements
• Reasonable fees and charges associated with conducting business
• Consistent, high-quality core services with limited resources
• Competitive utility rates
• Encouragement of community building and partnerships
• Ongoing dialogue with primary employers, entrepreneurs, and business groups to continuously improve the business climate
• Recommendations from the Economic Opportunity Zone (EOZ) plans for the Southeast Colorado Springs EOZ and North Nevada EOZ implemented
• Continued collaboration with City for Champions project element sponsors
Chief Financial Officer *
Manager1.00
Economic Development
2.00
* The Chief Financial Officer position is funded as part of the Finance Department budget. This position is not reflected in the position count in the Budget Summary below.
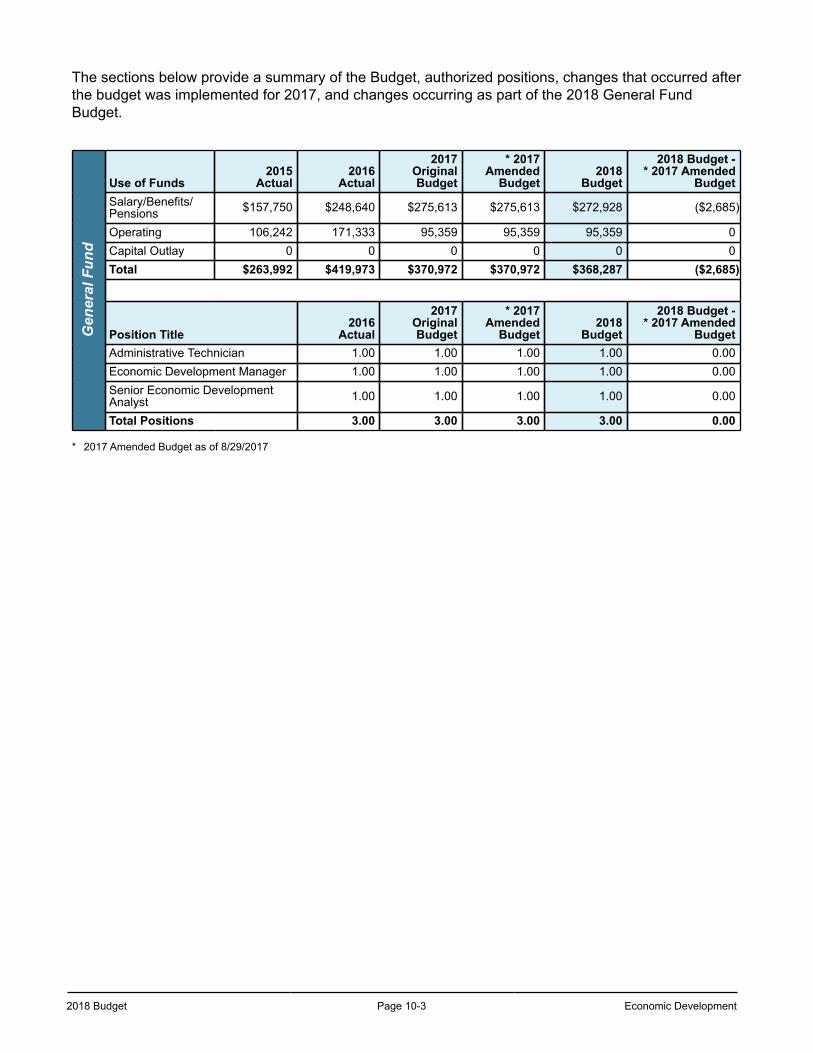
2018 Budget Page 10-3 Economic Development
The sections below provide a summary of the Budget, authorized positions, changes that occurred after the budget was implemented for 2017, and changes occurring as part of the 2018 General Fund Budget.
Gen
eral
Fun
d
Use of Funds2015
Actual2016
Actual
2017OriginalBudget
* 2017Amended
Budget2018
Budget
2018 Budget -* 2017 Amended
BudgetSalary/Benefits/Pensions $157,750 $248,640 $275,613 $275,613 $272,928 ($2,685)
Operating 106,242 171,333 95,359 95,359 95,359 0Capital Outlay 0 0 0 0 0 0Total $263,992 $419,973 $370,972 $370,972 $368,287 ($2,685)
Position Title2016
Actual
2017OriginalBudget
* 2017Amended
Budget2018
Budget
2018 Budget -* 2017 Amended
BudgetAdministrative Technician 1.00 1.00 1.00 1.00 0.00Economic Development Manager 1.00 1.00 1.00 1.00 0.00Senior Economic DevelopmentAnalyst 1.00 1.00 1.00 1.00 0.00
Total Positions 3.00 3.00 3.00 3.00 0.00
* 2017 Amended Budget as of 8/29/2017
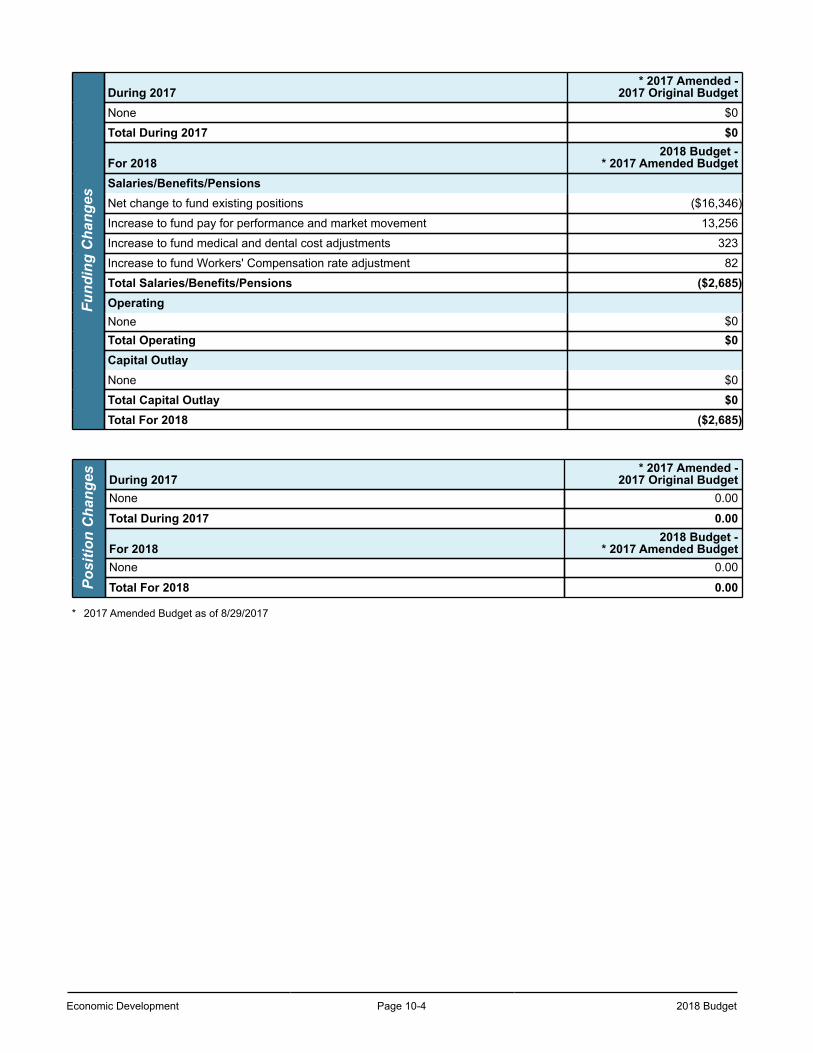
Economic Development Page 10-4 2018 Budget
Fund
ing
Cha
nges
During 2017* 2017 Amended -
2017 Original BudgetNone $0
Total During 2017 $0
For 20182018 Budget -
* 2017 Amended BudgetSalaries/Benefits/PensionsNet change to fund existing positions ($16,346)
Increase to fund pay for performance and market movement 13,256
Increase to fund medical and dental cost adjustments 323
Increase to fund Workers' Compensation rate adjustment 82
Total Salaries/Benefits/Pensions ($2,685)OperatingNone $0Total Operating $0Capital OutlayNone $0
Total Capital Outlay $0Total For 2018 ($2,685)
Posi
tion
Cha
nges During 2017
* 2017 Amended -2017 Original Budget
None 0.00
Total During 2017 0.00
For 20182018 Budget -
* 2017 Amended BudgetNone 0.00
Total For 2018 0.00
* 2017 Amended Budget as of 8/29/2017
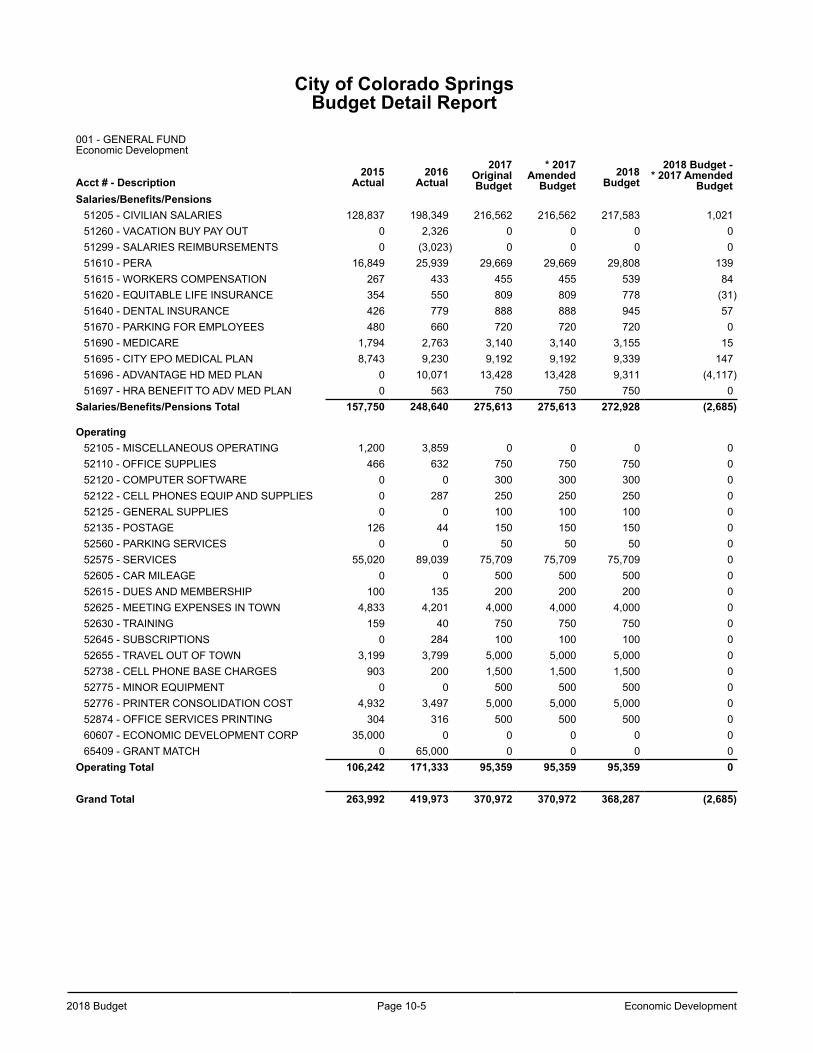
2018 Budget Page 10-5 Economic Development
City of Colorado SpringsBudget Detail Report
001 - GENERAL FUND Economic Development
Acct # - Description2015
Actual2016
Actual2017
OriginalBudget
* 2017Amended
Budget2018
Budget2018 Budget -
* 2017 AmendedBudget
Salaries/Benefits/Pensions51205 - CIVILIAN SALARIES 128,837 198,349 216,562 216,562 217,583 1,02151260 - VACATION BUY PAY OUT 0 2,326 0 0 0 051299 - SALARIES REIMBURSEMENTS 0 (3,023) 0 0 0 051610 - PERA 16,849 25,939 29,669 29,669 29,808 13951615 - WORKERS COMPENSATION 267 433 455 455 539 8451620 - EQUITABLE LIFE INSURANCE 354 550 809 809 778 (31)51640 - DENTAL INSURANCE 426 779 888 888 945 5751670 - PARKING FOR EMPLOYEES 480 660 720 720 720 051690 - MEDICARE 1,794 2,763 3,140 3,140 3,155 1551695 - CITY EPO MEDICAL PLAN 8,743 9,230 9,192 9,192 9,339 14751696 - ADVANTAGE HD MED PLAN 0 10,071 13,428 13,428 9,311 (4,117)51697 - HRA BENEFIT TO ADV MED PLAN 0 563 750 750 750 0
Salaries/Benefits/Pensions Total 157,750 248,640 275,613 275,613 272,928 (2,685)
Operating52105 - MISCELLANEOUS OPERATING 1,200 3,859 0 0 0 052110 - OFFICE SUPPLIES 466 632 750 750 750 052120 - COMPUTER SOFTWARE 0 0 300 300 300 052122 - CELL PHONES EQUIP AND SUPPLIES 0 287 250 250 250 052125 - GENERAL SUPPLIES 0 0 100 100 100 052135 - POSTAGE 126 44 150 150 150 052560 - PARKING SERVICES 0 0 50 50 50 052575 - SERVICES 55,020 89,039 75,709 75,709 75,709 052605 - CAR MILEAGE 0 0 500 500 500 052615 - DUES AND MEMBERSHIP 100 135 200 200 200 052625 - MEETING EXPENSES IN TOWN 4,833 4,201 4,000 4,000 4,000 052630 - TRAINING 159 40 750 750 750 052645 - SUBSCRIPTIONS 0 284 100 100 100 052655 - TRAVEL OUT OF TOWN 3,199 3,799 5,000 5,000 5,000 052738 - CELL PHONE BASE CHARGES 903 200 1,500 1,500 1,500 052775 - MINOR EQUIPMENT 0 0 500 500 500 052776 - PRINTER CONSOLIDATION COST 4,932 3,497 5,000 5,000 5,000 052874 - OFFICE SERVICES PRINTING 304 316 500 500 500 060607 - ECONOMIC DEVELOPMENT CORP 35,000 0 0 0 0 065409 - GRANT MATCH 0 65,000 0 0 0 0
Operating Total 106,242 171,333 95,359 95,359 95,359 0
Grand Total 263,992 419,973 370,972 370,972 368,287 (2,685)

Economic Development Page 10-6 2018 Budget
This page left blank intentionally.
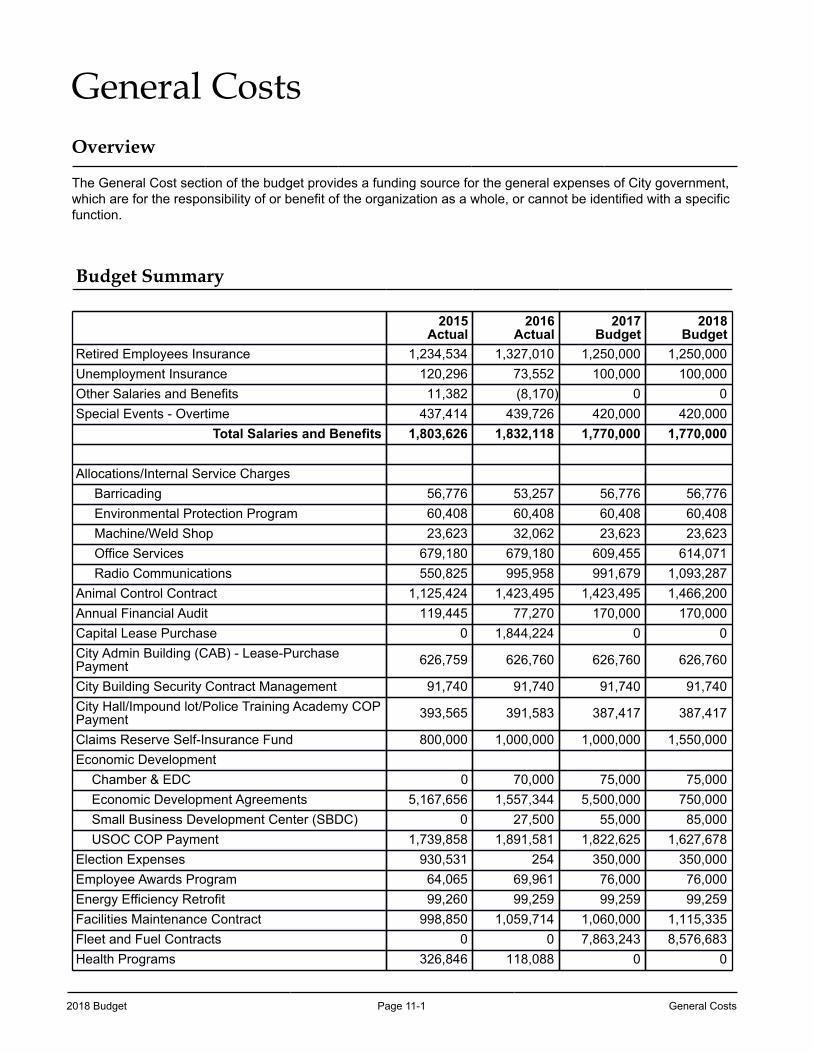
2018 Budget Page 11-1 General Costs
General CostsOverview
The General Cost section of the budget provides a funding source for the general expenses of City government, which are for the responsibility of or benefit of the organization as a whole, or cannot be identified with a specific function.
Budget Summary
2015Actual
2016Actual
2017Budget
2018Budget
Retired Employees Insurance 1,234,534 1,327,010 1,250,000 1,250,000Unemployment Insurance 120,296 73,552 100,000 100,000Other Salaries and Benefits 11,382 (8,170) 0 0Special Events - Overtime 437,414 439,726 420,000 420,000
Total Salaries and Benefits 1,803,626 1,832,118 1,770,000 1,770,000
Allocations/Internal Service ChargesBarricading 56,776 53,257 56,776 56,776Environmental Protection Program 60,408 60,408 60,408 60,408Machine/Weld Shop 23,623 32,062 23,623 23,623Office Services 679,180 679,180 609,455 614,071Radio Communications 550,825 995,958 991,679 1,093,287
Animal Control Contract 1,125,424 1,423,495 1,423,495 1,466,200Annual Financial Audit 119,445 77,270 170,000 170,000Capital Lease Purchase 0 1,844,224 0 0City Admin Building (CAB) - Lease-PurchasePayment 626,759 626,760 626,760 626,760
City Building Security Contract Management 91,740 91,740 91,740 91,740City Hall/Impound lot/Police Training Academy COPPayment 393,565 391,583 387,417 387,417
Claims Reserve Self-Insurance Fund 800,000 1,000,000 1,000,000 1,550,000Economic Development
Chamber & EDC 0 70,000 75,000 75,000Economic Development Agreements 5,167,656 1,557,344 5,500,000 750,000Small Business Development Center (SBDC) 0 27,500 55,000 85,000USOC COP Payment 1,739,858 1,891,581 1,822,625 1,627,678
Election Expenses 930,531 254 350,000 350,000Employee Awards Program 64,065 69,961 76,000 76,000Energy Efficiency Retrofit 99,260 99,259 99,259 99,259Facilities Maintenance Contract 998,850 1,059,714 1,060,000 1,115,335Fleet and Fuel Contracts 0 0 7,863,243 8,576,683Health Programs 326,846 118,088 0 0
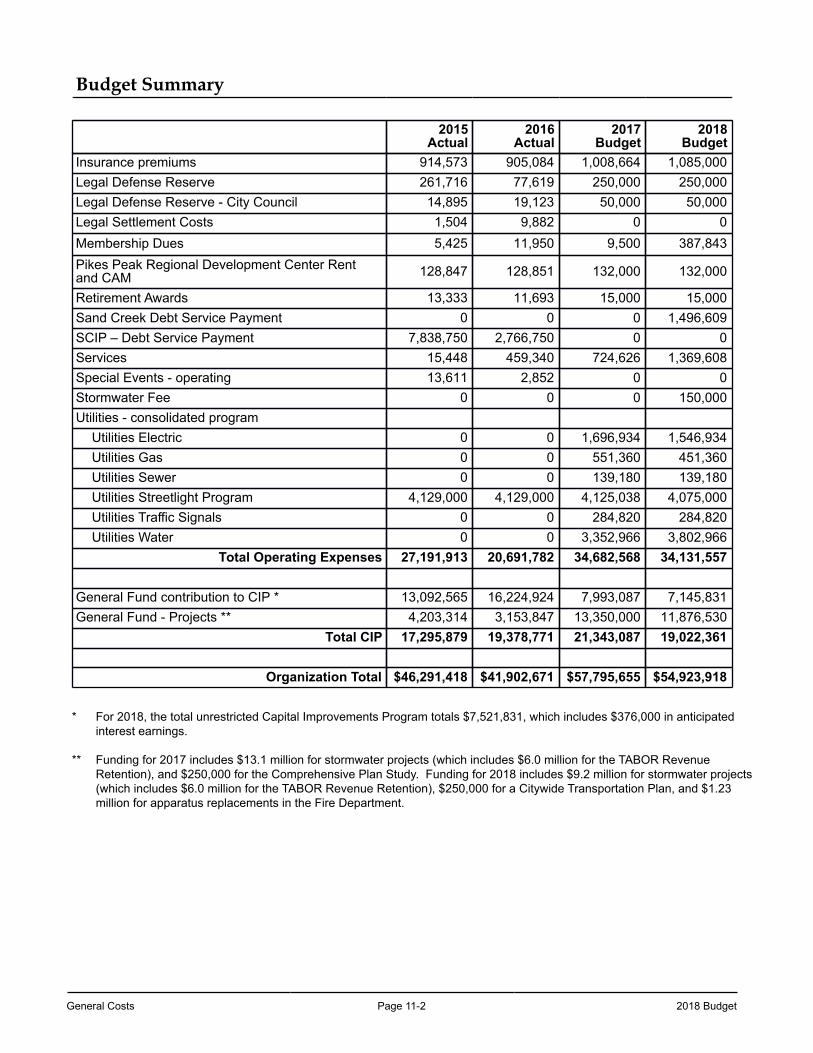
General Costs Page 11-2 2018 Budget
Budget Summary
2015Actual
2016Actual
2017Budget
2018Budget
Insurance premiums 914,573 905,084 1,008,664 1,085,000Legal Defense Reserve 261,716 77,619 250,000 250,000Legal Defense Reserve - City Council 14,895 19,123 50,000 50,000Legal Settlement Costs 1,504 9,882 0 0Membership Dues 5,425 11,950 9,500 387,843Pikes Peak Regional Development Center Rentand CAM 128,847 128,851 132,000 132,000
Retirement Awards 13,333 11,693 15,000 15,000Sand Creek Debt Service Payment 0 0 0 1,496,609SCIP – Debt Service Payment 7,838,750 2,766,750 0 0Services 15,448 459,340 724,626 1,369,608Special Events - operating 13,611 2,852 0 0Stormwater Fee 0 0 0 150,000Utilities - consolidated program
Utilities Electric 0 0 1,696,934 1,546,934Utilities Gas 0 0 551,360 451,360Utilities Sewer 0 0 139,180 139,180Utilities Streetlight Program 4,129,000 4,129,000 4,125,038 4,075,000Utilities Traffic Signals 0 0 284,820 284,820Utilities Water 0 0 3,352,966 3,802,966
Total Operating Expenses 27,191,913 20,691,782 34,682,568 34,131,557
General Fund contribution to CIP * 13,092,565 16,224,924 7,993,087 7,145,831General Fund - Projects ** 4,203,314 3,153,847 13,350,000 11,876,530
Total CIP 17,295,879 19,378,771 21,343,087 19,022,361
Organization Total $46,291,418 $41,902,671 $57,795,655 $54,923,918
* For 2018, the total unrestricted Capital Improvements Program totals $7,521,831, which includes $376,000 in anticipated interest earnings.
** Funding for 2017 includes $13.1 million for stormwater projects (which includes $6.0 million for the TABOR Revenue Retention), and $250,000 for the Comprehensive Plan Study. Funding for 2018 includes $9.2 million for stormwater projects (which includes $6.0 million for the TABOR Revenue Retention), $250,000 for a Citywide Transportation Plan, and $1.23 million for apparatus replacements in the Fire Department.
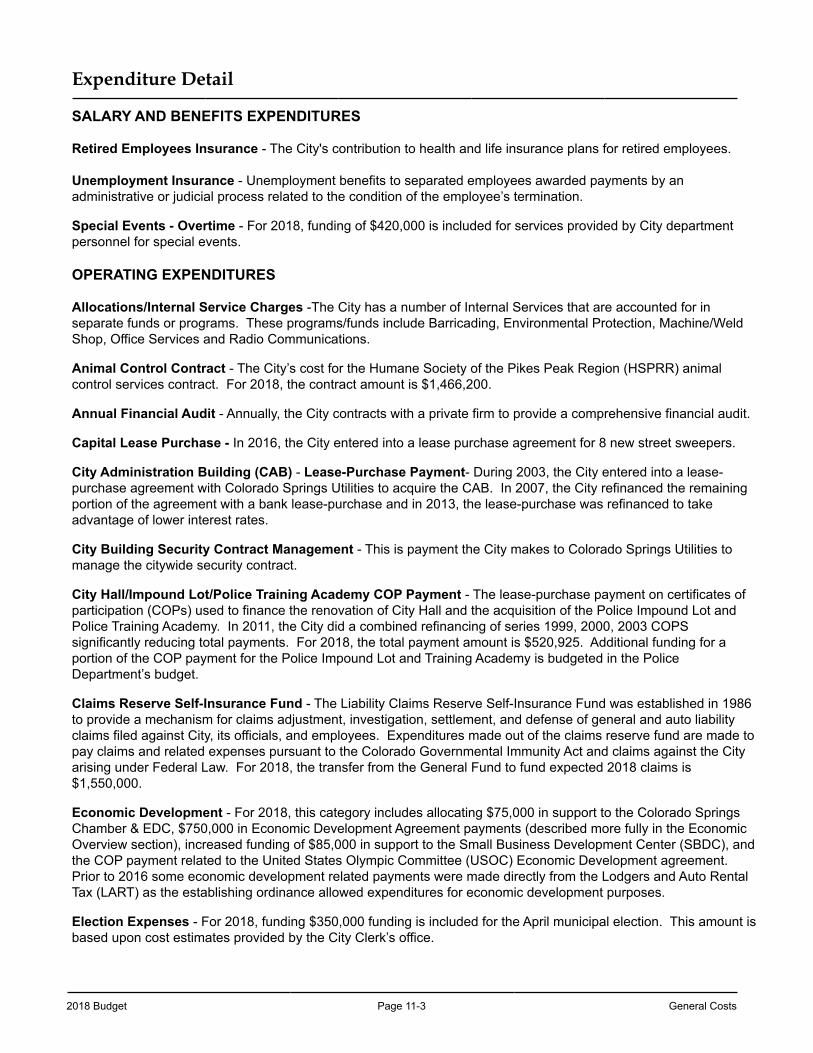
2018 Budget Page 11-3 General Costs
Expenditure Detail
SALARY AND BENEFITS EXPENDITURES
Retired Employees Insurance - The City's contribution to health and life insurance plans for retired employees.
Unemployment Insurance - Unemployment benefits to separated employees awarded payments by an administrative or judicial process related to the condition of the employee’s termination.
Special Events - Overtime - For 2018, funding of $420,000 is included for services provided by City department personnel for special events.
OPERATING EXPENDITURES
Allocations/Internal Service Charges -The City has a number of Internal Services that are accounted for in separate funds or programs. These programs/funds include Barricading, Environmental Protection, Machine/Weld Shop, Office Services and Radio Communications.
Animal Control Contract - The City’s cost for the Humane Society of the Pikes Peak Region (HSPRR) animal control services contract. For 2018, the contract amount is $1,466,200.
Annual Financial Audit - Annually, the City contracts with a private firm to provide a comprehensive financial audit.
Capital Lease Purchase - In 2016, the City entered into a lease purchase agreement for 8 new street sweepers.
City Administration Building (CAB) - Lease-Purchase Payment- During 2003, the City entered into a lease-purchase agreement with Colorado Springs Utilities to acquire the CAB. In 2007, the City refinanced the remaining portion of the agreement with a bank lease-purchase and in 2013, the lease-purchase was refinanced to take advantage of lower interest rates.
City Building Security Contract Management - This is payment the City makes to Colorado Springs Utilities to manage the citywide security contract.
City Hall/Impound Lot/Police Training Academy COP Payment - The lease-purchase payment on certificates of participation (COPs) used to finance the renovation of City Hall and the acquisition of the Police Impound Lot and Police Training Academy. In 2011, the City did a combined refinancing of series 1999, 2000, 2003 COPS significantly reducing total payments. For 2018, the total payment amount is $520,925. Additional funding for a portion of the COP payment for the Police Impound Lot and Training Academy is budgeted in the Police Department’s budget.
Claims Reserve Self-Insurance Fund - The Liability Claims Reserve Self-Insurance Fund was established in 1986 to provide a mechanism for claims adjustment, investigation, settlement, and defense of general and auto liability claims filed against City, its officials, and employees. Expenditures made out of the claims reserve fund are made to pay claims and related expenses pursuant to the Colorado Governmental Immunity Act and claims against the City arising under Federal Law. For 2018, the transfer from the General Fund to fund expected 2018 claims is $1,550,000.
Economic Development - For 2018, this category includes allocating $75,000 in support to the Colorado Springs Chamber & EDC, $750,000 in Economic Development Agreement payments (described more fully in the Economic Overview section), increased funding of $85,000 in support to the Small Business Development Center (SBDC), and the COP payment related to the United States Olympic Committee (USOC) Economic Development agreement. Prior to 2016 some economic development related payments were made directly from the Lodgers and Auto Rental Tax (LART) as the establishing ordinance allowed expenditures for economic development purposes.
Election Expenses - For 2018, funding $350,000 funding is included for the April municipal election. This amount is based upon cost estimates provided by the City Clerk’s office.
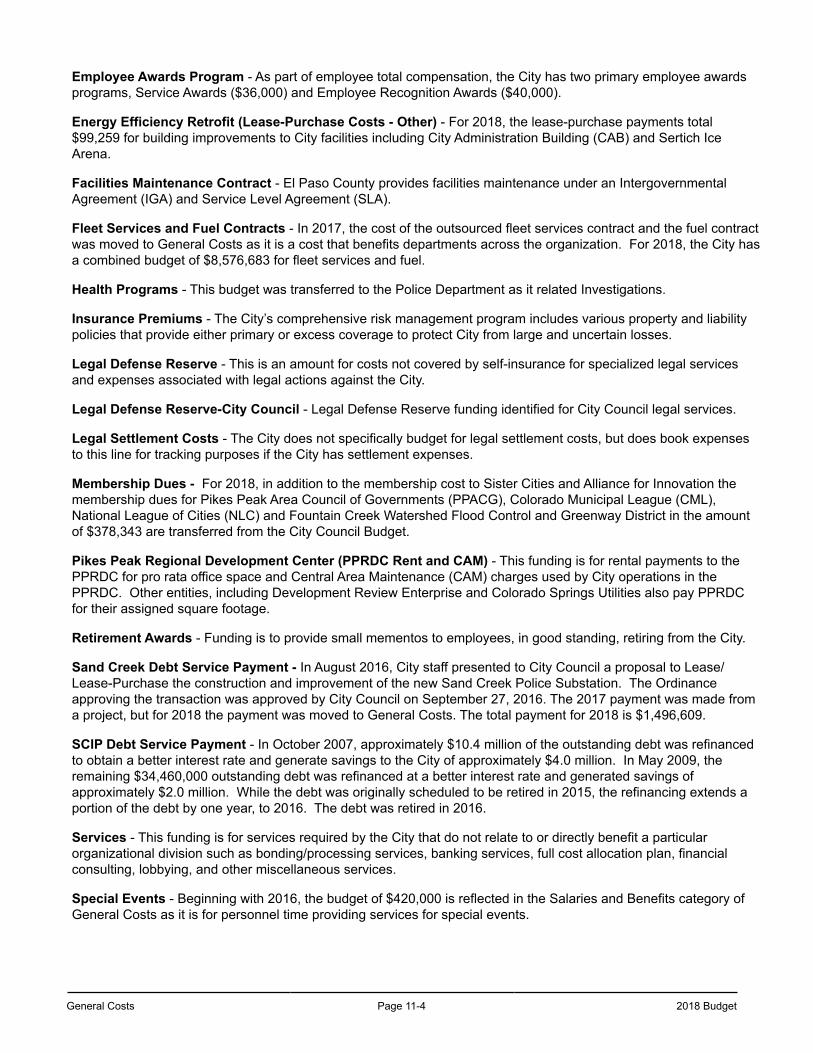
General Costs Page 11-4 2018 Budget
Employee Awards Program - As part of employee total compensation, the City has two primary employee awards programs, Service Awards ($36,000) and Employee Recognition Awards ($40,000).
Energy Efficiency Retrofit (Lease-Purchase Costs - Other) - For 2018, the lease-purchase payments total $99,259 for building improvements to City facilities including City Administration Building (CAB) and Sertich Ice Arena.
Facilities Maintenance Contract - El Paso County provides facilities maintenance under an Intergovernmental Agreement (IGA) and Service Level Agreement (SLA).
Fleet Services and Fuel Contracts - In 2017, the cost of the outsourced fleet services contract and the fuel contract was moved to General Costs as it is a cost that benefits departments across the organization. For 2018, the City has a combined budget of $8,576,683 for fleet services and fuel.
Health Programs - This budget was transferred to the Police Department as it related Investigations.
Insurance Premiums - The City’s comprehensive risk management program includes various property and liability policies that provide either primary or excess coverage to protect City from large and uncertain losses.
Legal Defense Reserve - This is an amount for costs not covered by self-insurance for specialized legal services and expenses associated with legal actions against the City.
Legal Defense Reserve-City Council - Legal Defense Reserve funding identified for City Council legal services.
Legal Settlement Costs - The City does not specifically budget for legal settlement costs, but does book expenses to this line for tracking purposes if the City has settlement expenses.
Membership Dues - For 2018, in addition to the membership cost to Sister Cities and Alliance for Innovation the membership dues for Pikes Peak Area Council of Governments (PPACG), Colorado Municipal League (CML), National League of Cities (NLC) and Fountain Creek Watershed Flood Control and Greenway District in the amount of $378,343 are transferred from the City Council Budget.
Pikes Peak Regional Development Center (PPRDC Rent and CAM) - This funding is for rental payments to the PPRDC for pro rata office space and Central Area Maintenance (CAM) charges used by City operations in the PPRDC. Other entities, including Development Review Enterprise and Colorado Springs Utilities also pay PPRDC for their assigned square footage.
Retirement Awards - Funding is to provide small mementos to employees, in good standing, retiring from the City.
Sand Creek Debt Service Payment - In August 2016, City staff presented to City Council a proposal to Lease/Lease-Purchase the construction and improvement of the new Sand Creek Police Substation. The Ordinance approving the transaction was approved by City Council on September 27, 2016. The 2017 payment was made from a project, but for 2018 the payment was moved to General Costs. The total payment for 2018 is $1,496,609.
SCIP Debt Service Payment - In October 2007, approximately $10.4 million of the outstanding debt was refinanced to obtain a better interest rate and generate savings to the City of approximately $4.0 million. In May 2009, the remaining $34,460,000 outstanding debt was refinanced at a better interest rate and generated savings of approximately $2.0 million. While the debt was originally scheduled to be retired in 2015, the refinancing extends a portion of the debt by one year, to 2016. The debt was retired in 2016.
Services - This funding is for services required by the City that do not relate to or directly benefit a particular organizational division such as bonding/processing services, banking services, full cost allocation plan, financial consulting, lobbying, and other miscellaneous services.
Special Events - Beginning with 2016, the budget of $420,000 is reflected in the Salaries and Benefits category of General Costs as it is for personnel time providing services for special events.
2018 Budget Page 11-5 General Costs
Stormwater Fee - The cost for the stormwater infrastructure and maintenance fee that was passed by the voters on November 7, 2017 for City owned properties. The collection of this fee begins July 1, 2018 and ends July 1, 2038. For 2018, the total amount is $150,000 which represents 6 months of fees.
Utilities - Consolidated Program - In 2017, the City centralized General Fund budgets from all the departments and divisions to General Costs for all City utilities expenses in order to better manage utility usage and achieve sustainability goals. The charge from Colorado Springs Utilities for the operation of the Streetlight system has always been budgeted in General Costs and is incorporated in this consolidated program.
CAPITAL OUTLAY EXPENDITURES
General Fund Contribution to City CIP Fund - For 2018, the General Fund contribution is $7,145,831. These projects are for roads and bridges projects, grant matches, technology, other payments, and City facility repairs. For 2018, Stormwater projects are not budgeted in the CIP fund, but rather are reflected below and in the Public Works, Water Resources Engineering budget.
General Fund - Projects - For 2018, the budget for projects is set at $11,876,530; $9,177,013 for stormwater projects (which includes $6.0 million for the TABOR Revenue Retention), 250,000 for a Citywide Transportation Plan, and $1,023,857 for apparatus replacement in the Fire Department.

General Costs Page 11-6 2018 Budget
This page left blank intentionally.
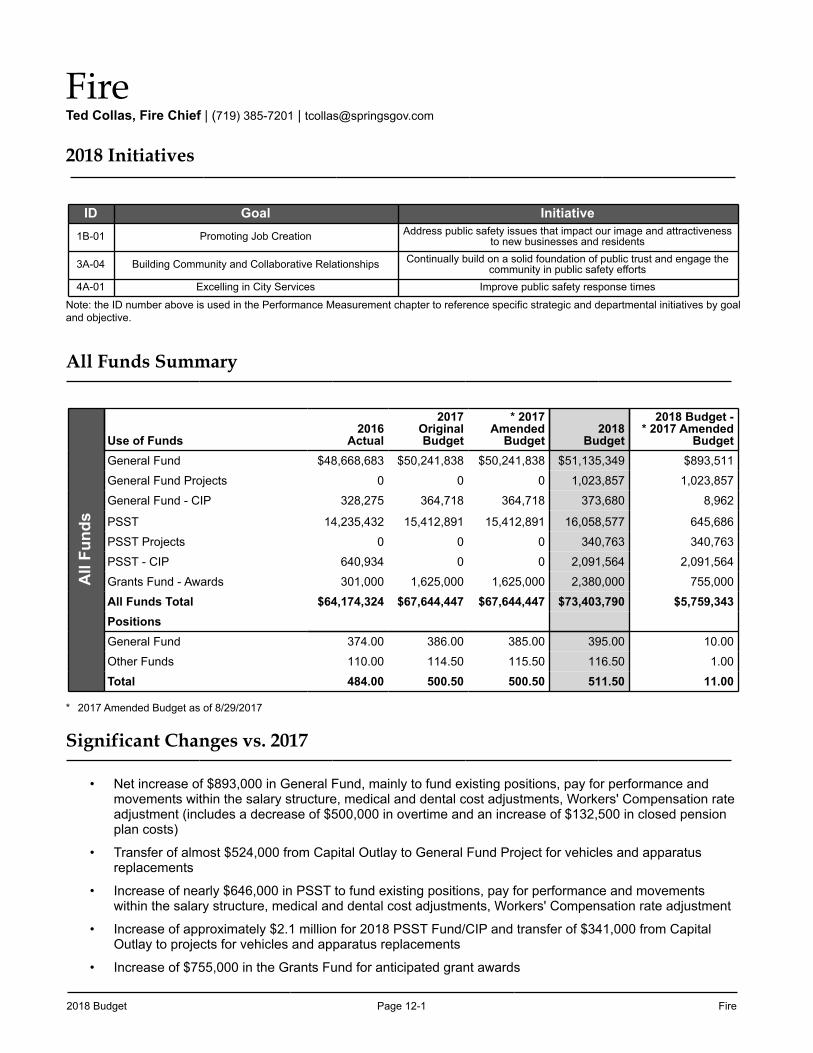
2018 Budget Page 12-1 Fire
FireTed Collas, Fire Chief | (719) 385-7201 | [email protected]
2018 Initiatives
ID Goal Initiative1B-01 Promoting Job Creation Address public safety issues that impact our image and attractiveness
to new businesses and residents
3A-04 Building Community and Collaborative Relationships Continually build on a solid foundation of public trust and engage the community in public safety efforts
4A-01 Excelling in City Services Improve public safety response times
Note: the ID number above is used in the Performance Measurement chapter to reference specific strategic and departmental initiatives by goal and objective.
All Funds Summary
All
Fund
s
Use of Funds2016
Actual
2017OriginalBudget
* 2017Amended
Budget2018
Budget
2018 Budget -* 2017 Amended
BudgetGeneral Fund $48,668,683 $50,241,838 $50,241,838 $51,135,349 $893,511
General Fund Projects 0 0 0 1,023,857 1,023,857
General Fund - CIP 328,275 364,718 364,718 373,680 8,962
PSST 14,235,432 15,412,891 15,412,891 16,058,577 645,686
PSST Projects 0 0 0 340,763 340,763
PSST - CIP 640,934 0 0 2,091,564 2,091,564
Grants Fund - Awards 301,000 1,625,000 1,625,000 2,380,000 755,000
All Funds Total $64,174,324 $67,644,447 $67,644,447 $73,403,790 $5,759,343PositionsGeneral Fund 374.00 386.00 385.00 395.00 10.00
Other Funds 110.00 114.50 115.50 116.50 1.00
Total 484.00 500.50 500.50 511.50 11.00
* 2017 Amended Budget as of 8/29/2017
Significant Changes vs. 2017
• Net increase of $893,000 in General Fund, mainly to fund existing positions, pay for performance and movements within the salary structure, medical and dental cost adjustments, Workers' Compensation rate adjustment (includes a decrease of $500,000 in overtime and an increase of $132,500 in closed pension plan costs)
• Transfer of almost $524,000 from Capital Outlay to General Fund Project for vehicles and apparatus replacements
• Increase of nearly $646,000 in PSST to fund existing positions, pay for performance and movements within the salary structure, medical and dental cost adjustments, Workers' Compensation rate adjustment
• Increase of approximately $2.1 million for 2018 PSST Fund/CIP and transfer of $341,000 from Capital Outlay to projects for vehicles and apparatus replacements
• Increase of $755,000 in the Grants Fund for anticipated grant awards
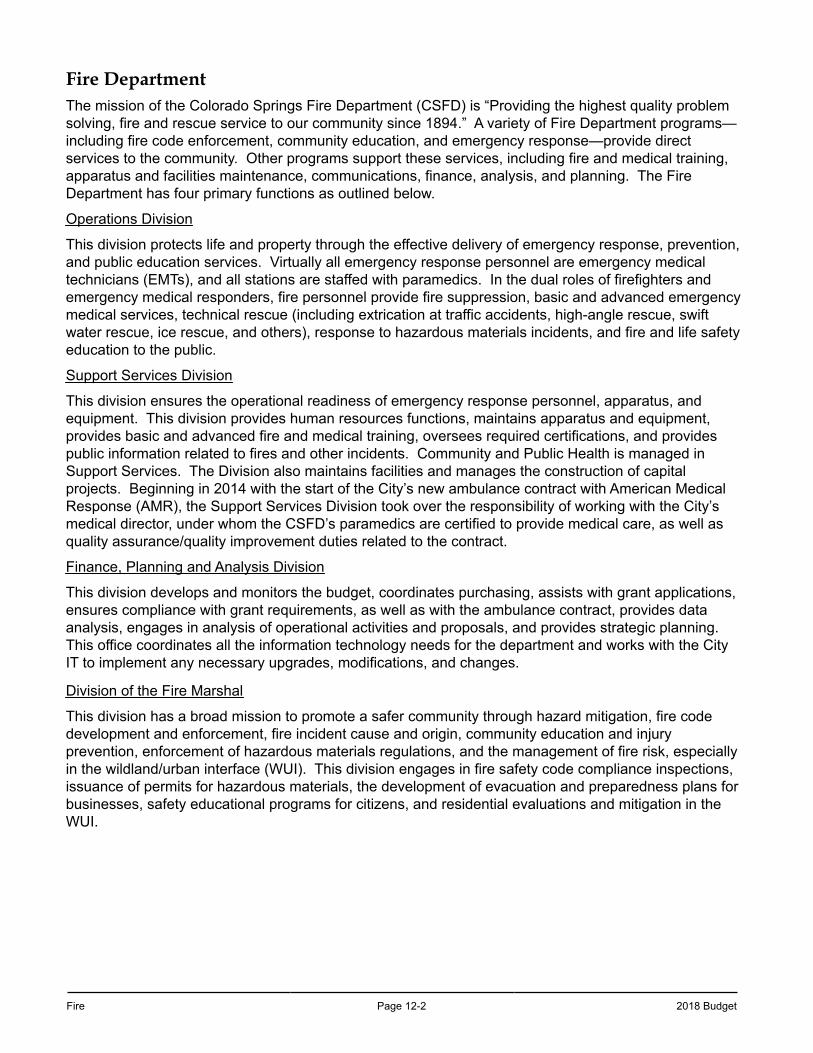
Fire Page 12-2 2018 Budget
Fire DepartmentThe mission of the Colorado Springs Fire Department (CSFD) is “Providing the highest quality problem solving, fire and rescue service to our community since 1894.” A variety of Fire Department programs—including fire code enforcement, community education, and emergency response—provide direct services to the community. Other programs support these services, including fire and medical training, apparatus and facilities maintenance, communications, finance, analysis, and planning. The Fire Department has four primary functions as outlined below.
Operations Division
This division protects life and property through the effective delivery of emergency response, prevention, and public education services. Virtually all emergency response personnel are emergency medical technicians (EMTs), and all stations are staffed with paramedics. In the dual roles of firefighters and emergency medical responders, fire personnel provide fire suppression, basic and advanced emergency medical services, technical rescue (including extrication at traffic accidents, high-angle rescue, swift water rescue, ice rescue, and others), response to hazardous materials incidents, and fire and life safety education to the public.
Support Services Division
This division ensures the operational readiness of emergency response personnel, apparatus, and equipment. This division provides human resources functions, maintains apparatus and equipment, provides basic and advanced fire and medical training, oversees required certifications, and provides public information related to fires and other incidents. Community and Public Health is managed in Support Services. The Division also maintains facilities and manages the construction of capital projects. Beginning in 2014 with the start of the City’s new ambulance contract with American Medical Response (AMR), the Support Services Division took over the responsibility of working with the City’s medical director, under whom the CSFD’s paramedics are certified to provide medical care, as well as quality assurance/quality improvement duties related to the contract.
Finance, Planning and Analysis Division
This division develops and monitors the budget, coordinates purchasing, assists with grant applications, ensures compliance with grant requirements, as well as with the ambulance contract, provides data analysis, engages in analysis of operational activities and proposals, and provides strategic planning. This office coordinates all the information technology needs for the department and works with the City IT to implement any necessary upgrades, modifications, and changes.
Division of the Fire Marshal
This division has a broad mission to promote a safer community through hazard mitigation, fire code development and enforcement, fire incident cause and origin, community education and injury prevention, enforcement of hazardous materials regulations, and the management of fire risk, especially in the wildland/urban interface (WUI). This division engages in fire safety code compliance inspections, issuance of permits for hazardous materials, the development of evacuation and preparedness plans for businesses, safety educational programs for citizens, and residential evaluations and mitigation in the WUI.
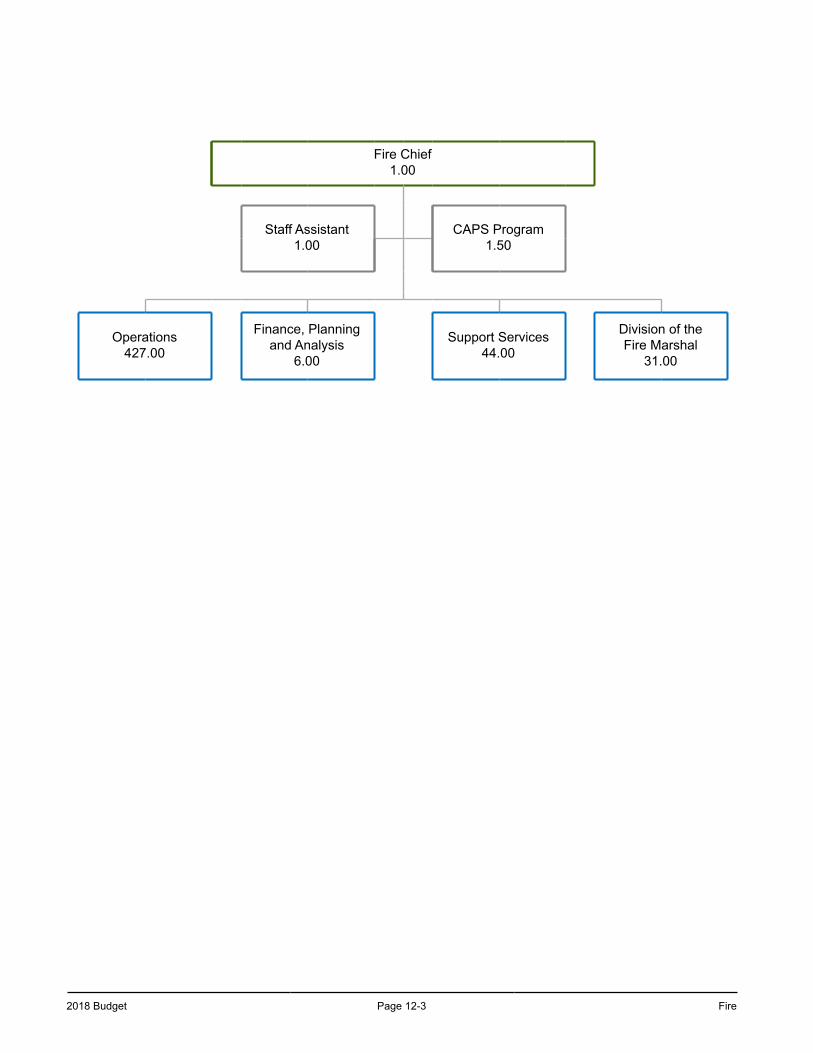
2018 Budget Page 12-3 Fire
Fire Chief1.00
Staff Assistant1.00
CAPS Program1.50
Operations427.00
Finance, Planningand Analysis
6.00
Support Services44.00
Division of theFire Marshal
31.00
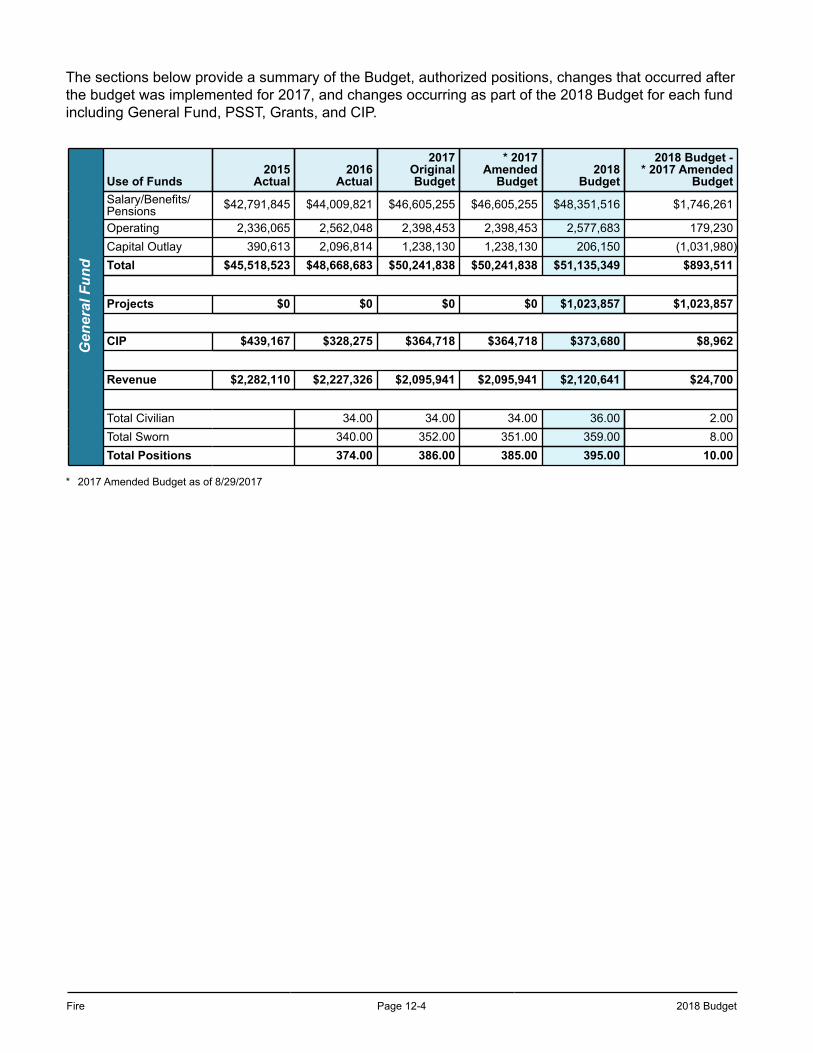
Fire Page 12-4 2018 Budget
The sections below provide a summary of the Budget, authorized positions, changes that occurred after the budget was implemented for 2017, and changes occurring as part of the 2018 Budget for each fund including General Fund, PSST, Grants, and CIP.
Gen
eral
Fun
d
Use of Funds2015
Actual2016
Actual
2017OriginalBudget
* 2017Amended
Budget2018
Budget
2018 Budget -* 2017 Amended
BudgetSalary/Benefits/Pensions $42,791,845 $44,009,821 $46,605,255 $46,605,255 $48,351,516 $1,746,261
Operating 2,336,065 2,562,048 2,398,453 2,398,453 2,577,683 179,230Capital Outlay 390,613 2,096,814 1,238,130 1,238,130 206,150 (1,031,980)Total $45,518,523 $48,668,683 $50,241,838 $50,241,838 $51,135,349 $893,511
Projects $0 $0 $0 $0 $1,023,857 $1,023,857
CIP $439,167 $328,275 $364,718 $364,718 $373,680 $8,962
Revenue $2,282,110 $2,227,326 $2,095,941 $2,095,941 $2,120,641 $24,700
Total Civilian 34.00 34.00 34.00 36.00 2.00Total Sworn 340.00 352.00 351.00 359.00 8.00Total Positions 374.00 386.00 385.00 395.00 10.00
* 2017 Amended Budget as of 8/29/2017
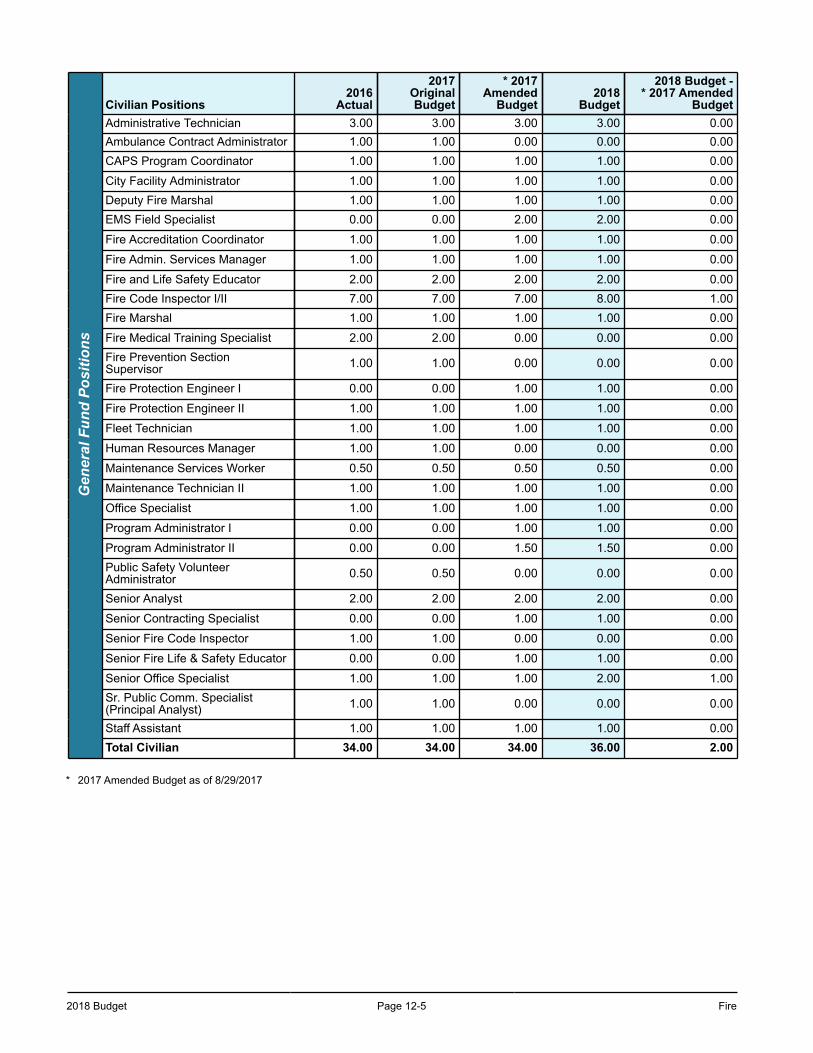
2018 Budget Page 12-5 Fire
Gen
eral
Fun
d Po
sitio
nsCivilian Positions
2016Actual
2017OriginalBudget
* 2017Amended
Budget2018
Budget
2018 Budget -* 2017 Amended
BudgetAdministrative Technician 3.00 3.00 3.00 3.00 0.00Ambulance Contract Administrator 1.00 1.00 0.00 0.00 0.00CAPS Program Coordinator 1.00 1.00 1.00 1.00 0.00
City Facility Administrator 1.00 1.00 1.00 1.00 0.00Deputy Fire Marshal 1.00 1.00 1.00 1.00 0.00EMS Field Specialist 0.00 0.00 2.00 2.00 0.00
Fire Accreditation Coordinator 1.00 1.00 1.00 1.00 0.00
Fire Admin. Services Manager 1.00 1.00 1.00 1.00 0.00
Fire and Life Safety Educator 2.00 2.00 2.00 2.00 0.00Fire Code Inspector I/II 7.00 7.00 7.00 8.00 1.00Fire Marshal 1.00 1.00 1.00 1.00 0.00
Fire Medical Training Specialist 2.00 2.00 0.00 0.00 0.00Fire Prevention SectionSupervisor 1.00 1.00 0.00 0.00 0.00
Fire Protection Engineer I 0.00 0.00 1.00 1.00 0.00
Fire Protection Engineer II 1.00 1.00 1.00 1.00 0.00
Fleet Technician 1.00 1.00 1.00 1.00 0.00
Human Resources Manager 1.00 1.00 0.00 0.00 0.00
Maintenance Services Worker 0.50 0.50 0.50 0.50 0.00
Maintenance Technician II 1.00 1.00 1.00 1.00 0.00
Office Specialist 1.00 1.00 1.00 1.00 0.00
Program Administrator I 0.00 0.00 1.00 1.00 0.00
Program Administrator II 0.00 0.00 1.50 1.50 0.00Public Safety VolunteerAdministrator 0.50 0.50 0.00 0.00 0.00
Senior Analyst 2.00 2.00 2.00 2.00 0.00
Senior Contracting Specialist 0.00 0.00 1.00 1.00 0.00
Senior Fire Code Inspector 1.00 1.00 0.00 0.00 0.00
Senior Fire Life & Safety Educator 0.00 0.00 1.00 1.00 0.00
Senior Office Specialist 1.00 1.00 1.00 2.00 1.00Sr. Public Comm. Specialist(Principal Analyst) 1.00 1.00 0.00 0.00 0.00
Staff Assistant 1.00 1.00 1.00 1.00 0.00Total Civilian 34.00 34.00 34.00 36.00 2.00
* 2017 Amended Budget as of 8/29/2017
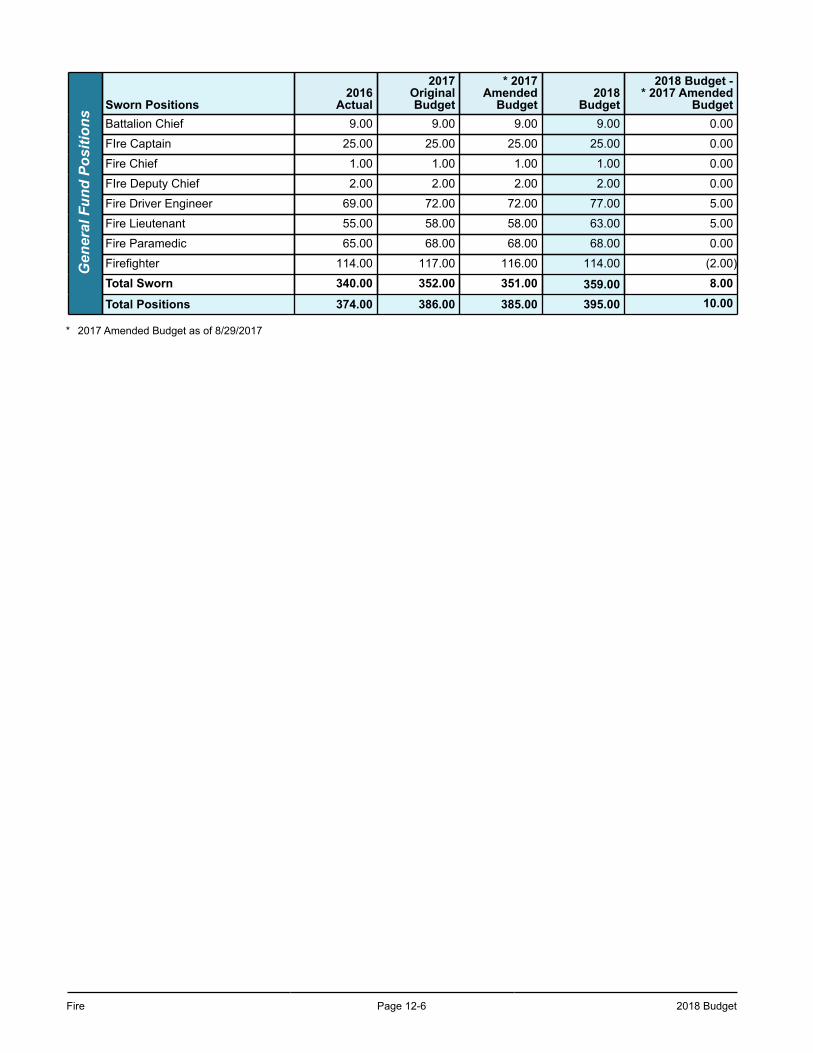
Fire Page 12-6 2018 Budget
Gen
eral
Fun
d Po
sitio
nsSworn Positions
2016Actual
2017OriginalBudget
* 2017Amended
Budget2018
Budget
2018 Budget -* 2017 Amended
BudgetBattalion Chief 9.00 9.00 9.00 9.00 0.00
FIre Captain 25.00 25.00 25.00 25.00 0.00
Fire Chief 1.00 1.00 1.00 1.00 0.00
FIre Deputy Chief 2.00 2.00 2.00 2.00 0.00
Fire Driver Engineer 69.00 72.00 72.00 77.00 5.00
Fire Lieutenant 55.00 58.00 58.00 63.00 5.00
Fire Paramedic 65.00 68.00 68.00 68.00 0.00
Firefighter 114.00 117.00 116.00 114.00 (2.00)
Total Sworn 340.00 352.00 351.00 359.00 8.00
Total Positions 374.00 386.00 385.00 395.00 10.00
* 2017 Amended Budget as of 8/29/2017
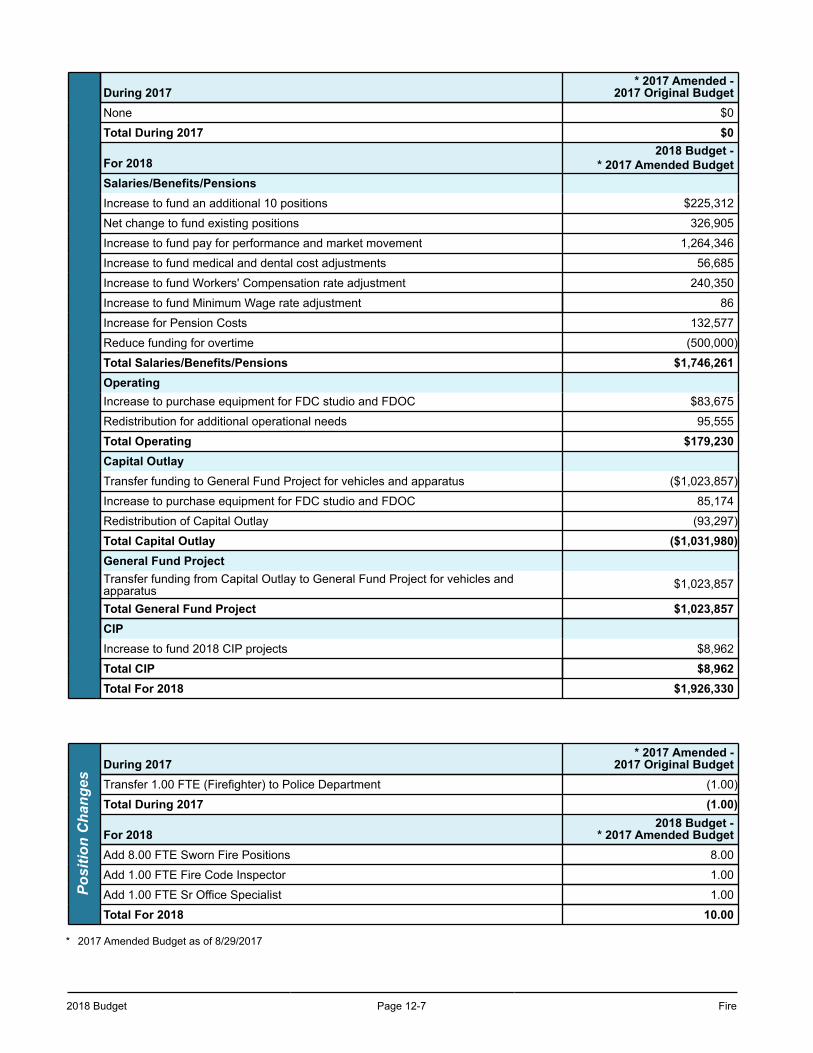
2018 Budget Page 12-7 Fire
During 2017* 2017 Amended -
2017 Original BudgetNone $0
Total During 2017 $0
For 20182018 Budget -
* 2017 Amended BudgetSalaries/Benefits/PensionsIncrease to fund an additional 10 positions $225,312
Net change to fund existing positions 326,905
Increase to fund pay for performance and market movement 1,264,346
Increase to fund medical and dental cost adjustments 56,685
Increase to fund Workers' Compensation rate adjustment 240,350
Increase to fund Minimum Wage rate adjustment 86
Increase for Pension Costs 132,577
Reduce funding for overtime (500,000)
Total Salaries/Benefits/Pensions $1,746,261OperatingIncrease to purchase equipment for FDC studio and FDOC $83,675
Redistribution for additional operational needs 95,555
Total Operating $179,230Capital OutlayTransfer funding to General Fund Project for vehicles and apparatus ($1,023,857)
Increase to purchase equipment for FDC studio and FDOC 85,174
Redistribution of Capital Outlay (93,297)
Total Capital Outlay ($1,031,980)General Fund ProjectTransfer funding from Capital Outlay to General Fund Project for vehicles andapparatus $1,023,857
Total General Fund Project $1,023,857CIPIncrease to fund 2018 CIP projects $8,962
Total CIP $8,962Total For 2018 $1,926,330
Posi
tion
Cha
nges
During 2017* 2017 Amended -
2017 Original BudgetTransfer 1.00 FTE (Firefighter) to Police Department (1.00)
Total During 2017 (1.00)
For 20182018 Budget -
* 2017 Amended BudgetAdd 8.00 FTE Sworn Fire Positions 8.00
Add 1.00 FTE Fire Code Inspector 1.00
Add 1.00 FTE Sr Office Specialist 1.00
Total For 2018 10.00
* 2017 Amended Budget as of 8/29/2017
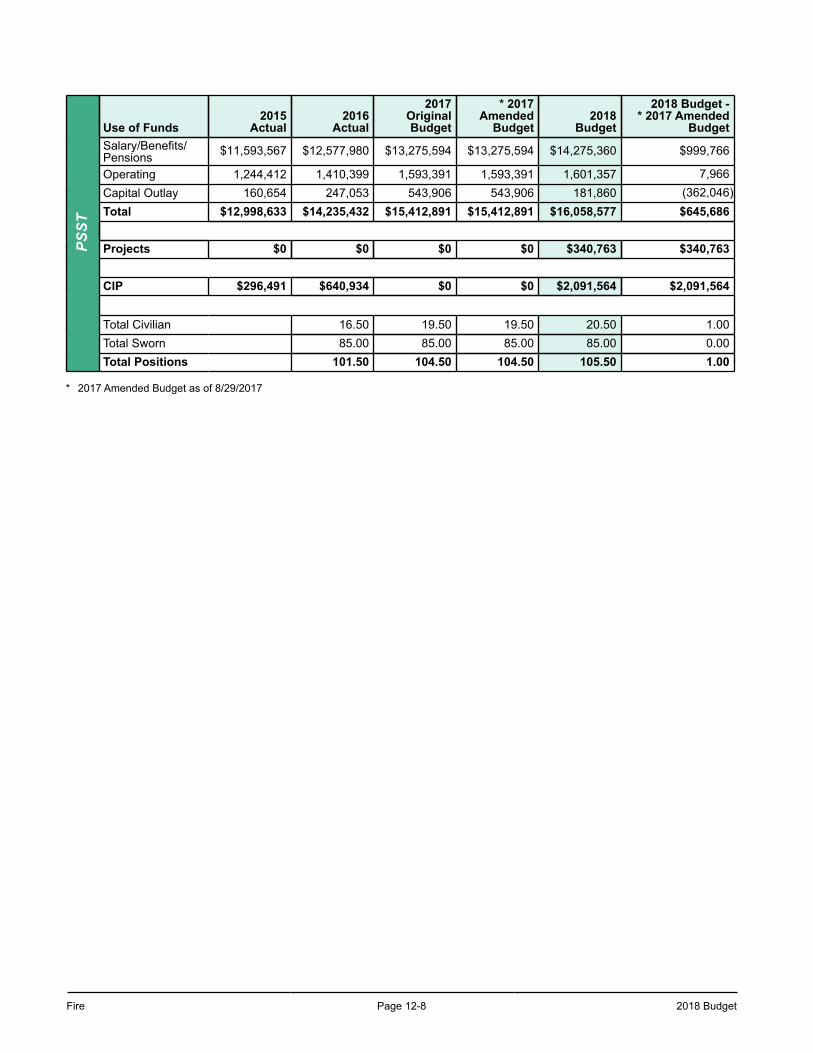
Fire Page 12-8 2018 Budget
PSST
Use of Funds2015
Actual2016
Actual
2017OriginalBudget
* 2017Amended
Budget2018
Budget
2018 Budget -* 2017 Amended
BudgetSalary/Benefits/Pensions $11,593,567 $12,577,980 $13,275,594 $13,275,594 $14,275,360 $999,766
Operating 1,244,412 1,410,399 1,593,391 1,593,391 1,601,357 7,966Capital Outlay 160,654 247,053 543,906 543,906 181,860 (362,046)Total $12,998,633 $14,235,432 $15,412,891 $15,412,891 $16,058,577 $645,686
Projects $0 $0 $0 $0 $340,763 $340,763
CIP $296,491 $640,934 $0 $0 $2,091,564 $2,091,564
Total Civilian 16.50 19.50 19.50 20.50 1.00Total Sworn 85.00 85.00 85.00 85.00 0.00Total Positions 101.50 104.50 104.50 105.50 1.00
* 2017 Amended Budget as of 8/29/2017
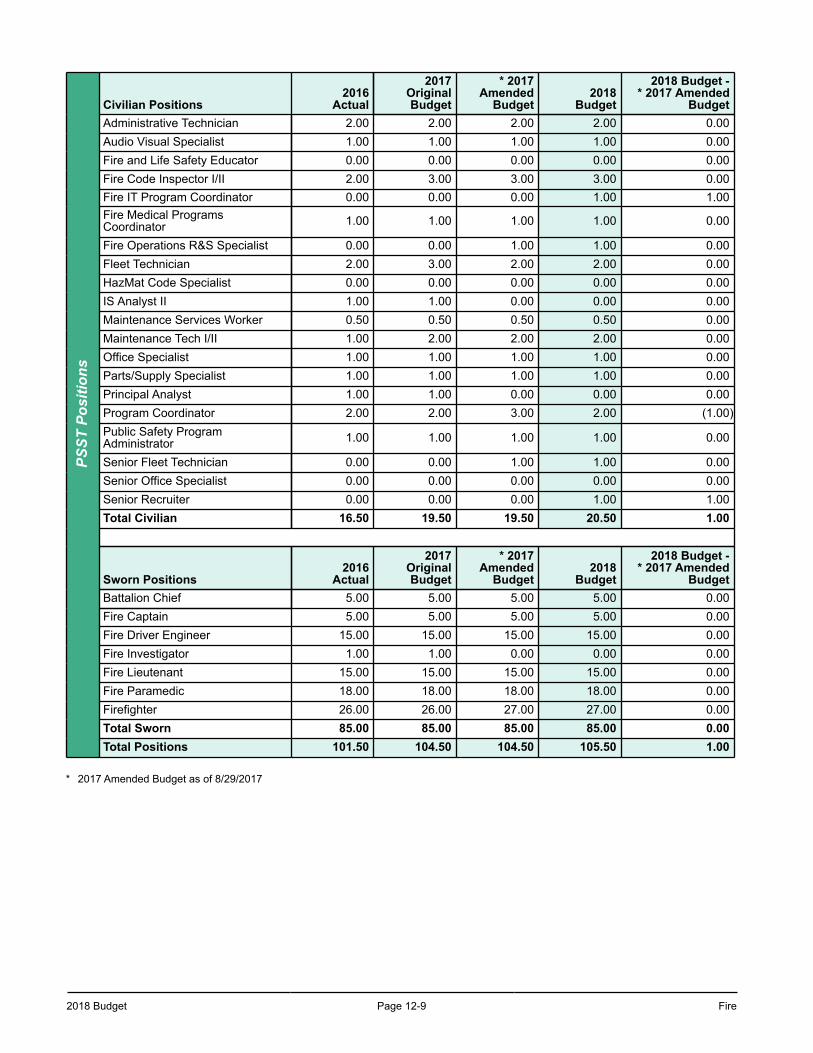
2018 Budget Page 12-9 Fire
PSST
Pos
ition
sCivilian Positions
2016Actual
2017OriginalBudget
* 2017Amended
Budget2018
Budget
2018 Budget -* 2017 Amended
BudgetAdministrative Technician 2.00 2.00 2.00 2.00 0.00Audio Visual Specialist 1.00 1.00 1.00 1.00 0.00Fire and Life Safety Educator 0.00 0.00 0.00 0.00 0.00Fire Code Inspector I/II 2.00 3.00 3.00 3.00 0.00Fire IT Program Coordinator 0.00 0.00 0.00 1.00 1.00Fire Medical ProgramsCoordinator 1.00 1.00 1.00 1.00 0.00
Fire Operations R&S Specialist 0.00 0.00 1.00 1.00 0.00Fleet Technician 2.00 3.00 2.00 2.00 0.00HazMat Code Specialist 0.00 0.00 0.00 0.00 0.00IS Analyst II 1.00 1.00 0.00 0.00 0.00Maintenance Services Worker 0.50 0.50 0.50 0.50 0.00Maintenance Tech I/II 1.00 2.00 2.00 2.00 0.00Office Specialist 1.00 1.00 1.00 1.00 0.00Parts/Supply Specialist 1.00 1.00 1.00 1.00 0.00Principal Analyst 1.00 1.00 0.00 0.00 0.00Program Coordinator 2.00 2.00 3.00 2.00 (1.00)Public Safety ProgramAdministrator 1.00 1.00 1.00 1.00 0.00
Senior Fleet Technician 0.00 0.00 1.00 1.00 0.00Senior Office Specialist 0.00 0.00 0.00 0.00 0.00Senior Recruiter 0.00 0.00 0.00 1.00 1.00Total Civilian 16.50 19.50 19.50 20.50 1.00
Sworn Positions2016
Actual
2017OriginalBudget
* 2017Amended
Budget2018
Budget
2018 Budget -* 2017 Amended
BudgetBattalion Chief 5.00 5.00 5.00 5.00 0.00Fire Captain 5.00 5.00 5.00 5.00 0.00Fire Driver Engineer 15.00 15.00 15.00 15.00 0.00Fire Investigator 1.00 1.00 0.00 0.00 0.00Fire Lieutenant 15.00 15.00 15.00 15.00 0.00Fire Paramedic 18.00 18.00 18.00 18.00 0.00Firefighter 26.00 26.00 27.00 27.00 0.00Total Sworn 85.00 85.00 85.00 85.00 0.00Total Positions 101.50 104.50 104.50 105.50 1.00
* 2017 Amended Budget as of 8/29/2017
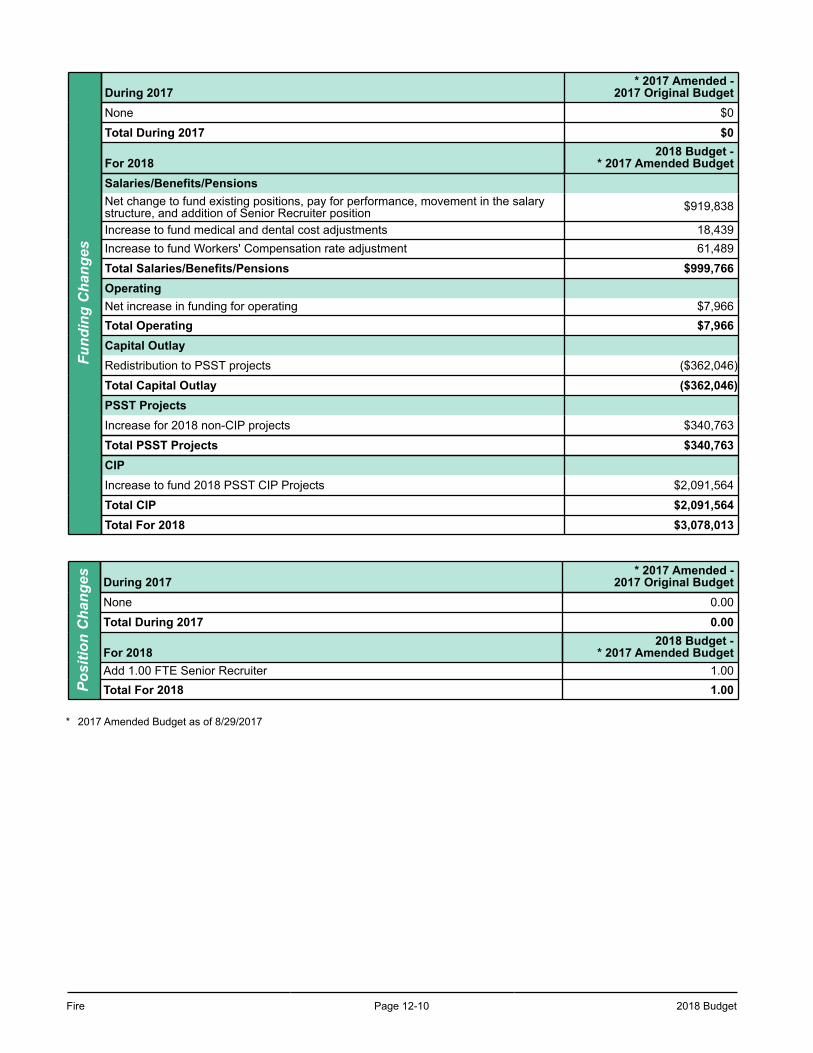
Fire Page 12-10 2018 Budget
Fund
ing
Cha
nges
During 2017* 2017 Amended -
2017 Original BudgetNone $0
Total During 2017 $0
For 20182018 Budget -
* 2017 Amended BudgetSalaries/Benefits/PensionsNet change to fund existing positions, pay for performance, movement in the salarystructure, and addition of Senior Recruiter position $919,838
Increase to fund medical and dental cost adjustments 18,439Increase to fund Workers' Compensation rate adjustment 61,489
Total Salaries/Benefits/Pensions $999,766OperatingNet increase in funding for operating $7,966Total Operating $7,966Capital OutlayRedistribution to PSST projects ($362,046)
Total Capital Outlay ($362,046)PSST ProjectsIncrease for 2018 non-CIP projects $340,763
Total PSST Projects $340,763CIPIncrease to fund 2018 PSST CIP Projects $2,091,564
Total CIP $2,091,564Total For 2018 $3,078,013
Posi
tion
Cha
nges During 2017
* 2017 Amended -2017 Original Budget
None 0.00
Total During 2017 0.00
For 20182018 Budget -
* 2017 Amended BudgetAdd 1.00 FTE Senior Recruiter 1.00Total For 2018 1.00
* 2017 Amended Budget as of 8/29/2017
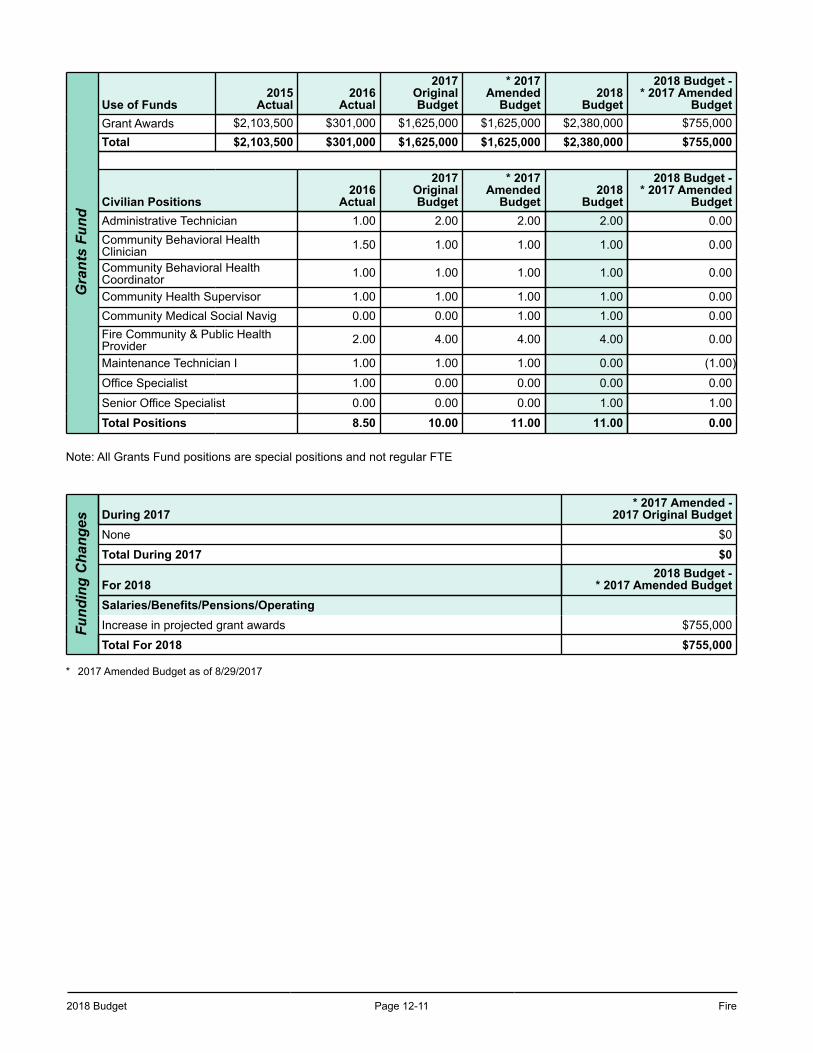
2018 Budget Page 12-11 Fire
Gra
nts
Fund
Use of Funds2015
Actual2016
Actual
2017OriginalBudget
* 2017Amended
Budget2018
Budget
2018 Budget -* 2017 Amended
BudgetGrant Awards $2,103,500 $301,000 $1,625,000 $1,625,000 $2,380,000 $755,000Total $2,103,500 $301,000 $1,625,000 $1,625,000 $2,380,000 $755,000
Civilian Positions2016
Actual
2017OriginalBudget
* 2017Amended
Budget2018
Budget
2018 Budget -* 2017 Amended
BudgetAdministrative Technician 1.00 2.00 2.00 2.00 0.00Community Behavioral HealthClinician 1.50 1.00 1.00 1.00 0.00
Community Behavioral HealthCoordinator 1.00 1.00 1.00 1.00 0.00
Community Health Supervisor 1.00 1.00 1.00 1.00 0.00Community Medical Social Navig 0.00 0.00 1.00 1.00 0.00Fire Community & Public HealthProvider 2.00 4.00 4.00 4.00 0.00
Maintenance Technician I 1.00 1.00 1.00 0.00 (1.00)
Office Specialist 1.00 0.00 0.00 0.00 0.00
Senior Office Specialist 0.00 0.00 0.00 1.00 1.00
Total Positions 8.50 10.00 11.00 11.00 0.00
Note: All Grants Fund positions are special positions and not regular FTE
Fund
ing
Cha
nges During 2017
* 2017 Amended -2017 Original Budget
None $0
Total During 2017 $0
For 20182018 Budget -
* 2017 Amended BudgetSalaries/Benefits/Pensions/OperatingIncrease in projected grant awards $755,000
Total For 2018 $755,000
* 2017 Amended Budget as of 8/29/2017
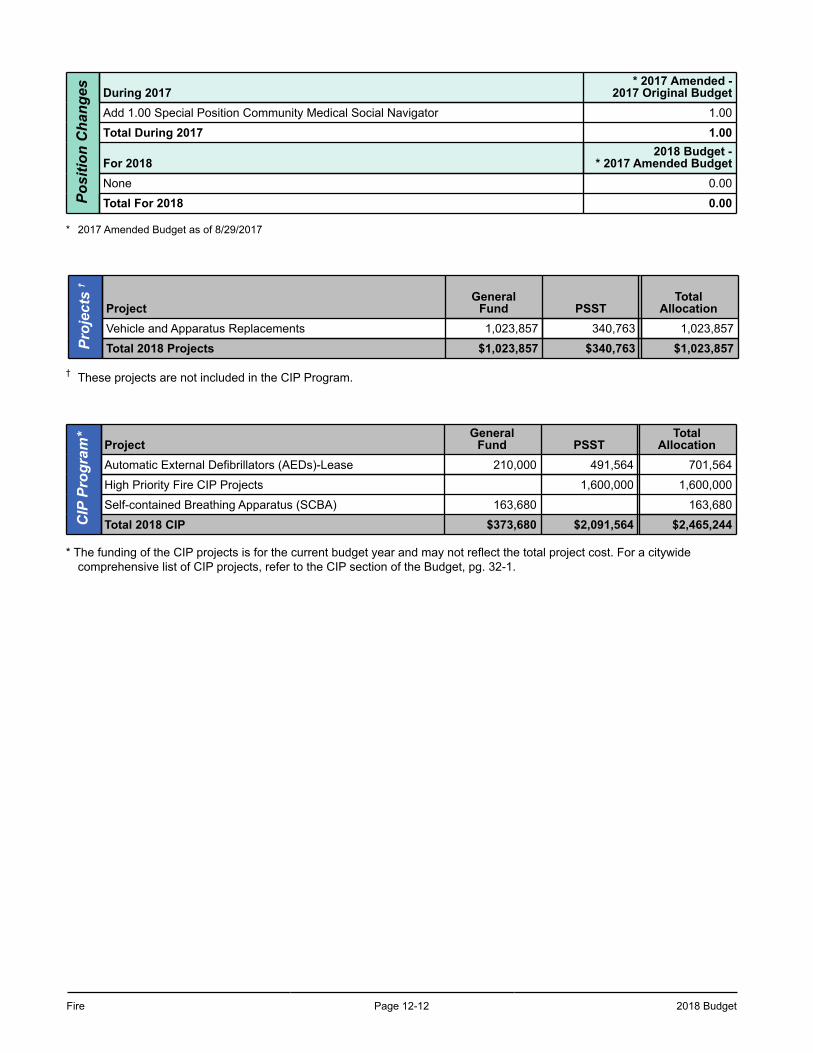
Fire Page 12-12 2018 Budget
Posi
tion
Cha
nges During 2017
* 2017 Amended -2017 Original Budget
Add 1.00 Special Position Community Medical Social Navigator 1.00
Total During 2017 1.00
For 20182018 Budget -
* 2017 Amended BudgetNone 0.00
Total For 2018 0.00
* 2017 Amended Budget as of 8/29/2017
Proj
ects
†
ProjectGeneral
Fund PSSTTotal
AllocationVehicle and Apparatus Replacements 1,023,857 340,763 1,023,857
Total 2018 Projects $1,023,857 $340,763 $1,023,857
† These projects are not included in the CIP Program.
CIP
Pro
gram
*
ProjectGeneral
Fund PSSTTotal
AllocationAutomatic External Defibrillators (AEDs)-Lease 210,000 491,564 701,564
High Priority Fire CIP Projects 1,600,000 1,600,000
Self-contained Breathing Apparatus (SCBA) 163,680 163,680
Total 2018 CIP $373,680 $2,091,564 $2,465,244
* The funding of the CIP projects is for the current budget year and may not reflect the total project cost. For a citywide comprehensive list of CIP projects, refer to the CIP section of the Budget, pg. 32-1.
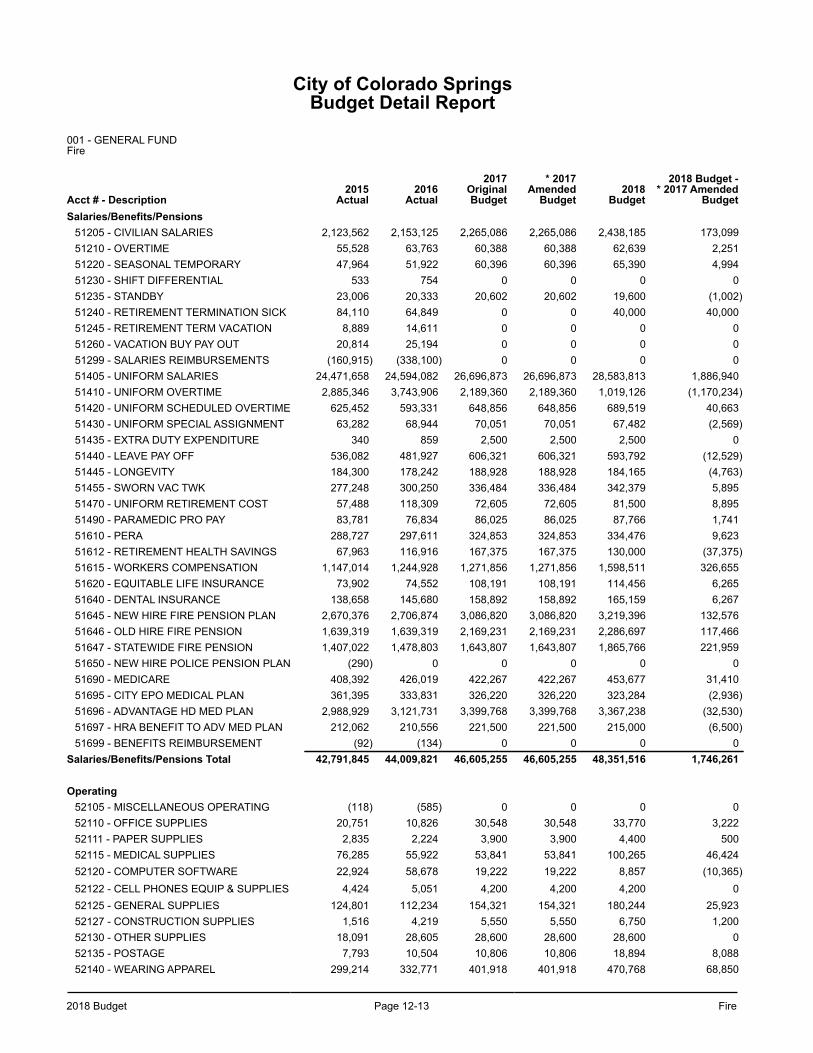
2018 Budget Page 12-13 Fire
City of Colorado SpringsBudget Detail Report
001 - GENERAL FUND Fire
Acct # - Description2015
Actual2016
Actual
2017OriginalBudget
* 2017Amended
Budget2018
Budget
2018 Budget -* 2017 Amended
BudgetSalaries/Benefits/Pensions
51205 - CIVILIAN SALARIES 2,123,562 2,153,125 2,265,086 2,265,086 2,438,185 173,09951210 - OVERTIME 55,528 63,763 60,388 60,388 62,639 2,25151220 - SEASONAL TEMPORARY 47,964 51,922 60,396 60,396 65,390 4,99451230 - SHIFT DIFFERENTIAL 533 754 0 0 0 051235 - STANDBY 23,006 20,333 20,602 20,602 19,600 (1,002)51240 - RETIREMENT TERMINATION SICK 84,110 64,849 0 0 40,000 40,00051245 - RETIREMENT TERM VACATION 8,889 14,611 0 0 0 051260 - VACATION BUY PAY OUT 20,814 25,194 0 0 0 051299 - SALARIES REIMBURSEMENTS (160,915) (338,100) 0 0 0 051405 - UNIFORM SALARIES 24,471,658 24,594,082 26,696,873 26,696,873 28,583,813 1,886,94051410 - UNIFORM OVERTIME 2,885,346 3,743,906 2,189,360 2,189,360 1,019,126 (1,170,234)51420 - UNIFORM SCHEDULED OVERTIME 625,452 593,331 648,856 648,856 689,519 40,66351430 - UNIFORM SPECIAL ASSIGNMENT 63,282 68,944 70,051 70,051 67,482 (2,569)51435 - EXTRA DUTY EXPENDITURE 340 859 2,500 2,500 2,500 051440 - LEAVE PAY OFF 536,082 481,927 606,321 606,321 593,792 (12,529)51445 - LONGEVITY 184,300 178,242 188,928 188,928 184,165 (4,763)51455 - SWORN VAC TWK 277,248 300,250 336,484 336,484 342,379 5,89551470 - UNIFORM RETIREMENT COST 57,488 118,309 72,605 72,605 81,500 8,89551490 - PARAMEDIC PRO PAY 83,781 76,834 86,025 86,025 87,766 1,74151610 - PERA 288,727 297,611 324,853 324,853 334,476 9,62351612 - RETIREMENT HEALTH SAVINGS 67,963 116,916 167,375 167,375 130,000 (37,375)51615 - WORKERS COMPENSATION 1,147,014 1,244,928 1,271,856 1,271,856 1,598,511 326,65551620 - EQUITABLE LIFE INSURANCE 73,902 74,552 108,191 108,191 114,456 6,26551640 - DENTAL INSURANCE 138,658 145,680 158,892 158,892 165,159 6,26751645 - NEW HIRE FIRE PENSION PLAN 2,670,376 2,706,874 3,086,820 3,086,820 3,219,396 132,57651646 - OLD HIRE FIRE PENSION 1,639,319 1,639,319 2,169,231 2,169,231 2,286,697 117,46651647 - STATEWIDE FIRE PENSION 1,407,022 1,478,803 1,643,807 1,643,807 1,865,766 221,95951650 - NEW HIRE POLICE PENSION PLAN (290) 0 0 0 0 051690 - MEDICARE 408,392 426,019 422,267 422,267 453,677 31,41051695 - CITY EPO MEDICAL PLAN 361,395 333,831 326,220 326,220 323,284 (2,936)51696 - ADVANTAGE HD MED PLAN 2,988,929 3,121,731 3,399,768 3,399,768 3,367,238 (32,530)51697 - HRA BENEFIT TO ADV MED PLAN 212,062 210,556 221,500 221,500 215,000 (6,500)51699 - BENEFITS REIMBURSEMENT (92) (134) 0 0 0 0
Salaries/Benefits/Pensions Total 42,791,845 44,009,821 46,605,255 46,605,255 48,351,516 1,746,261
Operating52105 - MISCELLANEOUS OPERATING (118) (585) 0 0 0 052110 - OFFICE SUPPLIES 20,751 10,826 30,548 30,548 33,770 3,22252111 - PAPER SUPPLIES 2,835 2,224 3,900 3,900 4,400 50052115 - MEDICAL SUPPLIES 76,285 55,922 53,841 53,841 100,265 46,42452120 - COMPUTER SOFTWARE 22,924 58,678 19,222 19,222 8,857 (10,365)52122 - CELL PHONES EQUIP & SUPPLIES 4,424 5,051 4,200 4,200 4,200 052125 - GENERAL SUPPLIES 124,801 112,234 154,321 154,321 180,244 25,92352127 - CONSTRUCTION SUPPLIES 1,516 4,219 5,550 5,550 6,750 1,20052130 - OTHER SUPPLIES 18,091 28,605 28,600 28,600 28,600 052135 - POSTAGE 7,793 10,504 10,806 10,806 18,894 8,08852140 - WEARING APPAREL 299,214 332,771 401,918 401,918 470,768 68,850
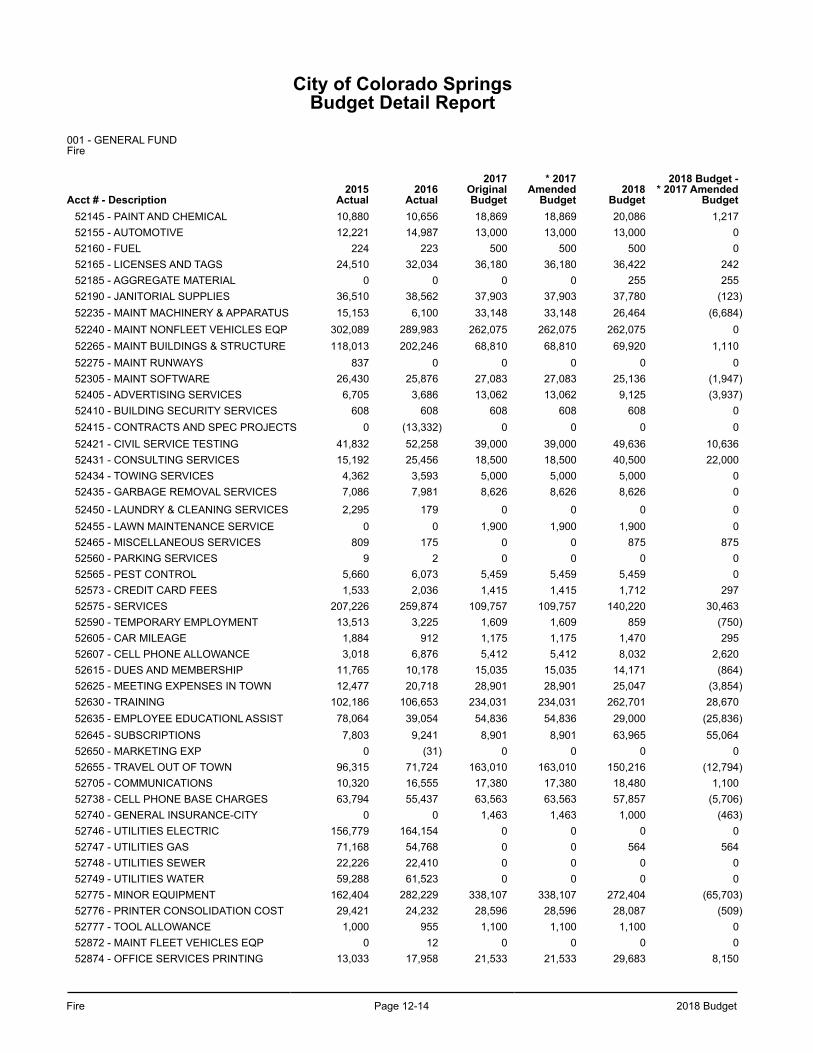
Fire Page 12-14 2018 Budget
City of Colorado SpringsBudget Detail Report
001 - GENERAL FUND Fire
Acct # - Description2015
Actual2016
Actual
2017OriginalBudget
* 2017Amended
Budget2018
Budget
2018 Budget -* 2017 Amended
Budget52145 - PAINT AND CHEMICAL 10,880 10,656 18,869 18,869 20,086 1,21752155 - AUTOMOTIVE 12,221 14,987 13,000 13,000 13,000 052160 - FUEL 224 223 500 500 500 052165 - LICENSES AND TAGS 24,510 32,034 36,180 36,180 36,422 24252185 - AGGREGATE MATERIAL 0 0 0 0 255 25552190 - JANITORIAL SUPPLIES 36,510 38,562 37,903 37,903 37,780 (123)52235 - MAINT MACHINERY & APPARATUS 15,153 6,100 33,148 33,148 26,464 (6,684)52240 - MAINT NONFLEET VEHICLES EQP 302,089 289,983 262,075 262,075 262,075 052265 - MAINT BUILDINGS & STRUCTURE 118,013 202,246 68,810 68,810 69,920 1,11052275 - MAINT RUNWAYS 837 0 0 0 0 052305 - MAINT SOFTWARE 26,430 25,876 27,083 27,083 25,136 (1,947)52405 - ADVERTISING SERVICES 6,705 3,686 13,062 13,062 9,125 (3,937)52410 - BUILDING SECURITY SERVICES 608 608 608 608 608 052415 - CONTRACTS AND SPEC PROJECTS 0 (13,332) 0 0 0 052421 - CIVIL SERVICE TESTING 41,832 52,258 39,000 39,000 49,636 10,63652431 - CONSULTING SERVICES 15,192 25,456 18,500 18,500 40,500 22,00052434 - TOWING SERVICES 4,362 3,593 5,000 5,000 5,000 052435 - GARBAGE REMOVAL SERVICES 7,086 7,981 8,626 8,626 8,626 0
52450 - LAUNDRY & CLEANING SERVICES 2,295 179 0 0 0 052455 - LAWN MAINTENANCE SERVICE 0 0 1,900 1,900 1,900 052465 - MISCELLANEOUS SERVICES 809 175 0 0 875 87552560 - PARKING SERVICES 9 2 0 0 0 052565 - PEST CONTROL 5,660 6,073 5,459 5,459 5,459 052573 - CREDIT CARD FEES 1,533 2,036 1,415 1,415 1,712 29752575 - SERVICES 207,226 259,874 109,757 109,757 140,220 30,46352590 - TEMPORARY EMPLOYMENT 13,513 3,225 1,609 1,609 859 (750)52605 - CAR MILEAGE 1,884 912 1,175 1,175 1,470 29552607 - CELL PHONE ALLOWANCE 3,018 6,876 5,412 5,412 8,032 2,62052615 - DUES AND MEMBERSHIP 11,765 10,178 15,035 15,035 14,171 (864)52625 - MEETING EXPENSES IN TOWN 12,477 20,718 28,901 28,901 25,047 (3,854)52630 - TRAINING 102,186 106,653 234,031 234,031 262,701 28,67052635 - EMPLOYEE EDUCATIONL ASSIST 78,064 39,054 54,836 54,836 29,000 (25,836)52645 - SUBSCRIPTIONS 7,803 9,241 8,901 8,901 63,965 55,06452650 - MARKETING EXP 0 (31) 0 0 0 052655 - TRAVEL OUT OF TOWN 96,315 71,724 163,010 163,010 150,216 (12,794)52705 - COMMUNICATIONS 10,320 16,555 17,380 17,380 18,480 1,10052738 - CELL PHONE BASE CHARGES 63,794 55,437 63,563 63,563 57,857 (5,706)52740 - GENERAL INSURANCE-CITY 0 0 1,463 1,463 1,000 (463)52746 - UTILITIES ELECTRIC 156,779 164,154 0 0 0 052747 - UTILITIES GAS 71,168 54,768 0 0 564 56452748 - UTILITIES SEWER 22,226 22,410 0 0 0 052749 - UTILITIES WATER 59,288 61,523 0 0 0 052775 - MINOR EQUIPMENT 162,404 282,229 338,107 338,107 272,404 (65,703)52776 - PRINTER CONSOLIDATION COST 29,421 24,232 28,596 28,596 28,087 (509)52777 - TOOL ALLOWANCE 1,000 955 1,100 1,100 1,100 052872 - MAINT FLEET VEHICLES EQP 0 12 0 0 0 052874 - OFFICE SERVICES PRINTING 13,033 17,958 21,533 21,533 29,683 8,150
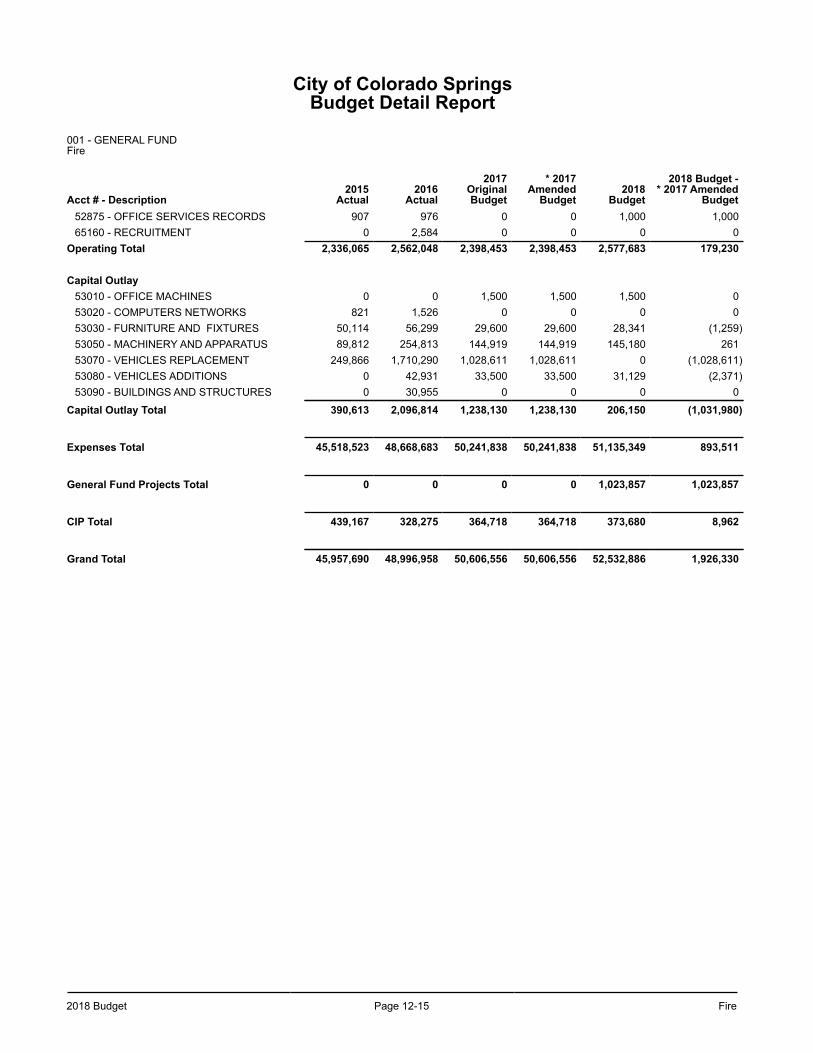
2018 Budget Page 12-15 Fire
City of Colorado SpringsBudget Detail Report
001 - GENERAL FUND Fire
Acct # - Description2015
Actual2016
Actual
2017OriginalBudget
* 2017Amended
Budget2018
Budget
2018 Budget -* 2017 Amended
Budget52875 - OFFICE SERVICES RECORDS 907 976 0 0 1,000 1,00065160 - RECRUITMENT 0 2,584 0 0 0 0
Operating Total 2,336,065 2,562,048 2,398,453 2,398,453 2,577,683 179,230
Capital Outlay53010 - OFFICE MACHINES 0 0 1,500 1,500 1,500 053020 - COMPUTERS NETWORKS 821 1,526 0 0 0 053030 - FURNITURE AND FIXTURES 50,114 56,299 29,600 29,600 28,341 (1,259)53050 - MACHINERY AND APPARATUS 89,812 254,813 144,919 144,919 145,180 26153070 - VEHICLES REPLACEMENT 249,866 1,710,290 1,028,611 1,028,611 0 (1,028,611)53080 - VEHICLES ADDITIONS 0 42,931 33,500 33,500 31,129 (2,371)53090 - BUILDINGS AND STRUCTURES 0 30,955 0 0 0 0
Capital Outlay Total 390,613 2,096,814 1,238,130 1,238,130 206,150 (1,031,980)
Expenses Total 45,518,523 48,668,683 50,241,838 50,241,838 51,135,349 893,511
General Fund Projects Total 0 0 0 0 1,023,857 1,023,857
CIP Total 439,167 328,275 364,718 364,718 373,680 8,962
Grand Total 45,957,690 48,996,958 50,606,556 50,606,556 52,532,886 1,926,330
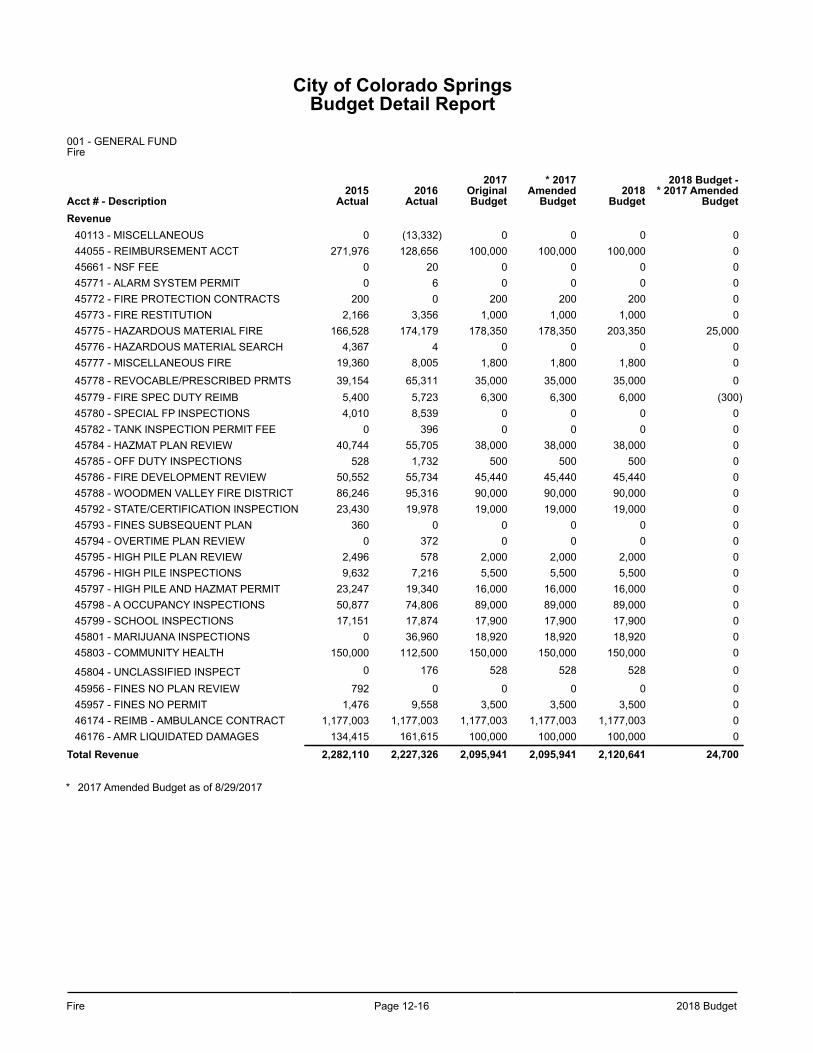
Fire Page 12-16 2018 Budget
City of Colorado SpringsBudget Detail Report
001 - GENERAL FUND Fire
Acct # - Description2015
Actual2016
Actual
2017OriginalBudget
* 2017Amended
Budget2018
Budget
2018 Budget -* 2017 Amended
BudgetRevenue
40113 - MISCELLANEOUS 0 (13,332) 0 0 0 044055 - REIMBURSEMENT ACCT 271,976 128,656 100,000 100,000 100,000 045661 - NSF FEE 0 20 0 0 0 045771 - ALARM SYSTEM PERMIT 0 6 0 0 0 045772 - FIRE PROTECTION CONTRACTS 200 0 200 200 200 045773 - FIRE RESTITUTION 2,166 3,356 1,000 1,000 1,000 045775 - HAZARDOUS MATERIAL FIRE 166,528 174,179 178,350 178,350 203,350 25,00045776 - HAZARDOUS MATERIAL SEARCH 4,367 4 0 0 0 045777 - MISCELLANEOUS FIRE 19,360 8,005 1,800 1,800 1,800 0
45778 - REVOCABLE/PRESCRIBED PRMTS 39,154 65,311 35,000 35,000 35,000 045779 - FIRE SPEC DUTY REIMB 5,400 5,723 6,300 6,300 6,000 (300)45780 - SPECIAL FP INSPECTIONS 4,010 8,539 0 0 0 045782 - TANK INSPECTION PERMIT FEE 0 396 0 0 0 045784 - HAZMAT PLAN REVIEW 40,744 55,705 38,000 38,000 38,000 045785 - OFF DUTY INSPECTIONS 528 1,732 500 500 500 045786 - FIRE DEVELOPMENT REVIEW 50,552 55,734 45,440 45,440 45,440 045788 - WOODMEN VALLEY FIRE DISTRICT 86,246 95,316 90,000 90,000 90,000 045792 - STATE/CERTIFICATION INSPECTION 23,430 19,978 19,000 19,000 19,000 045793 - FINES SUBSEQUENT PLAN 360 0 0 0 0 045794 - OVERTIME PLAN REVIEW 0 372 0 0 0 045795 - HIGH PILE PLAN REVIEW 2,496 578 2,000 2,000 2,000 045796 - HIGH PILE INSPECTIONS 9,632 7,216 5,500 5,500 5,500 045797 - HIGH PILE AND HAZMAT PERMIT 23,247 19,340 16,000 16,000 16,000 045798 - A OCCUPANCY INSPECTIONS 50,877 74,806 89,000 89,000 89,000 045799 - SCHOOL INSPECTIONS 17,151 17,874 17,900 17,900 17,900 045801 - MARIJUANA INSPECTIONS 0 36,960 18,920 18,920 18,920 045803 - COMMUNITY HEALTH 150,000 112,500 150,000 150,000 150,000 0
45804 - UNCLASSIFIED INSPECT 0 176 528 528 528 0
45956 - FINES NO PLAN REVIEW 792 0 0 0 0 045957 - FINES NO PERMIT 1,476 9,558 3,500 3,500 3,500 046174 - REIMB - AMBULANCE CONTRACT 1,177,003 1,177,003 1,177,003 1,177,003 1,177,003 046176 - AMR LIQUIDATED DAMAGES 134,415 161,615 100,000 100,000 100,000 0
Total Revenue 2,282,110 2,227,326 2,095,941 2,095,941 2,120,641 24,700
* 2017 Amended Budget as of 8/29/2017
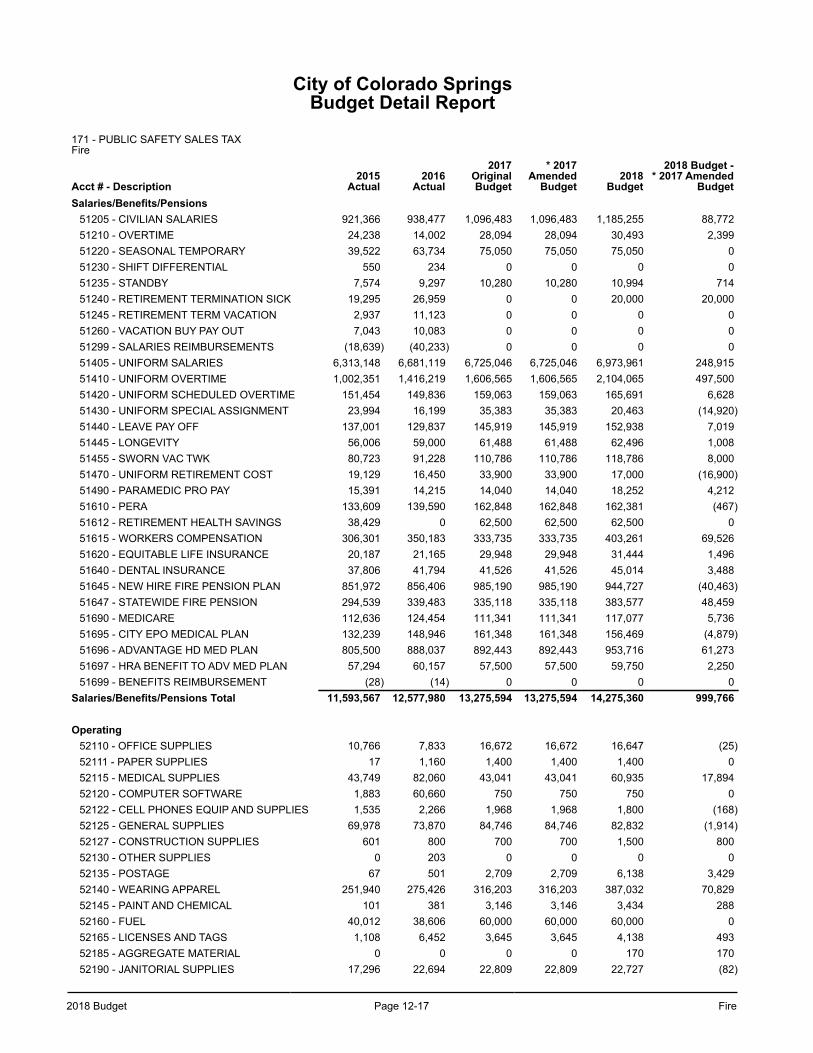
2018 Budget Page 12-17 Fire
City of Colorado SpringsBudget Detail Report
171 - PUBLIC SAFETY SALES TAXFire
Acct # - Description2015
Actual2016
Actual
2017OriginalBudget
* 2017Amended
Budget2018
Budget
2018 Budget -* 2017 Amended
BudgetSalaries/Benefits/Pensions
51205 - CIVILIAN SALARIES 921,366 938,477 1,096,483 1,096,483 1,185,255 88,77251210 - OVERTIME 24,238 14,002 28,094 28,094 30,493 2,39951220 - SEASONAL TEMPORARY 39,522 63,734 75,050 75,050 75,050 051230 - SHIFT DIFFERENTIAL 550 234 0 0 0 051235 - STANDBY 7,574 9,297 10,280 10,280 10,994 71451240 - RETIREMENT TERMINATION SICK 19,295 26,959 0 0 20,000 20,00051245 - RETIREMENT TERM VACATION 2,937 11,123 0 0 0 051260 - VACATION BUY PAY OUT 7,043 10,083 0 0 0 051299 - SALARIES REIMBURSEMENTS (18,639) (40,233) 0 0 0 051405 - UNIFORM SALARIES 6,313,148 6,681,119 6,725,046 6,725,046 6,973,961 248,91551410 - UNIFORM OVERTIME 1,002,351 1,416,219 1,606,565 1,606,565 2,104,065 497,50051420 - UNIFORM SCHEDULED OVERTIME 151,454 149,836 159,063 159,063 165,691 6,62851430 - UNIFORM SPECIAL ASSIGNMENT 23,994 16,199 35,383 35,383 20,463 (14,920)51440 - LEAVE PAY OFF 137,001 129,837 145,919 145,919 152,938 7,01951445 - LONGEVITY 56,006 59,000 61,488 61,488 62,496 1,00851455 - SWORN VAC TWK 80,723 91,228 110,786 110,786 118,786 8,00051470 - UNIFORM RETIREMENT COST 19,129 16,450 33,900 33,900 17,000 (16,900)51490 - PARAMEDIC PRO PAY 15,391 14,215 14,040 14,040 18,252 4,21251610 - PERA 133,609 139,590 162,848 162,848 162,381 (467)51612 - RETIREMENT HEALTH SAVINGS 38,429 0 62,500 62,500 62,500 051615 - WORKERS COMPENSATION 306,301 350,183 333,735 333,735 403,261 69,52651620 - EQUITABLE LIFE INSURANCE 20,187 21,165 29,948 29,948 31,444 1,49651640 - DENTAL INSURANCE 37,806 41,794 41,526 41,526 45,014 3,48851645 - NEW HIRE FIRE PENSION PLAN 851,972 856,406 985,190 985,190 944,727 (40,463)51647 - STATEWIDE FIRE PENSION 294,539 339,483 335,118 335,118 383,577 48,45951690 - MEDICARE 112,636 124,454 111,341 111,341 117,077 5,73651695 - CITY EPO MEDICAL PLAN 132,239 148,946 161,348 161,348 156,469 (4,879)51696 - ADVANTAGE HD MED PLAN 805,500 888,037 892,443 892,443 953,716 61,27351697 - HRA BENEFIT TO ADV MED PLAN 57,294 60,157 57,500 57,500 59,750 2,25051699 - BENEFITS REIMBURSEMENT (28) (14) 0 0 0 0
Salaries/Benefits/Pensions Total 11,593,567 12,577,980 13,275,594 13,275,594 14,275,360 999,766
Operating52110 - OFFICE SUPPLIES 10,766 7,833 16,672 16,672 16,647 (25)52111 - PAPER SUPPLIES 17 1,160 1,400 1,400 1,400 052115 - MEDICAL SUPPLIES 43,749 82,060 43,041 43,041 60,935 17,89452120 - COMPUTER SOFTWARE 1,883 60,660 750 750 750 052122 - CELL PHONES EQUIP AND SUPPLIES 1,535 2,266 1,968 1,968 1,800 (168)52125 - GENERAL SUPPLIES 69,978 73,870 84,746 84,746 82,832 (1,914)52127 - CONSTRUCTION SUPPLIES 601 800 700 700 1,500 80052130 - OTHER SUPPLIES 0 203 0 0 0 052135 - POSTAGE 67 501 2,709 2,709 6,138 3,42952140 - WEARING APPAREL 251,940 275,426 316,203 316,203 387,032 70,82952145 - PAINT AND CHEMICAL 101 381 3,146 3,146 3,434 28852160 - FUEL 40,012 38,606 60,000 60,000 60,000 052165 - LICENSES AND TAGS 1,108 6,452 3,645 3,645 4,138 49352185 - AGGREGATE MATERIAL 0 0 0 0 170 17052190 - JANITORIAL SUPPLIES 17,296 22,694 22,809 22,809 22,727 (82)
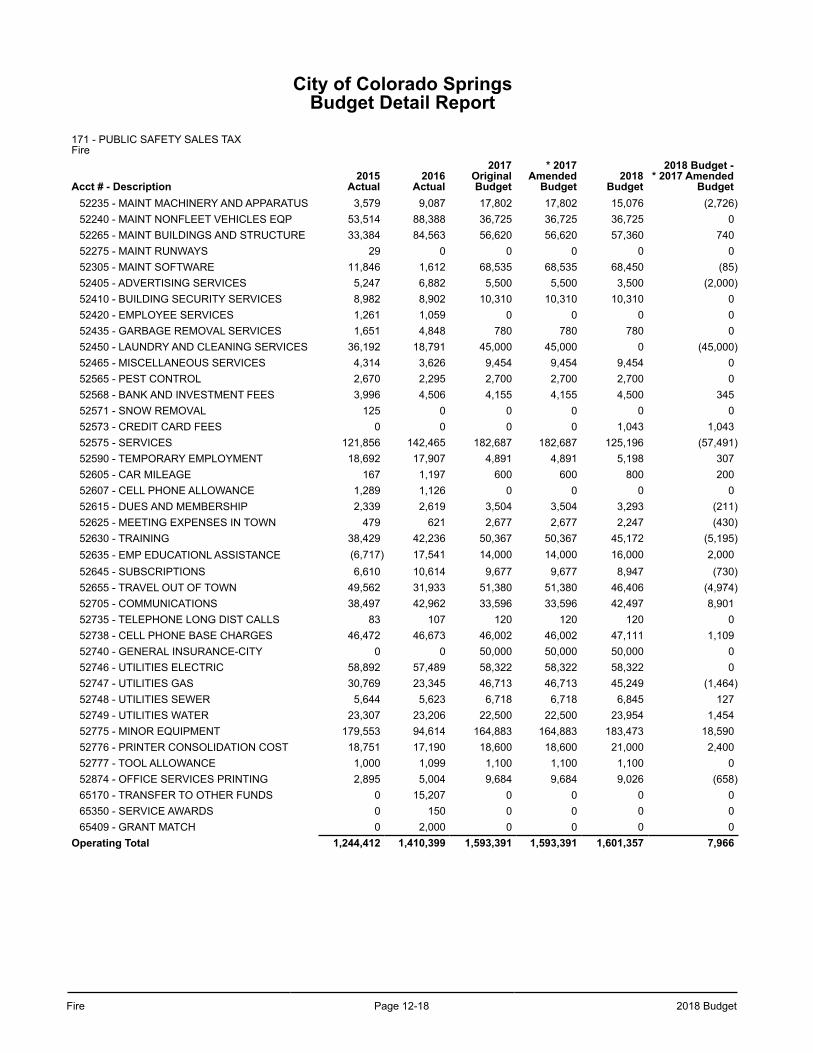
Fire Page 12-18 2018 Budget
City of Colorado SpringsBudget Detail Report
171 - PUBLIC SAFETY SALES TAXFire
Acct # - Description2015
Actual2016
Actual
2017OriginalBudget
* 2017Amended
Budget2018
Budget
2018 Budget -* 2017 Amended
Budget52235 - MAINT MACHINERY AND APPARATUS 3,579 9,087 17,802 17,802 15,076 (2,726)52240 - MAINT NONFLEET VEHICLES EQP 53,514 88,388 36,725 36,725 36,725 052265 - MAINT BUILDINGS AND STRUCTURE 33,384 84,563 56,620 56,620 57,360 74052275 - MAINT RUNWAYS 29 0 0 0 0 052305 - MAINT SOFTWARE 11,846 1,612 68,535 68,535 68,450 (85)52405 - ADVERTISING SERVICES 5,247 6,882 5,500 5,500 3,500 (2,000)52410 - BUILDING SECURITY SERVICES 8,982 8,902 10,310 10,310 10,310 052420 - EMPLOYEE SERVICES 1,261 1,059 0 0 0 052435 - GARBAGE REMOVAL SERVICES 1,651 4,848 780 780 780 052450 - LAUNDRY AND CLEANING SERVICES 36,192 18,791 45,000 45,000 0 (45,000)52465 - MISCELLANEOUS SERVICES 4,314 3,626 9,454 9,454 9,454 052565 - PEST CONTROL 2,670 2,295 2,700 2,700 2,700 052568 - BANK AND INVESTMENT FEES 3,996 4,506 4,155 4,155 4,500 34552571 - SNOW REMOVAL 125 0 0 0 0 052573 - CREDIT CARD FEES 0 0 0 0 1,043 1,04352575 - SERVICES 121,856 142,465 182,687 182,687 125,196 (57,491)52590 - TEMPORARY EMPLOYMENT 18,692 17,907 4,891 4,891 5,198 30752605 - CAR MILEAGE 167 1,197 600 600 800 20052607 - CELL PHONE ALLOWANCE 1,289 1,126 0 0 0 052615 - DUES AND MEMBERSHIP 2,339 2,619 3,504 3,504 3,293 (211)52625 - MEETING EXPENSES IN TOWN 479 621 2,677 2,677 2,247 (430)52630 - TRAINING 38,429 42,236 50,367 50,367 45,172 (5,195)52635 - EMP EDUCATIONL ASSISTANCE (6,717) 17,541 14,000 14,000 16,000 2,00052645 - SUBSCRIPTIONS 6,610 10,614 9,677 9,677 8,947 (730)52655 - TRAVEL OUT OF TOWN 49,562 31,933 51,380 51,380 46,406 (4,974)52705 - COMMUNICATIONS 38,497 42,962 33,596 33,596 42,497 8,90152735 - TELEPHONE LONG DIST CALLS 83 107 120 120 120 052738 - CELL PHONE BASE CHARGES 46,472 46,673 46,002 46,002 47,111 1,10952740 - GENERAL INSURANCE-CITY 0 0 50,000 50,000 50,000 052746 - UTILITIES ELECTRIC 58,892 57,489 58,322 58,322 58,322 052747 - UTILITIES GAS 30,769 23,345 46,713 46,713 45,249 (1,464)52748 - UTILITIES SEWER 5,644 5,623 6,718 6,718 6,845 12752749 - UTILITIES WATER 23,307 23,206 22,500 22,500 23,954 1,45452775 - MINOR EQUIPMENT 179,553 94,614 164,883 164,883 183,473 18,59052776 - PRINTER CONSOLIDATION COST 18,751 17,190 18,600 18,600 21,000 2,40052777 - TOOL ALLOWANCE 1,000 1,099 1,100 1,100 1,100 052874 - OFFICE SERVICES PRINTING 2,895 5,004 9,684 9,684 9,026 (658)65170 - TRANSFER TO OTHER FUNDS 0 15,207 0 0 0 065350 - SERVICE AWARDS 0 150 0 0 0 065409 - GRANT MATCH 0 2,000 0 0 0 0
Operating Total 1,244,412 1,410,399 1,593,391 1,593,391 1,601,357 7,966
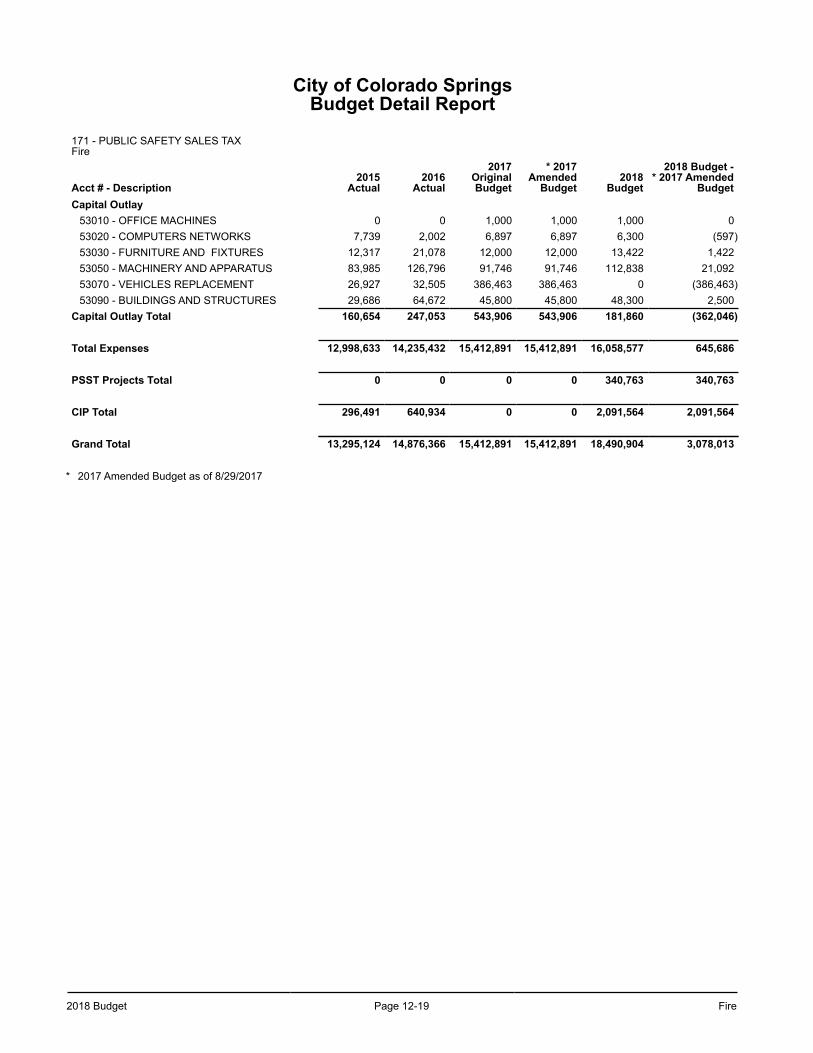
2018 Budget Page 12-19 Fire
City of Colorado SpringsBudget Detail Report
171 - PUBLIC SAFETY SALES TAXFire
Acct # - Description2015
Actual2016
Actual
2017OriginalBudget
* 2017Amended
Budget2018
Budget
2018 Budget -* 2017 Amended
BudgetCapital Outlay
53010 - OFFICE MACHINES 0 0 1,000 1,000 1,000 053020 - COMPUTERS NETWORKS 7,739 2,002 6,897 6,897 6,300 (597)53030 - FURNITURE AND FIXTURES 12,317 21,078 12,000 12,000 13,422 1,42253050 - MACHINERY AND APPARATUS 83,985 126,796 91,746 91,746 112,838 21,09253070 - VEHICLES REPLACEMENT 26,927 32,505 386,463 386,463 0 (386,463)53090 - BUILDINGS AND STRUCTURES 29,686 64,672 45,800 45,800 48,300 2,500
Capital Outlay Total 160,654 247,053 543,906 543,906 181,860 (362,046)
Total Expenses 12,998,633 14,235,432 15,412,891 15,412,891 16,058,577 645,686
PSST Projects Total 0 0 0 0 340,763 340,763
CIP Total 296,491 640,934 0 0 2,091,564 2,091,564
Grand Total 13,295,124 14,876,366 15,412,891 15,412,891 18,490,904 3,078,013
* 2017 Amended Budget as of 8/29/2017

Fire Page 12-20 2018 Budget
This page left blank intentionally.
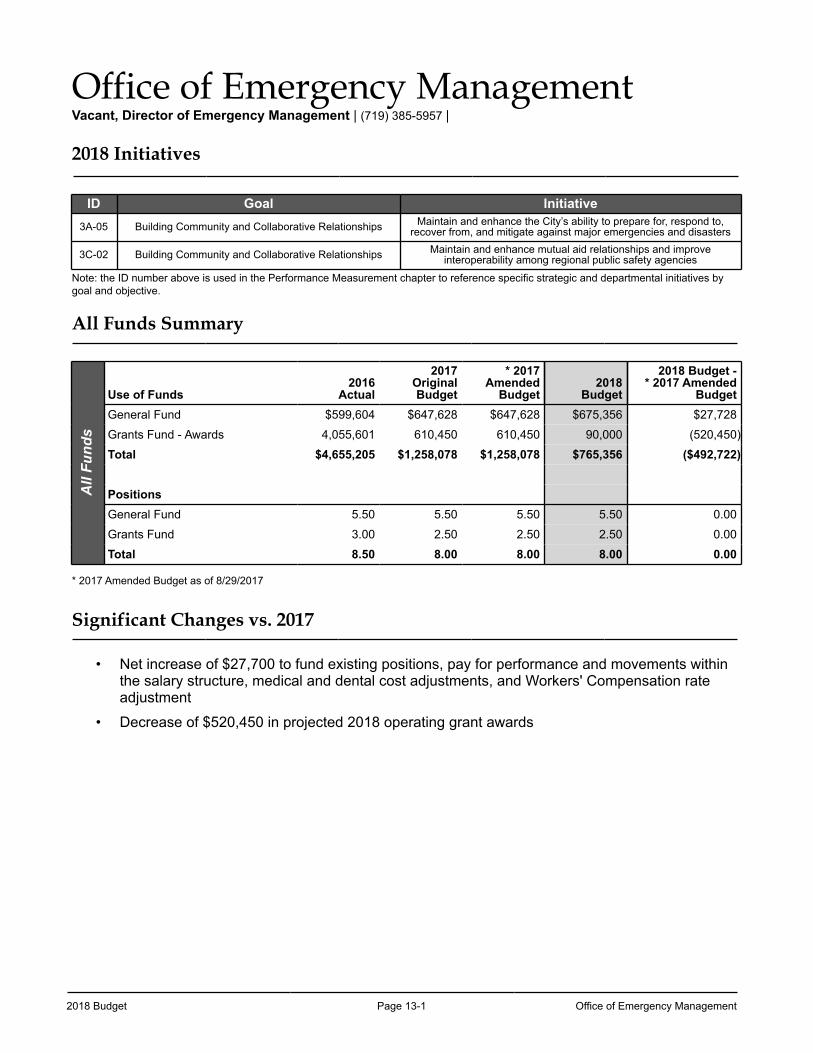
2018 Budget Page 13-1 Office of Emergency Management
Office of Emergency ManagementVacant, Director of Emergency Management | (719) 385-5957 |
2018 Initiatives
ID Goal Initiative3A-05 Building Community and Collaborative Relationships Maintain and enhance the City’s ability to prepare for, respond to,
recover from, and mitigate against major emergencies and disasters
3C-02 Building Community and Collaborative Relationships Maintain and enhance mutual aid relationships and improve interoperability among regional public safety agencies
Note: the ID number above is used in the Performance Measurement chapter to reference specific strategic and departmental initiatives by goal and objective.
All Funds Summary
All
Fund
s
Use of Funds2016
Actual
2017OriginalBudget
* 2017Amended
Budget2018
Budget
2018 Budget -* 2017 Amended
BudgetGeneral Fund $599,604 $647,628 $647,628 $675,356 $27,728
Grants Fund - Awards 4,055,601 610,450 610,450 90,000 (520,450)
Total $4,655,205 $1,258,078 $1,258,078 $765,356 ($492,722)
PositionsGeneral Fund 5.50 5.50 5.50 5.50 0.00
Grants Fund 3.00 2.50 2.50 2.50 0.00
Total 8.50 8.00 8.00 8.00 0.00
* 2017 Amended Budget as of 8/29/2017
Significant Changes vs. 2017
• Net increase of $27,700 to fund existing positions, pay for performance and movements within the salary structure, medical and dental cost adjustments, and Workers' Compensation rate adjustment
• Decrease of $520,450 in projected 2018 operating grant awards
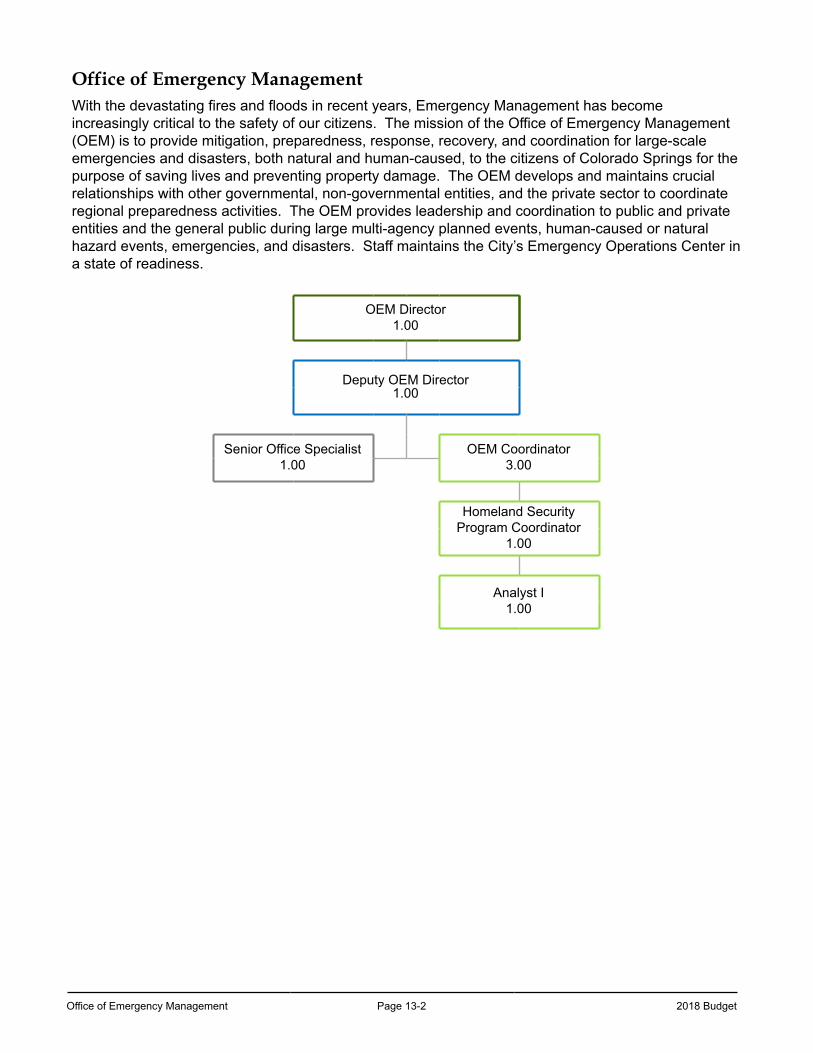
Office of Emergency Management Page 13-2 2018 Budget
Office of Emergency ManagementWith the devastating fires and floods in recent years, Emergency Management has become increasingly critical to the safety of our citizens. The mission of the Office of Emergency Management (OEM) is to provide mitigation, preparedness, response, recovery, and coordination for large-scale emergencies and disasters, both natural and human-caused, to the citizens of Colorado Springs for the purpose of saving lives and preventing property damage. The OEM develops and maintains crucial relationships with other governmental, non-governmental entities, and the private sector to coordinate regional preparedness activities. The OEM provides leadership and coordination to public and private entities and the general public during large multi-agency planned events, human-caused or natural hazard events, emergencies, and disasters. Staff maintains the City’s Emergency Operations Center in a state of readiness.
OEM Director1.00
Deputy OEM Director1.00
Senior Office Specialist1.00
OEM Coordinator3.00
Homeland Security Program Coordinator
1.00
Analyst I1.00
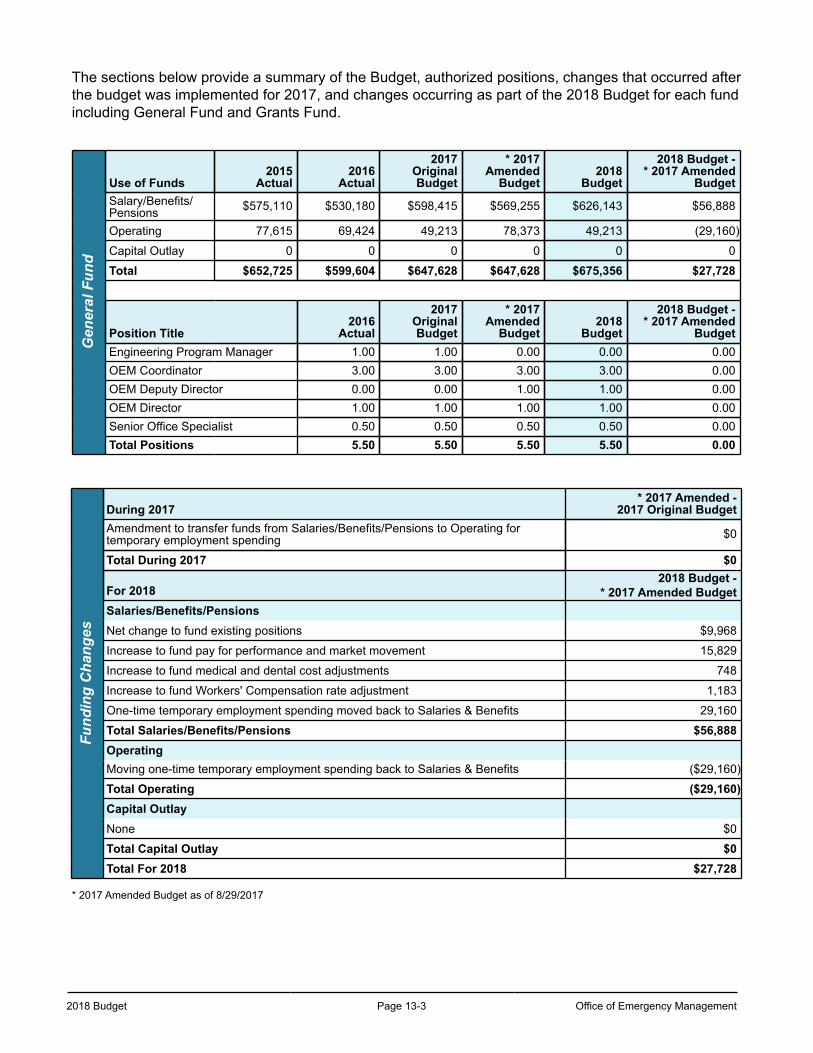
2018 Budget Page 13-3 Office of Emergency Management
The sections below provide a summary of the Budget, authorized positions, changes that occurred after the budget was implemented for 2017, and changes occurring as part of the 2018 Budget for each fund including General Fund and Grants Fund.
Gen
eral
Fun
d
Use of Funds2015
Actual2016
Actual
2017OriginalBudget
* 2017Amended
Budget2018
Budget
2018 Budget -* 2017 Amended
BudgetSalary/Benefits/Pensions $575,110 $530,180 $598,415 $569,255 $626,143 $56,888
Operating 77,615 69,424 49,213 78,373 49,213 (29,160)
Capital Outlay 0 0 0 0 0 0
Total $652,725 $599,604 $647,628 $647,628 $675,356 $27,728
Position Title2016
Actual
2017OriginalBudget
* 2017Amended
Budget2018
Budget
2018 Budget -* 2017 Amended
BudgetEngineering Program Manager 1.00 1.00 0.00 0.00 0.00OEM Coordinator 3.00 3.00 3.00 3.00 0.00OEM Deputy Director 0.00 0.00 1.00 1.00 0.00OEM Director 1.00 1.00 1.00 1.00 0.00Senior Office Specialist 0.50 0.50 0.50 0.50 0.00Total Positions 5.50 5.50 5.50 5.50 0.00
Fund
ing
Cha
nges
During 2017* 2017 Amended -
2017 Original BudgetAmendment to transfer funds from Salaries/Benefits/Pensions to Operating fortemporary employment spending $0
Total During 2017 $0
For 20182018 Budget -
* 2017 Amended BudgetSalaries/Benefits/PensionsNet change to fund existing positions $9,968
Increase to fund pay for performance and market movement 15,829
Increase to fund medical and dental cost adjustments 748
Increase to fund Workers' Compensation rate adjustment 1,183
One-time temporary employment spending moved back to Salaries & Benefits 29,160
Total Salaries/Benefits/Pensions $56,888OperatingMoving one-time temporary employment spending back to Salaries & Benefits ($29,160)
Total Operating ($29,160)Capital OutlayNone $0
Total Capital Outlay $0Total For 2018 $27,728
* 2017 Amended Budget as of 8/29/2017
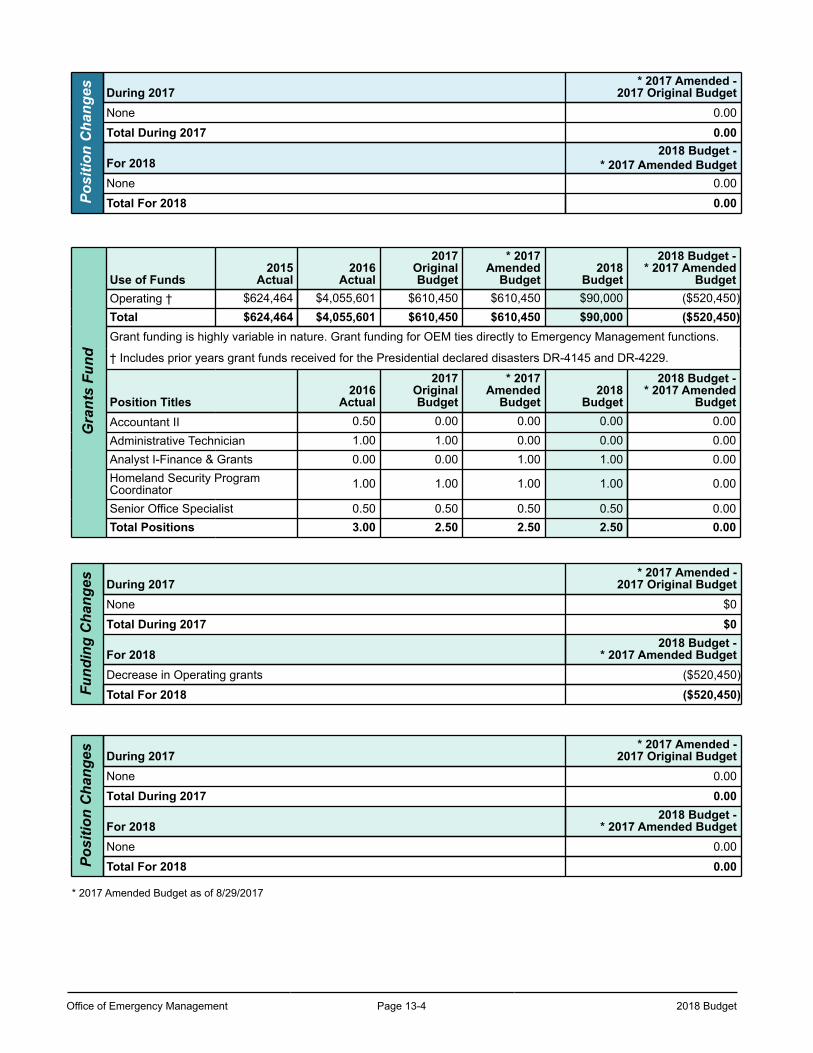
Office of Emergency Management Page 13-4 2018 Budget
Posi
tion
Cha
nges During 2017
* 2017 Amended -2017 Original Budget
None 0.00
Total During 2017 0.00
For 20182018 Budget -
* 2017 Amended BudgetNone 0.00
Total For 2018 0.00
Gra
nts
Fund
Use of Funds2015
Actual2016
Actual
2017OriginalBudget
* 2017Amended
Budget2018
Budget
2018 Budget -* 2017 Amended
BudgetOperating † $624,464 $4,055,601 $610,450 $610,450 $90,000 ($520,450)Total $624,464 $4,055,601 $610,450 $610,450 $90,000 ($520,450)Grant funding is highly variable in nature. Grant funding for OEM ties directly to Emergency Management functions.
† Includes prior years grant funds received for the Presidential declared disasters DR-4145 and DR-4229.
Position Titles2016
Actual
2017OriginalBudget
* 2017Amended
Budget2018
Budget
2018 Budget -* 2017 Amended
BudgetAccountant II 0.50 0.00 0.00 0.00 0.00Administrative Technician 1.00 1.00 0.00 0.00 0.00Analyst I-Finance & Grants 0.00 0.00 1.00 1.00 0.00Homeland Security ProgramCoordinator 1.00 1.00 1.00 1.00 0.00
Senior Office Specialist 0.50 0.50 0.50 0.50 0.00Total Positions 3.00 2.50 2.50 2.50 0.00
Fund
ing
Cha
nges During 2017
* 2017 Amended -2017 Original Budget
None $0
Total During 2017 $0
For 20182018 Budget -
* 2017 Amended BudgetDecrease in Operating grants ($520,450)
Total For 2018 ($520,450)
Posi
tion
Cha
nges During 2017
* 2017 Amended -2017 Original Budget
None 0.00
Total During 2017 0.00
For 20182018 Budget -
* 2017 Amended BudgetNone 0.00
Total For 2018 0.00
* 2017 Amended Budget as of 8/29/2017
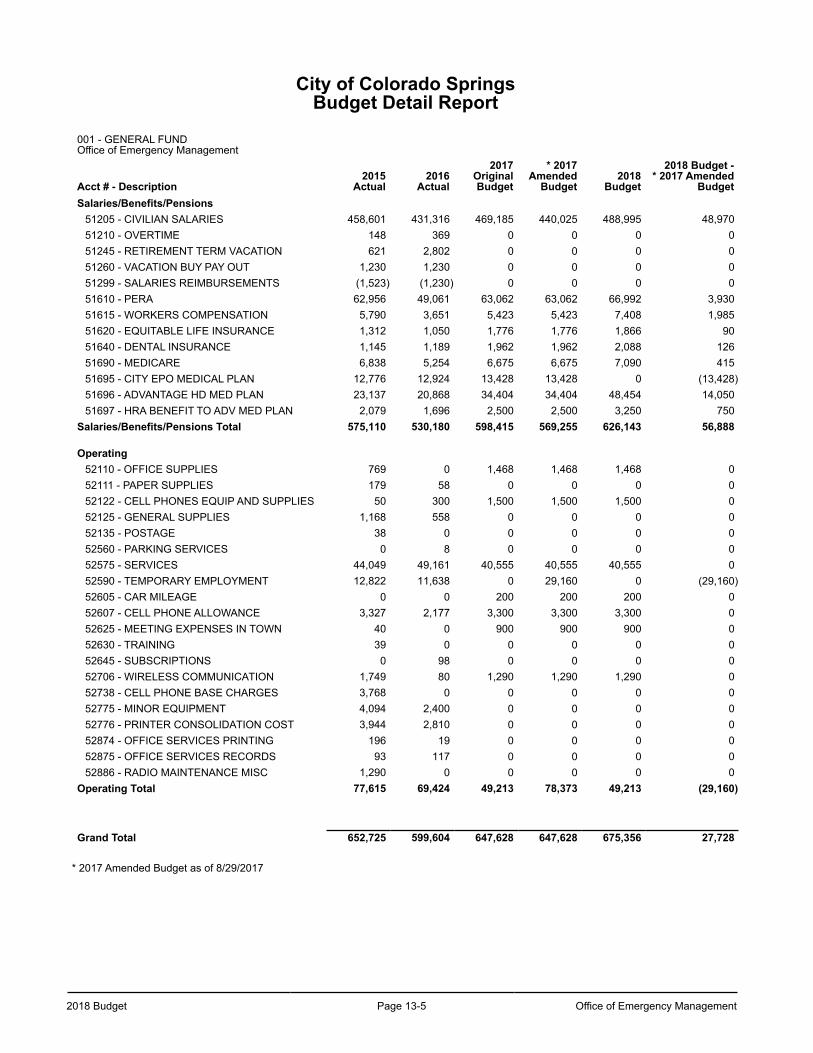
2018 Budget Page 13-5 Office of Emergency Management
City of Colorado SpringsBudget Detail Report
001 - GENERAL FUNDOffice of Emergency Management
Acct # - Description2015
Actual2016
Actual
2017OriginalBudget
* 2017Amended
Budget2018
Budget
2018 Budget -* 2017 Amended
BudgetSalaries/Benefits/Pensions
51205 - CIVILIAN SALARIES 458,601 431,316 469,185 440,025 488,995 48,97051210 - OVERTIME 148 369 0 0 0 051245 - RETIREMENT TERM VACATION 621 2,802 0 0 0 051260 - VACATION BUY PAY OUT 1,230 1,230 0 0 0 051299 - SALARIES REIMBURSEMENTS (1,523) (1,230) 0 0 0 051610 - PERA 62,956 49,061 63,062 63,062 66,992 3,93051615 - WORKERS COMPENSATION 5,790 3,651 5,423 5,423 7,408 1,98551620 - EQUITABLE LIFE INSURANCE 1,312 1,050 1,776 1,776 1,866 9051640 - DENTAL INSURANCE 1,145 1,189 1,962 1,962 2,088 12651690 - MEDICARE 6,838 5,254 6,675 6,675 7,090 41551695 - CITY EPO MEDICAL PLAN 12,776 12,924 13,428 13,428 0 (13,428)51696 - ADVANTAGE HD MED PLAN 23,137 20,868 34,404 34,404 48,454 14,05051697 - HRA BENEFIT TO ADV MED PLAN 2,079 1,696 2,500 2,500 3,250 750
Salaries/Benefits/Pensions Total 575,110 530,180 598,415 569,255 626,143 56,888
Operating52110 - OFFICE SUPPLIES 769 0 1,468 1,468 1,468 052111 - PAPER SUPPLIES 179 58 0 0 0 052122 - CELL PHONES EQUIP AND SUPPLIES 50 300 1,500 1,500 1,500 052125 - GENERAL SUPPLIES 1,168 558 0 0 0 052135 - POSTAGE 38 0 0 0 0 052560 - PARKING SERVICES 0 8 0 0 0 052575 - SERVICES 44,049 49,161 40,555 40,555 40,555 052590 - TEMPORARY EMPLOYMENT 12,822 11,638 0 29,160 0 (29,160)52605 - CAR MILEAGE 0 0 200 200 200 052607 - CELL PHONE ALLOWANCE 3,327 2,177 3,300 3,300 3,300 052625 - MEETING EXPENSES IN TOWN 40 0 900 900 900 052630 - TRAINING 39 0 0 0 0 052645 - SUBSCRIPTIONS 0 98 0 0 0 052706 - WIRELESS COMMUNICATION 1,749 80 1,290 1,290 1,290 052738 - CELL PHONE BASE CHARGES 3,768 0 0 0 0 052775 - MINOR EQUIPMENT 4,094 2,400 0 0 0 052776 - PRINTER CONSOLIDATION COST 3,944 2,810 0 0 0 052874 - OFFICE SERVICES PRINTING 196 19 0 0 0 052875 - OFFICE SERVICES RECORDS 93 117 0 0 0 052886 - RADIO MAINTENANCE MISC 1,290 0 0 0 0 0
Operating Total 77,615 69,424 49,213 78,373 49,213 (29,160)
Grand Total 652,725 599,604 647,628 647,628 675,356 27,728
* 2017 Amended Budget as of 8/29/2017

Office of Emergency Management Page 13-6 2018 Budget
This page left blank intentionally.
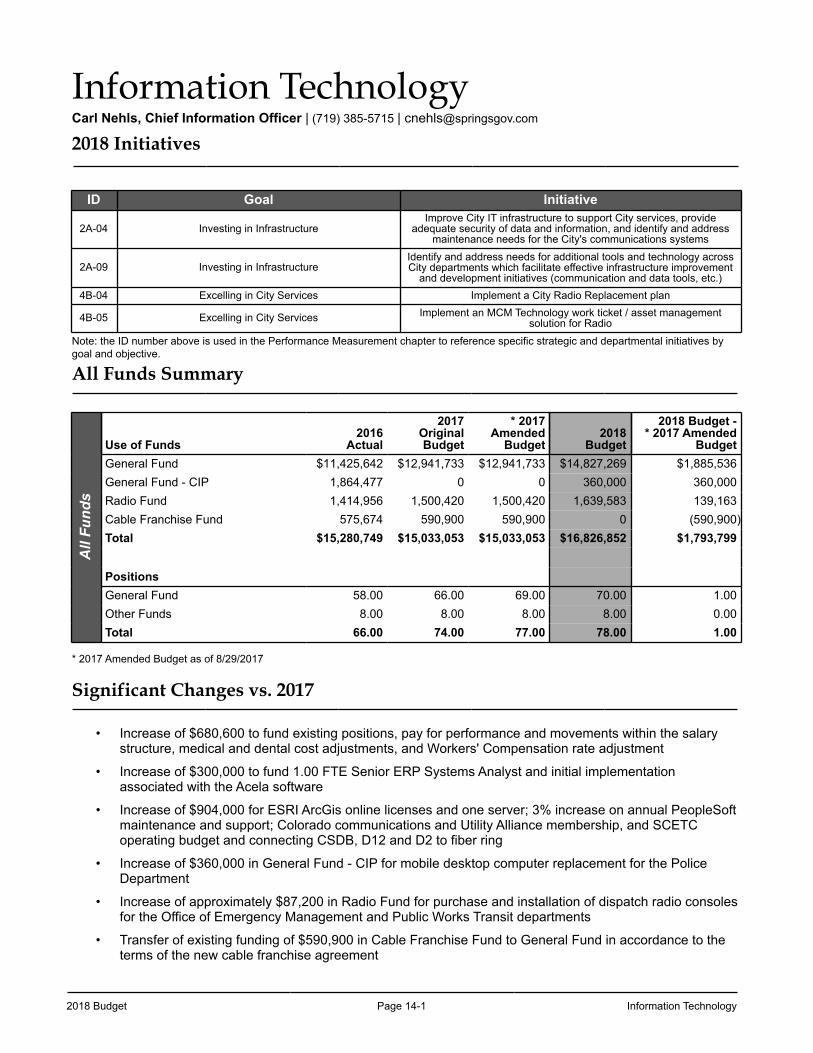
2018 Budget Page 14-1 Information Technology
Information TechnologyCarl Nehls, Chief Information Officer | (719) 385-5715 | [email protected]
2018 Initiatives
ID Goal Initiative
2A-04 Investing in InfrastructureImprove City IT infrastructure to support City services, provide
adequate security of data and information, and identify and address maintenance needs for the City's communications systems
2A-09 Investing in InfrastructureIdentify and address needs for additional tools and technology across City departments which facilitate effective infrastructure improvement
and development initiatives (communication and data tools, etc.)4B-04 Excelling in City Services Implement a City Radio Replacement plan
4B-05 Excelling in City Services Implement an MCM Technology work ticket / asset management solution for Radio
Note: the ID number above is used in the Performance Measurement chapter to reference specific strategic and departmental initiatives by goal and objective.
All Funds Summary
All
Fund
s
Use of Funds2016
Actual
2017OriginalBudget
* 2017Amended
Budget2018
Budget
2018 Budget -* 2017 Amended
BudgetGeneral Fund $11,425,642 $12,941,733 $12,941,733 $14,827,269 $1,885,536General Fund - CIP 1,864,477 0 0 360,000 360,000Radio Fund 1,414,956 1,500,420 1,500,420 1,639,583 139,163Cable Franchise Fund 575,674 590,900 590,900 0 (590,900)Total $15,280,749 $15,033,053 $15,033,053 $16,826,852 $1,793,799
PositionsGeneral Fund 58.00 66.00 69.00 70.00 1.00Other Funds 8.00 8.00 8.00 8.00 0.00Total 66.00 74.00 77.00 78.00 1.00
* 2017 Amended Budget as of 8/29/2017
Significant Changes vs. 2017
• Increase of $680,600 to fund existing positions, pay for performance and movements within the salary structure, medical and dental cost adjustments, and Workers' Compensation rate adjustment
• Increase of $300,000 to fund 1.00 FTE Senior ERP Systems Analyst and initial implementation associated with the Acela software
• Increase of $904,000 for ESRI ArcGis online licenses and one server; 3% increase on annual PeopleSoft maintenance and support; Colorado communications and Utility Alliance membership, and SCETC operating budget and connecting CSDB, D12 and D2 to fiber ring
• Increase of $360,000 in General Fund - CIP for mobile desktop computer replacement for the Police Department
• Increase of approximately $87,200 in Radio Fund for purchase and installation of dispatch radio consoles for the Office of Emergency Management and Public Works Transit departments
• Transfer of existing funding of $590,900 in Cable Franchise Fund to General Fund in accordance to the terms of the new cable franchise agreement
Information Technology Page 14-2 2018 Budget
Information Technology
The mission of City Information Technology (IT) is to provide information, technology, and communication services to the City of Colorado Springs and its citizens so they can accomplish their objectives. We provide a comprehensive portfolio of services across the City, including:
• Enterprise business systems, including enterprise resource planning, customer relationship management, website, intranet, performance management, recruitment, and electronic payments
• Line of business applications, including public safety applications, records management, fire management, computer-aided dispatch, automatic vehicle locating, personnel management, sex offender tracking, license plate readers, electronic ticketing, transit management, work order and asset management systems, permitting, plan review, justice information systems, geospatial information systems, legislative management, campaign finance tracking, and sales tax collection system
• Communication and collaboration systems, including email, calendar, group collaboration, audio and video-conferencing, local and wide-area network, voice-over-internet-protocol telephony, and mobility solutions
• Hosting and infrastructure, including data center, virtualization, storage management, co-location, streaming video, web-content filtering, SPAM filtering, backup and restoration
• Service desk and desktop support
• Public safety radio network, including network design, installation, and maintenance, provisioning and management
City IT will contribute directly to the attainment of the City’s strategic goals through:
• Planning and Alignment – we will increase the business return on technology investments by creating and managing a road map of technology change
• Strategic Sourcing – we will establish and implement a strategic technology sourcing strategy
• Process Rigor – we will ensure a great customer experience by designing, implementing, managing, and continually improving our processes
• Information Security – we will enhance our Information Security Program to protect the organization against escalating risks and maintain its ability to perform its mission
• Transform Data into Information – we will understand and manage our data, transforming it into business critical information and analytics necessary to inform our strategies and operations
• Automate and Orchestrate Business Processes – we will employ targeted technologies designed to automate repetitive processes and ensure efficient, effective, and compliant workflows
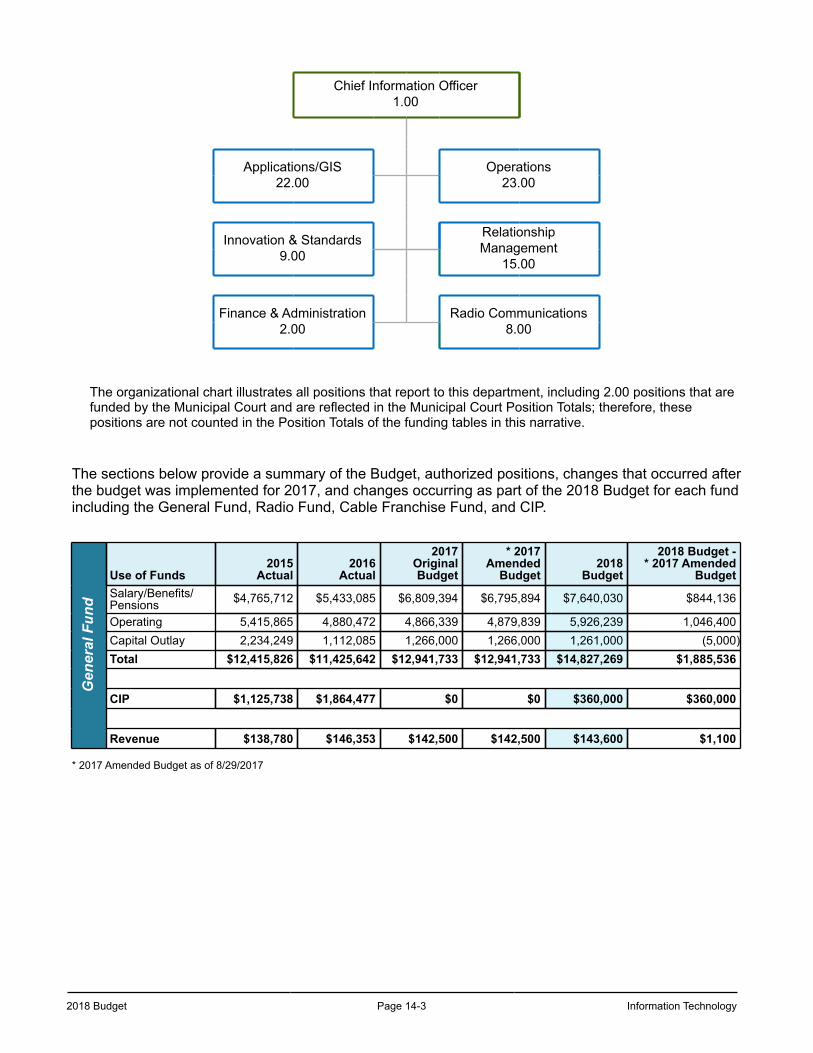
2018 Budget Page 14-3 Information Technology
Chief Information Officer1.00
Applications/GIS22.00
Operations23.00
Innovation & Standards9.00
Relationship Management
15.00
Finance & Administration2.00
Radio Communications8.00
The organizational chart illustrates all positions that report to this department, including 2.00 positions that are funded by the Municipal Court and are reflected in the Municipal Court Position Totals; therefore, these positions are not counted in the Position Totals of the funding tables in this narrative.
The sections below provide a summary of the Budget, authorized positions, changes that occurred after the budget was implemented for 2017, and changes occurring as part of the 2018 Budget for each fund including the General Fund, Radio Fund, Cable Franchise Fund, and CIP.
Gen
eral
Fun
d
Use of Funds2015
Actual2016
Actual
2017OriginalBudget
* 2017Amended
Budget2018
Budget
2018 Budget -* 2017 Amended
BudgetSalary/Benefits/Pensions $4,765,712 $5,433,085 $6,809,394 $6,795,894 $7,640,030 $844,136
Operating 5,415,865 4,880,472 4,866,339 4,879,839 5,926,239 1,046,400Capital Outlay 2,234,249 1,112,085 1,266,000 1,266,000 1,261,000 (5,000)Total $12,415,826 $11,425,642 $12,941,733 $12,941,733 $14,827,269 $1,885,536
CIP $1,125,738 $1,864,477 $0 $0 $360,000 $360,000
Revenue $138,780 $146,353 $142,500 $142,500 $143,600 $1,100
* 2017 Amended Budget as of 8/29/2017
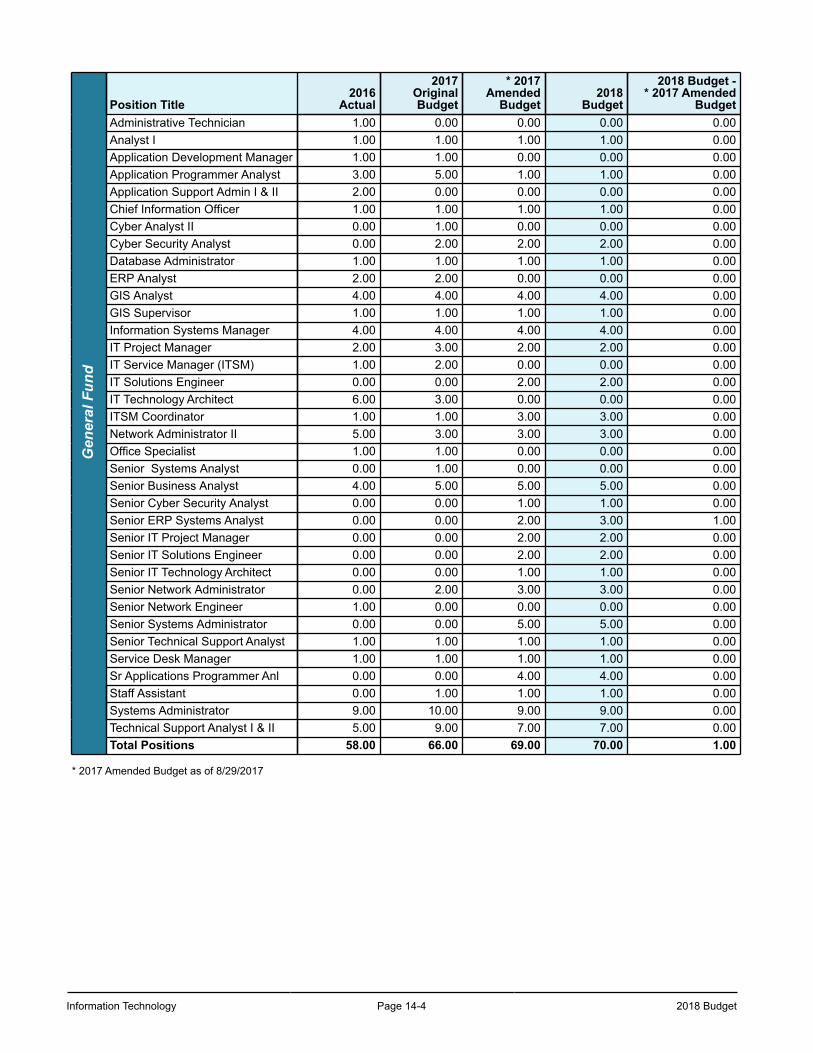
Information Technology Page 14-4 2018 Budget
Gen
eral
Fun
dPosition Title
2016Actual
2017OriginalBudget
* 2017Amended
Budget2018
Budget
2018 Budget -* 2017 Amended
BudgetAdministrative Technician 1.00 0.00 0.00 0.00 0.00Analyst I 1.00 1.00 1.00 1.00 0.00Application Development Manager 1.00 1.00 0.00 0.00 0.00Application Programmer Analyst 3.00 5.00 1.00 1.00 0.00Application Support Admin I & II 2.00 0.00 0.00 0.00 0.00Chief Information Officer 1.00 1.00 1.00 1.00 0.00Cyber Analyst II 0.00 1.00 0.00 0.00 0.00Cyber Security Analyst 0.00 2.00 2.00 2.00 0.00Database Administrator 1.00 1.00 1.00 1.00 0.00ERP Analyst 2.00 2.00 0.00 0.00 0.00GIS Analyst 4.00 4.00 4.00 4.00 0.00GIS Supervisor 1.00 1.00 1.00 1.00 0.00Information Systems Manager 4.00 4.00 4.00 4.00 0.00IT Project Manager 2.00 3.00 2.00 2.00 0.00IT Service Manager (ITSM) 1.00 2.00 0.00 0.00 0.00IT Solutions Engineer 0.00 0.00 2.00 2.00 0.00IT Technology Architect 6.00 3.00 0.00 0.00 0.00ITSM Coordinator 1.00 1.00 3.00 3.00 0.00Network Administrator II 5.00 3.00 3.00 3.00 0.00Office Specialist 1.00 1.00 0.00 0.00 0.00Senior Systems Analyst 0.00 1.00 0.00 0.00 0.00Senior Business Analyst 4.00 5.00 5.00 5.00 0.00Senior Cyber Security Analyst 0.00 0.00 1.00 1.00 0.00Senior ERP Systems Analyst 0.00 0.00 2.00 3.00 1.00Senior IT Project Manager 0.00 0.00 2.00 2.00 0.00Senior IT Solutions Engineer 0.00 0.00 2.00 2.00 0.00Senior IT Technology Architect 0.00 0.00 1.00 1.00 0.00Senior Network Administrator 0.00 2.00 3.00 3.00 0.00Senior Network Engineer 1.00 0.00 0.00 0.00 0.00Senior Systems Administrator 0.00 0.00 5.00 5.00 0.00Senior Technical Support Analyst 1.00 1.00 1.00 1.00 0.00Service Desk Manager 1.00 1.00 1.00 1.00 0.00Sr Applications Programmer Anl 0.00 0.00 4.00 4.00 0.00Staff Assistant 0.00 1.00 1.00 1.00 0.00Systems Administrator 9.00 10.00 9.00 9.00 0.00Technical Support Analyst I & II 5.00 9.00 7.00 7.00 0.00Total Positions 58.00 66.00 69.00 70.00 1.00
* 2017 Amended Budget as of 8/29/2017
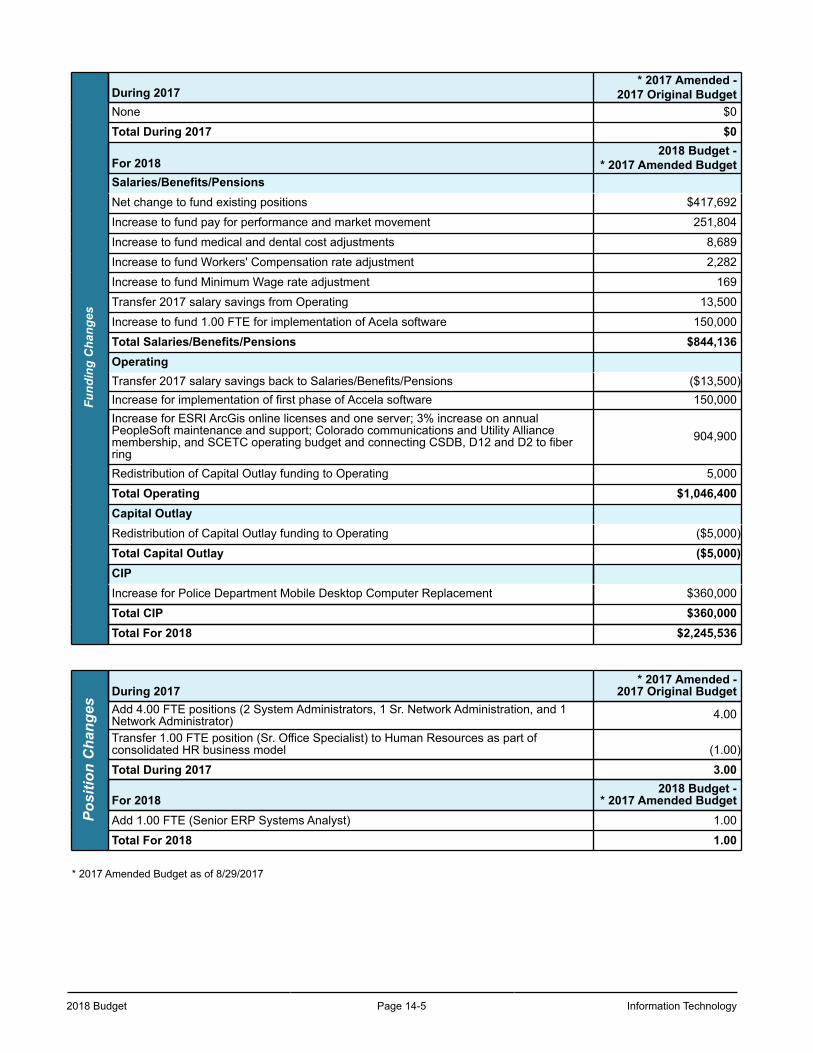
2018 Budget Page 14-5 Information Technology
Fund
ing
Cha
nges
During 2017* 2017 Amended -
2017 Original BudgetNone $0
Total During 2017 $0
For 20182018 Budget -
* 2017 Amended BudgetSalaries/Benefits/PensionsNet change to fund existing positions $417,692
Increase to fund pay for performance and market movement 251,804
Increase to fund medical and dental cost adjustments 8,689
Increase to fund Workers' Compensation rate adjustment 2,282
Increase to fund Minimum Wage rate adjustment 169
Transfer 2017 salary savings from Operating 13,500
Increase to fund 1.00 FTE for implementation of Acela software 150,000
Total Salaries/Benefits/Pensions $844,136OperatingTransfer 2017 salary savings back to Salaries/Benefits/Pensions ($13,500)Increase for implementation of first phase of Accela software 150,000Increase for ESRI ArcGis online licenses and one server; 3% increase on annualPeopleSoft maintenance and support; Colorado communications and Utility Alliancemembership, and SCETC operating budget and connecting CSDB, D12 and D2 to fiberring
904,900
Redistribution of Capital Outlay funding to Operating 5,000
Total Operating $1,046,400Capital OutlayRedistribution of Capital Outlay funding to Operating ($5,000)
Total Capital Outlay ($5,000)CIPIncrease for Police Department Mobile Desktop Computer Replacement $360,000
Total CIP $360,000Total For 2018 $2,245,536
Posi
tion
Cha
nges
During 2017* 2017 Amended -
2017 Original BudgetAdd 4.00 FTE positions (2 System Administrators, 1 Sr. Network Administration, and 1Network Administrator) 4.00
Transfer 1.00 FTE position (Sr. Office Specialist) to Human Resources as part ofconsolidated HR business model (1.00)
Total During 2017 3.00
For 20182018 Budget -
* 2017 Amended BudgetAdd 1.00 FTE (Senior ERP Systems Analyst) 1.00
Total For 2018 1.00
* 2017 Amended Budget as of 8/29/2017
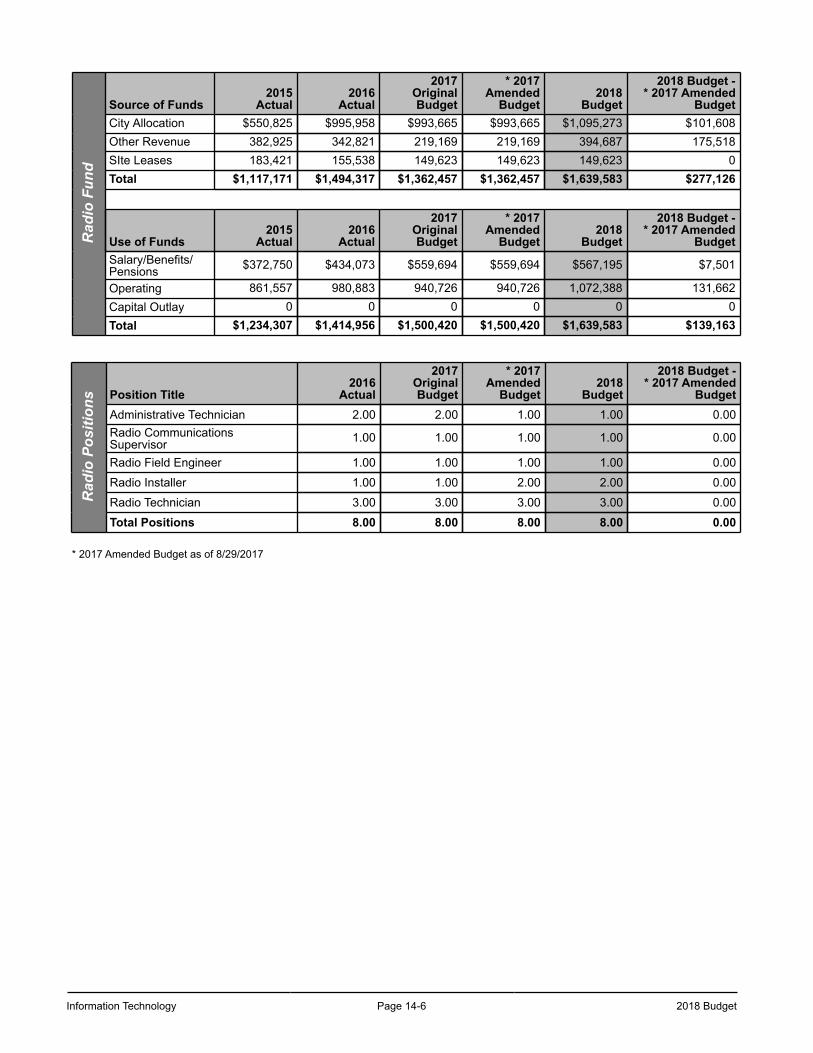
Information Technology Page 14-6 2018 Budget
Rad
io F
und
Source of Funds2015
Actual2016
Actual
2017OriginalBudget
* 2017Amended
Budget2018
Budget
2018 Budget -* 2017 Amended
BudgetCity Allocation $550,825 $995,958 $993,665 $993,665 $1,095,273 $101,608Other Revenue 382,925 342,821 219,169 219,169 394,687 175,518SIte Leases 183,421 155,538 149,623 149,623 149,623 0Total $1,117,171 $1,494,317 $1,362,457 $1,362,457 $1,639,583 $277,126
Use of Funds2015
Actual2016
Actual
2017OriginalBudget
* 2017Amended
Budget2018
Budget
2018 Budget -* 2017 Amended
BudgetSalary/Benefits/Pensions $372,750 $434,073 $559,694 $559,694 $567,195 $7,501
Operating 861,557 980,883 940,726 940,726 1,072,388 131,662Capital Outlay 0 0 0 0 0 0Total $1,234,307 $1,414,956 $1,500,420 $1,500,420 $1,639,583 $139,163
Rad
io P
ositi
ons Position Title
2016Actual
2017OriginalBudget
* 2017Amended
Budget2018
Budget
2018 Budget -* 2017 Amended
BudgetAdministrative Technician 2.00 2.00 1.00 1.00 0.00Radio CommunicationsSupervisor 1.00 1.00 1.00 1.00 0.00
Radio Field Engineer 1.00 1.00 1.00 1.00 0.00
Radio Installer 1.00 1.00 2.00 2.00 0.00
Radio Technician 3.00 3.00 3.00 3.00 0.00
Total Positions 8.00 8.00 8.00 8.00 0.00
* 2017 Amended Budget as of 8/29/2017
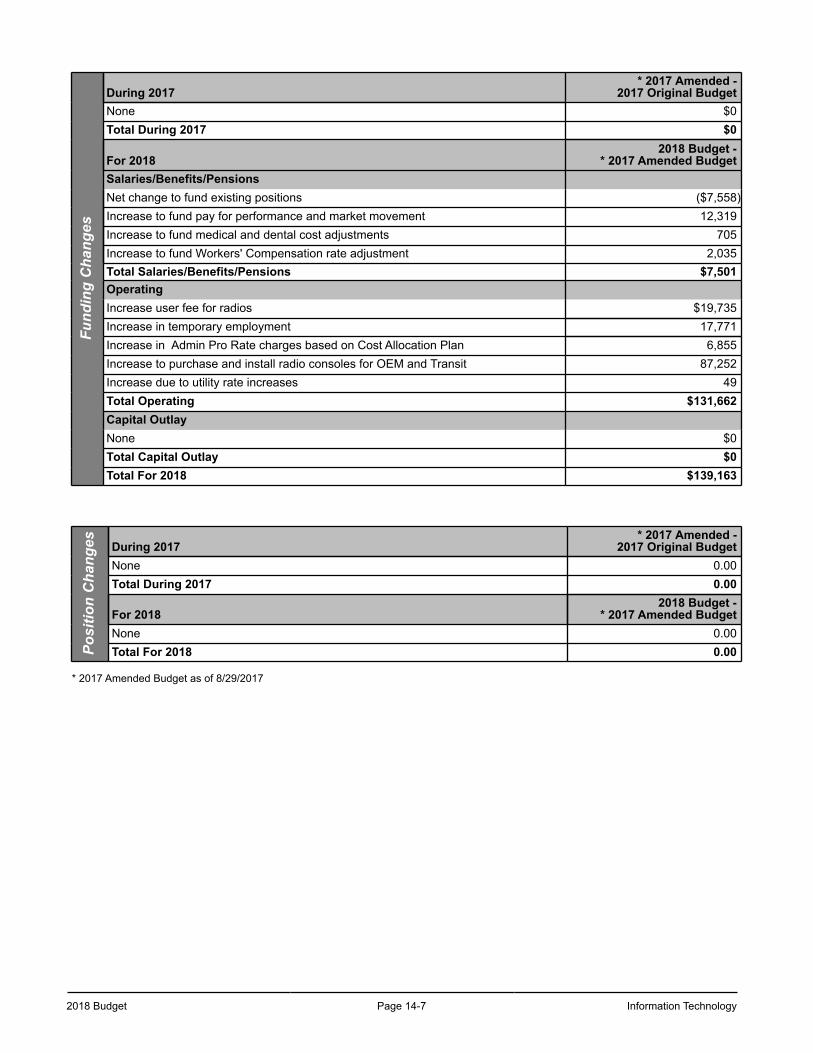
2018 Budget Page 14-7 Information Technology
Fund
ing
Cha
nges
During 2017* 2017 Amended -
2017 Original BudgetNone $0Total During 2017 $0
For 20182018 Budget -
* 2017 Amended BudgetSalaries/Benefits/PensionsNet change to fund existing positions ($7,558)Increase to fund pay for performance and market movement 12,319Increase to fund medical and dental cost adjustments 705Increase to fund Workers' Compensation rate adjustment 2,035Total Salaries/Benefits/Pensions $7,501OperatingIncrease user fee for radios $19,735Increase in temporary employment 17,771Increase in Admin Pro Rate charges based on Cost Allocation Plan 6,855Increase to purchase and install radio consoles for OEM and Transit 87,252Increase due to utility rate increases 49Total Operating $131,662Capital OutlayNone $0Total Capital Outlay $0Total For 2018 $139,163
Posi
tion
Cha
nges During 2017
* 2017 Amended -2017 Original Budget
None 0.00Total During 2017 0.00
For 20182018 Budget -
* 2017 Amended BudgetNone 0.00Total For 2018 0.00
* 2017 Amended Budget as of 8/29/2017
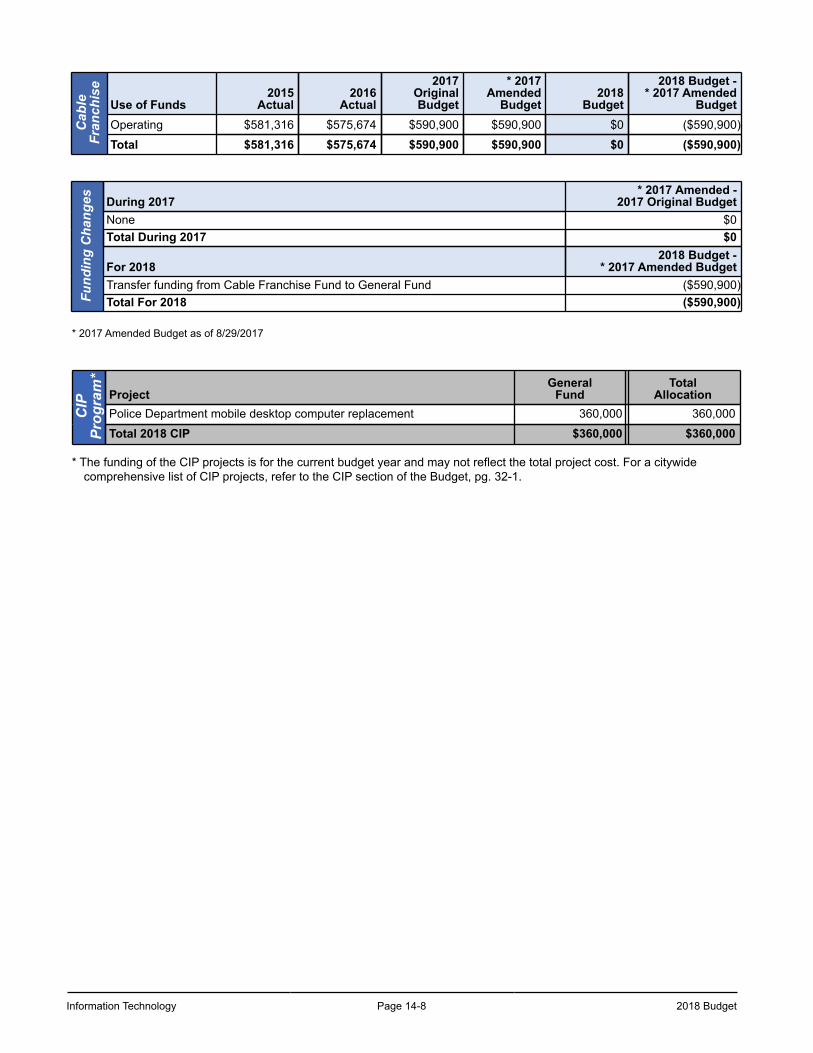
Information Technology Page 14-8 2018 Budget
Cab
leFr
anch
ise
Use of Funds2015
Actual2016
Actual
2017OriginalBudget
* 2017Amended
Budget2018
Budget
2018 Budget -* 2017 Amended
BudgetOperating $581,316 $575,674 $590,900 $590,900 $0 ($590,900)
Total $581,316 $575,674 $590,900 $590,900 $0 ($590,900)
Fund
ing
Cha
nges During 2017
* 2017 Amended -2017 Original Budget
None $0Total During 2017 $0
For 20182018 Budget -
* 2017 Amended BudgetTransfer funding from Cable Franchise Fund to General Fund ($590,900)Total For 2018 ($590,900)
* 2017 Amended Budget as of 8/29/2017
CIP
Prog
ram
*
ProjectGeneral
FundTotal
AllocationPolice Department mobile desktop computer replacement 360,000 360,000
Total 2018 CIP $360,000 $360,000
* The funding of the CIP projects is for the current budget year and may not reflect the total project cost. For a citywide comprehensive list of CIP projects, refer to the CIP section of the Budget, pg. 32-1.
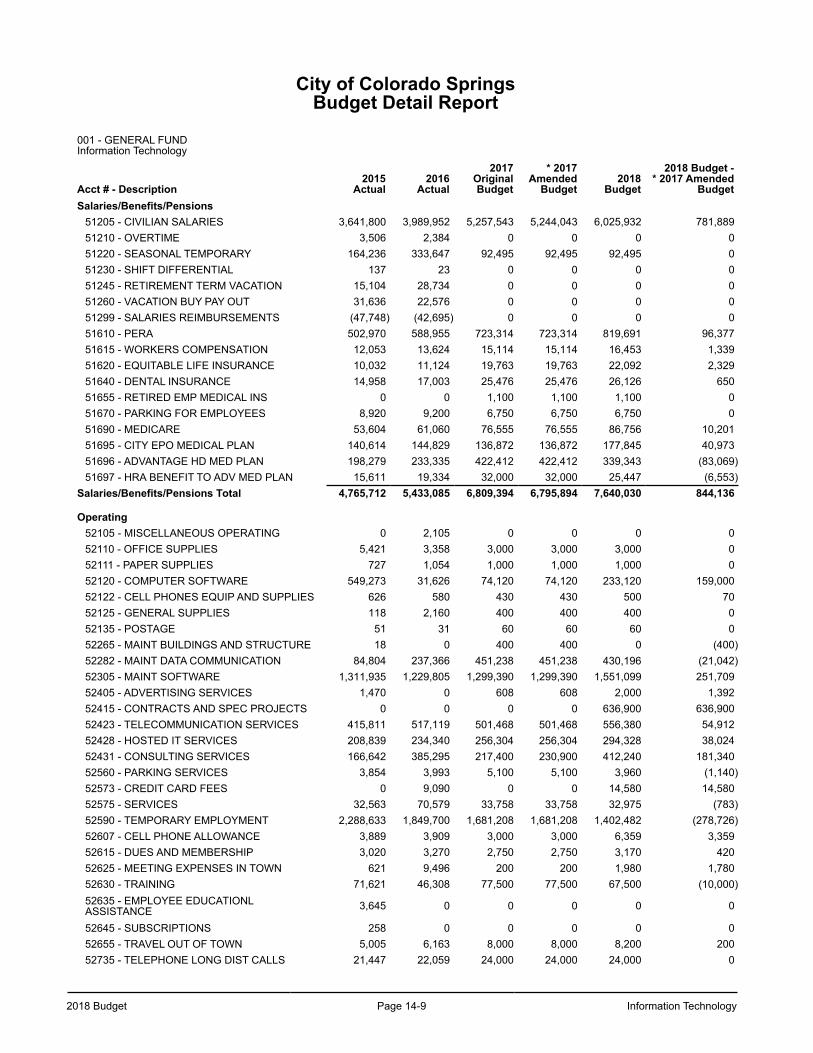
2018 Budget Page 14-9 Information Technology
City of Colorado SpringsBudget Detail Report
001 - GENERAL FUNDInformation Technology
Acct # - Description2015
Actual2016
Actual
2017OriginalBudget
* 2017Amended
Budget2018
Budget
2018 Budget -* 2017 Amended
BudgetSalaries/Benefits/Pensions
51205 - CIVILIAN SALARIES 3,641,800 3,989,952 5,257,543 5,244,043 6,025,932 781,88951210 - OVERTIME 3,506 2,384 0 0 0 051220 - SEASONAL TEMPORARY 164,236 333,647 92,495 92,495 92,495 051230 - SHIFT DIFFERENTIAL 137 23 0 0 0 051245 - RETIREMENT TERM VACATION 15,104 28,734 0 0 0 051260 - VACATION BUY PAY OUT 31,636 22,576 0 0 0 051299 - SALARIES REIMBURSEMENTS (47,748) (42,695) 0 0 0 051610 - PERA 502,970 588,955 723,314 723,314 819,691 96,37751615 - WORKERS COMPENSATION 12,053 13,624 15,114 15,114 16,453 1,33951620 - EQUITABLE LIFE INSURANCE 10,032 11,124 19,763 19,763 22,092 2,32951640 - DENTAL INSURANCE 14,958 17,003 25,476 25,476 26,126 65051655 - RETIRED EMP MEDICAL INS 0 0 1,100 1,100 1,100 051670 - PARKING FOR EMPLOYEES 8,920 9,200 6,750 6,750 6,750 051690 - MEDICARE 53,604 61,060 76,555 76,555 86,756 10,20151695 - CITY EPO MEDICAL PLAN 140,614 144,829 136,872 136,872 177,845 40,97351696 - ADVANTAGE HD MED PLAN 198,279 233,335 422,412 422,412 339,343 (83,069)51697 - HRA BENEFIT TO ADV MED PLAN 15,611 19,334 32,000 32,000 25,447 (6,553)
Salaries/Benefits/Pensions Total 4,765,712 5,433,085 6,809,394 6,795,894 7,640,030 844,136
Operating52105 - MISCELLANEOUS OPERATING 0 2,105 0 0 0 052110 - OFFICE SUPPLIES 5,421 3,358 3,000 3,000 3,000 052111 - PAPER SUPPLIES 727 1,054 1,000 1,000 1,000 052120 - COMPUTER SOFTWARE 549,273 31,626 74,120 74,120 233,120 159,00052122 - CELL PHONES EQUIP AND SUPPLIES 626 580 430 430 500 7052125 - GENERAL SUPPLIES 118 2,160 400 400 400 052135 - POSTAGE 51 31 60 60 60 052265 - MAINT BUILDINGS AND STRUCTURE 18 0 400 400 0 (400)52282 - MAINT DATA COMMUNICATION 84,804 237,366 451,238 451,238 430,196 (21,042)52305 - MAINT SOFTWARE 1,311,935 1,229,805 1,299,390 1,299,390 1,551,099 251,70952405 - ADVERTISING SERVICES 1,470 0 608 608 2,000 1,39252415 - CONTRACTS AND SPEC PROJECTS 0 0 0 0 636,900 636,90052423 - TELECOMMUNICATION SERVICES 415,811 517,119 501,468 501,468 556,380 54,91252428 - HOSTED IT SERVICES 208,839 234,340 256,304 256,304 294,328 38,02452431 - CONSULTING SERVICES 166,642 385,295 217,400 230,900 412,240 181,34052560 - PARKING SERVICES 3,854 3,993 5,100 5,100 3,960 (1,140)52573 - CREDIT CARD FEES 0 9,090 0 0 14,580 14,58052575 - SERVICES 32,563 70,579 33,758 33,758 32,975 (783)52590 - TEMPORARY EMPLOYMENT 2,288,633 1,849,700 1,681,208 1,681,208 1,402,482 (278,726)52607 - CELL PHONE ALLOWANCE 3,889 3,909 3,000 3,000 6,359 3,35952615 - DUES AND MEMBERSHIP 3,020 3,270 2,750 2,750 3,170 42052625 - MEETING EXPENSES IN TOWN 621 9,496 200 200 1,980 1,78052630 - TRAINING 71,621 46,308 77,500 77,500 67,500 (10,000)52635 - EMPLOYEE EDUCATIONLASSISTANCE 3,645 0 0 0 0 0
52645 - SUBSCRIPTIONS 258 0 0 0 0 052655 - TRAVEL OUT OF TOWN 5,005 6,163 8,000 8,000 8,200 20052735 - TELEPHONE LONG DIST CALLS 21,447 22,059 24,000 24,000 24,000 0
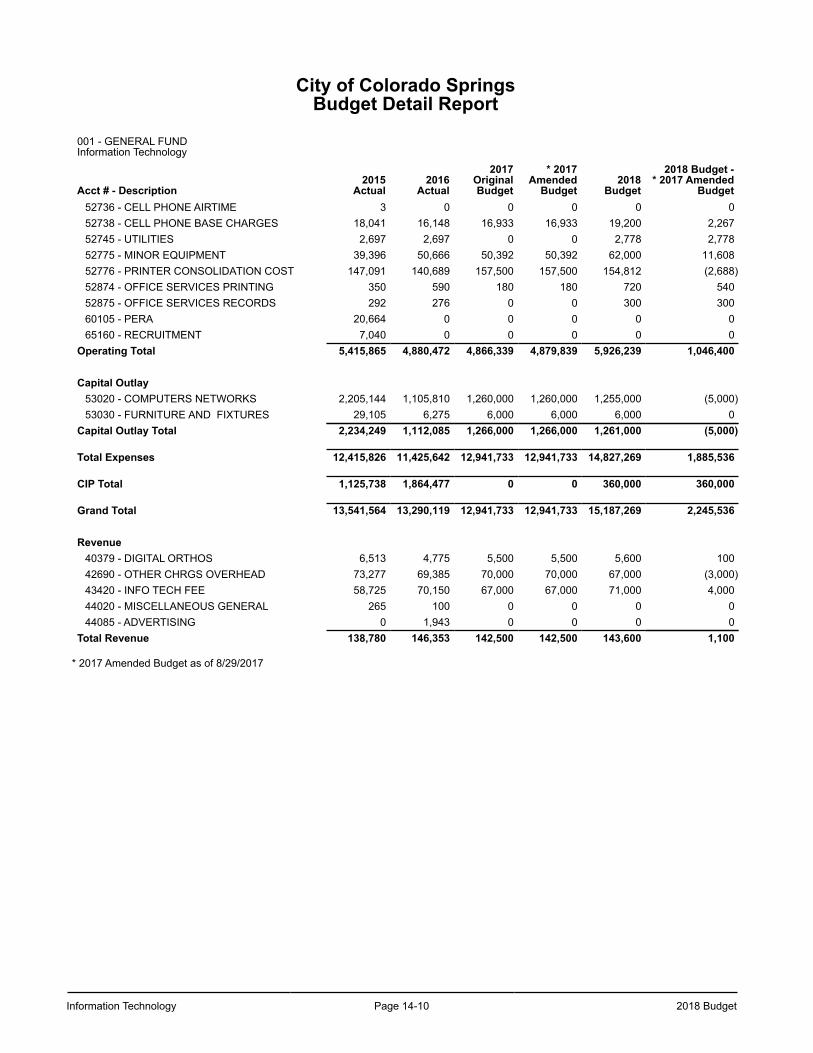
Information Technology Page 14-10 2018 Budget
City of Colorado SpringsBudget Detail Report
001 - GENERAL FUNDInformation Technology
Acct # - Description2015
Actual2016
Actual
2017OriginalBudget
* 2017Amended
Budget2018
Budget
2018 Budget -* 2017 Amended
Budget52736 - CELL PHONE AIRTIME 3 0 0 0 0 052738 - CELL PHONE BASE CHARGES 18,041 16,148 16,933 16,933 19,200 2,26752745 - UTILITIES 2,697 2,697 0 0 2,778 2,77852775 - MINOR EQUIPMENT 39,396 50,666 50,392 50,392 62,000 11,60852776 - PRINTER CONSOLIDATION COST 147,091 140,689 157,500 157,500 154,812 (2,688)52874 - OFFICE SERVICES PRINTING 350 590 180 180 720 54052875 - OFFICE SERVICES RECORDS 292 276 0 0 300 30060105 - PERA 20,664 0 0 0 0 065160 - RECRUITMENT 7,040 0 0 0 0 0
Operating Total 5,415,865 4,880,472 4,866,339 4,879,839 5,926,239 1,046,400
Capital Outlay53020 - COMPUTERS NETWORKS 2,205,144 1,105,810 1,260,000 1,260,000 1,255,000 (5,000)53030 - FURNITURE AND FIXTURES 29,105 6,275 6,000 6,000 6,000 0
Capital Outlay Total 2,234,249 1,112,085 1,266,000 1,266,000 1,261,000 (5,000)
Total Expenses 12,415,826 11,425,642 12,941,733 12,941,733 14,827,269 1,885,536
CIP Total 1,125,738 1,864,477 0 0 360,000 360,000
Grand Total 13,541,564 13,290,119 12,941,733 12,941,733 15,187,269 2,245,536
Revenue40379 - DIGITAL ORTHOS 6,513 4,775 5,500 5,500 5,600 10042690 - OTHER CHRGS OVERHEAD 73,277 69,385 70,000 70,000 67,000 (3,000)43420 - INFO TECH FEE 58,725 70,150 67,000 67,000 71,000 4,00044020 - MISCELLANEOUS GENERAL 265 100 0 0 0 044085 - ADVERTISING 0 1,943 0 0 0 0
Total Revenue 138,780 146,353 142,500 142,500 143,600 1,100
* 2017 Amended Budget as of 8/29/2017
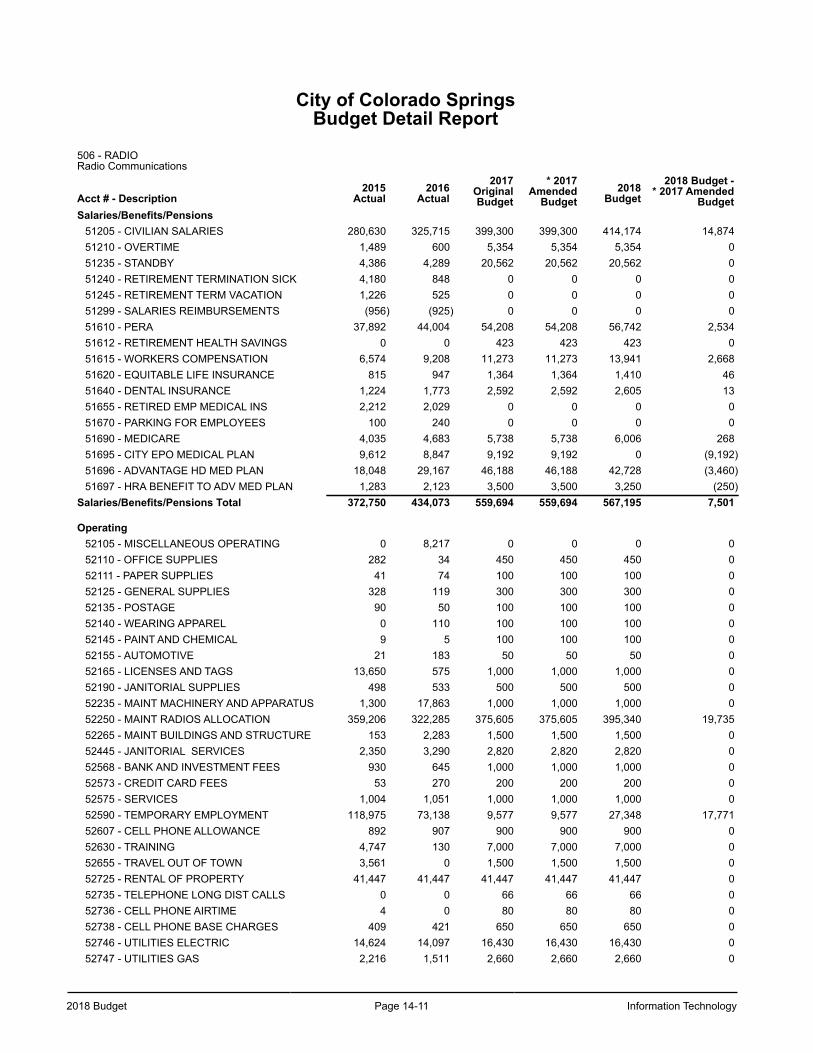
2018 Budget Page 14-11 Information Technology
City of Colorado SpringsBudget Detail Report
506 - RADIORadio Communications
Acct # - Description2015
Actual2016
Actual2017
OriginalBudget
* 2017Amended
Budget2018
Budget2018 Budget -
* 2017 AmendedBudget
Salaries/Benefits/Pensions51205 - CIVILIAN SALARIES 280,630 325,715 399,300 399,300 414,174 14,87451210 - OVERTIME 1,489 600 5,354 5,354 5,354 051235 - STANDBY 4,386 4,289 20,562 20,562 20,562 051240 - RETIREMENT TERMINATION SICK 4,180 848 0 0 0 051245 - RETIREMENT TERM VACATION 1,226 525 0 0 0 051299 - SALARIES REIMBURSEMENTS (956) (925) 0 0 0 051610 - PERA 37,892 44,004 54,208 54,208 56,742 2,53451612 - RETIREMENT HEALTH SAVINGS 0 0 423 423 423 051615 - WORKERS COMPENSATION 6,574 9,208 11,273 11,273 13,941 2,66851620 - EQUITABLE LIFE INSURANCE 815 947 1,364 1,364 1,410 4651640 - DENTAL INSURANCE 1,224 1,773 2,592 2,592 2,605 1351655 - RETIRED EMP MEDICAL INS 2,212 2,029 0 0 0 051670 - PARKING FOR EMPLOYEES 100 240 0 0 0 051690 - MEDICARE 4,035 4,683 5,738 5,738 6,006 26851695 - CITY EPO MEDICAL PLAN 9,612 8,847 9,192 9,192 0 (9,192)51696 - ADVANTAGE HD MED PLAN 18,048 29,167 46,188 46,188 42,728 (3,460)51697 - HRA BENEFIT TO ADV MED PLAN 1,283 2,123 3,500 3,500 3,250 (250)
Salaries/Benefits/Pensions Total 372,750 434,073 559,694 559,694 567,195 7,501
Operating52105 - MISCELLANEOUS OPERATING 0 8,217 0 0 0 052110 - OFFICE SUPPLIES 282 34 450 450 450 052111 - PAPER SUPPLIES 41 74 100 100 100 052125 - GENERAL SUPPLIES 328 119 300 300 300 052135 - POSTAGE 90 50 100 100 100 052140 - WEARING APPAREL 0 110 100 100 100 052145 - PAINT AND CHEMICAL 9 5 100 100 100 052155 - AUTOMOTIVE 21 183 50 50 50 052165 - LICENSES AND TAGS 13,650 575 1,000 1,000 1,000 052190 - JANITORIAL SUPPLIES 498 533 500 500 500 052235 - MAINT MACHINERY AND APPARATUS 1,300 17,863 1,000 1,000 1,000 052250 - MAINT RADIOS ALLOCATION 359,206 322,285 375,605 375,605 395,340 19,73552265 - MAINT BUILDINGS AND STRUCTURE 153 2,283 1,500 1,500 1,500 052445 - JANITORIAL SERVICES 2,350 3,290 2,820 2,820 2,820 052568 - BANK AND INVESTMENT FEES 930 645 1,000 1,000 1,000 052573 - CREDIT CARD FEES 53 270 200 200 200 052575 - SERVICES 1,004 1,051 1,000 1,000 1,000 052590 - TEMPORARY EMPLOYMENT 118,975 73,138 9,577 9,577 27,348 17,77152607 - CELL PHONE ALLOWANCE 892 907 900 900 900 052630 - TRAINING 4,747 130 7,000 7,000 7,000 052655 - TRAVEL OUT OF TOWN 3,561 0 1,500 1,500 1,500 052725 - RENTAL OF PROPERTY 41,447 41,447 41,447 41,447 41,447 052735 - TELEPHONE LONG DIST CALLS 0 0 66 66 66 052736 - CELL PHONE AIRTIME 4 0 80 80 80 052738 - CELL PHONE BASE CHARGES 409 421 650 650 650 052746 - UTILITIES ELECTRIC 14,624 14,097 16,430 16,430 16,430 052747 - UTILITIES GAS 2,216 1,511 2,660 2,660 2,660 0
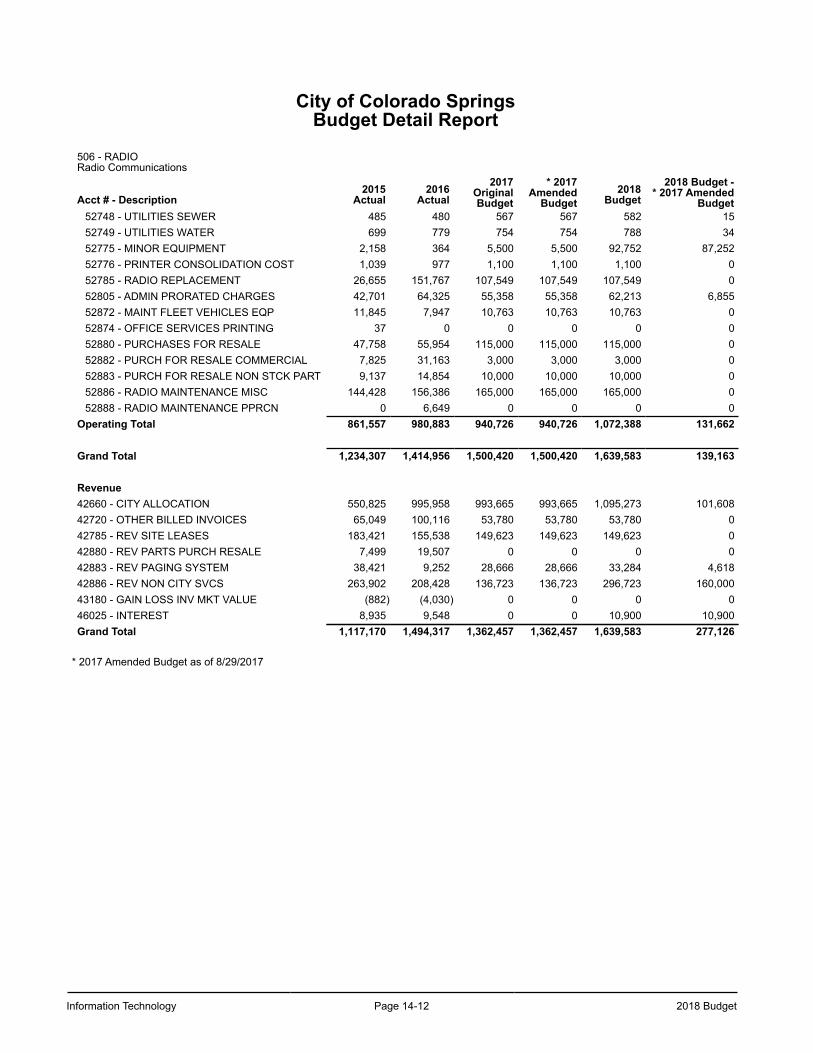
Information Technology Page 14-12 2018 Budget
City of Colorado SpringsBudget Detail Report
506 - RADIORadio Communications
Acct # - Description2015
Actual2016
Actual2017
OriginalBudget
* 2017Amended
Budget2018
Budget2018 Budget -
* 2017 AmendedBudget
52748 - UTILITIES SEWER 485 480 567 567 582 1552749 - UTILITIES WATER 699 779 754 754 788 3452775 - MINOR EQUIPMENT 2,158 364 5,500 5,500 92,752 87,25252776 - PRINTER CONSOLIDATION COST 1,039 977 1,100 1,100 1,100 052785 - RADIO REPLACEMENT 26,655 151,767 107,549 107,549 107,549 052805 - ADMIN PRORATED CHARGES 42,701 64,325 55,358 55,358 62,213 6,85552872 - MAINT FLEET VEHICLES EQP 11,845 7,947 10,763 10,763 10,763 052874 - OFFICE SERVICES PRINTING 37 0 0 0 0 052880 - PURCHASES FOR RESALE 47,758 55,954 115,000 115,000 115,000 052882 - PURCH FOR RESALE COMMERCIAL 7,825 31,163 3,000 3,000 3,000 052883 - PURCH FOR RESALE NON STCK PART 9,137 14,854 10,000 10,000 10,000 052886 - RADIO MAINTENANCE MISC 144,428 156,386 165,000 165,000 165,000 052888 - RADIO MAINTENANCE PPRCN 0 6,649 0 0 0 0
Operating Total 861,557 980,883 940,726 940,726 1,072,388 131,662
Grand Total 1,234,307 1,414,956 1,500,420 1,500,420 1,639,583 139,163
Revenue42660 - CITY ALLOCATION 550,825 995,958 993,665 993,665 1,095,273 101,60842720 - OTHER BILLED INVOICES 65,049 100,116 53,780 53,780 53,780 042785 - REV SITE LEASES 183,421 155,538 149,623 149,623 149,623 042880 - REV PARTS PURCH RESALE 7,499 19,507 0 0 0 042883 - REV PAGING SYSTEM 38,421 9,252 28,666 28,666 33,284 4,61842886 - REV NON CITY SVCS 263,902 208,428 136,723 136,723 296,723 160,00043180 - GAIN LOSS INV MKT VALUE (882) (4,030) 0 0 0 046025 - INTEREST 8,935 9,548 0 0 10,900 10,900Grand Total 1,117,170 1,494,317 1,362,457 1,362,457 1,639,583 277,126
* 2017 Amended Budget as of 8/29/2017
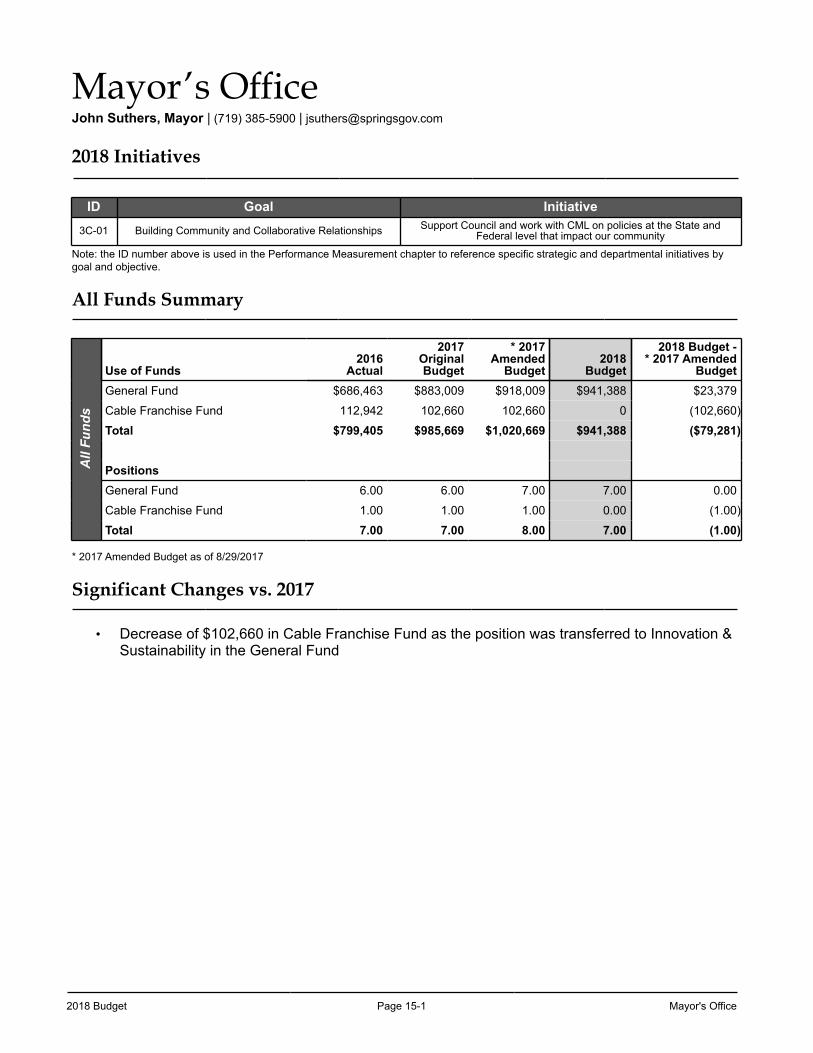
2018 Budget Page 15-1 Mayor's Office
Mayor’s OfficeJohn Suthers, Mayor | (719) 385-5900 | [email protected]
2018 Initiatives
ID Goal Initiative
3C-01 Building Community and Collaborative Relationships Support Council and work with CML on policies at the State and Federal level that impact our community
Note: the ID number above is used in the Performance Measurement chapter to reference specific strategic and departmental initiatives by goal and objective.
All Funds Summary
All
Fund
s
Use of Funds2016
Actual
2017OriginalBudget
* 2017Amended
Budget2018
Budget
2018 Budget -* 2017 Amended
BudgetGeneral Fund $686,463 $883,009 $918,009 $941,388 $23,379
Cable Franchise Fund 112,942 102,660 102,660 0 (102,660)
Total $799,405 $985,669 $1,020,669 $941,388 ($79,281)
PositionsGeneral Fund 6.00 6.00 7.00 7.00 0.00
Cable Franchise Fund 1.00 1.00 1.00 0.00 (1.00)
Total 7.00 7.00 8.00 7.00 (1.00)
* 2017 Amended Budget as of 8/29/2017
Significant Changes vs. 2017
• Decrease of $102,660 in Cable Franchise Fund as the position was transferred to Innovation & Sustainability in the General Fund
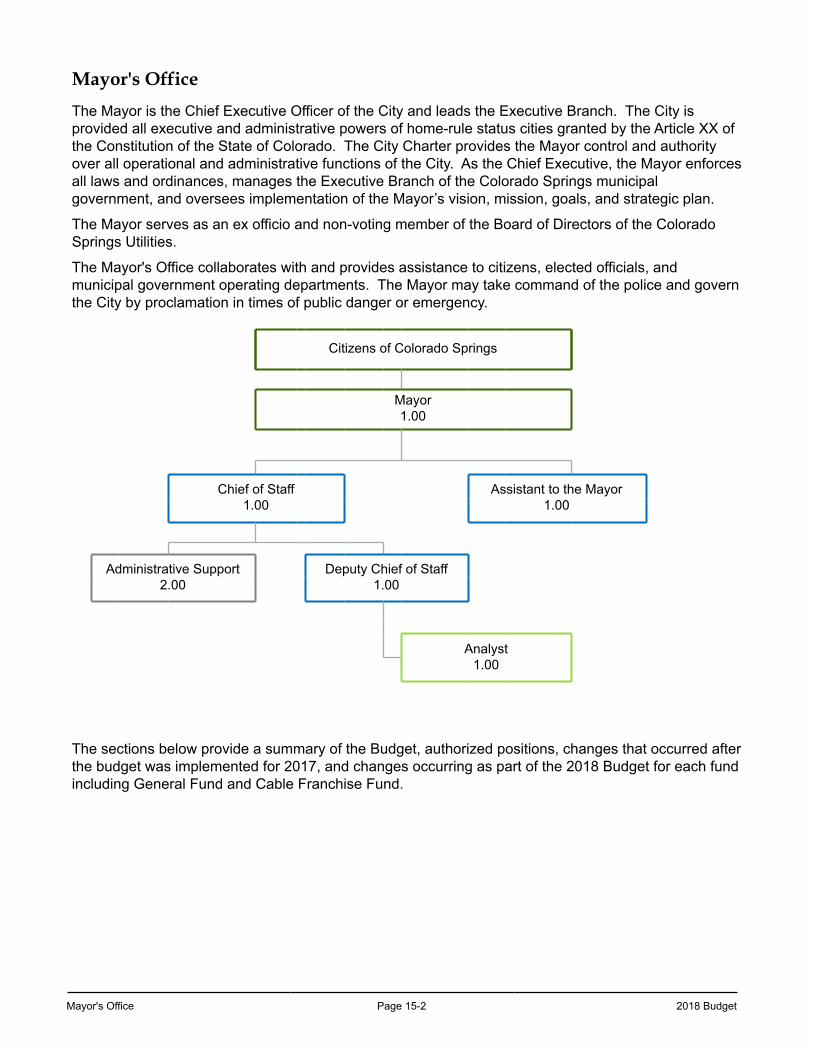
Mayor's Office Page 15-2 2018 Budget
Mayor's Office
The Mayor is the Chief Executive Officer of the City and leads the Executive Branch. The City is provided all executive and administrative powers of home-rule status cities granted by the Article XX of the Constitution of the State of Colorado. The City Charter provides the Mayor control and authority over all operational and administrative functions of the City. As the Chief Executive, the Mayor enforces all laws and ordinances, manages the Executive Branch of the Colorado Springs municipal government, and oversees implementation of the Mayor’s vision, mission, goals, and strategic plan.
The Mayor serves as an ex officio and non-voting member of the Board of Directors of the Colorado Springs Utilities.
The Mayor's Office collaborates with and provides assistance to citizens, elected officials, and municipal government operating departments. The Mayor may take command of the police and govern the City by proclamation in times of public danger or emergency.
Citizens of Colorado Springs
Mayor1.00
Chief of Staff1.00
Assistant to the Mayor1.00
Administrative Support2.00
Deputy Chief of Staff1.00
Analyst1.00
The sections below provide a summary of the Budget, authorized positions, changes that occurred after the budget was implemented for 2017, and changes occurring as part of the 2018 Budget for each fund including General Fund and Cable Franchise Fund.
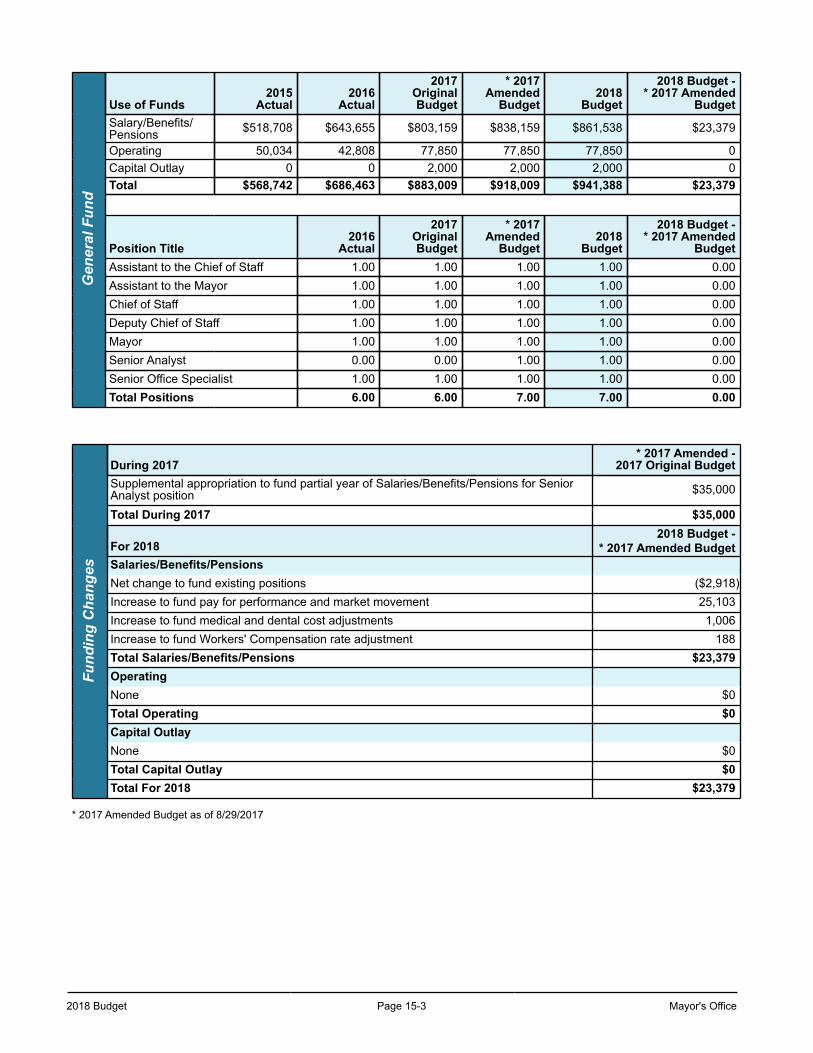
2018 Budget Page 15-3 Mayor's Office
Gen
eral
Fun
dUse of Funds
2015Actual
2016Actual
2017OriginalBudget
* 2017Amended
Budget2018
Budget
2018 Budget -* 2017 Amended
BudgetSalary/Benefits/Pensions $518,708 $643,655 $803,159 $838,159 $861,538 $23,379
Operating 50,034 42,808 77,850 77,850 77,850 0Capital Outlay 0 0 2,000 2,000 2,000 0Total $568,742 $686,463 $883,009 $918,009 $941,388 $23,379
Position Title2016
Actual
2017OriginalBudget
* 2017Amended
Budget2018
Budget
2018 Budget -* 2017 Amended
BudgetAssistant to the Chief of Staff 1.00 1.00 1.00 1.00 0.00Assistant to the Mayor 1.00 1.00 1.00 1.00 0.00Chief of Staff 1.00 1.00 1.00 1.00 0.00Deputy Chief of Staff 1.00 1.00 1.00 1.00 0.00Mayor 1.00 1.00 1.00 1.00 0.00Senior Analyst 0.00 0.00 1.00 1.00 0.00Senior Office Specialist 1.00 1.00 1.00 1.00 0.00Total Positions 6.00 6.00 7.00 7.00 0.00
Fund
ing
Cha
nges
During 2017* 2017 Amended -
2017 Original BudgetSupplemental appropriation to fund partial year of Salaries/Benefits/Pensions for SeniorAnalyst position $35,000
Total During 2017 $35,000
For 20182018 Budget -
* 2017 Amended BudgetSalaries/Benefits/PensionsNet change to fund existing positions ($2,918)Increase to fund pay for performance and market movement 25,103Increase to fund medical and dental cost adjustments 1,006Increase to fund Workers' Compensation rate adjustment 188Total Salaries/Benefits/Pensions $23,379OperatingNone $0Total Operating $0Capital OutlayNone $0Total Capital Outlay $0Total For 2018 $23,379
* 2017 Amended Budget as of 8/29/2017
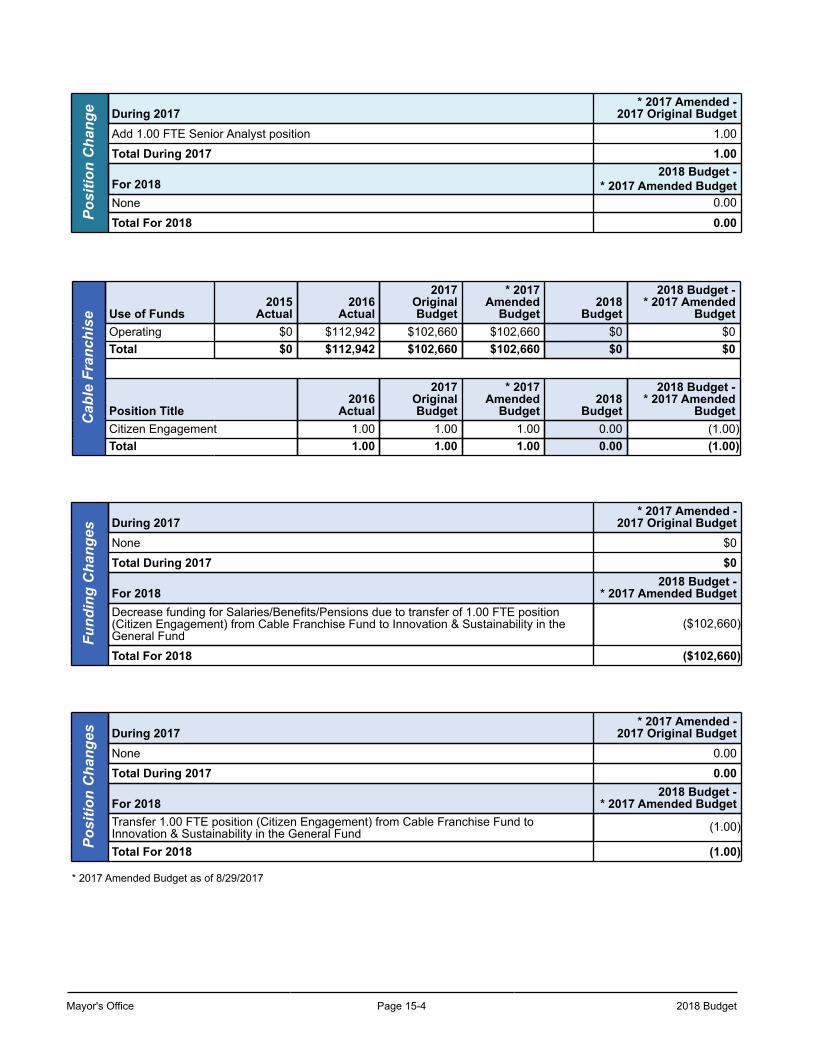
Mayor's Office Page 15-4 2018 Budget
Posi
tion
Cha
nge During 2017
* 2017 Amended -2017 Original Budget
Add 1.00 FTE Senior Analyst position 1.00
Total During 2017 1.00
For 20182018 Budget -
* 2017 Amended BudgetNone 0.00
Total For 2018 0.00
Cab
le F
ranc
hise Use of Funds
2015Actual
2016Actual
2017OriginalBudget
* 2017Amended
Budget2018
Budget
2018 Budget -* 2017 Amended
BudgetOperating $0 $112,942 $102,660 $102,660 $0 $0Total $0 $112,942 $102,660 $102,660 $0 $0
Position Title2016
Actual
2017OriginalBudget
* 2017Amended
Budget2018
Budget
2018 Budget -* 2017 Amended
BudgetCitizen Engagement 1.00 1.00 1.00 0.00 (1.00)Total 1.00 1.00 1.00 0.00 (1.00)
Fund
ing
Cha
nges
During 2017* 2017 Amended -
2017 Original BudgetNone $0
Total During 2017 $0
For 20182018 Budget -
* 2017 Amended BudgetDecrease funding for Salaries/Benefits/Pensions due to transfer of 1.00 FTE position(Citizen Engagement) from Cable Franchise Fund to Innovation & Sustainability in theGeneral Fund
($102,660)
Total For 2018 ($102,660)
Posi
tion
Cha
nges During 2017
* 2017 Amended -2017 Original Budget
None 0.00
Total During 2017 0.00
For 20182018 Budget -
* 2017 Amended BudgetTransfer 1.00 FTE position (Citizen Engagement) from Cable Franchise Fund toInnovation & Sustainability in the General Fund (1.00)
Total For 2018 (1.00)
* 2017 Amended Budget as of 8/29/2017
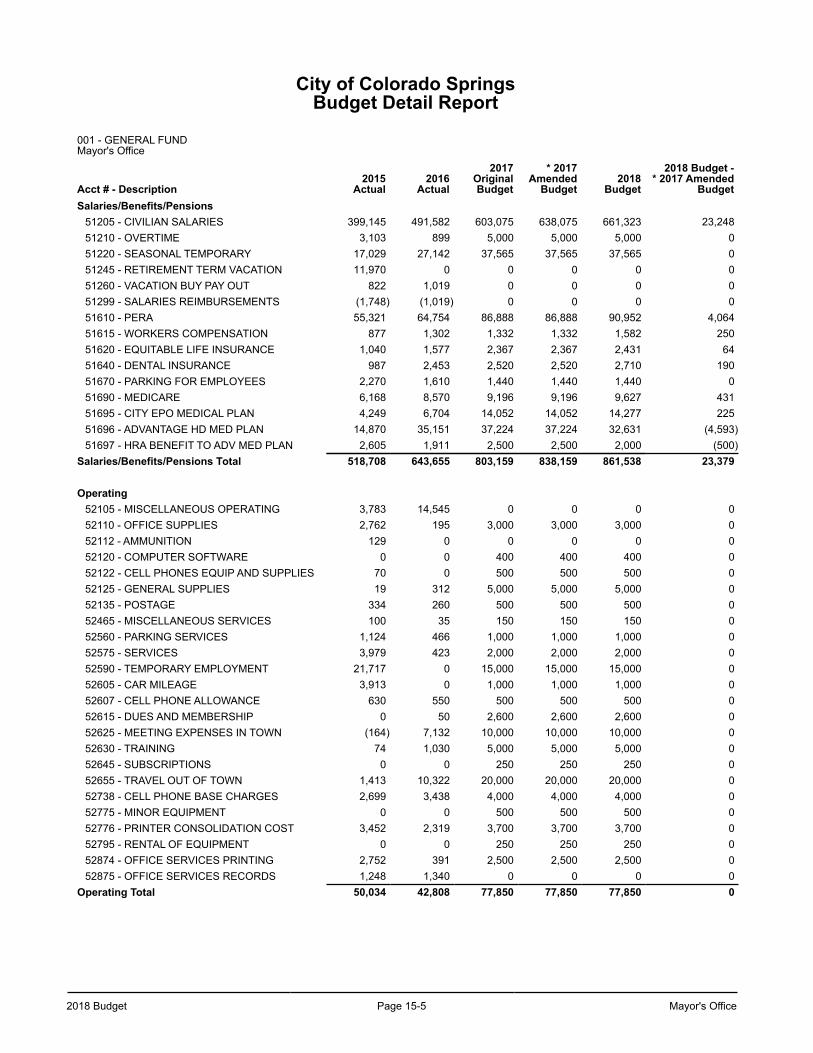
2018 Budget Page 15-5 Mayor's Office
City of Colorado SpringsBudget Detail Report
001 - GENERAL FUNDMayor's Office
Acct # - Description2015
Actual2016
Actual
2017OriginalBudget
* 2017Amended
Budget2018
Budget
2018 Budget -* 2017 Amended
BudgetSalaries/Benefits/Pensions
51205 - CIVILIAN SALARIES 399,145 491,582 603,075 638,075 661,323 23,24851210 - OVERTIME 3,103 899 5,000 5,000 5,000 051220 - SEASONAL TEMPORARY 17,029 27,142 37,565 37,565 37,565 051245 - RETIREMENT TERM VACATION 11,970 0 0 0 0 051260 - VACATION BUY PAY OUT 822 1,019 0 0 0 051299 - SALARIES REIMBURSEMENTS (1,748) (1,019) 0 0 0 051610 - PERA 55,321 64,754 86,888 86,888 90,952 4,06451615 - WORKERS COMPENSATION 877 1,302 1,332 1,332 1,582 25051620 - EQUITABLE LIFE INSURANCE 1,040 1,577 2,367 2,367 2,431 6451640 - DENTAL INSURANCE 987 2,453 2,520 2,520 2,710 19051670 - PARKING FOR EMPLOYEES 2,270 1,610 1,440 1,440 1,440 051690 - MEDICARE 6,168 8,570 9,196 9,196 9,627 43151695 - CITY EPO MEDICAL PLAN 4,249 6,704 14,052 14,052 14,277 22551696 - ADVANTAGE HD MED PLAN 14,870 35,151 37,224 37,224 32,631 (4,593)51697 - HRA BENEFIT TO ADV MED PLAN 2,605 1,911 2,500 2,500 2,000 (500)
Salaries/Benefits/Pensions Total 518,708 643,655 803,159 838,159 861,538 23,379
Operating52105 - MISCELLANEOUS OPERATING 3,783 14,545 0 0 0 052110 - OFFICE SUPPLIES 2,762 195 3,000 3,000 3,000 052112 - AMMUNITION 129 0 0 0 0 052120 - COMPUTER SOFTWARE 0 0 400 400 400 052122 - CELL PHONES EQUIP AND SUPPLIES 70 0 500 500 500 052125 - GENERAL SUPPLIES 19 312 5,000 5,000 5,000 052135 - POSTAGE 334 260 500 500 500 052465 - MISCELLANEOUS SERVICES 100 35 150 150 150 052560 - PARKING SERVICES 1,124 466 1,000 1,000 1,000 052575 - SERVICES 3,979 423 2,000 2,000 2,000 052590 - TEMPORARY EMPLOYMENT 21,717 0 15,000 15,000 15,000 052605 - CAR MILEAGE 3,913 0 1,000 1,000 1,000 052607 - CELL PHONE ALLOWANCE 630 550 500 500 500 052615 - DUES AND MEMBERSHIP 0 50 2,600 2,600 2,600 052625 - MEETING EXPENSES IN TOWN (164) 7,132 10,000 10,000 10,000 052630 - TRAINING 74 1,030 5,000 5,000 5,000 052645 - SUBSCRIPTIONS 0 0 250 250 250 052655 - TRAVEL OUT OF TOWN 1,413 10,322 20,000 20,000 20,000 052738 - CELL PHONE BASE CHARGES 2,699 3,438 4,000 4,000 4,000 052775 - MINOR EQUIPMENT 0 0 500 500 500 052776 - PRINTER CONSOLIDATION COST 3,452 2,319 3,700 3,700 3,700 052795 - RENTAL OF EQUIPMENT 0 0 250 250 250 052874 - OFFICE SERVICES PRINTING 2,752 391 2,500 2,500 2,500 052875 - OFFICE SERVICES RECORDS 1,248 1,340 0 0 0 0
Operating Total 50,034 42,808 77,850 77,850 77,850 0
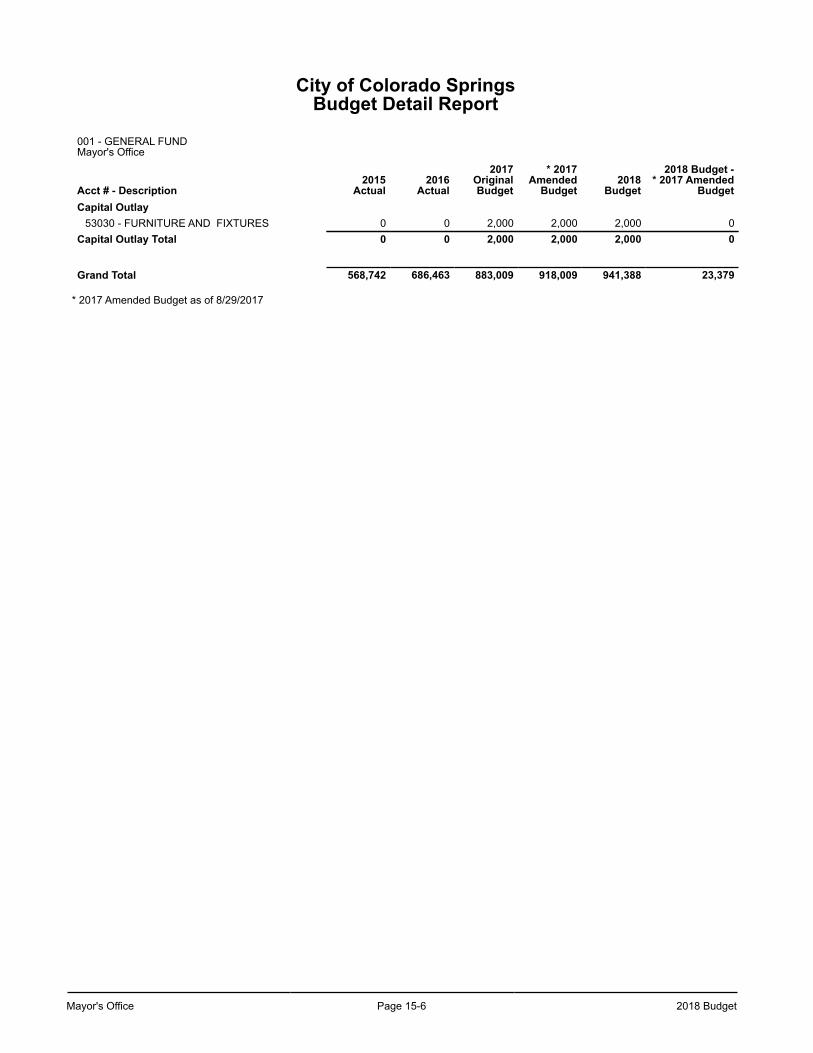
Mayor's Office Page 15-6 2018 Budget
City of Colorado SpringsBudget Detail Report
001 - GENERAL FUNDMayor's Office
Acct # - Description2015
Actual2016
Actual
2017OriginalBudget
* 2017Amended
Budget2018
Budget
2018 Budget -* 2017 Amended
BudgetCapital Outlay
53030 - FURNITURE AND FIXTURES 0 0 2,000 2,000 2,000 0Capital Outlay Total 0 0 2,000 2,000 2,000 0
Grand Total 568,742 686,463 883,009 918,009 941,388 23,379
* 2017 Amended Budget as of 8/29/2017
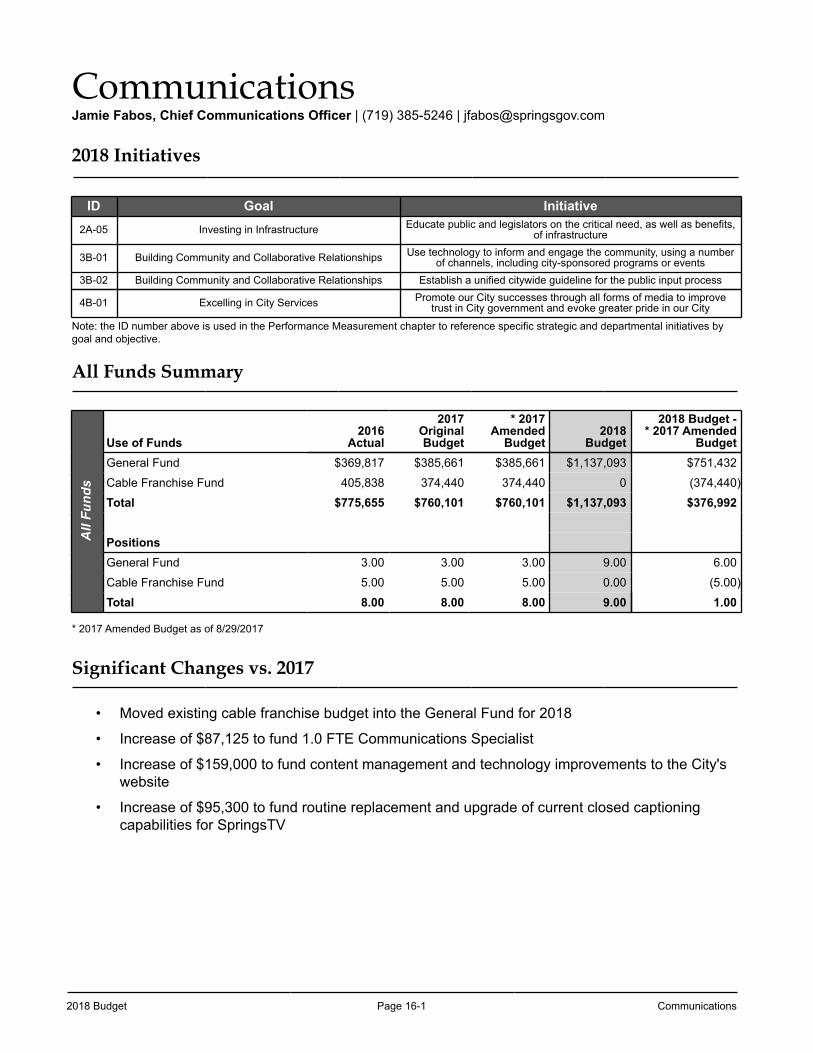
2018 Budget Page 16-1 Communications
CommunicationsJamie Fabos, Chief Communications Officer | (719) 385-5246 | [email protected]
2018 Initiatives
ID Goal Initiative2A-05 Investing in Infrastructure Educate public and legislators on the critical need, as well as benefits,
of infrastructure
3B-01 Building Community and Collaborative Relationships Use technology to inform and engage the community, using a number of channels, including city-sponsored programs or events
3B-02 Building Community and Collaborative Relationships Establish a unified citywide guideline for the public input process
4B-01 Excelling in City Services Promote our City successes through all forms of media to improve trust in City government and evoke greater pride in our City
Note: the ID number above is used in the Performance Measurement chapter to reference specific strategic and departmental initiatives by goal and objective.
All Funds Summary
All
Fund
s
Use of Funds2016
Actual
2017OriginalBudget
* 2017Amended
Budget2018
Budget
2018 Budget -* 2017 Amended
BudgetGeneral Fund $369,817 $385,661 $385,661 $1,137,093 $751,432
Cable Franchise Fund 405,838 374,440 374,440 0 (374,440)
Total $775,655 $760,101 $760,101 $1,137,093 $376,992
PositionsGeneral Fund 3.00 3.00 3.00 9.00 6.00
Cable Franchise Fund 5.00 5.00 5.00 0.00 (5.00)
Total 8.00 8.00 8.00 9.00 1.00
* 2017 Amended Budget as of 8/29/2017
Significant Changes vs. 2017
• Moved existing cable franchise budget into the General Fund for 2018
• Increase of $87,125 to fund 1.0 FTE Communications Specialist
• Increase of $159,000 to fund content management and technology improvements to the City's website
• Increase of $95,300 to fund routine replacement and upgrade of current closed captioning capabilities for SpringsTV
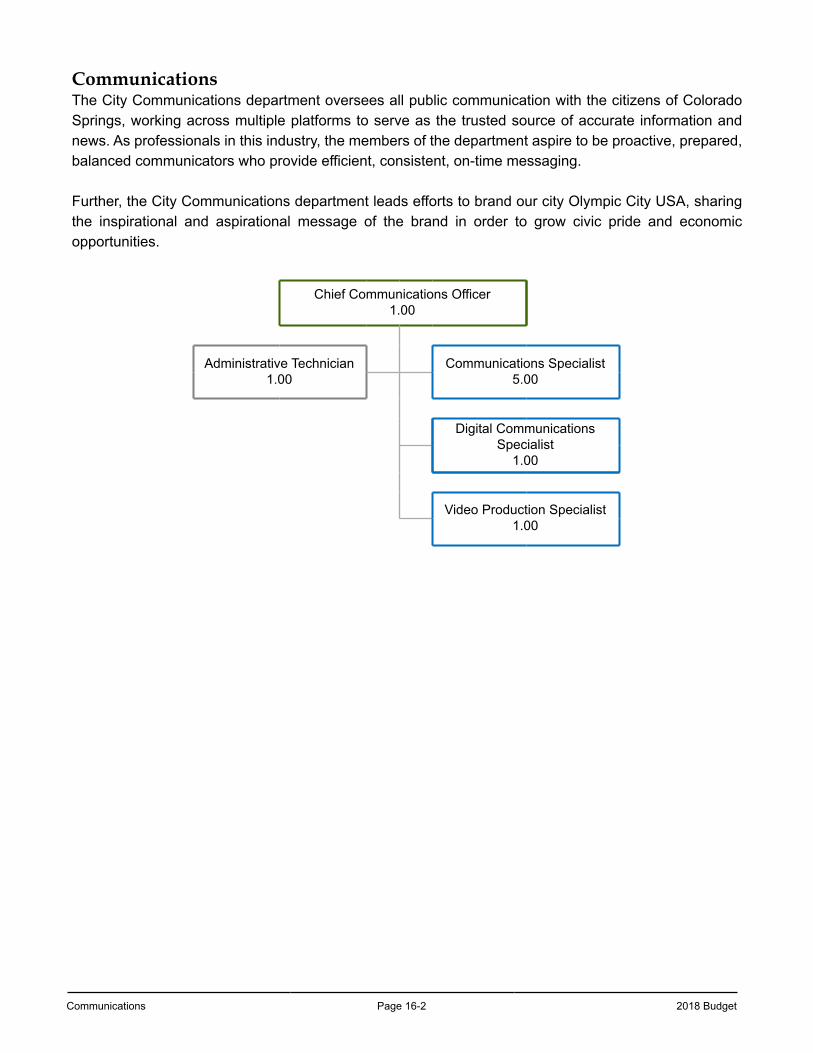
Communications Page 16-2 2018 Budget
CommunicationsThe City Communications department oversees all public communication with the citizens of Colorado Springs, working across multiple platforms to serve as the trusted source of accurate information and news. As professionals in this industry, the members of the department aspire to be proactive, prepared, balanced communicators who provide efficient, consistent, on-time messaging.
Further, the City Communications department leads efforts to brand our city Olympic City USA, sharing the inspirational and aspirational message of the brand in order to grow civic pride and economic opportunities.
Chief Communications Officer1.00
Administrative Technician1.00
Communications Specialist5.00
Digital Communications Specialist
1.00
Video Production Specialist1.00
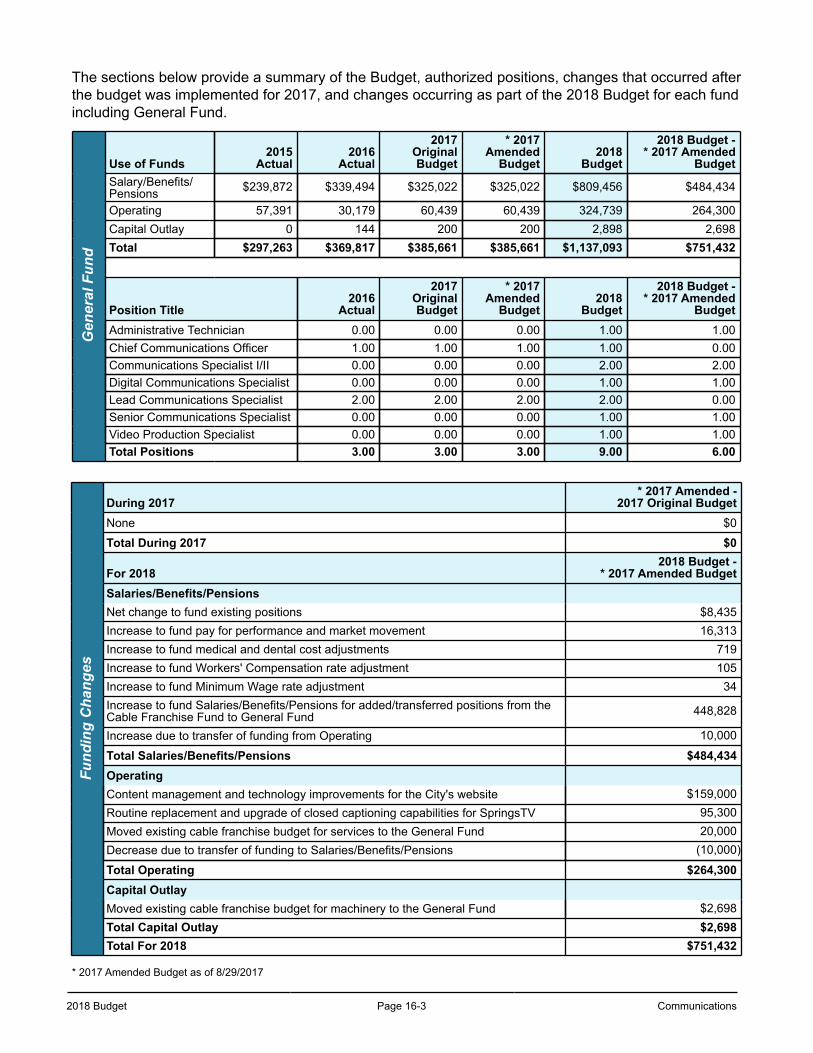
2018 Budget Page 16-3 Communications
The sections below provide a summary of the Budget, authorized positions, changes that occurred after the budget was implemented for 2017, and changes occurring as part of the 2018 Budget for each fund including General Fund.
Gen
eral
Fun
d
Use of Funds2015
Actual2016
Actual
2017OriginalBudget
* 2017Amended
Budget2018
Budget
2018 Budget -* 2017 Amended
BudgetSalary/Benefits/Pensions $239,872 $339,494 $325,022 $325,022 $809,456 $484,434
Operating 57,391 30,179 60,439 60,439 324,739 264,300Capital Outlay 0 144 200 200 2,898 2,698Total $297,263 $369,817 $385,661 $385,661 $1,137,093 $751,432
Position Title2016
Actual
2017OriginalBudget
* 2017Amended
Budget2018
Budget
2018 Budget -* 2017 Amended
BudgetAdministrative Technician 0.00 0.00 0.00 1.00 1.00Chief Communications Officer 1.00 1.00 1.00 1.00 0.00Communications Specialist I/II 0.00 0.00 0.00 2.00 2.00Digital Communications Specialist 0.00 0.00 0.00 1.00 1.00Lead Communications Specialist 2.00 2.00 2.00 2.00 0.00Senior Communications Specialist 0.00 0.00 0.00 1.00 1.00Video Production Specialist 0.00 0.00 0.00 1.00 1.00Total Positions 3.00 3.00 3.00 9.00 6.00
Fund
ing
Cha
nges
During 2017* 2017 Amended -
2017 Original BudgetNone $0
Total During 2017 $0
For 20182018 Budget -
* 2017 Amended BudgetSalaries/Benefits/PensionsNet change to fund existing positions $8,435Increase to fund pay for performance and market movement 16,313Increase to fund medical and dental cost adjustments 719Increase to fund Workers' Compensation rate adjustment 105Increase to fund Minimum Wage rate adjustment 34Increase to fund Salaries/Benefits/Pensions for added/transferred positions from theCable Franchise Fund to General Fund 448,828
Increase due to transfer of funding from Operating 10,000
Total Salaries/Benefits/Pensions $484,434OperatingContent management and technology improvements for the City's website $159,000Routine replacement and upgrade of closed captioning capabilities for SpringsTV 95,300Moved existing cable franchise budget for services to the General Fund 20,000Decrease due to transfer of funding to Salaries/Benefits/Pensions (10,000)
Total Operating $264,300Capital OutlayMoved existing cable franchise budget for machinery to the General Fund $2,698Total Capital Outlay $2,698Total For 2018 $751,432
* 2017 Amended Budget as of 8/29/2017
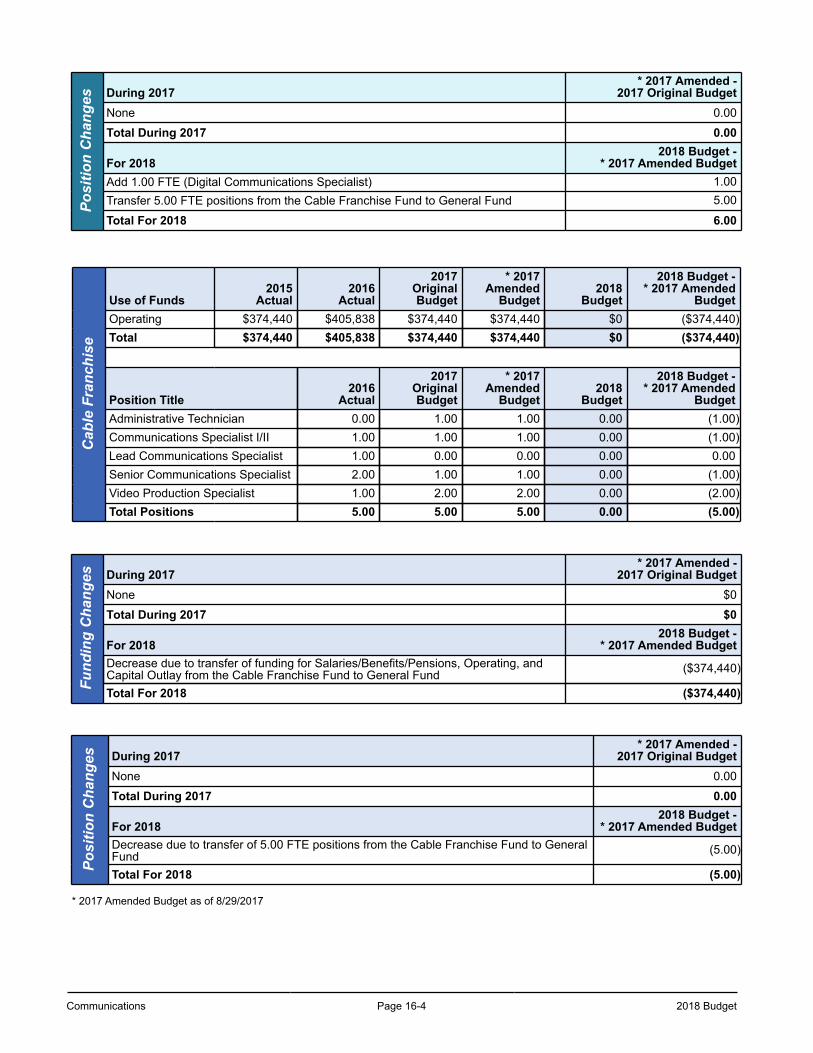
Communications Page 16-4 2018 Budget
Posi
tion
Cha
nges During 2017
* 2017 Amended -2017 Original Budget
None 0.00
Total During 2017 0.00
For 20182018 Budget -
* 2017 Amended BudgetAdd 1.00 FTE (Digital Communications Specialist) 1.00Transfer 5.00 FTE positions from the Cable Franchise Fund to General Fund 5.00
Total For 2018 6.00
Cab
le F
ranc
hise
Use of Funds2015
Actual2016
Actual
2017OriginalBudget
* 2017Amended
Budget2018
Budget
2018 Budget -* 2017 Amended
BudgetOperating $374,440 $405,838 $374,440 $374,440 $0 ($374,440)Total $374,440 $405,838 $374,440 $374,440 $0 ($374,440)
Position Title2016
Actual
2017OriginalBudget
* 2017Amended
Budget2018
Budget
2018 Budget -* 2017 Amended
BudgetAdministrative Technician 0.00 1.00 1.00 0.00 (1.00)Communications Specialist I/II 1.00 1.00 1.00 0.00 (1.00)Lead Communications Specialist 1.00 0.00 0.00 0.00 0.00Senior Communications Specialist 2.00 1.00 1.00 0.00 (1.00)Video Production Specialist 1.00 2.00 2.00 0.00 (2.00)Total Positions 5.00 5.00 5.00 0.00 (5.00)
Fund
ing
Cha
nges During 2017
* 2017 Amended -2017 Original Budget
None $0
Total During 2017 $0
For 20182018 Budget -
* 2017 Amended BudgetDecrease due to transfer of funding for Salaries/Benefits/Pensions, Operating, andCapital Outlay from the Cable Franchise Fund to General Fund ($374,440)
Total For 2018 ($374,440)
Posi
tion
Cha
nges During 2017
* 2017 Amended -2017 Original Budget
None 0.00
Total During 2017 0.00
For 20182018 Budget -
* 2017 Amended BudgetDecrease due to transfer of 5.00 FTE positions from the Cable Franchise Fund to GeneralFund (5.00)
Total For 2018 (5.00)
* 2017 Amended Budget as of 8/29/2017
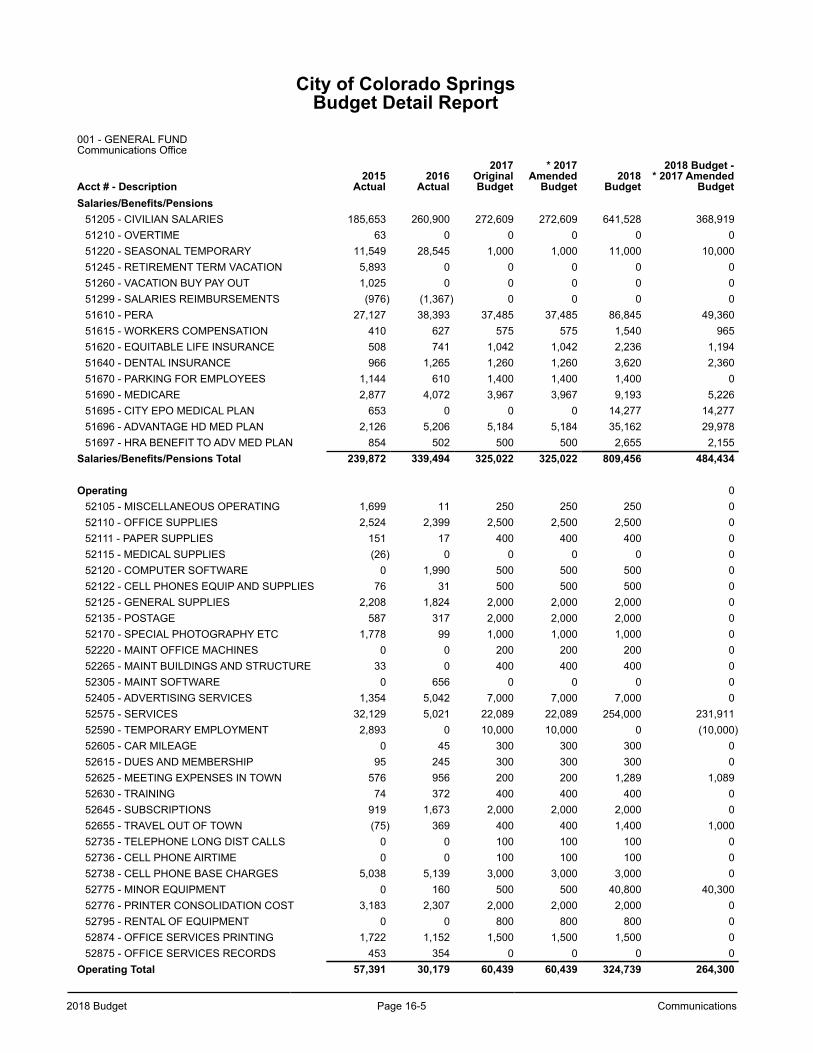
2018 Budget Page 16-5 Communications
City of Colorado SpringsBudget Detail Report
001 - GENERAL FUNDCommunications Office
Acct # - Description2015
Actual2016
Actual
2017OriginalBudget
* 2017Amended
Budget2018
Budget
2018 Budget -* 2017 Amended
BudgetSalaries/Benefits/Pensions
51205 - CIVILIAN SALARIES 185,653 260,900 272,609 272,609 641,528 368,91951210 - OVERTIME 63 0 0 0 0 051220 - SEASONAL TEMPORARY 11,549 28,545 1,000 1,000 11,000 10,00051245 - RETIREMENT TERM VACATION 5,893 0 0 0 0 051260 - VACATION BUY PAY OUT 1,025 0 0 0 0 051299 - SALARIES REIMBURSEMENTS (976) (1,367) 0 0 0 051610 - PERA 27,127 38,393 37,485 37,485 86,845 49,36051615 - WORKERS COMPENSATION 410 627 575 575 1,540 96551620 - EQUITABLE LIFE INSURANCE 508 741 1,042 1,042 2,236 1,19451640 - DENTAL INSURANCE 966 1,265 1,260 1,260 3,620 2,36051670 - PARKING FOR EMPLOYEES 1,144 610 1,400 1,400 1,400 051690 - MEDICARE 2,877 4,072 3,967 3,967 9,193 5,22651695 - CITY EPO MEDICAL PLAN 653 0 0 0 14,277 14,27751696 - ADVANTAGE HD MED PLAN 2,126 5,206 5,184 5,184 35,162 29,97851697 - HRA BENEFIT TO ADV MED PLAN 854 502 500 500 2,655 2,155
Salaries/Benefits/Pensions Total 239,872 339,494 325,022 325,022 809,456 484,434
Operating 052105 - MISCELLANEOUS OPERATING 1,699 11 250 250 250 052110 - OFFICE SUPPLIES 2,524 2,399 2,500 2,500 2,500 052111 - PAPER SUPPLIES 151 17 400 400 400 052115 - MEDICAL SUPPLIES (26) 0 0 0 0 052120 - COMPUTER SOFTWARE 0 1,990 500 500 500 052122 - CELL PHONES EQUIP AND SUPPLIES 76 31 500 500 500 052125 - GENERAL SUPPLIES 2,208 1,824 2,000 2,000 2,000 052135 - POSTAGE 587 317 2,000 2,000 2,000 052170 - SPECIAL PHOTOGRAPHY ETC 1,778 99 1,000 1,000 1,000 052220 - MAINT OFFICE MACHINES 0 0 200 200 200 052265 - MAINT BUILDINGS AND STRUCTURE 33 0 400 400 400 052305 - MAINT SOFTWARE 0 656 0 0 0 052405 - ADVERTISING SERVICES 1,354 5,042 7,000 7,000 7,000 052575 - SERVICES 32,129 5,021 22,089 22,089 254,000 231,91152590 - TEMPORARY EMPLOYMENT 2,893 0 10,000 10,000 0 (10,000)52605 - CAR MILEAGE 0 45 300 300 300 052615 - DUES AND MEMBERSHIP 95 245 300 300 300 052625 - MEETING EXPENSES IN TOWN 576 956 200 200 1,289 1,08952630 - TRAINING 74 372 400 400 400 052645 - SUBSCRIPTIONS 919 1,673 2,000 2,000 2,000 052655 - TRAVEL OUT OF TOWN (75) 369 400 400 1,400 1,00052735 - TELEPHONE LONG DIST CALLS 0 0 100 100 100 052736 - CELL PHONE AIRTIME 0 0 100 100 100 052738 - CELL PHONE BASE CHARGES 5,038 5,139 3,000 3,000 3,000 052775 - MINOR EQUIPMENT 0 160 500 500 40,800 40,30052776 - PRINTER CONSOLIDATION COST 3,183 2,307 2,000 2,000 2,000 052795 - RENTAL OF EQUIPMENT 0 0 800 800 800 052874 - OFFICE SERVICES PRINTING 1,722 1,152 1,500 1,500 1,500 052875 - OFFICE SERVICES RECORDS 453 354 0 0 0 0
Operating Total 57,391 30,179 60,439 60,439 324,739 264,300
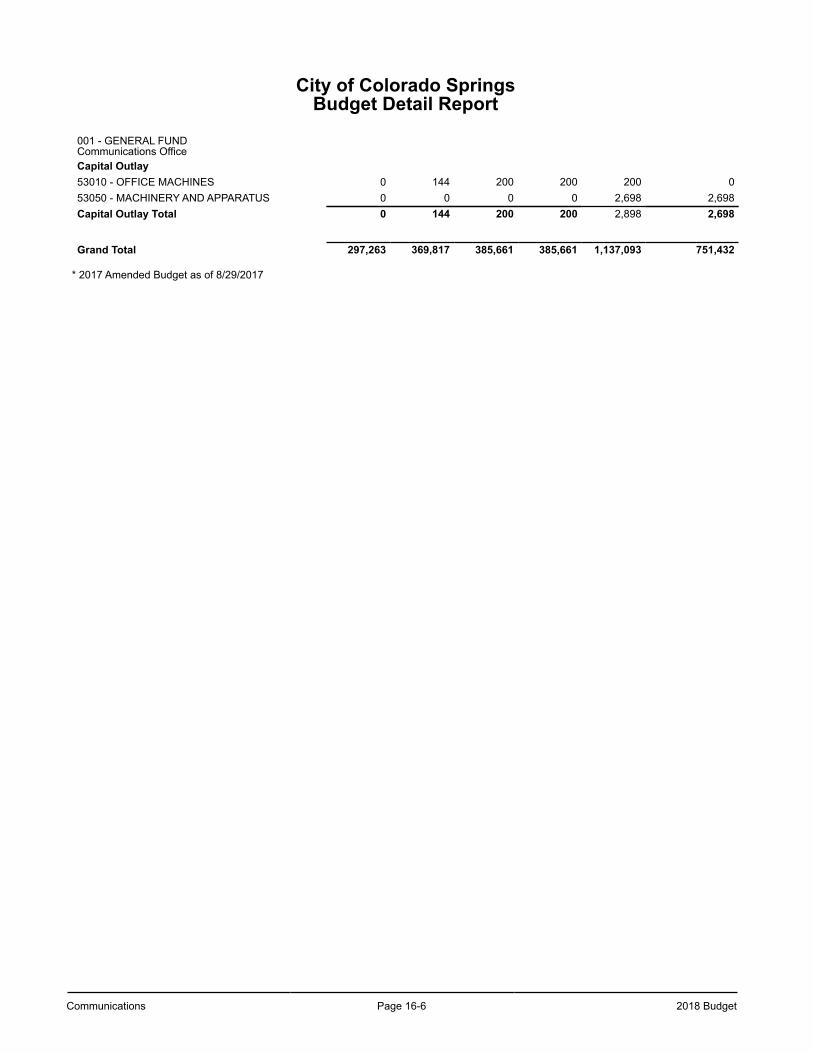
Communications Page 16-6 2018 Budget
City of Colorado SpringsBudget Detail Report
001 - GENERAL FUNDCommunications OfficeCapital Outlay53010 - OFFICE MACHINES 0 144 200 200 200 053050 - MACHINERY AND APPARATUS 0 0 0 0 2,698 2,698Capital Outlay Total 0 144 200 200 2,898 2,698
Grand Total 297,263 369,817 385,661 385,661 1,137,093 751,432
* 2017 Amended Budget as of 8/29/2017
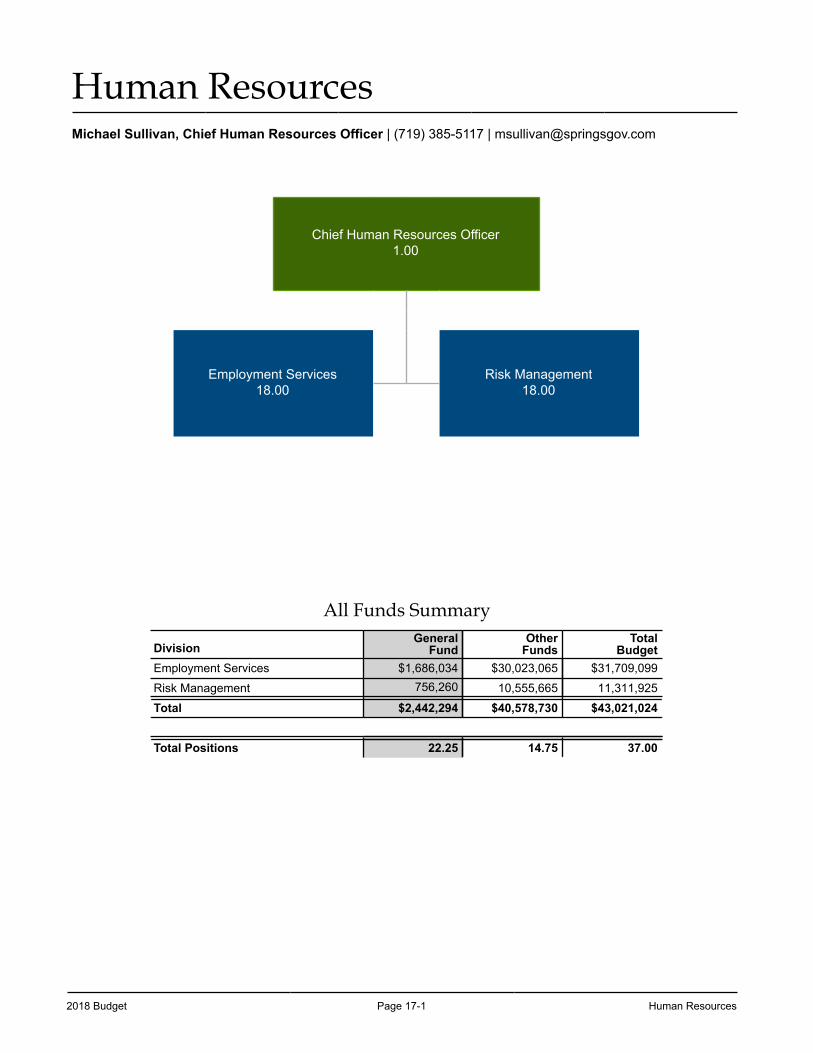
2018 Budget Page 17-1 Human Resources
Human ResourcesMichael Sullivan, Chief Human Resources Officer | (719) 385-5117 | [email protected]
Chief Human Resources Officer1.00
Employment Services18.00
Risk Management18.00
All Funds Summary
DivisionGeneral
FundOther
FundsTotal
BudgetEmployment Services $1,686,034 $30,023,065 $31,709,099
Risk Management 756,260 10,555,665 11,311,925
Total $2,442,294 $40,578,730 $43,021,024
Total Positions 22.25 14.75 37.00
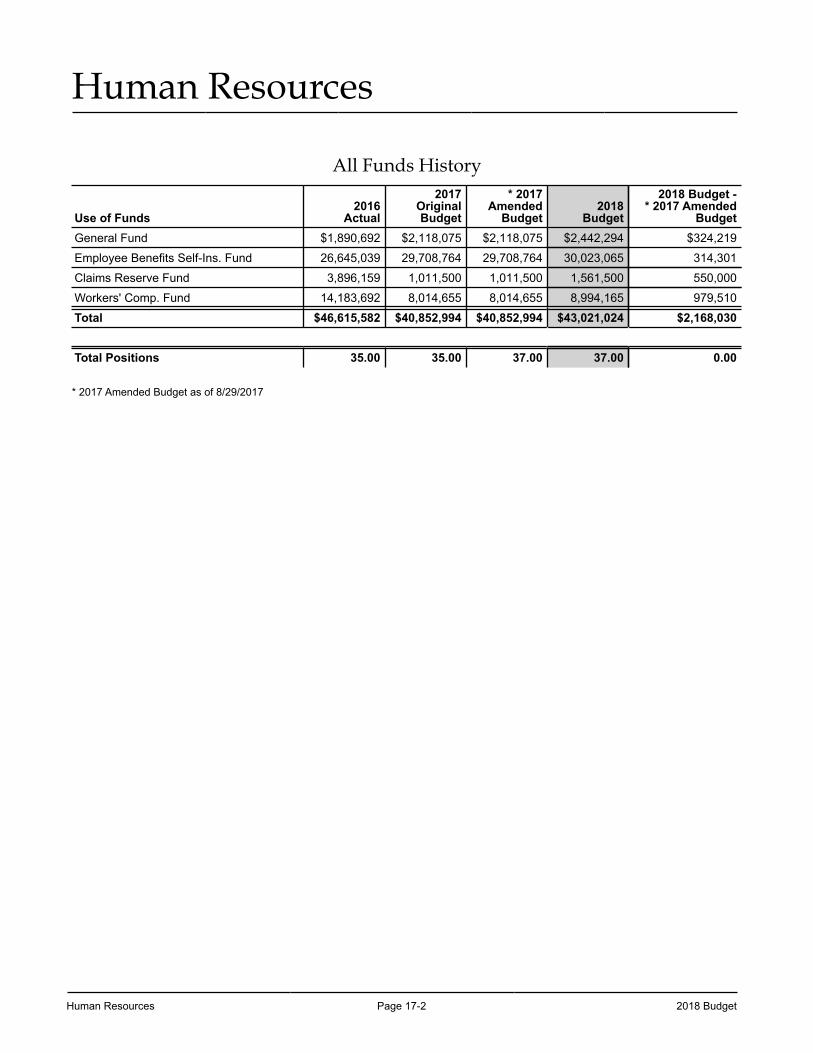
Human Resources Page 17-2 2018 Budget
Human Resources
All Funds History
Use of Funds2016
Actual
2017OriginalBudget
* 2017Amended
Budget2018
Budget
2018 Budget -* 2017 Amended
BudgetGeneral Fund $1,890,692 $2,118,075 $2,118,075 $2,442,294 $324,219
Employee Benefits Self-Ins. Fund 26,645,039 29,708,764 29,708,764 30,023,065 314,301
Claims Reserve Fund 3,896,159 1,011,500 1,011,500 1,561,500 550,000
Workers' Comp. Fund 14,183,692 8,014,655 8,014,655 8,994,165 979,510
Total $46,615,582 $40,852,994 $40,852,994 $43,021,024 $2,168,030
Total Positions 35.00 35.00 37.00 37.00 0.00
* 2017 Amended Budget as of 8/29/2017
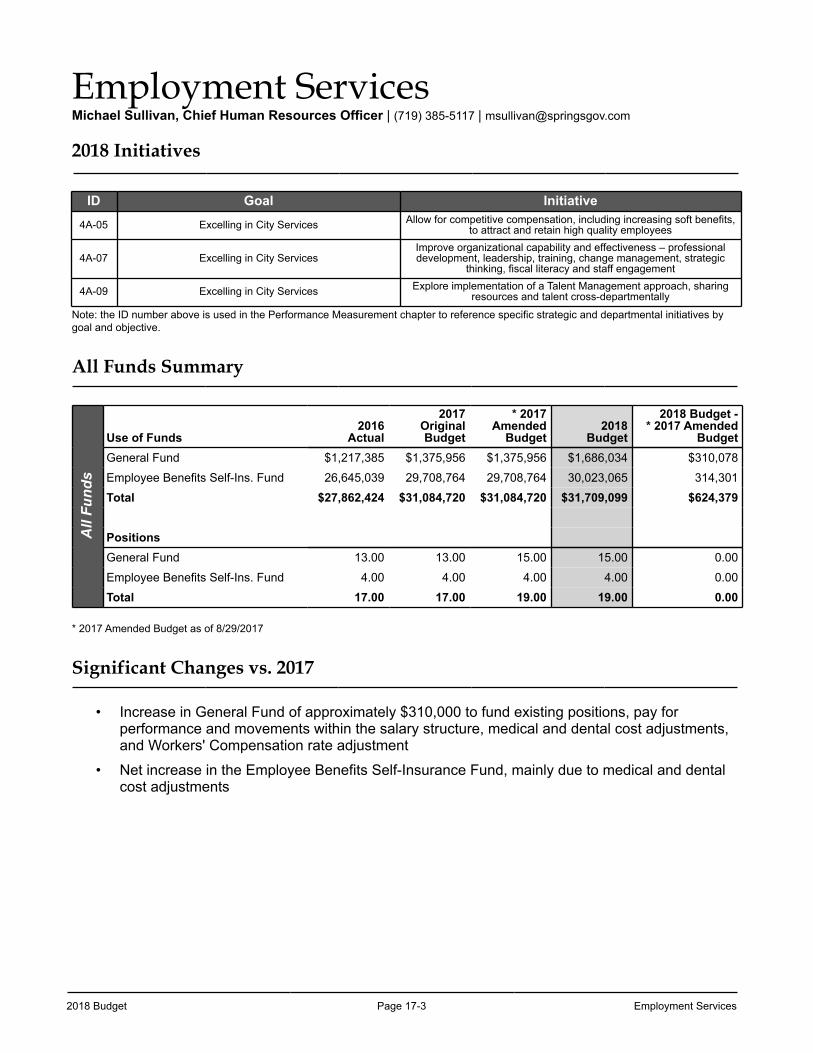
2018 Budget Page 17-3 Employment Services
Employment ServicesMichael Sullivan, Chief Human Resources Officer | (719) 385-5117 | [email protected]
2018 Initiatives
ID Goal Initiative
4A-05 Excelling in City Services Allow for competitive compensation, including increasing soft benefits, to attract and retain high quality employees
4A-07 Excelling in City ServicesImprove organizational capability and effectiveness – professional development, leadership, training, change management, strategic
thinking, fiscal literacy and staff engagement
4A-09 Excelling in City Services Explore implementation of a Talent Management approach, sharing resources and talent cross-departmentally
Note: the ID number above is used in the Performance Measurement chapter to reference specific strategic and departmental initiatives by goal and objective.
All Funds Summary
All
Fund
s
Use of Funds2016
Actual
2017OriginalBudget
* 2017Amended
Budget2018
Budget
2018 Budget -* 2017 Amended
BudgetGeneral Fund $1,217,385 $1,375,956 $1,375,956 $1,686,034 $310,078
Employee Benefits Self-Ins. Fund 26,645,039 29,708,764 29,708,764 30,023,065 314,301
Total $27,862,424 $31,084,720 $31,084,720 $31,709,099 $624,379
PositionsGeneral Fund 13.00 13.00 15.00 15.00 0.00
Employee Benefits Self-Ins. Fund 4.00 4.00 4.00 4.00 0.00
Total 17.00 17.00 19.00 19.00 0.00
* 2017 Amended Budget as of 8/29/2017
Significant Changes vs. 2017
• Increase in General Fund of approximately $310,000 to fund existing positions, pay for performance and movements within the salary structure, medical and dental cost adjustments, and Workers' Compensation rate adjustment
• Net increase in the Employee Benefits Self-Insurance Fund, mainly due to medical and dental cost adjustments
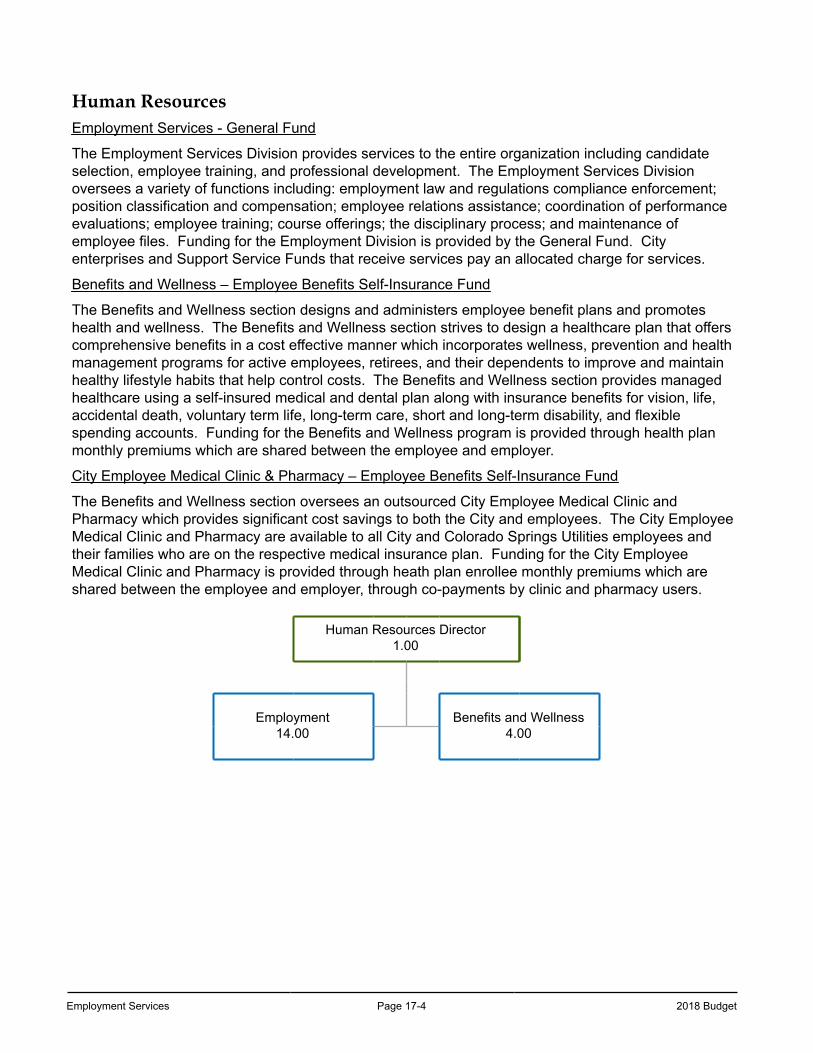
Employment Services Page 17-4 2018 Budget
Human ResourcesEmployment Services - General Fund
The Employment Services Division provides services to the entire organization including candidate selection, employee training, and professional development. The Employment Services Division oversees a variety of functions including: employment law and regulations compliance enforcement; position classification and compensation; employee relations assistance; coordination of performance evaluations; employee training; course offerings; the disciplinary process; and maintenance of employee files. Funding for the Employment Division is provided by the General Fund. City enterprises and Support Service Funds that receive services pay an allocated charge for services.
Benefits and Wellness – Employee Benefits Self-Insurance Fund
The Benefits and Wellness section designs and administers employee benefit plans and promotes health and wellness. The Benefits and Wellness section strives to design a healthcare plan that offers comprehensive benefits in a cost effective manner which incorporates wellness, prevention and health management programs for active employees, retirees, and their dependents to improve and maintain healthy lifestyle habits that help control costs. The Benefits and Wellness section provides managed healthcare using a self-insured medical and dental plan along with insurance benefits for vision, life, accidental death, voluntary term life, long-term care, short and long-term disability, and flexible spending accounts. Funding for the Benefits and Wellness program is provided through health plan monthly premiums which are shared between the employee and employer.
City Employee Medical Clinic & Pharmacy – Employee Benefits Self-Insurance Fund
The Benefits and Wellness section oversees an outsourced City Employee Medical Clinic and Pharmacy which provides significant cost savings to both the City and employees. The City Employee Medical Clinic and Pharmacy are available to all City and Colorado Springs Utilities employees and their families who are on the respective medical insurance plan. Funding for the City Employee Medical Clinic and Pharmacy is provided through heath plan enrollee monthly premiums which are shared between the employee and employer, through co-payments by clinic and pharmacy users.
Human Resources Director1.00
Employment14.00
Benefits and Wellness4.00
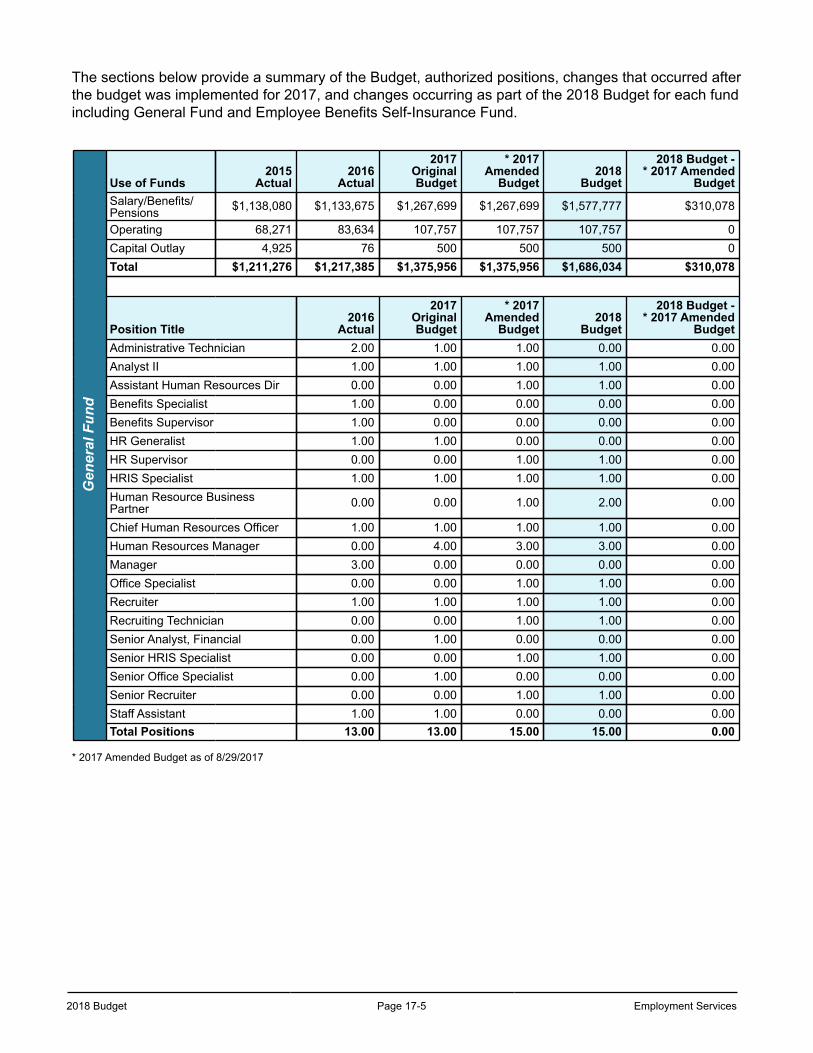
2018 Budget Page 17-5 Employment Services
The sections below provide a summary of the Budget, authorized positions, changes that occurred after the budget was implemented for 2017, and changes occurring as part of the 2018 Budget for each fund including General Fund and Employee Benefits Self-Insurance Fund.
Gen
eral
Fun
d
Use of Funds2015
Actual2016
Actual
2017OriginalBudget
* 2017Amended
Budget2018
Budget
2018 Budget -* 2017 Amended
BudgetSalary/Benefits/Pensions $1,138,080 $1,133,675 $1,267,699 $1,267,699 $1,577,777 $310,078
Operating 68,271 83,634 107,757 107,757 107,757 0Capital Outlay 4,925 76 500 500 500 0Total $1,211,276 $1,217,385 $1,375,956 $1,375,956 $1,686,034 $310,078
Position Title2016
Actual
2017OriginalBudget
* 2017Amended
Budget2018
Budget
2018 Budget -* 2017 Amended
BudgetAdministrative Technician 2.00 1.00 1.00 0.00 0.00Analyst II 1.00 1.00 1.00 1.00 0.00Assistant Human Resources Dir 0.00 0.00 1.00 1.00 0.00Benefits Specialist 1.00 0.00 0.00 0.00 0.00Benefits Supervisor 1.00 0.00 0.00 0.00 0.00HR Generalist 1.00 1.00 0.00 0.00 0.00HR Supervisor 0.00 0.00 1.00 1.00 0.00HRIS Specialist 1.00 1.00 1.00 1.00 0.00Human Resource BusinessPartner 0.00 0.00 1.00 2.00 0.00
Chief Human Resources Officer 1.00 1.00 1.00 1.00 0.00Human Resources Manager 0.00 4.00 3.00 3.00 0.00Manager 3.00 0.00 0.00 0.00 0.00Office Specialist 0.00 0.00 1.00 1.00 0.00Recruiter 1.00 1.00 1.00 1.00 0.00Recruiting Technician 0.00 0.00 1.00 1.00 0.00Senior Analyst, Financial 0.00 1.00 0.00 0.00 0.00Senior HRIS Specialist 0.00 0.00 1.00 1.00 0.00Senior Office Specialist 0.00 1.00 0.00 0.00 0.00Senior Recruiter 0.00 0.00 1.00 1.00 0.00Staff Assistant 1.00 1.00 0.00 0.00 0.00Total Positions 13.00 13.00 15.00 15.00 0.00
* 2017 Amended Budget as of 8/29/2017
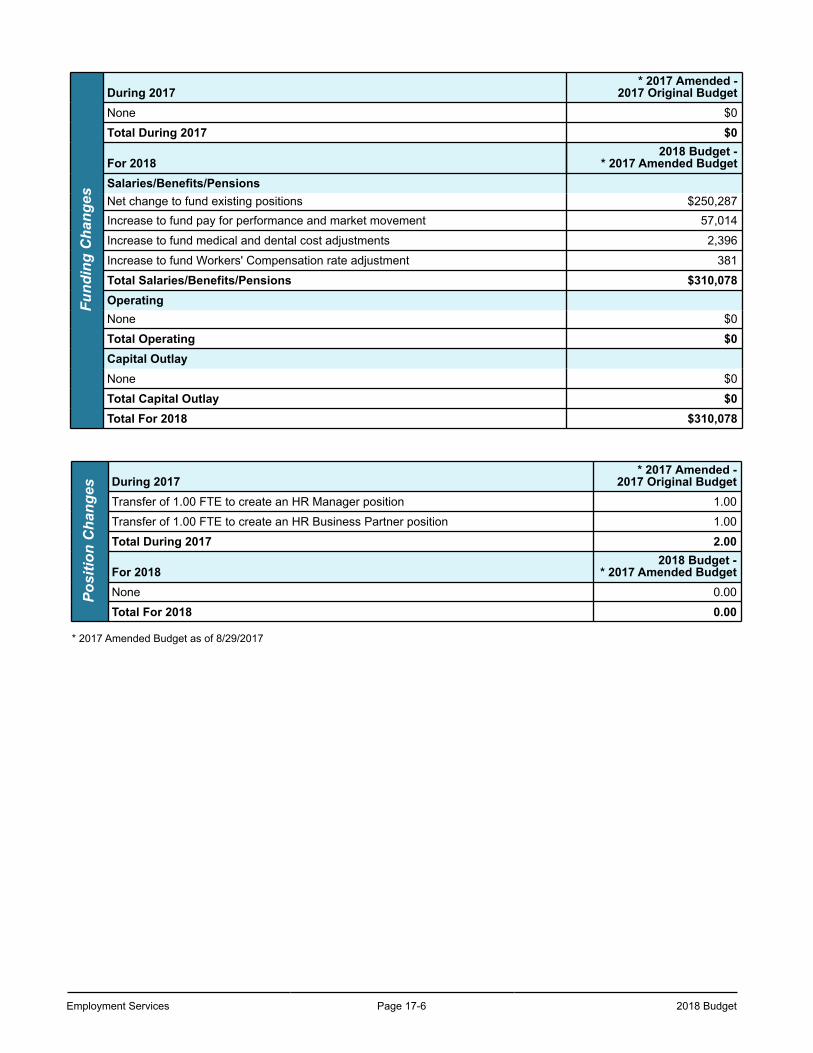
Employment Services Page 17-6 2018 Budget
Fund
ing
Cha
nges
During 2017* 2017 Amended -
2017 Original BudgetNone $0
Total During 2017 $0
For 20182018 Budget -
* 2017 Amended BudgetSalaries/Benefits/PensionsNet change to fund existing positions $250,287Increase to fund pay for performance and market movement 57,014
Increase to fund medical and dental cost adjustments 2,396
Increase to fund Workers' Compensation rate adjustment 381
Total Salaries/Benefits/Pensions $310,078OperatingNone $0
Total Operating $0Capital OutlayNone $0
Total Capital Outlay $0Total For 2018 $310,078
Posi
tion
Cha
nges During 2017
* 2017 Amended -2017 Original Budget
Transfer of 1.00 FTE to create an HR Manager position 1.00
Transfer of 1.00 FTE to create an HR Business Partner position 1.00
Total During 2017 2.00
For 20182018 Budget -
* 2017 Amended BudgetNone 0.00
Total For 2018 0.00
* 2017 Amended Budget as of 8/29/2017
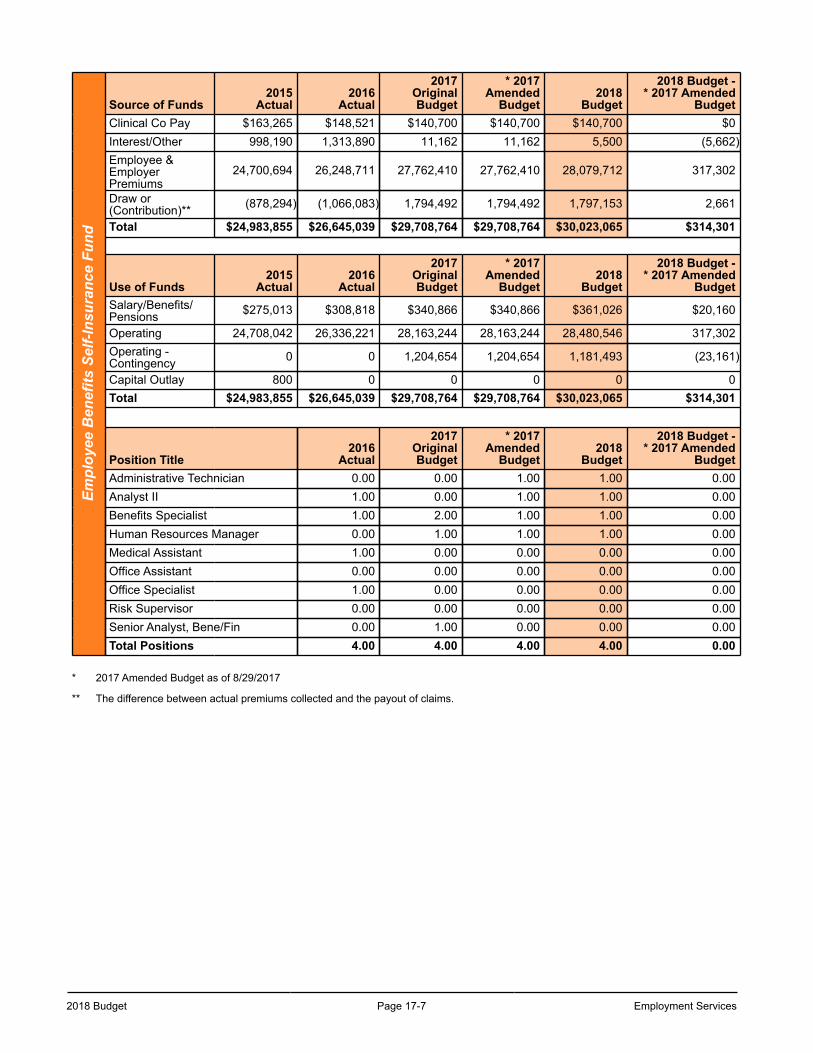
2018 Budget Page 17-7 Employment Services
Empl
oyee
Ben
efits
Sel
f-Ins
uran
ce F
und
Source of Funds2015
Actual2016
Actual
2017OriginalBudget
* 2017Amended
Budget2018
Budget
2018 Budget -* 2017 Amended
BudgetClinical Co Pay $163,265 $148,521 $140,700 $140,700 $140,700 $0Interest/Other 998,190 1,313,890 11,162 11,162 5,500 (5,662)Employee &EmployerPremiums
24,700,694 26,248,711 27,762,410 27,762,410 28,079,712 317,302
Draw or(Contribution)** (878,294) (1,066,083) 1,794,492 1,794,492 1,797,153 2,661
Total $24,983,855 $26,645,039 $29,708,764 $29,708,764 $30,023,065 $314,301
Use of Funds2015
Actual2016
Actual
2017OriginalBudget
* 2017Amended
Budget2018
Budget
2018 Budget -* 2017 Amended
BudgetSalary/Benefits/Pensions $275,013 $308,818 $340,866 $340,866 $361,026 $20,160
Operating 24,708,042 26,336,221 28,163,244 28,163,244 28,480,546 317,302Operating -Contingency 0 0 1,204,654 1,204,654 1,181,493 (23,161)
Capital Outlay 800 0 0 0 0 0Total $24,983,855 $26,645,039 $29,708,764 $29,708,764 $30,023,065 $314,301
Position Title2016
Actual
2017OriginalBudget
* 2017Amended
Budget2018
Budget
2018 Budget -* 2017 Amended
BudgetAdministrative Technician 0.00 0.00 1.00 1.00 0.00Analyst II 1.00 0.00 1.00 1.00 0.00Benefits Specialist 1.00 2.00 1.00 1.00 0.00Human Resources Manager 0.00 1.00 1.00 1.00 0.00Medical Assistant 1.00 0.00 0.00 0.00 0.00Office Assistant 0.00 0.00 0.00 0.00 0.00Office Specialist 1.00 0.00 0.00 0.00 0.00Risk Supervisor 0.00 0.00 0.00 0.00 0.00Senior Analyst, Bene/Fin 0.00 1.00 0.00 0.00 0.00Total Positions 4.00 4.00 4.00 4.00 0.00
* 2017 Amended Budget as of 8/29/2017
** The difference between actual premiums collected and the payout of claims.
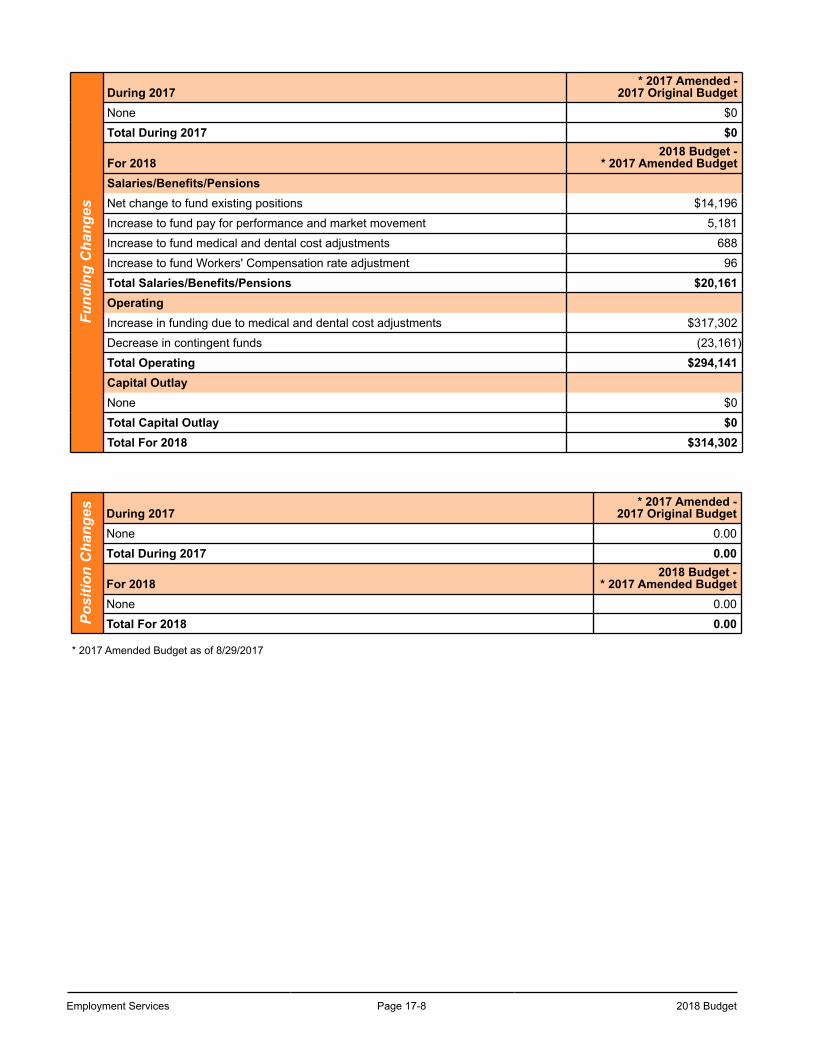
Employment Services Page 17-8 2018 Budget
Fund
ing
Cha
nges
During 2017* 2017 Amended -
2017 Original BudgetNone $0
Total During 2017 $0
For 20182018 Budget -
* 2017 Amended BudgetSalaries/Benefits/PensionsNet change to fund existing positions $14,196
Increase to fund pay for performance and market movement 5,181
Increase to fund medical and dental cost adjustments 688
Increase to fund Workers' Compensation rate adjustment 96
Total Salaries/Benefits/Pensions $20,161OperatingIncrease in funding due to medical and dental cost adjustments $317,302
Decrease in contingent funds (23,161)
Total Operating $294,141Capital OutlayNone $0
Total Capital Outlay $0Total For 2018 $314,302
Posi
tion
Cha
nges During 2017
* 2017 Amended -2017 Original Budget
None 0.00
Total During 2017 0.00
For 20182018 Budget -
* 2017 Amended BudgetNone 0.00
Total For 2018 0.00
* 2017 Amended Budget as of 8/29/2017
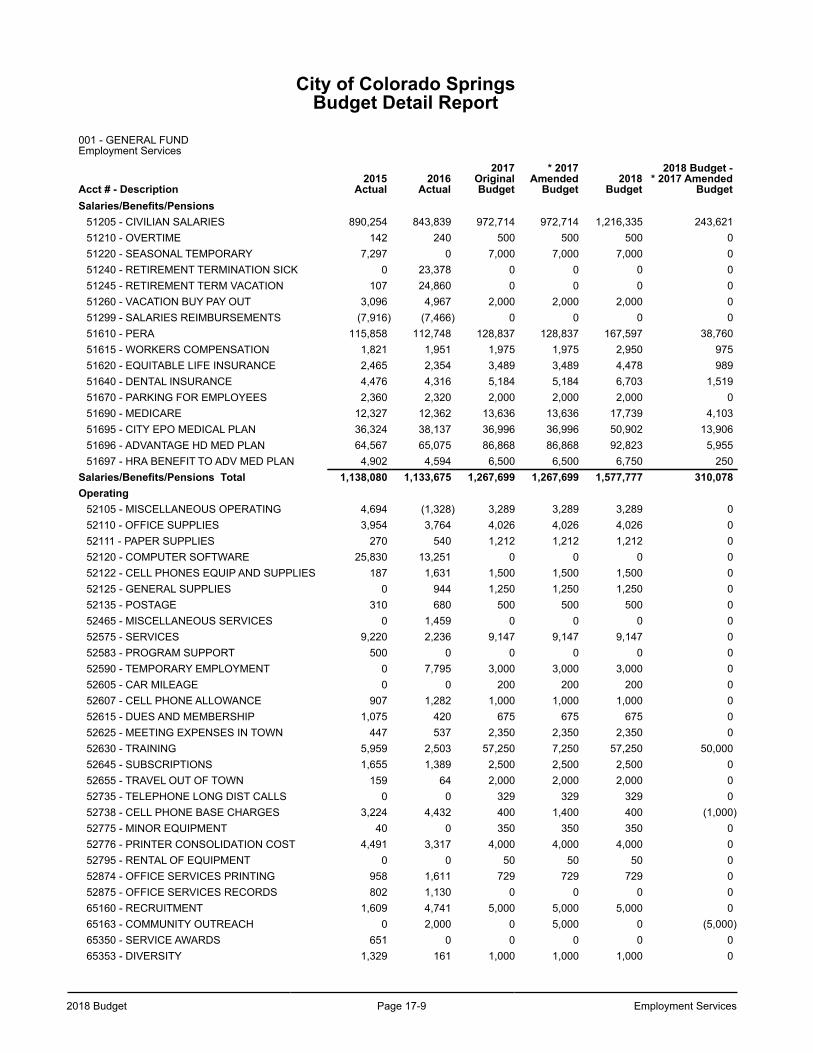
2018 Budget Page 17-9 Employment Services
City of Colorado SpringsBudget Detail Report
001 - GENERAL FUND Employment Services
Acct # - Description2015
Actual2016
Actual
2017OriginalBudget
* 2017Amended
Budget2018
Budget
2018 Budget -* 2017 Amended
BudgetSalaries/Benefits/Pensions
51205 - CIVILIAN SALARIES 890,254 843,839 972,714 972,714 1,216,335 243,62151210 - OVERTIME 142 240 500 500 500 051220 - SEASONAL TEMPORARY 7,297 0 7,000 7,000 7,000 051240 - RETIREMENT TERMINATION SICK 0 23,378 0 0 0 051245 - RETIREMENT TERM VACATION 107 24,860 0 0 0 051260 - VACATION BUY PAY OUT 3,096 4,967 2,000 2,000 2,000 051299 - SALARIES REIMBURSEMENTS (7,916) (7,466) 0 0 0 051610 - PERA 115,858 112,748 128,837 128,837 167,597 38,76051615 - WORKERS COMPENSATION 1,821 1,951 1,975 1,975 2,950 97551620 - EQUITABLE LIFE INSURANCE 2,465 2,354 3,489 3,489 4,478 98951640 - DENTAL INSURANCE 4,476 4,316 5,184 5,184 6,703 1,51951670 - PARKING FOR EMPLOYEES 2,360 2,320 2,000 2,000 2,000 051690 - MEDICARE 12,327 12,362 13,636 13,636 17,739 4,10351695 - CITY EPO MEDICAL PLAN 36,324 38,137 36,996 36,996 50,902 13,90651696 - ADVANTAGE HD MED PLAN 64,567 65,075 86,868 86,868 92,823 5,95551697 - HRA BENEFIT TO ADV MED PLAN 4,902 4,594 6,500 6,500 6,750 250
Salaries/Benefits/Pensions Total 1,138,080 1,133,675 1,267,699 1,267,699 1,577,777 310,078Operating
52105 - MISCELLANEOUS OPERATING 4,694 (1,328) 3,289 3,289 3,289 052110 - OFFICE SUPPLIES 3,954 3,764 4,026 4,026 4,026 052111 - PAPER SUPPLIES 270 540 1,212 1,212 1,212 052120 - COMPUTER SOFTWARE 25,830 13,251 0 0 0 052122 - CELL PHONES EQUIP AND SUPPLIES 187 1,631 1,500 1,500 1,500 052125 - GENERAL SUPPLIES 0 944 1,250 1,250 1,250 052135 - POSTAGE 310 680 500 500 500 052465 - MISCELLANEOUS SERVICES 0 1,459 0 0 0 052575 - SERVICES 9,220 2,236 9,147 9,147 9,147 052583 - PROGRAM SUPPORT 500 0 0 0 0 052590 - TEMPORARY EMPLOYMENT 0 7,795 3,000 3,000 3,000 052605 - CAR MILEAGE 0 0 200 200 200 052607 - CELL PHONE ALLOWANCE 907 1,282 1,000 1,000 1,000 052615 - DUES AND MEMBERSHIP 1,075 420 675 675 675 052625 - MEETING EXPENSES IN TOWN 447 537 2,350 2,350 2,350 052630 - TRAINING 5,959 2,503 57,250 7,250 57,250 50,00052645 - SUBSCRIPTIONS 1,655 1,389 2,500 2,500 2,500 052655 - TRAVEL OUT OF TOWN 159 64 2,000 2,000 2,000 052735 - TELEPHONE LONG DIST CALLS 0 0 329 329 329 052738 - CELL PHONE BASE CHARGES 3,224 4,432 400 1,400 400 (1,000)52775 - MINOR EQUIPMENT 40 0 350 350 350 052776 - PRINTER CONSOLIDATION COST 4,491 3,317 4,000 4,000 4,000 052795 - RENTAL OF EQUIPMENT 0 0 50 50 50 052874 - OFFICE SERVICES PRINTING 958 1,611 729 729 729 052875 - OFFICE SERVICES RECORDS 802 1,130 0 0 0 065160 - RECRUITMENT 1,609 4,741 5,000 5,000 5,000 065163 - COMMUNITY OUTREACH 0 2,000 0 5,000 0 (5,000)65350 - SERVICE AWARDS 651 0 0 0 0 065353 - DIVERSITY 1,329 161 1,000 1,000 1,000 0
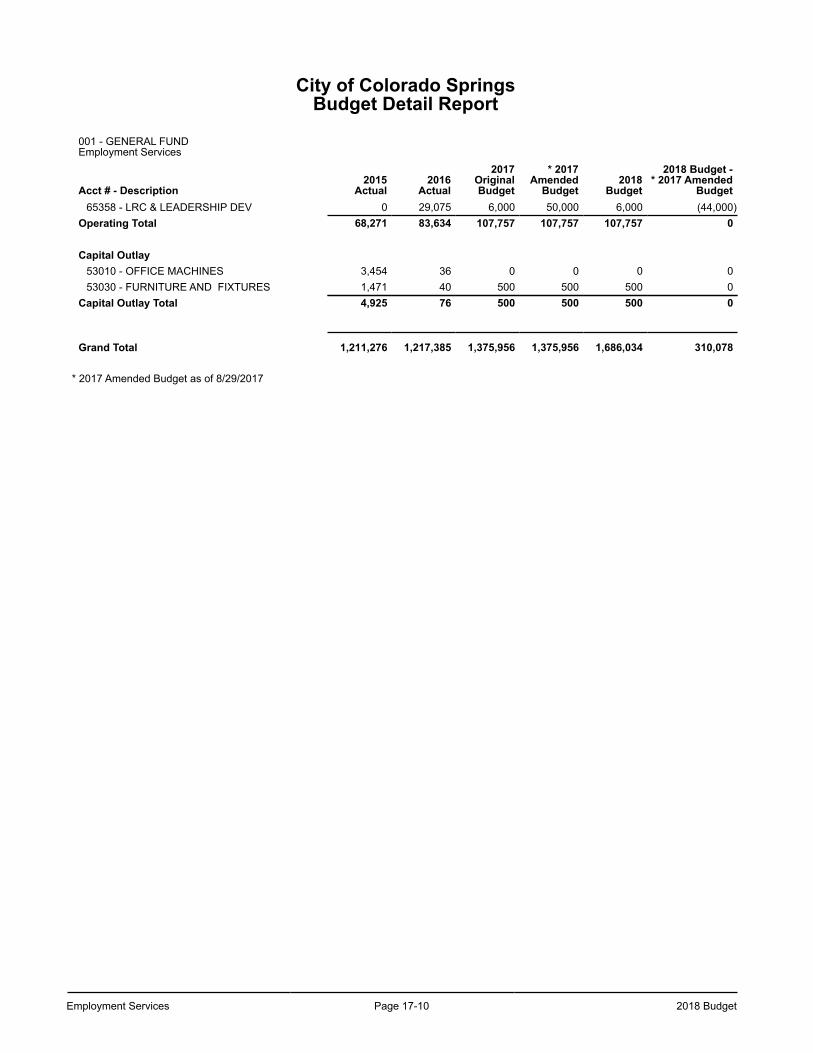
Employment Services Page 17-10 2018 Budget
City of Colorado SpringsBudget Detail Report
001 - GENERAL FUND Employment Services
Acct # - Description2015
Actual2016
Actual
2017OriginalBudget
* 2017Amended
Budget2018
Budget
2018 Budget -* 2017 Amended
Budget65358 - LRC & LEADERSHIP DEV 0 29,075 6,000 50,000 6,000 (44,000)
Operating Total 68,271 83,634 107,757 107,757 107,757 0
Capital Outlay53010 - OFFICE MACHINES 3,454 36 0 0 0 053030 - FURNITURE AND FIXTURES 1,471 40 500 500 500 0
Capital Outlay Total 4,925 76 500 500 500 0
Grand Total 1,211,276 1,217,385 1,375,956 1,375,956 1,686,034 310,078
* 2017 Amended Budget as of 8/29/2017
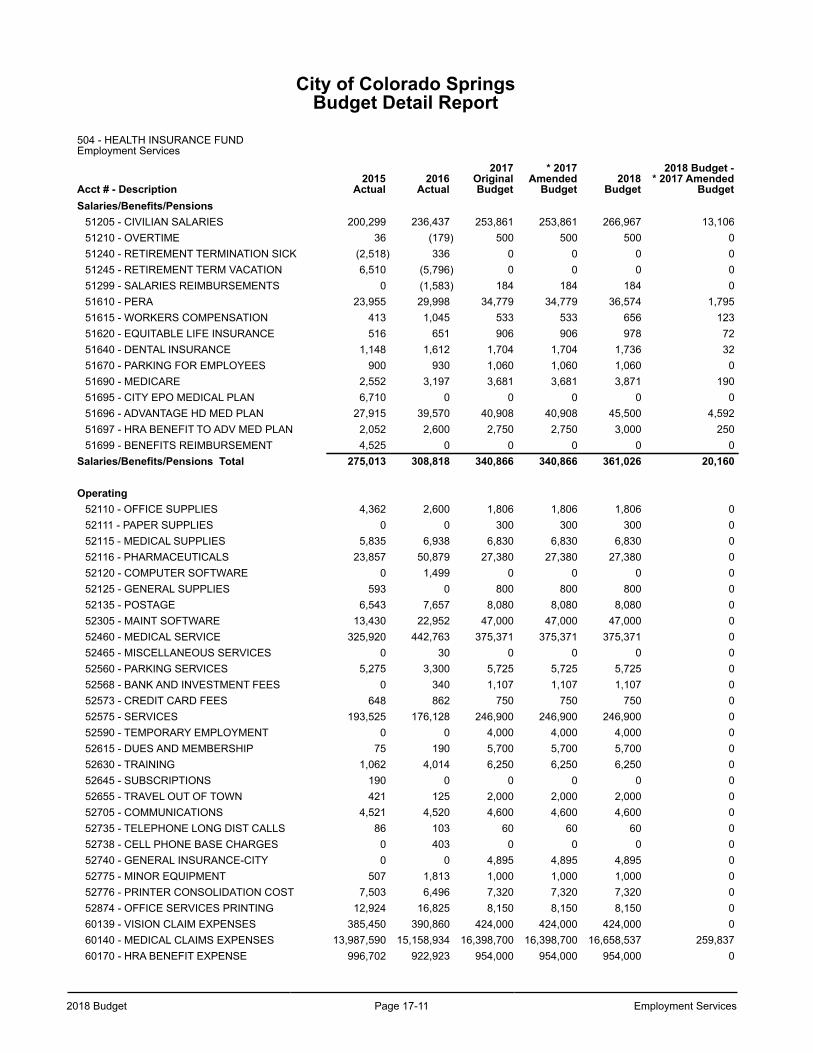
2018 Budget Page 17-11 Employment Services
City of Colorado SpringsBudget Detail Report
504 - HEALTH INSURANCE FUND Employment Services
Acct # - Description2015
Actual2016
Actual
2017OriginalBudget
* 2017Amended
Budget2018
Budget
2018 Budget -* 2017 Amended
BudgetSalaries/Benefits/Pensions
51205 - CIVILIAN SALARIES 200,299 236,437 253,861 253,861 266,967 13,10651210 - OVERTIME 36 (179) 500 500 500 051240 - RETIREMENT TERMINATION SICK (2,518) 336 0 0 0 051245 - RETIREMENT TERM VACATION 6,510 (5,796) 0 0 0 051299 - SALARIES REIMBURSEMENTS 0 (1,583) 184 184 184 051610 - PERA 23,955 29,998 34,779 34,779 36,574 1,79551615 - WORKERS COMPENSATION 413 1,045 533 533 656 12351620 - EQUITABLE LIFE INSURANCE 516 651 906 906 978 7251640 - DENTAL INSURANCE 1,148 1,612 1,704 1,704 1,736 3251670 - PARKING FOR EMPLOYEES 900 930 1,060 1,060 1,060 051690 - MEDICARE 2,552 3,197 3,681 3,681 3,871 19051695 - CITY EPO MEDICAL PLAN 6,710 0 0 0 0 051696 - ADVANTAGE HD MED PLAN 27,915 39,570 40,908 40,908 45,500 4,59251697 - HRA BENEFIT TO ADV MED PLAN 2,052 2,600 2,750 2,750 3,000 25051699 - BENEFITS REIMBURSEMENT 4,525 0 0 0 0 0
Salaries/Benefits/Pensions Total 275,013 308,818 340,866 340,866 361,026 20,160
Operating52110 - OFFICE SUPPLIES 4,362 2,600 1,806 1,806 1,806 052111 - PAPER SUPPLIES 0 0 300 300 300 052115 - MEDICAL SUPPLIES 5,835 6,938 6,830 6,830 6,830 052116 - PHARMACEUTICALS 23,857 50,879 27,380 27,380 27,380 052120 - COMPUTER SOFTWARE 0 1,499 0 0 0 052125 - GENERAL SUPPLIES 593 0 800 800 800 052135 - POSTAGE 6,543 7,657 8,080 8,080 8,080 052305 - MAINT SOFTWARE 13,430 22,952 47,000 47,000 47,000 052460 - MEDICAL SERVICE 325,920 442,763 375,371 375,371 375,371 052465 - MISCELLANEOUS SERVICES 0 30 0 0 0 052560 - PARKING SERVICES 5,275 3,300 5,725 5,725 5,725 052568 - BANK AND INVESTMENT FEES 0 340 1,107 1,107 1,107 052573 - CREDIT CARD FEES 648 862 750 750 750 052575 - SERVICES 193,525 176,128 246,900 246,900 246,900 052590 - TEMPORARY EMPLOYMENT 0 0 4,000 4,000 4,000 052615 - DUES AND MEMBERSHIP 75 190 5,700 5,700 5,700 052630 - TRAINING 1,062 4,014 6,250 6,250 6,250 052645 - SUBSCRIPTIONS 190 0 0 0 0 052655 - TRAVEL OUT OF TOWN 421 125 2,000 2,000 2,000 052705 - COMMUNICATIONS 4,521 4,520 4,600 4,600 4,600 052735 - TELEPHONE LONG DIST CALLS 86 103 60 60 60 052738 - CELL PHONE BASE CHARGES 0 403 0 0 0 052740 - GENERAL INSURANCE-CITY 0 0 4,895 4,895 4,895 052775 - MINOR EQUIPMENT 507 1,813 1,000 1,000 1,000 052776 - PRINTER CONSOLIDATION COST 7,503 6,496 7,320 7,320 7,320 052874 - OFFICE SERVICES PRINTING 12,924 16,825 8,150 8,150 8,150 060139 - VISION CLAIM EXPENSES 385,450 390,860 424,000 424,000 424,000 060140 - MEDICAL CLAIMS EXPENSES 13,987,590 15,158,934 16,398,700 16,398,700 16,658,537 259,83760170 - HRA BENEFIT EXPENSE 996,702 922,923 954,000 954,000 954,000 0
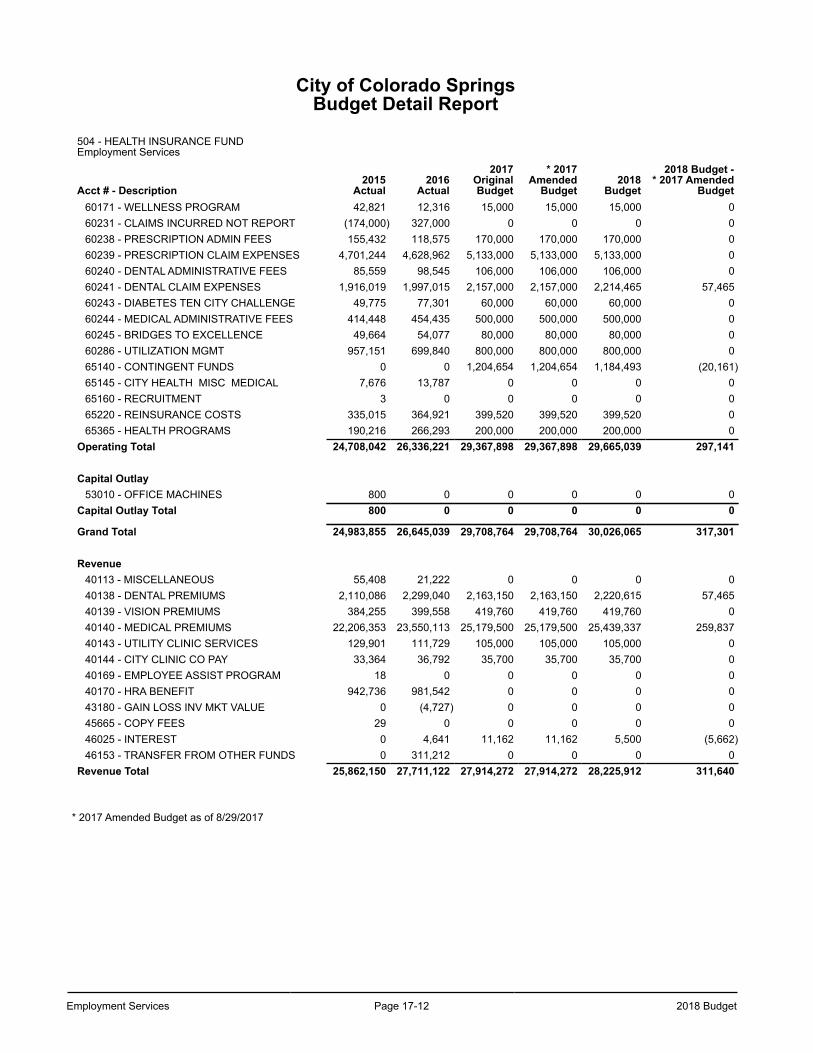
Employment Services Page 17-12 2018 Budget
City of Colorado SpringsBudget Detail Report
504 - HEALTH INSURANCE FUND Employment Services
Acct # - Description2015
Actual2016
Actual
2017OriginalBudget
* 2017Amended
Budget2018
Budget
2018 Budget -* 2017 Amended
Budget60171 - WELLNESS PROGRAM 42,821 12,316 15,000 15,000 15,000 060231 - CLAIMS INCURRED NOT REPORT (174,000) 327,000 0 0 0 060238 - PRESCRIPTION ADMIN FEES 155,432 118,575 170,000 170,000 170,000 060239 - PRESCRIPTION CLAIM EXPENSES 4,701,244 4,628,962 5,133,000 5,133,000 5,133,000 060240 - DENTAL ADMINISTRATIVE FEES 85,559 98,545 106,000 106,000 106,000 060241 - DENTAL CLAIM EXPENSES 1,916,019 1,997,015 2,157,000 2,157,000 2,214,465 57,46560243 - DIABETES TEN CITY CHALLENGE 49,775 77,301 60,000 60,000 60,000 060244 - MEDICAL ADMINISTRATIVE FEES 414,448 454,435 500,000 500,000 500,000 060245 - BRIDGES TO EXCELLENCE 49,664 54,077 80,000 80,000 80,000 060286 - UTILIZATION MGMT 957,151 699,840 800,000 800,000 800,000 065140 - CONTINGENT FUNDS 0 0 1,204,654 1,204,654 1,184,493 (20,161)65145 - CITY HEALTH MISC MEDICAL 7,676 13,787 0 0 0 065160 - RECRUITMENT 3 0 0 0 0 065220 - REINSURANCE COSTS 335,015 364,921 399,520 399,520 399,520 065365 - HEALTH PROGRAMS 190,216 266,293 200,000 200,000 200,000 0
Operating Total 24,708,042 26,336,221 29,367,898 29,367,898 29,665,039 297,141
Capital Outlay53010 - OFFICE MACHINES 800 0 0 0 0 0
Capital Outlay Total 800 0 0 0 0 0
Grand Total 24,983,855 26,645,039 29,708,764 29,708,764 30,026,065 317,301
Revenue40113 - MISCELLANEOUS 55,408 21,222 0 0 0 040138 - DENTAL PREMIUMS 2,110,086 2,299,040 2,163,150 2,163,150 2,220,615 57,46540139 - VISION PREMIUMS 384,255 399,558 419,760 419,760 419,760 040140 - MEDICAL PREMIUMS 22,206,353 23,550,113 25,179,500 25,179,500 25,439,337 259,83740143 - UTILITY CLINIC SERVICES 129,901 111,729 105,000 105,000 105,000 040144 - CITY CLINIC CO PAY 33,364 36,792 35,700 35,700 35,700 040169 - EMPLOYEE ASSIST PROGRAM 18 0 0 0 0 040170 - HRA BENEFIT 942,736 981,542 0 0 0 043180 - GAIN LOSS INV MKT VALUE 0 (4,727) 0 0 0 045665 - COPY FEES 29 0 0 0 0 046025 - INTEREST 0 4,641 11,162 11,162 5,500 (5,662)46153 - TRANSFER FROM OTHER FUNDS 0 311,212 0 0 0 0
Revenue Total 25,862,150 27,711,122 27,914,272 27,914,272 28,225,912 311,640
* 2017 Amended Budget as of 8/29/2017
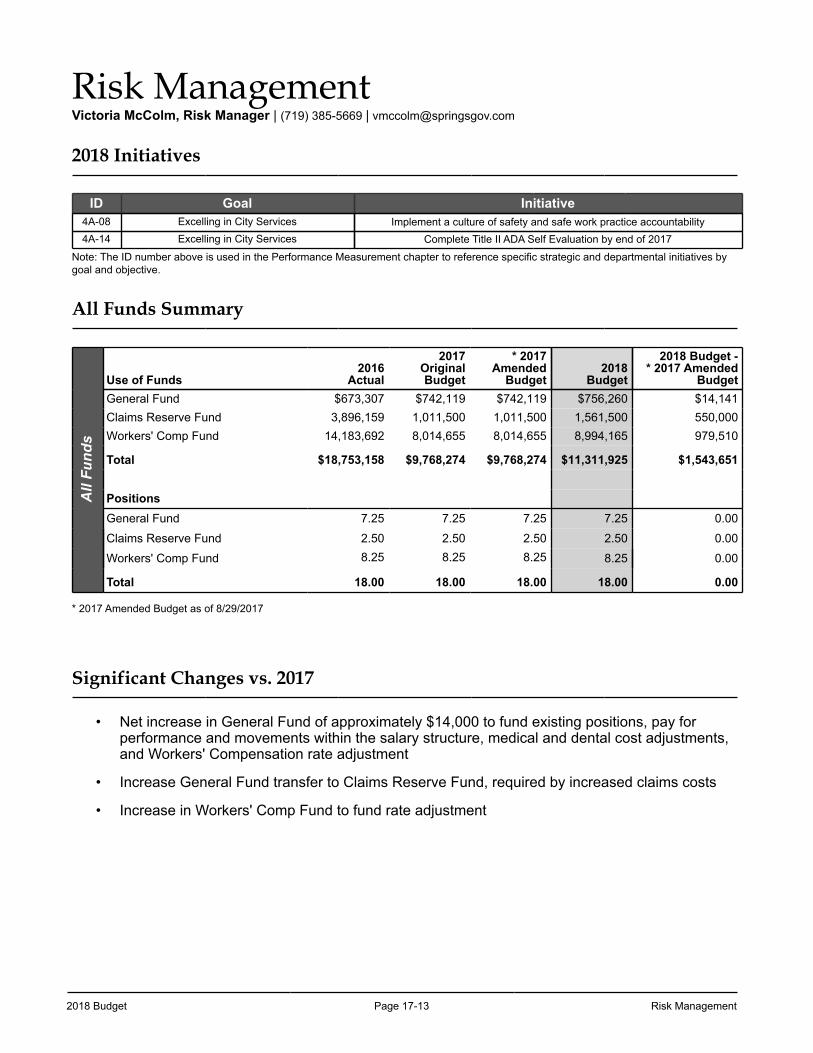
2018 Budget Page 17-13 Risk Management
Risk ManagementVictoria McColm, Risk Manager | (719) 385-5669 | [email protected]
2018 Initiatives
ID Goal Initiative4A-08 Excelling in City Services Implement a culture of safety and safe work practice accountability 4A-14 Excelling in City Services Complete Title II ADA Self Evaluation by end of 2017
Note: The ID number above is used in the Performance Measurement chapter to reference specific strategic and departmental initiatives by goal and objective.
All Funds Summary
All
Fund
s
Use of Funds2016
Actual
2017OriginalBudget
* 2017Amended
Budget2018
Budget
2018 Budget -* 2017 Amended
BudgetGeneral Fund $673,307 $742,119 $742,119 $756,260 $14,141Claims Reserve Fund 3,896,159 1,011,500 1,011,500 1,561,500 550,000Workers' Comp Fund 14,183,692 8,014,655 8,014,655 8,994,165 979,510
Total $18,753,158 $9,768,274 $9,768,274 $11,311,925 $1,543,651
PositionsGeneral Fund 7.25 7.25 7.25 7.25 0.00
Claims Reserve Fund 2.50 2.50 2.50 2.50 0.00
Workers' Comp Fund 8.25 8.25 8.25 8.25 0.00
Total 18.00 18.00 18.00 18.00 0.00
* 2017 Amended Budget as of 8/29/2017
Significant Changes vs. 2017
• Net increase in General Fund of approximately $14,000 to fund existing positions, pay for performance and movements within the salary structure, medical and dental cost adjustments, and Workers' Compensation rate adjustment
• Increase General Fund transfer to Claims Reserve Fund, required by increased claims costs
• Increase in Workers' Comp Fund to fund rate adjustment
Risk Management Page 17-14 2018 Budget
Risk ManagementThe Risk Management Division serves the entire organization by ensuring compliance with statutory mandates and protecting the City’s assets. The Risk Management Division assesses risk to control liability and loss exposures; processes and manages employee injury claims; manages the occupational health clinic, physical therapy clinic, promotes health and wellness; and emphasizes employee safety. Funding for specific Risk Management activities is provided by the General Fund, Claims Reserve Fund, and Workers’ Compensation Fund. City enterprises and Support Service Funds pay an allocated charge for services.
Safety
The Safety section ensures that employees have the knowledge and skills to safely perform job duties and administers a cost-effective program designed for safety awareness, employee feedback, guidance in training, and prevention of employee injuries. The highest practical degree of care will be used in complying with safety and health standards. Funding for the Safety program is provided by the General Fund. City enterprises and Support Service Funds that receive services pay an allocated charge for Safety services.
Liability Claims Administration – Claims Reserve Fund
The Liability Claims section investigates, evaluates, and settles all liability claims brought under state and federal laws for both the City and Colorado Springs Utilities. The claims adjusters investigate the legal liability associated with the claims, negotiate settlement, and defend claims that lack merit. By placing a high priority on handling claims efficiently, this section is able to provide a cost-effective service that is competitive with external public liability claims service providers. City enterprises and Support Service Funds that receive services pay an allocated charge for liability claims services.
Workers’ Compensation Claims Administration – Workers’ Compensation Fund
The Workers’ Compensation section manages and controls workers’ compensation claims and strives to help employees recover from work-related injuries and return to work as soon as possible. The adjusters are able to provide prompt and fair resolution of claims. All direct costs associated with administering claims, medical, indemnity, physical therapy, and occupational therapy are budgeted in this fund.
According to City Code §1.5.602, “The workers’ compensation claim reserve fund shall maintain reserves to provide for contingency so that in any year the contribution of the workers’ compensation claim reserve funds from other funds is adequate to cover the actual expenses in that year.” Funding for the Workers’ Compensation Fund is provided through payroll charges based upon job classification codes set by the National Council on Compensation Insurance, Inc. (NCCI), with a greater amount charged for positions with greater risk of injury. These rates are set so as to contribute to the fund from all funding sources an amount projected to be adequate to cover the actual expenses of that year. City enterprises and Support Service Funds that receive services pay an allocated charge for indirect costs allocated to the Workers’ Compensation Fund.
Injury leave pay is not budgeted in the Workers’ Compensation Fund - all pay is budgeted in department and division budgets. Injury pay is charged to department and division budgets during the year and at the end of the year, those expenses will be transferred to the Workers’ Compensation Fund to reflect all costs associated with Workers’ Compensation related injuries.
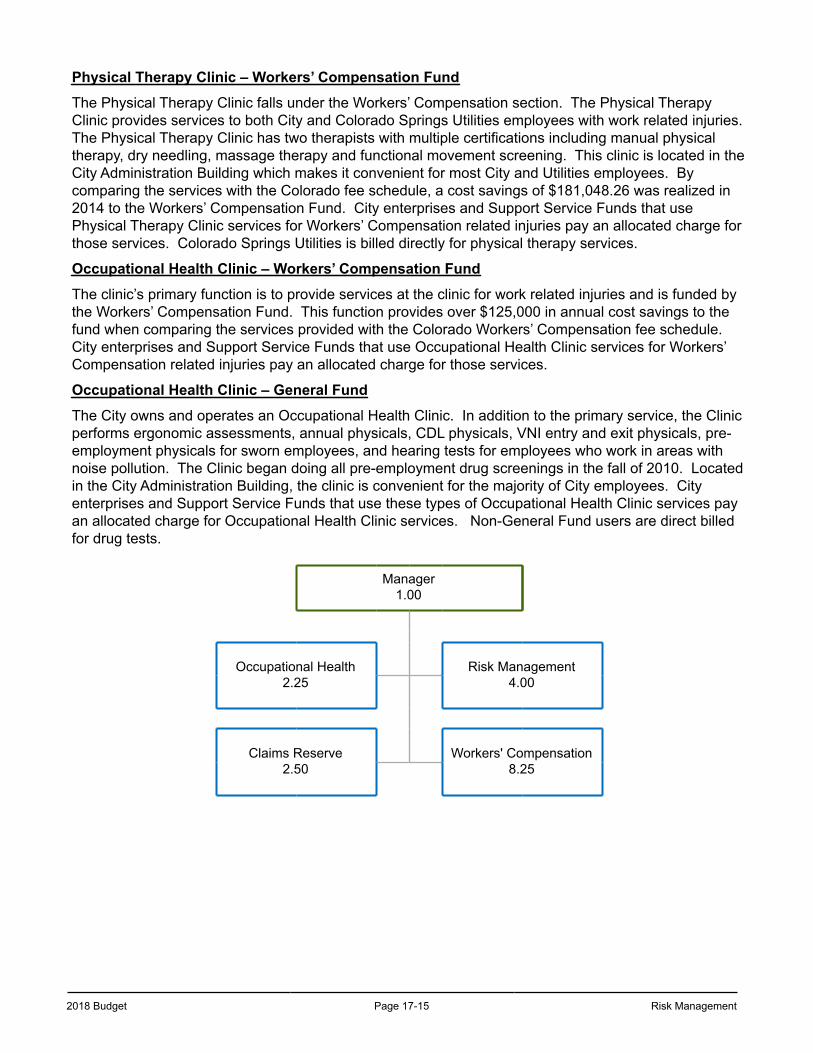
2018 Budget Page 17-15 Risk Management
Physical Therapy Clinic – Workers’ Compensation Fund
The Physical Therapy Clinic falls under the Workers’ Compensation section. The Physical Therapy Clinic provides services to both City and Colorado Springs Utilities employees with work related injuries. The Physical Therapy Clinic has two therapists with multiple certifications including manual physical therapy, dry needling, massage therapy and functional movement screening. This clinic is located in the City Administration Building which makes it convenient for most City and Utilities employees. By comparing the services with the Colorado fee schedule, a cost savings of $181,048.26 was realized in 2014 to the Workers’ Compensation Fund. City enterprises and Support Service Funds that use Physical Therapy Clinic services for Workers’ Compensation related injuries pay an allocated charge for those services. Colorado Springs Utilities is billed directly for physical therapy services.
Occupational Health Clinic – Workers’ Compensation Fund
The clinic’s primary function is to provide services at the clinic for work related injuries and is funded by the Workers’ Compensation Fund. This function provides over $125,000 in annual cost savings to the fund when comparing the services provided with the Colorado Workers’ Compensation fee schedule. City enterprises and Support Service Funds that use Occupational Health Clinic services for Workers’ Compensation related injuries pay an allocated charge for those services.
Occupational Health Clinic – General Fund
The City owns and operates an Occupational Health Clinic. In addition to the primary service, the Clinic performs ergonomic assessments, annual physicals, CDL physicals, VNI entry and exit physicals, pre-employment physicals for sworn employees, and hearing tests for employees who work in areas with noise pollution. The Clinic began doing all pre-employment drug screenings in the fall of 2010. Located in the City Administration Building, the clinic is convenient for the majority of City employees. City enterprises and Support Service Funds that use these types of Occupational Health Clinic services pay an allocated charge for Occupational Health Clinic services. Non-General Fund users are direct billed for drug tests.
Manager1.00
Occupational Health2.25
Risk Management4.00
Claims Reserve2.50
Workers' Compensation8.25
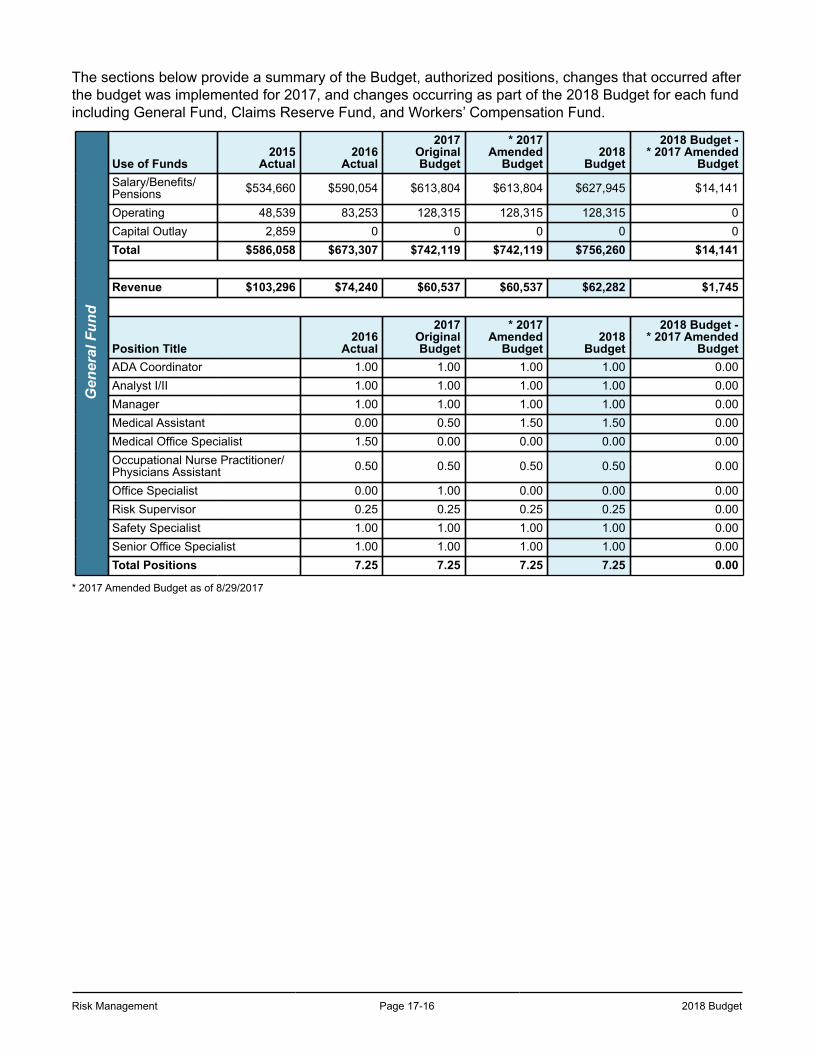
Risk Management Page 17-16 2018 Budget
The sections below provide a summary of the Budget, authorized positions, changes that occurred after the budget was implemented for 2017, and changes occurring as part of the 2018 Budget for each fund including General Fund, Claims Reserve Fund, and Workers’ Compensation Fund.
Gen
eral
Fun
d
Use of Funds2015
Actual2016
Actual
2017OriginalBudget
* 2017Amended
Budget2018
Budget
2018 Budget -* 2017 Amended
BudgetSalary/Benefits/Pensions $534,660 $590,054 $613,804 $613,804 $627,945 $14,141
Operating 48,539 83,253 128,315 128,315 128,315 0Capital Outlay 2,859 0 0 0 0 0Total $586,058 $673,307 $742,119 $742,119 $756,260 $14,141
Revenue $103,296 $74,240 $60,537 $60,537 $62,282 $1,745
Position Title2016
Actual
2017OriginalBudget
* 2017Amended
Budget2018
Budget
2018 Budget -* 2017 Amended
BudgetADA Coordinator 1.00 1.00 1.00 1.00 0.00Analyst I/II 1.00 1.00 1.00 1.00 0.00Manager 1.00 1.00 1.00 1.00 0.00Medical Assistant 0.00 0.50 1.50 1.50 0.00Medical Office Specialist 1.50 0.00 0.00 0.00 0.00Occupational Nurse Practitioner/Physicians Assistant 0.50 0.50 0.50 0.50 0.00
Office Specialist 0.00 1.00 0.00 0.00 0.00Risk Supervisor 0.25 0.25 0.25 0.25 0.00Safety Specialist 1.00 1.00 1.00 1.00 0.00Senior Office Specialist 1.00 1.00 1.00 1.00 0.00Total Positions 7.25 7.25 7.25 7.25 0.00
* 2017 Amended Budget as of 8/29/2017
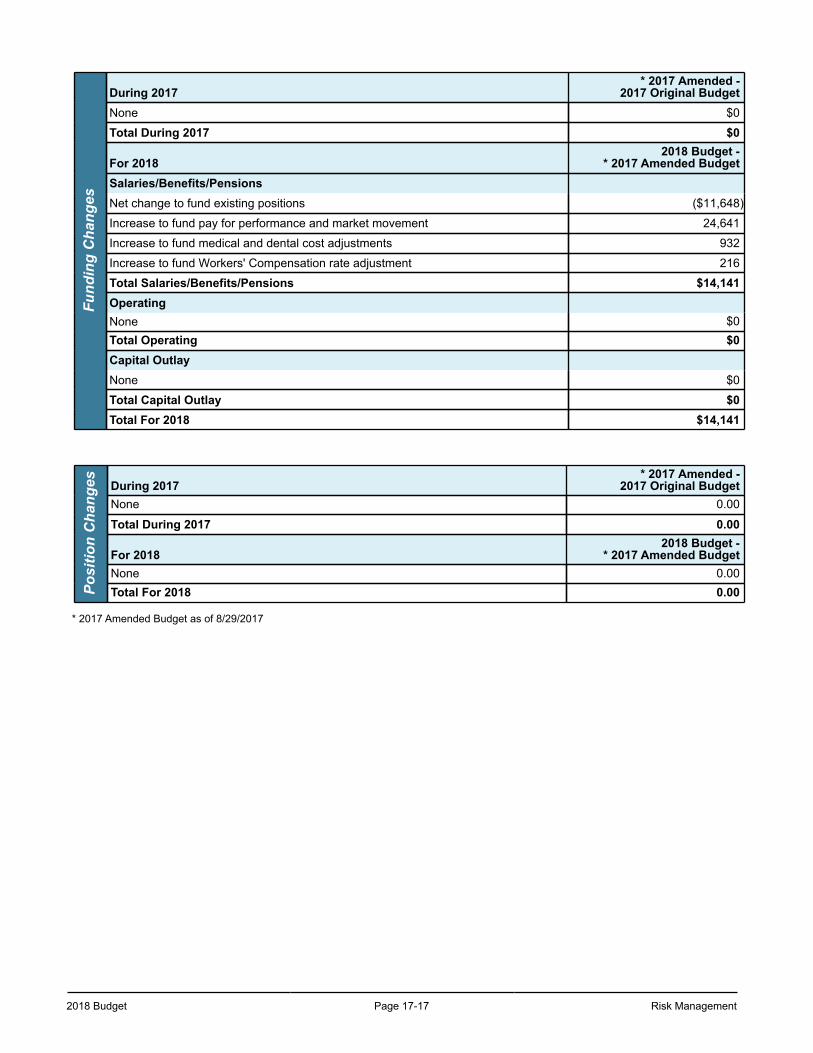
2018 Budget Page 17-17 Risk Management
Fund
ing
Cha
nges
During 2017* 2017 Amended -
2017 Original BudgetNone $0
Total During 2017 $0
For 20182018 Budget -
* 2017 Amended BudgetSalaries/Benefits/PensionsNet change to fund existing positions ($11,648)
Increase to fund pay for performance and market movement 24,641
Increase to fund medical and dental cost adjustments 932
Increase to fund Workers' Compensation rate adjustment 216
Total Salaries/Benefits/Pensions $14,141OperatingNone $0Total Operating $0Capital OutlayNone $0
Total Capital Outlay $0Total For 2018 $14,141
Posi
tion
Cha
nges During 2017
* 2017 Amended -2017 Original Budget
None 0.00
Total During 2017 0.00
For 20182018 Budget -
* 2017 Amended BudgetNone 0.00Total For 2018 0.00
* 2017 Amended Budget as of 8/29/2017
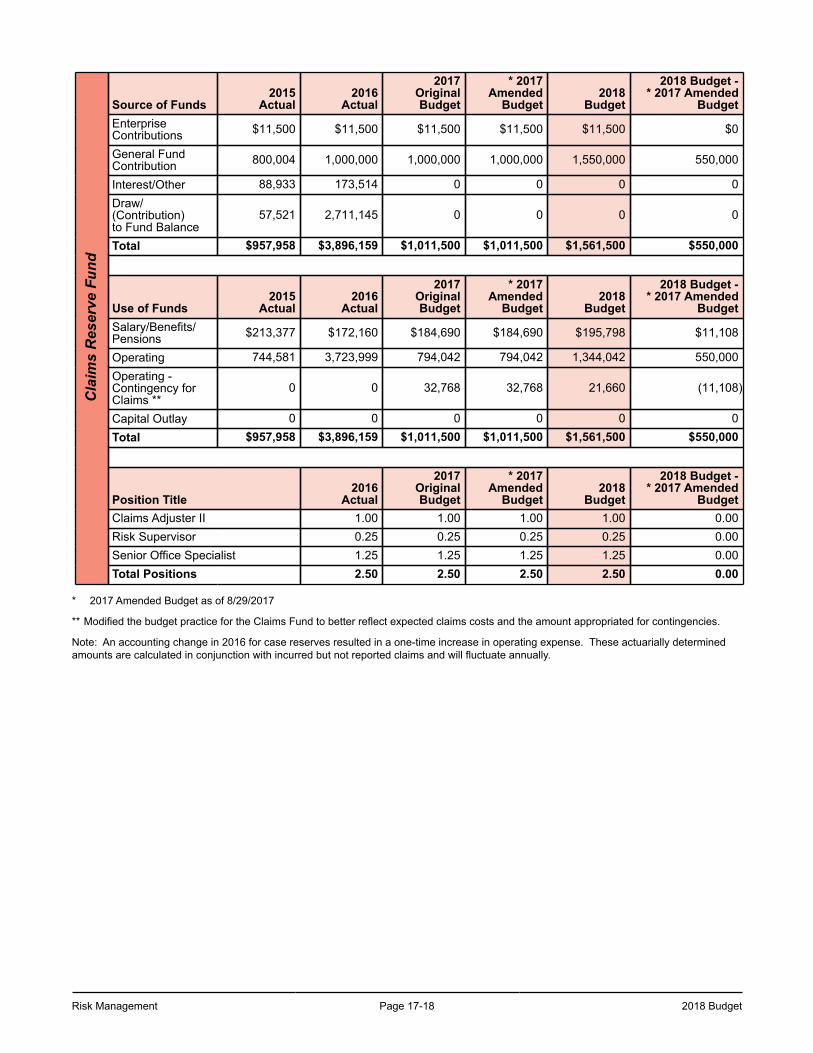
Risk Management Page 17-18 2018 Budget
Cla
ims
Res
erve
Fun
dSource of Funds
2015Actual
2016Actual
2017OriginalBudget
* 2017Amended
Budget2018
Budget
2018 Budget -* 2017 Amended
BudgetEnterpriseContributions $11,500 $11,500 $11,500 $11,500 $11,500 $0
General FundContribution 800,004 1,000,000 1,000,000 1,000,000 1,550,000 550,000
Interest/Other 88,933 173,514 0 0 0 0Draw/(Contribution)to Fund Balance
57,521 2,711,145 0 0 0 0
Total $957,958 $3,896,159 $1,011,500 $1,011,500 $1,561,500 $550,000
Use of Funds2015
Actual2016
Actual
2017OriginalBudget
* 2017Amended
Budget2018
Budget
2018 Budget -* 2017 Amended
BudgetSalary/Benefits/Pensions $213,377 $172,160 $184,690 $184,690 $195,798 $11,108
Operating 744,581 3,723,999 794,042 794,042 1,344,042 550,000Operating -Contingency forClaims **
0 0 32,768 32,768 21,660 (11,108)
Capital Outlay 0 0 0 0 0 0Total $957,958 $3,896,159 $1,011,500 $1,011,500 $1,561,500 $550,000
Position Title2016
Actual
2017OriginalBudget
* 2017Amended
Budget2018
Budget
2018 Budget -* 2017 Amended
BudgetClaims Adjuster II 1.00 1.00 1.00 1.00 0.00Risk Supervisor 0.25 0.25 0.25 0.25 0.00Senior Office Specialist 1.25 1.25 1.25 1.25 0.00Total Positions 2.50 2.50 2.50 2.50 0.00
* 2017 Amended Budget as of 8/29/2017
** Modified the budget practice for the Claims Fund to better reflect expected claims costs and the amount appropriated for contingencies.
Note: An accounting change in 2016 for case reserves resulted in a one-time increase in operating expense. These actuarially determined amounts are calculated in conjunction with incurred but not reported claims and will fluctuate annually.
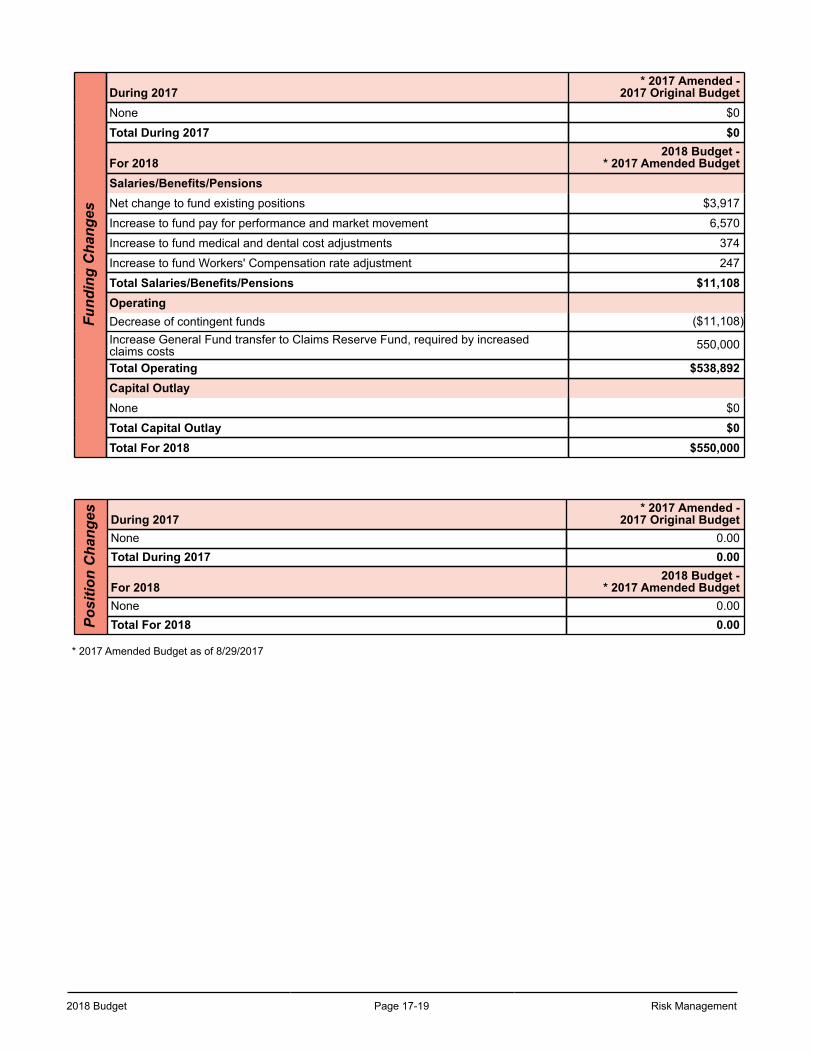
2018 Budget Page 17-19 Risk Management
Fund
ing
Cha
nges
During 2017* 2017 Amended -
2017 Original BudgetNone $0
Total During 2017 $0
For 20182018 Budget -
* 2017 Amended BudgetSalaries/Benefits/PensionsNet change to fund existing positions $3,917
Increase to fund pay for performance and market movement 6,570
Increase to fund medical and dental cost adjustments 374
Increase to fund Workers' Compensation rate adjustment 247
Total Salaries/Benefits/Pensions $11,108OperatingDecrease of contingent funds ($11,108)Increase General Fund transfer to Claims Reserve Fund, required by increasedclaims costs 550,000
Total Operating $538,892Capital OutlayNone $0
Total Capital Outlay $0Total For 2018 $550,000
Posi
tion
Cha
nges During 2017
* 2017 Amended -2017 Original Budget
None 0.00Total During 2017 0.00
For 20182018 Budget -
* 2017 Amended BudgetNone 0.00Total For 2018 0.00
* 2017 Amended Budget as of 8/29/2017
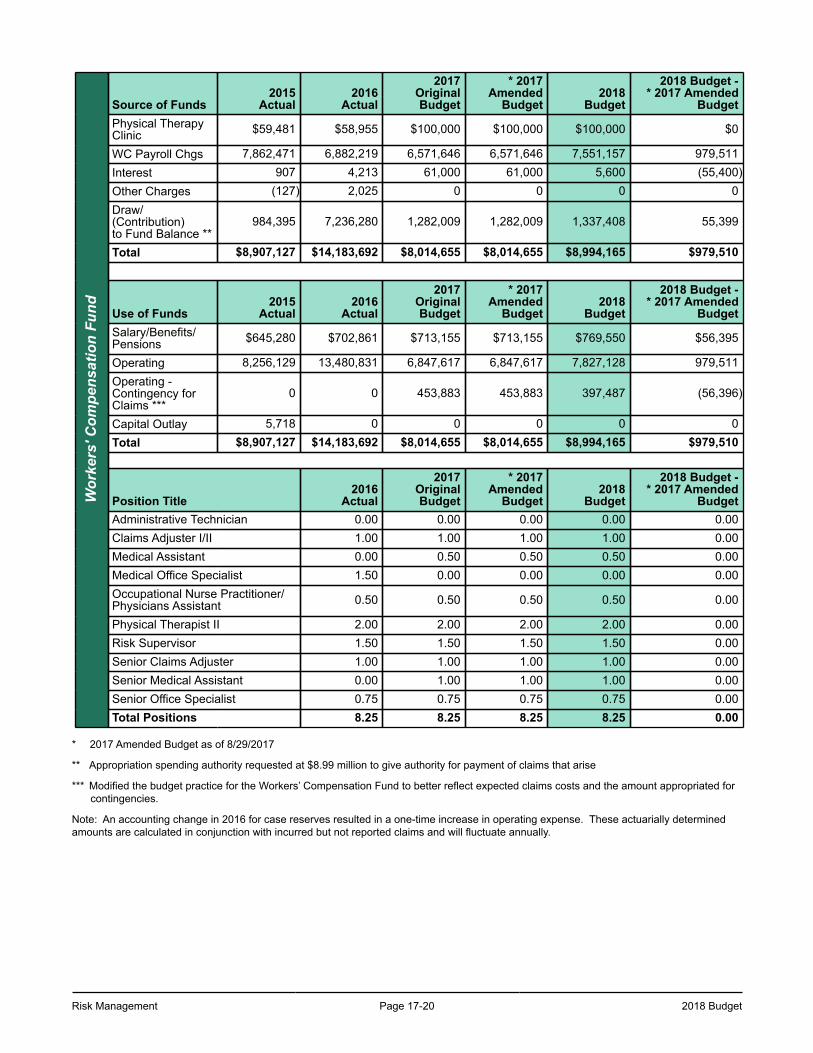
Risk Management Page 17-20 2018 Budget
Wor
kers
' Com
pens
atio
n Fu
ndSource of Funds
2015Actual
2016Actual
2017OriginalBudget
* 2017Amended
Budget2018
Budget
2018 Budget -* 2017 Amended
BudgetPhysical TherapyClinic $59,481 $58,955 $100,000 $100,000 $100,000 $0
WC Payroll Chgs 7,862,471 6,882,219 6,571,646 6,571,646 7,551,157 979,511Interest 907 4,213 61,000 61,000 5,600 (55,400)Other Charges (127) 2,025 0 0 0 0Draw/(Contribution)to Fund Balance **
984,395 7,236,280 1,282,009 1,282,009 1,337,408 55,399
Total $8,907,127 $14,183,692 $8,014,655 $8,014,655 $8,994,165 $979,510
Use of Funds2015
Actual2016
Actual
2017OriginalBudget
* 2017Amended
Budget2018
Budget
2018 Budget -* 2017 Amended
BudgetSalary/Benefits/Pensions $645,280 $702,861 $713,155 $713,155 $769,550 $56,395
Operating 8,256,129 13,480,831 6,847,617 6,847,617 7,827,128 979,511Operating -Contingency forClaims ***
0 0 453,883 453,883 397,487 (56,396)
Capital Outlay 5,718 0 0 0 0 0Total $8,907,127 $14,183,692 $8,014,655 $8,014,655 $8,994,165 $979,510
Position Title2016
Actual
2017OriginalBudget
* 2017Amended
Budget2018
Budget
2018 Budget -* 2017 Amended
BudgetAdministrative Technician 0.00 0.00 0.00 0.00 0.00Claims Adjuster I/II 1.00 1.00 1.00 1.00 0.00Medical Assistant 0.00 0.50 0.50 0.50 0.00Medical Office Specialist 1.50 0.00 0.00 0.00 0.00Occupational Nurse Practitioner/Physicians Assistant 0.50 0.50 0.50 0.50 0.00
Physical Therapist II 2.00 2.00 2.00 2.00 0.00Risk Supervisor 1.50 1.50 1.50 1.50 0.00Senior Claims Adjuster 1.00 1.00 1.00 1.00 0.00Senior Medical Assistant 0.00 1.00 1.00 1.00 0.00Senior Office Specialist 0.75 0.75 0.75 0.75 0.00Total Positions 8.25 8.25 8.25 8.25 0.00
* 2017 Amended Budget as of 8/29/2017
** Appropriation spending authority requested at $8.99 million to give authority for payment of claims that arise
*** Modified the budget practice for the Workers’ Compensation Fund to better reflect expected claims costs and the amount appropriated for contingencies.
Note: An accounting change in 2016 for case reserves resulted in a one-time increase in operating expense. These actuarially determined amounts are calculated in conjunction with incurred but not reported claims and will fluctuate annually.
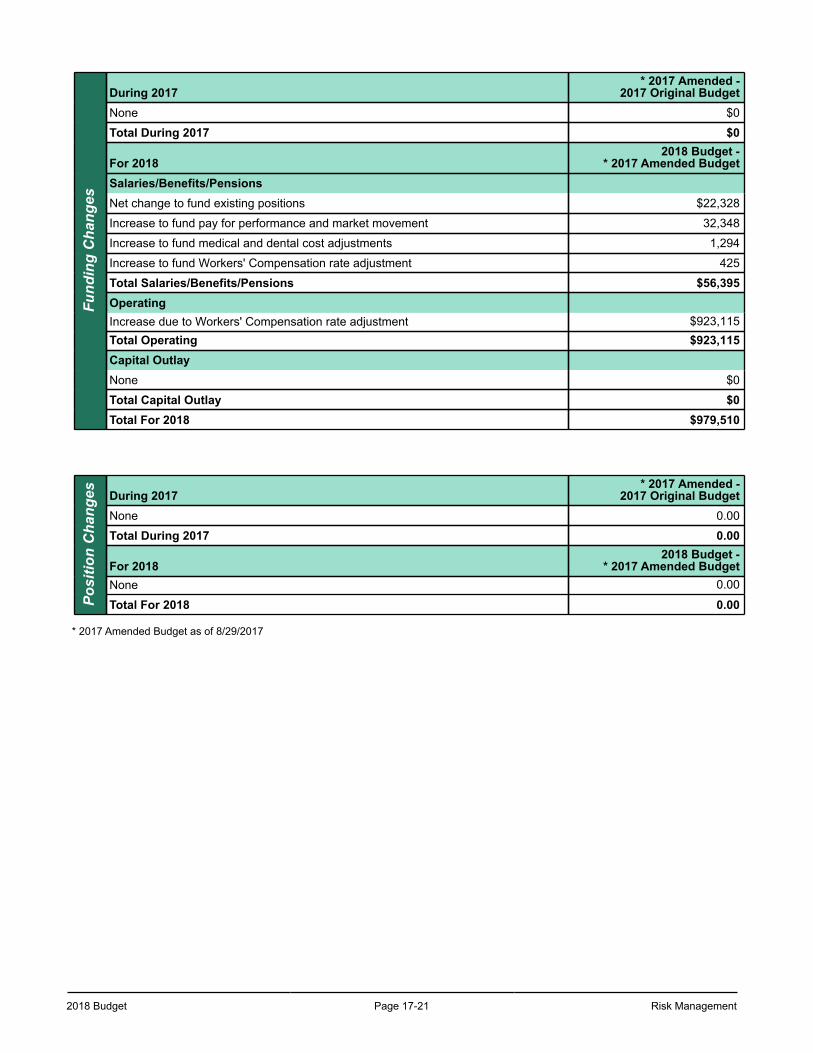
2018 Budget Page 17-21 Risk Management
Fund
ing
Cha
nges
During 2017* 2017 Amended -
2017 Original BudgetNone $0
Total During 2017 $0
For 20182018 Budget -
* 2017 Amended BudgetSalaries/Benefits/PensionsNet change to fund existing positions $22,328
Increase to fund pay for performance and market movement 32,348
Increase to fund medical and dental cost adjustments 1,294
Increase to fund Workers' Compensation rate adjustment 425
Total Salaries/Benefits/Pensions $56,395OperatingIncrease due to Workers' Compensation rate adjustment $923,115Total Operating $923,115Capital OutlayNone $0
Total Capital Outlay $0Total For 2018 $979,510
Posi
tion
Cha
nges During 2017
* 2017 Amended -2017 Original Budget
None 0.00
Total During 2017 0.00
For 20182018 Budget -
* 2017 Amended BudgetNone 0.00
Total For 2018 0.00
* 2017 Amended Budget as of 8/29/2017
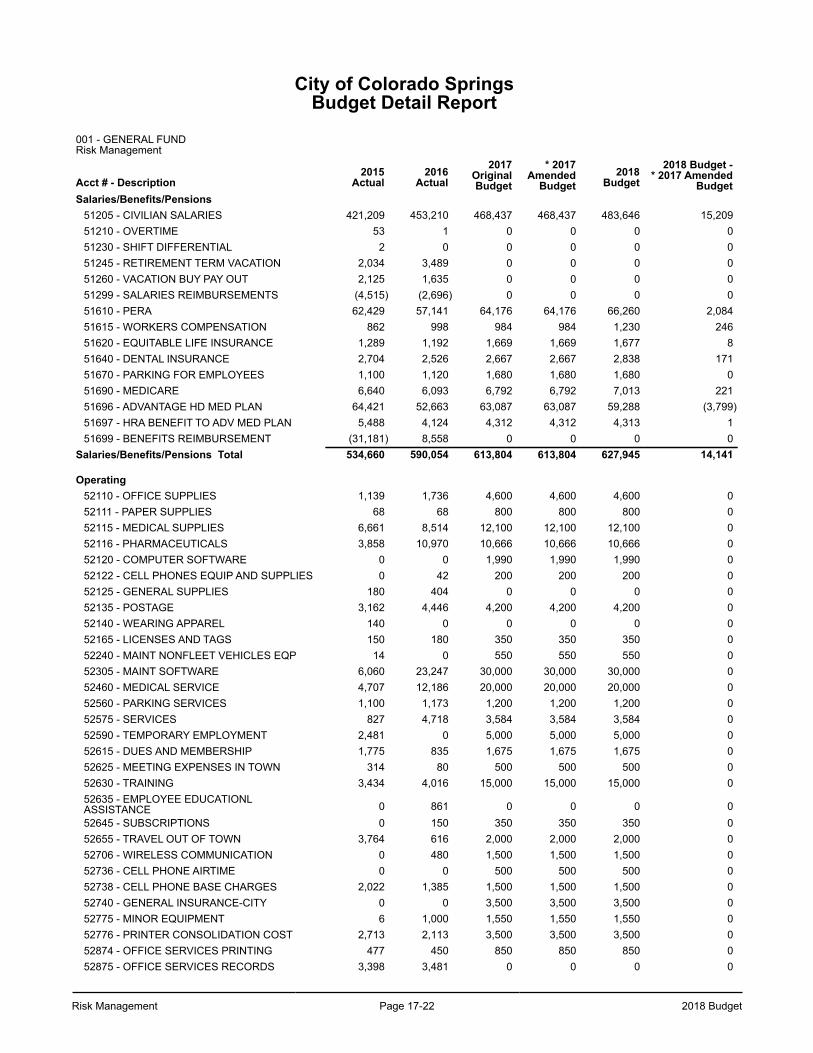
Risk Management Page 17-22 2018 Budget
City of Colorado SpringsBudget Detail Report
001 - GENERAL FUND Risk Management
Acct # - Description2015
Actual2016
Actual2017
OriginalBudget
* 2017Amended
Budget2018
Budget2018 Budget -
* 2017 AmendedBudget
Salaries/Benefits/Pensions51205 - CIVILIAN SALARIES 421,209 453,210 468,437 468,437 483,646 15,20951210 - OVERTIME 53 1 0 0 0 051230 - SHIFT DIFFERENTIAL 2 0 0 0 0 051245 - RETIREMENT TERM VACATION 2,034 3,489 0 0 0 051260 - VACATION BUY PAY OUT 2,125 1,635 0 0 0 051299 - SALARIES REIMBURSEMENTS (4,515) (2,696) 0 0 0 051610 - PERA 62,429 57,141 64,176 64,176 66,260 2,08451615 - WORKERS COMPENSATION 862 998 984 984 1,230 24651620 - EQUITABLE LIFE INSURANCE 1,289 1,192 1,669 1,669 1,677 851640 - DENTAL INSURANCE 2,704 2,526 2,667 2,667 2,838 17151670 - PARKING FOR EMPLOYEES 1,100 1,120 1,680 1,680 1,680 051690 - MEDICARE 6,640 6,093 6,792 6,792 7,013 22151696 - ADVANTAGE HD MED PLAN 64,421 52,663 63,087 63,087 59,288 (3,799)51697 - HRA BENEFIT TO ADV MED PLAN 5,488 4,124 4,312 4,312 4,313 151699 - BENEFITS REIMBURSEMENT (31,181) 8,558 0 0 0 0
Salaries/Benefits/Pensions Total 534,660 590,054 613,804 613,804 627,945 14,141
Operating52110 - OFFICE SUPPLIES 1,139 1,736 4,600 4,600 4,600 052111 - PAPER SUPPLIES 68 68 800 800 800 052115 - MEDICAL SUPPLIES 6,661 8,514 12,100 12,100 12,100 052116 - PHARMACEUTICALS 3,858 10,970 10,666 10,666 10,666 052120 - COMPUTER SOFTWARE 0 0 1,990 1,990 1,990 052122 - CELL PHONES EQUIP AND SUPPLIES 0 42 200 200 200 052125 - GENERAL SUPPLIES 180 404 0 0 0 052135 - POSTAGE 3,162 4,446 4,200 4,200 4,200 052140 - WEARING APPAREL 140 0 0 0 0 052165 - LICENSES AND TAGS 150 180 350 350 350 052240 - MAINT NONFLEET VEHICLES EQP 14 0 550 550 550 052305 - MAINT SOFTWARE 6,060 23,247 30,000 30,000 30,000 052460 - MEDICAL SERVICE 4,707 12,186 20,000 20,000 20,000 052560 - PARKING SERVICES 1,100 1,173 1,200 1,200 1,200 052575 - SERVICES 827 4,718 3,584 3,584 3,584 052590 - TEMPORARY EMPLOYMENT 2,481 0 5,000 5,000 5,000 052615 - DUES AND MEMBERSHIP 1,775 835 1,675 1,675 1,675 052625 - MEETING EXPENSES IN TOWN 314 80 500 500 500 052630 - TRAINING 3,434 4,016 15,000 15,000 15,000 052635 - EMPLOYEE EDUCATIONLASSISTANCE 0 861 0 0 0 052645 - SUBSCRIPTIONS 0 150 350 350 350 052655 - TRAVEL OUT OF TOWN 3,764 616 2,000 2,000 2,000 052706 - WIRELESS COMMUNICATION 0 480 1,500 1,500 1,500 052736 - CELL PHONE AIRTIME 0 0 500 500 500 052738 - CELL PHONE BASE CHARGES 2,022 1,385 1,500 1,500 1,500 052740 - GENERAL INSURANCE-CITY 0 0 3,500 3,500 3,500 052775 - MINOR EQUIPMENT 6 1,000 1,550 1,550 1,550 052776 - PRINTER CONSOLIDATION COST 2,713 2,113 3,500 3,500 3,500 052874 - OFFICE SERVICES PRINTING 477 450 850 850 850 052875 - OFFICE SERVICES RECORDS 3,398 3,481 0 0 0 0
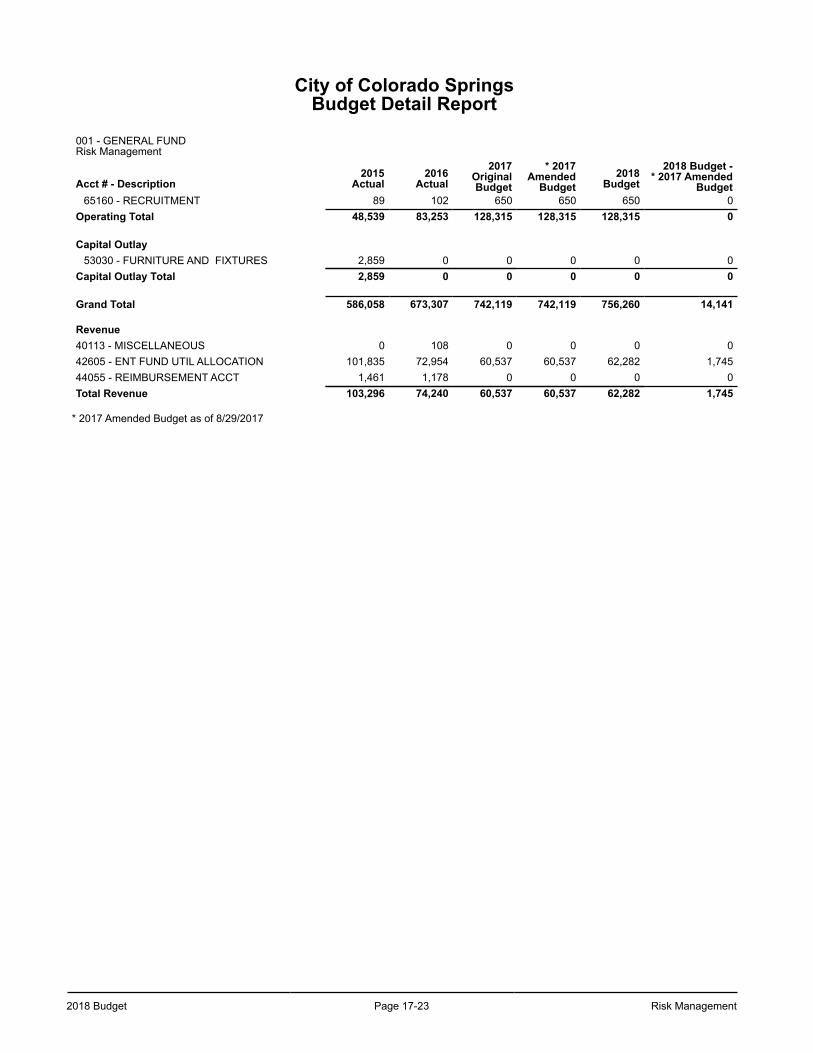
2018 Budget Page 17-23 Risk Management
City of Colorado SpringsBudget Detail Report
001 - GENERAL FUND Risk Management
Acct # - Description2015
Actual2016
Actual2017
OriginalBudget
* 2017Amended
Budget2018
Budget2018 Budget -
* 2017 AmendedBudget
65160 - RECRUITMENT 89 102 650 650 650 0Operating Total 48,539 83,253 128,315 128,315 128,315 0
Capital Outlay53030 - FURNITURE AND FIXTURES 2,859 0 0 0 0 0
Capital Outlay Total 2,859 0 0 0 0 0
Grand Total 586,058 673,307 742,119 742,119 756,260 14,141
Revenue40113 - MISCELLANEOUS 0 108 0 0 0 042605 - ENT FUND UTIL ALLOCATION 101,835 72,954 60,537 60,537 62,282 1,74544055 - REIMBURSEMENT ACCT 1,461 1,178 0 0 0 0Total Revenue 103,296 74,240 60,537 60,537 62,282 1,745
* 2017 Amended Budget as of 8/29/2017
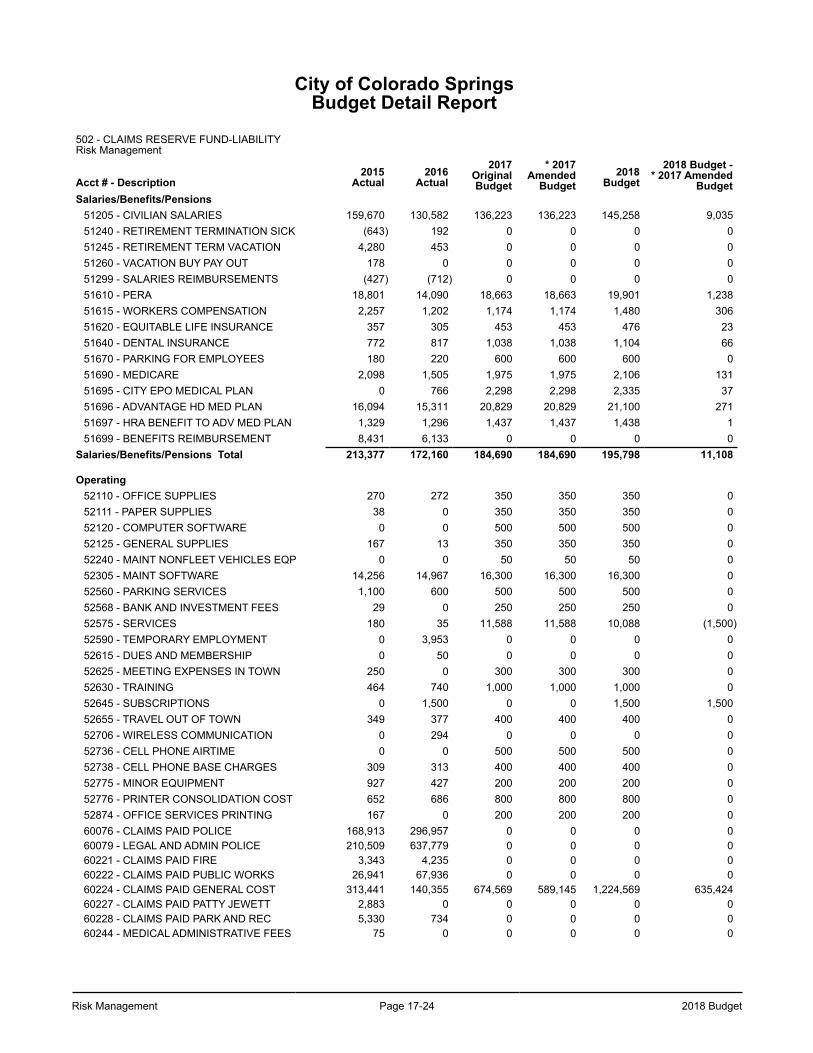
Risk Management Page 17-24 2018 Budget
City of Colorado SpringsBudget Detail Report
502 - CLAIMS RESERVE FUND-LIABILITYRisk Management
Acct # - Description2015
Actual2016
Actual2017
OriginalBudget
* 2017Amended
Budget2018
Budget2018 Budget -
* 2017 AmendedBudget
Salaries/Benefits/Pensions51205 - CIVILIAN SALARIES 159,670 130,582 136,223 136,223 145,258 9,03551240 - RETIREMENT TERMINATION SICK (643) 192 0 0 0 051245 - RETIREMENT TERM VACATION 4,280 453 0 0 0 051260 - VACATION BUY PAY OUT 178 0 0 0 0 051299 - SALARIES REIMBURSEMENTS (427) (712) 0 0 0 051610 - PERA 18,801 14,090 18,663 18,663 19,901 1,23851615 - WORKERS COMPENSATION 2,257 1,202 1,174 1,174 1,480 30651620 - EQUITABLE LIFE INSURANCE 357 305 453 453 476 2351640 - DENTAL INSURANCE 772 817 1,038 1,038 1,104 6651670 - PARKING FOR EMPLOYEES 180 220 600 600 600 051690 - MEDICARE 2,098 1,505 1,975 1,975 2,106 13151695 - CITY EPO MEDICAL PLAN 0 766 2,298 2,298 2,335 3751696 - ADVANTAGE HD MED PLAN 16,094 15,311 20,829 20,829 21,100 27151697 - HRA BENEFIT TO ADV MED PLAN 1,329 1,296 1,437 1,437 1,438 151699 - BENEFITS REIMBURSEMENT 8,431 6,133 0 0 0 0
Salaries/Benefits/Pensions Total 213,377 172,160 184,690 184,690 195,798 11,108
Operating52110 - OFFICE SUPPLIES 270 272 350 350 350 052111 - PAPER SUPPLIES 38 0 350 350 350 052120 - COMPUTER SOFTWARE 0 0 500 500 500 052125 - GENERAL SUPPLIES 167 13 350 350 350 052240 - MAINT NONFLEET VEHICLES EQP 0 0 50 50 50 052305 - MAINT SOFTWARE 14,256 14,967 16,300 16,300 16,300 052560 - PARKING SERVICES 1,100 600 500 500 500 052568 - BANK AND INVESTMENT FEES 29 0 250 250 250 052575 - SERVICES 180 35 11,588 11,588 10,088 (1,500)52590 - TEMPORARY EMPLOYMENT 0 3,953 0 0 0 052615 - DUES AND MEMBERSHIP 0 50 0 0 0 052625 - MEETING EXPENSES IN TOWN 250 0 300 300 300 052630 - TRAINING 464 740 1,000 1,000 1,000 052645 - SUBSCRIPTIONS 0 1,500 0 0 1,500 1,50052655 - TRAVEL OUT OF TOWN 349 377 400 400 400 052706 - WIRELESS COMMUNICATION 0 294 0 0 0 052736 - CELL PHONE AIRTIME 0 0 500 500 500 052738 - CELL PHONE BASE CHARGES 309 313 400 400 400 052775 - MINOR EQUIPMENT 927 427 200 200 200 052776 - PRINTER CONSOLIDATION COST 652 686 800 800 800 052874 - OFFICE SERVICES PRINTING 167 0 200 200 200 060076 - CLAIMS PAID POLICE 168,913 296,957 0 0 0 060079 - LEGAL AND ADMIN POLICE 210,509 637,779 0 0 0 060221 - CLAIMS PAID FIRE 3,343 4,235 0 0 0 060222 - CLAIMS PAID PUBLIC WORKS 26,941 67,936 0 0 0 060224 - CLAIMS PAID GENERAL COST 313,441 140,355 674,569 589,145 1,224,569 635,42460227 - CLAIMS PAID PATTY JEWETT 2,883 0 0 0 0 060228 - CLAIMS PAID PARK AND REC 5,330 734 0 0 0 060244 - MEDICAL ADMINISTRATIVE FEES 75 0 0 0 0 0
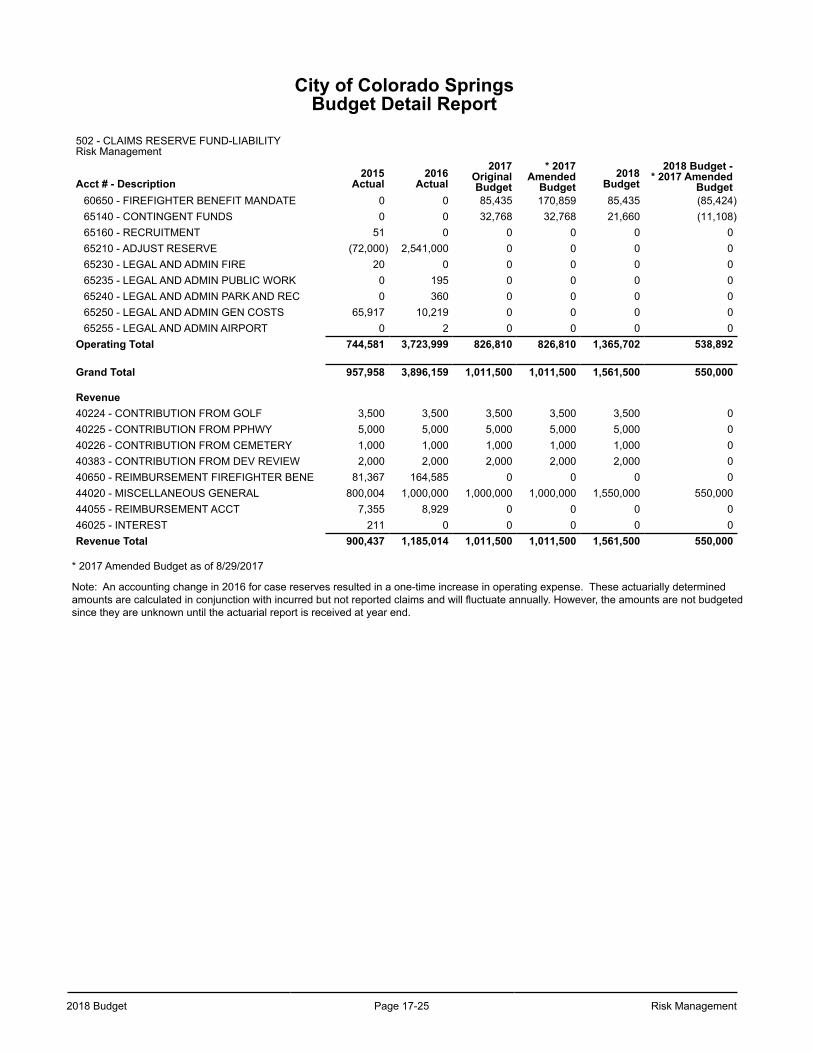
2018 Budget Page 17-25 Risk Management
City of Colorado SpringsBudget Detail Report
502 - CLAIMS RESERVE FUND-LIABILITYRisk Management
Acct # - Description2015
Actual2016
Actual2017
OriginalBudget
* 2017Amended
Budget2018
Budget2018 Budget -
* 2017 AmendedBudget
60650 - FIREFIGHTER BENEFIT MANDATE 0 0 85,435 170,859 85,435 (85,424)65140 - CONTINGENT FUNDS 0 0 32,768 32,768 21,660 (11,108)65160 - RECRUITMENT 51 0 0 0 0 065210 - ADJUST RESERVE (72,000) 2,541,000 0 0 0 065230 - LEGAL AND ADMIN FIRE 20 0 0 0 0 065235 - LEGAL AND ADMIN PUBLIC WORK 0 195 0 0 0 065240 - LEGAL AND ADMIN PARK AND REC 0 360 0 0 0 065250 - LEGAL AND ADMIN GEN COSTS 65,917 10,219 0 0 0 065255 - LEGAL AND ADMIN AIRPORT 0 2 0 0 0 0
Operating Total 744,581 3,723,999 826,810 826,810 1,365,702 538,892
Grand Total 957,958 3,896,159 1,011,500 1,011,500 1,561,500 550,000
Revenue40224 - CONTRIBUTION FROM GOLF 3,500 3,500 3,500 3,500 3,500 040225 - CONTRIBUTION FROM PPHWY 5,000 5,000 5,000 5,000 5,000 040226 - CONTRIBUTION FROM CEMETERY 1,000 1,000 1,000 1,000 1,000 040383 - CONTRIBUTION FROM DEV REVIEW 2,000 2,000 2,000 2,000 2,000 040650 - REIMBURSEMENT FIREFIGHTER BENE 81,367 164,585 0 0 0 044020 - MISCELLANEOUS GENERAL 800,004 1,000,000 1,000,000 1,000,000 1,550,000 550,00044055 - REIMBURSEMENT ACCT 7,355 8,929 0 0 0 046025 - INTEREST 211 0 0 0 0 0Revenue Total 900,437 1,185,014 1,011,500 1,011,500 1,561,500 550,000
* 2017 Amended Budget as of 8/29/2017
Note: An accounting change in 2016 for case reserves resulted in a one-time increase in operating expense. These actuarially determined amounts are calculated in conjunction with incurred but not reported claims and will fluctuate annually. However, the amounts are not budgeted since they are unknown until the actuarial report is received at year end.

Risk Management Page 17-26 2018 Budget
City of Colorado SpringsBudget Detail Report
503 - SELF INSURANCE-WORK COMPRisk Management
Acct # - Description2015
Actual2016
Actual2017
OriginalBudget
* 2017Amended
Budget2018
Budget2018 Budget -
* 2017 AmendedBudget
Salaries/Benefits/Pensions51205 - CIVILIAN SALARIES 478,348 526,642 531,001 531,001 582,215 51,21451210 - OVERTIME 129 0 0 0 0 051240 - RETIREMENT TERMINATION SICK (4,435) 688 0 0 0 051245 - RETIREMENT TERM VACATION 4,738 3,997 0 0 0 051260 - VACATION BUY PAY OUT 2,089 4,886 0 0 0 051299 - SALARIES REIMBURSEMENTS (1,258) (7,116) 0 0 0 051610 - PERA 63,431 74,326 72,748 72,748 79,764 7,01651615 - WORKERS COMPENSATION 1,113 2,032 1,956 1,956 2,511 55551620 - EQUITABLE LIFE INSURANCE 1,311 1,609 1,852 1,852 1,984 13251640 - DENTAL INSURANCE 3,015 3,369 3,111 3,111 3,310 19951670 - PARKING FOR EMPLOYEES 1,280 1,420 2,280 2,280 2,280 051690 - MEDICARE 6,748 7,921 7,700 7,700 8,442 74251695 - CITY EPO MEDICAL PLAN 5,078 8,464 6,894 6,894 7,004 11051696 - ADVANTAGE HD MED PLAN 60,735 83,709 80,364 80,364 76,789 (3,575)51697 - HRA BENEFIT TO ADV MED PLAN 4,733 5,605 5,249 5,249 5,251 251699 - BENEFITS REIMBURSEMENT 18,225 (14,691) 0 0 0 0
Salaries/Benefits/Pensions Total 645,280 702,861 713,155 713,155 769,550 56,395
Operating52110 - OFFICE SUPPLIES 3,901 3,363 3,850 3,850 3,850 052111 - PAPER SUPPLIES 709 1,132 750 750 750 052115 - MEDICAL SUPPLIES 12,757 15,130 18,000 18,000 18,000 052116 - PHARMACEUTICALS 2,621 1,352 3,250 3,250 3,250 052122 - CELL PHONES EQUIP AND SUPPLIES 72 0 0 0 0 052125 - GENERAL SUPPLIES 275 121 0 0 0 052135 - POSTAGE 193 116 325 325 325 052165 - LICENSES AND TAGS 0 0 100 100 100 052305 - MAINT SOFTWARE 36,315 22,673 42,000 42,000 42,000 052428 - HOSTED IT SERVICES 9,105 9,225 9,100 9,100 9,100 052460 - MEDICAL SERVICE 42,861 35,855 77,400 77,400 77,400 052560 - PARKING SERVICES 680 2,824 4,400 4,400 4,400 052568 - BANK AND INVESTMENT FEES 70 312 1,000 1,000 1,000 052575 - SERVICES 225,616 185,505 260,620 260,620 260,620 052590 - TEMPORARY EMPLOYMENT 0 0 1,500 1,500 1,500 052615 - DUES AND MEMBERSHIP 735 1,435 1,850 1,850 1,850 052625 - MEETING EXPENSES IN TOWN 290 0 100 100 100 052630 - TRAINING 5,990 1,762 5,350 5,350 5,350 052635 - EMPLOYEE EDUCATIONLASSISTANCE 0 861 2,000 2,000 2,000 0
52645 - SUBSCRIPTIONS 150 152 200 200 200 052655 - TRAVEL OUT OF TOWN 1,197 993 3,606 3,606 3,606 052705 - COMMUNICATIONS 3,827 3,663 4,000 4,000 4,000 052735 - TELEPHONE LONG DIST CALLS 119 106 0 0 0 052738 - CELL PHONE BASE CHARGES 1,551 1,028 1,550 1,550 1,550 052740 - GENERAL INSURANCE-CITY 241,744 242,001 256,516 256,516 256,516 052775 - MINOR EQUIPMENT 1,995 9,561 2,700 2,700 2,700 052776 - PRINTER CONSOLIDATION COST 8,251 6,760 8,600 8,600 8,600 052872 - MAINT FLEET VEHICLES EQP 1,661 877 750 750 750 052874 - OFFICE SERVICES PRINTING 585 694 1,100 1,100 1,100 0
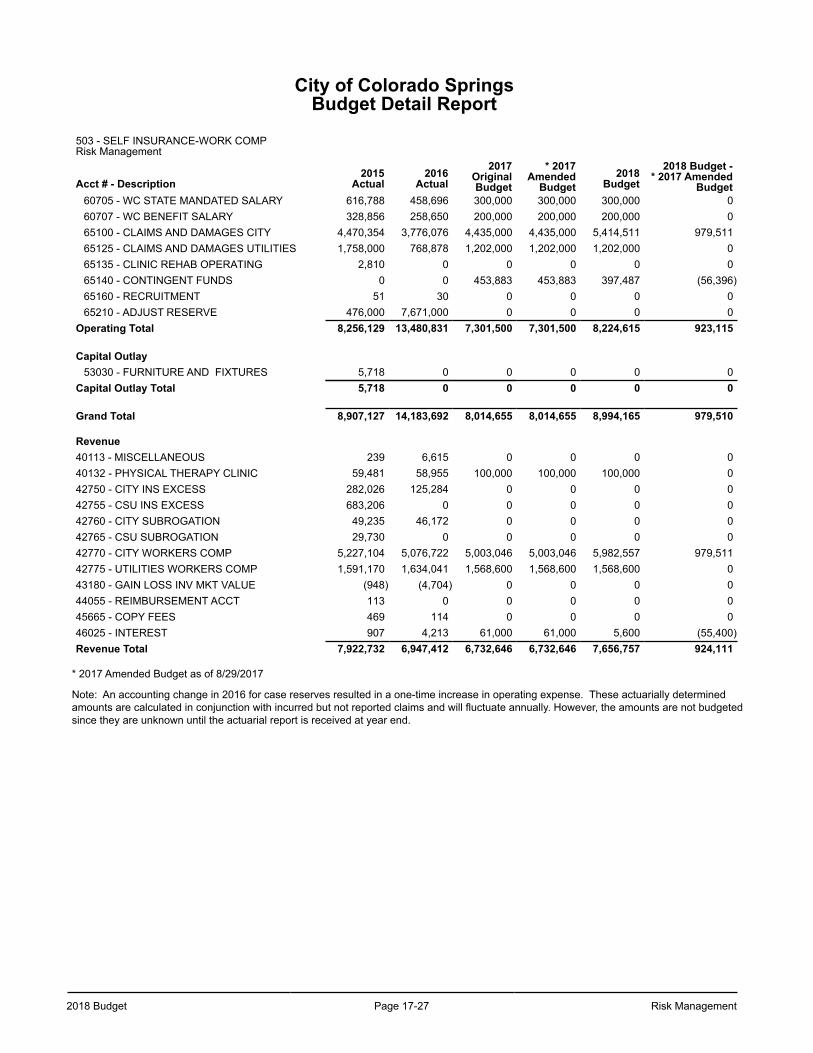
2018 Budget Page 17-27 Risk Management
City of Colorado SpringsBudget Detail Report
503 - SELF INSURANCE-WORK COMPRisk Management
Acct # - Description2015
Actual2016
Actual2017
OriginalBudget
* 2017Amended
Budget2018
Budget2018 Budget -
* 2017 AmendedBudget
60705 - WC STATE MANDATED SALARY 616,788 458,696 300,000 300,000 300,000 060707 - WC BENEFIT SALARY 328,856 258,650 200,000 200,000 200,000 065100 - CLAIMS AND DAMAGES CITY 4,470,354 3,776,076 4,435,000 4,435,000 5,414,511 979,51165125 - CLAIMS AND DAMAGES UTILITIES 1,758,000 768,878 1,202,000 1,202,000 1,202,000 065135 - CLINIC REHAB OPERATING 2,810 0 0 0 0 065140 - CONTINGENT FUNDS 0 0 453,883 453,883 397,487 (56,396)65160 - RECRUITMENT 51 30 0 0 0 065210 - ADJUST RESERVE 476,000 7,671,000 0 0 0 0
Operating Total 8,256,129 13,480,831 7,301,500 7,301,500 8,224,615 923,115
Capital Outlay53030 - FURNITURE AND FIXTURES 5,718 0 0 0 0 0
Capital Outlay Total 5,718 0 0 0 0 0
Grand Total 8,907,127 14,183,692 8,014,655 8,014,655 8,994,165 979,510
Revenue40113 - MISCELLANEOUS 239 6,615 0 0 0 040132 - PHYSICAL THERAPY CLINIC 59,481 58,955 100,000 100,000 100,000 042750 - CITY INS EXCESS 282,026 125,284 0 0 0 042755 - CSU INS EXCESS 683,206 0 0 0 0 042760 - CITY SUBROGATION 49,235 46,172 0 0 0 042765 - CSU SUBROGATION 29,730 0 0 0 0 042770 - CITY WORKERS COMP 5,227,104 5,076,722 5,003,046 5,003,046 5,982,557 979,51142775 - UTILITIES WORKERS COMP 1,591,170 1,634,041 1,568,600 1,568,600 1,568,600 043180 - GAIN LOSS INV MKT VALUE (948) (4,704) 0 0 0 044055 - REIMBURSEMENT ACCT 113 0 0 0 0 045665 - COPY FEES 469 114 0 0 0 046025 - INTEREST 907 4,213 61,000 61,000 5,600 (55,400)Revenue Total 7,922,732 6,947,412 6,732,646 6,732,646 7,656,757 924,111
* 2017 Amended Budget as of 8/29/2017
Note: An accounting change in 2016 for case reserves resulted in a one-time increase in operating expense. These actuarially determined amounts are calculated in conjunction with incurred but not reported claims and will fluctuate annually. However, the amounts are not budgeted since they are unknown until the actuarial report is received at year end.

Risk Management Page 17-28 2018 Budget
This page left blank intentionally.
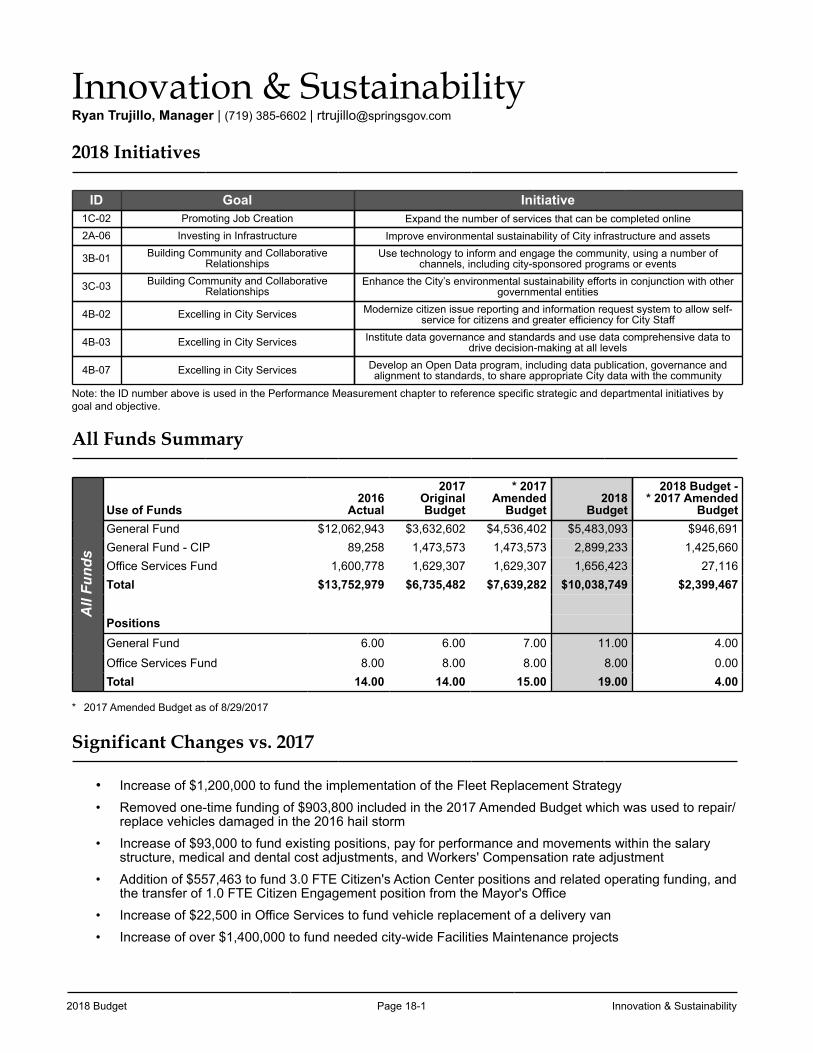
2018 Budget Page 18-1 Innovation & Sustainability
Innovation & SustainabilityRyan Trujillo, Manager | (719) 385-6602 | [email protected]
2018 Initiatives
ID Goal Initiative1C-02 Promoting Job Creation Expand the number of services that can be completed online2A-06 Investing in Infrastructure Improve environmental sustainability of City infrastructure and assets
3B-01 Building Community and CollaborativeRelationships
Use technology to inform and engage the community, using a number ofchannels, including city-sponsored programs or events
3C-03 Building Community and Collaborative Relationships
Enhance the City’s environmental sustainability efforts in conjunction with other governmental entities
4B-02 Excelling in City Services Modernize citizen issue reporting and information request system to allow self-service for citizens and greater efficiency for City Staff
4B-03 Excelling in City Services Institute data governance and standards and use data comprehensive data todrive decision-making at all levels
4B-07 Excelling in City Services Develop an Open Data program, including data publication, governance andalignment to standards, to share appropriate City data with the community
Note: the ID number above is used in the Performance Measurement chapter to reference specific strategic and departmental initiatives by goal and objective.
All Funds Summary
All
Fund
s
Use of Funds2016
Actual
2017OriginalBudget
* 2017Amended
Budget2018
Budget
2018 Budget -* 2017 Amended
BudgetGeneral Fund $12,062,943 $3,632,602 $4,536,402 $5,483,093 $946,691General Fund - CIP 89,258 1,473,573 1,473,573 2,899,233 1,425,660Office Services Fund 1,600,778 1,629,307 1,629,307 1,656,423 27,116Total $13,752,979 $6,735,482 $7,639,282 $10,038,749 $2,399,467
PositionsGeneral Fund 6.00 6.00 7.00 11.00 4.00
Office Services Fund 8.00 8.00 8.00 8.00 0.00Total 14.00 14.00 15.00 19.00 4.00
* 2017 Amended Budget as of 8/29/2017
Significant Changes vs. 2017
• Increase of $1,200,000 to fund the implementation of the Fleet Replacement Strategy• Removed one-time funding of $903,800 included in the 2017 Amended Budget which was used to repair/
replace vehicles damaged in the 2016 hail storm• Increase of $93,000 to fund existing positions, pay for performance and movements within the salary
structure, medical and dental cost adjustments, and Workers' Compensation rate adjustment• Addition of $557,463 to fund 3.0 FTE Citizen's Action Center positions and related operating funding, and
the transfer of 1.0 FTE Citizen Engagement position from the Mayor's Office• Increase of $22,500 in Office Services to fund vehicle replacement of a delivery van• Increase of over $1,400,000 to fund needed city-wide Facilities Maintenance projects
Innovation & Sustainability Page 18-2 2018 Budget
Innovation & SustainabilityThis division was organized in 2018 to include Contract Compliance, Smart Cities & Sustainability, Downtown Facilities Maintenance, Office Services, Strategic Planning & Performance, and Citizen Engagement & Open Data.
Contract Compliance• Provides contract administration and oversight for the City’s internal services contracts (i.e. Serco –
fleet maintenance, Xerox, Verizon, etc.)• Provides contract administration and oversight for the Cable Franchise Agreements• Provides fleet services such as fuel supply/distribution and vehicle acquisition/disposal• Implements and manages process improvement and strategic initiatives
Smart Cities & Sustainability• Oversees development of a Smart Cities plan• Supports implementation of Smart Cities initiatives• Oversees a City cross-departmental Sustainability Team to track and report ongoing sustainability
initiatives, and to develop new sustainability initiatives with significant ROI• Actively involved in regional sustainability efforts
Facilities Maintenance
• Provides contract administration and oversight of the El Paso County intergovernmental agreement• Provides facility maintenance services for downtown administration buildings• Develops 5-year CIP facility maintenance plan and 10-year Facility Needs Master Plan
Citizen Engagement & Open Data• Develops initiatives that make it easier to do business with the City by expanding the number of
services that can be completed online.• Expands and encourages citizen engagement through the use of technology to inform and engage
the community• Works to modernize citizen issue reporting and information request system to allow self-service for
citizens and greater staff efficiency• Develops and maintains an Open Data program to share appropriate City data with the community
Strategic Planning & Performance• Provides oversight and assistance with the Strategic Plan creation, updates, and data collection• Facilitates departmental and community engagement• Tracks and reports Strategic Plan initiatives and provides updates to Executive Leadership and City
Council• Facilitates and develops the City's Organizational Performance Program
Office Services
• Provides reprographics and mail processing support to all City departments and Springs Utilities
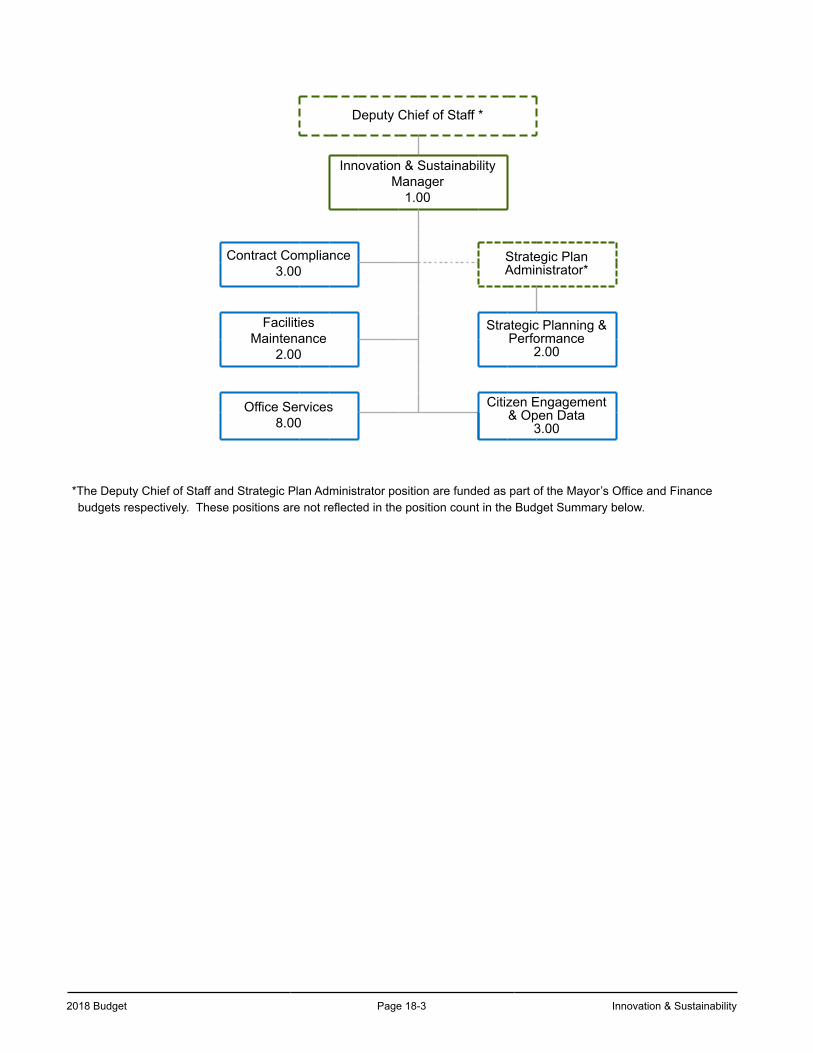
2018 Budget Page 18-3 Innovation & Sustainability
Deputy Chief of Staff *
Innovation & Sustainability Manager
1.00
Contract Compliance3.00
Strategic PlanAdministrator*
Facilities Maintenance
2.00
Strategic Planning & Performance
2.00
Office Services8.00
Citizen Engagement & Open Data
3.00
*The Deputy Chief of Staff and Strategic Plan Administrator position are funded as part of the Mayor’s Office and Finance budgets respectively. These positions are not reflected in the position count in the Budget Summary below.
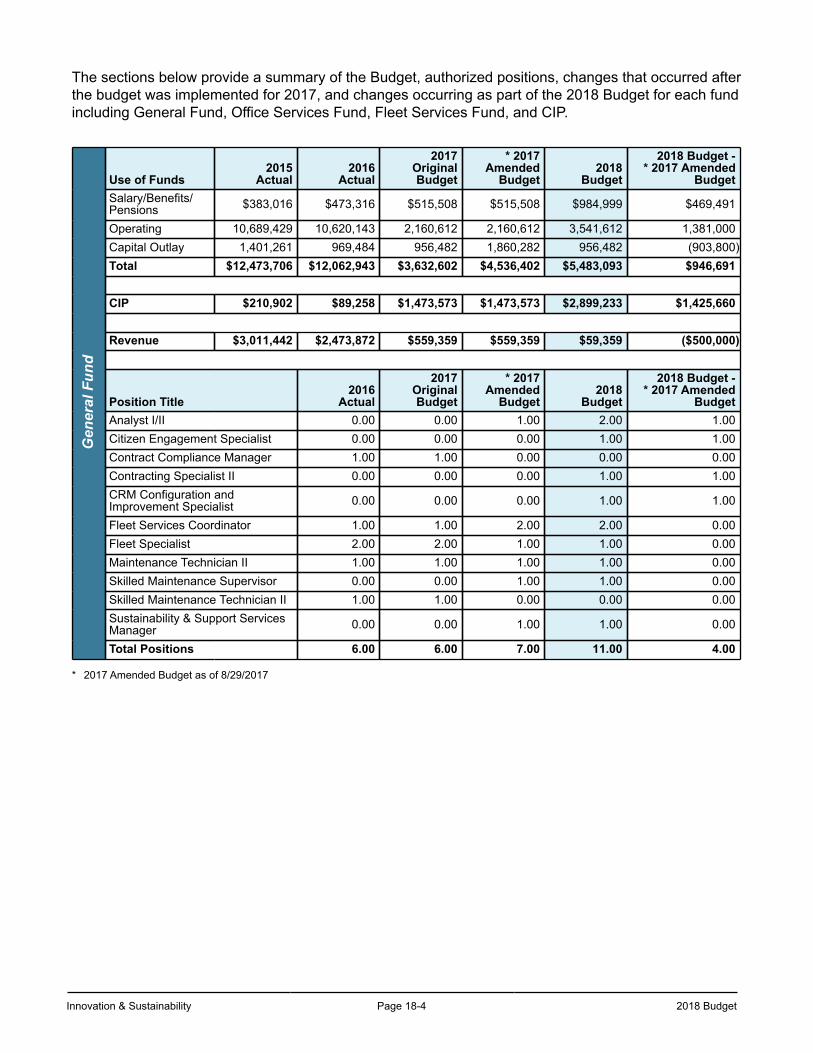
Innovation & Sustainability Page 18-4 2018 Budget
The sections below provide a summary of the Budget, authorized positions, changes that occurred after the budget was implemented for 2017, and changes occurring as part of the 2018 Budget for each fund including General Fund, Office Services Fund, Fleet Services Fund, and CIP.
Gen
eral
Fun
d
Use of Funds2015
Actual2016
Actual
2017OriginalBudget
* 2017Amended
Budget2018
Budget
2018 Budget -* 2017 Amended
BudgetSalary/Benefits/Pensions $383,016 $473,316 $515,508 $515,508 $984,999 $469,491
Operating 10,689,429 10,620,143 2,160,612 2,160,612 3,541,612 1,381,000Capital Outlay 1,401,261 969,484 956,482 1,860,282 956,482 (903,800)Total $12,473,706 $12,062,943 $3,632,602 $4,536,402 $5,483,093 $946,691
CIP $210,902 $89,258 $1,473,573 $1,473,573 $2,899,233 $1,425,660
Revenue $3,011,442 $2,473,872 $559,359 $559,359 $59,359 ($500,000)
Position Title2016
Actual
2017OriginalBudget
* 2017Amended
Budget2018
Budget
2018 Budget -* 2017 Amended
BudgetAnalyst I/II 0.00 0.00 1.00 2.00 1.00Citizen Engagement Specialist 0.00 0.00 0.00 1.00 1.00Contract Compliance Manager 1.00 1.00 0.00 0.00 0.00Contracting Specialist II 0.00 0.00 0.00 1.00 1.00CRM Configuration andImprovement Specialist 0.00 0.00 0.00 1.00 1.00
Fleet Services Coordinator 1.00 1.00 2.00 2.00 0.00Fleet Specialist 2.00 2.00 1.00 1.00 0.00Maintenance Technician II 1.00 1.00 1.00 1.00 0.00Skilled Maintenance Supervisor 0.00 0.00 1.00 1.00 0.00Skilled Maintenance Technician II 1.00 1.00 0.00 0.00 0.00Sustainability & Support ServicesManager 0.00 0.00 1.00 1.00 0.00
Total Positions 6.00 6.00 7.00 11.00 4.00
* 2017 Amended Budget as of 8/29/2017
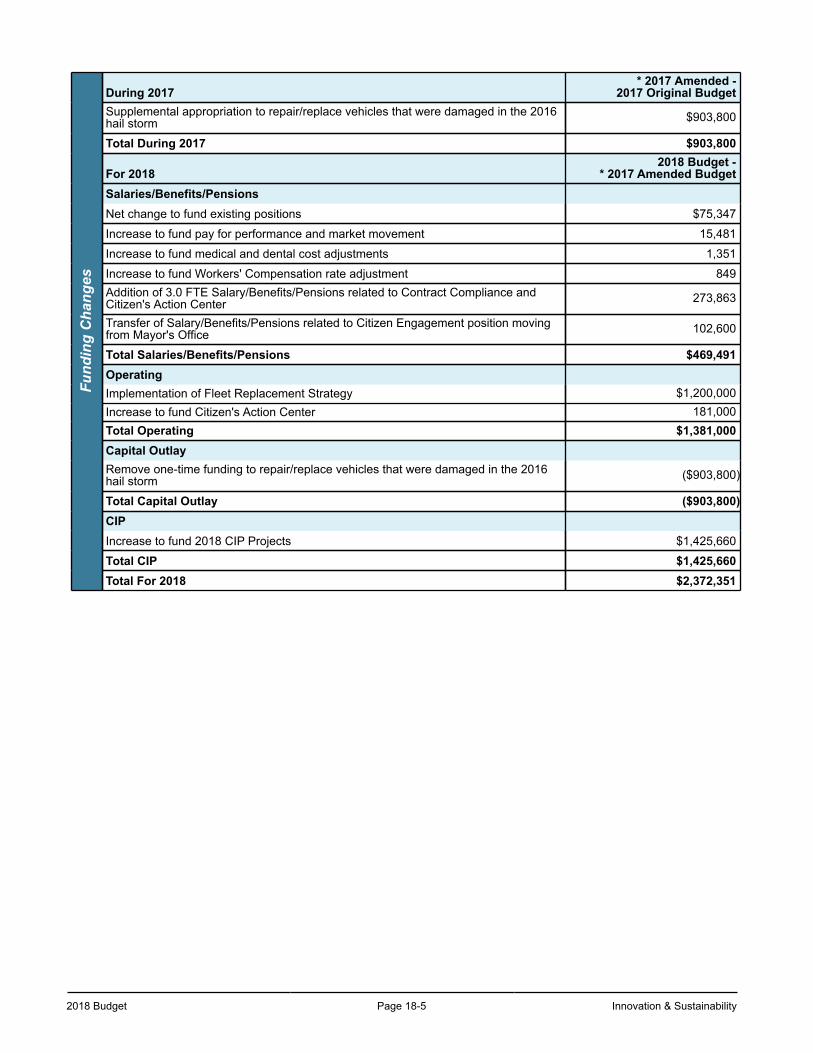
2018 Budget Page 18-5 Innovation & Sustainability
Fund
ing
Cha
nges
During 2017* 2017 Amended -
2017 Original BudgetSupplemental appropriation to repair/replace vehicles that were damaged in the 2016hail storm $903,800
Total During 2017 $903,800
For 20182018 Budget -
* 2017 Amended BudgetSalaries/Benefits/PensionsNet change to fund existing positions $75,347
Increase to fund pay for performance and market movement 15,481
Increase to fund medical and dental cost adjustments 1,351
Increase to fund Workers' Compensation rate adjustment 849Addition of 3.0 FTE Salary/Benefits/Pensions related to Contract Compliance andCitizen's Action Center 273,863
Transfer of Salary/Benefits/Pensions related to Citizen Engagement position movingfrom Mayor's Office 102,600
Total Salaries/Benefits/Pensions $469,491OperatingImplementation of Fleet Replacement Strategy $1,200,000Increase to fund Citizen's Action Center 181,000Total Operating $1,381,000Capital OutlayRemove one-time funding to repair/replace vehicles that were damaged in the 2016hail storm ($903,800)
Total Capital Outlay ($903,800)CIPIncrease to fund 2018 CIP Projects $1,425,660
Total CIP $1,425,660Total For 2018 $2,372,351
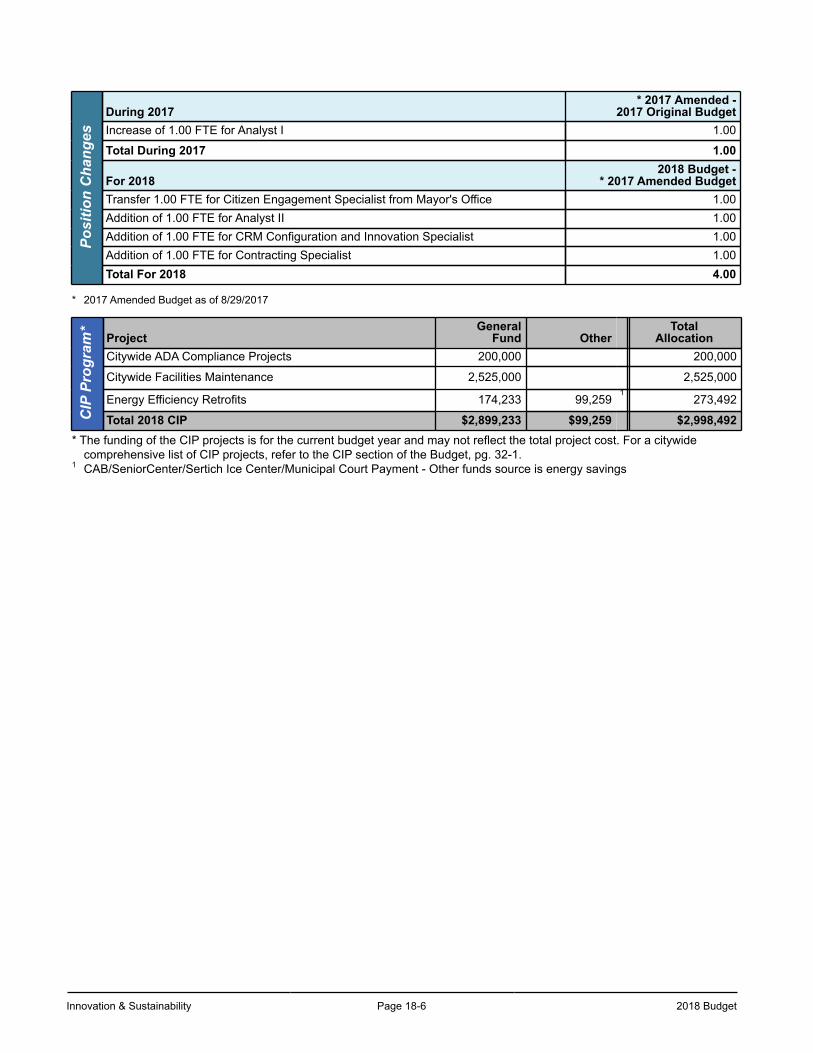
Innovation & Sustainability Page 18-6 2018 Budget
Posi
tion
Cha
nges
During 2017* 2017 Amended -
2017 Original BudgetIncrease of 1.00 FTE for Analyst I 1.00
Total During 2017 1.00
For 20182018 Budget -
* 2017 Amended BudgetTransfer 1.00 FTE for Citizen Engagement Specialist from Mayor's Office 1.00Addition of 1.00 FTE for Analyst II 1.00Addition of 1.00 FTE for CRM Configuration and Innovation Specialist 1.00Addition of 1.00 FTE for Contracting Specialist 1.00Total For 2018 4.00
* 2017 Amended Budget as of 8/29/2017
CIP
Pro
gram
*
ProjectGeneral
Fund OtherTotal
AllocationCitywide ADA Compliance Projects 200,000 200,000
Citywide Facilities Maintenance 2,525,000 2,525,000
Energy Efficiency Retrofits 174,233 99,2591
273,492
Total 2018 CIP $2,899,233 $99,259 $2,998,492* The funding of the CIP projects is for the current budget year and may not reflect the total project cost. For a citywide
comprehensive list of CIP projects, refer to the CIP section of the Budget, pg. 32-1.1 CAB/SeniorCenter/Sertich Ice Center/Municipal Court Payment - Other funds source is energy savings
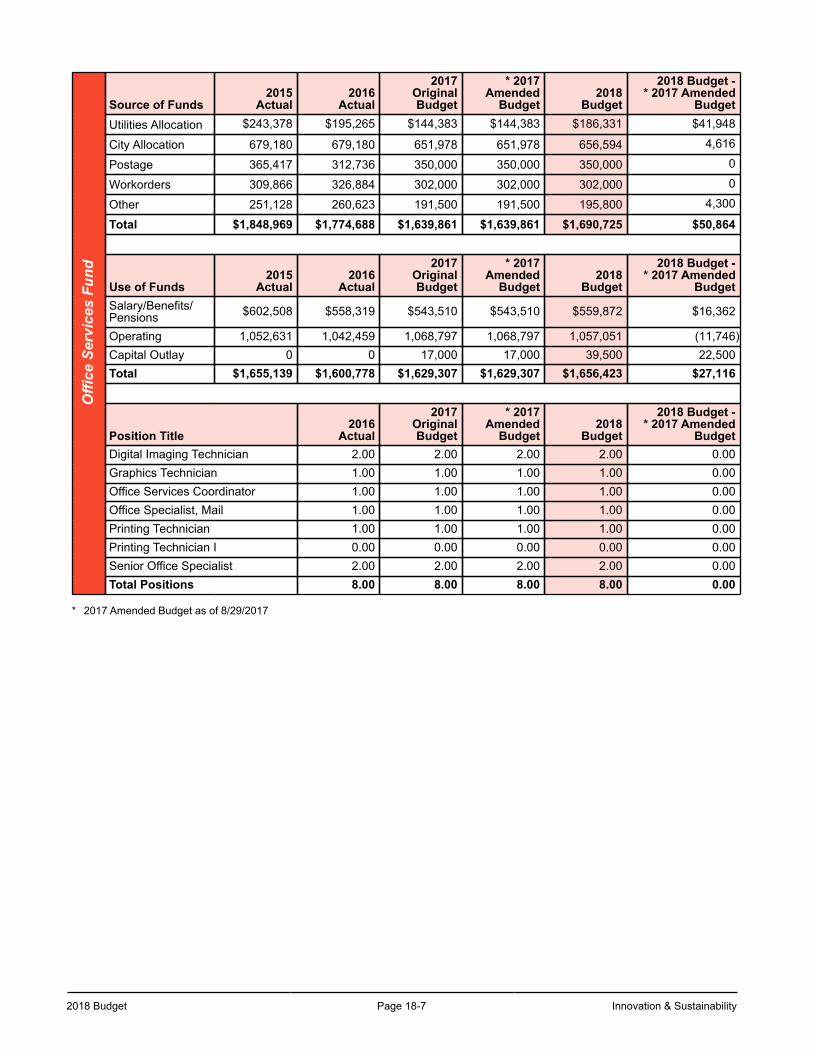
2018 Budget Page 18-7 Innovation & Sustainability
Offi
ce S
ervi
ces
Fund
Source of Funds2015
Actual2016
Actual
2017OriginalBudget
* 2017Amended
Budget2018
Budget
2018 Budget -* 2017 Amended
BudgetUtilities Allocation $243,378 $195,265 $144,383 $144,383 $186,331 $41,948
City Allocation 679,180 679,180 651,978 651,978 656,594 4,616
Postage 365,417 312,736 350,000 350,000 350,000 0
Workorders 309,866 326,884 302,000 302,000 302,000 0
Other 251,128 260,623 191,500 191,500 195,800 4,300
Total $1,848,969 $1,774,688 $1,639,861 $1,639,861 $1,690,725 $50,864
Use of Funds2015
Actual2016
Actual
2017OriginalBudget
* 2017Amended
Budget2018
Budget
2018 Budget -* 2017 Amended
BudgetSalary/Benefits/Pensions $602,508 $558,319 $543,510 $543,510 $559,872 $16,362
Operating 1,052,631 1,042,459 1,068,797 1,068,797 1,057,051 (11,746)Capital Outlay 0 0 17,000 17,000 39,500 22,500Total $1,655,139 $1,600,778 $1,629,307 $1,629,307 $1,656,423 $27,116
Position Title2016
Actual
2017OriginalBudget
* 2017Amended
Budget2018
Budget
2018 Budget -* 2017 Amended
BudgetDigital Imaging Technician 2.00 2.00 2.00 2.00 0.00Graphics Technician 1.00 1.00 1.00 1.00 0.00Office Services Coordinator 1.00 1.00 1.00 1.00 0.00Office Specialist, Mail 1.00 1.00 1.00 1.00 0.00Printing Technician 1.00 1.00 1.00 1.00 0.00Printing Technician I 0.00 0.00 0.00 0.00 0.00Senior Office Specialist 2.00 2.00 2.00 2.00 0.00Total Positions 8.00 8.00 8.00 8.00 0.00
* 2017 Amended Budget as of 8/29/2017
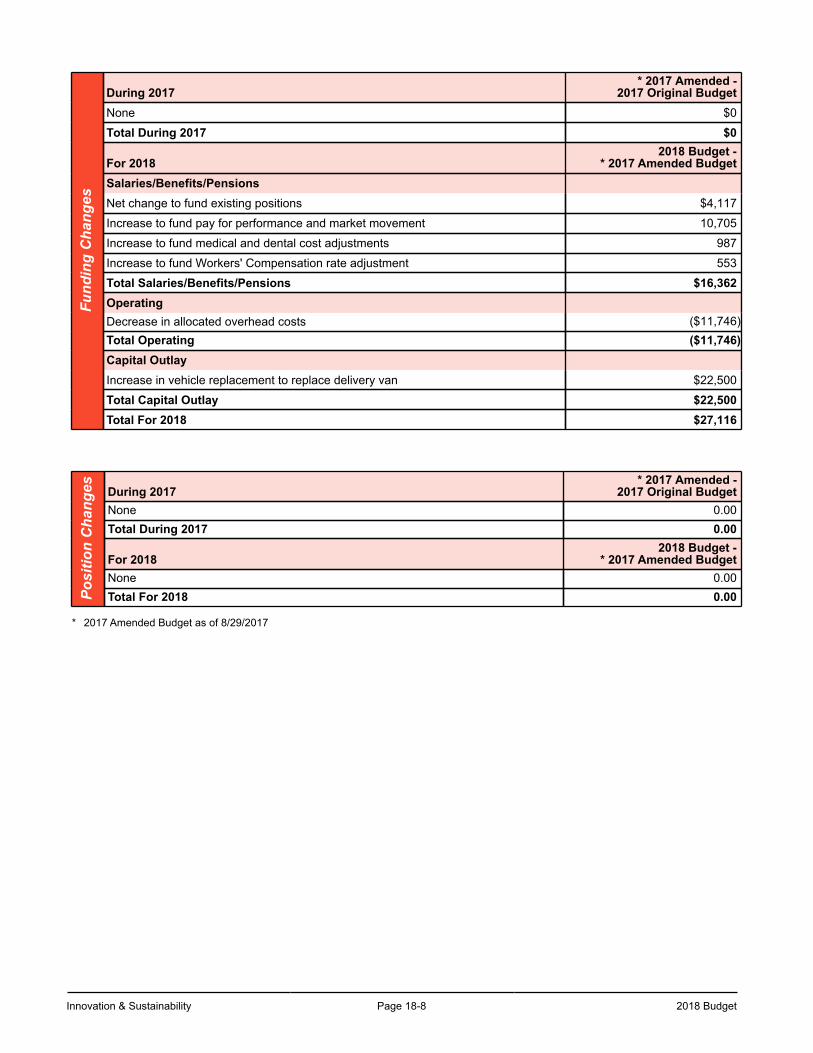
Innovation & Sustainability Page 18-8 2018 Budget
Fund
ing
Cha
nges
During 2017* 2017 Amended -
2017 Original BudgetNone $0
Total During 2017 $0
For 20182018 Budget -
* 2017 Amended BudgetSalaries/Benefits/PensionsNet change to fund existing positions $4,117
Increase to fund pay for performance and market movement 10,705
Increase to fund medical and dental cost adjustments 987
Increase to fund Workers' Compensation rate adjustment 553
Total Salaries/Benefits/Pensions $16,362OperatingDecrease in allocated overhead costs ($11,746)Total Operating ($11,746)Capital OutlayIncrease in vehicle replacement to replace delivery van $22,500
Total Capital Outlay $22,500Total For 2018 $27,116
Posi
tion
Cha
nges During 2017
* 2017 Amended -2017 Original Budget
None 0.00Total During 2017 0.00
For 20182018 Budget -
* 2017 Amended BudgetNone 0.00Total For 2018 0.00
* 2017 Amended Budget as of 8/29/2017
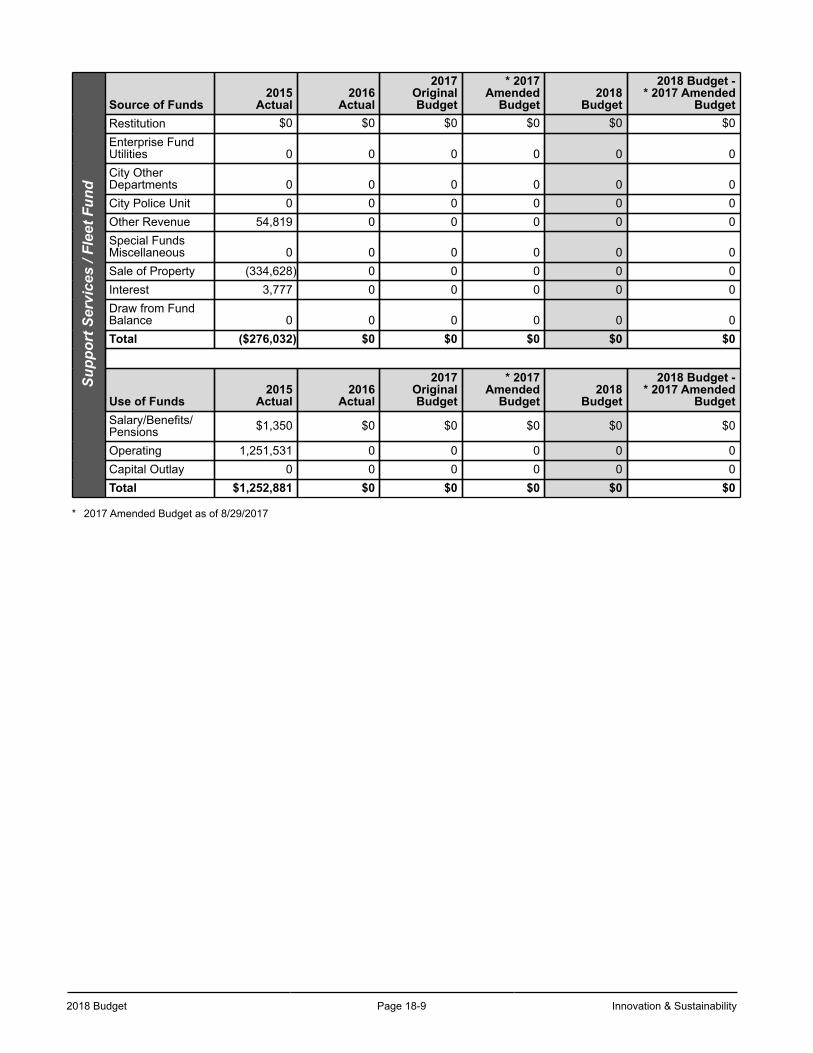
2018 Budget Page 18-9 Innovation & Sustainability
Supp
ort S
ervi
ces
/ Fle
et F
und
Source of Funds2015
Actual2016
Actual
2017OriginalBudget
* 2017Amended
Budget2018
Budget
2018 Budget -* 2017 Amended
BudgetRestitution $0 $0 $0 $0 $0 $0Enterprise FundUtilities 0 0 0 0 0 0City OtherDepartments 0 0 0 0 0 0City Police Unit 0 0 0 0 0 0Other Revenue 54,819 0 0 0 0 0Special FundsMiscellaneous 0 0 0 0 0 0Sale of Property (334,628) 0 0 0 0 0Interest 3,777 0 0 0 0 0Draw from FundBalance 0 0 0 0 0 0Total ($276,032) $0 $0 $0 $0 $0
Use of Funds2015
Actual2016
Actual
2017OriginalBudget
* 2017Amended
Budget2018
Budget
2018 Budget -* 2017 Amended
BudgetSalary/Benefits/Pensions $1,350 $0 $0 $0 $0 $0
Operating 1,251,531 0 0 0 0 0Capital Outlay 0 0 0 0 0 0Total $1,252,881 $0 $0 $0 $0 $0
* 2017 Amended Budget as of 8/29/2017
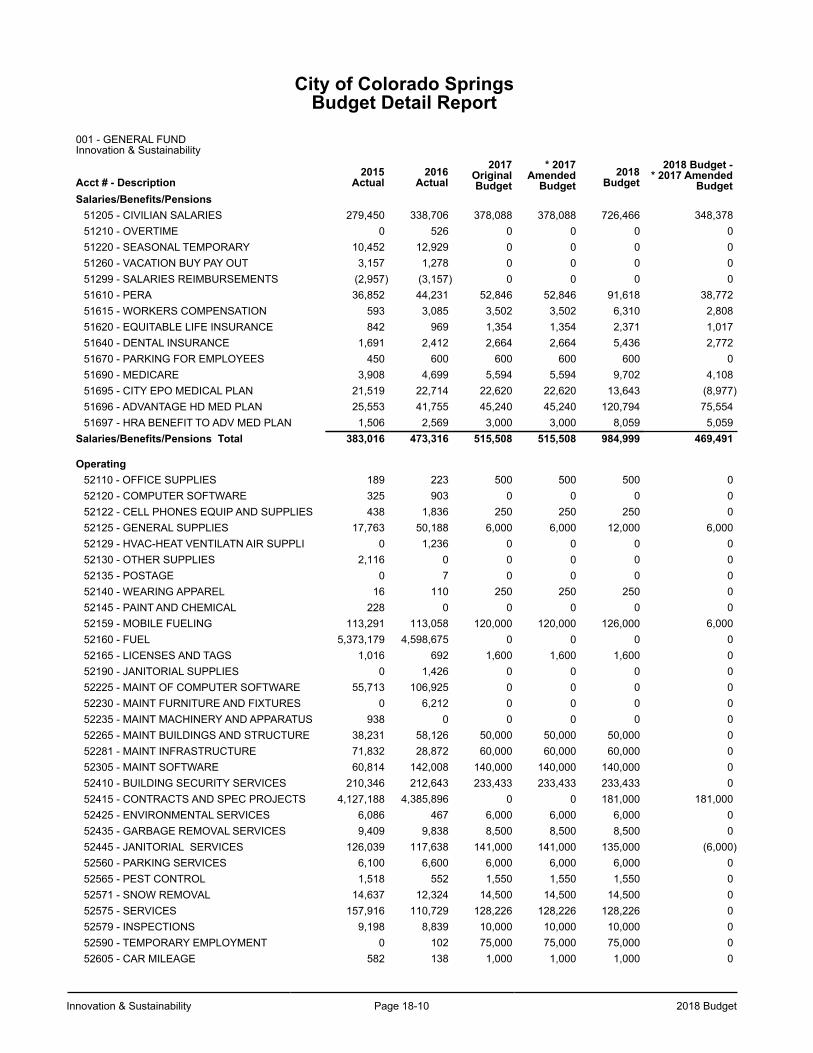
Innovation & Sustainability Page 18-10 2018 Budget
City of Colorado SpringsBudget Detail Report
001 - GENERAL FUND Innovation & Sustainability
Acct # - Description2015
Actual2016
Actual2017
OriginalBudget
* 2017Amended
Budget2018
Budget2018 Budget -
* 2017 AmendedBudget
Salaries/Benefits/Pensions51205 - CIVILIAN SALARIES 279,450 338,706 378,088 378,088 726,466 348,37851210 - OVERTIME 0 526 0 0 0 051220 - SEASONAL TEMPORARY 10,452 12,929 0 0 0 051260 - VACATION BUY PAY OUT 3,157 1,278 0 0 0 051299 - SALARIES REIMBURSEMENTS (2,957) (3,157) 0 0 0 051610 - PERA 36,852 44,231 52,846 52,846 91,618 38,77251615 - WORKERS COMPENSATION 593 3,085 3,502 3,502 6,310 2,80851620 - EQUITABLE LIFE INSURANCE 842 969 1,354 1,354 2,371 1,01751640 - DENTAL INSURANCE 1,691 2,412 2,664 2,664 5,436 2,77251670 - PARKING FOR EMPLOYEES 450 600 600 600 600 051690 - MEDICARE 3,908 4,699 5,594 5,594 9,702 4,10851695 - CITY EPO MEDICAL PLAN 21,519 22,714 22,620 22,620 13,643 (8,977)51696 - ADVANTAGE HD MED PLAN 25,553 41,755 45,240 45,240 120,794 75,55451697 - HRA BENEFIT TO ADV MED PLAN 1,506 2,569 3,000 3,000 8,059 5,059
Salaries/Benefits/Pensions Total 383,016 473,316 515,508 515,508 984,999 469,491
Operating52110 - OFFICE SUPPLIES 189 223 500 500 500 052120 - COMPUTER SOFTWARE 325 903 0 0 0 052122 - CELL PHONES EQUIP AND SUPPLIES 438 1,836 250 250 250 052125 - GENERAL SUPPLIES 17,763 50,188 6,000 6,000 12,000 6,00052129 - HVAC-HEAT VENTILATN AIR SUPPLI 0 1,236 0 0 0 052130 - OTHER SUPPLIES 2,116 0 0 0 0 052135 - POSTAGE 0 7 0 0 0 052140 - WEARING APPAREL 16 110 250 250 250 052145 - PAINT AND CHEMICAL 228 0 0 0 0 052159 - MOBILE FUELING 113,291 113,058 120,000 120,000 126,000 6,00052160 - FUEL 5,373,179 4,598,675 0 0 0 052165 - LICENSES AND TAGS 1,016 692 1,600 1,600 1,600 052190 - JANITORIAL SUPPLIES 0 1,426 0 0 0 052225 - MAINT OF COMPUTER SOFTWARE 55,713 106,925 0 0 0 052230 - MAINT FURNITURE AND FIXTURES 0 6,212 0 0 0 052235 - MAINT MACHINERY AND APPARATUS 938 0 0 0 0 052265 - MAINT BUILDINGS AND STRUCTURE 38,231 58,126 50,000 50,000 50,000 052281 - MAINT INFRASTRUCTURE 71,832 28,872 60,000 60,000 60,000 052305 - MAINT SOFTWARE 60,814 142,008 140,000 140,000 140,000 052410 - BUILDING SECURITY SERVICES 210,346 212,643 233,433 233,433 233,433 052415 - CONTRACTS AND SPEC PROJECTS 4,127,188 4,385,896 0 0 181,000 181,00052425 - ENVIRONMENTAL SERVICES 6,086 467 6,000 6,000 6,000 052435 - GARBAGE REMOVAL SERVICES 9,409 9,838 8,500 8,500 8,500 052445 - JANITORIAL SERVICES 126,039 117,638 141,000 141,000 135,000 (6,000)52560 - PARKING SERVICES 6,100 6,600 6,000 6,000 6,000 052565 - PEST CONTROL 1,518 552 1,550 1,550 1,550 052571 - SNOW REMOVAL 14,637 12,324 14,500 14,500 14,500 052575 - SERVICES 157,916 110,729 128,226 128,226 128,226 052579 - INSPECTIONS 9,198 8,839 10,000 10,000 10,000 052590 - TEMPORARY EMPLOYMENT 0 102 75,000 75,000 75,000 052605 - CAR MILEAGE 582 138 1,000 1,000 1,000 0
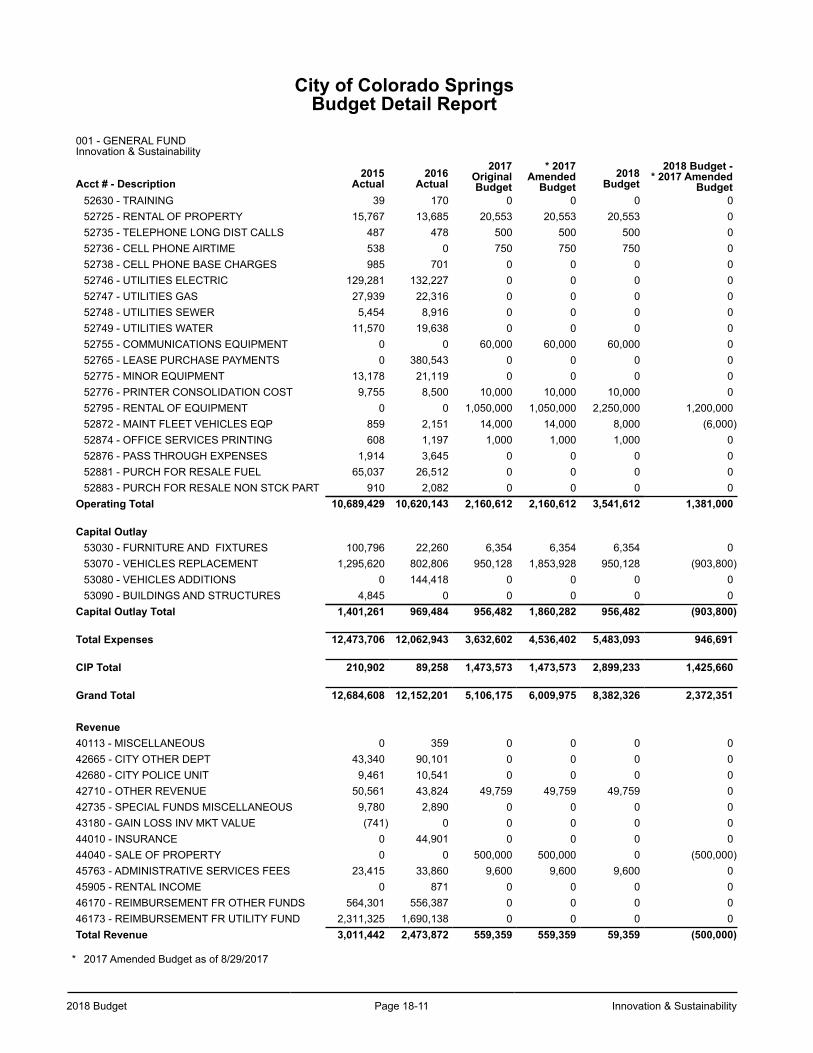
2018 Budget Page 18-11 Innovation & Sustainability
City of Colorado SpringsBudget Detail Report
001 - GENERAL FUND Innovation & Sustainability
Acct # - Description2015
Actual2016
Actual2017
OriginalBudget
* 2017Amended
Budget2018
Budget2018 Budget -
* 2017 AmendedBudget
52630 - TRAINING 39 170 0 0 0 052725 - RENTAL OF PROPERTY 15,767 13,685 20,553 20,553 20,553 052735 - TELEPHONE LONG DIST CALLS 487 478 500 500 500 052736 - CELL PHONE AIRTIME 538 0 750 750 750 052738 - CELL PHONE BASE CHARGES 985 701 0 0 0 052746 - UTILITIES ELECTRIC 129,281 132,227 0 0 0 052747 - UTILITIES GAS 27,939 22,316 0 0 0 052748 - UTILITIES SEWER 5,454 8,916 0 0 0 052749 - UTILITIES WATER 11,570 19,638 0 0 0 052755 - COMMUNICATIONS EQUIPMENT 0 0 60,000 60,000 60,000 052765 - LEASE PURCHASE PAYMENTS 0 380,543 0 0 0 052775 - MINOR EQUIPMENT 13,178 21,119 0 0 0 052776 - PRINTER CONSOLIDATION COST 9,755 8,500 10,000 10,000 10,000 052795 - RENTAL OF EQUIPMENT 0 0 1,050,000 1,050,000 2,250,000 1,200,00052872 - MAINT FLEET VEHICLES EQP 859 2,151 14,000 14,000 8,000 (6,000)52874 - OFFICE SERVICES PRINTING 608 1,197 1,000 1,000 1,000 052876 - PASS THROUGH EXPENSES 1,914 3,645 0 0 0 052881 - PURCH FOR RESALE FUEL 65,037 26,512 0 0 0 052883 - PURCH FOR RESALE NON STCK PART 910 2,082 0 0 0 0
Operating Total 10,689,429 10,620,143 2,160,612 2,160,612 3,541,612 1,381,000
Capital Outlay53030 - FURNITURE AND FIXTURES 100,796 22,260 6,354 6,354 6,354 053070 - VEHICLES REPLACEMENT 1,295,620 802,806 950,128 1,853,928 950,128 (903,800)53080 - VEHICLES ADDITIONS 0 144,418 0 0 0 053090 - BUILDINGS AND STRUCTURES 4,845 0 0 0 0 0
Capital Outlay Total 1,401,261 969,484 956,482 1,860,282 956,482 (903,800)
Total Expenses 12,473,706 12,062,943 3,632,602 4,536,402 5,483,093 946,691
CIP Total 210,902 89,258 1,473,573 1,473,573 2,899,233 1,425,660
Grand Total 12,684,608 12,152,201 5,106,175 6,009,975 8,382,326 2,372,351
Revenue40113 - MISCELLANEOUS 0 359 0 0 0 042665 - CITY OTHER DEPT 43,340 90,101 0 0 0 042680 - CITY POLICE UNIT 9,461 10,541 0 0 0 042710 - OTHER REVENUE 50,561 43,824 49,759 49,759 49,759 042735 - SPECIAL FUNDS MISCELLANEOUS 9,780 2,890 0 0 0 043180 - GAIN LOSS INV MKT VALUE (741) 0 0 0 0 044010 - INSURANCE 0 44,901 0 0 0 044040 - SALE OF PROPERTY 0 0 500,000 500,000 0 (500,000)45763 - ADMINISTRATIVE SERVICES FEES 23,415 33,860 9,600 9,600 9,600 045905 - RENTAL INCOME 0 871 0 0 0 046170 - REIMBURSEMENT FR OTHER FUNDS 564,301 556,387 0 0 0 046173 - REIMBURSEMENT FR UTILITY FUND 2,311,325 1,690,138 0 0 0 0Total Revenue 3,011,442 2,473,872 559,359 559,359 59,359 (500,000)
* 2017 Amended Budget as of 8/29/2017
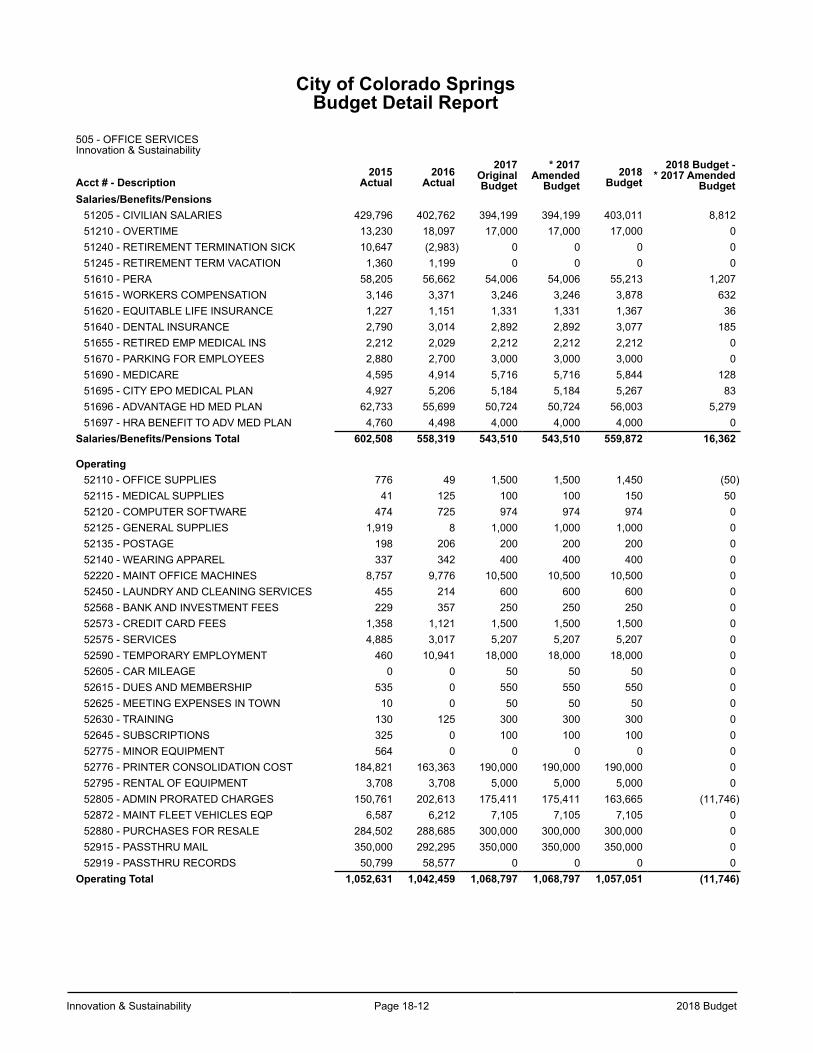
Innovation & Sustainability Page 18-12 2018 Budget
City of Colorado SpringsBudget Detail Report
505 - OFFICE SERVICES Innovation & Sustainability
Acct # - Description2015
Actual2016
Actual2017
OriginalBudget
* 2017Amended
Budget2018
Budget2018 Budget -
* 2017 AmendedBudget
Salaries/Benefits/Pensions51205 - CIVILIAN SALARIES 429,796 402,762 394,199 394,199 403,011 8,81251210 - OVERTIME 13,230 18,097 17,000 17,000 17,000 051240 - RETIREMENT TERMINATION SICK 10,647 (2,983) 0 0 0 051245 - RETIREMENT TERM VACATION 1,360 1,199 0 0 0 051610 - PERA 58,205 56,662 54,006 54,006 55,213 1,20751615 - WORKERS COMPENSATION 3,146 3,371 3,246 3,246 3,878 63251620 - EQUITABLE LIFE INSURANCE 1,227 1,151 1,331 1,331 1,367 3651640 - DENTAL INSURANCE 2,790 3,014 2,892 2,892 3,077 18551655 - RETIRED EMP MEDICAL INS 2,212 2,029 2,212 2,212 2,212 051670 - PARKING FOR EMPLOYEES 2,880 2,700 3,000 3,000 3,000 051690 - MEDICARE 4,595 4,914 5,716 5,716 5,844 12851695 - CITY EPO MEDICAL PLAN 4,927 5,206 5,184 5,184 5,267 8351696 - ADVANTAGE HD MED PLAN 62,733 55,699 50,724 50,724 56,003 5,27951697 - HRA BENEFIT TO ADV MED PLAN 4,760 4,498 4,000 4,000 4,000 0
Salaries/Benefits/Pensions Total 602,508 558,319 543,510 543,510 559,872 16,362
Operating52110 - OFFICE SUPPLIES 776 49 1,500 1,500 1,450 (50)52115 - MEDICAL SUPPLIES 41 125 100 100 150 5052120 - COMPUTER SOFTWARE 474 725 974 974 974 052125 - GENERAL SUPPLIES 1,919 8 1,000 1,000 1,000 052135 - POSTAGE 198 206 200 200 200 052140 - WEARING APPAREL 337 342 400 400 400 052220 - MAINT OFFICE MACHINES 8,757 9,776 10,500 10,500 10,500 052450 - LAUNDRY AND CLEANING SERVICES 455 214 600 600 600 052568 - BANK AND INVESTMENT FEES 229 357 250 250 250 052573 - CREDIT CARD FEES 1,358 1,121 1,500 1,500 1,500 052575 - SERVICES 4,885 3,017 5,207 5,207 5,207 052590 - TEMPORARY EMPLOYMENT 460 10,941 18,000 18,000 18,000 052605 - CAR MILEAGE 0 0 50 50 50 052615 - DUES AND MEMBERSHIP 535 0 550 550 550 052625 - MEETING EXPENSES IN TOWN 10 0 50 50 50 052630 - TRAINING 130 125 300 300 300 052645 - SUBSCRIPTIONS 325 0 100 100 100 052775 - MINOR EQUIPMENT 564 0 0 0 0 052776 - PRINTER CONSOLIDATION COST 184,821 163,363 190,000 190,000 190,000 052795 - RENTAL OF EQUIPMENT 3,708 3,708 5,000 5,000 5,000 052805 - ADMIN PRORATED CHARGES 150,761 202,613 175,411 175,411 163,665 (11,746)52872 - MAINT FLEET VEHICLES EQP 6,587 6,212 7,105 7,105 7,105 052880 - PURCHASES FOR RESALE 284,502 288,685 300,000 300,000 300,000 052915 - PASSTHRU MAIL 350,000 292,295 350,000 350,000 350,000 052919 - PASSTHRU RECORDS 50,799 58,577 0 0 0 0
Operating Total 1,052,631 1,042,459 1,068,797 1,068,797 1,057,051 (11,746)
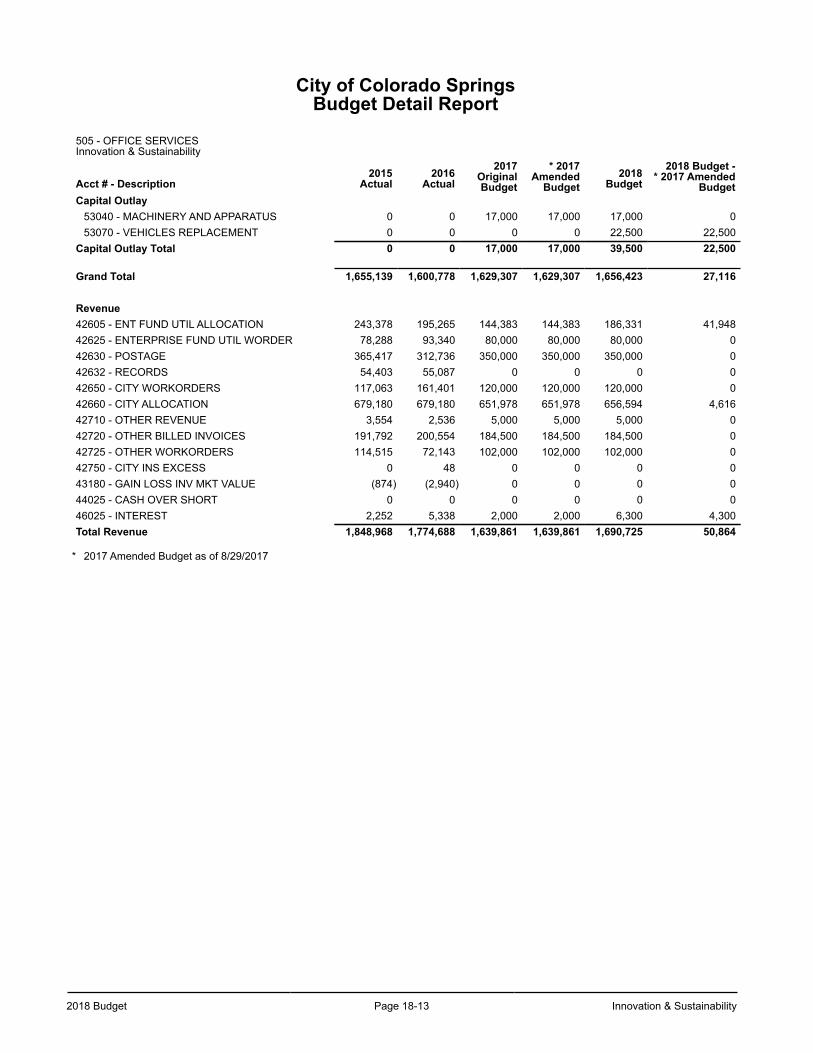
2018 Budget Page 18-13 Innovation & Sustainability
City of Colorado SpringsBudget Detail Report
505 - OFFICE SERVICES Innovation & Sustainability
Acct # - Description2015
Actual2016
Actual2017
OriginalBudget
* 2017Amended
Budget2018
Budget2018 Budget -
* 2017 AmendedBudget
Capital Outlay53040 - MACHINERY AND APPARATUS 0 0 17,000 17,000 17,000 053070 - VEHICLES REPLACEMENT 0 0 0 0 22,500 22,500
Capital Outlay Total 0 0 17,000 17,000 39,500 22,500
Grand Total 1,655,139 1,600,778 1,629,307 1,629,307 1,656,423 27,116
Revenue42605 - ENT FUND UTIL ALLOCATION 243,378 195,265 144,383 144,383 186,331 41,94842625 - ENTERPRISE FUND UTIL WORDER 78,288 93,340 80,000 80,000 80,000 042630 - POSTAGE 365,417 312,736 350,000 350,000 350,000 042632 - RECORDS 54,403 55,087 0 0 0 042650 - CITY WORKORDERS 117,063 161,401 120,000 120,000 120,000 042660 - CITY ALLOCATION 679,180 679,180 651,978 651,978 656,594 4,61642710 - OTHER REVENUE 3,554 2,536 5,000 5,000 5,000 042720 - OTHER BILLED INVOICES 191,792 200,554 184,500 184,500 184,500 042725 - OTHER WORKORDERS 114,515 72,143 102,000 102,000 102,000 042750 - CITY INS EXCESS 0 48 0 0 0 043180 - GAIN LOSS INV MKT VALUE (874) (2,940) 0 0 0 044025 - CASH OVER SHORT 0 0 0 0 0 046025 - INTEREST 2,252 5,338 2,000 2,000 6,300 4,300Total Revenue 1,848,968 1,774,688 1,639,861 1,639,861 1,690,725 50,864
* 2017 Amended Budget as of 8/29/2017
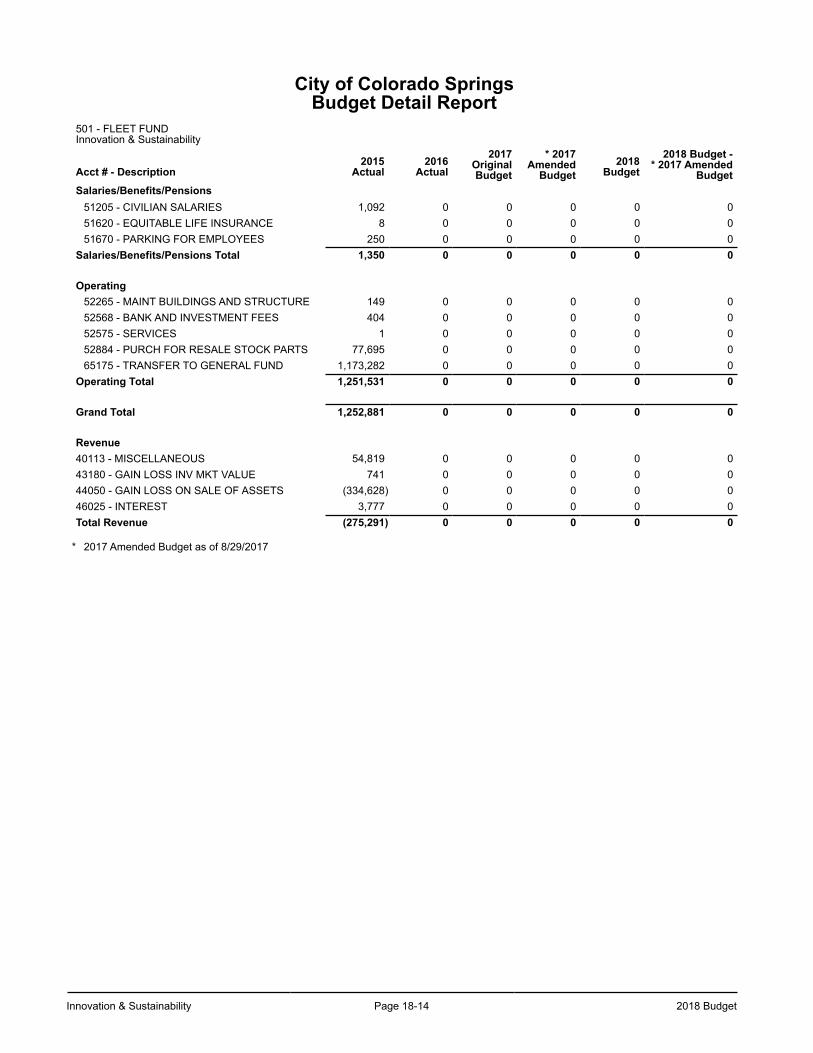
Innovation & Sustainability Page 18-14 2018 Budget
City of Colorado SpringsBudget Detail Report
501 - FLEET FUND Innovation & Sustainability
Acct # - Description2015
Actual2016
Actual2017
OriginalBudget
* 2017Amended
Budget2018
Budget2018 Budget -
* 2017 AmendedBudget
Salaries/Benefits/Pensions51205 - CIVILIAN SALARIES 1,092 0 0 0 0 051620 - EQUITABLE LIFE INSURANCE 8 0 0 0 0 051670 - PARKING FOR EMPLOYEES 250 0 0 0 0 0
Salaries/Benefits/Pensions Total 1,350 0 0 0 0 0
Operating52265 - MAINT BUILDINGS AND STRUCTURE 149 0 0 0 0 052568 - BANK AND INVESTMENT FEES 404 0 0 0 0 052575 - SERVICES 1 0 0 0 0 052884 - PURCH FOR RESALE STOCK PARTS 77,695 0 0 0 0 065175 - TRANSFER TO GENERAL FUND 1,173,282 0 0 0 0 0
Operating Total 1,251,531 0 0 0 0 0
Grand Total 1,252,881 0 0 0 0 0
Revenue40113 - MISCELLANEOUS 54,819 0 0 0 0 043180 - GAIN LOSS INV MKT VALUE 741 0 0 0 0 044050 - GAIN LOSS ON SALE OF ASSETS (334,628) 0 0 0 0 046025 - INTEREST 3,777 0 0 0 0 0Total Revenue (275,291) 0 0 0 0 0
* 2017 Amended Budget as of 8/29/2017
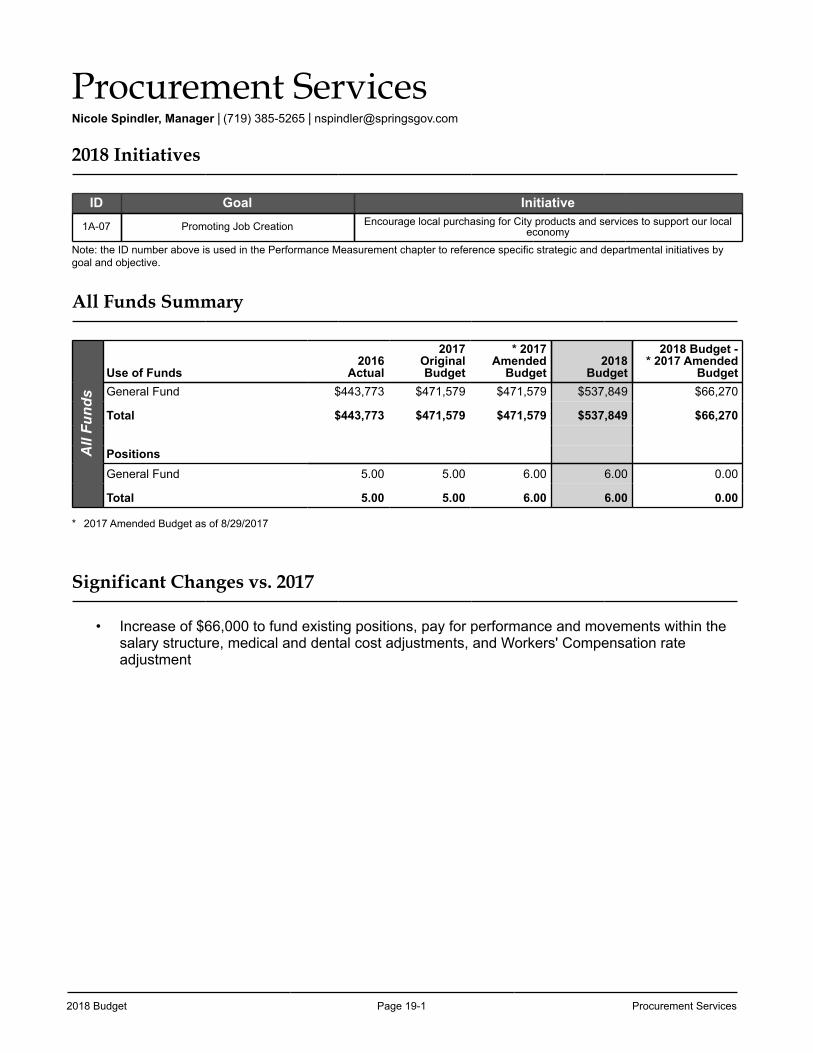
2018 Budget Page 19-1 Procurement Services
Procurement ServicesNicole Spindler, Manager | (719) 385-5265 | [email protected]
2018 Initiatives
ID Goal Initiative1A-07 Promoting Job Creation Encourage local purchasing for City products and services to support our local
economy
Note: the ID number above is used in the Performance Measurement chapter to reference specific strategic and departmental initiatives by goal and objective.
All Funds Summary
All
Fund
s
Use of Funds2016
Actual
2017OriginalBudget
* 2017Amended
Budget2018
Budget
2018 Budget -* 2017 Amended
BudgetGeneral Fund $443,773 $471,579 $471,579 $537,849 $66,270
Total $443,773 $471,579 $471,579 $537,849 $66,270
PositionsGeneral Fund 5.00 5.00 6.00 6.00 0.00
Total 5.00 5.00 6.00 6.00 0.00
* 2017 Amended Budget as of 8/29/2017
Significant Changes vs. 2017
• Increase of $66,000 to fund existing positions, pay for performance and movements within the salary structure, medical and dental cost adjustments, and Workers' Compensation rate adjustment
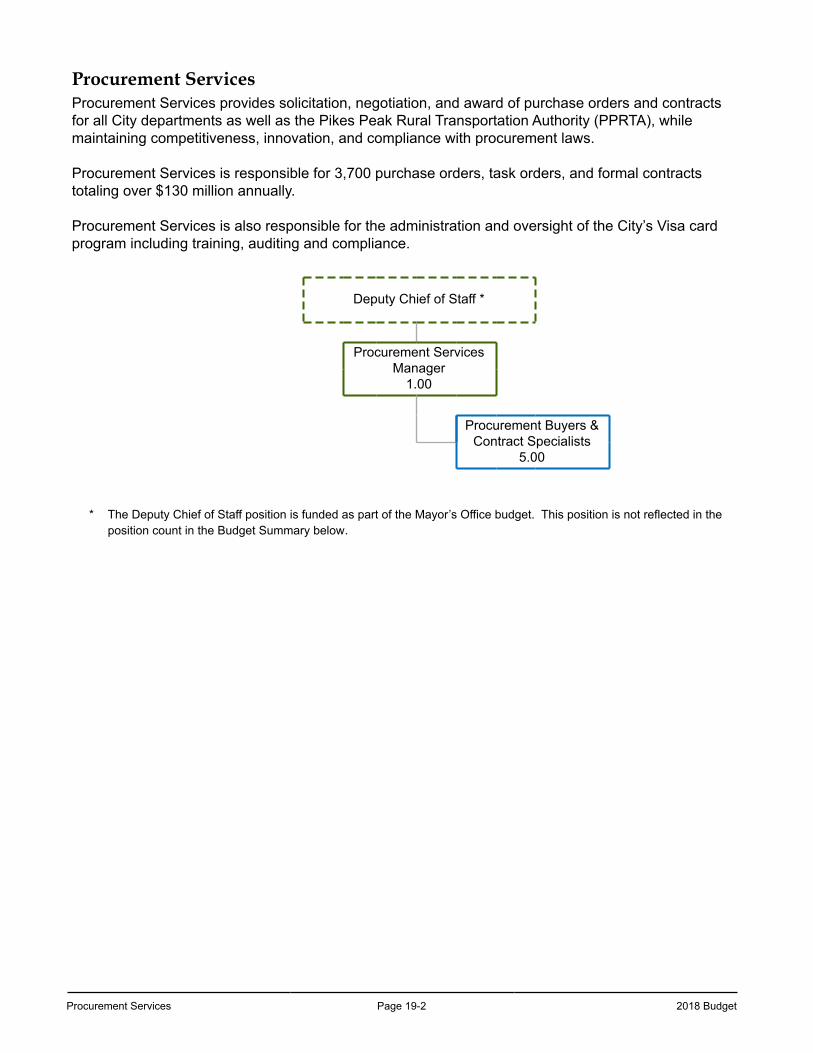
Procurement Services Page 19-2 2018 Budget
Procurement ServicesProcurement Services provides solicitation, negotiation, and award of purchase orders and contracts for all City departments as well as the Pikes Peak Rural Transportation Authority (PPRTA), while maintaining competitiveness, innovation, and compliance with procurement laws.
Procurement Services is responsible for 3,700 purchase orders, task orders, and formal contracts totaling over $130 million annually.
Procurement Services is also responsible for the administration and oversight of the City’s Visa card program including training, auditing and compliance.
Deputy Chief of Staff *
Procurement Services Manager
1.00
Procurement Buyers & Contract Specialists
5.00
* The Deputy Chief of Staff position is funded as part of the Mayor’s Office budget. This position is not reflected in the position count in the Budget Summary below.
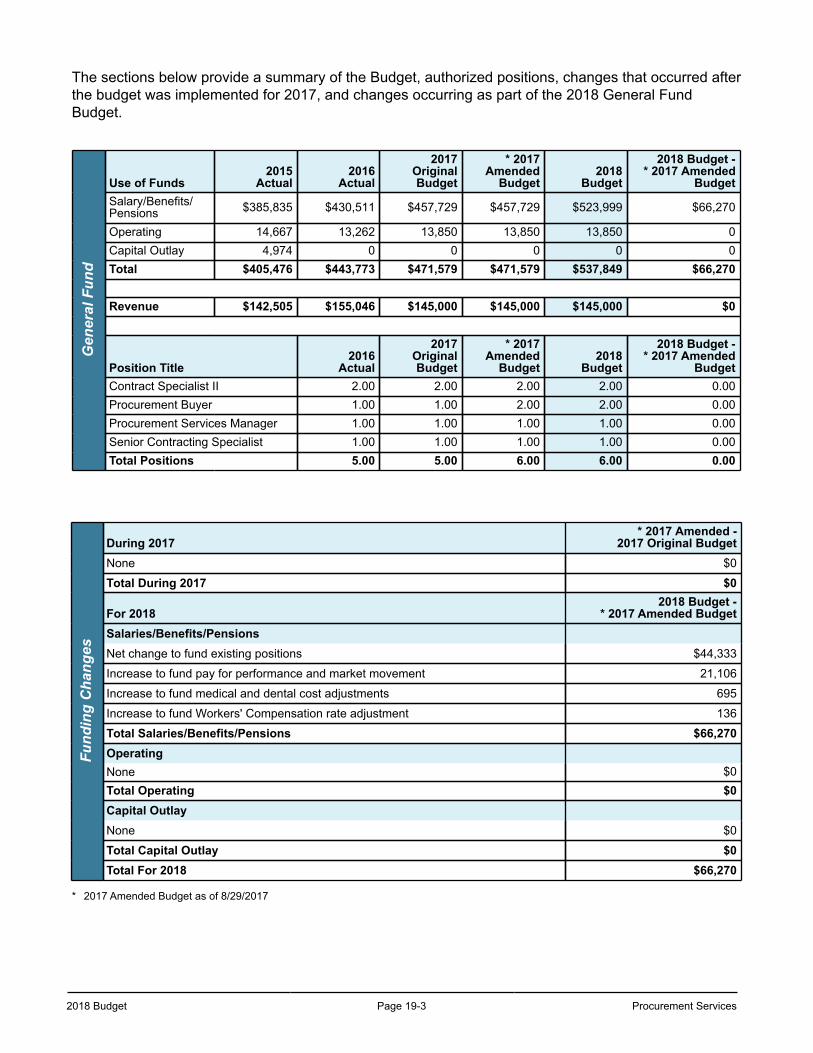
2018 Budget Page 19-3 Procurement Services
The sections below provide a summary of the Budget, authorized positions, changes that occurred after the budget was implemented for 2017, and changes occurring as part of the 2018 General Fund Budget.
Gen
eral
Fun
d
Use of Funds2015
Actual2016
Actual
2017OriginalBudget
* 2017Amended
Budget2018
Budget
2018 Budget -* 2017 Amended
BudgetSalary/Benefits/Pensions $385,835 $430,511 $457,729 $457,729 $523,999 $66,270
Operating 14,667 13,262 13,850 13,850 13,850 0Capital Outlay 4,974 0 0 0 0 0Total $405,476 $443,773 $471,579 $471,579 $537,849 $66,270
Revenue $142,505 $155,046 $145,000 $145,000 $145,000 $0
Position Title2016
Actual
2017OriginalBudget
* 2017Amended
Budget2018
Budget
2018 Budget -* 2017 Amended
BudgetContract Specialist II 2.00 2.00 2.00 2.00 0.00Procurement Buyer 1.00 1.00 2.00 2.00 0.00Procurement Services Manager 1.00 1.00 1.00 1.00 0.00Senior Contracting Specialist 1.00 1.00 1.00 1.00 0.00Total Positions 5.00 5.00 6.00 6.00 0.00
Fund
ing
Cha
nges
During 2017* 2017 Amended -
2017 Original BudgetNone $0
Total During 2017 $0
For 20182018 Budget -
* 2017 Amended BudgetSalaries/Benefits/PensionsNet change to fund existing positions $44,333
Increase to fund pay for performance and market movement 21,106
Increase to fund medical and dental cost adjustments 695
Increase to fund Workers' Compensation rate adjustment 136
Total Salaries/Benefits/Pensions $66,270OperatingNone $0Total Operating $0Capital OutlayNone $0
Total Capital Outlay $0Total For 2018 $66,270
* 2017 Amended Budget as of 8/29/2017
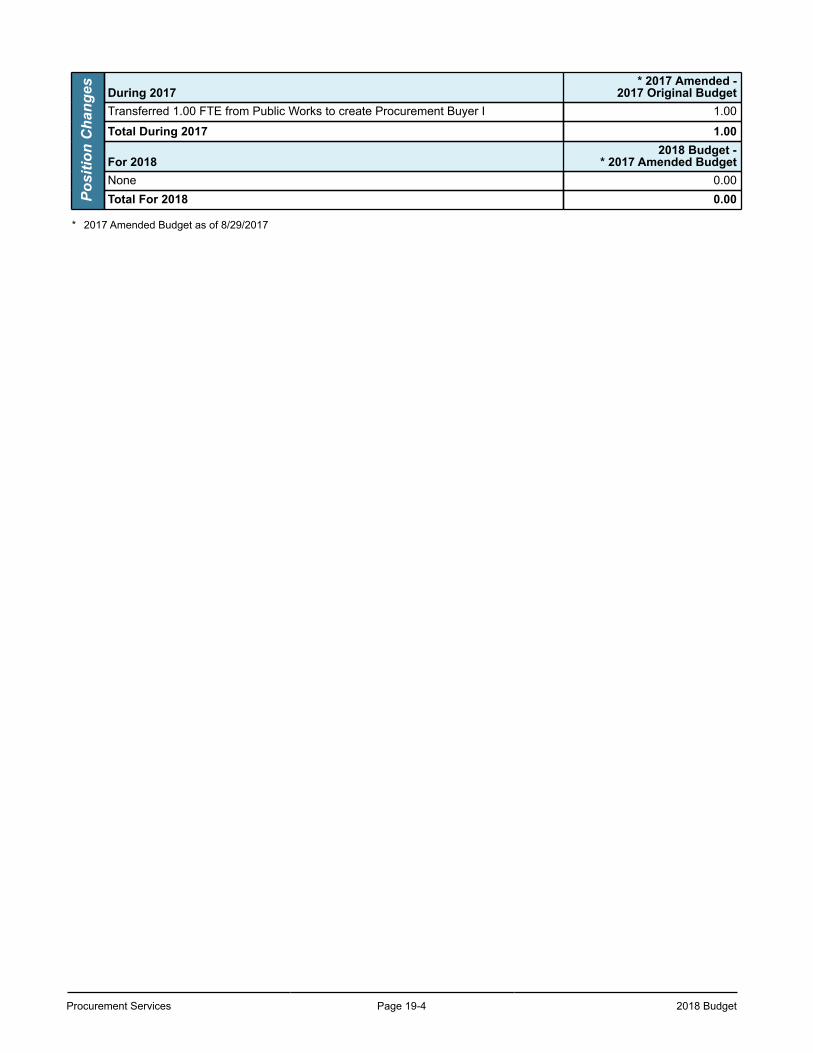
Procurement Services Page 19-4 2018 Budget
Posi
tion
Cha
nges During 2017
* 2017 Amended -2017 Original Budget
Transferred 1.00 FTE from Public Works to create Procurement Buyer I 1.00
Total During 2017 1.00
For 20182018 Budget -
* 2017 Amended BudgetNone 0.00Total For 2018 0.00
* 2017 Amended Budget as of 8/29/2017
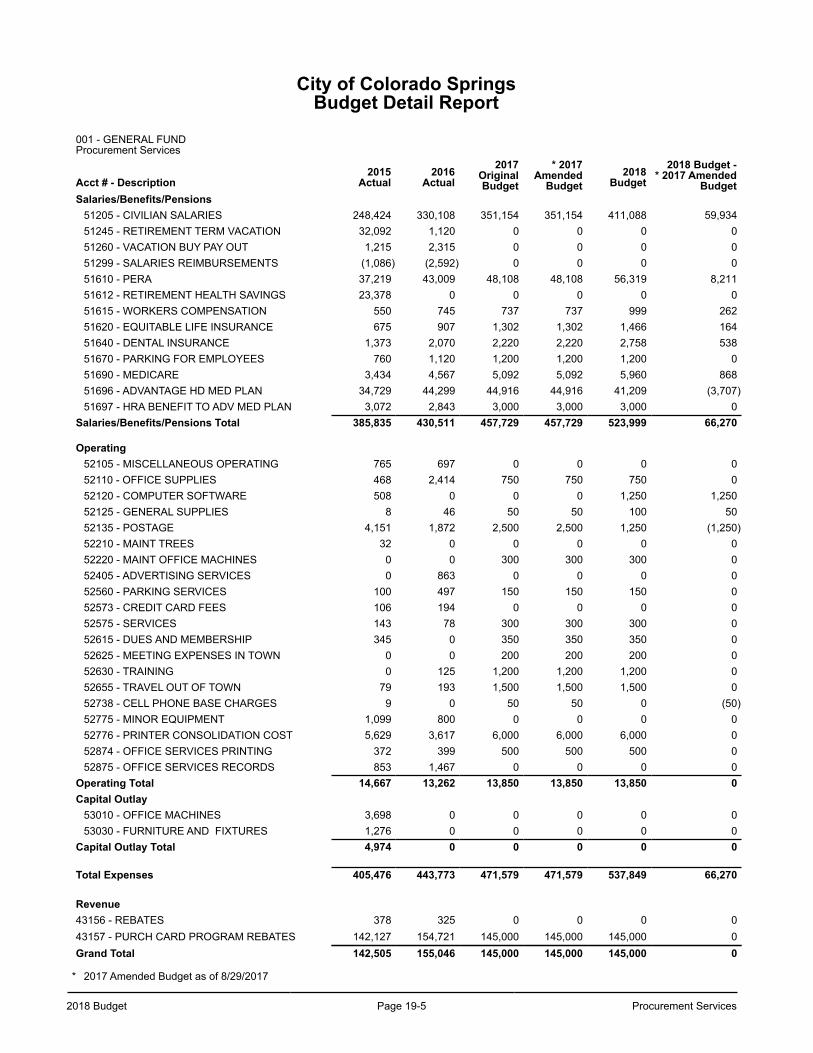
2018 Budget Page 19-5 Procurement Services
City of Colorado SpringsBudget Detail Report
001 - GENERAL FUND Procurement Services
Acct # - Description2015
Actual2016
Actual2017
OriginalBudget
* 2017Amended
Budget2018
Budget2018 Budget -
* 2017 AmendedBudget
Salaries/Benefits/Pensions51205 - CIVILIAN SALARIES 248,424 330,108 351,154 351,154 411,088 59,93451245 - RETIREMENT TERM VACATION 32,092 1,120 0 0 0 051260 - VACATION BUY PAY OUT 1,215 2,315 0 0 0 051299 - SALARIES REIMBURSEMENTS (1,086) (2,592) 0 0 0 051610 - PERA 37,219 43,009 48,108 48,108 56,319 8,21151612 - RETIREMENT HEALTH SAVINGS 23,378 0 0 0 0 051615 - WORKERS COMPENSATION 550 745 737 737 999 26251620 - EQUITABLE LIFE INSURANCE 675 907 1,302 1,302 1,466 16451640 - DENTAL INSURANCE 1,373 2,070 2,220 2,220 2,758 53851670 - PARKING FOR EMPLOYEES 760 1,120 1,200 1,200 1,200 051690 - MEDICARE 3,434 4,567 5,092 5,092 5,960 86851696 - ADVANTAGE HD MED PLAN 34,729 44,299 44,916 44,916 41,209 (3,707)51697 - HRA BENEFIT TO ADV MED PLAN 3,072 2,843 3,000 3,000 3,000 0
Salaries/Benefits/Pensions Total 385,835 430,511 457,729 457,729 523,999 66,270
Operating52105 - MISCELLANEOUS OPERATING 765 697 0 0 0 052110 - OFFICE SUPPLIES 468 2,414 750 750 750 052120 - COMPUTER SOFTWARE 508 0 0 0 1,250 1,25052125 - GENERAL SUPPLIES 8 46 50 50 100 5052135 - POSTAGE 4,151 1,872 2,500 2,500 1,250 (1,250)52210 - MAINT TREES 32 0 0 0 0 052220 - MAINT OFFICE MACHINES 0 0 300 300 300 052405 - ADVERTISING SERVICES 0 863 0 0 0 052560 - PARKING SERVICES 100 497 150 150 150 052573 - CREDIT CARD FEES 106 194 0 0 0 052575 - SERVICES 143 78 300 300 300 052615 - DUES AND MEMBERSHIP 345 0 350 350 350 052625 - MEETING EXPENSES IN TOWN 0 0 200 200 200 052630 - TRAINING 0 125 1,200 1,200 1,200 052655 - TRAVEL OUT OF TOWN 79 193 1,500 1,500 1,500 052738 - CELL PHONE BASE CHARGES 9 0 50 50 0 (50)52775 - MINOR EQUIPMENT 1,099 800 0 0 0 052776 - PRINTER CONSOLIDATION COST 5,629 3,617 6,000 6,000 6,000 052874 - OFFICE SERVICES PRINTING 372 399 500 500 500 052875 - OFFICE SERVICES RECORDS 853 1,467 0 0 0 0
Operating Total 14,667 13,262 13,850 13,850 13,850 0Capital Outlay
53010 - OFFICE MACHINES 3,698 0 0 0 0 053030 - FURNITURE AND FIXTURES 1,276 0 0 0 0 0
Capital Outlay Total 4,974 0 0 0 0 0
Total Expenses 405,476 443,773 471,579 471,579 537,849 66,270
Revenue43156 - REBATES 378 325 0 0 0 043157 - PURCH CARD PROGRAM REBATES 142,127 154,721 145,000 145,000 145,000 0Grand Total 142,505 155,046 145,000 145,000 145,000 0
* 2017 Amended Budget as of 8/29/2017

Procurement Services Page 19-6 2018 Budget
This page left blank intentionally.
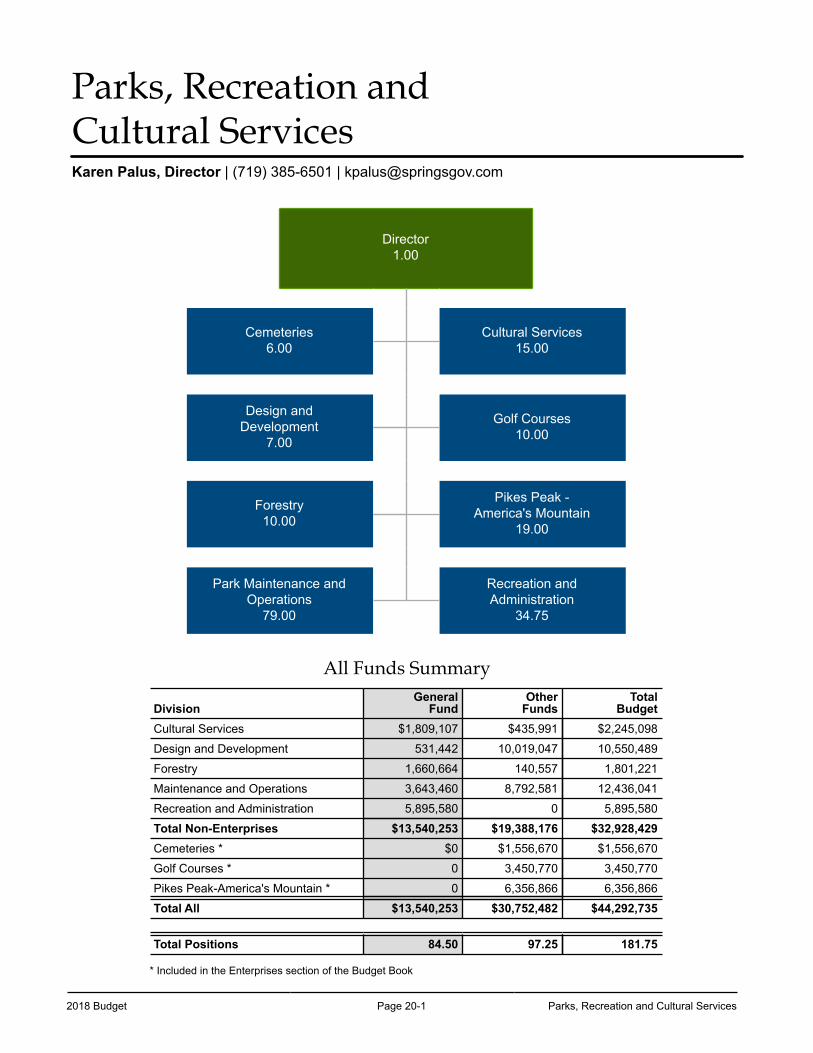
2018 Budget Page 20-1 Parks, Recreation and Cultural Services
Parks, Recreation andCultural ServicesKaren Palus, Director | (719) 385-6501 | [email protected]
Director1.00
Cemeteries6.00
Cultural Services15.00
Design and Development
7.00
Golf Courses10.00
Forestry10.00
Pikes Peak - America's Mountain
19.00
Park Maintenance andOperations
79.00
Recreation and Administration
34.75
All Funds Summary
DivisionGeneral
FundOther
FundsTotal
BudgetCultural Services $1,809,107 $435,991 $2,245,098
Design and Development 531,442 10,019,047 10,550,489
Forestry 1,660,664 140,557 1,801,221
Maintenance and Operations 3,643,460 8,792,581 12,436,041
Recreation and Administration 5,895,580 0 5,895,580
Total Non-Enterprises $13,540,253 $19,388,176 $32,928,429Cemeteries * $0 $1,556,670 $1,556,670
Golf Courses * 0 3,450,770 3,450,770
Pikes Peak-America's Mountain * 0 6,356,866 6,356,866
Total All $13,540,253 $30,752,482 $44,292,735
Total Positions 84.50 97.25 181.75
* Included in the Enterprises section of the Budget Book
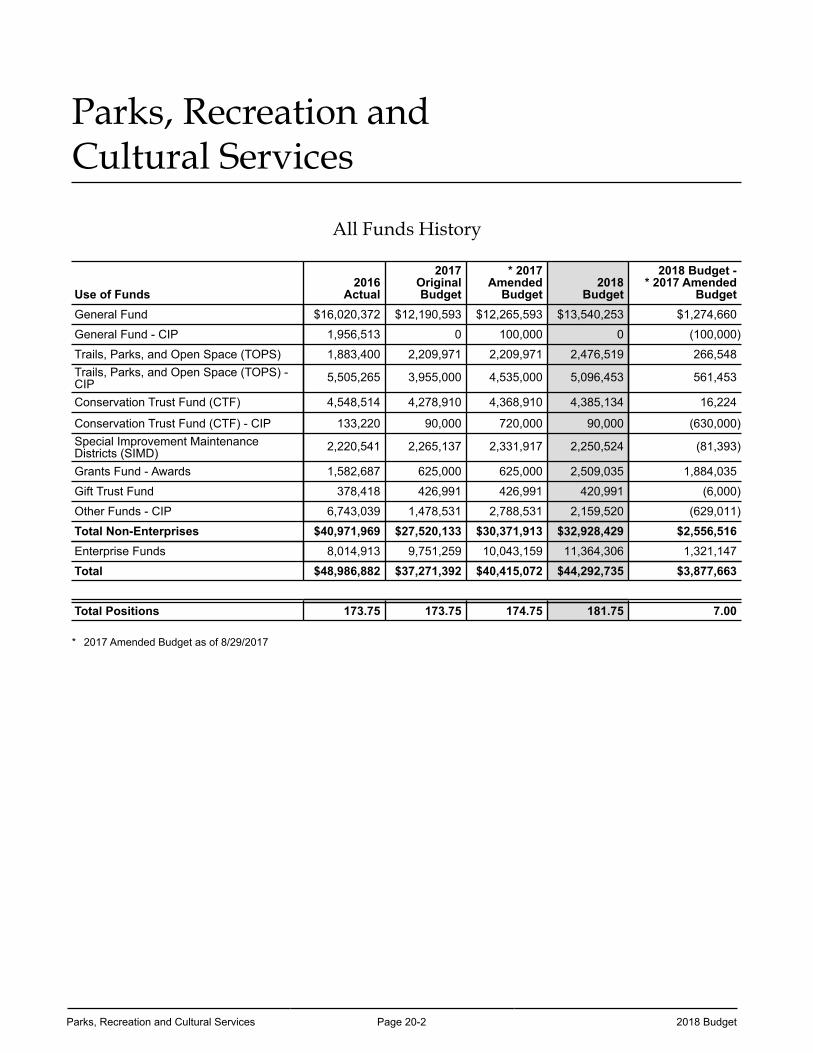
Parks, Recreation and Cultural Services Page 20-2 2018 Budget
Parks, Recreation andCultural Services
All Funds History
Use of Funds2016
Actual
2017OriginalBudget
* 2017Amended
Budget2018
Budget
2018 Budget -* 2017 Amended
BudgetGeneral Fund $16,020,372 $12,190,593 $12,265,593 $13,540,253 $1,274,660
General Fund - CIP 1,956,513 0 100,000 0 (100,000)
Trails, Parks, and Open Space (TOPS) 1,883,400 2,209,971 2,209,971 2,476,519 266,548Trails, Parks, and Open Space (TOPS) -CIP 5,505,265 3,955,000 4,535,000 5,096,453 561,453
Conservation Trust Fund (CTF) 4,548,514 4,278,910 4,368,910 4,385,134 16,224
Conservation Trust Fund (CTF) - CIP 133,220 90,000 720,000 90,000 (630,000)Special Improvement MaintenanceDistricts (SIMD) 2,220,541 2,265,137 2,331,917 2,250,524 (81,393)
Grants Fund - Awards 1,582,687 625,000 625,000 2,509,035 1,884,035
Gift Trust Fund 378,418 426,991 426,991 420,991 (6,000)
Other Funds - CIP 6,743,039 1,478,531 2,788,531 2,159,520 (629,011)
Total Non-Enterprises $40,971,969 $27,520,133 $30,371,913 $32,928,429 $2,556,516Enterprise Funds 8,014,913 9,751,259 10,043,159 11,364,306 1,321,147
Total $48,986,882 $37,271,392 $40,415,072 $44,292,735 $3,877,663
Total Positions 173.75 173.75 174.75 181.75 7.00
* 2017 Amended Budget as of 8/29/2017
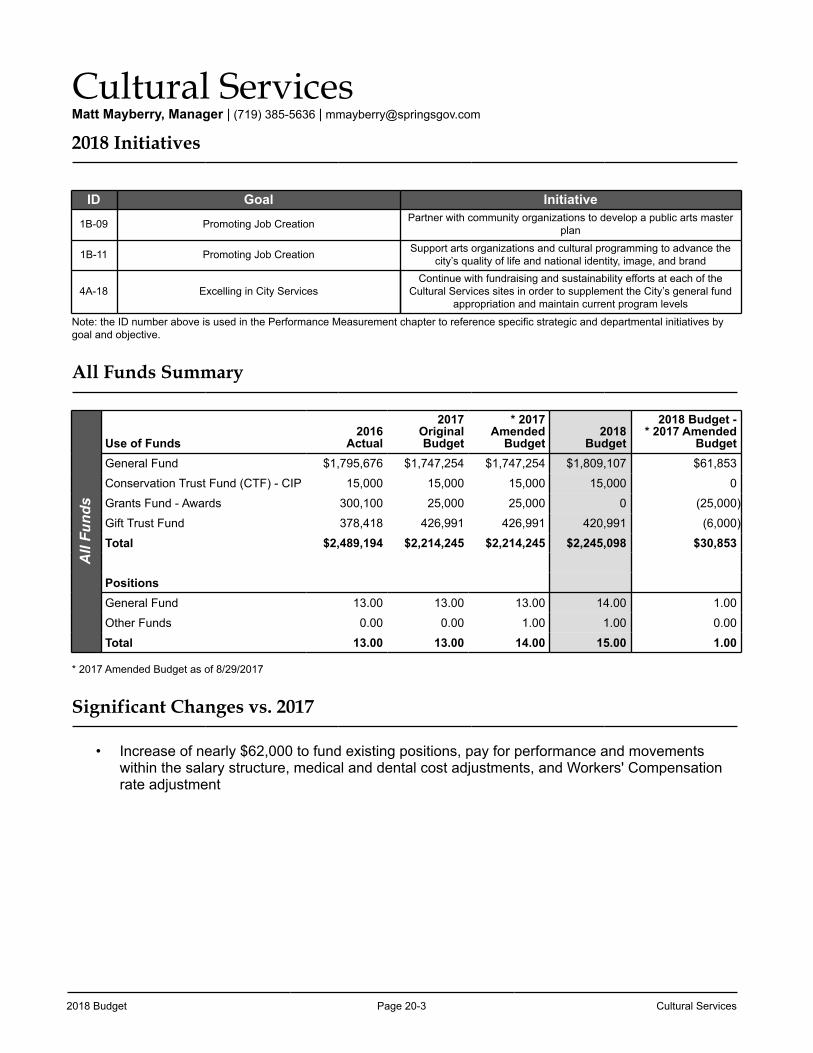
2018 Budget Page 20-3 Cultural Services
Cultural ServicesMatt Mayberry, Manager | (719) 385-5636 | [email protected]
2018 Initiatives
ID Goal Initiative
1B-09 Promoting Job Creation Partner with community organizations to develop a public arts master plan
1B-11 Promoting Job Creation Support arts organizations and cultural programming to advance the city’s quality of life and national identity, image, and brand
4A-18 Excelling in City ServicesContinue with fundraising and sustainability efforts at each of the
Cultural Services sites in order to supplement the City’s general fund appropriation and maintain current program levels
Note: the ID number above is used in the Performance Measurement chapter to reference specific strategic and departmental initiatives by goal and objective. All Funds Summary
All
Fund
s
Use of Funds2016
Actual
2017OriginalBudget
* 2017Amended
Budget2018
Budget
2018 Budget -* 2017 Amended
BudgetGeneral Fund $1,795,676 $1,747,254 $1,747,254 $1,809,107 $61,853
Conservation Trust Fund (CTF) - CIP 15,000 15,000 15,000 15,000 0
Grants Fund - Awards 300,100 25,000 25,000 0 (25,000)
Gift Trust Fund 378,418 426,991 426,991 420,991 (6,000)
Total $2,489,194 $2,214,245 $2,214,245 $2,245,098 $30,853
PositionsGeneral Fund 13.00 13.00 13.00 14.00 1.00
Other Funds 0.00 0.00 1.00 1.00 0.00
Total 13.00 13.00 14.00 15.00 1.00
* 2017 Amended Budget as of 8/29/2017
Significant Changes vs. 2017
• Increase of nearly $62,000 to fund existing positions, pay for performance and movements within the salary structure, medical and dental cost adjustments, and Workers' Compensation rate adjustment
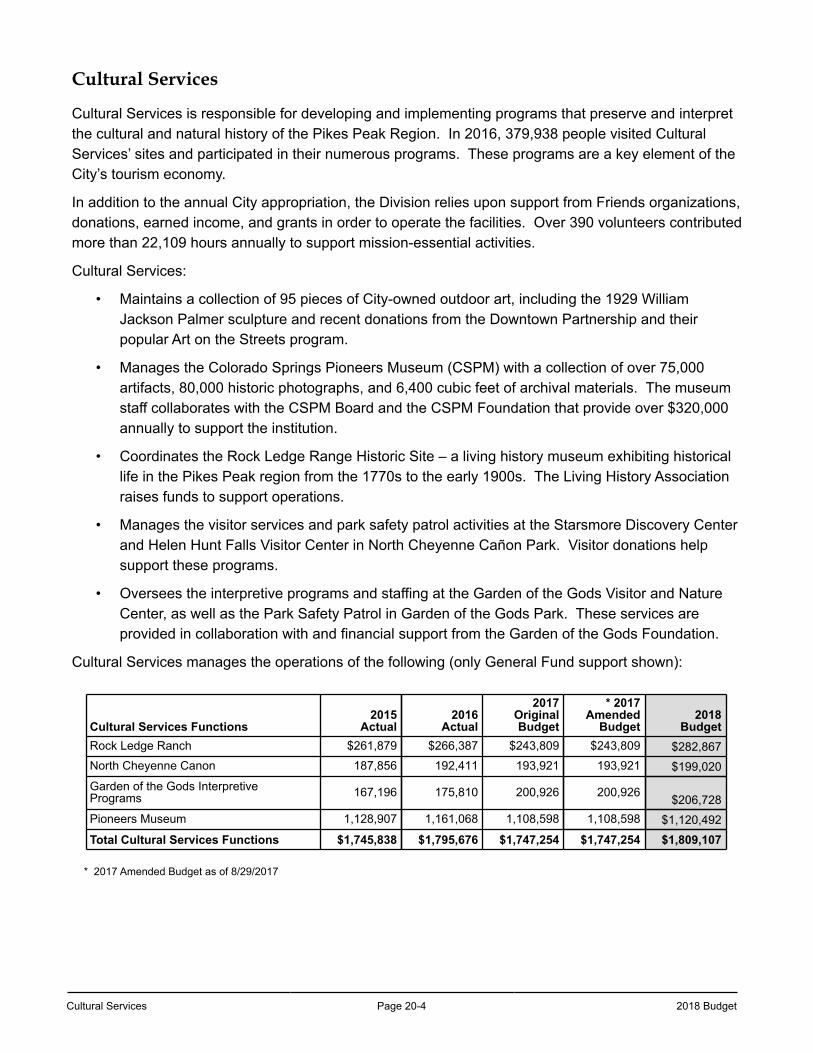
Cultural Services Page 20-4 2018 Budget
Cultural Services
Cultural Services is responsible for developing and implementing programs that preserve and interpret the cultural and natural history of the Pikes Peak Region. In 2016, 379,938 people visited Cultural Services’ sites and participated in their numerous programs. These programs are a key element of the City’s tourism economy.
In addition to the annual City appropriation, the Division relies upon support from Friends organizations, donations, earned income, and grants in order to operate the facilities. Over 390 volunteers contributed more than 22,109 hours annually to support mission-essential activities.
Cultural Services:
• Maintains a collection of 95 pieces of City-owned outdoor art, including the 1929 William Jackson Palmer sculpture and recent donations from the Downtown Partnership and their popular Art on the Streets program.
• Manages the Colorado Springs Pioneers Museum (CSPM) with a collection of over 75,000 artifacts, 80,000 historic photographs, and 6,400 cubic feet of archival materials. The museum staff collaborates with the CSPM Board and the CSPM Foundation that provide over $320,000 annually to support the institution.
• Coordinates the Rock Ledge Range Historic Site – a living history museum exhibiting historical life in the Pikes Peak region from the 1770s to the early 1900s. The Living History Association raises funds to support operations.
• Manages the visitor services and park safety patrol activities at the Starsmore Discovery Center and Helen Hunt Falls Visitor Center in North Cheyenne Cañon Park. Visitor donations help support these programs.
• Oversees the interpretive programs and staffing at the Garden of the Gods Visitor and Nature Center, as well as the Park Safety Patrol in Garden of the Gods Park. These services are provided in collaboration with and financial support from the Garden of the Gods Foundation.
Cultural Services manages the operations of the following (only General Fund support shown):
Cultural Services Functions2015
Actual2016
Actual
2017OriginalBudget
* 2017Amended
Budget2018
BudgetRock Ledge Ranch $261,879 $266,387 $243,809 $243,809 $282,867North Cheyenne Canon 187,856 192,411 193,921 193,921 $199,020Garden of the Gods InterpretivePrograms 167,196 175,810 200,926 200,926 $206,728Pioneers Museum 1,128,907 1,161,068 1,108,598 1,108,598 $1,120,492
Total Cultural Services Functions $1,745,838 $1,795,676 $1,747,254 $1,747,254 $1,809,107
* 2017 Amended Budget as of 8/29/2017
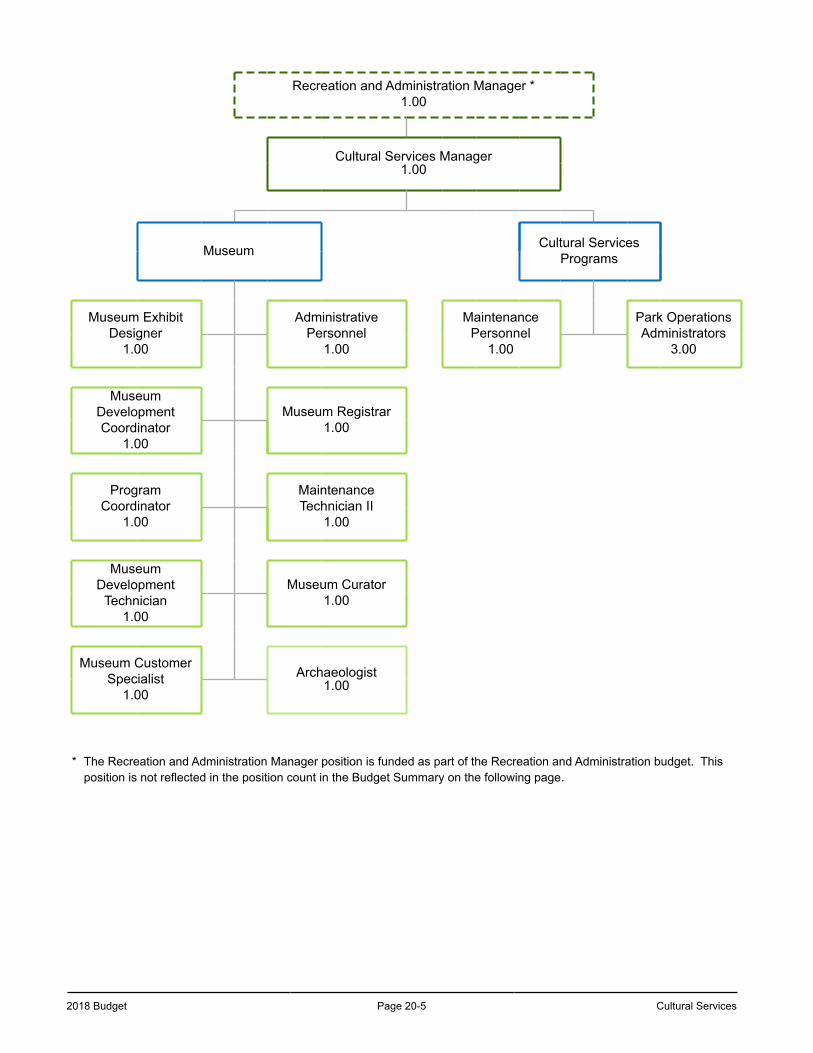
2018 Budget Page 20-5 Cultural Services
Recreation and Administration Manager *1.00
Cultural Services Manager1.00
Museum Cultural ServicesPrograms
Museum Exhibit Designer
1.00
Administrative Personnel
1.00
Maintenance Personnel
1.00
Park Operations Administrators
3.00
Museum Development Coordinator
1.00
Museum Registrar1.00
Program Coordinator
1.00
Maintenance Technician II
1.00
Museum Development
Technician1.00
Museum Curator1.00
Museum CustomerSpecialist
1.00
Archaeologist1.00
* The Recreation and Administration Manager position is funded as part of the Recreation and Administration budget. This position is not reflected in the position count in the Budget Summary on the following page.
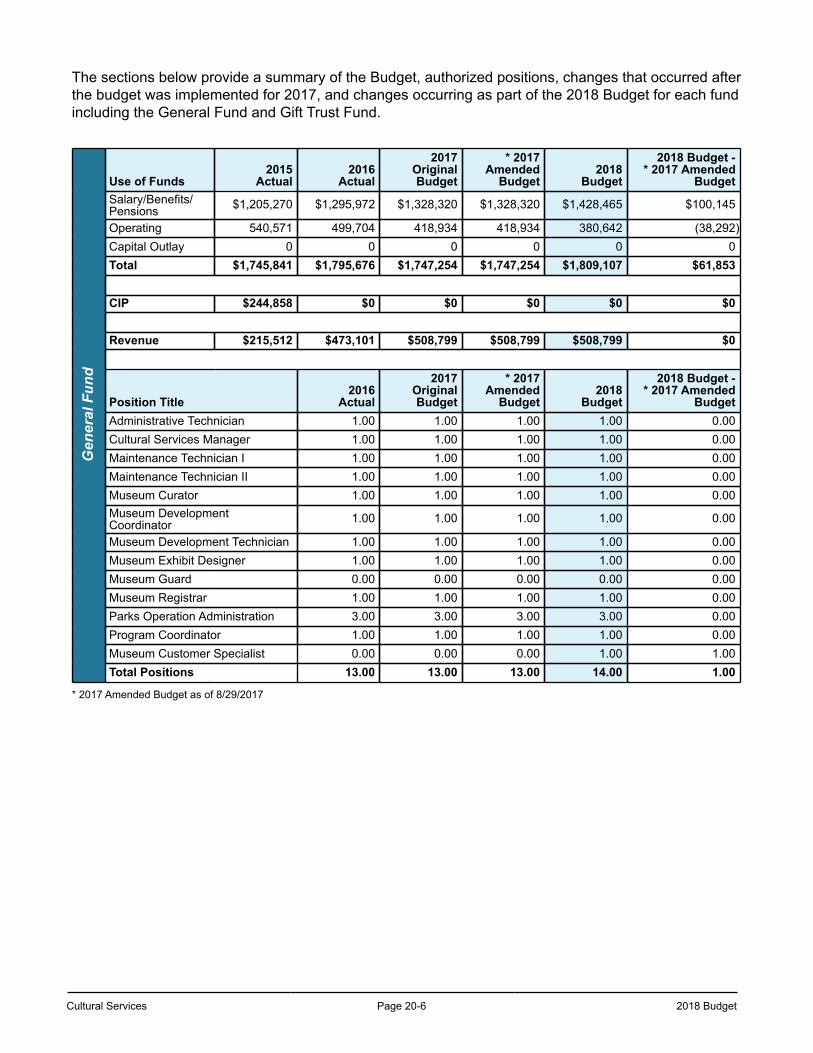
Cultural Services Page 20-6 2018 Budget
The sections below provide a summary of the Budget, authorized positions, changes that occurred afterthe budget was implemented for 2017, and changes occurring as part of the 2018 Budget for each fundincluding the General Fund and Gift Trust Fund.
Gen
eral
Fun
d
Use of Funds2015
Actual2016
Actual
2017OriginalBudget
* 2017Amended
Budget2018
Budget
2018 Budget -* 2017 Amended
BudgetSalary/Benefits/Pensions $1,205,270 $1,295,972 $1,328,320 $1,328,320 $1,428,465 $100,145
Operating 540,571 499,704 418,934 418,934 380,642 (38,292)Capital Outlay 0 0 0 0 0 0Total $1,745,841 $1,795,676 $1,747,254 $1,747,254 $1,809,107 $61,853
CIP $244,858 $0 $0 $0 $0 $0
Revenue $215,512 $473,101 $508,799 $508,799 $508,799 $0
Position Title2016
Actual
2017OriginalBudget
* 2017Amended
Budget2018
Budget
2018 Budget -* 2017 Amended
BudgetAdministrative Technician 1.00 1.00 1.00 1.00 0.00Cultural Services Manager 1.00 1.00 1.00 1.00 0.00Maintenance Technician I 1.00 1.00 1.00 1.00 0.00Maintenance Technician II 1.00 1.00 1.00 1.00 0.00Museum Curator 1.00 1.00 1.00 1.00 0.00Museum DevelopmentCoordinator 1.00 1.00 1.00 1.00 0.00
Museum Development Technician 1.00 1.00 1.00 1.00 0.00Museum Exhibit Designer 1.00 1.00 1.00 1.00 0.00Museum Guard 0.00 0.00 0.00 0.00 0.00Museum Registrar 1.00 1.00 1.00 1.00 0.00Parks Operation Administration 3.00 3.00 3.00 3.00 0.00Program Coordinator 1.00 1.00 1.00 1.00 0.00Museum Customer Specialist 0.00 0.00 0.00 1.00 1.00Total Positions 13.00 13.00 13.00 14.00 1.00
* 2017 Amended Budget as of 8/29/2017
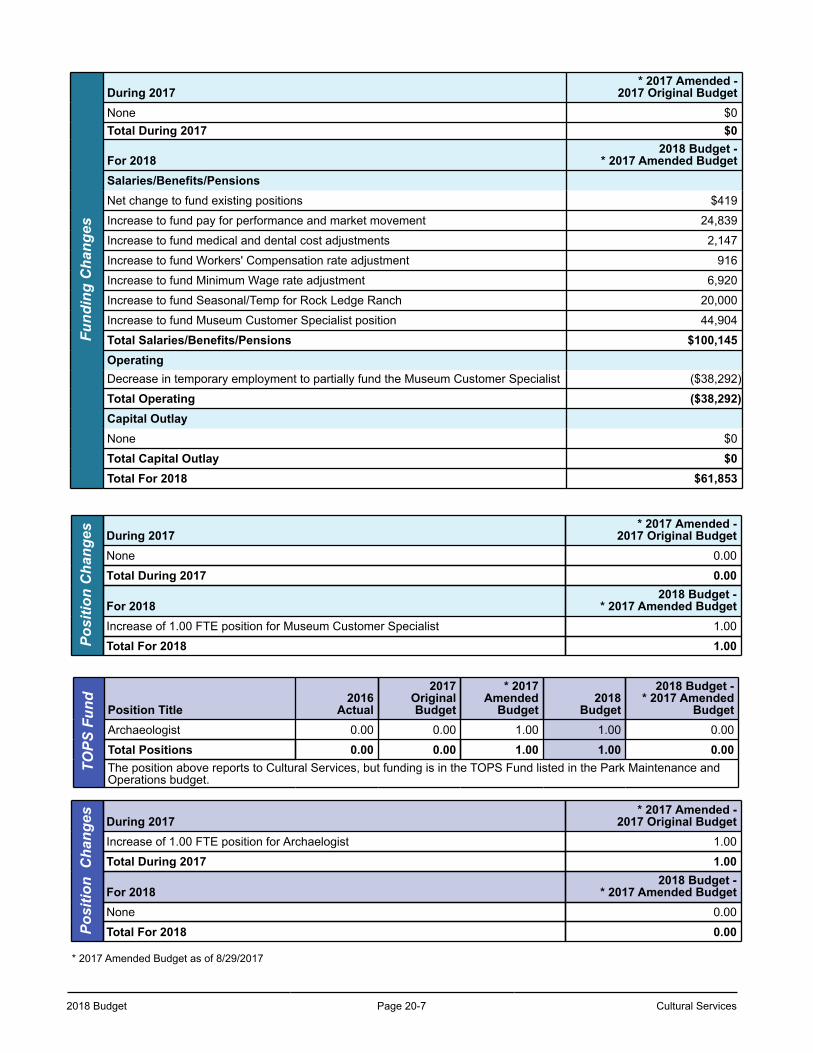
2018 Budget Page 20-7 Cultural Services
Fund
ing
Cha
nges
During 2017* 2017 Amended -
2017 Original BudgetNone $0Total During 2017 $0
For 20182018 Budget -
* 2017 Amended BudgetSalaries/Benefits/PensionsNet change to fund existing positions $419
Increase to fund pay for performance and market movement 24,839
Increase to fund medical and dental cost adjustments 2,147
Increase to fund Workers' Compensation rate adjustment 916
Increase to fund Minimum Wage rate adjustment 6,920
Increase to fund Seasonal/Temp for Rock Ledge Ranch 20,000
Increase to fund Museum Customer Specialist position 44,904
Total Salaries/Benefits/Pensions $100,145OperatingDecrease in temporary employment to partially fund the Museum Customer Specialist ($38,292)
Total Operating ($38,292)Capital OutlayNone $0
Total Capital Outlay $0Total For 2018 $61,853
Posi
tion
Cha
nges During 2017
* 2017 Amended -2017 Original Budget
None 0.00
Total During 2017 0.00
For 20182018 Budget -
* 2017 Amended BudgetIncrease of 1.00 FTE position for Museum Customer Specialist 1.00
Total For 2018 1.00
TOPS
Fun
d
Position Title2016
Actual
2017OriginalBudget
* 2017Amended
Budget2018
Budget
2018 Budget -* 2017 Amended
BudgetArchaeologist 0.00 0.00 1.00 1.00 0.00
Total Positions 0.00 0.00 1.00 1.00 0.00The position above reports to Cultural Services, but funding is in the TOPS Fund listed in the Park Maintenance andOperations budget.
Posi
tion
Cha
nges During 2017
* 2017 Amended -2017 Original Budget
Increase of 1.00 FTE position for Archaelogist 1.00
Total During 2017 1.00
For 20182018 Budget -
* 2017 Amended BudgetNone 0.00
Total For 2018 0.00
* 2017 Amended Budget as of 8/29/2017
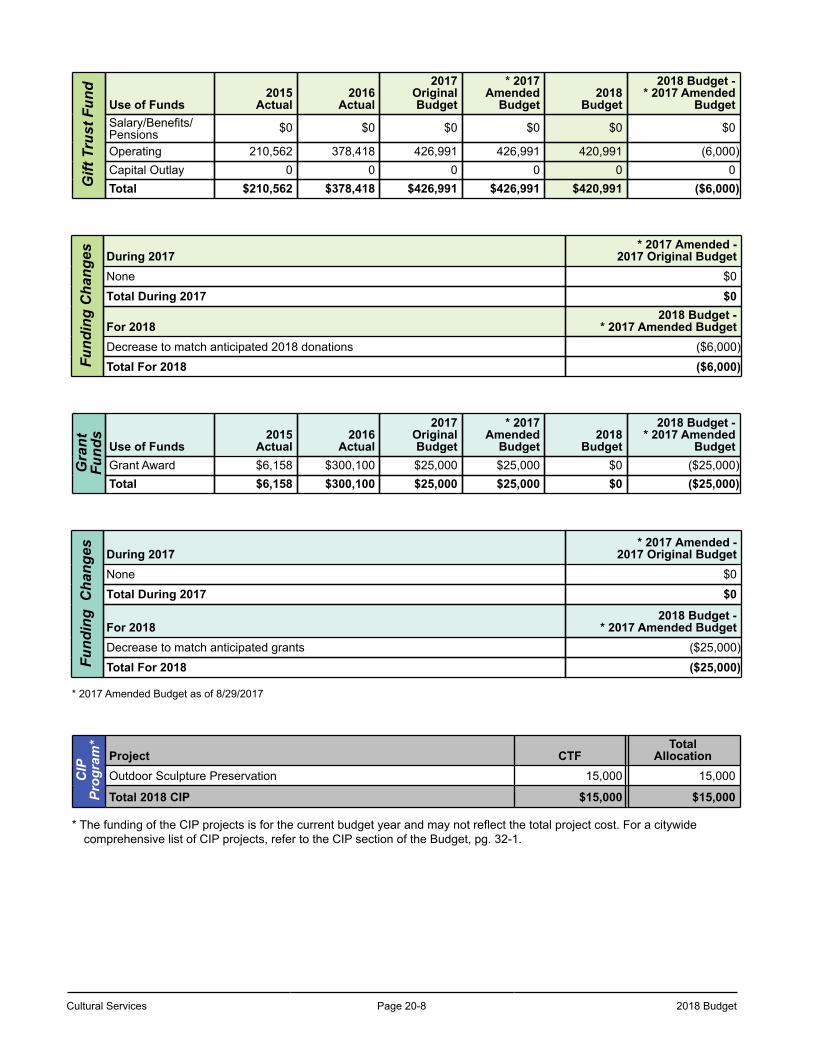
Cultural Services Page 20-8 2018 Budget
Gift
Tru
st F
und
Use of Funds2015
Actual2016
Actual
2017OriginalBudget
* 2017Amended
Budget2018
Budget
2018 Budget -* 2017 Amended
BudgetSalary/Benefits/Pensions $0 $0 $0 $0 $0 $0
Operating 210,562 378,418 426,991 426,991 420,991 (6,000)Capital Outlay 0 0 0 0 0 0Total $210,562 $378,418 $426,991 $426,991 $420,991 ($6,000)
Fund
ing
Cha
nges During 2017
* 2017 Amended -2017 Original Budget
None $0
Total During 2017 $0
For 20182018 Budget -
* 2017 Amended BudgetDecrease to match anticipated 2018 donations ($6,000)
Total For 2018 ($6,000)
Gra
ntFu
nds
Use of Funds2015
Actual2016
Actual
2017OriginalBudget
* 2017Amended
Budget2018
Budget
2018 Budget -* 2017 Amended
BudgetGrant Award $6,158 $300,100 $25,000 $25,000 $0 ($25,000)Total $6,158 $300,100 $25,000 $25,000 $0 ($25,000)
Fund
ing
Cha
nges During 2017
* 2017 Amended -2017 Original Budget
None $0
Total During 2017 $0
For 20182018 Budget -
* 2017 Amended BudgetDecrease to match anticipated grants ($25,000)
Total For 2018 ($25,000)
* 2017 Amended Budget as of 8/29/2017
CIP
Prog
ram
*
Project CTFTotal
AllocationOutdoor Sculpture Preservation 15,000 15,000
Total 2018 CIP $15,000 $15,000
* The funding of the CIP projects is for the current budget year and may not reflect the total project cost. For a citywide comprehensive list of CIP projects, refer to the CIP section of the Budget, pg. 32-1.
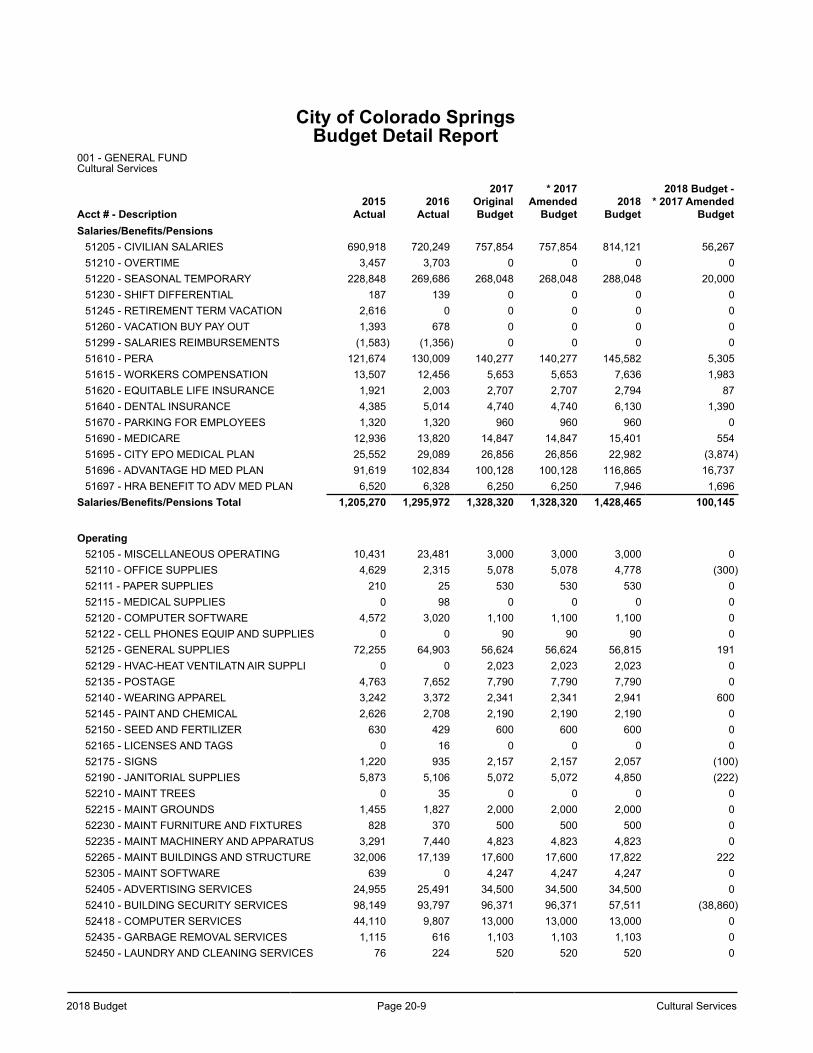
2018 Budget Page 20-9 Cultural Services
City of Colorado SpringsBudget Detail Report
001 - GENERAL FUNDCultural Services
Acct # - Description2015
Actual2016
Actual
2017OriginalBudget
* 2017Amended
Budget2018
Budget
2018 Budget -* 2017 Amended
BudgetSalaries/Benefits/Pensions
51205 - CIVILIAN SALARIES 690,918 720,249 757,854 757,854 814,121 56,26751210 - OVERTIME 3,457 3,703 0 0 0 051220 - SEASONAL TEMPORARY 228,848 269,686 268,048 268,048 288,048 20,00051230 - SHIFT DIFFERENTIAL 187 139 0 0 0 051245 - RETIREMENT TERM VACATION 2,616 0 0 0 0 051260 - VACATION BUY PAY OUT 1,393 678 0 0 0 051299 - SALARIES REIMBURSEMENTS (1,583) (1,356) 0 0 0 051610 - PERA 121,674 130,009 140,277 140,277 145,582 5,30551615 - WORKERS COMPENSATION 13,507 12,456 5,653 5,653 7,636 1,98351620 - EQUITABLE LIFE INSURANCE 1,921 2,003 2,707 2,707 2,794 8751640 - DENTAL INSURANCE 4,385 5,014 4,740 4,740 6,130 1,39051670 - PARKING FOR EMPLOYEES 1,320 1,320 960 960 960 051690 - MEDICARE 12,936 13,820 14,847 14,847 15,401 55451695 - CITY EPO MEDICAL PLAN 25,552 29,089 26,856 26,856 22,982 (3,874)51696 - ADVANTAGE HD MED PLAN 91,619 102,834 100,128 100,128 116,865 16,73751697 - HRA BENEFIT TO ADV MED PLAN 6,520 6,328 6,250 6,250 7,946 1,696
Salaries/Benefits/Pensions Total 1,205,270 1,295,972 1,328,320 1,328,320 1,428,465 100,145
Operating52105 - MISCELLANEOUS OPERATING 10,431 23,481 3,000 3,000 3,000 052110 - OFFICE SUPPLIES 4,629 2,315 5,078 5,078 4,778 (300)52111 - PAPER SUPPLIES 210 25 530 530 530 052115 - MEDICAL SUPPLIES 0 98 0 0 0 052120 - COMPUTER SOFTWARE 4,572 3,020 1,100 1,100 1,100 052122 - CELL PHONES EQUIP AND SUPPLIES 0 0 90 90 90 052125 - GENERAL SUPPLIES 72,255 64,903 56,624 56,624 56,815 19152129 - HVAC-HEAT VENTILATN AIR SUPPLI 0 0 2,023 2,023 2,023 052135 - POSTAGE 4,763 7,652 7,790 7,790 7,790 052140 - WEARING APPAREL 3,242 3,372 2,341 2,341 2,941 60052145 - PAINT AND CHEMICAL 2,626 2,708 2,190 2,190 2,190 052150 - SEED AND FERTILIZER 630 429 600 600 600 052165 - LICENSES AND TAGS 0 16 0 0 0 052175 - SIGNS 1,220 935 2,157 2,157 2,057 (100)52190 - JANITORIAL SUPPLIES 5,873 5,106 5,072 5,072 4,850 (222)52210 - MAINT TREES 0 35 0 0 0 052215 - MAINT GROUNDS 1,455 1,827 2,000 2,000 2,000 052230 - MAINT FURNITURE AND FIXTURES 828 370 500 500 500 052235 - MAINT MACHINERY AND APPARATUS 3,291 7,440 4,823 4,823 4,823 052265 - MAINT BUILDINGS AND STRUCTURE 32,006 17,139 17,600 17,600 17,822 22252305 - MAINT SOFTWARE 639 0 4,247 4,247 4,247 052405 - ADVERTISING SERVICES 24,955 25,491 34,500 34,500 34,500 052410 - BUILDING SECURITY SERVICES 98,149 93,797 96,371 96,371 57,511 (38,860)52418 - COMPUTER SERVICES 44,110 9,807 13,000 13,000 13,000 052435 - GARBAGE REMOVAL SERVICES 1,115 616 1,103 1,103 1,103 052450 - LAUNDRY AND CLEANING SERVICES 76 224 520 520 520 0
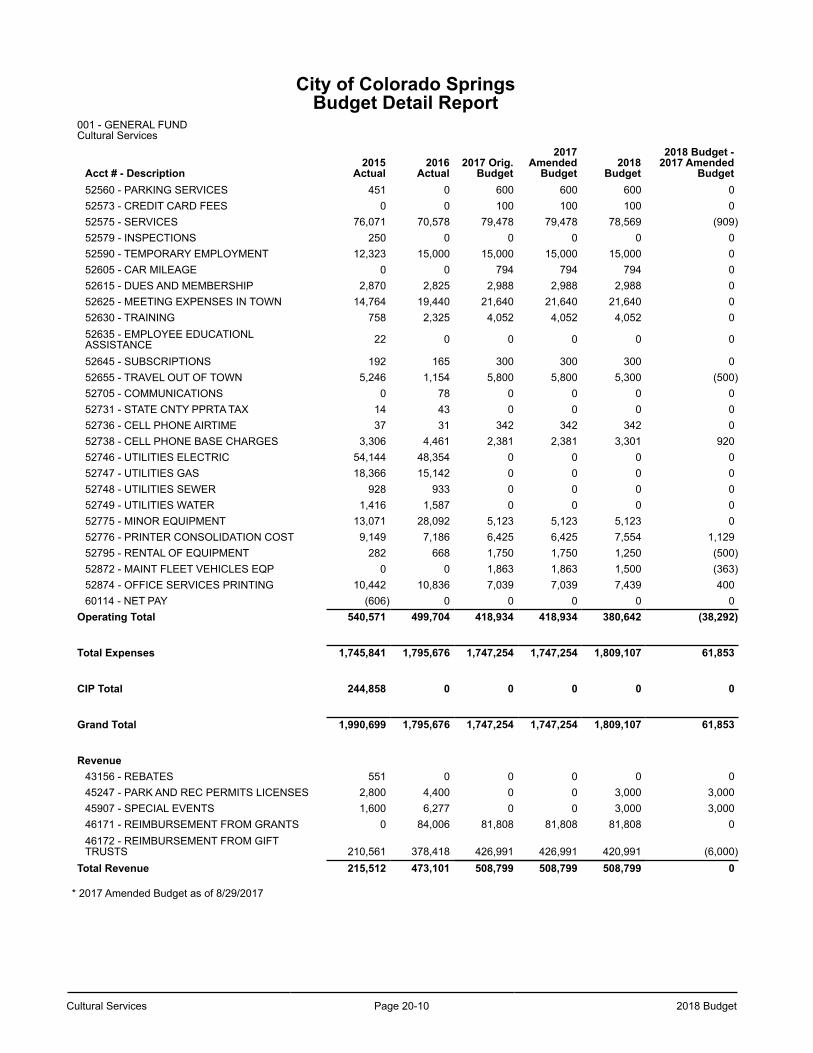
Cultural Services Page 20-10 2018 Budget
City of Colorado SpringsBudget Detail Report
001 - GENERAL FUNDCultural Services
Acct # - Description2015
Actual2016
Actual2017 Orig.
Budget
2017Amended
Budget2018
Budget
2018 Budget -2017 Amended
Budget52560 - PARKING SERVICES 451 0 600 600 600 052573 - CREDIT CARD FEES 0 0 100 100 100 052575 - SERVICES 76,071 70,578 79,478 79,478 78,569 (909)52579 - INSPECTIONS 250 0 0 0 0 052590 - TEMPORARY EMPLOYMENT 12,323 15,000 15,000 15,000 15,000 052605 - CAR MILEAGE 0 0 794 794 794 052615 - DUES AND MEMBERSHIP 2,870 2,825 2,988 2,988 2,988 052625 - MEETING EXPENSES IN TOWN 14,764 19,440 21,640 21,640 21,640 052630 - TRAINING 758 2,325 4,052 4,052 4,052 052635 - EMPLOYEE EDUCATIONLASSISTANCE 22 0 0 0 0 0
52645 - SUBSCRIPTIONS 192 165 300 300 300 052655 - TRAVEL OUT OF TOWN 5,246 1,154 5,800 5,800 5,300 (500)52705 - COMMUNICATIONS 0 78 0 0 0 052731 - STATE CNTY PPRTA TAX 14 43 0 0 0 052736 - CELL PHONE AIRTIME 37 31 342 342 342 052738 - CELL PHONE BASE CHARGES 3,306 4,461 2,381 2,381 3,301 92052746 - UTILITIES ELECTRIC 54,144 48,354 0 0 0 052747 - UTILITIES GAS 18,366 15,142 0 0 0 052748 - UTILITIES SEWER 928 933 0 0 0 052749 - UTILITIES WATER 1,416 1,587 0 0 0 052775 - MINOR EQUIPMENT 13,071 28,092 5,123 5,123 5,123 052776 - PRINTER CONSOLIDATION COST 9,149 7,186 6,425 6,425 7,554 1,12952795 - RENTAL OF EQUIPMENT 282 668 1,750 1,750 1,250 (500)52872 - MAINT FLEET VEHICLES EQP 0 0 1,863 1,863 1,500 (363)52874 - OFFICE SERVICES PRINTING 10,442 10,836 7,039 7,039 7,439 40060114 - NET PAY (606) 0 0 0 0 0
Operating Total 540,571 499,704 418,934 418,934 380,642 (38,292)
Total Expenses 1,745,841 1,795,676 1,747,254 1,747,254 1,809,107 61,853
CIP Total 244,858 0 0 0 0 0
Grand Total 1,990,699 1,795,676 1,747,254 1,747,254 1,809,107 61,853
Revenue43156 - REBATES 551 0 0 0 0 045247 - PARK AND REC PERMITS LICENSES 2,800 4,400 0 0 3,000 3,00045907 - SPECIAL EVENTS 1,600 6,277 0 0 3,000 3,00046171 - REIMBURSEMENT FROM GRANTS 0 84,006 81,808 81,808 81,808 046172 - REIMBURSEMENT FROM GIFTTRUSTS 210,561 378,418 426,991 426,991 420,991 (6,000)
Total Revenue 215,512 473,101 508,799 508,799 508,799 0
* 2017 Amended Budget as of 8/29/2017
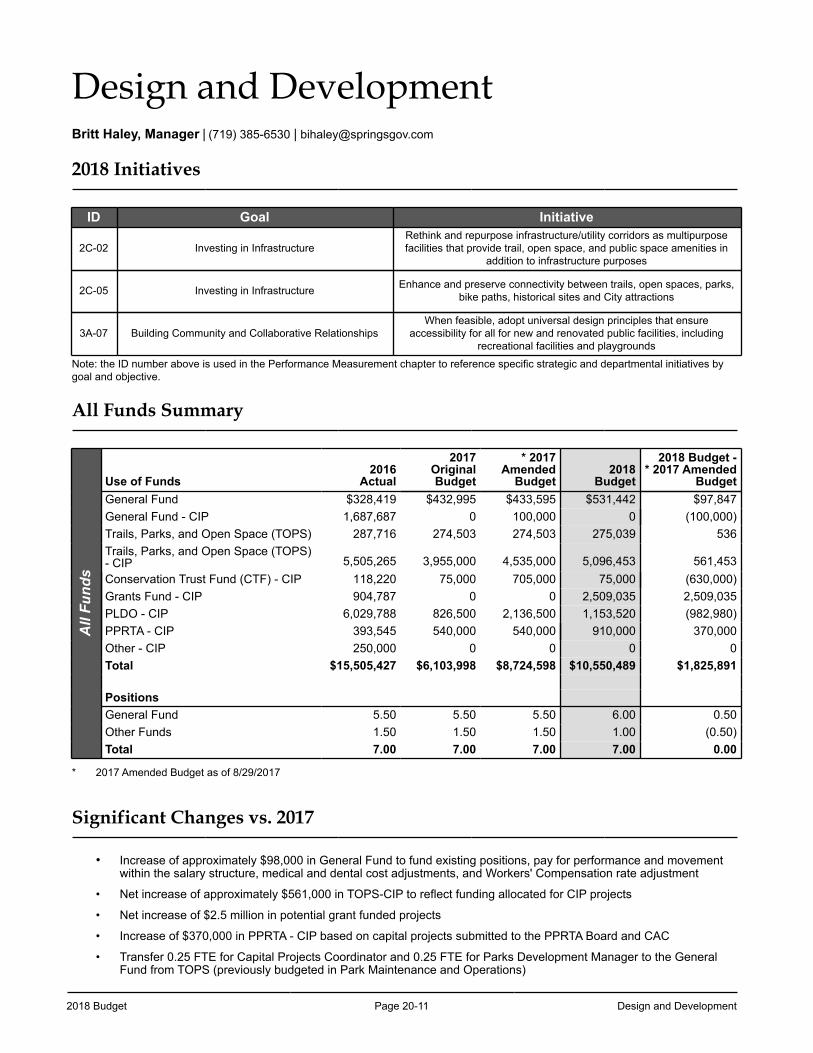
2018 Budget Page 20-11 Design and Development
Design and DevelopmentBritt Haley, Manager | (719) 385-6530 | [email protected]
2018 Initiatives
ID Goal Initiative
2C-02 Investing in InfrastructureRethink and repurpose infrastructure/utility corridors as multipurposefacilities that provide trail, open space, and public space amenities in
addition to infrastructure purposes
2C-05 Investing in Infrastructure Enhance and preserve connectivity between trails, open spaces, parks,bike paths, historical sites and City attractions
3A-07 Building Community and Collaborative RelationshipsWhen feasible, adopt universal design principles that ensure
accessibility for all for new and renovated public facilities, including recreational facilities and playgrounds
Note: the ID number above is used in the Performance Measurement chapter to reference specific strategic and departmental initiatives by goal and objective.
All Funds Summary
All
Fund
s
Use of Funds2016
Actual
2017OriginalBudget
* 2017Amended
Budget2018
Budget
2018 Budget -* 2017 Amended
BudgetGeneral Fund $328,419 $432,995 $433,595 $531,442 $97,847General Fund - CIP 1,687,687 0 100,000 0 (100,000)Trails, Parks, and Open Space (TOPS) 287,716 274,503 274,503 275,039 536Trails, Parks, and Open Space (TOPS)- CIP 5,505,265 3,955,000 4,535,000 5,096,453 561,453Conservation Trust Fund (CTF) - CIP 118,220 75,000 705,000 75,000 (630,000)Grants Fund - CIP 904,787 0 0 2,509,035 2,509,035PLDO - CIP 6,029,788 826,500 2,136,500 1,153,520 (982,980)PPRTA - CIP 393,545 540,000 540,000 910,000 370,000Other - CIP 250,000 0 0 0 0Total $15,505,427 $6,103,998 $8,724,598 $10,550,489 $1,825,891
PositionsGeneral Fund 5.50 5.50 5.50 6.00 0.50Other Funds 1.50 1.50 1.50 1.00 (0.50)Total 7.00 7.00 7.00 7.00 0.00
* 2017 Amended Budget as of 8/29/2017
Significant Changes vs. 2017
• Increase of approximately $98,000 in General Fund to fund existing positions, pay for performance and movement within the salary structure, medical and dental cost adjustments, and Workers' Compensation rate adjustment
• Net increase of approximately $561,000 in TOPS-CIP to reflect funding allocated for CIP projects
• Net increase of $2.5 million in potential grant funded projects
• Increase of $370,000 in PPRTA - CIP based on capital projects submitted to the PPRTA Board and CAC
• Transfer 0.25 FTE for Capital Projects Coordinator and 0.25 FTE for Parks Development Manager to the General Fund from TOPS (previously budgeted in Park Maintenance and Operations)
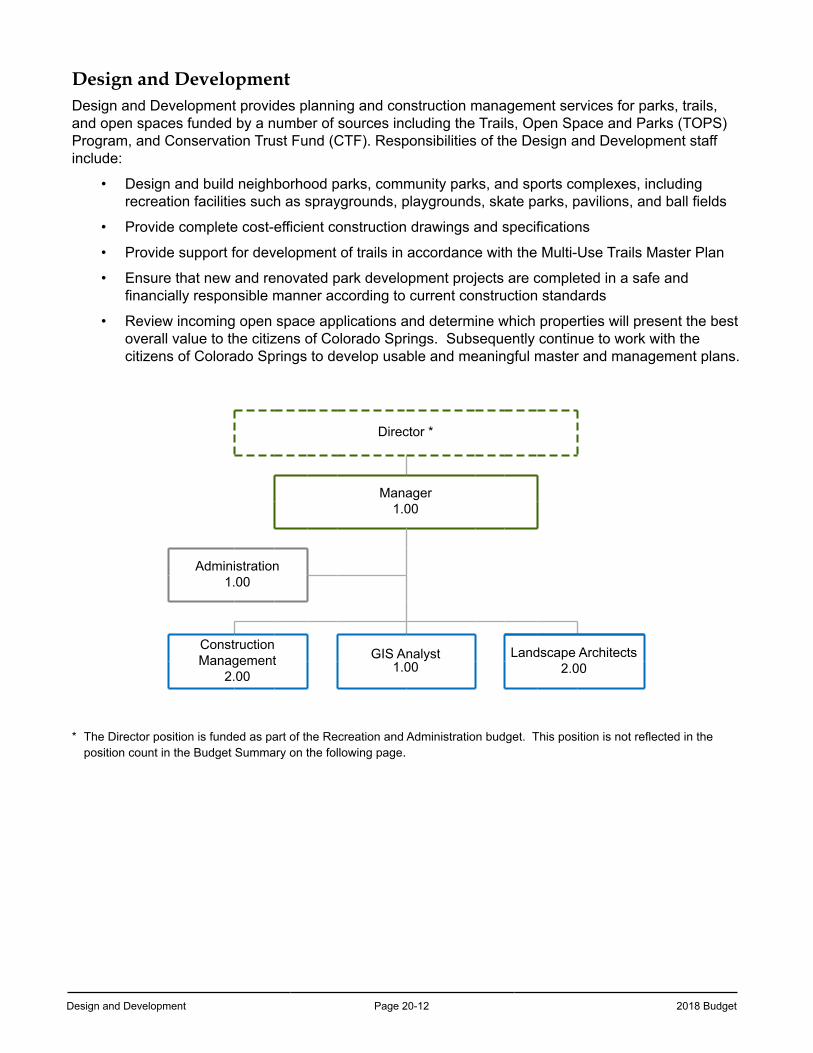
Design and Development Page 20-12 2018 Budget
Design and DevelopmentDesign and Development provides planning and construction management services for parks, trails, and open spaces funded by a number of sources including the Trails, Open Space and Parks (TOPS) Program, and Conservation Trust Fund (CTF). Responsibilities of the Design and Development staff include:
• Design and build neighborhood parks, community parks, and sports complexes, including recreation facilities such as spraygrounds, playgrounds, skate parks, pavilions, and ball fields
• Provide complete cost-efficient construction drawings and specifications
• Provide support for development of trails in accordance with the Multi-Use Trails Master Plan
• Ensure that new and renovated park development projects are completed in a safe and financially responsible manner according to current construction standards
• Review incoming open space applications and determine which properties will present the best overall value to the citizens of Colorado Springs. Subsequently continue to work with the citizens of Colorado Springs to develop usable and meaningful master and management plans.
Director *
Manager 1.00
Administration 1.00
Construction Management
2.00
GIS Analyst1.00
Landscape Architects2.00
* The Director position is funded as part of the Recreation and Administration budget. This position is not reflected in the position count in the Budget Summary on the following page.
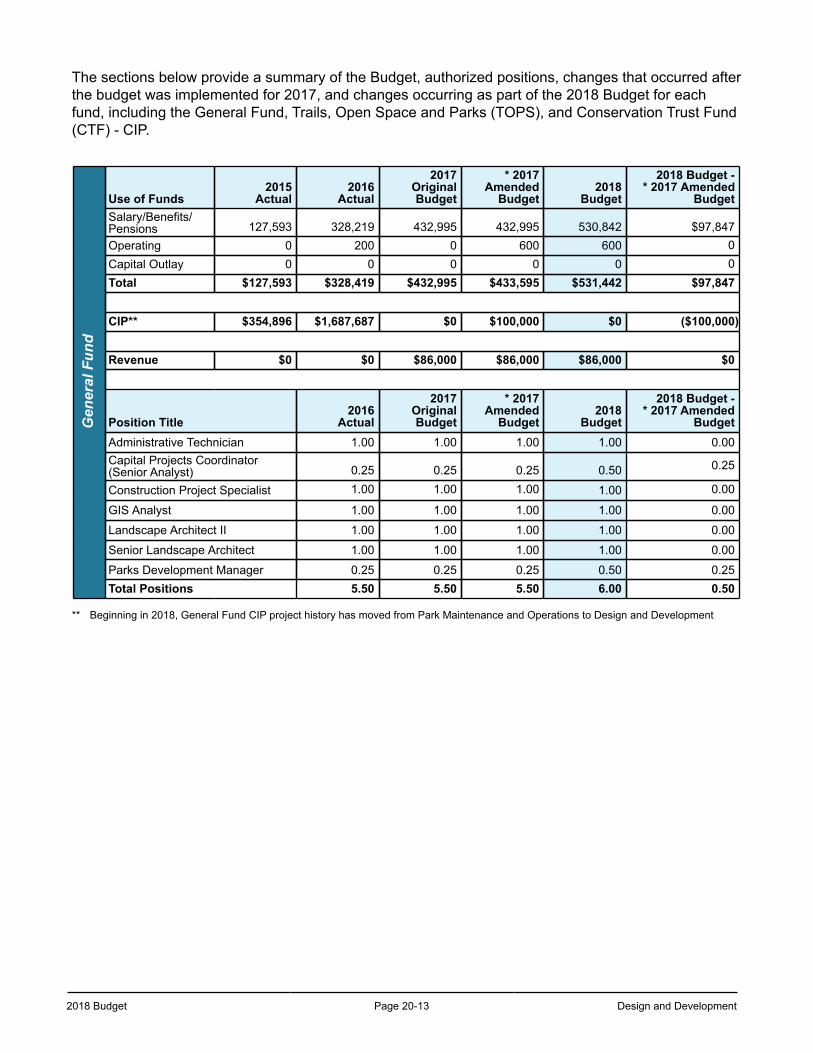
2018 Budget Page 20-13 Design and Development
The sections below provide a summary of the Budget, authorized positions, changes that occurred after the budget was implemented for 2017, and changes occurring as part of the 2018 Budget for each fund, including the General Fund, Trails, Open Space and Parks (TOPS), and Conservation Trust Fund (CTF) - CIP.
Gen
eral
Fun
d
Use of Funds2015
Actual2016
Actual
2017OriginalBudget
* 2017Amended
Budget2018
Budget
2018 Budget -* 2017 Amended
BudgetSalary/Benefits/Pensions 127,593 328,219 432,995 432,995 530,842 $97,847Operating 0 200 0 600 600 0Capital Outlay 0 0 0 0 0 0Total $127,593 $328,419 $432,995 $433,595 $531,442 $97,847
CIP** $354,896 $1,687,687 $0 $100,000 $0 ($100,000)
Revenue $0 $0 $86,000 $86,000 $86,000 $0
Position Title2016
Actual
2017OriginalBudget
* 2017Amended
Budget2018
Budget
2018 Budget -* 2017 Amended
BudgetAdministrative Technician 1.00 1.00 1.00 1.00 0.00Capital Projects Coordinator(Senior Analyst) 0.25 0.25 0.25 0.50 0.25
Construction Project Specialist 1.00 1.00 1.00 1.00 0.00
GIS Analyst 1.00 1.00 1.00 1.00 0.00
Landscape Architect II 1.00 1.00 1.00 1.00 0.00
Senior Landscape Architect 1.00 1.00 1.00 1.00 0.00
Parks Development Manager 0.25 0.25 0.25 0.50 0.25Total Positions 5.50 5.50 5.50 6.00 0.50
** Beginning in 2018, General Fund CIP project history has moved from Park Maintenance and Operations to Design and Development
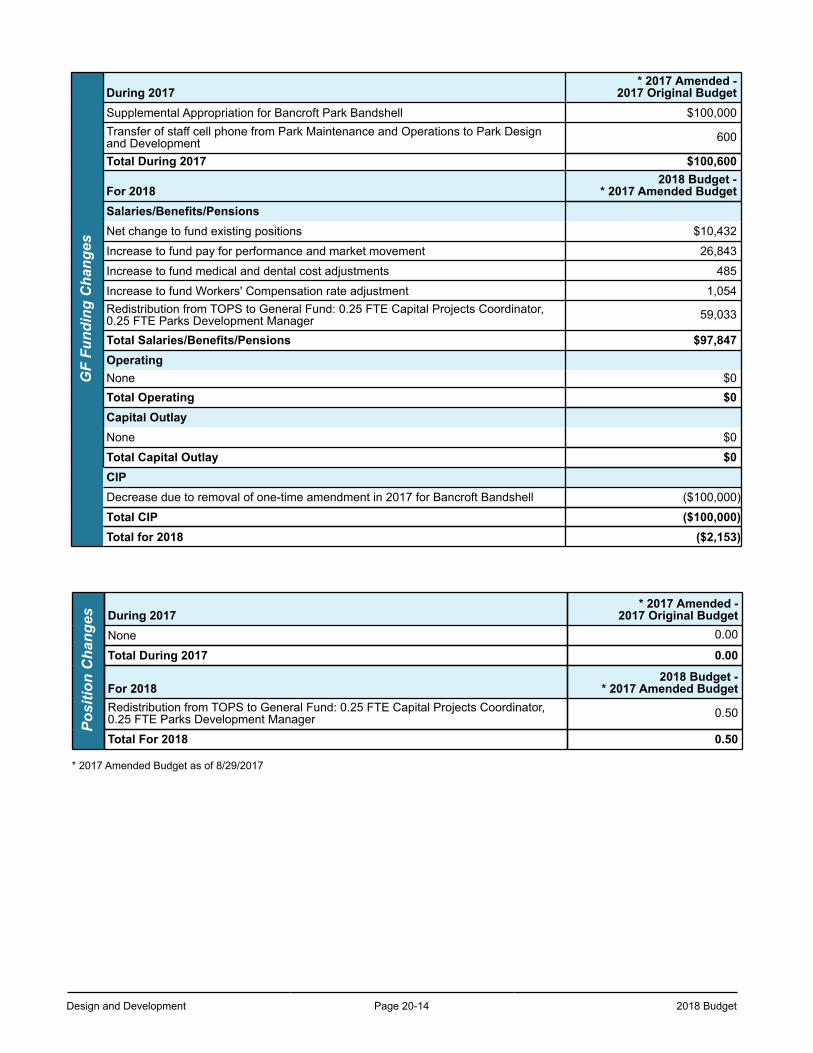
Design and Development Page 20-14 2018 Budget
GF
Fund
ing
Cha
nges
During 2017* 2017 Amended -
2017 Original BudgetSupplemental Appropriation for Bancroft Park Bandshell $100,000Transfer of staff cell phone from Park Maintenance and Operations to Park Designand Development 600
Total During 2017 $100,600
For 20182018 Budget -
* 2017 Amended BudgetSalaries/Benefits/PensionsNet change to fund existing positions $10,432
Increase to fund pay for performance and market movement 26,843
Increase to fund medical and dental cost adjustments 485
Increase to fund Workers' Compensation rate adjustment 1,054Redistribution from TOPS to General Fund: 0.25 FTE Capital Projects Coordinator,0.25 FTE Parks Development Manager 59,033
Total Salaries/Benefits/Pensions $97,847OperatingNone $0Total Operating $0Capital OutlayNone $0
Total Capital Outlay $0CIPDecrease due to removal of one-time amendment in 2017 for Bancroft Bandshell ($100,000)
Total CIP ($100,000)Total for 2018 ($2,153)
Posi
tion
Cha
nges During 2017
* 2017 Amended -2017 Original Budget
None 0.00
Total During 2017 0.00
For 20182018 Budget -
* 2017 Amended BudgetRedistribution from TOPS to General Fund: 0.25 FTE Capital Projects Coordinator,0.25 FTE Parks Development Manager 0.50
Total For 2018 0.50
* 2017 Amended Budget as of 8/29/2017
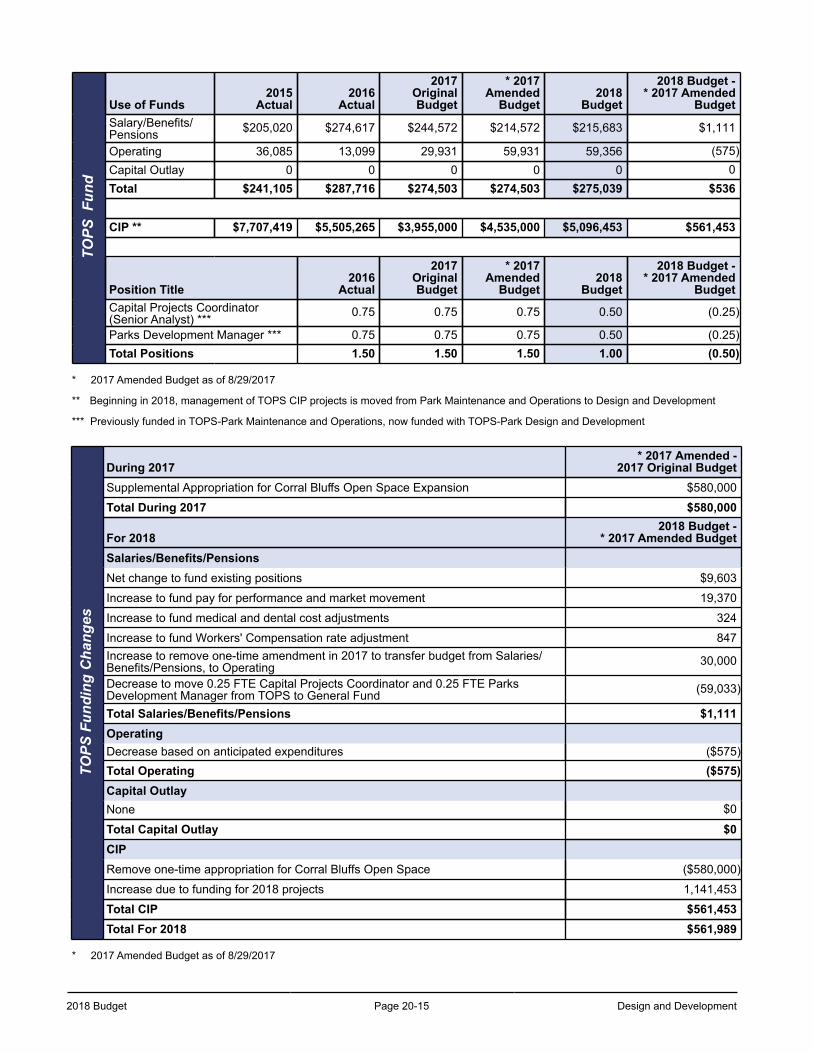
2018 Budget Page 20-15 Design and Development
TOPS
Fun
dUse of Funds
2015Actual
2016Actual
2017OriginalBudget
* 2017Amended
Budget2018
Budget
2018 Budget -* 2017 Amended
BudgetSalary/Benefits/Pensions $205,020 $274,617 $244,572 $214,572 $215,683 $1,111
Operating 36,085 13,099 29,931 59,931 59,356 (575)Capital Outlay 0 0 0 0 0 0Total $241,105 $287,716 $274,503 $274,503 $275,039 $536
CIP ** $7,707,419 $5,505,265 $3,955,000 $4,535,000 $5,096,453 $561,453
Position Title2016
Actual
2017OriginalBudget
* 2017Amended
Budget2018
Budget
2018 Budget -* 2017 Amended
BudgetCapital Projects Coordinator(Senior Analyst) *** 0.75 0.75 0.75 0.50 (0.25)
Parks Development Manager *** 0.75 0.75 0.75 0.50 (0.25)Total Positions 1.50 1.50 1.50 1.00 (0.50)
* 2017 Amended Budget as of 8/29/2017
** Beginning in 2018, management of TOPS CIP projects is moved from Park Maintenance and Operations to Design and Development
*** Previously funded in TOPS-Park Maintenance and Operations, now funded with TOPS-Park Design and Development
TOPS
Fun
ding
Cha
nges
During 2017* 2017 Amended -
2017 Original BudgetSupplemental Appropriation for Corral Bluffs Open Space Expansion $580,000
Total During 2017 $580,000
For 20182018 Budget -
* 2017 Amended BudgetSalaries/Benefits/PensionsNet change to fund existing positions $9,603
Increase to fund pay for performance and market movement 19,370
Increase to fund medical and dental cost adjustments 324
Increase to fund Workers' Compensation rate adjustment 847Increase to remove one-time amendment in 2017 to transfer budget from Salaries/Benefits/Pensions, to Operating 30,000
Decrease to move 0.25 FTE Capital Projects Coordinator and 0.25 FTE ParksDevelopment Manager from TOPS to General Fund (59,033)
Total Salaries/Benefits/Pensions $1,111OperatingDecrease based on anticipated expenditures ($575)Total Operating ($575)Capital OutlayNone $0
Total Capital Outlay $0CIPRemove one-time appropriation for Corral Bluffs Open Space ($580,000)
Increase due to funding for 2018 projects 1,141,453
Total CIP $561,453Total For 2018 $561,989
* 2017 Amended Budget as of 8/29/2017
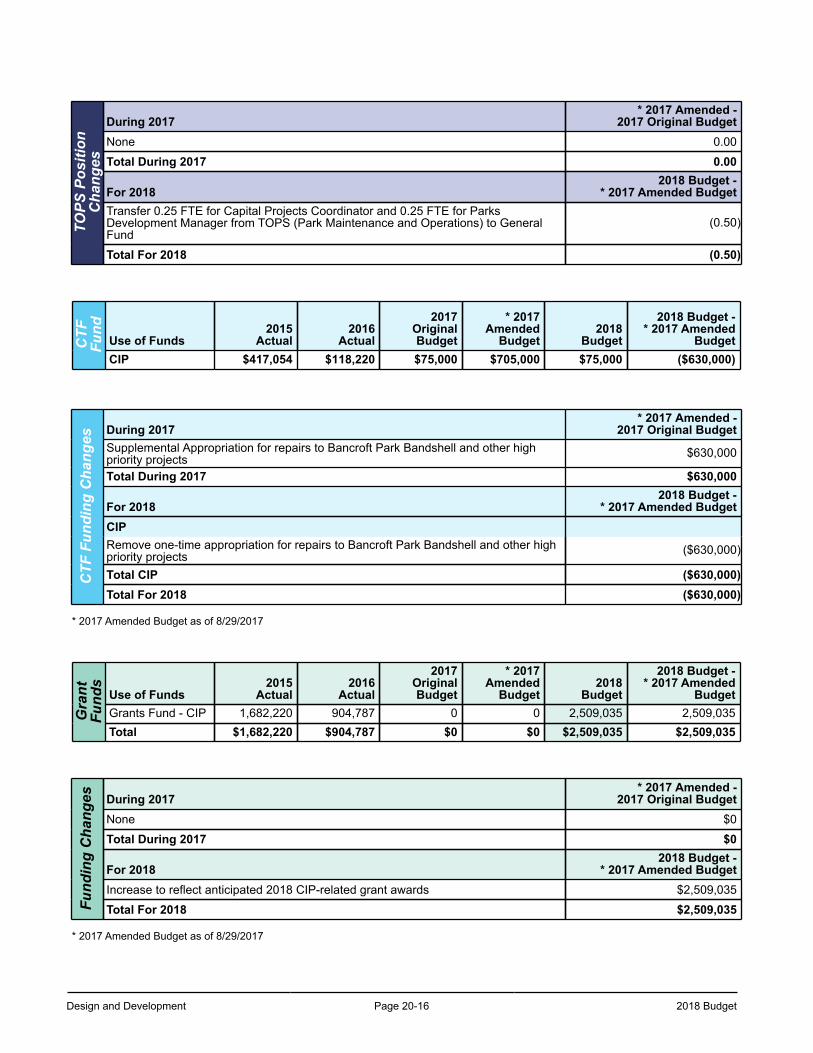
Design and Development Page 20-16 2018 Budget
TOPS
Pos
ition
Cha
nges
During 2017* 2017 Amended -
2017 Original BudgetNone 0.00
Total During 2017 0.00
For 20182018 Budget -
* 2017 Amended BudgetTransfer 0.25 FTE for Capital Projects Coordinator and 0.25 FTE for ParksDevelopment Manager from TOPS (Park Maintenance and Operations) to GeneralFund
(0.50)
Total For 2018 (0.50)
CTF
Fund
Use of Funds2015
Actual2016
Actual
2017OriginalBudget
* 2017Amended
Budget2018
Budget
2018 Budget -* 2017 Amended
BudgetCIP $417,054 $118,220 $75,000 $705,000 $75,000 ($630,000)
CTF
Fun
ding
Cha
nges
During 2017* 2017 Amended -
2017 Original BudgetSupplemental Appropriation for repairs to Bancroft Park Bandshell and other highpriority projects $630,000
Total During 2017 $630,000
For 20182018 Budget -
* 2017 Amended BudgetCIPRemove one-time appropriation for repairs to Bancroft Park Bandshell and other highpriority projects ($630,000)
Total CIP ($630,000)Total For 2018 ($630,000)
* 2017 Amended Budget as of 8/29/2017
Gra
nt
Fund
s
Use of Funds2015
Actual2016
Actual
2017OriginalBudget
* 2017Amended
Budget2018
Budget
2018 Budget -* 2017 Amended
BudgetGrants Fund - CIP 1,682,220 904,787 0 0 2,509,035 2,509,035Total $1,682,220 $904,787 $0 $0 $2,509,035 $2,509,035
Fund
ing
Cha
nges During 2017
* 2017 Amended -2017 Original Budget
None $0
Total During 2017 $0
For 20182018 Budget -
* 2017 Amended BudgetIncrease to reflect anticipated 2018 CIP-related grant awards $2,509,035
Total For 2018 $2,509,035
* 2017 Amended Budget as of 8/29/2017
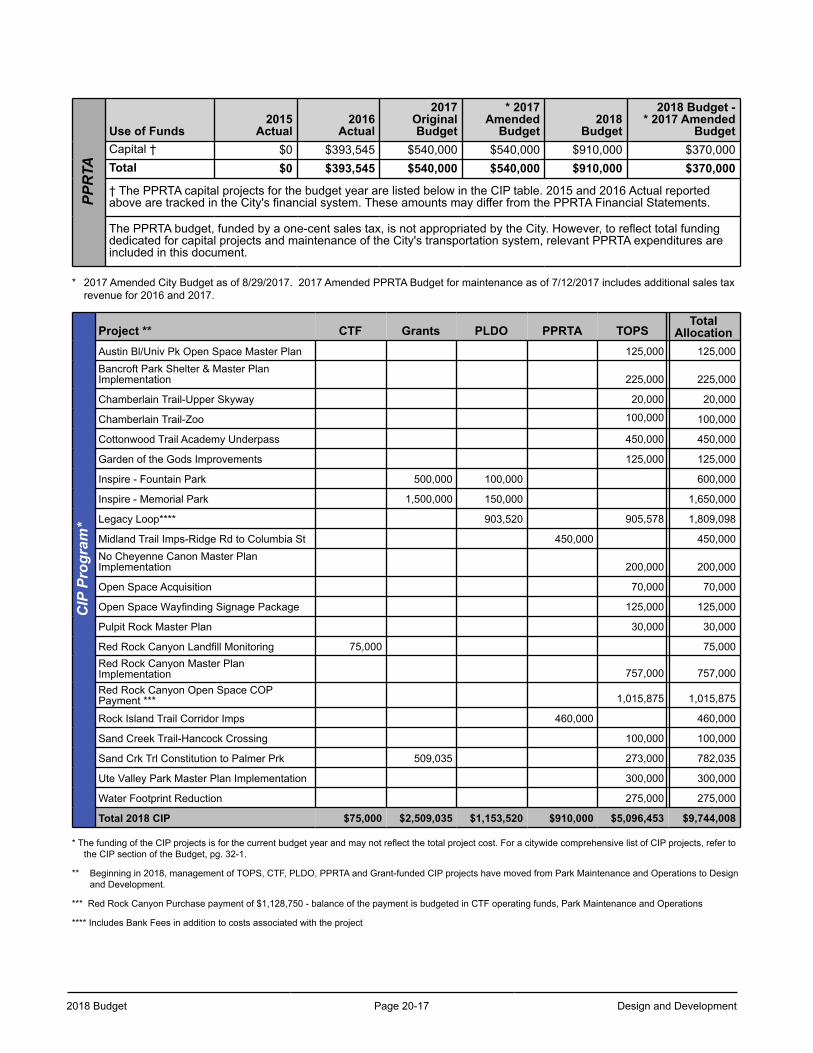
2018 Budget Page 20-17 Design and Development
PPR
TA
Use of Funds2015
Actual2016
Actual
2017OriginalBudget
* 2017Amended
Budget2018
Budget
2018 Budget -* 2017 Amended
BudgetCapital † $0 $393,545 $540,000 $540,000 $910,000 $370,000Total $0 $393,545 $540,000 $540,000 $910,000 $370,000
† The PPRTA capital projects for the budget year are listed below in the CIP table. 2015 and 2016 Actual reportedabove are tracked in the City's financial system. These amounts may differ from the PPRTA Financial Statements.
The PPRTA budget, funded by a one-cent sales tax, is not appropriated by the City. However, to reflect total fundingdedicated for capital projects and maintenance of the City's transportation system, relevant PPRTA expenditures areincluded in this document.
* 2017 Amended City Budget as of 8/29/2017. 2017 Amended PPRTA Budget for maintenance as of 7/12/2017 includes additional sales tax revenue for 2016 and 2017.
CIP
Pro
gram
*
Project ** CTF Grants PLDO PPRTA TOPSTotal
AllocationAustin Bl/Univ Pk Open Space Master Plan 125,000 125,000Bancroft Park Shelter & Master PlanImplementation 225,000 225,000
Chamberlain Trail-Upper Skyway 20,000 20,000
Chamberlain Trail-Zoo 100,000 100,000
Cottonwood Trail Academy Underpass 450,000 450,000
Garden of the Gods Improvements 125,000 125,000
Inspire - Fountain Park 500,000 100,000 600,000
Inspire - Memorial Park 1,500,000 150,000 1,650,000
Legacy Loop**** 903,520 905,578 1,809,098
Midland Trail Imps-Ridge Rd to Columbia St 450,000 450,000No Cheyenne Canon Master PlanImplementation 200,000 200,000
Open Space Acquisition 70,000 70,000
Open Space Wayfinding Signage Package 125,000 125,000
Pulpit Rock Master Plan 30,000 30,000
Red Rock Canyon Landfill Monitoring 75,000 75,000Red Rock Canyon Master PlanImplementation 757,000 757,000Red Rock Canyon Open Space COPPayment *** 1,015,875 1,015,875
Rock Island Trail Corridor Imps 460,000 460,000
Sand Creek Trail-Hancock Crossing 100,000 100,000
Sand Crk Trl Constitution to Palmer Prk 509,035 273,000 782,035
Ute Valley Park Master Plan Implementation 300,000 300,000
Water Footprint Reduction 275,000 275,000
Total 2018 CIP $75,000 $2,509,035 $1,153,520 $910,000 $5,096,453 $9,744,008
* The funding of the CIP projects is for the current budget year and may not reflect the total project cost. For a citywide comprehensive list of CIP projects, refer to the CIP section of the Budget, pg. 32-1.
** Beginning in 2018, management of TOPS, CTF, PLDO, PPRTA and Grant-funded CIP projects have moved from Park Maintenance and Operations to Design and Development.
*** Red Rock Canyon Purchase payment of $1,128,750 - balance of the payment is budgeted in CTF operating funds, Park Maintenance and Operations
**** Includes Bank Fees in addition to costs associated with the project
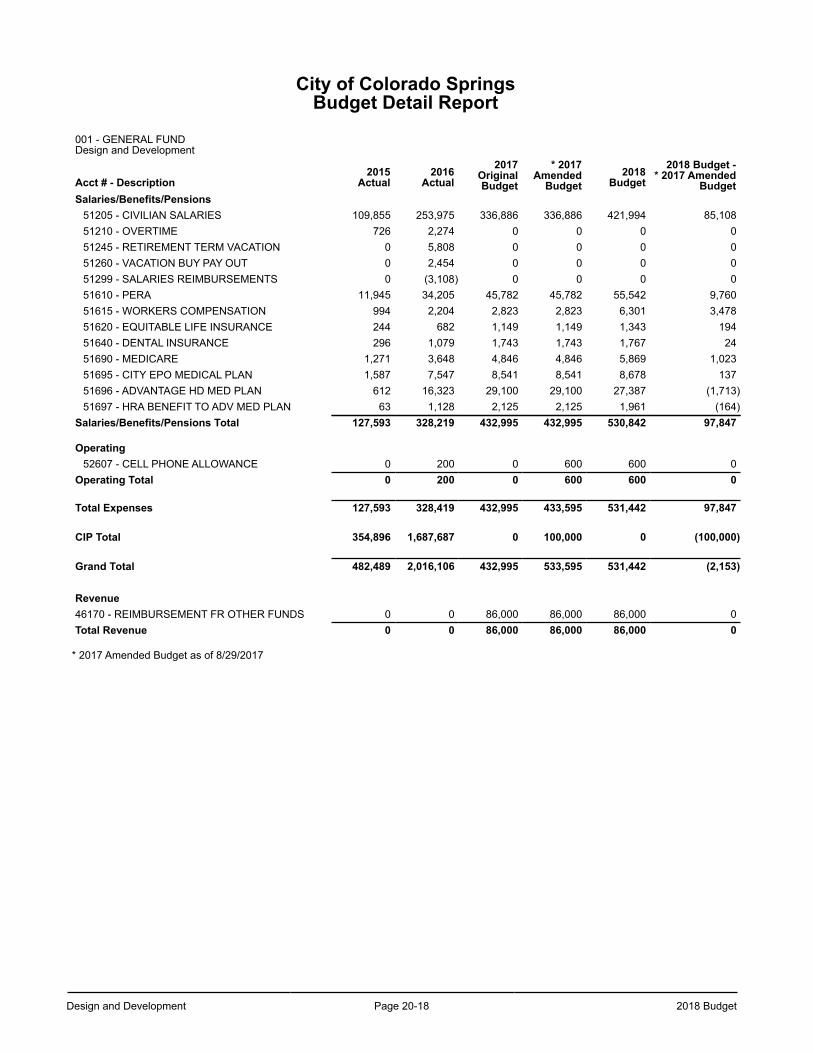
Design and Development Page 20-18 2018 Budget
City of Colorado SpringsBudget Detail Report
001 - GENERAL FUND Design and Development
Acct # - Description2015
Actual2016
Actual2017
OriginalBudget
* 2017Amended
Budget2018
Budget2018 Budget -
* 2017 AmendedBudget
Salaries/Benefits/Pensions51205 - CIVILIAN SALARIES 109,855 253,975 336,886 336,886 421,994 85,10851210 - OVERTIME 726 2,274 0 0 0 051245 - RETIREMENT TERM VACATION 0 5,808 0 0 0 051260 - VACATION BUY PAY OUT 0 2,454 0 0 0 051299 - SALARIES REIMBURSEMENTS 0 (3,108) 0 0 0 051610 - PERA 11,945 34,205 45,782 45,782 55,542 9,76051615 - WORKERS COMPENSATION 994 2,204 2,823 2,823 6,301 3,47851620 - EQUITABLE LIFE INSURANCE 244 682 1,149 1,149 1,343 19451640 - DENTAL INSURANCE 296 1,079 1,743 1,743 1,767 2451690 - MEDICARE 1,271 3,648 4,846 4,846 5,869 1,02351695 - CITY EPO MEDICAL PLAN 1,587 7,547 8,541 8,541 8,678 13751696 - ADVANTAGE HD MED PLAN 612 16,323 29,100 29,100 27,387 (1,713)51697 - HRA BENEFIT TO ADV MED PLAN 63 1,128 2,125 2,125 1,961 (164)
Salaries/Benefits/Pensions Total 127,593 328,219 432,995 432,995 530,842 97,847
Operating52607 - CELL PHONE ALLOWANCE 0 200 0 600 600 0
Operating Total 0 200 0 600 600 0
Total Expenses 127,593 328,419 432,995 433,595 531,442 97,847
CIP Total 354,896 1,687,687 0 100,000 0 (100,000)
Grand Total 482,489 2,016,106 432,995 533,595 531,442 (2,153)
Revenue46170 - REIMBURSEMENT FR OTHER FUNDS 0 0 86,000 86,000 86,000 0Total Revenue 0 0 86,000 86,000 86,000 0
* 2017 Amended Budget as of 8/29/2017
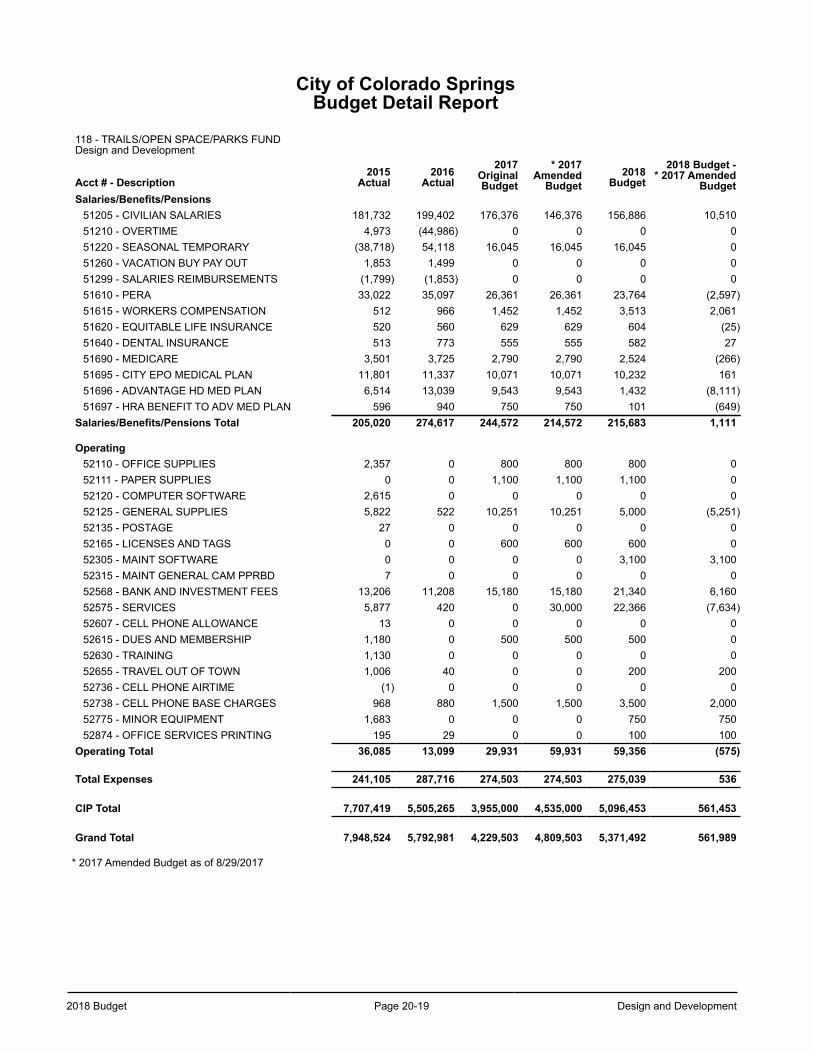
2018 Budget Page 20-19 Design and Development
City of Colorado SpringsBudget Detail Report
118 - TRAILS/OPEN SPACE/PARKS FUND Design and Development
Acct # - Description2015
Actual2016
Actual2017
OriginalBudget
* 2017Amended
Budget2018
Budget2018 Budget -
* 2017 AmendedBudget
Salaries/Benefits/Pensions51205 - CIVILIAN SALARIES 181,732 199,402 176,376 146,376 156,886 10,51051210 - OVERTIME 4,973 (44,986) 0 0 0 051220 - SEASONAL TEMPORARY (38,718) 54,118 16,045 16,045 16,045 051260 - VACATION BUY PAY OUT 1,853 1,499 0 0 0 051299 - SALARIES REIMBURSEMENTS (1,799) (1,853) 0 0 0 051610 - PERA 33,022 35,097 26,361 26,361 23,764 (2,597)51615 - WORKERS COMPENSATION 512 966 1,452 1,452 3,513 2,06151620 - EQUITABLE LIFE INSURANCE 520 560 629 629 604 (25)51640 - DENTAL INSURANCE 513 773 555 555 582 2751690 - MEDICARE 3,501 3,725 2,790 2,790 2,524 (266)51695 - CITY EPO MEDICAL PLAN 11,801 11,337 10,071 10,071 10,232 16151696 - ADVANTAGE HD MED PLAN 6,514 13,039 9,543 9,543 1,432 (8,111)51697 - HRA BENEFIT TO ADV MED PLAN 596 940 750 750 101 (649)
Salaries/Benefits/Pensions Total 205,020 274,617 244,572 214,572 215,683 1,111
Operating52110 - OFFICE SUPPLIES 2,357 0 800 800 800 052111 - PAPER SUPPLIES 0 0 1,100 1,100 1,100 052120 - COMPUTER SOFTWARE 2,615 0 0 0 0 052125 - GENERAL SUPPLIES 5,822 522 10,251 10,251 5,000 (5,251)52135 - POSTAGE 27 0 0 0 0 052165 - LICENSES AND TAGS 0 0 600 600 600 052305 - MAINT SOFTWARE 0 0 0 0 3,100 3,10052315 - MAINT GENERAL CAM PPRBD 7 0 0 0 0 052568 - BANK AND INVESTMENT FEES 13,206 11,208 15,180 15,180 21,340 6,16052575 - SERVICES 5,877 420 0 30,000 22,366 (7,634)52607 - CELL PHONE ALLOWANCE 13 0 0 0 0 052615 - DUES AND MEMBERSHIP 1,180 0 500 500 500 052630 - TRAINING 1,130 0 0 0 0 052655 - TRAVEL OUT OF TOWN 1,006 40 0 0 200 20052736 - CELL PHONE AIRTIME (1) 0 0 0 0 052738 - CELL PHONE BASE CHARGES 968 880 1,500 1,500 3,500 2,00052775 - MINOR EQUIPMENT 1,683 0 0 0 750 75052874 - OFFICE SERVICES PRINTING 195 29 0 0 100 100
Operating Total 36,085 13,099 29,931 59,931 59,356 (575)
Total Expenses 241,105 287,716 274,503 274,503 275,039 536
CIP Total 7,707,419 5,505,265 3,955,000 4,535,000 5,096,453 561,453
Grand Total 7,948,524 5,792,981 4,229,503 4,809,503 5,371,492 561,989
* 2017 Amended Budget as of 8/29/2017

Design and Development Page 20-20 2018 Budget
This page left intentionally blank.
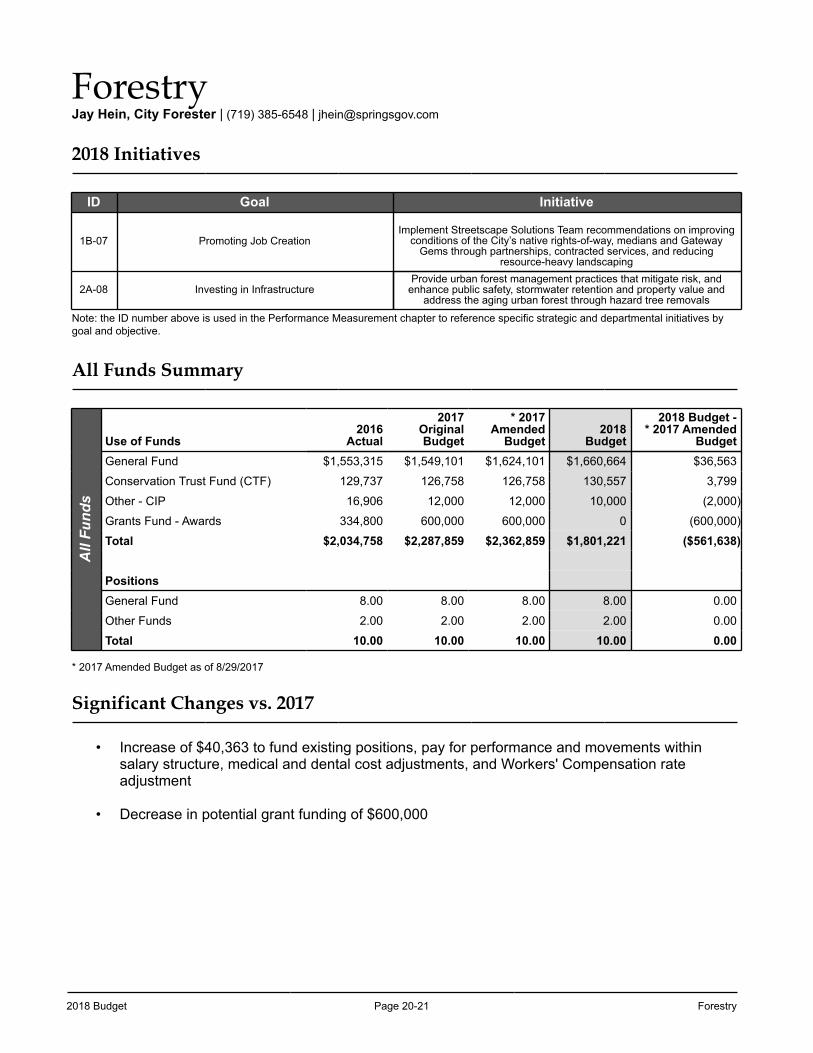
2018 Budget Page 20-21 Forestry
ForestryJay Hein, City Forester | (719) 385-6548 | [email protected]
2018 Initiatives
ID Goal Initiative
1B-07 Promoting Job CreationImplement Streetscape Solutions Team recommendations on improving
conditions of the City’s native rights-of-way, medians and Gateway Gems through partnerships, contracted services, and reducing
resource-heavy landscaping
2A-08 Investing in InfrastructureProvide urban forest management practices that mitigate risk, and
enhance public safety, stormwater retention and property value and address the aging urban forest through hazard tree removals
Note: the ID number above is used in the Performance Measurement chapter to reference specific strategic and departmental initiatives by goal and objective.
All Funds Summary
All
Fund
s
Use of Funds2016
Actual
2017OriginalBudget
* 2017Amended
Budget2018
Budget
2018 Budget -* 2017 Amended
BudgetGeneral Fund $1,553,315 $1,549,101 $1,624,101 $1,660,664 $36,563
Conservation Trust Fund (CTF) 129,737 126,758 126,758 130,557 3,799
Other - CIP 16,906 12,000 12,000 10,000 (2,000)
Grants Fund - Awards 334,800 600,000 600,000 0 (600,000)
Total $2,034,758 $2,287,859 $2,362,859 $1,801,221 ($561,638)
PositionsGeneral Fund 8.00 8.00 8.00 8.00 0.00
Other Funds 2.00 2.00 2.00 2.00 0.00
Total 10.00 10.00 10.00 10.00 0.00
* 2017 Amended Budget as of 8/29/2017
Significant Changes vs. 2017
• Increase of $40,363 to fund existing positions, pay for performance and movements within salary structure, medical and dental cost adjustments, and Workers' Compensation rate adjustment
• Decrease in potential grant funding of $600,000
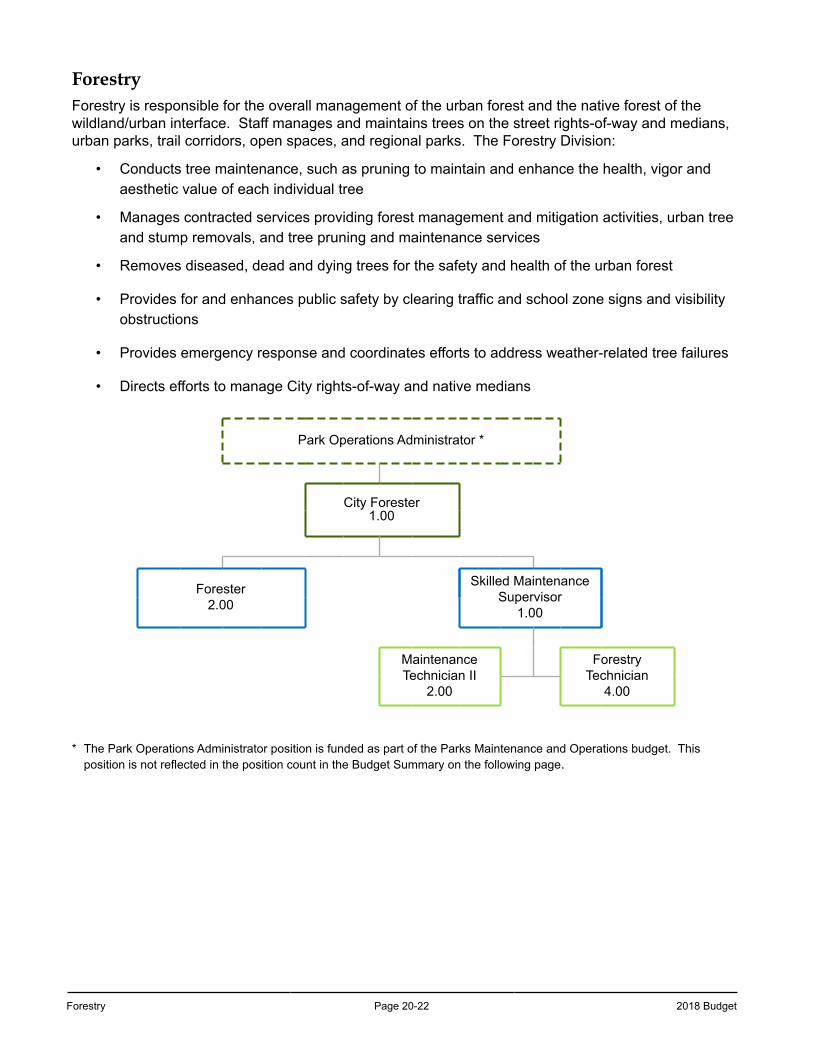
Forestry Page 20-22 2018 Budget
ForestryForestry is responsible for the overall management of the urban forest and the native forest of the wildland/urban interface. Staff manages and maintains trees on the street rights-of-way and medians, urban parks, trail corridors, open spaces, and regional parks. The Forestry Division:
• Conducts tree maintenance, such as pruning to maintain and enhance the health, vigor and aesthetic value of each individual tree
• Manages contracted services providing forest management and mitigation activities, urban tree and stump removals, and tree pruning and maintenance services
• Removes diseased, dead and dying trees for the safety and health of the urban forest
• Provides for and enhances public safety by clearing traffic and school zone signs and visibility obstructions
• Provides emergency response and coordinates efforts to address weather-related tree failures
• Directs efforts to manage City rights-of-way and native medians
Park Operations Administrator *
City Forester1.00
Forester2.00
Skilled MaintenanceSupervisor
1.00
Maintenance Technician II
2.00
ForestryTechnician
4.00
* The Park Operations Administrator position is funded as part of the Parks Maintenance and Operations budget. This position is not reflected in the position count in the Budget Summary on the following page.
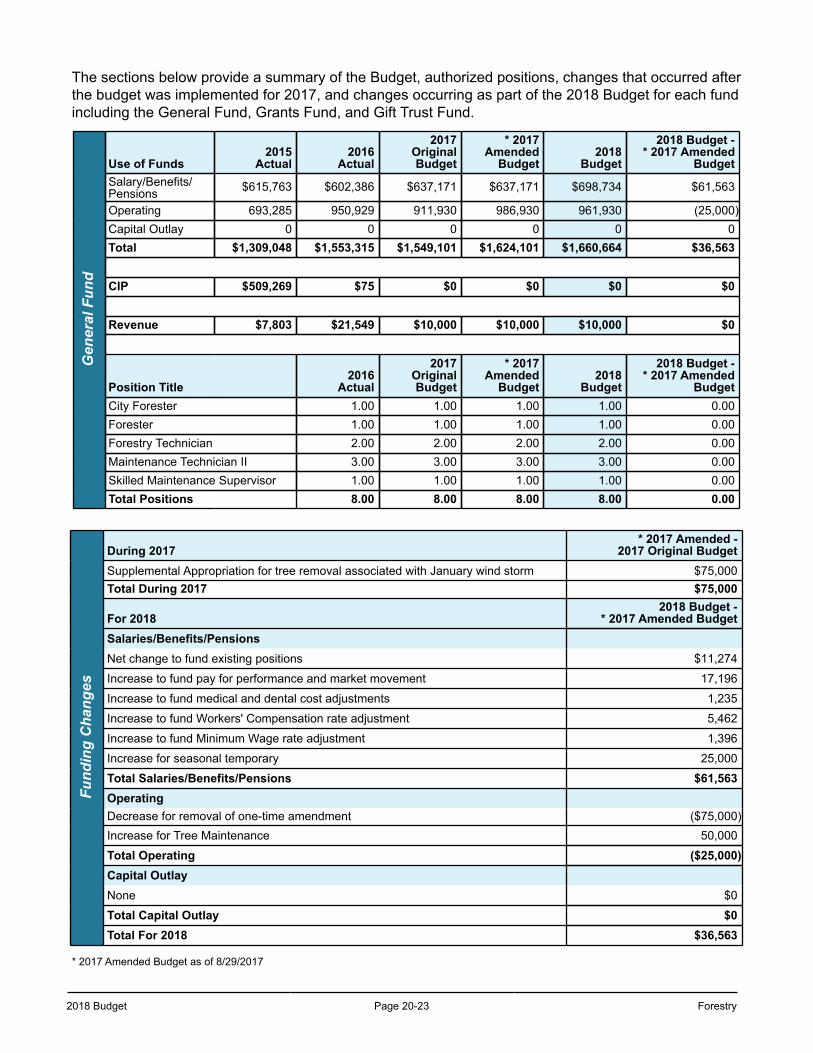
2018 Budget Page 20-23 Forestry
The sections below provide a summary of the Budget, authorized positions, changes that occurred after the budget was implemented for 2017, and changes occurring as part of the 2018 Budget for each fund including the General Fund, Grants Fund, and Gift Trust Fund.
Gen
eral
Fun
d
Use of Funds2015
Actual2016
Actual
2017OriginalBudget
* 2017Amended
Budget2018
Budget
2018 Budget -* 2017 Amended
BudgetSalary/Benefits/Pensions $615,763 $602,386 $637,171 $637,171 $698,734 $61,563
Operating 693,285 950,929 911,930 986,930 961,930 (25,000)Capital Outlay 0 0 0 0 0 0Total $1,309,048 $1,553,315 $1,549,101 $1,624,101 $1,660,664 $36,563
CIP $509,269 $75 $0 $0 $0 $0
Revenue $7,803 $21,549 $10,000 $10,000 $10,000 $0
Position Title2016
Actual
2017OriginalBudget
* 2017Amended
Budget2018
Budget
2018 Budget -* 2017 Amended
BudgetCity Forester 1.00 1.00 1.00 1.00 0.00Forester 1.00 1.00 1.00 1.00 0.00Forestry Technician 2.00 2.00 2.00 2.00 0.00Maintenance Technician II 3.00 3.00 3.00 3.00 0.00Skilled Maintenance Supervisor 1.00 1.00 1.00 1.00 0.00Total Positions 8.00 8.00 8.00 8.00 0.00
Fund
ing
Cha
nges
During 2017* 2017 Amended -
2017 Original BudgetSupplemental Appropriation for tree removal associated with January wind storm $75,000Total During 2017 $75,000
For 20182018 Budget -
* 2017 Amended BudgetSalaries/Benefits/PensionsNet change to fund existing positions $11,274
Increase to fund pay for performance and market movement 17,196
Increase to fund medical and dental cost adjustments 1,235
Increase to fund Workers' Compensation rate adjustment 5,462
Increase to fund Minimum Wage rate adjustment 1,396
Increase for seasonal temporary 25,000
Total Salaries/Benefits/Pensions $61,563OperatingDecrease for removal of one-time amendment ($75,000)Increase for Tree Maintenance 50,000
Total Operating ($25,000)Capital OutlayNone $0
Total Capital Outlay $0Total For 2018 $36,563
* 2017 Amended Budget as of 8/29/2017
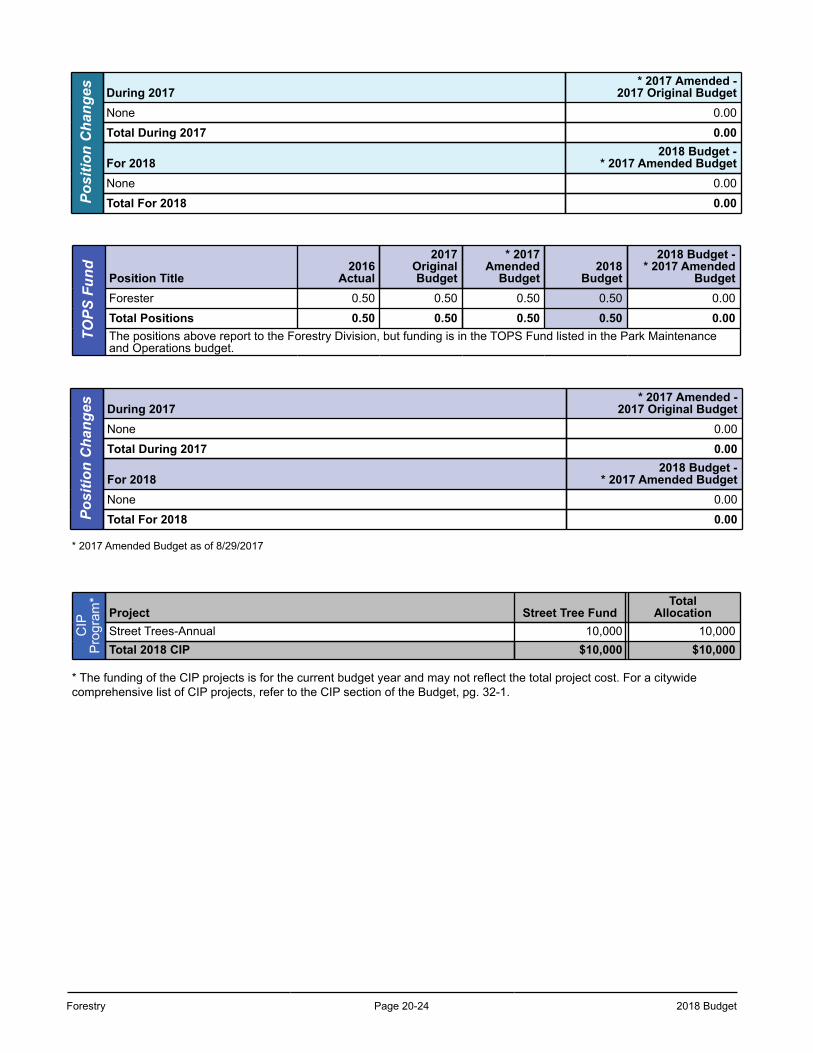
Forestry Page 20-24 2018 Budget
Posi
tion
Cha
nges During 2017
* 2017 Amended -2017 Original Budget
None 0.00
Total During 2017 0.00
For 20182018 Budget -
* 2017 Amended BudgetNone 0.00
Total For 2018 0.00
TOPS
Fun
d
Position Title2016
Actual
2017OriginalBudget
* 2017Amended
Budget2018
Budget
2018 Budget -* 2017 Amended
BudgetForester 0.50 0.50 0.50 0.50 0.00
Total Positions 0.50 0.50 0.50 0.50 0.00The positions above report to the Forestry Division, but funding is in the TOPS Fund listed in the Park Maintenanceand Operations budget.
Posi
tion
Cha
nges During 2017* 2017 Amended -
2017 Original BudgetNone 0.00
Total During 2017 0.00
For 20182018 Budget -
* 2017 Amended BudgetNone 0.00
Total For 2018 0.00
* 2017 Amended Budget as of 8/29/2017
CIP
Pro
gram
*
Project Street Tree FundTotal
AllocationStreet Trees-Annual 10,000 10,000Total 2018 CIP $10,000 $10,000
* The funding of the CIP projects is for the current budget year and may not reflect the total project cost. For a citywide comprehensive list of CIP projects, refer to the CIP section of the Budget, pg. 32-1.
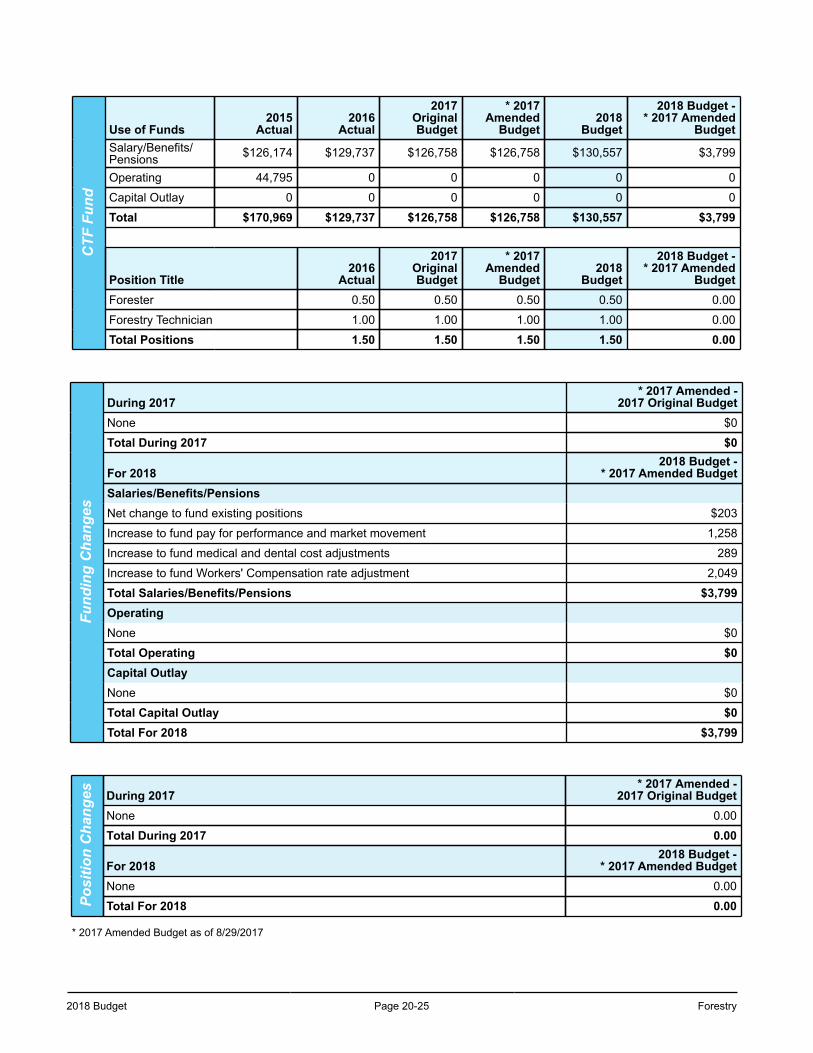
2018 Budget Page 20-25 Forestry
CTF
Fun
d
Use of Funds2015
Actual2016
Actual
2017OriginalBudget
* 2017Amended
Budget2018
Budget
2018 Budget -* 2017 Amended
BudgetSalary/Benefits/Pensions $126,174 $129,737 $126,758 $126,758 $130,557 $3,799
Operating 44,795 0 0 0 0 0
Capital Outlay 0 0 0 0 0 0
Total $170,969 $129,737 $126,758 $126,758 $130,557 $3,799
Position Title2016
Actual
2017OriginalBudget
* 2017Amended
Budget2018
Budget
2018 Budget -* 2017 Amended
BudgetForester 0.50 0.50 0.50 0.50 0.00
Forestry Technician 1.00 1.00 1.00 1.00 0.00
Total Positions 1.50 1.50 1.50 1.50 0.00
Fund
ing
Cha
nges
During 2017* 2017 Amended -
2017 Original BudgetNone $0
Total During 2017 $0
For 20182018 Budget -
* 2017 Amended BudgetSalaries/Benefits/PensionsNet change to fund existing positions $203
Increase to fund pay for performance and market movement 1,258
Increase to fund medical and dental cost adjustments 289
Increase to fund Workers' Compensation rate adjustment 2,049
Total Salaries/Benefits/Pensions $3,799OperatingNone $0
Total Operating $0Capital OutlayNone $0
Total Capital Outlay $0Total For 2018 $3,799
Posi
tion
Cha
nges During 2017
* 2017 Amended -2017 Original Budget
None 0.00
Total During 2017 0.00
For 20182018 Budget -
* 2017 Amended BudgetNone 0.00
Total For 2018 0.00
* 2017 Amended Budget as of 8/29/2017
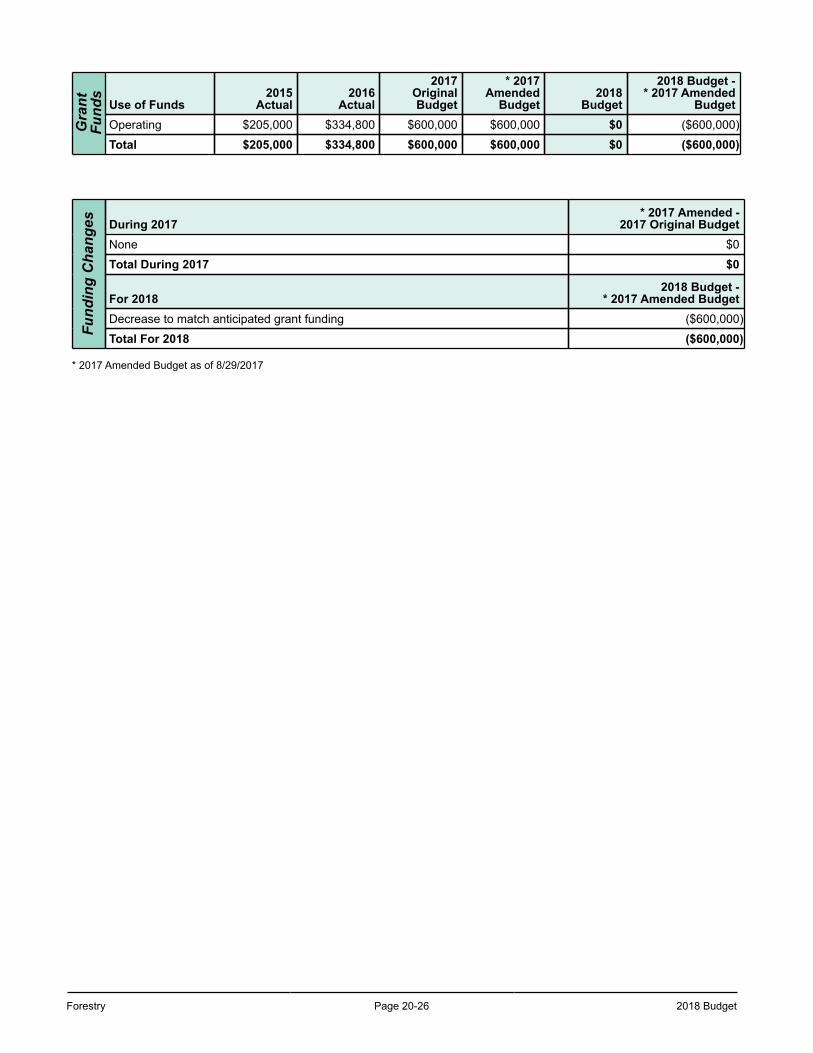
Forestry Page 20-26 2018 Budget
Gra
ntFu
nds
Use of Funds2015
Actual2016
Actual
2017OriginalBudget
* 2017Amended
Budget2018
Budget
2018 Budget -* 2017 Amended
BudgetOperating $205,000 $334,800 $600,000 $600,000 $0 ($600,000)
Total $205,000 $334,800 $600,000 $600,000 $0 ($600,000)
Fund
ing
Cha
nges During 2017
* 2017 Amended -2017 Original Budget
None $0
Total During 2017 $0
For 20182018 Budget -
* 2017 Amended BudgetDecrease to match anticipated grant funding ($600,000)
Total For 2018 ($600,000)
* 2017 Amended Budget as of 8/29/2017
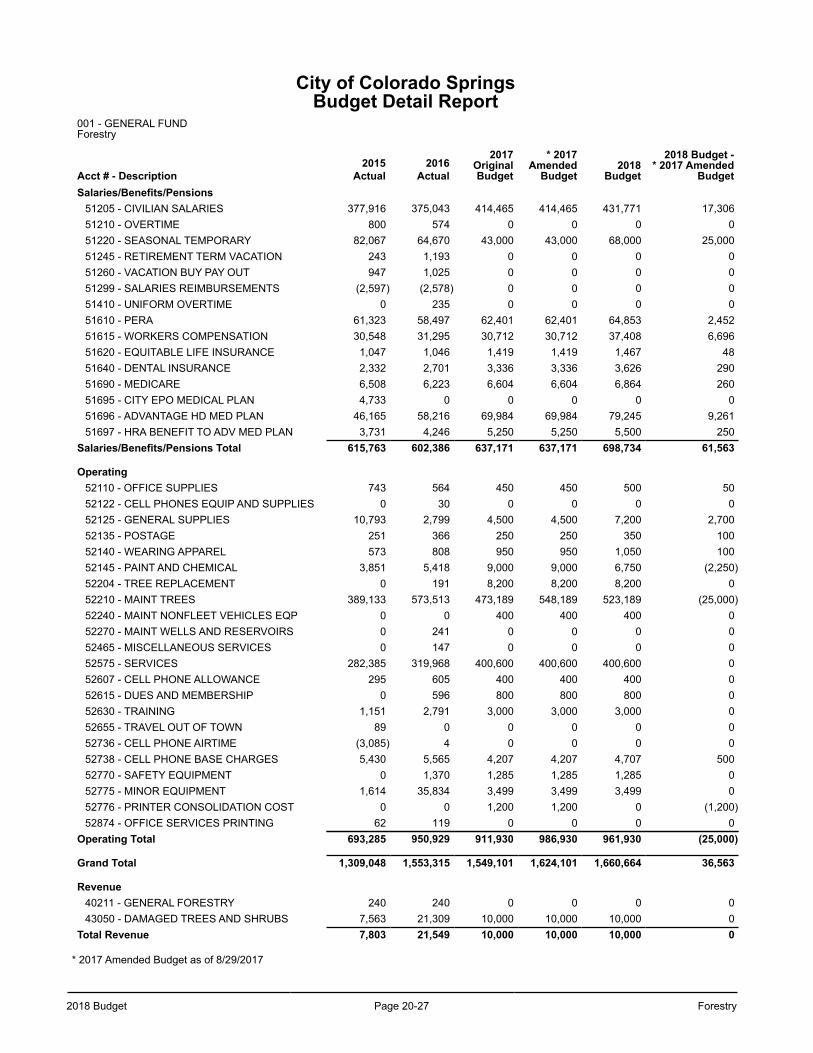
2018 Budget Page 20-27 Forestry
City of Colorado SpringsBudget Detail Report
001 - GENERAL FUNDForestry
Acct # - Description2015
Actual2016
Actual
2017OriginalBudget
* 2017Amended
Budget2018
Budget
2018 Budget -* 2017 Amended
BudgetSalaries/Benefits/Pensions
51205 - CIVILIAN SALARIES 377,916 375,043 414,465 414,465 431,771 17,30651210 - OVERTIME 800 574 0 0 0 051220 - SEASONAL TEMPORARY 82,067 64,670 43,000 43,000 68,000 25,00051245 - RETIREMENT TERM VACATION 243 1,193 0 0 0 051260 - VACATION BUY PAY OUT 947 1,025 0 0 0 051299 - SALARIES REIMBURSEMENTS (2,597) (2,578) 0 0 0 051410 - UNIFORM OVERTIME 0 235 0 0 0 051610 - PERA 61,323 58,497 62,401 62,401 64,853 2,45251615 - WORKERS COMPENSATION 30,548 31,295 30,712 30,712 37,408 6,69651620 - EQUITABLE LIFE INSURANCE 1,047 1,046 1,419 1,419 1,467 4851640 - DENTAL INSURANCE 2,332 2,701 3,336 3,336 3,626 29051690 - MEDICARE 6,508 6,223 6,604 6,604 6,864 26051695 - CITY EPO MEDICAL PLAN 4,733 0 0 0 0 051696 - ADVANTAGE HD MED PLAN 46,165 58,216 69,984 69,984 79,245 9,26151697 - HRA BENEFIT TO ADV MED PLAN 3,731 4,246 5,250 5,250 5,500 250
Salaries/Benefits/Pensions Total 615,763 602,386 637,171 637,171 698,734 61,563
Operating52110 - OFFICE SUPPLIES 743 564 450 450 500 5052122 - CELL PHONES EQUIP AND SUPPLIES 0 30 0 0 0 052125 - GENERAL SUPPLIES 10,793 2,799 4,500 4,500 7,200 2,70052135 - POSTAGE 251 366 250 250 350 10052140 - WEARING APPAREL 573 808 950 950 1,050 10052145 - PAINT AND CHEMICAL 3,851 5,418 9,000 9,000 6,750 (2,250)52204 - TREE REPLACEMENT 0 191 8,200 8,200 8,200 052210 - MAINT TREES 389,133 573,513 473,189 548,189 523,189 (25,000)52240 - MAINT NONFLEET VEHICLES EQP 0 0 400 400 400 052270 - MAINT WELLS AND RESERVOIRS 0 241 0 0 0 052465 - MISCELLANEOUS SERVICES 0 147 0 0 0 052575 - SERVICES 282,385 319,968 400,600 400,600 400,600 052607 - CELL PHONE ALLOWANCE 295 605 400 400 400 052615 - DUES AND MEMBERSHIP 0 596 800 800 800 052630 - TRAINING 1,151 2,791 3,000 3,000 3,000 052655 - TRAVEL OUT OF TOWN 89 0 0 0 0 052736 - CELL PHONE AIRTIME (3,085) 4 0 0 0 052738 - CELL PHONE BASE CHARGES 5,430 5,565 4,207 4,207 4,707 50052770 - SAFETY EQUIPMENT 0 1,370 1,285 1,285 1,285 052775 - MINOR EQUIPMENT 1,614 35,834 3,499 3,499 3,499 052776 - PRINTER CONSOLIDATION COST 0 0 1,200 1,200 0 (1,200)52874 - OFFICE SERVICES PRINTING 62 119 0 0 0 0
Operating Total 693,285 950,929 911,930 986,930 961,930 (25,000)
Grand Total 1,309,048 1,553,315 1,549,101 1,624,101 1,660,664 36,563
Revenue40211 - GENERAL FORESTRY 240 240 0 0 0 043050 - DAMAGED TREES AND SHRUBS 7,563 21,309 10,000 10,000 10,000 0
Total Revenue 7,803 21,549 10,000 10,000 10,000 0
* 2017 Amended Budget as of 8/29/2017
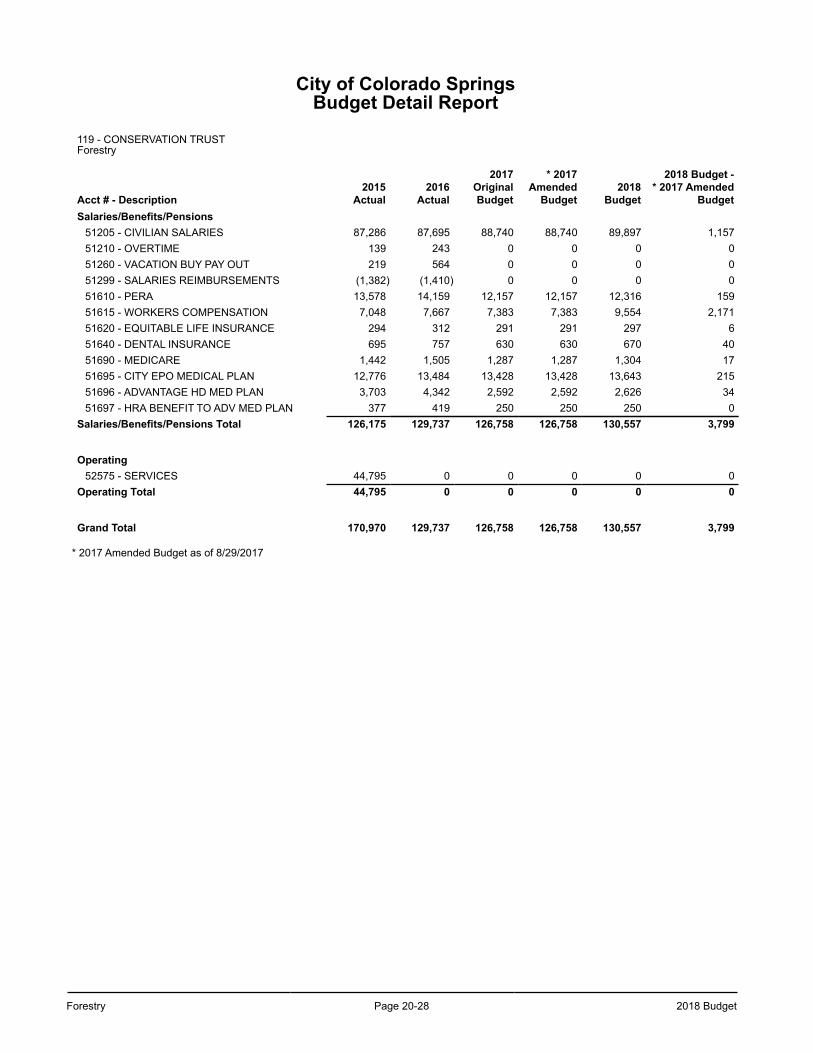
Forestry Page 20-28 2018 Budget
City of Colorado SpringsBudget Detail Report
119 - CONSERVATION TRUSTForestry
Acct # - Description2015
Actual2016
Actual
2017OriginalBudget
* 2017Amended
Budget2018
Budget
2018 Budget -* 2017 Amended
BudgetSalaries/Benefits/Pensions
51205 - CIVILIAN SALARIES 87,286 87,695 88,740 88,740 89,897 1,15751210 - OVERTIME 139 243 0 0 0 051260 - VACATION BUY PAY OUT 219 564 0 0 0 051299 - SALARIES REIMBURSEMENTS (1,382) (1,410) 0 0 0 051610 - PERA 13,578 14,159 12,157 12,157 12,316 15951615 - WORKERS COMPENSATION 7,048 7,667 7,383 7,383 9,554 2,17151620 - EQUITABLE LIFE INSURANCE 294 312 291 291 297 651640 - DENTAL INSURANCE 695 757 630 630 670 4051690 - MEDICARE 1,442 1,505 1,287 1,287 1,304 1751695 - CITY EPO MEDICAL PLAN 12,776 13,484 13,428 13,428 13,643 21551696 - ADVANTAGE HD MED PLAN 3,703 4,342 2,592 2,592 2,626 3451697 - HRA BENEFIT TO ADV MED PLAN 377 419 250 250 250 0
Salaries/Benefits/Pensions Total 126,175 129,737 126,758 126,758 130,557 3,799
Operating52575 - SERVICES 44,795 0 0 0 0 0
Operating Total 44,795 0 0 0 0 0
Grand Total 170,970 129,737 126,758 126,758 130,557 3,799
* 2017 Amended Budget as of 8/29/2017
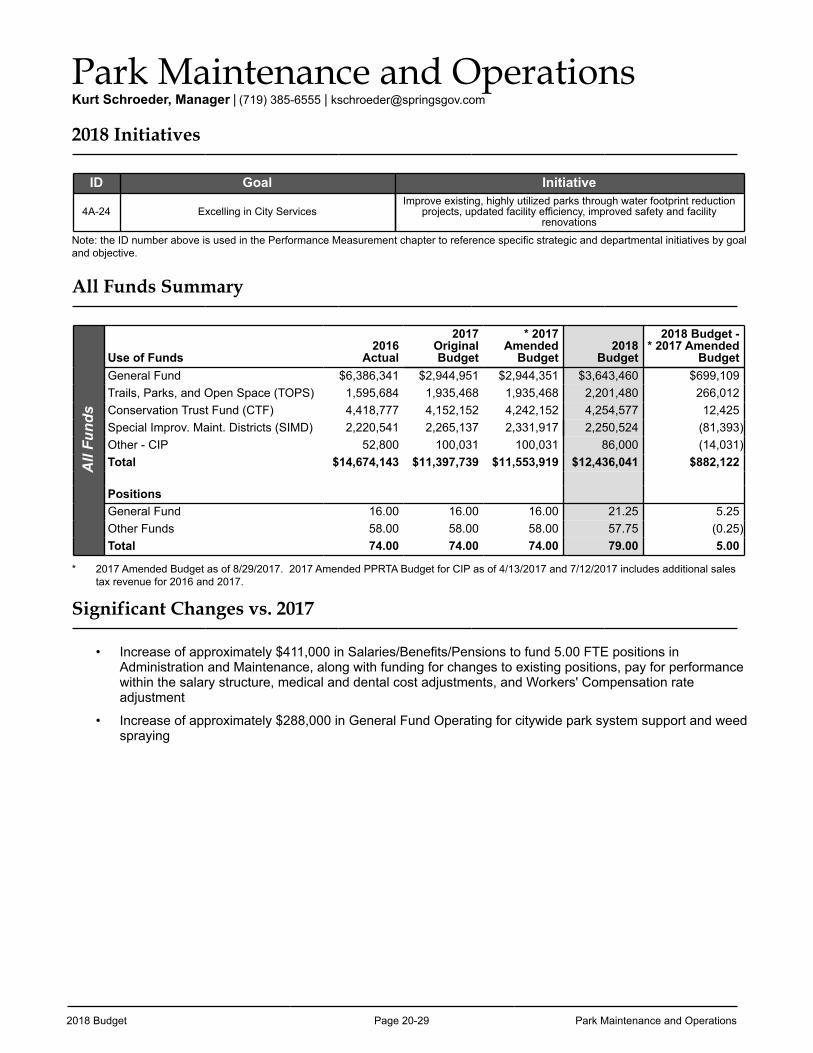
2018 Budget Page 20-29 Park Maintenance and Operations
Park Maintenance and OperationsKurt Schroeder, Manager | (719) 385-6555 | [email protected]
2018 Initiatives
ID Goal Initiative
4A-24 Excelling in City ServicesImprove existing, highly utilized parks through water footprint reduction
projects, updated facility efficiency, improved safety and facility renovations
Note: the ID number above is used in the Performance Measurement chapter to reference specific strategic and departmental initiatives by goal and objective.
All Funds Summary
All
Fund
s
Use of Funds2016
Actual
2017OriginalBudget
* 2017Amended
Budget2018
Budget
2018 Budget -* 2017 Amended
BudgetGeneral Fund $6,386,341 $2,944,951 $2,944,351 $3,643,460 $699,109Trails, Parks, and Open Space (TOPS) 1,595,684 1,935,468 1,935,468 2,201,480 266,012Conservation Trust Fund (CTF) 4,418,777 4,152,152 4,242,152 4,254,577 12,425Special Improv. Maint. Districts (SIMD) 2,220,541 2,265,137 2,331,917 2,250,524 (81,393)Other - CIP 52,800 100,031 100,031 86,000 (14,031)Total $14,674,143 $11,397,739 $11,553,919 $12,436,041 $882,122
PositionsGeneral Fund 16.00 16.00 16.00 21.25 5.25Other Funds 58.00 58.00 58.00 57.75 (0.25)Total 74.00 74.00 74.00 79.00 5.00
* 2017 Amended Budget as of 8/29/2017. 2017 Amended PPRTA Budget for CIP as of 4/13/2017 and 7/12/2017 includes additional sales tax revenue for 2016 and 2017.
Significant Changes vs. 2017
• Increase of approximately $411,000 in Salaries/Benefits/Pensions to fund 5.00 FTE positions in Administration and Maintenance, along with funding for changes to existing positions, pay for performance within the salary structure, medical and dental cost adjustments, and Workers' Compensation rate adjustment
• Increase of approximately $288,000 in General Fund Operating for citywide park system support and weed spraying
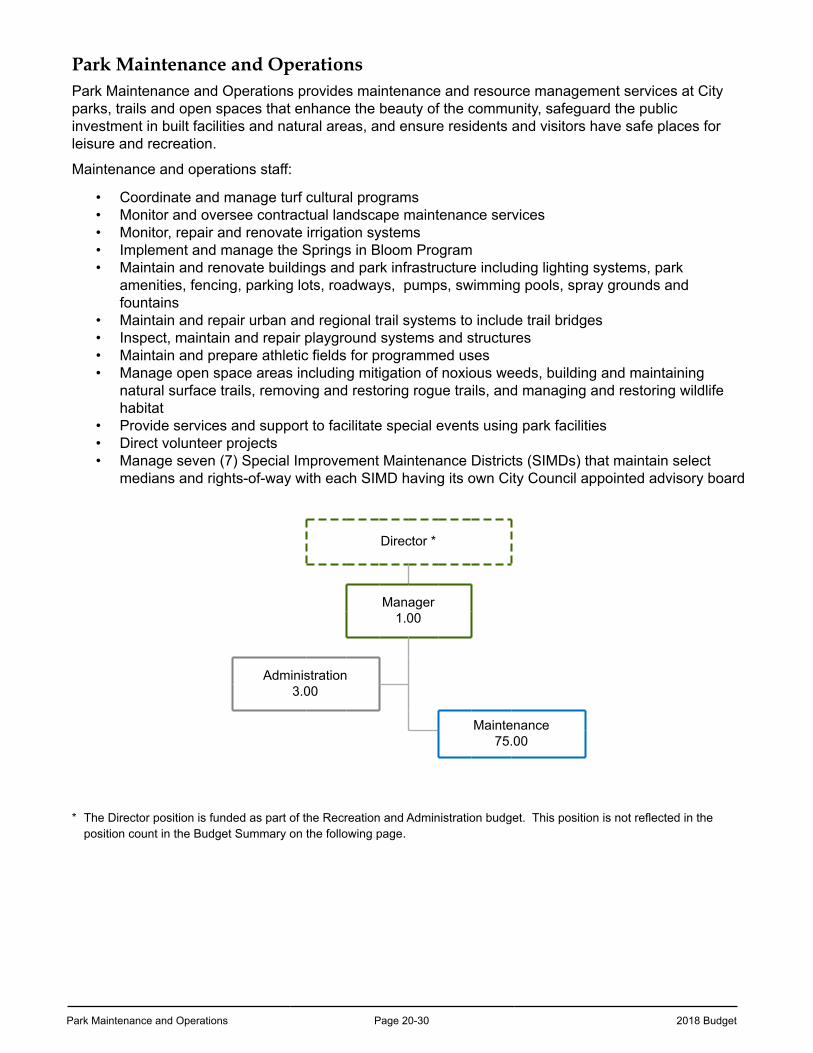
Park Maintenance and Operations Page 20-30 2018 Budget
Park Maintenance and OperationsPark Maintenance and Operations provides maintenance and resource management services at City parks, trails and open spaces that enhance the beauty of the community, safeguard the public investment in built facilities and natural areas, and ensure residents and visitors have safe places for leisure and recreation.
Maintenance and operations staff:
• Coordinate and manage turf cultural programs• Monitor and oversee contractual landscape maintenance services• Monitor, repair and renovate irrigation systems• Implement and manage the Springs in Bloom Program• Maintain and renovate buildings and park infrastructure including lighting systems, park
amenities, fencing, parking lots, roadways, pumps, swimming pools, spray grounds and fountains
• Maintain and repair urban and regional trail systems to include trail bridges• Inspect, maintain and repair playground systems and structures• Maintain and prepare athletic fields for programmed uses• Manage open space areas including mitigation of noxious weeds, building and maintaining
natural surface trails, removing and restoring rogue trails, and managing and restoring wildlife habitat
• Provide services and support to facilitate special events using park facilities• Direct volunteer projects• Manage seven (7) Special Improvement Maintenance Districts (SIMDs) that maintain select
medians and rights-of-way with each SIMD having its own City Council appointed advisory board
Director *
Manager1.00
Administration 3.00
Maintenance75.00
* The Director position is funded as part of the Recreation and Administration budget. This position is not reflected in the position count in the Budget Summary on the following page.
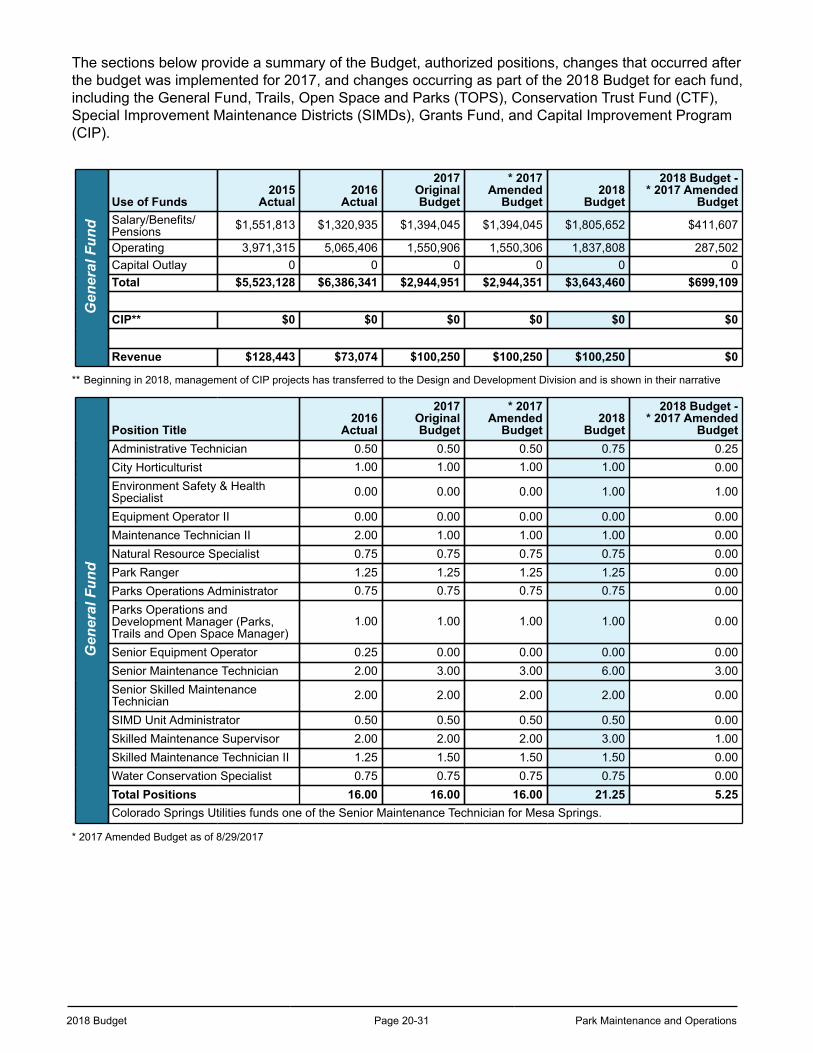
2018 Budget Page 20-31 Park Maintenance and Operations
The sections below provide a summary of the Budget, authorized positions, changes that occurred after the budget was implemented for 2017, and changes occurring as part of the 2018 Budget for each fund, including the General Fund, Trails, Open Space and Parks (TOPS), Conservation Trust Fund (CTF), Special Improvement Maintenance Districts (SIMDs), Grants Fund, and Capital Improvement Program (CIP).
Gen
eral
Fun
d
Use of Funds2015
Actual2016
Actual
2017OriginalBudget
* 2017Amended
Budget2018
Budget
2018 Budget -* 2017 Amended
BudgetSalary/Benefits/Pensions $1,551,813 $1,320,935 $1,394,045 $1,394,045 $1,805,652 $411,607
Operating 3,971,315 5,065,406 1,550,906 1,550,306 1,837,808 287,502Capital Outlay 0 0 0 0 0 0Total $5,523,128 $6,386,341 $2,944,951 $2,944,351 $3,643,460 $699,109
CIP** $0 $0 $0 $0 $0 $0
Revenue $128,443 $73,074 $100,250 $100,250 $100,250 $0
** Beginning in 2018, management of CIP projects has transferred to the Design and Development Division and is shown in their narrative
Gen
eral
Fun
d
Position Title2016
Actual
2017OriginalBudget
* 2017Amended
Budget2018
Budget
2018 Budget -* 2017 Amended
BudgetAdministrative Technician 0.50 0.50 0.50 0.75 0.25City Horticulturist 1.00 1.00 1.00 1.00 0.00Environment Safety & HealthSpecialist 0.00 0.00 0.00 1.00 1.00
Equipment Operator II 0.00 0.00 0.00 0.00 0.00Maintenance Technician II 2.00 1.00 1.00 1.00 0.00Natural Resource Specialist 0.75 0.75 0.75 0.75 0.00Park Ranger 1.25 1.25 1.25 1.25 0.00Parks Operations Administrator 0.75 0.75 0.75 0.75 0.00Parks Operations andDevelopment Manager (Parks,Trails and Open Space Manager)
1.00 1.00 1.00 1.00 0.00
Senior Equipment Operator 0.25 0.00 0.00 0.00 0.00Senior Maintenance Technician 2.00 3.00 3.00 6.00 3.00Senior Skilled MaintenanceTechnician 2.00 2.00 2.00 2.00 0.00
SIMD Unit Administrator 0.50 0.50 0.50 0.50 0.00Skilled Maintenance Supervisor 2.00 2.00 2.00 3.00 1.00Skilled Maintenance Technician II 1.25 1.50 1.50 1.50 0.00Water Conservation Specialist 0.75 0.75 0.75 0.75 0.00Total Positions 16.00 16.00 16.00 21.25 5.25Colorado Springs Utilities funds one of the Senior Maintenance Technician for Mesa Springs.
* 2017 Amended Budget as of 8/29/2017
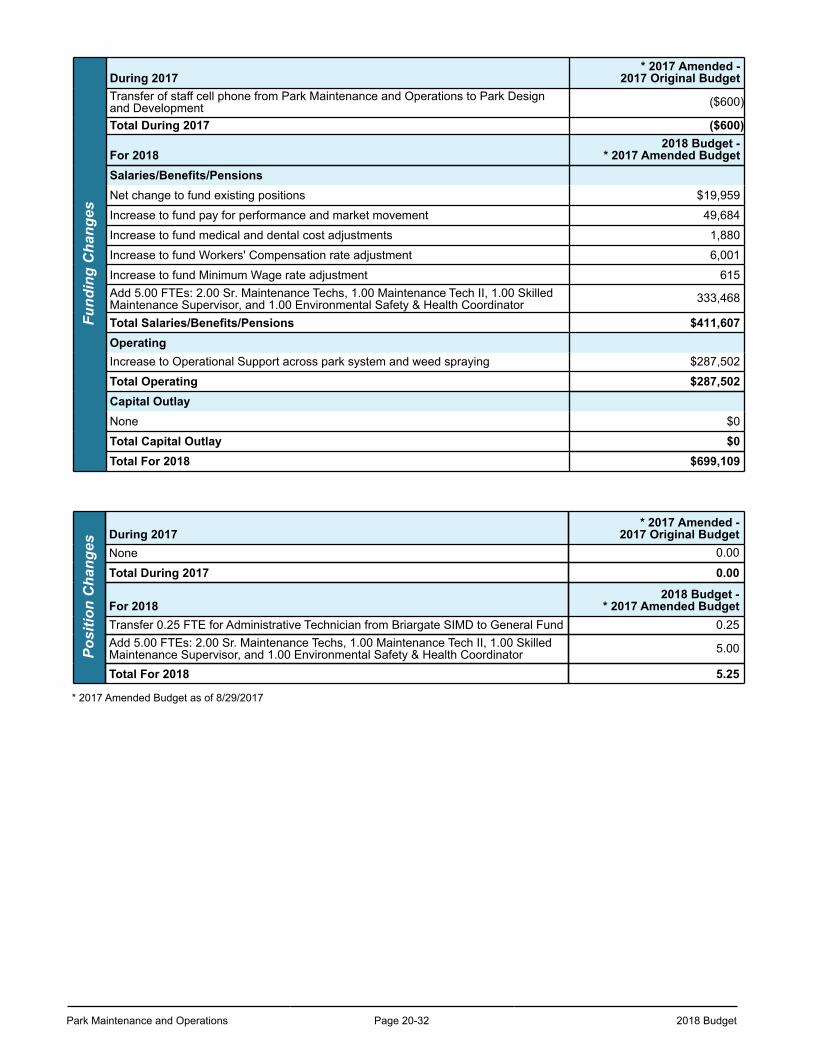
Park Maintenance and Operations Page 20-32 2018 Budget
Fund
ing
Cha
nges
During 2017* 2017 Amended -
2017 Original BudgetTransfer of staff cell phone from Park Maintenance and Operations to Park Designand Development ($600)
Total During 2017 ($600)
For 20182018 Budget -
* 2017 Amended BudgetSalaries/Benefits/PensionsNet change to fund existing positions $19,959
Increase to fund pay for performance and market movement 49,684
Increase to fund medical and dental cost adjustments 1,880
Increase to fund Workers' Compensation rate adjustment 6,001
Increase to fund Minimum Wage rate adjustment 615Add 5.00 FTEs: 2.00 Sr. Maintenance Techs, 1.00 Maintenance Tech II, 1.00 SkilledMaintenance Supervisor, and 1.00 Environmental Safety & Health Coordinator 333,468
Total Salaries/Benefits/Pensions $411,607OperatingIncrease to Operational Support across park system and weed spraying $287,502
Total Operating $287,502Capital OutlayNone $0
Total Capital Outlay $0Total For 2018 $699,109
Posi
tion
Cha
nges
During 2017* 2017 Amended -
2017 Original BudgetNone 0.00
Total During 2017 0.00
For 20182018 Budget -
* 2017 Amended BudgetTransfer 0.25 FTE for Administrative Technician from Briargate SIMD to General Fund 0.25Add 5.00 FTEs: 2.00 Sr. Maintenance Techs, 1.00 Maintenance Tech II, 1.00 SkilledMaintenance Supervisor, and 1.00 Environmental Safety & Health Coordinator 5.00
Total For 2018 5.25
* 2017 Amended Budget as of 8/29/2017
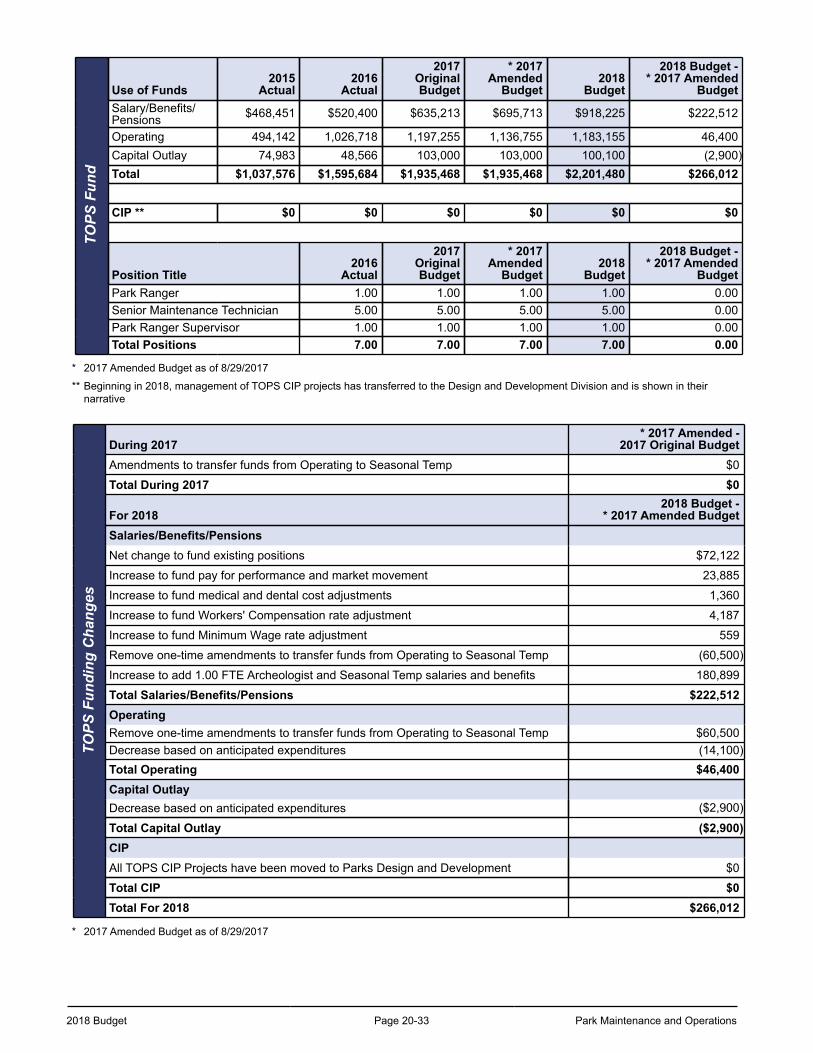
2018 Budget Page 20-33 Park Maintenance and Operations
TOPS
Fun
dUse of Funds
2015Actual
2016Actual
2017OriginalBudget
* 2017Amended
Budget2018
Budget
2018 Budget -* 2017 Amended
BudgetSalary/Benefits/Pensions $468,451 $520,400 $635,213 $695,713 $918,225 $222,512
Operating 494,142 1,026,718 1,197,255 1,136,755 1,183,155 46,400Capital Outlay 74,983 48,566 103,000 103,000 100,100 (2,900)Total $1,037,576 $1,595,684 $1,935,468 $1,935,468 $2,201,480 $266,012
CIP ** $0 $0 $0 $0 $0 $0
Position Title2016
Actual
2017OriginalBudget
* 2017Amended
Budget2018
Budget
2018 Budget -* 2017 Amended
BudgetPark Ranger 1.00 1.00 1.00 1.00 0.00Senior Maintenance Technician 5.00 5.00 5.00 5.00 0.00Park Ranger Supervisor 1.00 1.00 1.00 1.00 0.00Total Positions 7.00 7.00 7.00 7.00 0.00
* 2017 Amended Budget as of 8/29/2017
** Beginning in 2018, management of TOPS CIP projects has transferred to the Design and Development Division and is shown in their narrative
TOPS
Fun
ding
Cha
nges
During 2017* 2017 Amended -
2017 Original BudgetAmendments to transfer funds from Operating to Seasonal Temp $0
Total During 2017 $0
For 20182018 Budget -
* 2017 Amended BudgetSalaries/Benefits/PensionsNet change to fund existing positions $72,122
Increase to fund pay for performance and market movement 23,885
Increase to fund medical and dental cost adjustments 1,360
Increase to fund Workers' Compensation rate adjustment 4,187
Increase to fund Minimum Wage rate adjustment 559
Remove one-time amendments to transfer funds from Operating to Seasonal Temp (60,500)
Increase to add 1.00 FTE Archeologist and Seasonal Temp salaries and benefits 180,899
Total Salaries/Benefits/Pensions $222,512OperatingRemove one-time amendments to transfer funds from Operating to Seasonal Temp $60,500Decrease based on anticipated expenditures (14,100)Total Operating $46,400Capital OutlayDecrease based on anticipated expenditures ($2,900)
Total Capital Outlay ($2,900)CIPAll TOPS CIP Projects have been moved to Parks Design and Development $0
Total CIP $0Total For 2018 $266,012
* 2017 Amended Budget as of 8/29/2017
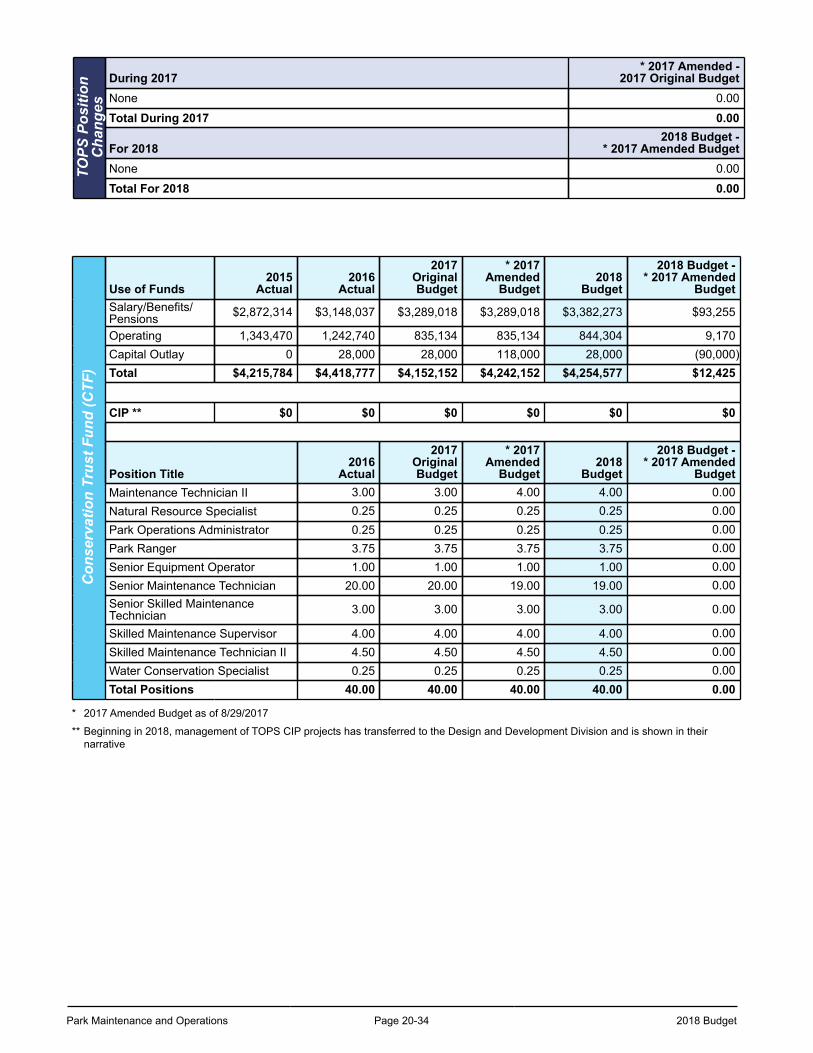
Park Maintenance and Operations Page 20-34 2018 Budget
TOPS
Pos
ition
Cha
nges
During 2017* 2017 Amended -
2017 Original BudgetNone 0.00
Total During 2017 0.00
For 20182018 Budget -
* 2017 Amended BudgetNone 0.00
Total For 2018 0.00
Con
serv
atio
n Tr
ust F
und
(CTF
)
Use of Funds2015
Actual2016
Actual
2017OriginalBudget
* 2017Amended
Budget2018
Budget
2018 Budget -* 2017 Amended
BudgetSalary/Benefits/Pensions $2,872,314 $3,148,037 $3,289,018 $3,289,018 $3,382,273 $93,255
Operating 1,343,470 1,242,740 835,134 835,134 844,304 9,170Capital Outlay 0 28,000 28,000 118,000 28,000 (90,000)Total $4,215,784 $4,418,777 $4,152,152 $4,242,152 $4,254,577 $12,425
CIP ** $0 $0 $0 $0 $0 $0
Position Title2016
Actual
2017OriginalBudget
* 2017Amended
Budget2018
Budget
2018 Budget -* 2017 Amended
BudgetMaintenance Technician II 3.00 3.00 4.00 4.00 0.00Natural Resource Specialist 0.25 0.25 0.25 0.25 0.00Park Operations Administrator 0.25 0.25 0.25 0.25 0.00Park Ranger 3.75 3.75 3.75 3.75 0.00Senior Equipment Operator 1.00 1.00 1.00 1.00 0.00Senior Maintenance Technician 20.00 20.00 19.00 19.00 0.00Senior Skilled MaintenanceTechnician 3.00 3.00 3.00 3.00 0.00
Skilled Maintenance Supervisor 4.00 4.00 4.00 4.00 0.00Skilled Maintenance Technician II 4.50 4.50 4.50 4.50 0.00Water Conservation Specialist 0.25 0.25 0.25 0.25 0.00Total Positions 40.00 40.00 40.00 40.00 0.00
* 2017 Amended Budget as of 8/29/2017
** Beginning in 2018, management of TOPS CIP projects has transferred to the Design and Development Division and is shown in their narrative
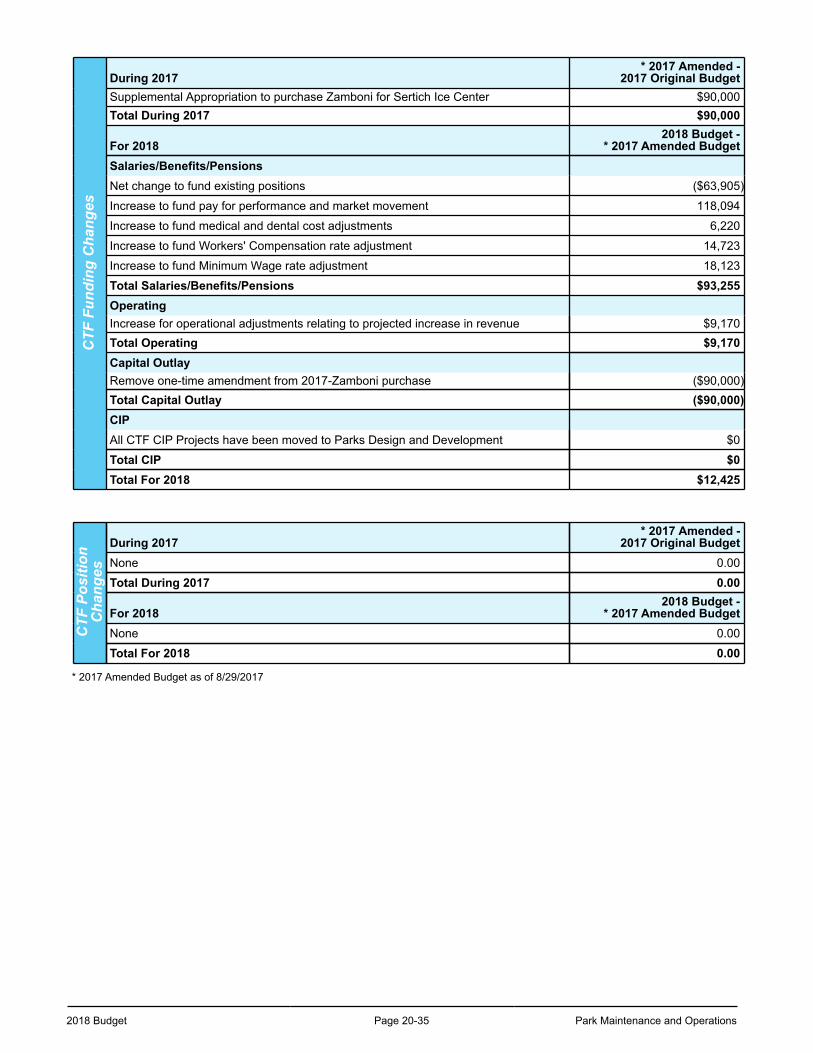
2018 Budget Page 20-35 Park Maintenance and Operations
CTF
Fun
ding
Cha
nges
During 2017* 2017 Amended -
2017 Original BudgetSupplemental Appropriation to purchase Zamboni for Sertich Ice Center $90,000Total During 2017 $90,000
For 20182018 Budget -
* 2017 Amended BudgetSalaries/Benefits/PensionsNet change to fund existing positions ($63,905)
Increase to fund pay for performance and market movement 118,094
Increase to fund medical and dental cost adjustments 6,220
Increase to fund Workers' Compensation rate adjustment 14,723
Increase to fund Minimum Wage rate adjustment 18,123
Total Salaries/Benefits/Pensions $93,255OperatingIncrease for operational adjustments relating to projected increase in revenue $9,170Total Operating $9,170Capital OutlayRemove one-time amendment from 2017-Zamboni purchase ($90,000)Total Capital Outlay ($90,000)CIPAll CTF CIP Projects have been moved to Parks Design and Development $0
Total CIP $0Total For 2018 $12,425
CTF
Pos
ition
Cha
nges
During 2017* 2017 Amended -
2017 Original BudgetNone 0.00
Total During 2017 0.00
For 20182018 Budget -
* 2017 Amended BudgetNone 0.00
Total For 2018 0.00
* 2017 Amended Budget as of 8/29/2017
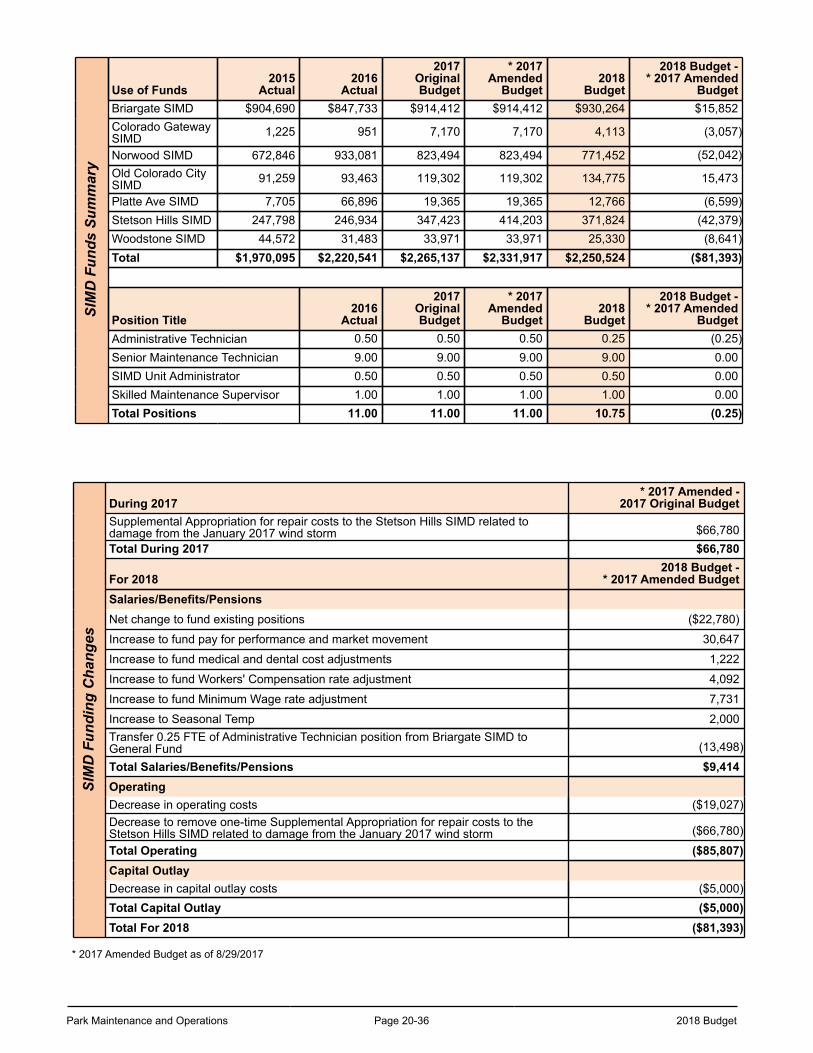
Park Maintenance and Operations Page 20-36 2018 Budget
SIM
D F
unds
Sum
mar
yUse of Funds
2015Actual
2016Actual
2017OriginalBudget
* 2017Amended
Budget2018
Budget
2018 Budget -* 2017 Amended
BudgetBriargate SIMD $904,690 $847,733 $914,412 $914,412 $930,264 $15,852Colorado GatewaySIMD 1,225 951 7,170 7,170 4,113 (3,057)
Norwood SIMD 672,846 933,081 823,494 823,494 771,452 (52,042)Old Colorado CitySIMD 91,259 93,463 119,302 119,302 134,775 15,473
Platte Ave SIMD 7,705 66,896 19,365 19,365 12,766 (6,599)Stetson Hills SIMD 247,798 246,934 347,423 414,203 371,824 (42,379)Woodstone SIMD 44,572 31,483 33,971 33,971 25,330 (8,641)Total $1,970,095 $2,220,541 $2,265,137 $2,331,917 $2,250,524 ($81,393)
Position Title2016
Actual
2017OriginalBudget
* 2017Amended
Budget2018
Budget
2018 Budget -* 2017 Amended
BudgetAdministrative Technician 0.50 0.50 0.50 0.25 (0.25)Senior Maintenance Technician 9.00 9.00 9.00 9.00 0.00SIMD Unit Administrator 0.50 0.50 0.50 0.50 0.00Skilled Maintenance Supervisor 1.00 1.00 1.00 1.00 0.00Total Positions 11.00 11.00 11.00 10.75 (0.25)
SIM
D F
undi
ng C
hang
es
During 2017* 2017 Amended -
2017 Original BudgetSupplemental Appropriation for repair costs to the Stetson Hills SIMD related todamage from the January 2017 wind storm $66,780Total During 2017 $66,780
For 20182018 Budget -
* 2017 Amended BudgetSalaries/Benefits/PensionsNet change to fund existing positions ($22,780)
Increase to fund pay for performance and market movement 30,647
Increase to fund medical and dental cost adjustments 1,222
Increase to fund Workers' Compensation rate adjustment 4,092
Increase to fund Minimum Wage rate adjustment 7,731
Increase to Seasonal Temp 2,000Transfer 0.25 FTE of Administrative Technician position from Briargate SIMD toGeneral Fund (13,498)
Total Salaries/Benefits/Pensions $9,414OperatingDecrease in operating costs ($19,027)Decrease to remove one-time Supplemental Appropriation for repair costs to theStetson Hills SIMD related to damage from the January 2017 wind storm ($66,780)
Total Operating ($85,807)Capital OutlayDecrease in capital outlay costs ($5,000)Total Capital Outlay ($5,000)Total For 2018 ($81,393)
* 2017 Amended Budget as of 8/29/2017
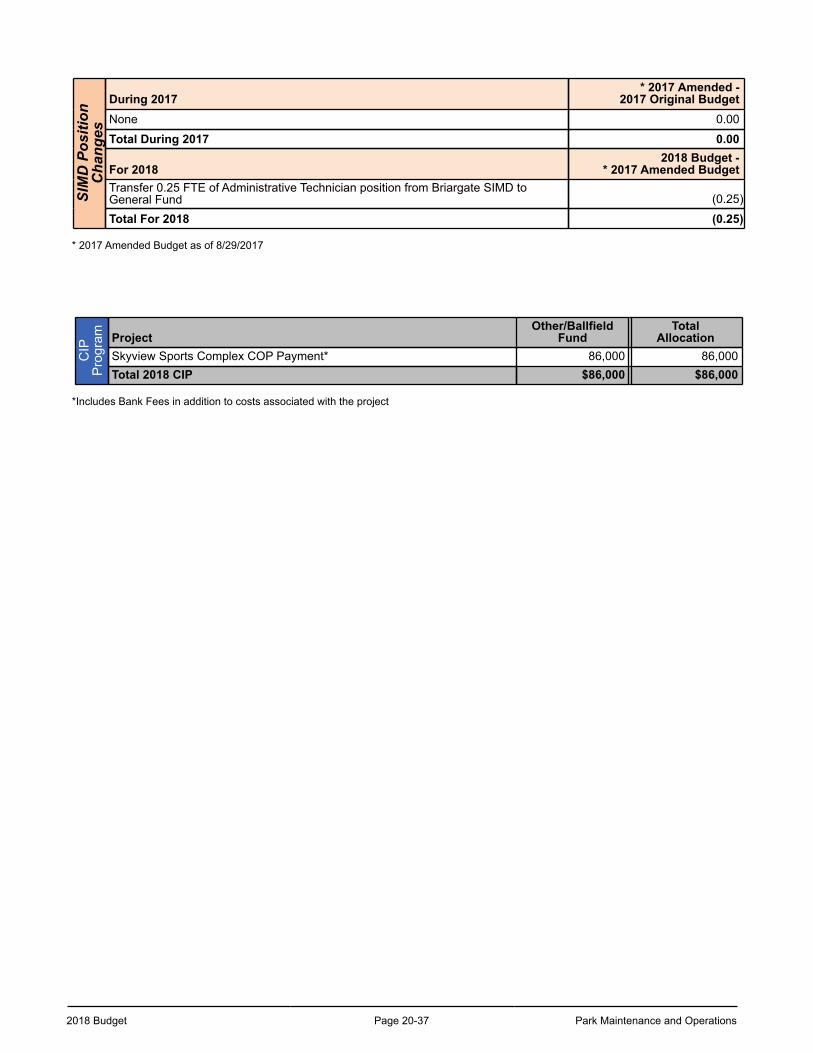
2018 Budget Page 20-37 Park Maintenance and Operations
SIM
D P
ositi
onC
hang
esDuring 2017
* 2017 Amended -2017 Original Budget
None 0.00
Total During 2017 0.00
For 20182018 Budget -
* 2017 Amended BudgetTransfer 0.25 FTE of Administrative Technician position from Briargate SIMD toGeneral Fund (0.25)
Total For 2018 (0.25)
* 2017 Amended Budget as of 8/29/2017
CIP
Pro
gram Project
Other/BallfieldFund
TotalAllocation
Skyview Sports Complex COP Payment* 86,000 86,000Total 2018 CIP $86,000 $86,000
*Includes Bank Fees in addition to costs associated with the project
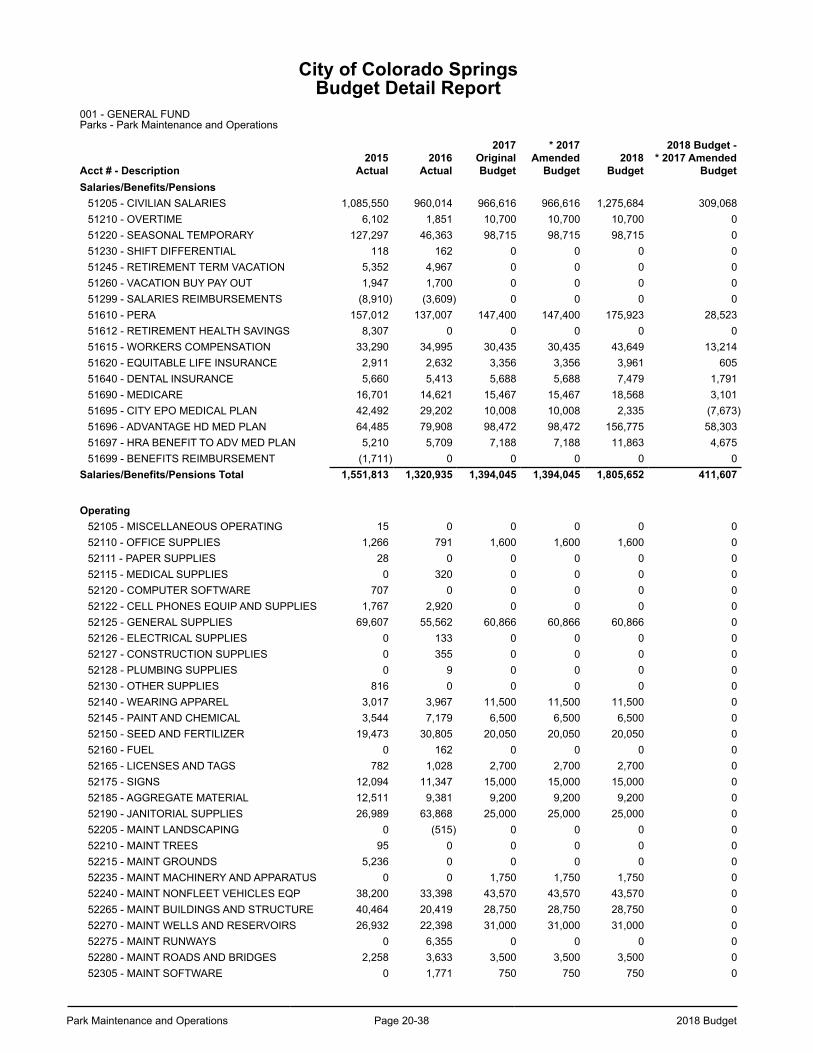
Park Maintenance and Operations Page 20-38 2018 Budget
City of Colorado SpringsBudget Detail Report
001 - GENERAL FUNDParks - Park Maintenance and Operations
Acct # - Description2015
Actual2016
Actual
2017OriginalBudget
* 2017Amended
Budget2018
Budget
2018 Budget -* 2017 Amended
BudgetSalaries/Benefits/Pensions
51205 - CIVILIAN SALARIES 1,085,550 960,014 966,616 966,616 1,275,684 309,06851210 - OVERTIME 6,102 1,851 10,700 10,700 10,700 051220 - SEASONAL TEMPORARY 127,297 46,363 98,715 98,715 98,715 051230 - SHIFT DIFFERENTIAL 118 162 0 0 0 051245 - RETIREMENT TERM VACATION 5,352 4,967 0 0 0 051260 - VACATION BUY PAY OUT 1,947 1,700 0 0 0 051299 - SALARIES REIMBURSEMENTS (8,910) (3,609) 0 0 0 051610 - PERA 157,012 137,007 147,400 147,400 175,923 28,52351612 - RETIREMENT HEALTH SAVINGS 8,307 0 0 0 0 051615 - WORKERS COMPENSATION 33,290 34,995 30,435 30,435 43,649 13,21451620 - EQUITABLE LIFE INSURANCE 2,911 2,632 3,356 3,356 3,961 60551640 - DENTAL INSURANCE 5,660 5,413 5,688 5,688 7,479 1,79151690 - MEDICARE 16,701 14,621 15,467 15,467 18,568 3,10151695 - CITY EPO MEDICAL PLAN 42,492 29,202 10,008 10,008 2,335 (7,673)51696 - ADVANTAGE HD MED PLAN 64,485 79,908 98,472 98,472 156,775 58,30351697 - HRA BENEFIT TO ADV MED PLAN 5,210 5,709 7,188 7,188 11,863 4,67551699 - BENEFITS REIMBURSEMENT (1,711) 0 0 0 0 0
Salaries/Benefits/Pensions Total 1,551,813 1,320,935 1,394,045 1,394,045 1,805,652 411,607
Operating52105 - MISCELLANEOUS OPERATING 15 0 0 0 0 052110 - OFFICE SUPPLIES 1,266 791 1,600 1,600 1,600 052111 - PAPER SUPPLIES 28 0 0 0 0 052115 - MEDICAL SUPPLIES 0 320 0 0 0 052120 - COMPUTER SOFTWARE 707 0 0 0 0 052122 - CELL PHONES EQUIP AND SUPPLIES 1,767 2,920 0 0 0 052125 - GENERAL SUPPLIES 69,607 55,562 60,866 60,866 60,866 052126 - ELECTRICAL SUPPLIES 0 133 0 0 0 052127 - CONSTRUCTION SUPPLIES 0 355 0 0 0 052128 - PLUMBING SUPPLIES 0 9 0 0 0 052130 - OTHER SUPPLIES 816 0 0 0 0 052140 - WEARING APPAREL 3,017 3,967 11,500 11,500 11,500 052145 - PAINT AND CHEMICAL 3,544 7,179 6,500 6,500 6,500 052150 - SEED AND FERTILIZER 19,473 30,805 20,050 20,050 20,050 052160 - FUEL 0 162 0 0 0 052165 - LICENSES AND TAGS 782 1,028 2,700 2,700 2,700 052175 - SIGNS 12,094 11,347 15,000 15,000 15,000 052185 - AGGREGATE MATERIAL 12,511 9,381 9,200 9,200 9,200 052190 - JANITORIAL SUPPLIES 26,989 63,868 25,000 25,000 25,000 052205 - MAINT LANDSCAPING 0 (515) 0 0 0 052210 - MAINT TREES 95 0 0 0 0 052215 - MAINT GROUNDS 5,236 0 0 0 0 052235 - MAINT MACHINERY AND APPARATUS 0 0 1,750 1,750 1,750 052240 - MAINT NONFLEET VEHICLES EQP 38,200 33,398 43,570 43,570 43,570 052265 - MAINT BUILDINGS AND STRUCTURE 40,464 20,419 28,750 28,750 28,750 052270 - MAINT WELLS AND RESERVOIRS 26,932 22,398 31,000 31,000 31,000 052275 - MAINT RUNWAYS 0 6,355 0 0 0 052280 - MAINT ROADS AND BRIDGES 2,258 3,633 3,500 3,500 3,500 052305 - MAINT SOFTWARE 0 1,771 750 750 750 0
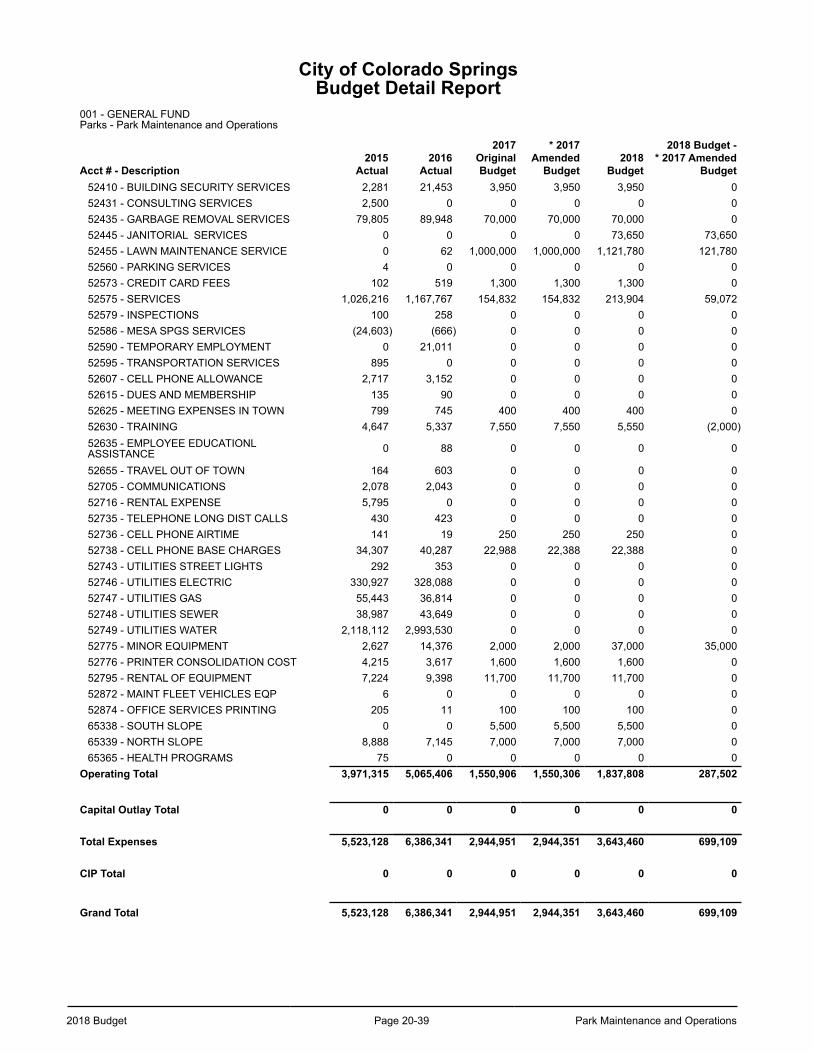
2018 Budget Page 20-39 Park Maintenance and Operations
City of Colorado SpringsBudget Detail Report
001 - GENERAL FUNDParks - Park Maintenance and Operations
Acct # - Description2015
Actual2016
Actual
2017OriginalBudget
* 2017Amended
Budget2018
Budget
2018 Budget -* 2017 Amended
Budget52410 - BUILDING SECURITY SERVICES 2,281 21,453 3,950 3,950 3,950 052431 - CONSULTING SERVICES 2,500 0 0 0 0 052435 - GARBAGE REMOVAL SERVICES 79,805 89,948 70,000 70,000 70,000 052445 - JANITORIAL SERVICES 0 0 0 0 73,650 73,65052455 - LAWN MAINTENANCE SERVICE 0 62 1,000,000 1,000,000 1,121,780 121,78052560 - PARKING SERVICES 4 0 0 0 0 052573 - CREDIT CARD FEES 102 519 1,300 1,300 1,300 052575 - SERVICES 1,026,216 1,167,767 154,832 154,832 213,904 59,07252579 - INSPECTIONS 100 258 0 0 0 052586 - MESA SPGS SERVICES (24,603) (666) 0 0 0 052590 - TEMPORARY EMPLOYMENT 0 21,011 0 0 0 052595 - TRANSPORTATION SERVICES 895 0 0 0 0 052607 - CELL PHONE ALLOWANCE 2,717 3,152 0 0 0 052615 - DUES AND MEMBERSHIP 135 90 0 0 0 052625 - MEETING EXPENSES IN TOWN 799 745 400 400 400 052630 - TRAINING 4,647 5,337 7,550 7,550 5,550 (2,000)52635 - EMPLOYEE EDUCATIONLASSISTANCE 0 88 0 0 0 0
52655 - TRAVEL OUT OF TOWN 164 603 0 0 0 052705 - COMMUNICATIONS 2,078 2,043 0 0 0 052716 - RENTAL EXPENSE 5,795 0 0 0 0 052735 - TELEPHONE LONG DIST CALLS 430 423 0 0 0 052736 - CELL PHONE AIRTIME 141 19 250 250 250 052738 - CELL PHONE BASE CHARGES 34,307 40,287 22,988 22,388 22,388 052743 - UTILITIES STREET LIGHTS 292 353 0 0 0 052746 - UTILITIES ELECTRIC 330,927 328,088 0 0 0 052747 - UTILITIES GAS 55,443 36,814 0 0 0 052748 - UTILITIES SEWER 38,987 43,649 0 0 0 052749 - UTILITIES WATER 2,118,112 2,993,530 0 0 0 052775 - MINOR EQUIPMENT 2,627 14,376 2,000 2,000 37,000 35,00052776 - PRINTER CONSOLIDATION COST 4,215 3,617 1,600 1,600 1,600 052795 - RENTAL OF EQUIPMENT 7,224 9,398 11,700 11,700 11,700 052872 - MAINT FLEET VEHICLES EQP 6 0 0 0 0 052874 - OFFICE SERVICES PRINTING 205 11 100 100 100 065338 - SOUTH SLOPE 0 0 5,500 5,500 5,500 065339 - NORTH SLOPE 8,888 7,145 7,000 7,000 7,000 065365 - HEALTH PROGRAMS 75 0 0 0 0 0
Operating Total 3,971,315 5,065,406 1,550,906 1,550,306 1,837,808 287,502
Capital Outlay Total 0 0 0 0 0 0
Total Expenses 5,523,128 6,386,341 2,944,951 2,944,351 3,643,460 699,109
CIP Total 0 0 0 0 0 0
Grand Total 5,523,128 6,386,341 2,944,951 2,944,351 3,643,460 699,109
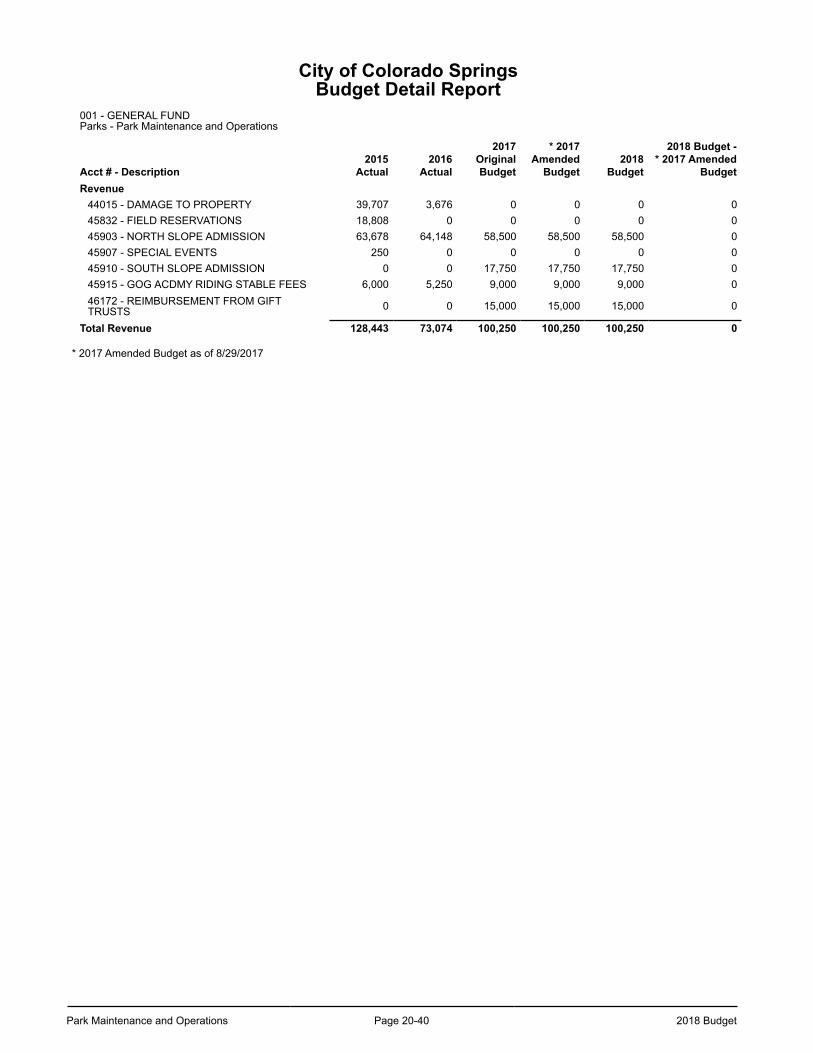
Park Maintenance and Operations Page 20-40 2018 Budget
City of Colorado SpringsBudget Detail Report
001 - GENERAL FUNDParks - Park Maintenance and Operations
Acct # - Description2015
Actual2016
Actual
2017OriginalBudget
* 2017Amended
Budget2018
Budget
2018 Budget -* 2017 Amended
BudgetRevenue
44015 - DAMAGE TO PROPERTY 39,707 3,676 0 0 0 045832 - FIELD RESERVATIONS 18,808 0 0 0 0 045903 - NORTH SLOPE ADMISSION 63,678 64,148 58,500 58,500 58,500 045907 - SPECIAL EVENTS 250 0 0 0 0 045910 - SOUTH SLOPE ADMISSION 0 0 17,750 17,750 17,750 045915 - GOG ACDMY RIDING STABLE FEES 6,000 5,250 9,000 9,000 9,000 046172 - REIMBURSEMENT FROM GIFTTRUSTS 0 0 15,000 15,000 15,000 0
Total Revenue 128,443 73,074 100,250 100,250 100,250 0
* 2017 Amended Budget as of 8/29/2017
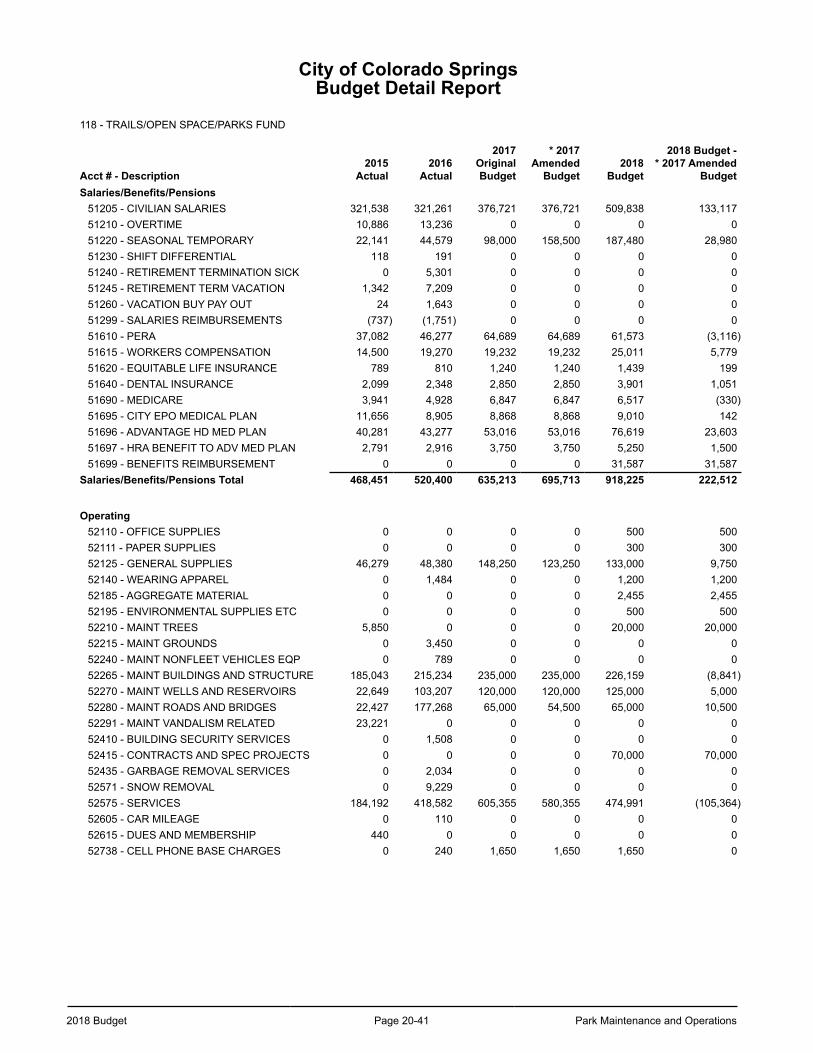
2018 Budget Page 20-41 Park Maintenance and Operations
City of Colorado SpringsBudget Detail Report
118 - TRAILS/OPEN SPACE/PARKS FUND
Acct # - Description2015
Actual2016
Actual
2017OriginalBudget
* 2017Amended
Budget2018
Budget
2018 Budget -* 2017 Amended
BudgetSalaries/Benefits/Pensions
51205 - CIVILIAN SALARIES 321,538 321,261 376,721 376,721 509,838 133,11751210 - OVERTIME 10,886 13,236 0 0 0 051220 - SEASONAL TEMPORARY 22,141 44,579 98,000 158,500 187,480 28,98051230 - SHIFT DIFFERENTIAL 118 191 0 0 0 051240 - RETIREMENT TERMINATION SICK 0 5,301 0 0 0 051245 - RETIREMENT TERM VACATION 1,342 7,209 0 0 0 051260 - VACATION BUY PAY OUT 24 1,643 0 0 0 051299 - SALARIES REIMBURSEMENTS (737) (1,751) 0 0 0 051610 - PERA 37,082 46,277 64,689 64,689 61,573 (3,116)51615 - WORKERS COMPENSATION 14,500 19,270 19,232 19,232 25,011 5,77951620 - EQUITABLE LIFE INSURANCE 789 810 1,240 1,240 1,439 19951640 - DENTAL INSURANCE 2,099 2,348 2,850 2,850 3,901 1,05151690 - MEDICARE 3,941 4,928 6,847 6,847 6,517 (330)51695 - CITY EPO MEDICAL PLAN 11,656 8,905 8,868 8,868 9,010 14251696 - ADVANTAGE HD MED PLAN 40,281 43,277 53,016 53,016 76,619 23,60351697 - HRA BENEFIT TO ADV MED PLAN 2,791 2,916 3,750 3,750 5,250 1,50051699 - BENEFITS REIMBURSEMENT 0 0 0 0 31,587 31,587
Salaries/Benefits/Pensions Total 468,451 520,400 635,213 695,713 918,225 222,512
Operating52110 - OFFICE SUPPLIES 0 0 0 0 500 50052111 - PAPER SUPPLIES 0 0 0 0 300 30052125 - GENERAL SUPPLIES 46,279 48,380 148,250 123,250 133,000 9,75052140 - WEARING APPAREL 0 1,484 0 0 1,200 1,20052185 - AGGREGATE MATERIAL 0 0 0 0 2,455 2,45552195 - ENVIRONMENTAL SUPPLIES ETC 0 0 0 0 500 50052210 - MAINT TREES 5,850 0 0 0 20,000 20,00052215 - MAINT GROUNDS 0 3,450 0 0 0 052240 - MAINT NONFLEET VEHICLES EQP 0 789 0 0 0 052265 - MAINT BUILDINGS AND STRUCTURE 185,043 215,234 235,000 235,000 226,159 (8,841)52270 - MAINT WELLS AND RESERVOIRS 22,649 103,207 120,000 120,000 125,000 5,00052280 - MAINT ROADS AND BRIDGES 22,427 177,268 65,000 54,500 65,000 10,50052291 - MAINT VANDALISM RELATED 23,221 0 0 0 0 052410 - BUILDING SECURITY SERVICES 0 1,508 0 0 0 052415 - CONTRACTS AND SPEC PROJECTS 0 0 0 0 70,000 70,00052435 - GARBAGE REMOVAL SERVICES 0 2,034 0 0 0 052571 - SNOW REMOVAL 0 9,229 0 0 0 052575 - SERVICES 184,192 418,582 605,355 580,355 474,991 (105,364)52605 - CAR MILEAGE 0 110 0 0 0 052615 - DUES AND MEMBERSHIP 440 0 0 0 0 052738 - CELL PHONE BASE CHARGES 0 240 1,650 1,650 1,650 0
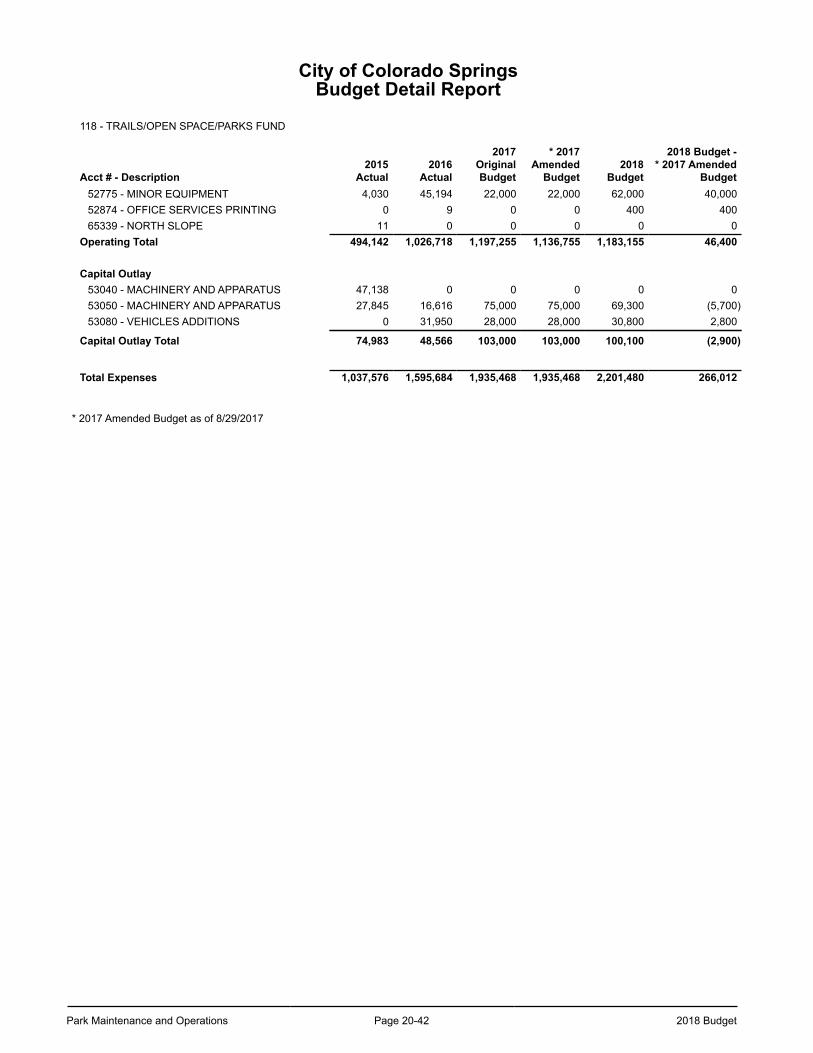
Park Maintenance and Operations Page 20-42 2018 Budget
City of Colorado SpringsBudget Detail Report
118 - TRAILS/OPEN SPACE/PARKS FUND
Acct # - Description2015
Actual2016
Actual
2017OriginalBudget
* 2017Amended
Budget2018
Budget
2018 Budget -* 2017 Amended
Budget52775 - MINOR EQUIPMENT 4,030 45,194 22,000 22,000 62,000 40,00052874 - OFFICE SERVICES PRINTING 0 9 0 0 400 40065339 - NORTH SLOPE 11 0 0 0 0 0
Operating Total 494,142 1,026,718 1,197,255 1,136,755 1,183,155 46,400
Capital Outlay53040 - MACHINERY AND APPARATUS 47,138 0 0 0 0 053050 - MACHINERY AND APPARATUS 27,845 16,616 75,000 75,000 69,300 (5,700)53080 - VEHICLES ADDITIONS 0 31,950 28,000 28,000 30,800 2,800
Capital Outlay Total 74,983 48,566 103,000 103,000 100,100 (2,900)
Total Expenses 1,037,576 1,595,684 1,935,468 1,935,468 2,201,480 266,012
* 2017 Amended Budget as of 8/29/2017
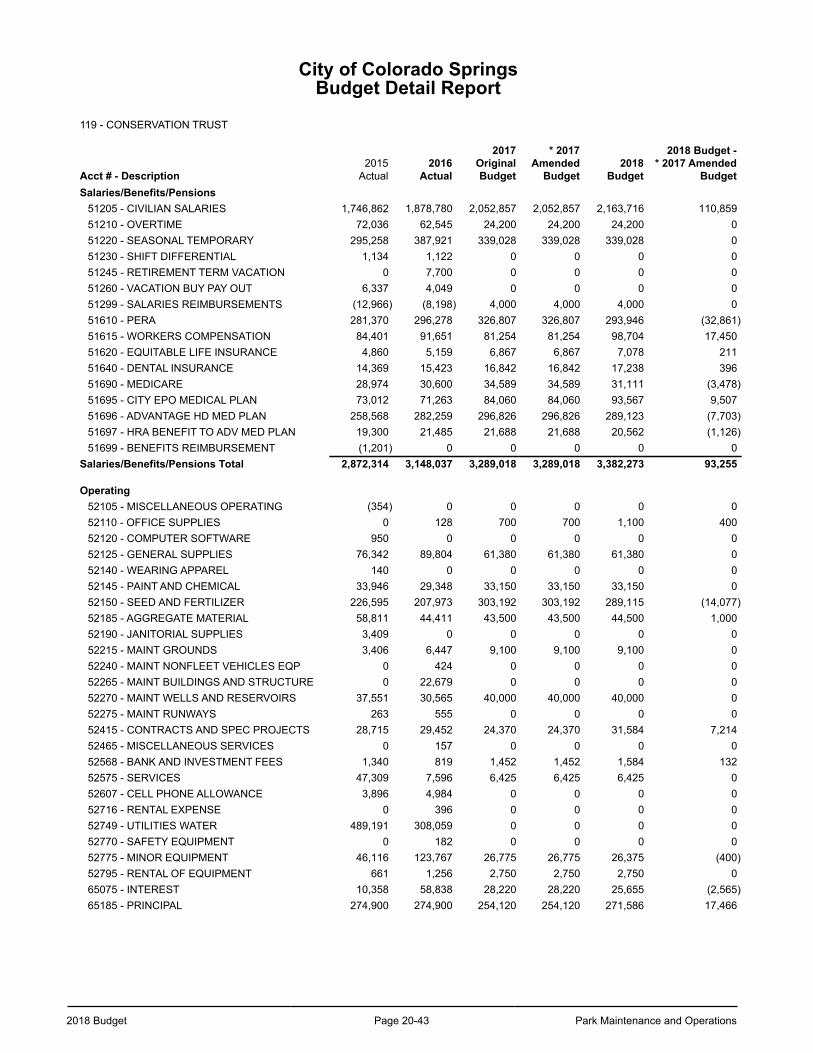
2018 Budget Page 20-43 Park Maintenance and Operations
City of Colorado SpringsBudget Detail Report
119 - CONSERVATION TRUST
Acct # - Description2015
Actual2016
Actual
2017OriginalBudget
* 2017Amended
Budget2018
Budget
2018 Budget -* 2017 Amended
BudgetSalaries/Benefits/Pensions
51205 - CIVILIAN SALARIES 1,746,862 1,878,780 2,052,857 2,052,857 2,163,716 110,85951210 - OVERTIME 72,036 62,545 24,200 24,200 24,200 051220 - SEASONAL TEMPORARY 295,258 387,921 339,028 339,028 339,028 051230 - SHIFT DIFFERENTIAL 1,134 1,122 0 0 0 051245 - RETIREMENT TERM VACATION 0 7,700 0 0 0 051260 - VACATION BUY PAY OUT 6,337 4,049 0 0 0 051299 - SALARIES REIMBURSEMENTS (12,966) (8,198) 4,000 4,000 4,000 051610 - PERA 281,370 296,278 326,807 326,807 293,946 (32,861)51615 - WORKERS COMPENSATION 84,401 91,651 81,254 81,254 98,704 17,45051620 - EQUITABLE LIFE INSURANCE 4,860 5,159 6,867 6,867 7,078 21151640 - DENTAL INSURANCE 14,369 15,423 16,842 16,842 17,238 39651690 - MEDICARE 28,974 30,600 34,589 34,589 31,111 (3,478)51695 - CITY EPO MEDICAL PLAN 73,012 71,263 84,060 84,060 93,567 9,50751696 - ADVANTAGE HD MED PLAN 258,568 282,259 296,826 296,826 289,123 (7,703)51697 - HRA BENEFIT TO ADV MED PLAN 19,300 21,485 21,688 21,688 20,562 (1,126)51699 - BENEFITS REIMBURSEMENT (1,201) 0 0 0 0 0
Salaries/Benefits/Pensions Total 2,872,314 3,148,037 3,289,018 3,289,018 3,382,273 93,255
Operating52105 - MISCELLANEOUS OPERATING (354) 0 0 0 0 052110 - OFFICE SUPPLIES 0 128 700 700 1,100 40052120 - COMPUTER SOFTWARE 950 0 0 0 0 052125 - GENERAL SUPPLIES 76,342 89,804 61,380 61,380 61,380 052140 - WEARING APPAREL 140 0 0 0 0 052145 - PAINT AND CHEMICAL 33,946 29,348 33,150 33,150 33,150 052150 - SEED AND FERTILIZER 226,595 207,973 303,192 303,192 289,115 (14,077)52185 - AGGREGATE MATERIAL 58,811 44,411 43,500 43,500 44,500 1,00052190 - JANITORIAL SUPPLIES 3,409 0 0 0 0 052215 - MAINT GROUNDS 3,406 6,447 9,100 9,100 9,100 052240 - MAINT NONFLEET VEHICLES EQP 0 424 0 0 0 052265 - MAINT BUILDINGS AND STRUCTURE 0 22,679 0 0 0 052270 - MAINT WELLS AND RESERVOIRS 37,551 30,565 40,000 40,000 40,000 052275 - MAINT RUNWAYS 263 555 0 0 0 052415 - CONTRACTS AND SPEC PROJECTS 28,715 29,452 24,370 24,370 31,584 7,21452465 - MISCELLANEOUS SERVICES 0 157 0 0 0 052568 - BANK AND INVESTMENT FEES 1,340 819 1,452 1,452 1,584 13252575 - SERVICES 47,309 7,596 6,425 6,425 6,425 052607 - CELL PHONE ALLOWANCE 3,896 4,984 0 0 0 052716 - RENTAL EXPENSE 0 396 0 0 0 052749 - UTILITIES WATER 489,191 308,059 0 0 0 052770 - SAFETY EQUIPMENT 0 182 0 0 0 052775 - MINOR EQUIPMENT 46,116 123,767 26,775 26,775 26,375 (400)52795 - RENTAL OF EQUIPMENT 661 1,256 2,750 2,750 2,750 065075 - INTEREST 10,358 58,838 28,220 28,220 25,655 (2,565)65185 - PRINCIPAL 274,900 274,900 254,120 254,120 271,586 17,466
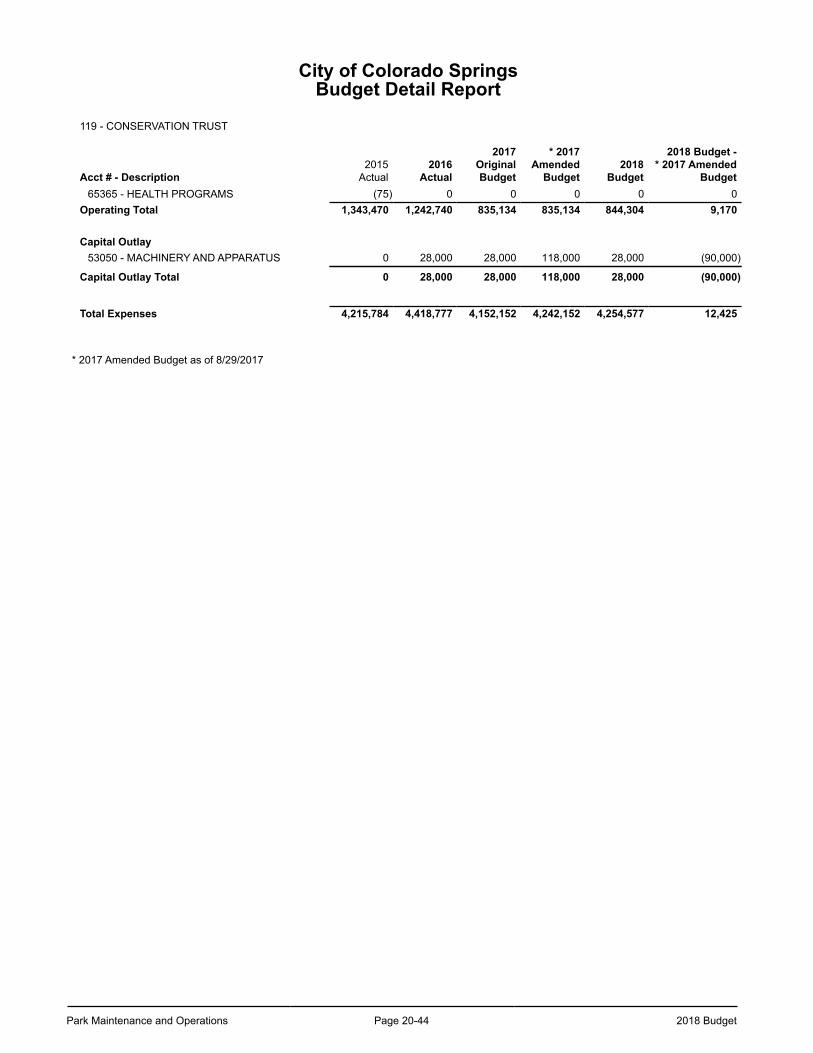
Park Maintenance and Operations Page 20-44 2018 Budget
City of Colorado SpringsBudget Detail Report
119 - CONSERVATION TRUST
Acct # - Description2015
Actual2016
Actual
2017OriginalBudget
* 2017Amended
Budget2018
Budget
2018 Budget -* 2017 Amended
Budget65365 - HEALTH PROGRAMS (75) 0 0 0 0 0
Operating Total 1,343,470 1,242,740 835,134 835,134 844,304 9,170
Capital Outlay53050 - MACHINERY AND APPARATUS 0 28,000 28,000 118,000 28,000 (90,000)
Capital Outlay Total 0 28,000 28,000 118,000 28,000 (90,000)
Total Expenses 4,215,784 4,418,777 4,152,152 4,242,152 4,254,577 12,425
* 2017 Amended Budget as of 8/29/2017
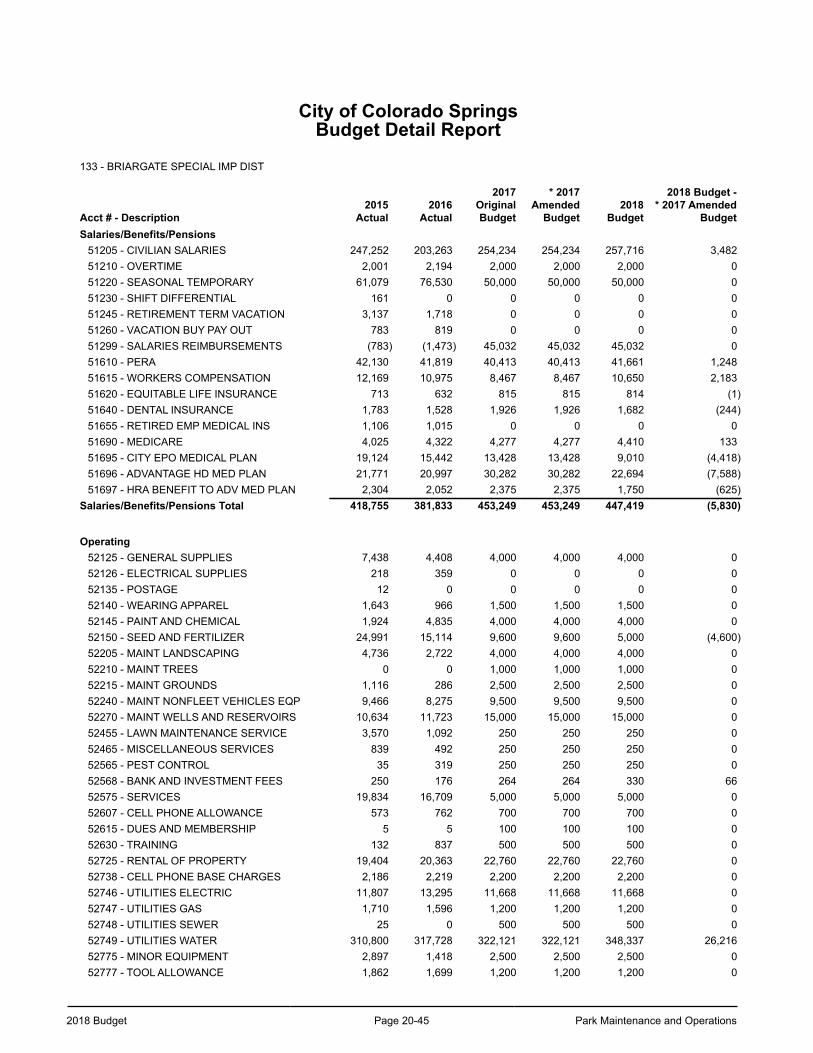
2018 Budget Page 20-45 Park Maintenance and Operations
City of Colorado SpringsBudget Detail Report
133 - BRIARGATE SPECIAL IMP DIST
Acct # - Description2015
Actual2016
Actual
2017OriginalBudget
* 2017Amended
Budget2018
Budget
2018 Budget -* 2017 Amended
BudgetSalaries/Benefits/Pensions
51205 - CIVILIAN SALARIES 247,252 203,263 254,234 254,234 257,716 3,48251210 - OVERTIME 2,001 2,194 2,000 2,000 2,000 051220 - SEASONAL TEMPORARY 61,079 76,530 50,000 50,000 50,000 051230 - SHIFT DIFFERENTIAL 161 0 0 0 0 051245 - RETIREMENT TERM VACATION 3,137 1,718 0 0 0 051260 - VACATION BUY PAY OUT 783 819 0 0 0 051299 - SALARIES REIMBURSEMENTS (783) (1,473) 45,032 45,032 45,032 051610 - PERA 42,130 41,819 40,413 40,413 41,661 1,24851615 - WORKERS COMPENSATION 12,169 10,975 8,467 8,467 10,650 2,18351620 - EQUITABLE LIFE INSURANCE 713 632 815 815 814 (1)51640 - DENTAL INSURANCE 1,783 1,528 1,926 1,926 1,682 (244)51655 - RETIRED EMP MEDICAL INS 1,106 1,015 0 0 0 051690 - MEDICARE 4,025 4,322 4,277 4,277 4,410 13351695 - CITY EPO MEDICAL PLAN 19,124 15,442 13,428 13,428 9,010 (4,418)51696 - ADVANTAGE HD MED PLAN 21,771 20,997 30,282 30,282 22,694 (7,588)51697 - HRA BENEFIT TO ADV MED PLAN 2,304 2,052 2,375 2,375 1,750 (625)
Salaries/Benefits/Pensions Total 418,755 381,833 453,249 453,249 447,419 (5,830)
Operating52125 - GENERAL SUPPLIES 7,438 4,408 4,000 4,000 4,000 052126 - ELECTRICAL SUPPLIES 218 359 0 0 0 052135 - POSTAGE 12 0 0 0 0 052140 - WEARING APPAREL 1,643 966 1,500 1,500 1,500 052145 - PAINT AND CHEMICAL 1,924 4,835 4,000 4,000 4,000 052150 - SEED AND FERTILIZER 24,991 15,114 9,600 9,600 5,000 (4,600)52205 - MAINT LANDSCAPING 4,736 2,722 4,000 4,000 4,000 052210 - MAINT TREES 0 0 1,000 1,000 1,000 052215 - MAINT GROUNDS 1,116 286 2,500 2,500 2,500 052240 - MAINT NONFLEET VEHICLES EQP 9,466 8,275 9,500 9,500 9,500 052270 - MAINT WELLS AND RESERVOIRS 10,634 11,723 15,000 15,000 15,000 052455 - LAWN MAINTENANCE SERVICE 3,570 1,092 250 250 250 052465 - MISCELLANEOUS SERVICES 839 492 250 250 250 052565 - PEST CONTROL 35 319 250 250 250 052568 - BANK AND INVESTMENT FEES 250 176 264 264 330 6652575 - SERVICES 19,834 16,709 5,000 5,000 5,000 052607 - CELL PHONE ALLOWANCE 573 762 700 700 700 052615 - DUES AND MEMBERSHIP 5 5 100 100 100 052630 - TRAINING 132 837 500 500 500 052725 - RENTAL OF PROPERTY 19,404 20,363 22,760 22,760 22,760 052738 - CELL PHONE BASE CHARGES 2,186 2,219 2,200 2,200 2,200 052746 - UTILITIES ELECTRIC 11,807 13,295 11,668 11,668 11,668 052747 - UTILITIES GAS 1,710 1,596 1,200 1,200 1,200 052748 - UTILITIES SEWER 25 0 500 500 500 052749 - UTILITIES WATER 310,800 317,728 322,121 322,121 348,337 26,21652775 - MINOR EQUIPMENT 2,897 1,418 2,500 2,500 2,500 052777 - TOOL ALLOWANCE 1,862 1,699 1,200 1,200 1,200 0
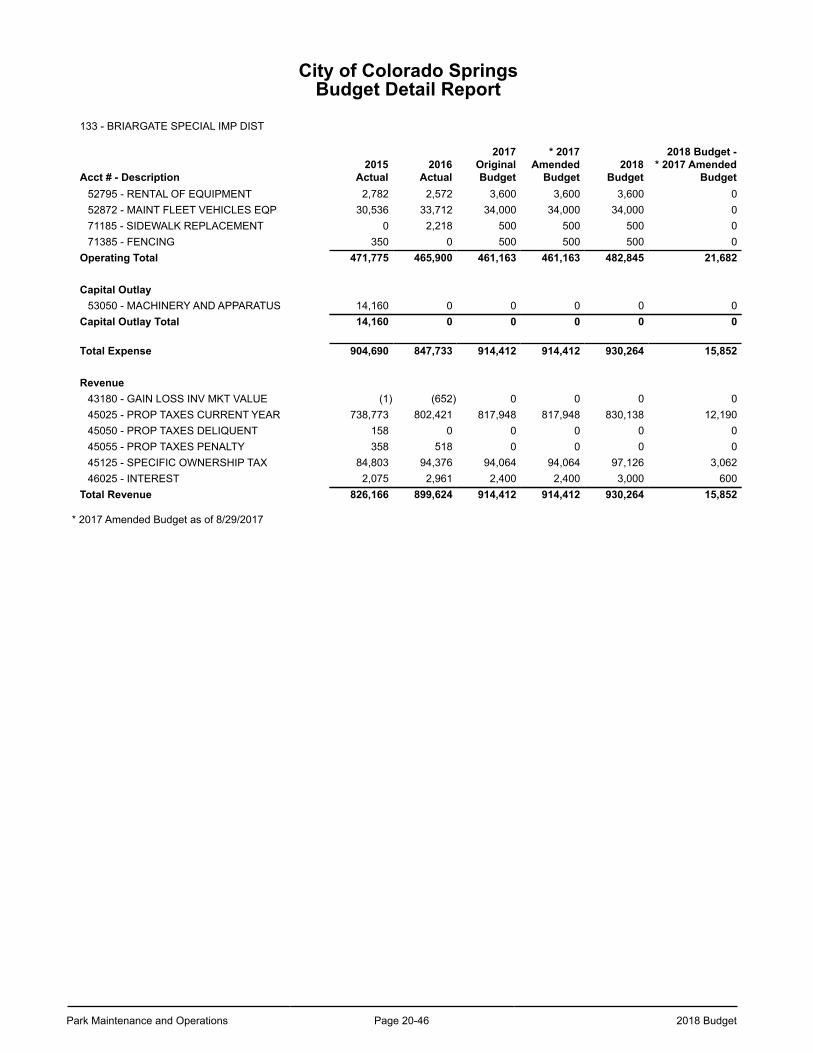
Park Maintenance and Operations Page 20-46 2018 Budget
City of Colorado SpringsBudget Detail Report
133 - BRIARGATE SPECIAL IMP DIST
Acct # - Description2015
Actual2016
Actual
2017OriginalBudget
* 2017Amended
Budget2018
Budget
2018 Budget -* 2017 Amended
Budget52795 - RENTAL OF EQUIPMENT 2,782 2,572 3,600 3,600 3,600 052872 - MAINT FLEET VEHICLES EQP 30,536 33,712 34,000 34,000 34,000 071185 - SIDEWALK REPLACEMENT 0 2,218 500 500 500 071385 - FENCING 350 0 500 500 500 0
Operating Total 471,775 465,900 461,163 461,163 482,845 21,682
Capital Outlay53050 - MACHINERY AND APPARATUS 14,160 0 0 0 0 0
Capital Outlay Total 14,160 0 0 0 0 0
Total Expense 904,690 847,733 914,412 914,412 930,264 15,852
Revenue43180 - GAIN LOSS INV MKT VALUE (1) (652) 0 0 0 045025 - PROP TAXES CURRENT YEAR 738,773 802,421 817,948 817,948 830,138 12,19045050 - PROP TAXES DELIQUENT 158 0 0 0 0 045055 - PROP TAXES PENALTY 358 518 0 0 0 045125 - SPECIFIC OWNERSHIP TAX 84,803 94,376 94,064 94,064 97,126 3,06246025 - INTEREST 2,075 2,961 2,400 2,400 3,000 600
Total Revenue 826,166 899,624 914,412 914,412 930,264 15,852
* 2017 Amended Budget as of 8/29/2017
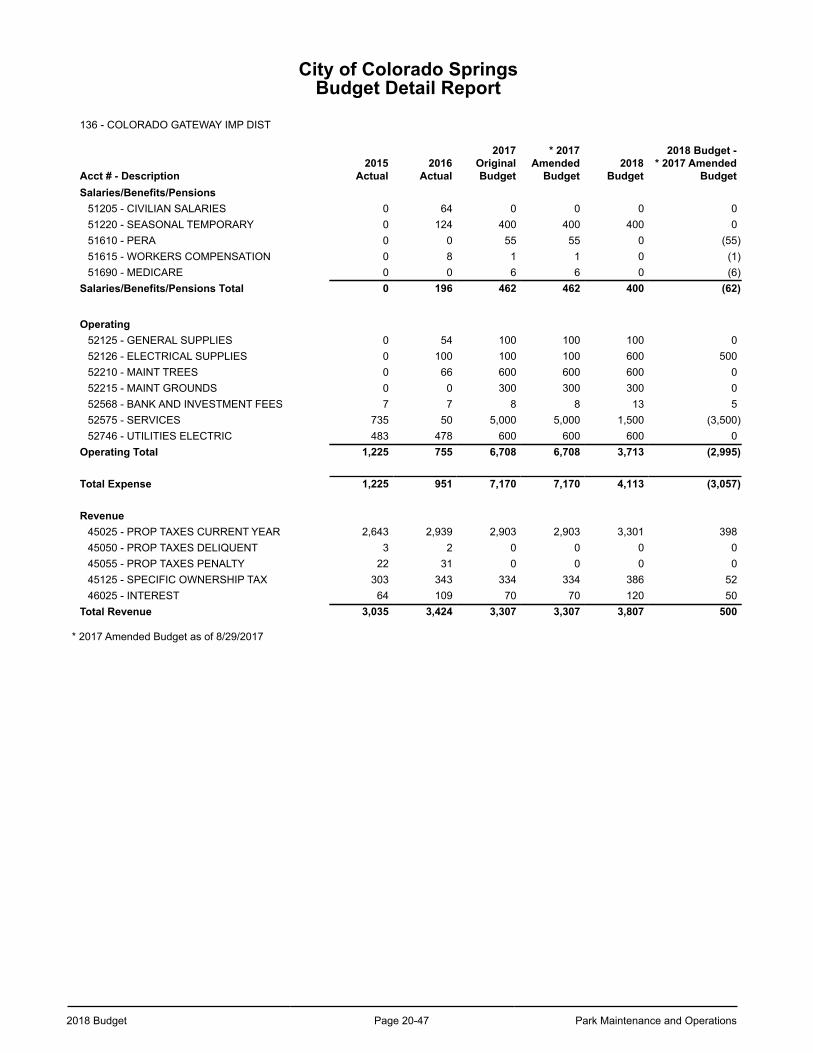
2018 Budget Page 20-47 Park Maintenance and Operations
City of Colorado SpringsBudget Detail Report
136 - COLORADO GATEWAY IMP DIST
Acct # - Description2015
Actual2016
Actual
2017OriginalBudget
* 2017Amended
Budget2018
Budget
2018 Budget -* 2017 Amended
BudgetSalaries/Benefits/Pensions
51205 - CIVILIAN SALARIES 0 64 0 0 0 051220 - SEASONAL TEMPORARY 0 124 400 400 400 051610 - PERA 0 0 55 55 0 (55)51615 - WORKERS COMPENSATION 0 8 1 1 0 (1)51690 - MEDICARE 0 0 6 6 0 (6)
Salaries/Benefits/Pensions Total 0 196 462 462 400 (62)
Operating52125 - GENERAL SUPPLIES 0 54 100 100 100 052126 - ELECTRICAL SUPPLIES 0 100 100 100 600 50052210 - MAINT TREES 0 66 600 600 600 052215 - MAINT GROUNDS 0 0 300 300 300 052568 - BANK AND INVESTMENT FEES 7 7 8 8 13 552575 - SERVICES 735 50 5,000 5,000 1,500 (3,500)52746 - UTILITIES ELECTRIC 483 478 600 600 600 0
Operating Total 1,225 755 6,708 6,708 3,713 (2,995)
Total Expense 1,225 951 7,170 7,170 4,113 (3,057)
Revenue45025 - PROP TAXES CURRENT YEAR 2,643 2,939 2,903 2,903 3,301 39845050 - PROP TAXES DELIQUENT 3 2 0 0 0 045055 - PROP TAXES PENALTY 22 31 0 0 0 045125 - SPECIFIC OWNERSHIP TAX 303 343 334 334 386 5246025 - INTEREST 64 109 70 70 120 50
Total Revenue 3,035 3,424 3,307 3,307 3,807 500
* 2017 Amended Budget as of 8/29/2017
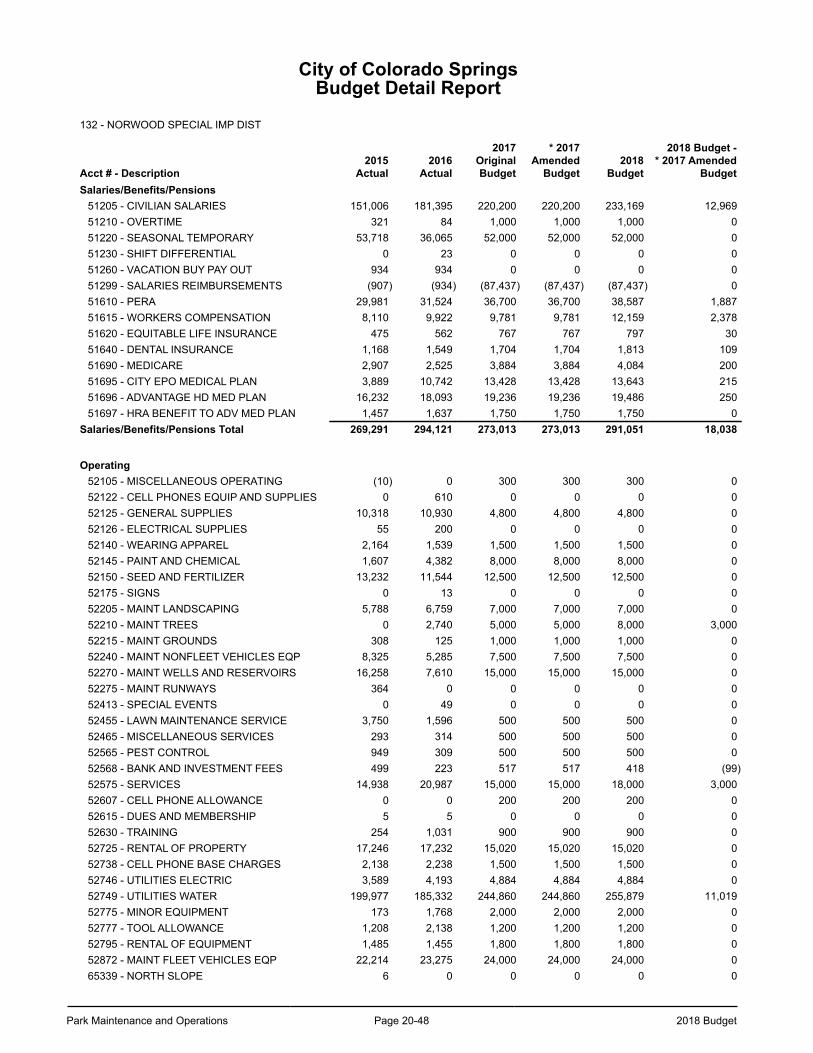
Park Maintenance and Operations Page 20-48 2018 Budget
City of Colorado SpringsBudget Detail Report
132 - NORWOOD SPECIAL IMP DIST
Acct # - Description2015
Actual2016
Actual
2017OriginalBudget
* 2017Amended
Budget2018
Budget
2018 Budget -* 2017 Amended
BudgetSalaries/Benefits/Pensions
51205 - CIVILIAN SALARIES 151,006 181,395 220,200 220,200 233,169 12,96951210 - OVERTIME 321 84 1,000 1,000 1,000 051220 - SEASONAL TEMPORARY 53,718 36,065 52,000 52,000 52,000 051230 - SHIFT DIFFERENTIAL 0 23 0 0 0 051260 - VACATION BUY PAY OUT 934 934 0 0 0 051299 - SALARIES REIMBURSEMENTS (907) (934) (87,437) (87,437) (87,437) 051610 - PERA 29,981 31,524 36,700 36,700 38,587 1,88751615 - WORKERS COMPENSATION 8,110 9,922 9,781 9,781 12,159 2,37851620 - EQUITABLE LIFE INSURANCE 475 562 767 767 797 3051640 - DENTAL INSURANCE 1,168 1,549 1,704 1,704 1,813 10951690 - MEDICARE 2,907 2,525 3,884 3,884 4,084 20051695 - CITY EPO MEDICAL PLAN 3,889 10,742 13,428 13,428 13,643 21551696 - ADVANTAGE HD MED PLAN 16,232 18,093 19,236 19,236 19,486 25051697 - HRA BENEFIT TO ADV MED PLAN 1,457 1,637 1,750 1,750 1,750 0
Salaries/Benefits/Pensions Total 269,291 294,121 273,013 273,013 291,051 18,038
Operating52105 - MISCELLANEOUS OPERATING (10) 0 300 300 300 052122 - CELL PHONES EQUIP AND SUPPLIES 0 610 0 0 0 052125 - GENERAL SUPPLIES 10,318 10,930 4,800 4,800 4,800 052126 - ELECTRICAL SUPPLIES 55 200 0 0 0 052140 - WEARING APPAREL 2,164 1,539 1,500 1,500 1,500 052145 - PAINT AND CHEMICAL 1,607 4,382 8,000 8,000 8,000 052150 - SEED AND FERTILIZER 13,232 11,544 12,500 12,500 12,500 052175 - SIGNS 0 13 0 0 0 052205 - MAINT LANDSCAPING 5,788 6,759 7,000 7,000 7,000 052210 - MAINT TREES 0 2,740 5,000 5,000 8,000 3,00052215 - MAINT GROUNDS 308 125 1,000 1,000 1,000 052240 - MAINT NONFLEET VEHICLES EQP 8,325 5,285 7,500 7,500 7,500 052270 - MAINT WELLS AND RESERVOIRS 16,258 7,610 15,000 15,000 15,000 052275 - MAINT RUNWAYS 364 0 0 0 0 052413 - SPECIAL EVENTS 0 49 0 0 0 052455 - LAWN MAINTENANCE SERVICE 3,750 1,596 500 500 500 052465 - MISCELLANEOUS SERVICES 293 314 500 500 500 052565 - PEST CONTROL 949 309 500 500 500 052568 - BANK AND INVESTMENT FEES 499 223 517 517 418 (99)52575 - SERVICES 14,938 20,987 15,000 15,000 18,000 3,00052607 - CELL PHONE ALLOWANCE 0 0 200 200 200 052615 - DUES AND MEMBERSHIP 5 5 0 0 0 052630 - TRAINING 254 1,031 900 900 900 052725 - RENTAL OF PROPERTY 17,246 17,232 15,020 15,020 15,020 052738 - CELL PHONE BASE CHARGES 2,138 2,238 1,500 1,500 1,500 052746 - UTILITIES ELECTRIC 3,589 4,193 4,884 4,884 4,884 052749 - UTILITIES WATER 199,977 185,332 244,860 244,860 255,879 11,01952775 - MINOR EQUIPMENT 173 1,768 2,000 2,000 2,000 052777 - TOOL ALLOWANCE 1,208 2,138 1,200 1,200 1,200 052795 - RENTAL OF EQUIPMENT 1,485 1,455 1,800 1,800 1,800 052872 - MAINT FLEET VEHICLES EQP 22,214 23,275 24,000 24,000 24,000 065339 - NORTH SLOPE 6 0 0 0 0 0
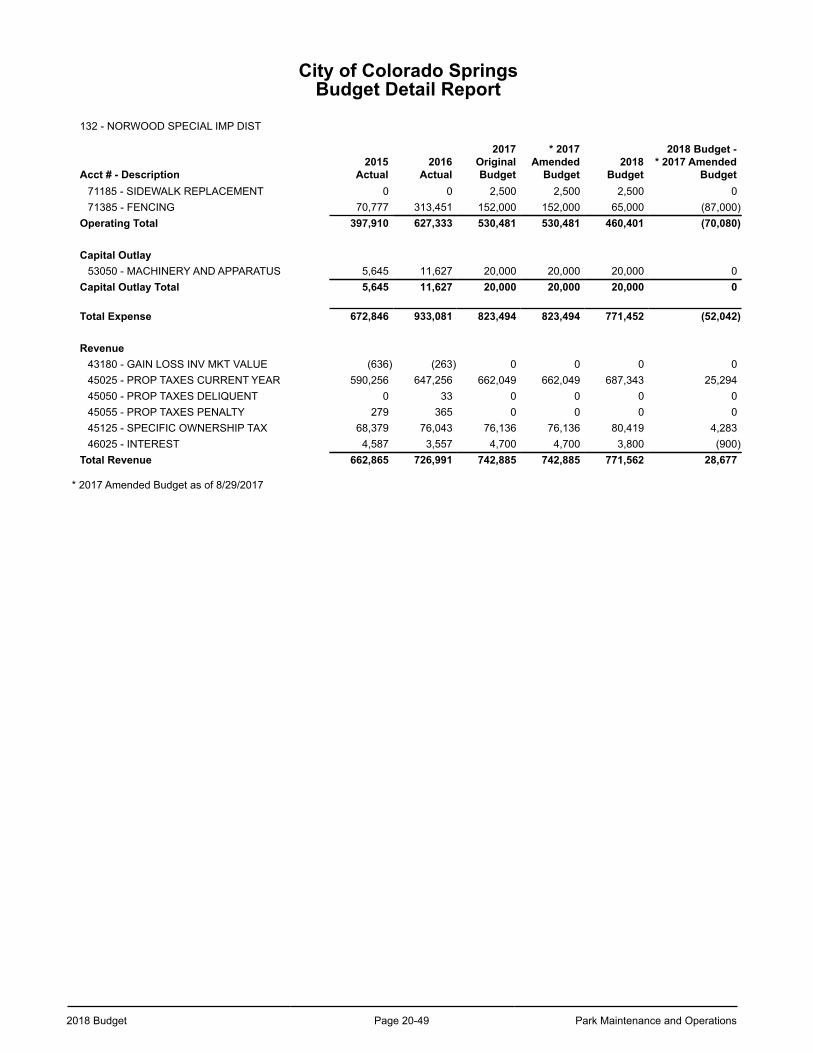
2018 Budget Page 20-49 Park Maintenance and Operations
City of Colorado SpringsBudget Detail Report
132 - NORWOOD SPECIAL IMP DIST
Acct # - Description2015
Actual2016
Actual
2017OriginalBudget
* 2017Amended
Budget2018
Budget
2018 Budget -* 2017 Amended
Budget71185 - SIDEWALK REPLACEMENT 0 0 2,500 2,500 2,500 071385 - FENCING 70,777 313,451 152,000 152,000 65,000 (87,000)
Operating Total 397,910 627,333 530,481 530,481 460,401 (70,080)
Capital Outlay53050 - MACHINERY AND APPARATUS 5,645 11,627 20,000 20,000 20,000 0
Capital Outlay Total 5,645 11,627 20,000 20,000 20,000 0
Total Expense 672,846 933,081 823,494 823,494 771,452 (52,042)
Revenue43180 - GAIN LOSS INV MKT VALUE (636) (263) 0 0 0 045025 - PROP TAXES CURRENT YEAR 590,256 647,256 662,049 662,049 687,343 25,29445050 - PROP TAXES DELIQUENT 0 33 0 0 0 045055 - PROP TAXES PENALTY 279 365 0 0 0 045125 - SPECIFIC OWNERSHIP TAX 68,379 76,043 76,136 76,136 80,419 4,28346025 - INTEREST 4,587 3,557 4,700 4,700 3,800 (900)
Total Revenue 662,865 726,991 742,885 742,885 771,562 28,677
* 2017 Amended Budget as of 8/29/2017
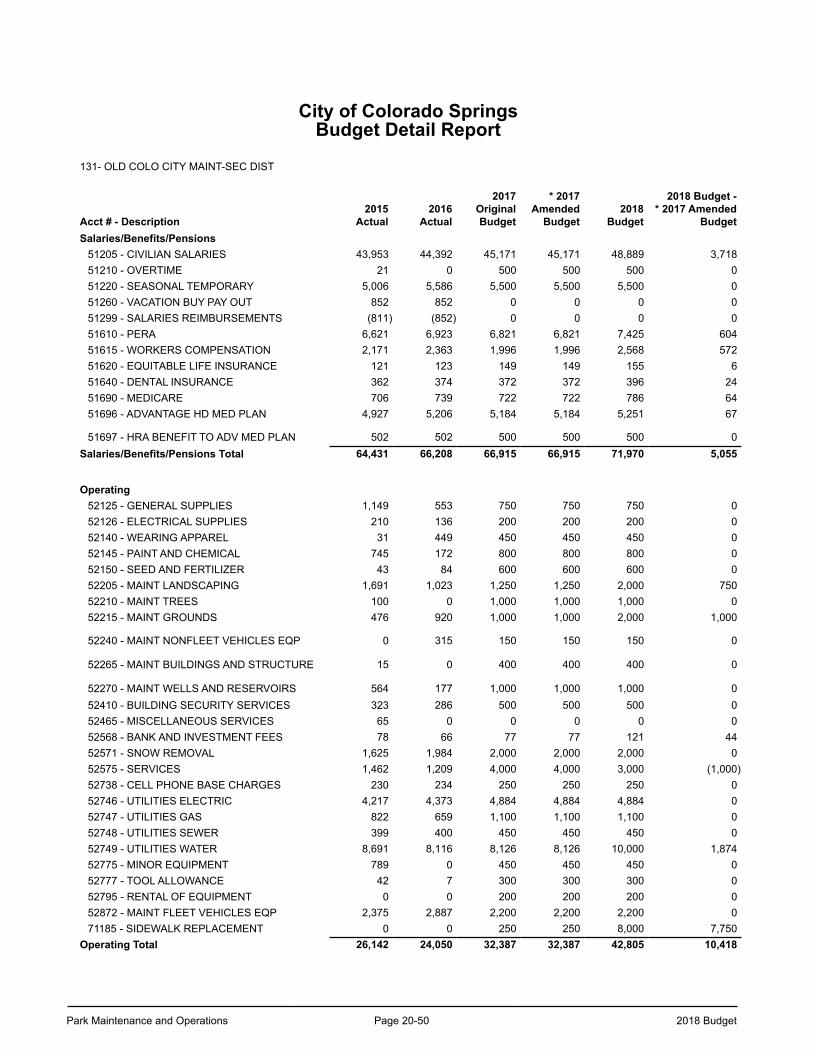
Park Maintenance and Operations Page 20-50 2018 Budget
City of Colorado SpringsBudget Detail Report
131- OLD COLO CITY MAINT-SEC DIST
Acct # - Description2015
Actual2016
Actual
2017OriginalBudget
* 2017Amended
Budget2018
Budget
2018 Budget -* 2017 Amended
BudgetSalaries/Benefits/Pensions
51205 - CIVILIAN SALARIES 43,953 44,392 45,171 45,171 48,889 3,71851210 - OVERTIME 21 0 500 500 500 051220 - SEASONAL TEMPORARY 5,006 5,586 5,500 5,500 5,500 051260 - VACATION BUY PAY OUT 852 852 0 0 0 051299 - SALARIES REIMBURSEMENTS (811) (852) 0 0 0 051610 - PERA 6,621 6,923 6,821 6,821 7,425 60451615 - WORKERS COMPENSATION 2,171 2,363 1,996 1,996 2,568 57251620 - EQUITABLE LIFE INSURANCE 121 123 149 149 155 651640 - DENTAL INSURANCE 362 374 372 372 396 2451690 - MEDICARE 706 739 722 722 786 6451696 - ADVANTAGE HD MED PLAN 4,927 5,206 5,184 5,184 5,251 67
51697 - HRA BENEFIT TO ADV MED PLAN 502 502 500 500 500 0Salaries/Benefits/Pensions Total 64,431 66,208 66,915 66,915 71,970 5,055
Operating52125 - GENERAL SUPPLIES 1,149 553 750 750 750 052126 - ELECTRICAL SUPPLIES 210 136 200 200 200 052140 - WEARING APPAREL 31 449 450 450 450 052145 - PAINT AND CHEMICAL 745 172 800 800 800 052150 - SEED AND FERTILIZER 43 84 600 600 600 052205 - MAINT LANDSCAPING 1,691 1,023 1,250 1,250 2,000 75052210 - MAINT TREES 100 0 1,000 1,000 1,000 052215 - MAINT GROUNDS 476 920 1,000 1,000 2,000 1,000
52240 - MAINT NONFLEET VEHICLES EQP 0 315 150 150 150 0
52265 - MAINT BUILDINGS AND STRUCTURE 15 0 400 400 400 0
52270 - MAINT WELLS AND RESERVOIRS 564 177 1,000 1,000 1,000 052410 - BUILDING SECURITY SERVICES 323 286 500 500 500 052465 - MISCELLANEOUS SERVICES 65 0 0 0 0 052568 - BANK AND INVESTMENT FEES 78 66 77 77 121 4452571 - SNOW REMOVAL 1,625 1,984 2,000 2,000 2,000 052575 - SERVICES 1,462 1,209 4,000 4,000 3,000 (1,000)52738 - CELL PHONE BASE CHARGES 230 234 250 250 250 052746 - UTILITIES ELECTRIC 4,217 4,373 4,884 4,884 4,884 052747 - UTILITIES GAS 822 659 1,100 1,100 1,100 052748 - UTILITIES SEWER 399 400 450 450 450 052749 - UTILITIES WATER 8,691 8,116 8,126 8,126 10,000 1,87452775 - MINOR EQUIPMENT 789 0 450 450 450 052777 - TOOL ALLOWANCE 42 7 300 300 300 052795 - RENTAL OF EQUIPMENT 0 0 200 200 200 052872 - MAINT FLEET VEHICLES EQP 2,375 2,887 2,200 2,200 2,200 071185 - SIDEWALK REPLACEMENT 0 0 250 250 8,000 7,750
Operating Total 26,142 24,050 32,387 32,387 42,805 10,418
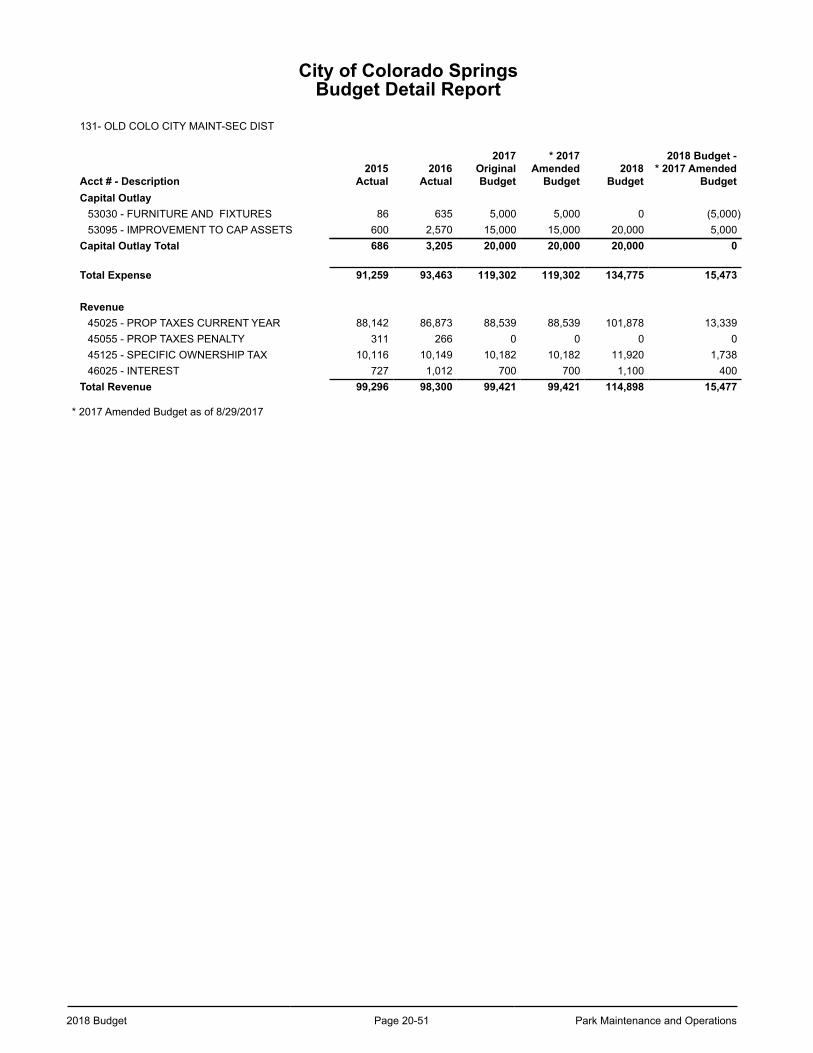
2018 Budget Page 20-51 Park Maintenance and Operations
City of Colorado SpringsBudget Detail Report
131- OLD COLO CITY MAINT-SEC DIST
Acct # - Description2015
Actual2016
Actual
2017OriginalBudget
* 2017Amended
Budget2018
Budget
2018 Budget -* 2017 Amended
BudgetCapital Outlay
53030 - FURNITURE AND FIXTURES 86 635 5,000 5,000 0 (5,000)53095 - IMPROVEMENT TO CAP ASSETS 600 2,570 15,000 15,000 20,000 5,000
Capital Outlay Total 686 3,205 20,000 20,000 20,000 0
Total Expense 91,259 93,463 119,302 119,302 134,775 15,473
Revenue45025 - PROP TAXES CURRENT YEAR 88,142 86,873 88,539 88,539 101,878 13,33945055 - PROP TAXES PENALTY 311 266 0 0 0 045125 - SPECIFIC OWNERSHIP TAX 10,116 10,149 10,182 10,182 11,920 1,73846025 - INTEREST 727 1,012 700 700 1,100 400
Total Revenue 99,296 98,300 99,421 99,421 114,898 15,477
* 2017 Amended Budget as of 8/29/2017
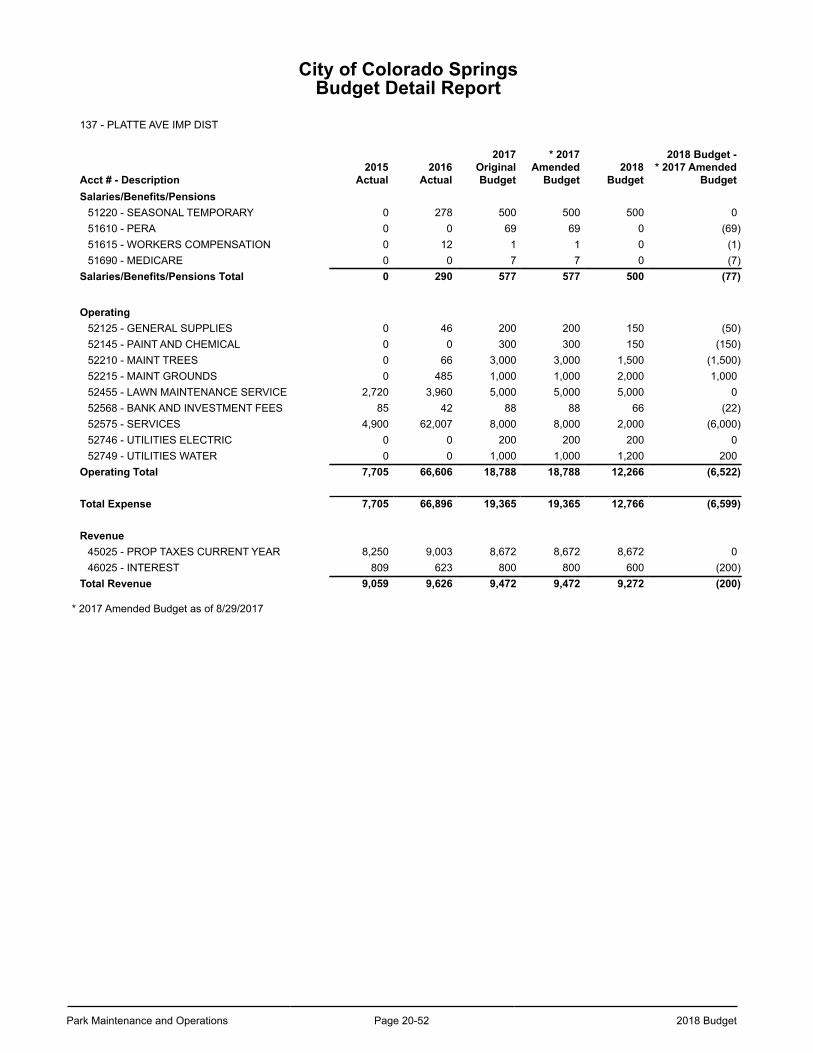
Park Maintenance and Operations Page 20-52 2018 Budget
City of Colorado SpringsBudget Detail Report
137 - PLATTE AVE IMP DIST
Acct # - Description2015
Actual2016
Actual
2017OriginalBudget
* 2017Amended
Budget2018
Budget
2018 Budget -* 2017 Amended
BudgetSalaries/Benefits/Pensions
51220 - SEASONAL TEMPORARY 0 278 500 500 500 051610 - PERA 0 0 69 69 0 (69)51615 - WORKERS COMPENSATION 0 12 1 1 0 (1)51690 - MEDICARE 0 0 7 7 0 (7)
Salaries/Benefits/Pensions Total 0 290 577 577 500 (77)
Operating52125 - GENERAL SUPPLIES 0 46 200 200 150 (50)52145 - PAINT AND CHEMICAL 0 0 300 300 150 (150)52210 - MAINT TREES 0 66 3,000 3,000 1,500 (1,500)52215 - MAINT GROUNDS 0 485 1,000 1,000 2,000 1,00052455 - LAWN MAINTENANCE SERVICE 2,720 3,960 5,000 5,000 5,000 052568 - BANK AND INVESTMENT FEES 85 42 88 88 66 (22)52575 - SERVICES 4,900 62,007 8,000 8,000 2,000 (6,000)52746 - UTILITIES ELECTRIC 0 0 200 200 200 052749 - UTILITIES WATER 0 0 1,000 1,000 1,200 200
Operating Total 7,705 66,606 18,788 18,788 12,266 (6,522)
Total Expense 7,705 66,896 19,365 19,365 12,766 (6,599)
Revenue45025 - PROP TAXES CURRENT YEAR 8,250 9,003 8,672 8,672 8,672 046025 - INTEREST 809 623 800 800 600 (200)
Total Revenue 9,059 9,626 9,472 9,472 9,272 (200)
* 2017 Amended Budget as of 8/29/2017
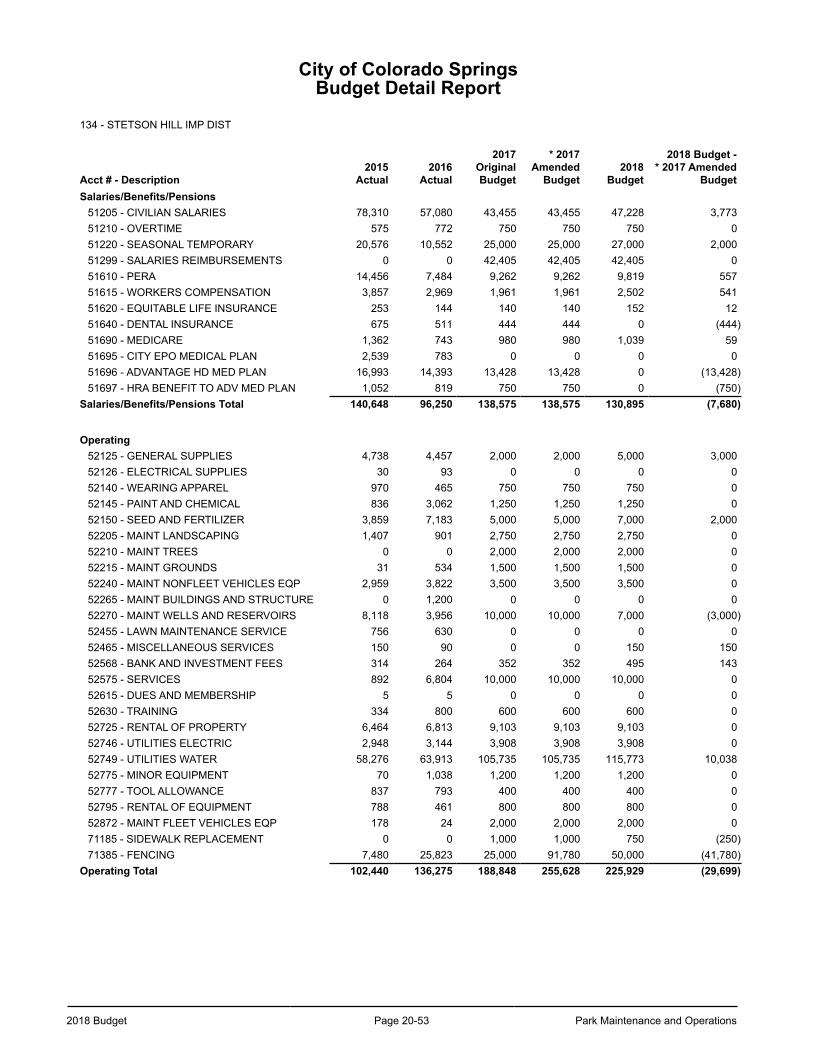
2018 Budget Page 20-53 Park Maintenance and Operations
City of Colorado SpringsBudget Detail Report
134 - STETSON HILL IMP DIST
Acct # - Description2015
Actual2016
Actual
2017OriginalBudget
* 2017Amended
Budget2018
Budget
2018 Budget -* 2017 Amended
BudgetSalaries/Benefits/Pensions
51205 - CIVILIAN SALARIES 78,310 57,080 43,455 43,455 47,228 3,77351210 - OVERTIME 575 772 750 750 750 051220 - SEASONAL TEMPORARY 20,576 10,552 25,000 25,000 27,000 2,00051299 - SALARIES REIMBURSEMENTS 0 0 42,405 42,405 42,405 051610 - PERA 14,456 7,484 9,262 9,262 9,819 55751615 - WORKERS COMPENSATION 3,857 2,969 1,961 1,961 2,502 54151620 - EQUITABLE LIFE INSURANCE 253 144 140 140 152 1251640 - DENTAL INSURANCE 675 511 444 444 0 (444)51690 - MEDICARE 1,362 743 980 980 1,039 5951695 - CITY EPO MEDICAL PLAN 2,539 783 0 0 0 051696 - ADVANTAGE HD MED PLAN 16,993 14,393 13,428 13,428 0 (13,428)51697 - HRA BENEFIT TO ADV MED PLAN 1,052 819 750 750 0 (750)
Salaries/Benefits/Pensions Total 140,648 96,250 138,575 138,575 130,895 (7,680)
Operating52125 - GENERAL SUPPLIES 4,738 4,457 2,000 2,000 5,000 3,00052126 - ELECTRICAL SUPPLIES 30 93 0 0 0 052140 - WEARING APPAREL 970 465 750 750 750 052145 - PAINT AND CHEMICAL 836 3,062 1,250 1,250 1,250 052150 - SEED AND FERTILIZER 3,859 7,183 5,000 5,000 7,000 2,00052205 - MAINT LANDSCAPING 1,407 901 2,750 2,750 2,750 052210 - MAINT TREES 0 0 2,000 2,000 2,000 052215 - MAINT GROUNDS 31 534 1,500 1,500 1,500 052240 - MAINT NONFLEET VEHICLES EQP 2,959 3,822 3,500 3,500 3,500 052265 - MAINT BUILDINGS AND STRUCTURE 0 1,200 0 0 0 052270 - MAINT WELLS AND RESERVOIRS 8,118 3,956 10,000 10,000 7,000 (3,000)52455 - LAWN MAINTENANCE SERVICE 756 630 0 0 0 052465 - MISCELLANEOUS SERVICES 150 90 0 0 150 15052568 - BANK AND INVESTMENT FEES 314 264 352 352 495 14352575 - SERVICES 892 6,804 10,000 10,000 10,000 052615 - DUES AND MEMBERSHIP 5 5 0 0 0 052630 - TRAINING 334 800 600 600 600 052725 - RENTAL OF PROPERTY 6,464 6,813 9,103 9,103 9,103 052746 - UTILITIES ELECTRIC 2,948 3,144 3,908 3,908 3,908 052749 - UTILITIES WATER 58,276 63,913 105,735 105,735 115,773 10,03852775 - MINOR EQUIPMENT 70 1,038 1,200 1,200 1,200 052777 - TOOL ALLOWANCE 837 793 400 400 400 052795 - RENTAL OF EQUIPMENT 788 461 800 800 800 052872 - MAINT FLEET VEHICLES EQP 178 24 2,000 2,000 2,000 071185 - SIDEWALK REPLACEMENT 0 0 1,000 1,000 750 (250)71385 - FENCING 7,480 25,823 25,000 91,780 50,000 (41,780)
Operating Total 102,440 136,275 188,848 255,628 225,929 (29,699)
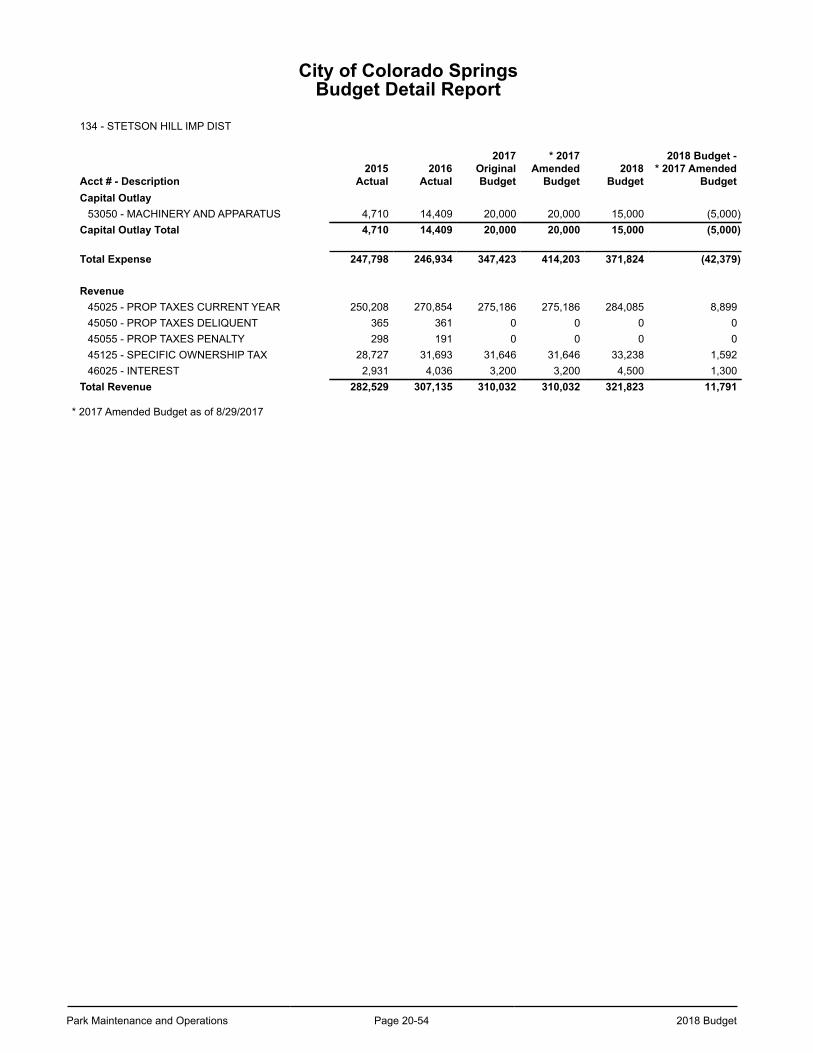
Park Maintenance and Operations Page 20-54 2018 Budget
City of Colorado SpringsBudget Detail Report
134 - STETSON HILL IMP DIST
Acct # - Description2015
Actual2016
Actual
2017OriginalBudget
* 2017Amended
Budget2018
Budget
2018 Budget -* 2017 Amended
BudgetCapital Outlay
53050 - MACHINERY AND APPARATUS 4,710 14,409 20,000 20,000 15,000 (5,000)Capital Outlay Total 4,710 14,409 20,000 20,000 15,000 (5,000)
Total Expense 247,798 246,934 347,423 414,203 371,824 (42,379)
Revenue45025 - PROP TAXES CURRENT YEAR 250,208 270,854 275,186 275,186 284,085 8,89945050 - PROP TAXES DELIQUENT 365 361 0 0 0 045055 - PROP TAXES PENALTY 298 191 0 0 0 045125 - SPECIFIC OWNERSHIP TAX 28,727 31,693 31,646 31,646 33,238 1,59246025 - INTEREST 2,931 4,036 3,200 3,200 4,500 1,300
Total Revenue 282,529 307,135 310,032 310,032 321,823 11,791
* 2017 Amended Budget as of 8/29/2017
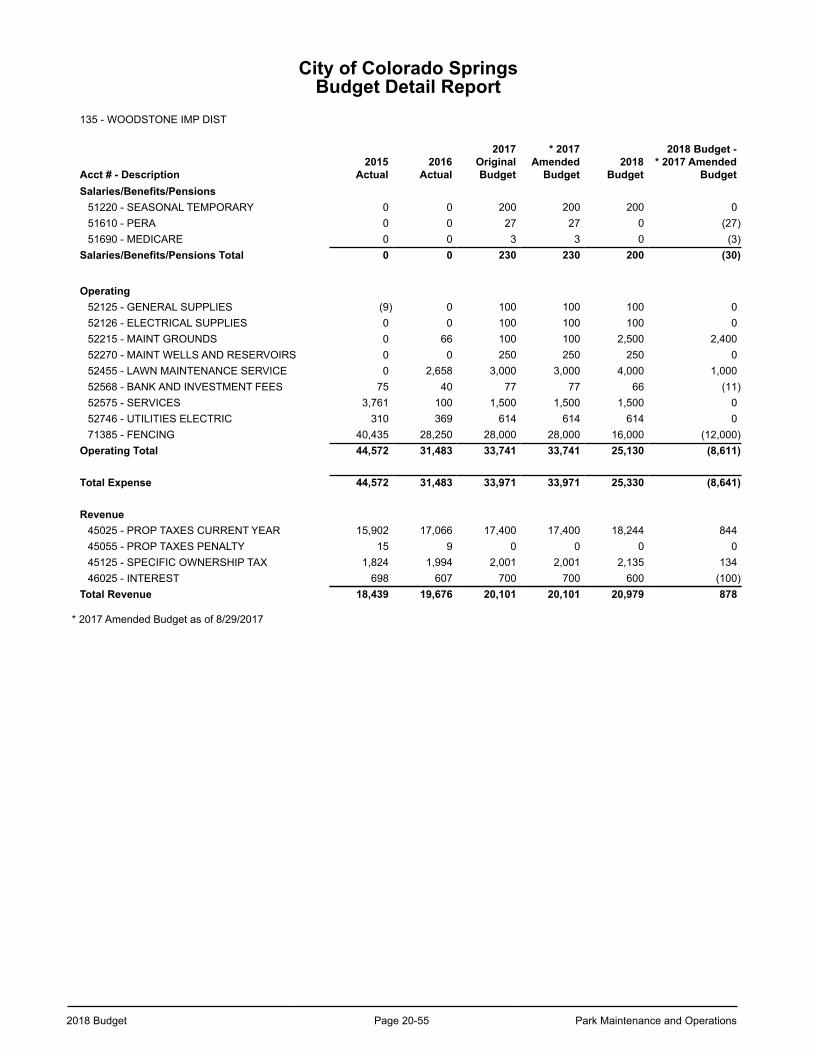
2018 Budget Page 20-55 Park Maintenance and Operations
City of Colorado SpringsBudget Detail Report
135 - WOODSTONE IMP DIST
Acct # - Description2015
Actual2016
Actual
2017OriginalBudget
* 2017Amended
Budget2018
Budget
2018 Budget -* 2017 Amended
BudgetSalaries/Benefits/Pensions
51220 - SEASONAL TEMPORARY 0 0 200 200 200 051610 - PERA 0 0 27 27 0 (27)51690 - MEDICARE 0 0 3 3 0 (3)
Salaries/Benefits/Pensions Total 0 0 230 230 200 (30)
Operating52125 - GENERAL SUPPLIES (9) 0 100 100 100 052126 - ELECTRICAL SUPPLIES 0 0 100 100 100 052215 - MAINT GROUNDS 0 66 100 100 2,500 2,40052270 - MAINT WELLS AND RESERVOIRS 0 0 250 250 250 052455 - LAWN MAINTENANCE SERVICE 0 2,658 3,000 3,000 4,000 1,00052568 - BANK AND INVESTMENT FEES 75 40 77 77 66 (11)52575 - SERVICES 3,761 100 1,500 1,500 1,500 052746 - UTILITIES ELECTRIC 310 369 614 614 614 071385 - FENCING 40,435 28,250 28,000 28,000 16,000 (12,000)
Operating Total 44,572 31,483 33,741 33,741 25,130 (8,611)
Total Expense 44,572 31,483 33,971 33,971 25,330 (8,641)
Revenue45025 - PROP TAXES CURRENT YEAR 15,902 17,066 17,400 17,400 18,244 84445055 - PROP TAXES PENALTY 15 9 0 0 0 045125 - SPECIFIC OWNERSHIP TAX 1,824 1,994 2,001 2,001 2,135 13446025 - INTEREST 698 607 700 700 600 (100)
Total Revenue 18,439 19,676 20,101 20,101 20,979 878
* 2017 Amended Budget as of 8/29/2017

Park Maintenance and Operations Page 20-56 2018 Budget
This page left blank intentionally.
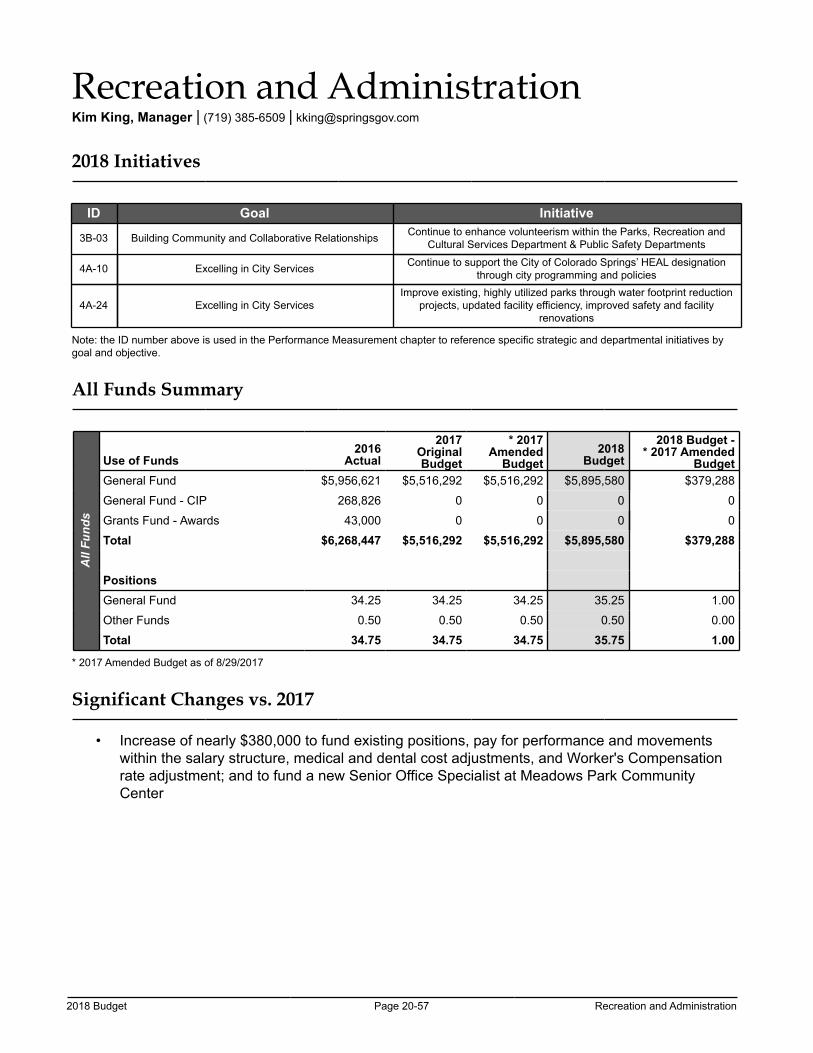
2018 Budget Page 20-57 Recreation and Administration
Recreation and AdministrationKim King, Manager | (719) 385-6509 | [email protected]
2018 Initiatives
ID Goal Initiative
3B-03 Building Community and Collaborative Relationships Continue to enhance volunteerism within the Parks, Recreation and Cultural Services Department & Public Safety Departments
4A-10 Excelling in City Services Continue to support the City of Colorado Springs’ HEAL designation through city programming and policies
4A-24 Excelling in City ServicesImprove existing, highly utilized parks through water footprint reduction
projects, updated facility efficiency, improved safety and facility renovations
Note: the ID number above is used in the Performance Measurement chapter to reference specific strategic and departmental initiatives by goal and objective.
All Funds Summary
All
Fund
s
Use of Funds2016
Actual
2017OriginalBudget
* 2017Amended
Budget2018
Budget
2018 Budget -* 2017 Amended
BudgetGeneral Fund $5,956,621 $5,516,292 $5,516,292 $5,895,580 $379,288
General Fund - CIP 268,826 0 0 0 0
Grants Fund - Awards 43,000 0 0 0 0
Total $6,268,447 $5,516,292 $5,516,292 $5,895,580 $379,288
PositionsGeneral Fund 34.25 34.25 34.25 35.25 1.00
Other Funds 0.50 0.50 0.50 0.50 0.00
Total 34.75 34.75 34.75 35.75 1.00
* 2017 Amended Budget as of 8/29/2017
Significant Changes vs. 2017
• Increase of nearly $380,000 to fund existing positions, pay for performance and movements within the salary structure, medical and dental cost adjustments, and Worker's Compensation rate adjustment; and to fund a new Senior Office Specialist at Meadows Park Community Center
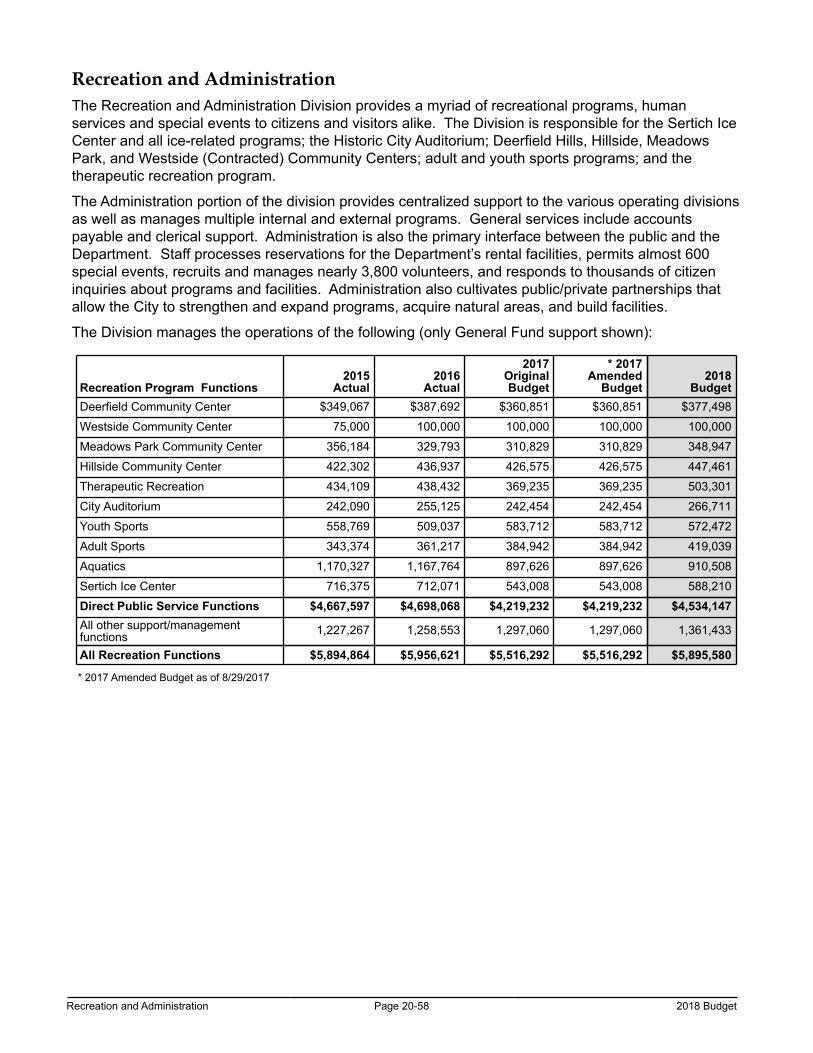
Recreation and Administration Page 20-58 2018 Budget
Recreation and AdministrationThe Recreation and Administration Division provides a myriad of recreational programs, human services and special events to citizens and visitors alike. The Division is responsible for the Sertich Ice Center and all ice-related programs; the Historic City Auditorium; Deerfield Hills, Hillside, Meadows Park, and Westside (Contracted) Community Centers; adult and youth sports programs; and the therapeutic recreation program.
The Administration portion of the division provides centralized support to the various operating divisions as well as manages multiple internal and external programs. General services include accounts payable and clerical support. Administration is also the primary interface between the public and the Department. Staff processes reservations for the Department’s rental facilities, permits almost 600 special events, recruits and manages nearly 3,800 volunteers, and responds to thousands of citizen inquiries about programs and facilities. Administration also cultivates public/private partnerships that allow the City to strengthen and expand programs, acquire natural areas, and build facilities.
The Division manages the operations of the following (only General Fund support shown):
Recreation Program Functions2015
Actual2016
Actual
2017OriginalBudget
* 2017Amended
Budget2018
BudgetDeerfield Community Center $349,067 $387,692 $360,851 $360,851 $377,498
Westside Community Center 75,000 100,000 100,000 100,000 100,000
Meadows Park Community Center 356,184 329,793 310,829 310,829 348,947
Hillside Community Center 422,302 436,937 426,575 426,575 447,461
Therapeutic Recreation 434,109 438,432 369,235 369,235 503,301
City Auditorium 242,090 255,125 242,454 242,454 266,711
Youth Sports 558,769 509,037 583,712 583,712 572,472
Adult Sports 343,374 361,217 384,942 384,942 419,039
Aquatics 1,170,327 1,167,764 897,626 897,626 910,508
Sertich Ice Center 716,375 712,071 543,008 543,008 588,210
Direct Public Service Functions $4,667,597 $4,698,068 $4,219,232 $4,219,232 $4,534,147All other support/managementfunctions 1,227,267 1,258,553 1,297,060 1,297,060 1,361,433
All Recreation Functions $5,894,864 $5,956,621 $5,516,292 $5,516,292 $5,895,580
* 2017 Amended Budget as of 8/29/2017
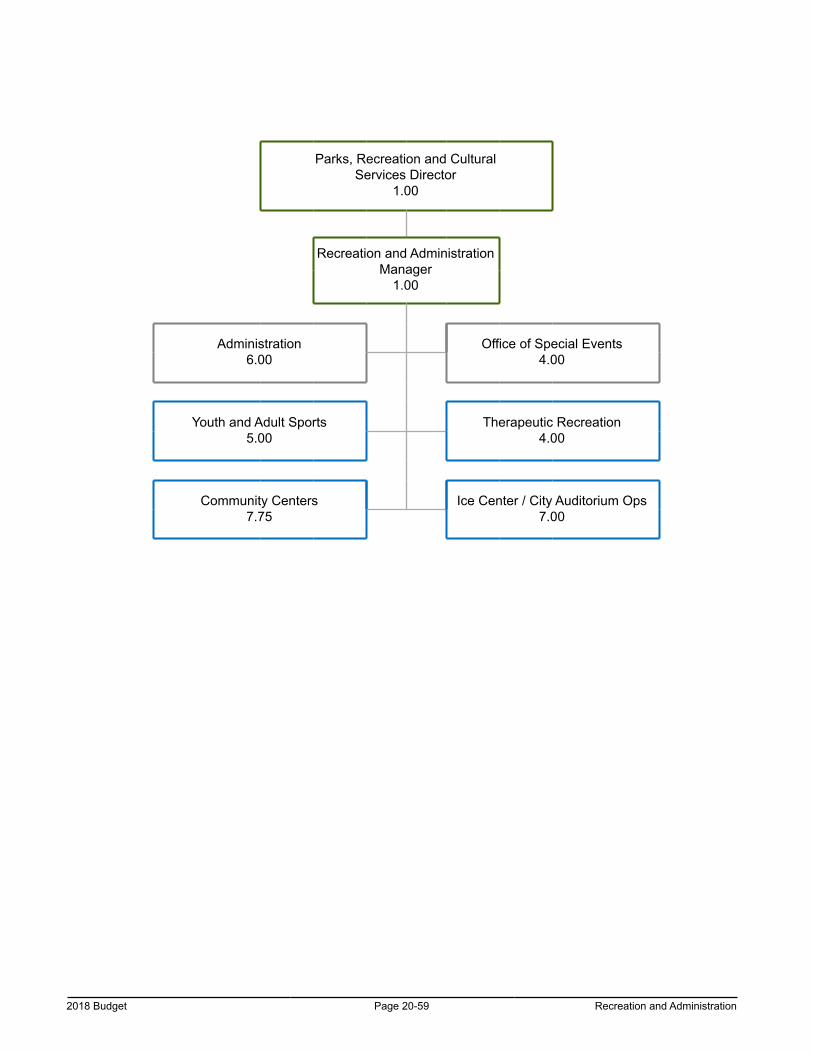
2018 Budget Page 20-59 Recreation and Administration
Parks, Recreation and CulturalServices Director
1.00
Recreation and Administration Manager
1.00
Administration6.00
Office of Special Events4.00
Youth and Adult Sports5.00
Therapeutic Recreation4.00
Community Centers7.75
Ice Center / City Auditorium Ops7.00
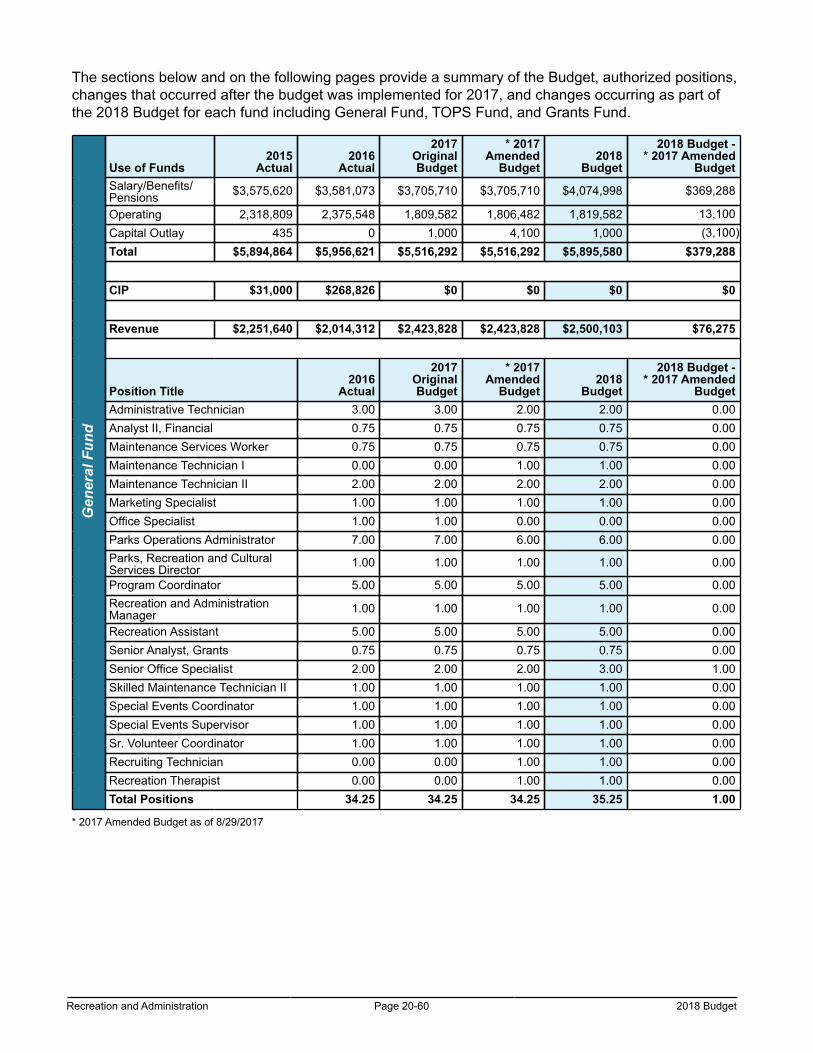
Recreation and Administration Page 20-60 2018 Budget
The sections below and on the following pages provide a summary of the Budget, authorized positions, changes that occurred after the budget was implemented for 2017, and changes occurring as part of the 2018 Budget for each fund including General Fund, TOPS Fund, and Grants Fund.
Gen
eral
Fun
d
Use of Funds2015
Actual2016
Actual
2017OriginalBudget
* 2017Amended
Budget2018
Budget
2018 Budget -* 2017 Amended
BudgetSalary/Benefits/Pensions $3,575,620 $3,581,073 $3,705,710 $3,705,710 $4,074,998 $369,288
Operating 2,318,809 2,375,548 1,809,582 1,806,482 1,819,582 13,100Capital Outlay 435 0 1,000 4,100 1,000 (3,100)Total $5,894,864 $5,956,621 $5,516,292 $5,516,292 $5,895,580 $379,288
CIP $31,000 $268,826 $0 $0 $0 $0
Revenue $2,251,640 $2,014,312 $2,423,828 $2,423,828 $2,500,103 $76,275
Position Title2016
Actual
2017OriginalBudget
* 2017Amended
Budget2018
Budget
2018 Budget -* 2017 Amended
BudgetAdministrative Technician 3.00 3.00 2.00 2.00 0.00Analyst II, Financial 0.75 0.75 0.75 0.75 0.00Maintenance Services Worker 0.75 0.75 0.75 0.75 0.00Maintenance Technician I 0.00 0.00 1.00 1.00 0.00Maintenance Technician II 2.00 2.00 2.00 2.00 0.00Marketing Specialist 1.00 1.00 1.00 1.00 0.00Office Specialist 1.00 1.00 0.00 0.00 0.00Parks Operations Administrator 7.00 7.00 6.00 6.00 0.00Parks, Recreation and CulturalServices Director 1.00 1.00 1.00 1.00 0.00
Program Coordinator 5.00 5.00 5.00 5.00 0.00Recreation and AdministrationManager 1.00 1.00 1.00 1.00 0.00
Recreation Assistant 5.00 5.00 5.00 5.00 0.00Senior Analyst, Grants 0.75 0.75 0.75 0.75 0.00Senior Office Specialist 2.00 2.00 2.00 3.00 1.00Skilled Maintenance Technician II 1.00 1.00 1.00 1.00 0.00Special Events Coordinator 1.00 1.00 1.00 1.00 0.00Special Events Supervisor 1.00 1.00 1.00 1.00 0.00Sr. Volunteer Coordinator 1.00 1.00 1.00 1.00 0.00Recruiting Technician 0.00 0.00 1.00 1.00 0.00Recreation Therapist 0.00 0.00 1.00 1.00 0.00Total Positions 34.25 34.25 34.25 35.25 1.00
* 2017 Amended Budget as of 8/29/2017

2018 Budget Page 20-61 Recreation and Administration
Fund
ing
Cha
nges
During 2017* 2017 Amended -
2017 Original BudgetAmendment to transfer funds from Operating to Capital Outlay $0Total During 2017 $0
For 20182018 Budget -
* 2017 Amended BudgetSalaries/Benefits/PensionsNet change to fund existing positions $92,406Increase to fund pay for performance and market movement 89,553Increase to fund medical and dental cost adjustments 5,167Increase to fund Workers' Compensation rate adjustment 3,439Increase to fund Minimum Wage rate adjustment 28,722Increase to fund existing Therapeutic Rec Program Coordinator, add 1.00 FTE SeniorOffice Specialist at Meadows Park Community Center, and City Auditorium seasonalsalaries
140,001
Increase due to redistribution from Operating to increase funding in seasonaltemporary to staff various programs 10,000
Total Salaries/Benefits/Pensions $369,288OperatingIncrease to fund operating expenses at Deerfield Hills Community Center $10,000Increase to fund staff training 10,000Remove one-time amendment-redistribute to Capital Outlay 3,100Decrease due to redistribution to Salaries/Benefits/Pensions to increase funding inseasonal temporary to staff various programs (10,000)
Total Operating $13,100Capital OutlayRemove one-time amendment-redistribute to Operating ($3,100)Total Capital Outlay ($3,100)Total For 2018 $379,288
Posi
tion
Cha
nges During 2017
* 2017 Amended -2017 Original Budget
None 0.00
Total During 2017 0.00
For 20182018 Budget -
* 2017 Amended BudgetIncrease of 1.00 FTE position - Senior Office Specialist at Meadows Park CommunityCenter 1.00
Total For 2018 1.00
* 2017 Amended Budget as of 8/29/2017
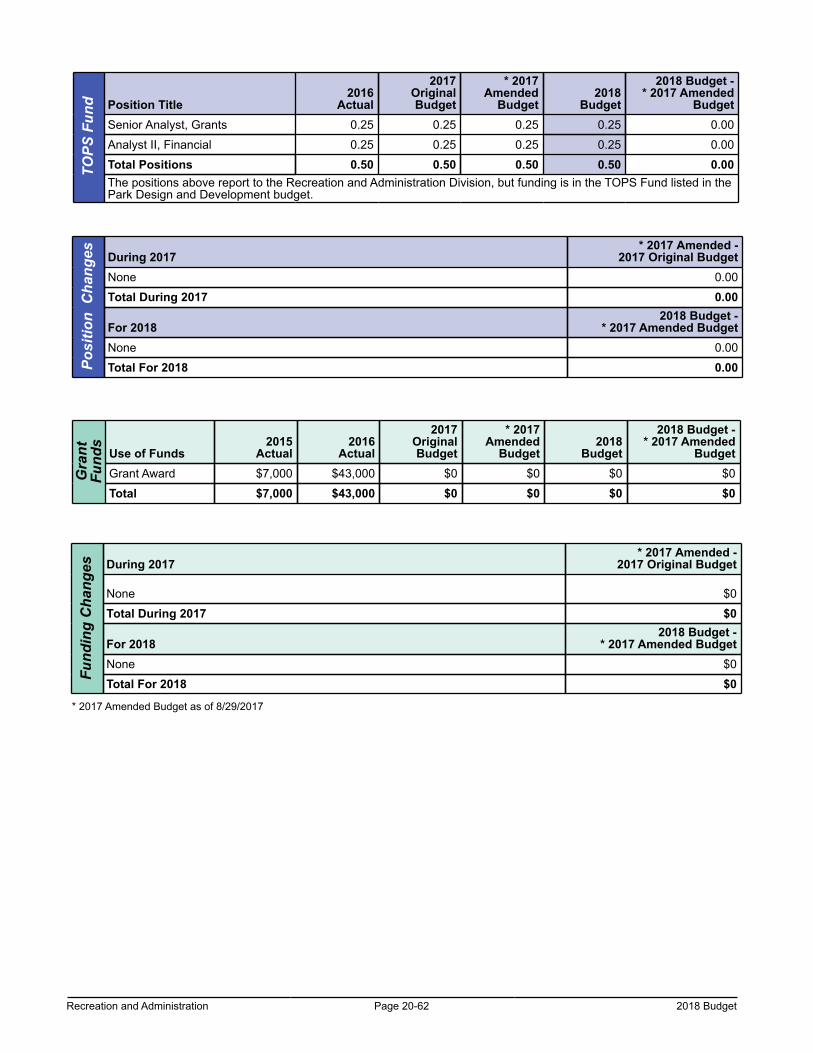
Recreation and Administration Page 20-62 2018 Budget
TOPS
Fun
d Position Title2016
Actual
2017OriginalBudget
* 2017Amended
Budget2018
Budget
2018 Budget -* 2017 Amended
BudgetSenior Analyst, Grants 0.25 0.25 0.25 0.25 0.00
Analyst II, Financial 0.25 0.25 0.25 0.25 0.00
Total Positions 0.50 0.50 0.50 0.50 0.00The positions above report to the Recreation and Administration Division, but funding is in the TOPS Fund listed in thePark Design and Development budget.
Posi
tion
Cha
nges During 2017
* 2017 Amended -2017 Original Budget
None 0.00
Total During 2017 0.00
For 20182018 Budget -
* 2017 Amended BudgetNone 0.00
Total For 2018 0.00
Gra
ntFu
nds
Use of Funds2015
Actual2016
Actual
2017OriginalBudget
* 2017Amended
Budget2018
Budget
2018 Budget -* 2017 Amended
BudgetGrant Award $7,000 $43,000 $0 $0 $0 $0
Total $7,000 $43,000 $0 $0 $0 $0
Fund
ing
Cha
nges During 2017
* 2017 Amended -2017 Original Budget
None $0
Total During 2017 $0
For 20182018 Budget -
* 2017 Amended BudgetNone $0
Total For 2018 $0
* 2017 Amended Budget as of 8/29/2017
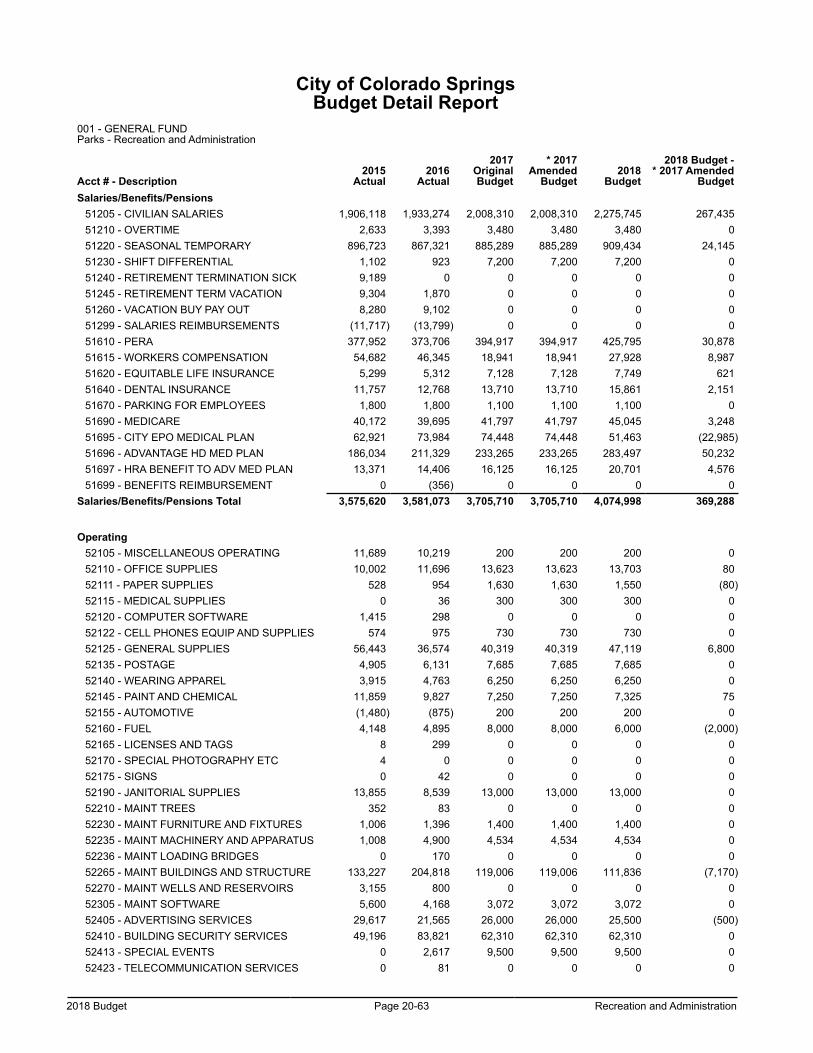
2018 Budget Page 20-63 Recreation and Administration
City of Colorado SpringsBudget Detail Report
001 - GENERAL FUNDParks - Recreation and Administration
Acct # - Description2015
Actual2016
Actual
2017OriginalBudget
* 2017Amended
Budget2018
Budget
2018 Budget -* 2017 Amended
BudgetSalaries/Benefits/Pensions
51205 - CIVILIAN SALARIES 1,906,118 1,933,274 2,008,310 2,008,310 2,275,745 267,43551210 - OVERTIME 2,633 3,393 3,480 3,480 3,480 051220 - SEASONAL TEMPORARY 896,723 867,321 885,289 885,289 909,434 24,14551230 - SHIFT DIFFERENTIAL 1,102 923 7,200 7,200 7,200 051240 - RETIREMENT TERMINATION SICK 9,189 0 0 0 0 051245 - RETIREMENT TERM VACATION 9,304 1,870 0 0 0 051260 - VACATION BUY PAY OUT 8,280 9,102 0 0 0 051299 - SALARIES REIMBURSEMENTS (11,717) (13,799) 0 0 0 051610 - PERA 377,952 373,706 394,917 394,917 425,795 30,87851615 - WORKERS COMPENSATION 54,682 46,345 18,941 18,941 27,928 8,98751620 - EQUITABLE LIFE INSURANCE 5,299 5,312 7,128 7,128 7,749 62151640 - DENTAL INSURANCE 11,757 12,768 13,710 13,710 15,861 2,15151670 - PARKING FOR EMPLOYEES 1,800 1,800 1,100 1,100 1,100 051690 - MEDICARE 40,172 39,695 41,797 41,797 45,045 3,24851695 - CITY EPO MEDICAL PLAN 62,921 73,984 74,448 74,448 51,463 (22,985)51696 - ADVANTAGE HD MED PLAN 186,034 211,329 233,265 233,265 283,497 50,23251697 - HRA BENEFIT TO ADV MED PLAN 13,371 14,406 16,125 16,125 20,701 4,57651699 - BENEFITS REIMBURSEMENT 0 (356) 0 0 0 0
Salaries/Benefits/Pensions Total 3,575,620 3,581,073 3,705,710 3,705,710 4,074,998 369,288
Operating52105 - MISCELLANEOUS OPERATING 11,689 10,219 200 200 200 052110 - OFFICE SUPPLIES 10,002 11,696 13,623 13,623 13,703 8052111 - PAPER SUPPLIES 528 954 1,630 1,630 1,550 (80)52115 - MEDICAL SUPPLIES 0 36 300 300 300 052120 - COMPUTER SOFTWARE 1,415 298 0 0 0 052122 - CELL PHONES EQUIP AND SUPPLIES 574 975 730 730 730 052125 - GENERAL SUPPLIES 56,443 36,574 40,319 40,319 47,119 6,80052135 - POSTAGE 4,905 6,131 7,685 7,685 7,685 052140 - WEARING APPAREL 3,915 4,763 6,250 6,250 6,250 052145 - PAINT AND CHEMICAL 11,859 9,827 7,250 7,250 7,325 7552155 - AUTOMOTIVE (1,480) (875) 200 200 200 052160 - FUEL 4,148 4,895 8,000 8,000 6,000 (2,000)52165 - LICENSES AND TAGS 8 299 0 0 0 052170 - SPECIAL PHOTOGRAPHY ETC 4 0 0 0 0 052175 - SIGNS 0 42 0 0 0 052190 - JANITORIAL SUPPLIES 13,855 8,539 13,000 13,000 13,000 052210 - MAINT TREES 352 83 0 0 0 052230 - MAINT FURNITURE AND FIXTURES 1,006 1,396 1,400 1,400 1,400 052235 - MAINT MACHINERY AND APPARATUS 1,008 4,900 4,534 4,534 4,534 052236 - MAINT LOADING BRIDGES 0 170 0 0 0 052265 - MAINT BUILDINGS AND STRUCTURE 133,227 204,818 119,006 119,006 111,836 (7,170)52270 - MAINT WELLS AND RESERVOIRS 3,155 800 0 0 0 052305 - MAINT SOFTWARE 5,600 4,168 3,072 3,072 3,072 052405 - ADVERTISING SERVICES 29,617 21,565 26,000 26,000 25,500 (500)52410 - BUILDING SECURITY SERVICES 49,196 83,821 62,310 62,310 62,310 052413 - SPECIAL EVENTS 0 2,617 9,500 9,500 9,500 052423 - TELECOMMUNICATION SERVICES 0 81 0 0 0 0
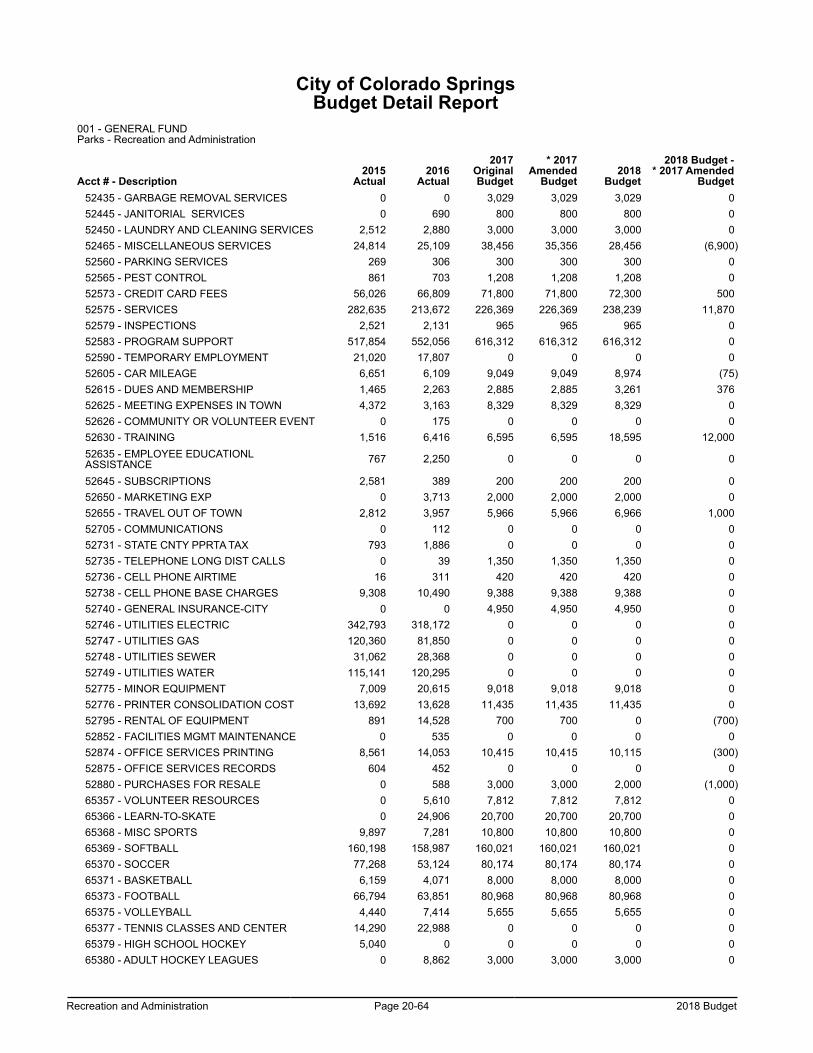
Recreation and Administration Page 20-64 2018 Budget
City of Colorado SpringsBudget Detail Report
001 - GENERAL FUNDParks - Recreation and Administration
Acct # - Description2015
Actual2016
Actual
2017OriginalBudget
* 2017Amended
Budget2018
Budget
2018 Budget -* 2017 Amended
Budget52435 - GARBAGE REMOVAL SERVICES 0 0 3,029 3,029 3,029 052445 - JANITORIAL SERVICES 0 690 800 800 800 052450 - LAUNDRY AND CLEANING SERVICES 2,512 2,880 3,000 3,000 3,000 052465 - MISCELLANEOUS SERVICES 24,814 25,109 38,456 35,356 28,456 (6,900)52560 - PARKING SERVICES 269 306 300 300 300 052565 - PEST CONTROL 861 703 1,208 1,208 1,208 052573 - CREDIT CARD FEES 56,026 66,809 71,800 71,800 72,300 50052575 - SERVICES 282,635 213,672 226,369 226,369 238,239 11,87052579 - INSPECTIONS 2,521 2,131 965 965 965 052583 - PROGRAM SUPPORT 517,854 552,056 616,312 616,312 616,312 052590 - TEMPORARY EMPLOYMENT 21,020 17,807 0 0 0 052605 - CAR MILEAGE 6,651 6,109 9,049 9,049 8,974 (75)52615 - DUES AND MEMBERSHIP 1,465 2,263 2,885 2,885 3,261 37652625 - MEETING EXPENSES IN TOWN 4,372 3,163 8,329 8,329 8,329 052626 - COMMUNITY OR VOLUNTEER EVENT 0 175 0 0 0 052630 - TRAINING 1,516 6,416 6,595 6,595 18,595 12,00052635 - EMPLOYEE EDUCATIONLASSISTANCE 767 2,250 0 0 0 0
52645 - SUBSCRIPTIONS 2,581 389 200 200 200 052650 - MARKETING EXP 0 3,713 2,000 2,000 2,000 052655 - TRAVEL OUT OF TOWN 2,812 3,957 5,966 5,966 6,966 1,00052705 - COMMUNICATIONS 0 112 0 0 0 052731 - STATE CNTY PPRTA TAX 793 1,886 0 0 0 052735 - TELEPHONE LONG DIST CALLS 0 39 1,350 1,350 1,350 052736 - CELL PHONE AIRTIME 16 311 420 420 420 052738 - CELL PHONE BASE CHARGES 9,308 10,490 9,388 9,388 9,388 052740 - GENERAL INSURANCE-CITY 0 0 4,950 4,950 4,950 052746 - UTILITIES ELECTRIC 342,793 318,172 0 0 0 052747 - UTILITIES GAS 120,360 81,850 0 0 0 052748 - UTILITIES SEWER 31,062 28,368 0 0 0 052749 - UTILITIES WATER 115,141 120,295 0 0 0 052775 - MINOR EQUIPMENT 7,009 20,615 9,018 9,018 9,018 052776 - PRINTER CONSOLIDATION COST 13,692 13,628 11,435 11,435 11,435 052795 - RENTAL OF EQUIPMENT 891 14,528 700 700 0 (700)52852 - FACILITIES MGMT MAINTENANCE 0 535 0 0 0 052874 - OFFICE SERVICES PRINTING 8,561 14,053 10,415 10,415 10,115 (300)52875 - OFFICE SERVICES RECORDS 604 452 0 0 0 052880 - PURCHASES FOR RESALE 0 588 3,000 3,000 2,000 (1,000)65357 - VOLUNTEER RESOURCES 0 5,610 7,812 7,812 7,812 065366 - LEARN-TO-SKATE 0 24,906 20,700 20,700 20,700 065368 - MISC SPORTS 9,897 7,281 10,800 10,800 10,800 065369 - SOFTBALL 160,198 158,987 160,021 160,021 160,021 065370 - SOCCER 77,268 53,124 80,174 80,174 80,174 065371 - BASKETBALL 6,159 4,071 8,000 8,000 8,000 065373 - FOOTBALL 66,794 63,851 80,968 80,968 80,968 065375 - VOLLEYBALL 4,440 7,414 5,655 5,655 5,655 065377 - TENNIS CLASSES AND CENTER 14,290 22,988 0 0 0 065379 - HIGH SCHOOL HOCKEY 5,040 0 0 0 0 065380 - ADULT HOCKEY LEAGUES 0 8,862 3,000 3,000 3,000 0
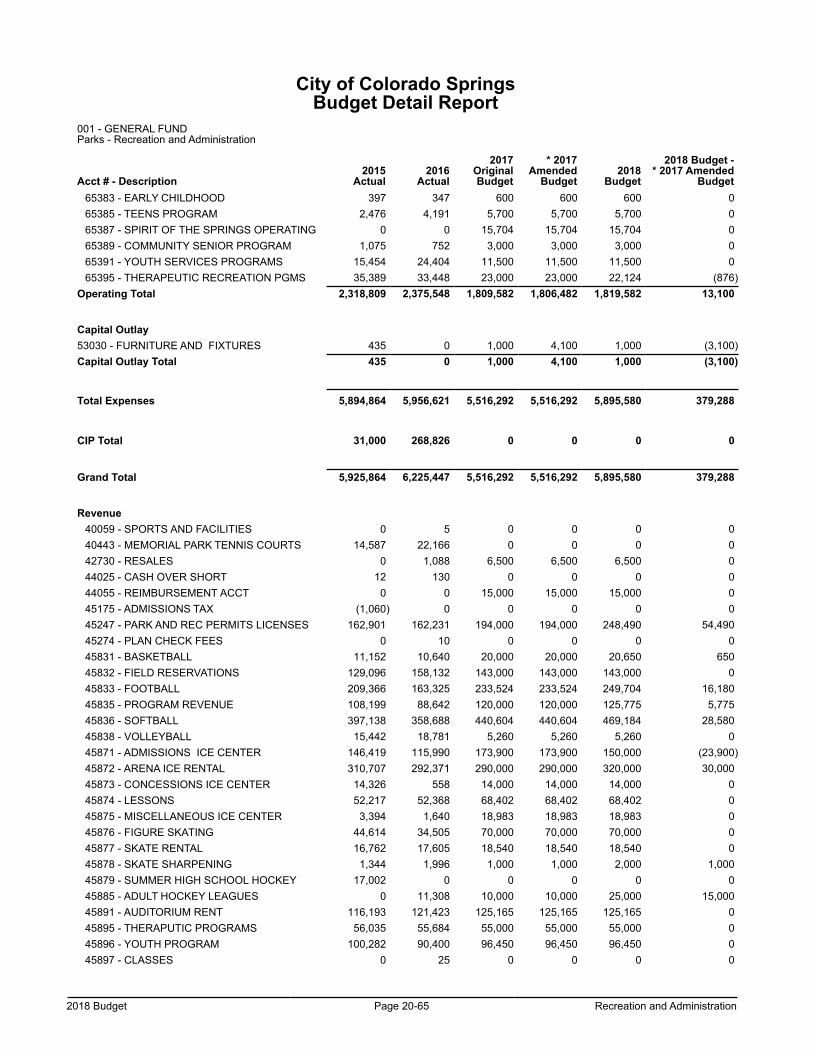
2018 Budget Page 20-65 Recreation and Administration
City of Colorado SpringsBudget Detail Report
001 - GENERAL FUNDParks - Recreation and Administration
Acct # - Description2015
Actual2016
Actual
2017OriginalBudget
* 2017Amended
Budget2018
Budget
2018 Budget -* 2017 Amended
Budget65383 - EARLY CHILDHOOD 397 347 600 600 600 065385 - TEENS PROGRAM 2,476 4,191 5,700 5,700 5,700 065387 - SPIRIT OF THE SPRINGS OPERATING 0 0 15,704 15,704 15,704 065389 - COMMUNITY SENIOR PROGRAM 1,075 752 3,000 3,000 3,000 065391 - YOUTH SERVICES PROGRAMS 15,454 24,404 11,500 11,500 11,500 065395 - THERAPEUTIC RECREATION PGMS 35,389 33,448 23,000 23,000 22,124 (876)
Operating Total 2,318,809 2,375,548 1,809,582 1,806,482 1,819,582 13,100
Capital Outlay53030 - FURNITURE AND FIXTURES 435 0 1,000 4,100 1,000 (3,100)Capital Outlay Total 435 0 1,000 4,100 1,000 (3,100)
Total Expenses 5,894,864 5,956,621 5,516,292 5,516,292 5,895,580 379,288
CIP Total 31,000 268,826 0 0 0 0
Grand Total 5,925,864 6,225,447 5,516,292 5,516,292 5,895,580 379,288
Revenue40059 - SPORTS AND FACILITIES 0 5 0 0 0 040443 - MEMORIAL PARK TENNIS COURTS 14,587 22,166 0 0 0 042730 - RESALES 0 1,088 6,500 6,500 6,500 044025 - CASH OVER SHORT 12 130 0 0 0 044055 - REIMBURSEMENT ACCT 0 0 15,000 15,000 15,000 045175 - ADMISSIONS TAX (1,060) 0 0 0 0 045247 - PARK AND REC PERMITS LICENSES 162,901 162,231 194,000 194,000 248,490 54,49045274 - PLAN CHECK FEES 0 10 0 0 0 045831 - BASKETBALL 11,152 10,640 20,000 20,000 20,650 65045832 - FIELD RESERVATIONS 129,096 158,132 143,000 143,000 143,000 045833 - FOOTBALL 209,366 163,325 233,524 233,524 249,704 16,18045835 - PROGRAM REVENUE 108,199 88,642 120,000 120,000 125,775 5,77545836 - SOFTBALL 397,138 358,688 440,604 440,604 469,184 28,58045838 - VOLLEYBALL 15,442 18,781 5,260 5,260 5,260 045871 - ADMISSIONS ICE CENTER 146,419 115,990 173,900 173,900 150,000 (23,900)45872 - ARENA ICE RENTAL 310,707 292,371 290,000 290,000 320,000 30,00045873 - CONCESSIONS ICE CENTER 14,326 558 14,000 14,000 14,000 045874 - LESSONS 52,217 52,368 68,402 68,402 68,402 045875 - MISCELLANEOUS ICE CENTER 3,394 1,640 18,983 18,983 18,983 045876 - FIGURE SKATING 44,614 34,505 70,000 70,000 70,000 045877 - SKATE RENTAL 16,762 17,605 18,540 18,540 18,540 045878 - SKATE SHARPENING 1,344 1,996 1,000 1,000 2,000 1,00045879 - SUMMER HIGH SCHOOL HOCKEY 17,002 0 0 0 0 045885 - ADULT HOCKEY LEAGUES 0 11,308 10,000 10,000 25,000 15,00045891 - AUDITORIUM RENT 116,193 121,423 125,165 125,165 125,165 045895 - THERAPUTIC PROGRAMS 56,035 55,684 55,000 55,000 55,000 045896 - YOUTH PROGRAM 100,282 90,400 96,450 96,450 96,450 045897 - CLASSES 0 25 0 0 0 0
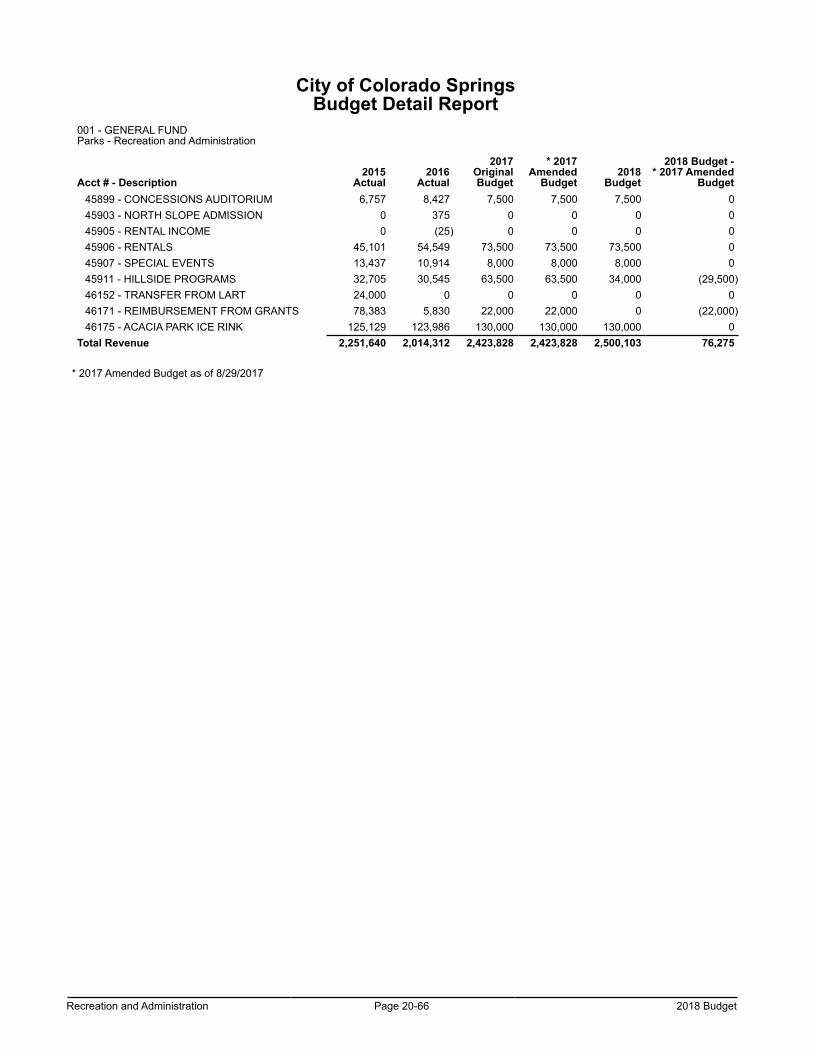
Recreation and Administration Page 20-66 2018 Budget
City of Colorado SpringsBudget Detail Report
001 - GENERAL FUNDParks - Recreation and Administration
Acct # - Description2015
Actual2016
Actual
2017OriginalBudget
* 2017Amended
Budget2018
Budget
2018 Budget -* 2017 Amended
Budget45899 - CONCESSIONS AUDITORIUM 6,757 8,427 7,500 7,500 7,500 045903 - NORTH SLOPE ADMISSION 0 375 0 0 0 045905 - RENTAL INCOME 0 (25) 0 0 0 045906 - RENTALS 45,101 54,549 73,500 73,500 73,500 045907 - SPECIAL EVENTS 13,437 10,914 8,000 8,000 8,000 045911 - HILLSIDE PROGRAMS 32,705 30,545 63,500 63,500 34,000 (29,500)46152 - TRANSFER FROM LART 24,000 0 0 0 0 046171 - REIMBURSEMENT FROM GRANTS 78,383 5,830 22,000 22,000 0 (22,000)46175 - ACACIA PARK ICE RINK 125,129 123,986 130,000 130,000 130,000 0
Total Revenue 2,251,640 2,014,312 2,423,828 2,423,828 2,500,103 76,275
* 2017 Amended Budget as of 8/29/2017
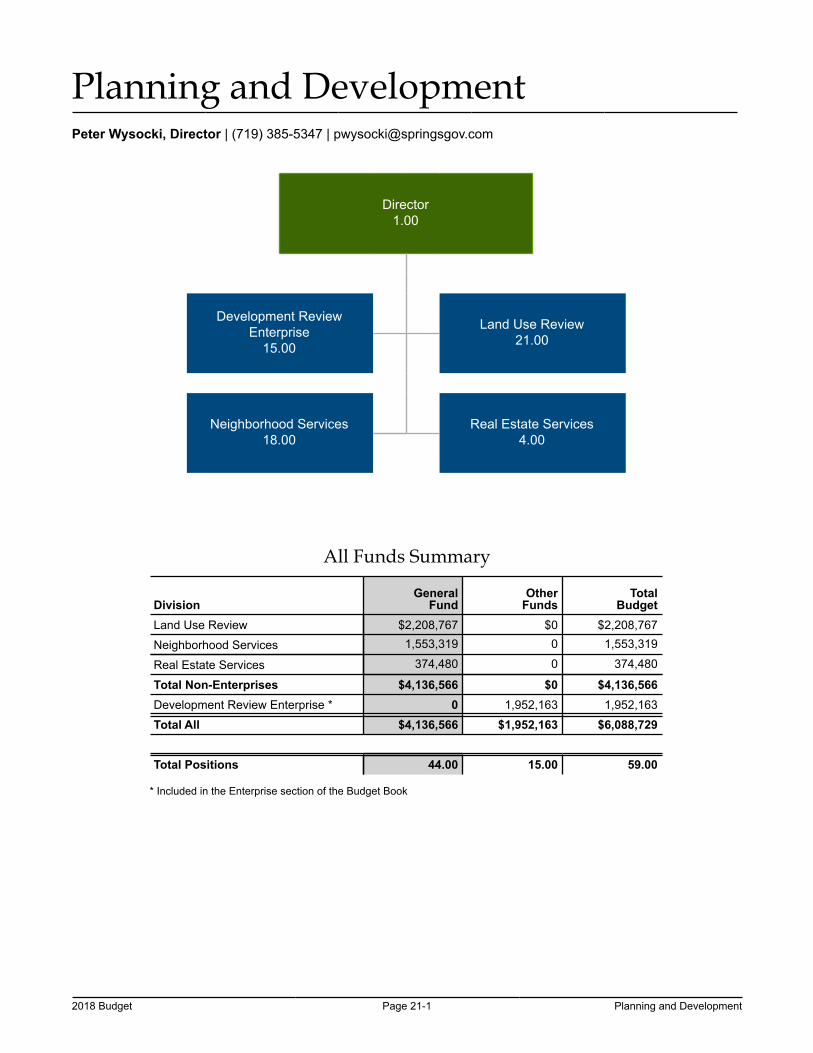
2018 Budget Page 21-1 Planning and Development
Planning and DevelopmentPeter Wysocki, Director | (719) 385-5347 | [email protected]
Director1.00
Development ReviewEnterprise
15.00
Land Use Review21.00
Neighborhood Services18.00
Real Estate Services4.00
All Funds Summary
DivisionGeneral
FundOther
FundsTotal
BudgetLand Use Review $2,208,767 $0 $2,208,767
Neighborhood Services 1,553,319 0 1,553,319
Real Estate Services 374,480 0 374,480
Total Non-Enterprises $4,136,566 $0 $4,136,566Development Review Enterprise * 0 1,952,163 1,952,163
Total All $4,136,566 $1,952,163 $6,088,729
Total Positions 44.00 15.00 59.00
* Included in the Enterprise section of the Budget Book
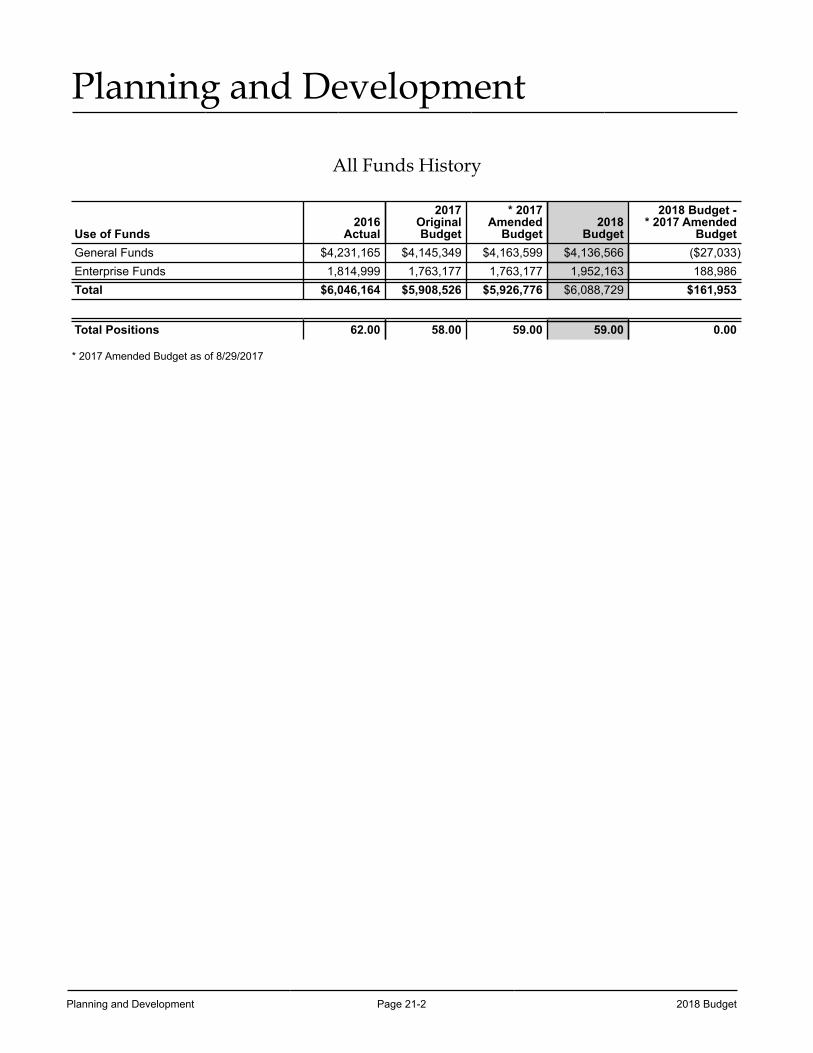
Planning and Development Page 21-2 2018 Budget
Planning and Development
All Funds History
Use of Funds2016
Actual
2017OriginalBudget
* 2017Amended
Budget2018
Budget
2018 Budget -* 2017 Amended
BudgetGeneral Funds $4,231,165 $4,145,349 $4,163,599 $4,136,566 ($27,033)Enterprise Funds 1,814,999 1,763,177 1,763,177 1,952,163 188,986Total $6,046,164 $5,908,526 $5,926,776 $6,088,729 $161,953
Total Positions 62.00 58.00 59.00 59.00 0.00
* 2017 Amended Budget as of 8/29/2017
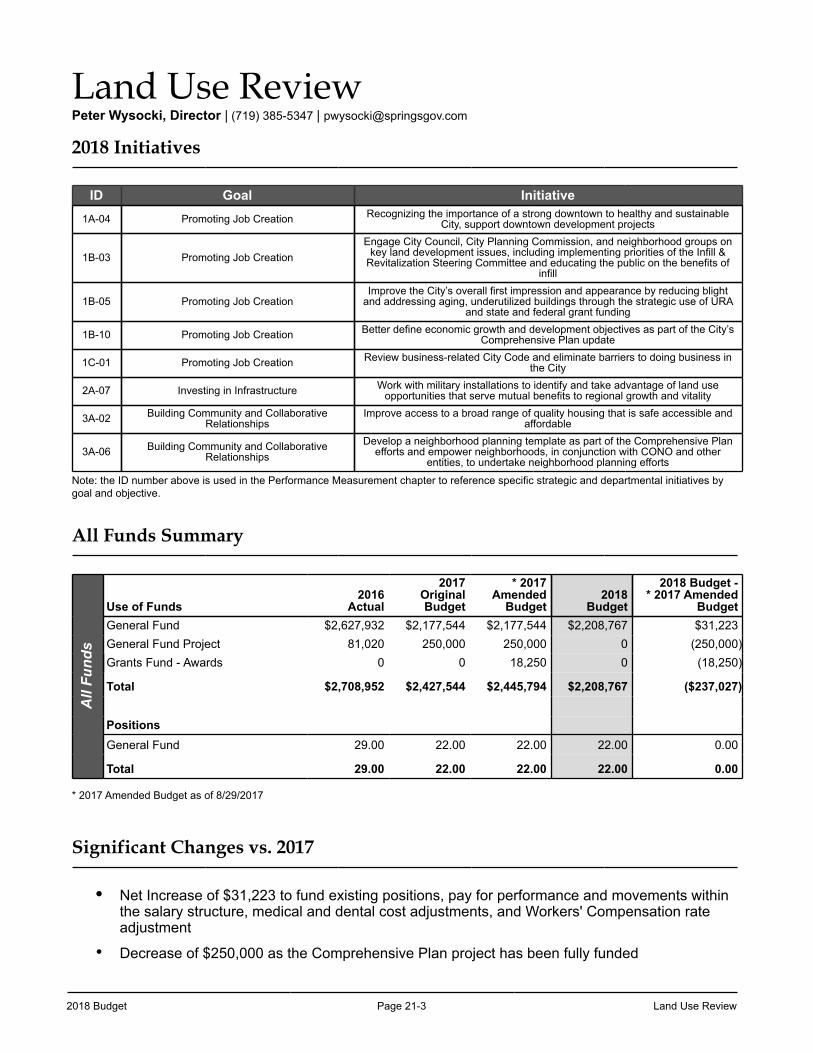
2018 Budget Page 21-3 Land Use Review
Land Use ReviewPeter Wysocki, Director | (719) 385-5347 | [email protected]
2018 Initiatives
ID Goal Initiative1A-04 Promoting Job Creation Recognizing the importance of a strong downtown to healthy and sustainable
City, support downtown development projects
1B-03 Promoting Job CreationEngage City Council, City Planning Commission, and neighborhood groups on
key land development issues, including implementing priorities of the Infill & Revitalization Steering Committee and educating the public on the benefits of
infill
1B-05 Promoting Job CreationImprove the City’s overall first impression and appearance by reducing blight
and addressing aging, underutilized buildings through the strategic use of URA and state and federal grant funding
1B-10 Promoting Job Creation Better define economic growth and development objectives as part of the City’s Comprehensive Plan update
1C-01 Promoting Job Creation Review business-related City Code and eliminate barriers to doing business in the City
2A-07 Investing in Infrastructure Work with military installations to identify and take advantage of land use opportunities that serve mutual benefits to regional growth and vitality
3A-02 Building Community and Collaborative Relationships
Improve access to a broad range of quality housing that is safe accessible and affordable
3A-06 Building Community and Collaborative Relationships
Develop a neighborhood planning template as part of the Comprehensive Plan efforts and empower neighborhoods, in conjunction with CONO and other
entities, to undertake neighborhood planning efforts
Note: the ID number above is used in the Performance Measurement chapter to reference specific strategic and departmental initiatives by goal and objective.
All Funds Summary
All
Fund
s
Use of Funds2016
Actual
2017OriginalBudget
* 2017Amended
Budget2018
Budget
2018 Budget -* 2017 Amended
BudgetGeneral Fund $2,627,932 $2,177,544 $2,177,544 $2,208,767 $31,223General Fund Project 81,020 250,000 250,000 0 (250,000)Grants Fund - Awards 0 0 18,250 0 (18,250)
Total $2,708,952 $2,427,544 $2,445,794 $2,208,767 ($237,027)
PositionsGeneral Fund 29.00 22.00 22.00 22.00 0.00
Total 29.00 22.00 22.00 22.00 0.00
* 2017 Amended Budget as of 8/29/2017
Significant Changes vs. 2017
• Net Increase of $31,223 to fund existing positions, pay for performance and movements within the salary structure, medical and dental cost adjustments, and Workers' Compensation rate adjustment
• Decrease of $250,000 as the Comprehensive Plan project has been fully funded
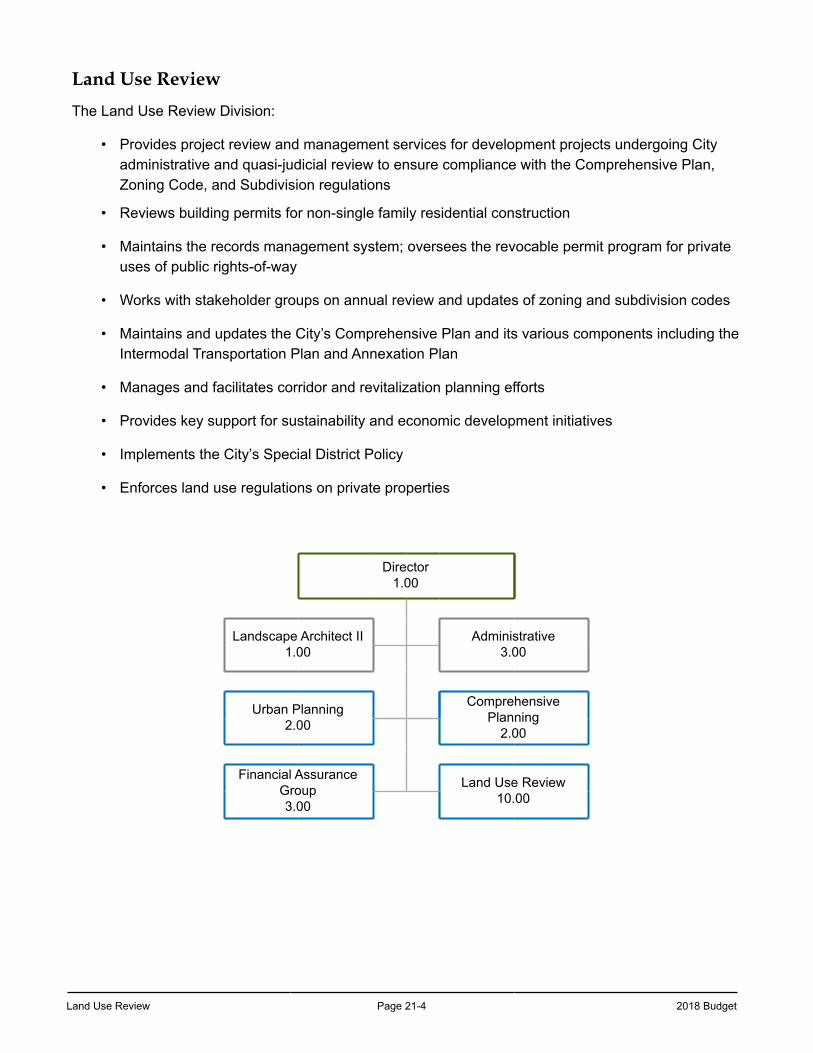
Land Use Review Page 21-4 2018 Budget
Land Use Review
The Land Use Review Division:
• Provides project review and management services for development projects undergoing City administrative and quasi-judicial review to ensure compliance with the Comprehensive Plan, Zoning Code, and Subdivision regulations
• Reviews building permits for non-single family residential construction
• Maintains the records management system; oversees the revocable permit program for private uses of public rights-of-way
• Works with stakeholder groups on annual review and updates of zoning and subdivision codes
• Maintains and updates the City’s Comprehensive Plan and its various components including the Intermodal Transportation Plan and Annexation Plan
• Manages and facilitates corridor and revitalization planning efforts
• Provides key support for sustainability and economic development initiatives
• Implements the City’s Special District Policy
• Enforces land use regulations on private properties
Director1.00
Landscape Architect II1.00
Administrative3.00
Urban Planning2.00
Comprehensive Planning
2.00
Financial Assurance Group3.00
Land Use Review10.00
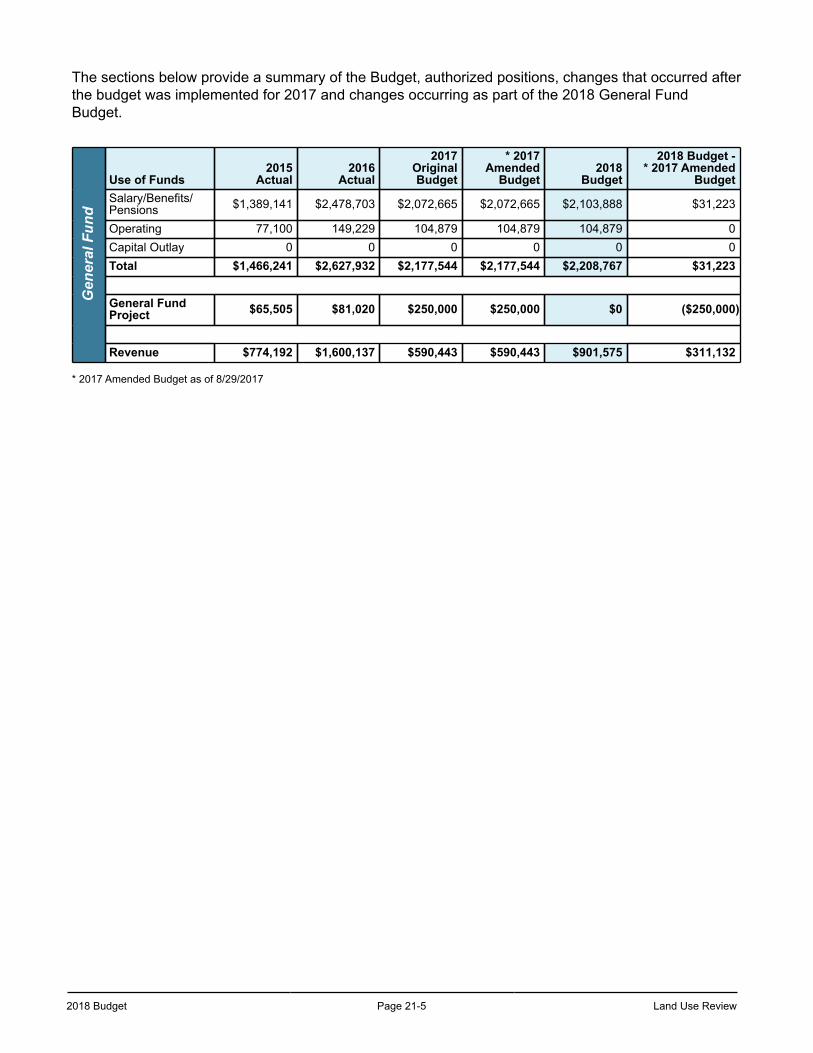
2018 Budget Page 21-5 Land Use Review
The sections below provide a summary of the Budget, authorized positions, changes that occurred after the budget was implemented for 2017 and changes occurring as part of the 2018 General Fund Budget.
Gen
eral
Fun
d
Use of Funds2015
Actual2016
Actual
2017OriginalBudget
* 2017Amended
Budget2018
Budget
2018 Budget -* 2017 Amended
BudgetSalary/Benefits/Pensions $1,389,141 $2,478,703 $2,072,665 $2,072,665 $2,103,888 $31,223
Operating 77,100 149,229 104,879 104,879 104,879 0Capital Outlay 0 0 0 0 0 0Total $1,466,241 $2,627,932 $2,177,544 $2,177,544 $2,208,767 $31,223
General FundProject $65,505 $81,020 $250,000 $250,000 $0 ($250,000)
Revenue $774,192 $1,600,137 $590,443 $590,443 $901,575 $311,132
* 2017 Amended Budget as of 8/29/2017
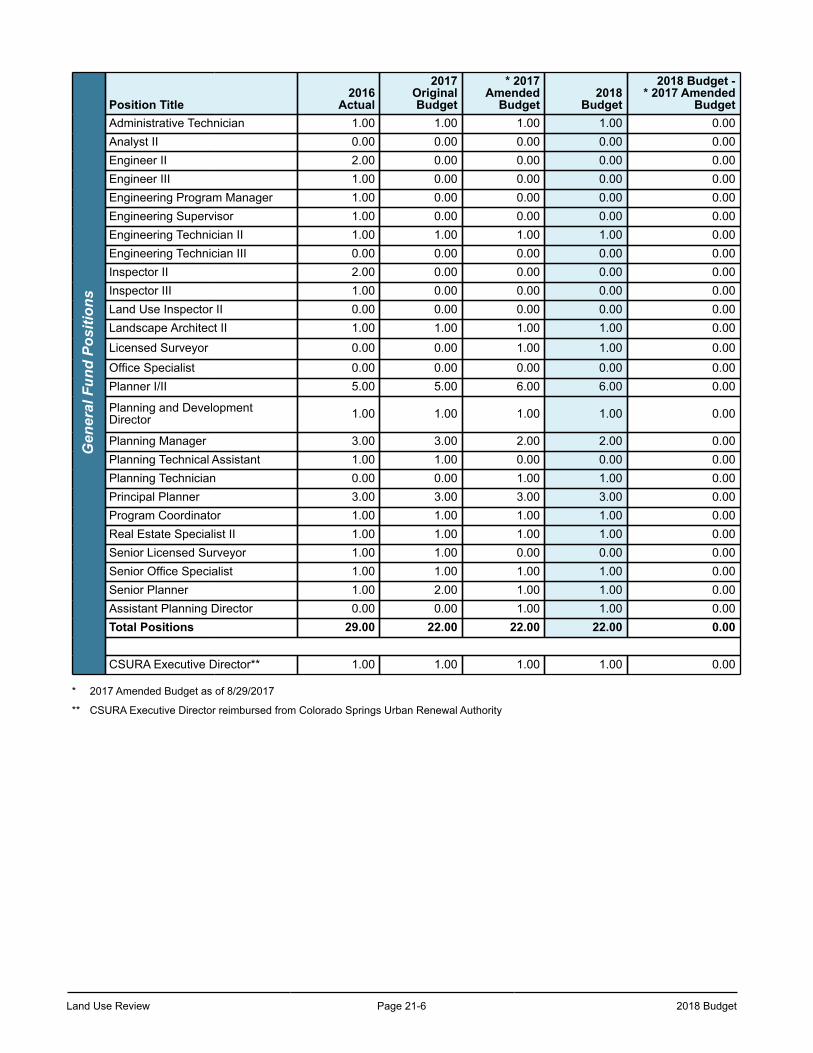
Land Use Review Page 21-6 2018 Budget
Gen
eral
Fun
d Po
sitio
nsPosition Title
2016Actual
2017OriginalBudget
* 2017Amended
Budget2018
Budget
2018 Budget -* 2017 Amended
BudgetAdministrative Technician 1.00 1.00 1.00 1.00 0.00Analyst II 0.00 0.00 0.00 0.00 0.00Engineer II 2.00 0.00 0.00 0.00 0.00Engineer III 1.00 0.00 0.00 0.00 0.00Engineering Program Manager 1.00 0.00 0.00 0.00 0.00Engineering Supervisor 1.00 0.00 0.00 0.00 0.00Engineering Technician II 1.00 1.00 1.00 1.00 0.00Engineering Technician III 0.00 0.00 0.00 0.00 0.00Inspector II 2.00 0.00 0.00 0.00 0.00Inspector III 1.00 0.00 0.00 0.00 0.00Land Use Inspector II 0.00 0.00 0.00 0.00 0.00Landscape Architect II 1.00 1.00 1.00 1.00 0.00
Licensed Surveyor 0.00 0.00 1.00 1.00 0.00
Office Specialist 0.00 0.00 0.00 0.00 0.00Planner I/II 5.00 5.00 6.00 6.00 0.00
Planning and DevelopmentDirector 1.00 1.00 1.00 1.00 0.00
Planning Manager 3.00 3.00 2.00 2.00 0.00Planning Technical Assistant 1.00 1.00 0.00 0.00 0.00Planning Technician 0.00 0.00 1.00 1.00 0.00Principal Planner 3.00 3.00 3.00 3.00 0.00Program Coordinator 1.00 1.00 1.00 1.00 0.00Real Estate Specialist II 1.00 1.00 1.00 1.00 0.00Senior Licensed Surveyor 1.00 1.00 0.00 0.00 0.00Senior Office Specialist 1.00 1.00 1.00 1.00 0.00Senior Planner 1.00 2.00 1.00 1.00 0.00Assistant Planning Director 0.00 0.00 1.00 1.00 0.00Total Positions 29.00 22.00 22.00 22.00 0.00
CSURA Executive Director** 1.00 1.00 1.00 1.00 0.00
* 2017 Amended Budget as of 8/29/2017
** CSURA Executive Director reimbursed from Colorado Springs Urban Renewal Authority
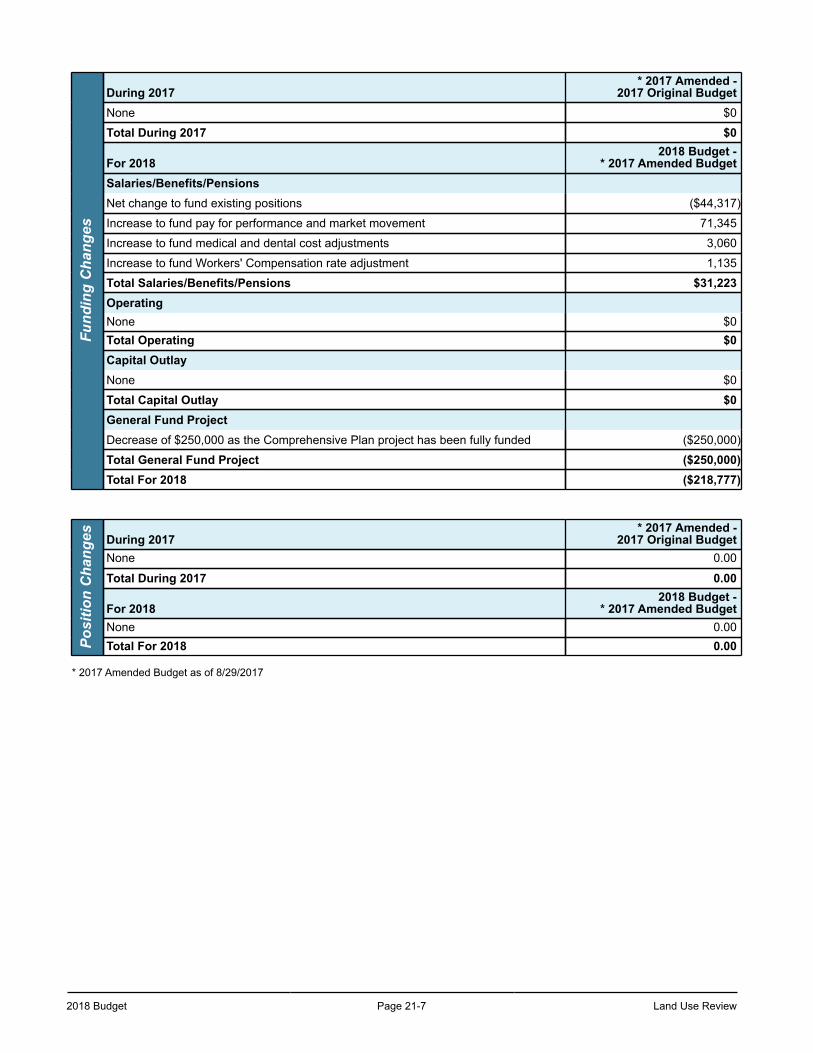
2018 Budget Page 21-7 Land Use Review
Fund
ing
Cha
nges
During 2017* 2017 Amended -
2017 Original BudgetNone $0
Total During 2017 $0
For 20182018 Budget -
* 2017 Amended BudgetSalaries/Benefits/PensionsNet change to fund existing positions ($44,317)
Increase to fund pay for performance and market movement 71,345
Increase to fund medical and dental cost adjustments 3,060
Increase to fund Workers' Compensation rate adjustment 1,135
Total Salaries/Benefits/Pensions $31,223OperatingNone $0Total Operating $0Capital OutlayNone $0
Total Capital Outlay $0General Fund ProjectDecrease of $250,000 as the Comprehensive Plan project has been fully funded ($250,000)
Total General Fund Project ($250,000)Total For 2018 ($218,777)
Posi
tion
Cha
nges During 2017
* 2017 Amended -2017 Original Budget
None 0.00
Total During 2017 0.00
For 20182018 Budget -
* 2017 Amended BudgetNone 0.00Total For 2018 0.00
* 2017 Amended Budget as of 8/29/2017
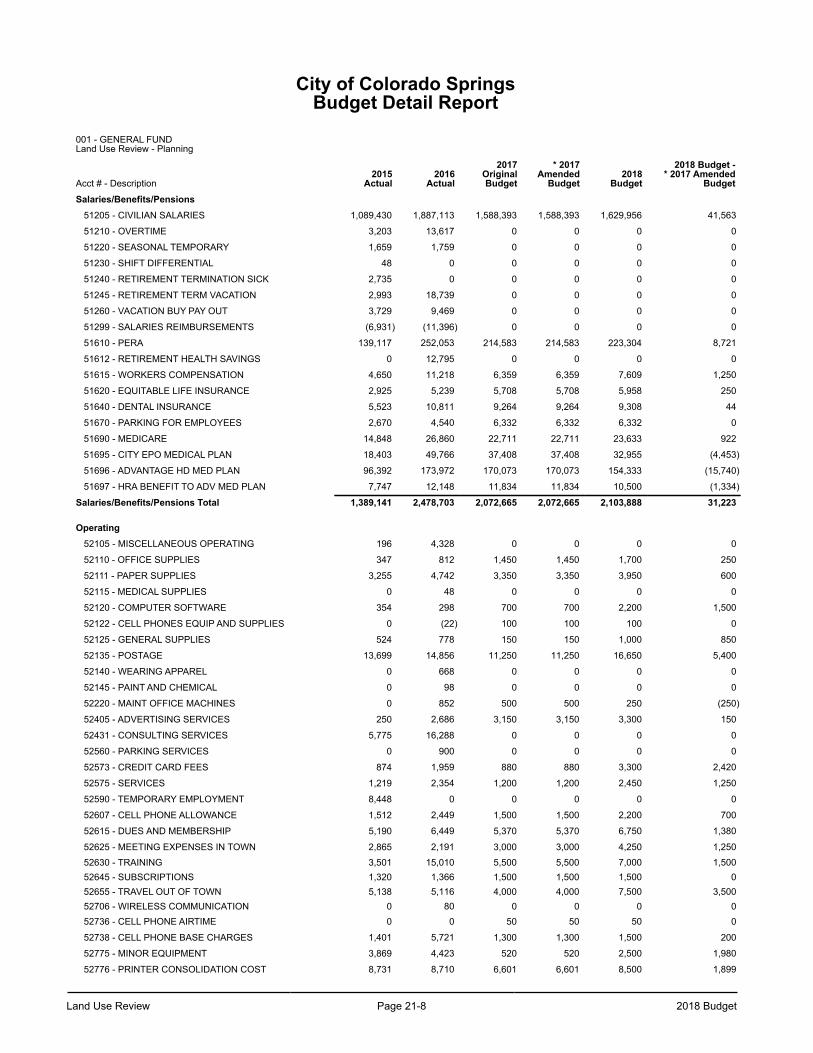
Land Use Review Page 21-8 2018 Budget
City of Colorado SpringsBudget Detail Report
001 - GENERAL FUND Land Use Review - Planning
Acct # - Description2015
Actual2016
Actual
2017OriginalBudget
* 2017Amended
Budget2018
Budget
2018 Budget -* 2017 Amended
BudgetSalaries/Benefits/Pensions
51205 - CIVILIAN SALARIES 1,089,430 1,887,113 1,588,393 1,588,393 1,629,956 41,563
51210 - OVERTIME 3,203 13,617 0 0 0 0
51220 - SEASONAL TEMPORARY 1,659 1,759 0 0 0 0
51230 - SHIFT DIFFERENTIAL 48 0 0 0 0 0
51240 - RETIREMENT TERMINATION SICK 2,735 0 0 0 0 0
51245 - RETIREMENT TERM VACATION 2,993 18,739 0 0 0 0
51260 - VACATION BUY PAY OUT 3,729 9,469 0 0 0 0
51299 - SALARIES REIMBURSEMENTS (6,931) (11,396) 0 0 0 0
51610 - PERA 139,117 252,053 214,583 214,583 223,304 8,721
51612 - RETIREMENT HEALTH SAVINGS 0 12,795 0 0 0 0
51615 - WORKERS COMPENSATION 4,650 11,218 6,359 6,359 7,609 1,250
51620 - EQUITABLE LIFE INSURANCE 2,925 5,239 5,708 5,708 5,958 250
51640 - DENTAL INSURANCE 5,523 10,811 9,264 9,264 9,308 44
51670 - PARKING FOR EMPLOYEES 2,670 4,540 6,332 6,332 6,332 0
51690 - MEDICARE 14,848 26,860 22,711 22,711 23,633 922
51695 - CITY EPO MEDICAL PLAN 18,403 49,766 37,408 37,408 32,955 (4,453)
51696 - ADVANTAGE HD MED PLAN 96,392 173,972 170,073 170,073 154,333 (15,740)
51697 - HRA BENEFIT TO ADV MED PLAN 7,747 12,148 11,834 11,834 10,500 (1,334)
Salaries/Benefits/Pensions Total 1,389,141 2,478,703 2,072,665 2,072,665 2,103,888 31,223
Operating52105 - MISCELLANEOUS OPERATING 196 4,328 0 0 0 0
52110 - OFFICE SUPPLIES 347 812 1,450 1,450 1,700 250
52111 - PAPER SUPPLIES 3,255 4,742 3,350 3,350 3,950 600
52115 - MEDICAL SUPPLIES 0 48 0 0 0 0
52120 - COMPUTER SOFTWARE 354 298 700 700 2,200 1,500
52122 - CELL PHONES EQUIP AND SUPPLIES 0 (22) 100 100 100 0
52125 - GENERAL SUPPLIES 524 778 150 150 1,000 850
52135 - POSTAGE 13,699 14,856 11,250 11,250 16,650 5,400
52140 - WEARING APPAREL 0 668 0 0 0 0
52145 - PAINT AND CHEMICAL 0 98 0 0 0 0
52220 - MAINT OFFICE MACHINES 0 852 500 500 250 (250)
52405 - ADVERTISING SERVICES 250 2,686 3,150 3,150 3,300 150
52431 - CONSULTING SERVICES 5,775 16,288 0 0 0 0
52560 - PARKING SERVICES 0 900 0 0 0 0
52573 - CREDIT CARD FEES 874 1,959 880 880 3,300 2,420
52575 - SERVICES 1,219 2,354 1,200 1,200 2,450 1,250
52590 - TEMPORARY EMPLOYMENT 8,448 0 0 0 0 0
52607 - CELL PHONE ALLOWANCE 1,512 2,449 1,500 1,500 2,200 700
52615 - DUES AND MEMBERSHIP 5,190 6,449 5,370 5,370 6,750 1,380
52625 - MEETING EXPENSES IN TOWN 2,865 2,191 3,000 3,000 4,250 1,250
52630 - TRAINING 3,501 15,010 5,500 5,500 7,000 1,50052645 - SUBSCRIPTIONS 1,320 1,366 1,500 1,500 1,500 052655 - TRAVEL OUT OF TOWN 5,138 5,116 4,000 4,000 7,500 3,50052706 - WIRELESS COMMUNICATION 0 80 0 0 0 052736 - CELL PHONE AIRTIME 0 0 50 50 50 0
52738 - CELL PHONE BASE CHARGES 1,401 5,721 1,300 1,300 1,500 200
52775 - MINOR EQUIPMENT 3,869 4,423 520 520 2,500 1,980
52776 - PRINTER CONSOLIDATION COST 8,731 8,710 6,601 6,601 8,500 1,899
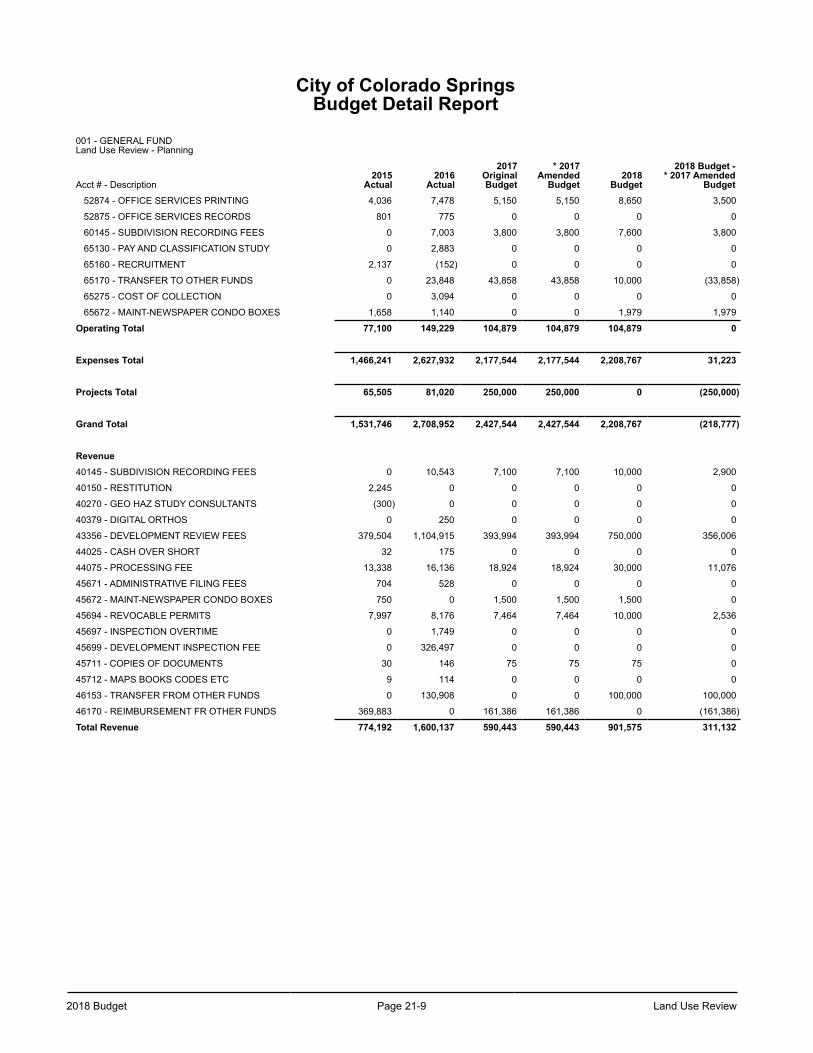
2018 Budget Page 21-9 Land Use Review
City of Colorado SpringsBudget Detail Report
001 - GENERAL FUND Land Use Review - Planning
Acct # - Description2015
Actual2016
Actual
2017OriginalBudget
* 2017Amended
Budget2018
Budget
2018 Budget -* 2017 Amended
Budget52874 - OFFICE SERVICES PRINTING 4,036 7,478 5,150 5,150 8,650 3,500
52875 - OFFICE SERVICES RECORDS 801 775 0 0 0 0
60145 - SUBDIVISION RECORDING FEES 0 7,003 3,800 3,800 7,600 3,800
65130 - PAY AND CLASSIFICATION STUDY 0 2,883 0 0 0 0
65160 - RECRUITMENT 2,137 (152) 0 0 0 0
65170 - TRANSFER TO OTHER FUNDS 0 23,848 43,858 43,858 10,000 (33,858)
65275 - COST OF COLLECTION 0 3,094 0 0 0 0
65672 - MAINT-NEWSPAPER CONDO BOXES 1,658 1,140 0 0 1,979 1,979
Operating Total 77,100 149,229 104,879 104,879 104,879 0
Expenses Total 1,466,241 2,627,932 2,177,544 2,177,544 2,208,767 31,223
Projects Total 65,505 81,020 250,000 250,000 0 (250,000)
Grand Total 1,531,746 2,708,952 2,427,544 2,427,544 2,208,767 (218,777)
Revenue40145 - SUBDIVISION RECORDING FEES 0 10,543 7,100 7,100 10,000 2,900
40150 - RESTITUTION 2,245 0 0 0 0 0
40270 - GEO HAZ STUDY CONSULTANTS (300) 0 0 0 0 0
40379 - DIGITAL ORTHOS 0 250 0 0 0 0
43356 - DEVELOPMENT REVIEW FEES 379,504 1,104,915 393,994 393,994 750,000 356,006
44025 - CASH OVER SHORT 32 175 0 0 0 0
44075 - PROCESSING FEE 13,338 16,136 18,924 18,924 30,000 11,076
45671 - ADMINISTRATIVE FILING FEES 704 528 0 0 0 0
45672 - MAINT-NEWSPAPER CONDO BOXES 750 0 1,500 1,500 1,500 0
45694 - REVOCABLE PERMITS 7,997 8,176 7,464 7,464 10,000 2,536
45697 - INSPECTION OVERTIME 0 1,749 0 0 0 0
45699 - DEVELOPMENT INSPECTION FEE 0 326,497 0 0 0 0
45711 - COPIES OF DOCUMENTS 30 146 75 75 75 0
45712 - MAPS BOOKS CODES ETC 9 114 0 0 0 0
46153 - TRANSFER FROM OTHER FUNDS 0 130,908 0 0 100,000 100,000
46170 - REIMBURSEMENT FR OTHER FUNDS 369,883 0 161,386 161,386 0 (161,386)
Total Revenue 774,192 1,600,137 590,443 590,443 901,575 311,132

Land Use Review Page 21-10 2018 Budget
This page left blank intentionally.
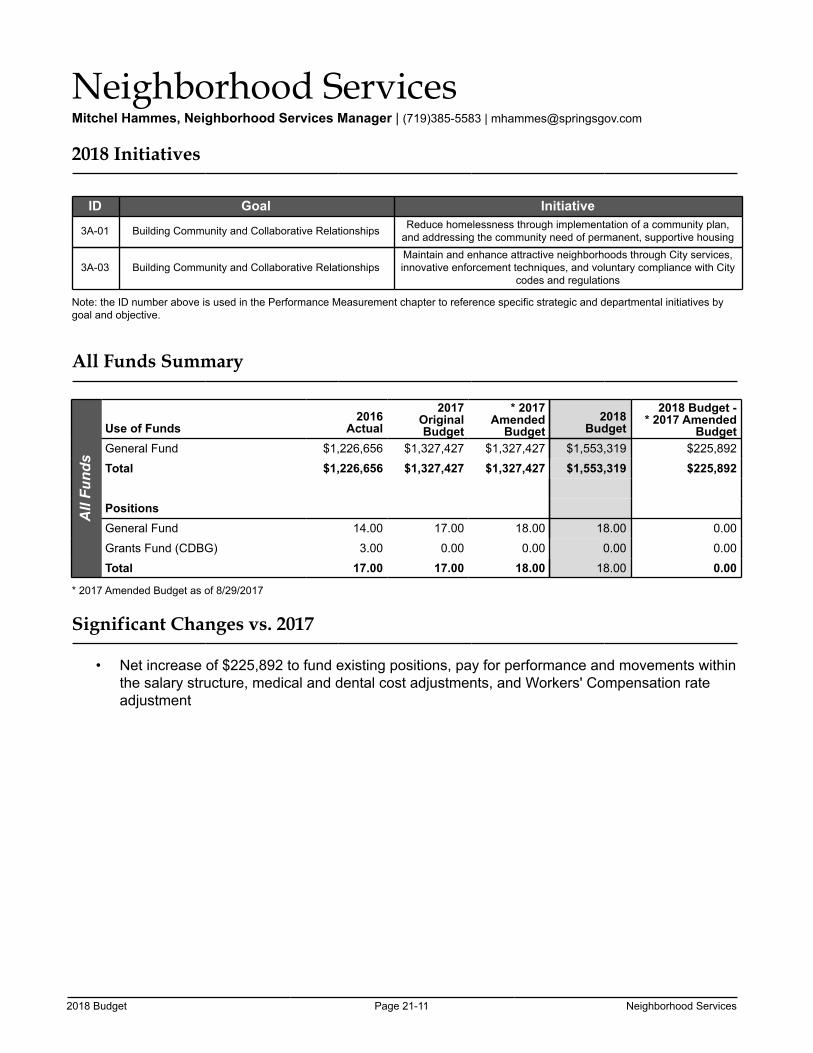
2018 Budget Page 21-11 Neighborhood Services
Neighborhood ServicesMitchel Hammes, Neighborhood Services Manager | (719)385-5583 | [email protected]
2018 Initiatives
ID Goal Initiative
3A-01 Building Community and Collaborative Relationships Reduce homelessness through implementation of a community plan, and addressing the community need of permanent, supportive housing
3A-03 Building Community and Collaborative RelationshipsMaintain and enhance attractive neighborhoods through City services, innovative enforcement techniques, and voluntary compliance with City
codes and regulations
Note: the ID number above is used in the Performance Measurement chapter to reference specific strategic and departmental initiatives by goal and objective.
All Funds Summary
All
Fund
s
Use of Funds2016
Actual
2017OriginalBudget
* 2017Amended
Budget2018
Budget
2018 Budget -* 2017 Amended
BudgetGeneral Fund $1,226,656 $1,327,427 $1,327,427 $1,553,319 $225,892
Total $1,226,656 $1,327,427 $1,327,427 $1,553,319 $225,892
PositionsGeneral Fund 14.00 17.00 18.00 18.00 0.00
Grants Fund (CDBG) 3.00 0.00 0.00 0.00 0.00
Total 17.00 17.00 18.00 18.00 0.00
* 2017 Amended Budget as of 8/29/2017
Significant Changes vs. 2017
• Net increase of $225,892 to fund existing positions, pay for performance and movements within the salary structure, medical and dental cost adjustments, and Workers' Compensation rate adjustment
Neighborhood Services 21-12 2018 Budget
Neighborhood Services
The Neighborhood Services Division of the Planning and Community Development Department serves the City of Colorado Springs by preserving, enhancing, and engaging Colorado Springs' neighborhoods. As part of a strategic restructuring in 2017, Neighborhood Services created four unique teams to more evenly distribute our code enforcement caseloads, calls for graffiti/abatement services, and administrative/community engagement initiatives.
The Division has two code enforcement teams comprised of a Code Enforcement Supervisor, a Senior Code Enforcement Officer, and three code enforcement Officers. These teams investigate complaints and enforce provisions of our City Code pertaining to:
• Outside Storage of Personal Property Visible from Beyond Property Boundaries• Litter and Debris• Overgrown Vegetation• Maintenance of Adjacent Rights-of-Way• Minimum Housing Standards• Obstruction of Public Ways (Sidewalks & Streets)• Oversized Vehicle Parking/Storage in Residential Zones• Unlicensed/Inoperable Vehicles on Private Property• Unpermitted Land Uses/Zoning Violations• Other provisions of the Colorado Springs City Code
The Quality of Life Team is comprised of a Code Enforcement Supervisor, a full-time Maintenance Technician, and four part-time/hourly maintenance support staff. This team provides a community response and abatement of:
• Graffiti• Removal of Unpermitted signs in the right of way• Abatement of sanitation or overgrown vegetation when private property owners refuse• Removal of debris and overgrown vegetation on City owned property not maintained by another
department• Clean-up and removal of vacated homeless camps on public and private property
The Administrative/Community Engagement team is comprised of the Neighborhood Services Manager, two Code Enforcement Technicians, a Code Enforcement Officer specifically trained in HUD Housing Quality Standards dedicated to housing code violations, a Homelessness Prevention and Response Coordinator, and a Neighborhood Development Outreach Specialist. This team is responsible for the administration and management of strategic and operational division initiatives, intake of code enforcement complaints, managing stakeholder inquiries regarding the development process, developing and implementing neighborhood engagement programs, and executing the City’s response and participation with stakeholders to combat homelessness in our community.
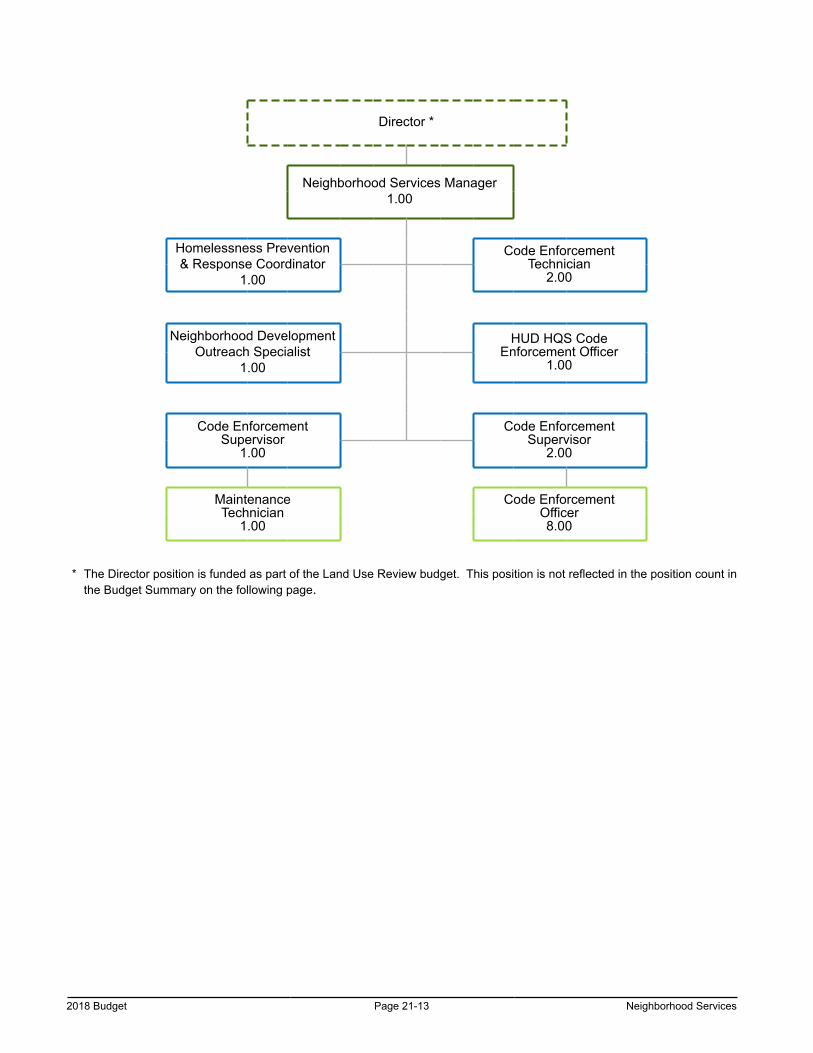
2018 Budget Page 21-13 Neighborhood Services
Director *
Neighborhood Services Manager1.00
Homelessness Prevention & Response Coordinator
1.00
Code EnforcementTechnician
2.00
Neighborhood Development Outreach Specialist
1.00
HUD HQS Code Enforcement Officer
1.00
Code Enforcement Supervisor
1.00
Code Enforcement Supervisor
2.00
MaintenanceTechnician
1.00
Code EnforcementOfficer8.00
* The Director position is funded as part of the Land Use Review budget. This position is not reflected in the position count in the Budget Summary on the following page.
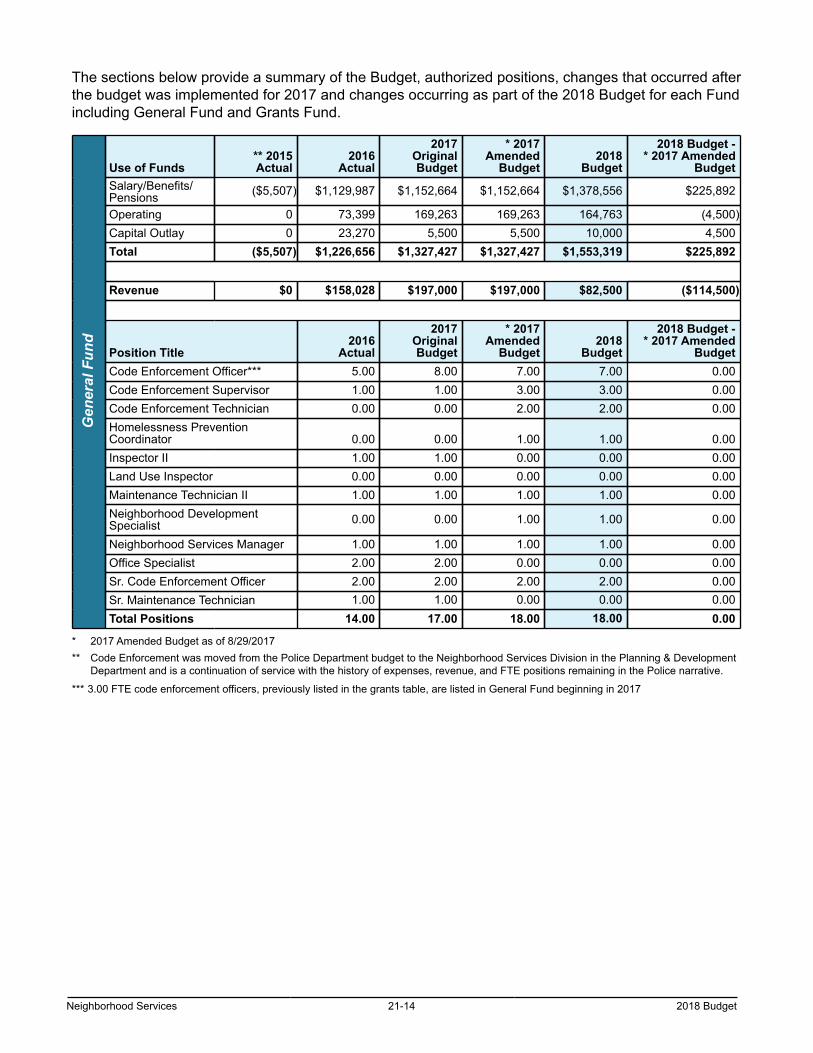
Neighborhood Services 21-14 2018 Budget
The sections below provide a summary of the Budget, authorized positions, changes that occurred after the budget was implemented for 2017 and changes occurring as part of the 2018 Budget for each Fund including General Fund and Grants Fund.
Gen
eral
Fun
d
Use of Funds ** 2015Actual
2016Actual
2017OriginalBudget
* 2017Amended
Budget2018
Budget
2018 Budget -* 2017 Amended
BudgetSalary/Benefits/Pensions ($5,507) $1,129,987 $1,152,664 $1,152,664 $1,378,556 $225,892
Operating 0 73,399 169,263 169,263 164,763 (4,500)Capital Outlay 0 23,270 5,500 5,500 10,000 4,500Total ($5,507) $1,226,656 $1,327,427 $1,327,427 $1,553,319 $225,892
Revenue $0 $158,028 $197,000 $197,000 $82,500 ($114,500)
Position Title2016
Actual
2017OriginalBudget
* 2017Amended
Budget2018
Budget
2018 Budget -* 2017 Amended
BudgetCode Enforcement Officer*** 5.00 8.00 7.00 7.00 0.00Code Enforcement Supervisor 1.00 1.00 3.00 3.00 0.00Code Enforcement Technician 0.00 0.00 2.00 2.00 0.00Homelessness PreventionCoordinator 0.00 0.00 1.00 1.00 0.00Inspector II 1.00 1.00 0.00 0.00 0.00Land Use Inspector 0.00 0.00 0.00 0.00 0.00Maintenance Technician II 1.00 1.00 1.00 1.00 0.00Neighborhood DevelopmentSpecialist 0.00 0.00 1.00 1.00 0.00
Neighborhood Services Manager 1.00 1.00 1.00 1.00 0.00Office Specialist 2.00 2.00 0.00 0.00 0.00Sr. Code Enforcement Officer 2.00 2.00 2.00 2.00 0.00Sr. Maintenance Technician 1.00 1.00 0.00 0.00 0.00Total Positions 14.00 17.00 18.00 18.00 0.00
* 2017 Amended Budget as of 8/29/2017** Code Enforcement was moved from the Police Department budget to the Neighborhood Services Division in the Planning & Development
Department and is a continuation of service with the history of expenses, revenue, and FTE positions remaining in the Police narrative.
*** 3.00 FTE code enforcement officers, previously listed in the grants table, are listed in General Fund beginning in 2017
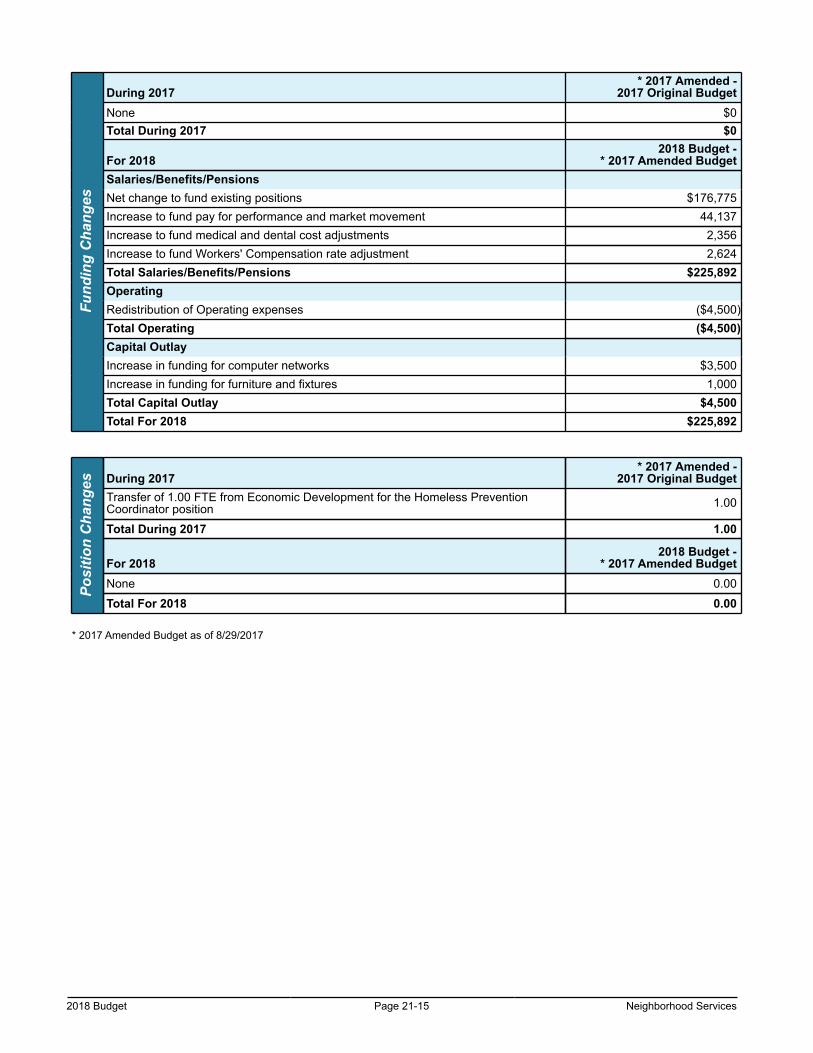
2018 Budget Page 21-15 Neighborhood Services
Fund
ing
Cha
nges
During 2017* 2017 Amended -
2017 Original BudgetNone $0Total During 2017 $0
For 20182018 Budget -
* 2017 Amended BudgetSalaries/Benefits/PensionsNet change to fund existing positions $176,775Increase to fund pay for performance and market movement 44,137Increase to fund medical and dental cost adjustments 2,356Increase to fund Workers' Compensation rate adjustment 2,624Total Salaries/Benefits/Pensions $225,892OperatingRedistribution of Operating expenses ($4,500)Total Operating ($4,500)Capital OutlayIncrease in funding for computer networks $3,500Increase in funding for furniture and fixtures 1,000Total Capital Outlay $4,500Total For 2018 $225,892
Posi
tion
Cha
nges During 2017
* 2017 Amended -2017 Original Budget
Transfer of 1.00 FTE from Economic Development for the Homeless PreventionCoordinator position 1.00
Total During 2017 1.00
For 20182018 Budget -
* 2017 Amended BudgetNone 0.00
Total For 2018 0.00
* 2017 Amended Budget as of 8/29/2017
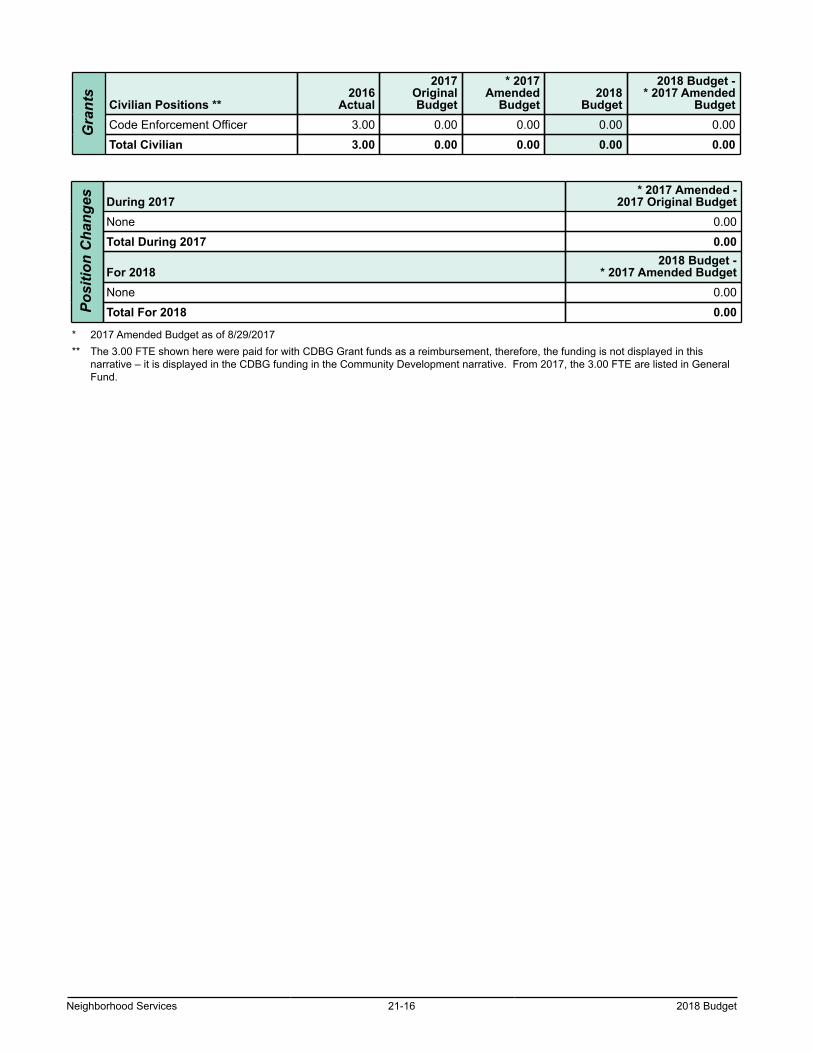
Neighborhood Services 21-16 2018 Budget
Gra
nts
Civilian Positions **2016
Actual
2017OriginalBudget
* 2017Amended
Budget2018
Budget
2018 Budget -* 2017 Amended
BudgetCode Enforcement Officer 3.00 0.00 0.00 0.00 0.00
Total Civilian 3.00 0.00 0.00 0.00 0.00
Posi
tion
Cha
nges During 2017
* 2017 Amended -2017 Original Budget
None 0.00
Total During 2017 0.00
For 20182018 Budget -
* 2017 Amended BudgetNone 0.00
Total For 2018 0.00
* 2017 Amended Budget as of 8/29/2017** The 3.00 FTE shown here were paid for with CDBG Grant funds as a reimbursement, therefore, the funding is not displayed in this
narrative – it is displayed in the CDBG funding in the Community Development narrative. From 2017, the 3.00 FTE are listed in General Fund.
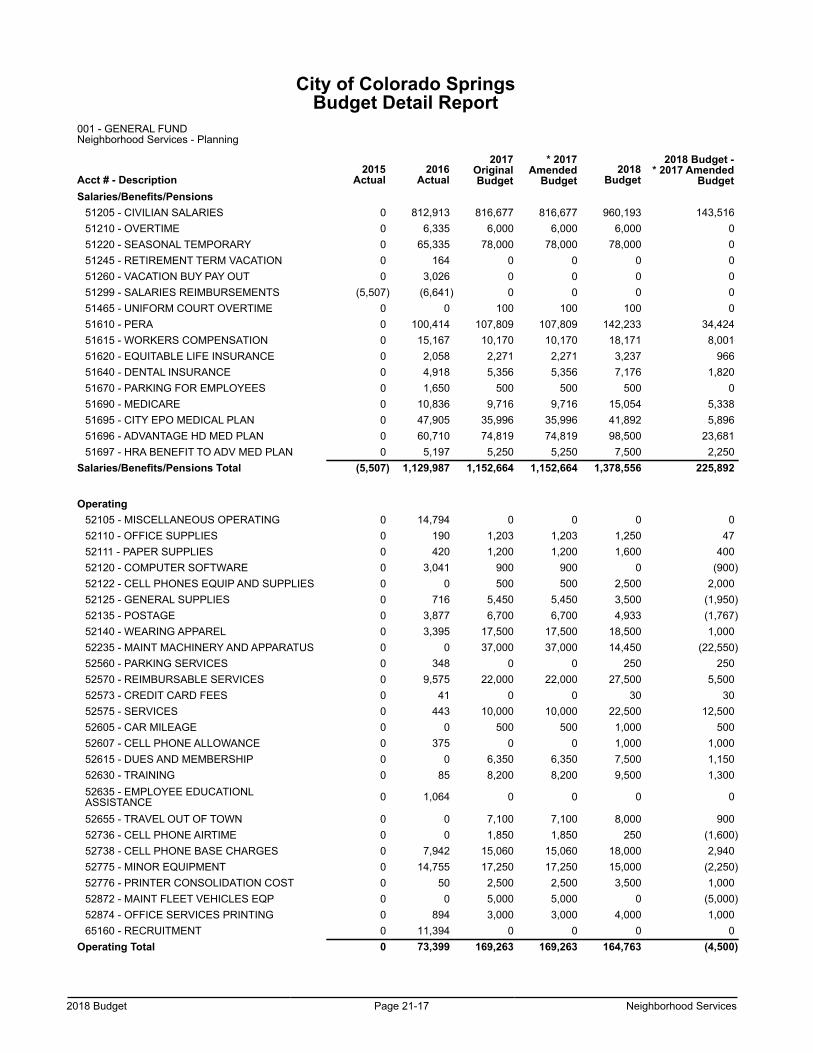
2018 Budget Page 21-17 Neighborhood Services
City of Colorado SpringsBudget Detail Report
001 - GENERAL FUNDNeighborhood Services - Planning
Acct # - Description2015
Actual2016
Actual
2017OriginalBudget
* 2017Amended
Budget2018
Budget
2018 Budget -* 2017 Amended
BudgetSalaries/Benefits/Pensions
51205 - CIVILIAN SALARIES 0 812,913 816,677 816,677 960,193 143,51651210 - OVERTIME 0 6,335 6,000 6,000 6,000 051220 - SEASONAL TEMPORARY 0 65,335 78,000 78,000 78,000 051245 - RETIREMENT TERM VACATION 0 164 0 0 0 051260 - VACATION BUY PAY OUT 0 3,026 0 0 0 051299 - SALARIES REIMBURSEMENTS (5,507) (6,641) 0 0 0 051465 - UNIFORM COURT OVERTIME 0 0 100 100 100 051610 - PERA 0 100,414 107,809 107,809 142,233 34,42451615 - WORKERS COMPENSATION 0 15,167 10,170 10,170 18,171 8,00151620 - EQUITABLE LIFE INSURANCE 0 2,058 2,271 2,271 3,237 96651640 - DENTAL INSURANCE 0 4,918 5,356 5,356 7,176 1,82051670 - PARKING FOR EMPLOYEES 0 1,650 500 500 500 051690 - MEDICARE 0 10,836 9,716 9,716 15,054 5,33851695 - CITY EPO MEDICAL PLAN 0 47,905 35,996 35,996 41,892 5,89651696 - ADVANTAGE HD MED PLAN 0 60,710 74,819 74,819 98,500 23,68151697 - HRA BENEFIT TO ADV MED PLAN 0 5,197 5,250 5,250 7,500 2,250
Salaries/Benefits/Pensions Total (5,507) 1,129,987 1,152,664 1,152,664 1,378,556 225,892
Operating52105 - MISCELLANEOUS OPERATING 0 14,794 0 0 0 052110 - OFFICE SUPPLIES 0 190 1,203 1,203 1,250 4752111 - PAPER SUPPLIES 0 420 1,200 1,200 1,600 40052120 - COMPUTER SOFTWARE 0 3,041 900 900 0 (900)52122 - CELL PHONES EQUIP AND SUPPLIES 0 0 500 500 2,500 2,00052125 - GENERAL SUPPLIES 0 716 5,450 5,450 3,500 (1,950)52135 - POSTAGE 0 3,877 6,700 6,700 4,933 (1,767)52140 - WEARING APPAREL 0 3,395 17,500 17,500 18,500 1,00052235 - MAINT MACHINERY AND APPARATUS 0 0 37,000 37,000 14,450 (22,550)52560 - PARKING SERVICES 0 348 0 0 250 25052570 - REIMBURSABLE SERVICES 0 9,575 22,000 22,000 27,500 5,50052573 - CREDIT CARD FEES 0 41 0 0 30 3052575 - SERVICES 0 443 10,000 10,000 22,500 12,50052605 - CAR MILEAGE 0 0 500 500 1,000 50052607 - CELL PHONE ALLOWANCE 0 375 0 0 1,000 1,00052615 - DUES AND MEMBERSHIP 0 0 6,350 6,350 7,500 1,15052630 - TRAINING 0 85 8,200 8,200 9,500 1,30052635 - EMPLOYEE EDUCATIONLASSISTANCE 0 1,064 0 0 0 0
52655 - TRAVEL OUT OF TOWN 0 0 7,100 7,100 8,000 90052736 - CELL PHONE AIRTIME 0 0 1,850 1,850 250 (1,600)52738 - CELL PHONE BASE CHARGES 0 7,942 15,060 15,060 18,000 2,94052775 - MINOR EQUIPMENT 0 14,755 17,250 17,250 15,000 (2,250)52776 - PRINTER CONSOLIDATION COST 0 50 2,500 2,500 3,500 1,00052872 - MAINT FLEET VEHICLES EQP 0 0 5,000 5,000 0 (5,000)52874 - OFFICE SERVICES PRINTING 0 894 3,000 3,000 4,000 1,00065160 - RECRUITMENT 0 11,394 0 0 0 0
Operating Total 0 73,399 169,263 169,263 164,763 (4,500)
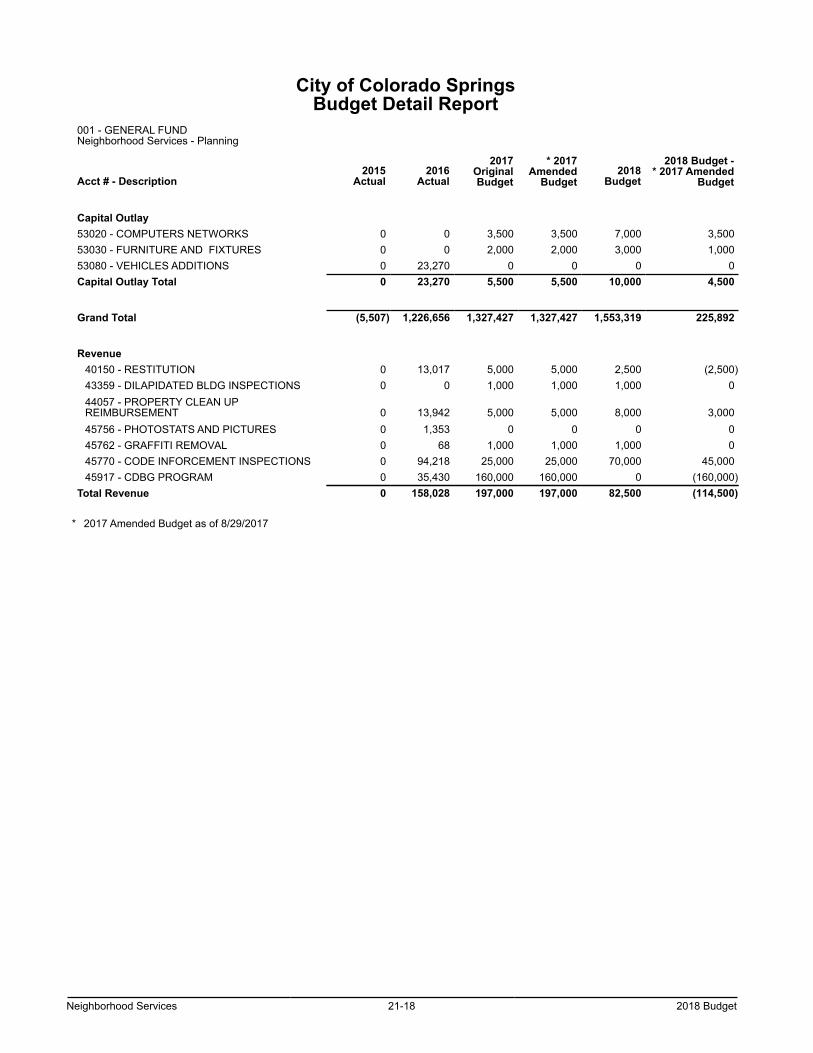
Neighborhood Services 21-18 2018 Budget
City of Colorado SpringsBudget Detail Report
001 - GENERAL FUNDNeighborhood Services - Planning
Acct # - Description2015
Actual2016
Actual
2017OriginalBudget
* 2017Amended
Budget2018
Budget
2018 Budget -* 2017 Amended
Budget
Capital Outlay53020 - COMPUTERS NETWORKS 0 0 3,500 3,500 7,000 3,50053030 - FURNITURE AND FIXTURES 0 0 2,000 2,000 3,000 1,00053080 - VEHICLES ADDITIONS 0 23,270 0 0 0 0Capital Outlay Total 0 23,270 5,500 5,500 10,000 4,500
Grand Total (5,507) 1,226,656 1,327,427 1,327,427 1,553,319 225,892
Revenue40150 - RESTITUTION 0 13,017 5,000 5,000 2,500 (2,500)43359 - DILAPIDATED BLDG INSPECTIONS 0 0 1,000 1,000 1,000 044057 - PROPERTY CLEAN UPREIMBURSEMENT 0 13,942 5,000 5,000 8,000 3,00045756 - PHOTOSTATS AND PICTURES 0 1,353 0 0 0 045762 - GRAFFITI REMOVAL 0 68 1,000 1,000 1,000 045770 - CODE INFORCEMENT INSPECTIONS 0 94,218 25,000 25,000 70,000 45,00045917 - CDBG PROGRAM 0 35,430 160,000 160,000 0 (160,000)
Total Revenue 0 158,028 197,000 197,000 82,500 (114,500)
* 2017 Amended Budget as of 8/29/2017
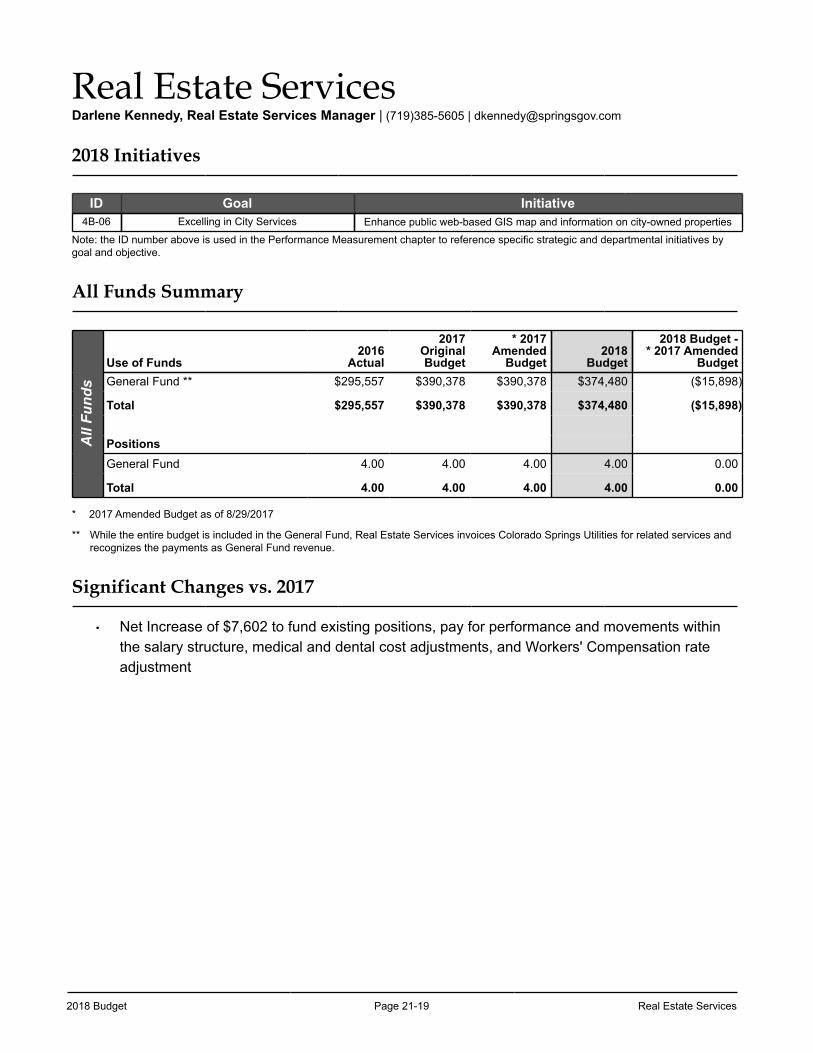
2018 Budget Page 21-19 Real Estate Services
Real Estate ServicesDarlene Kennedy, Real Estate Services Manager | (719)385-5605 | [email protected]
2018 Initiatives
ID Goal Initiative4B-06 Excelling in City Services Enhance public web-based GIS map and information on city-owned properties
Note: the ID number above is used in the Performance Measurement chapter to reference specific strategic and departmental initiatives by goal and objective.
All Funds Summary
All
Fund
s
Use of Funds2016
Actual
2017OriginalBudget
* 2017Amended
Budget2018
Budget
2018 Budget -* 2017 Amended
BudgetGeneral Fund ** $295,557 $390,378 $390,378 $374,480 ($15,898)
Total $295,557 $390,378 $390,378 $374,480 ($15,898)
PositionsGeneral Fund 4.00 4.00 4.00 4.00 0.00
Total 4.00 4.00 4.00 4.00 0.00
* 2017 Amended Budget as of 8/29/2017
** While the entire budget is included in the General Fund, Real Estate Services invoices Colorado Springs Utilities for related services and recognizes the payments as General Fund revenue.
Significant Changes vs. 2017
• Net Increase of $7,602 to fund existing positions, pay for performance and movements within the salary structure, medical and dental cost adjustments, and Workers' Compensation rate adjustment
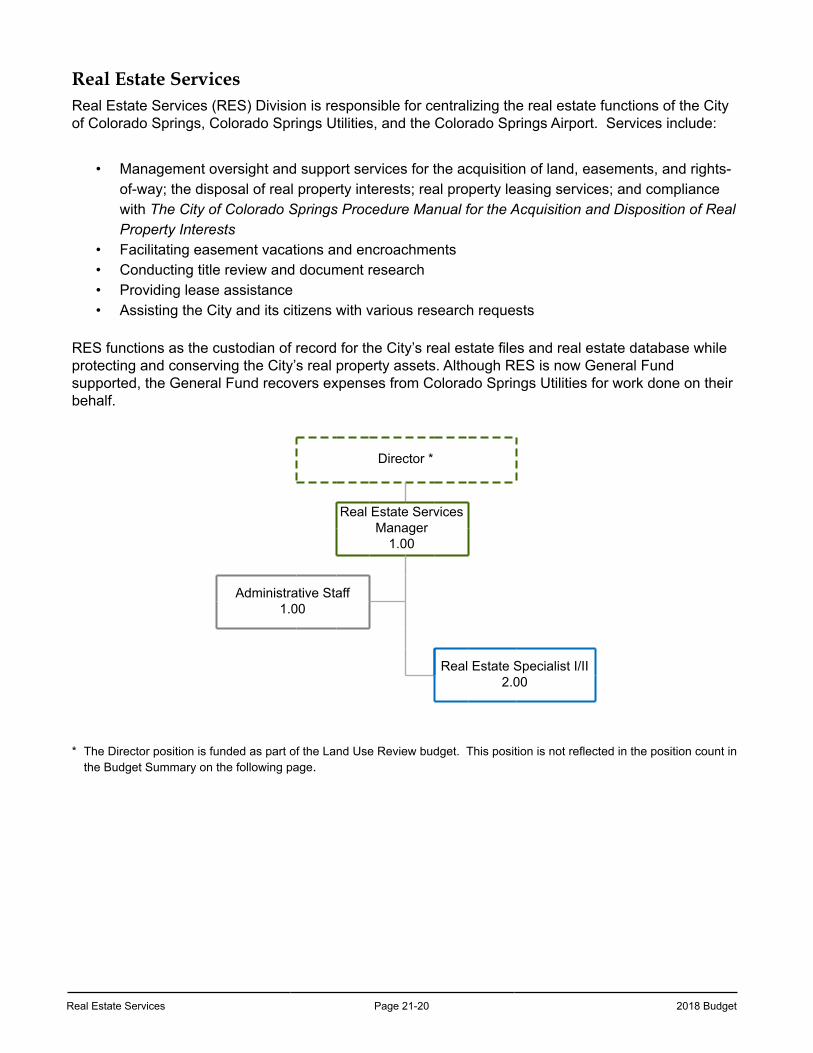
Real Estate Services Page 21-20 2018 Budget
Real Estate ServicesReal Estate Services (RES) Division is responsible for centralizing the real estate functions of the City of Colorado Springs, Colorado Springs Utilities, and the Colorado Springs Airport. Services include:
• Management oversight and support services for the acquisition of land, easements, and rights-of-way; the disposal of real property interests; real property leasing services; and compliance with The City of Colorado Springs Procedure Manual for the Acquisition and Disposition of Real Property Interests
• Facilitating easement vacations and encroachments• Conducting title review and document research• Providing lease assistance• Assisting the City and its citizens with various research requests
RES functions as the custodian of record for the City’s real estate files and real estate database while protecting and conserving the City’s real property assets. Although RES is now General Fund supported, the General Fund recovers expenses from Colorado Springs Utilities for work done on their behalf.
Director *
Real Estate Services Manager
1.00
Administrative Staff 1.00
Real Estate Specialist I/II2.00
* The Director position is funded as part of the Land Use Review budget. This position is not reflected in the position count in the Budget Summary on the following page.
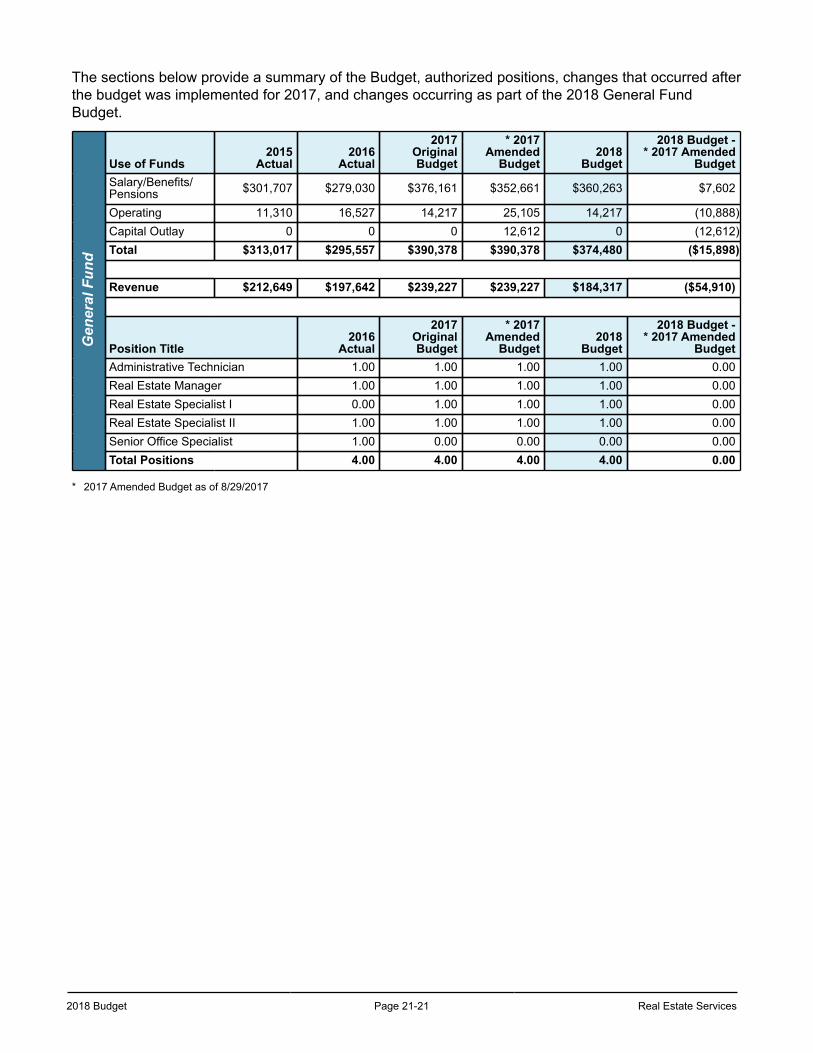
2018 Budget Page 21-21 Real Estate Services
The sections below provide a summary of the Budget, authorized positions, changes that occurred after the budget was implemented for 2017, and changes occurring as part of the 2018 General Fund Budget.
Gen
eral
Fun
d
Use of Funds2015
Actual2016
Actual
2017OriginalBudget
* 2017Amended
Budget2018
Budget
2018 Budget -* 2017 Amended
BudgetSalary/Benefits/Pensions $301,707 $279,030 $376,161 $352,661 $360,263 $7,602
Operating 11,310 16,527 14,217 25,105 14,217 (10,888)Capital Outlay 0 0 0 12,612 0 (12,612)Total $313,017 $295,557 $390,378 $390,378 $374,480 ($15,898)
Revenue $212,649 $197,642 $239,227 $239,227 $184,317 ($54,910)
Position Title2016
Actual
2017OriginalBudget
* 2017Amended
Budget2018
Budget
2018 Budget -* 2017 Amended
BudgetAdministrative Technician 1.00 1.00 1.00 1.00 0.00Real Estate Manager 1.00 1.00 1.00 1.00 0.00Real Estate Specialist I 0.00 1.00 1.00 1.00 0.00Real Estate Specialist II 1.00 1.00 1.00 1.00 0.00Senior Office Specialist 1.00 0.00 0.00 0.00 0.00Total Positions 4.00 4.00 4.00 4.00 0.00
* 2017 Amended Budget as of 8/29/2017
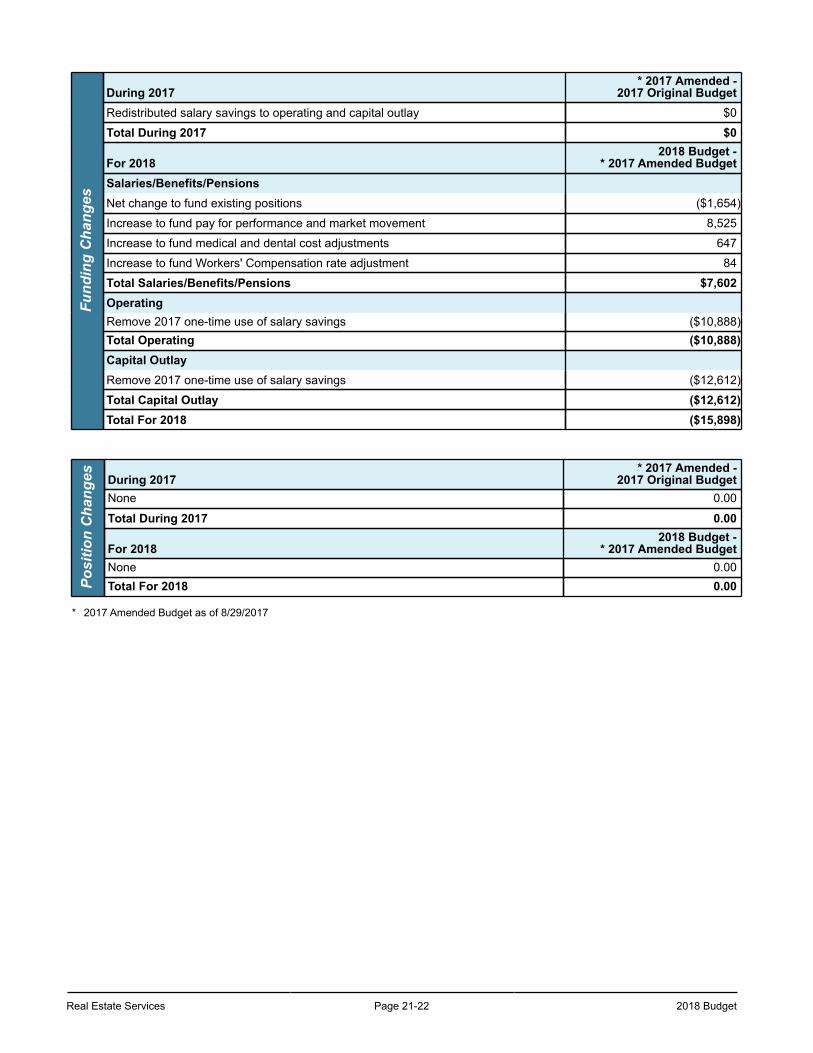
Real Estate Services Page 21-22 2018 Budget
Fund
ing
Cha
nges
During 2017* 2017 Amended -
2017 Original BudgetRedistributed salary savings to operating and capital outlay $0
Total During 2017 $0
For 20182018 Budget -
* 2017 Amended BudgetSalaries/Benefits/PensionsNet change to fund existing positions ($1,654)
Increase to fund pay for performance and market movement 8,525
Increase to fund medical and dental cost adjustments 647
Increase to fund Workers' Compensation rate adjustment 84
Total Salaries/Benefits/Pensions $7,602OperatingRemove 2017 one-time use of salary savings ($10,888)Total Operating ($10,888)Capital OutlayRemove 2017 one-time use of salary savings ($12,612)
Total Capital Outlay ($12,612)Total For 2018 ($15,898)
Posi
tion
Cha
nges During 2017
* 2017 Amended -2017 Original Budget
None 0.00
Total During 2017 0.00
For 20182018 Budget -
* 2017 Amended BudgetNone 0.00Total For 2018 0.00
* 2017 Amended Budget as of 8/29/2017
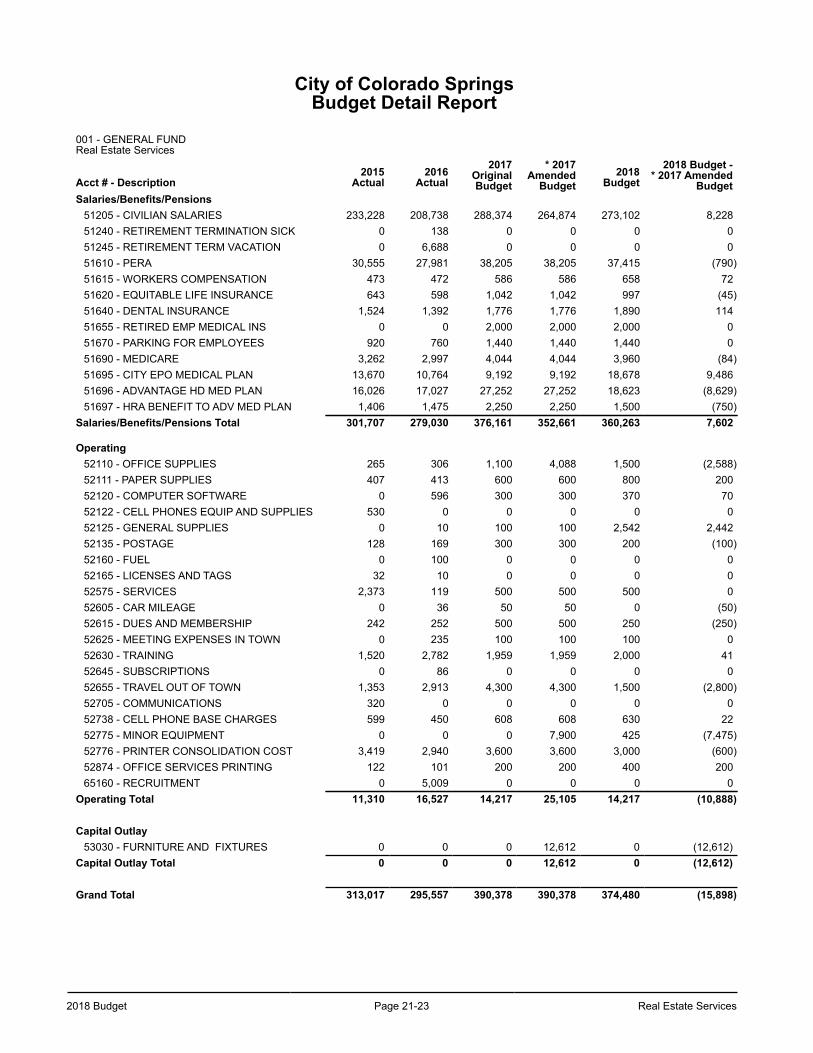
2018 Budget Page 21-23 Real Estate Services
City of Colorado SpringsBudget Detail Report
001 - GENERAL FUND Real Estate Services
Acct # - Description2015
Actual2016
Actual2017
OriginalBudget
* 2017Amended
Budget2018
Budget2018 Budget -
* 2017 AmendedBudget
Salaries/Benefits/Pensions51205 - CIVILIAN SALARIES 233,228 208,738 288,374 264,874 273,102 8,22851240 - RETIREMENT TERMINATION SICK 0 138 0 0 0 051245 - RETIREMENT TERM VACATION 0 6,688 0 0 0 051610 - PERA 30,555 27,981 38,205 38,205 37,415 (790)51615 - WORKERS COMPENSATION 473 472 586 586 658 7251620 - EQUITABLE LIFE INSURANCE 643 598 1,042 1,042 997 (45)51640 - DENTAL INSURANCE 1,524 1,392 1,776 1,776 1,890 11451655 - RETIRED EMP MEDICAL INS 0 0 2,000 2,000 2,000 051670 - PARKING FOR EMPLOYEES 920 760 1,440 1,440 1,440 051690 - MEDICARE 3,262 2,997 4,044 4,044 3,960 (84)51695 - CITY EPO MEDICAL PLAN 13,670 10,764 9,192 9,192 18,678 9,48651696 - ADVANTAGE HD MED PLAN 16,026 17,027 27,252 27,252 18,623 (8,629)51697 - HRA BENEFIT TO ADV MED PLAN 1,406 1,475 2,250 2,250 1,500 (750)
Salaries/Benefits/Pensions Total 301,707 279,030 376,161 352,661 360,263 7,602
Operating52110 - OFFICE SUPPLIES 265 306 1,100 4,088 1,500 (2,588)52111 - PAPER SUPPLIES 407 413 600 600 800 20052120 - COMPUTER SOFTWARE 0 596 300 300 370 7052122 - CELL PHONES EQUIP AND SUPPLIES 530 0 0 0 0 052125 - GENERAL SUPPLIES 0 10 100 100 2,542 2,44252135 - POSTAGE 128 169 300 300 200 (100)52160 - FUEL 0 100 0 0 0 052165 - LICENSES AND TAGS 32 10 0 0 0 052575 - SERVICES 2,373 119 500 500 500 052605 - CAR MILEAGE 0 36 50 50 0 (50)52615 - DUES AND MEMBERSHIP 242 252 500 500 250 (250)52625 - MEETING EXPENSES IN TOWN 0 235 100 100 100 052630 - TRAINING 1,520 2,782 1,959 1,959 2,000 4152645 - SUBSCRIPTIONS 0 86 0 0 0 052655 - TRAVEL OUT OF TOWN 1,353 2,913 4,300 4,300 1,500 (2,800)52705 - COMMUNICATIONS 320 0 0 0 0 052738 - CELL PHONE BASE CHARGES 599 450 608 608 630 2252775 - MINOR EQUIPMENT 0 0 0 7,900 425 (7,475)52776 - PRINTER CONSOLIDATION COST 3,419 2,940 3,600 3,600 3,000 (600)52874 - OFFICE SERVICES PRINTING 122 101 200 200 400 20065160 - RECRUITMENT 0 5,009 0 0 0 0
Operating Total 11,310 16,527 14,217 25,105 14,217 (10,888)
Capital Outlay53030 - FURNITURE AND FIXTURES 0 0 0 12,612 0 (12,612)
Capital Outlay Total 0 0 0 12,612 0 (12,612)
Grand Total 313,017 295,557 390,378 390,378 374,480 (15,898)
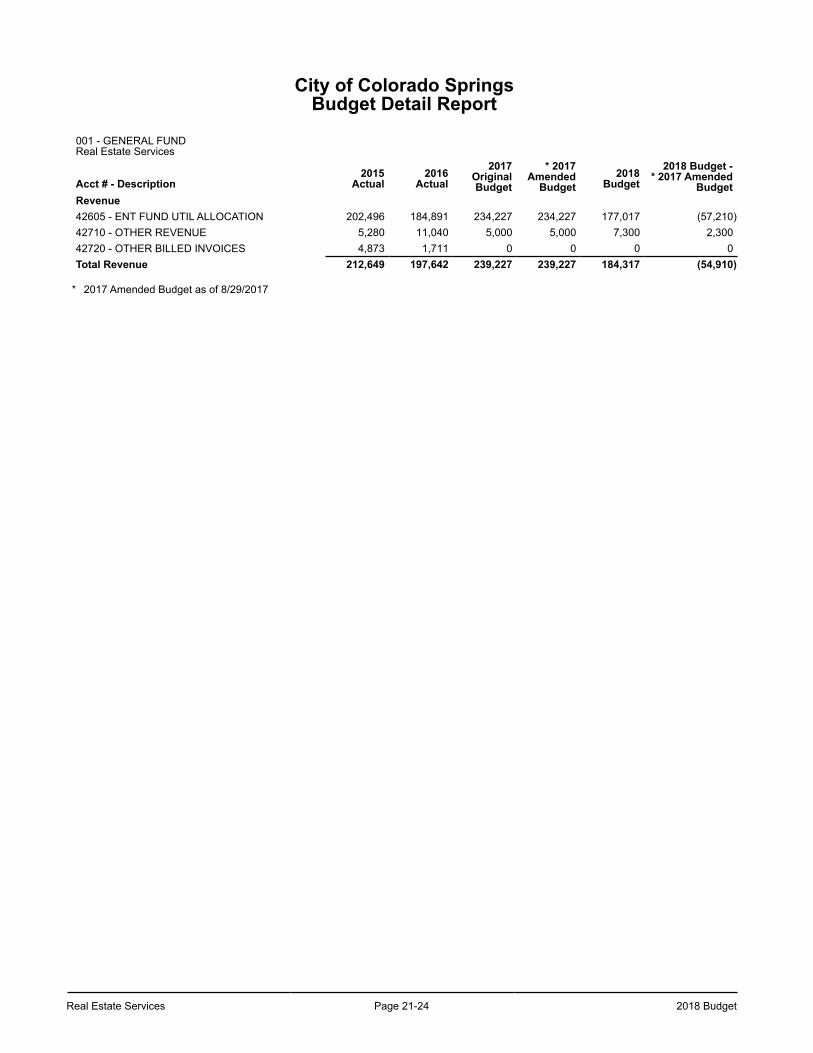
Real Estate Services Page 21-24 2018 Budget
City of Colorado SpringsBudget Detail Report
001 - GENERAL FUND Real Estate Services
Acct # - Description2015
Actual2016
Actual2017
OriginalBudget
* 2017Amended
Budget2018
Budget2018 Budget -
* 2017 AmendedBudget
Revenue42605 - ENT FUND UTIL ALLOCATION 202,496 184,891 234,227 234,227 177,017 (57,210)42710 - OTHER REVENUE 5,280 11,040 5,000 5,000 7,300 2,30042720 - OTHER BILLED INVOICES 4,873 1,711 0 0 0 0Total Revenue 212,649 197,642 239,227 239,227 184,317 (54,910)
* 2017 Amended Budget as of 8/29/2017
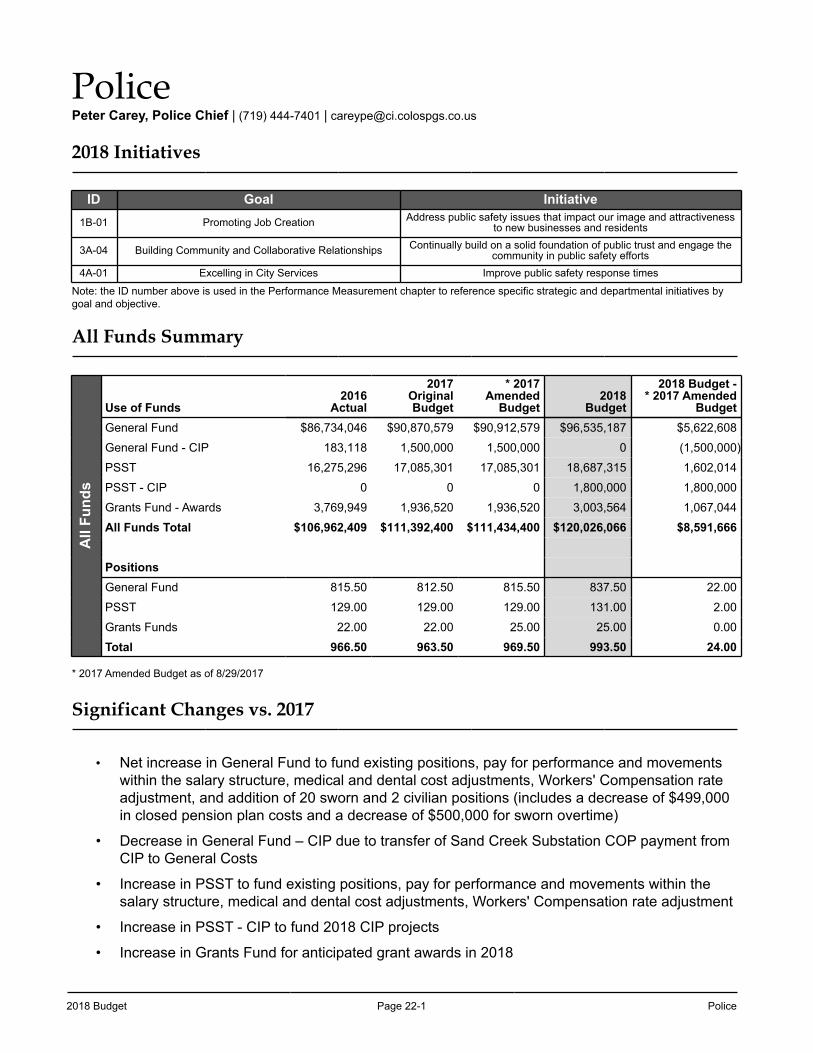
2018 Budget Page 22-1 Police
PolicePeter Carey, Police Chief | (719) 444-7401 | [email protected]
2018 Initiatives
ID Goal Initiative1B-01 Promoting Job Creation Address public safety issues that impact our image and attractiveness
to new businesses and residents
3A-04 Building Community and Collaborative Relationships Continually build on a solid foundation of public trust and engage the community in public safety efforts
4A-01 Excelling in City Services Improve public safety response times
Note: the ID number above is used in the Performance Measurement chapter to reference specific strategic and departmental initiatives by goal and objective.
All Funds Summary
All
Fund
s
Use of Funds2016
Actual
2017OriginalBudget
* 2017Amended
Budget2018
Budget
2018 Budget -* 2017 Amended
BudgetGeneral Fund $86,734,046 $90,870,579 $90,912,579 $96,535,187 $5,622,608
General Fund - CIP 183,118 1,500,000 1,500,000 0 (1,500,000)
PSST 16,275,296 17,085,301 17,085,301 18,687,315 1,602,014
PSST - CIP 0 0 0 1,800,000 1,800,000
Grants Fund - Awards 3,769,949 1,936,520 1,936,520 3,003,564 1,067,044
All Funds Total $106,962,409 $111,392,400 $111,434,400 $120,026,066 $8,591,666
PositionsGeneral Fund 815.50 812.50 815.50 837.50 22.00
PSST 129.00 129.00 129.00 131.00 2.00
Grants Funds 22.00 22.00 25.00 25.00 0.00
Total 966.50 963.50 969.50 993.50 24.00
* 2017 Amended Budget as of 8/29/2017
Significant Changes vs. 2017
• Net increase in General Fund to fund existing positions, pay for performance and movements within the salary structure, medical and dental cost adjustments, Workers' Compensation rate adjustment, and addition of 20 sworn and 2 civilian positions (includes a decrease of $499,000 in closed pension plan costs and a decrease of $500,000 for sworn overtime)
• Decrease in General Fund – CIP due to transfer of Sand Creek Substation COP payment from CIP to General Costs
• Increase in PSST to fund existing positions, pay for performance and movements within the salary structure, medical and dental cost adjustments, Workers' Compensation rate adjustment
• Increase in PSST - CIP to fund 2018 CIP projects
• Increase in Grants Fund for anticipated grant awards in 2018
Police Page 22-2 2018 Budget
Police Department
The Colorado Springs Police Department (CSPD) provides police services in partnership with the community to promote the safety and welfare of our citizens. Police services span a large continuum, from answering citizens’ calls for service to solving crimes and arresting criminals. Police services also include other critical components, such as tactical operations, traffic safety and enforcement, community and media outreach, victim services, crime prevention, and crime lab services.
To achieve this mission, the CSPD collaborates extensively with local, state, and federal partners from the military, multiple communities, and other public sectors. Numerous relationships are essential to gathering community input on police services and engaging the community as partners in solving issues. The Colorado Springs Police Department is comprised of three components: The Office of the Chief of Police, the Patrol Operations Bureau, and the Operations Support Bureau.
The Office of the Chief of Police provides leadership and strategic direction for the Police Department through the development and implementation of the Department’s goals, objectives, policies, and priorities for each assigned service area. Support services for general City functions also reside in the Office of the Chief of Police. Support services include Human Resources, Fiscal Services, and the Volunteer Program administration. The Patrol Operations Bureau consists of the Gold Hill Division, Falcon Division, Sand Creek Division, Stetson Hills Division, and the Communications Center.
Patrol Divisions respond to citizens’ calls for service, conduct criminal investigations, provide traffic and DUI enforcement, investigate traffic crashes, and engage in problem-solving efforts in collaboration with the community. Patrol officers are also involved in providing safety assessments and public awareness presentations. In addition, specially trained, non-sworn Community Service Officers assigned to each patrol division perform a variety of duties that have traditionally been handled by police officers. These duties include, but are not limited to, making face-to-face contact with citizens to prepare certain types of case reports; enforcing parking complaints; addressing abandoned vehicles and traffic hazards; providing traffic control at accident scenes; and, offering car seat safety checks.
The Communications Center is responsible for answering 911 calls as well as non-emergency requests for police, fire or medical within the City of Colorado Springs. Through the knowledge, procedures, and skills of the trained communications personnel, pre-arrival instructions are given to callers while responders are en route. The Center is committed to providing safe, efficient, and effective service delivery in emergency dispatch.
The Operations Support Bureau consists of five divisions.
The Investigations Division investigates violent crimes, including homicides, robberies, sexual assaults, felony assaults, child abuse, felony domestic violence, and felony elder abuse; provides assistance to victims of crimes; investigates financial crimes to include fraud and identity theft; investigates and combats the exploitation of children on the Internet; operates the Metro Crime Lab where DNA analyses and many other tests and evaluations of physical evidence are performed, and provides crime scene investigation.
The Specialized Enforcement Division’s mission is to provide a tactical and/or canine response to volatile situations, security to numerous municipal facilities, traffic enforcement at high accident locations and school zones, investigations of major accidents, parking meter enforcement downtown and in Old Colorado City, and handicap parking enforcement. The Specialized
2018 Budget Page 22-3 Police
Enforcement Division also supports special events throughout the City and provides VIP security services for dignitaries visiting our community.
The Metro Vice, Narcotics and Intelligence Division (MVNI) works to impact the local drug and human trafficking market and its negative effects on our community; performs complex investigations of major drug organizations, money laundering, and the smuggling of drugs throughout the United States; and, acts to eliminate other vice crimes such as prostitution and gambling. The Division is also responsible for enforcement and compliance of laws and regulations affecting marijuana and liquor throughout the 4th Judicial District. MVNI is multi-jurisdictional, with members from the Colorado Springs, Woodland Park and Fountain Police Departments, as well as, the El Paso and Teller County Sheriff’s Offices. MVNI is actively engaged with similar federal and state investigative agencies, allowing for criminal information gathering and sharing, threat analysis and enforcement. In addition, MVNI oversees the Strategic Information Center (STIC), an active collaboration of Crime Analysis and Intelligence, responsible for advancing Intelligence Led Policing within CSPD. This integrated approach is designed to provide enhanced tactical, operational, and strategic intelligence to CSPD personnel and leadership targeted toward the identification and examination of specific targets, threats and problems. The Professional Standards Division is responsible for a number of compliance functions, such as distribution of policies and procedures, accreditation, inspections and internal investigations. This Division is also responsible for Planning, Grants and Research and the Department’s continuous connection to the community through the Media Liaison and Community Relations Unit. Professional Standards is also responsible for the Evidence and Impound units.
The Management Services Division is responsible for the Training Academy which provides training for applicants who have been hired as police officers by CSPD and ongoing training for existing employees. Interface with the City’s Information Technology Division and oversight of CSPD’s multiple technology solutions are also responsibilities of the Management Services Division. In addition, this Division includes the Records and Identification Section; and, the department’s fleet and resource allocation, facilities maintenance, and capital project management.
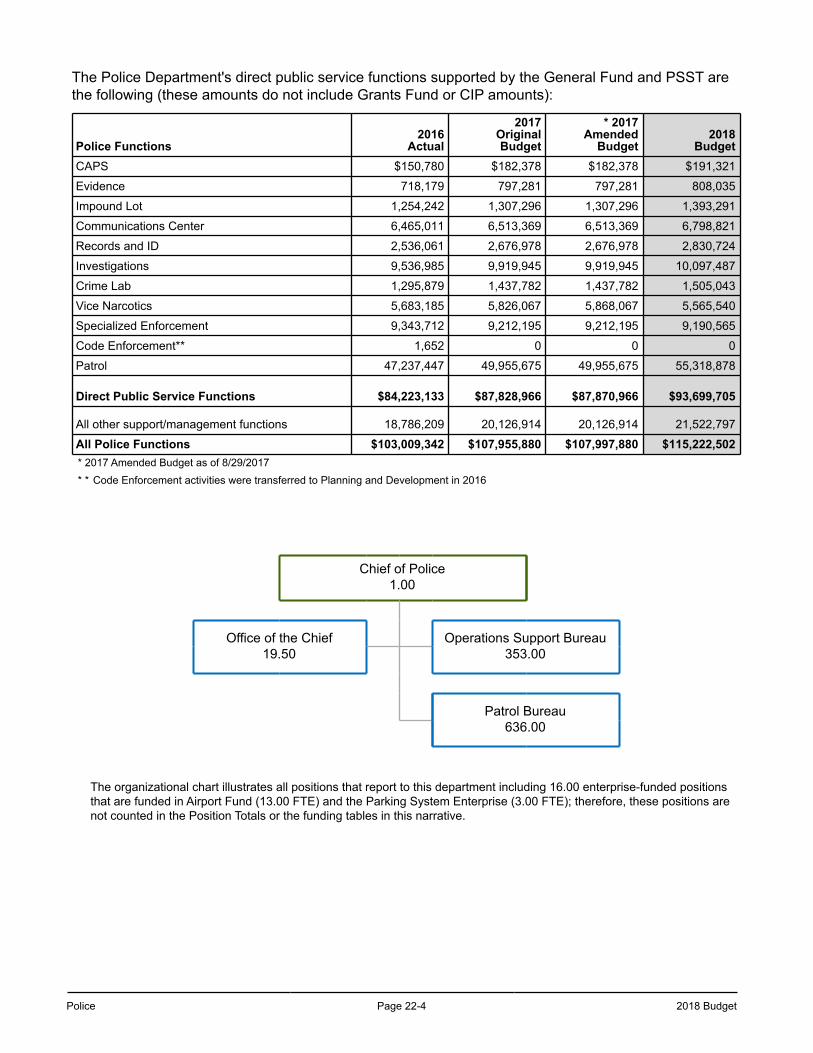
Police Page 22-4 2018 Budget
The Police Department's direct public service functions supported by the General Fund and PSST are the following (these amounts do not include Grants Fund or CIP amounts):
Police Functions2016
Actual
2017OriginalBudget
* 2017Amended
Budget2018
BudgetCAPS $150,780 $182,378 $182,378 $191,321
Evidence 718,179 797,281 797,281 808,035
Impound Lot 1,254,242 1,307,296 1,307,296 1,393,291
Communications Center 6,465,011 6,513,369 6,513,369 6,798,821
Records and ID 2,536,061 2,676,978 2,676,978 2,830,724
Investigations 9,536,985 9,919,945 9,919,945 10,097,487
Crime Lab 1,295,879 1,437,782 1,437,782 1,505,043
Vice Narcotics 5,683,185 5,826,067 5,868,067 5,565,540
Specialized Enforcement 9,343,712 9,212,195 9,212,195 9,190,565
Code Enforcement** 1,652 0 0 0
Patrol 47,237,447 49,955,675 49,955,675 55,318,878
Direct Public Service Functions $84,223,133 $87,828,966 $87,870,966 $93,699,705
All other support/management functions 18,786,209 20,126,914 20,126,914 21,522,797
All Police Functions $103,009,342 $107,955,880 $107,997,880 $115,222,502 * 2017 Amended Budget as of 8/29/2017 * * Code Enforcement activities were transferred to Planning and Development in 2016
Chief of Police1.00
Office of the Chief19.50
Operations Support Bureau353.00
Patrol Bureau636.00
The organizational chart illustrates all positions that report to this department including 16.00 enterprise-funded positions that are funded in Airport Fund (13.00 FTE) and the Parking System Enterprise (3.00 FTE); therefore, these positions are not counted in the Position Totals or the funding tables in this narrative.
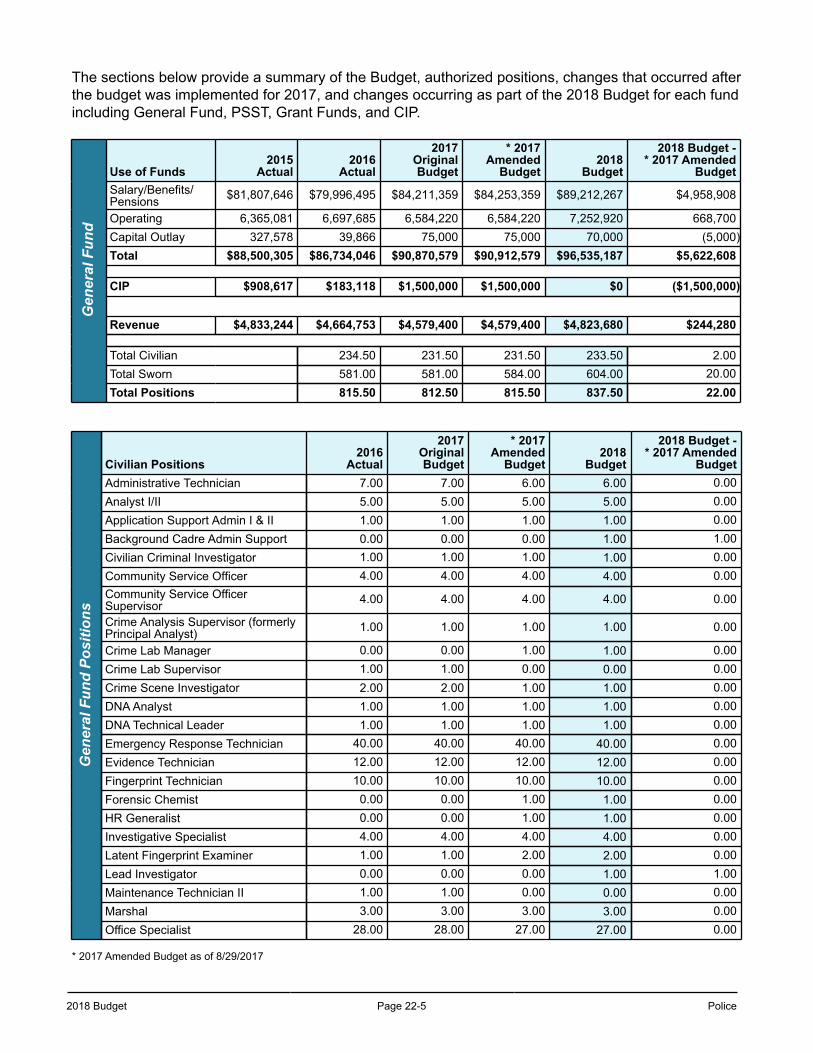
2018 Budget Page 22-5 Police
The sections below provide a summary of the Budget, authorized positions, changes that occurred after the budget was implemented for 2017, and changes occurring as part of the 2018 Budget for each fund including General Fund, PSST, Grant Funds, and CIP.
Gen
eral
Fun
d
Use of Funds2015
Actual2016
Actual
2017OriginalBudget
* 2017Amended
Budget2018
Budget
2018 Budget -* 2017 Amended
BudgetSalary/Benefits/Pensions $81,807,646 $79,996,495 $84,211,359 $84,253,359 $89,212,267 $4,958,908
Operating 6,365,081 6,697,685 6,584,220 6,584,220 7,252,920 668,700Capital Outlay 327,578 39,866 75,000 75,000 70,000 (5,000)Total $88,500,305 $86,734,046 $90,870,579 $90,912,579 $96,535,187 $5,622,608
CIP $908,617 $183,118 $1,500,000 $1,500,000 $0 ($1,500,000)
Revenue $4,833,244 $4,664,753 $4,579,400 $4,579,400 $4,823,680 $244,280
Total Civilian 234.50 231.50 231.50 233.50 2.00Total Sworn 581.00 581.00 584.00 604.00 20.00Total Positions 815.50 812.50 815.50 837.50 22.00
Gen
eral
Fun
d Po
sitio
ns
Civilian Positions2016
Actual
2017OriginalBudget
* 2017Amended
Budget2018
Budget
2018 Budget -* 2017 Amended
BudgetAdministrative Technician 7.00 7.00 6.00 6.00 0.00Analyst I/II 5.00 5.00 5.00 5.00 0.00Application Support Admin I & II 1.00 1.00 1.00 1.00 0.00Background Cadre Admin Support 0.00 0.00 0.00 1.00 1.00Civilian Criminal Investigator 1.00 1.00 1.00 1.00 0.00Community Service Officer 4.00 4.00 4.00 4.00 0.00Community Service OfficerSupervisor 4.00 4.00 4.00 4.00 0.00
Crime Analysis Supervisor (formerlyPrincipal Analyst) 1.00 1.00 1.00 1.00 0.00
Crime Lab Manager 0.00 0.00 1.00 1.00 0.00Crime Lab Supervisor 1.00 1.00 0.00 0.00 0.00Crime Scene Investigator 2.00 2.00 1.00 1.00 0.00DNA Analyst 1.00 1.00 1.00 1.00 0.00DNA Technical Leader 1.00 1.00 1.00 1.00 0.00Emergency Response Technician 40.00 40.00 40.00 40.00 0.00Evidence Technician 12.00 12.00 12.00 12.00 0.00Fingerprint Technician 10.00 10.00 10.00 10.00 0.00Forensic Chemist 0.00 0.00 1.00 1.00 0.00HR Generalist 0.00 0.00 1.00 1.00 0.00Investigative Specialist 4.00 4.00 4.00 4.00 0.00Latent Fingerprint Examiner 1.00 1.00 2.00 2.00 0.00Lead Investigator 0.00 0.00 0.00 1.00 1.00Maintenance Technician II 1.00 1.00 0.00 0.00 0.00Marshal 3.00 3.00 3.00 3.00 0.00Office Specialist 28.00 28.00 27.00 27.00 0.00
* 2017 Amended Budget as of 8/29/2017
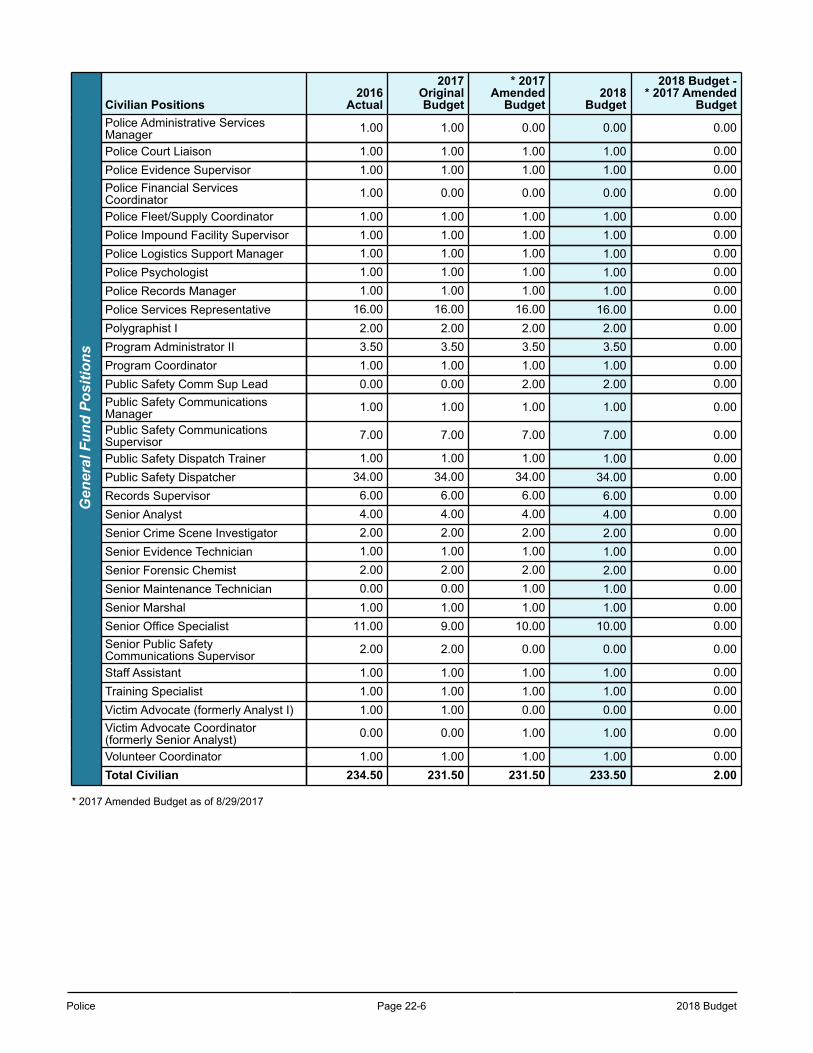
Police Page 22-6 2018 Budget
Gen
eral
Fun
d Po
sitio
nsCivilian Positions
2016Actual
2017OriginalBudget
* 2017Amended
Budget2018
Budget
2018 Budget -* 2017 Amended
BudgetPolice Administrative ServicesManager 1.00 1.00 0.00 0.00 0.00
Police Court Liaison 1.00 1.00 1.00 1.00 0.00Police Evidence Supervisor 1.00 1.00 1.00 1.00 0.00Police Financial ServicesCoordinator 1.00 0.00 0.00 0.00 0.00
Police Fleet/Supply Coordinator 1.00 1.00 1.00 1.00 0.00Police Impound Facility Supervisor 1.00 1.00 1.00 1.00 0.00Police Logistics Support Manager 1.00 1.00 1.00 1.00 0.00Police Psychologist 1.00 1.00 1.00 1.00 0.00Police Records Manager 1.00 1.00 1.00 1.00 0.00Police Services Representative 16.00 16.00 16.00 16.00 0.00Polygraphist I 2.00 2.00 2.00 2.00 0.00Program Administrator II 3.50 3.50 3.50 3.50 0.00Program Coordinator 1.00 1.00 1.00 1.00 0.00Public Safety Comm Sup Lead 0.00 0.00 2.00 2.00 0.00Public Safety CommunicationsManager 1.00 1.00 1.00 1.00 0.00
Public Safety CommunicationsSupervisor 7.00 7.00 7.00 7.00 0.00
Public Safety Dispatch Trainer 1.00 1.00 1.00 1.00 0.00Public Safety Dispatcher 34.00 34.00 34.00 34.00 0.00Records Supervisor 6.00 6.00 6.00 6.00 0.00Senior Analyst 4.00 4.00 4.00 4.00 0.00Senior Crime Scene Investigator 2.00 2.00 2.00 2.00 0.00Senior Evidence Technician 1.00 1.00 1.00 1.00 0.00Senior Forensic Chemist 2.00 2.00 2.00 2.00 0.00Senior Maintenance Technician 0.00 0.00 1.00 1.00 0.00Senior Marshal 1.00 1.00 1.00 1.00 0.00Senior Office Specialist 11.00 9.00 10.00 10.00 0.00Senior Public SafetyCommunications Supervisor 2.00 2.00 0.00 0.00 0.00
Staff Assistant 1.00 1.00 1.00 1.00 0.00Training Specialist 1.00 1.00 1.00 1.00 0.00Victim Advocate (formerly Analyst I) 1.00 1.00 0.00 0.00 0.00Victim Advocate Coordinator(formerly Senior Analyst) 0.00 0.00 1.00 1.00 0.00
Volunteer Coordinator 1.00 1.00 1.00 1.00 0.00Total Civilian 234.50 231.50 231.50 233.50 2.00
* 2017 Amended Budget as of 8/29/2017
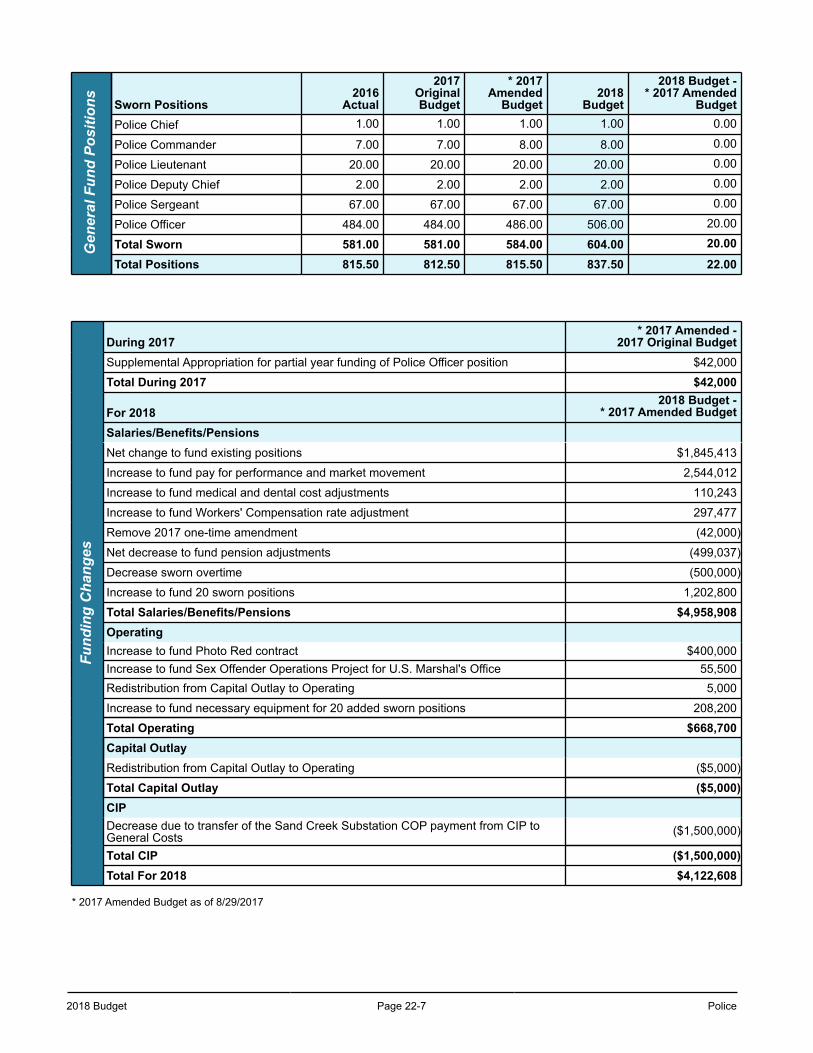
2018 Budget Page 22-7 Police
Gen
eral
Fun
d Po
sitio
ns Sworn Positions2016
Actual
2017OriginalBudget
* 2017Amended
Budget2018
Budget
2018 Budget -* 2017 Amended
BudgetPolice Chief 1.00 1.00 1.00 1.00 0.00
Police Commander 7.00 7.00 8.00 8.00 0.00
Police Lieutenant 20.00 20.00 20.00 20.00 0.00
Police Deputy Chief 2.00 2.00 2.00 2.00 0.00
Police Sergeant 67.00 67.00 67.00 67.00 0.00
Police Officer 484.00 484.00 486.00 506.00 20.00
Total Sworn 581.00 581.00 584.00 604.00 20.00
Total Positions 815.50 812.50 815.50 837.50 22.00
Fund
ing
Cha
nges
During 2017* 2017 Amended -
2017 Original BudgetSupplemental Appropriation for partial year funding of Police Officer position $42,000
Total During 2017 $42,000
For 20182018 Budget -
* 2017 Amended Budget
Salaries/Benefits/PensionsNet change to fund existing positions $1,845,413
Increase to fund pay for performance and market movement 2,544,012
Increase to fund medical and dental cost adjustments 110,243
Increase to fund Workers' Compensation rate adjustment 297,477
Remove 2017 one-time amendment (42,000)
Net decrease to fund pension adjustments (499,037)
Decrease sworn overtime (500,000)
Increase to fund 20 sworn positions 1,202,800
Total Salaries/Benefits/Pensions $4,958,908OperatingIncrease to fund Photo Red contract $400,000Increase to fund Sex Offender Operations Project for U.S. Marshal's Office 55,500Redistribution from Capital Outlay to Operating 5,000
Increase to fund necessary equipment for 20 added sworn positions 208,200
Total Operating $668,700Capital OutlayRedistribution from Capital Outlay to Operating ($5,000)
Total Capital Outlay ($5,000)CIPDecrease due to transfer of the Sand Creek Substation COP payment from CIP toGeneral Costs ($1,500,000)
Total CIP ($1,500,000)Total For 2018 $4,122,608
* 2017 Amended Budget as of 8/29/2017
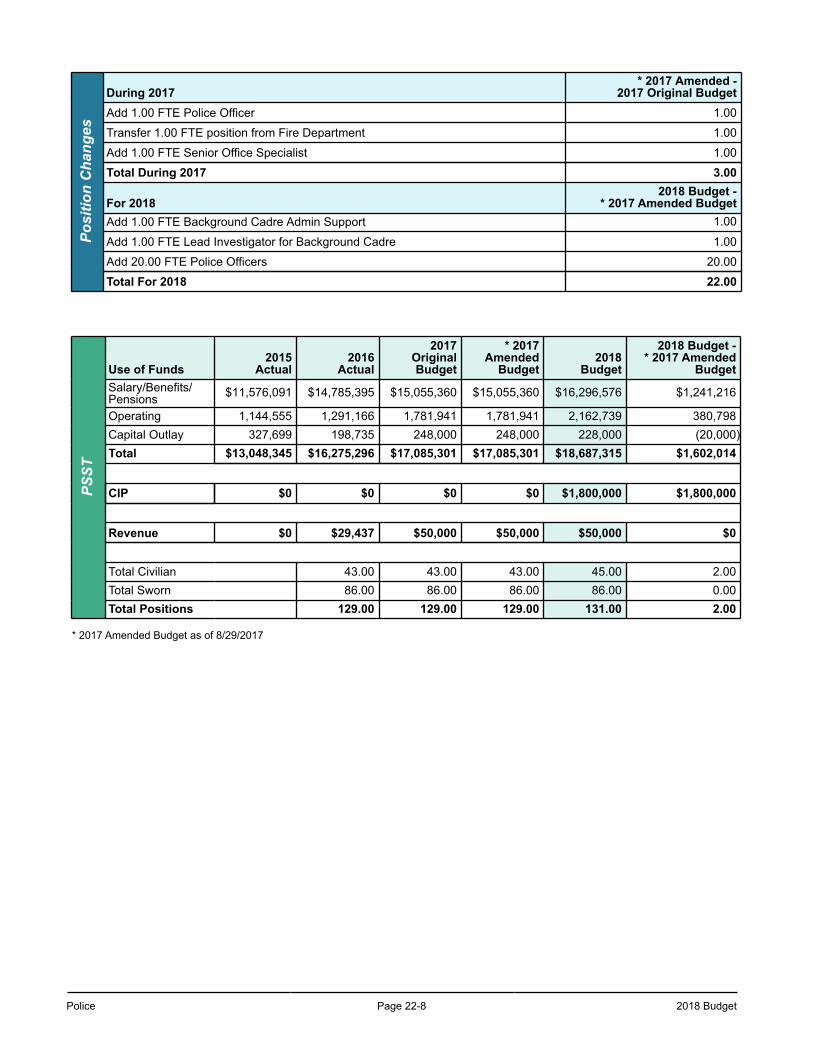
Police Page 22-8 2018 Budget
Posi
tion
Cha
nges
During 2017* 2017 Amended -
2017 Original BudgetAdd 1.00 FTE Police Officer 1.00
Transfer 1.00 FTE position from Fire Department 1.00
Add 1.00 FTE Senior Office Specialist 1.00
Total During 2017 3.00
For 20182018 Budget -
* 2017 Amended BudgetAdd 1.00 FTE Background Cadre Admin Support 1.00
Add 1.00 FTE Lead Investigator for Background Cadre 1.00
Add 20.00 FTE Police Officers 20.00
Total For 2018 22.00
PSST
Use of Funds2015
Actual2016
Actual
2017OriginalBudget
* 2017Amended
Budget2018
Budget
2018 Budget -* 2017 Amended
BudgetSalary/Benefits/Pensions $11,576,091 $14,785,395 $15,055,360 $15,055,360 $16,296,576 $1,241,216
Operating 1,144,555 1,291,166 1,781,941 1,781,941 2,162,739 380,798Capital Outlay 327,699 198,735 248,000 248,000 228,000 (20,000)Total $13,048,345 $16,275,296 $17,085,301 $17,085,301 $18,687,315 $1,602,014
CIP $0 $0 $0 $0 $1,800,000 $1,800,000
Revenue $0 $29,437 $50,000 $50,000 $50,000 $0
Total Civilian 43.00 43.00 43.00 45.00 2.00Total Sworn 86.00 86.00 86.00 86.00 0.00Total Positions 129.00 129.00 129.00 131.00 2.00
* 2017 Amended Budget as of 8/29/2017
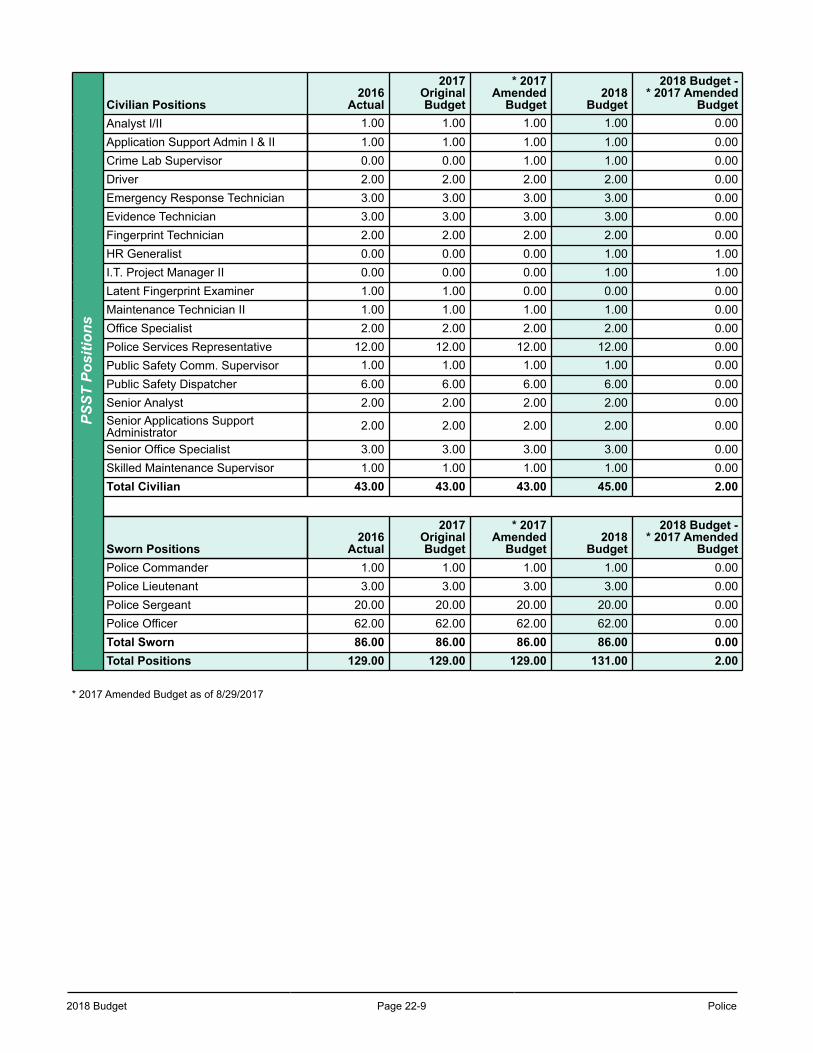
2018 Budget Page 22-9 Police
PSST
Pos
ition
sCivilian Positions
2016Actual
2017OriginalBudget
* 2017Amended
Budget2018
Budget
2018 Budget -* 2017 Amended
BudgetAnalyst I/II 1.00 1.00 1.00 1.00 0.00Application Support Admin I & II 1.00 1.00 1.00 1.00 0.00Crime Lab Supervisor 0.00 0.00 1.00 1.00 0.00Driver 2.00 2.00 2.00 2.00 0.00Emergency Response Technician 3.00 3.00 3.00 3.00 0.00Evidence Technician 3.00 3.00 3.00 3.00 0.00Fingerprint Technician 2.00 2.00 2.00 2.00 0.00HR Generalist 0.00 0.00 0.00 1.00 1.00I.T. Project Manager II 0.00 0.00 0.00 1.00 1.00Latent Fingerprint Examiner 1.00 1.00 0.00 0.00 0.00Maintenance Technician II 1.00 1.00 1.00 1.00 0.00Office Specialist 2.00 2.00 2.00 2.00 0.00Police Services Representative 12.00 12.00 12.00 12.00 0.00Public Safety Comm. Supervisor 1.00 1.00 1.00 1.00 0.00Public Safety Dispatcher 6.00 6.00 6.00 6.00 0.00Senior Analyst 2.00 2.00 2.00 2.00 0.00Senior Applications SupportAdministrator 2.00 2.00 2.00 2.00 0.00
Senior Office Specialist 3.00 3.00 3.00 3.00 0.00Skilled Maintenance Supervisor 1.00 1.00 1.00 1.00 0.00Total Civilian 43.00 43.00 43.00 45.00 2.00
Sworn Positions2016
Actual
2017OriginalBudget
* 2017Amended
Budget2018
Budget
2018 Budget -* 2017 Amended
BudgetPolice Commander 1.00 1.00 1.00 1.00 0.00Police Lieutenant 3.00 3.00 3.00 3.00 0.00Police Sergeant 20.00 20.00 20.00 20.00 0.00Police Officer 62.00 62.00 62.00 62.00 0.00Total Sworn 86.00 86.00 86.00 86.00 0.00Total Positions 129.00 129.00 129.00 131.00 2.00
* 2017 Amended Budget as of 8/29/2017
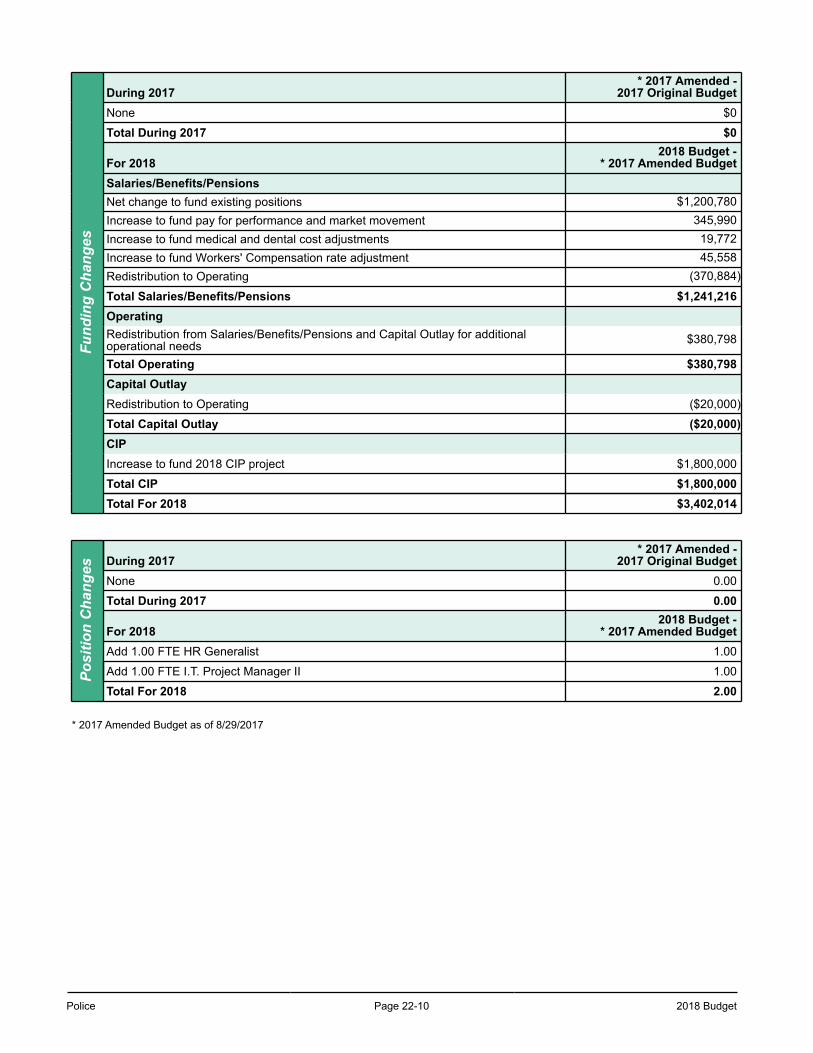
Police Page 22-10 2018 Budget
Fund
ing
Cha
nges
During 2017* 2017 Amended -
2017 Original BudgetNone $0
Total During 2017 $0
For 20182018 Budget -
* 2017 Amended BudgetSalaries/Benefits/PensionsNet change to fund existing positions $1,200,780Increase to fund pay for performance and market movement 345,990Increase to fund medical and dental cost adjustments 19,772Increase to fund Workers' Compensation rate adjustment 45,558Redistribution to Operating (370,884)
Total Salaries/Benefits/Pensions $1,241,216OperatingRedistribution from Salaries/Benefits/Pensions and Capital Outlay for additionaloperational needs $380,798
Total Operating $380,798Capital OutlayRedistribution to Operating ($20,000)
Total Capital Outlay ($20,000)CIPIncrease to fund 2018 CIP project $1,800,000
Total CIP $1,800,000Total For 2018 $3,402,014
Posi
tion
Cha
nges During 2017
* 2017 Amended -2017 Original Budget
None 0.00
Total During 2017 0.00
For 20182018 Budget -
* 2017 Amended BudgetAdd 1.00 FTE HR Generalist 1.00
Add 1.00 FTE I.T. Project Manager II 1.00
Total For 2018 2.00
* 2017 Amended Budget as of 8/29/2017
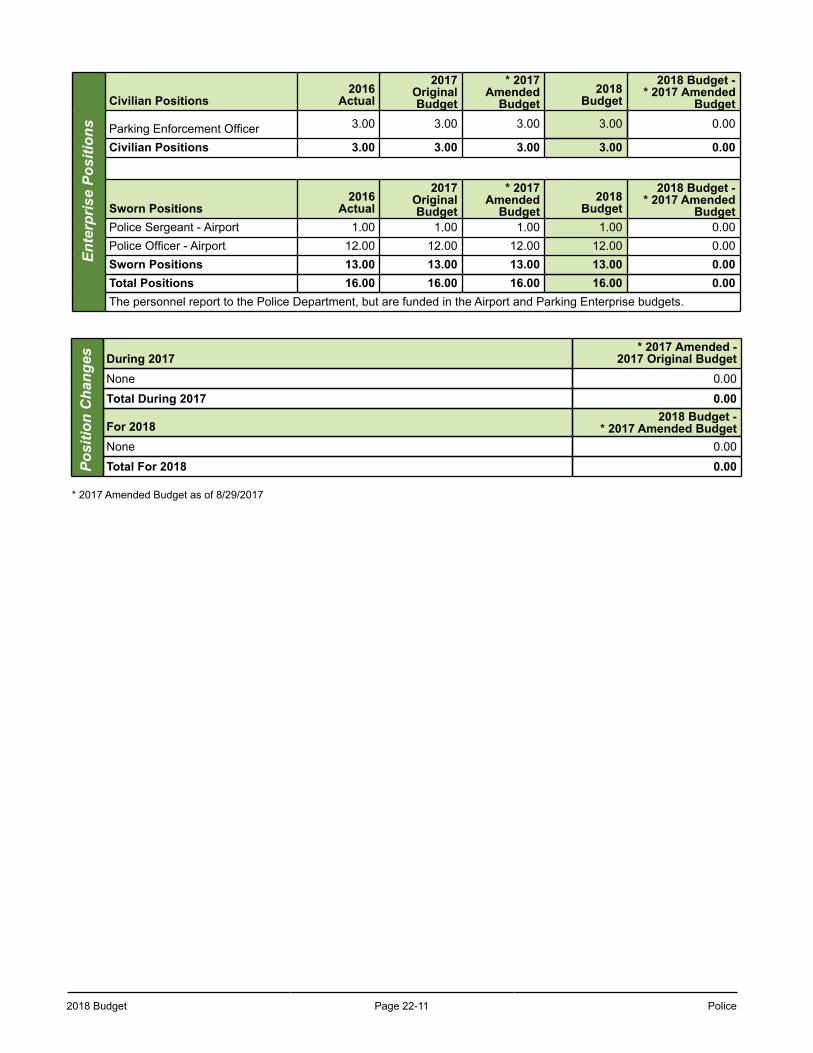
2018 Budget Page 22-11 Police
Ente
rpris
e Po
sitio
nsCivilian Positions
2016Actual
2017OriginalBudget
* 2017Amended
Budget2018
Budget
2018 Budget -* 2017 Amended
Budget
Parking Enforcement Officer 3.00 3.00 3.00 3.00 0.00
Civilian Positions 3.00 3.00 3.00 3.00 0.00
Sworn Positions2016
Actual
2017OriginalBudget
* 2017Amended
Budget2018
Budget
2018 Budget -* 2017 Amended
BudgetPolice Sergeant - Airport 1.00 1.00 1.00 1.00 0.00Police Officer - Airport 12.00 12.00 12.00 12.00 0.00Sworn Positions 13.00 13.00 13.00 13.00 0.00Total Positions 16.00 16.00 16.00 16.00 0.00The personnel report to the Police Department, but are funded in the Airport and Parking Enterprise budgets.
Posi
tion
Cha
nges During 2017
* 2017 Amended -2017 Original Budget
None 0.00
Total During 2017 0.00
For 20182018 Budget -
* 2017 Amended BudgetNone 0.00
Total For 2018 0.00
* 2017 Amended Budget as of 8/29/2017
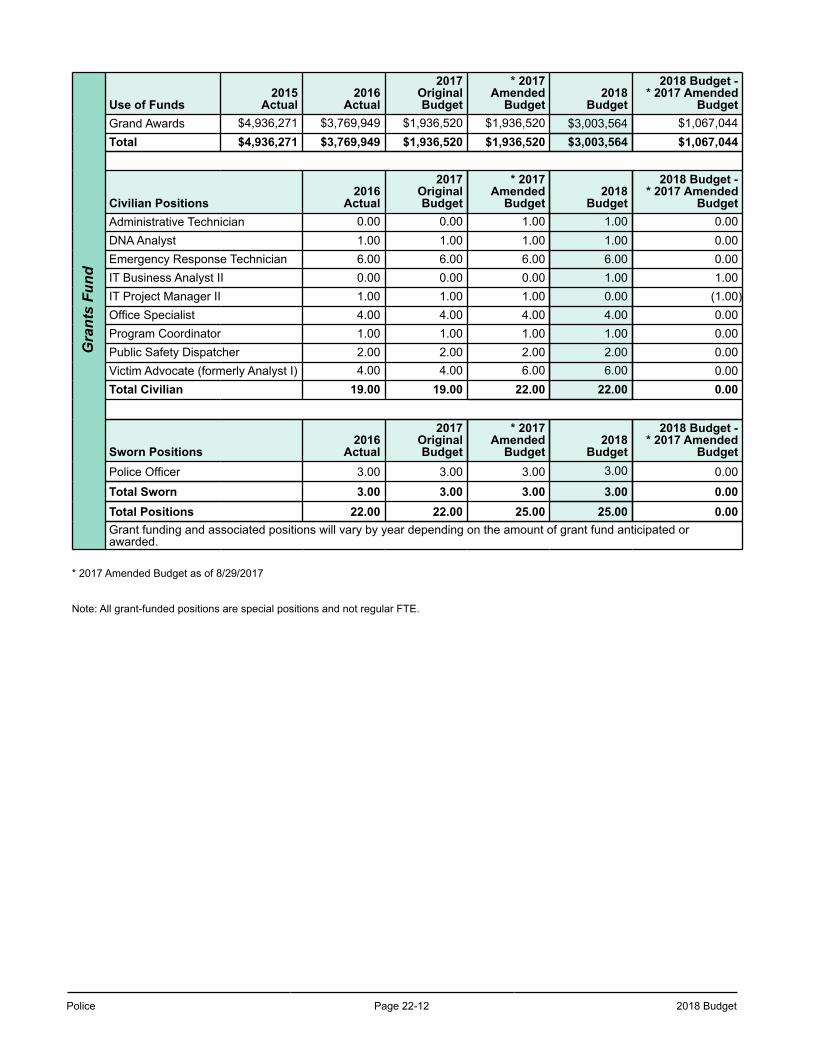
Police Page 22-12 2018 Budget
Gra
nts
Fund
Use of Funds2015
Actual2016
Actual
2017OriginalBudget
* 2017Amended
Budget2018
Budget
2018 Budget -* 2017 Amended
BudgetGrand Awards $4,936,271 $3,769,949 $1,936,520 $1,936,520 $3,003,564 $1,067,044Total $4,936,271 $3,769,949 $1,936,520 $1,936,520 $3,003,564 $1,067,044
Civilian Positions2016
Actual
2017OriginalBudget
* 2017Amended
Budget2018
Budget
2018 Budget -* 2017 Amended
BudgetAdministrative Technician 0.00 0.00 1.00 1.00 0.00DNA Analyst 1.00 1.00 1.00 1.00 0.00Emergency Response Technician 6.00 6.00 6.00 6.00 0.00IT Business Analyst II 0.00 0.00 0.00 1.00 1.00IT Project Manager II 1.00 1.00 1.00 0.00 (1.00)Office Specialist 4.00 4.00 4.00 4.00 0.00Program Coordinator 1.00 1.00 1.00 1.00 0.00Public Safety Dispatcher 2.00 2.00 2.00 2.00 0.00Victim Advocate (formerly Analyst I) 4.00 4.00 6.00 6.00 0.00Total Civilian 19.00 19.00 22.00 22.00 0.00
Sworn Positions2016
Actual
2017OriginalBudget
* 2017Amended
Budget2018
Budget
2018 Budget -* 2017 Amended
BudgetPolice Officer 3.00 3.00 3.00 3.00 0.00
Total Sworn 3.00 3.00 3.00 3.00 0.00Total Positions 22.00 22.00 25.00 25.00 0.00Grant funding and associated positions will vary by year depending on the amount of grant fund anticipated orawarded.
* 2017 Amended Budget as of 8/29/2017
Note: All grant-funded positions are special positions and not regular FTE.
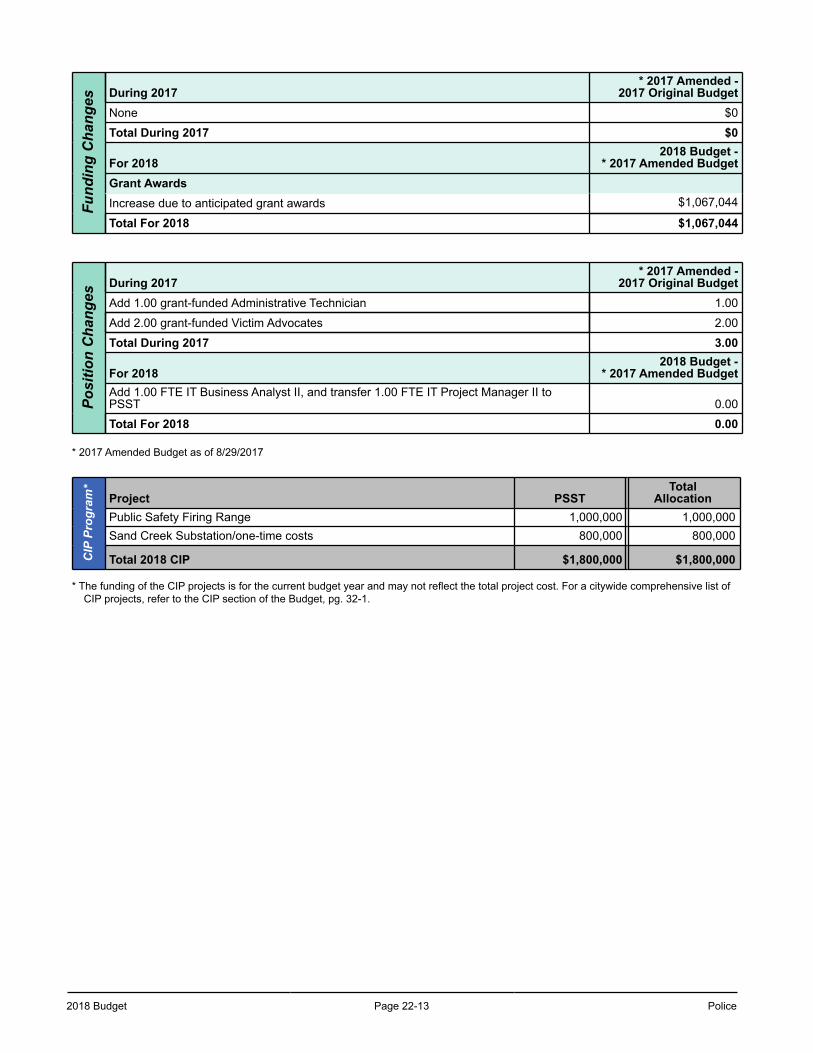
2018 Budget Page 22-13 Police
Fund
ing
Cha
nges During 2017
* 2017 Amended -2017 Original Budget
None $0
Total During 2017 $0
For 20182018 Budget -
* 2017 Amended BudgetGrant AwardsIncrease due to anticipated grant awards $1,067,044
Total For 2018 $1,067,044
Posi
tion
Cha
nges
During 2017* 2017 Amended -
2017 Original BudgetAdd 1.00 grant-funded Administrative Technician 1.00
Add 2.00 grant-funded Victim Advocates 2.00
Total During 2017 3.00
For 20182018 Budget -
* 2017 Amended BudgetAdd 1.00 FTE IT Business Analyst II, and transfer 1.00 FTE IT Project Manager II toPSST 0.00
Total For 2018 0.00
* 2017 Amended Budget as of 8/29/2017
CIP
Pro
gram
*
Project PSSTTotal
AllocationPublic Safety Firing Range 1,000,000 1,000,000Sand Creek Substation/one-time costs 800,000 800,000
Total 2018 CIP $1,800,000 $1,800,000
* The funding of the CIP projects is for the current budget year and may not reflect the total project cost. For a citywide comprehensive list of CIP projects, refer to the CIP section of the Budget, pg. 32-1.
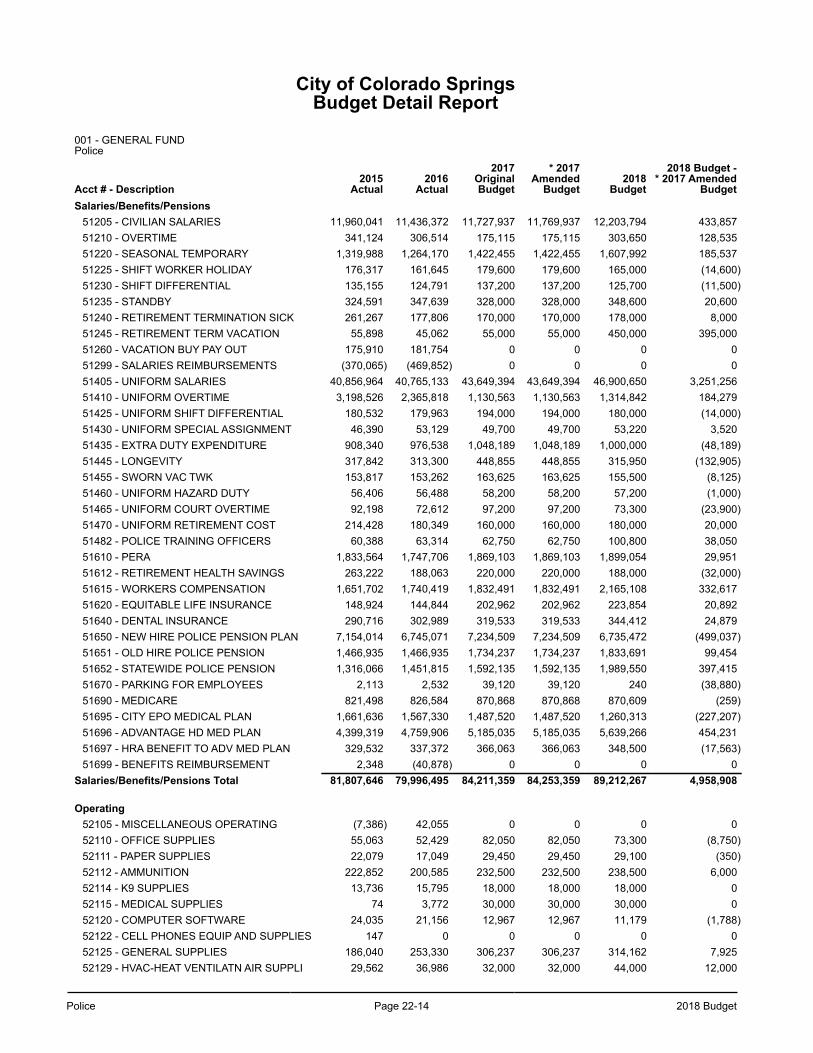
Police Page 22-14 2018 Budget
City of Colorado SpringsBudget Detail Report
001 - GENERAL FUND Police
Acct # - Description2015
Actual2016
Actual
2017OriginalBudget
* 2017Amended
Budget2018
Budget
2018 Budget -* 2017 Amended
BudgetSalaries/Benefits/Pensions
51205 - CIVILIAN SALARIES 11,960,041 11,436,372 11,727,937 11,769,937 12,203,794 433,85751210 - OVERTIME 341,124 306,514 175,115 175,115 303,650 128,53551220 - SEASONAL TEMPORARY 1,319,988 1,264,170 1,422,455 1,422,455 1,607,992 185,53751225 - SHIFT WORKER HOLIDAY 176,317 161,645 179,600 179,600 165,000 (14,600)51230 - SHIFT DIFFERENTIAL 135,155 124,791 137,200 137,200 125,700 (11,500)51235 - STANDBY 324,591 347,639 328,000 328,000 348,600 20,60051240 - RETIREMENT TERMINATION SICK 261,267 177,806 170,000 170,000 178,000 8,00051245 - RETIREMENT TERM VACATION 55,898 45,062 55,000 55,000 450,000 395,00051260 - VACATION BUY PAY OUT 175,910 181,754 0 0 0 051299 - SALARIES REIMBURSEMENTS (370,065) (469,852) 0 0 0 051405 - UNIFORM SALARIES 40,856,964 40,765,133 43,649,394 43,649,394 46,900,650 3,251,25651410 - UNIFORM OVERTIME 3,198,526 2,365,818 1,130,563 1,130,563 1,314,842 184,27951425 - UNIFORM SHIFT DIFFERENTIAL 180,532 179,963 194,000 194,000 180,000 (14,000)51430 - UNIFORM SPECIAL ASSIGNMENT 46,390 53,129 49,700 49,700 53,220 3,52051435 - EXTRA DUTY EXPENDITURE 908,340 976,538 1,048,189 1,048,189 1,000,000 (48,189)51445 - LONGEVITY 317,842 313,300 448,855 448,855 315,950 (132,905)51455 - SWORN VAC TWK 153,817 153,262 163,625 163,625 155,500 (8,125)51460 - UNIFORM HAZARD DUTY 56,406 56,488 58,200 58,200 57,200 (1,000)51465 - UNIFORM COURT OVERTIME 92,198 72,612 97,200 97,200 73,300 (23,900)51470 - UNIFORM RETIREMENT COST 214,428 180,349 160,000 160,000 180,000 20,00051482 - POLICE TRAINING OFFICERS 60,388 63,314 62,750 62,750 100,800 38,05051610 - PERA 1,833,564 1,747,706 1,869,103 1,869,103 1,899,054 29,95151612 - RETIREMENT HEALTH SAVINGS 263,222 188,063 220,000 220,000 188,000 (32,000)51615 - WORKERS COMPENSATION 1,651,702 1,740,419 1,832,491 1,832,491 2,165,108 332,61751620 - EQUITABLE LIFE INSURANCE 148,924 144,844 202,962 202,962 223,854 20,89251640 - DENTAL INSURANCE 290,716 302,989 319,533 319,533 344,412 24,87951650 - NEW HIRE POLICE PENSION PLAN 7,154,014 6,745,071 7,234,509 7,234,509 6,735,472 (499,037)51651 - OLD HIRE POLICE PENSION 1,466,935 1,466,935 1,734,237 1,734,237 1,833,691 99,45451652 - STATEWIDE POLICE PENSION 1,316,066 1,451,815 1,592,135 1,592,135 1,989,550 397,41551670 - PARKING FOR EMPLOYEES 2,113 2,532 39,120 39,120 240 (38,880)51690 - MEDICARE 821,498 826,584 870,868 870,868 870,609 (259)51695 - CITY EPO MEDICAL PLAN 1,661,636 1,567,330 1,487,520 1,487,520 1,260,313 (227,207)51696 - ADVANTAGE HD MED PLAN 4,399,319 4,759,906 5,185,035 5,185,035 5,639,266 454,23151697 - HRA BENEFIT TO ADV MED PLAN 329,532 337,372 366,063 366,063 348,500 (17,563)51699 - BENEFITS REIMBURSEMENT 2,348 (40,878) 0 0 0 0
Salaries/Benefits/Pensions Total 81,807,646 79,996,495 84,211,359 84,253,359 89,212,267 4,958,908
Operating52105 - MISCELLANEOUS OPERATING (7,386) 42,055 0 0 0 052110 - OFFICE SUPPLIES 55,063 52,429 82,050 82,050 73,300 (8,750)52111 - PAPER SUPPLIES 22,079 17,049 29,450 29,450 29,100 (350)52112 - AMMUNITION 222,852 200,585 232,500 232,500 238,500 6,00052114 - K9 SUPPLIES 13,736 15,795 18,000 18,000 18,000 052115 - MEDICAL SUPPLIES 74 3,772 30,000 30,000 30,000 052120 - COMPUTER SOFTWARE 24,035 21,156 12,967 12,967 11,179 (1,788)52122 - CELL PHONES EQUIP AND SUPPLIES 147 0 0 0 0 052125 - GENERAL SUPPLIES 186,040 253,330 306,237 306,237 314,162 7,92552129 - HVAC-HEAT VENTILATN AIR SUPPLI 29,562 36,986 32,000 32,000 44,000 12,000
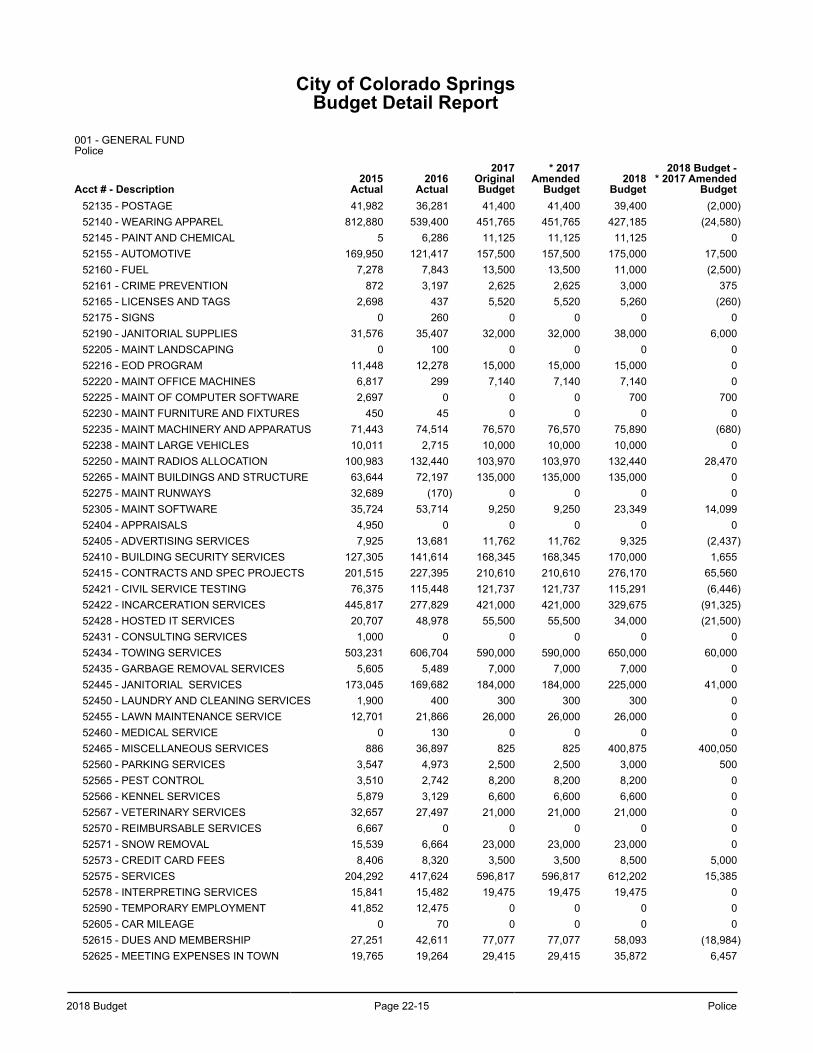
2018 Budget Page 22-15 Police
City of Colorado SpringsBudget Detail Report
001 - GENERAL FUND Police
Acct # - Description2015
Actual2016
Actual
2017OriginalBudget
* 2017Amended
Budget2018
Budget
2018 Budget -* 2017 Amended
Budget52135 - POSTAGE 41,982 36,281 41,400 41,400 39,400 (2,000)52140 - WEARING APPAREL 812,880 539,400 451,765 451,765 427,185 (24,580)52145 - PAINT AND CHEMICAL 5 6,286 11,125 11,125 11,125 052155 - AUTOMOTIVE 169,950 121,417 157,500 157,500 175,000 17,50052160 - FUEL 7,278 7,843 13,500 13,500 11,000 (2,500)52161 - CRIME PREVENTION 872 3,197 2,625 2,625 3,000 37552165 - LICENSES AND TAGS 2,698 437 5,520 5,520 5,260 (260)52175 - SIGNS 0 260 0 0 0 052190 - JANITORIAL SUPPLIES 31,576 35,407 32,000 32,000 38,000 6,00052205 - MAINT LANDSCAPING 0 100 0 0 0 052216 - EOD PROGRAM 11,448 12,278 15,000 15,000 15,000 052220 - MAINT OFFICE MACHINES 6,817 299 7,140 7,140 7,140 052225 - MAINT OF COMPUTER SOFTWARE 2,697 0 0 0 700 70052230 - MAINT FURNITURE AND FIXTURES 450 45 0 0 0 052235 - MAINT MACHINERY AND APPARATUS 71,443 74,514 76,570 76,570 75,890 (680)52238 - MAINT LARGE VEHICLES 10,011 2,715 10,000 10,000 10,000 052250 - MAINT RADIOS ALLOCATION 100,983 132,440 103,970 103,970 132,440 28,47052265 - MAINT BUILDINGS AND STRUCTURE 63,644 72,197 135,000 135,000 135,000 052275 - MAINT RUNWAYS 32,689 (170) 0 0 0 052305 - MAINT SOFTWARE 35,724 53,714 9,250 9,250 23,349 14,09952404 - APPRAISALS 4,950 0 0 0 0 052405 - ADVERTISING SERVICES 7,925 13,681 11,762 11,762 9,325 (2,437)52410 - BUILDING SECURITY SERVICES 127,305 141,614 168,345 168,345 170,000 1,65552415 - CONTRACTS AND SPEC PROJECTS 201,515 227,395 210,610 210,610 276,170 65,56052421 - CIVIL SERVICE TESTING 76,375 115,448 121,737 121,737 115,291 (6,446)52422 - INCARCERATION SERVICES 445,817 277,829 421,000 421,000 329,675 (91,325)52428 - HOSTED IT SERVICES 20,707 48,978 55,500 55,500 34,000 (21,500)52431 - CONSULTING SERVICES 1,000 0 0 0 0 052434 - TOWING SERVICES 503,231 606,704 590,000 590,000 650,000 60,00052435 - GARBAGE REMOVAL SERVICES 5,605 5,489 7,000 7,000 7,000 052445 - JANITORIAL SERVICES 173,045 169,682 184,000 184,000 225,000 41,00052450 - LAUNDRY AND CLEANING SERVICES 1,900 400 300 300 300 052455 - LAWN MAINTENANCE SERVICE 12,701 21,866 26,000 26,000 26,000 052460 - MEDICAL SERVICE 0 130 0 0 0 052465 - MISCELLANEOUS SERVICES 886 36,897 825 825 400,875 400,05052560 - PARKING SERVICES 3,547 4,973 2,500 2,500 3,000 50052565 - PEST CONTROL 3,510 2,742 8,200 8,200 8,200 052566 - KENNEL SERVICES 5,879 3,129 6,600 6,600 6,600 052567 - VETERINARY SERVICES 32,657 27,497 21,000 21,000 21,000 052570 - REIMBURSABLE SERVICES 6,667 0 0 0 0 052571 - SNOW REMOVAL 15,539 6,664 23,000 23,000 23,000 052573 - CREDIT CARD FEES 8,406 8,320 3,500 3,500 8,500 5,00052575 - SERVICES 204,292 417,624 596,817 596,817 612,202 15,38552578 - INTERPRETING SERVICES 15,841 15,482 19,475 19,475 19,475 052590 - TEMPORARY EMPLOYMENT 41,852 12,475 0 0 0 052605 - CAR MILEAGE 0 70 0 0 0 052615 - DUES AND MEMBERSHIP 27,251 42,611 77,077 77,077 58,093 (18,984)52625 - MEETING EXPENSES IN TOWN 19,765 19,264 29,415 29,415 35,872 6,457
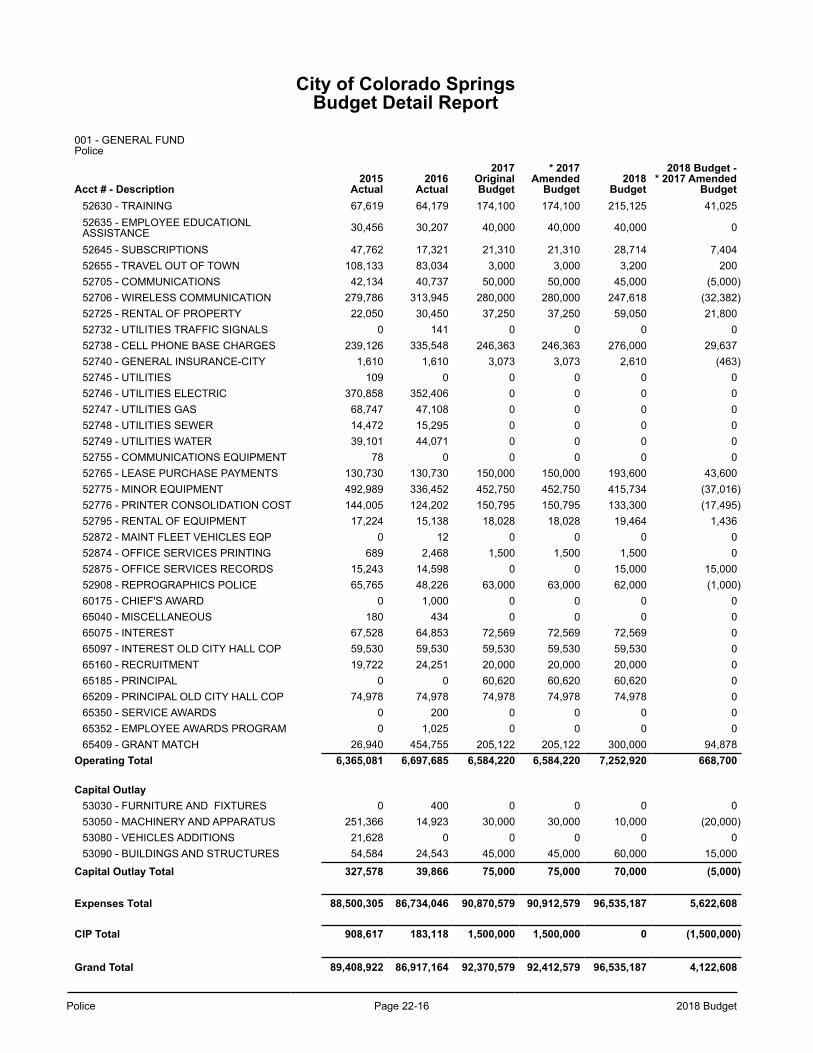
Police Page 22-16 2018 Budget
City of Colorado SpringsBudget Detail Report
001 - GENERAL FUND Police
Acct # - Description2015
Actual2016
Actual
2017OriginalBudget
* 2017Amended
Budget2018
Budget
2018 Budget -* 2017 Amended
Budget52630 - TRAINING 67,619 64,179 174,100 174,100 215,125 41,02552635 - EMPLOYEE EDUCATIONLASSISTANCE 30,456 30,207 40,000 40,000 40,000 0
52645 - SUBSCRIPTIONS 47,762 17,321 21,310 21,310 28,714 7,40452655 - TRAVEL OUT OF TOWN 108,133 83,034 3,000 3,000 3,200 20052705 - COMMUNICATIONS 42,134 40,737 50,000 50,000 45,000 (5,000)52706 - WIRELESS COMMUNICATION 279,786 313,945 280,000 280,000 247,618 (32,382)52725 - RENTAL OF PROPERTY 22,050 30,450 37,250 37,250 59,050 21,80052732 - UTILITIES TRAFFIC SIGNALS 0 141 0 0 0 052738 - CELL PHONE BASE CHARGES 239,126 335,548 246,363 246,363 276,000 29,63752740 - GENERAL INSURANCE-CITY 1,610 1,610 3,073 3,073 2,610 (463)52745 - UTILITIES 109 0 0 0 0 052746 - UTILITIES ELECTRIC 370,858 352,406 0 0 0 052747 - UTILITIES GAS 68,747 47,108 0 0 0 052748 - UTILITIES SEWER 14,472 15,295 0 0 0 052749 - UTILITIES WATER 39,101 44,071 0 0 0 052755 - COMMUNICATIONS EQUIPMENT 78 0 0 0 0 052765 - LEASE PURCHASE PAYMENTS 130,730 130,730 150,000 150,000 193,600 43,60052775 - MINOR EQUIPMENT 492,989 336,452 452,750 452,750 415,734 (37,016)52776 - PRINTER CONSOLIDATION COST 144,005 124,202 150,795 150,795 133,300 (17,495)52795 - RENTAL OF EQUIPMENT 17,224 15,138 18,028 18,028 19,464 1,43652872 - MAINT FLEET VEHICLES EQP 0 12 0 0 0 052874 - OFFICE SERVICES PRINTING 689 2,468 1,500 1,500 1,500 052875 - OFFICE SERVICES RECORDS 15,243 14,598 0 0 15,000 15,00052908 - REPROGRAPHICS POLICE 65,765 48,226 63,000 63,000 62,000 (1,000)60175 - CHIEF'S AWARD 0 1,000 0 0 0 065040 - MISCELLANEOUS 180 434 0 0 0 065075 - INTEREST 67,528 64,853 72,569 72,569 72,569 065097 - INTEREST OLD CITY HALL COP 59,530 59,530 59,530 59,530 59,530 065160 - RECRUITMENT 19,722 24,251 20,000 20,000 20,000 065185 - PRINCIPAL 0 0 60,620 60,620 60,620 065209 - PRINCIPAL OLD CITY HALL COP 74,978 74,978 74,978 74,978 74,978 065350 - SERVICE AWARDS 0 200 0 0 0 065352 - EMPLOYEE AWARDS PROGRAM 0 1,025 0 0 0 065409 - GRANT MATCH 26,940 454,755 205,122 205,122 300,000 94,878
Operating Total 6,365,081 6,697,685 6,584,220 6,584,220 7,252,920 668,700
Capital Outlay53030 - FURNITURE AND FIXTURES 0 400 0 0 0 053050 - MACHINERY AND APPARATUS 251,366 14,923 30,000 30,000 10,000 (20,000)53080 - VEHICLES ADDITIONS 21,628 0 0 0 0 053090 - BUILDINGS AND STRUCTURES 54,584 24,543 45,000 45,000 60,000 15,000
Capital Outlay Total 327,578 39,866 75,000 75,000 70,000 (5,000)
Expenses Total 88,500,305 86,734,046 90,870,579 90,912,579 96,535,187 5,622,608
CIP Total 908,617 183,118 1,500,000 1,500,000 0 (1,500,000)
Grand Total 89,408,922 86,917,164 92,370,579 92,412,579 96,535,187 4,122,608
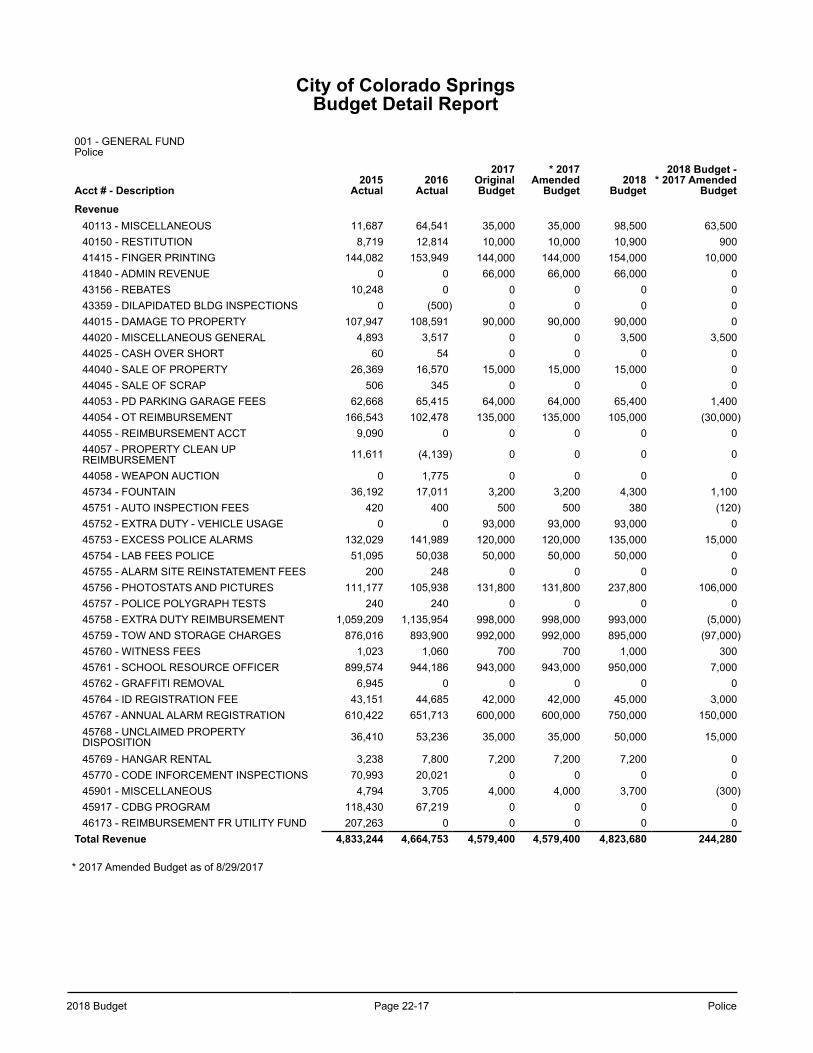
2018 Budget Page 22-17 Police
City of Colorado SpringsBudget Detail Report
001 - GENERAL FUND Police
Acct # - Description2015
Actual2016
Actual
2017OriginalBudget
* 2017Amended
Budget2018
Budget
2018 Budget -* 2017 Amended
Budget
Revenue40113 - MISCELLANEOUS 11,687 64,541 35,000 35,000 98,500 63,50040150 - RESTITUTION 8,719 12,814 10,000 10,000 10,900 90041415 - FINGER PRINTING 144,082 153,949 144,000 144,000 154,000 10,00041840 - ADMIN REVENUE 0 0 66,000 66,000 66,000 043156 - REBATES 10,248 0 0 0 0 043359 - DILAPIDATED BLDG INSPECTIONS 0 (500) 0 0 0 044015 - DAMAGE TO PROPERTY 107,947 108,591 90,000 90,000 90,000 044020 - MISCELLANEOUS GENERAL 4,893 3,517 0 0 3,500 3,50044025 - CASH OVER SHORT 60 54 0 0 0 044040 - SALE OF PROPERTY 26,369 16,570 15,000 15,000 15,000 044045 - SALE OF SCRAP 506 345 0 0 0 044053 - PD PARKING GARAGE FEES 62,668 65,415 64,000 64,000 65,400 1,40044054 - OT REIMBURSEMENT 166,543 102,478 135,000 135,000 105,000 (30,000)44055 - REIMBURSEMENT ACCT 9,090 0 0 0 0 044057 - PROPERTY CLEAN UPREIMBURSEMENT 11,611 (4,139) 0 0 0 0
44058 - WEAPON AUCTION 0 1,775 0 0 0 045734 - FOUNTAIN 36,192 17,011 3,200 3,200 4,300 1,10045751 - AUTO INSPECTION FEES 420 400 500 500 380 (120)45752 - EXTRA DUTY - VEHICLE USAGE 0 0 93,000 93,000 93,000 045753 - EXCESS POLICE ALARMS 132,029 141,989 120,000 120,000 135,000 15,00045754 - LAB FEES POLICE 51,095 50,038 50,000 50,000 50,000 045755 - ALARM SITE REINSTATEMENT FEES 200 248 0 0 0 045756 - PHOTOSTATS AND PICTURES 111,177 105,938 131,800 131,800 237,800 106,00045757 - POLICE POLYGRAPH TESTS 240 240 0 0 0 045758 - EXTRA DUTY REIMBURSEMENT 1,059,209 1,135,954 998,000 998,000 993,000 (5,000)45759 - TOW AND STORAGE CHARGES 876,016 893,900 992,000 992,000 895,000 (97,000)45760 - WITNESS FEES 1,023 1,060 700 700 1,000 30045761 - SCHOOL RESOURCE OFFICER 899,574 944,186 943,000 943,000 950,000 7,00045762 - GRAFFITI REMOVAL 6,945 0 0 0 0 045764 - ID REGISTRATION FEE 43,151 44,685 42,000 42,000 45,000 3,00045767 - ANNUAL ALARM REGISTRATION 610,422 651,713 600,000 600,000 750,000 150,00045768 - UNCLAIMED PROPERTYDISPOSITION 36,410 53,236 35,000 35,000 50,000 15,000
45769 - HANGAR RENTAL 3,238 7,800 7,200 7,200 7,200 045770 - CODE INFORCEMENT INSPECTIONS 70,993 20,021 0 0 0 045901 - MISCELLANEOUS 4,794 3,705 4,000 4,000 3,700 (300)45917 - CDBG PROGRAM 118,430 67,219 0 0 0 046173 - REIMBURSEMENT FR UTILITY FUND 207,263 0 0 0 0 0
Total Revenue 4,833,244 4,664,753 4,579,400 4,579,400 4,823,680 244,280
* 2017 Amended Budget as of 8/29/2017
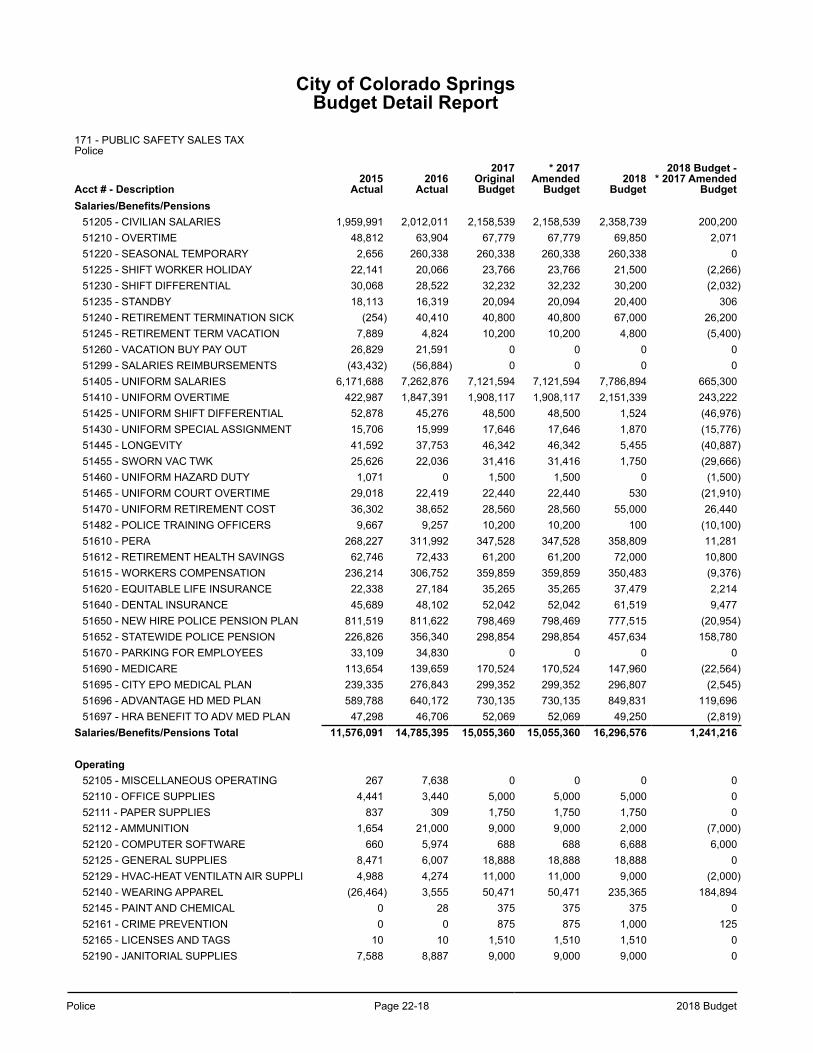
Police Page 22-18 2018 Budget
City of Colorado SpringsBudget Detail Report
171 - PUBLIC SAFETY SALES TAXPolice
Acct # - Description2015
Actual2016
Actual
2017OriginalBudget
* 2017Amended
Budget2018
Budget
2018 Budget -* 2017 Amended
BudgetSalaries/Benefits/Pensions
51205 - CIVILIAN SALARIES 1,959,991 2,012,011 2,158,539 2,158,539 2,358,739 200,20051210 - OVERTIME 48,812 63,904 67,779 67,779 69,850 2,07151220 - SEASONAL TEMPORARY 2,656 260,338 260,338 260,338 260,338 051225 - SHIFT WORKER HOLIDAY 22,141 20,066 23,766 23,766 21,500 (2,266)51230 - SHIFT DIFFERENTIAL 30,068 28,522 32,232 32,232 30,200 (2,032)51235 - STANDBY 18,113 16,319 20,094 20,094 20,400 30651240 - RETIREMENT TERMINATION SICK (254) 40,410 40,800 40,800 67,000 26,20051245 - RETIREMENT TERM VACATION 7,889 4,824 10,200 10,200 4,800 (5,400)51260 - VACATION BUY PAY OUT 26,829 21,591 0 0 0 051299 - SALARIES REIMBURSEMENTS (43,432) (56,884) 0 0 0 051405 - UNIFORM SALARIES 6,171,688 7,262,876 7,121,594 7,121,594 7,786,894 665,30051410 - UNIFORM OVERTIME 422,987 1,847,391 1,908,117 1,908,117 2,151,339 243,22251425 - UNIFORM SHIFT DIFFERENTIAL 52,878 45,276 48,500 48,500 1,524 (46,976)51430 - UNIFORM SPECIAL ASSIGNMENT 15,706 15,999 17,646 17,646 1,870 (15,776)51445 - LONGEVITY 41,592 37,753 46,342 46,342 5,455 (40,887)51455 - SWORN VAC TWK 25,626 22,036 31,416 31,416 1,750 (29,666)51460 - UNIFORM HAZARD DUTY 1,071 0 1,500 1,500 0 (1,500)51465 - UNIFORM COURT OVERTIME 29,018 22,419 22,440 22,440 530 (21,910)51470 - UNIFORM RETIREMENT COST 36,302 38,652 28,560 28,560 55,000 26,44051482 - POLICE TRAINING OFFICERS 9,667 9,257 10,200 10,200 100 (10,100)51610 - PERA 268,227 311,992 347,528 347,528 358,809 11,28151612 - RETIREMENT HEALTH SAVINGS 62,746 72,433 61,200 61,200 72,000 10,80051615 - WORKERS COMPENSATION 236,214 306,752 359,859 359,859 350,483 (9,376)51620 - EQUITABLE LIFE INSURANCE 22,338 27,184 35,265 35,265 37,479 2,21451640 - DENTAL INSURANCE 45,689 48,102 52,042 52,042 61,519 9,47751650 - NEW HIRE POLICE PENSION PLAN 811,519 811,622 798,469 798,469 777,515 (20,954)51652 - STATEWIDE POLICE PENSION 226,826 356,340 298,854 298,854 457,634 158,78051670 - PARKING FOR EMPLOYEES 33,109 34,830 0 0 0 051690 - MEDICARE 113,654 139,659 170,524 170,524 147,960 (22,564)51695 - CITY EPO MEDICAL PLAN 239,335 276,843 299,352 299,352 296,807 (2,545)51696 - ADVANTAGE HD MED PLAN 589,788 640,172 730,135 730,135 849,831 119,69651697 - HRA BENEFIT TO ADV MED PLAN 47,298 46,706 52,069 52,069 49,250 (2,819)
Salaries/Benefits/Pensions Total 11,576,091 14,785,395 15,055,360 15,055,360 16,296,576 1,241,216
Operating52105 - MISCELLANEOUS OPERATING 267 7,638 0 0 0 052110 - OFFICE SUPPLIES 4,441 3,440 5,000 5,000 5,000 052111 - PAPER SUPPLIES 837 309 1,750 1,750 1,750 052112 - AMMUNITION 1,654 21,000 9,000 9,000 2,000 (7,000)52120 - COMPUTER SOFTWARE 660 5,974 688 688 6,688 6,00052125 - GENERAL SUPPLIES 8,471 6,007 18,888 18,888 18,888 052129 - HVAC-HEAT VENTILATN AIR SUPPLI 4,988 4,274 11,000 11,000 9,000 (2,000)52140 - WEARING APPAREL (26,464) 3,555 50,471 50,471 235,365 184,89452145 - PAINT AND CHEMICAL 0 28 375 375 375 052161 - CRIME PREVENTION 0 0 875 875 1,000 12552165 - LICENSES AND TAGS 10 10 1,510 1,510 1,510 052190 - JANITORIAL SUPPLIES 7,588 8,887 9,000 9,000 9,000 0

2018 Budget Page 22-19 Police
City of Colorado SpringsBudget Detail Report
171 - PUBLIC SAFETY SALES TAXPolice
Acct # - Description2015
Actual2016
Actual
2017OriginalBudget
* 2017Amended
Budget2018
Budget
2018 Budget -* 2017 Amended
Budget52105 - MISCELLANEOUS OPERATING 267 7,638 0 0 0 052110 - OFFICE SUPPLIES 4,441 3,440 5,000 5,000 5,000 052111 - PAPER SUPPLIES 837 309 1,750 1,750 1,750 052112 - AMMUNITION 1,654 21,000 9,000 9,000 2,000 (7,000)52120 - COMPUTER SOFTWARE 660 5,974 688 688 6,688 6,00052125 - GENERAL SUPPLIES 8,471 6,007 18,888 18,888 18,888 052129 - HVAC-HEAT VENTILATN AIR SUPPLI 4,988 4,274 11,000 11,000 9,000 (2,000)52140 - WEARING APPAREL (26,464) 3,555 50,471 50,471 235,365 184,89452145 - PAINT AND CHEMICAL 0 28 375 375 375 052161 - CRIME PREVENTION 0 0 875 875 1,000 12552165 - LICENSES AND TAGS 10 10 1,510 1,510 1,510 052190 - JANITORIAL SUPPLIES 7,588 8,887 9,000 9,000 9,000 052220 - MAINT OFFICE MACHINES 0 0 500 500 500 052235 - MAINT MACHINERY AND APPARATUS 29,796 26,889 29,985 29,985 29,985 052250 - MAINT RADIOS ALLOCATION 18,400 19,780 22,790 22,790 19,780 (3,010)52265 - MAINT BUILDINGS AND STRUCTURE 52,310 33,174 62,000 62,000 62,000 052305 - MAINT SOFTWARE 383,601 392,211 337,717 337,717 318,748 (18,969)52410 - BUILDING SECURITY SERVICES 8,899 3,361 13,500 13,500 13,500 052428 - HOSTED IT SERVICES 24,684 89,683 111,850 111,850 152,066 40,21652435 - GARBAGE REMOVAL SERVICES 1,833 1,988 3,000 3,000 3,000 052445 - JANITORIAL SERVICES 52,917 52,733 55,200 55,200 55,200 052450 - LAUNDRY AND CLEANING SERVICES 27 9 0 0 0 052455 - LAWN MAINTENANCE SERVICE 8,698 17,036 12,000 12,000 17,000 5,00052565 - PEST CONTROL 1,746 1,937 4,000 4,000 4,000 052568 - BANK AND INVESTMENT FEES 3,996 4,506 0 0 5,000 5,00052571 - SNOW REMOVAL 11,797 3,719 16,000 16,000 16,000 052575 - SERVICES 28,357 32,299 50,887 50,887 56,750 5,86352578 - INTERPRETING SERVICES 193 376 4,625 4,625 4,625 052590 - TEMPORARY EMPLOYMENT 3,131 42,774 60,000 60,000 60,000 052605 - CAR MILEAGE 0 11 0 0 0 052615 - DUES AND MEMBERSHIP 0 10 188 188 188 052625 - MEETING EXPENSES IN TOWN 52 0 250 250 250 052630 - TRAINING 0 3,969 6,250 6,250 6,250 052645 - SUBSCRIPTIONS 48,941 73,742 50,477 50,477 82,800 32,32352655 - TRAVEL OUT OF TOWN 0 1,346 0 0 0 052705 - COMMUNICATIONS 20,353 19,229 41,000 41,000 25,000 (16,000)52706 - WIRELESS COMMUNICATION 507 676 33,000 33,000 33,000 052725 - RENTAL OF PROPERTY 12,000 12,000 12,000 12,000 12,000 052735 - TELEPHONE LONG DIST CALLS 866 857 1,100 1,100 1,100 052738 - CELL PHONE BASE CHARGES 0 0 30,000 30,000 162,000 132,00052746 - UTILITIES ELECTRIC 80,465 77,138 95,800 95,800 96,421 62152747 - UTILITIES GAS 13,700 8,303 13,700 13,700 10,378 (3,322)52748 - UTILITIES SEWER 4,240 3,764 4,326 4,326 5,293 96752749 - UTILITIES WATER 18,720 17,263 22,000 22,000 22,550 55052765 - LEASE PURCHASE PAYMENTS 21,942 21,942 25,000 25,000 26,400 1,40052775 - MINOR EQUIPMENT 34,839 5,360 294,864 294,864 301,379 6,51552776 - PRINTER CONSOLIDATION COST 13,013 10,124 14,375 14,375 12,000 (2,375)52827 - CHGS POLICE 145,061 121,148 145,000 145,000 145,000 0
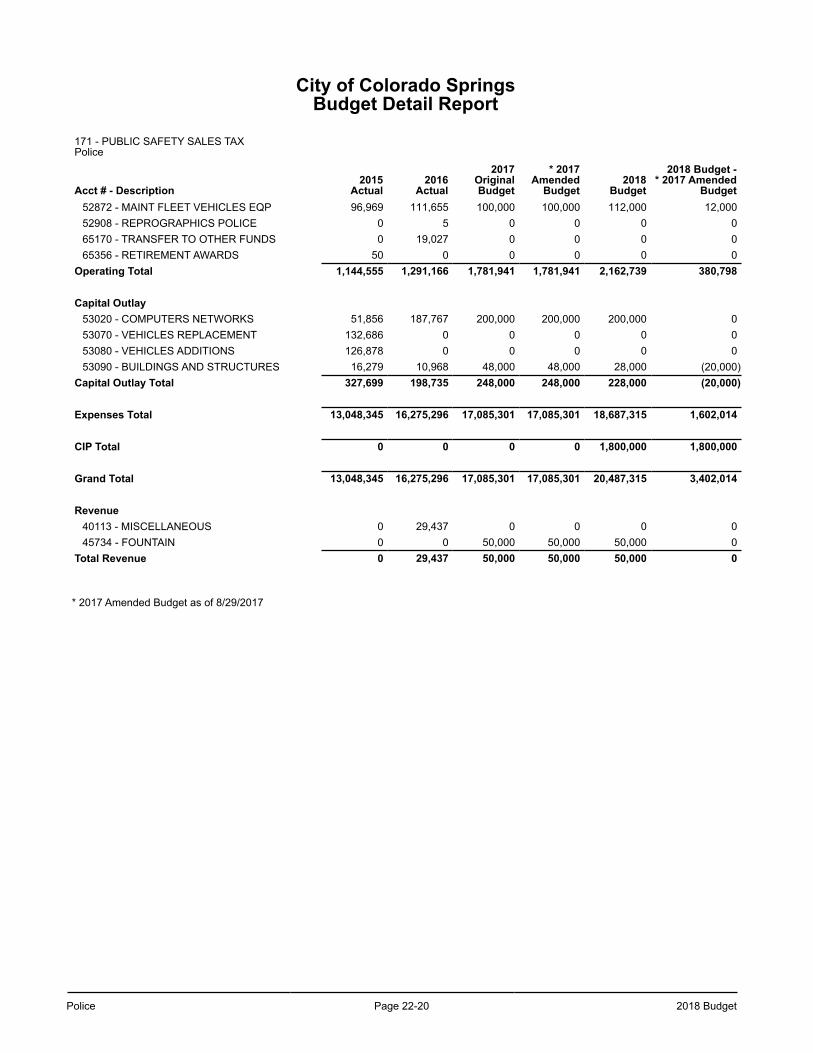
Police Page 22-20 2018 Budget
City of Colorado SpringsBudget Detail Report
171 - PUBLIC SAFETY SALES TAXPolice
Acct # - Description2015
Actual2016
Actual
2017OriginalBudget
* 2017Amended
Budget2018
Budget
2018 Budget -* 2017 Amended
Budget52872 - MAINT FLEET VEHICLES EQP 96,969 111,655 100,000 100,000 112,000 12,00052908 - REPROGRAPHICS POLICE 0 5 0 0 0 065170 - TRANSFER TO OTHER FUNDS 0 19,027 0 0 0 065356 - RETIREMENT AWARDS 50 0 0 0 0 0
Operating Total 1,144,555 1,291,166 1,781,941 1,781,941 2,162,739 380,798
Capital Outlay53020 - COMPUTERS NETWORKS 51,856 187,767 200,000 200,000 200,000 053070 - VEHICLES REPLACEMENT 132,686 0 0 0 0 053080 - VEHICLES ADDITIONS 126,878 0 0 0 0 053090 - BUILDINGS AND STRUCTURES 16,279 10,968 48,000 48,000 28,000 (20,000)
Capital Outlay Total 327,699 198,735 248,000 248,000 228,000 (20,000)
Expenses Total 13,048,345 16,275,296 17,085,301 17,085,301 18,687,315 1,602,014
CIP Total 0 0 0 0 1,800,000 1,800,000
Grand Total 13,048,345 16,275,296 17,085,301 17,085,301 20,487,315 3,402,014
Revenue40113 - MISCELLANEOUS 0 29,437 0 0 0 045734 - FOUNTAIN 0 0 50,000 50,000 50,000 0
Total Revenue 0 29,437 50,000 50,000 50,000 0
* 2017 Amended Budget as of 8/29/2017
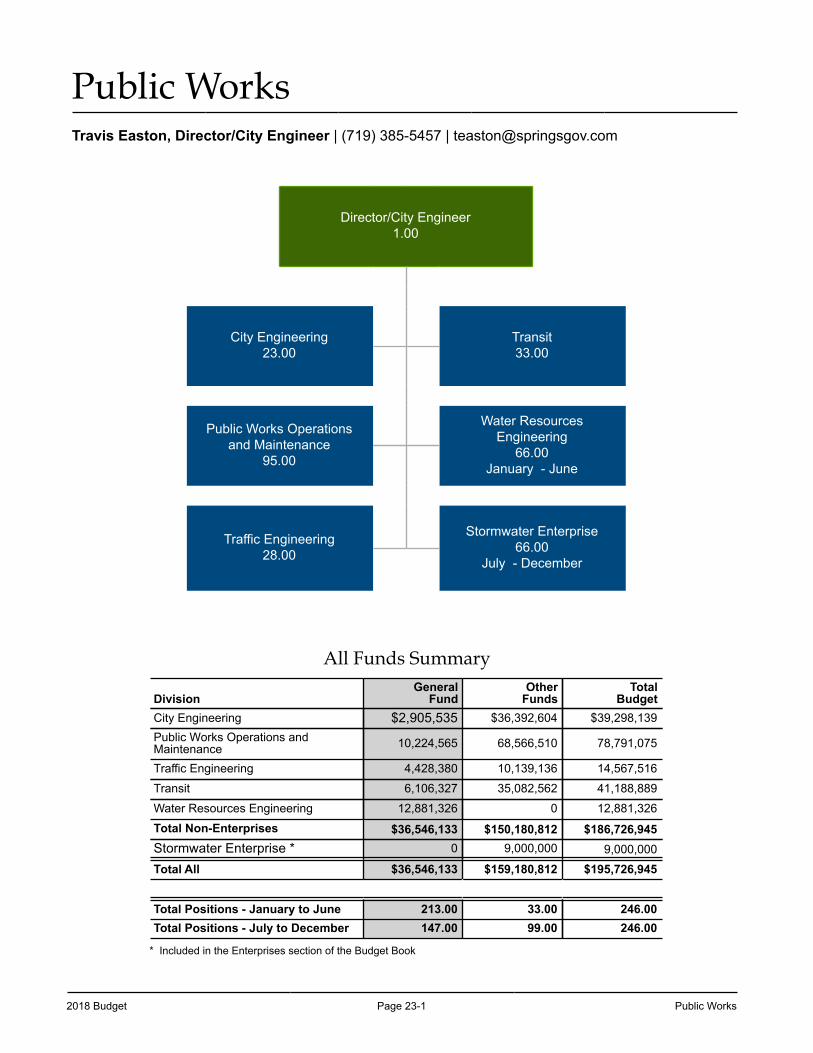
2018 Budget Page 23-1 Public Works
Public WorksTravis Easton, Director/City Engineer | (719) 385-5457 | [email protected]
Director/City Engineer1.00
City Engineering23.00
Transit33.00
Public Works Operationsand Maintenance
95.00
Water ResourcesEngineering
66.00January - June
Traffic Engineering28.00
Stormwater Enterprise66.00
July - December
All Funds Summary
DivisionGeneral
FundOther
FundsTotal
BudgetCity Engineering $2,905,535 $36,392,604 $39,298,139Public Works Operations andMaintenance 10,224,565 68,566,510 78,791,075
Traffic Engineering 4,428,380 10,139,136 14,567,516
Transit 6,106,327 35,082,562 41,188,889
Water Resources Engineering 12,881,326 0 12,881,326
Total Non-Enterprises $36,546,133 $150,180,812 $186,726,945Stormwater Enterprise * 0 9,000,000 9,000,000
Total All $36,546,133 $159,180,812 $195,726,945
Total Positions - January to June 213.00 33.00 246.00Total Positions - July to December 147.00 99.00 246.00
* Included in the Enterprises section of the Budget Book
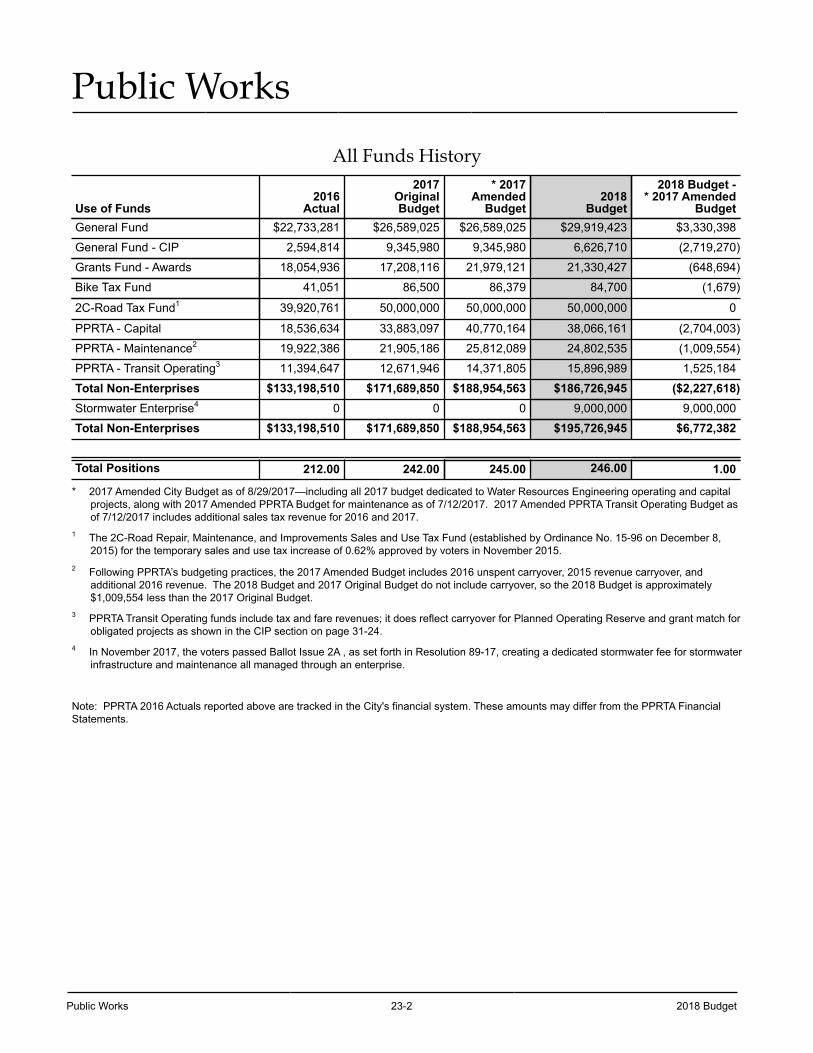
Public Works 23-2 2018 Budget
Public Works
All Funds History
Use of Funds2016
Actual
2017OriginalBudget
* 2017Amended
Budget2018
Budget
2018 Budget -* 2017 Amended
BudgetGeneral Fund $22,733,281 $26,589,025 $26,589,025 $29,919,423 $3,330,398
General Fund - CIP 2,594,814 9,345,980 9,345,980 6,626,710 (2,719,270)
Grants Fund - Awards 18,054,936 17,208,116 21,979,121 21,330,427 (648,694)
Bike Tax Fund 41,051 86,500 86,379 84,700 (1,679)
2C-Road Tax Fund1 39,920,761 50,000,000 50,000,000 50,000,000 0
PPRTA - Capital 18,536,634 33,883,097 40,770,164 38,066,161 (2,704,003)
PPRTA - Maintenance2 19,922,386 21,905,186 25,812,089 24,802,535 (1,009,554)
PPRTA - Transit Operating3 11,394,647 12,671,946 14,371,805 15,896,989 1,525,184
Total Non-Enterprises $133,198,510 $171,689,850 $188,954,563 $186,726,945 ($2,227,618)Stormwater Enterprise4 0 0 0 9,000,000 9,000,000
Total Non-Enterprises $133,198,510 $171,689,850 $188,954,563 $195,726,945 $6,772,382
Total Positions 212.00 242.00 245.00 246.00 1.00
* 2017 Amended City Budget as of 8/29/2017—including all 2017 budget dedicated to Water Resources Engineering operating and capital projects, along with 2017 Amended PPRTA Budget for maintenance as of 7/12/2017. 2017 Amended PPRTA Transit Operating Budget as of 7/12/2017 includes additional sales tax revenue for 2016 and 2017.
1 The 2C-Road Repair, Maintenance, and Improvements Sales and Use Tax Fund (established by Ordinance No. 15-96 on December 8, 2015) for the temporary sales and use tax increase of 0.62% approved by voters in November 2015.
2 Following PPRTA’s budgeting practices, the 2017 Amended Budget includes 2016 unspent carryover, 2015 revenue carryover, and additional 2016 revenue. The 2018 Budget and 2017 Original Budget do not include carryover, so the 2018 Budget is approximately $1,009,554 less than the 2017 Original Budget.
3 PPRTA Transit Operating funds include tax and fare revenues; it does reflect carryover for Planned Operating Reserve and grant match for obligated projects as shown in the CIP section on page 31-24.
4 In November 2017, the voters passed Ballot Issue 2A , as set forth in Resolution 89-17, creating a dedicated stormwater fee for stormwater infrastructure and maintenance all managed through an enterprise.
Note: PPRTA 2016 Actuals reported above are tracked in the City's financial system. These amounts may differ from the PPRTA Financial Statements.
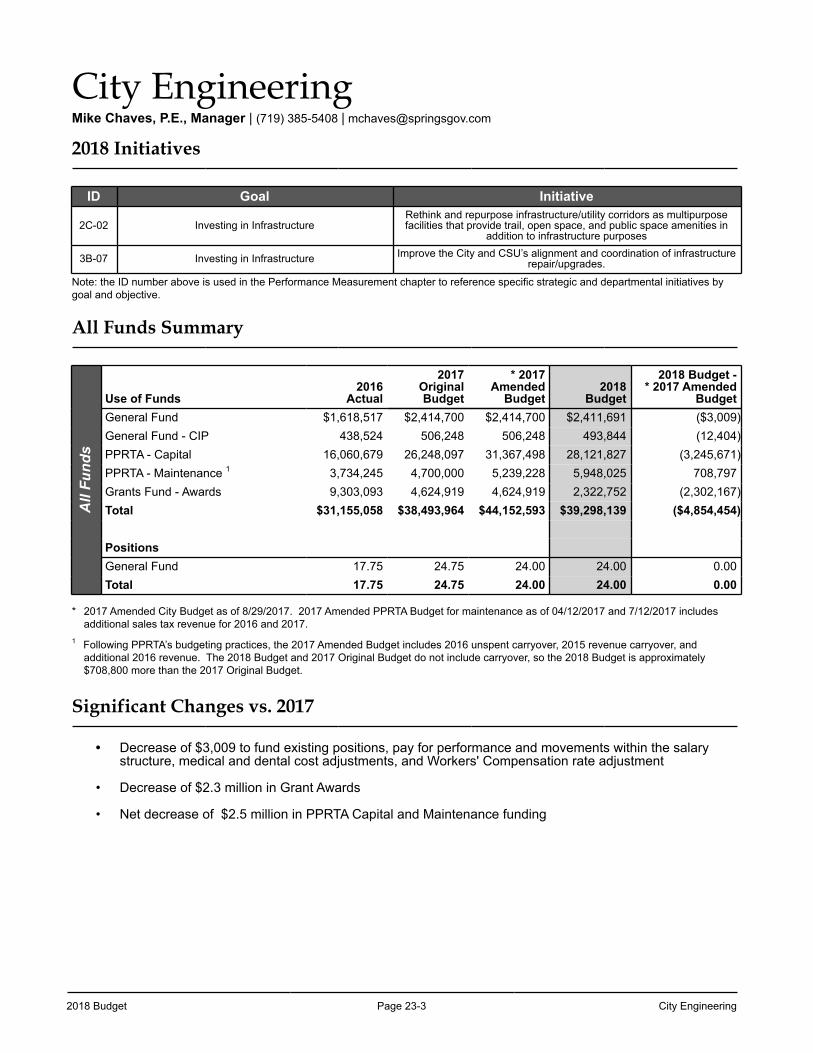
2018 Budget Page 23-3 City Engineering
City EngineeringMike Chaves, P.E., Manager | (719) 385-5408 | [email protected]
2018 Initiatives
ID Goal Initiative
2C-02 Investing in InfrastructureRethink and repurpose infrastructure/utility corridors as multipurpose facilities that provide trail, open space, and public space amenities in
addition to infrastructure purposes
3B-07 Investing in Infrastructure Improve the City and CSU’s alignment and coordination of infrastructurerepair/upgrades.
Note: the ID number above is used in the Performance Measurement chapter to reference specific strategic and departmental initiatives by goal and objective.
All Funds Summary
All
Fund
s
Use of Funds2016
Actual
2017OriginalBudget
* 2017Amended
Budget2018
Budget
2018 Budget -* 2017 Amended
BudgetGeneral Fund $1,618,517 $2,414,700 $2,414,700 $2,411,691 ($3,009)General Fund - CIP 438,524 506,248 506,248 493,844 (12,404)PPRTA - Capital 16,060,679 26,248,097 31,367,498 28,121,827 (3,245,671)PPRTA - Maintenance 1 3,734,245 4,700,000 5,239,228 5,948,025 708,797Grants Fund - Awards 9,303,093 4,624,919 4,624,919 2,322,752 (2,302,167)Total $31,155,058 $38,493,964 $44,152,593 $39,298,139 ($4,854,454)
PositionsGeneral Fund 17.75 24.75 24.00 24.00 0.00Total 17.75 24.75 24.00 24.00 0.00
* 2017 Amended City Budget as of 8/29/2017. 2017 Amended PPRTA Budget for maintenance as of 04/12/2017 and 7/12/2017 includes additional sales tax revenue for 2016 and 2017.
1 Following PPRTA’s budgeting practices, the 2017 Amended Budget includes 2016 unspent carryover, 2015 revenue carryover, and additional 2016 revenue. The 2018 Budget and 2017 Original Budget do not include carryover, so the 2018 Budget is approximately $708,800 more than the 2017 Original Budget.
Significant Changes vs. 2017
• Decrease of $3,009 to fund existing positions, pay for performance and movements within the salary structure, medical and dental cost adjustments, and Workers' Compensation rate adjustment
• Decrease of $2.3 million in Grant Awards
• Net decrease of $2.5 million in PPRTA Capital and Maintenance funding
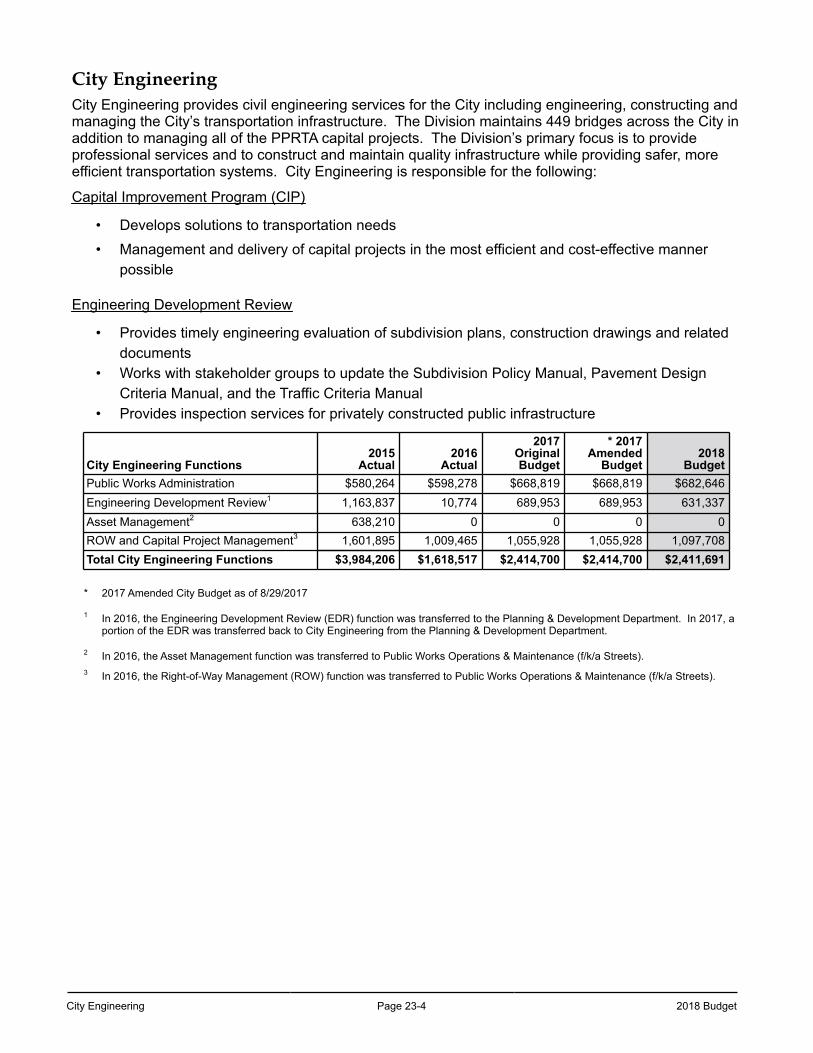
City Engineering Page 23-4 2018 Budget
City EngineeringCity Engineering provides civil engineering services for the City including engineering, constructing and managing the City’s transportation infrastructure. The Division maintains 449 bridges across the City in addition to managing all of the PPRTA capital projects. The Division’s primary focus is to provide professional services and to construct and maintain quality infrastructure while providing safer, more efficient transportation systems. City Engineering is responsible for the following:
Capital Improvement Program (CIP)
• Develops solutions to transportation needs • Management and delivery of capital projects in the most efficient and cost-effective manner
possible
Engineering Development Review
• Provides timely engineering evaluation of subdivision plans, construction drawings and related documents
• Works with stakeholder groups to update the Subdivision Policy Manual, Pavement Design Criteria Manual, and the Traffic Criteria Manual
• Provides inspection services for privately constructed public infrastructure
City Engineering Functions2015
Actual2016
Actual
2017OriginalBudget
* 2017Amended
Budget2018
BudgetPublic Works Administration $580,264 $598,278 $668,819 $668,819 $682,646Engineering Development Review1 1,163,837 10,774 689,953 689,953 631,337Asset Management2 638,210 0 0 0 0ROW and Capital Project Management3 1,601,895 1,009,465 1,055,928 1,055,928 1,097,708Total City Engineering Functions $3,984,206 $1,618,517 $2,414,700 $2,414,700 $2,411,691
* 2017 Amended City Budget as of 8/29/2017
1 In 2016, the Engineering Development Review (EDR) function was transferred to the Planning & Development Department. In 2017, a portion of the EDR was transferred back to City Engineering from the Planning & Development Department.
2 In 2016, the Asset Management function was transferred to Public Works Operations & Maintenance (f/k/a Streets).3 In 2016, the Right-of-Way Management (ROW) function was transferred to Public Works Operations & Maintenance (f/k/a Streets).
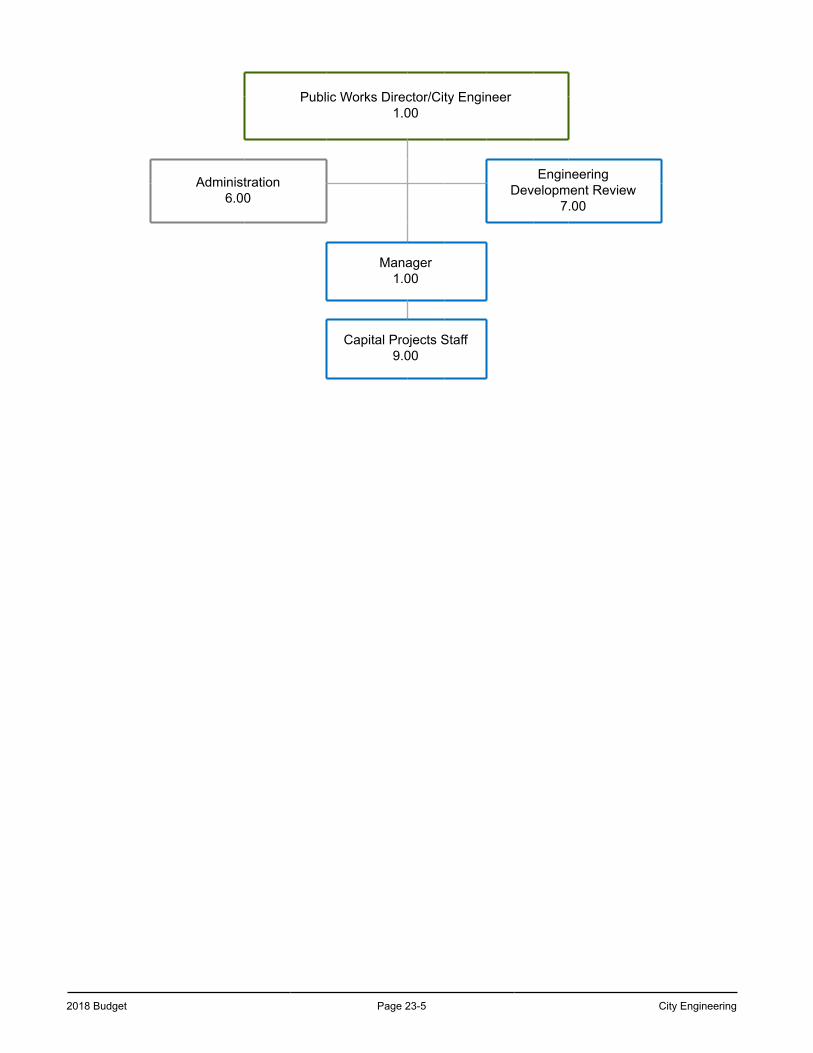
2018 Budget Page 23-5 City Engineering
Public Works Director/City Engineer1.00
Administration6.00
Engineering Development Review
7.00
Manager1.00
Capital Projects Staff9.00
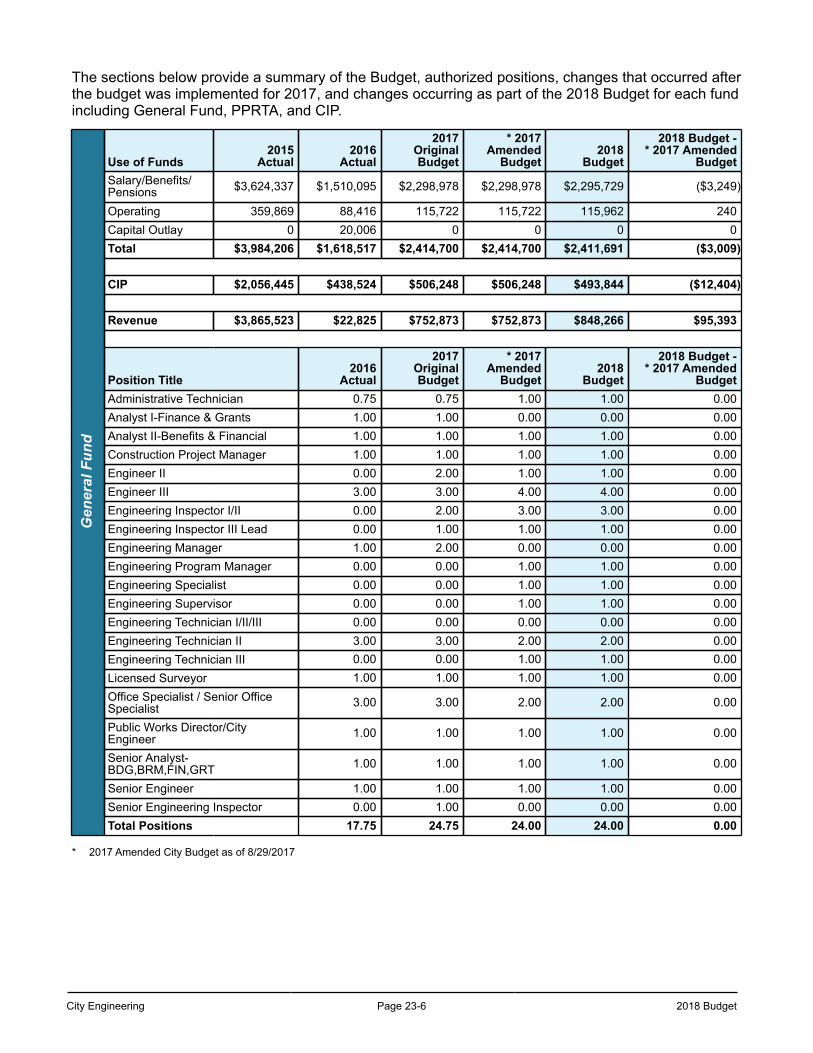
City Engineering Page 23-6 2018 Budget
The sections below provide a summary of the Budget, authorized positions, changes that occurred after the budget was implemented for 2017, and changes occurring as part of the 2018 Budget for each fund including General Fund, PPRTA, and CIP.
Gen
eral
Fun
d
Use of Funds2015
Actual2016
Actual
2017OriginalBudget
* 2017Amended
Budget2018
Budget
2018 Budget -* 2017 Amended
BudgetSalary/Benefits/Pensions $3,624,337 $1,510,095 $2,298,978 $2,298,978 $2,295,729 ($3,249)
Operating 359,869 88,416 115,722 115,722 115,962 240Capital Outlay 0 20,006 0 0 0 0Total $3,984,206 $1,618,517 $2,414,700 $2,414,700 $2,411,691 ($3,009)
CIP $2,056,445 $438,524 $506,248 $506,248 $493,844 ($12,404)
Revenue $3,865,523 $22,825 $752,873 $752,873 $848,266 $95,393
Position Title2016
Actual
2017OriginalBudget
* 2017Amended
Budget2018
Budget
2018 Budget -* 2017 Amended
BudgetAdministrative Technician 0.75 0.75 1.00 1.00 0.00Analyst I-Finance & Grants 1.00 1.00 0.00 0.00 0.00Analyst II-Benefits & Financial 1.00 1.00 1.00 1.00 0.00Construction Project Manager 1.00 1.00 1.00 1.00 0.00Engineer II 0.00 2.00 1.00 1.00 0.00Engineer III 3.00 3.00 4.00 4.00 0.00Engineering Inspector I/II 0.00 2.00 3.00 3.00 0.00Engineering Inspector III Lead 0.00 1.00 1.00 1.00 0.00Engineering Manager 1.00 2.00 0.00 0.00 0.00Engineering Program Manager 0.00 0.00 1.00 1.00 0.00Engineering Specialist 0.00 0.00 1.00 1.00 0.00Engineering Supervisor 0.00 0.00 1.00 1.00 0.00Engineering Technician I/II/III 0.00 0.00 0.00 0.00 0.00Engineering Technician II 3.00 3.00 2.00 2.00 0.00Engineering Technician III 0.00 0.00 1.00 1.00 0.00Licensed Surveyor 1.00 1.00 1.00 1.00 0.00Office Specialist / Senior OfficeSpecialist 3.00 3.00 2.00 2.00 0.00
Public Works Director/CityEngineer 1.00 1.00 1.00 1.00 0.00
Senior Analyst-BDG,BRM,FIN,GRT 1.00 1.00 1.00 1.00 0.00
Senior Engineer 1.00 1.00 1.00 1.00 0.00Senior Engineering Inspector 0.00 1.00 0.00 0.00 0.00Total Positions 17.75 24.75 24.00 24.00 0.00
* 2017 Amended City Budget as of 8/29/2017
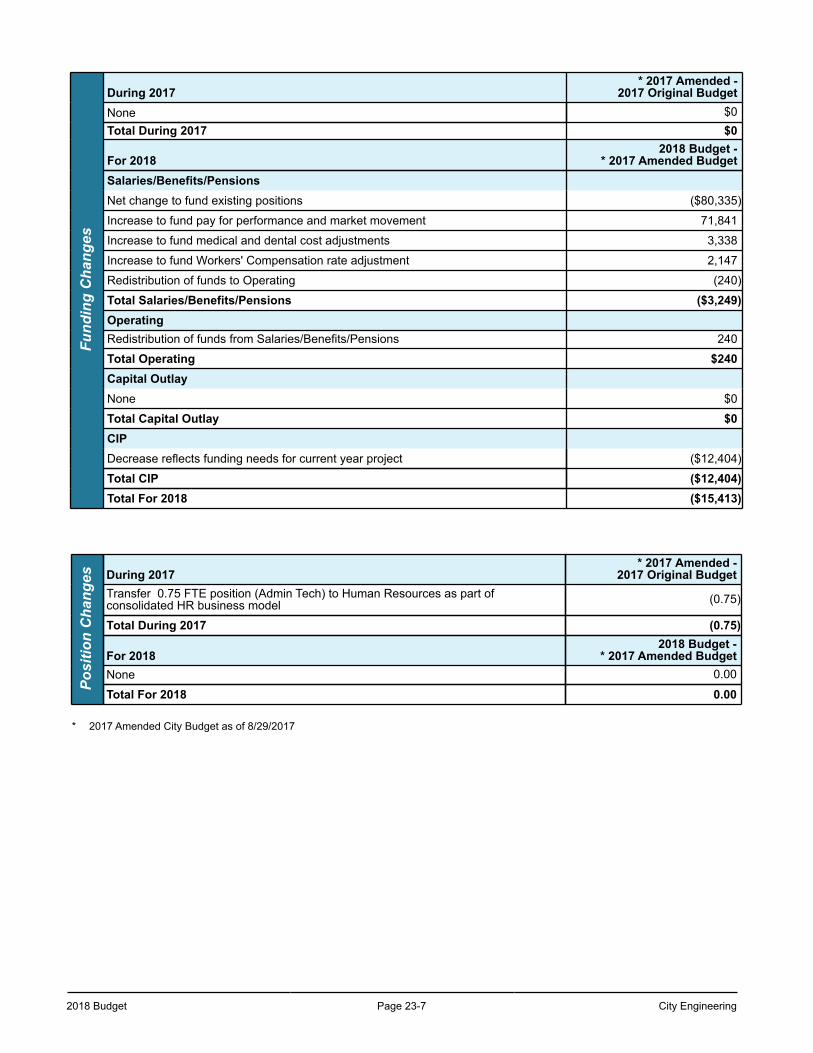
2018 Budget Page 23-7 City Engineering
Fund
ing
Cha
nges
During 2017* 2017 Amended -
2017 Original BudgetNone $0Total During 2017 $0
For 20182018 Budget -
* 2017 Amended BudgetSalaries/Benefits/PensionsNet change to fund existing positions ($80,335)
Increase to fund pay for performance and market movement 71,841
Increase to fund medical and dental cost adjustments 3,338
Increase to fund Workers' Compensation rate adjustment 2,147
Redistribution of funds to Operating (240)
Total Salaries/Benefits/Pensions ($3,249)OperatingRedistribution of funds from Salaries/Benefits/Pensions 240
Total Operating $240Capital OutlayNone $0
Total Capital Outlay $0CIPDecrease reflects funding needs for current year project ($12,404)
Total CIP ($12,404)Total For 2018 ($15,413)
Posi
tion
Cha
nges During 2017
* 2017 Amended -2017 Original Budget
Transfer 0.75 FTE position (Admin Tech) to Human Resources as part ofconsolidated HR business model (0.75)
Total During 2017 (0.75)
For 20182018 Budget -
* 2017 Amended BudgetNone 0.00
Total For 2018 0.00
* 2017 Amended City Budget as of 8/29/2017
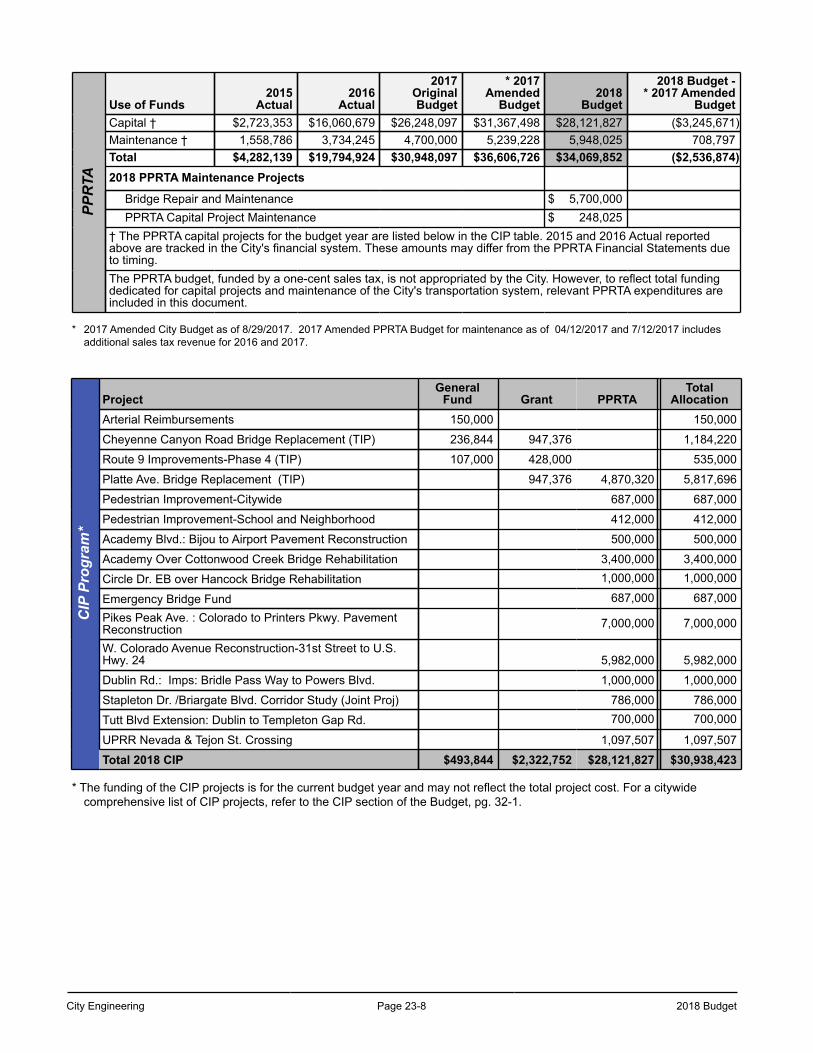
City Engineering Page 23-8 2018 Budget
PPR
TAUse of Funds
2015Actual
2016Actual
2017OriginalBudget
* 2017Amended
Budget2018
Budget
2018 Budget -* 2017 Amended
BudgetCapital † $2,723,353 $16,060,679 $26,248,097 $31,367,498 $28,121,827 ($3,245,671)Maintenance † 1,558,786 3,734,245 4,700,000 5,239,228 5,948,025 708,797Total $4,282,139 $19,794,924 $30,948,097 $36,606,726 $34,069,852 ($2,536,874)2018 PPRTA Maintenance Projects
Bridge Repair and Maintenance $ 5,700,000PPRTA Capital Project Maintenance $ 248,025
† The PPRTA capital projects for the budget year are listed below in the CIP table. 2015 and 2016 Actual reportedabove are tracked in the City's financial system. These amounts may differ from the PPRTA Financial Statements dueto timing.The PPRTA budget, funded by a one-cent sales tax, is not appropriated by the City. However, to reflect total fundingdedicated for capital projects and maintenance of the City's transportation system, relevant PPRTA expenditures areincluded in this document.
* 2017 Amended City Budget as of 8/29/2017. 2017 Amended PPRTA Budget for maintenance as of 04/12/2017 and 7/12/2017 includes additional sales tax revenue for 2016 and 2017.
CIP
Pro
gram
*
ProjectGeneral
Fund Grant PPRTATotal
AllocationArterial Reimbursements 150,000 150,000
Cheyenne Canyon Road Bridge Replacement (TIP) 236,844 947,376 1,184,220
Route 9 Improvements-Phase 4 (TIP) 107,000 428,000 535,000
Platte Ave. Bridge Replacement (TIP) 947,376 4,870,320 5,817,696
Pedestrian Improvement-Citywide 687,000 687,000
Pedestrian Improvement-School and Neighborhood 412,000 412,000
Academy Blvd.: Bijou to Airport Pavement Reconstruction 500,000 500,000
Academy Over Cottonwood Creek Bridge Rehabilitation 3,400,000 3,400,000
Circle Dr. EB over Hancock Bridge Rehabilitation 1,000,000 1,000,000
Emergency Bridge Fund 687,000 687,000Pikes Peak Ave. : Colorado to Printers Pkwy. PavementReconstruction 7,000,000 7,000,000
W. Colorado Avenue Reconstruction-31st Street to U.S.Hwy. 24 5,982,000 5,982,000
Dublin Rd.: Imps: Bridle Pass Way to Powers Blvd. 1,000,000 1,000,000
Stapleton Dr. /Briargate Blvd. Corridor Study (Joint Proj) 786,000 786,000
Tutt Blvd Extension: Dublin to Templeton Gap Rd. 700,000 700,000
UPRR Nevada & Tejon St. Crossing 1,097,507 1,097,507
Total 2018 CIP $493,844 $2,322,752 $28,121,827 $30,938,423
* The funding of the CIP projects is for the current budget year and may not reflect the total project cost. For a citywide comprehensive list of CIP projects, refer to the CIP section of the Budget, pg. 32-1.
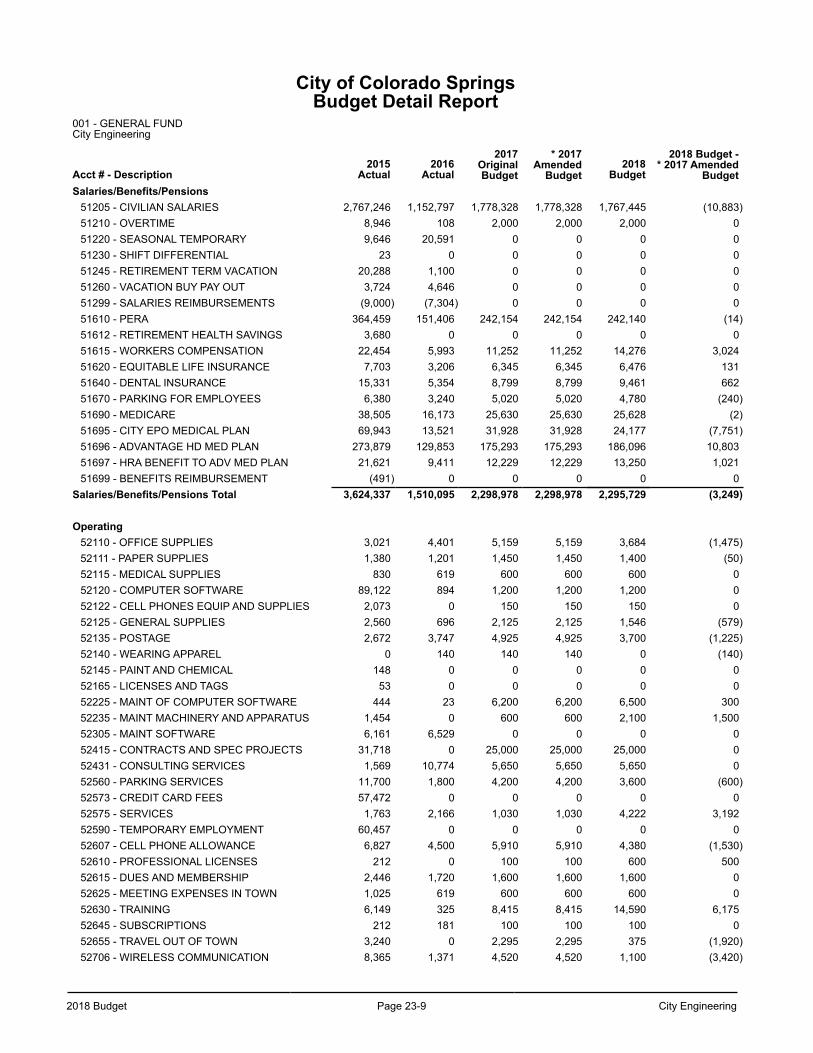
2018 Budget Page 23-9 City Engineering
City of Colorado SpringsBudget Detail Report
001 - GENERAL FUNDCity Engineering
Acct # - Description2015
Actual2016
Actual
2017OriginalBudget
* 2017Amended
Budget2018
Budget
2018 Budget -* 2017 Amended
BudgetSalaries/Benefits/Pensions
51205 - CIVILIAN SALARIES 2,767,246 1,152,797 1,778,328 1,778,328 1,767,445 (10,883)51210 - OVERTIME 8,946 108 2,000 2,000 2,000 051220 - SEASONAL TEMPORARY 9,646 20,591 0 0 0 051230 - SHIFT DIFFERENTIAL 23 0 0 0 0 051245 - RETIREMENT TERM VACATION 20,288 1,100 0 0 0 051260 - VACATION BUY PAY OUT 3,724 4,646 0 0 0 051299 - SALARIES REIMBURSEMENTS (9,000) (7,304) 0 0 0 051610 - PERA 364,459 151,406 242,154 242,154 242,140 (14)51612 - RETIREMENT HEALTH SAVINGS 3,680 0 0 0 0 051615 - WORKERS COMPENSATION 22,454 5,993 11,252 11,252 14,276 3,02451620 - EQUITABLE LIFE INSURANCE 7,703 3,206 6,345 6,345 6,476 13151640 - DENTAL INSURANCE 15,331 5,354 8,799 8,799 9,461 66251670 - PARKING FOR EMPLOYEES 6,380 3,240 5,020 5,020 4,780 (240)51690 - MEDICARE 38,505 16,173 25,630 25,630 25,628 (2)51695 - CITY EPO MEDICAL PLAN 69,943 13,521 31,928 31,928 24,177 (7,751)51696 - ADVANTAGE HD MED PLAN 273,879 129,853 175,293 175,293 186,096 10,80351697 - HRA BENEFIT TO ADV MED PLAN 21,621 9,411 12,229 12,229 13,250 1,02151699 - BENEFITS REIMBURSEMENT (491) 0 0 0 0 0
Salaries/Benefits/Pensions Total 3,624,337 1,510,095 2,298,978 2,298,978 2,295,729 (3,249)
Operating52110 - OFFICE SUPPLIES 3,021 4,401 5,159 5,159 3,684 (1,475)52111 - PAPER SUPPLIES 1,380 1,201 1,450 1,450 1,400 (50)52115 - MEDICAL SUPPLIES 830 619 600 600 600 052120 - COMPUTER SOFTWARE 89,122 894 1,200 1,200 1,200 052122 - CELL PHONES EQUIP AND SUPPLIES 2,073 0 150 150 150 052125 - GENERAL SUPPLIES 2,560 696 2,125 2,125 1,546 (579)52135 - POSTAGE 2,672 3,747 4,925 4,925 3,700 (1,225)52140 - WEARING APPAREL 0 140 140 140 0 (140)52145 - PAINT AND CHEMICAL 148 0 0 0 0 052165 - LICENSES AND TAGS 53 0 0 0 0 052225 - MAINT OF COMPUTER SOFTWARE 444 23 6,200 6,200 6,500 30052235 - MAINT MACHINERY AND APPARATUS 1,454 0 600 600 2,100 1,50052305 - MAINT SOFTWARE 6,161 6,529 0 0 0 052415 - CONTRACTS AND SPEC PROJECTS 31,718 0 25,000 25,000 25,000 052431 - CONSULTING SERVICES 1,569 10,774 5,650 5,650 5,650 052560 - PARKING SERVICES 11,700 1,800 4,200 4,200 3,600 (600)52573 - CREDIT CARD FEES 57,472 0 0 0 0 052575 - SERVICES 1,763 2,166 1,030 1,030 4,222 3,19252590 - TEMPORARY EMPLOYMENT 60,457 0 0 0 0 052607 - CELL PHONE ALLOWANCE 6,827 4,500 5,910 5,910 4,380 (1,530)52610 - PROFESSIONAL LICENSES 212 0 100 100 600 50052615 - DUES AND MEMBERSHIP 2,446 1,720 1,600 1,600 1,600 052625 - MEETING EXPENSES IN TOWN 1,025 619 600 600 600 052630 - TRAINING 6,149 325 8,415 8,415 14,590 6,17552645 - SUBSCRIPTIONS 212 181 100 100 100 052655 - TRAVEL OUT OF TOWN 3,240 0 2,295 2,295 375 (1,920)52706 - WIRELESS COMMUNICATION 8,365 1,371 4,520 4,520 1,100 (3,420)
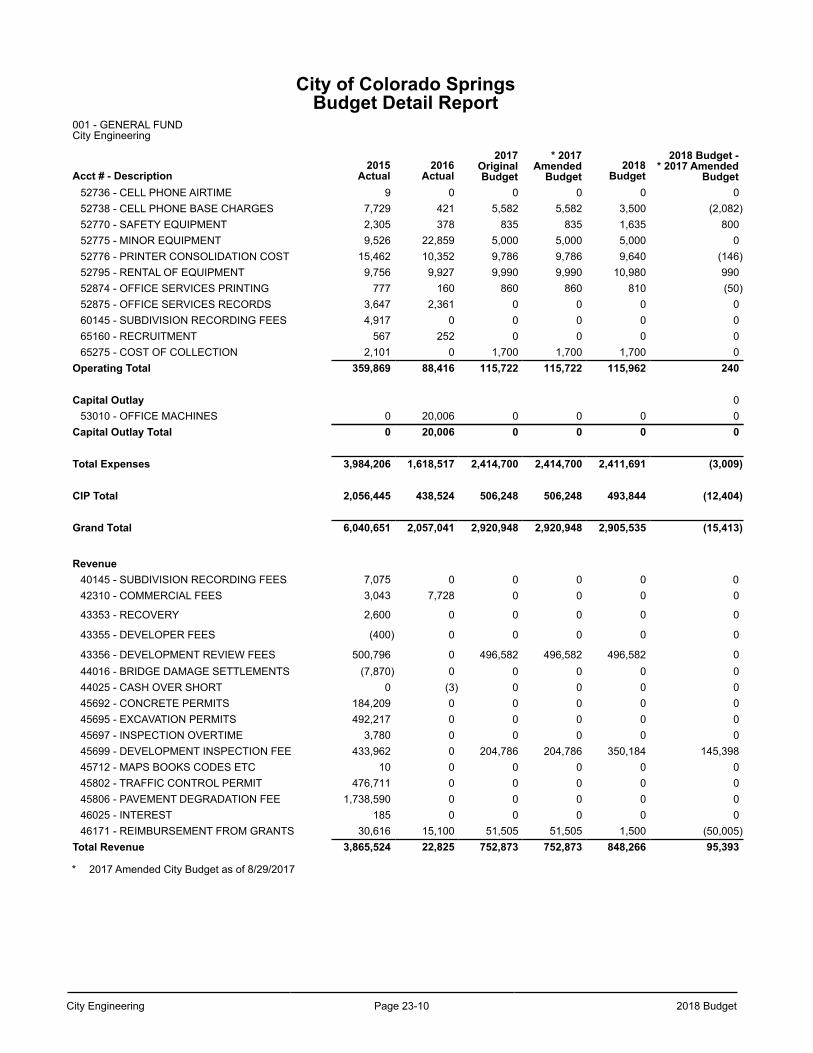
City Engineering Page 23-10 2018 Budget
City of Colorado SpringsBudget Detail Report
001 - GENERAL FUNDCity Engineering
Acct # - Description2015
Actual2016
Actual
2017OriginalBudget
* 2017Amended
Budget2018
Budget
2018 Budget -* 2017 Amended
Budget52736 - CELL PHONE AIRTIME 9 0 0 0 0 052738 - CELL PHONE BASE CHARGES 7,729 421 5,582 5,582 3,500 (2,082)52770 - SAFETY EQUIPMENT 2,305 378 835 835 1,635 80052775 - MINOR EQUIPMENT 9,526 22,859 5,000 5,000 5,000 052776 - PRINTER CONSOLIDATION COST 15,462 10,352 9,786 9,786 9,640 (146)52795 - RENTAL OF EQUIPMENT 9,756 9,927 9,990 9,990 10,980 99052874 - OFFICE SERVICES PRINTING 777 160 860 860 810 (50)52875 - OFFICE SERVICES RECORDS 3,647 2,361 0 0 0 060145 - SUBDIVISION RECORDING FEES 4,917 0 0 0 0 065160 - RECRUITMENT 567 252 0 0 0 065275 - COST OF COLLECTION 2,101 0 1,700 1,700 1,700 0
Operating Total 359,869 88,416 115,722 115,722 115,962 240
Capital Outlay 053010 - OFFICE MACHINES 0 20,006 0 0 0 0
Capital Outlay Total 0 20,006 0 0 0 0
Total Expenses 3,984,206 1,618,517 2,414,700 2,414,700 2,411,691 (3,009)
CIP Total 2,056,445 438,524 506,248 506,248 493,844 (12,404)
Grand Total 6,040,651 2,057,041 2,920,948 2,920,948 2,905,535 (15,413)
Revenue40145 - SUBDIVISION RECORDING FEES 7,075 0 0 0 0 042310 - COMMERCIAL FEES 3,043 7,728 0 0 0 0
43353 - RECOVERY 2,600 0 0 0 0 0
43355 - DEVELOPER FEES (400) 0 0 0 0 0
43356 - DEVELOPMENT REVIEW FEES 500,796 0 496,582 496,582 496,582 044016 - BRIDGE DAMAGE SETTLEMENTS (7,870) 0 0 0 0 044025 - CASH OVER SHORT 0 (3) 0 0 0 045692 - CONCRETE PERMITS 184,209 0 0 0 0 045695 - EXCAVATION PERMITS 492,217 0 0 0 0 045697 - INSPECTION OVERTIME 3,780 0 0 0 0 045699 - DEVELOPMENT INSPECTION FEE 433,962 0 204,786 204,786 350,184 145,39845712 - MAPS BOOKS CODES ETC 10 0 0 0 0 045802 - TRAFFIC CONTROL PERMIT 476,711 0 0 0 0 045806 - PAVEMENT DEGRADATION FEE 1,738,590 0 0 0 0 046025 - INTEREST 185 0 0 0 0 046171 - REIMBURSEMENT FROM GRANTS 30,616 15,100 51,505 51,505 1,500 (50,005)
Total Revenue 3,865,524 22,825 752,873 752,873 848,266 95,393
* 2017 Amended City Budget as of 8/29/2017
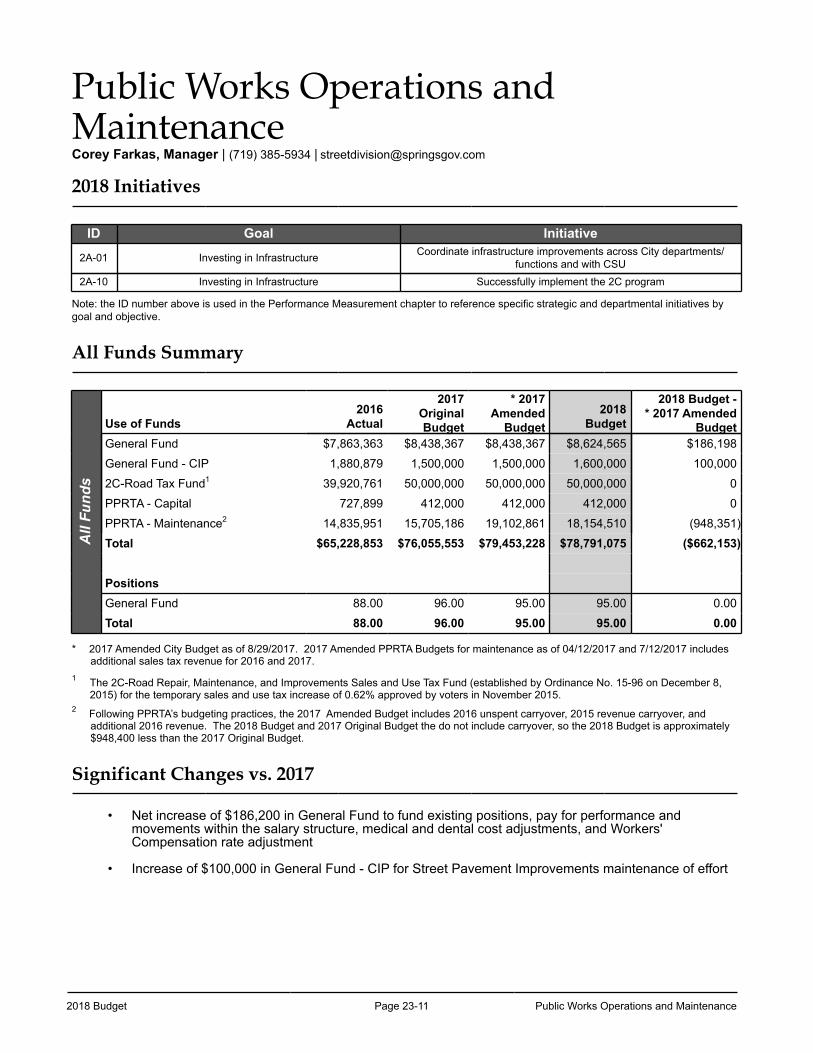
2018 Budget Page 23-11 Public Works Operations and Maintenance
Public Works Operations and MaintenanceCorey Farkas, Manager | (719) 385-5934 | [email protected]
2018 Initiatives
ID Goal Initiative
2A-01 Investing in Infrastructure Coordinate infrastructure improvements across City departments/functions and with CSU
2A-10 Investing in Infrastructure Successfully implement the 2C program
Note: the ID number above is used in the Performance Measurement chapter to reference specific strategic and departmental initiatives by goal and objective.
All Funds Summary
All
Fund
s
Use of Funds2016
Actual
2017OriginalBudget
* 2017Amended
Budget2018
Budget
2018 Budget -* 2017 Amended
BudgetGeneral Fund $7,863,363 $8,438,367 $8,438,367 $8,624,565 $186,198
General Fund - CIP 1,880,879 1,500,000 1,500,000 1,600,000 100,000
2C-Road Tax Fund1 39,920,761 50,000,000 50,000,000 50,000,000 0
PPRTA - Capital 727,899 412,000 412,000 412,000 0
PPRTA - Maintenance2 14,835,951 15,705,186 19,102,861 18,154,510 (948,351)
Total $65,228,853 $76,055,553 $79,453,228 $78,791,075 ($662,153)
PositionsGeneral Fund 88.00 96.00 95.00 95.00 0.00
Total 88.00 96.00 95.00 95.00 0.00
* 2017 Amended City Budget as of 8/29/2017. 2017 Amended PPRTA Budgets for maintenance as of 04/12/2017 and 7/12/2017 includes additional sales tax revenue for 2016 and 2017.
1 The 2C-Road Repair, Maintenance, and Improvements Sales and Use Tax Fund (established by Ordinance No. 15-96 on December 8, 2015) for the temporary sales and use tax increase of 0.62% approved by voters in November 2015.
2 Following PPRTA’s budgeting practices, the 2017 Amended Budget includes 2016 unspent carryover, 2015 revenue carryover, and additional 2016 revenue. The 2018 Budget and 2017 Original Budget the do not include carryover, so the 2018 Budget is approximately $948,400 less than the 2017 Original Budget.
Significant Changes vs. 2017
• Net increase of $186,200 in General Fund to fund existing positions, pay for performance and movements within the salary structure, medical and dental cost adjustments, and Workers' Compensation rate adjustment
• Increase of $100,000 in General Fund - CIP for Street Pavement Improvements maintenance of effort
Public Works Operations and Maintenance Page 23-12 2018 Budget
Public Works Operations and MaintenanceThe mission of the Public Works Operations and Maintenance Division is to ensure that quality maintenance and rehabilitation are provided for the City’s roadway and drainage infrastructure.
Asset Management
• Maintains condition inventory of infrastructure assets including bridges, storm pipes and channels, roadway pavements, traffic signals, signs, pavement markings, curb and gutter, sidewalk, pedestrian ramps, trails, and more
• Analyzes and monitors the conditions, costs, and life cycle of the City's infrastructure assets to equip decision makers with information for maintaining safe and operational public infrastructure
Concrete Repair, Pavement Rehabilitation and Resurfacing
• Provide concrete repairs for roadway infrastructure including curb/gutter, sidewalks, pedestrian ramps, crosspans, and overlay prep for resurfacing
• Provide minor resurfacing for sections of roadway• Prioritize street resurfacing based on surface distress, traffic volume, faulty drainage, oxidation (weather
wear), deterioration, and failure of the sub-grade material• Manage contracts for pavement resurfacing (mill/overlay, chip and slurry seal)
Right-of-way Management
• Ensures that new and retrofit concrete, street excavations, and capital project work in the public right-of-way is constructed to Engineering standards
• Issues permits for and inspects work performed in the City right-of-way• Reviews traffic control plans for permitted work and capital project work to help ensure safety in the public
right-of-way
Signs & Markings• Maintain the City’s signs and markings system • Install new signage and replace worn out signs to meet federal standards• Re-stripe roadways, crosswalks, legends, and bike lanes• Coordinate new guardrail installations and coordinate replacement of damaged guardrail
Snow, Ice Control and Emergency Weather Response• Provide snow and emergency weather conditions response year-round to establish safe and passable
streets • Provide service for over 5,600 lane miles of roadway extending over a 194 square-mile area
2C-Road Tax Fund *• Oversee two paving contracts in 2018 for the Overlay Program to repair and/or improve roadway
segments• Oversee six pre-overlay concrete contracts in 2018 for the Concrete Program to repair and/or improve
concrete such as curb and gutter, sidewalks, and pedestrian ramps• Oversee contracts for inspection and third-party testing of the individual projects
* The 2C-Road Repair, Maintenance, and Improvements Sales and Use Tax Fund (established by Ordinance No. 15-96 on December 8, 2015) for the temporary sales and use tax increase of 0.62% approved by voters in November 2015.
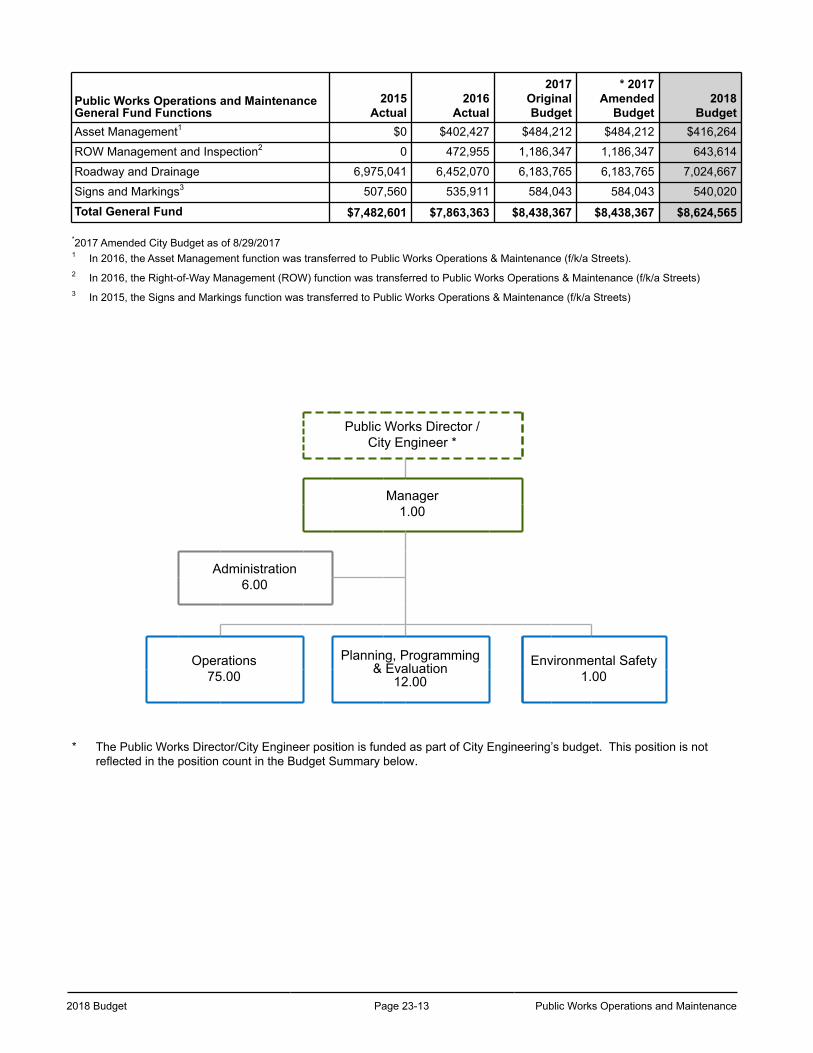
2018 Budget Page 23-13 Public Works Operations and Maintenance
Public Works Operations and MaintenanceGeneral Fund Functions
2015Actual
2016Actual
2017OriginalBudget
* 2017Amended
Budget2018
BudgetAsset Management1 $0 $402,427 $484,212 $484,212 $416,264
ROW Management and Inspection2 0 472,955 1,186,347 1,186,347 643,614
Roadway and Drainage 6,975,041 6,452,070 6,183,765 6,183,765 7,024,667
Signs and Markings3 507,560 535,911 584,043 584,043 540,020
Total General Fund $7,482,601 $7,863,363 $8,438,367 $8,438,367 $8,624,565
*2017 Amended City Budget as of 8/29/20171 In 2016, the Asset Management function was transferred to Public Works Operations & Maintenance (f/k/a Streets).2 In 2016, the Right-of-Way Management (ROW) function was transferred to Public Works Operations & Maintenance (f/k/a Streets)3 In 2015, the Signs and Markings function was transferred to Public Works Operations & Maintenance (f/k/a Streets)
Public Works Director /City Engineer *
Manager1.00
Administration 6.00
Operations75.00
Planning, Programming & Evaluation
12.00Environmental Safety
1.00
* The Public Works Director/City Engineer position is funded as part of City Engineering’s budget. This position is not reflected in the position count in the Budget Summary below.
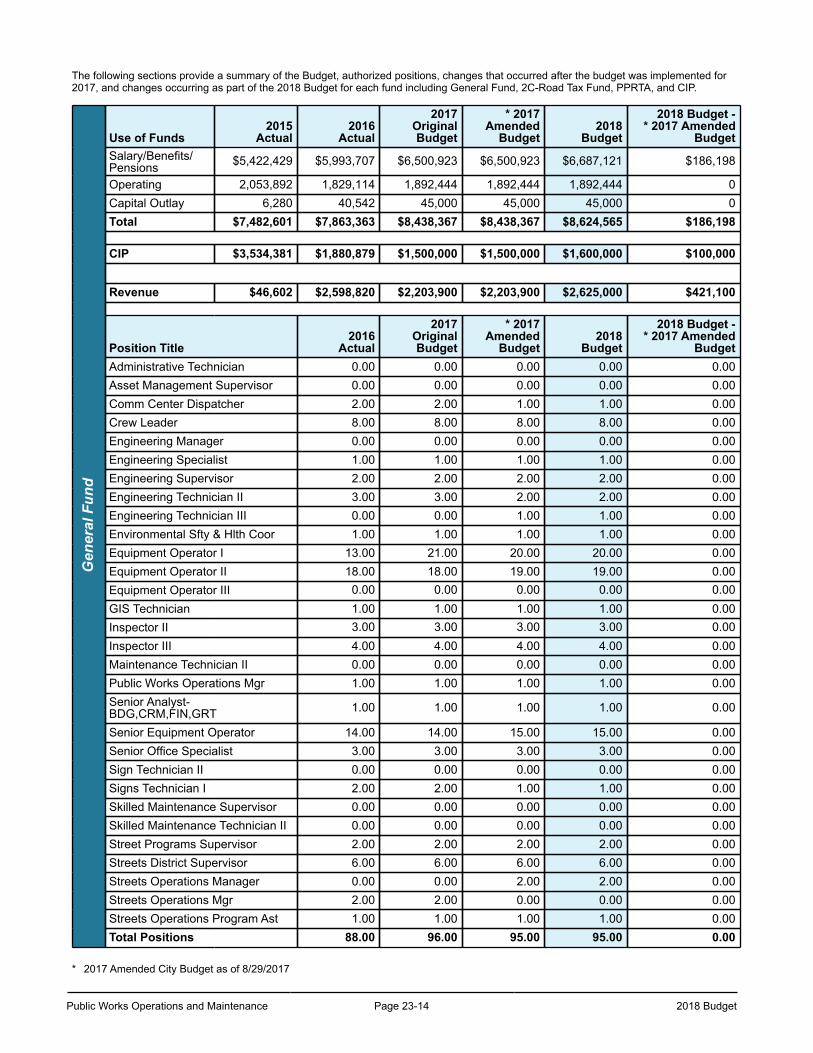
Public Works Operations and Maintenance Page 23-14 2018 Budget
The following sections provide a summary of the Budget, authorized positions, changes that occurred after the budget was implemented for 2017, and changes occurring as part of the 2018 Budget for each fund including General Fund, 2C-Road Tax Fund, PPRTA, and CIP.
Gen
eral
Fun
d
Use of Funds2015
Actual2016
Actual
2017OriginalBudget
* 2017Amended
Budget2018
Budget
2018 Budget -* 2017 Amended
BudgetSalary/Benefits/Pensions $5,422,429 $5,993,707 $6,500,923 $6,500,923 $6,687,121 $186,198
Operating 2,053,892 1,829,114 1,892,444 1,892,444 1,892,444 0Capital Outlay 6,280 40,542 45,000 45,000 45,000 0Total $7,482,601 $7,863,363 $8,438,367 $8,438,367 $8,624,565 $186,198
CIP $3,534,381 $1,880,879 $1,500,000 $1,500,000 $1,600,000 $100,000
Revenue $46,602 $2,598,820 $2,203,900 $2,203,900 $2,625,000 $421,100
Position Title2016
Actual
2017OriginalBudget
* 2017Amended
Budget2018
Budget
2018 Budget -* 2017 Amended
BudgetAdministrative Technician 0.00 0.00 0.00 0.00 0.00Asset Management Supervisor 0.00 0.00 0.00 0.00 0.00Comm Center Dispatcher 2.00 2.00 1.00 1.00 0.00Crew Leader 8.00 8.00 8.00 8.00 0.00Engineering Manager 0.00 0.00 0.00 0.00 0.00Engineering Specialist 1.00 1.00 1.00 1.00 0.00Engineering Supervisor 2.00 2.00 2.00 2.00 0.00Engineering Technician II 3.00 3.00 2.00 2.00 0.00Engineering Technician III 0.00 0.00 1.00 1.00 0.00Environmental Sfty & Hlth Coor 1.00 1.00 1.00 1.00 0.00Equipment Operator I 13.00 21.00 20.00 20.00 0.00Equipment Operator II 18.00 18.00 19.00 19.00 0.00Equipment Operator III 0.00 0.00 0.00 0.00 0.00GIS Technician 1.00 1.00 1.00 1.00 0.00Inspector II 3.00 3.00 3.00 3.00 0.00Inspector III 4.00 4.00 4.00 4.00 0.00Maintenance Technician II 0.00 0.00 0.00 0.00 0.00Public Works Operations Mgr 1.00 1.00 1.00 1.00 0.00Senior Analyst-BDG,CRM,FIN,GRT 1.00 1.00 1.00 1.00 0.00
Senior Equipment Operator 14.00 14.00 15.00 15.00 0.00Senior Office Specialist 3.00 3.00 3.00 3.00 0.00Sign Technician II 0.00 0.00 0.00 0.00 0.00Signs Technician I 2.00 2.00 1.00 1.00 0.00Skilled Maintenance Supervisor 0.00 0.00 0.00 0.00 0.00Skilled Maintenance Technician II 0.00 0.00 0.00 0.00 0.00Street Programs Supervisor 2.00 2.00 2.00 2.00 0.00Streets District Supervisor 6.00 6.00 6.00 6.00 0.00Streets Operations Manager 0.00 0.00 2.00 2.00 0.00Streets Operations Mgr 2.00 2.00 0.00 0.00 0.00Streets Operations Program Ast 1.00 1.00 1.00 1.00 0.00Total Positions 88.00 96.00 95.00 95.00 0.00
* 2017 Amended City Budget as of 8/29/2017
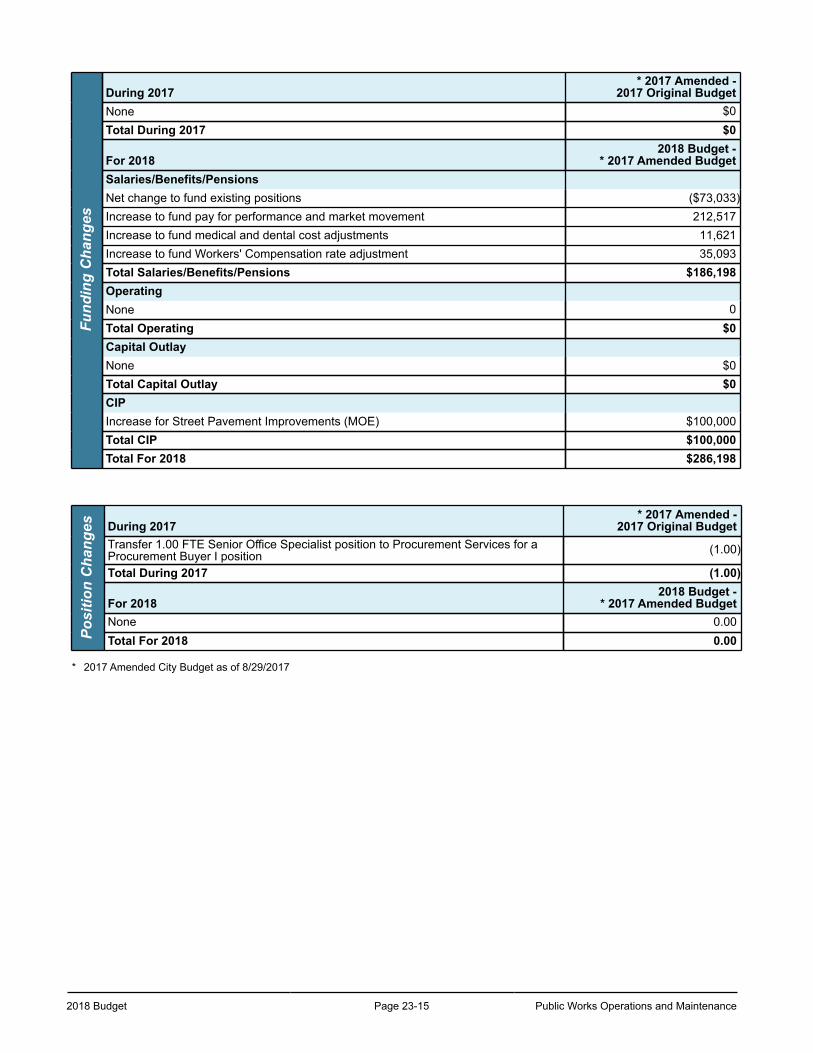
2018 Budget Page 23-15 Public Works Operations and Maintenance
Fund
ing
Cha
nges
During 2017* 2017 Amended -
2017 Original BudgetNone $0Total During 2017 $0
For 20182018 Budget -
* 2017 Amended BudgetSalaries/Benefits/PensionsNet change to fund existing positions ($73,033)Increase to fund pay for performance and market movement 212,517Increase to fund medical and dental cost adjustments 11,621Increase to fund Workers' Compensation rate adjustment 35,093Total Salaries/Benefits/Pensions $186,198OperatingNone 0Total Operating $0Capital OutlayNone $0Total Capital Outlay $0CIPIncrease for Street Pavement Improvements (MOE) $100,000Total CIP $100,000Total For 2018 $286,198
Posi
tion
Cha
nges During 2017
* 2017 Amended -2017 Original Budget
Transfer 1.00 FTE Senior Office Specialist position to Procurement Services for aProcurement Buyer I position (1.00)
Total During 2017 (1.00)
For 20182018 Budget -
* 2017 Amended BudgetNone 0.00Total For 2018 0.00
* 2017 Amended City Budget as of 8/29/2017
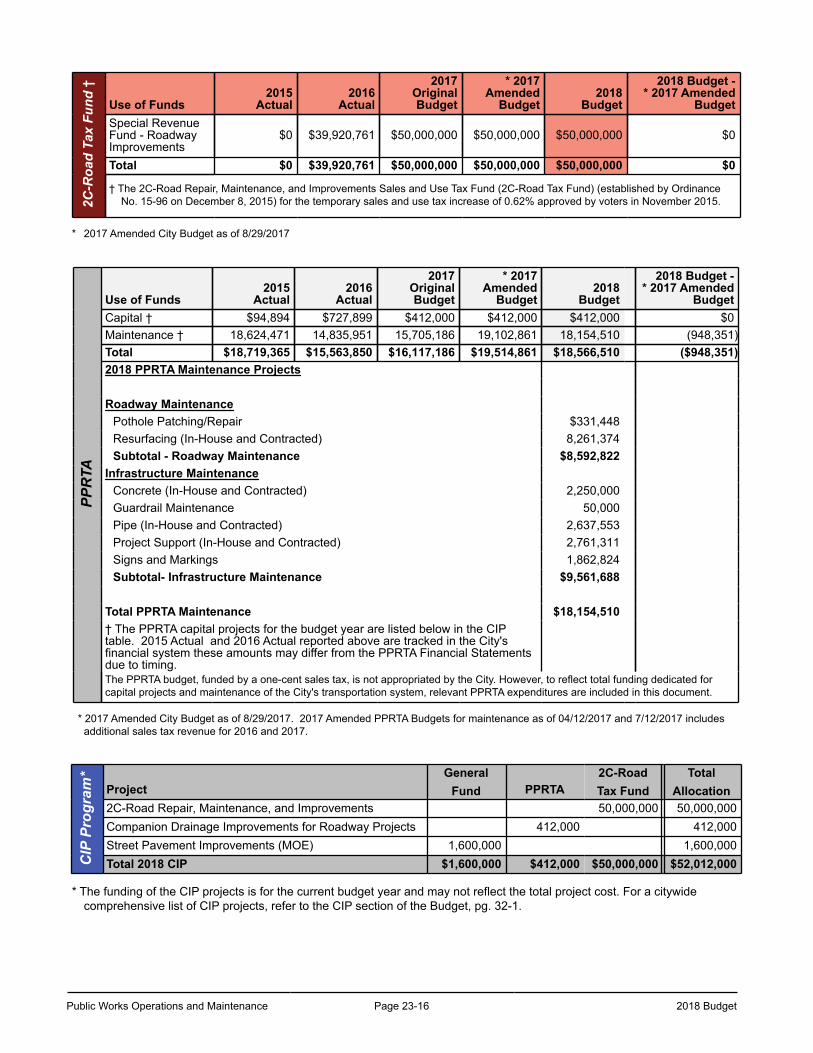
Public Works Operations and Maintenance Page 23-16 2018 Budget
2C-R
oad
Tax
Fund
†Use of Funds
2015Actual
2016Actual
2017OriginalBudget
* 2017Amended
Budget2018
Budget
2018 Budget -* 2017 Amended
BudgetSpecial RevenueFund - RoadwayImprovements
$0 $39,920,761 $50,000,000 $50,000,000 $50,000,000 $0
Total $0 $39,920,761 $50,000,000 $50,000,000 $50,000,000 $0
† The 2C-Road Repair, Maintenance, and Improvements Sales and Use Tax Fund (2C-Road Tax Fund) (established by OrdinanceNo. 15-96 on December 8, 2015) for the temporary sales and use tax increase of 0.62% approved by voters in November 2015.
* 2017 Amended City Budget as of 8/29/2017
PPR
TA
Use of Funds2015
Actual2016
Actual
2017OriginalBudget
* 2017Amended
Budget2018
Budget
2018 Budget -* 2017 Amended
BudgetCapital † $94,894 $727,899 $412,000 $412,000 $412,000 $0Maintenance † 18,624,471 14,835,951 15,705,186 19,102,861 18,154,510 (948,351)Total $18,719,365 $15,563,850 $16,117,186 $19,514,861 $18,566,510 ($948,351)2018 PPRTA Maintenance Projects
Roadway MaintenancePothole Patching/Repair $331,448Resurfacing (In-House and Contracted) 8,261,374Subtotal - Roadway Maintenance $8,592,822
Infrastructure MaintenanceConcrete (In-House and Contracted) 2,250,000Guardrail Maintenance 50,000Pipe (In-House and Contracted) 2,637,553Project Support (In-House and Contracted) 2,761,311Signs and Markings 1,862,824Subtotal- Infrastructure Maintenance $9,561,688
Total PPRTA Maintenance $18,154,510† The PPRTA capital projects for the budget year are listed below in the CIP table. 2015 Actual and 2016 Actual reported above are tracked in the City's financial system these amounts may differ from the PPRTA Financial Statements due to timing.The PPRTA budget, funded by a one-cent sales tax, is not appropriated by the City. However, to reflect total funding dedicated forcapital projects and maintenance of the City's transportation system, relevant PPRTA expenditures are included in this document.
* 2017 Amended City Budget as of 8/29/2017. 2017 Amended PPRTA Budgets for maintenance as of 04/12/2017 and 7/12/2017 includes additional sales tax revenue for 2016 and 2017.
CIP
Pro
gram
*
ProjectGeneral
Fund PPRTA2C-RoadTax Fund
TotalAllocation
2C-Road Repair, Maintenance, and Improvements 50,000,000 50,000,000Companion Drainage Improvements for Roadway Projects 412,000 412,000Street Pavement Improvements (MOE) 1,600,000 1,600,000Total 2018 CIP $1,600,000 $412,000 $50,000,000 $52,012,000
* The funding of the CIP projects is for the current budget year and may not reflect the total project cost. For a citywide comprehensive list of CIP projects, refer to the CIP section of the Budget, pg. 32-1.
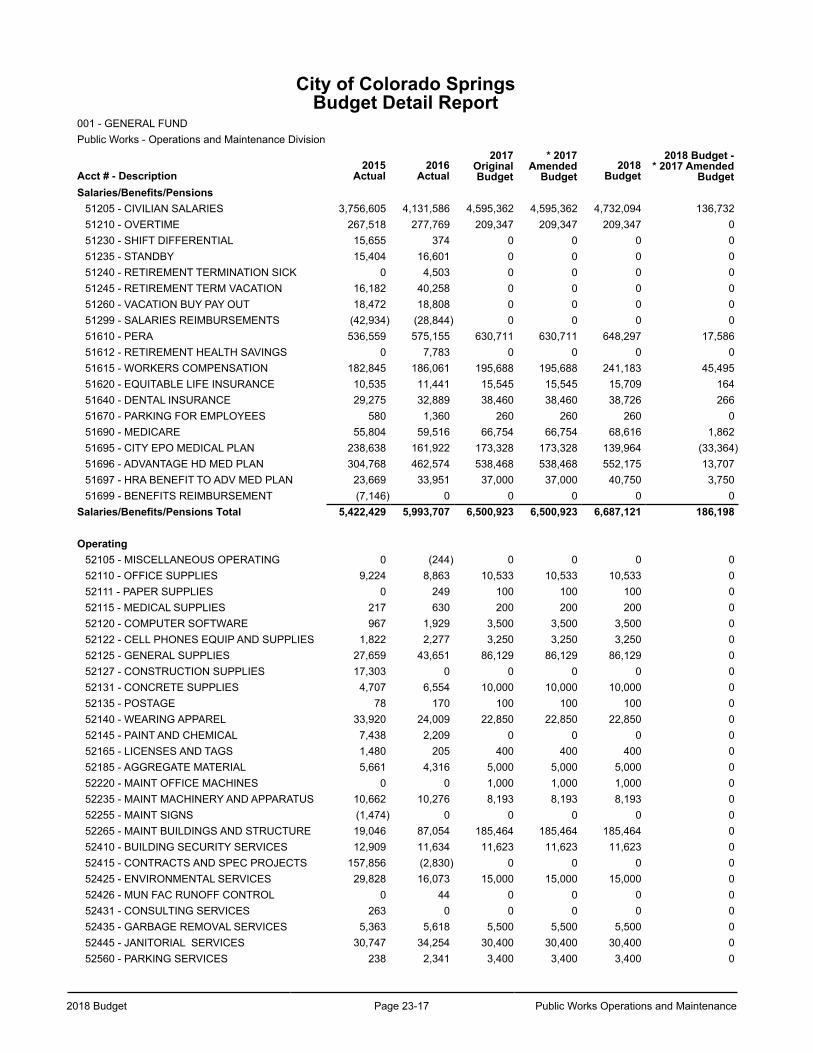
2018 Budget Page 23-17 Public Works Operations and Maintenance
City of Colorado SpringsBudget Detail Report
001 - GENERAL FUNDPublic Works - Operations and Maintenance Division
Acct # - Description2015
Actual2016
Actual
2017OriginalBudget
* 2017Amended
Budget2018
Budget
2018 Budget -* 2017 Amended
BudgetSalaries/Benefits/Pensions
51205 - CIVILIAN SALARIES 3,756,605 4,131,586 4,595,362 4,595,362 4,732,094 136,73251210 - OVERTIME 267,518 277,769 209,347 209,347 209,347 051230 - SHIFT DIFFERENTIAL 15,655 374 0 0 0 051235 - STANDBY 15,404 16,601 0 0 0 051240 - RETIREMENT TERMINATION SICK 0 4,503 0 0 0 051245 - RETIREMENT TERM VACATION 16,182 40,258 0 0 0 051260 - VACATION BUY PAY OUT 18,472 18,808 0 0 0 051299 - SALARIES REIMBURSEMENTS (42,934) (28,844) 0 0 0 051610 - PERA 536,559 575,155 630,711 630,711 648,297 17,58651612 - RETIREMENT HEALTH SAVINGS 0 7,783 0 0 0 051615 - WORKERS COMPENSATION 182,845 186,061 195,688 195,688 241,183 45,49551620 - EQUITABLE LIFE INSURANCE 10,535 11,441 15,545 15,545 15,709 16451640 - DENTAL INSURANCE 29,275 32,889 38,460 38,460 38,726 26651670 - PARKING FOR EMPLOYEES 580 1,360 260 260 260 051690 - MEDICARE 55,804 59,516 66,754 66,754 68,616 1,86251695 - CITY EPO MEDICAL PLAN 238,638 161,922 173,328 173,328 139,964 (33,364)51696 - ADVANTAGE HD MED PLAN 304,768 462,574 538,468 538,468 552,175 13,70751697 - HRA BENEFIT TO ADV MED PLAN 23,669 33,951 37,000 37,000 40,750 3,75051699 - BENEFITS REIMBURSEMENT (7,146) 0 0 0 0 0
Salaries/Benefits/Pensions Total 5,422,429 5,993,707 6,500,923 6,500,923 6,687,121 186,198
Operating52105 - MISCELLANEOUS OPERATING 0 (244) 0 0 0 052110 - OFFICE SUPPLIES 9,224 8,863 10,533 10,533 10,533 052111 - PAPER SUPPLIES 0 249 100 100 100 052115 - MEDICAL SUPPLIES 217 630 200 200 200 052120 - COMPUTER SOFTWARE 967 1,929 3,500 3,500 3,500 052122 - CELL PHONES EQUIP AND SUPPLIES 1,822 2,277 3,250 3,250 3,250 052125 - GENERAL SUPPLIES 27,659 43,651 86,129 86,129 86,129 052127 - CONSTRUCTION SUPPLIES 17,303 0 0 0 0 052131 - CONCRETE SUPPLIES 4,707 6,554 10,000 10,000 10,000 052135 - POSTAGE 78 170 100 100 100 052140 - WEARING APPAREL 33,920 24,009 22,850 22,850 22,850 052145 - PAINT AND CHEMICAL 7,438 2,209 0 0 0 052165 - LICENSES AND TAGS 1,480 205 400 400 400 052185 - AGGREGATE MATERIAL 5,661 4,316 5,000 5,000 5,000 052220 - MAINT OFFICE MACHINES 0 0 1,000 1,000 1,000 052235 - MAINT MACHINERY AND APPARATUS 10,662 10,276 8,193 8,193 8,193 052255 - MAINT SIGNS (1,474) 0 0 0 0 052265 - MAINT BUILDINGS AND STRUCTURE 19,046 87,054 185,464 185,464 185,464 052410 - BUILDING SECURITY SERVICES 12,909 11,634 11,623 11,623 11,623 052415 - CONTRACTS AND SPEC PROJECTS 157,856 (2,830) 0 0 0 052425 - ENVIRONMENTAL SERVICES 29,828 16,073 15,000 15,000 15,000 052426 - MUN FAC RUNOFF CONTROL 0 44 0 0 0 052431 - CONSULTING SERVICES 263 0 0 0 0 052435 - GARBAGE REMOVAL SERVICES 5,363 5,618 5,500 5,500 5,500 052445 - JANITORIAL SERVICES 30,747 34,254 30,400 30,400 30,400 052560 - PARKING SERVICES 238 2,341 3,400 3,400 3,400 0
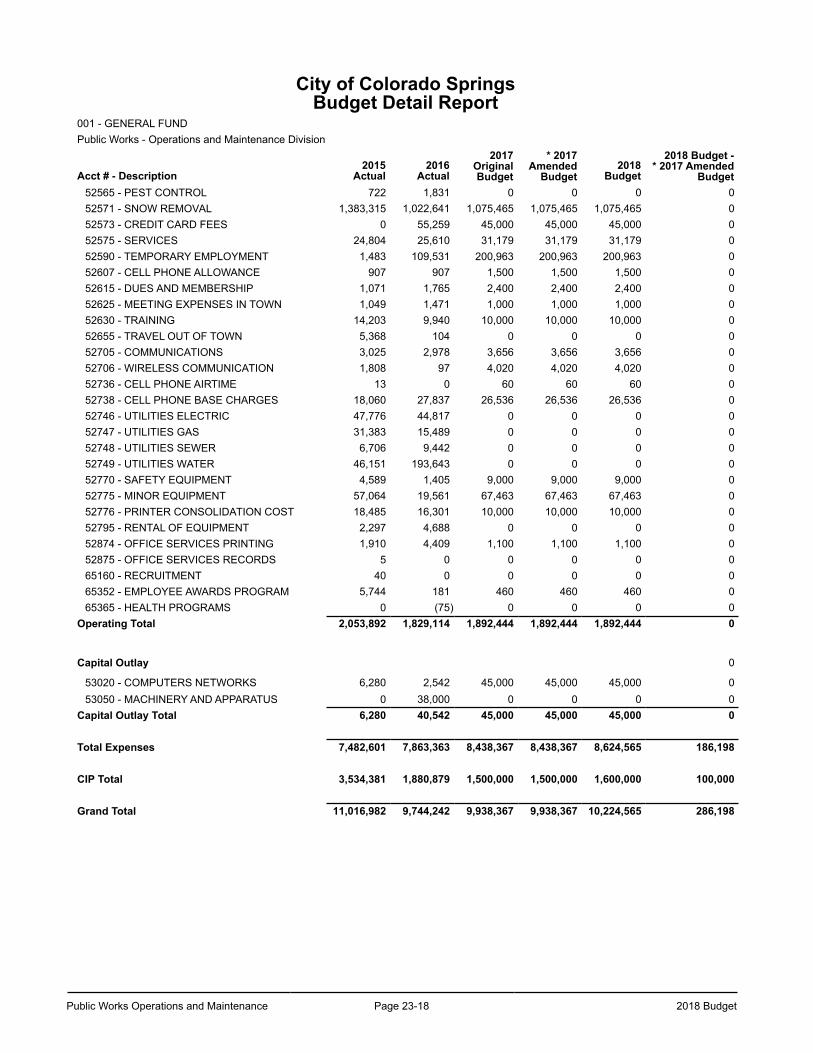
Public Works Operations and Maintenance Page 23-18 2018 Budget
City of Colorado SpringsBudget Detail Report
001 - GENERAL FUNDPublic Works - Operations and Maintenance Division
Acct # - Description2015
Actual2016
Actual
2017OriginalBudget
* 2017Amended
Budget2018
Budget
2018 Budget -* 2017 Amended
Budget52565 - PEST CONTROL 722 1,831 0 0 0 052571 - SNOW REMOVAL 1,383,315 1,022,641 1,075,465 1,075,465 1,075,465 052573 - CREDIT CARD FEES 0 55,259 45,000 45,000 45,000 052575 - SERVICES 24,804 25,610 31,179 31,179 31,179 052590 - TEMPORARY EMPLOYMENT 1,483 109,531 200,963 200,963 200,963 052607 - CELL PHONE ALLOWANCE 907 907 1,500 1,500 1,500 052615 - DUES AND MEMBERSHIP 1,071 1,765 2,400 2,400 2,400 052625 - MEETING EXPENSES IN TOWN 1,049 1,471 1,000 1,000 1,000 052630 - TRAINING 14,203 9,940 10,000 10,000 10,000 052655 - TRAVEL OUT OF TOWN 5,368 104 0 0 0 052705 - COMMUNICATIONS 3,025 2,978 3,656 3,656 3,656 052706 - WIRELESS COMMUNICATION 1,808 97 4,020 4,020 4,020 052736 - CELL PHONE AIRTIME 13 0 60 60 60 052738 - CELL PHONE BASE CHARGES 18,060 27,837 26,536 26,536 26,536 052746 - UTILITIES ELECTRIC 47,776 44,817 0 0 0 052747 - UTILITIES GAS 31,383 15,489 0 0 0 052748 - UTILITIES SEWER 6,706 9,442 0 0 0 052749 - UTILITIES WATER 46,151 193,643 0 0 0 052770 - SAFETY EQUIPMENT 4,589 1,405 9,000 9,000 9,000 052775 - MINOR EQUIPMENT 57,064 19,561 67,463 67,463 67,463 052776 - PRINTER CONSOLIDATION COST 18,485 16,301 10,000 10,000 10,000 052795 - RENTAL OF EQUIPMENT 2,297 4,688 0 0 0 052874 - OFFICE SERVICES PRINTING 1,910 4,409 1,100 1,100 1,100 052875 - OFFICE SERVICES RECORDS 5 0 0 0 0 065160 - RECRUITMENT 40 0 0 0 0 065352 - EMPLOYEE AWARDS PROGRAM 5,744 181 460 460 460 065365 - HEALTH PROGRAMS 0 (75) 0 0 0 0
Operating Total 2,053,892 1,829,114 1,892,444 1,892,444 1,892,444 0
Capital Outlay 0
53020 - COMPUTERS NETWORKS 6,280 2,542 45,000 45,000 45,000 053050 - MACHINERY AND APPARATUS 0 38,000 0 0 0 0
Capital Outlay Total 6,280 40,542 45,000 45,000 45,000 0
Total Expenses 7,482,601 7,863,363 8,438,367 8,438,367 8,624,565 186,198
CIP Total 3,534,381 1,880,879 1,500,000 1,500,000 1,600,000 100,000
Grand Total 11,016,982 9,744,242 9,938,367 9,938,367 10,224,565 286,198
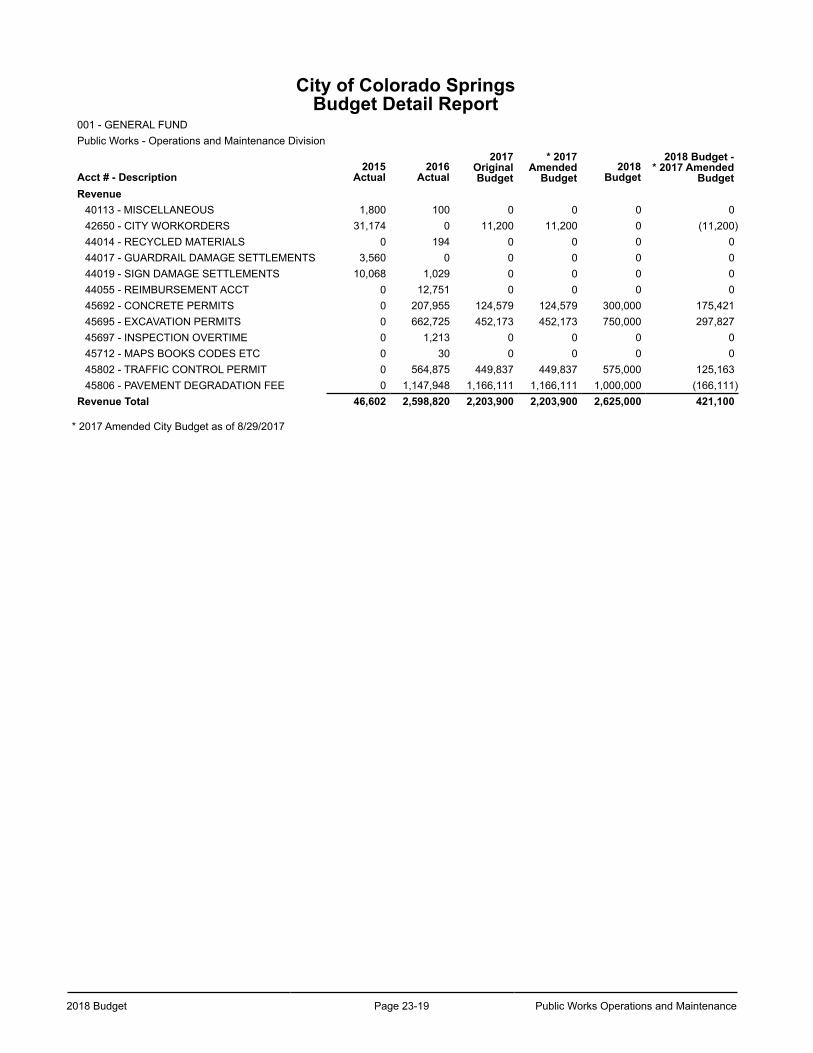
2018 Budget Page 23-19 Public Works Operations and Maintenance
City of Colorado SpringsBudget Detail Report
001 - GENERAL FUNDPublic Works - Operations and Maintenance Division
Acct # - Description2015
Actual2016
Actual
2017OriginalBudget
* 2017Amended
Budget2018
Budget
2018 Budget -* 2017 Amended
BudgetRevenue
40113 - MISCELLANEOUS 1,800 100 0 0 0 042650 - CITY WORKORDERS 31,174 0 11,200 11,200 0 (11,200)44014 - RECYCLED MATERIALS 0 194 0 0 0 044017 - GUARDRAIL DAMAGE SETTLEMENTS 3,560 0 0 0 0 044019 - SIGN DAMAGE SETTLEMENTS 10,068 1,029 0 0 0 044055 - REIMBURSEMENT ACCT 0 12,751 0 0 0 045692 - CONCRETE PERMITS 0 207,955 124,579 124,579 300,000 175,42145695 - EXCAVATION PERMITS 0 662,725 452,173 452,173 750,000 297,82745697 - INSPECTION OVERTIME 0 1,213 0 0 0 045712 - MAPS BOOKS CODES ETC 0 30 0 0 0 045802 - TRAFFIC CONTROL PERMIT 0 564,875 449,837 449,837 575,000 125,16345806 - PAVEMENT DEGRADATION FEE 0 1,147,948 1,166,111 1,166,111 1,000,000 (166,111)
Revenue Total 46,602 2,598,820 2,203,900 2,203,900 2,625,000 421,100
* 2017 Amended City Budget as of 8/29/2017

Public Works Operations and Maintenance Page 23-20 2018 Budget
This page left blank intentionally.
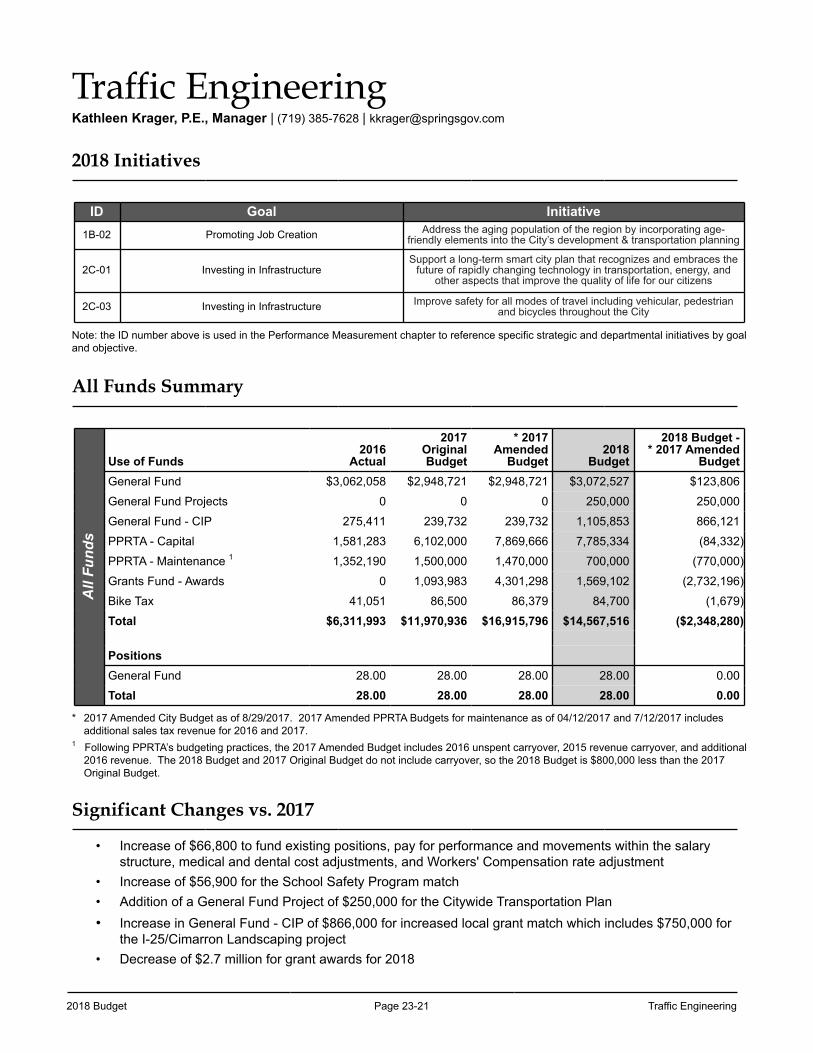
2018 Budget Page 23-21 Traffic Engineering
Traffic Engineering Kathleen Krager, P.E., Manager | (719) 385-7628 | [email protected]
2018 Initiatives
ID Goal Initiative1B-02 Promoting Job Creation Address the aging population of the region by incorporating age-
friendly elements into the City’s development & transportation planning
2C-01 Investing in InfrastructureSupport a long-term smart city plan that recognizes and embraces the
future of rapidly changing technology in transportation, energy, and other aspects that improve the quality of life for our citizens
2C-03 Investing in Infrastructure Improve safety for all modes of travel including vehicular, pedestrian and bicycles throughout the City
Note: the ID number above is used in the Performance Measurement chapter to reference specific strategic and departmental initiatives by goal and objective.
All Funds Summary
All
Fund
s
Use of Funds2016
Actual
2017OriginalBudget
* 2017Amended
Budget2018
Budget
2018 Budget -* 2017 Amended
BudgetGeneral Fund $3,062,058 $2,948,721 $2,948,721 $3,072,527 $123,806
General Fund Projects 0 0 0 250,000 250,000
General Fund - CIP 275,411 239,732 239,732 1,105,853 866,121
PPRTA - Capital 1,581,283 6,102,000 7,869,666 7,785,334 (84,332)
PPRTA - Maintenance 1 1,352,190 1,500,000 1,470,000 700,000 (770,000)
Grants Fund - Awards 0 1,093,983 4,301,298 1,569,102 (2,732,196)
Bike Tax 41,051 86,500 86,379 84,700 (1,679)
Total $6,311,993 $11,970,936 $16,915,796 $14,567,516 ($2,348,280)
PositionsGeneral Fund 28.00 28.00 28.00 28.00 0.00
Total 28.00 28.00 28.00 28.00 0.00
* 2017 Amended City Budget as of 8/29/2017. 2017 Amended PPRTA Budgets for maintenance as of 04/12/2017 and 7/12/2017 includes additional sales tax revenue for 2016 and 2017.
1 Following PPRTA’s budgeting practices, the 2017 Amended Budget includes 2016 unspent carryover, 2015 revenue carryover, and additional 2016 revenue. The 2018 Budget and 2017 Original Budget do not include carryover, so the 2018 Budget is $800,000 less than the 2017 Original Budget.
Significant Changes vs. 2017
• Increase of $66,800 to fund existing positions, pay for performance and movements within the salary structure, medical and dental cost adjustments, and Workers' Compensation rate adjustment
• Increase of $56,900 for the School Safety Program match• Addition of a General Fund Project of $250,000 for the Citywide Transportation Plan• Increase in General Fund - CIP of $866,000 for increased local grant match which includes $750,000 for
the I-25/Cimarron Landscaping project• Decrease of $2.7 million for grant awards for 2018
Traffic Engineering Page 23-22 2018 Budget
Traffic EngineeringTraffic Engineering’s primary mission is to provide safe and efficient movement of vehicles, cyclists, and pedestrians on the public rights-of-way. The Division works to improve mobility and traffic flow, maintain public safety, reduce travel times and mitigate congestion. Traffic Engineering is responsible for three major programs:
Traffic Signal Systems
• Manage signal timing, coordination and maintenance of the City’s 587 traffic signals and 76 CDOT signals• Respond to 24 hour emergency traffic signal malfunction repairs• Operate the incident management system (traffic cameras and message boards) on key arterials
throughout the City• Analyze requests for new traffic signals and additional phases to existing traffic signals• Manage school zone flashing beacon schedule and maintenance• Coordinate the annual traffic signal rebuild program• Maintain the priority green system for emergency first responders
Transportation Planning
• Plan and implement roadway, bike, and pedestrian projects and programs to develop a multi-modal transportation system
• Identify and monitor projects to manage roadway congestion and unsafe locations for all modes of transportation
• Identify funding for transportation and safety projects including grant applications to leverage local funds• Administer the School Safety Program • Conduct public process to develop regional, sub-regional and neighborhood projects• Address neighborhood parking and cut-through traffic issues• Conduct various studies and analyses for both traffic congestion and bicycling• Coordinate transportation planning efforts with city departments, government agencies, and citizen groups
in the Pikes Peak Region• Collect traffic data, analyze, generate traffic studies• Administer the City’s truck route program• Update and maintain the Bike Master Plan and other planning documents associated with Bike Planning• Develop and implement bike infrastructure and construct safety improvements where warranted• Institute bike programs that help promote and enhance bicycling in Colorado Springs
Traffic Operations
• Municipal Court Liaison for traffic related legal issues including research, field investigation, and representing the City of Colorado Springs in court
• Identify Transportation and Safety projects • Develop and coordinate Federal Highway Administration mandated compliance programs• Review roadway plans for capital projects and development for new roadway corridors, roundabouts, bike
lane projects• Provide school safety services related to school crossings and parking concerns/issues• Review and comment on traffic related Revocable Permits
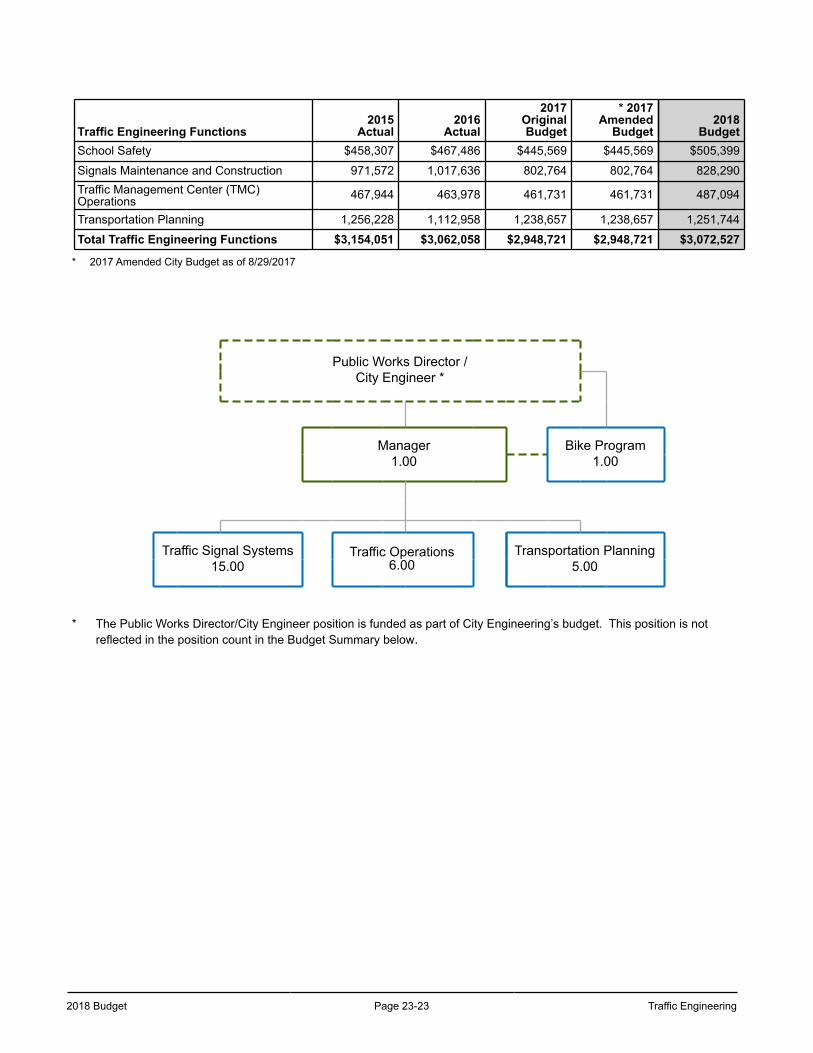
2018 Budget Page 23-23 Traffic Engineering
Traffic Engineering Functions2015
Actual2016
Actual
2017OriginalBudget
* 2017Amended
Budget2018
BudgetSchool Safety $458,307 $467,486 $445,569 $445,569 $505,399
Signals Maintenance and Construction 971,572 1,017,636 802,764 802,764 828,290Traffic Management Center (TMC)Operations 467,944 463,978 461,731 461,731 487,094
Transportation Planning 1,256,228 1,112,958 1,238,657 1,238,657 1,251,744
Total Traffic Engineering Functions $3,154,051 $3,062,058 $2,948,721 $2,948,721 $3,072,527
* 2017 Amended City Budget as of 8/29/2017
Public Works Director /City Engineer *
Manager1.00
Bike Program1.00
Traffic Signal Systems15.00
Traffic Operations6.00
Transportation Planning5.00
* The Public Works Director/City Engineer position is funded as part of City Engineering’s budget. This position is not reflected in the position count in the Budget Summary below.
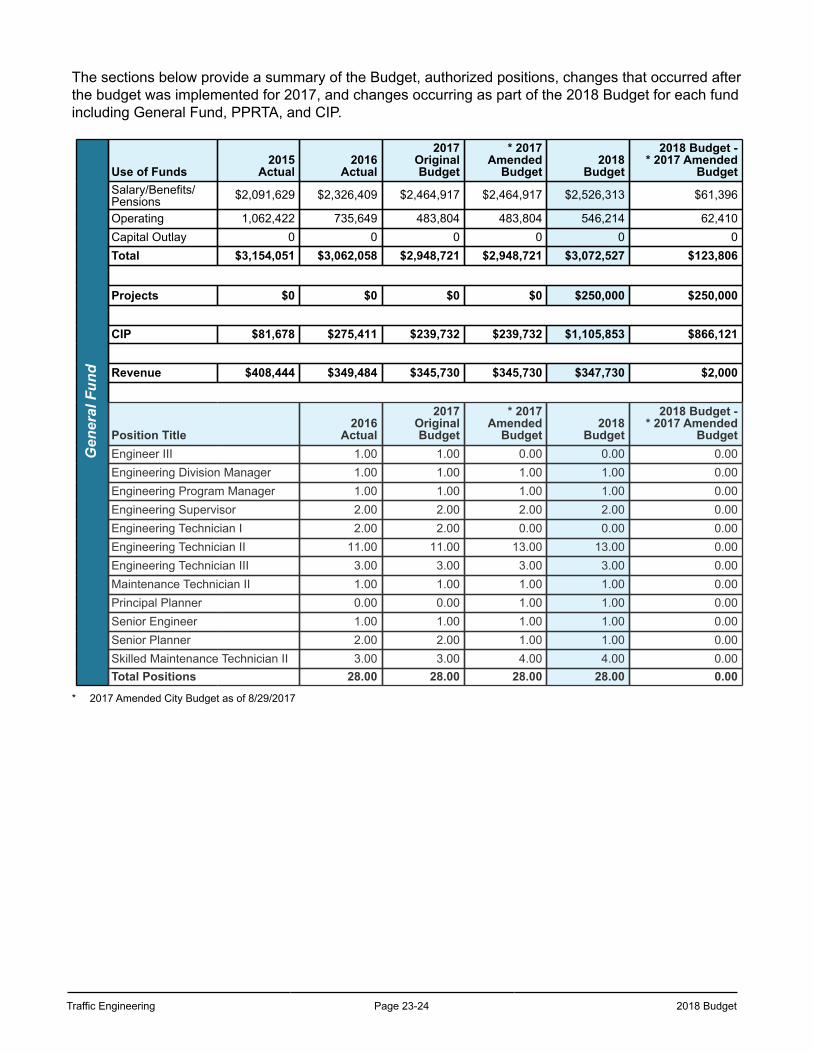
Traffic Engineering Page 23-24 2018 Budget
The sections below provide a summary of the Budget, authorized positions, changes that occurred after the budget was implemented for 2017, and changes occurring as part of the 2018 Budget for each fund including General Fund, PPRTA, and CIP.
Gen
eral
Fun
d
Use of Funds2015
Actual2016
Actual
2017OriginalBudget
* 2017Amended
Budget2018
Budget
2018 Budget -* 2017 Amended
BudgetSalary/Benefits/Pensions $2,091,629 $2,326,409 $2,464,917 $2,464,917 $2,526,313 $61,396
Operating 1,062,422 735,649 483,804 483,804 546,214 62,410Capital Outlay 0 0 0 0 0 0Total $3,154,051 $3,062,058 $2,948,721 $2,948,721 $3,072,527 $123,806
Projects $0 $0 $0 $0 $250,000 $250,000
CIP $81,678 $275,411 $239,732 $239,732 $1,105,853 $866,121
Revenue $408,444 $349,484 $345,730 $345,730 $347,730 $2,000
Position Title2016
Actual
2017OriginalBudget
* 2017Amended
Budget2018
Budget
2018 Budget -* 2017 Amended
BudgetEngineer III 1.00 1.00 0.00 0.00 0.00Engineering Division Manager 1.00 1.00 1.00 1.00 0.00Engineering Program Manager 1.00 1.00 1.00 1.00 0.00Engineering Supervisor 2.00 2.00 2.00 2.00 0.00Engineering Technician I 2.00 2.00 0.00 0.00 0.00Engineering Technician II 11.00 11.00 13.00 13.00 0.00Engineering Technician III 3.00 3.00 3.00 3.00 0.00Maintenance Technician II 1.00 1.00 1.00 1.00 0.00Principal Planner 0.00 0.00 1.00 1.00 0.00Senior Engineer 1.00 1.00 1.00 1.00 0.00Senior Planner 2.00 2.00 1.00 1.00 0.00Skilled Maintenance Technician II 3.00 3.00 4.00 4.00 0.00Total Positions 28.00 28.00 28.00 28.00 0.00
* 2017 Amended City Budget as of 8/29/2017
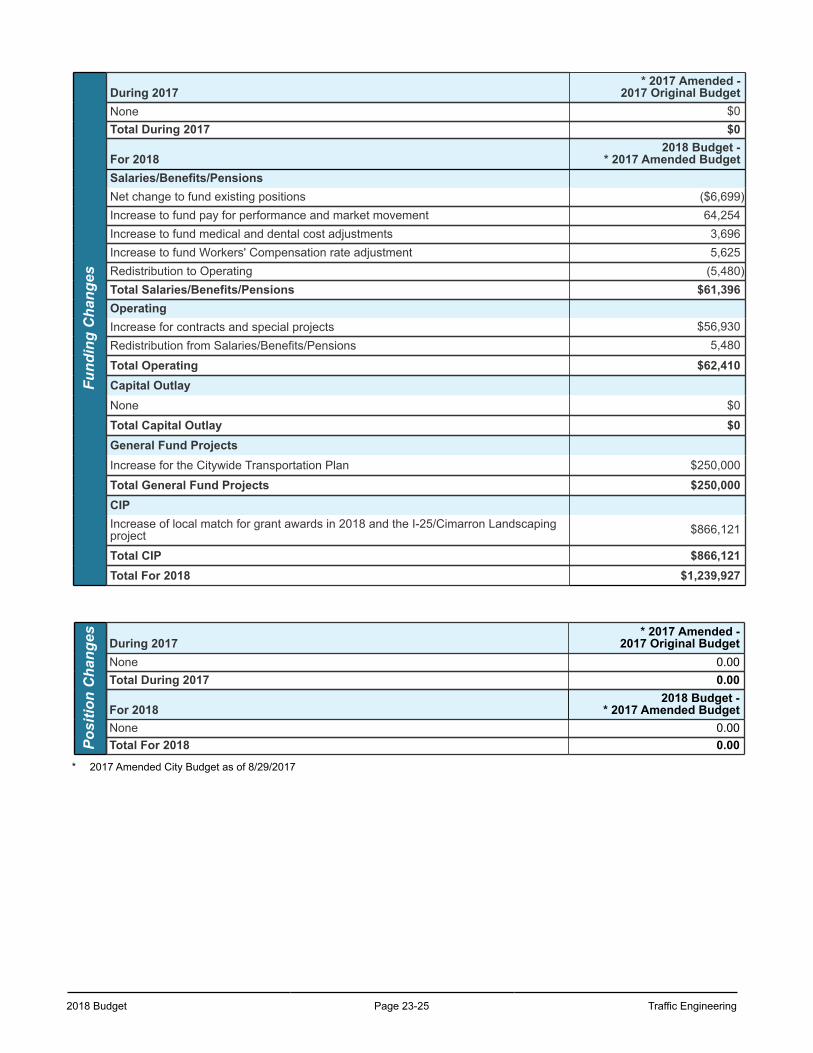
2018 Budget Page 23-25 Traffic Engineering
Fund
ing
Cha
nges
During 2017* 2017 Amended -
2017 Original BudgetNone $0Total During 2017 $0
For 20182018 Budget -
* 2017 Amended BudgetSalaries/Benefits/PensionsNet change to fund existing positions ($6,699)Increase to fund pay for performance and market movement 64,254Increase to fund medical and dental cost adjustments 3,696Increase to fund Workers' Compensation rate adjustment 5,625Redistribution to Operating (5,480)Total Salaries/Benefits/Pensions $61,396OperatingIncrease for contracts and special projects $56,930Redistribution from Salaries/Benefits/Pensions 5,480
Total Operating $62,410Capital OutlayNone $0
Total Capital Outlay $0General Fund ProjectsIncrease for the Citywide Transportation Plan $250,000
Total General Fund Projects $250,000CIPIncrease of local match for grant awards in 2018 and the I-25/Cimarron Landscapingproject $866,121
Total CIP $866,121Total For 2018 $1,239,927
Posi
tion
Cha
nges During 2017
* 2017 Amended -2017 Original Budget
None 0.00Total During 2017 0.00
For 20182018 Budget -
* 2017 Amended BudgetNone 0.00Total For 2018 0.00
* 2017 Amended City Budget as of 8/29/2017
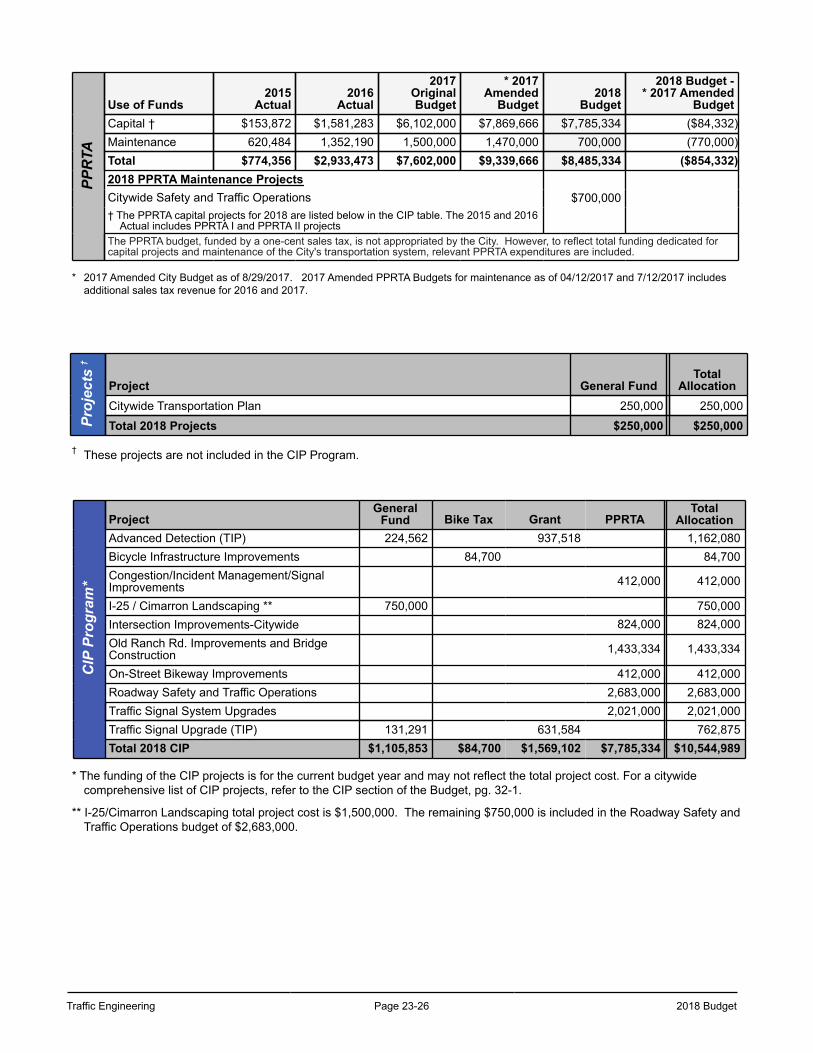
Traffic Engineering Page 23-26 2018 Budget
PPR
TAUse of Funds
2015Actual
2016Actual
2017OriginalBudget
* 2017Amended
Budget2018
Budget
2018 Budget -* 2017 Amended
BudgetCapital † $153,872 $1,581,283 $6,102,000 $7,869,666 $7,785,334 ($84,332)Maintenance 620,484 1,352,190 1,500,000 1,470,000 700,000 (770,000)Total $774,356 $2,933,473 $7,602,000 $9,339,666 $8,485,334 ($854,332)2018 PPRTA Maintenance ProjectsCitywide Safety and Traffic Operations $700,000† The PPRTA capital projects for 2018 are listed below in the CIP table. The 2015 and 2016
Actual includes PPRTA I and PPRTA II projectsThe PPRTA budget, funded by a one-cent sales tax, is not appropriated by the City. However, to reflect total funding dedicated forcapital projects and maintenance of the City's transportation system, relevant PPRTA expenditures are included.
* 2017 Amended City Budget as of 8/29/2017. 2017 Amended PPRTA Budgets for maintenance as of 04/12/2017 and 7/12/2017 includes additional sales tax revenue for 2016 and 2017.
Proj
ects
†
Project General FundTotal
AllocationCitywide Transportation Plan 250,000 250,000
Total 2018 Projects $250,000 $250,000
† These projects are not included in the CIP Program.
CIP
Pro
gram
*
ProjectGeneral
Fund Bike Tax Grant PPRTATotal
AllocationAdvanced Detection (TIP) 224,562 937,518 1,162,080Bicycle Infrastructure Improvements 84,700 84,700Congestion/Incident Management/SignalImprovements 412,000 412,000
I-25 / Cimarron Landscaping ** 750,000 750,000Intersection Improvements-Citywide 824,000 824,000Old Ranch Rd. Improvements and BridgeConstruction 1,433,334 1,433,334
On-Street Bikeway Improvements 412,000 412,000Roadway Safety and Traffic Operations 2,683,000 2,683,000Traffic Signal System Upgrades 2,021,000 2,021,000Traffic Signal Upgrade (TIP) 131,291 631,584 762,875Total 2018 CIP $1,105,853 $84,700 $1,569,102 $7,785,334 $10,544,989
* The funding of the CIP projects is for the current budget year and may not reflect the total project cost. For a citywide comprehensive list of CIP projects, refer to the CIP section of the Budget, pg. 32-1.
** I-25/Cimarron Landscaping total project cost is $1,500,000. The remaining $750,000 is included in the Roadway Safety and Traffic Operations budget of $2,683,000.
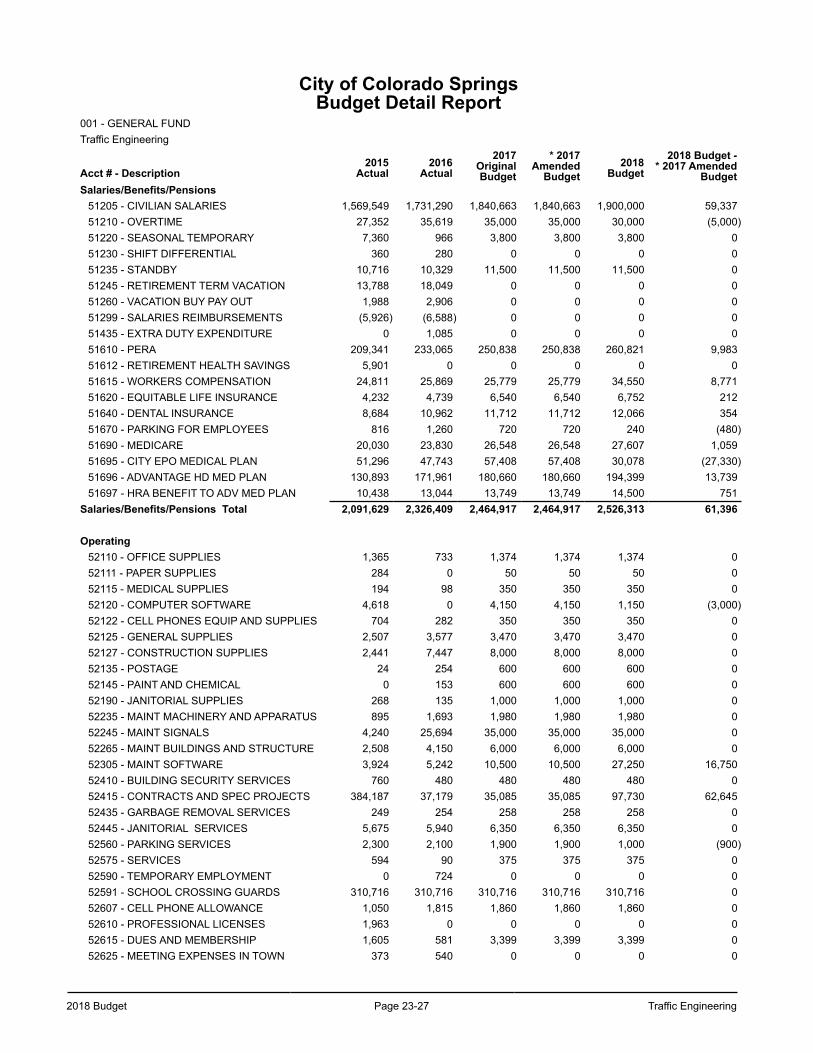
2018 Budget Page 23-27 Traffic Engineering
City of Colorado SpringsBudget Detail Report
001 - GENERAL FUNDTraffic Engineering
Acct # - Description2015
Actual2016
Actual2017
OriginalBudget
* 2017Amended
Budget2018
Budget2018 Budget -
* 2017 AmendedBudget
Salaries/Benefits/Pensions51205 - CIVILIAN SALARIES 1,569,549 1,731,290 1,840,663 1,840,663 1,900,000 59,33751210 - OVERTIME 27,352 35,619 35,000 35,000 30,000 (5,000)51220 - SEASONAL TEMPORARY 7,360 966 3,800 3,800 3,800 051230 - SHIFT DIFFERENTIAL 360 280 0 0 0 051235 - STANDBY 10,716 10,329 11,500 11,500 11,500 051245 - RETIREMENT TERM VACATION 13,788 18,049 0 0 0 051260 - VACATION BUY PAY OUT 1,988 2,906 0 0 0 051299 - SALARIES REIMBURSEMENTS (5,926) (6,588) 0 0 0 051435 - EXTRA DUTY EXPENDITURE 0 1,085 0 0 0 051610 - PERA 209,341 233,065 250,838 250,838 260,821 9,98351612 - RETIREMENT HEALTH SAVINGS 5,901 0 0 0 0 051615 - WORKERS COMPENSATION 24,811 25,869 25,779 25,779 34,550 8,77151620 - EQUITABLE LIFE INSURANCE 4,232 4,739 6,540 6,540 6,752 21251640 - DENTAL INSURANCE 8,684 10,962 11,712 11,712 12,066 35451670 - PARKING FOR EMPLOYEES 816 1,260 720 720 240 (480)51690 - MEDICARE 20,030 23,830 26,548 26,548 27,607 1,05951695 - CITY EPO MEDICAL PLAN 51,296 47,743 57,408 57,408 30,078 (27,330)51696 - ADVANTAGE HD MED PLAN 130,893 171,961 180,660 180,660 194,399 13,73951697 - HRA BENEFIT TO ADV MED PLAN 10,438 13,044 13,749 13,749 14,500 751
Salaries/Benefits/Pensions Total 2,091,629 2,326,409 2,464,917 2,464,917 2,526,313 61,396
Operating52110 - OFFICE SUPPLIES 1,365 733 1,374 1,374 1,374 052111 - PAPER SUPPLIES 284 0 50 50 50 052115 - MEDICAL SUPPLIES 194 98 350 350 350 052120 - COMPUTER SOFTWARE 4,618 0 4,150 4,150 1,150 (3,000)52122 - CELL PHONES EQUIP AND SUPPLIES 704 282 350 350 350 052125 - GENERAL SUPPLIES 2,507 3,577 3,470 3,470 3,470 052127 - CONSTRUCTION SUPPLIES 2,441 7,447 8,000 8,000 8,000 052135 - POSTAGE 24 254 600 600 600 052145 - PAINT AND CHEMICAL 0 153 600 600 600 052190 - JANITORIAL SUPPLIES 268 135 1,000 1,000 1,000 052235 - MAINT MACHINERY AND APPARATUS 895 1,693 1,980 1,980 1,980 052245 - MAINT SIGNALS 4,240 25,694 35,000 35,000 35,000 052265 - MAINT BUILDINGS AND STRUCTURE 2,508 4,150 6,000 6,000 6,000 052305 - MAINT SOFTWARE 3,924 5,242 10,500 10,500 27,250 16,75052410 - BUILDING SECURITY SERVICES 760 480 480 480 480 052415 - CONTRACTS AND SPEC PROJECTS 384,187 37,179 35,085 35,085 97,730 62,64552435 - GARBAGE REMOVAL SERVICES 249 254 258 258 258 052445 - JANITORIAL SERVICES 5,675 5,940 6,350 6,350 6,350 052560 - PARKING SERVICES 2,300 2,100 1,900 1,900 1,000 (900)52575 - SERVICES 594 90 375 375 375 052590 - TEMPORARY EMPLOYMENT 0 724 0 0 0 052591 - SCHOOL CROSSING GUARDS 310,716 310,716 310,716 310,716 310,716 052607 - CELL PHONE ALLOWANCE 1,050 1,815 1,860 1,860 1,860 052610 - PROFESSIONAL LICENSES 1,963 0 0 0 0 052615 - DUES AND MEMBERSHIP 1,605 581 3,399 3,399 3,399 052625 - MEETING EXPENSES IN TOWN 373 540 0 0 0 0
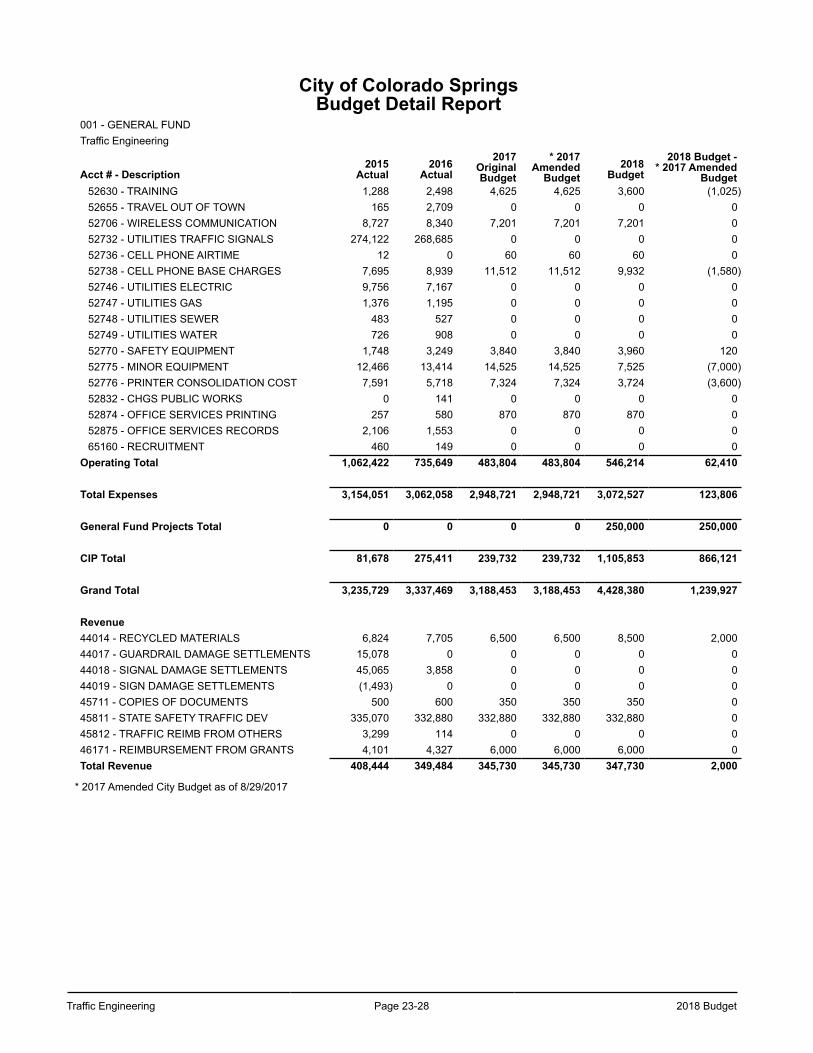
Traffic Engineering Page 23-28 2018 Budget
City of Colorado SpringsBudget Detail Report
001 - GENERAL FUNDTraffic Engineering
Acct # - Description2015
Actual2016
Actual2017
OriginalBudget
* 2017Amended
Budget2018
Budget2018 Budget -
* 2017 AmendedBudget
52630 - TRAINING 1,288 2,498 4,625 4,625 3,600 (1,025)52655 - TRAVEL OUT OF TOWN 165 2,709 0 0 0 052706 - WIRELESS COMMUNICATION 8,727 8,340 7,201 7,201 7,201 052732 - UTILITIES TRAFFIC SIGNALS 274,122 268,685 0 0 0 052736 - CELL PHONE AIRTIME 12 0 60 60 60 052738 - CELL PHONE BASE CHARGES 7,695 8,939 11,512 11,512 9,932 (1,580)52746 - UTILITIES ELECTRIC 9,756 7,167 0 0 0 052747 - UTILITIES GAS 1,376 1,195 0 0 0 052748 - UTILITIES SEWER 483 527 0 0 0 052749 - UTILITIES WATER 726 908 0 0 0 052770 - SAFETY EQUIPMENT 1,748 3,249 3,840 3,840 3,960 12052775 - MINOR EQUIPMENT 12,466 13,414 14,525 14,525 7,525 (7,000)52776 - PRINTER CONSOLIDATION COST 7,591 5,718 7,324 7,324 3,724 (3,600)52832 - CHGS PUBLIC WORKS 0 141 0 0 0 052874 - OFFICE SERVICES PRINTING 257 580 870 870 870 052875 - OFFICE SERVICES RECORDS 2,106 1,553 0 0 0 065160 - RECRUITMENT 460 149 0 0 0 0
Operating Total 1,062,422 735,649 483,804 483,804 546,214 62,410
Total Expenses 3,154,051 3,062,058 2,948,721 2,948,721 3,072,527 123,806
General Fund Projects Total 0 0 0 0 250,000 250,000
CIP Total 81,678 275,411 239,732 239,732 1,105,853 866,121
Grand Total 3,235,729 3,337,469 3,188,453 3,188,453 4,428,380 1,239,927
Revenue44014 - RECYCLED MATERIALS 6,824 7,705 6,500 6,500 8,500 2,00044017 - GUARDRAIL DAMAGE SETTLEMENTS 15,078 0 0 0 0 044018 - SIGNAL DAMAGE SETTLEMENTS 45,065 3,858 0 0 0 044019 - SIGN DAMAGE SETTLEMENTS (1,493) 0 0 0 0 045711 - COPIES OF DOCUMENTS 500 600 350 350 350 045811 - STATE SAFETY TRAFFIC DEV 335,070 332,880 332,880 332,880 332,880 045812 - TRAFFIC REIMB FROM OTHERS 3,299 114 0 0 0 046171 - REIMBURSEMENT FROM GRANTS 4,101 4,327 6,000 6,000 6,000 0Total Revenue 408,444 349,484 345,730 345,730 347,730 2,000
* 2017 Amended City Budget as of 8/29/2017
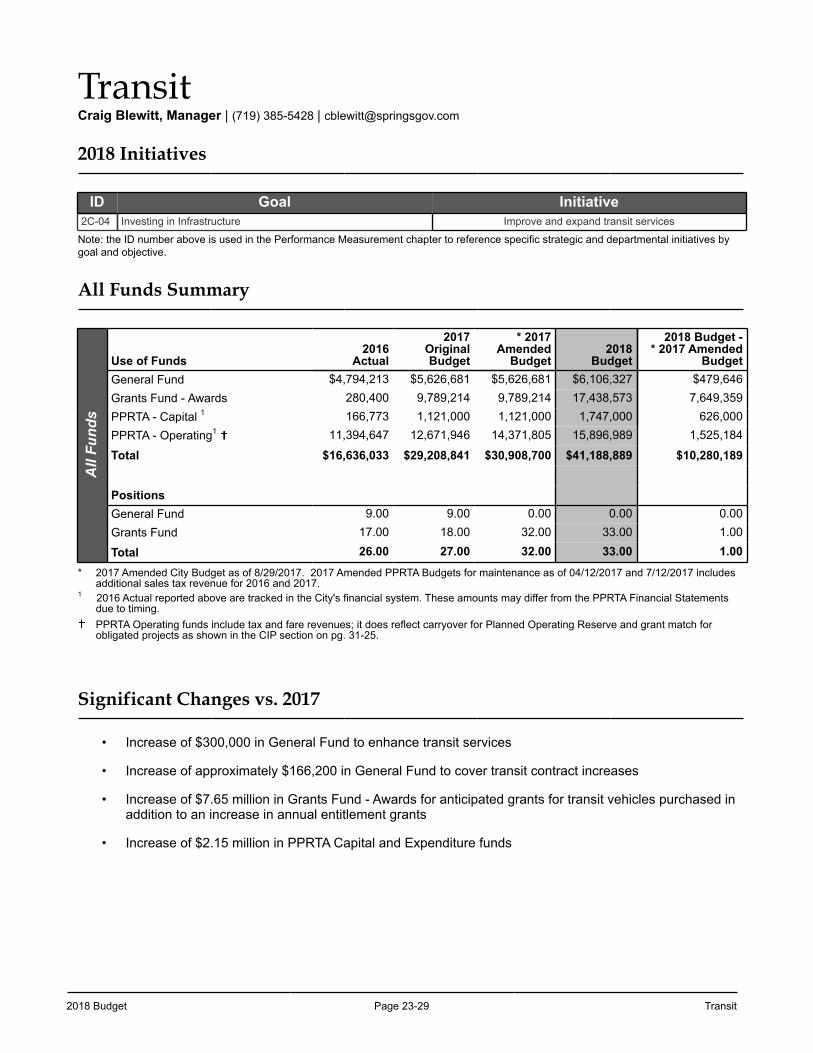
2018 Budget Page 23-29 Transit
TransitCraig Blewitt, Manager | (719) 385-5428 | [email protected]
2018 Initiatives
ID Goal Initiative2C-04 Investing in Infrastructure Improve and expand transit services
Note: the ID number above is used in the Performance Measurement chapter to reference specific strategic and departmental initiatives by goal and objective.
All Funds Summary
All
Fund
s
Use of Funds2016
Actual
2017OriginalBudget
* 2017Amended
Budget2018
Budget
2018 Budget -* 2017 Amended
BudgetGeneral Fund $4,794,213 $5,626,681 $5,626,681 $6,106,327 $479,646Grants Fund - Awards 280,400 9,789,214 9,789,214 17,438,573 7,649,359PPRTA - Capital 1 166,773 1,121,000 1,121,000 1,747,000 626,000PPRTA - Operating1 11,394,647 12,671,946 14,371,805 15,896,989 1,525,184
Total $16,636,033 $29,208,841 $30,908,700 $41,188,889 $10,280,189
PositionsGeneral Fund 9.00 9.00 0.00 0.00 0.00Grants Fund 17.00 18.00 32.00 33.00 1.00
Total 26.00 27.00 32.00 33.00 1.00
* 2017 Amended City Budget as of 8/29/2017. 2017 Amended PPRTA Budgets for maintenance as of 04/12/2017 and 7/12/2017 includes additional sales tax revenue for 2016 and 2017.
1 2016 Actual reported above are tracked in the City's financial system. These amounts may differ from the PPRTA Financial Statements due to timing.PPRTA Operating funds include tax and fare revenues; it does reflect carryover for Planned Operating Reserve and grant match for obligated projects as shown in the CIP section on pg. 31-25.
Significant Changes vs. 2017
• Increase of $300,000 in General Fund to enhance transit services
• Increase of approximately $166,200 in General Fund to cover transit contract increases
• Increase of $7.65 million in Grants Fund - Awards for anticipated grants for transit vehicles purchased in addition to an increase in annual entitlement grants
• Increase of $2.15 million in PPRTA Capital and Expenditure funds
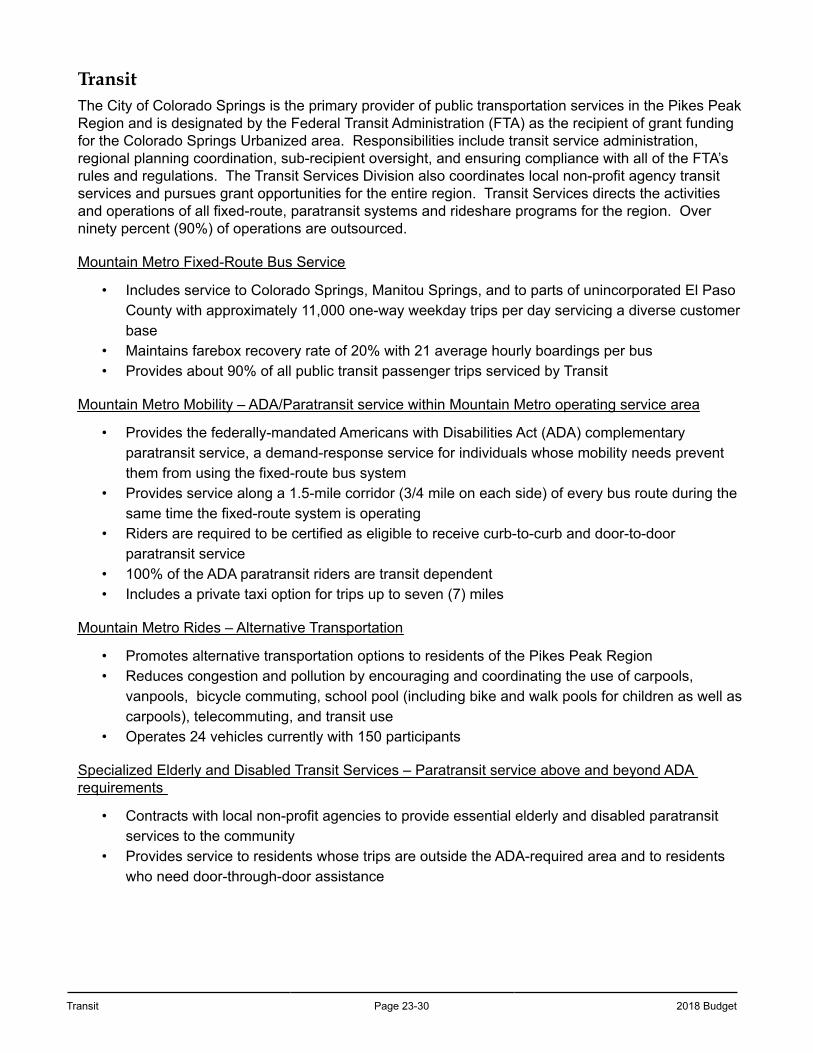
Transit Page 23-30 2018 Budget
Transit The City of Colorado Springs is the primary provider of public transportation services in the Pikes Peak Region and is designated by the Federal Transit Administration (FTA) as the recipient of grant funding for the Colorado Springs Urbanized area. Responsibilities include transit service administration, regional planning coordination, sub-recipient oversight, and ensuring compliance with all of the FTA’s rules and regulations. The Transit Services Division also coordinates local non-profit agency transit services and pursues grant opportunities for the entire region. Transit Services directs the activities and operations of all fixed-route, paratransit systems and rideshare programs for the region. Over ninety percent (90%) of operations are outsourced.
Mountain Metro Fixed-Route Bus Service
• Includes service to Colorado Springs, Manitou Springs, and to parts of unincorporated El Paso County with approximately 11,000 one-way weekday trips per day servicing a diverse customer base
• Maintains farebox recovery rate of 20% with 21 average hourly boardings per bus • Provides about 90% of all public transit passenger trips serviced by Transit
Mountain Metro Mobility – ADA/Paratransit service within Mountain Metro operating service area
• Provides the federally-mandated Americans with Disabilities Act (ADA) complementary paratransit service, a demand-response service for individuals whose mobility needs prevent them from using the fixed-route bus system
• Provides service along a 1.5-mile corridor (3/4 mile on each side) of every bus route during the same time the fixed-route system is operating
• Riders are required to be certified as eligible to receive curb-to-curb and door-to-door paratransit service
• 100% of the ADA paratransit riders are transit dependent• Includes a private taxi option for trips up to seven (7) miles
Mountain Metro Rides – Alternative Transportation
• Promotes alternative transportation options to residents of the Pikes Peak Region• Reduces congestion and pollution by encouraging and coordinating the use of carpools,
vanpools, bicycle commuting, school pool (including bike and walk pools for children as well as carpools), telecommuting, and transit use
• Operates 24 vehicles currently with 150 participants
Specialized Elderly and Disabled Transit Services – Paratransit service above and beyond ADA requirements
• Contracts with local non-profit agencies to provide essential elderly and disabled paratransit services to the community
• Provides service to residents whose trips are outside the ADA-required area and to residents who need door-through-door assistance
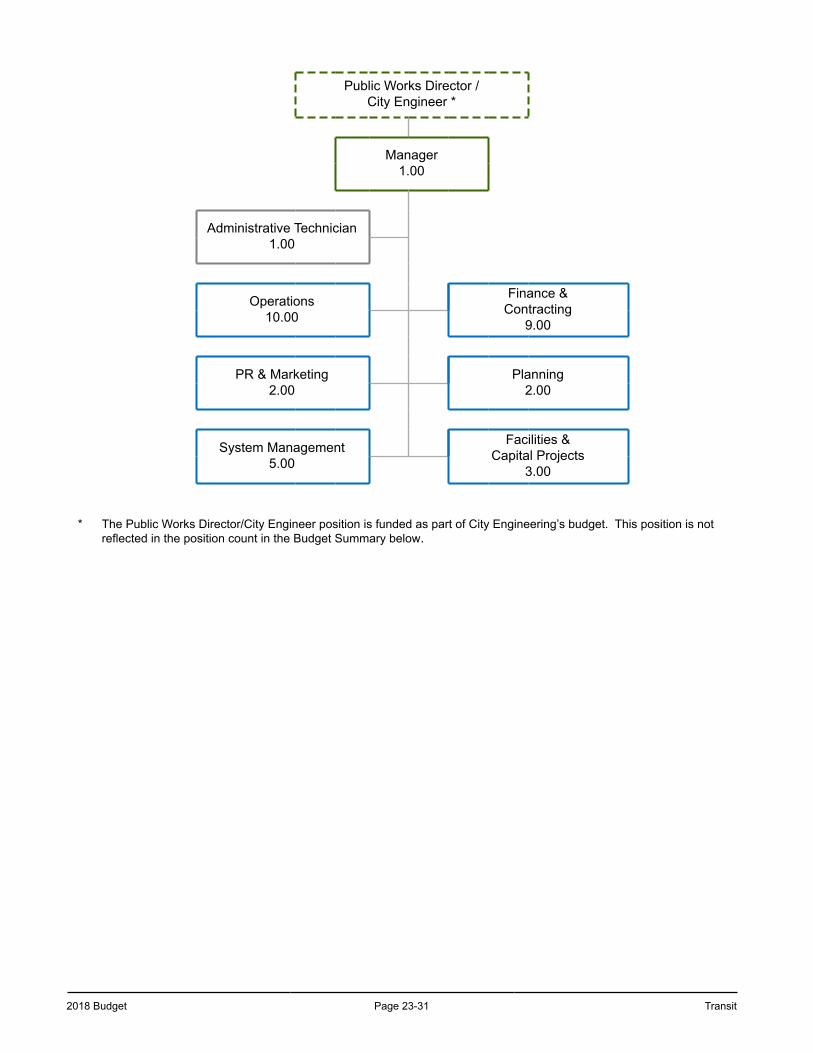
2018 Budget Page 23-31 Transit
Public Works Director /City Engineer *
Manager1.00
Administrative Technician1.00
Operations10.00
Finance & Contracting
9.00
PR & Marketing2.00
Planning2.00
System Management5.00
Facilities &Capital Projects
3.00
* The Public Works Director/City Engineer position is funded as part of City Engineering’s budget. This position is not reflected in the position count in the Budget Summary below.
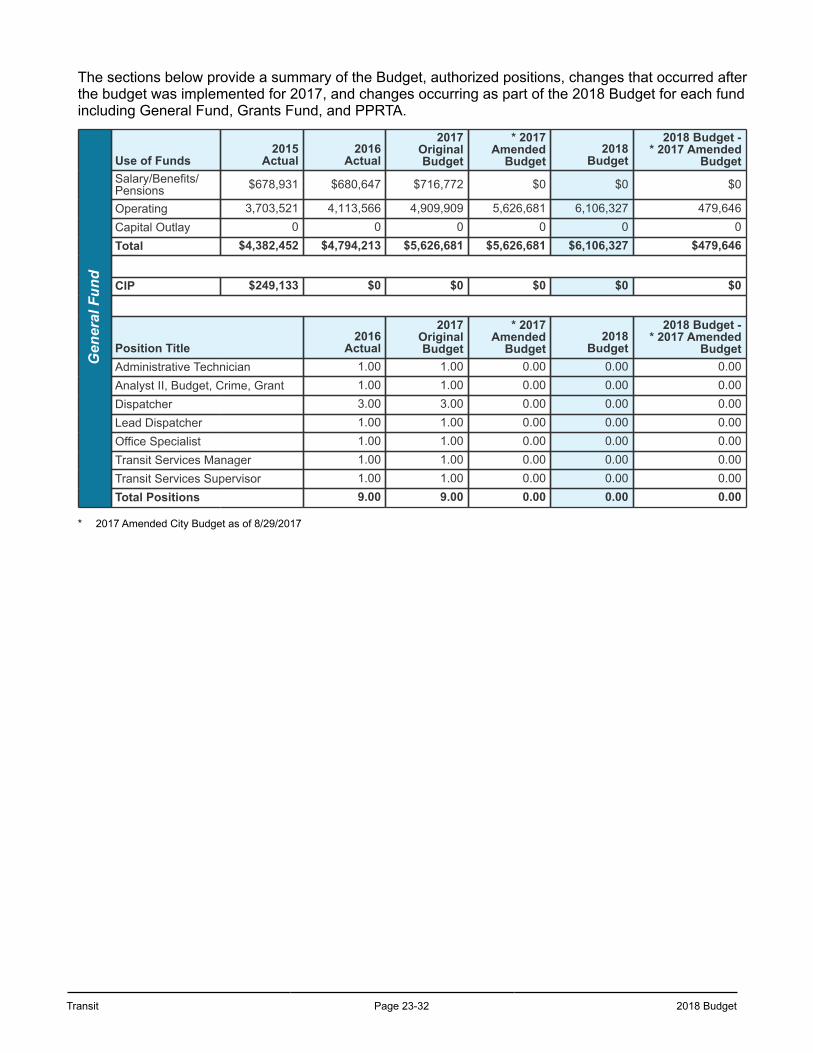
Transit Page 23-32 2018 Budget
The sections below provide a summary of the Budget, authorized positions, changes that occurred after the budget was implemented for 2017, and changes occurring as part of the 2018 Budget for each fund including General Fund, Grants Fund, and PPRTA.
Gen
eral
Fun
d
Use of Funds2015
Actual2016
Actual
2017OriginalBudget
* 2017Amended
Budget2018
Budget
2018 Budget -* 2017 Amended
BudgetSalary/Benefits/Pensions $678,931 $680,647 $716,772 $0 $0 $0
Operating 3,703,521 4,113,566 4,909,909 5,626,681 6,106,327 479,646Capital Outlay 0 0 0 0 0 0Total $4,382,452 $4,794,213 $5,626,681 $5,626,681 $6,106,327 $479,646
CIP $249,133 $0 $0 $0 $0 $0
Position Title2016
Actual
2017OriginalBudget
* 2017Amended
Budget2018
Budget
2018 Budget -* 2017 Amended
BudgetAdministrative Technician 1.00 1.00 0.00 0.00 0.00Analyst II, Budget, Crime, Grant 1.00 1.00 0.00 0.00 0.00Dispatcher 3.00 3.00 0.00 0.00 0.00Lead Dispatcher 1.00 1.00 0.00 0.00 0.00Office Specialist 1.00 1.00 0.00 0.00 0.00Transit Services Manager 1.00 1.00 0.00 0.00 0.00Transit Services Supervisor 1.00 1.00 0.00 0.00 0.00Total Positions 9.00 9.00 0.00 0.00 0.00
* 2017 Amended City Budget as of 8/29/2017
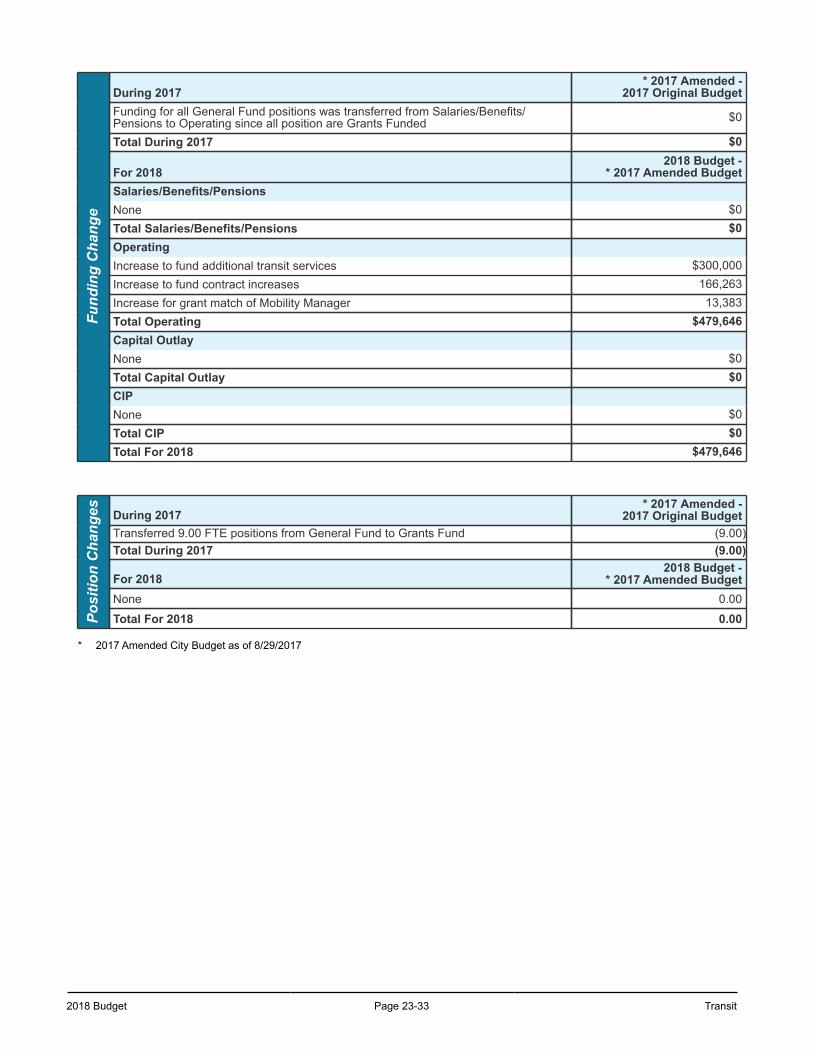
2018 Budget Page 23-33 Transit
Fund
ing
Cha
nge
During 2017* 2017 Amended -
2017 Original BudgetFunding for all General Fund positions was transferred from Salaries/Benefits/Pensions to Operating since all position are Grants Funded $0
Total During 2017 $0
For 20182018 Budget -
* 2017 Amended BudgetSalaries/Benefits/PensionsNone $0Total Salaries/Benefits/Pensions $0OperatingIncrease to fund additional transit services $300,000Increase to fund contract increases 166,263Increase for grant match of Mobility Manager 13,383Total Operating $479,646Capital OutlayNone $0Total Capital Outlay $0CIPNone $0Total CIP $0Total For 2018 $479,646
Posi
tion
Cha
nges During 2017
* 2017 Amended -2017 Original Budget
Transferred 9.00 FTE positions from General Fund to Grants Fund (9.00)Total During 2017 (9.00)
For 20182018 Budget -
* 2017 Amended BudgetNone 0.00
Total For 2018 0.00
* 2017 Amended City Budget as of 8/29/2017
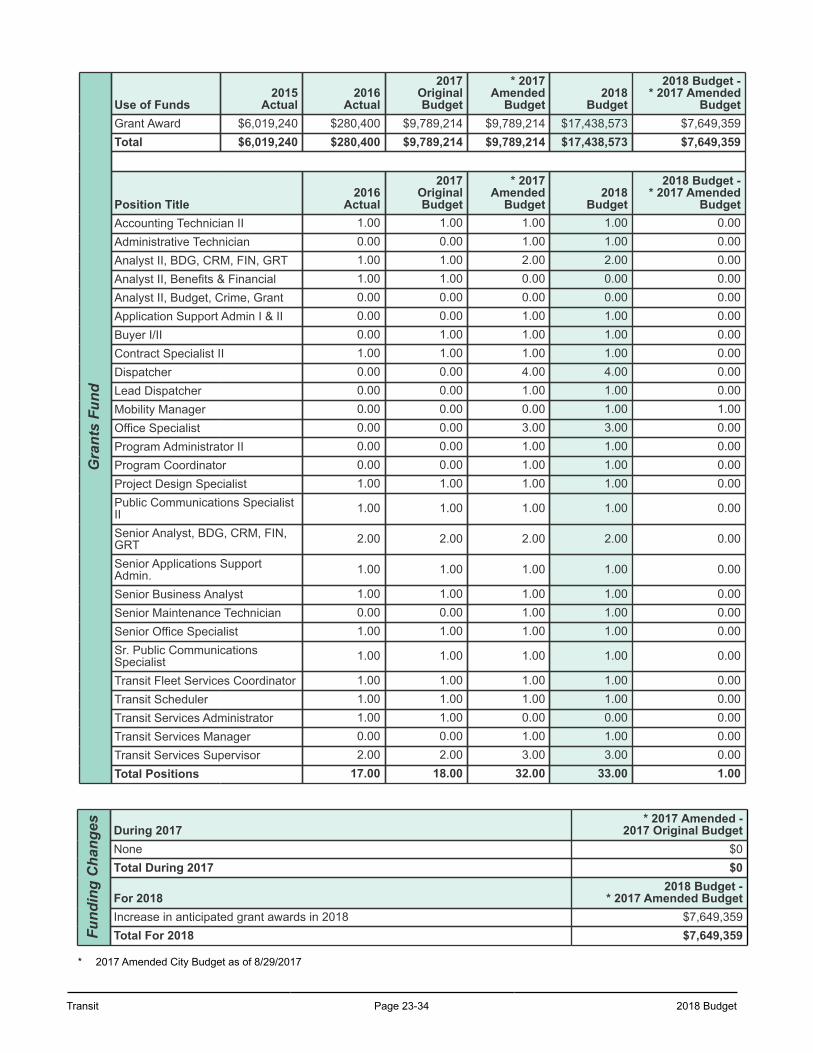
Transit Page 23-34 2018 Budget
Gra
nts
Fund
Use of Funds2015
Actual2016
Actual
2017OriginalBudget
* 2017Amended
Budget2018
Budget
2018 Budget -* 2017 Amended
BudgetGrant Award $6,019,240 $280,400 $9,789,214 $9,789,214 $17,438,573 $7,649,359Total $6,019,240 $280,400 $9,789,214 $9,789,214 $17,438,573 $7,649,359
Position Title2016
Actual
2017OriginalBudget
* 2017Amended
Budget2018
Budget
2018 Budget -* 2017 Amended
BudgetAccounting Technician II 1.00 1.00 1.00 1.00 0.00Administrative Technician 0.00 0.00 1.00 1.00 0.00Analyst II, BDG, CRM, FIN, GRT 1.00 1.00 2.00 2.00 0.00Analyst II, Benefits & Financial 1.00 1.00 0.00 0.00 0.00Analyst II, Budget, Crime, Grant 0.00 0.00 0.00 0.00 0.00Application Support Admin I & II 0.00 0.00 1.00 1.00 0.00Buyer I/II 0.00 1.00 1.00 1.00 0.00Contract Specialist II 1.00 1.00 1.00 1.00 0.00Dispatcher 0.00 0.00 4.00 4.00 0.00Lead Dispatcher 0.00 0.00 1.00 1.00 0.00Mobility Manager 0.00 0.00 0.00 1.00 1.00Office Specialist 0.00 0.00 3.00 3.00 0.00Program Administrator II 0.00 0.00 1.00 1.00 0.00Program Coordinator 0.00 0.00 1.00 1.00 0.00Project Design Specialist 1.00 1.00 1.00 1.00 0.00Public Communications SpecialistII 1.00 1.00 1.00 1.00 0.00
Senior Analyst, BDG, CRM, FIN,GRT 2.00 2.00 2.00 2.00 0.00
Senior Applications SupportAdmin. 1.00 1.00 1.00 1.00 0.00
Senior Business Analyst 1.00 1.00 1.00 1.00 0.00Senior Maintenance Technician 0.00 0.00 1.00 1.00 0.00Senior Office Specialist 1.00 1.00 1.00 1.00 0.00Sr. Public CommunicationsSpecialist 1.00 1.00 1.00 1.00 0.00
Transit Fleet Services Coordinator 1.00 1.00 1.00 1.00 0.00Transit Scheduler 1.00 1.00 1.00 1.00 0.00Transit Services Administrator 1.00 1.00 0.00 0.00 0.00Transit Services Manager 0.00 0.00 1.00 1.00 0.00Transit Services Supervisor 2.00 2.00 3.00 3.00 0.00Total Positions 17.00 18.00 32.00 33.00 1.00
Fund
ing
Cha
nges During 2017
* 2017 Amended -2017 Original Budget
None $0Total During 2017 $0
For 20182018 Budget -
* 2017 Amended BudgetIncrease in anticipated grant awards in 2018 $7,649,359Total For 2018 $7,649,359
* 2017 Amended City Budget as of 8/29/2017
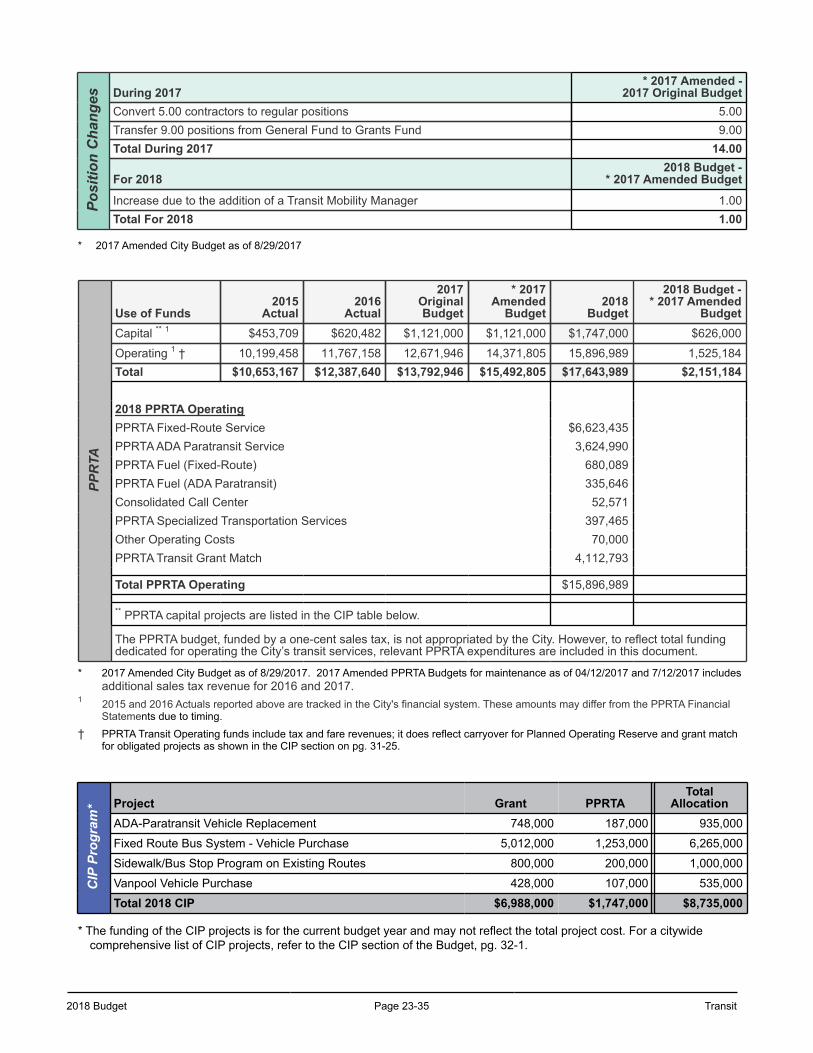
2018 Budget Page 23-35 Transit
Posi
tion
Cha
nges During 2017
* 2017 Amended -2017 Original Budget
Convert 5.00 contractors to regular positions 5.00Transfer 9.00 positions from General Fund to Grants Fund 9.00Total During 2017 14.00
For 20182018 Budget -
* 2017 Amended Budget
Increase due to the addition of a Transit Mobility Manager 1.00Total For 2018 1.00
* 2017 Amended City Budget as of 8/29/2017
PPR
TA
Use of Funds2015
Actual2016
Actual
2017OriginalBudget
* 2017Amended
Budget2018
Budget
2018 Budget -* 2017 Amended
BudgetCapital ** 1 $453,709 $620,482 $1,121,000 $1,121,000 $1,747,000 $626,000
Operating 1 † 10,199,458 11,767,158 12,671,946 14,371,805 15,896,989 1,525,184Total $10,653,167 $12,387,640 $13,792,946 $15,492,805 $17,643,989 $2,151,184
2018 PPRTA OperatingPPRTA Fixed-Route Service $6,623,435PPRTA ADA Paratransit Service 3,624,990PPRTA Fuel (Fixed-Route) 680,089PPRTA Fuel (ADA Paratransit) 335,646Consolidated Call Center 52,571PPRTA Specialized Transportation Services 397,465Other Operating Costs 70,000PPRTA Transit Grant Match 4,112,793
Total PPRTA Operating $15,896,989
** PPRTA capital projects are listed in the CIP table below.
The PPRTA budget, funded by a one-cent sales tax, is not appropriated by the City. However, to reflect total fundingdedicated for operating the City’s transit services, relevant PPRTA expenditures are included in this document.
* 2017 Amended City Budget as of 8/29/2017. 2017 Amended PPRTA Budgets for maintenance as of 04/12/2017 and 7/12/2017 includes additional sales tax revenue for 2016 and 2017.
1 2015 and 2016 Actuals reported above are tracked in the City's financial system. These amounts may differ from the PPRTA Financial Statements due to timing.
† PPRTA Transit Operating funds include tax and fare revenues; it does reflect carryover for Planned Operating Reserve and grant match for obligated projects as shown in the CIP section on pg. 31-25.
CIP
Pro
gram
* Project Grant PPRTATotal
AllocationADA-Paratransit Vehicle Replacement 748,000 187,000 935,000
Fixed Route Bus System - Vehicle Purchase 5,012,000 1,253,000 6,265,000
Sidewalk/Bus Stop Program on Existing Routes 800,000 200,000 1,000,000
Vanpool Vehicle Purchase 428,000 107,000 535,000
Total 2018 CIP $6,988,000 $1,747,000 $8,735,000
* The funding of the CIP projects is for the current budget year and may not reflect the total project cost. For a citywide comprehensive list of CIP projects, refer to the CIP section of the Budget, pg. 32-1.
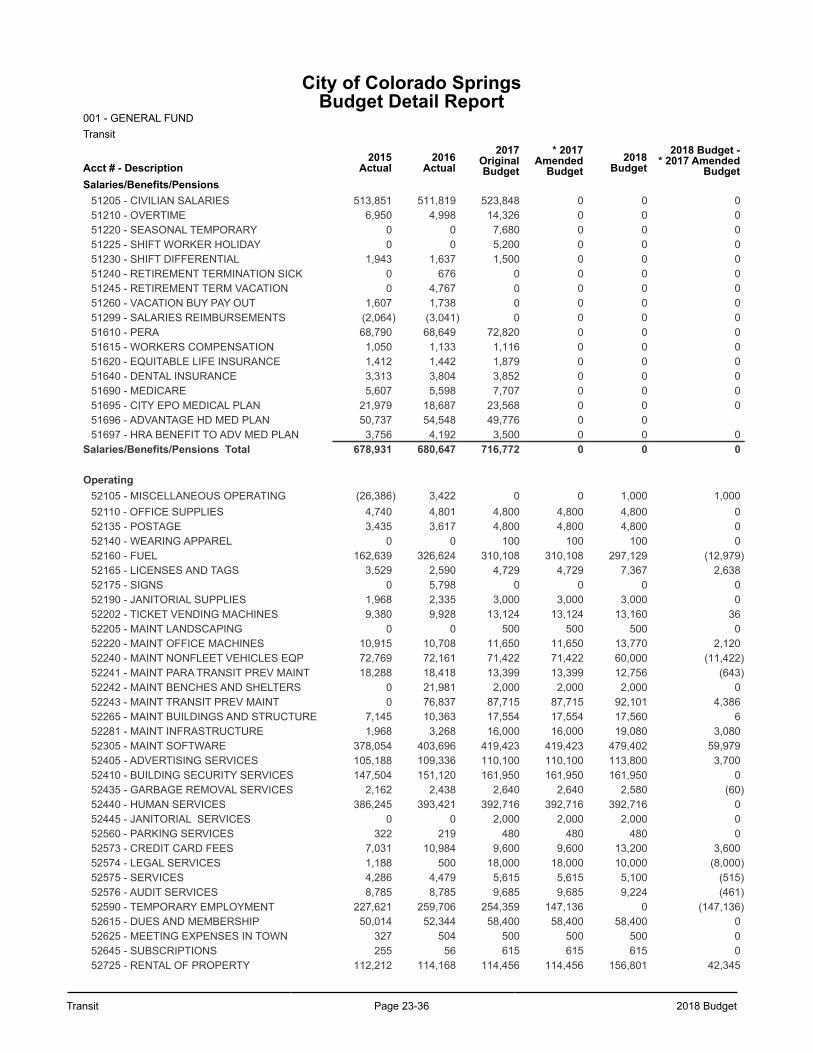
Transit Page 23-36 2018 Budget
City of Colorado SpringsBudget Detail Report
001 - GENERAL FUNDTransit
Acct # - Description2015
Actual2016
Actual2017
OriginalBudget
* 2017Amended
Budget2018
Budget2018 Budget -
* 2017 AmendedBudget
Salaries/Benefits/Pensions51205 - CIVILIAN SALARIES 513,851 511,819 523,848 0 0 051210 - OVERTIME 6,950 4,998 14,326 0 0 051220 - SEASONAL TEMPORARY 0 0 7,680 0 0 051225 - SHIFT WORKER HOLIDAY 0 0 5,200 0 0 051230 - SHIFT DIFFERENTIAL 1,943 1,637 1,500 0 0 051240 - RETIREMENT TERMINATION SICK 0 676 0 0 0 051245 - RETIREMENT TERM VACATION 0 4,767 0 0 0 051260 - VACATION BUY PAY OUT 1,607 1,738 0 0 0 051299 - SALARIES REIMBURSEMENTS (2,064) (3,041) 0 0 0 051610 - PERA 68,790 68,649 72,820 0 0 051615 - WORKERS COMPENSATION 1,050 1,133 1,116 0 0 051620 - EQUITABLE LIFE INSURANCE 1,412 1,442 1,879 0 0 051640 - DENTAL INSURANCE 3,313 3,804 3,852 0 0 051690 - MEDICARE 5,607 5,598 7,707 0 0 051695 - CITY EPO MEDICAL PLAN 21,979 18,687 23,568 0 0 051696 - ADVANTAGE HD MED PLAN 50,737 54,548 49,776 0 051697 - HRA BENEFIT TO ADV MED PLAN 3,756 4,192 3,500 0 0 0
Salaries/Benefits/Pensions Total 678,931 680,647 716,772 0 0 0
Operating52105 - MISCELLANEOUS OPERATING (26,386) 3,422 0 0 1,000 1,00052110 - OFFICE SUPPLIES 4,740 4,801 4,800 4,800 4,800 052135 - POSTAGE 3,435 3,617 4,800 4,800 4,800 052140 - WEARING APPAREL 0 0 100 100 100 052160 - FUEL 162,639 326,624 310,108 310,108 297,129 (12,979)52165 - LICENSES AND TAGS 3,529 2,590 4,729 4,729 7,367 2,63852175 - SIGNS 0 5,798 0 0 0 052190 - JANITORIAL SUPPLIES 1,968 2,335 3,000 3,000 3,000 052202 - TICKET VENDING MACHINES 9,380 9,928 13,124 13,124 13,160 3652205 - MAINT LANDSCAPING 0 0 500 500 500 052220 - MAINT OFFICE MACHINES 10,915 10,708 11,650 11,650 13,770 2,12052240 - MAINT NONFLEET VEHICLES EQP 72,769 72,161 71,422 71,422 60,000 (11,422)52241 - MAINT PARA TRANSIT PREV MAINT 18,288 18,418 13,399 13,399 12,756 (643)52242 - MAINT BENCHES AND SHELTERS 0 21,981 2,000 2,000 2,000 052243 - MAINT TRANSIT PREV MAINT 0 76,837 87,715 87,715 92,101 4,38652265 - MAINT BUILDINGS AND STRUCTURE 7,145 10,363 17,554 17,554 17,560 652281 - MAINT INFRASTRUCTURE 1,968 3,268 16,000 16,000 19,080 3,08052305 - MAINT SOFTWARE 378,054 403,696 419,423 419,423 479,402 59,97952405 - ADVERTISING SERVICES 105,188 109,336 110,100 110,100 113,800 3,70052410 - BUILDING SECURITY SERVICES 147,504 151,120 161,950 161,950 161,950 052435 - GARBAGE REMOVAL SERVICES 2,162 2,438 2,640 2,640 2,580 (60)52440 - HUMAN SERVICES 386,245 393,421 392,716 392,716 392,716 052445 - JANITORIAL SERVICES 0 0 2,000 2,000 2,000 052560 - PARKING SERVICES 322 219 480 480 480 052573 - CREDIT CARD FEES 7,031 10,984 9,600 9,600 13,200 3,60052574 - LEGAL SERVICES 1,188 500 18,000 18,000 10,000 (8,000)52575 - SERVICES 4,286 4,479 5,615 5,615 5,100 (515)52576 - AUDIT SERVICES 8,785 8,785 9,685 9,685 9,224 (461)52590 - TEMPORARY EMPLOYMENT 227,621 259,706 254,359 147,136 0 (147,136)52615 - DUES AND MEMBERSHIP 50,014 52,344 58,400 58,400 58,400 052625 - MEETING EXPENSES IN TOWN 327 504 500 500 500 052645 - SUBSCRIPTIONS 255 56 615 615 615 052725 - RENTAL OF PROPERTY 112,212 114,168 114,456 114,456 156,801 42,345
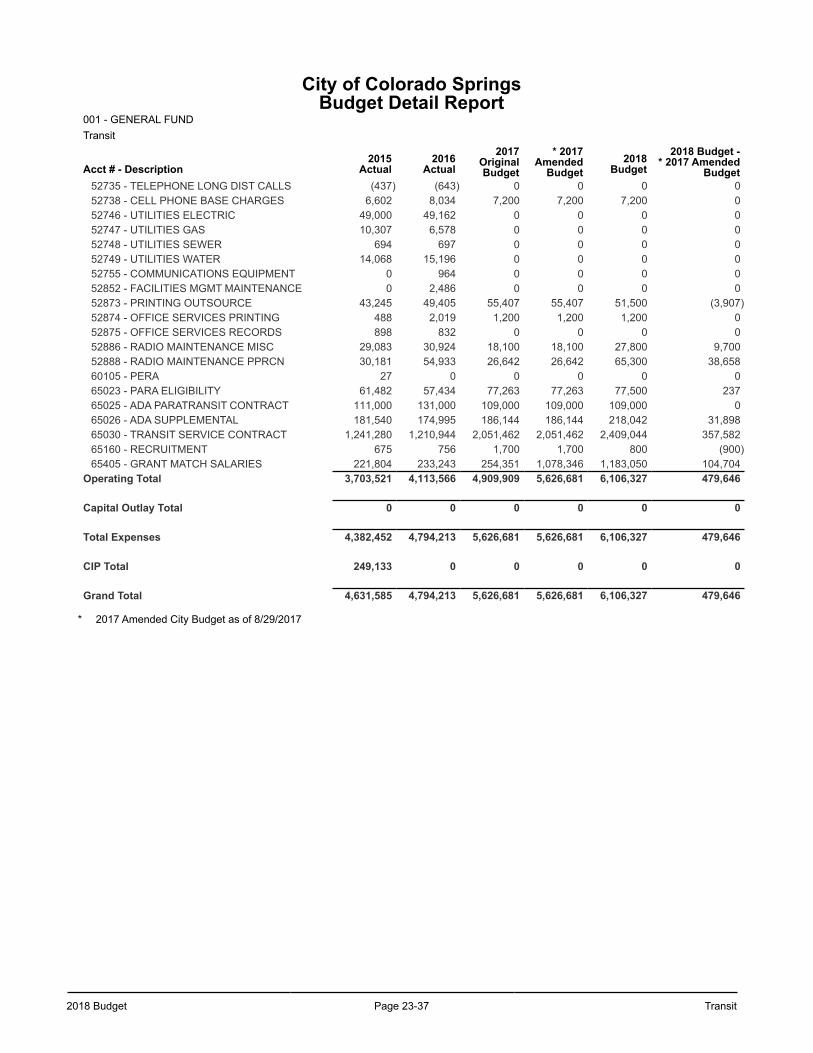
2018 Budget Page 23-37 Transit
City of Colorado SpringsBudget Detail Report
001 - GENERAL FUNDTransit
Acct # - Description2015
Actual2016
Actual2017
OriginalBudget
* 2017Amended
Budget2018
Budget2018 Budget -
* 2017 AmendedBudget
52735 - TELEPHONE LONG DIST CALLS (437) (643) 0 0 0 052738 - CELL PHONE BASE CHARGES 6,602 8,034 7,200 7,200 7,200 052746 - UTILITIES ELECTRIC 49,000 49,162 0 0 0 052747 - UTILITIES GAS 10,307 6,578 0 0 0 052748 - UTILITIES SEWER 694 697 0 0 0 052749 - UTILITIES WATER 14,068 15,196 0 0 0 052755 - COMMUNICATIONS EQUIPMENT 0 964 0 0 0 052852 - FACILITIES MGMT MAINTENANCE 0 2,486 0 0 0 052873 - PRINTING OUTSOURCE 43,245 49,405 55,407 55,407 51,500 (3,907)52874 - OFFICE SERVICES PRINTING 488 2,019 1,200 1,200 1,200 052875 - OFFICE SERVICES RECORDS 898 832 0 0 0 052886 - RADIO MAINTENANCE MISC 29,083 30,924 18,100 18,100 27,800 9,70052888 - RADIO MAINTENANCE PPRCN 30,181 54,933 26,642 26,642 65,300 38,65860105 - PERA 27 0 0 0 0 065023 - PARA ELIGIBILITY 61,482 57,434 77,263 77,263 77,500 23765025 - ADA PARATRANSIT CONTRACT 111,000 131,000 109,000 109,000 109,000 065026 - ADA SUPPLEMENTAL 181,540 174,995 186,144 186,144 218,042 31,89865030 - TRANSIT SERVICE CONTRACT 1,241,280 1,210,944 2,051,462 2,051,462 2,409,044 357,58265160 - RECRUITMENT 675 756 1,700 1,700 800 (900)65405 - GRANT MATCH SALARIES 221,804 233,243 254,351 1,078,346 1,183,050 104,704
Operating Total 3,703,521 4,113,566 4,909,909 5,626,681 6,106,327 479,646
Capital Outlay Total 0 0 0 0 0 0
Total Expenses 4,382,452 4,794,213 5,626,681 5,626,681 6,106,327 479,646
CIP Total 249,133 0 0 0 0 0
Grand Total 4,631,585 4,794,213 5,626,681 5,626,681 6,106,327 479,646
* 2017 Amended City Budget as of 8/29/2017

Transit Page 23-38 2018 Budget
This page left blank intentionally.
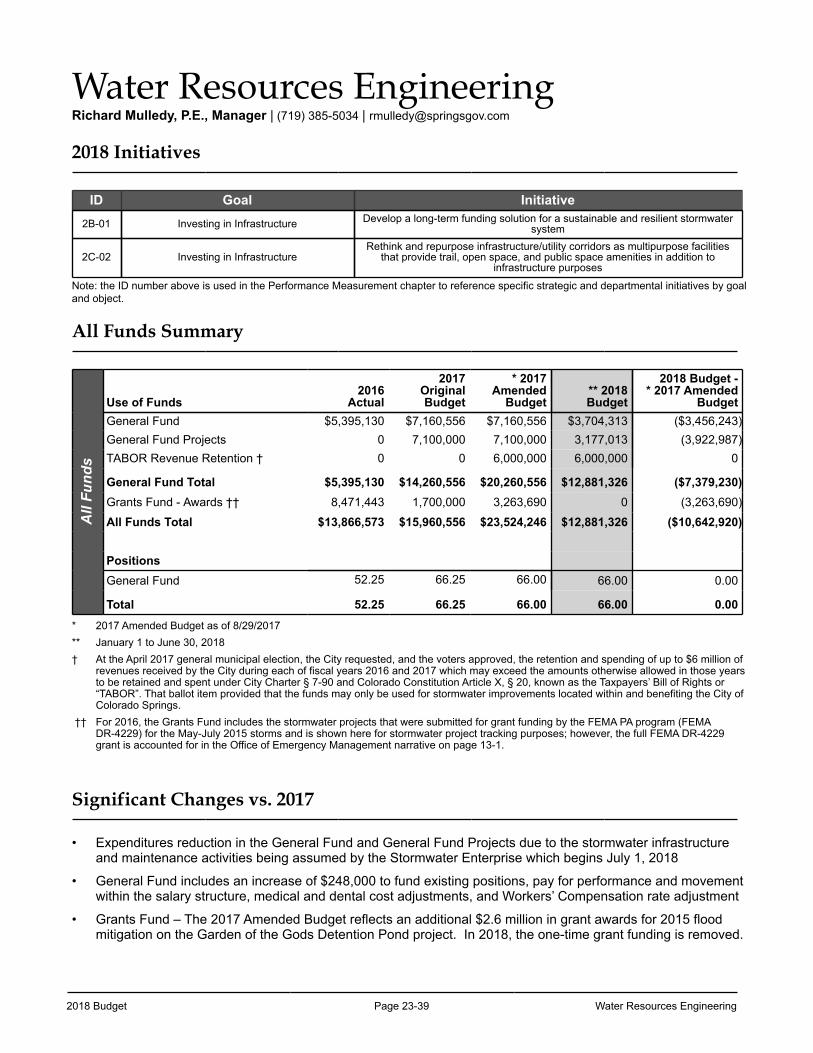
2018 Budget Page 23-39 Water Resources Engineering
Water Resources EngineeringRichard Mulledy, P.E., Manager | (719) 385-5034 | [email protected]
2018 Initiatives
ID Goal Initiative2B-01 Investing in Infrastructure Develop a long-term funding solution for a sustainable and resilient stormwater
system
2C-02 Investing in InfrastructureRethink and repurpose infrastructure/utility corridors as multipurpose facilities
that provide trail, open space, and public space amenities in addition to infrastructure purposes
Note: the ID number above is used in the Performance Measurement chapter to reference specific strategic and departmental initiatives by goal and object.
All Funds Summary
All
Fund
s
Use of Funds2016
Actual
2017OriginalBudget
* 2017Amended
Budget** 2018Budget
2018 Budget -* 2017 Amended
BudgetGeneral Fund $5,395,130 $7,160,556 $7,160,556 $3,704,313 ($3,456,243)General Fund Projects 0 7,100,000 7,100,000 3,177,013 (3,922,987)TABOR Revenue Retention † 0 0 6,000,000 6,000,000 0
General Fund Total $5,395,130 $14,260,556 $20,260,556 $12,881,326 ($7,379,230)Grants Fund - Awards †† 8,471,443 1,700,000 3,263,690 0 (3,263,690)
All Funds Total $13,866,573 $15,960,556 $23,524,246 $12,881,326 ($10,642,920)
PositionsGeneral Fund 52.25 66.25 66.00 66.00 0.00
Total 52.25 66.25 66.00 66.00 0.00* 2017 Amended Budget as of 8/29/2017** January 1 to June 30, 2018† At the April 2017 general municipal election, the City requested, and the voters approved, the retention and spending of up to $6 million of
revenues received by the City during each of fiscal years 2016 and 2017 which may exceed the amounts otherwise allowed in those years to be retained and spent under City Charter § 7-90 and Colorado Constitution Article X, § 20, known as the Taxpayers’ Bill of Rights or “TABOR”. That ballot item provided that the funds may only be used for stormwater improvements located within and benefiting the City of Colorado Springs.
†† For 2016, the Grants Fund includes the stormwater projects that were submitted for grant funding by the FEMA PA program (FEMA DR-4229) for the May-July 2015 storms and is shown here for stormwater project tracking purposes; however, the full FEMA DR-4229 grant is accounted for in the Office of Emergency Management narrative on page 13-1.
Significant Changes vs. 2017
• Expenditures reduction in the General Fund and General Fund Projects due to the stormwater infrastructure and maintenance activities being assumed by the Stormwater Enterprise which begins July 1, 2018
• General Fund includes an increase of $248,000 to fund existing positions, pay for performance and movement within the salary structure, medical and dental cost adjustments, and Workers’ Compensation rate adjustment
• Grants Fund – The 2017 Amended Budget reflects an additional $2.6 million in grant awards for 2015 flood mitigation on the Garden of the Gods Detention Pond project. In 2018, the one-time grant funding is removed.
Water Resources Engineering Page 23-40 2018 Budget
Water Resources EngineeringAlthough Ballot Issue 2A passed on November 7, 2017 which created a dedicated stormwater fee to fund stormwater infrastructure and maintenance, this division will continue to operate until the Stormwater Enterprise begins operation on July 1, 2018. The Division’s primary focus will continue to manage the City’s stormwater system until the operation is transferred to Stormwater Enterprise. This includes the management of the City's Municipal Separate Storm Sewer System (MS4) Permit and the City’s drainage basins. The stormwater permit addresses stormwater quality with an emphasis on controlling and limiting pollutants to the City's drainage system through maintenance and Best Management Practices.
• Administers the City’s Municipal Separate Storm Sewer System (MS4) Permit to ensure compliance with federal and state stormwater regulations including education, pollution prevention, inspections, and construction controls.
• Evaluates and implements drainage improvements to address street flooding, drainage way repairs and failing infrastructure.
• Maintenance of the City stormwater system is done by the Stormwater section of the Public Works Operations and Maintenance Division. This includes maintaining detention ponds and pipes, and removal of debris from inlets, culverts, and channels. In addition, crews repair and stabilize stream banks.
• Manages stormwater capital construction projects.
• Manages the street sweeping/air quality control program to ensure the following criteria is met:
Meet federal, state and local environmental and air quality mandates through sweeping and dust abatement
Sweep streets in downtown area two times per week; sweep all other City streets two times per year
Collect 28,000 cubic yards of material annually while sweeping 11,322 lane miles of roadway
In 2016, the City of Colorado Springs negotiated an Intergovernmental Agreement (IGA) with Pueblo County in order to resolve a dispute regarding Colorado Springs Utilities’ 1041 Permit for the Southern Delivery System and the City’s funding of its stormwater control program. On April 20, 2016, City Council passed Resolution No. 36-16 approving the IGA, which commits to fund $460 million from 2016 to 2035. In July 2016, the draft Stormwater Program Implementation Plan was released—it provides greater details of the program and is available at: https://coloradosprings.gov/stormwater/page/stormwater-program-implementation-plan.
As a result, some of the stormwater projects originally planned for 2016 were incorporated into the list of 71 stormwater projects to be completed over the 20-year program. The funding for these projects was redistributed in order to provide additional Stormwater operating funds in 2016. Each year the City and Pueblo County prioritize the CIP projects for the following year.
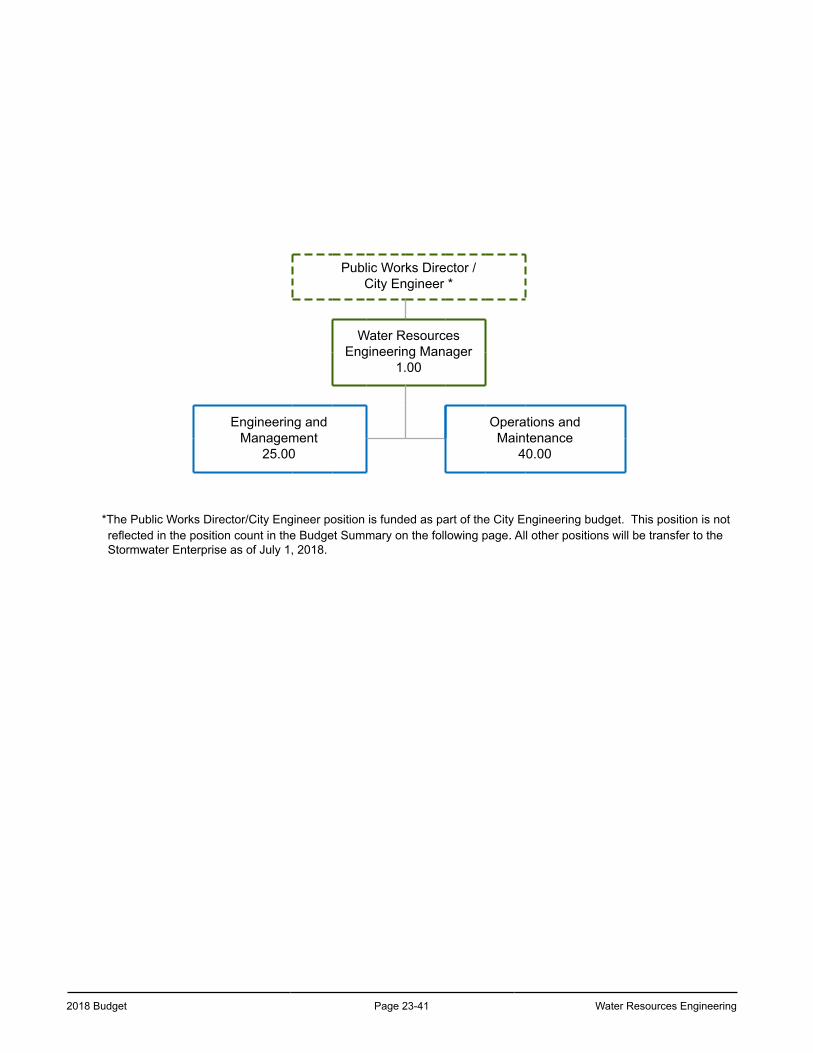
2018 Budget Page 23-41 Water Resources Engineering
Public Works Director /City Engineer *
Water Resources Engineering Manager
1.00
Engineering and Management
25.00
Operations andMaintenance
40.00
*The Public Works Director/City Engineer position is funded as part of the City Engineering budget. This position is not reflected in the position count in the Budget Summary on the following page. All other positions will be transfer to the Stormwater Enterprise as of July 1, 2018.
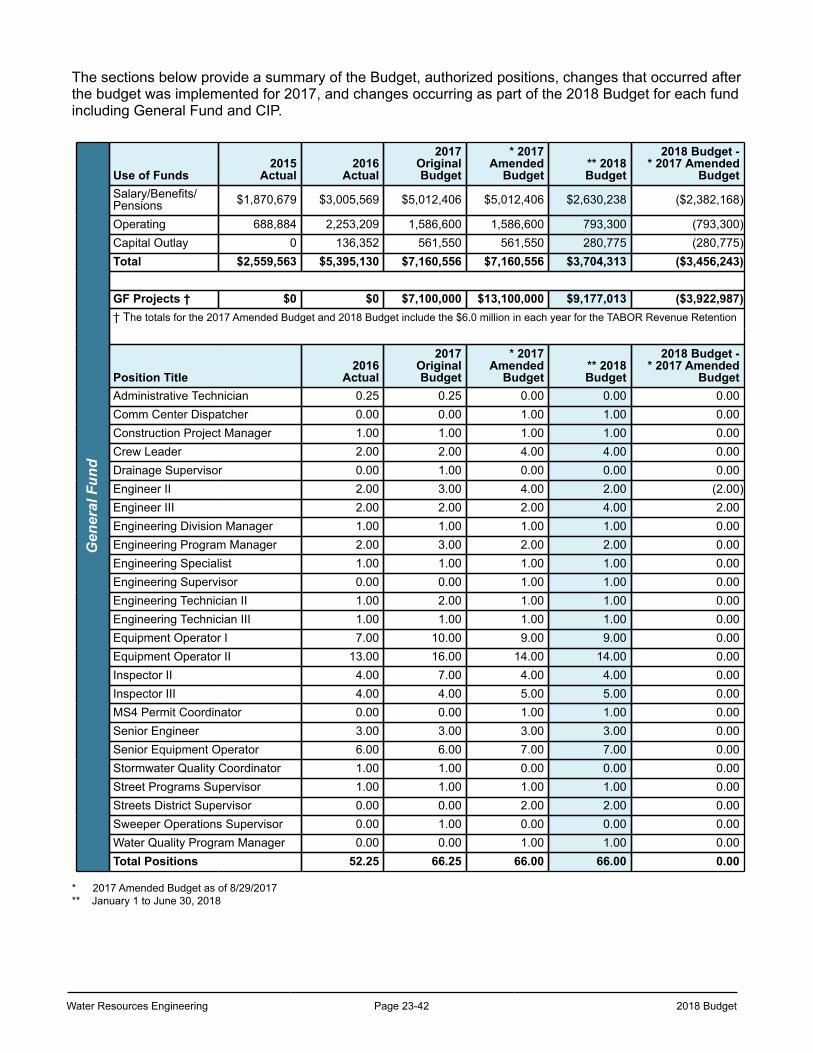
Water Resources Engineering Page 23-42 2018 Budget
The sections below provide a summary of the Budget, authorized positions, changes that occurred after the budget was implemented for 2017, and changes occurring as part of the 2018 Budget for each fund including General Fund and CIP.
Gen
eral
Fun
d
Use of Funds2015
Actual2016
Actual
2017OriginalBudget
* 2017Amended
Budget** 2018Budget
2018 Budget -* 2017 Amended
BudgetSalary/Benefits/Pensions $1,870,679 $3,005,569 $5,012,406 $5,012,406 $2,630,238 ($2,382,168)
Operating 688,884 2,253,209 1,586,600 1,586,600 793,300 (793,300)Capital Outlay 0 136,352 561,550 561,550 280,775 (280,775)Total $2,559,563 $5,395,130 $7,160,556 $7,160,556 $3,704,313 ($3,456,243)
GF Projects † $0 $0 $7,100,000 $13,100,000 $9,177,013 ($3,922,987)† The totals for the 2017 Amended Budget and 2018 Budget include the $6.0 million in each year for the TABOR Revenue Retention
Position Title2016
Actual
2017OriginalBudget
* 2017Amended
Budget** 2018Budget
2018 Budget -* 2017 Amended
BudgetAdministrative Technician 0.25 0.25 0.00 0.00 0.00Comm Center Dispatcher 0.00 0.00 1.00 1.00 0.00Construction Project Manager 1.00 1.00 1.00 1.00 0.00Crew Leader 2.00 2.00 4.00 4.00 0.00Drainage Supervisor 0.00 1.00 0.00 0.00 0.00Engineer II 2.00 3.00 4.00 2.00 (2.00)Engineer III 2.00 2.00 2.00 4.00 2.00Engineering Division Manager 1.00 1.00 1.00 1.00 0.00Engineering Program Manager 2.00 3.00 2.00 2.00 0.00Engineering Specialist 1.00 1.00 1.00 1.00 0.00Engineering Supervisor 0.00 0.00 1.00 1.00 0.00Engineering Technician II 1.00 2.00 1.00 1.00 0.00Engineering Technician III 1.00 1.00 1.00 1.00 0.00Equipment Operator I 7.00 10.00 9.00 9.00 0.00Equipment Operator II 13.00 16.00 14.00 14.00 0.00Inspector II 4.00 7.00 4.00 4.00 0.00Inspector III 4.00 4.00 5.00 5.00 0.00MS4 Permit Coordinator 0.00 0.00 1.00 1.00 0.00Senior Engineer 3.00 3.00 3.00 3.00 0.00Senior Equipment Operator 6.00 6.00 7.00 7.00 0.00Stormwater Quality Coordinator 1.00 1.00 0.00 0.00 0.00Street Programs Supervisor 1.00 1.00 1.00 1.00 0.00Streets District Supervisor 0.00 0.00 2.00 2.00 0.00Sweeper Operations Supervisor 0.00 1.00 0.00 0.00 0.00Water Quality Program Manager 0.00 0.00 1.00 1.00 0.00Total Positions 52.25 66.25 66.00 66.00 0.00
* 2017 Amended Budget as of 8/29/2017** January 1 to June 30, 2018
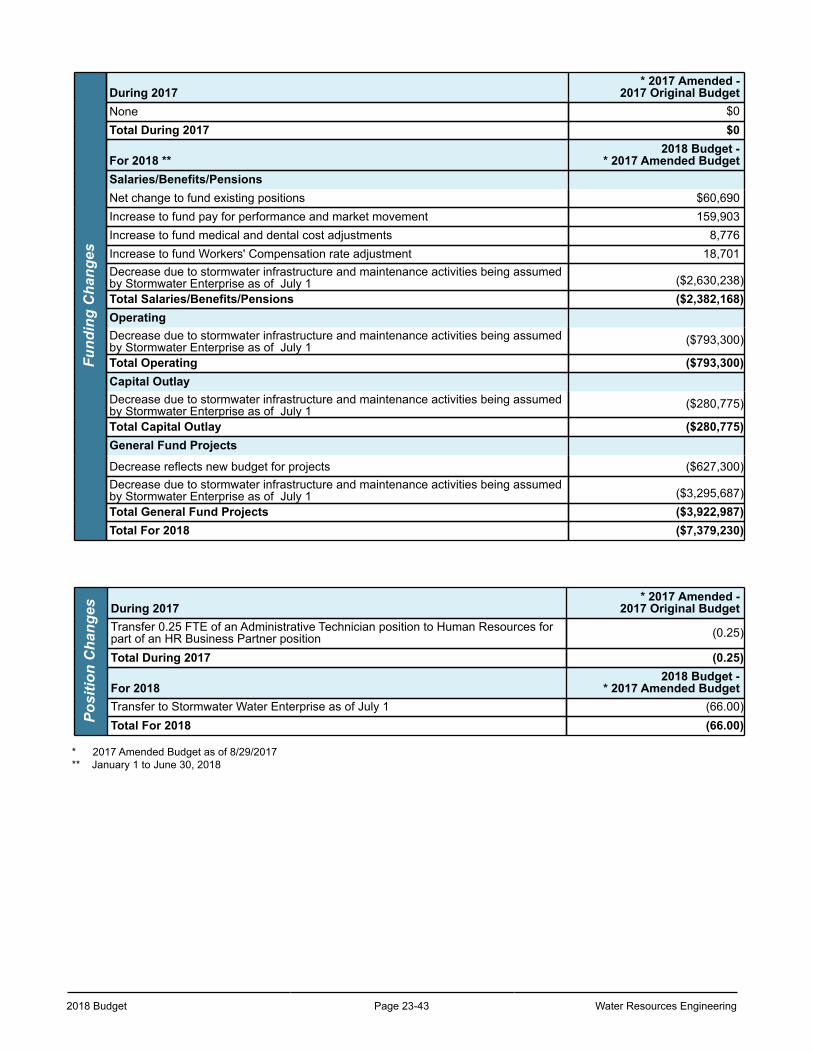
2018 Budget Page 23-43 Water Resources Engineering
Fund
ing
Cha
nges
During 2017* 2017 Amended -
2017 Original BudgetNone $0Total During 2017 $0
For 2018 **2018 Budget -
* 2017 Amended BudgetSalaries/Benefits/PensionsNet change to fund existing positions $60,690Increase to fund pay for performance and market movement 159,903Increase to fund medical and dental cost adjustments 8,776Increase to fund Workers' Compensation rate adjustment 18,701Decrease due to stormwater infrastructure and maintenance activities being assumedby Stormwater Enterprise as of July 1 ($2,630,238)Total Salaries/Benefits/Pensions ($2,382,168)OperatingDecrease due to stormwater infrastructure and maintenance activities being assumed by Stormwater Enterprise as of July 1 ($793,300)
Total Operating ($793,300)Capital OutlayDecrease due to stormwater infrastructure and maintenance activities being assumed by Stormwater Enterprise as of July 1 ($280,775)
Total Capital Outlay ($280,775)General Fund Projects
Decrease reflects new budget for projects ($627,300)Decrease due to stormwater infrastructure and maintenance activities being assumed by Stormwater Enterprise as of July 1 ($3,295,687)Total General Fund Projects ($3,922,987)Total For 2018 ($7,379,230)
Posi
tion
Cha
nges During 2017
* 2017 Amended -2017 Original Budget
Transfer 0.25 FTE of an Administrative Technician position to Human Resources forpart of an HR Business Partner position (0.25)
Total During 2017 (0.25)
For 20182018 Budget -
* 2017 Amended BudgetTransfer to Stormwater Water Enterprise as of July 1 (66.00)Total For 2018 (66.00)
* 2017 Amended Budget as of 8/29/2017** January 1 to June 30, 2018
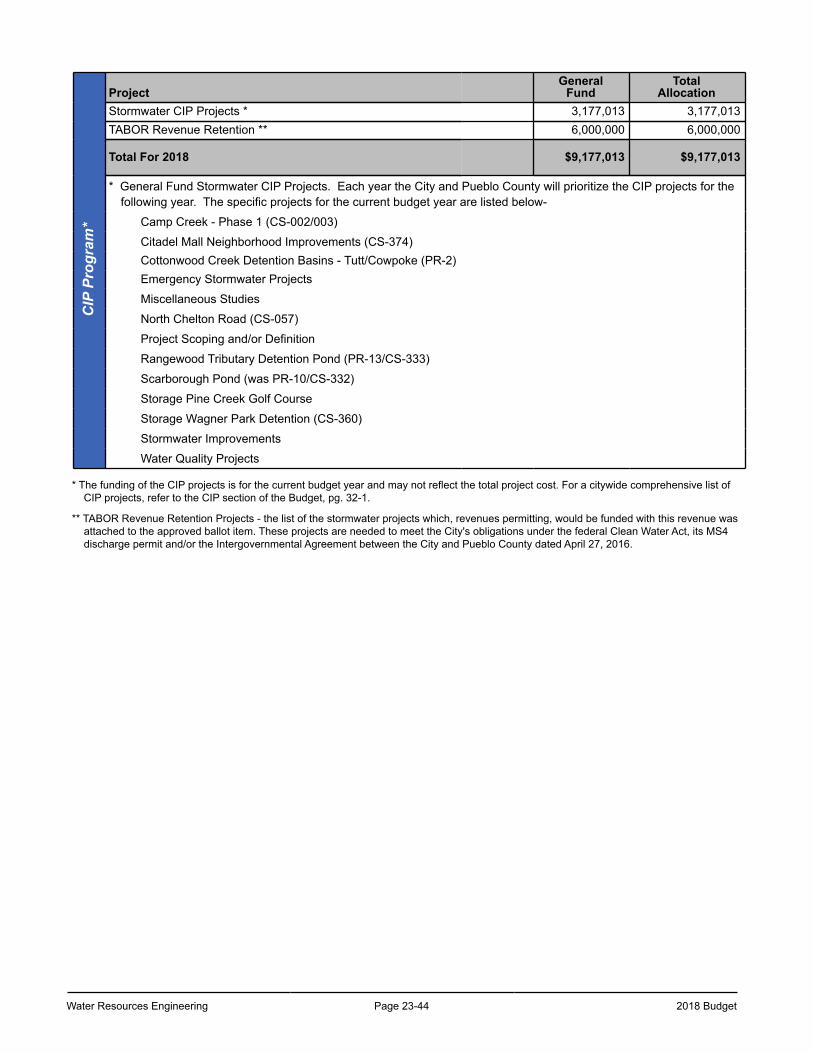
Water Resources Engineering Page 23-44 2018 Budget
CIP
Pro
gram
*Project
GeneralFund
TotalAllocation
Stormwater CIP Projects * 3,177,013 3,177,013TABOR Revenue Retention ** 6,000,000 6,000,000
Total For 2018 $9,177,013 $9,177,013
* General Fund Stormwater CIP Projects. Each year the City and Pueblo County will prioritize the CIP projects for thefollowing year. The specific projects for the current budget year are listed below-
Camp Creek - Phase 1 (CS-002/003)
Citadel Mall Neighborhood Improvements (CS-374)Cottonwood Creek Detention Basins - Tutt/Cowpoke (PR-2)Emergency Stormwater Projects
Miscellaneous Studies
North Chelton Road (CS-057)
Project Scoping and/or Definition
Rangewood Tributary Detention Pond (PR-13/CS-333)
Scarborough Pond (was PR-10/CS-332)
Storage Pine Creek Golf Course
Storage Wagner Park Detention (CS-360)
Stormwater Improvements
Water Quality Projects
* The funding of the CIP projects is for the current budget year and may not reflect the total project cost. For a citywide comprehensive list of CIP projects, refer to the CIP section of the Budget, pg. 32-1.
** TABOR Revenue Retention Projects - the list of the stormwater projects which, revenues permitting, would be funded with this revenue was attached to the approved ballot item. These projects are needed to meet the City's obligations under the federal Clean Water Act, its MS4 discharge permit and/or the Intergovernmental Agreement between the City and Pueblo County dated April 27, 2016.

2018 Budget Page 23-45 Water Resources Engineering
City of Colorado SpringsBudget Detail Report
001 - GENERAL FUNDWater Resources Engineering
Acct # - Description2015
Actual2016
Actual2017
OriginalBudget
* 2017Amended
Budget** 2018Budget
2018 Budget -* 2017 Amended
BudgetSalaries/Benefits/Pensions
51205 - CIVILIAN SALARIES 1,322,854 2,134,088 3,601,858 3,601,858 1,918,280 (1,683,578)51210 - OVERTIME 67,414 79,815 70,500 70,500 35,250 (35,250)51220 - SEASONAL TEMPORARY 6,593 4,438 25,000 25,000 12,500 (12,500)51230 - SHIFT DIFFERENTIAL 3,988 0 0 0 0 051235 - STANDBY 4,057 3,307 0 0 0 051240 - RETIREMENT TERMINATION SICK 6,402 0 0 0 0 051245 - RETIREMENT TERM VACATION 14,861 4,888 0 0 0 051260 - VACATION BUY PAY OUT 3,276 15,293 0 0 0 051299 - SALARIES REIMBURSEMENTS (32,982) (19,648) 0 0 0 051610 - PERA 185,377 297,091 486,346 486,346 264,517 (221,829)51612 - RETIREMENT HEALTH SAVINGS 3,680 0 0 0 0 051615 - WORKERS COMPENSATION 44,939 71,247 105,386 105,386 64,854 (40,532)51620 - EQUITABLE LIFE INSURANCE 3,666 5,982 12,347 12,347 6,673 (5,674)51640 - DENTAL INSURANCE 8,983 15,828 27,801 27,801 13,962 (13,839)51670 - PARKING FOR EMPLOYEES 820 1,920 4,560 4,560 2,280 (2,280)51690 - MEDICARE 19,292 31,620 51,475 51,475 27,997 (23,478)51695 - CITY EPO MEDICAL PLAN 49,638 71,418 74,448 74,448 38,783 (35,665)51696 - ADVANTAGE HD MED PLAN 156,659 268,957 513,498 513,498 228,892 (284,606)51697 - HRA BENEFIT TO ADV MED PLAN 11,618 19,325 39,187 39,187 16,250 (22,937)51699 - BENEFITS REIMBURSEMENT (10,456) 0 0 0 0 0
Salaries/Benefits/Pensions Total 1,870,679 3,005,569 5,012,406 5,012,406 2,630,238 (2,382,168)
Operating52110 - OFFICE SUPPLIES 489 3,750 2,345 2,345 1,173 (1,172)52111 - PAPER SUPPLIES 0 0 2,500 2,500 1,250 (1,250)52120 - COMPUTER SOFTWARE 354 2,968 8,000 8,000 4,000 (4,000)52122 - CELL PHONES EQUIP AND SUPPLIES 739 1,098 3,450 3,450 1,100 (2,350)52125 - GENERAL SUPPLIES 9,952 21,075 16,600 16,600 8,300 (8,300)52131 - CONCRETE SUPPLIES 495 6,245 0 0 0 052135 - POSTAGE 239 7 0 0 0 052140 - WEARING APPAREL 3,716 3,754 0 0 0 052145 - PAINT AND CHEMICAL 147 125 0 0 0 052150 - SEED AND FERTILIZER 0 230 0 0 0 052160 - FUEL 33 0 0 0 0 052185 - AGGREGATE MATERIAL 1,395 3,165 8,000 8,000 4,000 (4,000)52191 - STORMWATER QUALITY 105,586 345,700 460,000 460,000 230,000 (230,000)52192 - STORMWATER PERMIT 11,080 11,080 11,080 11,080 5,540 (5,540)52225 - MAINT OF COMPUTER SOFTWARE 1,980 1,980 10,700 10,700 16,066 5,36652235 - MAINT MACHINERY AND APPARATUS 3,845 1,160 2,500 2,500 1,250 (1,250)52265 - MAINT BUILDINGS AND STRUCTURE 11,332 23,687 0 0 0 052281 - MAINT INFRASTRUCTURE 342,122 235,604 504,500 504,500 252,250 (252,250)52305 - MAINT SOFTWARE 0 328 3,075 3,075 0 (3,075)52410 - BUILDING SECURITY SERVICES (1,275) 0 0 0 0 052415 - CONTRACTS AND SPEC PROJECTS 108,139 130,504 100,000 100,000 50,000 (50,000)52426 - MUN FAC RUNOFF CONTROL 33,699 115,200 100,000 100,000 50,000 (50,000)52431 - CONSULTING SERVICES 0 308,089 200,000 200,000 91,341 (108,659)52435 - GARBAGE REMOVAL SERVICES 456 698 0 0 0 052560 - PARKING SERVICES 1,204 2,403 1,500 1,500 1,500 052574 - LEGAL SERVICES 0 838,838 0 0 0 0
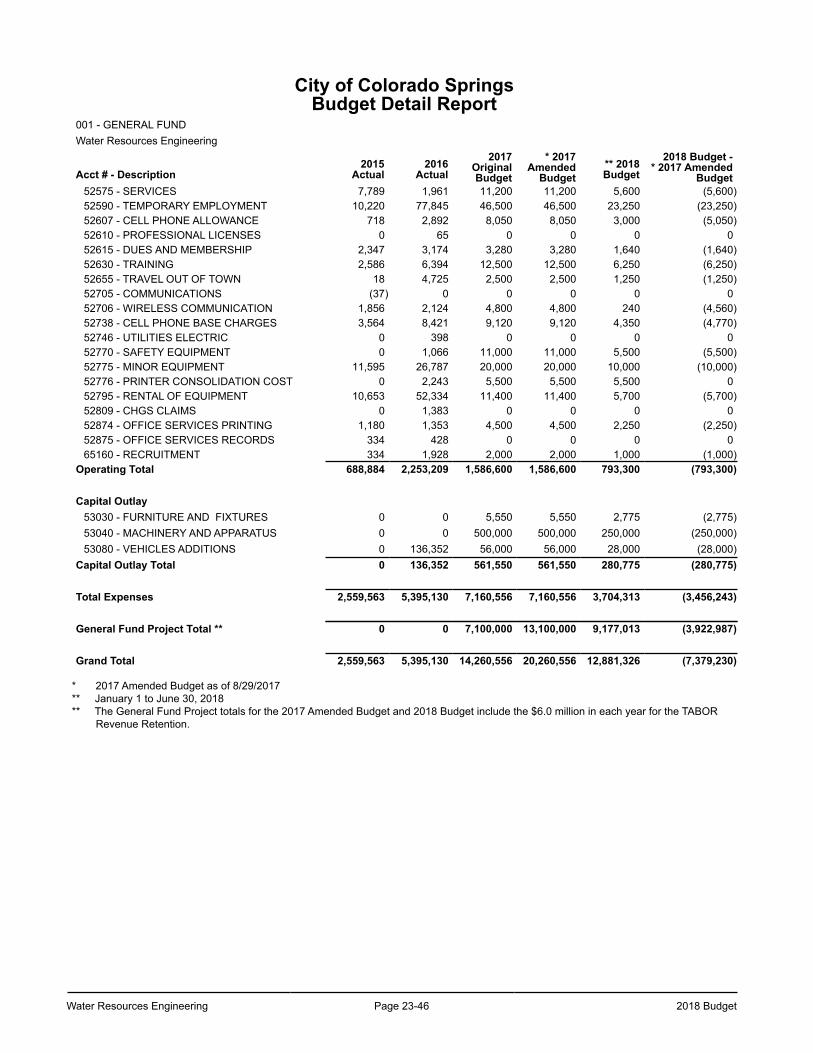
Water Resources Engineering Page 23-46 2018 Budget
City of Colorado SpringsBudget Detail Report
001 - GENERAL FUNDWater Resources Engineering
Acct # - Description2015
Actual2016
Actual2017
OriginalBudget
* 2017Amended
Budget** 2018Budget
2018 Budget -* 2017 Amended
Budget52575 - SERVICES 7,789 1,961 11,200 11,200 5,600 (5,600)52590 - TEMPORARY EMPLOYMENT 10,220 77,845 46,500 46,500 23,250 (23,250)52607 - CELL PHONE ALLOWANCE 718 2,892 8,050 8,050 3,000 (5,050)52610 - PROFESSIONAL LICENSES 0 65 0 0 0 052615 - DUES AND MEMBERSHIP 2,347 3,174 3,280 3,280 1,640 (1,640)52630 - TRAINING 2,586 6,394 12,500 12,500 6,250 (6,250)52655 - TRAVEL OUT OF TOWN 18 4,725 2,500 2,500 1,250 (1,250)52705 - COMMUNICATIONS (37) 0 0 0 0 052706 - WIRELESS COMMUNICATION 1,856 2,124 4,800 4,800 240 (4,560)52738 - CELL PHONE BASE CHARGES 3,564 8,421 9,120 9,120 4,350 (4,770)52746 - UTILITIES ELECTRIC 0 398 0 0 0 052770 - SAFETY EQUIPMENT 0 1,066 11,000 11,000 5,500 (5,500)52775 - MINOR EQUIPMENT 11,595 26,787 20,000 20,000 10,000 (10,000)52776 - PRINTER CONSOLIDATION COST 0 2,243 5,500 5,500 5,500 052795 - RENTAL OF EQUIPMENT 10,653 52,334 11,400 11,400 5,700 (5,700)52809 - CHGS CLAIMS 0 1,383 0 0 0 052874 - OFFICE SERVICES PRINTING 1,180 1,353 4,500 4,500 2,250 (2,250)52875 - OFFICE SERVICES RECORDS 334 428 0 0 0 065160 - RECRUITMENT 334 1,928 2,000 2,000 1,000 (1,000)
Operating Total 688,884 2,253,209 1,586,600 1,586,600 793,300 (793,300)
Capital Outlay53030 - FURNITURE AND FIXTURES 0 0 5,550 5,550 2,775 (2,775)53040 - MACHINERY AND APPARATUS 0 0 500,000 500,000 250,000 (250,000)53080 - VEHICLES ADDITIONS 0 136,352 56,000 56,000 28,000 (28,000)
Capital Outlay Total 0 136,352 561,550 561,550 280,775 (280,775)
Total Expenses 2,559,563 5,395,130 7,160,556 7,160,556 3,704,313 (3,456,243)
General Fund Project Total ** 0 0 7,100,000 13,100,000 9,177,013 (3,922,987)
Grand Total 2,559,563 5,395,130 14,260,556 20,260,556 12,881,326 (7,379,230)
* 2017 Amended Budget as of 8/29/2017** January 1 to June 30, 2018** The General Fund Project totals for the 2017 Amended Budget and 2018 Budget include the $6.0 million in each year for the TABOR
Revenue Retention.
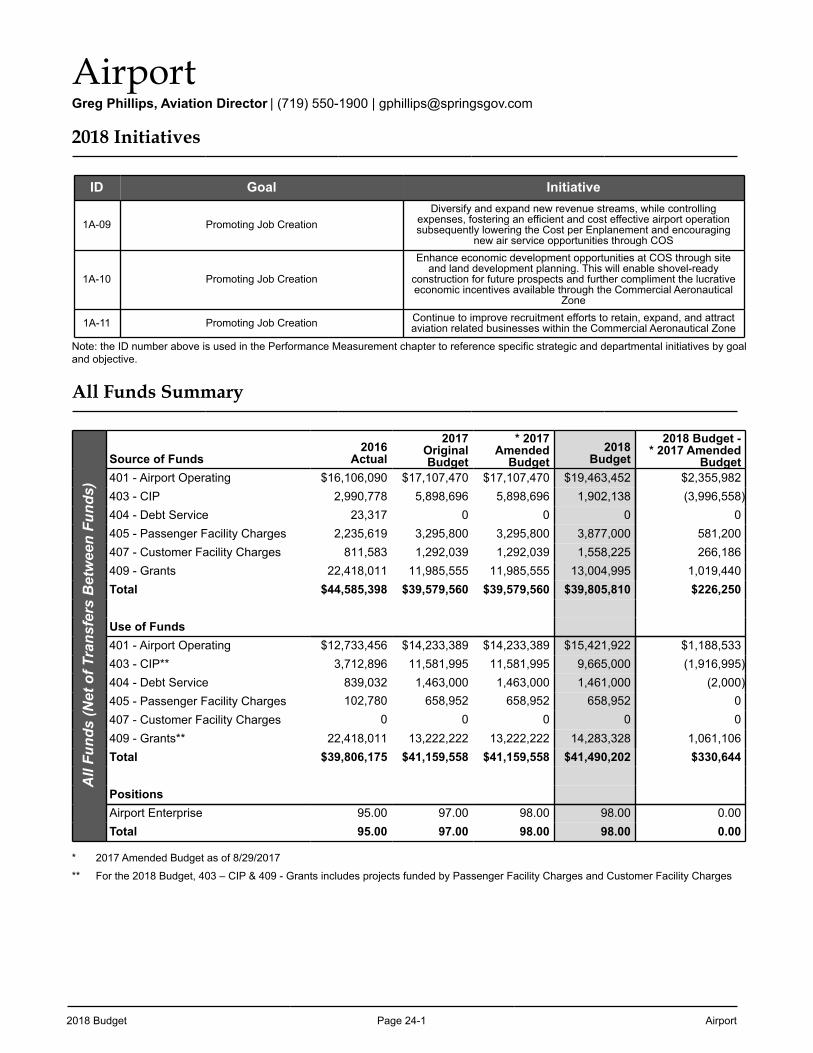
2018 Budget Page 24-1 Airport
AirportGreg Phillips, Aviation Director | (719) 550-1900 | [email protected]
2018 Initiatives
ID Goal Initiative
1A-09 Promoting Job CreationDiversify and expand new revenue streams, while controlling
expenses, fostering an efficient and cost effective airport operation subsequently lowering the Cost per Enplanement and encouraging
new air service opportunities through COS
1A-10 Promoting Job Creation
Enhance economic development opportunities at COS through site and land development planning. This will enable shovel-ready
construction for future prospects and further compliment the lucrative economic incentives available through the Commercial Aeronautical
Zone
1A-11 Promoting Job Creation Continue to improve recruitment efforts to retain, expand, and attract aviation related businesses within the Commercial Aeronautical Zone
Note: the ID number above is used in the Performance Measurement chapter to reference specific strategic and departmental initiatives by goal and objective.
All Funds Summary
All
Fund
s (N
et o
f Tra
nsfe
rs B
etw
een
Fund
s)
Source of Funds2016
Actual
2017OriginalBudget
* 2017Amended
Budget2018
Budget
2018 Budget -* 2017 Amended
Budget401 - Airport Operating $16,106,090 $17,107,470 $17,107,470 $19,463,452 $2,355,982403 - CIP 2,990,778 5,898,696 5,898,696 1,902,138 (3,996,558)404 - Debt Service 23,317 0 0 0 0405 - Passenger Facility Charges 2,235,619 3,295,800 3,295,800 3,877,000 581,200407 - Customer Facility Charges 811,583 1,292,039 1,292,039 1,558,225 266,186409 - Grants 22,418,011 11,985,555 11,985,555 13,004,995 1,019,440Total $44,585,398 $39,579,560 $39,579,560 $39,805,810 $226,250
Use of Funds401 - Airport Operating $12,733,456 $14,233,389 $14,233,389 $15,421,922 $1,188,533403 - CIP** 3,712,896 11,581,995 11,581,995 9,665,000 (1,916,995)404 - Debt Service 839,032 1,463,000 1,463,000 1,461,000 (2,000)405 - Passenger Facility Charges 102,780 658,952 658,952 658,952 0407 - Customer Facility Charges 0 0 0 0 0409 - Grants** 22,418,011 13,222,222 13,222,222 14,283,328 1,061,106Total $39,806,175 $41,159,558 $41,159,558 $41,490,202 $330,644
PositionsAirport Enterprise 95.00 97.00 98.00 98.00 0.00Total 95.00 97.00 98.00 98.00 0.00
* 2017 Amended Budget as of 8/29/2017
** For the 2018 Budget, 403 – CIP & 409 - Grants includes projects funded by Passenger Facility Charges and Customer Facility Charges
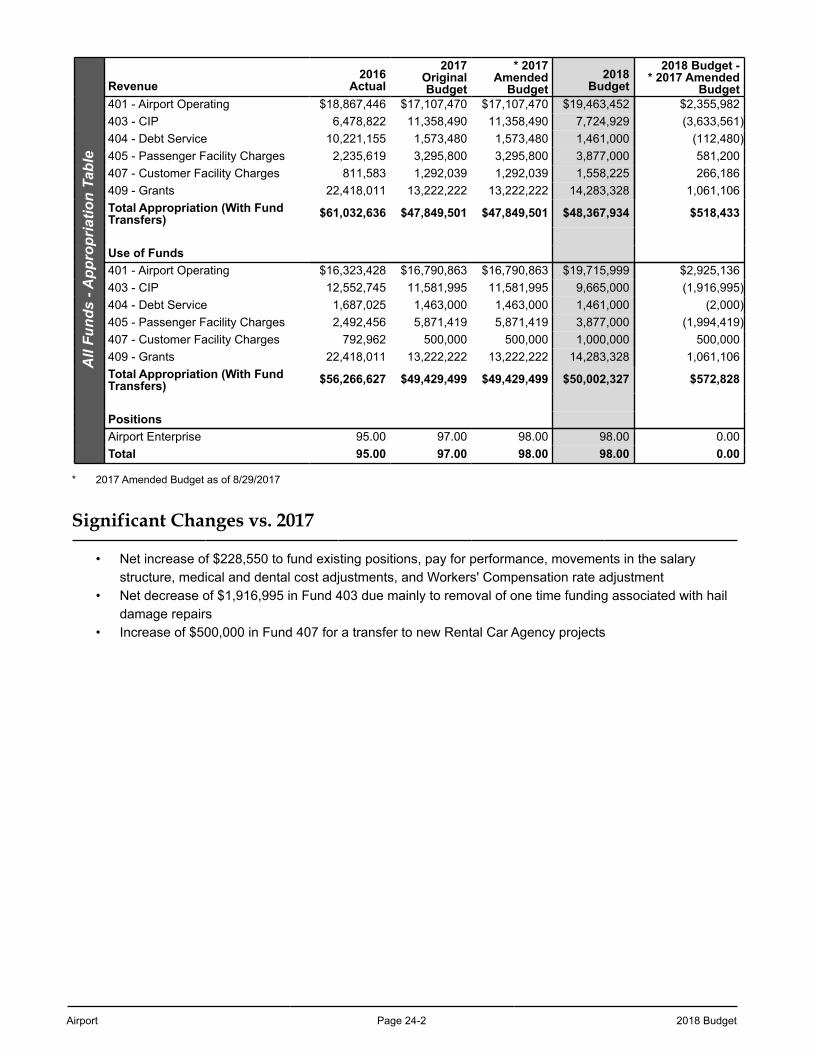
Airport Page 24-2 2018 Budget
All
Fund
s - A
ppro
pria
tion
Tabl
eRevenue
2016Actual
2017OriginalBudget
* 2017Amended
Budget2018
Budget
2018 Budget -* 2017 Amended
Budget401 - Airport Operating $18,867,446 $17,107,470 $17,107,470 $19,463,452 $2,355,982403 - CIP 6,478,822 11,358,490 11,358,490 7,724,929 (3,633,561)404 - Debt Service 10,221,155 1,573,480 1,573,480 1,461,000 (112,480)405 - Passenger Facility Charges 2,235,619 3,295,800 3,295,800 3,877,000 581,200407 - Customer Facility Charges 811,583 1,292,039 1,292,039 1,558,225 266,186409 - Grants 22,418,011 13,222,222 13,222,222 14,283,328 1,061,106Total Appropriation (With FundTransfers) $61,032,636 $47,849,501 $47,849,501 $48,367,934 $518,433
Use of Funds401 - Airport Operating $16,323,428 $16,790,863 $16,790,863 $19,715,999 $2,925,136403 - CIP 12,552,745 11,581,995 11,581,995 9,665,000 (1,916,995)404 - Debt Service 1,687,025 1,463,000 1,463,000 1,461,000 (2,000)405 - Passenger Facility Charges 2,492,456 5,871,419 5,871,419 3,877,000 (1,994,419)407 - Customer Facility Charges 792,962 500,000 500,000 1,000,000 500,000409 - Grants 22,418,011 13,222,222 13,222,222 14,283,328 1,061,106Total Appropriation (With FundTransfers) $56,266,627 $49,429,499 $49,429,499 $50,002,327 $572,828
PositionsAirport Enterprise 95.00 97.00 98.00 98.00 0.00Total 95.00 97.00 98.00 98.00 0.00
* 2017 Amended Budget as of 8/29/2017
Significant Changes vs. 2017
• Net increase of $228,550 to fund existing positions, pay for performance, movements in the salary structure, medical and dental cost adjustments, and Workers' Compensation rate adjustment
• Net decrease of $1,916,995 in Fund 403 due mainly to removal of one time funding associated with hail damage repairs
• Increase of $500,000 in Fund 407 for a transfer to new Rental Car Agency projects
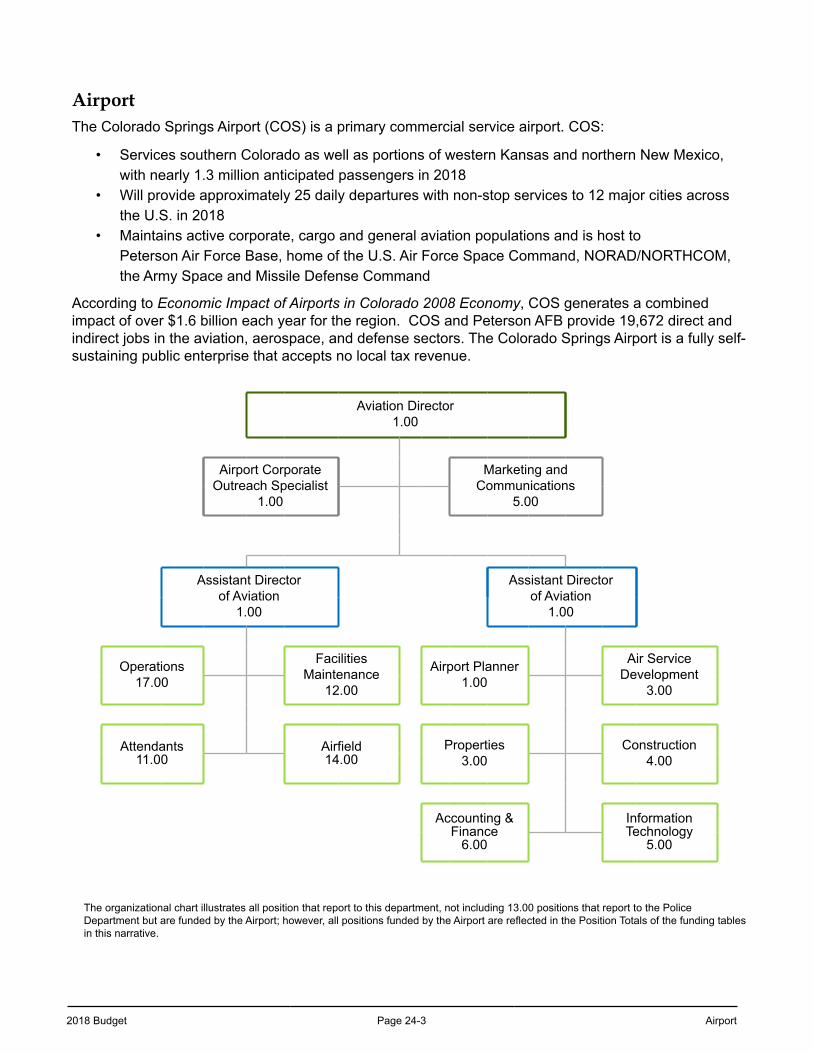
2018 Budget Page 24-3 Airport
AirportThe Colorado Springs Airport (COS) is a primary commercial service airport. COS:
• Services southern Colorado as well as portions of western Kansas and northern New Mexico, with nearly 1.3 million anticipated passengers in 2018
• Will provide approximately 25 daily departures with non-stop services to 12 major cities across the U.S. in 2018
• Maintains active corporate, cargo and general aviation populations and is host to Peterson Air Force Base, home of the U.S. Air Force Space Command, NORAD/NORTHCOM, the Army Space and Missile Defense Command
According to Economic Impact of Airports in Colorado 2008 Economy, COS generates a combined impact of over $1.6 billion each year for the region. COS and Peterson AFB provide 19,672 direct and indirect jobs in the aviation, aerospace, and defense sectors. The Colorado Springs Airport is a fully self-sustaining public enterprise that accepts no local tax revenue.
Aviation Director1.00
Airport Corporate Outreach Specialist
1.00
Marketing and Communications
5.00
Assistant Director of Aviation
1.00
Assistant Director of Aviation
1.00
Operations17.00
Facilities Maintenance
12.00
Airport Planner1.00
Air Service Development
3.00
Attendants11.00
Airfield14.00
Properties3.00
Construction4.00
Accounting & Finance
6.00
Information Technology
5.00
The organizational chart illustrates all position that report to this department, not including 13.00 positions that report to the Police Department but are funded by the Airport; however, all positions funded by the Airport are reflected in the Position Totals of the funding tables in this narrative.
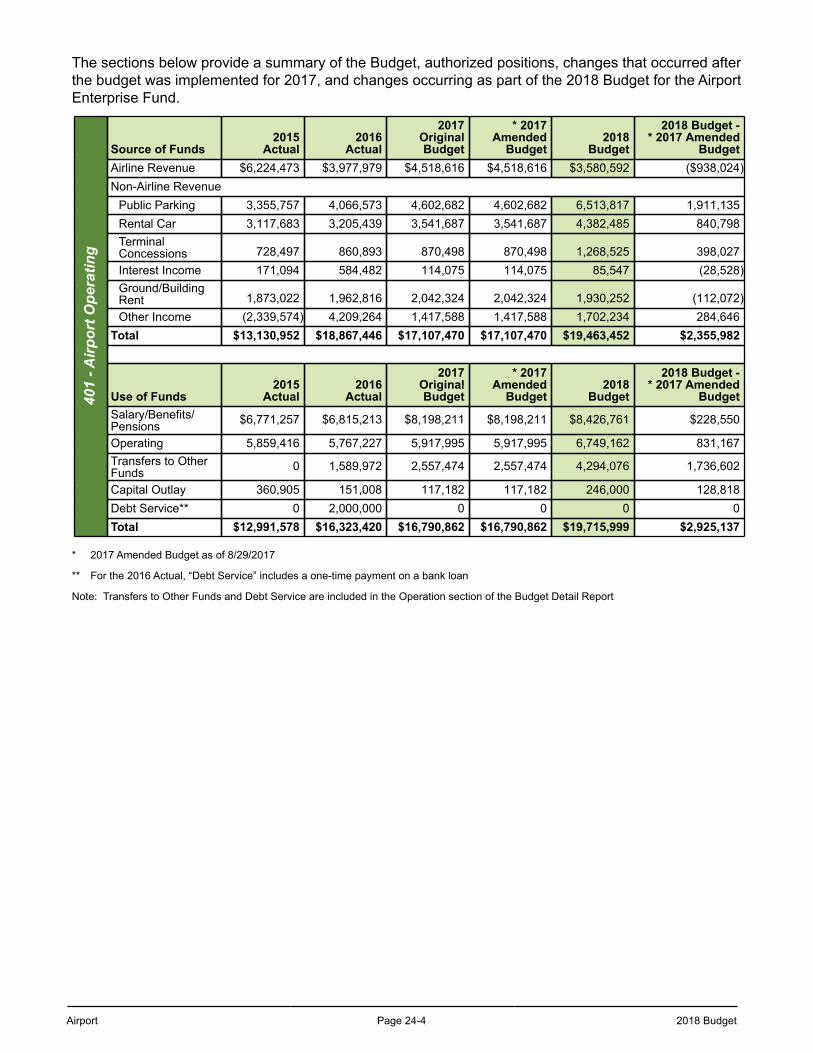
Airport Page 24-4 2018 Budget
The sections below provide a summary of the Budget, authorized positions, changes that occurred after the budget was implemented for 2017, and changes occurring as part of the 2018 Budget for the Airport Enterprise Fund.
401
- Airp
ort O
pera
ting
Source of Funds2015
Actual2016
Actual
2017OriginalBudget
* 2017Amended
Budget2018
Budget
2018 Budget -* 2017 Amended
BudgetAirline Revenue $6,224,473 $3,977,979 $4,518,616 $4,518,616 $3,580,592 ($938,024)Non-Airline Revenue
Public Parking 3,355,757 4,066,573 4,602,682 4,602,682 6,513,817 1,911,135Rental Car 3,117,683 3,205,439 3,541,687 3,541,687 4,382,485 840,798TerminalConcessions 728,497 860,893 870,498 870,498 1,268,525 398,027Interest Income 171,094 584,482 114,075 114,075 85,547 (28,528)Ground/BuildingRent 1,873,022 1,962,816 2,042,324 2,042,324 1,930,252 (112,072)Other Income (2,339,574) 4,209,264 1,417,588 1,417,588 1,702,234 284,646
Total $13,130,952 $18,867,446 $17,107,470 $17,107,470 $19,463,452 $2,355,982
Use of Funds2015
Actual2016
Actual
2017OriginalBudget
* 2017Amended
Budget2018
Budget
2018 Budget -* 2017 Amended
BudgetSalary/Benefits/Pensions $6,771,257 $6,815,213 $8,198,211 $8,198,211 $8,426,761 $228,550
Operating 5,859,416 5,767,227 5,917,995 5,917,995 6,749,162 831,167Transfers to OtherFunds 0 1,589,972 2,557,474 2,557,474 4,294,076 1,736,602
Capital Outlay 360,905 151,008 117,182 117,182 246,000 128,818Debt Service** 0 2,000,000 0 0 0 0Total $12,991,578 $16,323,420 $16,790,862 $16,790,862 $19,715,999 $2,925,137
* 2017 Amended Budget as of 8/29/2017
** For the 2016 Actual, “Debt Service” includes a one-time payment on a bank loan
Note: Transfers to Other Funds and Debt Service are included in the Operation section of the Budget Detail Report
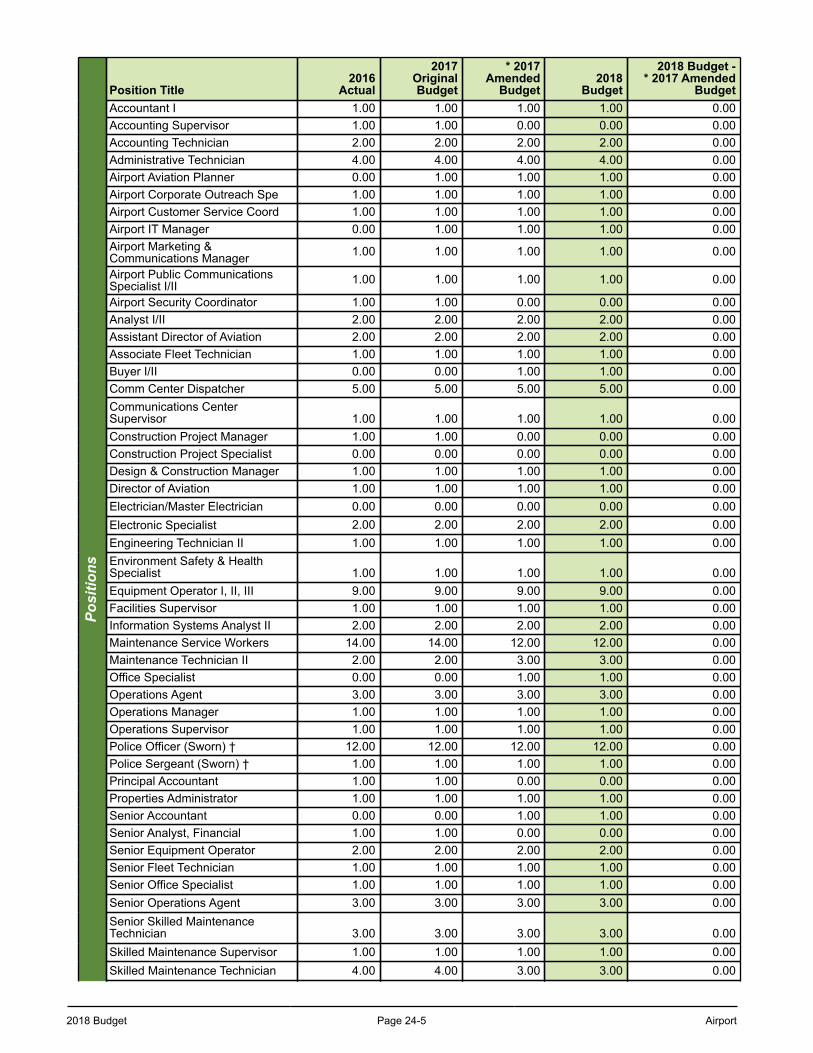
2018 Budget Page 24-5 Airport
Posi
tions
Position Title2016
Actual
2017OriginalBudget
* 2017Amended
Budget2018
Budget
2018 Budget -* 2017 Amended
BudgetAccountant I 1.00 1.00 1.00 1.00 0.00Accounting Supervisor 1.00 1.00 0.00 0.00 0.00Accounting Technician 2.00 2.00 2.00 2.00 0.00Administrative Technician 4.00 4.00 4.00 4.00 0.00Airport Aviation Planner 0.00 1.00 1.00 1.00 0.00Airport Corporate Outreach Spe 1.00 1.00 1.00 1.00 0.00Airport Customer Service Coord 1.00 1.00 1.00 1.00 0.00Airport IT Manager 0.00 1.00 1.00 1.00 0.00Airport Marketing &Communications Manager 1.00 1.00 1.00 1.00 0.00
Airport Public CommunicationsSpecialist I/II 1.00 1.00 1.00 1.00 0.00
Airport Security Coordinator 1.00 1.00 0.00 0.00 0.00Analyst I/II 2.00 2.00 2.00 2.00 0.00Assistant Director of Aviation 2.00 2.00 2.00 2.00 0.00Associate Fleet Technician 1.00 1.00 1.00 1.00 0.00Buyer I/II 0.00 0.00 1.00 1.00 0.00Comm Center Dispatcher 5.00 5.00 5.00 5.00 0.00Communications CenterSupervisor 1.00 1.00 1.00 1.00 0.00Construction Project Manager 1.00 1.00 0.00 0.00 0.00Construction Project Specialist 0.00 0.00 0.00 0.00 0.00Design & Construction Manager 1.00 1.00 1.00 1.00 0.00Director of Aviation 1.00 1.00 1.00 1.00 0.00Electrician/Master Electrician 0.00 0.00 0.00 0.00 0.00Electronic Specialist 2.00 2.00 2.00 2.00 0.00Engineering Technician II 1.00 1.00 1.00 1.00 0.00Environment Safety & HealthSpecialist 1.00 1.00 1.00 1.00 0.00Equipment Operator I, II, III 9.00 9.00 9.00 9.00 0.00Facilities Supervisor 1.00 1.00 1.00 1.00 0.00Information Systems Analyst II 2.00 2.00 2.00 2.00 0.00Maintenance Service Workers 14.00 14.00 12.00 12.00 0.00Maintenance Technician II 2.00 2.00 3.00 3.00 0.00Office Specialist 0.00 0.00 1.00 1.00 0.00Operations Agent 3.00 3.00 3.00 3.00 0.00Operations Manager 1.00 1.00 1.00 1.00 0.00Operations Supervisor 1.00 1.00 1.00 1.00 0.00Police Officer (Sworn) † 12.00 12.00 12.00 12.00 0.00Police Sergeant (Sworn) † 1.00 1.00 1.00 1.00 0.00Principal Accountant 1.00 1.00 0.00 0.00 0.00Properties Administrator 1.00 1.00 1.00 1.00 0.00Senior Accountant 0.00 0.00 1.00 1.00 0.00Senior Analyst, Financial 1.00 1.00 0.00 0.00 0.00Senior Equipment Operator 2.00 2.00 2.00 2.00 0.00Senior Fleet Technician 1.00 1.00 1.00 1.00 0.00Senior Office Specialist 1.00 1.00 1.00 1.00 0.00Senior Operations Agent 3.00 3.00 3.00 3.00 0.00Senior Skilled MaintenanceTechnician 3.00 3.00 3.00 3.00 0.00Skilled Maintenance Supervisor 1.00 1.00 1.00 1.00 0.00Skilled Maintenance Technician 4.00 4.00 3.00 3.00 0.00
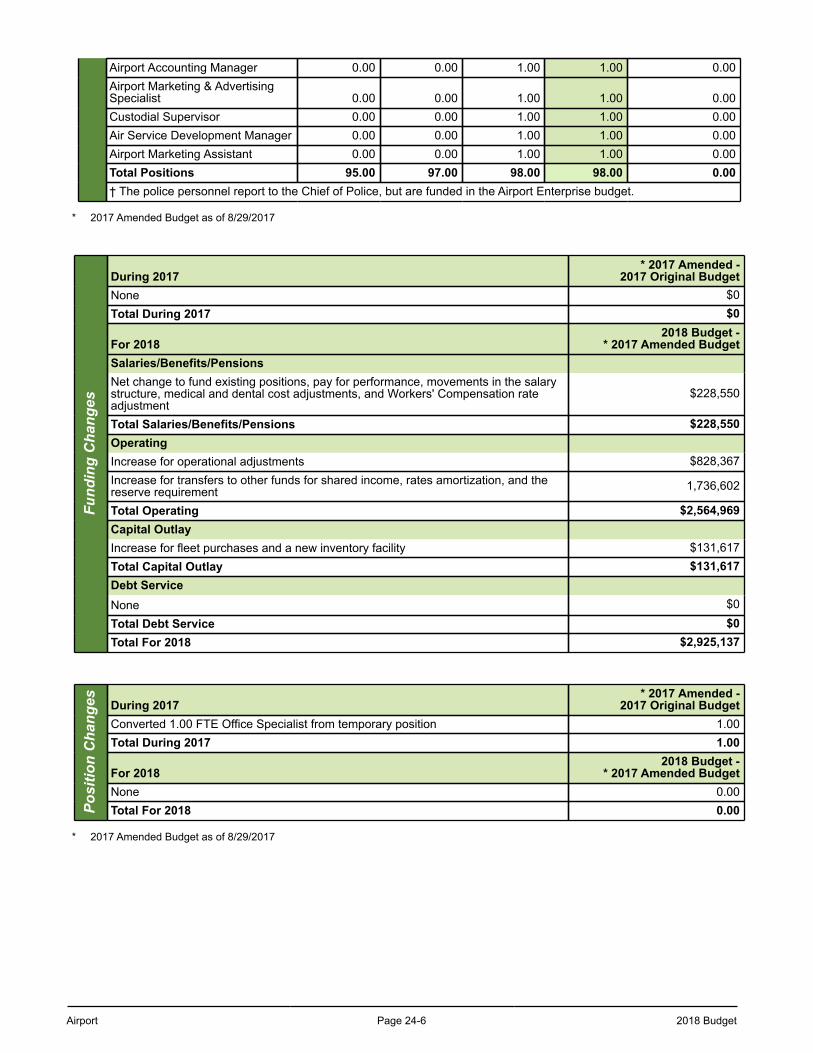
Airport Page 24-6 2018 Budget
Airport Accounting Manager 0.00 0.00 1.00 1.00 0.00Airport Marketing & AdvertisingSpecialist 0.00 0.00 1.00 1.00 0.00Custodial Supervisor 0.00 0.00 1.00 1.00 0.00Air Service Development Manager 0.00 0.00 1.00 1.00 0.00Airport Marketing Assistant 0.00 0.00 1.00 1.00 0.00Total Positions 95.00 97.00 98.00 98.00 0.00† The police personnel report to the Chief of Police, but are funded in the Airport Enterprise budget.
* 2017 Amended Budget as of 8/29/2017
Fund
ing
Cha
nges
During 2017* 2017 Amended -
2017 Original BudgetNone $0Total During 2017 $0
For 20182018 Budget -
* 2017 Amended BudgetSalaries/Benefits/PensionsNet change to fund existing positions, pay for performance, movements in the salarystructure, medical and dental cost adjustments, and Workers' Compensation rateadjustment
$228,550
Total Salaries/Benefits/Pensions $228,550OperatingIncrease for operational adjustments $828,367Increase for transfers to other funds for shared income, rates amortization, and thereserve requirement 1,736,602
Total Operating $2,564,969Capital OutlayIncrease for fleet purchases and a new inventory facility $131,617Total Capital Outlay $131,617Debt ServiceNone $0Total Debt Service $0Total For 2018 $2,925,137
Posi
tion
Cha
nges During 2017
* 2017 Amended -2017 Original Budget
Converted 1.00 FTE Office Specialist from temporary position 1.00Total During 2017 1.00
For 20182018 Budget -
* 2017 Amended BudgetNone 0.00Total For 2018 0.00
* 2017 Amended Budget as of 8/29/2017
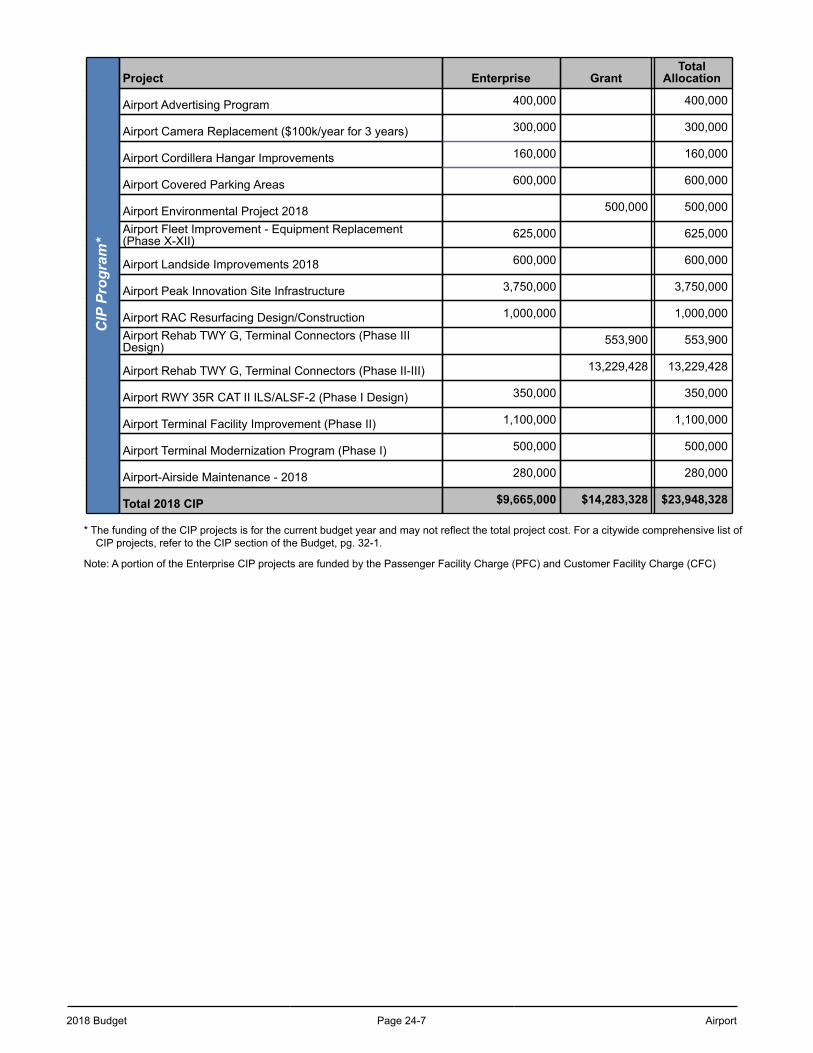
2018 Budget Page 24-7 Airport
CIP
Pro
gram
*Project Enterprise Grant
TotalAllocation
Airport Advertising Program 400,000 400,000
Airport Camera Replacement ($100k/year for 3 years) 300,000 300,000
Airport Cordillera Hangar Improvements 160,000 160,000
Airport Covered Parking Areas 600,000 600,000
Airport Environmental Project 2018 500,000 500,000
Airport Fleet Improvement - Equipment Replacement(Phase X-XII) 625,000 625,000
Airport Landside Improvements 2018 600,000 600,000
Airport Peak Innovation Site Infrastructure 3,750,000 3,750,000
Airport RAC Resurfacing Design/Construction 1,000,000 1,000,000
Airport Rehab TWY G, Terminal Connectors (Phase IIIDesign) 553,900 553,900
Airport Rehab TWY G, Terminal Connectors (Phase II-III) 13,229,428 13,229,428
Airport RWY 35R CAT II ILS/ALSF-2 (Phase I Design) 350,000 350,000
Airport Terminal Facility Improvement (Phase II) 1,100,000 1,100,000
Airport Terminal Modernization Program (Phase I) 500,000 500,000
Airport-Airside Maintenance - 2018 280,000 280,000
Total 2018 CIP $9,665,000 $14,283,328 $23,948,328
* The funding of the CIP projects is for the current budget year and may not reflect the total project cost. For a citywide comprehensive list of CIP projects, refer to the CIP section of the Budget, pg. 32-1.
Note: A portion of the Enterprise CIP projects are funded by the Passenger Facility Charge (PFC) and Customer Facility Charge (CFC)
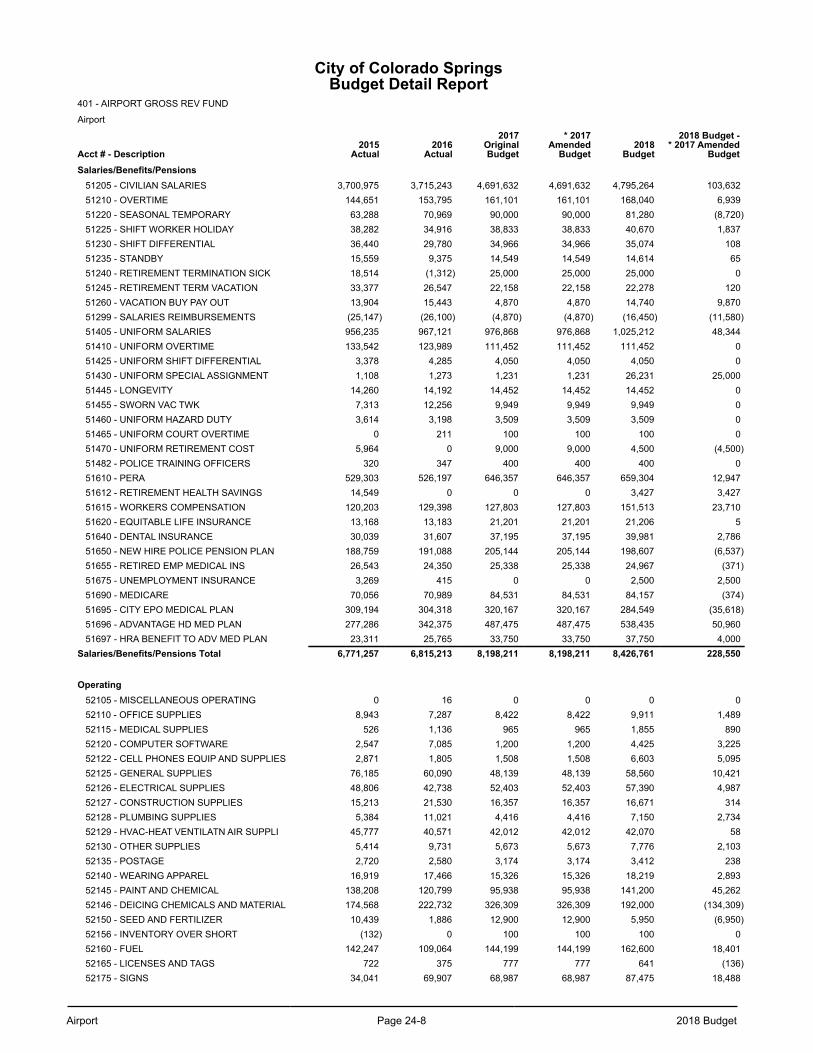
Airport Page 24-8 2018 Budget
City of Colorado SpringsBudget Detail Report
401 - AIRPORT GROSS REV FUND
Airport
Acct # - Description2015
Actual2016
Actual
2017OriginalBudget
* 2017Amended
Budget2018
Budget
2018 Budget -* 2017 Amended
BudgetSalaries/Benefits/Pensions
51205 - CIVILIAN SALARIES 3,700,975 3,715,243 4,691,632 4,691,632 4,795,264 103,63251210 - OVERTIME 144,651 153,795 161,101 161,101 168,040 6,93951220 - SEASONAL TEMPORARY 63,288 70,969 90,000 90,000 81,280 (8,720)51225 - SHIFT WORKER HOLIDAY 38,282 34,916 38,833 38,833 40,670 1,83751230 - SHIFT DIFFERENTIAL 36,440 29,780 34,966 34,966 35,074 10851235 - STANDBY 15,559 9,375 14,549 14,549 14,614 6551240 - RETIREMENT TERMINATION SICK 18,514 (1,312) 25,000 25,000 25,000 051245 - RETIREMENT TERM VACATION 33,377 26,547 22,158 22,158 22,278 12051260 - VACATION BUY PAY OUT 13,904 15,443 4,870 4,870 14,740 9,87051299 - SALARIES REIMBURSEMENTS (25,147) (26,100) (4,870) (4,870) (16,450) (11,580)51405 - UNIFORM SALARIES 956,235 967,121 976,868 976,868 1,025,212 48,34451410 - UNIFORM OVERTIME 133,542 123,989 111,452 111,452 111,452 051425 - UNIFORM SHIFT DIFFERENTIAL 3,378 4,285 4,050 4,050 4,050 051430 - UNIFORM SPECIAL ASSIGNMENT 1,108 1,273 1,231 1,231 26,231 25,00051445 - LONGEVITY 14,260 14,192 14,452 14,452 14,452 051455 - SWORN VAC TWK 7,313 12,256 9,949 9,949 9,949 051460 - UNIFORM HAZARD DUTY 3,614 3,198 3,509 3,509 3,509 051465 - UNIFORM COURT OVERTIME 0 211 100 100 100 051470 - UNIFORM RETIREMENT COST 5,964 0 9,000 9,000 4,500 (4,500)51482 - POLICE TRAINING OFFICERS 320 347 400 400 400 051610 - PERA 529,303 526,197 646,357 646,357 659,304 12,94751612 - RETIREMENT HEALTH SAVINGS 14,549 0 0 0 3,427 3,42751615 - WORKERS COMPENSATION 120,203 129,398 127,803 127,803 151,513 23,71051620 - EQUITABLE LIFE INSURANCE 13,168 13,183 21,201 21,201 21,206 551640 - DENTAL INSURANCE 30,039 31,607 37,195 37,195 39,981 2,78651650 - NEW HIRE POLICE PENSION PLAN 188,759 191,088 205,144 205,144 198,607 (6,537)51655 - RETIRED EMP MEDICAL INS 26,543 24,350 25,338 25,338 24,967 (371)51675 - UNEMPLOYMENT INSURANCE 3,269 415 0 0 2,500 2,50051690 - MEDICARE 70,056 70,989 84,531 84,531 84,157 (374)51695 - CITY EPO MEDICAL PLAN 309,194 304,318 320,167 320,167 284,549 (35,618)51696 - ADVANTAGE HD MED PLAN 277,286 342,375 487,475 487,475 538,435 50,96051697 - HRA BENEFIT TO ADV MED PLAN 23,311 25,765 33,750 33,750 37,750 4,000
Salaries/Benefits/Pensions Total 6,771,257 6,815,213 8,198,211 8,198,211 8,426,761 228,550
Operating52105 - MISCELLANEOUS OPERATING 0 16 0 0 0 052110 - OFFICE SUPPLIES 8,943 7,287 8,422 8,422 9,911 1,48952115 - MEDICAL SUPPLIES 526 1,136 965 965 1,855 89052120 - COMPUTER SOFTWARE 2,547 7,085 1,200 1,200 4,425 3,22552122 - CELL PHONES EQUIP AND SUPPLIES 2,871 1,805 1,508 1,508 6,603 5,09552125 - GENERAL SUPPLIES 76,185 60,090 48,139 48,139 58,560 10,42152126 - ELECTRICAL SUPPLIES 48,806 42,738 52,403 52,403 57,390 4,98752127 - CONSTRUCTION SUPPLIES 15,213 21,530 16,357 16,357 16,671 31452128 - PLUMBING SUPPLIES 5,384 11,021 4,416 4,416 7,150 2,73452129 - HVAC-HEAT VENTILATN AIR SUPPLI 45,777 40,571 42,012 42,012 42,070 5852130 - OTHER SUPPLIES 5,414 9,731 5,673 5,673 7,776 2,10352135 - POSTAGE 2,720 2,580 3,174 3,174 3,412 23852140 - WEARING APPAREL 16,919 17,466 15,326 15,326 18,219 2,89352145 - PAINT AND CHEMICAL 138,208 120,799 95,938 95,938 141,200 45,26252146 - DEICING CHEMICALS AND MATERIAL 174,568 222,732 326,309 326,309 192,000 (134,309)52150 - SEED AND FERTILIZER 10,439 1,886 12,900 12,900 5,950 (6,950)52156 - INVENTORY OVER SHORT (132) 0 100 100 100 052160 - FUEL 142,247 109,064 144,199 144,199 162,600 18,40152165 - LICENSES AND TAGS 722 375 777 777 641 (136)52175 - SIGNS 34,041 69,907 68,987 68,987 87,475 18,488
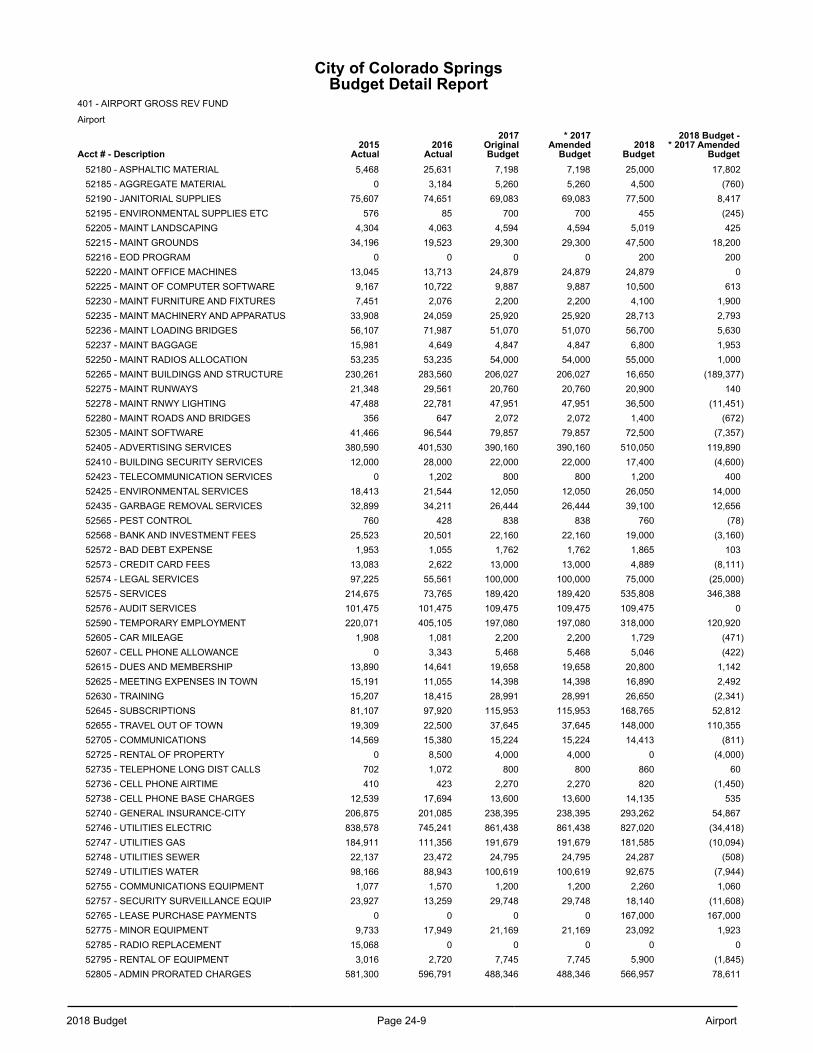
2018 Budget Page 24-9 Airport
City of Colorado SpringsBudget Detail Report
401 - AIRPORT GROSS REV FUND
Airport
Acct # - Description2015
Actual2016
Actual
2017OriginalBudget
* 2017Amended
Budget2018
Budget
2018 Budget -* 2017 Amended
Budget52180 - ASPHALTIC MATERIAL 5,468 25,631 7,198 7,198 25,000 17,80252185 - AGGREGATE MATERIAL 0 3,184 5,260 5,260 4,500 (760)52190 - JANITORIAL SUPPLIES 75,607 74,651 69,083 69,083 77,500 8,41752195 - ENVIRONMENTAL SUPPLIES ETC 576 85 700 700 455 (245)52205 - MAINT LANDSCAPING 4,304 4,063 4,594 4,594 5,019 42552215 - MAINT GROUNDS 34,196 19,523 29,300 29,300 47,500 18,20052216 - EOD PROGRAM 0 0 0 0 200 20052220 - MAINT OFFICE MACHINES 13,045 13,713 24,879 24,879 24,879 052225 - MAINT OF COMPUTER SOFTWARE 9,167 10,722 9,887 9,887 10,500 61352230 - MAINT FURNITURE AND FIXTURES 7,451 2,076 2,200 2,200 4,100 1,90052235 - MAINT MACHINERY AND APPARATUS 33,908 24,059 25,920 25,920 28,713 2,79352236 - MAINT LOADING BRIDGES 56,107 71,987 51,070 51,070 56,700 5,63052237 - MAINT BAGGAGE 15,981 4,649 4,847 4,847 6,800 1,95352250 - MAINT RADIOS ALLOCATION 53,235 53,235 54,000 54,000 55,000 1,00052265 - MAINT BUILDINGS AND STRUCTURE 230,261 283,560 206,027 206,027 16,650 (189,377)52275 - MAINT RUNWAYS 21,348 29,561 20,760 20,760 20,900 14052278 - MAINT RNWY LIGHTING 47,488 22,781 47,951 47,951 36,500 (11,451)52280 - MAINT ROADS AND BRIDGES 356 647 2,072 2,072 1,400 (672)52305 - MAINT SOFTWARE 41,466 96,544 79,857 79,857 72,500 (7,357)52405 - ADVERTISING SERVICES 380,590 401,530 390,160 390,160 510,050 119,89052410 - BUILDING SECURITY SERVICES 12,000 28,000 22,000 22,000 17,400 (4,600)52423 - TELECOMMUNICATION SERVICES 0 1,202 800 800 1,200 40052425 - ENVIRONMENTAL SERVICES 18,413 21,544 12,050 12,050 26,050 14,00052435 - GARBAGE REMOVAL SERVICES 32,899 34,211 26,444 26,444 39,100 12,65652565 - PEST CONTROL 760 428 838 838 760 (78)52568 - BANK AND INVESTMENT FEES 25,523 20,501 22,160 22,160 19,000 (3,160)52572 - BAD DEBT EXPENSE 1,953 1,055 1,762 1,762 1,865 10352573 - CREDIT CARD FEES 13,083 2,622 13,000 13,000 4,889 (8,111)52574 - LEGAL SERVICES 97,225 55,561 100,000 100,000 75,000 (25,000)52575 - SERVICES 214,675 73,765 189,420 189,420 535,808 346,38852576 - AUDIT SERVICES 101,475 101,475 109,475 109,475 109,475 052590 - TEMPORARY EMPLOYMENT 220,071 405,105 197,080 197,080 318,000 120,92052605 - CAR MILEAGE 1,908 1,081 2,200 2,200 1,729 (471)52607 - CELL PHONE ALLOWANCE 0 3,343 5,468 5,468 5,046 (422)52615 - DUES AND MEMBERSHIP 13,890 14,641 19,658 19,658 20,800 1,14252625 - MEETING EXPENSES IN TOWN 15,191 11,055 14,398 14,398 16,890 2,49252630 - TRAINING 15,207 18,415 28,991 28,991 26,650 (2,341)52645 - SUBSCRIPTIONS 81,107 97,920 115,953 115,953 168,765 52,81252655 - TRAVEL OUT OF TOWN 19,309 22,500 37,645 37,645 148,000 110,35552705 - COMMUNICATIONS 14,569 15,380 15,224 15,224 14,413 (811)52725 - RENTAL OF PROPERTY 0 8,500 4,000 4,000 0 (4,000)52735 - TELEPHONE LONG DIST CALLS 702 1,072 800 800 860 6052736 - CELL PHONE AIRTIME 410 423 2,270 2,270 820 (1,450)52738 - CELL PHONE BASE CHARGES 12,539 17,694 13,600 13,600 14,135 53552740 - GENERAL INSURANCE-CITY 206,875 201,085 238,395 238,395 293,262 54,86752746 - UTILITIES ELECTRIC 838,578 745,241 861,438 861,438 827,020 (34,418)52747 - UTILITIES GAS 184,911 111,356 191,679 191,679 181,585 (10,094)52748 - UTILITIES SEWER 22,137 23,472 24,795 24,795 24,287 (508)52749 - UTILITIES WATER 98,166 88,943 100,619 100,619 92,675 (7,944)52755 - COMMUNICATIONS EQUIPMENT 1,077 1,570 1,200 1,200 2,260 1,06052757 - SECURITY SURVEILLANCE EQUIP 23,927 13,259 29,748 29,748 18,140 (11,608)52765 - LEASE PURCHASE PAYMENTS 0 0 0 0 167,000 167,00052775 - MINOR EQUIPMENT 9,733 17,949 21,169 21,169 23,092 1,92352785 - RADIO REPLACEMENT 15,068 0 0 0 0 052795 - RENTAL OF EQUIPMENT 3,016 2,720 7,745 7,745 5,900 (1,845)52805 - ADMIN PRORATED CHARGES 581,300 596,791 488,346 488,346 566,957 78,611
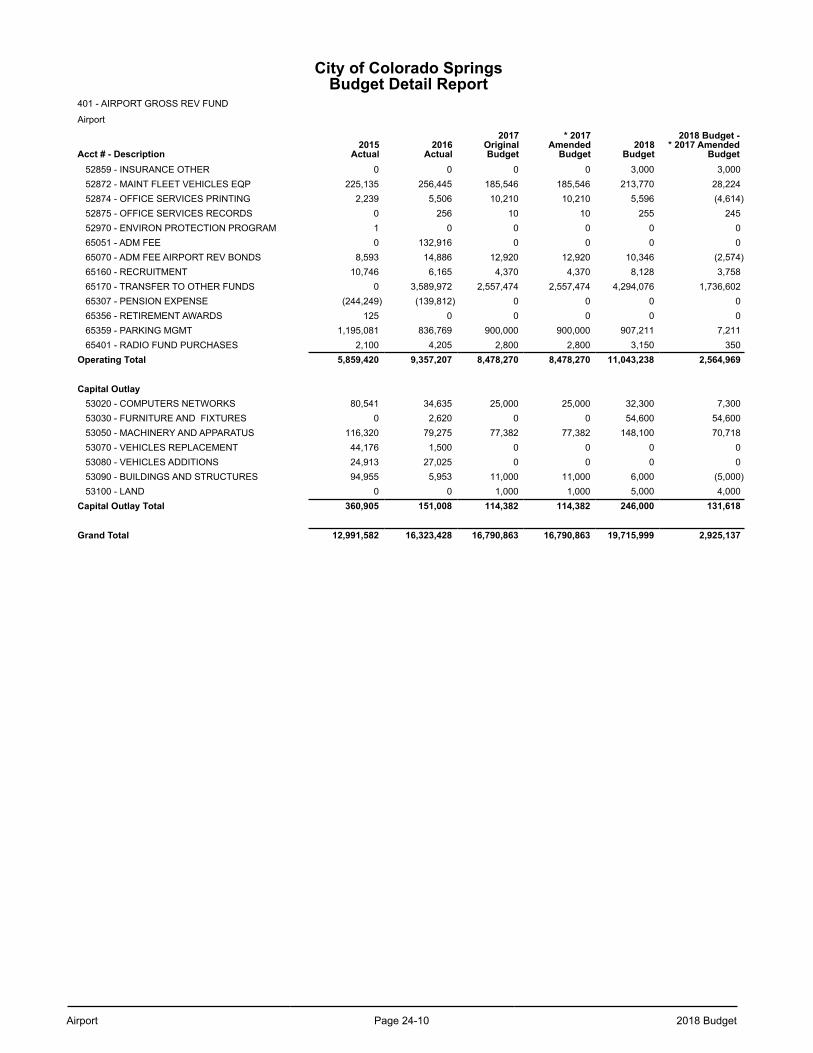
Airport Page 24-10 2018 Budget
City of Colorado SpringsBudget Detail Report
401 - AIRPORT GROSS REV FUND
Airport
Acct # - Description2015
Actual2016
Actual
2017OriginalBudget
* 2017Amended
Budget2018
Budget
2018 Budget -* 2017 Amended
Budget52859 - INSURANCE OTHER 0 0 0 0 3,000 3,00052872 - MAINT FLEET VEHICLES EQP 225,135 256,445 185,546 185,546 213,770 28,22452874 - OFFICE SERVICES PRINTING 2,239 5,506 10,210 10,210 5,596 (4,614)52875 - OFFICE SERVICES RECORDS 0 256 10 10 255 24552970 - ENVIRON PROTECTION PROGRAM 1 0 0 0 0 065051 - ADM FEE 0 132,916 0 0 0 065070 - ADM FEE AIRPORT REV BONDS 8,593 14,886 12,920 12,920 10,346 (2,574)65160 - RECRUITMENT 10,746 6,165 4,370 4,370 8,128 3,75865170 - TRANSFER TO OTHER FUNDS 0 3,589,972 2,557,474 2,557,474 4,294,076 1,736,60265307 - PENSION EXPENSE (244,249) (139,812) 0 0 0 065356 - RETIREMENT AWARDS 125 0 0 0 0 065359 - PARKING MGMT 1,195,081 836,769 900,000 900,000 907,211 7,21165401 - RADIO FUND PURCHASES 2,100 4,205 2,800 2,800 3,150 350
Operating Total 5,859,420 9,357,207 8,478,270 8,478,270 11,043,238 2,564,969
Capital Outlay53020 - COMPUTERS NETWORKS 80,541 34,635 25,000 25,000 32,300 7,30053030 - FURNITURE AND FIXTURES 0 2,620 0 0 54,600 54,60053050 - MACHINERY AND APPARATUS 116,320 79,275 77,382 77,382 148,100 70,71853070 - VEHICLES REPLACEMENT 44,176 1,500 0 0 0 053080 - VEHICLES ADDITIONS 24,913 27,025 0 0 0 053090 - BUILDINGS AND STRUCTURES 94,955 5,953 11,000 11,000 6,000 (5,000)53100 - LAND 0 0 1,000 1,000 5,000 4,000
Capital Outlay Total 360,905 151,008 114,382 114,382 246,000 131,618
Grand Total 12,991,582 16,323,428 16,790,863 16,790,863 19,715,999 2,925,137
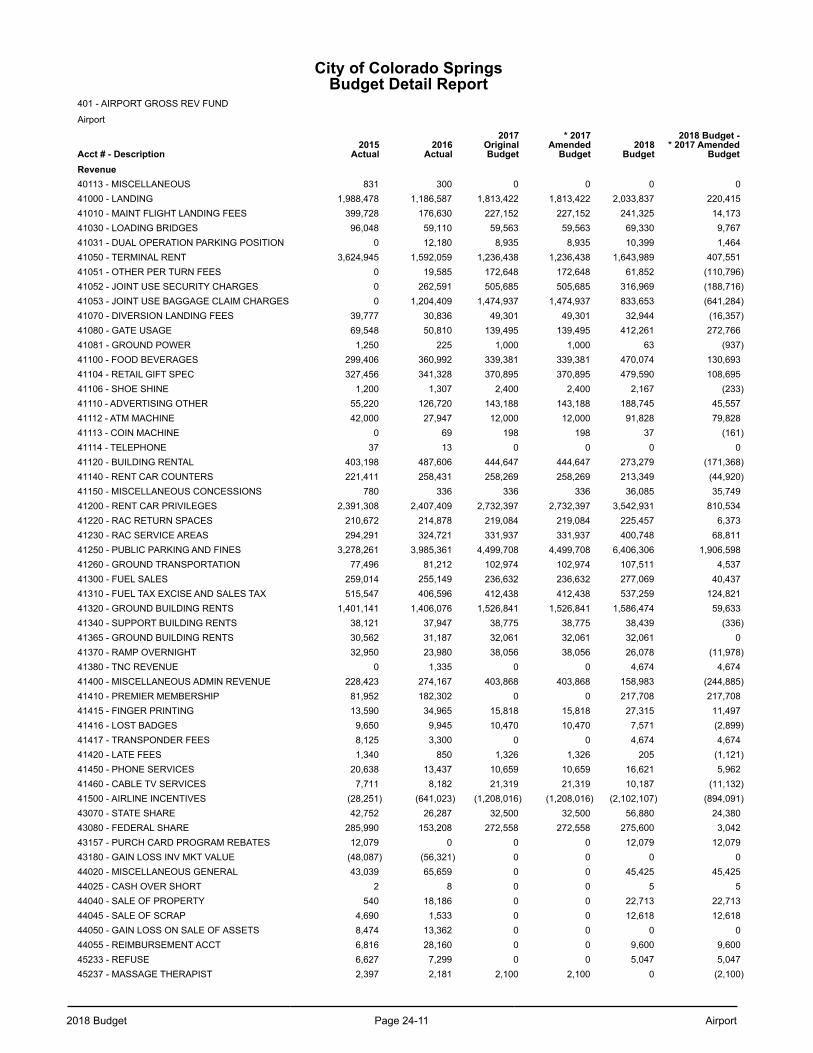
2018 Budget Page 24-11 Airport
City of Colorado SpringsBudget Detail Report
401 - AIRPORT GROSS REV FUND
Airport
Acct # - Description2015
Actual2016
Actual
2017OriginalBudget
* 2017Amended
Budget2018
Budget
2018 Budget -* 2017 Amended
BudgetRevenue40113 - MISCELLANEOUS 831 300 0 0 0 041000 - LANDING 1,988,478 1,186,587 1,813,422 1,813,422 2,033,837 220,41541010 - MAINT FLIGHT LANDING FEES 399,728 176,630 227,152 227,152 241,325 14,17341030 - LOADING BRIDGES 96,048 59,110 59,563 59,563 69,330 9,76741031 - DUAL OPERATION PARKING POSITION 0 12,180 8,935 8,935 10,399 1,46441050 - TERMINAL RENT 3,624,945 1,592,059 1,236,438 1,236,438 1,643,989 407,55141051 - OTHER PER TURN FEES 0 19,585 172,648 172,648 61,852 (110,796)41052 - JOINT USE SECURITY CHARGES 0 262,591 505,685 505,685 316,969 (188,716)41053 - JOINT USE BAGGAGE CLAIM CHARGES 0 1,204,409 1,474,937 1,474,937 833,653 (641,284)41070 - DIVERSION LANDING FEES 39,777 30,836 49,301 49,301 32,944 (16,357)41080 - GATE USAGE 69,548 50,810 139,495 139,495 412,261 272,76641081 - GROUND POWER 1,250 225 1,000 1,000 63 (937)41100 - FOOD BEVERAGES 299,406 360,992 339,381 339,381 470,074 130,69341104 - RETAIL GIFT SPEC 327,456 341,328 370,895 370,895 479,590 108,69541106 - SHOE SHINE 1,200 1,307 2,400 2,400 2,167 (233)41110 - ADVERTISING OTHER 55,220 126,720 143,188 143,188 188,745 45,55741112 - ATM MACHINE 42,000 27,947 12,000 12,000 91,828 79,82841113 - COIN MACHINE 0 69 198 198 37 (161)41114 - TELEPHONE 37 13 0 0 0 041120 - BUILDING RENTAL 403,198 487,606 444,647 444,647 273,279 (171,368)41140 - RENT CAR COUNTERS 221,411 258,431 258,269 258,269 213,349 (44,920)41150 - MISCELLANEOUS CONCESSIONS 780 336 336 336 36,085 35,74941200 - RENT CAR PRIVILEGES 2,391,308 2,407,409 2,732,397 2,732,397 3,542,931 810,53441220 - RAC RETURN SPACES 210,672 214,878 219,084 219,084 225,457 6,37341230 - RAC SERVICE AREAS 294,291 324,721 331,937 331,937 400,748 68,81141250 - PUBLIC PARKING AND FINES 3,278,261 3,985,361 4,499,708 4,499,708 6,406,306 1,906,59841260 - GROUND TRANSPORTATION 77,496 81,212 102,974 102,974 107,511 4,53741300 - FUEL SALES 259,014 255,149 236,632 236,632 277,069 40,43741310 - FUEL TAX EXCISE AND SALES TAX 515,547 406,596 412,438 412,438 537,259 124,82141320 - GROUND BUILDING RENTS 1,401,141 1,406,076 1,526,841 1,526,841 1,586,474 59,63341340 - SUPPORT BUILDING RENTS 38,121 37,947 38,775 38,775 38,439 (336)41365 - GROUND BUILDING RENTS 30,562 31,187 32,061 32,061 32,061 041370 - RAMP OVERNIGHT 32,950 23,980 38,056 38,056 26,078 (11,978)41380 - TNC REVENUE 0 1,335 0 0 4,674 4,67441400 - MISCELLANEOUS ADMIN REVENUE 228,423 274,167 403,868 403,868 158,983 (244,885)41410 - PREMIER MEMBERSHIP 81,952 182,302 0 0 217,708 217,70841415 - FINGER PRINTING 13,590 34,965 15,818 15,818 27,315 11,49741416 - LOST BADGES 9,650 9,945 10,470 10,470 7,571 (2,899)41417 - TRANSPONDER FEES 8,125 3,300 0 0 4,674 4,67441420 - LATE FEES 1,340 850 1,326 1,326 205 (1,121)41450 - PHONE SERVICES 20,638 13,437 10,659 10,659 16,621 5,96241460 - CABLE TV SERVICES 7,711 8,182 21,319 21,319 10,187 (11,132)41500 - AIRLINE INCENTIVES (28,251) (641,023) (1,208,016) (1,208,016) (2,102,107) (894,091)43070 - STATE SHARE 42,752 26,287 32,500 32,500 56,880 24,38043080 - FEDERAL SHARE 285,990 153,208 272,558 272,558 275,600 3,04243157 - PURCH CARD PROGRAM REBATES 12,079 0 0 0 12,079 12,07943180 - GAIN LOSS INV MKT VALUE (48,087) (56,321) 0 0 0 044020 - MISCELLANEOUS GENERAL 43,039 65,659 0 0 45,425 45,42544025 - CASH OVER SHORT 2 8 0 0 5 544040 - SALE OF PROPERTY 540 18,186 0 0 22,713 22,71344045 - SALE OF SCRAP 4,690 1,533 0 0 12,618 12,61844050 - GAIN LOSS ON SALE OF ASSETS 8,474 13,362 0 0 0 044055 - REIMBURSEMENT ACCT 6,816 28,160 0 0 9,600 9,60045233 - REFUSE 6,627 7,299 0 0 5,047 5,04745237 - MASSAGE THERAPIST 2,397 2,181 2,100 2,100 0 (2,100)
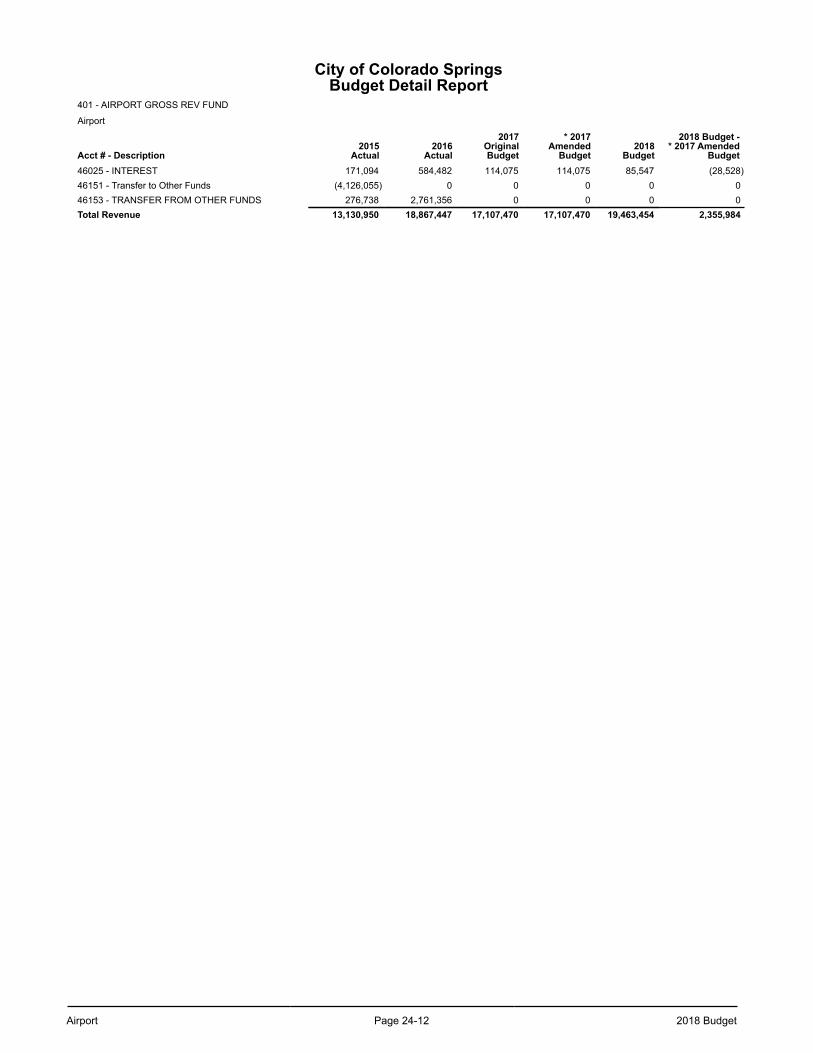
Airport Page 24-12 2018 Budget
City of Colorado SpringsBudget Detail Report
401 - AIRPORT GROSS REV FUND
Airport
Acct # - Description2015
Actual2016
Actual
2017OriginalBudget
* 2017Amended
Budget2018
Budget
2018 Budget -* 2017 Amended
Budget46025 - INTEREST 171,094 584,482 114,075 114,075 85,547 (28,528)46151 - Transfer to Other Funds (4,126,055) 0 0 0 0 046153 - TRANSFER FROM OTHER FUNDS 276,738 2,761,356 0 0 0 0Total Revenue 13,130,950 18,867,447 17,107,470 17,107,470 19,463,454 2,355,984
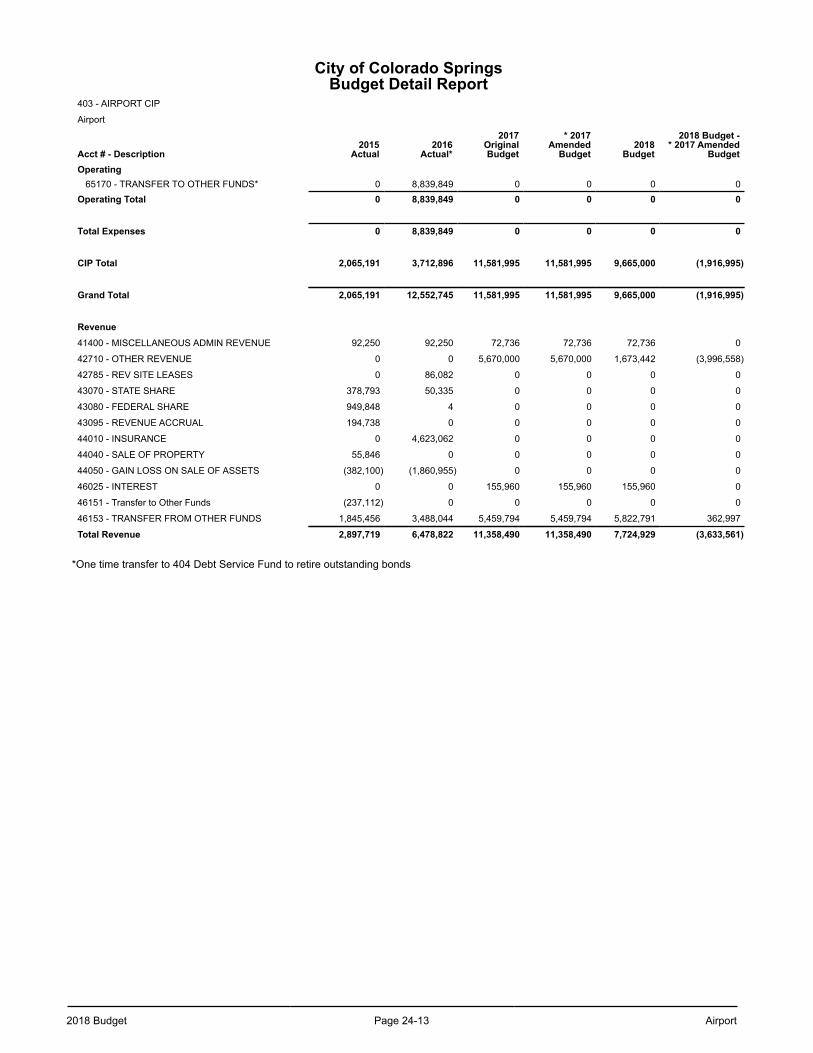
2018 Budget Page 24-13 Airport
City of Colorado SpringsBudget Detail Report
403 - AIRPORT CIP
Airport
Acct # - Description2015
Actual2016
Actual*
2017OriginalBudget
* 2017Amended
Budget2018
Budget
2018 Budget -* 2017 Amended
BudgetOperating
65170 - TRANSFER TO OTHER FUNDS* 0 8,839,849 0 0 0 0Operating Total 0 8,839,849 0 0 0 0
Total Expenses 0 8,839,849 0 0 0 0
CIP Total 2,065,191 3,712,896 11,581,995 11,581,995 9,665,000 (1,916,995)
Grand Total 2,065,191 12,552,745 11,581,995 11,581,995 9,665,000 (1,916,995)
Revenue41400 - MISCELLANEOUS ADMIN REVENUE 92,250 92,250 72,736 72,736 72,736 0
42710 - OTHER REVENUE 0 0 5,670,000 5,670,000 1,673,442 (3,996,558)
42785 - REV SITE LEASES 0 86,082 0 0 0 0
43070 - STATE SHARE 378,793 50,335 0 0 0 0
43080 - FEDERAL SHARE 949,848 4 0 0 0 0
43095 - REVENUE ACCRUAL 194,738 0 0 0 0 0
44010 - INSURANCE 0 4,623,062 0 0 0 0
44040 - SALE OF PROPERTY 55,846 0 0 0 0 0
44050 - GAIN LOSS ON SALE OF ASSETS (382,100) (1,860,955) 0 0 0 0
46025 - INTEREST 0 0 155,960 155,960 155,960 0
46151 - Transfer to Other Funds (237,112) 0 0 0 0 0
46153 - TRANSFER FROM OTHER FUNDS 1,845,456 3,488,044 5,459,794 5,459,794 5,822,791 362,997
Total Revenue 2,897,719 6,478,822 11,358,490 11,358,490 7,724,929 (3,633,561)
*One time transfer to 404 Debt Service Fund to retire outstanding bonds
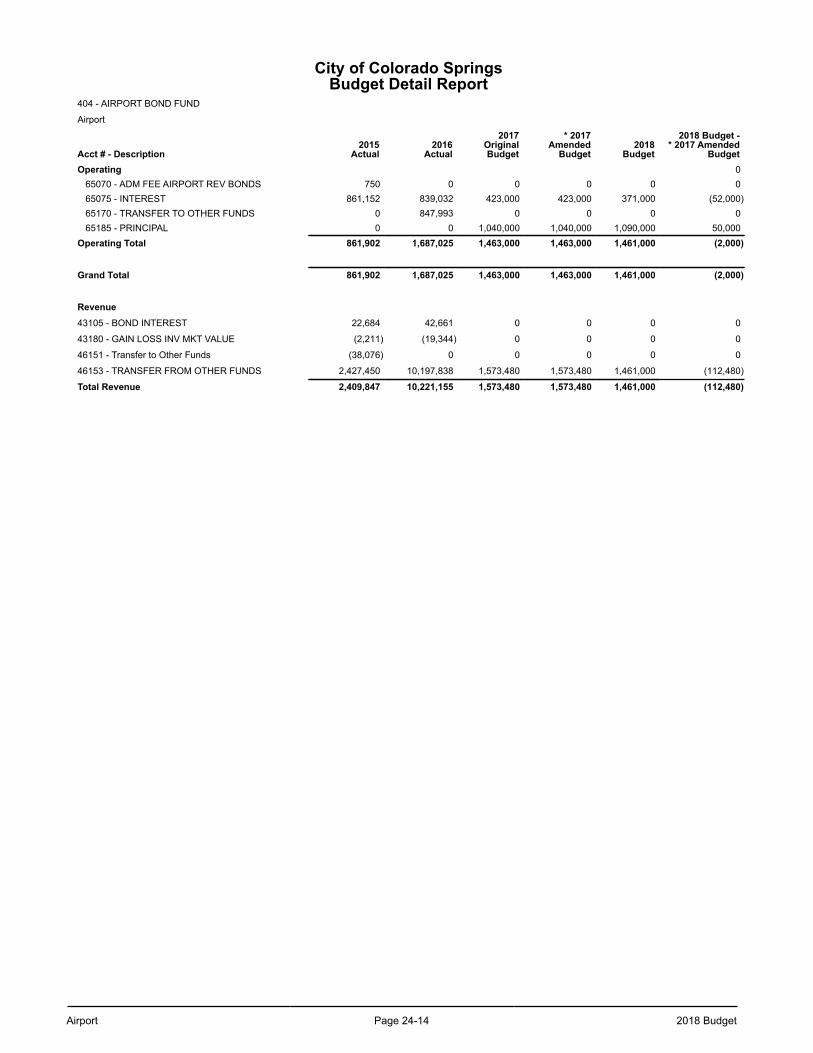
Airport Page 24-14 2018 Budget
City of Colorado SpringsBudget Detail Report
404 - AIRPORT BOND FUND
Airport
Acct # - Description2015
Actual2016
Actual
2017OriginalBudget
* 2017Amended
Budget2018
Budget
2018 Budget -* 2017 Amended
BudgetOperating 0
65070 - ADM FEE AIRPORT REV BONDS 750 0 0 0 0 065075 - INTEREST 861,152 839,032 423,000 423,000 371,000 (52,000)65170 - TRANSFER TO OTHER FUNDS 0 847,993 0 0 0 065185 - PRINCIPAL 0 0 1,040,000 1,040,000 1,090,000 50,000
Operating Total 861,902 1,687,025 1,463,000 1,463,000 1,461,000 (2,000)
Grand Total 861,902 1,687,025 1,463,000 1,463,000 1,461,000 (2,000)
Revenue43105 - BOND INTEREST 22,684 42,661 0 0 0 0
43180 - GAIN LOSS INV MKT VALUE (2,211) (19,344) 0 0 0 0
46151 - Transfer to Other Funds (38,076) 0 0 0 0 0
46153 - TRANSFER FROM OTHER FUNDS 2,427,450 10,197,838 1,573,480 1,573,480 1,461,000 (112,480)
Total Revenue 2,409,847 10,221,155 1,573,480 1,573,480 1,461,000 (112,480)
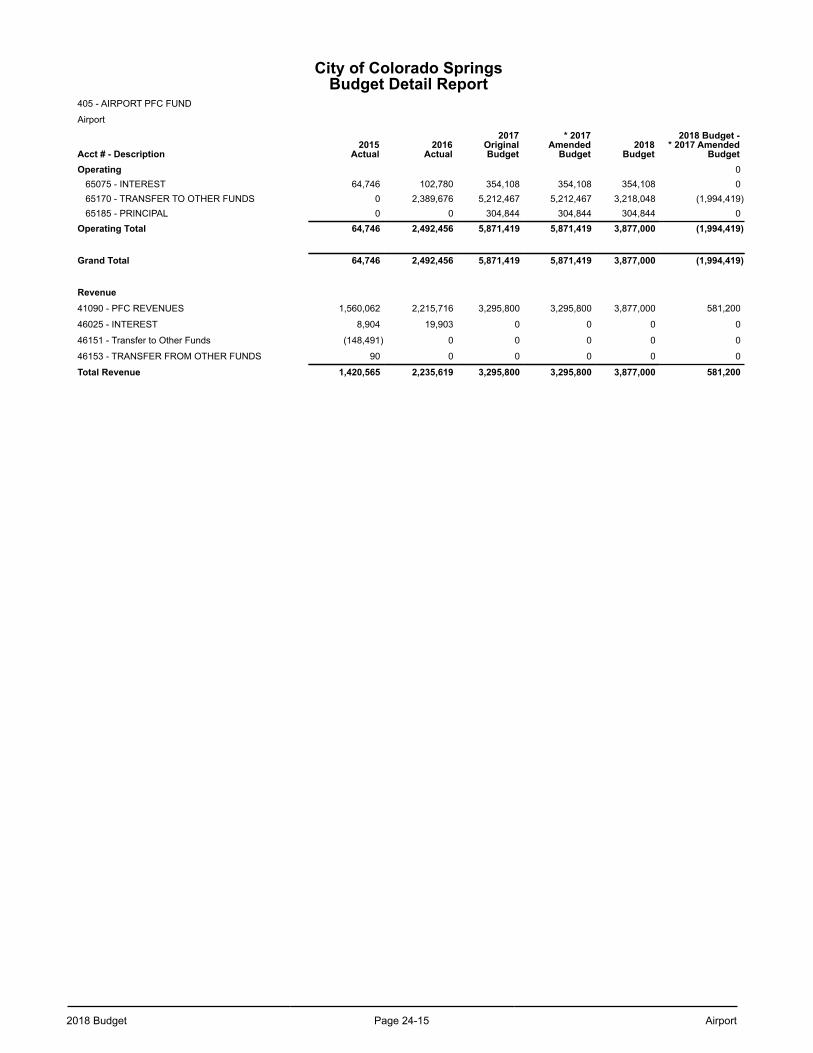
2018 Budget Page 24-15 Airport
City of Colorado SpringsBudget Detail Report
405 - AIRPORT PFC FUND
Airport
Acct # - Description2015
Actual2016
Actual
2017OriginalBudget
* 2017Amended
Budget2018
Budget
2018 Budget -* 2017 Amended
BudgetOperating 0
65075 - INTEREST 64,746 102,780 354,108 354,108 354,108 065170 - TRANSFER TO OTHER FUNDS 0 2,389,676 5,212,467 5,212,467 3,218,048 (1,994,419)65185 - PRINCIPAL 0 0 304,844 304,844 304,844 0
Operating Total 64,746 2,492,456 5,871,419 5,871,419 3,877,000 (1,994,419)
Grand Total 64,746 2,492,456 5,871,419 5,871,419 3,877,000 (1,994,419)
Revenue41090 - PFC REVENUES 1,560,062 2,215,716 3,295,800 3,295,800 3,877,000 581,200
46025 - INTEREST 8,904 19,903 0 0 0 0
46151 - Transfer to Other Funds (148,491) 0 0 0 0 0
46153 - TRANSFER FROM OTHER FUNDS 90 0 0 0 0 0
Total Revenue 1,420,565 2,235,619 3,295,800 3,295,800 3,877,000 581,200
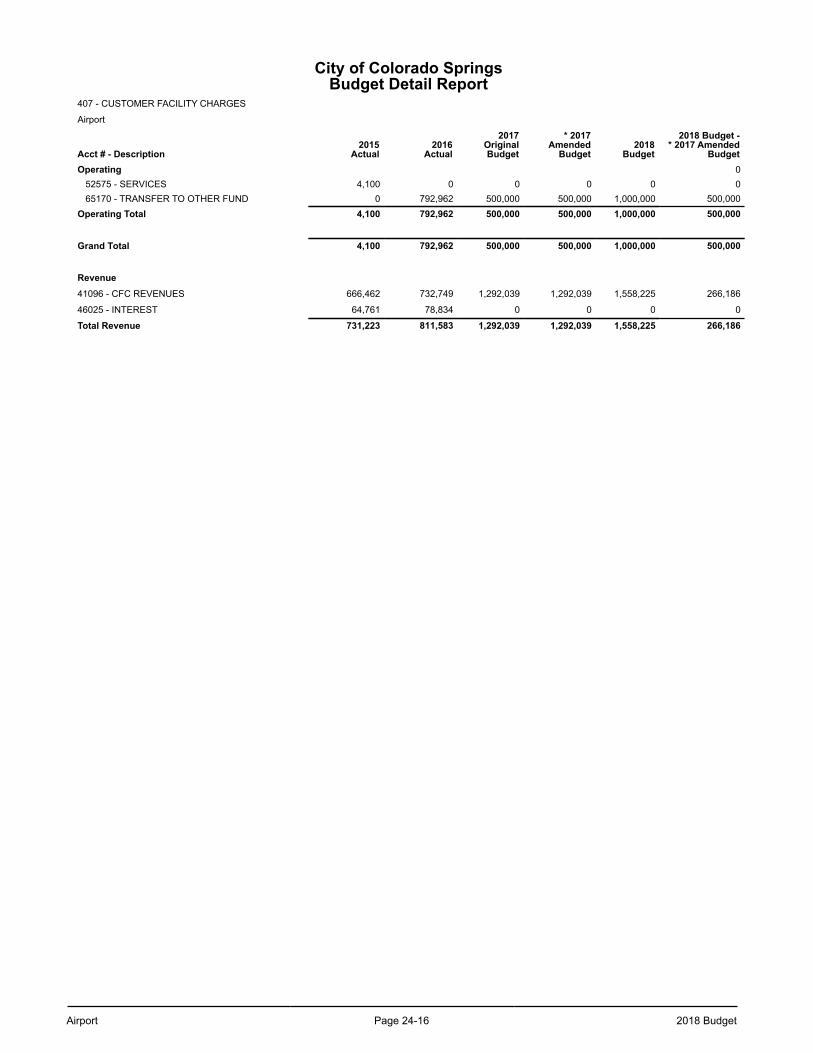
Airport Page 24-16 2018 Budget
City of Colorado SpringsBudget Detail Report
407 - CUSTOMER FACILITY CHARGES
Airport
Acct # - Description2015
Actual2016
Actual
2017OriginalBudget
* 2017Amended
Budget2018
Budget
2018 Budget -* 2017 Amended
BudgetOperating 0
52575 - SERVICES 4,100 0 0 0 0 065170 - TRANSFER TO OTHER FUND 0 792,962 500,000 500,000 1,000,000 500,000
Operating Total 4,100 792,962 500,000 500,000 1,000,000 500,000
Grand Total 4,100 792,962 500,000 500,000 1,000,000 500,000
Revenue41096 - CFC REVENUES 666,462 732,749 1,292,039 1,292,039 1,558,225 266,186
46025 - INTEREST 64,761 78,834 0 0 0 0
Total Revenue 731,223 811,583 1,292,039 1,292,039 1,558,225 266,186
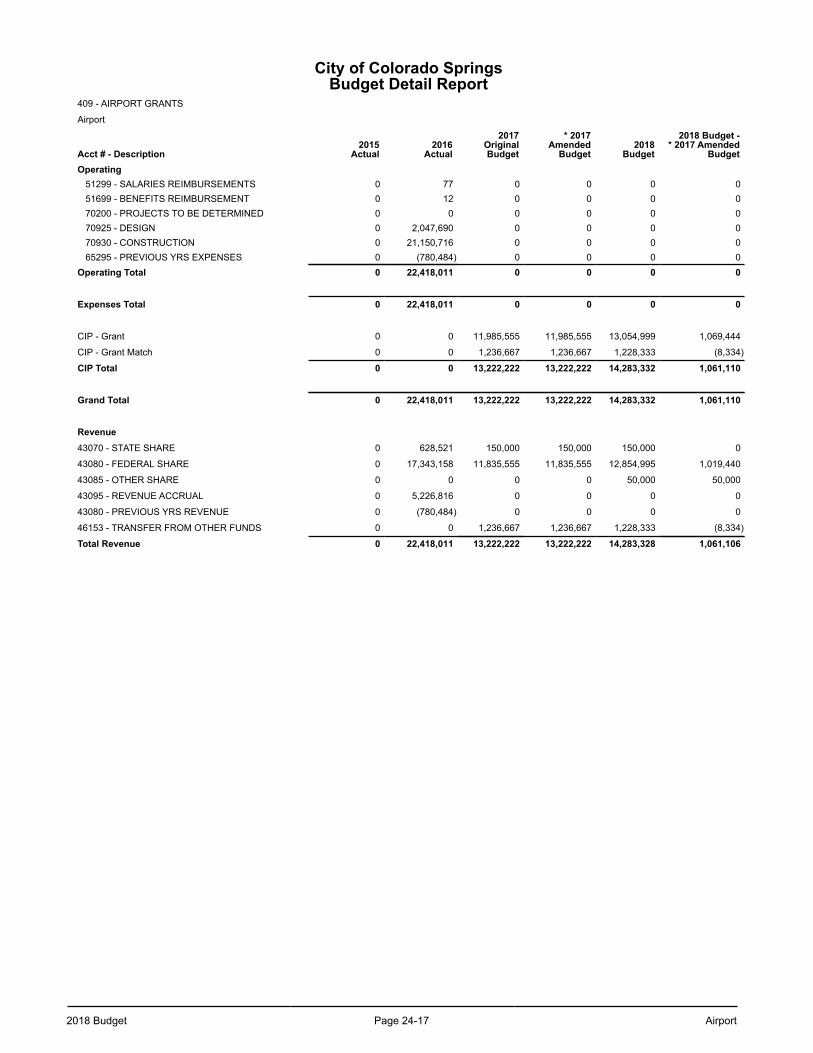
2018 Budget Page 24-17 Airport
City of Colorado SpringsBudget Detail Report
409 - AIRPORT GRANTS
Airport
Acct # - Description2015
Actual2016
Actual
2017OriginalBudget
* 2017Amended
Budget2018
Budget
2018 Budget -* 2017 Amended
BudgetOperating
51299 - SALARIES REIMBURSEMENTS 0 77 0 0 0 051699 - BENEFITS REIMBURSEMENT 0 12 0 0 0 070200 - PROJECTS TO BE DETERMINED 0 0 0 0 0 070925 - DESIGN 0 2,047,690 0 0 0 070930 - CONSTRUCTION 0 21,150,716 0 0 0 065295 - PREVIOUS YRS EXPENSES 0 (780,484) 0 0 0 0
Operating Total 0 22,418,011 0 0 0 0
Expenses Total 0 22,418,011 0 0 0 0
CIP - Grant 0 0 11,985,555 11,985,555 13,054,999 1,069,444
CIP - Grant Match 0 0 1,236,667 1,236,667 1,228,333 (8,334)
CIP Total 0 0 13,222,222 13,222,222 14,283,332 1,061,110
Grand Total 0 22,418,011 13,222,222 13,222,222 14,283,332 1,061,110
Revenue43070 - STATE SHARE 0 628,521 150,000 150,000 150,000 0
43080 - FEDERAL SHARE 0 17,343,158 11,835,555 11,835,555 12,854,995 1,019,440
43085 - OTHER SHARE 0 0 0 0 50,000 50,000
43095 - REVENUE ACCRUAL 0 5,226,816 0 0 0 0
43080 - PREVIOUS YRS REVENUE 0 (780,484) 0 0 0 0
46153 - TRANSFER FROM OTHER FUNDS 0 0 1,236,667 1,236,667 1,228,333 (8,334)
Total Revenue 0 22,418,011 13,222,222 13,222,222 14,283,328 1,061,106

Airport Page 24-18 2018 Budget
This page left blank intentionally.
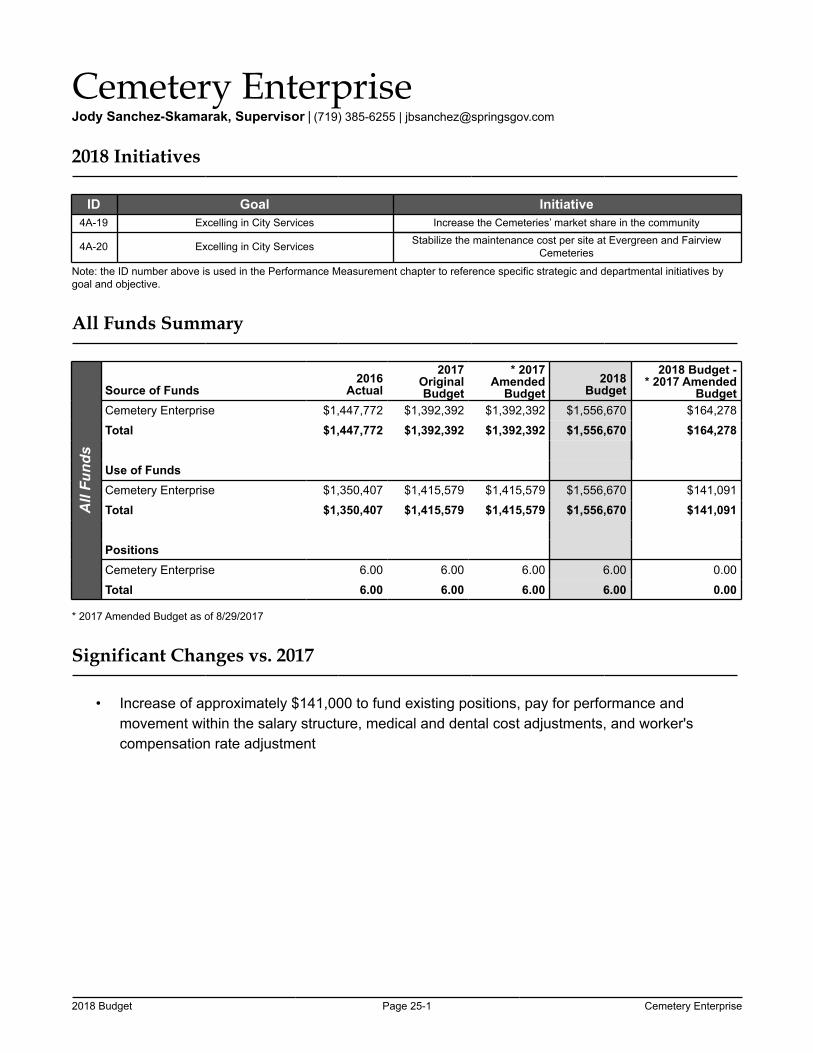
2018 Budget Page 25-1 Cemetery Enterprise
Cemetery EnterpriseJody Sanchez-Skamarak, Supervisor | (719) 385-6255 | [email protected]
2018 Initiatives
ID Goal Initiative4A-19 Excelling in City Services Increase the Cemeteries’ market share in the community
4A-20 Excelling in City Services Stabilize the maintenance cost per site at Evergreen and Fairview Cemeteries
Note: the ID number above is used in the Performance Measurement chapter to reference specific strategic and departmental initiatives by goal and objective.
All Funds Summary
All
Fund
s
Source of Funds2016
Actual
2017OriginalBudget
* 2017Amended
Budget2018
Budget
2018 Budget -* 2017 Amended
BudgetCemetery Enterprise $1,447,772 $1,392,392 $1,392,392 $1,556,670 $164,278
Total $1,447,772 $1,392,392 $1,392,392 $1,556,670 $164,278
Use of FundsCemetery Enterprise $1,350,407 $1,415,579 $1,415,579 $1,556,670 $141,091
Total $1,350,407 $1,415,579 $1,415,579 $1,556,670 $141,091
PositionsCemetery Enterprise 6.00 6.00 6.00 6.00 0.00
Total 6.00 6.00 6.00 6.00 0.00
* 2017 Amended Budget as of 8/29/2017
Significant Changes vs. 2017
• Increase of approximately $141,000 to fund existing positions, pay for performance and movement within the salary structure, medical and dental cost adjustments, and worker's compensation rate adjustment
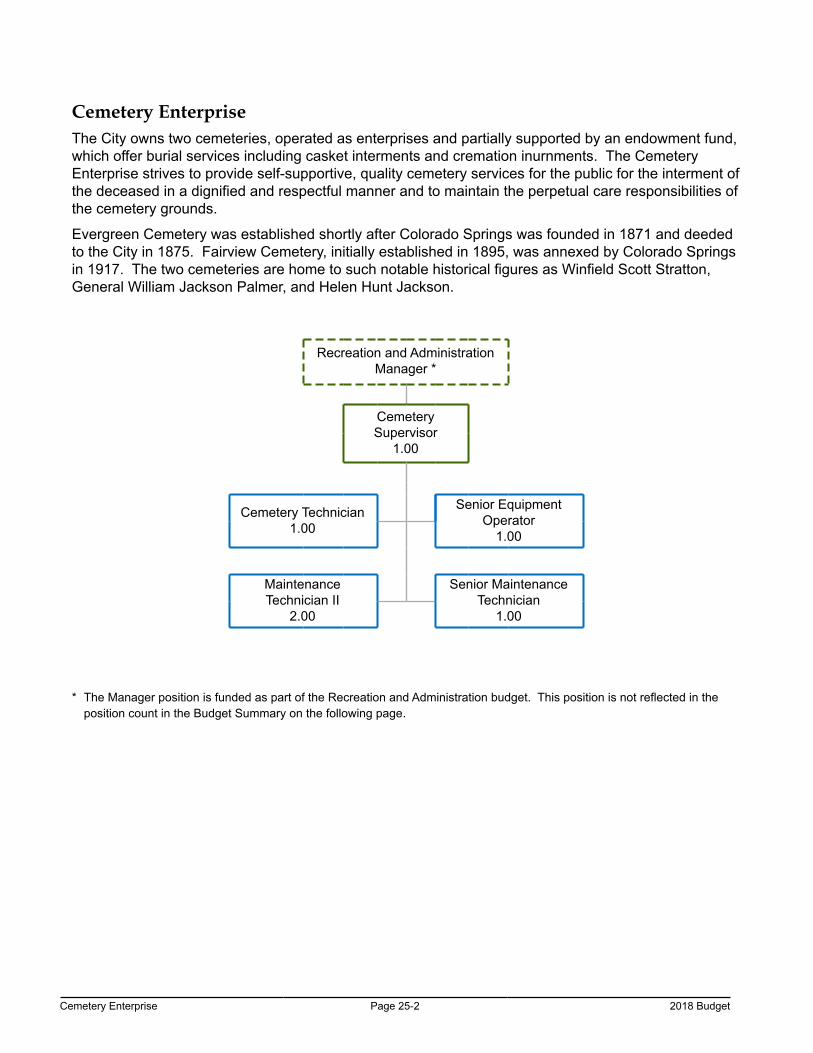
Cemetery Enterprise Page 25-2 2018 Budget
Cemetery Enterprise The City owns two cemeteries, operated as enterprises and partially supported by an endowment fund, which offer burial services including casket interments and cremation inurnments. The Cemetery Enterprise strives to provide self-supportive, quality cemetery services for the public for the interment of the deceased in a dignified and respectful manner and to maintain the perpetual care responsibilities of the cemetery grounds.
Evergreen Cemetery was established shortly after Colorado Springs was founded in 1871 and deeded to the City in 1875. Fairview Cemetery, initially established in 1895, was annexed by Colorado Springs in 1917. The two cemeteries are home to such notable historical figures as Winfield Scott Stratton, General William Jackson Palmer, and Helen Hunt Jackson.
Recreation and AdministrationManager *
Cemetery Supervisor
1.00
Cemetery Technician1.00
Senior Equipment Operator
1.00
Maintenance Technician II
2.00
Senior Maintenance Technician
1.00
* The Manager position is funded as part of the Recreation and Administration budget. This position is not reflected in the position count in the Budget Summary on the following page.
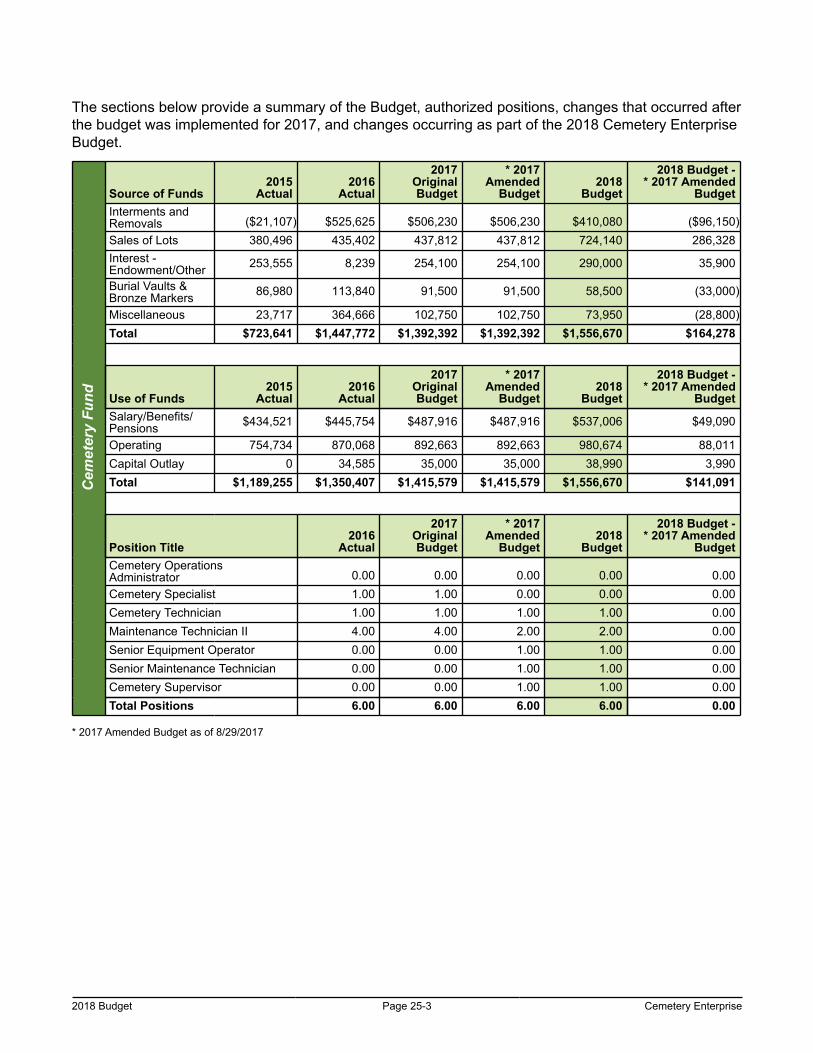
2018 Budget Page 25-3 Cemetery Enterprise
The sections below provide a summary of the Budget, authorized positions, changes that occurred after the budget was implemented for 2017, and changes occurring as part of the 2018 Cemetery Enterprise Budget.
Cem
eter
y Fu
nd
Source of Funds2015
Actual2016
Actual
2017OriginalBudget
* 2017Amended
Budget2018
Budget
2018 Budget -* 2017 Amended
BudgetInterments andRemovals ($21,107) $525,625 $506,230 $506,230 $410,080 ($96,150)Sales of Lots 380,496 435,402 437,812 437,812 724,140 286,328Interest -Endowment/Other 253,555 8,239 254,100 254,100 290,000 35,900
Burial Vaults &Bronze Markers 86,980 113,840 91,500 91,500 58,500 (33,000)
Miscellaneous 23,717 364,666 102,750 102,750 73,950 (28,800)Total $723,641 $1,447,772 $1,392,392 $1,392,392 $1,556,670 $164,278
Use of Funds2015
Actual2016
Actual
2017OriginalBudget
* 2017Amended
Budget2018
Budget
2018 Budget -* 2017 Amended
BudgetSalary/Benefits/Pensions $434,521 $445,754 $487,916 $487,916 $537,006 $49,090
Operating 754,734 870,068 892,663 892,663 980,674 88,011Capital Outlay 0 34,585 35,000 35,000 38,990 3,990Total $1,189,255 $1,350,407 $1,415,579 $1,415,579 $1,556,670 $141,091
Position Title2016
Actual
2017OriginalBudget
* 2017Amended
Budget2018
Budget
2018 Budget -* 2017 Amended
BudgetCemetery OperationsAdministrator 0.00 0.00 0.00 0.00 0.00Cemetery Specialist 1.00 1.00 0.00 0.00 0.00Cemetery Technician 1.00 1.00 1.00 1.00 0.00Maintenance Technician II 4.00 4.00 2.00 2.00 0.00Senior Equipment Operator 0.00 0.00 1.00 1.00 0.00Senior Maintenance Technician 0.00 0.00 1.00 1.00 0.00Cemetery Supervisor 0.00 0.00 1.00 1.00 0.00Total Positions 6.00 6.00 6.00 6.00 0.00
* 2017 Amended Budget as of 8/29/2017
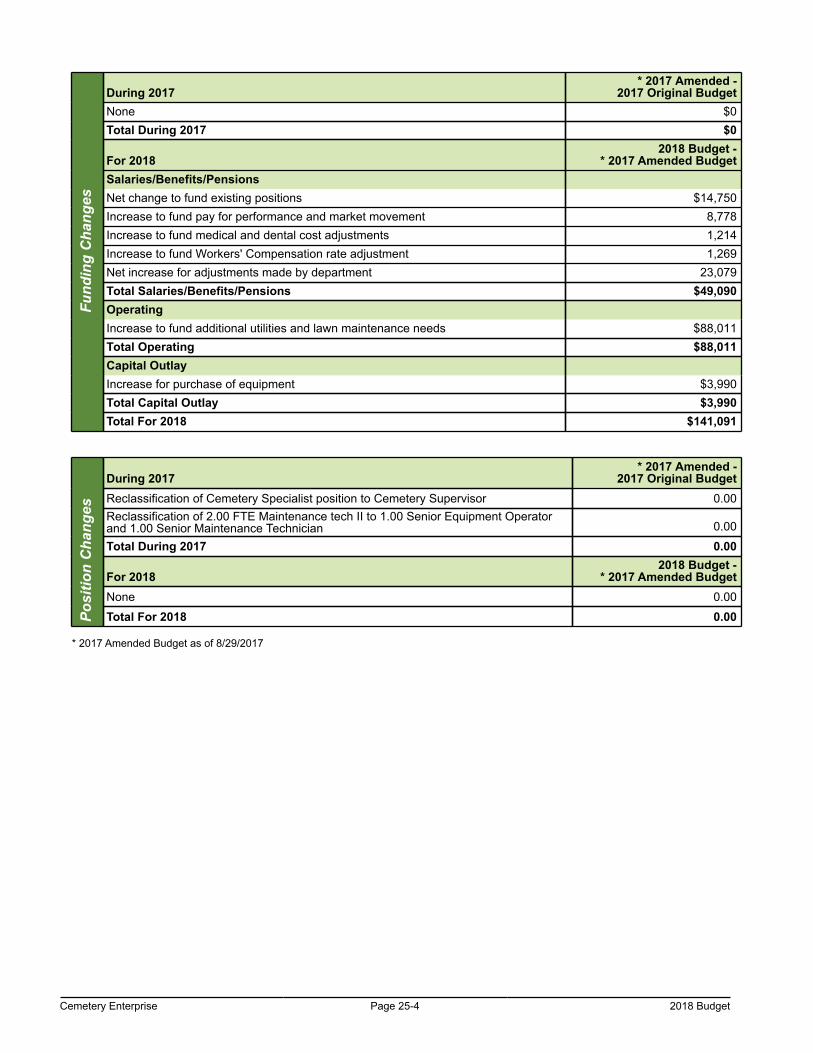
Cemetery Enterprise Page 25-4 2018 Budget
Fund
ing
Cha
nges
During 2017* 2017 Amended -
2017 Original BudgetNone $0Total During 2017 $0
For 20182018 Budget -
* 2017 Amended BudgetSalaries/Benefits/PensionsNet change to fund existing positions $14,750Increase to fund pay for performance and market movement 8,778Increase to fund medical and dental cost adjustments 1,214Increase to fund Workers' Compensation rate adjustment 1,269Net increase for adjustments made by department 23,079Total Salaries/Benefits/Pensions $49,090OperatingIncrease to fund additional utilities and lawn maintenance needs $88,011Total Operating $88,011Capital OutlayIncrease for purchase of equipment $3,990Total Capital Outlay $3,990Total For 2018 $141,091
Posi
tion
Cha
nges
During 2017* 2017 Amended -
2017 Original BudgetReclassification of Cemetery Specialist position to Cemetery Supervisor 0.00Reclassification of 2.00 FTE Maintenance tech II to 1.00 Senior Equipment Operatorand 1.00 Senior Maintenance Technician 0.00
Total During 2017 0.00
For 20182018 Budget -
* 2017 Amended BudgetNone 0.00
Total For 2018 0.00
* 2017 Amended Budget as of 8/29/2017
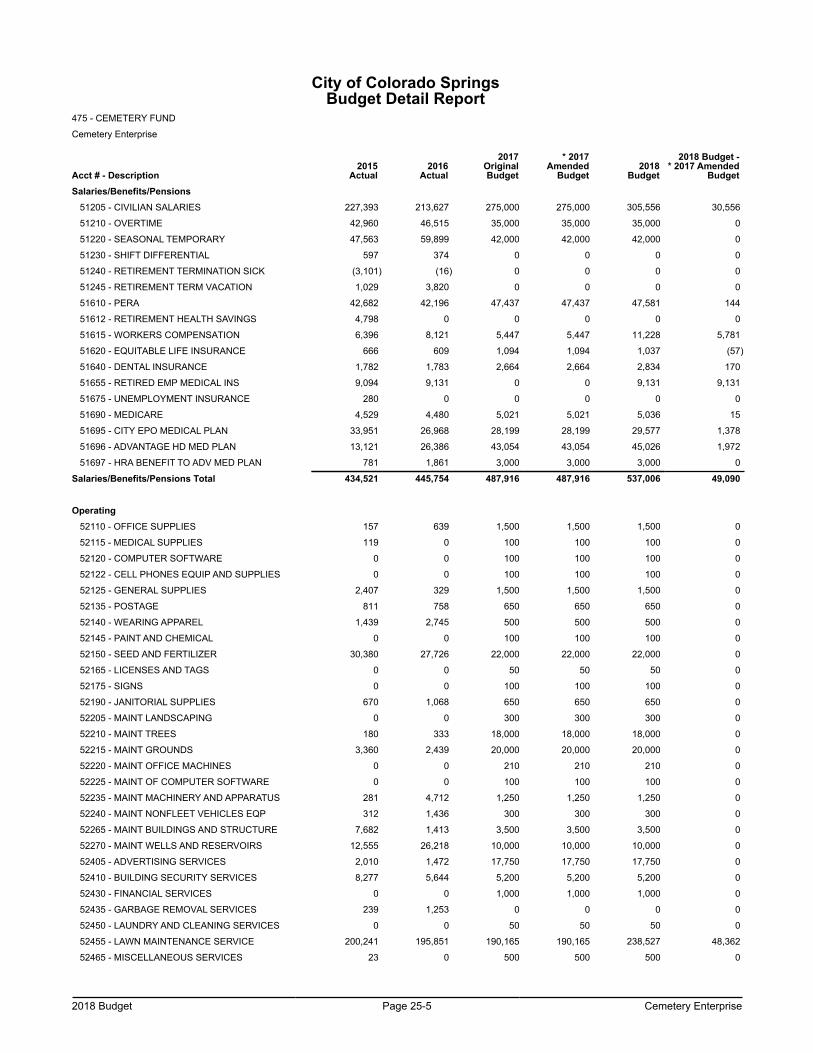
2018 Budget Page 25-5 Cemetery Enterprise
City of Colorado SpringsBudget Detail Report
475 - CEMETERY FUND
Cemetery Enterprise
Acct # - Description2015
Actual2016
Actual
2017OriginalBudget
* 2017Amended
Budget2018
Budget
2018 Budget -* 2017 Amended
BudgetSalaries/Benefits/Pensions
51205 - CIVILIAN SALARIES 227,393 213,627 275,000 275,000 305,556 30,556
51210 - OVERTIME 42,960 46,515 35,000 35,000 35,000 0
51220 - SEASONAL TEMPORARY 47,563 59,899 42,000 42,000 42,000 0
51230 - SHIFT DIFFERENTIAL 597 374 0 0 0 0
51240 - RETIREMENT TERMINATION SICK (3,101) (16) 0 0 0 0
51245 - RETIREMENT TERM VACATION 1,029 3,820 0 0 0 0
51610 - PERA 42,682 42,196 47,437 47,437 47,581 144
51612 - RETIREMENT HEALTH SAVINGS 4,798 0 0 0 0 0
51615 - WORKERS COMPENSATION 6,396 8,121 5,447 5,447 11,228 5,781
51620 - EQUITABLE LIFE INSURANCE 666 609 1,094 1,094 1,037 (57)
51640 - DENTAL INSURANCE 1,782 1,783 2,664 2,664 2,834 170
51655 - RETIRED EMP MEDICAL INS 9,094 9,131 0 0 9,131 9,131
51675 - UNEMPLOYMENT INSURANCE 280 0 0 0 0 0
51690 - MEDICARE 4,529 4,480 5,021 5,021 5,036 15
51695 - CITY EPO MEDICAL PLAN 33,951 26,968 28,199 28,199 29,577 1,378
51696 - ADVANTAGE HD MED PLAN 13,121 26,386 43,054 43,054 45,026 1,972
51697 - HRA BENEFIT TO ADV MED PLAN 781 1,861 3,000 3,000 3,000 0
Salaries/Benefits/Pensions Total 434,521 445,754 487,916 487,916 537,006 49,090
Operating52110 - OFFICE SUPPLIES 157 639 1,500 1,500 1,500 0
52115 - MEDICAL SUPPLIES 119 0 100 100 100 0
52120 - COMPUTER SOFTWARE 0 0 100 100 100 0
52122 - CELL PHONES EQUIP AND SUPPLIES 0 0 100 100 100 0
52125 - GENERAL SUPPLIES 2,407 329 1,500 1,500 1,500 0
52135 - POSTAGE 811 758 650 650 650 0
52140 - WEARING APPAREL 1,439 2,745 500 500 500 0
52145 - PAINT AND CHEMICAL 0 0 100 100 100 0
52150 - SEED AND FERTILIZER 30,380 27,726 22,000 22,000 22,000 0
52165 - LICENSES AND TAGS 0 0 50 50 50 0
52175 - SIGNS 0 0 100 100 100 0
52190 - JANITORIAL SUPPLIES 670 1,068 650 650 650 0
52205 - MAINT LANDSCAPING 0 0 300 300 300 0
52210 - MAINT TREES 180 333 18,000 18,000 18,000 0
52215 - MAINT GROUNDS 3,360 2,439 20,000 20,000 20,000 0
52220 - MAINT OFFICE MACHINES 0 0 210 210 210 0
52225 - MAINT OF COMPUTER SOFTWARE 0 0 100 100 100 0
52235 - MAINT MACHINERY AND APPARATUS 281 4,712 1,250 1,250 1,250 0
52240 - MAINT NONFLEET VEHICLES EQP 312 1,436 300 300 300 0
52265 - MAINT BUILDINGS AND STRUCTURE 7,682 1,413 3,500 3,500 3,500 0
52270 - MAINT WELLS AND RESERVOIRS 12,555 26,218 10,000 10,000 10,000 0
52405 - ADVERTISING SERVICES 2,010 1,472 17,750 17,750 17,750 0
52410 - BUILDING SECURITY SERVICES 8,277 5,644 5,200 5,200 5,200 0
52430 - FINANCIAL SERVICES 0 0 1,000 1,000 1,000 0
52435 - GARBAGE REMOVAL SERVICES 239 1,253 0 0 0 0
52450 - LAUNDRY AND CLEANING SERVICES 0 0 50 50 50 0
52455 - LAWN MAINTENANCE SERVICE 200,241 195,851 190,165 190,165 238,527 48,362
52465 - MISCELLANEOUS SERVICES 23 0 500 500 500 0
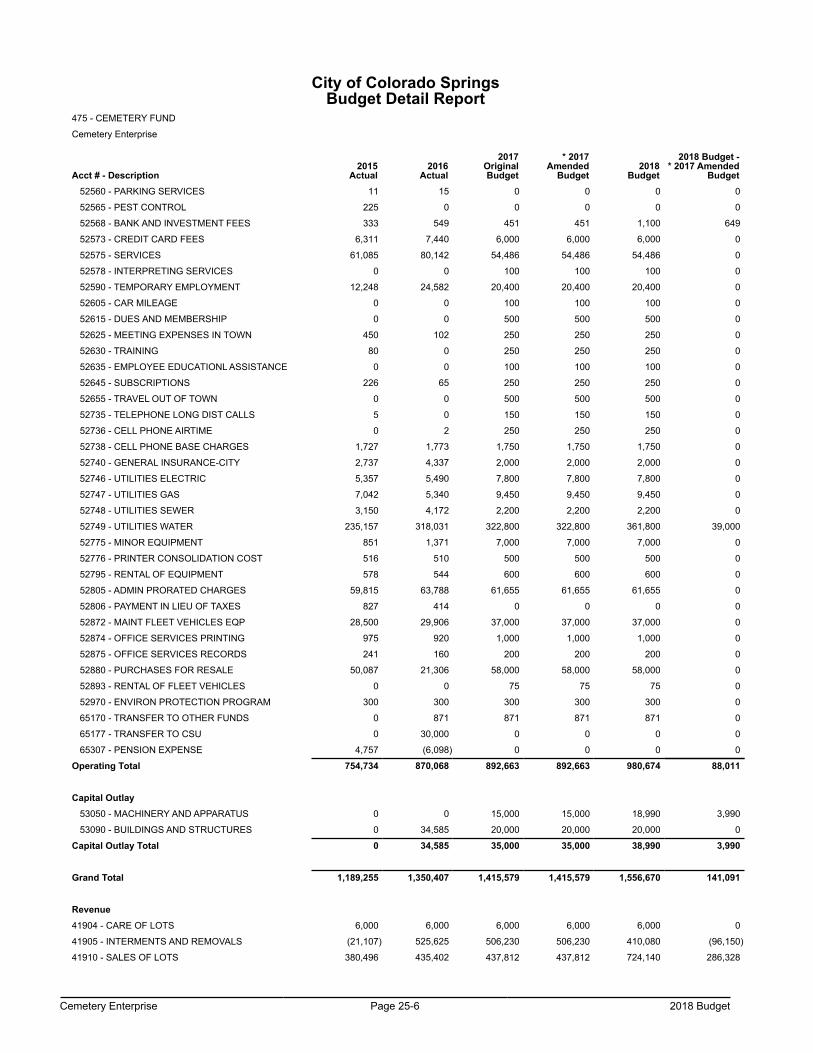
Cemetery Enterprise Page 25-6 2018 Budget
City of Colorado SpringsBudget Detail Report
475 - CEMETERY FUND
Cemetery Enterprise
Acct # - Description2015
Actual2016
Actual
2017OriginalBudget
* 2017Amended
Budget2018
Budget
2018 Budget -* 2017 Amended
Budget52560 - PARKING SERVICES 11 15 0 0 0 0
52565 - PEST CONTROL 225 0 0 0 0 0
52568 - BANK AND INVESTMENT FEES 333 549 451 451 1,100 649
52573 - CREDIT CARD FEES 6,311 7,440 6,000 6,000 6,000 0
52575 - SERVICES 61,085 80,142 54,486 54,486 54,486 0
52578 - INTERPRETING SERVICES 0 0 100 100 100 0
52590 - TEMPORARY EMPLOYMENT 12,248 24,582 20,400 20,400 20,400 0
52605 - CAR MILEAGE 0 0 100 100 100 0
52615 - DUES AND MEMBERSHIP 0 0 500 500 500 0
52625 - MEETING EXPENSES IN TOWN 450 102 250 250 250 0
52630 - TRAINING 80 0 250 250 250 0
52635 - EMPLOYEE EDUCATIONL ASSISTANCE 0 0 100 100 100 0
52645 - SUBSCRIPTIONS 226 65 250 250 250 0
52655 - TRAVEL OUT OF TOWN 0 0 500 500 500 0
52735 - TELEPHONE LONG DIST CALLS 5 0 150 150 150 0
52736 - CELL PHONE AIRTIME 0 2 250 250 250 0
52738 - CELL PHONE BASE CHARGES 1,727 1,773 1,750 1,750 1,750 0
52740 - GENERAL INSURANCE-CITY 2,737 4,337 2,000 2,000 2,000 0
52746 - UTILITIES ELECTRIC 5,357 5,490 7,800 7,800 7,800 0
52747 - UTILITIES GAS 7,042 5,340 9,450 9,450 9,450 0
52748 - UTILITIES SEWER 3,150 4,172 2,200 2,200 2,200 0
52749 - UTILITIES WATER 235,157 318,031 322,800 322,800 361,800 39,000
52775 - MINOR EQUIPMENT 851 1,371 7,000 7,000 7,000 0
52776 - PRINTER CONSOLIDATION COST 516 510 500 500 500 0
52795 - RENTAL OF EQUIPMENT 578 544 600 600 600 0
52805 - ADMIN PRORATED CHARGES 59,815 63,788 61,655 61,655 61,655 0
52806 - PAYMENT IN LIEU OF TAXES 827 414 0 0 0 0
52872 - MAINT FLEET VEHICLES EQP 28,500 29,906 37,000 37,000 37,000 0
52874 - OFFICE SERVICES PRINTING 975 920 1,000 1,000 1,000 0
52875 - OFFICE SERVICES RECORDS 241 160 200 200 200 0
52880 - PURCHASES FOR RESALE 50,087 21,306 58,000 58,000 58,000 0
52893 - RENTAL OF FLEET VEHICLES 0 0 75 75 75 0
52970 - ENVIRON PROTECTION PROGRAM 300 300 300 300 300 0
65170 - TRANSFER TO OTHER FUNDS 0 871 871 871 871 0
65177 - TRANSFER TO CSU 0 30,000 0 0 0 0
65307 - PENSION EXPENSE 4,757 (6,098) 0 0 0 0
Operating Total 754,734 870,068 892,663 892,663 980,674 88,011
Capital Outlay53050 - MACHINERY AND APPARATUS 0 0 15,000 15,000 18,990 3,990
53090 - BUILDINGS AND STRUCTURES 0 34,585 20,000 20,000 20,000 0
Capital Outlay Total 0 34,585 35,000 35,000 38,990 3,990
Grand Total 1,189,255 1,350,407 1,415,579 1,415,579 1,556,670 141,091
Revenue41904 - CARE OF LOTS 6,000 6,000 6,000 6,000 6,000 0
41905 - INTERMENTS AND REMOVALS (21,107) 525,625 506,230 506,230 410,080 (96,150)
41910 - SALES OF LOTS 380,496 435,402 437,812 437,812 724,140 286,328
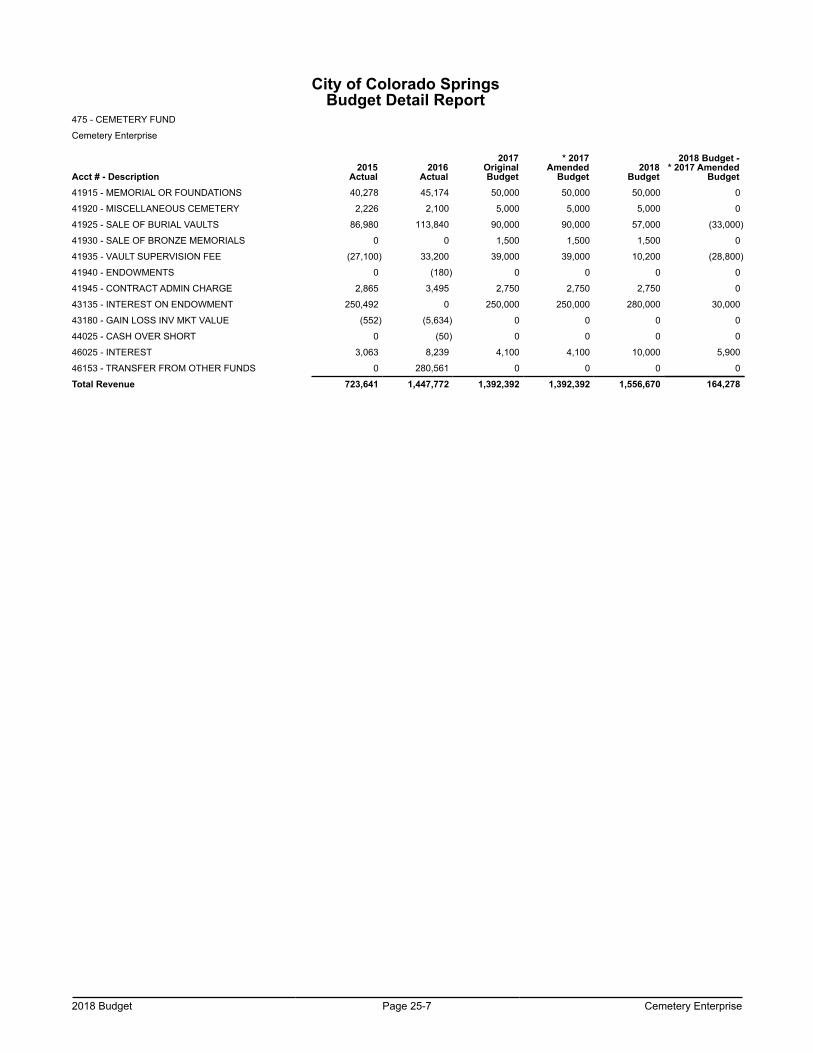
2018 Budget Page 25-7 Cemetery Enterprise
City of Colorado SpringsBudget Detail Report
475 - CEMETERY FUND
Cemetery Enterprise
Acct # - Description2015
Actual2016
Actual
2017OriginalBudget
* 2017Amended
Budget2018
Budget
2018 Budget -* 2017 Amended
Budget41915 - MEMORIAL OR FOUNDATIONS 40,278 45,174 50,000 50,000 50,000 0
41920 - MISCELLANEOUS CEMETERY 2,226 2,100 5,000 5,000 5,000 0
41925 - SALE OF BURIAL VAULTS 86,980 113,840 90,000 90,000 57,000 (33,000)
41930 - SALE OF BRONZE MEMORIALS 0 0 1,500 1,500 1,500 0
41935 - VAULT SUPERVISION FEE (27,100) 33,200 39,000 39,000 10,200 (28,800)
41940 - ENDOWMENTS 0 (180) 0 0 0 0
41945 - CONTRACT ADMIN CHARGE 2,865 3,495 2,750 2,750 2,750 0
43135 - INTEREST ON ENDOWMENT 250,492 0 250,000 250,000 280,000 30,000
43180 - GAIN LOSS INV MKT VALUE (552) (5,634) 0 0 0 0
44025 - CASH OVER SHORT 0 (50) 0 0 0 0
46025 - INTEREST 3,063 8,239 4,100 4,100 10,000 5,900
46153 - TRANSFER FROM OTHER FUNDS 0 280,561 0 0 0 0
Total Revenue 723,641 1,447,772 1,392,392 1,392,392 1,556,670 164,278

Cemetery Enterprise Page 25-8 2018 Budget
This page left blank intentionally.
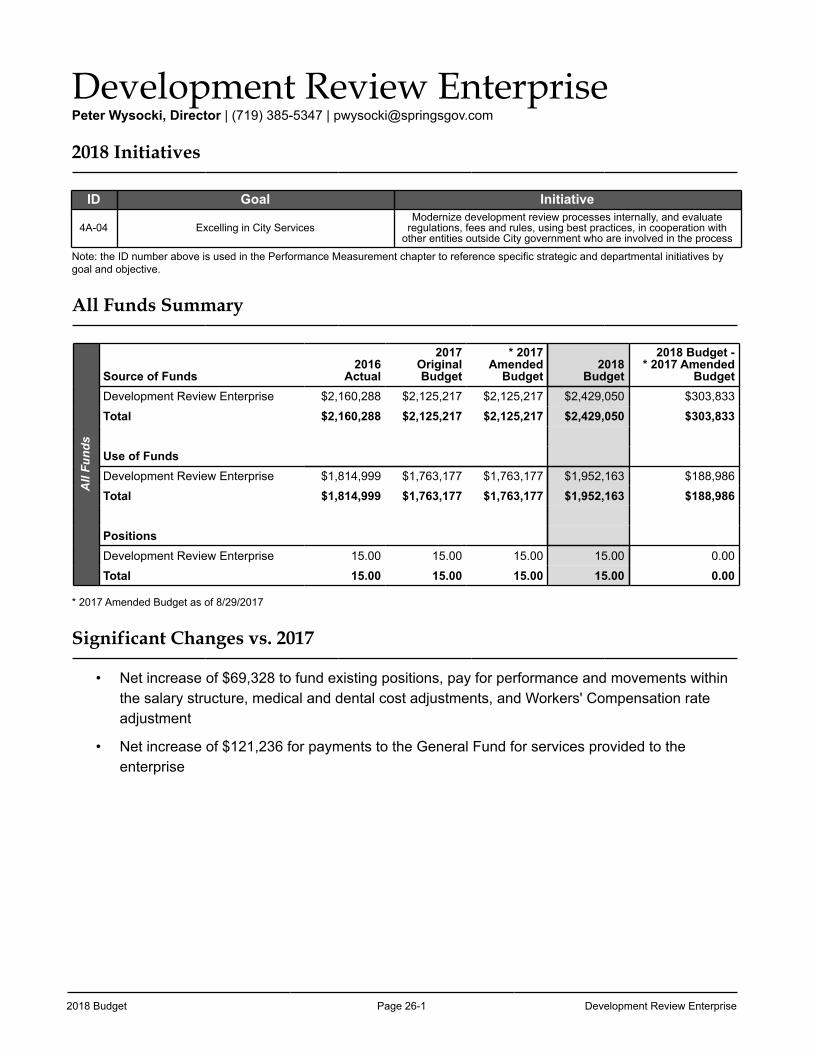
2018 Budget Page 26-1 Development Review Enterprise
Development Review Enterprise Peter Wysocki, Director | (719) 385-5347 | [email protected]
2018 Initiatives
ID Goal Initiative
4A-04 Excelling in City ServicesModernize development review processes internally, and evaluate
regulations, fees and rules, using best practices, in cooperation with other entities outside City government who are involved in the process
Note: the ID number above is used in the Performance Measurement chapter to reference specific strategic and departmental initiatives by goal and objective.
All Funds Summary
All
Fund
s
Source of Funds2016
Actual
2017OriginalBudget
* 2017Amended
Budget2018
Budget
2018 Budget -* 2017 Amended
BudgetDevelopment Review Enterprise $2,160,288 $2,125,217 $2,125,217 $2,429,050 $303,833
Total $2,160,288 $2,125,217 $2,125,217 $2,429,050 $303,833
Use of FundsDevelopment Review Enterprise $1,814,999 $1,763,177 $1,763,177 $1,952,163 $188,986
Total $1,814,999 $1,763,177 $1,763,177 $1,952,163 $188,986
PositionsDevelopment Review Enterprise 15.00 15.00 15.00 15.00 0.00
Total 15.00 15.00 15.00 15.00 0.00 * 2017 Amended Budget as of 8/29/2017
Significant Changes vs. 2017
• Net increase of $69,328 to fund existing positions, pay for performance and movements within the salary structure, medical and dental cost adjustments, and Workers' Compensation rate adjustment
• Net increase of $121,236 for payments to the General Fund for services provided to the enterprise
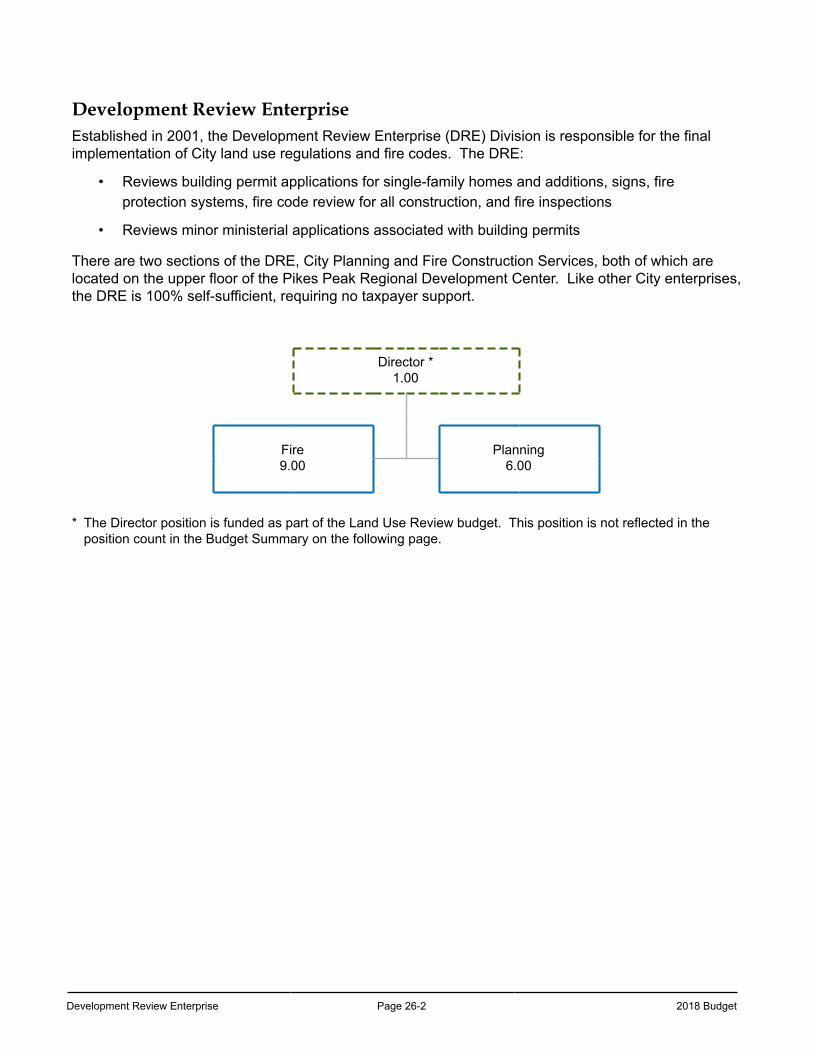
Development Review Enterprise Page 26-2 2018 Budget
Development Review EnterpriseEstablished in 2001, the Development Review Enterprise (DRE) Division is responsible for the final implementation of City land use regulations and fire codes. The DRE:
• Reviews building permit applications for single-family homes and additions, signs, fire protection systems, fire code review for all construction, and fire inspections
• Reviews minor ministerial applications associated with building permits
There are two sections of the DRE, City Planning and Fire Construction Services, both of which are located on the upper floor of the Pikes Peak Regional Development Center. Like other City enterprises, the DRE is 100% self-sufficient, requiring no taxpayer support.
Director *1.00
Fire9.00
Planning6.00
* The Director position is funded as part of the Land Use Review budget. This position is not reflected in the position count in the Budget Summary on the following page.
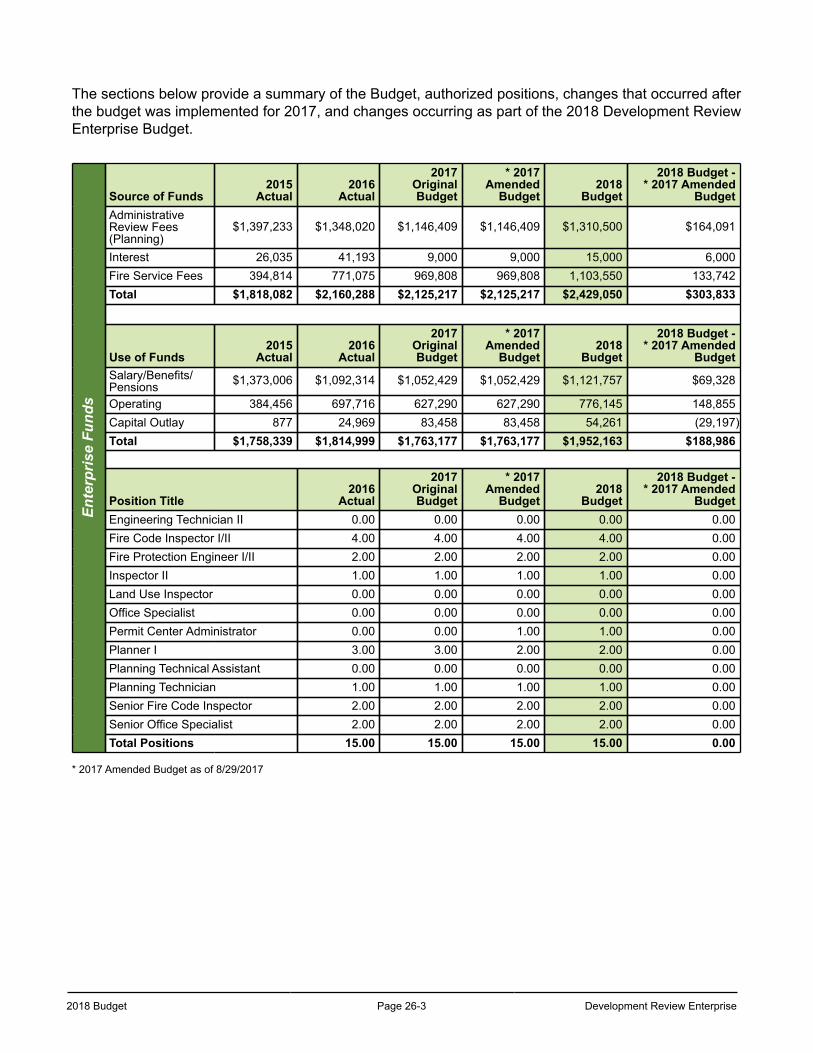
2018 Budget Page 26-3 Development Review Enterprise
The sections below provide a summary of the Budget, authorized positions, changes that occurred after the budget was implemented for 2017, and changes occurring as part of the 2018 Development Review Enterprise Budget.
Ente
rpris
e Fu
nds
Source of Funds2015
Actual2016
Actual
2017OriginalBudget
* 2017Amended
Budget2018
Budget
2018 Budget -* 2017 Amended
BudgetAdministrativeReview Fees(Planning)
$1,397,233 $1,348,020 $1,146,409 $1,146,409 $1,310,500 $164,091
Interest 26,035 41,193 9,000 9,000 15,000 6,000Fire Service Fees 394,814 771,075 969,808 969,808 1,103,550 133,742Total $1,818,082 $2,160,288 $2,125,217 $2,125,217 $2,429,050 $303,833
Use of Funds2015
Actual2016
Actual
2017OriginalBudget
* 2017Amended
Budget2018
Budget
2018 Budget -* 2017 Amended
BudgetSalary/Benefits/Pensions $1,373,006 $1,092,314 $1,052,429 $1,052,429 $1,121,757 $69,328
Operating 384,456 697,716 627,290 627,290 776,145 148,855Capital Outlay 877 24,969 83,458 83,458 54,261 (29,197)Total $1,758,339 $1,814,999 $1,763,177 $1,763,177 $1,952,163 $188,986
Position Title2016
Actual
2017OriginalBudget
* 2017Amended
Budget2018
Budget
2018 Budget -* 2017 Amended
BudgetEngineering Technician II 0.00 0.00 0.00 0.00 0.00Fire Code Inspector I/II 4.00 4.00 4.00 4.00 0.00Fire Protection Engineer I/II 2.00 2.00 2.00 2.00 0.00Inspector II 1.00 1.00 1.00 1.00 0.00Land Use Inspector 0.00 0.00 0.00 0.00 0.00Office Specialist 0.00 0.00 0.00 0.00 0.00Permit Center Administrator 0.00 0.00 1.00 1.00 0.00Planner I 3.00 3.00 2.00 2.00 0.00Planning Technical Assistant 0.00 0.00 0.00 0.00 0.00Planning Technician 1.00 1.00 1.00 1.00 0.00Senior Fire Code Inspector 2.00 2.00 2.00 2.00 0.00Senior Office Specialist 2.00 2.00 2.00 2.00 0.00Total Positions 15.00 15.00 15.00 15.00 0.00
* 2017 Amended Budget as of 8/29/2017
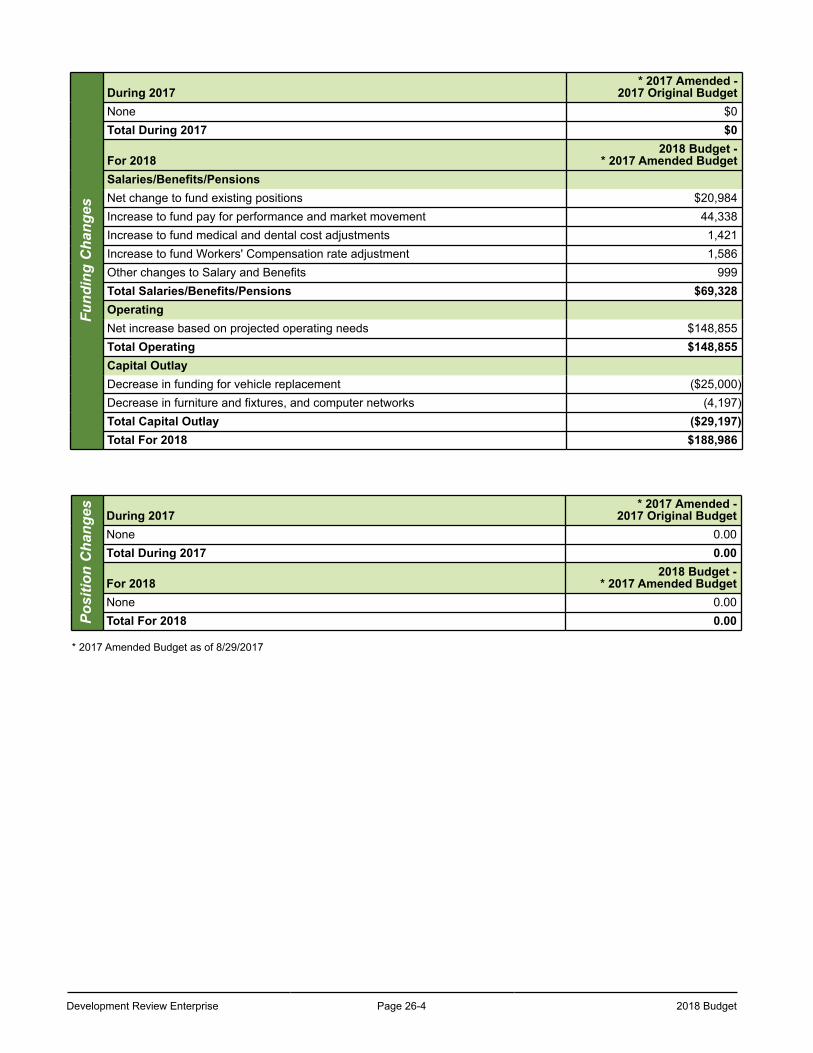
Development Review Enterprise Page 26-4 2018 Budget
Fund
ing
Cha
nges
During 2017* 2017 Amended -
2017 Original BudgetNone $0Total During 2017 $0
For 20182018 Budget -
* 2017 Amended BudgetSalaries/Benefits/PensionsNet change to fund existing positions $20,984Increase to fund pay for performance and market movement 44,338Increase to fund medical and dental cost adjustments 1,421Increase to fund Workers' Compensation rate adjustment 1,586Other changes to Salary and Benefits 999Total Salaries/Benefits/Pensions $69,328OperatingNet increase based on projected operating needs $148,855Total Operating $148,855Capital OutlayDecrease in funding for vehicle replacement ($25,000)Decrease in furniture and fixtures, and computer networks (4,197)Total Capital Outlay ($29,197)Total For 2018 $188,986
Posi
tion
Cha
nges During 2017
* 2017 Amended -2017 Original Budget
None 0.00Total During 2017 0.00
For 20182018 Budget -
* 2017 Amended BudgetNone 0.00Total For 2018 0.00
* 2017 Amended Budget as of 8/29/2017
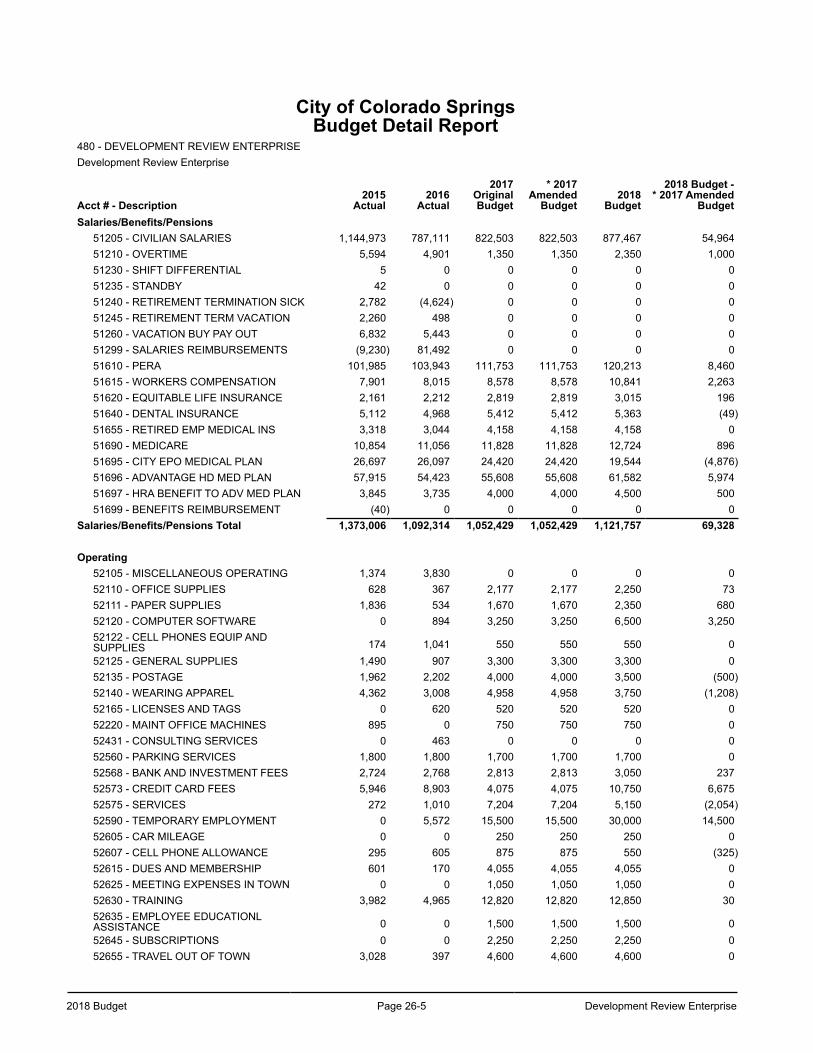
2018 Budget Page 26-5 Development Review Enterprise
City of Colorado SpringsBudget Detail Report
480 - DEVELOPMENT REVIEW ENTERPRISEDevelopment Review Enterprise
Acct # - Description2015
Actual2016
Actual
2017OriginalBudget
* 2017Amended
Budget2018
Budget
2018 Budget -* 2017 Amended
BudgetSalaries/Benefits/Pensions
51205 - CIVILIAN SALARIES 1,144,973 787,111 822,503 822,503 877,467 54,96451210 - OVERTIME 5,594 4,901 1,350 1,350 2,350 1,00051230 - SHIFT DIFFERENTIAL 5 0 0 0 0 051235 - STANDBY 42 0 0 0 0 051240 - RETIREMENT TERMINATION SICK 2,782 (4,624) 0 0 0 051245 - RETIREMENT TERM VACATION 2,260 498 0 0 0 051260 - VACATION BUY PAY OUT 6,832 5,443 0 0 0 051299 - SALARIES REIMBURSEMENTS (9,230) 81,492 0 0 0 051610 - PERA 101,985 103,943 111,753 111,753 120,213 8,46051615 - WORKERS COMPENSATION 7,901 8,015 8,578 8,578 10,841 2,26351620 - EQUITABLE LIFE INSURANCE 2,161 2,212 2,819 2,819 3,015 19651640 - DENTAL INSURANCE 5,112 4,968 5,412 5,412 5,363 (49)51655 - RETIRED EMP MEDICAL INS 3,318 3,044 4,158 4,158 4,158 051690 - MEDICARE 10,854 11,056 11,828 11,828 12,724 89651695 - CITY EPO MEDICAL PLAN 26,697 26,097 24,420 24,420 19,544 (4,876)51696 - ADVANTAGE HD MED PLAN 57,915 54,423 55,608 55,608 61,582 5,97451697 - HRA BENEFIT TO ADV MED PLAN 3,845 3,735 4,000 4,000 4,500 50051699 - BENEFITS REIMBURSEMENT (40) 0 0 0 0 0
Salaries/Benefits/Pensions Total 1,373,006 1,092,314 1,052,429 1,052,429 1,121,757 69,328
Operating52105 - MISCELLANEOUS OPERATING 1,374 3,830 0 0 0 052110 - OFFICE SUPPLIES 628 367 2,177 2,177 2,250 7352111 - PAPER SUPPLIES 1,836 534 1,670 1,670 2,350 68052120 - COMPUTER SOFTWARE 0 894 3,250 3,250 6,500 3,25052122 - CELL PHONES EQUIP ANDSUPPLIES 174 1,041 550 550 550 052125 - GENERAL SUPPLIES 1,490 907 3,300 3,300 3,300 052135 - POSTAGE 1,962 2,202 4,000 4,000 3,500 (500)52140 - WEARING APPAREL 4,362 3,008 4,958 4,958 3,750 (1,208)52165 - LICENSES AND TAGS 0 620 520 520 520 052220 - MAINT OFFICE MACHINES 895 0 750 750 750 052431 - CONSULTING SERVICES 0 463 0 0 0 052560 - PARKING SERVICES 1,800 1,800 1,700 1,700 1,700 052568 - BANK AND INVESTMENT FEES 2,724 2,768 2,813 2,813 3,050 23752573 - CREDIT CARD FEES 5,946 8,903 4,075 4,075 10,750 6,67552575 - SERVICES 272 1,010 7,204 7,204 5,150 (2,054)52590 - TEMPORARY EMPLOYMENT 0 5,572 15,500 15,500 30,000 14,50052605 - CAR MILEAGE 0 0 250 250 250 052607 - CELL PHONE ALLOWANCE 295 605 875 875 550 (325)52615 - DUES AND MEMBERSHIP 601 170 4,055 4,055 4,055 052625 - MEETING EXPENSES IN TOWN 0 0 1,050 1,050 1,050 052630 - TRAINING 3,982 4,965 12,820 12,820 12,850 3052635 - EMPLOYEE EDUCATIONLASSISTANCE 0 0 1,500 1,500 1,500 052645 - SUBSCRIPTIONS 0 0 2,250 2,250 2,250 052655 - TRAVEL OUT OF TOWN 3,028 397 4,600 4,600 4,600 0
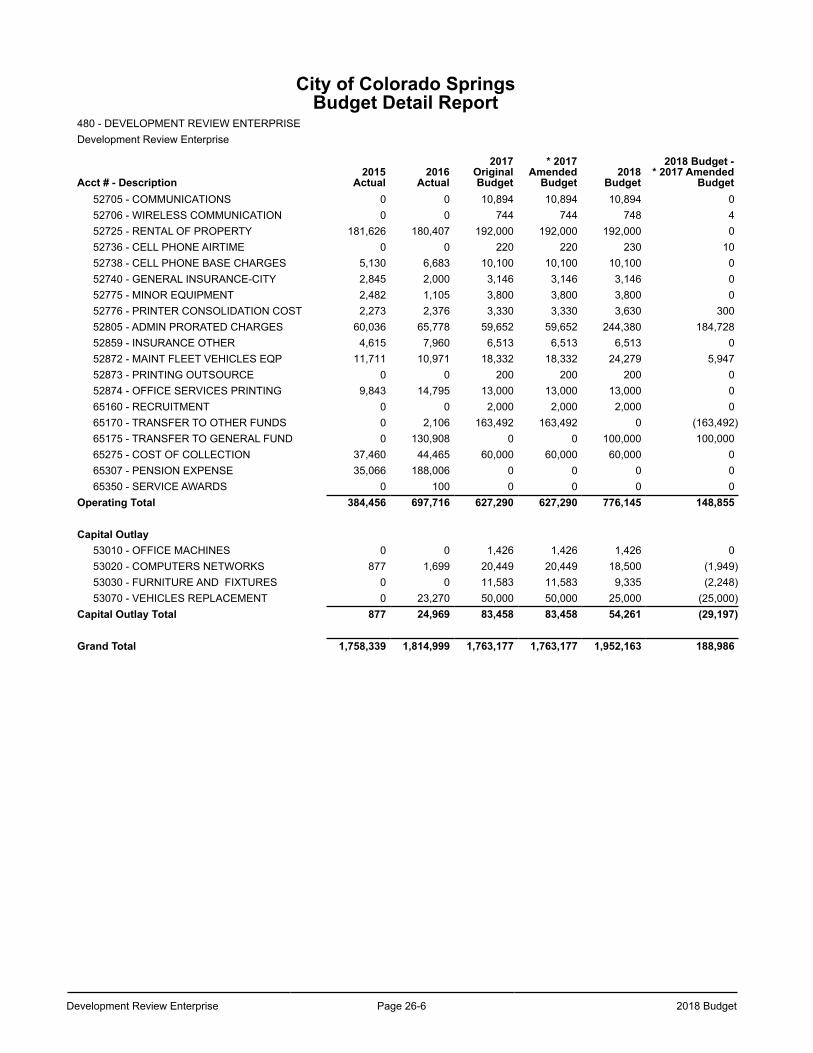
Development Review Enterprise Page 26-6 2018 Budget
City of Colorado SpringsBudget Detail Report
480 - DEVELOPMENT REVIEW ENTERPRISEDevelopment Review Enterprise
Acct # - Description2015
Actual2016
Actual
2017OriginalBudget
* 2017Amended
Budget2018
Budget
2018 Budget -* 2017 Amended
Budget52705 - COMMUNICATIONS 0 0 10,894 10,894 10,894 052706 - WIRELESS COMMUNICATION 0 0 744 744 748 452725 - RENTAL OF PROPERTY 181,626 180,407 192,000 192,000 192,000 052736 - CELL PHONE AIRTIME 0 0 220 220 230 1052738 - CELL PHONE BASE CHARGES 5,130 6,683 10,100 10,100 10,100 052740 - GENERAL INSURANCE-CITY 2,845 2,000 3,146 3,146 3,146 052775 - MINOR EQUIPMENT 2,482 1,105 3,800 3,800 3,800 052776 - PRINTER CONSOLIDATION COST 2,273 2,376 3,330 3,330 3,630 30052805 - ADMIN PRORATED CHARGES 60,036 65,778 59,652 59,652 244,380 184,72852859 - INSURANCE OTHER 4,615 7,960 6,513 6,513 6,513 052872 - MAINT FLEET VEHICLES EQP 11,711 10,971 18,332 18,332 24,279 5,94752873 - PRINTING OUTSOURCE 0 0 200 200 200 052874 - OFFICE SERVICES PRINTING 9,843 14,795 13,000 13,000 13,000 065160 - RECRUITMENT 0 0 2,000 2,000 2,000 065170 - TRANSFER TO OTHER FUNDS 0 2,106 163,492 163,492 0 (163,492)65175 - TRANSFER TO GENERAL FUND 0 130,908 0 0 100,000 100,00065275 - COST OF COLLECTION 37,460 44,465 60,000 60,000 60,000 065307 - PENSION EXPENSE 35,066 188,006 0 0 0 065350 - SERVICE AWARDS 0 100 0 0 0 0
Operating Total 384,456 697,716 627,290 627,290 776,145 148,855
Capital Outlay53010 - OFFICE MACHINES 0 0 1,426 1,426 1,426 053020 - COMPUTERS NETWORKS 877 1,699 20,449 20,449 18,500 (1,949)53030 - FURNITURE AND FIXTURES 0 0 11,583 11,583 9,335 (2,248)53070 - VEHICLES REPLACEMENT 0 23,270 50,000 50,000 25,000 (25,000)
Capital Outlay Total 877 24,969 83,458 83,458 54,261 (29,197)
Grand Total 1,758,339 1,814,999 1,763,177 1,763,177 1,952,163 188,986
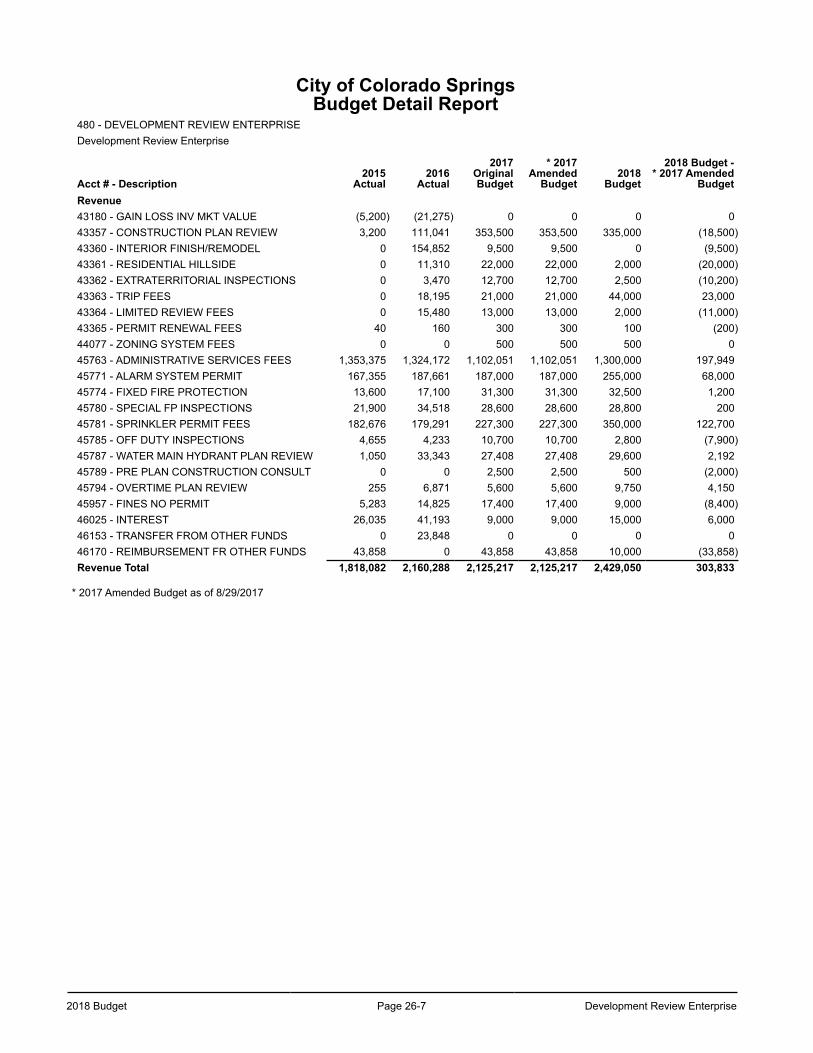
2018 Budget Page 26-7 Development Review Enterprise
City of Colorado SpringsBudget Detail Report
480 - DEVELOPMENT REVIEW ENTERPRISEDevelopment Review Enterprise
Acct # - Description2015
Actual2016
Actual
2017OriginalBudget
* 2017Amended
Budget2018
Budget
2018 Budget -* 2017 Amended
BudgetRevenue43180 - GAIN LOSS INV MKT VALUE (5,200) (21,275) 0 0 0 043357 - CONSTRUCTION PLAN REVIEW 3,200 111,041 353,500 353,500 335,000 (18,500)43360 - INTERIOR FINISH/REMODEL 0 154,852 9,500 9,500 0 (9,500)43361 - RESIDENTIAL HILLSIDE 0 11,310 22,000 22,000 2,000 (20,000)43362 - EXTRATERRITORIAL INSPECTIONS 0 3,470 12,700 12,700 2,500 (10,200)43363 - TRIP FEES 0 18,195 21,000 21,000 44,000 23,00043364 - LIMITED REVIEW FEES 0 15,480 13,000 13,000 2,000 (11,000)43365 - PERMIT RENEWAL FEES 40 160 300 300 100 (200)44077 - ZONING SYSTEM FEES 0 0 500 500 500 045763 - ADMINISTRATIVE SERVICES FEES 1,353,375 1,324,172 1,102,051 1,102,051 1,300,000 197,94945771 - ALARM SYSTEM PERMIT 167,355 187,661 187,000 187,000 255,000 68,00045774 - FIXED FIRE PROTECTION 13,600 17,100 31,300 31,300 32,500 1,20045780 - SPECIAL FP INSPECTIONS 21,900 34,518 28,600 28,600 28,800 20045781 - SPRINKLER PERMIT FEES 182,676 179,291 227,300 227,300 350,000 122,70045785 - OFF DUTY INSPECTIONS 4,655 4,233 10,700 10,700 2,800 (7,900)45787 - WATER MAIN HYDRANT PLAN REVIEW 1,050 33,343 27,408 27,408 29,600 2,19245789 - PRE PLAN CONSTRUCTION CONSULT 0 0 2,500 2,500 500 (2,000)45794 - OVERTIME PLAN REVIEW 255 6,871 5,600 5,600 9,750 4,15045957 - FINES NO PERMIT 5,283 14,825 17,400 17,400 9,000 (8,400)46025 - INTEREST 26,035 41,193 9,000 9,000 15,000 6,00046153 - TRANSFER FROM OTHER FUNDS 0 23,848 0 0 0 046170 - REIMBURSEMENT FR OTHER FUNDS 43,858 0 43,858 43,858 10,000 (33,858)Revenue Total 1,818,082 2,160,288 2,125,217 2,125,217 2,429,050 303,833
* 2017 Amended Budget as of 8/29/2017

Development Review Enterprise Page 26-8 2018 Budget
This page left intentionally blank
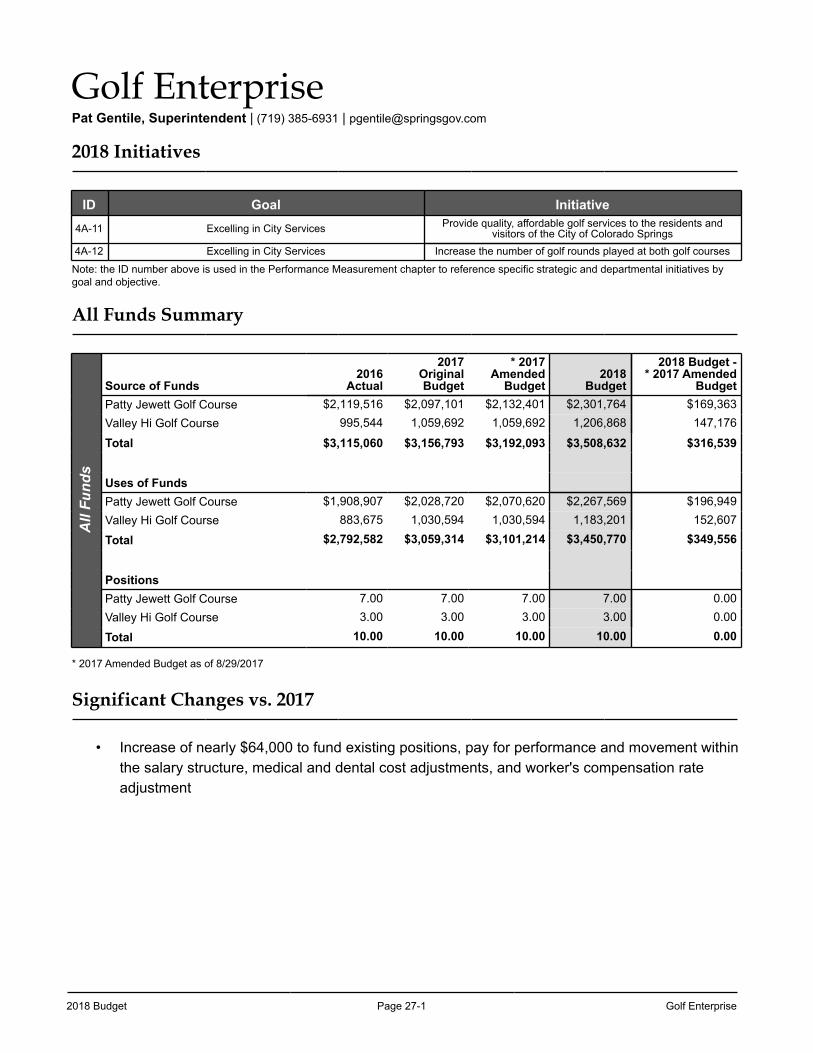
2018 Budget Page 27-1 Golf Enterprise
Golf EnterprisePat Gentile, Superintendent | (719) 385-6931 | [email protected]
2018 Initiatives
ID Goal Initiative4A-11 Excelling in City Services Provide quality, affordable golf services to the residents and
visitors of the City of Colorado Springs4A-12 Excelling in City Services Increase the number of golf rounds played at both golf courses
Note: the ID number above is used in the Performance Measurement chapter to reference specific strategic and departmental initiatives by goal and objective.
All Funds Summary
All
Fund
s
Source of Funds2016
Actual
2017OriginalBudget
* 2017Amended
Budget2018
Budget
2018 Budget -* 2017 Amended
BudgetPatty Jewett Golf Course $2,119,516 $2,097,101 $2,132,401 $2,301,764 $169,363Valley Hi Golf Course 995,544 1,059,692 1,059,692 1,206,868 147,176
Total $3,115,060 $3,156,793 $3,192,093 $3,508,632 $316,539
Uses of FundsPatty Jewett Golf Course $1,908,907 $2,028,720 $2,070,620 $2,267,569 $196,949Valley Hi Golf Course 883,675 1,030,594 1,030,594 1,183,201 152,607
Total $2,792,582 $3,059,314 $3,101,214 $3,450,770 $349,556
PositionsPatty Jewett Golf Course 7.00 7.00 7.00 7.00 0.00Valley Hi Golf Course 3.00 3.00 3.00 3.00 0.00
Total 10.00 10.00 10.00 10.00 0.00
* 2017 Amended Budget as of 8/29/2017
Significant Changes vs. 2017
• Increase of nearly $64,000 to fund existing positions, pay for performance and movement within the salary structure, medical and dental cost adjustments, and worker's compensation rate adjustment
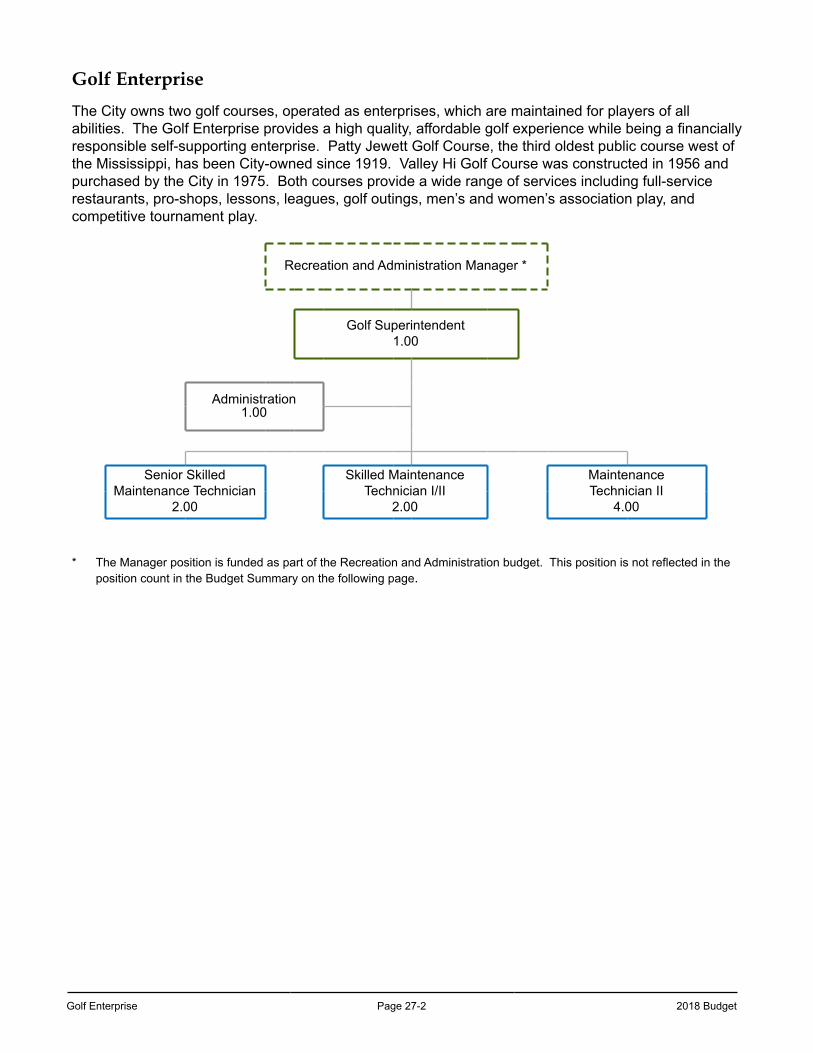
Golf Enterprise Page 27-2 2018 Budget
Golf Enterprise
The City owns two golf courses, operated as enterprises, which are maintained for players of all abilities. The Golf Enterprise provides a high quality, affordable golf experience while being a financially responsible self-supporting enterprise. Patty Jewett Golf Course, the third oldest public course west of the Mississippi, has been City-owned since 1919. Valley Hi Golf Course was constructed in 1956 and purchased by the City in 1975. Both courses provide a wide range of services including full-service restaurants, pro-shops, lessons, leagues, golf outings, men’s and women’s association play, and competitive tournament play.
Recreation and Administration Manager *
Golf Superintendent1.00
Administration1.00
Senior SkilledMaintenance Technician
2.00
Skilled MaintenanceTechnician I/II
2.00
MaintenanceTechnician II
4.00
* The Manager position is funded as part of the Recreation and Administration budget. This position is not reflected in the position count in the Budget Summary on the following page.
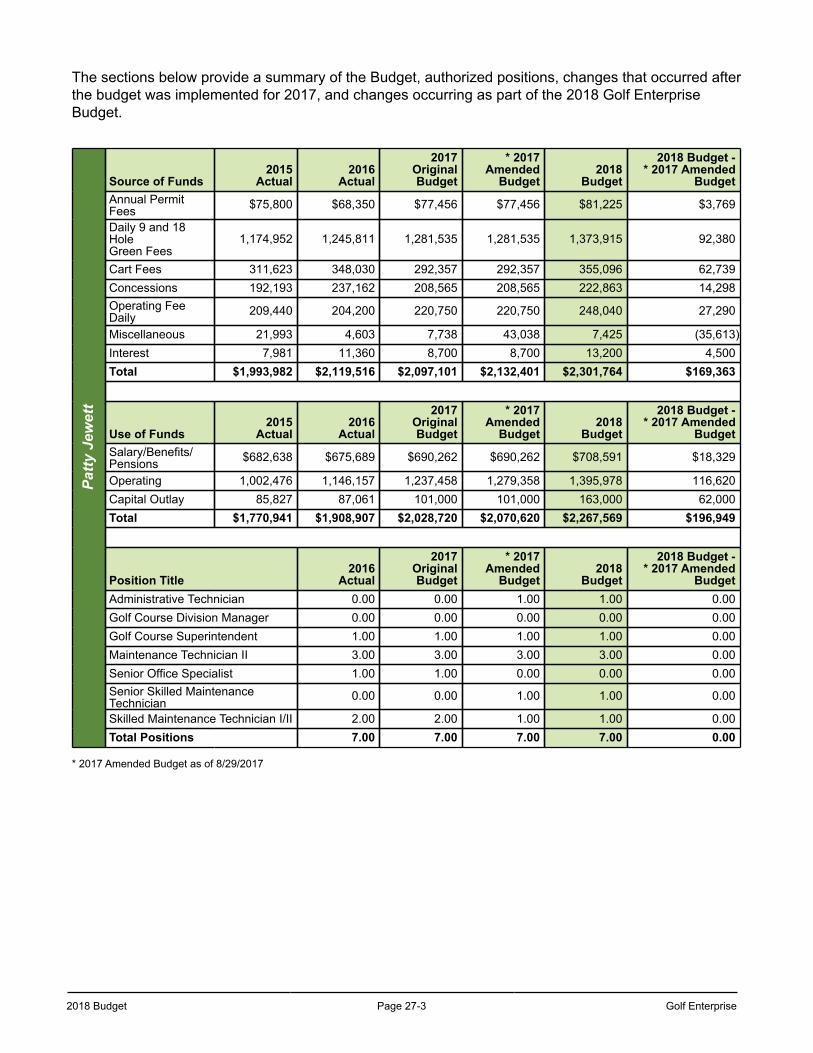
2018 Budget Page 27-3 Golf Enterprise
The sections below provide a summary of the Budget, authorized positions, changes that occurred after the budget was implemented for 2017, and changes occurring as part of the 2018 Golf Enterprise Budget.
Patty
Jew
ett
Source of Funds2015
Actual2016
Actual
2017OriginalBudget
* 2017Amended
Budget2018
Budget
2018 Budget -* 2017 Amended
BudgetAnnual PermitFees $75,800 $68,350 $77,456 $77,456 $81,225 $3,769
Daily 9 and 18 HoleGreen Fees
1,174,952 1,245,811 1,281,535 1,281,535 1,373,915 92,380
Cart Fees 311,623 348,030 292,357 292,357 355,096 62,739Concessions 192,193 237,162 208,565 208,565 222,863 14,298Operating FeeDaily 209,440 204,200 220,750 220,750 248,040 27,290
Miscellaneous 21,993 4,603 7,738 43,038 7,425 (35,613)Interest 7,981 11,360 8,700 8,700 13,200 4,500Total $1,993,982 $2,119,516 $2,097,101 $2,132,401 $2,301,764 $169,363
Use of Funds2015
Actual2016
Actual
2017OriginalBudget
* 2017Amended
Budget2018
Budget
2018 Budget -* 2017 Amended
BudgetSalary/Benefits/Pensions $682,638 $675,689 $690,262 $690,262 $708,591 $18,329
Operating 1,002,476 1,146,157 1,237,458 1,279,358 1,395,978 116,620Capital Outlay 85,827 87,061 101,000 101,000 163,000 62,000Total $1,770,941 $1,908,907 $2,028,720 $2,070,620 $2,267,569 $196,949
Position Title2016
Actual
2017OriginalBudget
* 2017Amended
Budget2018
Budget
2018 Budget -* 2017 Amended
BudgetAdministrative Technician 0.00 0.00 1.00 1.00 0.00Golf Course Division Manager 0.00 0.00 0.00 0.00 0.00Golf Course Superintendent 1.00 1.00 1.00 1.00 0.00Maintenance Technician II 3.00 3.00 3.00 3.00 0.00Senior Office Specialist 1.00 1.00 0.00 0.00 0.00Senior Skilled MaintenanceTechnician 0.00 0.00 1.00 1.00 0.00
Skilled Maintenance Technician I/II 2.00 2.00 1.00 1.00 0.00Total Positions 7.00 7.00 7.00 7.00 0.00
* 2017 Amended Budget as of 8/29/2017
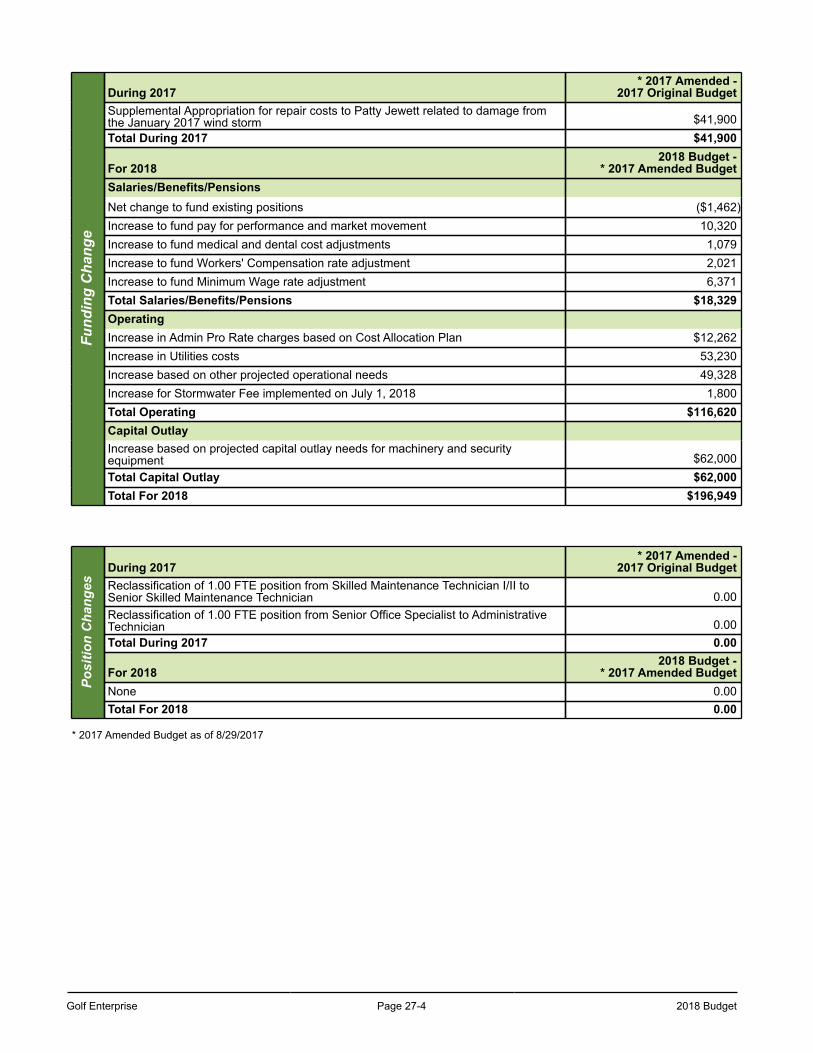
Golf Enterprise Page 27-4 2018 Budget
Fund
ing
Cha
nge
During 2017* 2017 Amended -
2017 Original BudgetSupplemental Appropriation for repair costs to Patty Jewett related to damage fromthe January 2017 wind storm $41,900Total During 2017 $41,900
For 20182018 Budget -
* 2017 Amended BudgetSalaries/Benefits/PensionsNet change to fund existing positions ($1,462)Increase to fund pay for performance and market movement 10,320Increase to fund medical and dental cost adjustments 1,079Increase to fund Workers' Compensation rate adjustment 2,021Increase to fund Minimum Wage rate adjustment 6,371Total Salaries/Benefits/Pensions $18,329OperatingIncrease in Admin Pro Rate charges based on Cost Allocation Plan $12,262Increase in Utilities costs 53,230Increase based on other projected operational needs 49,328Increase for Stormwater Fee implemented on July 1, 2018 1,800Total Operating $116,620Capital OutlayIncrease based on projected capital outlay needs for machinery and securityequipment $62,000Total Capital Outlay $62,000Total For 2018 $196,949
Posi
tion
Cha
nges
During 2017* 2017 Amended -
2017 Original BudgetReclassification of 1.00 FTE position from Skilled Maintenance Technician I/II toSenior Skilled Maintenance Technician 0.00Reclassification of 1.00 FTE position from Senior Office Specialist to AdministrativeTechnician 0.00Total During 2017 0.00
For 20182018 Budget -
* 2017 Amended BudgetNone 0.00Total For 2018 0.00
* 2017 Amended Budget as of 8/29/2017
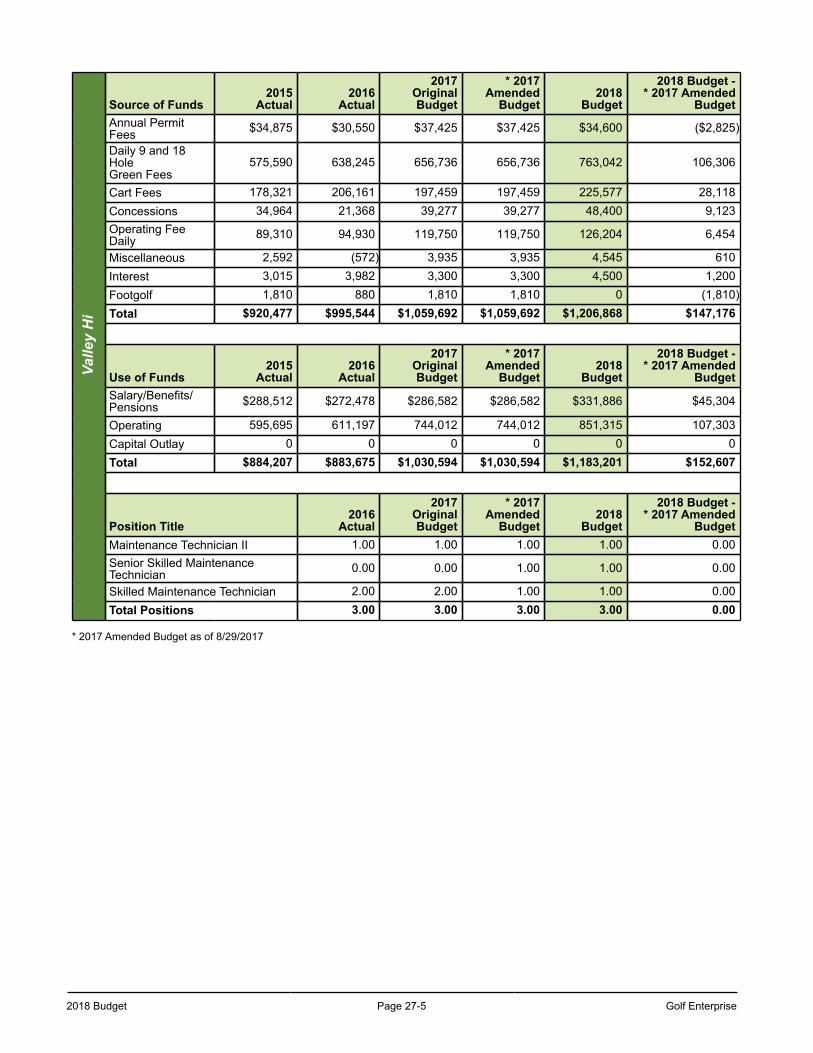
2018 Budget Page 27-5 Golf Enterprise
Valle
y H
iSource of Funds
2015Actual
2016Actual
2017OriginalBudget
* 2017Amended
Budget2018
Budget
2018 Budget -* 2017 Amended
BudgetAnnual PermitFees $34,875 $30,550 $37,425 $37,425 $34,600 ($2,825)
Daily 9 and 18 HoleGreen Fees
575,590 638,245 656,736 656,736 763,042 106,306
Cart Fees 178,321 206,161 197,459 197,459 225,577 28,118Concessions 34,964 21,368 39,277 39,277 48,400 9,123Operating FeeDaily 89,310 94,930 119,750 119,750 126,204 6,454
Miscellaneous 2,592 (572) 3,935 3,935 4,545 610Interest 3,015 3,982 3,300 3,300 4,500 1,200Footgolf 1,810 880 1,810 1,810 0 (1,810)Total $920,477 $995,544 $1,059,692 $1,059,692 $1,206,868 $147,176
Use of Funds2015
Actual2016
Actual
2017OriginalBudget
* 2017Amended
Budget2018
Budget
2018 Budget -* 2017 Amended
BudgetSalary/Benefits/Pensions $288,512 $272,478 $286,582 $286,582 $331,886 $45,304
Operating 595,695 611,197 744,012 744,012 851,315 107,303Capital Outlay 0 0 0 0 0 0Total $884,207 $883,675 $1,030,594 $1,030,594 $1,183,201 $152,607
Position Title2016
Actual
2017OriginalBudget
* 2017Amended
Budget2018
Budget
2018 Budget -* 2017 Amended
BudgetMaintenance Technician II 1.00 1.00 1.00 1.00 0.00Senior Skilled MaintenanceTechnician 0.00 0.00 1.00 1.00 0.00
Skilled Maintenance Technician 2.00 2.00 1.00 1.00 0.00Total Positions 3.00 3.00 3.00 3.00 0.00
* 2017 Amended Budget as of 8/29/2017
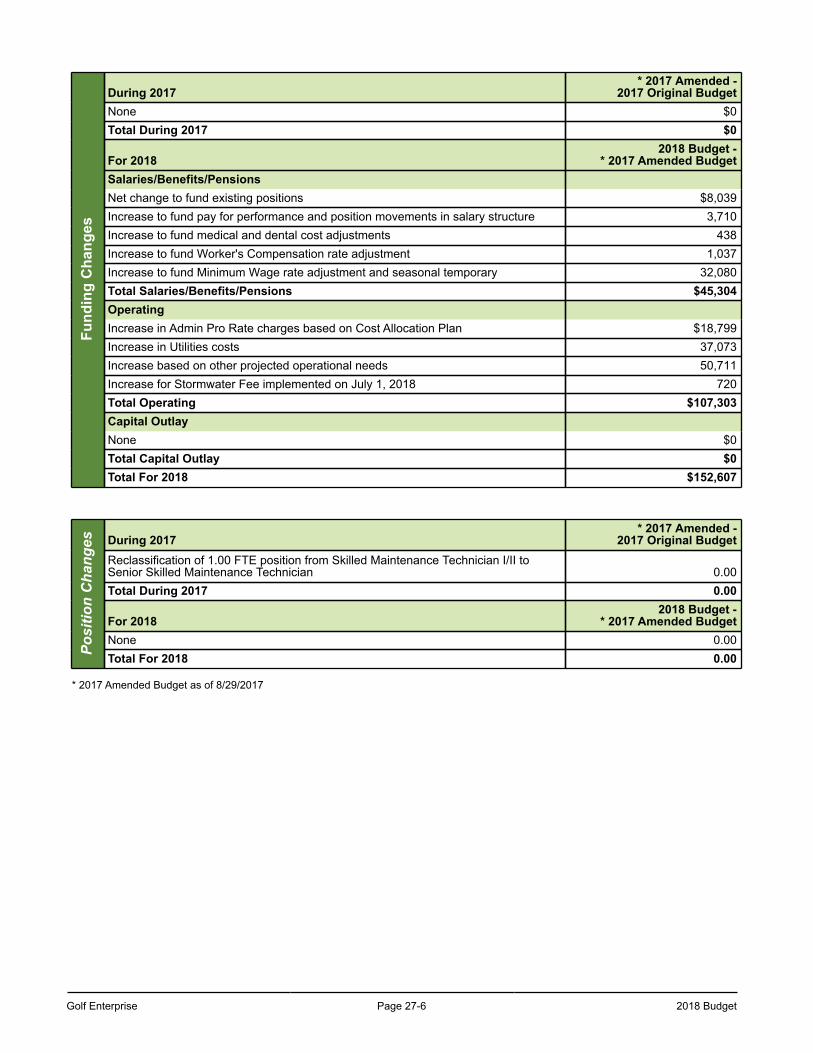
Golf Enterprise Page 27-6 2018 Budget
Fund
ing
Cha
nges
During 2017* 2017 Amended -
2017 Original BudgetNone $0Total During 2017 $0
For 20182018 Budget -
* 2017 Amended BudgetSalaries/Benefits/PensionsNet change to fund existing positions $8,039Increase to fund pay for performance and position movements in salary structure 3,710Increase to fund medical and dental cost adjustments 438Increase to fund Worker's Compensation rate adjustment 1,037Increase to fund Minimum Wage rate adjustment and seasonal temporary 32,080Total Salaries/Benefits/Pensions $45,304OperatingIncrease in Admin Pro Rate charges based on Cost Allocation Plan $18,799Increase in Utilities costs 37,073Increase based on other projected operational needs 50,711Increase for Stormwater Fee implemented on July 1, 2018 720Total Operating $107,303Capital OutlayNone $0Total Capital Outlay $0Total For 2018 $152,607
Posi
tion
Cha
nges During 2017
* 2017 Amended -2017 Original Budget
Reclassification of 1.00 FTE position from Skilled Maintenance Technician I/II toSenior Skilled Maintenance Technician 0.00Total During 2017 0.00
For 20182018 Budget -
* 2017 Amended BudgetNone 0.00Total For 2018 0.00
* 2017 Amended Budget as of 8/29/2017
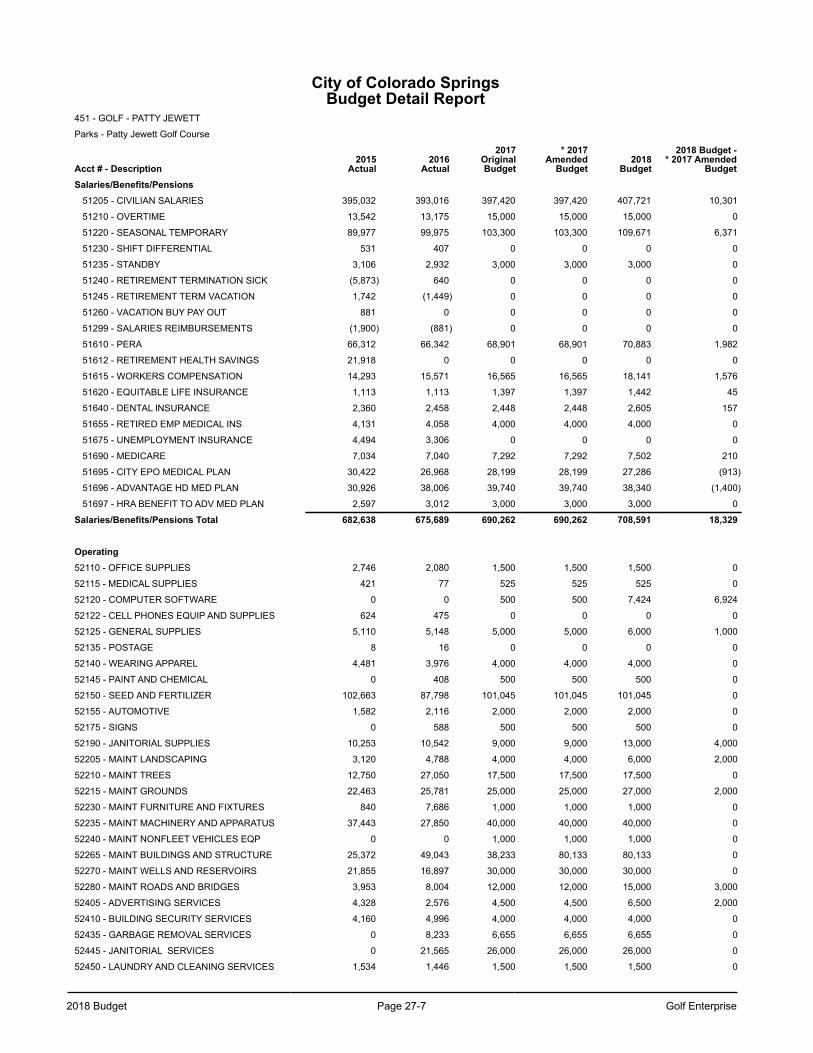
2018 Budget Page 27-7 Golf Enterprise
City of Colorado SpringsBudget Detail Report
451 - GOLF - PATTY JEWETT
Parks - Patty Jewett Golf Course
Acct # - Description2015
Actual2016
Actual
2017OriginalBudget
* 2017Amended
Budget2018
Budget
2018 Budget -* 2017 Amended
BudgetSalaries/Benefits/Pensions
51205 - CIVILIAN SALARIES 395,032 393,016 397,420 397,420 407,721 10,301
51210 - OVERTIME 13,542 13,175 15,000 15,000 15,000 0
51220 - SEASONAL TEMPORARY 89,977 99,975 103,300 103,300 109,671 6,371
51230 - SHIFT DIFFERENTIAL 531 407 0 0 0 0
51235 - STANDBY 3,106 2,932 3,000 3,000 3,000 0
51240 - RETIREMENT TERMINATION SICK (5,873) 640 0 0 0 0
51245 - RETIREMENT TERM VACATION 1,742 (1,449) 0 0 0 0
51260 - VACATION BUY PAY OUT 881 0 0 0 0 0
51299 - SALARIES REIMBURSEMENTS (1,900) (881) 0 0 0 0
51610 - PERA 66,312 66,342 68,901 68,901 70,883 1,982
51612 - RETIREMENT HEALTH SAVINGS 21,918 0 0 0 0 0
51615 - WORKERS COMPENSATION 14,293 15,571 16,565 16,565 18,141 1,576
51620 - EQUITABLE LIFE INSURANCE 1,113 1,113 1,397 1,397 1,442 45
51640 - DENTAL INSURANCE 2,360 2,458 2,448 2,448 2,605 157
51655 - RETIRED EMP MEDICAL INS 4,131 4,058 4,000 4,000 4,000 0
51675 - UNEMPLOYMENT INSURANCE 4,494 3,306 0 0 0 0
51690 - MEDICARE 7,034 7,040 7,292 7,292 7,502 210
51695 - CITY EPO MEDICAL PLAN 30,422 26,968 28,199 28,199 27,286 (913)
51696 - ADVANTAGE HD MED PLAN 30,926 38,006 39,740 39,740 38,340 (1,400)
51697 - HRA BENEFIT TO ADV MED PLAN 2,597 3,012 3,000 3,000 3,000 0
Salaries/Benefits/Pensions Total 682,638 675,689 690,262 690,262 708,591 18,329
Operating52110 - OFFICE SUPPLIES 2,746 2,080 1,500 1,500 1,500 0
52115 - MEDICAL SUPPLIES 421 77 525 525 525 0
52120 - COMPUTER SOFTWARE 0 0 500 500 7,424 6,924
52122 - CELL PHONES EQUIP AND SUPPLIES 624 475 0 0 0 0
52125 - GENERAL SUPPLIES 5,110 5,148 5,000 5,000 6,000 1,000
52135 - POSTAGE 8 16 0 0 0 0
52140 - WEARING APPAREL 4,481 3,976 4,000 4,000 4,000 0
52145 - PAINT AND CHEMICAL 0 408 500 500 500 0
52150 - SEED AND FERTILIZER 102,663 87,798 101,045 101,045 101,045 0
52155 - AUTOMOTIVE 1,582 2,116 2,000 2,000 2,000 0
52175 - SIGNS 0 588 500 500 500 0
52190 - JANITORIAL SUPPLIES 10,253 10,542 9,000 9,000 13,000 4,000
52205 - MAINT LANDSCAPING 3,120 4,788 4,000 4,000 6,000 2,000
52210 - MAINT TREES 12,750 27,050 17,500 17,500 17,500 0
52215 - MAINT GROUNDS 22,463 25,781 25,000 25,000 27,000 2,000
52230 - MAINT FURNITURE AND FIXTURES 840 7,686 1,000 1,000 1,000 0
52235 - MAINT MACHINERY AND APPARATUS 37,443 27,850 40,000 40,000 40,000 0
52240 - MAINT NONFLEET VEHICLES EQP 0 0 1,000 1,000 1,000 0
52265 - MAINT BUILDINGS AND STRUCTURE 25,372 49,043 38,233 80,133 80,133 0
52270 - MAINT WELLS AND RESERVOIRS 21,855 16,897 30,000 30,000 30,000 0
52280 - MAINT ROADS AND BRIDGES 3,953 8,004 12,000 12,000 15,000 3,000
52405 - ADVERTISING SERVICES 4,328 2,576 4,500 4,500 6,500 2,000
52410 - BUILDING SECURITY SERVICES 4,160 4,996 4,000 4,000 4,000 0
52435 - GARBAGE REMOVAL SERVICES 0 8,233 6,655 6,655 6,655 0
52445 - JANITORIAL SERVICES 0 21,565 26,000 26,000 26,000 0
52450 - LAUNDRY AND CLEANING SERVICES 1,534 1,446 1,500 1,500 1,500 0
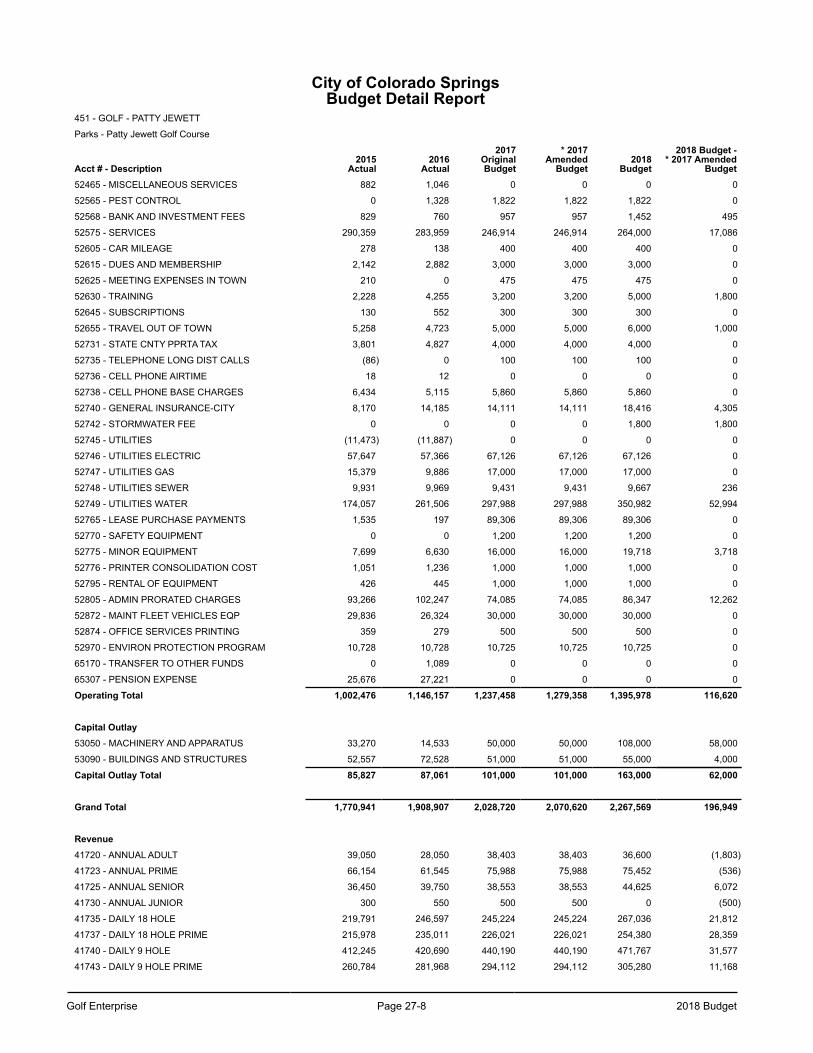
Golf Enterprise Page 27-8 2018 Budget
City of Colorado SpringsBudget Detail Report
451 - GOLF - PATTY JEWETT
Parks - Patty Jewett Golf Course
Acct # - Description2015
Actual2016
Actual
2017OriginalBudget
* 2017Amended
Budget2018
Budget
2018 Budget -* 2017 Amended
Budget52465 - MISCELLANEOUS SERVICES 882 1,046 0 0 0 0
52565 - PEST CONTROL 0 1,328 1,822 1,822 1,822 0
52568 - BANK AND INVESTMENT FEES 829 760 957 957 1,452 495
52575 - SERVICES 290,359 283,959 246,914 246,914 264,000 17,086
52605 - CAR MILEAGE 278 138 400 400 400 0
52615 - DUES AND MEMBERSHIP 2,142 2,882 3,000 3,000 3,000 0
52625 - MEETING EXPENSES IN TOWN 210 0 475 475 475 0
52630 - TRAINING 2,228 4,255 3,200 3,200 5,000 1,800
52645 - SUBSCRIPTIONS 130 552 300 300 300 0
52655 - TRAVEL OUT OF TOWN 5,258 4,723 5,000 5,000 6,000 1,000
52731 - STATE CNTY PPRTA TAX 3,801 4,827 4,000 4,000 4,000 0
52735 - TELEPHONE LONG DIST CALLS (86) 0 100 100 100 0
52736 - CELL PHONE AIRTIME 18 12 0 0 0 0
52738 - CELL PHONE BASE CHARGES 6,434 5,115 5,860 5,860 5,860 0
52740 - GENERAL INSURANCE-CITY 8,170 14,185 14,111 14,111 18,416 4,305
52742 - STORMWATER FEE 0 0 0 0 1,800 1,800
52745 - UTILITIES (11,473) (11,887) 0 0 0 0
52746 - UTILITIES ELECTRIC 57,647 57,366 67,126 67,126 67,126 0
52747 - UTILITIES GAS 15,379 9,886 17,000 17,000 17,000 0
52748 - UTILITIES SEWER 9,931 9,969 9,431 9,431 9,667 236
52749 - UTILITIES WATER 174,057 261,506 297,988 297,988 350,982 52,994
52765 - LEASE PURCHASE PAYMENTS 1,535 197 89,306 89,306 89,306 0
52770 - SAFETY EQUIPMENT 0 0 1,200 1,200 1,200 0
52775 - MINOR EQUIPMENT 7,699 6,630 16,000 16,000 19,718 3,718
52776 - PRINTER CONSOLIDATION COST 1,051 1,236 1,000 1,000 1,000 0
52795 - RENTAL OF EQUIPMENT 426 445 1,000 1,000 1,000 0
52805 - ADMIN PRORATED CHARGES 93,266 102,247 74,085 74,085 86,347 12,262
52872 - MAINT FLEET VEHICLES EQP 29,836 26,324 30,000 30,000 30,000 0
52874 - OFFICE SERVICES PRINTING 359 279 500 500 500 0
52970 - ENVIRON PROTECTION PROGRAM 10,728 10,728 10,725 10,725 10,725 0
65170 - TRANSFER TO OTHER FUNDS 0 1,089 0 0 0 0
65307 - PENSION EXPENSE 25,676 27,221 0 0 0 0
Operating Total 1,002,476 1,146,157 1,237,458 1,279,358 1,395,978 116,620
Capital Outlay53050 - MACHINERY AND APPARATUS 33,270 14,533 50,000 50,000 108,000 58,000
53090 - BUILDINGS AND STRUCTURES 52,557 72,528 51,000 51,000 55,000 4,000
Capital Outlay Total 85,827 87,061 101,000 101,000 163,000 62,000
Grand Total 1,770,941 1,908,907 2,028,720 2,070,620 2,267,569 196,949
Revenue41720 - ANNUAL ADULT 39,050 28,050 38,403 38,403 36,600 (1,803)
41723 - ANNUAL PRIME 66,154 61,545 75,988 75,988 75,452 (536)
41725 - ANNUAL SENIOR 36,450 39,750 38,553 38,553 44,625 6,072
41730 - ANNUAL JUNIOR 300 550 500 500 0 (500)
41735 - DAILY 18 HOLE 219,791 246,597 245,224 245,224 267,036 21,812
41737 - DAILY 18 HOLE PRIME 215,978 235,011 226,021 226,021 254,380 28,359
41740 - DAILY 9 HOLE 412,245 420,690 440,190 440,190 471,767 31,577
41743 - DAILY 9 HOLE PRIME 260,784 281,968 294,112 294,112 305,280 11,168
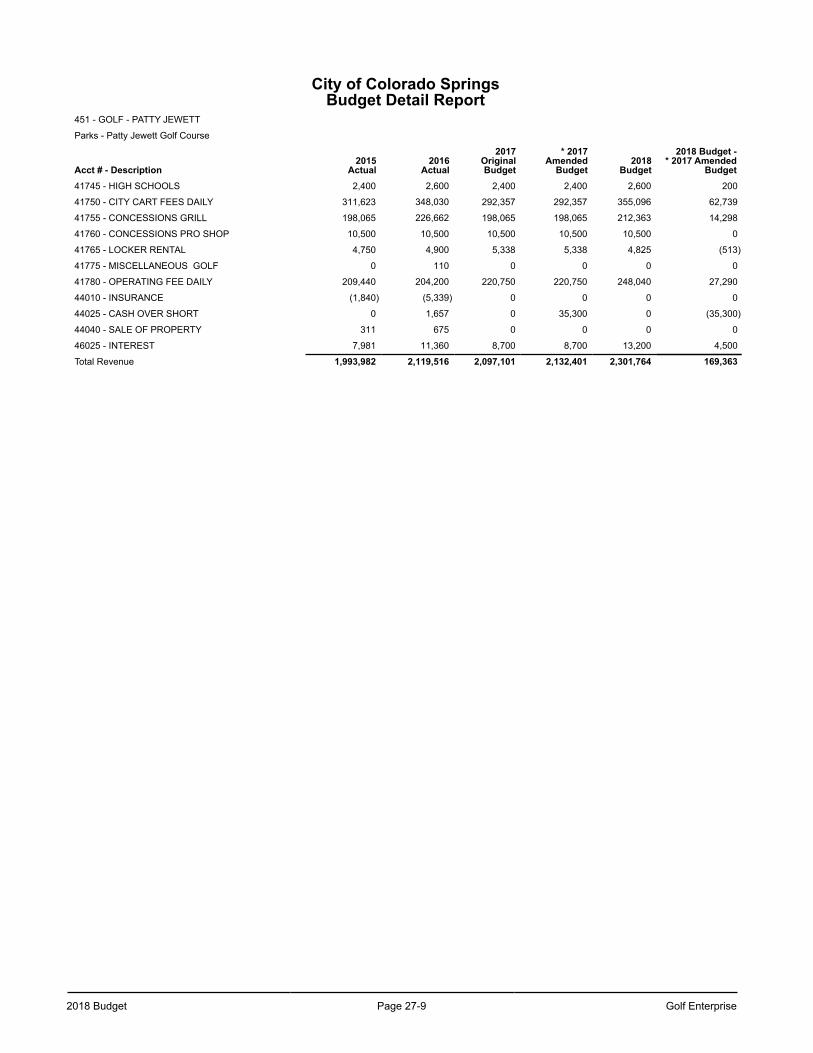
2018 Budget Page 27-9 Golf Enterprise
City of Colorado SpringsBudget Detail Report
451 - GOLF - PATTY JEWETT
Parks - Patty Jewett Golf Course
Acct # - Description2015
Actual2016
Actual
2017OriginalBudget
* 2017Amended
Budget2018
Budget
2018 Budget -* 2017 Amended
Budget41745 - HIGH SCHOOLS 2,400 2,600 2,400 2,400 2,600 200
41750 - CITY CART FEES DAILY 311,623 348,030 292,357 292,357 355,096 62,739
41755 - CONCESSIONS GRILL 198,065 226,662 198,065 198,065 212,363 14,298
41760 - CONCESSIONS PRO SHOP 10,500 10,500 10,500 10,500 10,500 0
41765 - LOCKER RENTAL 4,750 4,900 5,338 5,338 4,825 (513)
41775 - MISCELLANEOUS GOLF 0 110 0 0 0 0
41780 - OPERATING FEE DAILY 209,440 204,200 220,750 220,750 248,040 27,290
44010 - INSURANCE (1,840) (5,339) 0 0 0 0
44025 - CASH OVER SHORT 0 1,657 0 35,300 0 (35,300)
44040 - SALE OF PROPERTY 311 675 0 0 0 0
46025 - INTEREST 7,981 11,360 8,700 8,700 13,200 4,500
Total Revenue 1,993,982 2,119,516 2,097,101 2,132,401 2,301,764 169,363
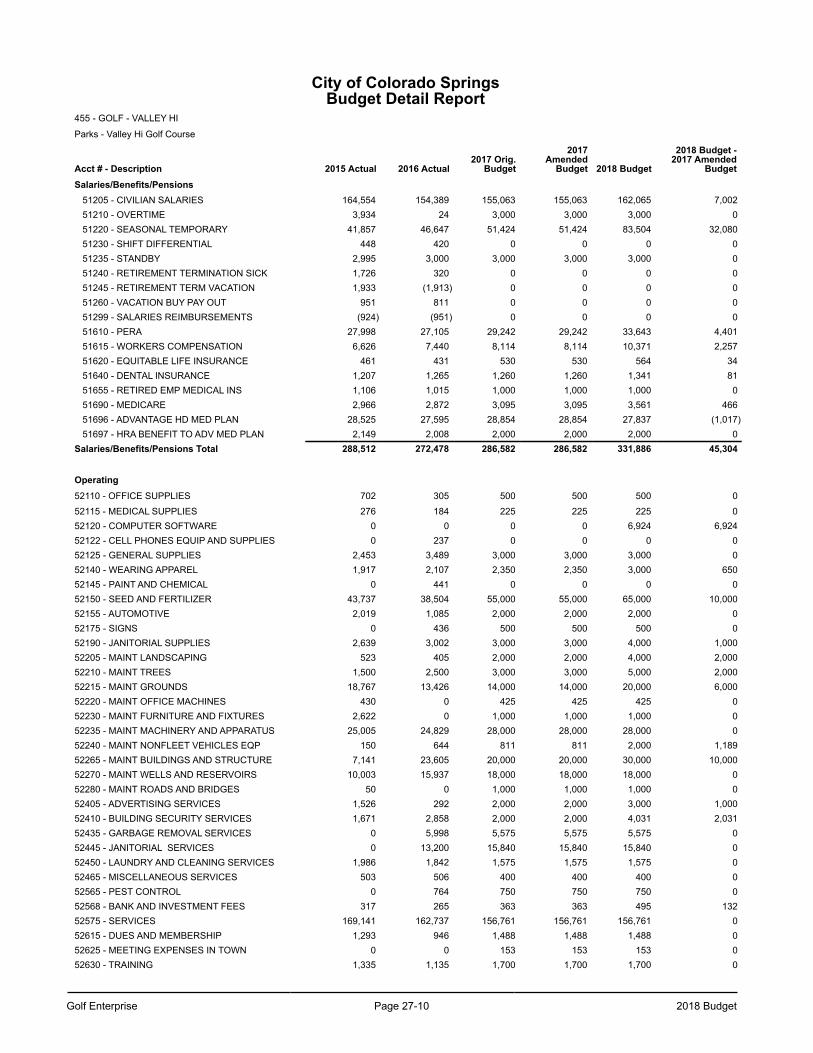
Golf Enterprise Page 27-10 2018 Budget
City of Colorado SpringsBudget Detail Report
455 - GOLF - VALLEY HI
Parks - Valley Hi Golf Course
Acct # - Description 2015 Actual 2016 Actual2017 Orig.
Budget
2017Amended
Budget 2018 Budget
2018 Budget -2017 Amended
BudgetSalaries/Benefits/Pensions
51205 - CIVILIAN SALARIES 164,554 154,389 155,063 155,063 162,065 7,00251210 - OVERTIME 3,934 24 3,000 3,000 3,000 051220 - SEASONAL TEMPORARY 41,857 46,647 51,424 51,424 83,504 32,08051230 - SHIFT DIFFERENTIAL 448 420 0 0 0 051235 - STANDBY 2,995 3,000 3,000 3,000 3,000 051240 - RETIREMENT TERMINATION SICK 1,726 320 0 0 0 051245 - RETIREMENT TERM VACATION 1,933 (1,913) 0 0 0 051260 - VACATION BUY PAY OUT 951 811 0 0 0 051299 - SALARIES REIMBURSEMENTS (924) (951) 0 0 0 051610 - PERA 27,998 27,105 29,242 29,242 33,643 4,40151615 - WORKERS COMPENSATION 6,626 7,440 8,114 8,114 10,371 2,25751620 - EQUITABLE LIFE INSURANCE 461 431 530 530 564 3451640 - DENTAL INSURANCE 1,207 1,265 1,260 1,260 1,341 8151655 - RETIRED EMP MEDICAL INS 1,106 1,015 1,000 1,000 1,000 051690 - MEDICARE 2,966 2,872 3,095 3,095 3,561 46651696 - ADVANTAGE HD MED PLAN 28,525 27,595 28,854 28,854 27,837 (1,017)51697 - HRA BENEFIT TO ADV MED PLAN 2,149 2,008 2,000 2,000 2,000 0
Salaries/Benefits/Pensions Total 288,512 272,478 286,582 286,582 331,886 45,304
Operating52110 - OFFICE SUPPLIES 702 305 500 500 500 052115 - MEDICAL SUPPLIES 276 184 225 225 225 052120 - COMPUTER SOFTWARE 0 0 0 0 6,924 6,92452122 - CELL PHONES EQUIP AND SUPPLIES 0 237 0 0 0 052125 - GENERAL SUPPLIES 2,453 3,489 3,000 3,000 3,000 052140 - WEARING APPAREL 1,917 2,107 2,350 2,350 3,000 65052145 - PAINT AND CHEMICAL 0 441 0 0 0 052150 - SEED AND FERTILIZER 43,737 38,504 55,000 55,000 65,000 10,00052155 - AUTOMOTIVE 2,019 1,085 2,000 2,000 2,000 052175 - SIGNS 0 436 500 500 500 052190 - JANITORIAL SUPPLIES 2,639 3,002 3,000 3,000 4,000 1,00052205 - MAINT LANDSCAPING 523 405 2,000 2,000 4,000 2,00052210 - MAINT TREES 1,500 2,500 3,000 3,000 5,000 2,00052215 - MAINT GROUNDS 18,767 13,426 14,000 14,000 20,000 6,00052220 - MAINT OFFICE MACHINES 430 0 425 425 425 052230 - MAINT FURNITURE AND FIXTURES 2,622 0 1,000 1,000 1,000 052235 - MAINT MACHINERY AND APPARATUS 25,005 24,829 28,000 28,000 28,000 052240 - MAINT NONFLEET VEHICLES EQP 150 644 811 811 2,000 1,18952265 - MAINT BUILDINGS AND STRUCTURE 7,141 23,605 20,000 20,000 30,000 10,00052270 - MAINT WELLS AND RESERVOIRS 10,003 15,937 18,000 18,000 18,000 052280 - MAINT ROADS AND BRIDGES 50 0 1,000 1,000 1,000 052405 - ADVERTISING SERVICES 1,526 292 2,000 2,000 3,000 1,00052410 - BUILDING SECURITY SERVICES 1,671 2,858 2,000 2,000 4,031 2,03152435 - GARBAGE REMOVAL SERVICES 0 5,998 5,575 5,575 5,575 052445 - JANITORIAL SERVICES 0 13,200 15,840 15,840 15,840 052450 - LAUNDRY AND CLEANING SERVICES 1,986 1,842 1,575 1,575 1,575 052465 - MISCELLANEOUS SERVICES 503 506 400 400 400 052565 - PEST CONTROL 0 764 750 750 750 052568 - BANK AND INVESTMENT FEES 317 265 363 363 495 13252575 - SERVICES 169,141 162,737 156,761 156,761 156,761 052615 - DUES AND MEMBERSHIP 1,293 946 1,488 1,488 1,488 052625 - MEETING EXPENSES IN TOWN 0 0 153 153 153 052630 - TRAINING 1,335 1,135 1,700 1,700 1,700 0
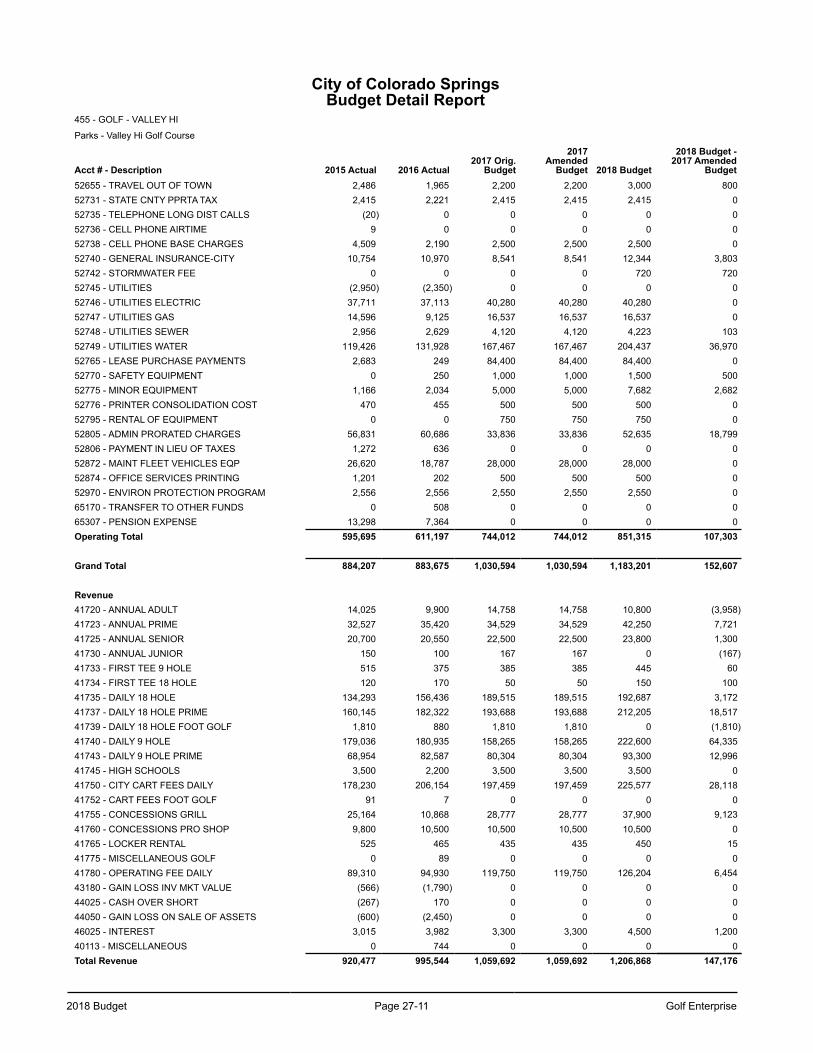
2018 Budget Page 27-11 Golf Enterprise
City of Colorado SpringsBudget Detail Report
455 - GOLF - VALLEY HI
Parks - Valley Hi Golf Course
Acct # - Description 2015 Actual 2016 Actual2017 Orig.
Budget
2017Amended
Budget 2018 Budget
2018 Budget -2017 Amended
Budget52655 - TRAVEL OUT OF TOWN 2,486 1,965 2,200 2,200 3,000 80052731 - STATE CNTY PPRTA TAX 2,415 2,221 2,415 2,415 2,415 052735 - TELEPHONE LONG DIST CALLS (20) 0 0 0 0 052736 - CELL PHONE AIRTIME 9 0 0 0 0 052738 - CELL PHONE BASE CHARGES 4,509 2,190 2,500 2,500 2,500 052740 - GENERAL INSURANCE-CITY 10,754 10,970 8,541 8,541 12,344 3,80352742 - STORMWATER FEE 0 0 0 0 720 72052745 - UTILITIES (2,950) (2,350) 0 0 0 052746 - UTILITIES ELECTRIC 37,711 37,113 40,280 40,280 40,280 052747 - UTILITIES GAS 14,596 9,125 16,537 16,537 16,537 052748 - UTILITIES SEWER 2,956 2,629 4,120 4,120 4,223 10352749 - UTILITIES WATER 119,426 131,928 167,467 167,467 204,437 36,97052765 - LEASE PURCHASE PAYMENTS 2,683 249 84,400 84,400 84,400 052770 - SAFETY EQUIPMENT 0 250 1,000 1,000 1,500 50052775 - MINOR EQUIPMENT 1,166 2,034 5,000 5,000 7,682 2,68252776 - PRINTER CONSOLIDATION COST 470 455 500 500 500 052795 - RENTAL OF EQUIPMENT 0 0 750 750 750 052805 - ADMIN PRORATED CHARGES 56,831 60,686 33,836 33,836 52,635 18,79952806 - PAYMENT IN LIEU OF TAXES 1,272 636 0 0 0 052872 - MAINT FLEET VEHICLES EQP 26,620 18,787 28,000 28,000 28,000 052874 - OFFICE SERVICES PRINTING 1,201 202 500 500 500 052970 - ENVIRON PROTECTION PROGRAM 2,556 2,556 2,550 2,550 2,550 065170 - TRANSFER TO OTHER FUNDS 0 508 0 0 0 065307 - PENSION EXPENSE 13,298 7,364 0 0 0 0Operating Total 595,695 611,197 744,012 744,012 851,315 107,303
Grand Total 884,207 883,675 1,030,594 1,030,594 1,183,201 152,607
Revenue41720 - ANNUAL ADULT 14,025 9,900 14,758 14,758 10,800 (3,958)41723 - ANNUAL PRIME 32,527 35,420 34,529 34,529 42,250 7,72141725 - ANNUAL SENIOR 20,700 20,550 22,500 22,500 23,800 1,30041730 - ANNUAL JUNIOR 150 100 167 167 0 (167)41733 - FIRST TEE 9 HOLE 515 375 385 385 445 6041734 - FIRST TEE 18 HOLE 120 170 50 50 150 10041735 - DAILY 18 HOLE 134,293 156,436 189,515 189,515 192,687 3,17241737 - DAILY 18 HOLE PRIME 160,145 182,322 193,688 193,688 212,205 18,51741739 - DAILY 18 HOLE FOOT GOLF 1,810 880 1,810 1,810 0 (1,810)41740 - DAILY 9 HOLE 179,036 180,935 158,265 158,265 222,600 64,33541743 - DAILY 9 HOLE PRIME 68,954 82,587 80,304 80,304 93,300 12,99641745 - HIGH SCHOOLS 3,500 2,200 3,500 3,500 3,500 041750 - CITY CART FEES DAILY 178,230 206,154 197,459 197,459 225,577 28,11841752 - CART FEES FOOT GOLF 91 7 0 0 0 041755 - CONCESSIONS GRILL 25,164 10,868 28,777 28,777 37,900 9,12341760 - CONCESSIONS PRO SHOP 9,800 10,500 10,500 10,500 10,500 041765 - LOCKER RENTAL 525 465 435 435 450 1541775 - MISCELLANEOUS GOLF 0 89 0 0 0 041780 - OPERATING FEE DAILY 89,310 94,930 119,750 119,750 126,204 6,45443180 - GAIN LOSS INV MKT VALUE (566) (1,790) 0 0 0 044025 - CASH OVER SHORT (267) 170 0 0 0 044050 - GAIN LOSS ON SALE OF ASSETS (600) (2,450) 0 0 0 046025 - INTEREST 3,015 3,982 3,300 3,300 4,500 1,20040113 - MISCELLANEOUS 0 744 0 0 0 0Total Revenue 920,477 995,544 1,059,692 1,059,692 1,206,868 147,176

Golf Enterprise Page 27-12 2018 Budget
This page left blank intentionally.
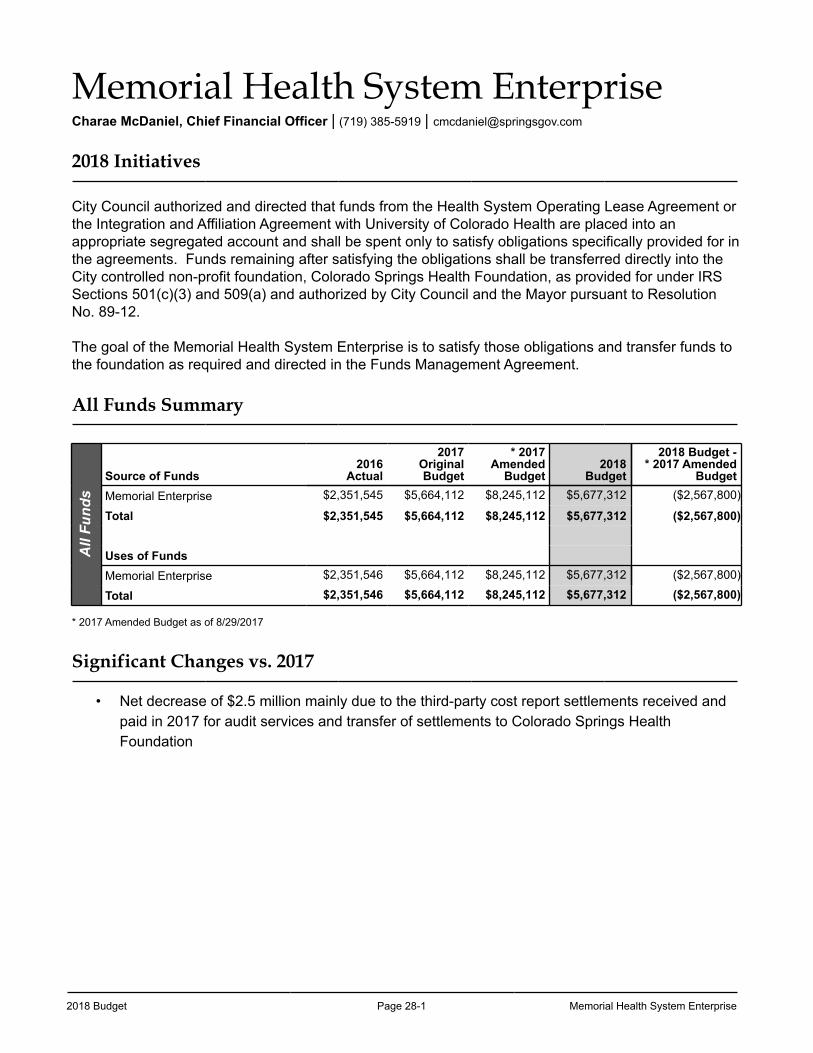
2018 Budget Page 28-1 Memorial Health System Enterprise
Memorial Health System EnterpriseCharae McDaniel, Chief Financial Officer | (719) 385-5919 | [email protected]
2018 Initiatives
City Council authorized and directed that funds from the Health System Operating Lease Agreement or the Integration and Affiliation Agreement with University of Colorado Health are placed into an appropriate segregated account and shall be spent only to satisfy obligations specifically provided for in the agreements. Funds remaining after satisfying the obligations shall be transferred directly into the City controlled non-profit foundation, Colorado Springs Health Foundation, as provided for under IRS Sections 501(c)(3) and 509(a) and authorized by City Council and the Mayor pursuant to Resolution No. 89-12.
The goal of the Memorial Health System Enterprise is to satisfy those obligations and transfer funds to the foundation as required and directed in the Funds Management Agreement.
All Funds Summary
All
Fund
s
Source of Funds2016
Actual
2017OriginalBudget
* 2017Amended
Budget2018
Budget
2018 Budget -* 2017 Amended
BudgetMemorial Enterprise $2,351,545 $5,664,112 $8,245,112 $5,677,312 ($2,567,800)
Total $2,351,545 $5,664,112 $8,245,112 $5,677,312 ($2,567,800)
Uses of FundsMemorial Enterprise $2,351,546 $5,664,112 $8,245,112 $5,677,312 ($2,567,800)
Total $2,351,546 $5,664,112 $8,245,112 $5,677,312 ($2,567,800)
* 2017 Amended Budget as of 8/29/2017
Significant Changes vs. 2017
• Net decrease of $2.5 million mainly due to the third-party cost report settlements received and paid in 2017 for audit services and transfer of settlements to Colorado Springs Health Foundation
Memorial Health System Enterprise Page 28-2 2018 Budget
Memorial Health System EnterpriseSince 1949, the City of Colorado Springs owned and operated Memorial Health System, dedicated to being a regional leader in providing high quality healthcare services to all citizens.
Upon careful consideration, City Council considered the option of leasing the assets of Memorial Health System to an outside independent operator to ensure the best possible healthcare for the entire community. The Memorial Health System Task Force, created by City Council, recommended that City Council select the University of Colorado Health System as the exclusive bidder to be considered for this strategic partnership.
On August 28, 2012, voters approved the proposed operating lease agreement and the integration and affiliation agreement with the University of Colorado Health System. The transaction was finalized on October 1, 2012.
The Memorial Health System Enterprise remains primarily as a leasing entity. The Memorial Health System Enterprise collects lease payments and continues to incur expenditures related to excluded liabilities, such as the run-out on medical claims and workers’ compensation claims incurred prior to October 1, 2012.
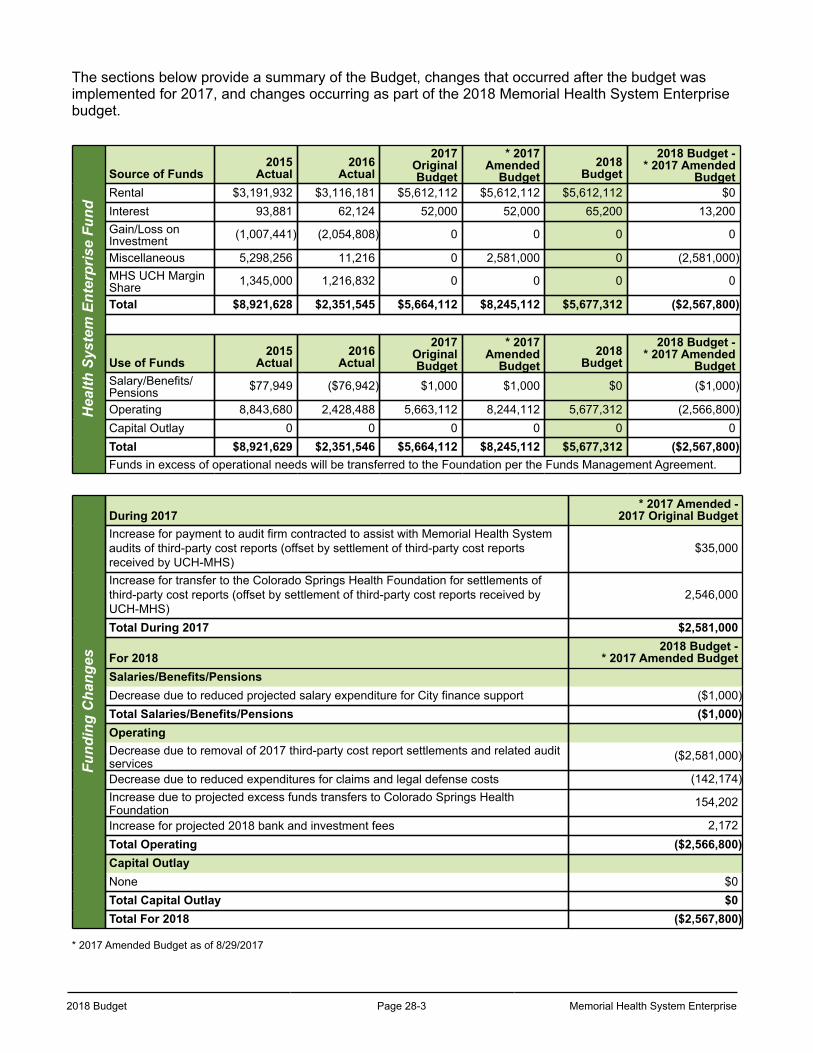
2018 Budget Page 28-3 Memorial Health System Enterprise
The sections below provide a summary of the Budget, changes that occurred after the budget was implemented for 2017, and changes occurring as part of the 2018 Memorial Health System Enterprise budget.
Hea
lth S
yste
m E
nter
pris
e Fu
nd
Source of Funds2015
Actual2016
Actual
2017OriginalBudget
* 2017Amended
Budget2018
Budget
2018 Budget -* 2017 Amended
BudgetRental $3,191,932 $3,116,181 $5,612,112 $5,612,112 $5,612,112 $0Interest 93,881 62,124 52,000 52,000 65,200 13,200Gain/Loss onInvestment (1,007,441) (2,054,808) 0 0 0 0
Miscellaneous 5,298,256 11,216 0 2,581,000 0 (2,581,000)MHS UCH MarginShare 1,345,000 1,216,832 0 0 0 0
Total $8,921,628 $2,351,545 $5,664,112 $8,245,112 $5,677,312 ($2,567,800)
Use of Funds2015
Actual2016
Actual
2017OriginalBudget
* 2017Amended
Budget2018
Budget
2018 Budget -* 2017 Amended
BudgetSalary/Benefits/Pensions $77,949 ($76,942) $1,000 $1,000 $0 ($1,000)
Operating 8,843,680 2,428,488 5,663,112 8,244,112 5,677,312 (2,566,800)Capital Outlay 0 0 0 0 0 0Total $8,921,629 $2,351,546 $5,664,112 $8,245,112 $5,677,312 ($2,567,800)Funds in excess of operational needs will be transferred to the Foundation per the Funds Management Agreement.
Fund
ing
Cha
nges
During 2017* 2017 Amended -
2017 Original BudgetIncrease for payment to audit firm contracted to assist with Memorial Health Systemaudits of third-party cost reports (offset by settlement of third-party cost reportsreceived by UCH-MHS)
$35,000
Increase for transfer to the Colorado Springs Health Foundation for settlements ofthird-party cost reports (offset by settlement of third-party cost reports received byUCH-MHS)
2,546,000
Total During 2017 $2,581,000
For 20182018 Budget -
* 2017 Amended BudgetSalaries/Benefits/PensionsDecrease due to reduced projected salary expenditure for City finance support ($1,000)Total Salaries/Benefits/Pensions ($1,000)OperatingDecrease due to removal of 2017 third-party cost report settlements and related auditservices
($2,581,000)
Decrease due to reduced expenditures for claims and legal defense costs (142,174)Increase due to projected excess funds transfers to Colorado Springs HealthFoundation
154,202
Increase for projected 2018 bank and investment fees 2,172Total Operating ($2,566,800)Capital OutlayNone $0Total Capital Outlay $0Total For 2018 ($2,567,800)
* 2017 Amended Budget as of 8/29/2017
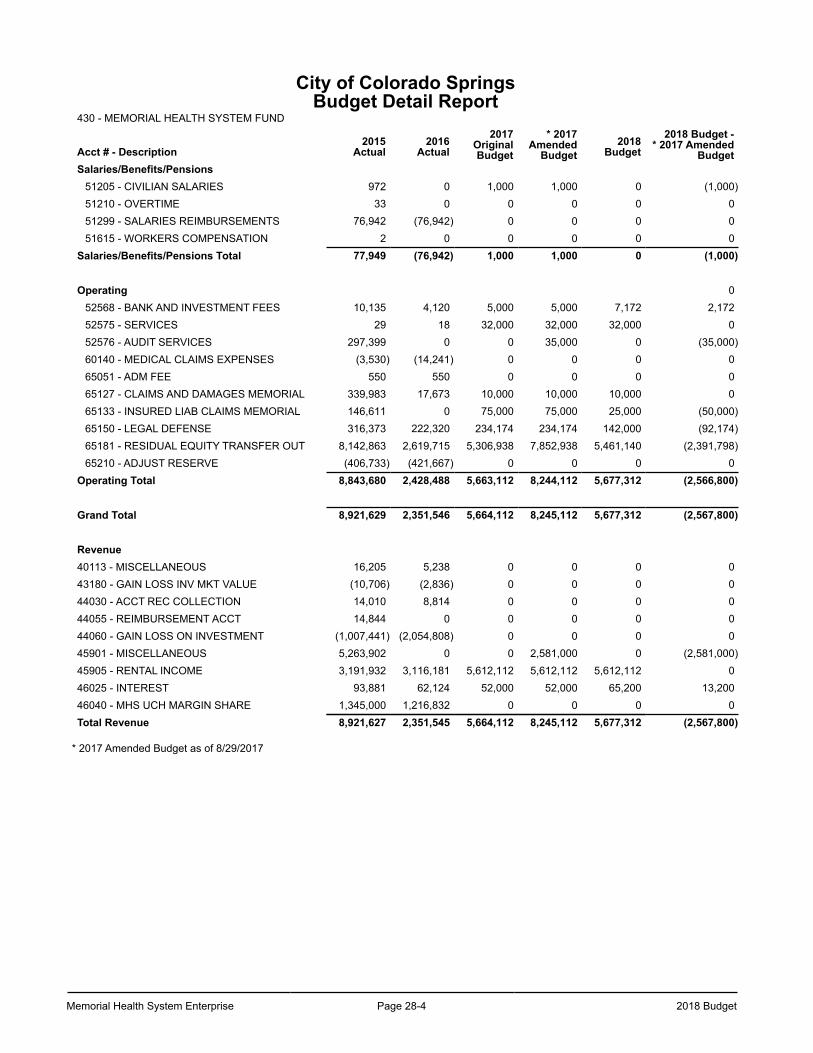
Memorial Health System Enterprise Page 28-4 2018 Budget
City of Colorado SpringsBudget Detail Report
430 - MEMORIAL HEALTH SYSTEM FUND
Acct # - Description2015
Actual2016
Actual2017
OriginalBudget
* 2017Amended
Budget2018
Budget2018 Budget -
* 2017 AmendedBudget
Salaries/Benefits/Pensions51205 - CIVILIAN SALARIES 972 0 1,000 1,000 0 (1,000)51210 - OVERTIME 33 0 0 0 0 051299 - SALARIES REIMBURSEMENTS 76,942 (76,942) 0 0 0 051615 - WORKERS COMPENSATION 2 0 0 0 0 0
Salaries/Benefits/Pensions Total 77,949 (76,942) 1,000 1,000 0 (1,000)
Operating 052568 - BANK AND INVESTMENT FEES 10,135 4,120 5,000 5,000 7,172 2,17252575 - SERVICES 29 18 32,000 32,000 32,000 052576 - AUDIT SERVICES 297,399 0 0 35,000 0 (35,000)60140 - MEDICAL CLAIMS EXPENSES (3,530) (14,241) 0 0 0 065051 - ADM FEE 550 550 0 0 0 065127 - CLAIMS AND DAMAGES MEMORIAL 339,983 17,673 10,000 10,000 10,000 065133 - INSURED LIAB CLAIMS MEMORIAL 146,611 0 75,000 75,000 25,000 (50,000)65150 - LEGAL DEFENSE 316,373 222,320 234,174 234,174 142,000 (92,174)65181 - RESIDUAL EQUITY TRANSFER OUT 8,142,863 2,619,715 5,306,938 7,852,938 5,461,140 (2,391,798)65210 - ADJUST RESERVE (406,733) (421,667) 0 0 0 0
Operating Total 8,843,680 2,428,488 5,663,112 8,244,112 5,677,312 (2,566,800)
Grand Total 8,921,629 2,351,546 5,664,112 8,245,112 5,677,312 (2,567,800)
Revenue40113 - MISCELLANEOUS 16,205 5,238 0 0 0 043180 - GAIN LOSS INV MKT VALUE (10,706) (2,836) 0 0 0 044030 - ACCT REC COLLECTION 14,010 8,814 0 0 0 044055 - REIMBURSEMENT ACCT 14,844 0 0 0 0 044060 - GAIN LOSS ON INVESTMENT (1,007,441) (2,054,808) 0 0 0 045901 - MISCELLANEOUS 5,263,902 0 0 2,581,000 0 (2,581,000)45905 - RENTAL INCOME 3,191,932 3,116,181 5,612,112 5,612,112 5,612,112 046025 - INTEREST 93,881 62,124 52,000 52,000 65,200 13,20046040 - MHS UCH MARGIN SHARE 1,345,000 1,216,832 0 0 0 0Total Revenue 8,921,627 2,351,545 5,664,112 8,245,112 5,677,312 (2,567,800)
* 2017 Amended Budget as of 8/29/2017
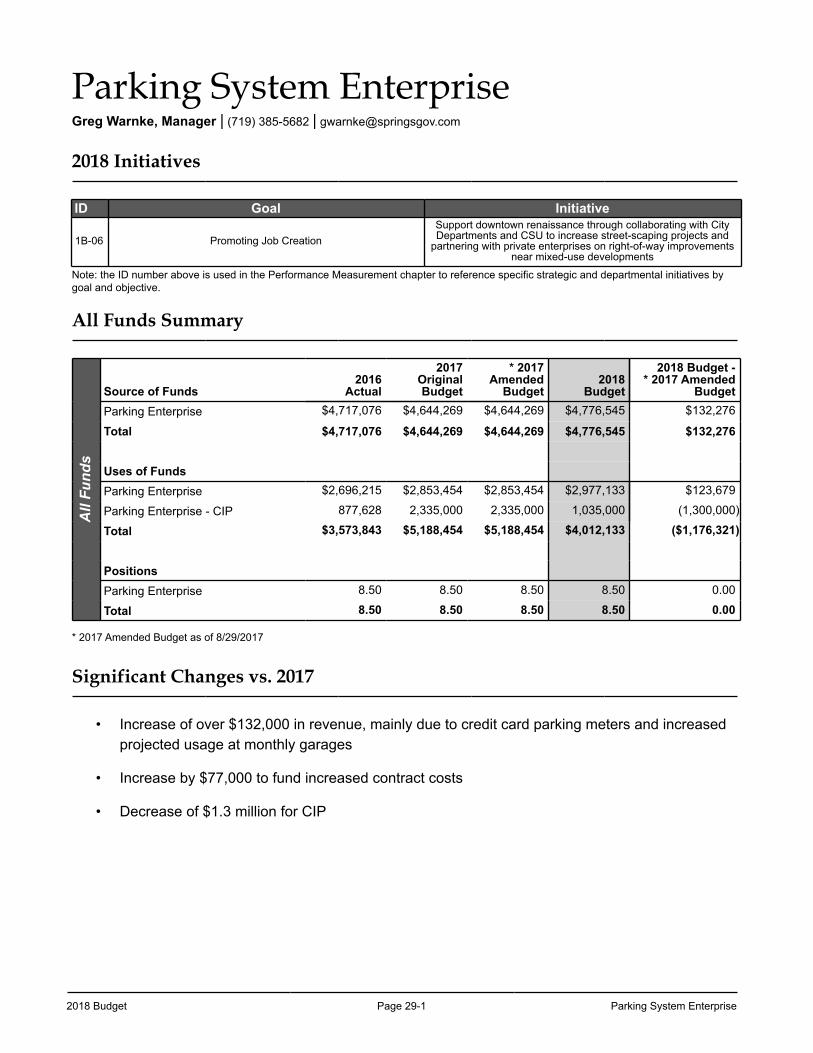
2018 Budget Page 29-1 Parking System Enterprise
Parking System EnterpriseGreg Warnke, Manager | (719) 385-5682 | [email protected]
2018 Initiatives
ID Goal Initiative
1B-06 Promoting Job CreationSupport downtown renaissance through collaborating with City Departments and CSU to increase street-scaping projects and
partnering with private enterprises on right-of-way improvements near mixed-use developments
Note: the ID number above is used in the Performance Measurement chapter to reference specific strategic and departmental initiatives by goal and objective.
All Funds Summary
All
Fund
s
Source of Funds2016
Actual
2017OriginalBudget
* 2017Amended
Budget2018
Budget
2018 Budget -* 2017 Amended
BudgetParking Enterprise $4,717,076 $4,644,269 $4,644,269 $4,776,545 $132,276
Total $4,717,076 $4,644,269 $4,644,269 $4,776,545 $132,276
Uses of FundsParking Enterprise $2,696,215 $2,853,454 $2,853,454 $2,977,133 $123,679
Parking Enterprise - CIP 877,628 2,335,000 2,335,000 1,035,000 (1,300,000)
Total $3,573,843 $5,188,454 $5,188,454 $4,012,133 ($1,176,321)
PositionsParking Enterprise 8.50 8.50 8.50 8.50 0.00
Total 8.50 8.50 8.50 8.50 0.00
* 2017 Amended Budget as of 8/29/2017
Significant Changes vs. 2017
• Increase of over $132,000 in revenue, mainly due to credit card parking meters and increased projected usage at monthly garages
• Increase by $77,000 to fund increased contract costs
• Decrease of $1.3 million for CIP
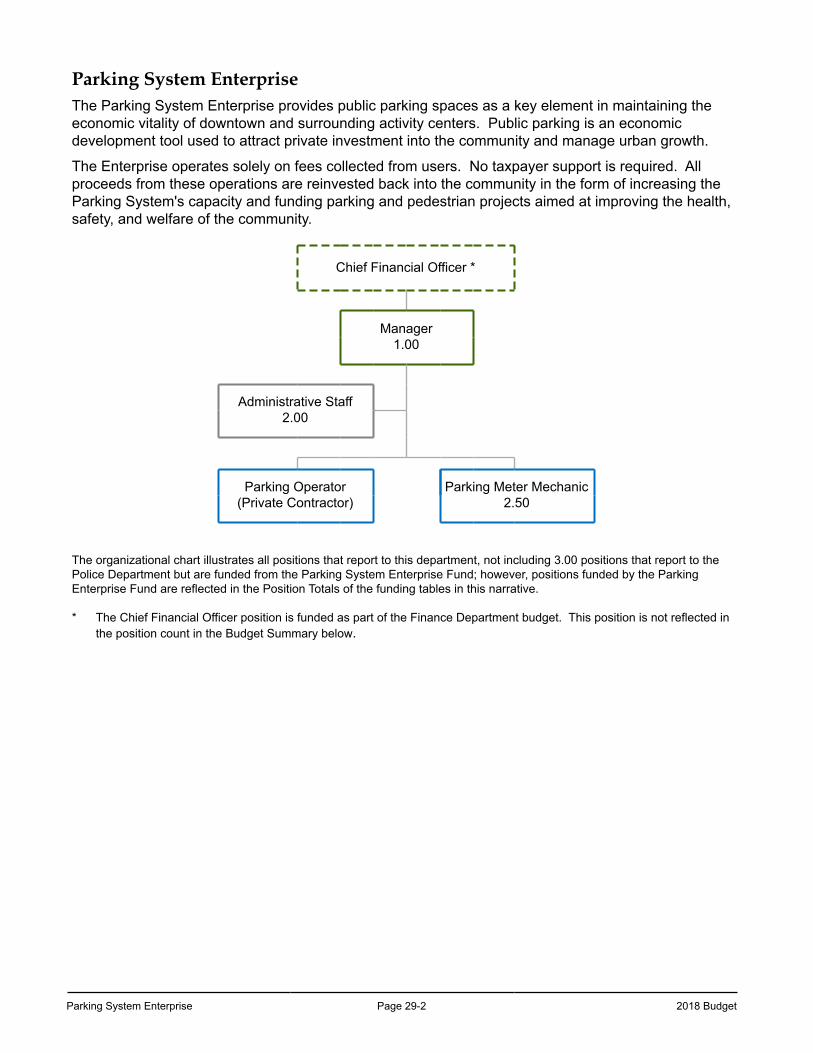
Parking System Enterprise Page 29-2 2018 Budget
Parking System EnterpriseThe Parking System Enterprise provides public parking spaces as a key element in maintaining the economic vitality of downtown and surrounding activity centers. Public parking is an economic development tool used to attract private investment into the community and manage urban growth.
The Enterprise operates solely on fees collected from users. No taxpayer support is required. All proceeds from these operations are reinvested back into the community in the form of increasing the Parking System's capacity and funding parking and pedestrian projects aimed at improving the health, safety, and welfare of the community.
Chief Financial Officer *
Manager1.00
Administrative Staff 2.00
Parking Operator(Private Contractor)
Parking Meter Mechanic2.50
The organizational chart illustrates all positions that report to this department, not including 3.00 positions that report to the Police Department but are funded from the Parking System Enterprise Fund; however, positions funded by the Parking Enterprise Fund are reflected in the Position Totals of the funding tables in this narrative.
* The Chief Financial Officer position is funded as part of the Finance Department budget. This position is not reflected in the position count in the Budget Summary below.
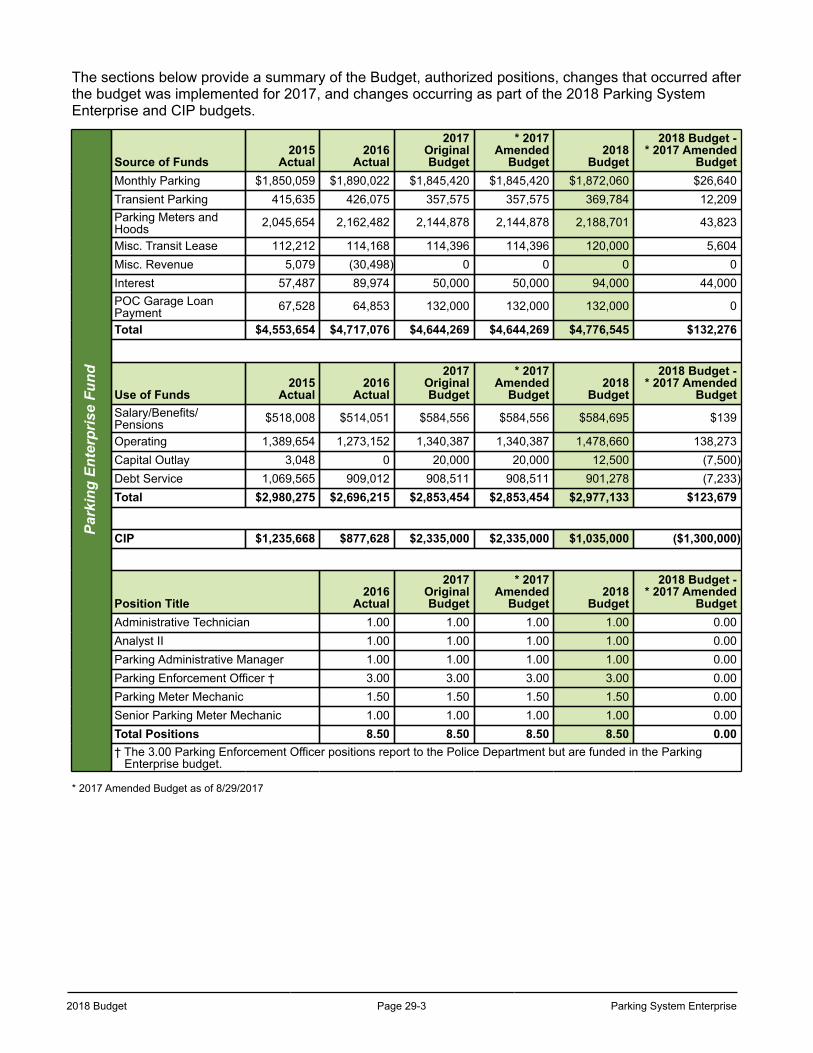
2018 Budget Page 29-3 Parking System Enterprise
The sections below provide a summary of the Budget, authorized positions, changes that occurred after the budget was implemented for 2017, and changes occurring as part of the 2018 Parking System Enterprise and CIP budgets.
Park
ing
Ente
rpris
e Fu
nd
Source of Funds2015
Actual2016
Actual
2017OriginalBudget
* 2017Amended
Budget2018
Budget
2018 Budget -* 2017 Amended
BudgetMonthly Parking $1,850,059 $1,890,022 $1,845,420 $1,845,420 $1,872,060 $26,640Transient Parking 415,635 426,075 357,575 357,575 369,784 12,209Parking Meters andHoods 2,045,654 2,162,482 2,144,878 2,144,878 2,188,701 43,823
Misc. Transit Lease 112,212 114,168 114,396 114,396 120,000 5,604Misc. Revenue 5,079 (30,498) 0 0 0 0Interest 57,487 89,974 50,000 50,000 94,000 44,000POC Garage LoanPayment 67,528 64,853 132,000 132,000 132,000 0
Total $4,553,654 $4,717,076 $4,644,269 $4,644,269 $4,776,545 $132,276
Use of Funds2015
Actual2016
Actual
2017OriginalBudget
* 2017Amended
Budget2018
Budget
2018 Budget -* 2017 Amended
BudgetSalary/Benefits/Pensions $518,008 $514,051 $584,556 $584,556 $584,695 $139
Operating 1,389,654 1,273,152 1,340,387 1,340,387 1,478,660 138,273Capital Outlay 3,048 0 20,000 20,000 12,500 (7,500)Debt Service 1,069,565 909,012 908,511 908,511 901,278 (7,233)Total $2,980,275 $2,696,215 $2,853,454 $2,853,454 $2,977,133 $123,679
CIP $1,235,668 $877,628 $2,335,000 $2,335,000 $1,035,000 ($1,300,000)
Position Title2016
Actual
2017OriginalBudget
* 2017Amended
Budget2018
Budget
2018 Budget -* 2017 Amended
BudgetAdministrative Technician 1.00 1.00 1.00 1.00 0.00Analyst II 1.00 1.00 1.00 1.00 0.00Parking Administrative Manager 1.00 1.00 1.00 1.00 0.00Parking Enforcement Officer † 3.00 3.00 3.00 3.00 0.00Parking Meter Mechanic 1.50 1.50 1.50 1.50 0.00Senior Parking Meter Mechanic 1.00 1.00 1.00 1.00 0.00Total Positions 8.50 8.50 8.50 8.50 0.00† The 3.00 Parking Enforcement Officer positions report to the Police Department but are funded in the Parking Enterprise budget.
* 2017 Amended Budget as of 8/29/2017
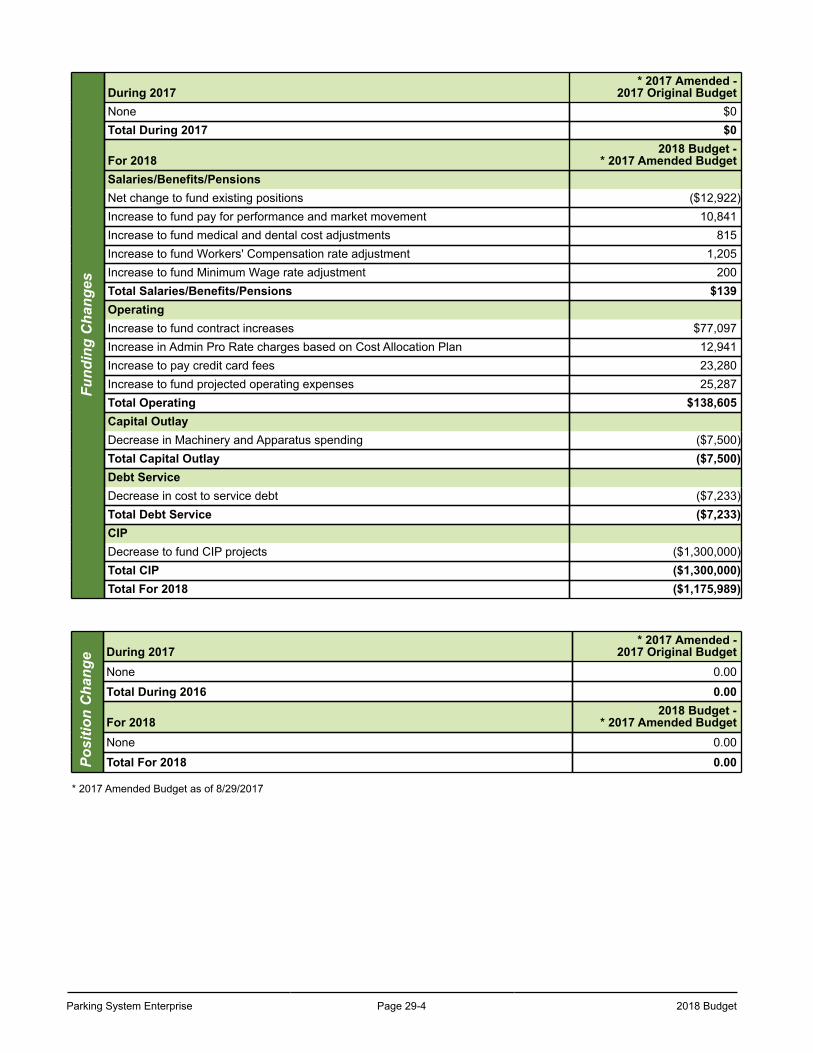
Parking System Enterprise Page 29-4 2018 Budget
Fund
ing
Cha
nges
During 2017* 2017 Amended -
2017 Original BudgetNone $0Total During 2017 $0
For 20182018 Budget -
* 2017 Amended BudgetSalaries/Benefits/PensionsNet change to fund existing positions ($12,922)Increase to fund pay for performance and market movement 10,841Increase to fund medical and dental cost adjustments 815Increase to fund Workers' Compensation rate adjustment 1,205Increase to fund Minimum Wage rate adjustment 200Total Salaries/Benefits/Pensions $139OperatingIncrease to fund contract increases $77,097Increase in Admin Pro Rate charges based on Cost Allocation Plan 12,941Increase to pay credit card fees 23,280Increase to fund projected operating expenses 25,287Total Operating $138,605Capital OutlayDecrease in Machinery and Apparatus spending ($7,500)Total Capital Outlay ($7,500)Debt ServiceDecrease in cost to service debt ($7,233)Total Debt Service ($7,233)CIPDecrease to fund CIP projects ($1,300,000)Total CIP ($1,300,000)Total For 2018 ($1,175,989)
Posi
tion
Cha
nge During 2017
* 2017 Amended -2017 Original Budget
None 0.00
Total During 2016 0.00
For 20182018 Budget -
* 2017 Amended BudgetNone 0.00
Total For 2018 0.00
* 2017 Amended Budget as of 8/29/2017
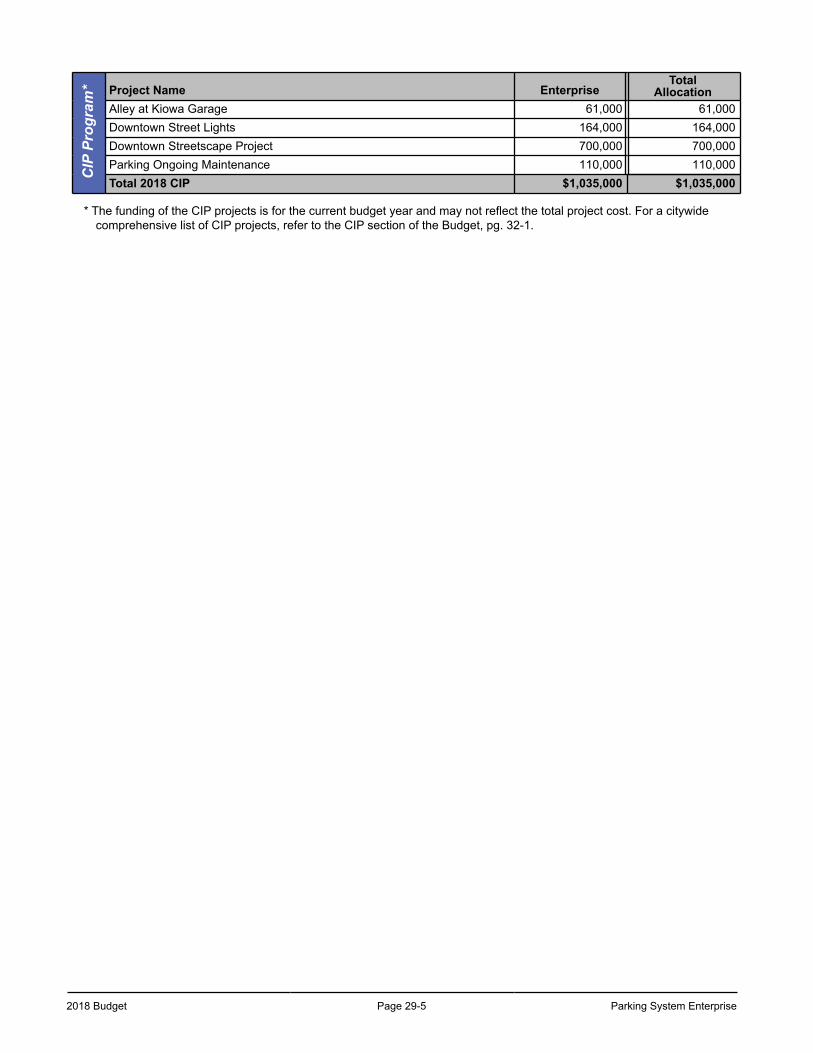
2018 Budget Page 29-5 Parking System Enterprise
CIP
Pro
gram
* Project Name EnterpriseTotal
AllocationAlley at Kiowa Garage 61,000 61,000Downtown Street Lights 164,000 164,000Downtown Streetscape Project 700,000 700,000Parking Ongoing Maintenance 110,000 110,000Total 2018 CIP $1,035,000 $1,035,000
* The funding of the CIP projects is for the current budget year and may not reflect the total project cost. For a citywide comprehensive list of CIP projects, refer to the CIP section of the Budget, pg. 32-1.
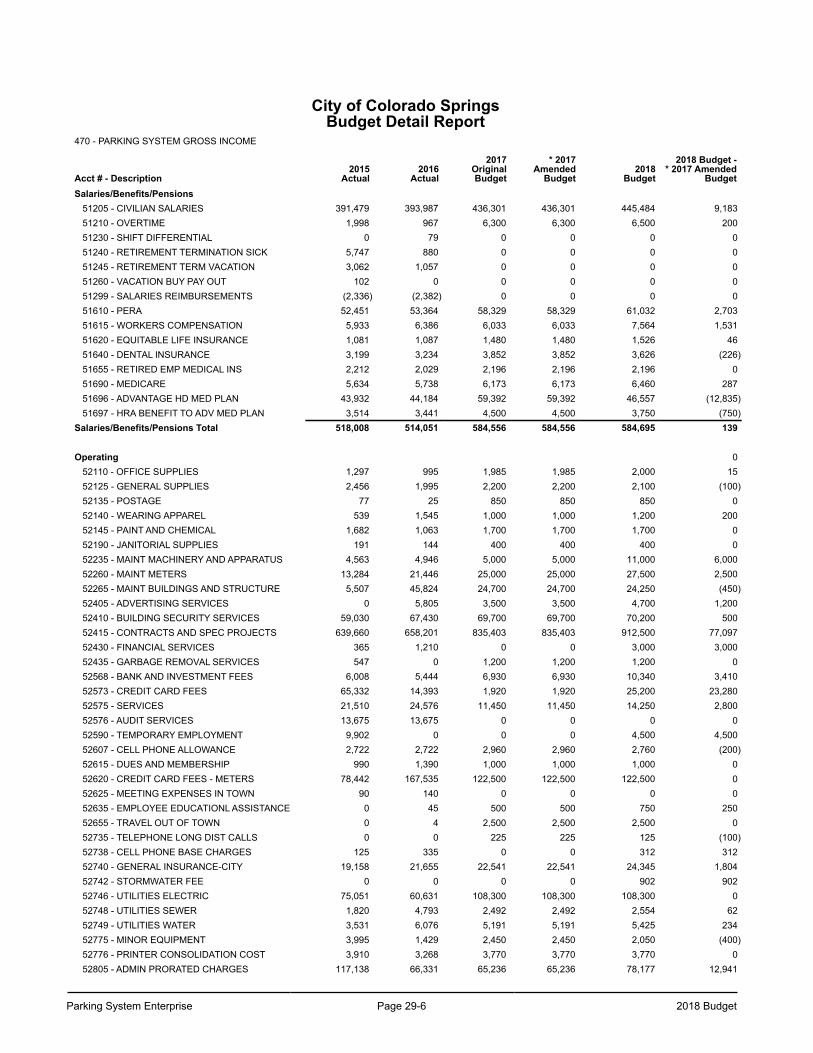
Parking System Enterprise Page 29-6 2018 Budget
City of Colorado SpringsBudget Detail Report
470 - PARKING SYSTEM GROSS INCOME
Acct # - Description2015
Actual2016
Actual
2017OriginalBudget
* 2017Amended
Budget2018
Budget
2018 Budget -* 2017 Amended
BudgetSalaries/Benefits/Pensions
51205 - CIVILIAN SALARIES 391,479 393,987 436,301 436,301 445,484 9,18351210 - OVERTIME 1,998 967 6,300 6,300 6,500 20051230 - SHIFT DIFFERENTIAL 0 79 0 0 0 051240 - RETIREMENT TERMINATION SICK 5,747 880 0 0 0 051245 - RETIREMENT TERM VACATION 3,062 1,057 0 0 0 051260 - VACATION BUY PAY OUT 102 0 0 0 0 051299 - SALARIES REIMBURSEMENTS (2,336) (2,382) 0 0 0 051610 - PERA 52,451 53,364 58,329 58,329 61,032 2,70351615 - WORKERS COMPENSATION 5,933 6,386 6,033 6,033 7,564 1,53151620 - EQUITABLE LIFE INSURANCE 1,081 1,087 1,480 1,480 1,526 4651640 - DENTAL INSURANCE 3,199 3,234 3,852 3,852 3,626 (226)51655 - RETIRED EMP MEDICAL INS 2,212 2,029 2,196 2,196 2,196 051690 - MEDICARE 5,634 5,738 6,173 6,173 6,460 28751696 - ADVANTAGE HD MED PLAN 43,932 44,184 59,392 59,392 46,557 (12,835)51697 - HRA BENEFIT TO ADV MED PLAN 3,514 3,441 4,500 4,500 3,750 (750)
Salaries/Benefits/Pensions Total 518,008 514,051 584,556 584,556 584,695 139
Operating 052110 - OFFICE SUPPLIES 1,297 995 1,985 1,985 2,000 1552125 - GENERAL SUPPLIES 2,456 1,995 2,200 2,200 2,100 (100)52135 - POSTAGE 77 25 850 850 850 052140 - WEARING APPAREL 539 1,545 1,000 1,000 1,200 20052145 - PAINT AND CHEMICAL 1,682 1,063 1,700 1,700 1,700 052190 - JANITORIAL SUPPLIES 191 144 400 400 400 052235 - MAINT MACHINERY AND APPARATUS 4,563 4,946 5,000 5,000 11,000 6,00052260 - MAINT METERS 13,284 21,446 25,000 25,000 27,500 2,50052265 - MAINT BUILDINGS AND STRUCTURE 5,507 45,824 24,700 24,700 24,250 (450)52405 - ADVERTISING SERVICES 0 5,805 3,500 3,500 4,700 1,20052410 - BUILDING SECURITY SERVICES 59,030 67,430 69,700 69,700 70,200 50052415 - CONTRACTS AND SPEC PROJECTS 639,660 658,201 835,403 835,403 912,500 77,09752430 - FINANCIAL SERVICES 365 1,210 0 0 3,000 3,00052435 - GARBAGE REMOVAL SERVICES 547 0 1,200 1,200 1,200 052568 - BANK AND INVESTMENT FEES 6,008 5,444 6,930 6,930 10,340 3,41052573 - CREDIT CARD FEES 65,332 14,393 1,920 1,920 25,200 23,28052575 - SERVICES 21,510 24,576 11,450 11,450 14,250 2,80052576 - AUDIT SERVICES 13,675 13,675 0 0 0 052590 - TEMPORARY EMPLOYMENT 9,902 0 0 0 4,500 4,50052607 - CELL PHONE ALLOWANCE 2,722 2,722 2,960 2,960 2,760 (200)52615 - DUES AND MEMBERSHIP 990 1,390 1,000 1,000 1,000 052620 - CREDIT CARD FEES - METERS 78,442 167,535 122,500 122,500 122,500 052625 - MEETING EXPENSES IN TOWN 90 140 0 0 0 052635 - EMPLOYEE EDUCATIONL ASSISTANCE 0 45 500 500 750 25052655 - TRAVEL OUT OF TOWN 0 4 2,500 2,500 2,500 052735 - TELEPHONE LONG DIST CALLS 0 0 225 225 125 (100)52738 - CELL PHONE BASE CHARGES 125 335 0 0 312 31252740 - GENERAL INSURANCE-CITY 19,158 21,655 22,541 22,541 24,345 1,80452742 - STORMWATER FEE 0 0 0 0 902 90252746 - UTILITIES ELECTRIC 75,051 60,631 108,300 108,300 108,300 052748 - UTILITIES SEWER 1,820 4,793 2,492 2,492 2,554 6252749 - UTILITIES WATER 3,531 6,076 5,191 5,191 5,425 23452775 - MINOR EQUIPMENT 3,995 1,429 2,450 2,450 2,050 (400)52776 - PRINTER CONSOLIDATION COST 3,910 3,268 3,770 3,770 3,770 052805 - ADMIN PRORATED CHARGES 117,138 66,331 65,236 65,236 78,177 12,941
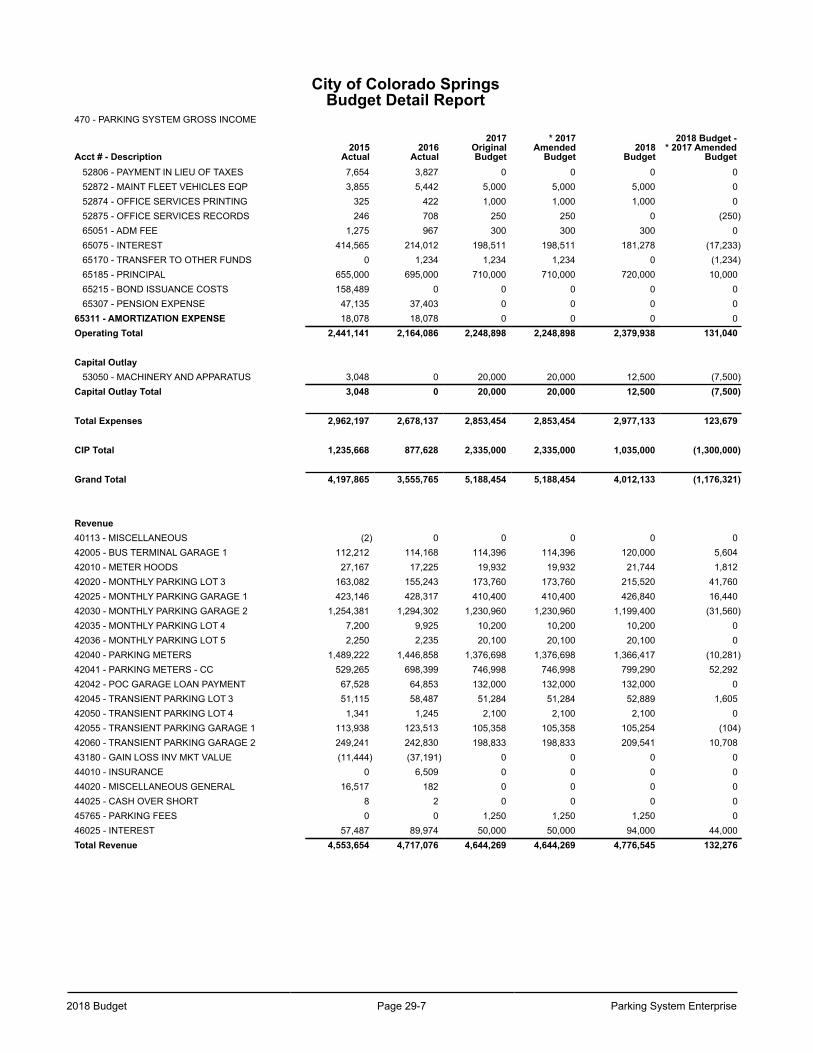
2018 Budget Page 29-7 Parking System Enterprise
City of Colorado SpringsBudget Detail Report
470 - PARKING SYSTEM GROSS INCOME
Acct # - Description2015
Actual2016
Actual
2017OriginalBudget
* 2017Amended
Budget2018
Budget
2018 Budget -* 2017 Amended
Budget52806 - PAYMENT IN LIEU OF TAXES 7,654 3,827 0 0 0 052872 - MAINT FLEET VEHICLES EQP 3,855 5,442 5,000 5,000 5,000 052874 - OFFICE SERVICES PRINTING 325 422 1,000 1,000 1,000 052875 - OFFICE SERVICES RECORDS 246 708 250 250 0 (250)65051 - ADM FEE 1,275 967 300 300 300 065075 - INTEREST 414,565 214,012 198,511 198,511 181,278 (17,233)65170 - TRANSFER TO OTHER FUNDS 0 1,234 1,234 1,234 0 (1,234)65185 - PRINCIPAL 655,000 695,000 710,000 710,000 720,000 10,00065215 - BOND ISSUANCE COSTS 158,489 0 0 0 0 065307 - PENSION EXPENSE 47,135 37,403 0 0 0 0
65311 - AMORTIZATION EXPENSE 18,078 18,078 0 0 0 0Operating Total 2,441,141 2,164,086 2,248,898 2,248,898 2,379,938 131,040
Capital Outlay53050 - MACHINERY AND APPARATUS 3,048 0 20,000 20,000 12,500 (7,500)
Capital Outlay Total 3,048 0 20,000 20,000 12,500 (7,500)
Total Expenses 2,962,197 2,678,137 2,853,454 2,853,454 2,977,133 123,679
CIP Total 1,235,668 877,628 2,335,000 2,335,000 1,035,000 (1,300,000)
Grand Total 4,197,865 3,555,765 5,188,454 5,188,454 4,012,133 (1,176,321)
Revenue40113 - MISCELLANEOUS (2) 0 0 0 0 042005 - BUS TERMINAL GARAGE 1 112,212 114,168 114,396 114,396 120,000 5,60442010 - METER HOODS 27,167 17,225 19,932 19,932 21,744 1,81242020 - MONTHLY PARKING LOT 3 163,082 155,243 173,760 173,760 215,520 41,76042025 - MONTHLY PARKING GARAGE 1 423,146 428,317 410,400 410,400 426,840 16,44042030 - MONTHLY PARKING GARAGE 2 1,254,381 1,294,302 1,230,960 1,230,960 1,199,400 (31,560)42035 - MONTHLY PARKING LOT 4 7,200 9,925 10,200 10,200 10,200 042036 - MONTHLY PARKING LOT 5 2,250 2,235 20,100 20,100 20,100 042040 - PARKING METERS 1,489,222 1,446,858 1,376,698 1,376,698 1,366,417 (10,281)42041 - PARKING METERS - CC 529,265 698,399 746,998 746,998 799,290 52,29242042 - POC GARAGE LOAN PAYMENT 67,528 64,853 132,000 132,000 132,000 042045 - TRANSIENT PARKING LOT 3 51,115 58,487 51,284 51,284 52,889 1,60542050 - TRANSIENT PARKING LOT 4 1,341 1,245 2,100 2,100 2,100 042055 - TRANSIENT PARKING GARAGE 1 113,938 123,513 105,358 105,358 105,254 (104)42060 - TRANSIENT PARKING GARAGE 2 249,241 242,830 198,833 198,833 209,541 10,70843180 - GAIN LOSS INV MKT VALUE (11,444) (37,191) 0 0 0 044010 - INSURANCE 0 6,509 0 0 0 044020 - MISCELLANEOUS GENERAL 16,517 182 0 0 0 044025 - CASH OVER SHORT 8 2 0 0 0 045765 - PARKING FEES 0 0 1,250 1,250 1,250 046025 - INTEREST 57,487 89,974 50,000 50,000 94,000 44,000Total Revenue 4,553,654 4,717,076 4,644,269 4,644,269 4,776,545 132,276

Parking System Enterprise Page 29-8 2018 Budget
This page left blank intentionally.
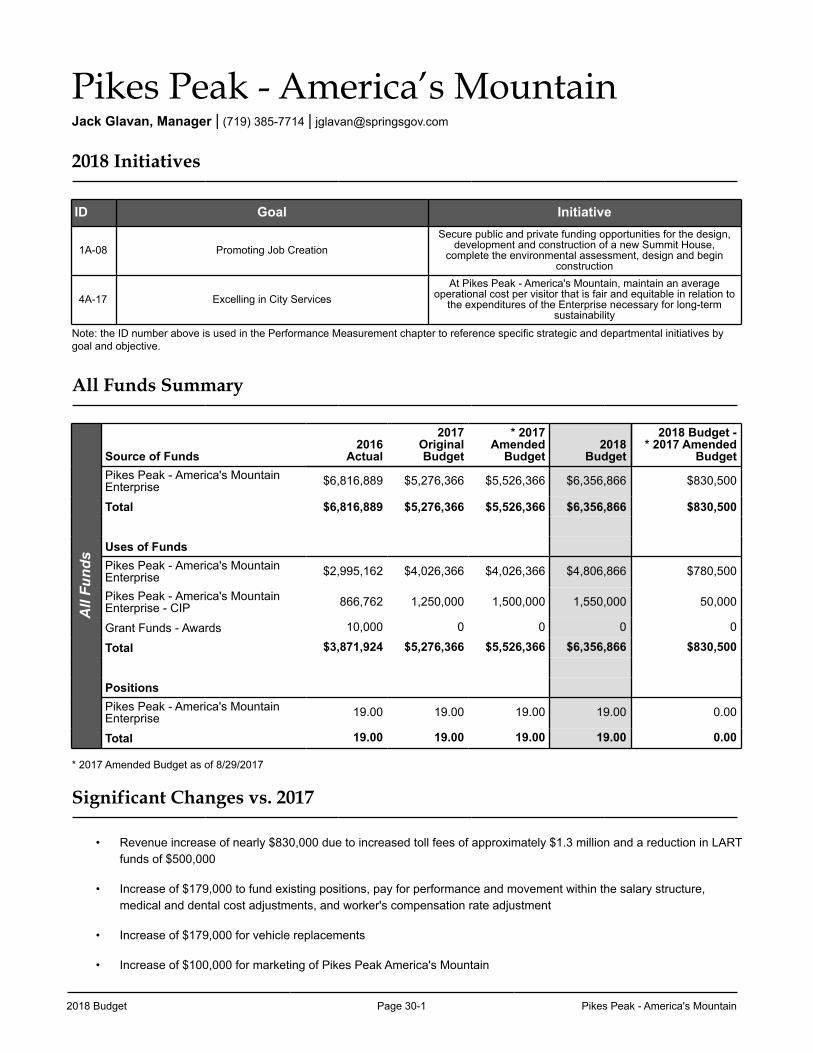
2018 Budget Page 30-1 Pikes Peak - America's Mountain
Pikes Peak - America’s MountainJack Glavan, Manager | (719) 385-7714 | [email protected]
2018 Initiatives
ID Goal Initiative
1A-08 Promoting Job CreationSecure public and private funding opportunities for the design,
development and construction of a new Summit House, complete the environmental assessment, design and begin
construction
4A-17 Excelling in City ServicesAt Pikes Peak - America's Mountain, maintain an average
operational cost per visitor that is fair and equitable in relation to the expenditures of the Enterprise necessary for long-term
sustainability
Note: the ID number above is used in the Performance Measurement chapter to reference specific strategic and departmental initiatives by goal and objective.
All Funds Summary
All
Fund
s
Source of Funds2016
Actual
2017OriginalBudget
* 2017Amended
Budget2018
Budget
2018 Budget -* 2017 Amended
BudgetPikes Peak - America's MountainEnterprise $6,816,889 $5,276,366 $5,526,366 $6,356,866 $830,500
Total $6,816,889 $5,276,366 $5,526,366 $6,356,866 $830,500
Uses of FundsPikes Peak - America's MountainEnterprise $2,995,162 $4,026,366 $4,026,366 $4,806,866 $780,500
Pikes Peak - America's MountainEnterprise - CIP 866,762 1,250,000 1,500,000 1,550,000 50,000
Grant Funds - Awards 10,000 0 0 0 0
Total $3,871,924 $5,276,366 $5,526,366 $6,356,866 $830,500
PositionsPikes Peak - America's MountainEnterprise 19.00 19.00 19.00 19.00 0.00
Total 19.00 19.00 19.00 19.00 0.00
* 2017 Amended Budget as of 8/29/2017
Significant Changes vs. 2017
• Revenue increase of nearly $830,000 due to increased toll fees of approximately $1.3 million and a reduction in LART funds of $500,000
• Increase of $179,000 to fund existing positions, pay for performance and movement within the salary structure, medical and dental cost adjustments, and worker's compensation rate adjustment
• Increase of $179,000 for vehicle replacements
• Increase of $100,000 for marketing of Pikes Peak America's Mountain
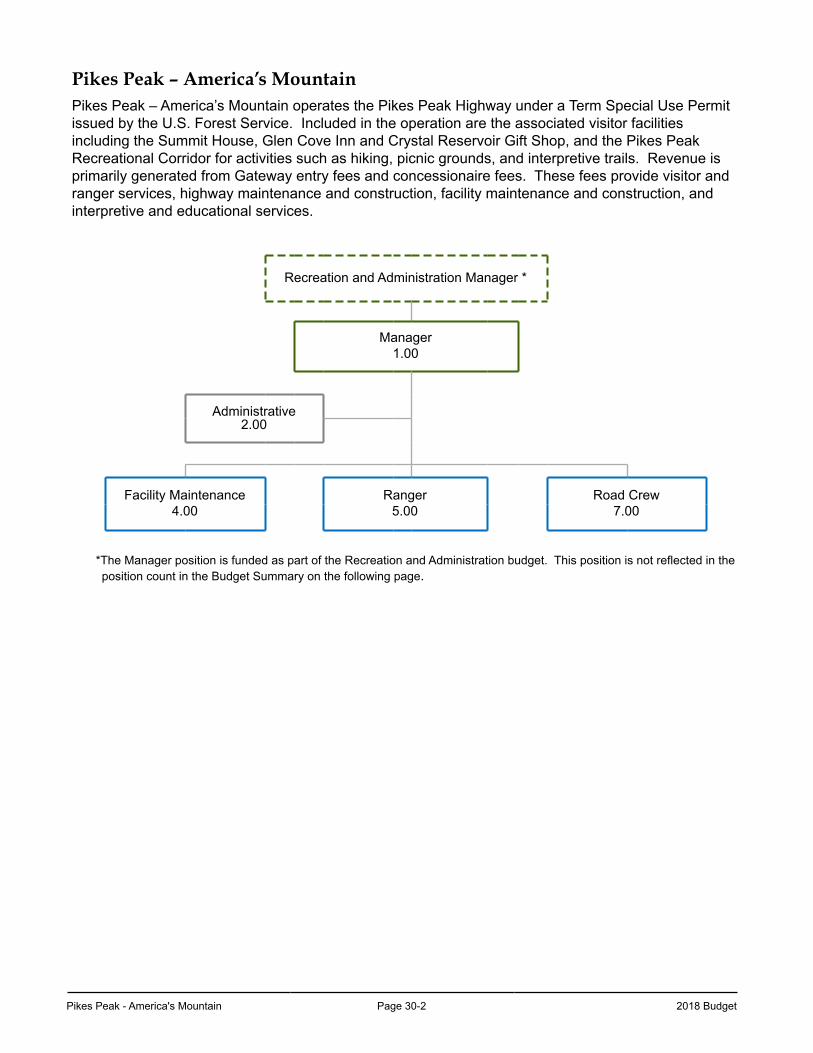
Pikes Peak - America's Mountain Page 30-2 2018 Budget
Pikes Peak – America’s MountainPikes Peak – America’s Mountain operates the Pikes Peak Highway under a Term Special Use Permit issued by the U.S. Forest Service. Included in the operation are the associated visitor facilities including the Summit House, Glen Cove Inn and Crystal Reservoir Gift Shop, and the Pikes Peak Recreational Corridor for activities such as hiking, picnic grounds, and interpretive trails. Revenue is primarily generated from Gateway entry fees and concessionaire fees. These fees provide visitor and ranger services, highway maintenance and construction, facility maintenance and construction, and interpretive and educational services.
Recreation and Administration Manager *
Manager1.00
Administrative2.00
Facility Maintenance4.00
Ranger5.00
Road Crew7.00
*The Manager position is funded as part of the Recreation and Administration budget. This position is not reflected in the position count in the Budget Summary on the following page.
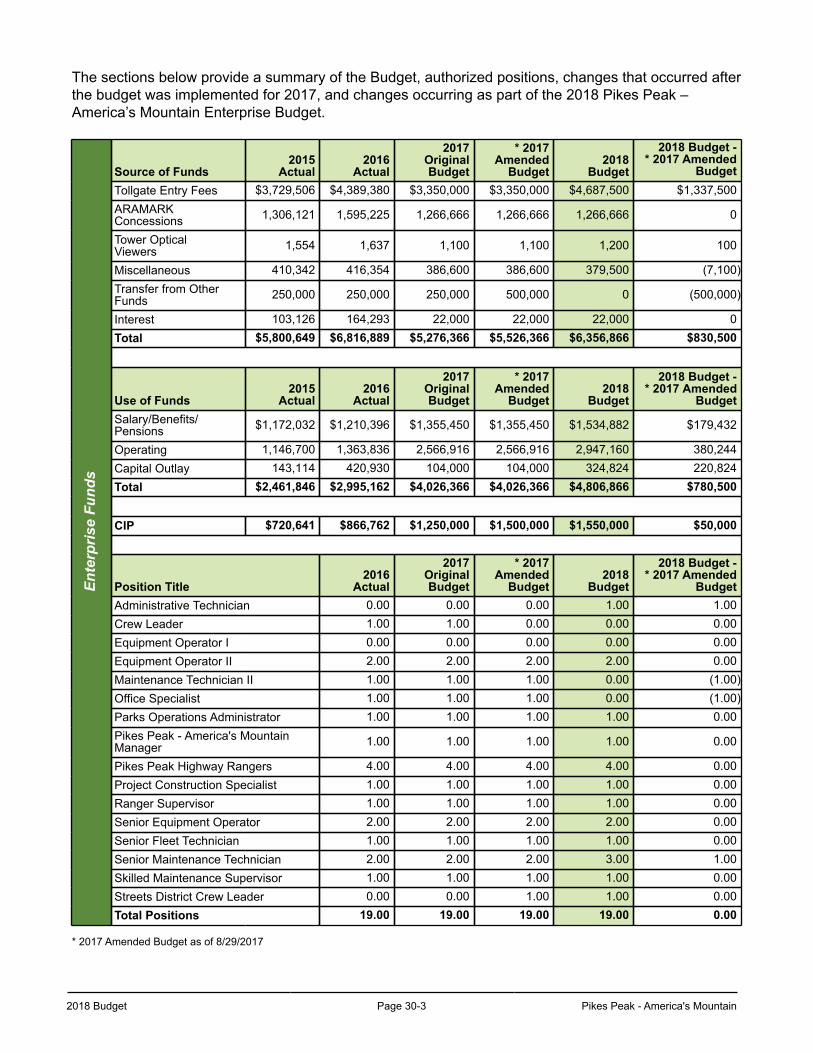
2018 Budget Page 30-3 Pikes Peak - America's Mountain
The sections below provide a summary of the Budget, authorized positions, changes that occurred after the budget was implemented for 2017, and changes occurring as part of the 2018 Pikes Peak – America’s Mountain Enterprise Budget.
Ente
rpris
e Fu
nds
Source of Funds2015
Actual2016
Actual
2017OriginalBudget
* 2017Amended
Budget2018
Budget
2018 Budget -* 2017 Amended
BudgetTollgate Entry Fees $3,729,506 $4,389,380 $3,350,000 $3,350,000 $4,687,500 $1,337,500ARAMARKConcessions 1,306,121 1,595,225 1,266,666 1,266,666 1,266,666 0
Tower OpticalViewers 1,554 1,637 1,100 1,100 1,200 100
Miscellaneous 410,342 416,354 386,600 386,600 379,500 (7,100)Transfer from OtherFunds 250,000 250,000 250,000 500,000 0 (500,000)
Interest 103,126 164,293 22,000 22,000 22,000 0Total $5,800,649 $6,816,889 $5,276,366 $5,526,366 $6,356,866 $830,500
Use of Funds2015
Actual2016
Actual
2017OriginalBudget
* 2017Amended
Budget2018
Budget
2018 Budget -* 2017 Amended
BudgetSalary/Benefits/Pensions $1,172,032 $1,210,396 $1,355,450 $1,355,450 $1,534,882 $179,432
Operating 1,146,700 1,363,836 2,566,916 2,566,916 2,947,160 380,244Capital Outlay 143,114 420,930 104,000 104,000 324,824 220,824Total $2,461,846 $2,995,162 $4,026,366 $4,026,366 $4,806,866 $780,500
CIP $720,641 $866,762 $1,250,000 $1,500,000 $1,550,000 $50,000
Position Title2016
Actual
2017OriginalBudget
* 2017Amended
Budget2018
Budget
2018 Budget -* 2017 Amended
BudgetAdministrative Technician 0.00 0.00 0.00 1.00 1.00Crew Leader 1.00 1.00 0.00 0.00 0.00Equipment Operator I 0.00 0.00 0.00 0.00 0.00Equipment Operator II 2.00 2.00 2.00 2.00 0.00Maintenance Technician II 1.00 1.00 1.00 0.00 (1.00)Office Specialist 1.00 1.00 1.00 0.00 (1.00)Parks Operations Administrator 1.00 1.00 1.00 1.00 0.00Pikes Peak - America's MountainManager 1.00 1.00 1.00 1.00 0.00
Pikes Peak Highway Rangers 4.00 4.00 4.00 4.00 0.00Project Construction Specialist 1.00 1.00 1.00 1.00 0.00Ranger Supervisor 1.00 1.00 1.00 1.00 0.00Senior Equipment Operator 2.00 2.00 2.00 2.00 0.00Senior Fleet Technician 1.00 1.00 1.00 1.00 0.00Senior Maintenance Technician 2.00 2.00 2.00 3.00 1.00Skilled Maintenance Supervisor 1.00 1.00 1.00 1.00 0.00Streets District Crew Leader 0.00 0.00 1.00 1.00 0.00Total Positions 19.00 19.00 19.00 19.00 0.00
* 2017 Amended Budget as of 8/29/2017
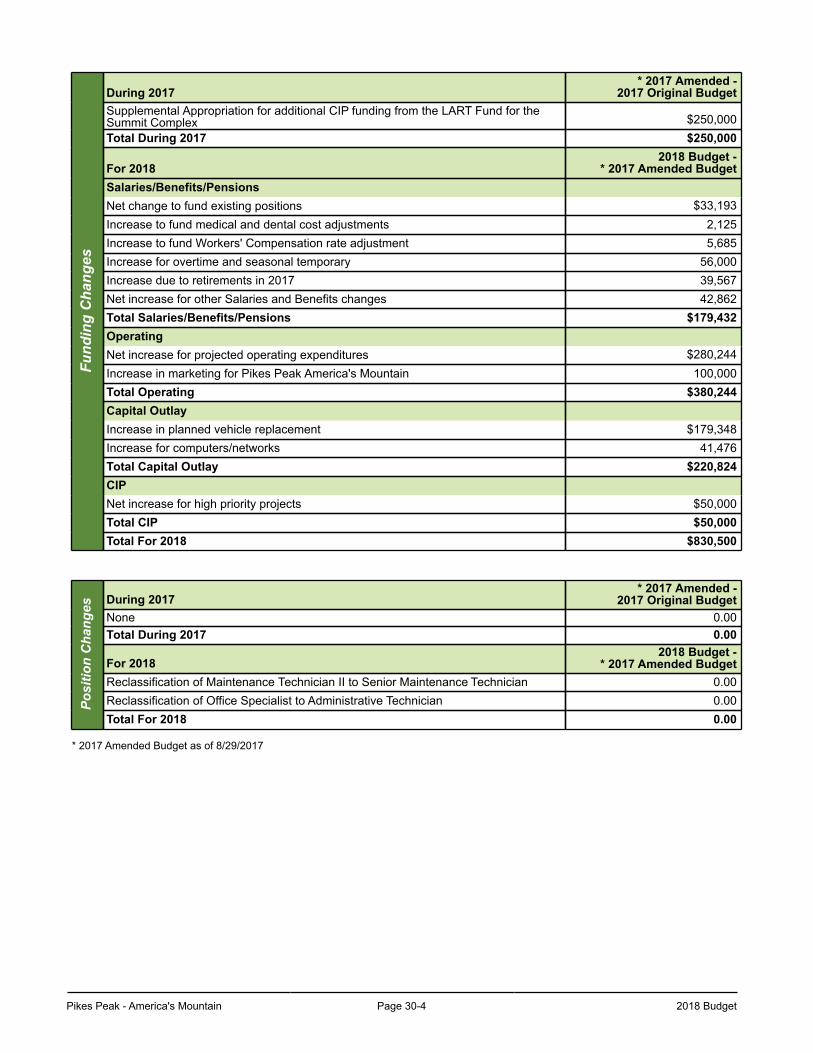
Pikes Peak - America's Mountain Page 30-4 2018 Budget
Fund
ing
Cha
nges
During 2017* 2017 Amended -
2017 Original BudgetSupplemental Appropriation for additional CIP funding from the LART Fund for theSummit Complex $250,000Total During 2017 $250,000
For 20182018 Budget -
* 2017 Amended BudgetSalaries/Benefits/PensionsNet change to fund existing positions $33,193Increase to fund medical and dental cost adjustments 2,125Increase to fund Workers' Compensation rate adjustment 5,685Increase for overtime and seasonal temporary 56,000Increase due to retirements in 2017 39,567Net increase for other Salaries and Benefits changes 42,862Total Salaries/Benefits/Pensions $179,432OperatingNet increase for projected operating expenditures $280,244Increase in marketing for Pikes Peak America's Mountain 100,000Total Operating $380,244Capital OutlayIncrease in planned vehicle replacement $179,348Increase for computers/networks 41,476Total Capital Outlay $220,824CIPNet increase for high priority projects $50,000Total CIP $50,000Total For 2018 $830,500
Posi
tion
Cha
nges During 2017
* 2017 Amended -2017 Original Budget
None 0.00Total During 2017 0.00
For 20182018 Budget -
* 2017 Amended BudgetReclassification of Maintenance Technician II to Senior Maintenance Technician 0.00Reclassification of Office Specialist to Administrative Technician 0.00Total For 2018 0.00
* 2017 Amended Budget as of 8/29/2017
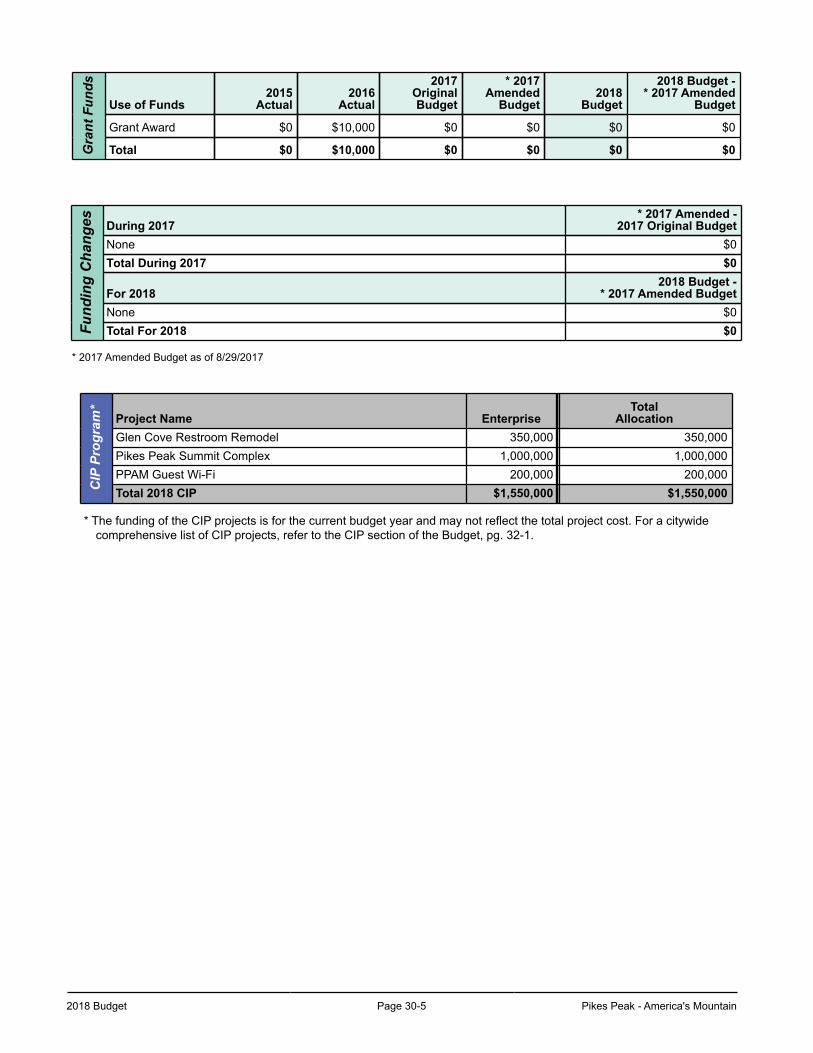
2018 Budget Page 30-5 Pikes Peak - America's Mountain
Gra
nt F
unds
Use of Funds2015
Actual2016
Actual
2017OriginalBudget
* 2017Amended
Budget2018
Budget
2018 Budget -* 2017 Amended
Budget
Grant Award $0 $10,000 $0 $0 $0 $0
Total $0 $10,000 $0 $0 $0 $0
Fund
ing
Cha
nges During 2017
* 2017 Amended -2017 Original Budget
None $0Total During 2017 $0
For 20182018 Budget -
* 2017 Amended BudgetNone $0Total For 2018 $0
* 2017 Amended Budget as of 8/29/2017
CIP
Pro
gram
*
Project Name EnterpriseTotal
AllocationGlen Cove Restroom Remodel 350,000 350,000Pikes Peak Summit Complex 1,000,000 1,000,000PPAM Guest Wi-Fi 200,000 200,000Total 2018 CIP $1,550,000 $1,550,000
* The funding of the CIP projects is for the current budget year and may not reflect the total project cost. For a citywide comprehensive list of CIP projects, refer to the CIP section of the Budget, pg. 32-1.
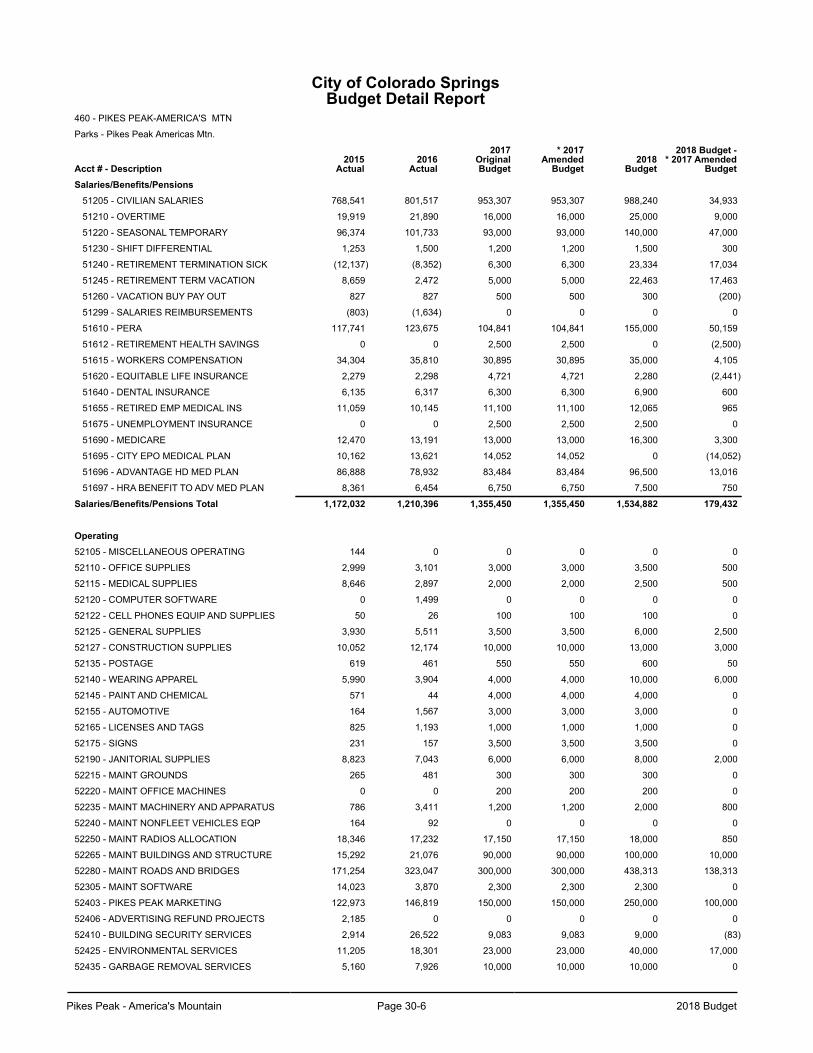
Pikes Peak - America's Mountain Page 30-6 2018 Budget
City of Colorado SpringsBudget Detail Report
460 - PIKES PEAK-AMERICA'S MTN
Parks - Pikes Peak Americas Mtn.
Acct # - Description2015
Actual2016
Actual
2017OriginalBudget
* 2017Amended
Budget2018
Budget
2018 Budget -* 2017 Amended
BudgetSalaries/Benefits/Pensions
51205 - CIVILIAN SALARIES 768,541 801,517 953,307 953,307 988,240 34,933
51210 - OVERTIME 19,919 21,890 16,000 16,000 25,000 9,000
51220 - SEASONAL TEMPORARY 96,374 101,733 93,000 93,000 140,000 47,000
51230 - SHIFT DIFFERENTIAL 1,253 1,500 1,200 1,200 1,500 300
51240 - RETIREMENT TERMINATION SICK (12,137) (8,352) 6,300 6,300 23,334 17,034
51245 - RETIREMENT TERM VACATION 8,659 2,472 5,000 5,000 22,463 17,463
51260 - VACATION BUY PAY OUT 827 827 500 500 300 (200)
51299 - SALARIES REIMBURSEMENTS (803) (1,634) 0 0 0 0
51610 - PERA 117,741 123,675 104,841 104,841 155,000 50,159
51612 - RETIREMENT HEALTH SAVINGS 0 0 2,500 2,500 0 (2,500)
51615 - WORKERS COMPENSATION 34,304 35,810 30,895 30,895 35,000 4,105
51620 - EQUITABLE LIFE INSURANCE 2,279 2,298 4,721 4,721 2,280 (2,441)
51640 - DENTAL INSURANCE 6,135 6,317 6,300 6,300 6,900 600
51655 - RETIRED EMP MEDICAL INS 11,059 10,145 11,100 11,100 12,065 965
51675 - UNEMPLOYMENT INSURANCE 0 0 2,500 2,500 2,500 0
51690 - MEDICARE 12,470 13,191 13,000 13,000 16,300 3,300
51695 - CITY EPO MEDICAL PLAN 10,162 13,621 14,052 14,052 0 (14,052)
51696 - ADVANTAGE HD MED PLAN 86,888 78,932 83,484 83,484 96,500 13,016
51697 - HRA BENEFIT TO ADV MED PLAN 8,361 6,454 6,750 6,750 7,500 750
Salaries/Benefits/Pensions Total 1,172,032 1,210,396 1,355,450 1,355,450 1,534,882 179,432
Operating52105 - MISCELLANEOUS OPERATING 144 0 0 0 0 0
52110 - OFFICE SUPPLIES 2,999 3,101 3,000 3,000 3,500 500
52115 - MEDICAL SUPPLIES 8,646 2,897 2,000 2,000 2,500 500
52120 - COMPUTER SOFTWARE 0 1,499 0 0 0 0
52122 - CELL PHONES EQUIP AND SUPPLIES 50 26 100 100 100 0
52125 - GENERAL SUPPLIES 3,930 5,511 3,500 3,500 6,000 2,500
52127 - CONSTRUCTION SUPPLIES 10,052 12,174 10,000 10,000 13,000 3,000
52135 - POSTAGE 619 461 550 550 600 50
52140 - WEARING APPAREL 5,990 3,904 4,000 4,000 10,000 6,000
52145 - PAINT AND CHEMICAL 571 44 4,000 4,000 4,000 0
52155 - AUTOMOTIVE 164 1,567 3,000 3,000 3,000 0
52165 - LICENSES AND TAGS 825 1,193 1,000 1,000 1,000 0
52175 - SIGNS 231 157 3,500 3,500 3,500 0
52190 - JANITORIAL SUPPLIES 8,823 7,043 6,000 6,000 8,000 2,000
52215 - MAINT GROUNDS 265 481 300 300 300 0
52220 - MAINT OFFICE MACHINES 0 0 200 200 200 0
52235 - MAINT MACHINERY AND APPARATUS 786 3,411 1,200 1,200 2,000 800
52240 - MAINT NONFLEET VEHICLES EQP 164 92 0 0 0 0
52250 - MAINT RADIOS ALLOCATION 18,346 17,232 17,150 17,150 18,000 850
52265 - MAINT BUILDINGS AND STRUCTURE 15,292 21,076 90,000 90,000 100,000 10,000
52280 - MAINT ROADS AND BRIDGES 171,254 323,047 300,000 300,000 438,313 138,313
52305 - MAINT SOFTWARE 14,023 3,870 2,300 2,300 2,300 0
52403 - PIKES PEAK MARKETING 122,973 146,819 150,000 150,000 250,000 100,000
52406 - ADVERTISING REFUND PROJECTS 2,185 0 0 0 0 0
52410 - BUILDING SECURITY SERVICES 2,914 26,522 9,083 9,083 9,000 (83)
52425 - ENVIRONMENTAL SERVICES 11,205 18,301 23,000 23,000 40,000 17,000
52435 - GARBAGE REMOVAL SERVICES 5,160 7,926 10,000 10,000 10,000 0
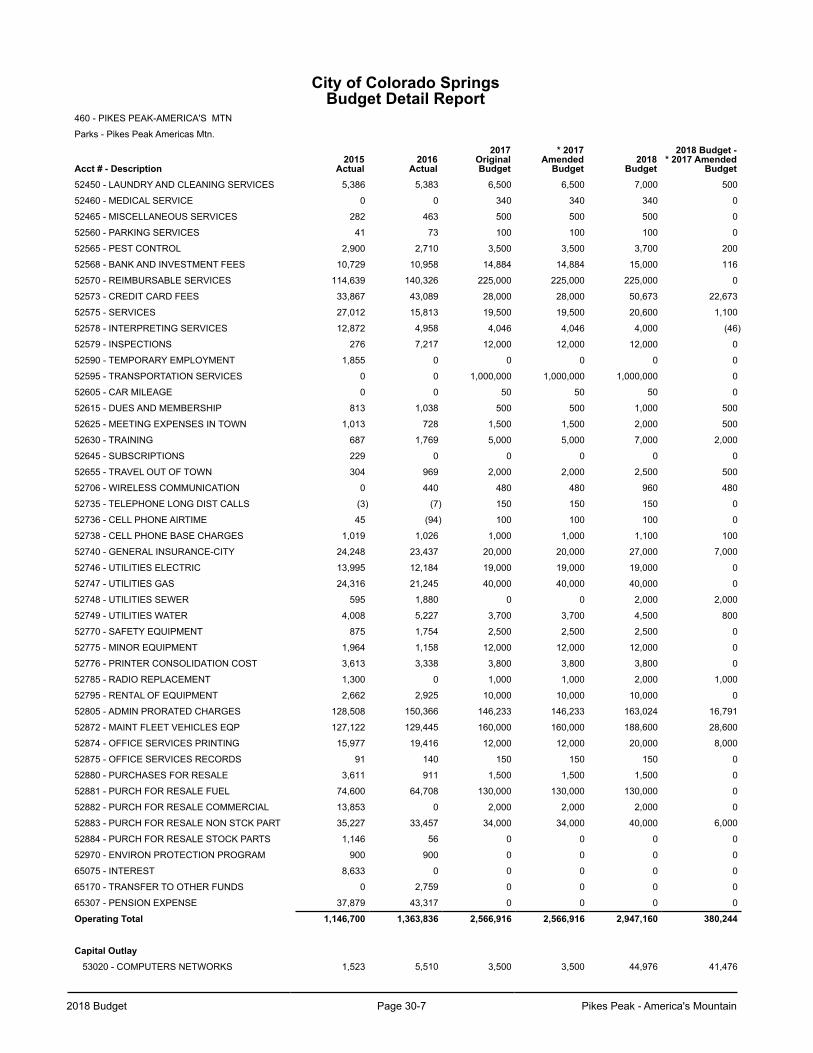
2018 Budget Page 30-7 Pikes Peak - America's Mountain
City of Colorado SpringsBudget Detail Report
460 - PIKES PEAK-AMERICA'S MTN
Parks - Pikes Peak Americas Mtn.
Acct # - Description2015
Actual2016
Actual
2017OriginalBudget
* 2017Amended
Budget2018
Budget
2018 Budget -* 2017 Amended
Budget52450 - LAUNDRY AND CLEANING SERVICES 5,386 5,383 6,500 6,500 7,000 500
52460 - MEDICAL SERVICE 0 0 340 340 340 0
52465 - MISCELLANEOUS SERVICES 282 463 500 500 500 0
52560 - PARKING SERVICES 41 73 100 100 100 0
52565 - PEST CONTROL 2,900 2,710 3,500 3,500 3,700 200
52568 - BANK AND INVESTMENT FEES 10,729 10,958 14,884 14,884 15,000 116
52570 - REIMBURSABLE SERVICES 114,639 140,326 225,000 225,000 225,000 0
52573 - CREDIT CARD FEES 33,867 43,089 28,000 28,000 50,673 22,673
52575 - SERVICES 27,012 15,813 19,500 19,500 20,600 1,100
52578 - INTERPRETING SERVICES 12,872 4,958 4,046 4,046 4,000 (46)
52579 - INSPECTIONS 276 7,217 12,000 12,000 12,000 0
52590 - TEMPORARY EMPLOYMENT 1,855 0 0 0 0 0
52595 - TRANSPORTATION SERVICES 0 0 1,000,000 1,000,000 1,000,000 0
52605 - CAR MILEAGE 0 0 50 50 50 0
52615 - DUES AND MEMBERSHIP 813 1,038 500 500 1,000 500
52625 - MEETING EXPENSES IN TOWN 1,013 728 1,500 1,500 2,000 500
52630 - TRAINING 687 1,769 5,000 5,000 7,000 2,000
52645 - SUBSCRIPTIONS 229 0 0 0 0 0
52655 - TRAVEL OUT OF TOWN 304 969 2,000 2,000 2,500 500
52706 - WIRELESS COMMUNICATION 0 440 480 480 960 480
52735 - TELEPHONE LONG DIST CALLS (3) (7) 150 150 150 0
52736 - CELL PHONE AIRTIME 45 (94) 100 100 100 0
52738 - CELL PHONE BASE CHARGES 1,019 1,026 1,000 1,000 1,100 100
52740 - GENERAL INSURANCE-CITY 24,248 23,437 20,000 20,000 27,000 7,000
52746 - UTILITIES ELECTRIC 13,995 12,184 19,000 19,000 19,000 0
52747 - UTILITIES GAS 24,316 21,245 40,000 40,000 40,000 0
52748 - UTILITIES SEWER 595 1,880 0 0 2,000 2,000
52749 - UTILITIES WATER 4,008 5,227 3,700 3,700 4,500 800
52770 - SAFETY EQUIPMENT 875 1,754 2,500 2,500 2,500 0
52775 - MINOR EQUIPMENT 1,964 1,158 12,000 12,000 12,000 0
52776 - PRINTER CONSOLIDATION COST 3,613 3,338 3,800 3,800 3,800 0
52785 - RADIO REPLACEMENT 1,300 0 1,000 1,000 2,000 1,000
52795 - RENTAL OF EQUIPMENT 2,662 2,925 10,000 10,000 10,000 0
52805 - ADMIN PRORATED CHARGES 128,508 150,366 146,233 146,233 163,024 16,791
52872 - MAINT FLEET VEHICLES EQP 127,122 129,445 160,000 160,000 188,600 28,600
52874 - OFFICE SERVICES PRINTING 15,977 19,416 12,000 12,000 20,000 8,000
52875 - OFFICE SERVICES RECORDS 91 140 150 150 150 0
52880 - PURCHASES FOR RESALE 3,611 911 1,500 1,500 1,500 0
52881 - PURCH FOR RESALE FUEL 74,600 64,708 130,000 130,000 130,000 0
52882 - PURCH FOR RESALE COMMERCIAL 13,853 0 2,000 2,000 2,000 0
52883 - PURCH FOR RESALE NON STCK PART 35,227 33,457 34,000 34,000 40,000 6,000
52884 - PURCH FOR RESALE STOCK PARTS 1,146 56 0 0 0 0
52970 - ENVIRON PROTECTION PROGRAM 900 900 0 0 0 0
65075 - INTEREST 8,633 0 0 0 0 0
65170 - TRANSFER TO OTHER FUNDS 0 2,759 0 0 0 0
65307 - PENSION EXPENSE 37,879 43,317 0 0 0 0
Operating Total 1,146,700 1,363,836 2,566,916 2,566,916 2,947,160 380,244
Capital Outlay53020 - COMPUTERS NETWORKS 1,523 5,510 3,500 3,500 44,976 41,476
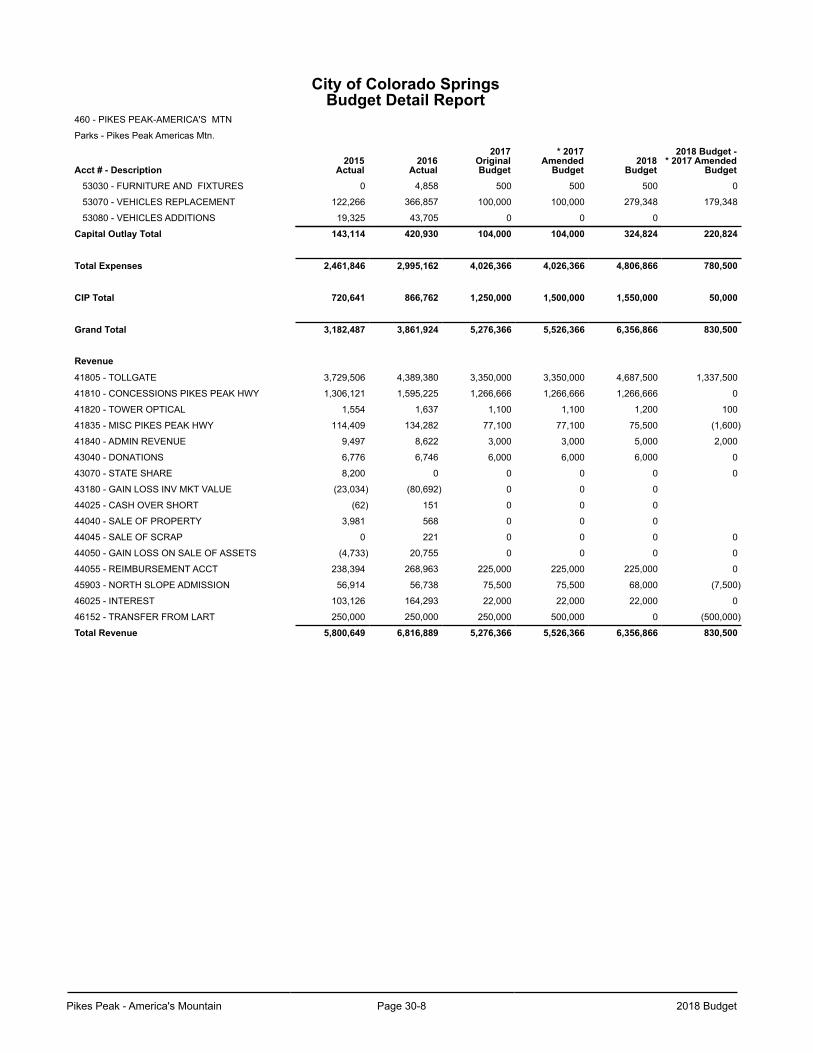
Pikes Peak - America's Mountain Page 30-8 2018 Budget
City of Colorado SpringsBudget Detail Report
460 - PIKES PEAK-AMERICA'S MTN
Parks - Pikes Peak Americas Mtn.
Acct # - Description2015
Actual2016
Actual
2017OriginalBudget
* 2017Amended
Budget2018
Budget
2018 Budget -* 2017 Amended
Budget53030 - FURNITURE AND FIXTURES 0 4,858 500 500 500 0
53070 - VEHICLES REPLACEMENT 122,266 366,857 100,000 100,000 279,348 179,348
53080 - VEHICLES ADDITIONS 19,325 43,705 0 0 0
Capital Outlay Total 143,114 420,930 104,000 104,000 324,824 220,824
Total Expenses 2,461,846 2,995,162 4,026,366 4,026,366 4,806,866 780,500
CIP Total 720,641 866,762 1,250,000 1,500,000 1,550,000 50,000
Grand Total 3,182,487 3,861,924 5,276,366 5,526,366 6,356,866 830,500
Revenue
41805 - TOLLGATE 3,729,506 4,389,380 3,350,000 3,350,000 4,687,500 1,337,500
41810 - CONCESSIONS PIKES PEAK HWY 1,306,121 1,595,225 1,266,666 1,266,666 1,266,666 0
41820 - TOWER OPTICAL 1,554 1,637 1,100 1,100 1,200 100
41835 - MISC PIKES PEAK HWY 114,409 134,282 77,100 77,100 75,500 (1,600)
41840 - ADMIN REVENUE 9,497 8,622 3,000 3,000 5,000 2,000
43040 - DONATIONS 6,776 6,746 6,000 6,000 6,000 0
43070 - STATE SHARE 8,200 0 0 0 0 0
43180 - GAIN LOSS INV MKT VALUE (23,034) (80,692) 0 0 0
44025 - CASH OVER SHORT (62) 151 0 0 0
44040 - SALE OF PROPERTY 3,981 568 0 0 0
44045 - SALE OF SCRAP 0 221 0 0 0 0
44050 - GAIN LOSS ON SALE OF ASSETS (4,733) 20,755 0 0 0 0
44055 - REIMBURSEMENT ACCT 238,394 268,963 225,000 225,000 225,000 0
45903 - NORTH SLOPE ADMISSION 56,914 56,738 75,500 75,500 68,000 (7,500)
46025 - INTEREST 103,126 164,293 22,000 22,000 22,000 0
46152 - TRANSFER FROM LART 250,000 250,000 250,000 500,000 0 (500,000)
Total Revenue 5,800,649 6,816,889 5,276,366 5,526,366 6,356,866 830,500
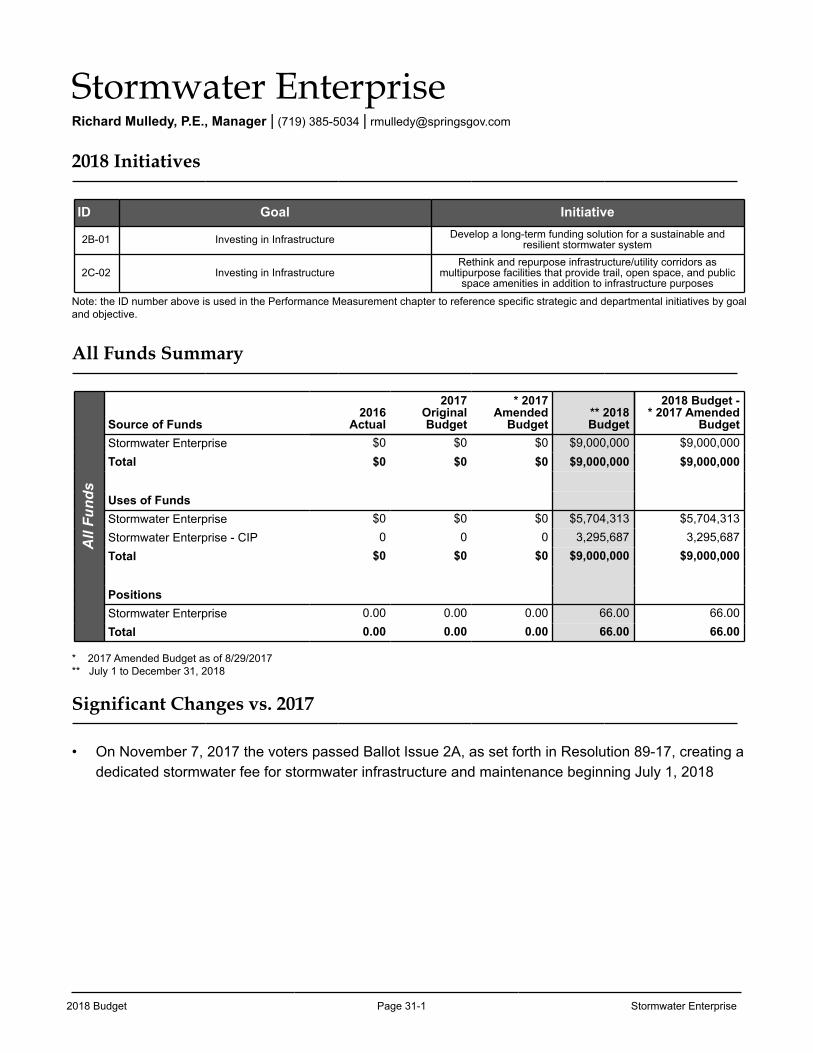
2018 Budget Page 31-1 Stormwater Enterprise
Stormwater EnterpriseRichard Mulledy, P.E., Manager | (719) 385-5034 | [email protected]
2018 Initiatives
ID Goal Initiative
2B-01 Investing in Infrastructure Develop a long-term funding solution for a sustainable and resilient stormwater system
2C-02 Investing in InfrastructureRethink and repurpose infrastructure/utility corridors as
multipurpose facilities that provide trail, open space, and public space amenities in addition to infrastructure purposes
Note: the ID number above is used in the Performance Measurement chapter to reference specific strategic and departmental initiatives by goal and objective.
All Funds Summary
All
Fund
s
Source of Funds2016
Actual
2017OriginalBudget
* 2017Amended
Budget** 2018Budget
2018 Budget -* 2017 Amended
BudgetStormwater Enterprise $0 $0 $0 $9,000,000 $9,000,000Total $0 $0 $0 $9,000,000 $9,000,000
Uses of FundsStormwater Enterprise $0 $0 $0 $5,704,313 $5,704,313Stormwater Enterprise - CIP 0 0 0 3,295,687 3,295,687Total $0 $0 $0 $9,000,000 $9,000,000
PositionsStormwater Enterprise 0.00 0.00 0.00 66.00 66.00Total 0.00 0.00 0.00 66.00 66.00
* 2017 Amended Budget as of 8/29/2017** July 1 to December 31, 2018
Significant Changes vs. 2017
• On November 7, 2017 the voters passed Ballot Issue 2A, as set forth in Resolution 89-17, creating a dedicated stormwater fee for stormwater infrastructure and maintenance beginning July 1, 2018
Stormwater Enterprise Page 31-2 2018 Budget
Stormwater Enterprise
On November 7, 2017 the voters passed Ballot Issue 2A, as set forth in Resolution 89-17, creating a dedicated stormwater fee for infrastructure and maintenance. The collection of Stormwater service fees begins July 1, 2018 and ends July 1, 2038. These fees will be used for the sole purpose of funding, through a City enterprise, the construction, improvement, operation and maintenance of public stormwater facilities and public stormwater system in the city. Effective July 1, 2018, Stormwater services fees will be imposed upon all improved or developed property within the City based on the following classifications:
Class of Property Fee RateResidential property $5.00 per dwelling unit/monthNon-Residential property $30.00 per acre/month
The Stormwater Enterprise’s primary focus is to implement a program to responsibly manage the City’s stormwater system. This includes the management of the City's Municipal Separate Storm Sewer System (MS4) Permit and the City’s drainage basins. The stormwater permit addresses stormwater quality with an emphasis on controlling and limiting pollutants to the City's drainage system through maintenance and Best Management Practices.
• Administers the City’s Municipal Separate Storm Sewer System (MS4) Permit to ensure compliance with federal and state stormwater regulations including education, pollution prevention, inspections, and construction controls.
• Evaluates and implements drainage improvements to address street flooding, drainage way repairs and failing infrastructure.
• Maintenance of the City stormwater system is done by the Stormwater Enterprise. This includes maintaining detention ponds and pipes, and removal of debris from inlets, culverts, and channels. In addition, crews repair and stabilize stream banks.
• Manages stormwater capital construction projects.
• Manages the street sweeping/air quality control program to ensure the following criteria is met:
Meet federal, state and local environmental and air quality mandates through sweeping and dust abatement
Sweep streets in downtown area two times per week; sweep all other City streets two times per year
Collect 28,000 cubic yards of material annually while sweeping 11,322 lane miles of roadway
In 2016, the City of Colorado Springs negotiated an Intergovernmental Agreement (IGA) with Pueblo County in order to resolve a dispute regarding Colorado Springs Utilities’ 1041 Permit for the Southern Delivery System and the City’s funding of its stormwater control program. On April 20, 2016, City Council passed Resolution No. 36-16 approving the IGA, which commits to fund $460 million from 2016 to 2035. In July 2016, the draft Stormwater Program Implementation Plan was released—it provides greater details of the program and is available at: https://coloradosprings.gov/stormwater/page/stormwater-program-implementation-plan.
As a result, some of the stormwater projects originally planned for 2016 were incorporated into the list of 71 stormwater projects to be completed over the 20-year program. The funding for these projects was redistributed in order to provide additional Stormwater operating funds in 2016. Each year the City and Pueblo County prioritize the CIP projects for the following year.
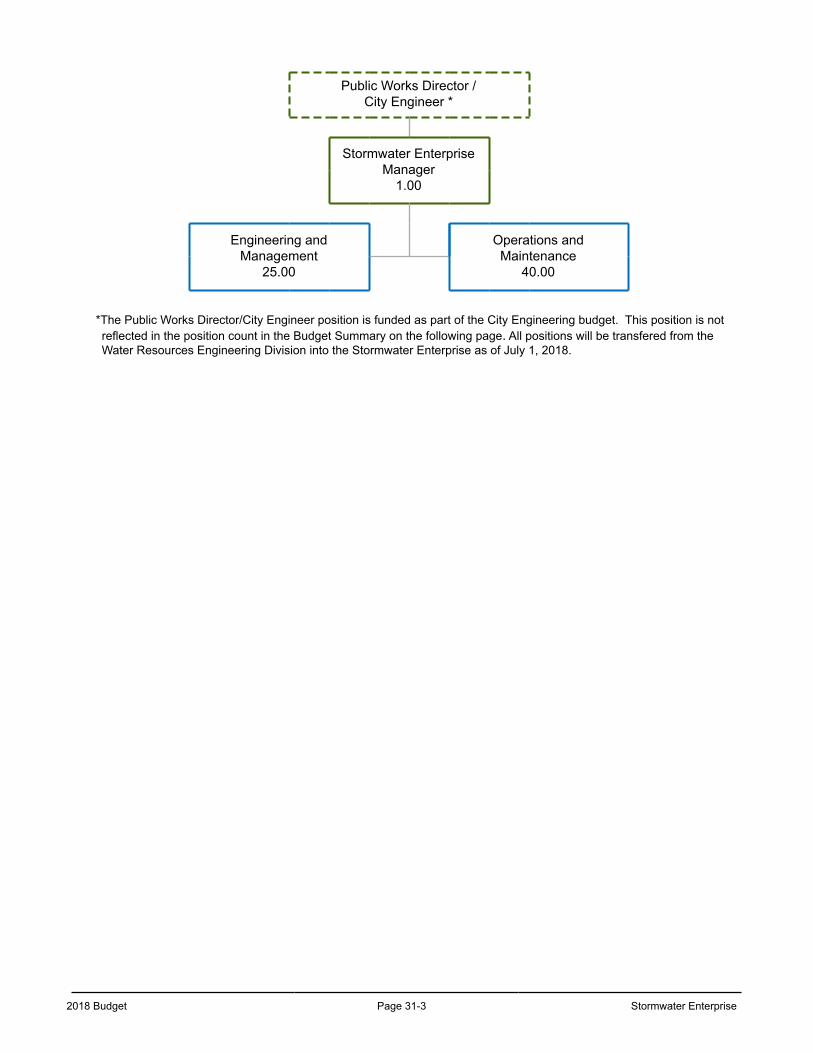
2018 Budget Page 31-3 Stormwater Enterprise
Public Works Director /City Engineer *
Stormwater Enterprise Manager
1.00
Engineering and Management
25.00
Operations andMaintenance
40.00
*The Public Works Director/City Engineer position is funded as part of the City Engineering budget. This position is not reflected in the position count in the Budget Summary on the following page. All positions will be transfered from the Water Resources Engineering Division into the Stormwater Enterprise as of July 1, 2018.
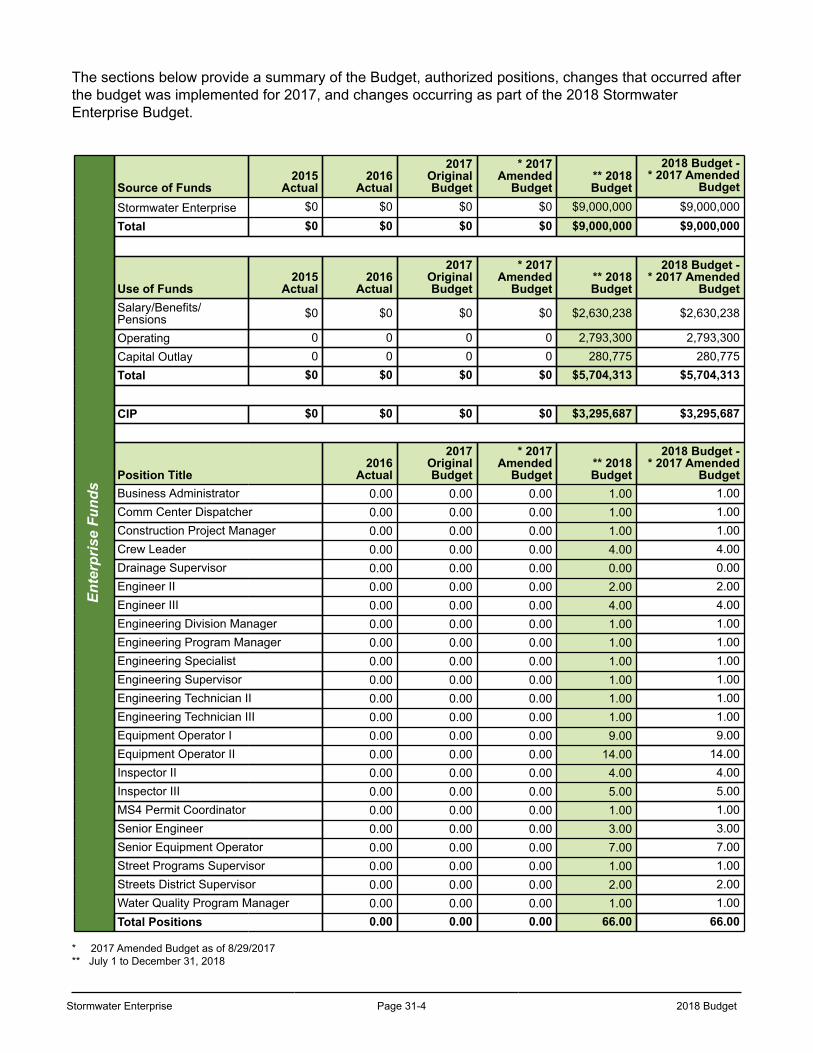
Stormwater Enterprise Page 31-4 2018 Budget
The sections below provide a summary of the Budget, authorized positions, changes that occurred after the budget was implemented for 2017, and changes occurring as part of the 2018 Stormwater Enterprise Budget.
Ente
rpris
e Fu
nds
Source of Funds2015
Actual2016
Actual
2017OriginalBudget
* 2017Amended
Budget** 2018Budget
2018 Budget -* 2017 Amended
Budget
Stormwater Enterprise $0 $0 $0 $0 $9,000,000 $9,000,000Total $0 $0 $0 $0 $9,000,000 $9,000,000
Use of Funds2015
Actual2016
Actual
2017OriginalBudget
* 2017Amended
Budget** 2018Budget
2018 Budget -* 2017 Amended
BudgetSalary/Benefits/Pensions $0 $0 $0 $0 $2,630,238 $2,630,238
Operating 0 0 0 0 2,793,300 2,793,300Capital Outlay 0 0 0 0 280,775 280,775Total $0 $0 $0 $0 $5,704,313 $5,704,313
CIP $0 $0 $0 $0 $3,295,687 $3,295,687
Position Title2016
Actual
2017OriginalBudget
* 2017Amended
Budget** 2018Budget
2018 Budget -* 2017 Amended
BudgetBusiness Administrator 0.00 0.00 0.00 1.00 1.00Comm Center Dispatcher 0.00 0.00 0.00 1.00 1.00Construction Project Manager 0.00 0.00 0.00 1.00 1.00Crew Leader 0.00 0.00 0.00 4.00 4.00Drainage Supervisor 0.00 0.00 0.00 0.00 0.00Engineer II 0.00 0.00 0.00 2.00 2.00Engineer III 0.00 0.00 0.00 4.00 4.00Engineering Division Manager 0.00 0.00 0.00 1.00 1.00Engineering Program Manager 0.00 0.00 0.00 1.00 1.00Engineering Specialist 0.00 0.00 0.00 1.00 1.00Engineering Supervisor 0.00 0.00 0.00 1.00 1.00Engineering Technician II 0.00 0.00 0.00 1.00 1.00Engineering Technician III 0.00 0.00 0.00 1.00 1.00Equipment Operator I 0.00 0.00 0.00 9.00 9.00Equipment Operator II 0.00 0.00 0.00 14.00 14.00Inspector II 0.00 0.00 0.00 4.00 4.00Inspector III 0.00 0.00 0.00 5.00 5.00MS4 Permit Coordinator 0.00 0.00 0.00 1.00 1.00Senior Engineer 0.00 0.00 0.00 3.00 3.00Senior Equipment Operator 0.00 0.00 0.00 7.00 7.00Street Programs Supervisor 0.00 0.00 0.00 1.00 1.00Streets District Supervisor 0.00 0.00 0.00 2.00 2.00Water Quality Program Manager 0.00 0.00 0.00 1.00 1.00Total Positions 0.00 0.00 0.00 66.00 66.00
* 2017 Amended Budget as of 8/29/2017** July 1 to December 31, 2018

2018 Budget Page 31-5 Stormwater Enterprise
Fund
ing
Cha
nges
During 2017* 2017 Amended -
2017 Original BudgetNone $0Total During 2017 $0
For 20182018 Budget -
* 2017 Amended BudgetSalaries/Benefits/PensionsFund 66 Enterprise positions for 6 months $2,630,238Total Salaries/Benefits/Pensions $2,630,238OperatingFund operating activities for 6 months $793,300Implementation and Administrative Fee 2,000,000Total Operating $2,793,300Capital OutlayFund capital outlay for 6 months $280,775Total Capital Outlay $280,775CIPFund CIP for 6 months $3,295,687Total CIP $3,295,687Total For 2018 $9,000,000
Posi
tion
Cha
nges During 2017
* 2017 Amended -2017 Original Budget
None 0.00Total During 2017 0.00
For 20182018 Budget -
* 2017 Amended BudgetTransfer from Water Resources Engineering as of July 1 66.00Total For 2018 66.00
* 2017 Amended Budget as of 8/29/2017** July 1 to December 31, 2018
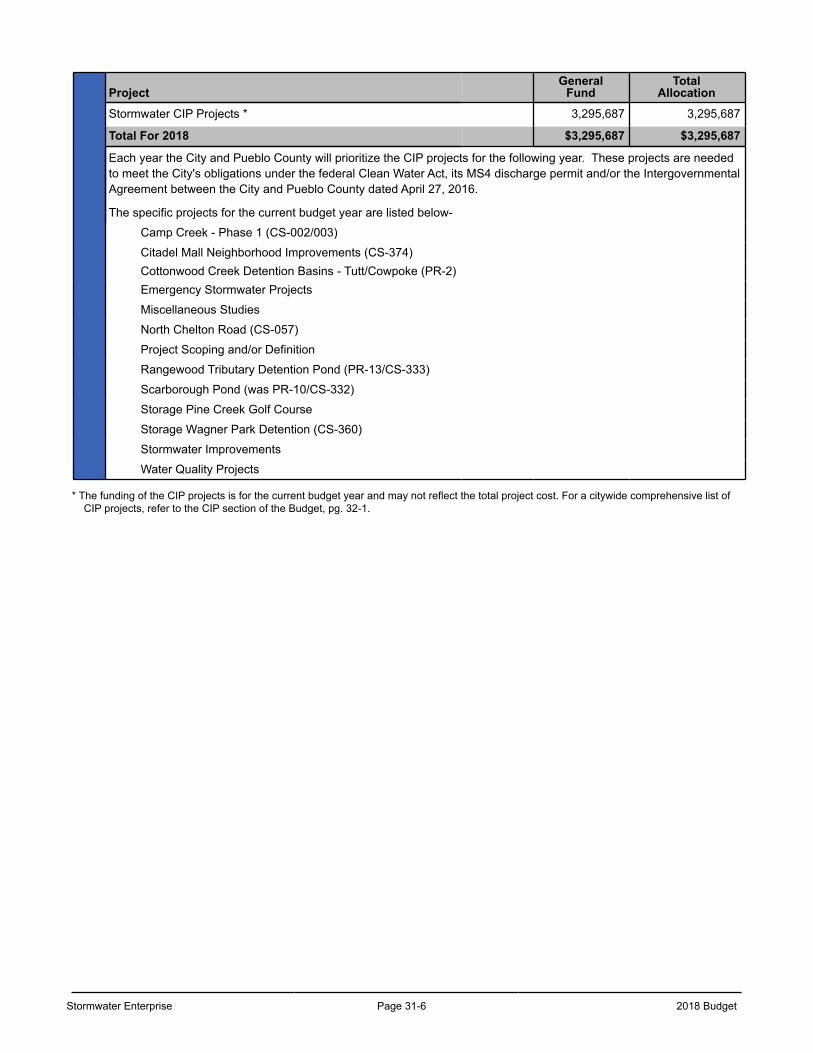
Stormwater Enterprise Page 31-6 2018 Budget
ProjectGeneral
FundTotal
Allocation
Stormwater CIP Projects * 3,295,687 3,295,687
Total For 2018 $3,295,687 $3,295,687
Each year the City and Pueblo County will prioritize the CIP projects for the following year. These projects are needed to meet the City's obligations under the federal Clean Water Act, its MS4 discharge permit and/or the Intergovernmental Agreement between the City and Pueblo County dated April 27, 2016.
The specific projects for the current budget year are listed below-
Camp Creek - Phase 1 (CS-002/003)
Citadel Mall Neighborhood Improvements (CS-374)Cottonwood Creek Detention Basins - Tutt/Cowpoke (PR-2)Emergency Stormwater Projects
Miscellaneous Studies
North Chelton Road (CS-057)
Project Scoping and/or Definition
Rangewood Tributary Detention Pond (PR-13/CS-333)
Scarborough Pond (was PR-10/CS-332)
Storage Pine Creek Golf Course
Storage Wagner Park Detention (CS-360)
Stormwater Improvements
Water Quality Projects
* The funding of the CIP projects is for the current budget year and may not reflect the total project cost. For a citywide comprehensive list of CIP projects, refer to the CIP section of the Budget, pg. 32-1.
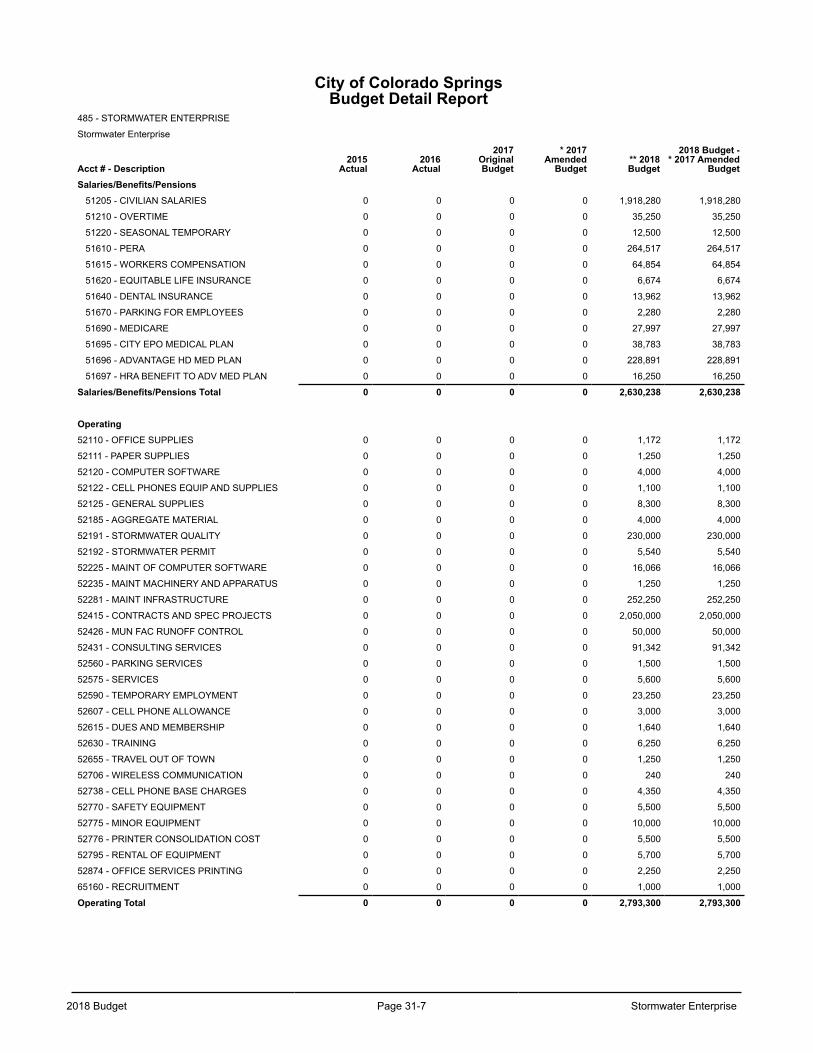
2018 Budget Page 31-7 Stormwater Enterprise
City of Colorado SpringsBudget Detail Report
485 - STORMWATER ENTERPRISE
Stormwater Enterprise
Acct # - Description2015
Actual2016
Actual
2017OriginalBudget
* 2017Amended
Budget** 2018Budget
2018 Budget -* 2017 Amended
BudgetSalaries/Benefits/Pensions
51205 - CIVILIAN SALARIES 0 0 0 0 1,918,280 1,918,280
51210 - OVERTIME 0 0 0 0 35,250 35,250
51220 - SEASONAL TEMPORARY 0 0 0 0 12,500 12,500
51610 - PERA 0 0 0 0 264,517 264,517
51615 - WORKERS COMPENSATION 0 0 0 0 64,854 64,854
51620 - EQUITABLE LIFE INSURANCE 0 0 0 0 6,674 6,674
51640 - DENTAL INSURANCE 0 0 0 0 13,962 13,962
51670 - PARKING FOR EMPLOYEES 0 0 0 0 2,280 2,280
51690 - MEDICARE 0 0 0 0 27,997 27,997
51695 - CITY EPO MEDICAL PLAN 0 0 0 0 38,783 38,783
51696 - ADVANTAGE HD MED PLAN 0 0 0 0 228,891 228,891
51697 - HRA BENEFIT TO ADV MED PLAN 0 0 0 0 16,250 16,250
Salaries/Benefits/Pensions Total 0 0 0 0 2,630,238 2,630,238
Operating52110 - OFFICE SUPPLIES 0 0 0 0 1,172 1,172
52111 - PAPER SUPPLIES 0 0 0 0 1,250 1,250
52120 - COMPUTER SOFTWARE 0 0 0 0 4,000 4,000
52122 - CELL PHONES EQUIP AND SUPPLIES 0 0 0 0 1,100 1,100
52125 - GENERAL SUPPLIES 0 0 0 0 8,300 8,300
52185 - AGGREGATE MATERIAL 0 0 0 0 4,000 4,000
52191 - STORMWATER QUALITY 0 0 0 0 230,000 230,000
52192 - STORMWATER PERMIT 0 0 0 0 5,540 5,540
52225 - MAINT OF COMPUTER SOFTWARE 0 0 0 0 16,066 16,066
52235 - MAINT MACHINERY AND APPARATUS 0 0 0 0 1,250 1,250
52281 - MAINT INFRASTRUCTURE 0 0 0 0 252,250 252,250
52415 - CONTRACTS AND SPEC PROJECTS 0 0 0 0 2,050,000 2,050,000
52426 - MUN FAC RUNOFF CONTROL 0 0 0 0 50,000 50,000
52431 - CONSULTING SERVICES 0 0 0 0 91,342 91,342
52560 - PARKING SERVICES 0 0 0 0 1,500 1,500
52575 - SERVICES 0 0 0 0 5,600 5,600
52590 - TEMPORARY EMPLOYMENT 0 0 0 0 23,250 23,250
52607 - CELL PHONE ALLOWANCE 0 0 0 0 3,000 3,000
52615 - DUES AND MEMBERSHIP 0 0 0 0 1,640 1,640
52630 - TRAINING 0 0 0 0 6,250 6,250
52655 - TRAVEL OUT OF TOWN 0 0 0 0 1,250 1,250
52706 - WIRELESS COMMUNICATION 0 0 0 0 240 240
52738 - CELL PHONE BASE CHARGES 0 0 0 0 4,350 4,350
52770 - SAFETY EQUIPMENT 0 0 0 0 5,500 5,500
52775 - MINOR EQUIPMENT 0 0 0 0 10,000 10,000
52776 - PRINTER CONSOLIDATION COST 0 0 0 0 5,500 5,500
52795 - RENTAL OF EQUIPMENT 0 0 0 0 5,700 5,700
52874 - OFFICE SERVICES PRINTING 0 0 0 0 2,250 2,250
65160 - RECRUITMENT 0 0 0 0 1,000 1,000
Operating Total 0 0 0 0 2,793,300 2,793,300
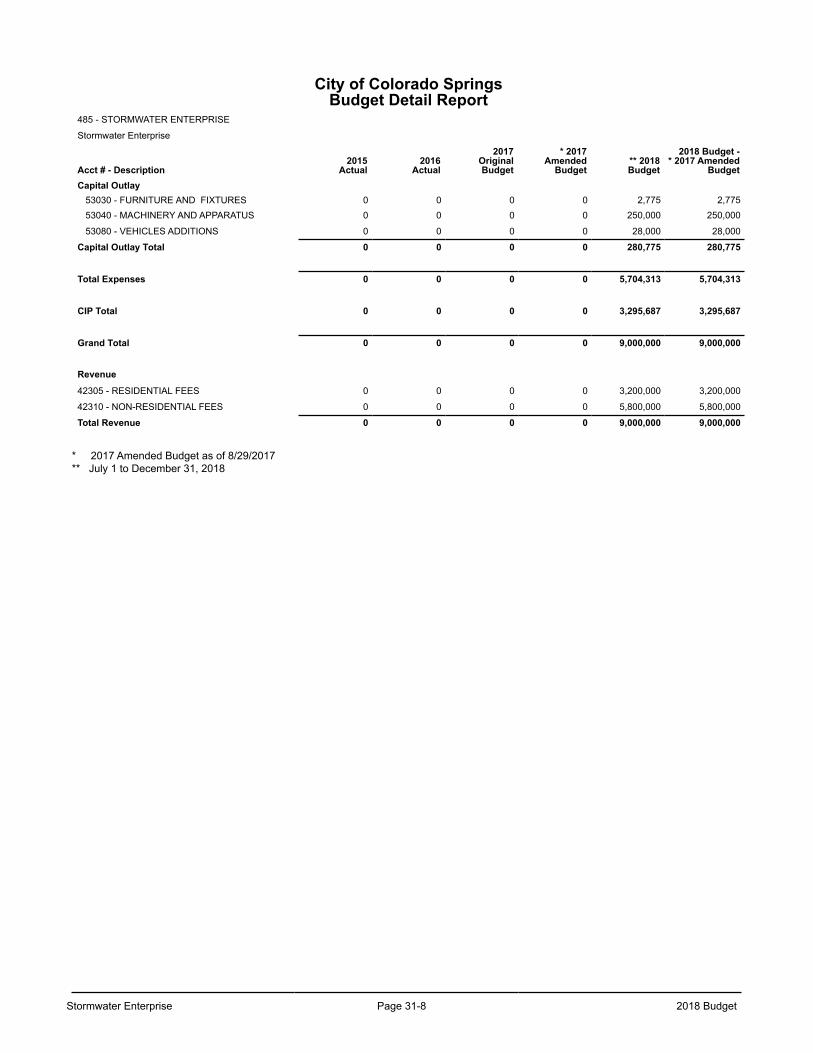
Stormwater Enterprise Page 31-8 2018 Budget
City of Colorado SpringsBudget Detail Report
485 - STORMWATER ENTERPRISE
Stormwater Enterprise
Acct # - Description2015
Actual2016
Actual
2017OriginalBudget
* 2017Amended
Budget** 2018Budget
2018 Budget -* 2017 Amended
BudgetCapital Outlay
53030 - FURNITURE AND FIXTURES 0 0 0 0 2,775 2,77553040 - MACHINERY AND APPARATUS 0 0 0 0 250,000 250,000
53080 - VEHICLES ADDITIONS 0 0 0 0 28,000 28,000
Capital Outlay Total 0 0 0 0 280,775 280,775
Total Expenses 0 0 0 0 5,704,313 5,704,313
CIP Total 0 0 0 0 3,295,687 3,295,687
Grand Total 0 0 0 0 9,000,000 9,000,000
Revenue
42305 - RESIDENTIAL FEES 0 0 0 0 3,200,000 3,200,000
42310 - NON-RESIDENTIAL FEES 0 0 0 0 5,800,000 5,800,000
Total Revenue 0 0 0 0 9,000,000 9,000,000
* 2017 Amended Budget as of 8/29/2017** July 1 to December 31, 2018
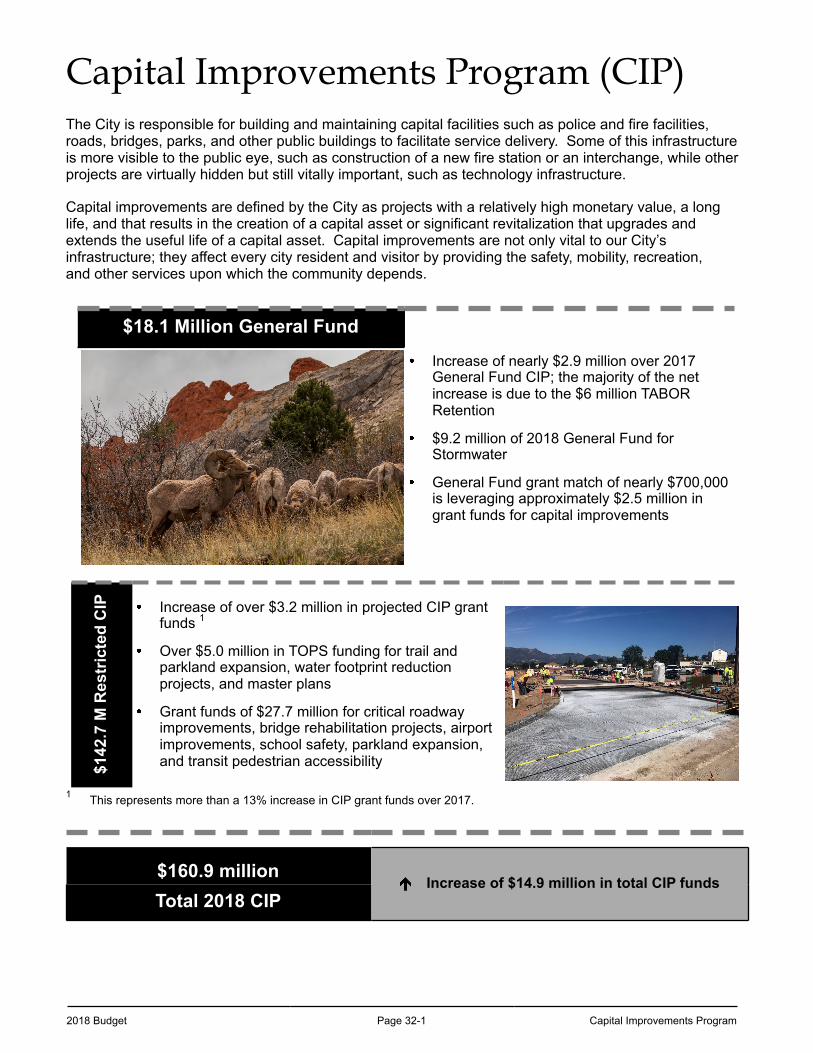
2018 Budget Page 32-1 Capital Improvements Program
Capital Improvements Program (CIP) The City is responsible for building and maintaining capital facilities such as police and fire facilities, roads, bridges, parks, and other public buildings to facilitate service delivery. Some of this infrastructure is more visible to the public eye, such as construction of a new fire station or an interchange, while other projects are virtually hidden but still vitally important, such as technology infrastructure.
Capital improvements are defined by the City as projects with a relatively high monetary value, a long life, and that results in the creation of a capital asset or significant revitalization that upgrades and extends the useful life of a capital asset. Capital improvements are not only vital to our City’s infrastructure; they affect every city resident and visitor by providing the safety, mobility, recreation, and other services upon which the community depends.
$18.1 Million General Fund
Increase of nearly $2.9 million over 2017 General Fund CIP; the majority of the net increase is due to the $6 million TABOR Retention
$9.2 million of 2018 General Fund for Stormwater
General Fund grant match of nearly $700,000 is leveraging approximately $2.5 million in grant funds for capital improvements
$142
.7 M
Res
tric
ted
CIP Increase of over $3.2 million in projected CIP grant
funds 1
Over $5.0 million in TOPS funding for trail and parkland expansion, water footprint reduction projects, and master plans
Grant funds of $27.7 million for critical roadway improvements, bridge rehabilitation projects, airport improvements, school safety, parkland expansion, and transit pedestrian accessibility
1 This represents more than a 13% increase in CIP grant funds over 2017.
$160.9 millionIncrease of $14.9 million in total CIP funds
Total 2018 CIP
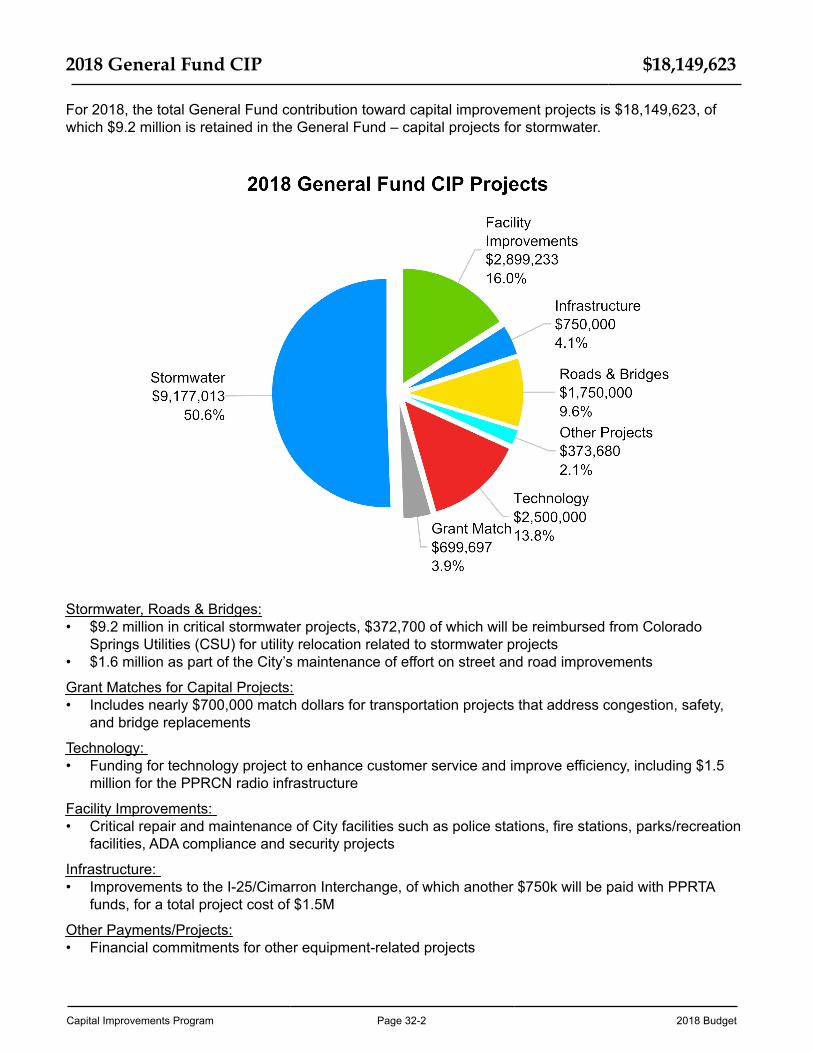
Capital Improvements Program Page 32-2 2018 Budget
2018 General Fund CIP $18,149,623
For 2018, the total General Fund contribution toward capital improvement projects is $18,149,623, of which $9.2 million is retained in the General Fund – capital projects for stormwater.
Stormwater, Roads & Bridges: • $9.2 million in critical stormwater projects, $372,700 of which will be reimbursed from Colorado
Springs Utilities (CSU) for utility relocation related to stormwater projects• $1.6 million as part of the City’s maintenance of effort on street and road improvements
Grant Matches for Capital Projects: • Includes nearly $700,000 match dollars for transportation projects that address congestion, safety,
and bridge replacements
Technology: • Funding for technology project to enhance customer service and improve efficiency, including $1.5
million for the PPRCN radio infrastructure
Facility Improvements: • Critical repair and maintenance of City facilities such as police stations, fire stations, parks/recreation
facilities, ADA compliance and security projects
Infrastructure: • Improvements to the I-25/Cimarron Interchange, of which another $750k will be paid with PPRTA
funds, for a total project cost of $1.5M
Other Payments/Projects: • Financial commitments for other equipment-related projects
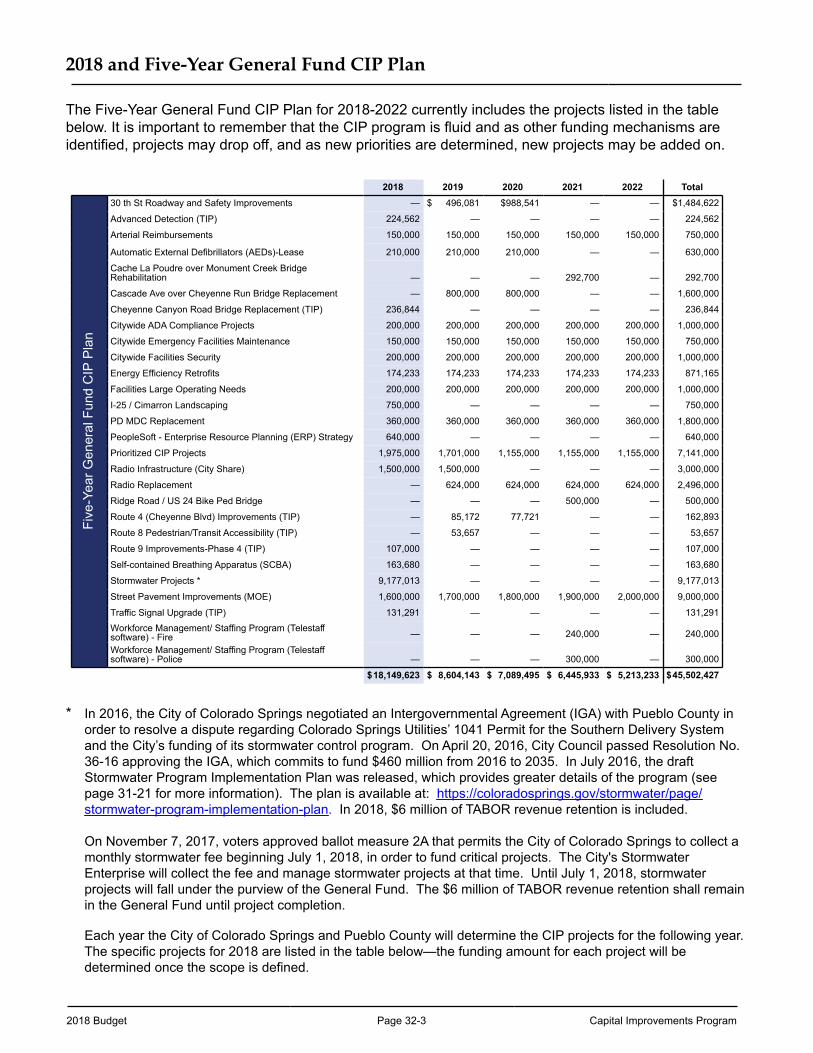
2018 Budget Page 32-3 Capital Improvements Program
2018 and Five-Year General Fund CIP Plan
The Five-Year General Fund CIP Plan for 2018-2022 currently includes the projects listed in the table below. It is important to remember that the CIP program is fluid and as other funding mechanisms are identified, projects may drop off, and as new priorities are determined, new projects may be added on.
2018 2019 2020 2021 2022 Total
Five
-Yea
r Gen
eral
Fun
d C
IP P
lan
30 th St Roadway and Safety Improvements — $ 496,081 $988,541 — — $1,484,622
Advanced Detection (TIP) 224,562 — — — — 224,562
Arterial Reimbursements 150,000 150,000 150,000 150,000 150,000 750,000
Automatic External Defibrillators (AEDs)-Lease 210,000 210,000 210,000 — — 630,000
Cache La Poudre over Monument Creek BridgeRehabilitation — — — 292,700 — 292,700
Cascade Ave over Cheyenne Run Bridge Replacement — 800,000 800,000 — — 1,600,000
Cheyenne Canyon Road Bridge Replacement (TIP) 236,844 — — — — 236,844
Citywide ADA Compliance Projects 200,000 200,000 200,000 200,000 200,000 1,000,000
Citywide Emergency Facilities Maintenance 150,000 150,000 150,000 150,000 150,000 750,000
Citywide Facilities Security 200,000 200,000 200,000 200,000 200,000 1,000,000
Energy Efficiency Retrofits 174,233 174,233 174,233 174,233 174,233 871,165
Facilities Large Operating Needs 200,000 200,000 200,000 200,000 200,000 1,000,000
I-25 / Cimarron Landscaping 750,000 — — — — 750,000
PD MDC Replacement 360,000 360,000 360,000 360,000 360,000 1,800,000
PeopleSoft - Enterprise Resource Planning (ERP) Strategy 640,000 — — — — 640,000
Prioritized CIP Projects 1,975,000 1,701,000 1,155,000 1,155,000 1,155,000 7,141,000
Radio Infrastructure (City Share) 1,500,000 1,500,000 — — — 3,000,000
Radio Replacement — 624,000 624,000 624,000 624,000 2,496,000
Ridge Road / US 24 Bike Ped Bridge — — — 500,000 — 500,000
Route 4 (Cheyenne Blvd) Improvements (TIP) — 85,172 77,721 — — 162,893
Route 8 Pedestrian/Transit Accessibility (TIP) — 53,657 — — — 53,657
Route 9 Improvements-Phase 4 (TIP) 107,000 — — — — 107,000
Self-contained Breathing Apparatus (SCBA) 163,680 — — — — 163,680
Stormwater Projects * 9,177,013 — — — — 9,177,013
Street Pavement Improvements (MOE) 1,600,000 1,700,000 1,800,000 1,900,000 2,000,000 9,000,000
Traffic Signal Upgrade (TIP) 131,291 — — — — 131,291
Workforce Management/ Staffing Program (Telestaffsoftware) - Fire — — — 240,000 — 240,000
Workforce Management/ Staffing Program (Telestaffsoftware) - Police — — — 300,000 — 300,000
$18,149,623 $ 8,604,143 $ 7,089,495 $ 6,445,933 $ 5,213,233 $45,502,427
* In 2016, the City of Colorado Springs negotiated an Intergovernmental Agreement (IGA) with Pueblo County in order to resolve a dispute regarding Colorado Springs Utilities’ 1041 Permit for the Southern Delivery System and the City’s funding of its stormwater control program. On April 20, 2016, City Council passed Resolution No. 36-16 approving the IGA, which commits to fund $460 million from 2016 to 2035. In July 2016, the draft Stormwater Program Implementation Plan was released, which provides greater details of the program (see page 31-21 for more information). The plan is available at: https://coloradosprings.gov/stormwater/page/stormwater-program-implementation-plan. In 2018, $6 million of TABOR revenue retention is included.
On November 7, 2017, voters approved ballot measure 2A that permits the City of Colorado Springs to collect a monthly stormwater fee beginning July 1, 2018, in order to fund critical projects. The City's Stormwater Enterprise will collect the fee and manage stormwater projects at that time. Until July 1, 2018, stormwater projects will fall under the purview of the General Fund. The $6 million of TABOR revenue retention shall remain in the General Fund until project completion.
Each year the City of Colorado Springs and Pueblo County will determine the CIP projects for the following year. The specific projects for 2018 are listed in the table below—the funding amount for each project will be determined once the scope is defined.
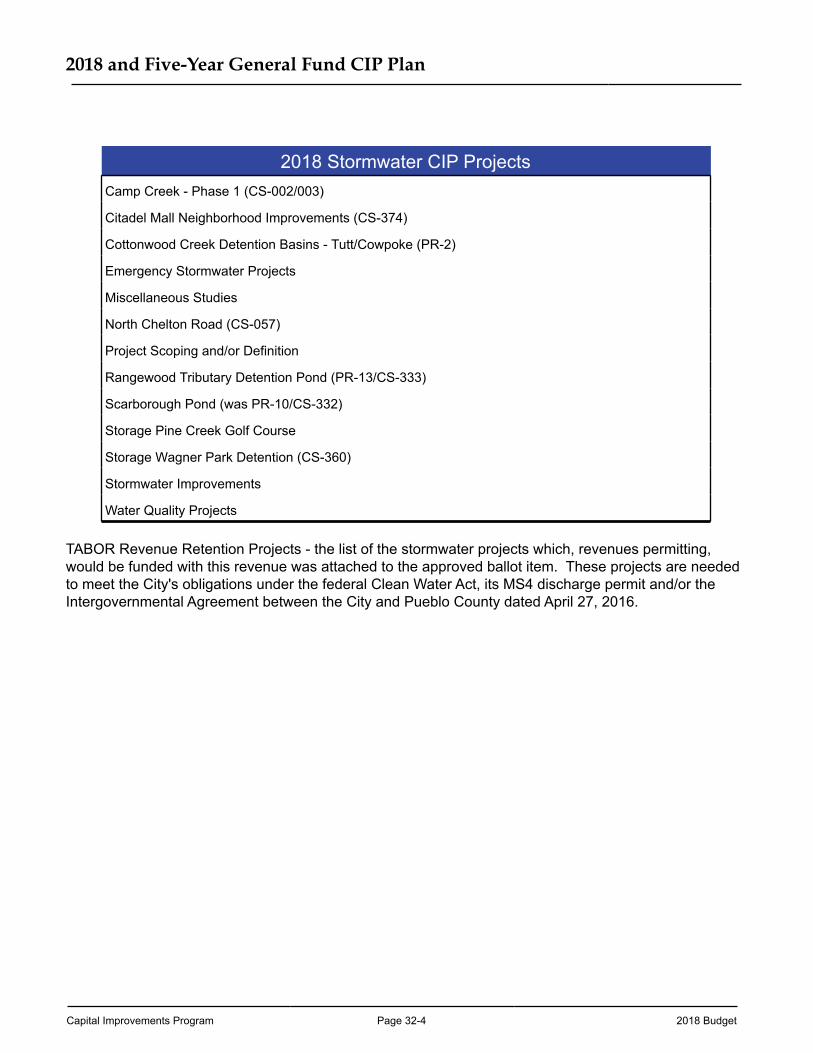
Capital Improvements Program Page 32-4 2018 Budget
2018 and Five-Year General Fund CIP Plan
2018 Stormwater CIP ProjectsCamp Creek - Phase 1 (CS-002/003)
Citadel Mall Neighborhood Improvements (CS-374)
Cottonwood Creek Detention Basins - Tutt/Cowpoke (PR-2)
Emergency Stormwater Projects
Miscellaneous Studies
North Chelton Road (CS-057)
Project Scoping and/or Definition
Rangewood Tributary Detention Pond (PR-13/CS-333)
Scarborough Pond (was PR-10/CS-332)
Storage Pine Creek Golf Course
Storage Wagner Park Detention (CS-360)
Stormwater Improvements
Water Quality Projects
TABOR Revenue Retention Projects - the list of the stormwater projects which, revenues permitting, would be funded with this revenue was attached to the approved ballot item. These projects are needed to meet the City's obligations under the federal Clean Water Act, its MS4 discharge permit and/or the Intergovernmental Agreement between the City and Pueblo County dated April 27, 2016.
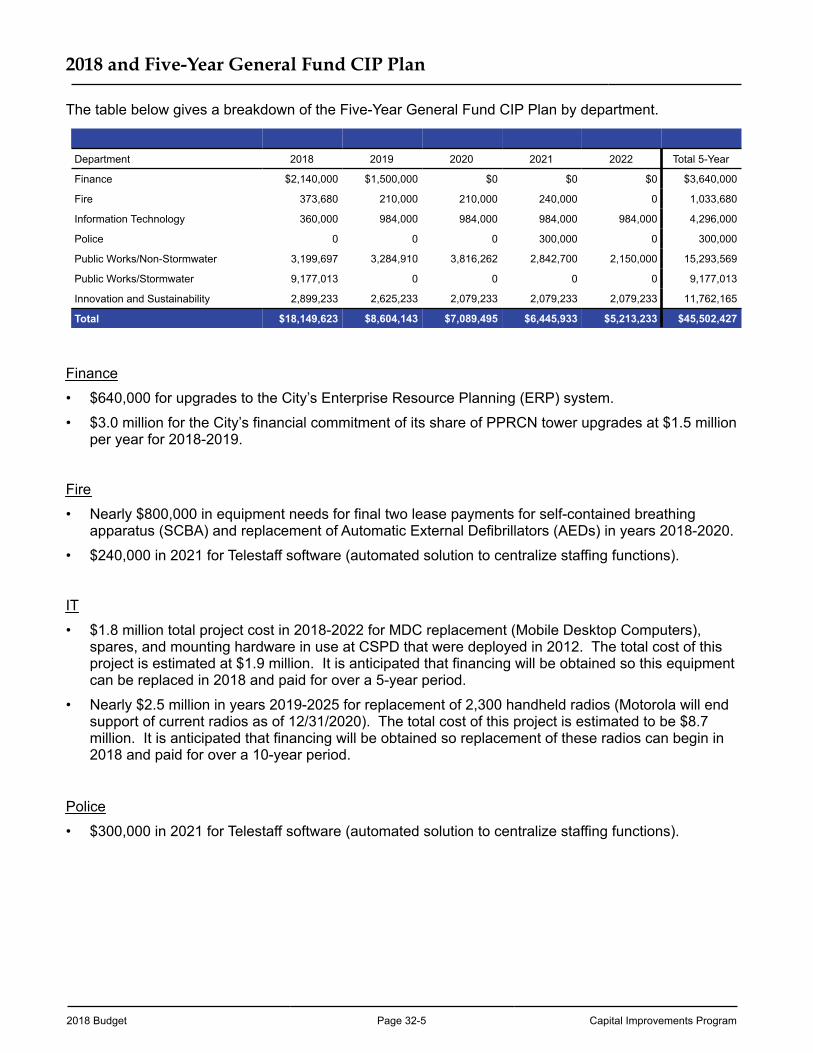
2018 Budget Page 32-5 Capital Improvements Program
2018 and Five-Year General Fund CIP Plan
The table below gives a breakdown of the Five-Year General Fund CIP Plan by department.
Department 2018 2019 2020 2021 2022 Total 5-Year
Finance $2,140,000 $1,500,000 $0 $0 $0 $3,640,000
Fire 373,680 210,000 210,000 240,000 0 1,033,680
Information Technology 360,000 984,000 984,000 984,000 984,000 4,296,000
Police 0 0 0 300,000 0 300,000
Public Works/Non-Stormwater 3,199,697 3,284,910 3,816,262 2,842,700 2,150,000 15,293,569
Public Works/Stormwater 9,177,013 0 0 0 0 9,177,013
Innovation and Sustainability 2,899,233 2,625,233 2,079,233 2,079,233 2,079,233 11,762,165
Total $18,149,623 $8,604,143 $7,089,495 $6,445,933 $5,213,233 $45,502,427
Finance
• $640,000 for upgrades to the City’s Enterprise Resource Planning (ERP) system.
• $3.0 million for the City’s financial commitment of its share of PPRCN tower upgrades at $1.5 million per year for 2018-2019.
Fire
• Nearly $800,000 in equipment needs for final two lease payments for self-contained breathing apparatus (SCBA) and replacement of Automatic External Defibrillators (AEDs) in years 2018-2020.
• $240,000 in 2021 for Telestaff software (automated solution to centralize staffing functions).
IT
• $1.8 million total project cost in 2018-2022 for MDC replacement (Mobile Desktop Computers), spares, and mounting hardware in use at CSPD that were deployed in 2012. The total cost of this project is estimated at $1.9 million. It is anticipated that financing will be obtained so this equipment can be replaced in 2018 and paid for over a 5-year period.
• Nearly $2.5 million in years 2019-2025 for replacement of 2,300 handheld radios (Motorola will end support of current radios as of 12/31/2020). The total cost of this project is estimated to be $8.7 million. It is anticipated that financing will be obtained so replacement of these radios can begin in 2018 and paid for over a 10-year period.
Police
• $300,000 in 2021 for Telestaff software (automated solution to centralize staffing functions).
Capital Improvements Program Page 32-6 2018 Budget
2018 and Five-Year General Fund CIP Plan
Public Works/Stormwater
• Year 2018 – $9.2 million budgeted in General Fund, $372,700 of which will be reimbursed from Colorado Springs Utilities (CSU) for utility relocation related to stormwater projects.
• Years 2019-2022 – $0 in General Fund. Beginning on July 1, 2018, all stormwater projects will be managed and funded under the Stormwater Enterprise.
In 2016, the City of Colorado Springs negotiated an Intergovernmental Agreement (IGA) with Pueblo County in order to resolve a dispute regarding Colorado Springs Utilities’ 1041 Permit for the Southern Delivery System and the City’s funding of its stormwater control program. On April 20, 2016, City Council passed Resolution No. 36-16 approving the IGA, which commits to fund $460 million from 2016 to 2035. In July 2016, the draft Stormwater Program Implementation Plan was released, which provides greater details of the program (see page 32-19 for more information). The plan is available at: https://coloradosprings.gov/stormwater/page/stormwater-program-implementation-plan.
Public Works/Non-Stormwater
• City Engineering – approximately $4.7 million
Bridges – $236,844 in 2018 for local grant match on the Cheyenne Canyon Road Bridge Replacement and nearly $1.9 million in 2019-2022 for other bridge design and construction projects.
Roads – $323,550 in 2018-2021 for local grant match pedestrian/transit accessibility and other roadway improvement projects (TIP); $1.5 million in 2019-2020 for local grant match on the 30th Street Roadway and Safety Improvements (TIP), and $750,000 in years 2018-2022 ($150,000/yr.) for arterial reimbursements to subdividers/developers for infrastructure improvements.
• Public Works Operations and Maintenance (f/k/a Streets) – $9.0 million over the 2018-2022 CIP plan as part of the City’s maintenance of effort on street and road improvements.
• Traffic Engineering – $355,850 in 2018 for local grant match of TIP projects (traffic signal upgrades and advanced detection); $750,000 commitment for landscaping near the I-25/Cimarron interchange (the remaining $750,000 of this $1.5 million project will be paid with PPRTA funds); and $500,000 in 2021 for the Ridge Road/US 24 Pedestrian Bridge.
Innovation & Sustainability • Approximately $10.9 million in 2018-2022 for maintenance of City facilities to address ADA
compliance, emergency maintenance, critical maintenance, and facility security.
• $871,000 for financial commitment of energy efficiency retrofits (final payment in 2022).
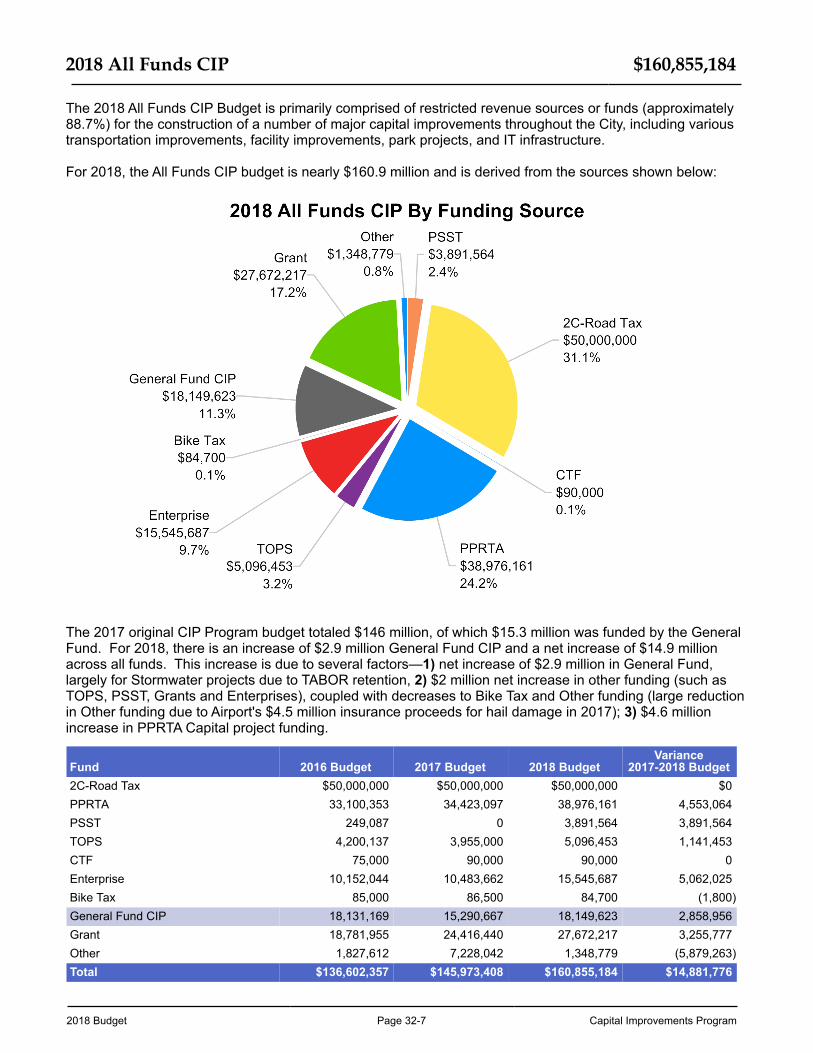
2018 Budget Page 32-7 Capital Improvements Program
2018 All Funds CIP $160,855,184
The 2018 All Funds CIP Budget is primarily comprised of restricted revenue sources or funds (approximately 88.7%) for the construction of a number of major capital improvements throughout the City, including various transportation improvements, facility improvements, park projects, and IT infrastructure.
For 2018, the All Funds CIP budget is nearly $160.9 million and is derived from the sources shown below:
The 2017 original CIP Program budget totaled $146 million, of which $15.3 million was funded by the General Fund. For 2018, there is an increase of $2.9 million General Fund CIP and a net increase of $14.9 million across all funds. This increase is due to several factors—1) net increase of $2.9 million in General Fund, largely for Stormwater projects due to TABOR retention, 2) $2 million net increase in other funding (such as TOPS, PSST, Grants and Enterprises), coupled with decreases to Bike Tax and Other funding (large reduction in Other funding due to Airport's $4.5 million insurance proceeds for hail damage in 2017); 3) $4.6 million increase in PPRTA Capital project funding.
Fund 2016 Budget 2017 Budget 2018 BudgetVariance
2017-2018 Budget2C-Road Tax $50,000,000 $50,000,000 $50,000,000 $0PPRTA 33,100,353 34,423,097 38,976,161 4,553,064PSST 249,087 0 3,891,564 3,891,564TOPS 4,200,137 3,955,000 5,096,453 1,141,453CTF 75,000 90,000 90,000 0Enterprise 10,152,044 10,483,662 15,545,687 5,062,025Bike Tax 85,000 86,500 84,700 (1,800)General Fund CIP 18,131,169 15,290,667 18,149,623 2,858,956Grant 18,781,955 24,416,440 27,672,217 3,255,777Other 1,827,612 7,228,042 1,348,779 (5,879,263)Total $136,602,357 $145,973,408 $160,855,184 $14,881,776
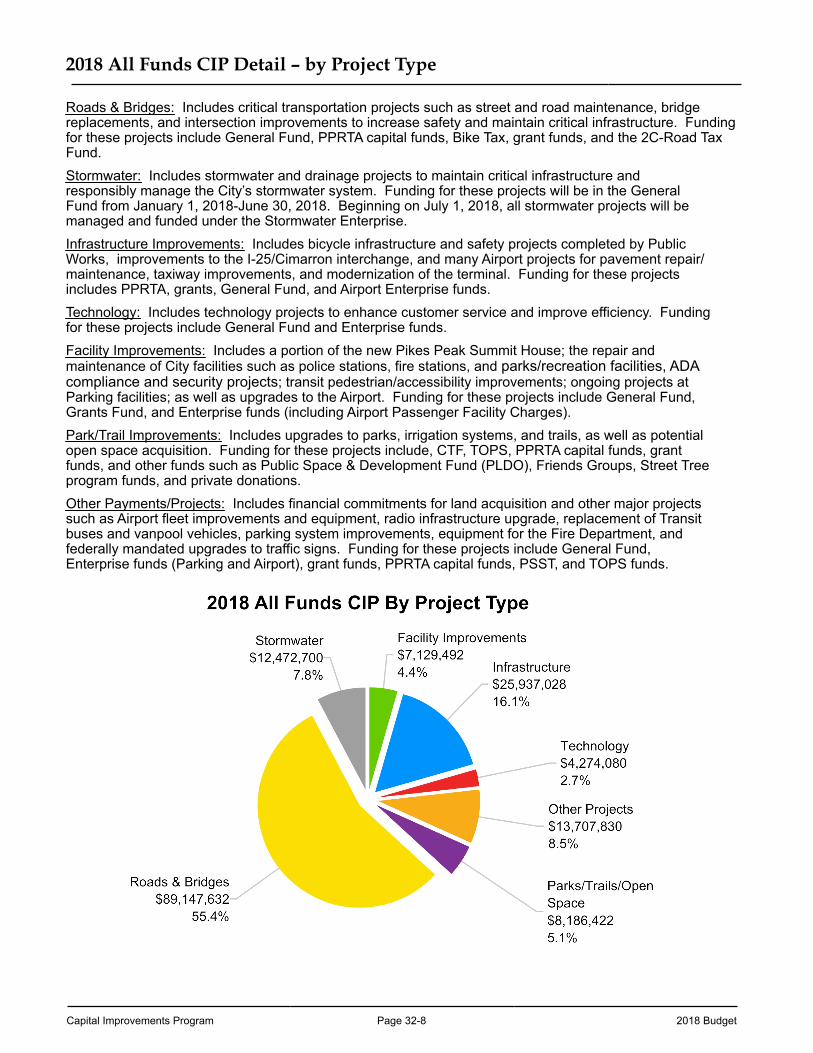
Capital Improvements Program Page 32-8 2018 Budget
2018 All Funds CIP Detail – by Project Type
Roads & Bridges: Includes critical transportation projects such as street and road maintenance, bridge replacements, and intersection improvements to increase safety and maintain critical infrastructure. Funding for these projects include General Fund, PPRTA capital funds, Bike Tax, grant funds, and the 2C-Road Tax Fund. Stormwater: Includes stormwater and drainage projects to maintain critical infrastructure and responsibly manage the City’s stormwater system. Funding for these projects will be in the General Fund from January 1, 2018-June 30, 2018. Beginning on July 1, 2018, all stormwater projects will be managed and funded under the Stormwater Enterprise. Infrastructure Improvements: Includes bicycle infrastructure and safety projects completed by Public Works, improvements to the I-25/Cimarron interchange, and many Airport projects for pavement repair/maintenance, taxiway improvements, and modernization of the terminal. Funding for these projects includes PPRTA, grants, General Fund, and Airport Enterprise funds.Technology: Includes technology projects to enhance customer service and improve efficiency. Funding for these projects include General Fund and Enterprise funds.Facility Improvements: Includes a portion of the new Pikes Peak Summit House; the repair and maintenance of City facilities such as police stations, fire stations, and parks/recreation facilities, ADA compliance and security projects; transit pedestrian/accessibility improvements; ongoing projects at Parking facilities; as well as upgrades to the Airport. Funding for these projects include General Fund, Grants Fund, and Enterprise funds (including Airport Passenger Facility Charges). Park/Trail Improvements: Includes upgrades to parks, irrigation systems, and trails, as well as potential open space acquisition. Funding for these projects include, CTF, TOPS, PPRTA capital funds, grant funds, and other funds such as Public Space & Development Fund (PLDO), Friends Groups, Street Tree program funds, and private donations.Other Payments/Projects: Includes financial commitments for land acquisition and other major projects such as Airport fleet improvements and equipment, radio infrastructure upgrade, replacement of Transit buses and vanpool vehicles, parking system improvements, equipment for the Fire Department, and federally mandated upgrades to traffic signs. Funding for these projects include General Fund, Enterprise funds (Parking and Airport), grant funds, PPRTA capital funds, PSST, and TOPS funds.
2018 Budget Page 32-9 Capital Improvements Program
Impact on Operating Budget $605,872
Increased operating and maintenance costs for CIP projects with 2018 funding are estimated at nearly $605,872, with the highest costs for estimated ongoing annual maintenance for the following types of projects:
Facility/Infrastructure Improvements $80,000 Technology (software) 251,872 Other (Airport fleet) 274,000
Many of the other CIP projects involve negligible increases that will be absorbed into the City’s current maintenance programs.
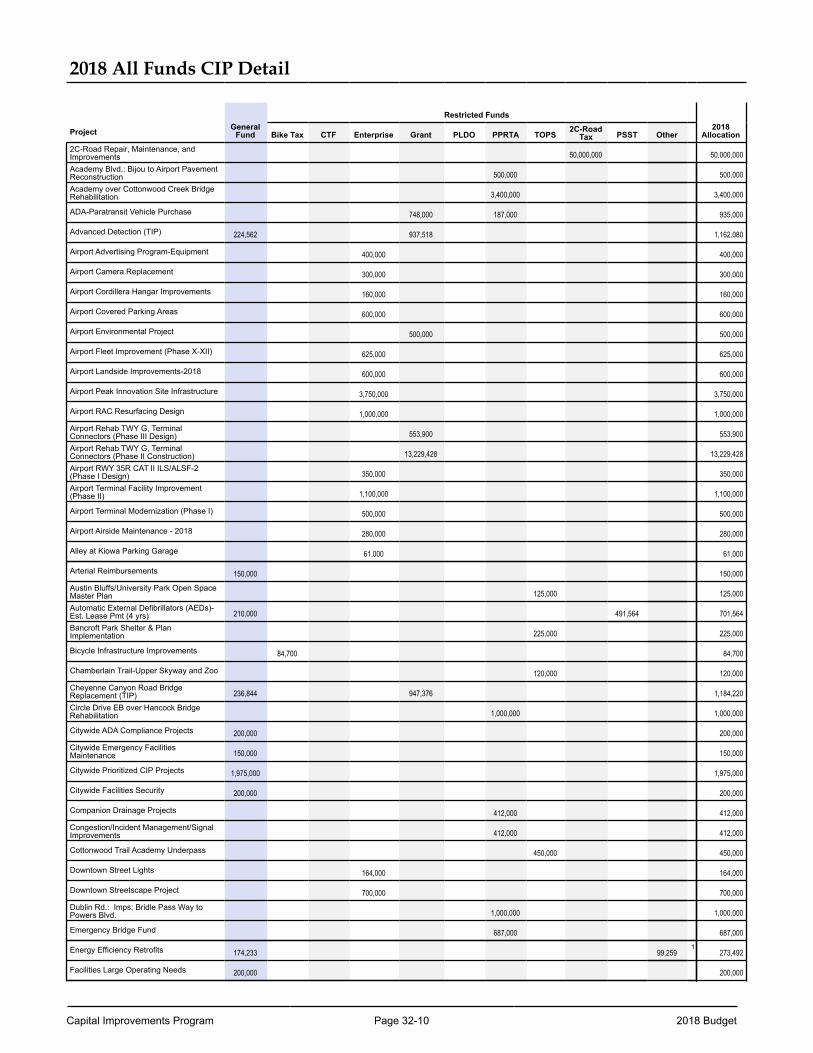
Capital Improvements Program Page 32-10 2018 Budget
2018 All Funds CIP Detail
GeneralFund
Restricted Funds2018
AllocationProject Bike Tax CTF Enterprise Grant PLDO PPRTA TOPS2C-Road
Tax PSST Other
2C-Road Repair, Maintenance, andImprovements 50,000,000 50,000,000
Academy Blvd.: Bijou to Airport PavementReconstruction 500,000 500,000
Academy over Cottonwood Creek BridgeRehabilitation 3,400,000 3,400,000
ADA-Paratransit Vehicle Purchase 748,000 187,000 935,000
Advanced Detection (TIP) 224,562 937,518 1,162,080
Airport Advertising Program-Equipment 400,000 400,000
Airport Camera Replacement 300,000 300,000
Airport Cordillera Hangar Improvements 160,000 160,000
Airport Covered Parking Areas 600,000 600,000
Airport Environmental Project 500,000 500,000
Airport Fleet Improvement (Phase X-XII) 625,000 625,000
Airport Landside Improvements-2018 600,000 600,000
Airport Peak Innovation Site Infrastructure 3,750,000 3,750,000
Airport RAC Resurfacing Design 1,000,000 1,000,000
Airport Rehab TWY G, TerminalConnectors (Phase III Design) 553,900 553,900
Airport Rehab TWY G, TerminalConnectors (Phase II Construction) 13,229,428 13,229,428
Airport RWY 35R CAT II ILS/ALSF-2(Phase I Design) 350,000 350,000
Airport Terminal Facility Improvement(Phase II) 1,100,000 1,100,000
Airport Terminal Modernization (Phase I) 500,000 500,000
Airport Airside Maintenance - 2018 280,000 280,000
Alley at Kiowa Parking Garage 61,000 61,000
Arterial Reimbursements 150,000 150,000
Austin Bluffs/University Park Open SpaceMaster Plan 125,000 125,000
Automatic External Defibrillators (AEDs)-Est. Lease Pmt (4 yrs) 210,000 491,564 701,564
Bancroft Park Shelter & PlanImplementation 225,000 225,000
Bicycle Infrastructure Improvements 84,700 84,700
Chamberlain Trail-Upper Skyway and Zoo 120,000 120,000
Cheyenne Canyon Road BridgeReplacement (TIP) 236,844 947,376 1,184,220
Circle Drive EB over Hancock BridgeRehabilitation 1,000,000 1,000,000
Citywide ADA Compliance Projects 200,000 200,000
Citywide Emergency FacilitiesMaintenance 150,000 150,000
Citywide Prioritized CIP Projects 1,975,000 1,975,000
Citywide Facilities Security 200,000 200,000
Companion Drainage Projects 412,000 412,000
Congestion/Incident Management/SignalImprovements 412,000 412,000
Cottonwood Trail Academy Underpass 450,000 450,000
Downtown Street Lights 164,000 164,000
Downtown Streetscape Project 700,000 700,000
Dublin Rd.: Imps: Bridle Pass Way toPowers Blvd. 1,000,000 1,000,000
Emergency Bridge Fund 687,000 687,000
Energy Efficiency Retrofits 174,233 99,2591
273,492
Facilities Large Operating Needs 200,000 200,000
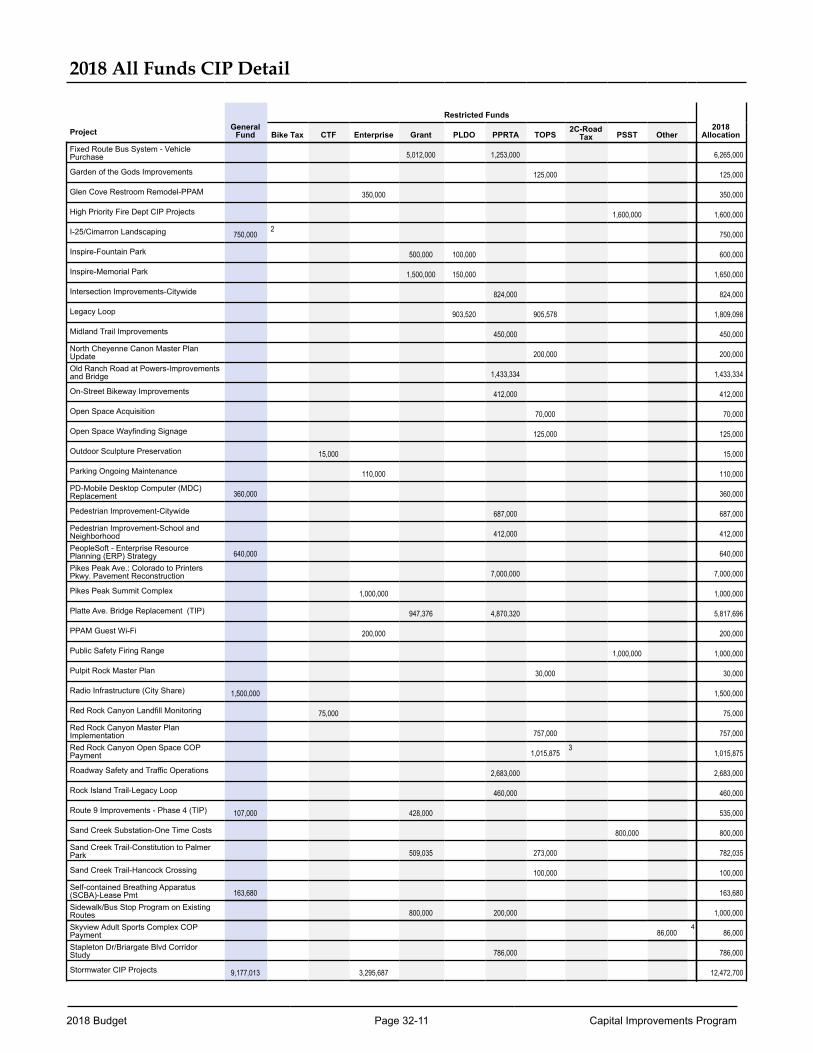
2018 Budget Page 32-11 Capital Improvements Program
2018 All Funds CIP Detail
GeneralFund
Restricted Funds2018
AllocationProject Bike Tax CTF Enterprise Grant PLDO PPRTA TOPS2C-Road
Tax PSST Other
Fixed Route Bus System - VehiclePurchase 5,012,000 1,253,000 6,265,000
Garden of the Gods Improvements 125,000 125,000
Glen Cove Restroom Remodel-PPAM 350,000 350,000
High Priority Fire Dept CIP Projects 1,600,000 1,600,000
I-25/Cimarron Landscaping 750,0002
750,000
Inspire-Fountain Park 500,000 100,000 600,000
Inspire-Memorial Park 1,500,000 150,000 1,650,000
Intersection Improvements-Citywide 824,000 824,000
Legacy Loop 903,520 905,578 1,809,098
Midland Trail Improvements 450,000 450,000
North Cheyenne Canon Master PlanUpdate 200,000 200,000
Old Ranch Road at Powers-Improvementsand Bridge 1,433,334 1,433,334
On-Street Bikeway Improvements 412,000 412,000
Open Space Acquisition 70,000 70,000
Open Space Wayfinding Signage 125,000 125,000
Outdoor Sculpture Preservation 15,000 15,000
Parking Ongoing Maintenance 110,000 110,000
PD-Mobile Desktop Computer (MDC)Replacement 360,000 360,000
Pedestrian Improvement-Citywide 687,000 687,000
Pedestrian Improvement-School andNeighborhood 412,000 412,000
PeopleSoft - Enterprise ResourcePlanning (ERP) Strategy 640,000 640,000
Pikes Peak Ave.: Colorado to PrintersPkwy. Pavement Reconstruction 7,000,000 7,000,000
Pikes Peak Summit Complex 1,000,000 1,000,000
Platte Ave. Bridge Replacement (TIP) 947,376 4,870,320 5,817,696
PPAM Guest Wi-Fi 200,000 200,000
Public Safety Firing Range 1,000,000 1,000,000
Pulpit Rock Master Plan 30,000 30,000
Radio Infrastructure (City Share) 1,500,000 1,500,000
Red Rock Canyon Landfill Monitoring 75,000 75,000
Red Rock Canyon Master PlanImplementation 757,000 757,000
Red Rock Canyon Open Space COPPayment 1,015,875
31,015,875
Roadway Safety and Traffic Operations 2,683,000 2,683,000
Rock Island Trail-Legacy Loop 460,000 460,000
Route 9 Improvements - Phase 4 (TIP) 107,000 428,000 535,000
Sand Creek Substation-One Time Costs 800,000 800,000
Sand Creek Trail-Constitution to PalmerPark 509,035 273,000 782,035
Sand Creek Trail-Hancock Crossing 100,000 100,000
Self-contained Breathing Apparatus(SCBA)-Lease Pmt 163,680 163,680
Sidewalk/Bus Stop Program on ExistingRoutes 800,000 200,000 1,000,000
Skyview Adult Sports Complex COPPayment 86,000
486,000
Stapleton Dr/Briargate Blvd CorridorStudy 786,000 786,000
Stormwater CIP Projects 9,177,013 3,295,687 12,472,700
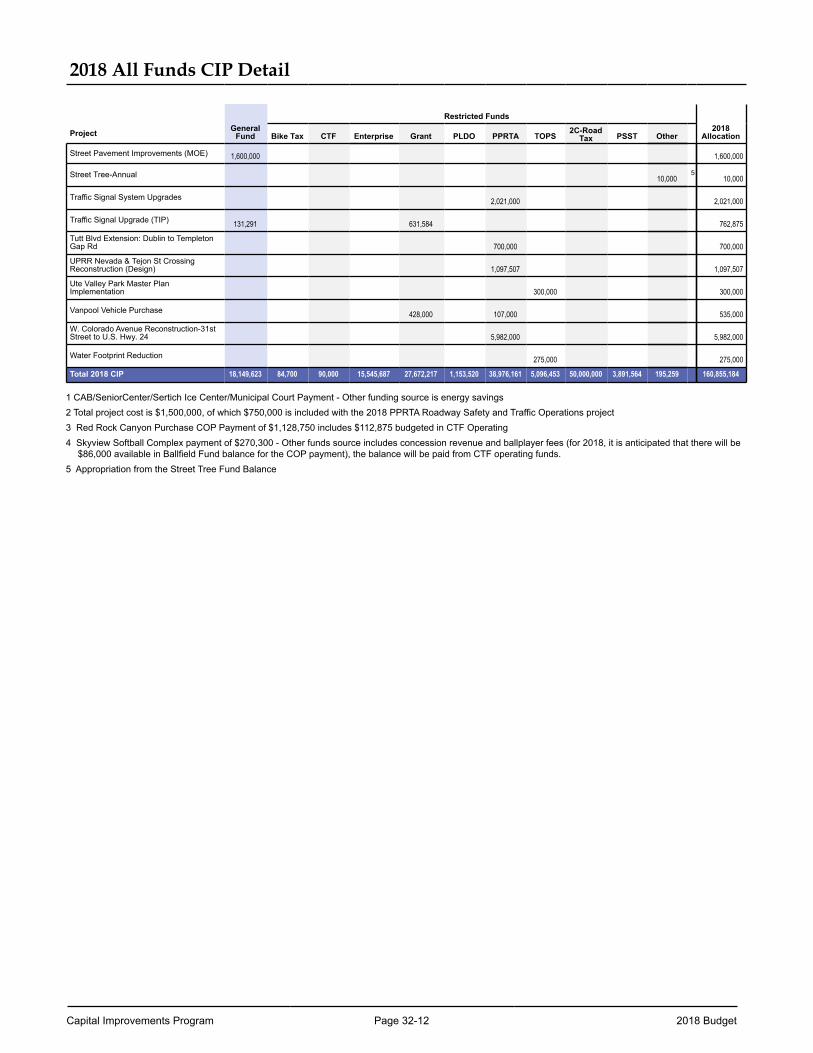
Capital Improvements Program Page 32-12 2018 Budget
2018 All Funds CIP Detail
GeneralFund
Restricted Funds2018
AllocationProject Bike Tax CTF Enterprise Grant PLDO PPRTA TOPS2C-Road
Tax PSST Other
Street Pavement Improvements (MOE) 1,600,000 1,600,000
Street Tree-Annual 10,0005
10,000
Traffic Signal System Upgrades 2,021,000 2,021,000
Traffic Signal Upgrade (TIP) 131,291 631,584 762,875
Tutt Blvd Extension: Dublin to TempletonGap Rd 700,000 700,000
UPRR Nevada & Tejon St CrossingReconstruction (Design) 1,097,507 1,097,507
Ute Valley Park Master PlanImplementation 300,000 300,000
Vanpool Vehicle Purchase 428,000 107,000 535,000
W. Colorado Avenue Reconstruction-31stStreet to U.S. Hwy. 24 5,982,000 5,982,000
Water Footprint Reduction 275,000 275,000
Total 2018 CIP 18,149,623 84,700 90,000 15,545,687 27,672,217 1,153,520 38,976,161 5,096,453 50,000,000 3,891,564 195,259 160,855,184
1 CAB/SeniorCenter/Sertich Ice Center/Municipal Court Payment - Other funding source is energy savings 2 Total project cost is $1,500,000, of which $750,000 is included with the 2018 PPRTA Roadway Safety and Traffic Operations project 3 Red Rock Canyon Purchase COP Payment of $1,128,750 includes $112,875 budgeted in CTF Operating4 Skyview Softball Complex payment of $270,300 - Other funds source includes concession revenue and ballplayer fees (for 2018, it is anticipated that there will be
$86,000 available in Ballfield Fund balance for the COP payment), the balance will be paid from CTF operating funds. 5 Appropriation from the Street Tree Fund Balance
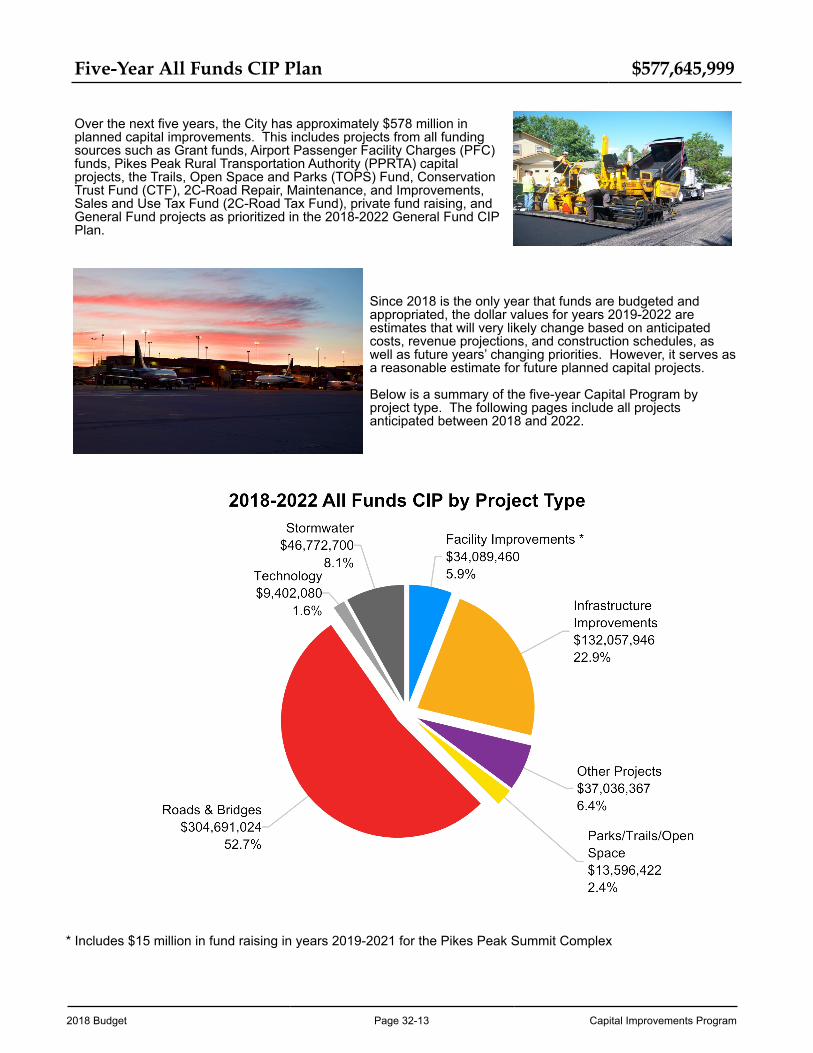
2018 Budget Page 32-13 Capital Improvements Program
Five-Year All Funds CIP Plan $577,645,999
Over the next five years, the City has approximately $578 million inplanned capital improvements. This includes projects from all fundingsources such as Grant funds, Airport Passenger Facility Charges (PFC)funds, Pikes Peak Rural Transportation Authority (PPRTA) capitalprojects, the Trails, Open Space and Parks (TOPS) Fund, ConservationTrust Fund (CTF), 2C-Road Repair, Maintenance, and Improvements,Sales and Use Tax Fund (2C-Road Tax Fund), private fund raising, andGeneral Fund projects as prioritized in the 2018-2022 General Fund CIPPlan.
Since 2018 is the only year that funds are budgeted and appropriated, the dollar values for years 2019-2022 are estimates that will very likely change based on anticipated costs, revenue projections, and construction schedules, as well as future years’ changing priorities. However, it serves as a reasonable estimate for future planned capital projects.
Below is a summary of the five-year Capital Program by project type. The following pages include all projects anticipated between 2018 and 2022.
* Includes $15 million in fund raising in years 2019-2021 for the Pikes Peak Summit Complex
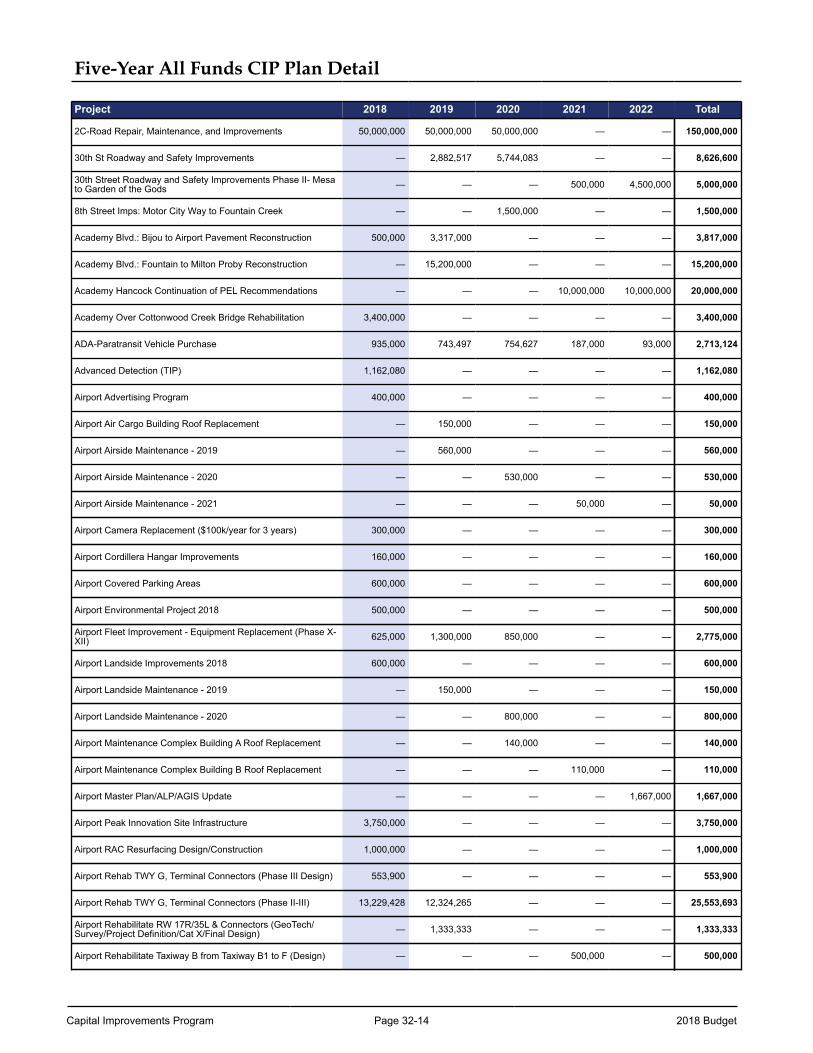
Capital Improvements Program Page 32-14 2018 Budget
Five-Year All Funds CIP Plan Detail
Project 2018 2019 2020 2021 2022 Total
2C-Road Repair, Maintenance, and Improvements 50,000,000 50,000,000 50,000,000 — — 150,000,000
30th St Roadway and Safety Improvements — 2,882,517 5,744,083 — — 8,626,600
30th Street Roadway and Safety Improvements Phase II- Mesato Garden of the Gods — — — 500,000 4,500,000 5,000,000
8th Street Imps: Motor City Way to Fountain Creek — — 1,500,000 — — 1,500,000
Academy Blvd.: Bijou to Airport Pavement Reconstruction 500,000 3,317,000 — — — 3,817,000
Academy Blvd.: Fountain to Milton Proby Reconstruction — 15,200,000 — — — 15,200,000
Academy Hancock Continuation of PEL Recommendations — — — 10,000,000 10,000,000 20,000,000
Academy Over Cottonwood Creek Bridge Rehabilitation 3,400,000 — — — — 3,400,000
ADA-Paratransit Vehicle Purchase 935,000 743,497 754,627 187,000 93,000 2,713,124
Advanced Detection (TIP) 1,162,080 — — — — 1,162,080
Airport Advertising Program 400,000 — — — — 400,000
Airport Air Cargo Building Roof Replacement — 150,000 — — — 150,000
Airport Airside Maintenance - 2019 — 560,000 — — — 560,000
Airport Airside Maintenance - 2020 — — 530,000 — — 530,000
Airport Airside Maintenance - 2021 — — — 50,000 — 50,000
Airport Camera Replacement ($100k/year for 3 years) 300,000 — — — — 300,000
Airport Cordillera Hangar Improvements 160,000 — — — — 160,000
Airport Covered Parking Areas 600,000 — — — — 600,000
Airport Environmental Project 2018 500,000 — — — — 500,000
Airport Fleet Improvement - Equipment Replacement (Phase X-XII) 625,000 1,300,000 850,000 — — 2,775,000
Airport Landside Improvements 2018 600,000 — — — — 600,000
Airport Landside Maintenance - 2019 — 150,000 — — — 150,000
Airport Landside Maintenance - 2020 — — 800,000 — — 800,000
Airport Maintenance Complex Building A Roof Replacement — — 140,000 — — 140,000
Airport Maintenance Complex Building B Roof Replacement — — — 110,000 — 110,000
Airport Master Plan/ALP/AGIS Update — — — — 1,667,000 1,667,000
Airport Peak Innovation Site Infrastructure 3,750,000 — — — — 3,750,000
Airport RAC Resurfacing Design/Construction 1,000,000 — — — — 1,000,000
Airport Rehab TWY G, Terminal Connectors (Phase III Design) 553,900 — — — — 553,900
Airport Rehab TWY G, Terminal Connectors (Phase II-III) 13,229,428 12,324,265 — — — 25,553,693
Airport Rehabilitate RW 17R/35L & Connectors (GeoTech/Survey/Project Definition/Cat X/Final Design) — 1,333,333 — — — 1,333,333
Airport Rehabilitate Taxiway B from Taxiway B1 to F (Design) — — — 500,000 — 500,000
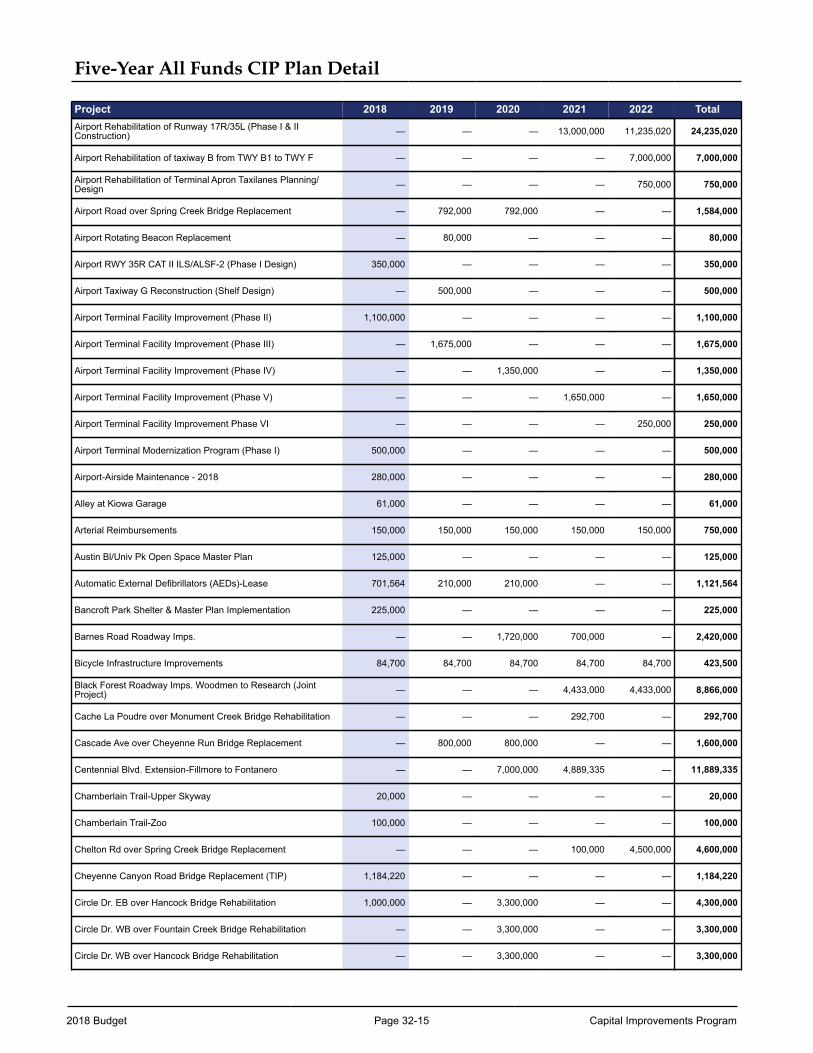
2018 Budget Page 32-15 Capital Improvements Program
Five-Year All Funds CIP Plan Detail
Project 2018 2019 2020 2021 2022 TotalAirport Rehabilitation of Runway 17R/35L (Phase I & IIConstruction) — — — 13,000,000 11,235,020 24,235,020
Airport Rehabilitation of taxiway B from TWY B1 to TWY F — — — — 7,000,000 7,000,000
Airport Rehabilitation of Terminal Apron Taxilanes Planning/Design — — — — 750,000 750,000
Airport Road over Spring Creek Bridge Replacement — 792,000 792,000 — — 1,584,000
Airport Rotating Beacon Replacement — 80,000 — — — 80,000
Airport RWY 35R CAT II ILS/ALSF-2 (Phase I Design) 350,000 — — — — 350,000
Airport Taxiway G Reconstruction (Shelf Design) — 500,000 — — — 500,000
Airport Terminal Facility Improvement (Phase II) 1,100,000 — — — — 1,100,000
Airport Terminal Facility Improvement (Phase III) — 1,675,000 — — — 1,675,000
Airport Terminal Facility Improvement (Phase IV) — — 1,350,000 — — 1,350,000
Airport Terminal Facility Improvement (Phase V) — — — 1,650,000 — 1,650,000
Airport Terminal Facility Improvement Phase VI — — — — 250,000 250,000
Airport Terminal Modernization Program (Phase I) 500,000 — — — — 500,000
Airport-Airside Maintenance - 2018 280,000 — — — — 280,000
Alley at Kiowa Garage 61,000 — — — — 61,000
Arterial Reimbursements 150,000 150,000 150,000 150,000 150,000 750,000
Austin Bl/Univ Pk Open Space Master Plan 125,000 — — — — 125,000
Automatic External Defibrillators (AEDs)-Lease 701,564 210,000 210,000 — — 1,121,564
Bancroft Park Shelter & Master Plan Implementation 225,000 — — — — 225,000
Barnes Road Roadway Imps. — — 1,720,000 700,000 — 2,420,000
Bicycle Infrastructure Improvements 84,700 84,700 84,700 84,700 84,700 423,500
Black Forest Roadway Imps. Woodmen to Research (JointProject) — — — 4,433,000 4,433,000 8,866,000
Cache La Poudre over Monument Creek Bridge Rehabilitation — — — 292,700 — 292,700
Cascade Ave over Cheyenne Run Bridge Replacement — 800,000 800,000 — — 1,600,000
Centennial Blvd. Extension-Fillmore to Fontanero — — 7,000,000 4,889,335 — 11,889,335
Chamberlain Trail-Upper Skyway 20,000 — — — — 20,000
Chamberlain Trail-Zoo 100,000 — — — — 100,000
Chelton Rd over Spring Creek Bridge Replacement — — — 100,000 4,500,000 4,600,000
Cheyenne Canyon Road Bridge Replacement (TIP) 1,184,220 — — — — 1,184,220
Circle Dr. EB over Hancock Bridge Rehabilitation 1,000,000 — 3,300,000 — — 4,300,000
Circle Dr. WB over Fountain Creek Bridge Rehabilitation — — 3,300,000 — — 3,300,000
Circle Dr. WB over Hancock Bridge Rehabilitation — — 3,300,000 — — 3,300,000
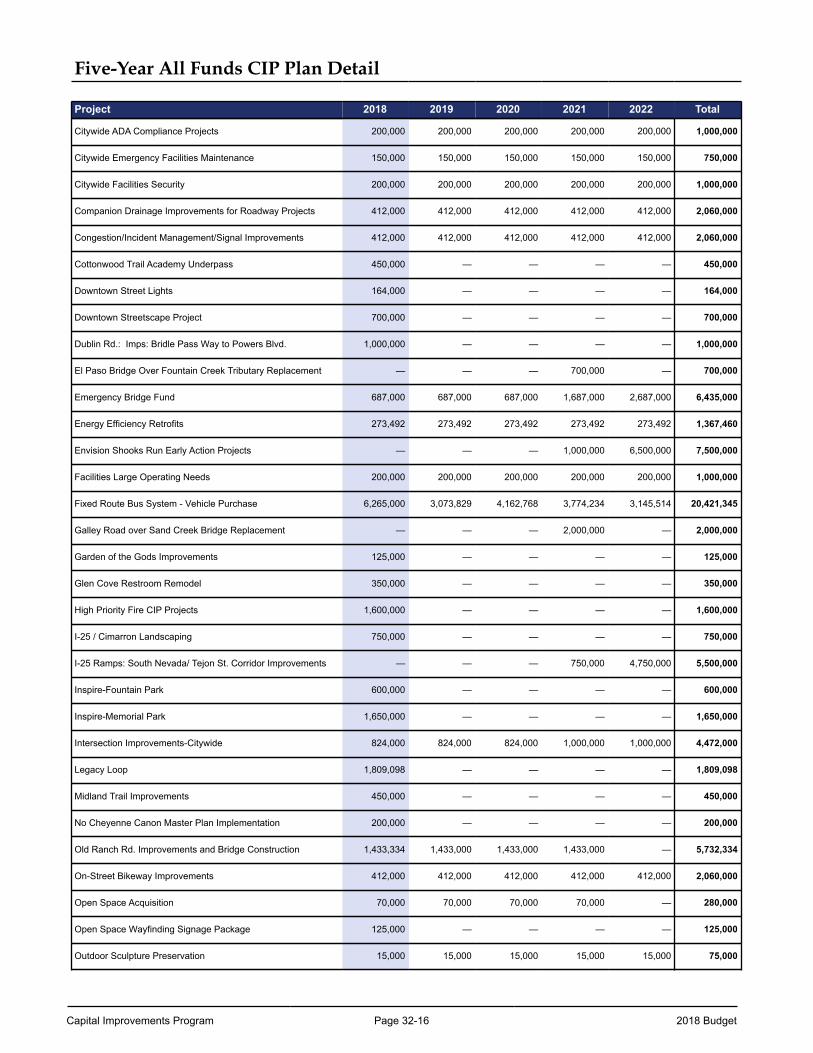
Capital Improvements Program Page 32-16 2018 Budget
Five-Year All Funds CIP Plan Detail
Project 2018 2019 2020 2021 2022 Total
Citywide ADA Compliance Projects 200,000 200,000 200,000 200,000 200,000 1,000,000
Citywide Emergency Facilities Maintenance 150,000 150,000 150,000 150,000 150,000 750,000
Citywide Facilities Security 200,000 200,000 200,000 200,000 200,000 1,000,000
Companion Drainage Improvements for Roadway Projects 412,000 412,000 412,000 412,000 412,000 2,060,000
Congestion/Incident Management/Signal Improvements 412,000 412,000 412,000 412,000 412,000 2,060,000
Cottonwood Trail Academy Underpass 450,000 — — — — 450,000
Downtown Street Lights 164,000 — — — — 164,000
Downtown Streetscape Project 700,000 — — — — 700,000
Dublin Rd.: Imps: Bridle Pass Way to Powers Blvd. 1,000,000 — — — — 1,000,000
El Paso Bridge Over Fountain Creek Tributary Replacement — — — 700,000 — 700,000
Emergency Bridge Fund 687,000 687,000 687,000 1,687,000 2,687,000 6,435,000
Energy Efficiency Retrofits 273,492 273,492 273,492 273,492 273,492 1,367,460
Envision Shooks Run Early Action Projects — — — 1,000,000 6,500,000 7,500,000
Facilities Large Operating Needs 200,000 200,000 200,000 200,000 200,000 1,000,000
Fixed Route Bus System - Vehicle Purchase 6,265,000 3,073,829 4,162,768 3,774,234 3,145,514 20,421,345
Galley Road over Sand Creek Bridge Replacement — — — 2,000,000 — 2,000,000
Garden of the Gods Improvements 125,000 — — — — 125,000
Glen Cove Restroom Remodel 350,000 — — — — 350,000
High Priority Fire CIP Projects 1,600,000 — — — — 1,600,000
I-25 / Cimarron Landscaping 750,000 — — — — 750,000
I-25 Ramps: South Nevada/ Tejon St. Corridor Improvements — — — 750,000 4,750,000 5,500,000
Inspire-Fountain Park 600,000 — — — — 600,000
Inspire-Memorial Park 1,650,000 — — — — 1,650,000
Intersection Improvements-Citywide 824,000 824,000 824,000 1,000,000 1,000,000 4,472,000
Legacy Loop 1,809,098 — — — — 1,809,098
Midland Trail Improvements 450,000 — — — — 450,000
No Cheyenne Canon Master Plan Implementation 200,000 — — — — 200,000
Old Ranch Rd. Improvements and Bridge Construction 1,433,334 1,433,000 1,433,000 1,433,000 — 5,732,334
On-Street Bikeway Improvements 412,000 412,000 412,000 412,000 412,000 2,060,000
Open Space Acquisition 70,000 70,000 70,000 70,000 — 280,000
Open Space Wayfinding Signage Package 125,000 — — — — 125,000
Outdoor Sculpture Preservation 15,000 15,000 15,000 15,000 15,000 75,000
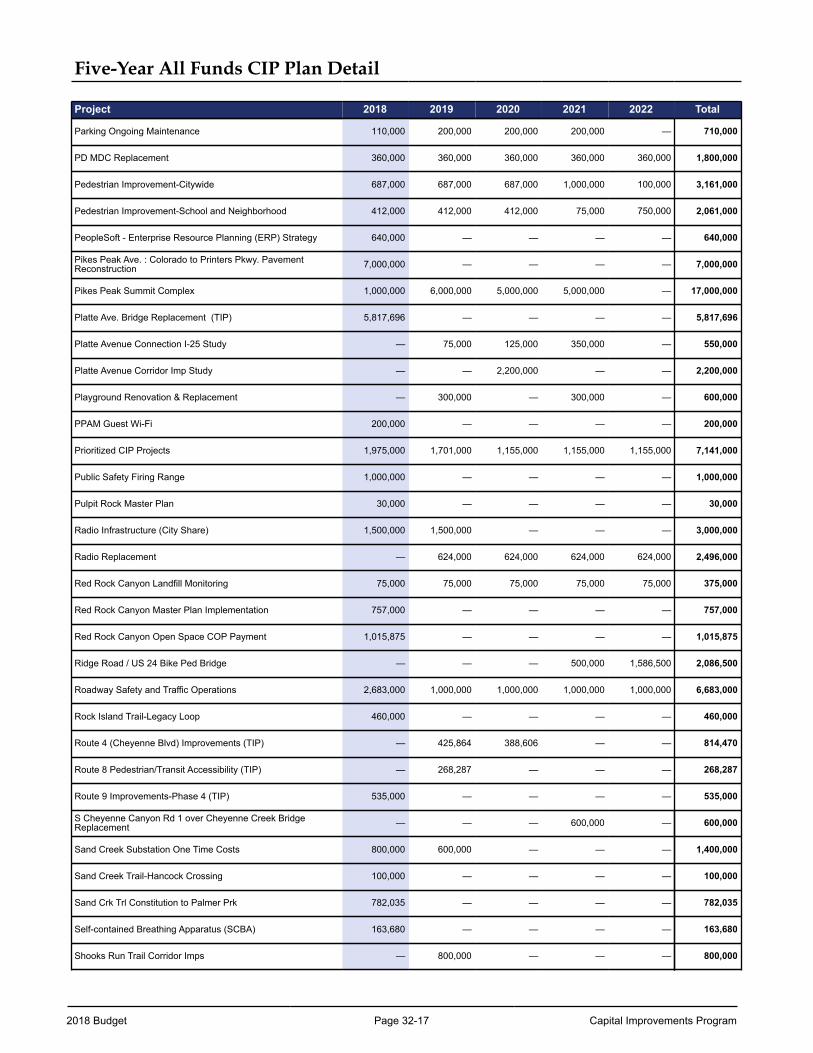
2018 Budget Page 32-17 Capital Improvements Program
Five-Year All Funds CIP Plan Detail
Project 2018 2019 2020 2021 2022 Total
Parking Ongoing Maintenance 110,000 200,000 200,000 200,000 — 710,000
PD MDC Replacement 360,000 360,000 360,000 360,000 360,000 1,800,000
Pedestrian Improvement-Citywide 687,000 687,000 687,000 1,000,000 100,000 3,161,000
Pedestrian Improvement-School and Neighborhood 412,000 412,000 412,000 75,000 750,000 2,061,000
PeopleSoft - Enterprise Resource Planning (ERP) Strategy 640,000 — — — — 640,000
Pikes Peak Ave. : Colorado to Printers Pkwy. PavementReconstruction 7,000,000 — — — — 7,000,000
Pikes Peak Summit Complex 1,000,000 6,000,000 5,000,000 5,000,000 — 17,000,000
Platte Ave. Bridge Replacement (TIP) 5,817,696 — — — — 5,817,696
Platte Avenue Connection I-25 Study — 75,000 125,000 350,000 — 550,000
Platte Avenue Corridor Imp Study — — 2,200,000 — — 2,200,000
Playground Renovation & Replacement — 300,000 — 300,000 — 600,000
PPAM Guest Wi-Fi 200,000 — — — — 200,000
Prioritized CIP Projects 1,975,000 1,701,000 1,155,000 1,155,000 1,155,000 7,141,000
Public Safety Firing Range 1,000,000 — — — — 1,000,000
Pulpit Rock Master Plan 30,000 — — — — 30,000
Radio Infrastructure (City Share) 1,500,000 1,500,000 — — — 3,000,000
Radio Replacement — 624,000 624,000 624,000 624,000 2,496,000
Red Rock Canyon Landfill Monitoring 75,000 75,000 75,000 75,000 75,000 375,000
Red Rock Canyon Master Plan Implementation 757,000 — — — — 757,000
Red Rock Canyon Open Space COP Payment 1,015,875 — — — — 1,015,875
Ridge Road / US 24 Bike Ped Bridge — — — 500,000 1,586,500 2,086,500
Roadway Safety and Traffic Operations 2,683,000 1,000,000 1,000,000 1,000,000 1,000,000 6,683,000
Rock Island Trail-Legacy Loop 460,000 — — — — 460,000
Route 4 (Cheyenne Blvd) Improvements (TIP) — 425,864 388,606 — — 814,470
Route 8 Pedestrian/Transit Accessibility (TIP) — 268,287 — — — 268,287
Route 9 Improvements-Phase 4 (TIP) 535,000 — — — — 535,000
S Cheyenne Canyon Rd 1 over Cheyenne Creek BridgeReplacement — — — 600,000 — 600,000
Sand Creek Substation One Time Costs 800,000 600,000 — — — 1,400,000
Sand Creek Trail-Hancock Crossing 100,000 — — — — 100,000
Sand Crk Trl Constitution to Palmer Prk 782,035 — — — — 782,035
Self-contained Breathing Apparatus (SCBA) 163,680 — — — — 163,680
Shooks Run Trail Corridor Imps — 800,000 — — — 800,000
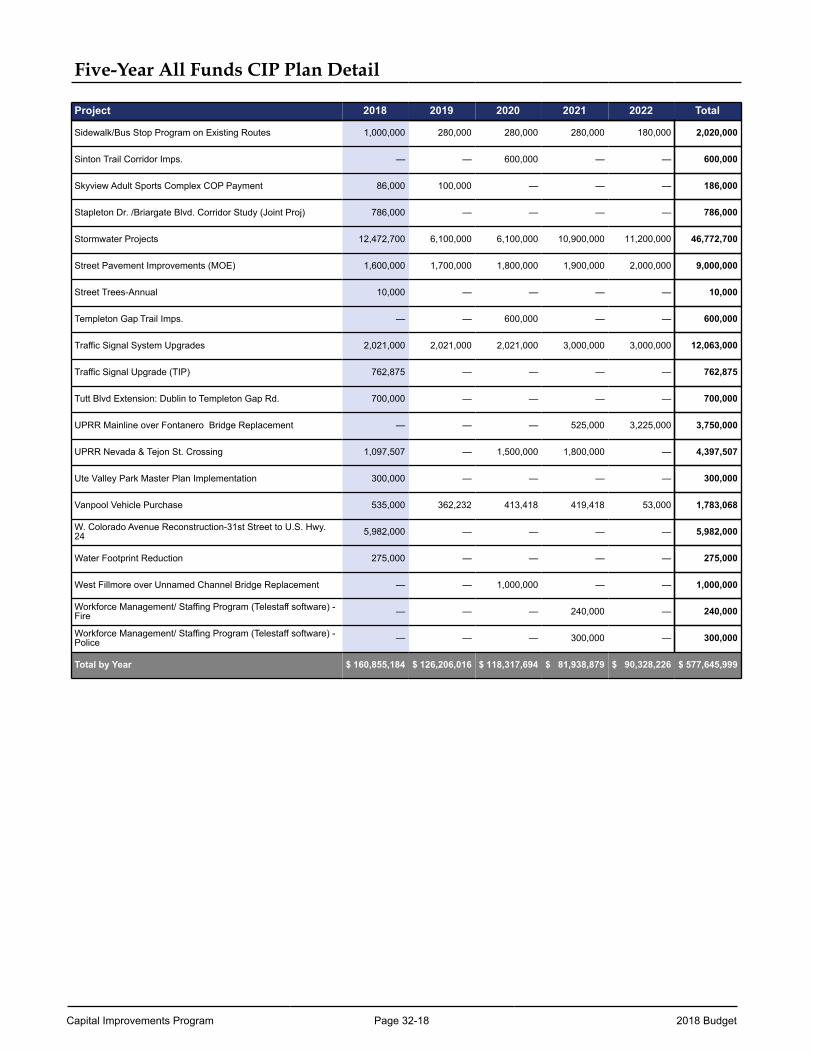
Capital Improvements Program Page 32-18 2018 Budget
Five-Year All Funds CIP Plan Detail
Project 2018 2019 2020 2021 2022 Total
Sidewalk/Bus Stop Program on Existing Routes 1,000,000 280,000 280,000 280,000 180,000 2,020,000
Sinton Trail Corridor Imps. — — 600,000 — — 600,000
Skyview Adult Sports Complex COP Payment 86,000 100,000 — — — 186,000
Stapleton Dr. /Briargate Blvd. Corridor Study (Joint Proj) 786,000 — — — — 786,000
Stormwater Projects 12,472,700 6,100,000 6,100,000 10,900,000 11,200,000 46,772,700
Street Pavement Improvements (MOE) 1,600,000 1,700,000 1,800,000 1,900,000 2,000,000 9,000,000
Street Trees-Annual 10,000 — — — — 10,000
Templeton Gap Trail Imps. — — 600,000 — — 600,000
Traffic Signal System Upgrades 2,021,000 2,021,000 2,021,000 3,000,000 3,000,000 12,063,000
Traffic Signal Upgrade (TIP) 762,875 — — — — 762,875
Tutt Blvd Extension: Dublin to Templeton Gap Rd. 700,000 — — — — 700,000
UPRR Mainline over Fontanero Bridge Replacement — — — 525,000 3,225,000 3,750,000
UPRR Nevada & Tejon St. Crossing 1,097,507 — 1,500,000 1,800,000 — 4,397,507
Ute Valley Park Master Plan Implementation 300,000 — — — — 300,000
Vanpool Vehicle Purchase 535,000 362,232 413,418 419,418 53,000 1,783,068
W. Colorado Avenue Reconstruction-31st Street to U.S. Hwy.24 5,982,000 — — — — 5,982,000
Water Footprint Reduction 275,000 — — — — 275,000
West Fillmore over Unnamed Channel Bridge Replacement — — 1,000,000 — — 1,000,000
Workforce Management/ Staffing Program (Telestaff software) -Fire — — — 240,000 — 240,000
Workforce Management/ Staffing Program (Telestaff software) -Police — — — 300,000 — 300,000
Total by Year $ 160,855,184 $ 126,206,016 $ 118,317,694 $ 81,938,879 $ 90,328,226 $ 577,645,999
2018 Budget Page 32-19 Capital Improvements Program
General Fund Five-Year CIP Prioritization Process
The following strategies were incorporated into the City’s 2018-2022 Five-Year Strategic Plan:
• Develop a five-year CIP program on an annual basis• Consider funding strategies to address the backlog of needs • Address ongoing and deferred maintenance• Reassess use of City facilities/space to maximize utilization • Enhance infrastructure development standards to provide a high return on investment • Renovate or develop infrastructure, roads and buildings, with a low-impact, low-energy approach to reduce
long-term maintenance and operating costs
The Five-Year CIP Plan was updated in 2017 after reviewing the projects with multi-year funding that were in the 2017-2021 plan and evaluating new project requests for funding in years of 2018-2022.
In 2014, a Citywide Facilities Maintenance Committee was established to coordinate facilities maintenance issues and provide annual funding recommendations as part of the budget process on citywide facilities maintenance projects to minimize the City’s risk exposure and maximize the use of its funds to address the highest priority needs.
In order to develop a data-based prioritization of facilities' needs, the Committee works with the County to provide detailed assessments of City facilities and uses this data to prioritize all facilities maintenance needs across the City. The Committee also works with the City's ADA Coordinator, who conducts assessments of City facilities and public areas to identify where the City has the highest ADA non-compliance risk. The Committee further recognizes the importance of the safety and security projects and works with all departments with facilities to evaluate and prioritize the safety and security needs in all City facilities.
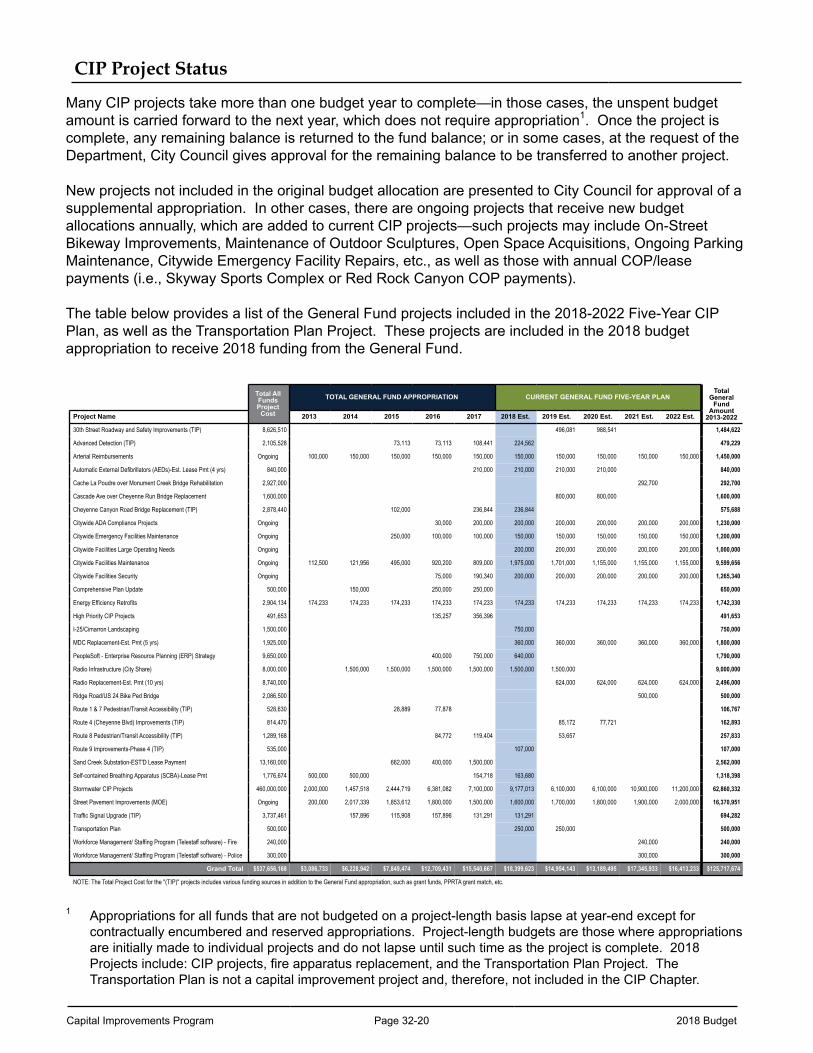
Capital Improvements Program Page 32-20 2018 Budget
CIP Project Status
Many CIP projects take more than one budget year to complete—in those cases, the unspent budget amount is carried forward to the next year, which does not require appropriation1. Once the project is complete, any remaining balance is returned to the fund balance; or in some cases, at the request of the Department, City Council gives approval for the remaining balance to be transferred to another project.
New projects not included in the original budget allocation are presented to City Council for approval of a supplemental appropriation. In other cases, there are ongoing projects that receive new budget allocations annually, which are added to current CIP projects—such projects may include On-Street Bikeway Improvements, Maintenance of Outdoor Sculptures, Open Space Acquisitions, Ongoing Parking Maintenance, Citywide Emergency Facility Repairs, etc., as well as those with annual COP/lease payments (i.e., Skyway Sports Complex or Red Rock Canyon COP payments).
The table below provides a list of the General Fund projects included in the 2018-2022 Five-Year CIP Plan, as well as the Transportation Plan Project. These projects are included in the 2018 budget appropriation to receive 2018 funding from the General Fund.
Total AllFundsProject
Cost
TOTAL GENERAL FUND APPROPRIATION CURRENT GENERAL FUND FIVE-YEAR PLANTotal
GeneralFund
Amount2013-2022Project Name 2013 2014 2015 2016 2017 2018 Est. 2019 Est. 2020 Est. 2021 Est. 2022 Est.
30th Street Roadway and Safety Improvements (TIP) 8,626,510 496,081 988,541 1,484,622
Advanced Detection (TIP) 2,105,528 73,113 73,113 108,441 224,562 479,229
Arterial Reimbursements Ongoing 100,000 150,000 150,000 150,000 150,000 150,000 150,000 150,000 150,000 150,000 1,450,000
Automatic External Defibrillators (AEDs)-Est. Lease Pmt (4 yrs) 840,000 210,000 210,000 210,000 210,000 840,000
Cache La Poudre over Monument Creek Bridge Rehabilitation 2,927,000 292,700 292,700
Cascade Ave over Cheyenne Run Bridge Replacement 1,600,000 800,000 800,000 1,600,000
Cheyenne Canyon Road Bridge Replacement (TIP) 2,878,440 102,000 236,844 236,844 575,688
Citywide ADA Compliance Projects Ongoing 30,000 200,000 200,000 200,000 200,000 200,000 200,000 1,230,000
Citywide Emergency Facilities Maintenance Ongoing 250,000 100,000 100,000 150,000 150,000 150,000 150,000 150,000 1,200,000
Citywide Facilities Large Operating Needs Ongoing 200,000 200,000 200,000 200,000 200,000 1,000,000
Citywide Facilities Maintenance Ongoing 112,500 121,956 495,000 920,200 809,000 1,975,000 1,701,000 1,155,000 1,155,000 1,155,000 9,599,656
Citywide Facilities Security Ongoing 75,000 190,340 200,000 200,000 200,000 200,000 200,000 1,265,340
Comprehensive Plan Update 500,000 150,000 250,000 250,000 650,000
Energy Efficiency Retrofits 2,904,134 174,233 174,233 174,233 174,233 174,233 174,233 174,233 174,233 174,233 174,233 1,742,330
High Priority CIP Projects 491,653 135,257 356,396 491,653
I-25/Cimarron Landscaping 1,500,000 750,000 750,000
MDC Replacement-Est. Pmt (5 yrs) 1,925,000 360,000 360,000 360,000 360,000 360,000 1,800,000
PeopleSoft - Enterprise Resource Planning (ERP) Strategy 9,650,000 400,000 750,000 640,000 1,790,000
Radio Infrastructure (City Share) 8,000,000 1,500,000 1,500,000 1,500,000 1,500,000 1,500,000 1,500,000 9,000,000
Radio Replacement-Est. Pmt (10 yrs) 8,740,000 624,000 624,000 624,000 624,000 2,496,000
Ridge Road/US 24 Bike Ped Bridge 2,086,500 500,000 500,000
Route 1 & 7 Pedestrian/Transit Accessibility (TIP) 528,630 28,889 77,878 106,767
Route 4 (Cheyenne Blvd) Improvements (TIP) 814,470 85,172 77,721 162,893
Route 8 Pedestrian/Transit Accessibility (TIP) 1,289,168 84,772 119,404 53,657 257,833
Route 9 Improvements-Phase 4 (TIP) 535,000 107,000 107,000
Sand Creek Substation-EST'D Lease Payment 13,160,000 662,000 400,000 1,500,000 2,562,000
Self-contained Breathing Apparatus (SCBA)-Lease Pmt 1,776,674 500,000 500,000 154,718 163,680 1,318,398
Stormwater CIP Projects 460,000,000 2,000,000 1,457,518 2,444,719 6,381,082 7,100,000 9,177,013 6,100,000 6,100,000 10,900,000 11,200,000 62,860,332
Street Pavement Improvements (MOE) Ongoing 200,000 2,017,339 1,853,612 1,800,000 1,500,000 1,600,000 1,700,000 1,800,000 1,900,000 2,000,000 16,370,951
Traffic Signal Upgrade (TIP) 3,737,461 157,896 115,908 157,896 131,291 131,291 694,282
Transportation Plan 500,000 250,000 250,000 500,000
Workforce Management/ Staffing Program (Telestaff software) - Fire 240,000 240,000 240,000
Workforce Management/ Staffing Program (Telestaff software) - Police 300,000 300,000 300,000
Grand Total $537,656,168 $3,086,733 $6,228,942 $7,849,474 $12,709,431 $15,540,667 $18,399,623 $14,954,143 $13,189,495 $17,345,933 $16,413,233 $125,717,674
NOTE: The Total Project Cost for the "(TIP)" projects includes various funding sources in addition to the General Fund appropriation, such as grant funds, PPRTA grant match, etc.
1 Appropriations for all funds that are not budgeted on a project-length basis lapse at year-end except for contractually encumbered and reserved appropriations. Project-length budgets are those where appropriations are initially made to individual projects and do not lapse until such time as the project is complete. 2018 Projects include: CIP projects, fire apparatus replacement, and the Transportation Plan Project. The Transportation Plan is not a capital improvement project and, therefore, not included in the CIP Chapter.
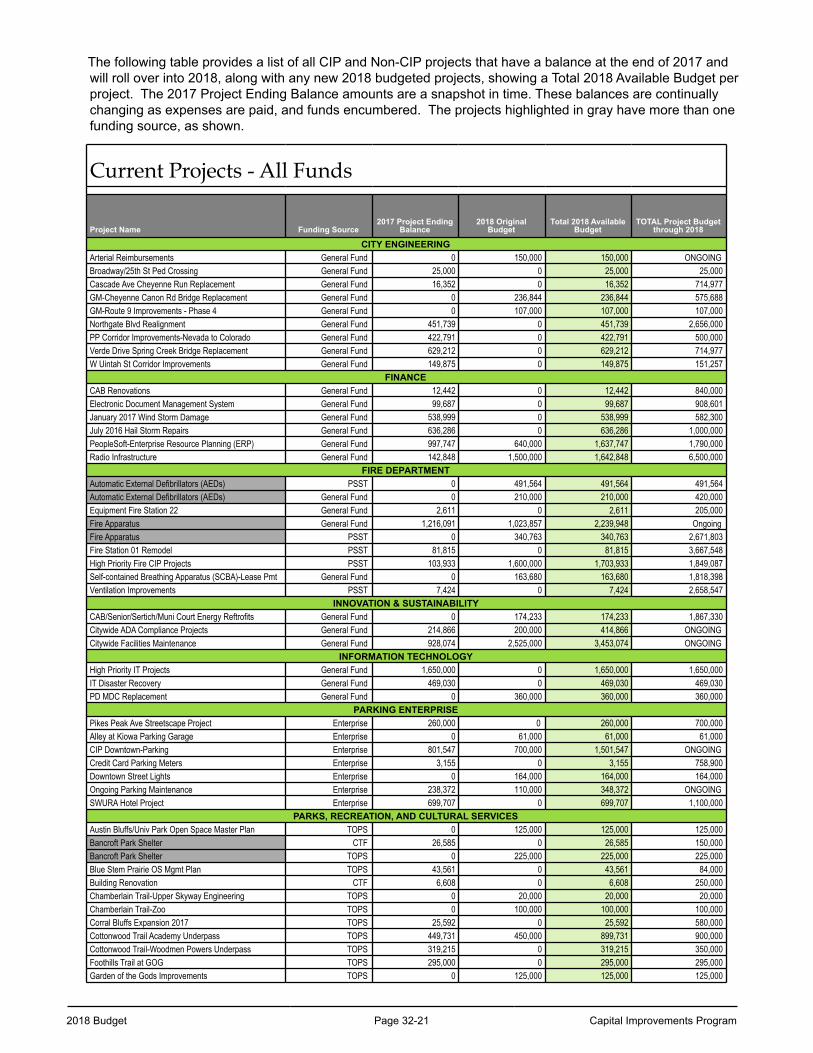
2018 Budget Page 32-21 Capital Improvements Program
The following table provides a list of all CIP and Non-CIP projects that have a balance at the end of 2017 and will roll over into 2018, along with any new 2018 budgeted projects, showing a Total 2018 Available Budget per project. The 2017 Project Ending Balance amounts are a snapshot in time. These balances are continually changing as expenses are paid, and funds encumbered. The projects highlighted in gray have more than one funding source, as shown.
Current Projects - All Funds
Project Name Funding Source2017 Project Ending
Balance2018 Original
BudgetTotal 2018 Available
BudgetTOTAL Project Budget
through 2018
CITY ENGINEERINGArterial Reimbursements General Fund 0 150,000 150,000 ONGOINGBroadway/25th St Ped Crossing General Fund 25,000 0 25,000 25,000Cascade Ave Cheyenne Run Replacement General Fund 16,352 0 16,352 714,977GM-Cheyenne Canon Rd Bridge Replacement General Fund 0 236,844 236,844 575,688GM-Route 9 Improvements - Phase 4 General Fund 0 107,000 107,000 107,000Northgate Blvd Realignment General Fund 451,739 0 451,739 2,656,000PP Corridor Improvements-Nevada to Colorado General Fund 422,791 0 422,791 500,000Verde Drive Spring Creek Bridge Replacement General Fund 629,212 0 629,212 714,977W Uintah St Corridor Improvements General Fund 149,875 0 149,875 151,257
FINANCECAB Renovations General Fund 12,442 0 12,442 840,000Electronic Document Management System General Fund 99,687 0 99,687 908,601January 2017 Wind Storm Damage General Fund 538,999 0 538,999 582,300July 2016 Hail Storm Repairs General Fund 636,286 0 636,286 1,000,000PeopleSoft-Enterprise Resource Planning (ERP) General Fund 997,747 640,000 1,637,747 1,790,000Radio Infrastructure General Fund 142,848 1,500,000 1,642,848 6,500,000
FIRE DEPARTMENTAutomatic External Defibrillators (AEDs) PSST 0 491,564 491,564 491,564Automatic External Defibrillators (AEDs) General Fund 0 210,000 210,000 420,000Equipment Fire Station 22 General Fund 2,611 0 2,611 205,000Fire Apparatus General Fund 1,216,091 1,023,857 2,239,948 OngoingFire Apparatus PSST 0 340,763 340,763 2,671,803Fire Station 01 Remodel PSST 81,815 0 81,815 3,667,548High Priority Fire CIP Projects PSST 103,933 1,600,000 1,703,933 1,849,087Self-contained Breathing Apparatus (SCBA)-Lease Pmt General Fund 0 163,680 163,680 1,818,398Ventilation Improvements PSST 7,424 0 7,424 2,658,547
INNOVATION & SUSTAINABILITYCAB/Senior/Sertich/Muni Court Energy Reftrofits General Fund 0 174,233 174,233 1,867,330Citywide ADA Compliance Projects General Fund 214,866 200,000 414,866 ONGOINGCitywide Facilities Maintenance General Fund 928,074 2,525,000 3,453,074 ONGOING
INFORMATION TECHNOLOGYHigh Priority IT Projects General Fund 1,650,000 0 1,650,000 1,650,000IT Disaster Recovery General Fund 469,030 0 469,030 469,030PD MDC Replacement General Fund 0 360,000 360,000 360,000
PARKING ENTERPRISEPikes Peak Ave Streetscape Project Enterprise 260,000 0 260,000 700,000Alley at Kiowa Parking Garage Enterprise 0 61,000 61,000 61,000CIP Downtown-Parking Enterprise 801,547 700,000 1,501,547 ONGOINGCredit Card Parking Meters Enterprise 3,155 0 3,155 758,900Downtown Street Lights Enterprise 0 164,000 164,000 164,000Ongoing Parking Maintenance Enterprise 238,372 110,000 348,372 ONGOINGSWURA Hotel Project Enterprise 699,707 0 699,707 1,100,000
PARKS, RECREATION, AND CULTURAL SERVICESAustin Bluffs/Univ Park Open Space Master Plan TOPS 0 125,000 125,000 125,000Bancroft Park Shelter CTF 26,585 0 26,585 150,000Bancroft Park Shelter TOPS 0 225,000 225,000 225,000Blue Stem Prairie OS Mgmt Plan TOPS 43,561 0 43,561 84,000Building Renovation CTF 6,608 0 6,608 250,000Chamberlain Trail-Upper Skyway Engineering TOPS 0 20,000 20,000 20,000Chamberlain Trail-Zoo TOPS 0 100,000 100,000 100,000Corral Bluffs Expansion 2017 TOPS 25,592 0 25,592 580,000Cottonwood Trail Academy Underpass TOPS 449,731 450,000 899,731 900,000Cottonwood Trail-Woodmen Powers Underpass TOPS 319,215 0 319,215 350,000Foothills Trail at GOG TOPS 295,000 0 295,000 295,000Garden of the Gods Improvements TOPS 0 125,000 125,000 125,000
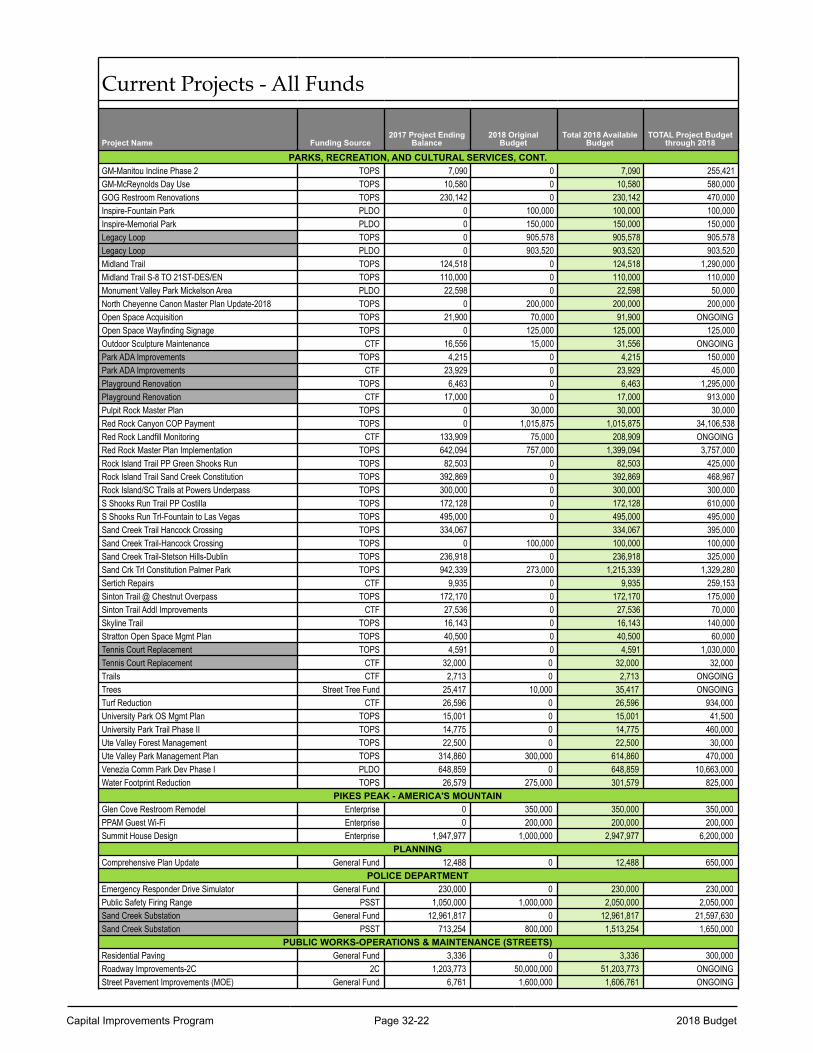
Capital Improvements Program Page 32-22 2018 Budget
Current Projects - All Funds
Project Name Funding Source2017 Project Ending
Balance2018 Original
BudgetTotal 2018 Available
BudgetTOTAL Project Budget
through 2018
PARKS, RECREATION, AND CULTURAL SERVICES, CONT.GM-Manitou Incline Phase 2 TOPS 7,090 0 7,090 255,421GM-McReynolds Day Use TOPS 10,580 0 10,580 580,000GOG Restroom Renovations TOPS 230,142 0 230,142 470,000Inspire-Fountain Park PLDO 0 100,000 100,000 100,000Inspire-Memorial Park PLDO 0 150,000 150,000 150,000Legacy Loop TOPS 0 905,578 905,578 905,578Legacy Loop PLDO 0 903,520 903,520 903,520Midland Trail TOPS 124,518 0 124,518 1,290,000Midland Trail S-8 TO 21ST-DES/EN TOPS 110,000 0 110,000 110,000Monument Valley Park Mickelson Area PLDO 22,598 0 22,598 50,000North Cheyenne Canon Master Plan Update-2018 TOPS 0 200,000 200,000 200,000Open Space Acquisition TOPS 21,900 70,000 91,900 ONGOINGOpen Space Wayfinding Signage TOPS 0 125,000 125,000 125,000Outdoor Sculpture Maintenance CTF 16,556 15,000 31,556 ONGOINGPark ADA Improvements TOPS 4,215 0 4,215 150,000Park ADA Improvements CTF 23,929 0 23,929 45,000Playground Renovation TOPS 6,463 0 6,463 1,295,000Playground Renovation CTF 17,000 0 17,000 913,000Pulpit Rock Master Plan TOPS 0 30,000 30,000 30,000Red Rock Canyon COP Payment TOPS 0 1,015,875 1,015,875 34,106,538Red Rock Landfill Monitoring CTF 133,909 75,000 208,909 ONGOINGRed Rock Master Plan Implementation TOPS 642,094 757,000 1,399,094 3,757,000Rock Island Trail PP Green Shooks Run TOPS 82,503 0 82,503 425,000Rock Island Trail Sand Creek Constitution TOPS 392,869 0 392,869 468,967Rock Island/SC Trails at Powers Underpass TOPS 300,000 0 300,000 300,000S Shooks Run Trail PP Costilla TOPS 172,128 0 172,128 610,000S Shooks Run Trl-Fountain to Las Vegas TOPS 495,000 0 495,000 495,000Sand Creek Trail Hancock Crossing TOPS 334,067 334,067 395,000Sand Creek Trail-Hancock Crossing TOPS 0 100,000 100,000 100,000Sand Creek Trail-Stetson Hills-Dublin TOPS 236,918 0 236,918 325,000Sand Crk Trl Constitution Palmer Park TOPS 942,339 273,000 1,215,339 1,329,280Sertich Repairs CTF 9,935 0 9,935 259,153Sinton Trail @ Chestnut Overpass TOPS 172,170 0 172,170 175,000Sinton Trail Addl Improvements CTF 27,536 0 27,536 70,000Skyline Trail TOPS 16,143 0 16,143 140,000Stratton Open Space Mgmt Plan TOPS 40,500 0 40,500 60,000Tennis Court Replacement TOPS 4,591 0 4,591 1,030,000Tennis Court Replacement CTF 32,000 0 32,000 32,000Trails CTF 2,713 0 2,713 ONGOINGTrees Street Tree Fund 25,417 10,000 35,417 ONGOINGTurf Reduction CTF 26,596 0 26,596 934,000University Park OS Mgmt Plan TOPS 15,001 0 15,001 41,500University Park Trail Phase II TOPS 14,775 0 14,775 460,000Ute Valley Forest Management TOPS 22,500 0 22,500 30,000Ute Valley Park Management Plan TOPS 314,860 300,000 614,860 470,000Venezia Comm Park Dev Phase I PLDO 648,859 0 648,859 10,663,000Water Footprint Reduction TOPS 26,579 275,000 301,579 825,000
PIKES PEAK - AMERICA'S MOUNTAINGlen Cove Restroom Remodel Enterprise 0 350,000 350,000 350,000PPAM Guest Wi-Fi Enterprise 0 200,000 200,000 200,000Summit House Design Enterprise 1,947,977 1,000,000 2,947,977 6,200,000
PLANNINGComprehensive Plan Update General Fund 12,488 0 12,488 650,000
POLICE DEPARTMENTEmergency Responder Drive Simulator General Fund 230,000 0 230,000 230,000Public Safety Firing Range PSST 1,050,000 1,000,000 2,050,000 2,050,000Sand Creek Substation General Fund 12,961,817 0 12,961,817 21,597,630Sand Creek Substation PSST 713,254 800,000 1,513,254 1,650,000
PUBLIC WORKS-OPERATIONS & MAINTENANCE (STREETS)Residential Paving General Fund 3,336 0 3,336 300,000Roadway Improvements-2C 2C 1,203,773 50,000,000 51,203,773 ONGOINGStreet Pavement Improvements (MOE) General Fund 6,761 1,600,000 1,606,761 ONGOING
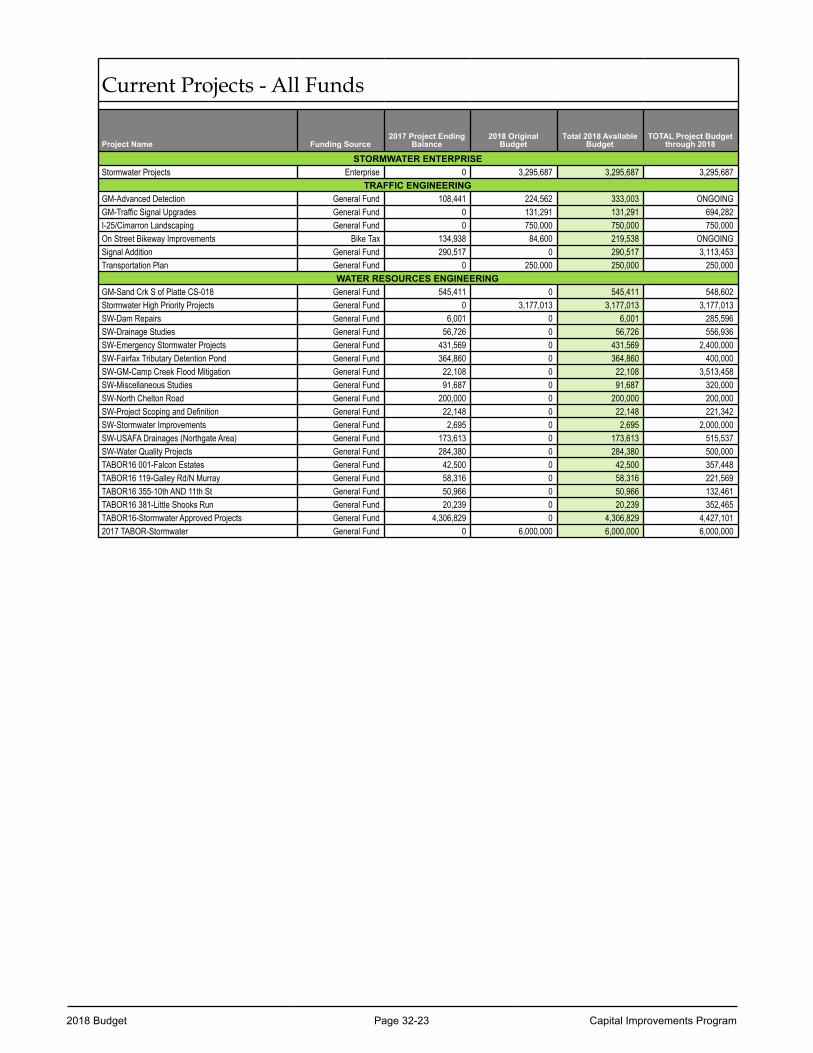
2018 Budget Page 32-23 Capital Improvements Program
Current Projects - All Funds
Project Name Funding Source2017 Project Ending
Balance2018 Original
BudgetTotal 2018 Available
BudgetTOTAL Project Budget
through 2018
STORMWATER ENTERPRISEStormwater Projects Enterprise 0 3,295,687 3,295,687 3,295,687
TRAFFIC ENGINEERINGGM-Advanced Detection General Fund 108,441 224,562 333,003 ONGOINGGM-Traffic Signal Upgrades General Fund 0 131,291 131,291 694,282I-25/Cimarron Landscaping General Fund 0 750,000 750,000 750,000On Street Bikeway Improvements Bike Tax 134,938 84,600 219,538 ONGOINGSignal Addition General Fund 290,517 0 290,517 3,113,453Transportation Plan General Fund 0 250,000 250,000 250,000
WATER RESOURCES ENGINEERINGGM-Sand Crk S of Platte CS-018 General Fund 545,411 0 545,411 548,602Stormwater High Priority Projects General Fund 0 3,177,013 3,177,013 3,177,013SW-Dam Repairs General Fund 6,001 0 6,001 285,596SW-Drainage Studies General Fund 56,726 0 56,726 556,936SW-Emergency Stormwater Projects General Fund 431,569 0 431,569 2,400,000SW-Fairfax Tributary Detention Pond General Fund 364,860 0 364,860 400,000SW-GM-Camp Creek Flood Mitigation General Fund 22,108 0 22,108 3,513,458SW-Miscellaneous Studies General Fund 91,687 0 91,687 320,000SW-North Chelton Road General Fund 200,000 0 200,000 200,000SW-Project Scoping and Definition General Fund 22,148 0 22,148 221,342SW-Stormwater Improvements General Fund 2,695 0 2,695 2,000,000SW-USAFA Drainages (Northgate Area) General Fund 173,613 0 173,613 515,537SW-Water Quality Projects General Fund 284,380 0 284,380 500,000TABOR16 001-Falcon Estates General Fund 42,500 0 42,500 357,448TABOR16 119-Galley Rd/N Murray General Fund 58,316 0 58,316 221,569TABOR16 355-10th AND 11th St General Fund 50,966 0 50,966 132,461TABOR16 381-Little Shooks Run General Fund 20,239 0 20,239 352,465TABOR16-Stormwater Approved Projects General Fund 4,306,829 0 4,306,829 4,427,1012017 TABOR-Stormwater General Fund 0 6,000,000 6,000,000 6,000,000
Capital Improvements Program Page 32-24 2018 Budget
Stormwater 20-Year IGA Plan $460,000,000
In 2016, the City of Colorado Springs negotiated an Intergovernmental Agreement (IGA) with Pueblo County in order to resolve a dispute regarding Colorado Springs Utilities’ 1041 Permit for the Southern Delivery System and the City’s funding of its stormwater control program. On April 20, 2016, City Council passed Resolution No. 36-16 approving the IGA, which commits to fund $460 million from 2016 to 2035. In July 2016, the draft Stormwater Program Implementation Plan was released, which provides greater details of the program—including the programs described below.
MS4 Program Implementation. The City’s Municipal Separate Storm Sewer System Permit (MS4) Program was developed to protect public health, safety, and the environment by complying with the conditions of the MS4 permit issued to the City by CDPHE. The MS4 permit requires the City to implement best management practices (BMPs) to minimize the effect of urban runoff on water quality. The MS4 Program addresses residential/commercial development, industrial sites, construction sites, municipal facilities, and illicit discharges through reviews, inspections, enforcement, and education/outreach.
The City’s goal is to have an MS4 Program with the following attributes:• Compliant program – assures full compliance with MS4 permit conditions• Sustainable program – has long-term sustainability in terms of financing and staffing• Proactive program – anticipates changes in MS4 and other environmental program regulations • Beneficial program – protects and enhances water quality within the watershed• Cost-effective program – develops efficiencies and balances MS4 needs with capital project
needs
Capital Program Improvement. The Capital Program consists of the staff, budget, and project control systems to plan, design, and construct larger-scale stormwater infrastructure projects. The purposes of the Capital Program Improvement Plan are to prepare an updated and reliable CIP list and develop a strategy and improved process for project implementation.
On November 7, 2017, voters approved ballot measure 2A that permits the City of Colorado Springs to collect a monthly stormwater fee beginning July 1, 2018, in order to fund critical projects. The City's Stormwater Enterprise will collect the fee and manage stormwater projects at that time. Until July 1, 2018, stormwater projects will fall under the purview of the General Fund. The $6 million of TABOR revenue retention shall remain in the General Fund until project completion.
Public Outreach and Communication Improvement Strategy. The City is in the process of improving its Stormwater Program. Its primary focus is to evaluate and develop a strategy for improving two major components of the Stormwater Program – the ongoing stormwater system operation, including the MS4 Program, and implementation of capital improvement projects for the stormwater system. To complement and support those efforts, the City has developed a strategy for improving public education and outreach related to the Stormwater Program.
The list of CIP projects, including the estimated year and costs are outlined in the Implementation Plan, which is available at: https://coloradosprings.gov/stormwater/page/stormwater-program-implementation-plan.
On the following page is the list of CIP projects from Table 1-1 of the Implementation Plan.
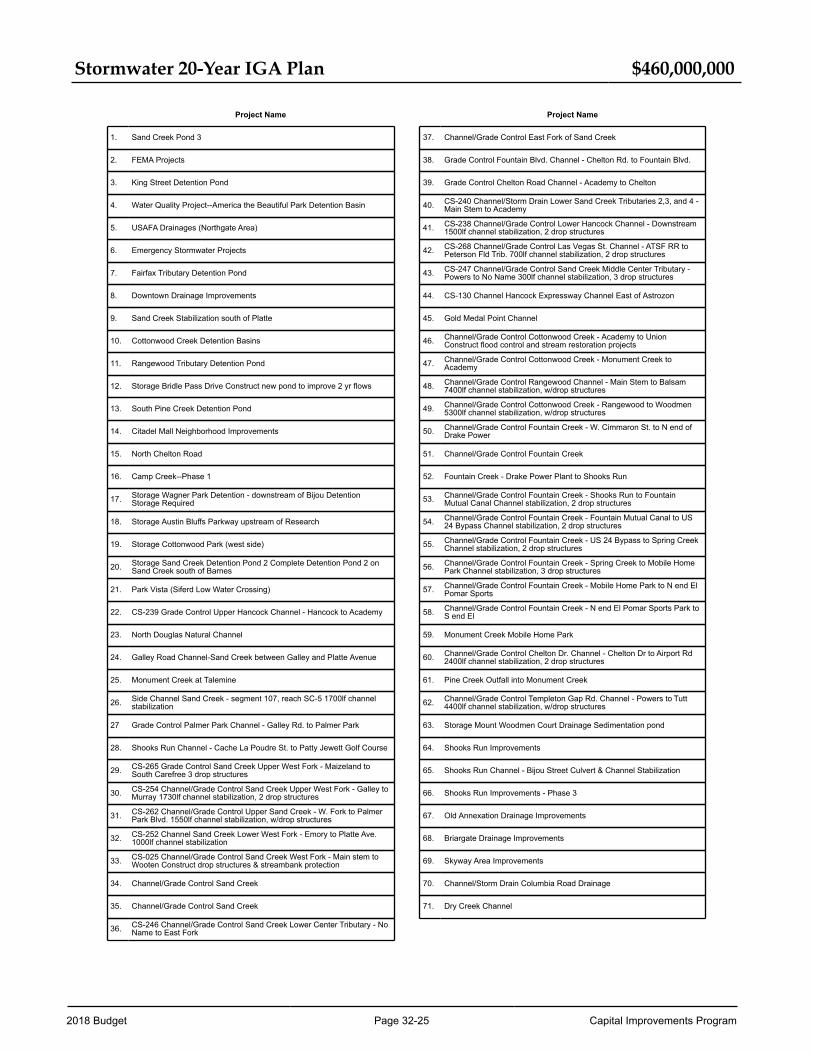
2018 Budget Page 32-25 Capital Improvements Program
Stormwater 20-Year IGA Plan $460,000,000
Project Name Project Name
1. Sand Creek Pond 3 37. Channel/Grade Control East Fork of Sand Creek
2. FEMA Projects 38. Grade Control Fountain Blvd. Channel - Chelton Rd. to Fountain Blvd.
3. King Street Detention Pond 39. Grade Control Chelton Road Channel - Academy to Chelton
4. Water Quality Project--America the Beautiful Park Detention Basin 40. CS-240 Channel/Storm Drain Lower Sand Creek Tributaries 2,3, and 4 -Main Stem to Academy
5. USAFA Drainages (Northgate Area) 41. CS-238 Channel/Grade Control Lower Hancock Channel - Downstream1500lf channel stabilization, 2 drop structures
6. Emergency Stormwater Projects 42. CS-268 Channel/Grade Control Las Vegas St. Channel - ATSF RR toPeterson Fld Trib. 700lf channel stabilization, 2 drop structures
7. Fairfax Tributary Detention Pond 43. CS-247 Channel/Grade Control Sand Creek Middle Center Tributary -Powers to No Name 300lf channel stabilization, 3 drop structures
8. Downtown Drainage Improvements 44. CS-130 Channel Hancock Expressway Channel East of Astrozon
9. Sand Creek Stabilization south of Platte 45. Gold Medal Point Channel
10. Cottonwood Creek Detention Basins 46. Channel/Grade Control Cottonwood Creek - Academy to UnionConstruct flood control and stream restoration projects
11. Rangewood Tributary Detention Pond 47. Channel/Grade Control Cottonwood Creek - Monument Creek toAcademy
12. Storage Bridle Pass Drive Construct new pond to improve 2 yr flows 48. Channel/Grade Control Rangewood Channel - Main Stem to Balsam7400lf channel stabilization, w/drop structures
13. South Pine Creek Detention Pond 49. Channel/Grade Control Cottonwood Creek - Rangewood to Woodmen5300lf channel stabilization, w/drop structures
14. Citadel Mall Neighborhood Improvements 50. Channel/Grade Control Fountain Creek - W. Cimmaron St. to N end ofDrake Power
15. North Chelton Road 51. Channel/Grade Control Fountain Creek
16. Camp Creek--Phase 1 52. Fountain Creek - Drake Power Plant to Shooks Run
17. Storage Wagner Park Detention - downstream of Bijou DetentionStorage Required 53. Channel/Grade Control Fountain Creek - Shooks Run to Fountain
Mutual Canal Channel stabilization, 2 drop structures
18. Storage Austin Bluffs Parkway upstream of Research 54. Channel/Grade Control Fountain Creek - Fountain Mutual Canal to US24 Bypass Channel stabilization, 2 drop structures
19. Storage Cottonwood Park (west side) 55. Channel/Grade Control Fountain Creek - US 24 Bypass to Spring CreekChannel stabilization, 2 drop structures
20. Storage Sand Creek Detention Pond 2 Complete Detention Pond 2 onSand Creek south of Barnes 56. Channel/Grade Control Fountain Creek - Spring Creek to Mobile Home
Park Channel stabilization, 3 drop structures
21. Park Vista (Siferd Low Water Crossing) 57. Channel/Grade Control Fountain Creek - Mobile Home Park to N end ElPomar Sports
22. CS-239 Grade Control Upper Hancock Channel - Hancock to Academy 58. Channel/Grade Control Fountain Creek - N end El Pomar Sports Park toS end El
23. North Douglas Natural Channel 59. Monument Creek Mobile Home Park
24. Galley Road Channel-Sand Creek between Galley and Platte Avenue 60. Channel/Grade Control Chelton Dr. Channel - Chelton Dr to Airport Rd2400lf channel stabilization, 2 drop structures
25. Monument Creek at Talemine 61. Pine Creek Outfall into Monument Creek
26. Side Channel Sand Creek - segment 107, reach SC-5 1700lf channelstabilization 62. Channel/Grade Control Templeton Gap Rd. Channel - Powers to Tutt
4400lf channel stabilization, w/drop structures
27 Grade Control Palmer Park Channel - Galley Rd. to Palmer Park 63. Storage Mount Woodmen Court Drainage Sedimentation pond
28. Shooks Run Channel - Cache La Poudre St. to Patty Jewett Golf Course 64. Shooks Run Improvements
29. CS-265 Grade Control Sand Creek Upper West Fork - Maizeland toSouth Carefree 3 drop structures 65. Shooks Run Channel - Bijou Street Culvert & Channel Stabilization
30. CS-254 Channel/Grade Control Sand Creek Upper West Fork - Galley toMurray 1730lf channel stabilization, 2 drop structures 66. Shooks Run Improvements - Phase 3
31. CS-262 Channel/Grade Control Upper Sand Creek - W. Fork to PalmerPark Blvd. 1550lf channel stabilization, w/drop structures 67. Old Annexation Drainage Improvements
32. CS-252 Channel Sand Creek Lower West Fork - Emory to Platte Ave.1000lf channel stabilization 68. Briargate Drainage Improvements
33. CS-025 Channel/Grade Control Sand Creek West Fork - Main stem toWooten Construct drop structures & streambank protection 69. Skyway Area Improvements
34. Channel/Grade Control Sand Creek 70. Channel/Storm Drain Columbia Road Drainage
35. Channel/Grade Control Sand Creek 71. Dry Creek Channel
36. CS-246 Channel/Grade Control Sand Creek Lower Center Tributary - NoName to East Fork
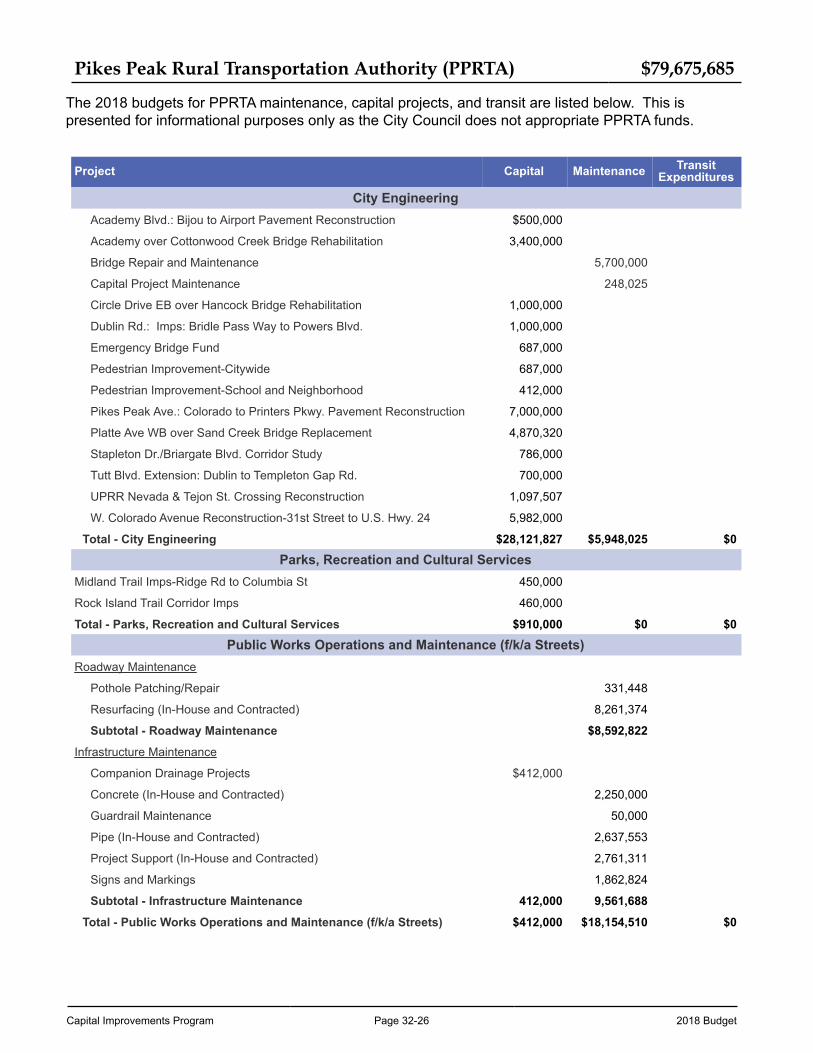
Capital Improvements Program Page 32-26 2018 Budget
Pikes Peak Rural Transportation Authority (PPRTA) $79,675,685
The 2018 budgets for PPRTA maintenance, capital projects, and transit are listed below. This is presented for informational purposes only as the City Council does not appropriate PPRTA funds.
Project Capital Maintenance TransitExpenditures
City EngineeringAcademy Blvd.: Bijou to Airport Pavement Reconstruction $500,000
Academy over Cottonwood Creek Bridge Rehabilitation 3,400,000
Bridge Repair and Maintenance 5,700,000
Capital Project Maintenance 248,025
Circle Drive EB over Hancock Bridge Rehabilitation 1,000,000
Dublin Rd.: Imps: Bridle Pass Way to Powers Blvd. 1,000,000
Emergency Bridge Fund 687,000
Pedestrian Improvement-Citywide 687,000
Pedestrian Improvement-School and Neighborhood 412,000
Pikes Peak Ave.: Colorado to Printers Pkwy. Pavement Reconstruction 7,000,000
Platte Ave WB over Sand Creek Bridge Replacement 4,870,320
Stapleton Dr./Briargate Blvd. Corridor Study 786,000
Tutt Blvd. Extension: Dublin to Templeton Gap Rd. 700,000
UPRR Nevada & Tejon St. Crossing Reconstruction 1,097,507
W. Colorado Avenue Reconstruction-31st Street to U.S. Hwy. 24 5,982,000
Total - City Engineering $28,121,827 $5,948,025 $0
Parks, Recreation and Cultural ServicesMidland Trail Imps-Ridge Rd to Columbia St 450,000
Rock Island Trail Corridor Imps 460,000
Total - Parks, Recreation and Cultural Services $910,000 $0 $0
Public Works Operations and Maintenance (f/k/a Streets)Roadway Maintenance
Pothole Patching/Repair 331,448
Resurfacing (In-House and Contracted) 8,261,374
Subtotal - Roadway Maintenance $8,592,822
Infrastructure Maintenance
Companion Drainage Projects $412,000
Concrete (In-House and Contracted) 2,250,000
Guardrail Maintenance 50,000
Pipe (In-House and Contracted) 2,637,553
Project Support (In-House and Contracted) 2,761,311
Signs and Markings 1,862,824
Subtotal - Infrastructure Maintenance 412,000 9,561,688
Total - Public Works Operations and Maintenance (f/k/a Streets) $412,000 $18,154,510 $0
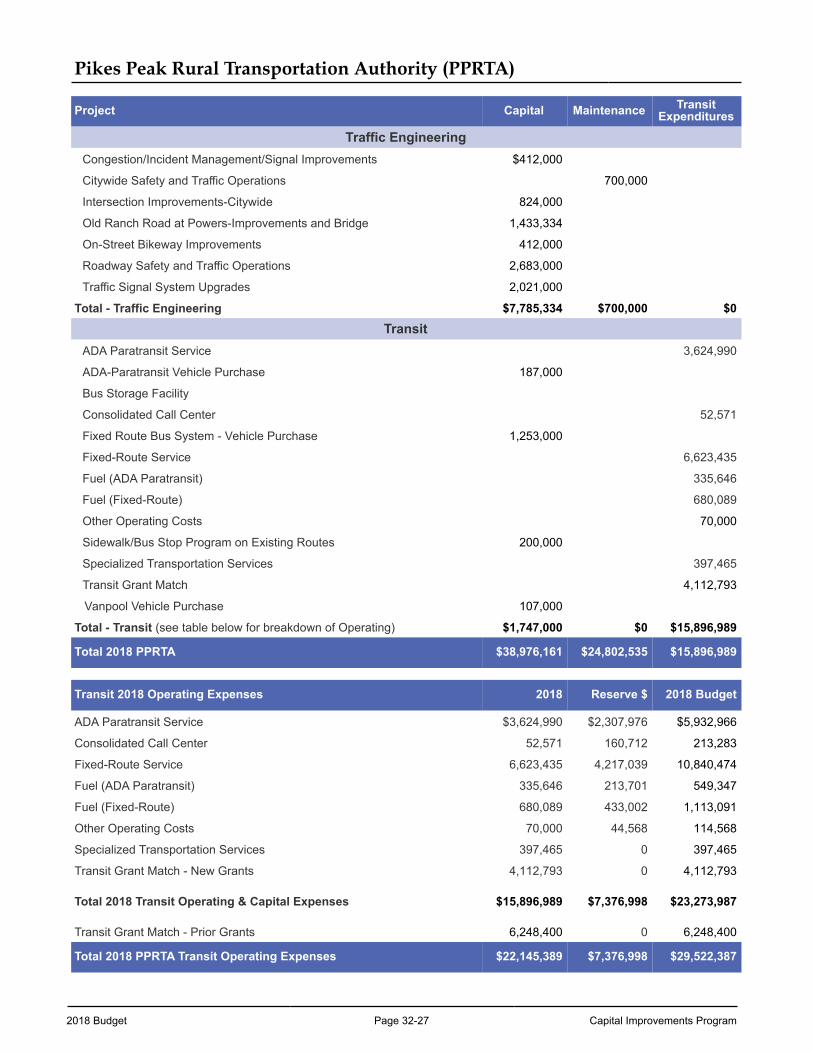
2018 Budget Page 32-27 Capital Improvements Program
Pikes Peak Rural Transportation Authority (PPRTA)
Project Capital Maintenance TransitExpenditures
Traffic EngineeringCongestion/Incident Management/Signal Improvements $412,000
Citywide Safety and Traffic Operations 700,000
Intersection Improvements-Citywide 824,000
Old Ranch Road at Powers-Improvements and Bridge 1,433,334
On-Street Bikeway Improvements 412,000
Roadway Safety and Traffic Operations 2,683,000
Traffic Signal System Upgrades 2,021,000
Total - Traffic Engineering $7,785,334 $700,000 $0
TransitADA Paratransit Service 3,624,990
ADA-Paratransit Vehicle Purchase 187,000
Bus Storage Facility
Consolidated Call Center 52,571
Fixed Route Bus System - Vehicle Purchase 1,253,000
Fixed-Route Service 6,623,435
Fuel (ADA Paratransit) 335,646
Fuel (Fixed-Route) 680,089
Other Operating Costs 70,000
Sidewalk/Bus Stop Program on Existing Routes 200,000
Specialized Transportation Services 397,465
Transit Grant Match 4,112,793
Vanpool Vehicle Purchase 107,000
Total - Transit (see table below for breakdown of Operating) $1,747,000 $0 $15,896,989
Total 2018 PPRTA $38,976,161 $24,802,535 $15,896,989
Transit 2018 Operating Expenses 2018 Reserve $ 2018 Budget
ADA Paratransit Service $3,624,990 $2,307,976 $5,932,966
Consolidated Call Center 52,571 160,712 213,283
Fixed-Route Service 6,623,435 4,217,039 10,840,474
Fuel (ADA Paratransit) 335,646 213,701 549,347
Fuel (Fixed-Route) 680,089 433,002 1,113,091
Other Operating Costs 70,000 44,568 114,568
Specialized Transportation Services 397,465 0 397,465
Transit Grant Match - New Grants 4,112,793 0 4,112,793
Total 2018 Transit Operating & Capital Expenses $15,896,989 $7,376,998 $23,273,987
Transit Grant Match - Prior Grants 6,248,400 0 6,248,400
Total 2018 PPRTA Transit Operating Expenses $22,145,389 $7,376,998 $29,522,387
Capital Improvements Program Page 32-28 2018 Budget
Restricted Fund Descriptions
This includes revenue from a number of sources, as described below:
Bicycle Tax: The City’s $4 excise tax on new bikes began in 1988 and the revenue goes toward bikeway improvements as recommended in the City’s Bicycle Plan.
Conservation Trust Fund (CTF): This is lottery revenue distributed through the Colorado Conservation Trust Program. These funds must be spent on park-related development, renovation, and maintenance.
Enterprise Funds: This is a general category of funds that includes allocations for CIP projects from various City-owned Enterprises. The source of funds comes from revenue earned during the course of conducting business. It includes the Airport, Parking, and Pikes Peak – America’s Mountain.
Grant Funds: The City estimates receiving approximately $27.7 million in grant funds for capital projects in 2018. Below are a few of the categories for capital-related grant funding.
Airport Grant Funds: This funding comes from the Airport Improvement Program (AIP) Grant funded by the federal government, as well as a Colorado Department of Transportation Grant.
Community Development Block Grant (CDBG): This funding is allocated by the federal government based on census records of the recipient municipality’s population and must adhere to strict federal guidelines. The City’s share of the funding must go toward identified Neighborhood Strategy Areas and are spent on public improvements in residential neighborhoods such as sidewalks, curbs, gutter, and pedestrian ramps. These funds cannot go toward the maintenance of existing facilities.
The Safe, Accountable, Flexible, Efficient Transportation Equity Act-Legacy for Users (SAFETEA-LU): These are funds that stem from the federal gas tax revenue, which are administered by the Pikes Peak Area Council of Governments (PPACG). The City competes regionally for federal grants for Transportation Enhancement (TE) projects, Congestion Mitigation and Air Quality (CMAQ) projects, and Surface Transportation (STP) projects. In general, the City receives funding annually in varying amounts according to the Transportation Improvement Program (TIP).
Funding Advancement for Surface Transportation & Economic Recovery (FASTER): These are State funds that stem primarily from daily car rental fees and weight based vehicle registration fee increases. The State allocates funding annually for state and local road and bridge safety projects and provides grants to local governments for transit and rail projects.
Great Outdoors Colorado Grants (GOCO): These funds are from Colorado Lottery proceeds and are intended to help preserve and enhance the state's parks, trails, wildlife, rivers and open spaces. The GOCO independent board awards competitive grants to local governments and land trusts.
Other Funds: This is a general category that includes various sources of funding. For any given project, the funds listed here do not easily fall into another category. Examples include energy savings, concession/player fee funding, Public Space & Development Fund (PLDO), gift trust funds, and donations.
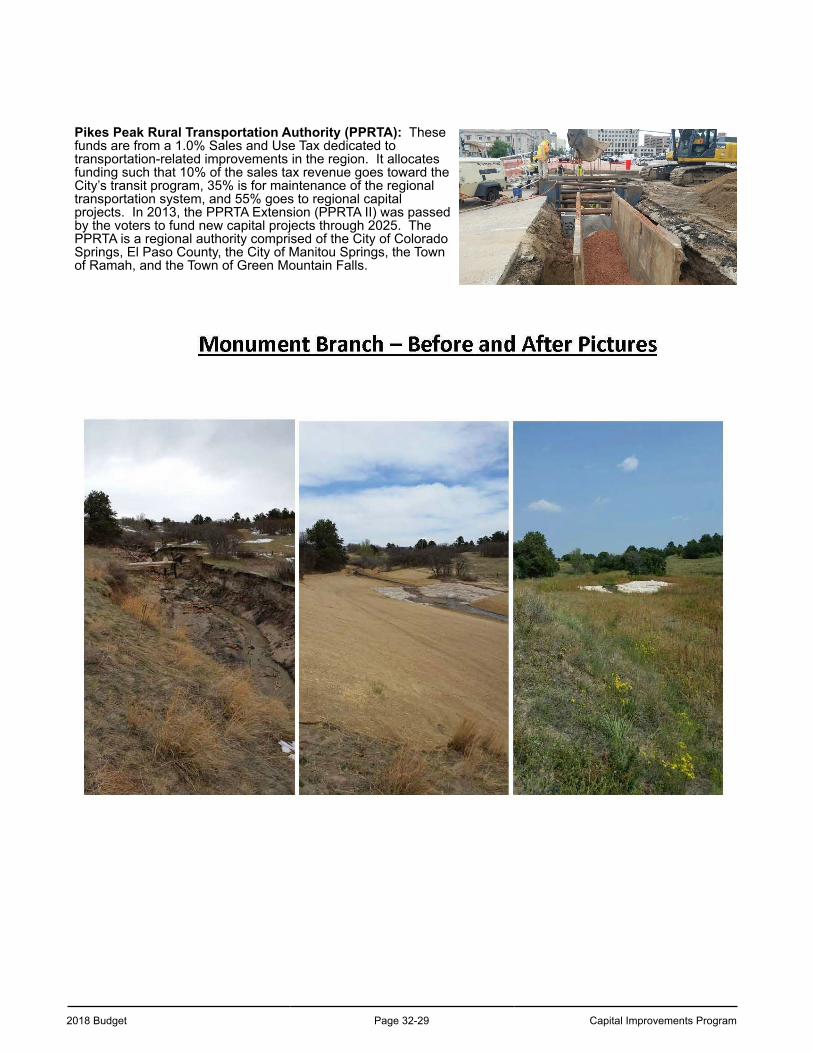
2018 Budget Page 32-29 Capital Improvements Program
Pikes Peak Rural Transportation Authority (PPRTA): These funds are from a 1.0% Sales and Use Tax dedicated to transportation-related improvements in the region. It allocates funding such that 10% of the sales tax revenue goes toward the City’s transit program, 35% is for maintenance of the regional transportation system, and 55% goes to regional capital projects. In 2013, the PPRTA Extension (PPRTA II) was passed by the voters to fund new capital projects through 2025. The PPRTA is a regional authority comprised of the City of Colorado Springs, El Paso County, the City of Manitou Springs, the Town of Ramah, and the Town of Green Mountain Falls.
Capital Improvements Program Page 32-30 2018 Budget
Public Safety Sales Tax (PSST): The PSST was approved by voters in November 2001. This 0.4% Sales and Use Tax is dedicated to funding 20 public safety projects and subsequent staffing, as well as related operational needs.
2C-Road Repair, Maintenance, and Improvements Sales and Use Tax Fund (2C-Road Tax Fund): In November 2015, voters approved to temporarily increase the sales and use tax by 0.62% (6.2 cents on a $10 purchase) effective as of January 1, 2016 for five years to fund only road repairs and improvements, and be permitted to retain all such revenues generated and to expend the same only for road repairs and improvements, exempt from spending and revenue limitations. The ballot measure states that:
• the temporary increase in sales and use tax revenue will be placed in a dedicated fund;• all such revenue will be used only for funding the cost to repair roads and streets throughout all areas of the
City, including cost of road reconstruction where severe deterioration does not allow repair;• none of the additional sales and use tax revenue will be used to hire additional City employees or purchase
additional equipment for City road projects; and• the repair work will be contracted out to the private sector.
In addition, Resolution No. 83-15 further provides that the expenditure of these revenues for road repairs and improvements is to be in addition to, and not in lieu of, amounts currently being expended by the City for road maintenance and improvements. During the period the temporary sales and use tax increase is in effect, the City will maintain spending on repair and maintenance of roads and streets at the average of the City's annual spending amount for such repair and maintenance during fiscal years 2012, 2013 and 2014. The City Auditor will perform an audit to calculate such average spending amount. Subject to City Charter limitations on preparation, submission and approval of the annual budget and annual appropriation ordinance, during such period, the City will annually expend at least the amount so computed on repair and maintenance of roads and streets.
2018 Budget Page 32-31 Capital Improvements Program
Trails, Open Space, and Parks (TOPS): A 0.1% Sales and Use Tax was approved by voters in 1997. It was slated to expire in 2009, until an extension was approved by voters in 2003 and will expire in 2025. Although the percentage split may vary from year to year, the funds are restricted over the life as follows:
3% allowed for Administration; 6% allowed for Maintenance; minimum of 60% must be used for acquisition and stewardship of
open space; maximum of 20% must be used for trail acquisition, construction
and maintenance; and maximum of 20% must be used for parks acquisition, construction
and maintenance (in 2012, voters approved using the Parks Category for maintenance of all Parks Department properties).
Capital Improvements Program Page 32-32 2018 Budget
Unfunded CIP Needs
In addition to the nearly $577.6 million in CIP projects listed in the Five-Year All Funds CIP Plan, the City has many unfunded projects that don’t have an identified funding source. As shown in the table below, there is an estimated $1.1 billion of unfunded needs, which includes projects such as new facilities, facility improvements/renovations, bridge replacements, stormwater system improvements, and park system improvements. See the table on the following pages for a current list of unfunded projects.
Unfunded CIP Needs Estimated Project Cost
Facility Improvements $73,638,633
Infrastructure Improvements 160,794,600
Park/Trail/Open Space Improvements 191,874,638
Stormwater, Roads & Bridges Total 664,845,906
Technology/Other 16,854,800
Total Unfunded CIP Needs $1,108,008,577
Unfunded CIP Needs
Project Type Project Department Project NameEstimated Project
Total Cost
Facility Improvements Fire Apparatus and Vehicle Storage $ 400,000
Class A Burn Prop $ 1,200,000
Driveway Exit - Squad 8 at FDC $ 350,000
Fire Station 17 - Add 3rd Apparatus Bay $ 252,000
Fire Station 3 Renovation $ 1,715,000
Fire Station 6 - Add 3rd Apparatus Bay $ 246,000
Health Clinic and Storage $ 2,050,000
Purchase property adjacent to Fire Station 10 $ 700,000
Training Tower Upgrade/ Replacement $ 200,000
Parks - Cultural Services Museum Exterior Renovation Phase V $ 619,550
Pioneers Museum-Interior rehabilitation $ 3,250,000
Rock Ledge Ranch-4-sided log equipment shed $ 52,000
Rock Ledge Ranch-Admissions/Orientation Center $ 1,040,000
Rock Ledge Ranch-Entry Embarkation Plaza $ 54,000
Rock Ledge Ranch-Irrigation $ 409,500
Rock Ledge Ranch-Log Cabin Replacement $ 50,000
Rock Ledge Ranch-Restroom at American Indian area $ 325,000
Rock Ledge Ranch-Steam heated greenhouse $ 250,000
Rock Ledge Ranch-Tipis replacement $ 50,000
Parks - Forestry Forestry Operation Center Pole Barn $ 200,000
Parks - Pikes Peak AmericasMtn. Garage and Maintenance Facility $ 500,000
Plant Roof Replacement $ 100,000
Parks - Recreation andAdministration ATB Julie Penrose Fountain $ 62,500
City Auditorium $ 200,000
City Auditorium-Lon Cheney Theater Remodel $ 250,000
Cottonwood Creek Recreation Center Pool Filter System Upgrade $ 50,000
2018 Budget Page 32-33 Capital Improvements Program
Unfunded CIP Needs
Project Type Project Department Project NameEstimated Project
Total Cost
Facility Improvements, cont. Cottonwood Creek Recreation Center-Addition, Gymnasium $ 2,700,000
Cottonwood Park-Recreation Center improvements $ 250,000
Deerfield Hills Community Center Expansion-Phase II & III $ 1,500,000
Memorial Park Recreation Center Roof $ 500,000
Memorial Park Recreation Center-Demo/Rebuild old pool area $ 1,000,000
Memorial Park Recreation Center-Gymnasium $ 2,700,000
Police Impound Lot Visitor Lobby/Office Expansion $ 200,000
Police Impound Facility Improvement Phase I (Expansion) $ 300,000
Police Impound Facility Improvement Phase II (Paving) $ 2,000,000
Public Works - TransitServices Downtown Transit Station Relocation $ 17,922,608
Transit Bus Storage $ 5,600,000
Parks - Park Maintenance andOperations Bott Park-Tennis Courts $ 246,000
Cascade Medians -Concrete flatwork $ 552,500
Cascade Medians -Irrigation $ 152,500
Central Parks Building Renovations $ 595,000
Corral Bluffs Open Space-New Visitor Center $ 1,500,000
Cottonwood Park-Parking Lots $ 40,000
Cottonwood Park-Tennis Courts $ 164,000
Franklin Park-Irrigation $ 40,000
Fremont Park-Irrigation $ 117,900
Garden of the Gods-roadway bridge improvements $ 1,300,000
Golden Hills Park-Irrigation $ 54,000
Goose Gossage Park-Artificial Turf $ 1,235,000
Goose Gossage Park-Parking Lots $ 95,000
Jackson Park Playground $ 150,000
Jackson Park-Irrigation $ 190,900
Jackson Park-Lighting $ 123,500
Lunar Park-Irrigation $ 47,000
Medians, Centennial and Powers triangles $ 150,000
Memorial Park Asphalt-Parking Lots $ 4,680,000
Memorial Park Asphalt-Walkway and Criterium Track $ 262,000
Memorial Park Concrete $ 75,000
Memorial Park-Artificial Turf $ 4,250,000
Memorial Park-Pavilion Restrooms $ 160,000
Memorial Park-Prospect Lake Promenade $ 300,000
Nevada Medians - Downtown, Irrigation $ 403,650
Nevada Medians -New curb line and crosswalks $ 67,275
North Athletic Amenity Repairs $ 150,000
North Athletic Parking Lots $ 185,500
North Parks Building Renovations $ 400,500
North Parks Concrete Flatwork $ 180,500
North Parks Playground and Amenity Repair/Renovation $ 1,800,000
North Slope Master Plan Implementation $ 750,000
Otis Park-Running Track Resurface $ 150,000
Palmer Park-Addition, Pavilion at Meadows $ 130,000
Capital Improvements Program Page 32-34 2018 Budget
Unfunded CIP Needs
Project Type Project Department Project NameEstimated Project
Total Cost
Facility Improvements, cont. Palmer Park-Playground renovation $ 58,500
Panorama Park-Park Improvements $ 845,000
Park Shops renovation $ 78,250
Parks Headquarters Entry/Reception upgrade $ 78,000
Pigpen Parks-Park Renovation $ 500,000
Portal Park-Parking Lot Main $ 200,000
Portal Park-Parking Lot North $ 50,000
Prospect Lake-Concrete curb and gutter $ 82,500
Prospect Lake-Swimming area upgrade $ 1,000,000
Quail Lake-Parking Lots $ 104,000
Rampart Park-Tennis Courts $ 164,000
Regional Parks-Building Renovations $ 159,500
South Athletics-Building and Drainage repairs/renovations $ 157,000
Wahsatch Medians -New curb line and crosswalks $ 156,000
Wolfe Ranch-Renovate Historic House $ 60,000
Facility Improvements Total $ 73,638,633
Infrastructure Improvements Parking System Alley Lighting-Kiowa Garage $ 29,300
Parks - Recreation andAdministration Ice Arena (2nd sheet) $ 4,500,000
Public Works - CityEngineering 21st St. over Fountain Creek Bridge Replacement $ 2,140,000
8th St. over Fountain Creek Bridge Rehabilitation $ 1,730,000
Brenner Place over T-Gap Bridge Replacement $ 650,000
Cheyenne Canyon # 4 over N. Cheyenne Creek Bridge Replacement $ 1,045,000
Drennan Rd. over Jimmy Camp Creek Bridge Replacement $ 1,753,000
El Paso St. over Platte Ave. Bridge Rehabilitation $ 1,340,000
Public Works - TrafficEngineering Relocation of Traffic Management Center $ 3,000,000
Public Works - TransitServices Bus Rapid Transit $ 80,750,000
Infrastructure For Electric Buses $ 2,500,000
Parks - Park Maintenance andOperations Acacia Park Park Renovation $ 1,000,000
Bancroft Park Restroom $ 225,000
Bluestem Prairie Trail $ 79,300
Central Parks Concrete Flatwork $ 125,000
Chamberlain Trail $ 682,500
Coleman Community Park $ 13,000,000
Corral Bluffs Expansion $ 5,000,000
Cottonwood Trail Tier 1 Segments and crossings $ 5,635,500
Disc Golf-TBD $ 75,000
Dog Park-TBD $ 350,000
Fishing Areas-TBD $ 2,000,000
Foothills Trail-Rockledge Ranch section $ 1,000,000
Homestead Trail $ 3,000,000
Leon Young Sports Complex Parking Lots and Drive $ 1,250,000
Manitou Incline Phase II $ 1,000,000
Milton Proby Trail $ 2,200,000
Monument Valley Park $ 200,000
Monument Valley Park - South $ 500,000
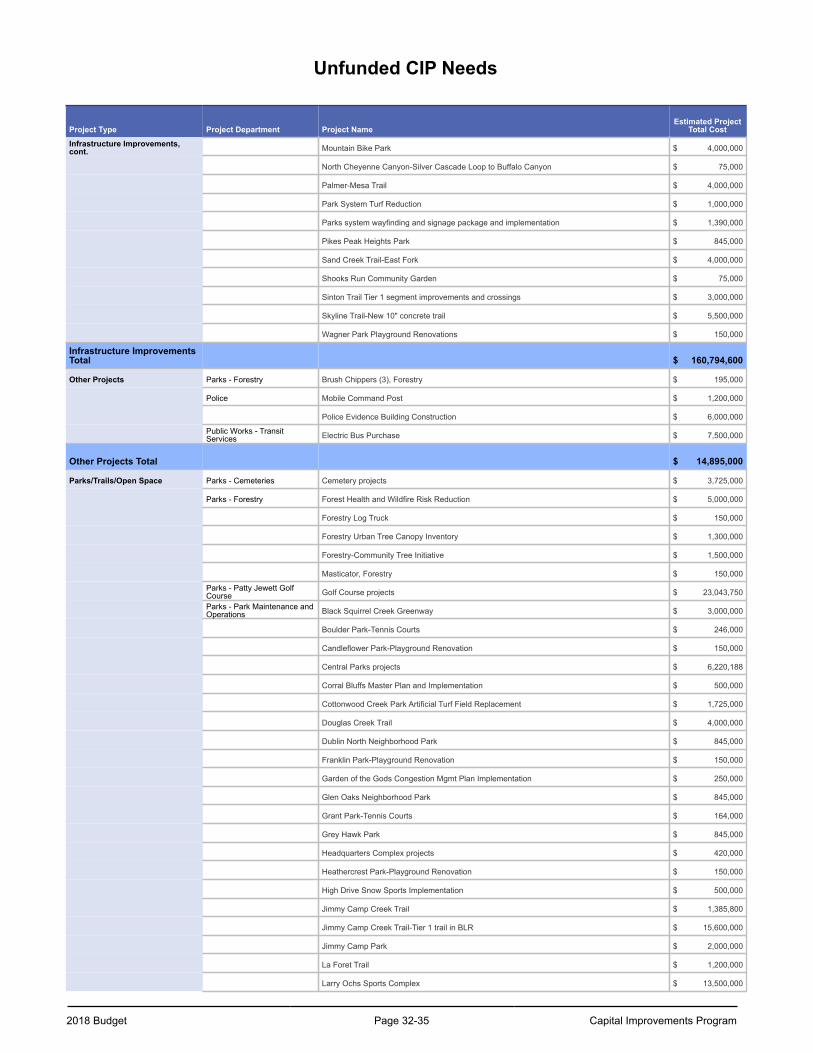
2018 Budget Page 32-35 Capital Improvements Program
Unfunded CIP Needs
Project Type Project Department Project NameEstimated Project
Total Cost
Infrastructure Improvements,cont. Mountain Bike Park $ 4,000,000
North Cheyenne Canyon-Silver Cascade Loop to Buffalo Canyon $ 75,000
Palmer-Mesa Trail $ 4,000,000
Park System Turf Reduction $ 1,000,000
Parks system wayfinding and signage package and implementation $ 1,390,000
Pikes Peak Heights Park $ 845,000
Sand Creek Trail-East Fork $ 4,000,000
Shooks Run Community Garden $ 75,000
Sinton Trail Tier 1 segment improvements and crossings $ 3,000,000
Skyline Trail-New 10" concrete trail $ 5,500,000
Wagner Park Playground Renovations $ 150,000
Infrastructure ImprovementsTotal $ 160,794,600
Other Projects Parks - Forestry Brush Chippers (3), Forestry $ 195,000
Police Mobile Command Post $ 1,200,000
Police Evidence Building Construction $ 6,000,000
Public Works - TransitServices Electric Bus Purchase $ 7,500,000
Other Projects Total $ 14,895,000
Parks/Trails/Open Space Parks - Cemeteries Cemetery projects $ 3,725,000
Parks - Forestry Forest Health and Wildfire Risk Reduction $ 5,000,000
Forestry Log Truck $ 150,000
Forestry Urban Tree Canopy Inventory $ 1,300,000
Forestry-Community Tree Initiative $ 1,500,000
Masticator, Forestry $ 150,000
Parks - Patty Jewett GolfCourse Golf Course projects $ 23,043,750
Parks - Park Maintenance andOperations Black Squirrel Creek Greenway $ 3,000,000
Boulder Park-Tennis Courts $ 246,000
Candleflower Park-Playground Renovation $ 150,000
Central Parks projects $ 6,220,188
Corral Bluffs Master Plan and Implementation $ 500,000
Cottonwood Creek Park Artificial Turf Field Replacement $ 1,725,000
Douglas Creek Trail $ 4,000,000
Dublin North Neighborhood Park $ 845,000
Franklin Park-Playground Renovation $ 150,000
Garden of the Gods Congestion Mgmt Plan Implementation $ 250,000
Glen Oaks Neighborhood Park $ 845,000
Grant Park-Tennis Courts $ 164,000
Grey Hawk Park $ 845,000
Headquarters Complex projects $ 420,000
Heathercrest Park-Playground Renovation $ 150,000
High Drive Snow Sports Implementation $ 500,000
Jimmy Camp Creek Trail $ 1,385,800
Jimmy Camp Creek Trail-Tier 1 trail in BLR $ 15,600,000
Jimmy Camp Park $ 2,000,000
La Foret Trail $ 1,200,000
Larry Ochs Sports Complex $ 13,500,000
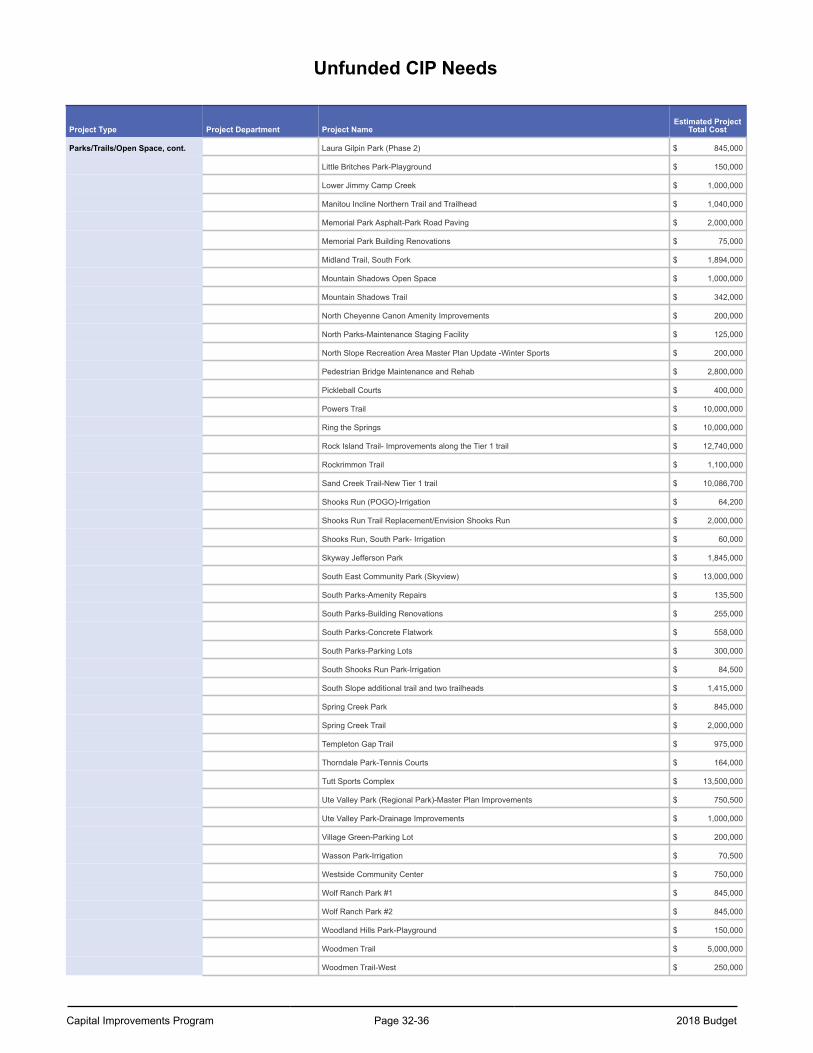
Capital Improvements Program Page 32-36 2018 Budget
Unfunded CIP Needs
Project Type Project Department Project NameEstimated Project
Total Cost
Parks/Trails/Open Space, cont. Laura Gilpin Park (Phase 2) $ 845,000
Little Britches Park-Playground $ 150,000
Lower Jimmy Camp Creek $ 1,000,000
Manitou Incline Northern Trail and Trailhead $ 1,040,000
Memorial Park Asphalt-Park Road Paving $ 2,000,000
Memorial Park Building Renovations $ 75,000
Midland Trail, South Fork $ 1,894,000
Mountain Shadows Open Space $ 1,000,000
Mountain Shadows Trail $ 342,000
North Cheyenne Canon Amenity Improvements $ 200,000
North Parks-Maintenance Staging Facility $ 125,000
North Slope Recreation Area Master Plan Update -Winter Sports $ 200,000
Pedestrian Bridge Maintenance and Rehab $ 2,800,000
Pickleball Courts $ 400,000
Powers Trail $ 10,000,000
Ring the Springs $ 10,000,000
Rock Island Trail- Improvements along the Tier 1 trail $ 12,740,000
Rockrimmon Trail $ 1,100,000
Sand Creek Trail-New Tier 1 trail $ 10,086,700
Shooks Run (POGO)-Irrigation $ 64,200
Shooks Run Trail Replacement/Envision Shooks Run $ 2,000,000
Shooks Run, South Park- Irrigation $ 60,000
Skyway Jefferson Park $ 1,845,000
South East Community Park (Skyview) $ 13,000,000
South Parks-Amenity Repairs $ 135,500
South Parks-Building Renovations $ 255,000
South Parks-Concrete Flatwork $ 558,000
South Parks-Parking Lots $ 300,000
South Shooks Run Park-Irrigation $ 84,500
South Slope additional trail and two trailheads $ 1,415,000
Spring Creek Park $ 845,000
Spring Creek Trail $ 2,000,000
Templeton Gap Trail $ 975,000
Thorndale Park-Tennis Courts $ 164,000
Tutt Sports Complex $ 13,500,000
Ute Valley Park (Regional Park)-Master Plan Improvements $ 750,500
Ute Valley Park-Drainage Improvements $ 1,000,000
Village Green-Parking Lot $ 200,000
Wasson Park-Irrigation $ 70,500
Westside Community Center $ 750,000
Wolf Ranch Park #1 $ 845,000
Wolf Ranch Park #2 $ 845,000
Woodland Hills Park-Playground $ 150,000
Woodmen Trail $ 5,000,000
Woodmen Trail-West $ 250,000
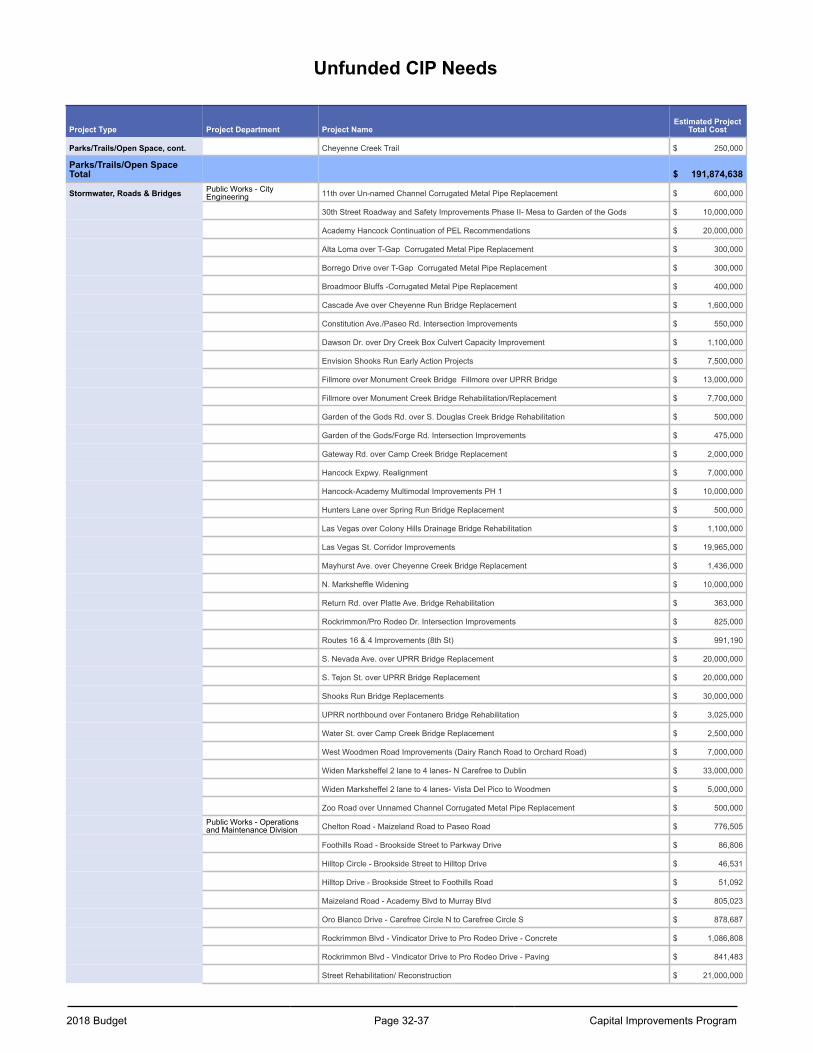
2018 Budget Page 32-37 Capital Improvements Program
Unfunded CIP Needs
Project Type Project Department Project NameEstimated Project
Total Cost
Parks/Trails/Open Space, cont. Cheyenne Creek Trail $ 250,000
Parks/Trails/Open SpaceTotal $ 191,874,638
Stormwater, Roads & Bridges Public Works - CityEngineering 11th over Un-named Channel Corrugated Metal Pipe Replacement $ 600,000
30th Street Roadway and Safety Improvements Phase II- Mesa to Garden of the Gods $ 10,000,000
Academy Hancock Continuation of PEL Recommendations $ 20,000,000
Alta Loma over T-Gap Corrugated Metal Pipe Replacement $ 300,000
Borrego Drive over T-Gap Corrugated Metal Pipe Replacement $ 300,000
Broadmoor Bluffs -Corrugated Metal Pipe Replacement $ 400,000
Cascade Ave over Cheyenne Run Bridge Replacement $ 1,600,000
Constitution Ave./Paseo Rd. Intersection Improvements $ 550,000
Dawson Dr. over Dry Creek Box Culvert Capacity Improvement $ 1,100,000
Envision Shooks Run Early Action Projects $ 7,500,000
Fillmore over Monument Creek Bridge Fillmore over UPRR Bridge $ 13,000,000
Fillmore over Monument Creek Bridge Rehabilitation/Replacement $ 7,700,000
Garden of the Gods Rd. over S. Douglas Creek Bridge Rehabilitation $ 500,000
Garden of the Gods/Forge Rd. Intersection Improvements $ 475,000
Gateway Rd. over Camp Creek Bridge Replacement $ 2,000,000
Hancock Expwy. Realignment $ 7,000,000
Hancock-Academy Multimodal Improvements PH 1 $ 10,000,000
Hunters Lane over Spring Run Bridge Replacement $ 500,000
Las Vegas over Colony Hills Drainage Bridge Rehabilitation $ 1,100,000
Las Vegas St. Corridor Improvements $ 19,965,000
Mayhurst Ave. over Cheyenne Creek Bridge Replacement $ 1,436,000
N. Marksheffle Widening $ 10,000,000
Return Rd. over Platte Ave. Bridge Rehabilitation $ 363,000
Rockrimmon/Pro Rodeo Dr. Intersection Improvements $ 825,000
Routes 16 & 4 Improvements (8th St) $ 991,190
S. Nevada Ave. over UPRR Bridge Replacement $ 20,000,000
S. Tejon St. over UPRR Bridge Replacement $ 20,000,000
Shooks Run Bridge Replacements $ 30,000,000
UPRR northbound over Fontanero Bridge Rehabilitation $ 3,025,000
Water St. over Camp Creek Bridge Replacement $ 2,500,000
West Woodmen Road Improvements (Dairy Ranch Road to Orchard Road) $ 7,000,000
Widen Marksheffel 2 lane to 4 lanes- N Carefree to Dublin $ 33,000,000
Widen Marksheffel 2 lane to 4 lanes- Vista Del Pico to Woodmen $ 5,000,000
Zoo Road over Unnamed Channel Corrugated Metal Pipe Replacement $ 500,000
Public Works - Operationsand Maintenance Division Chelton Road - Maizeland Road to Paseo Road $ 776,505
Foothills Road - Brookside Street to Parkway Drive $ 86,806
Hilltop Circle - Brookside Street to Hilltop Drive $ 46,531
Hilltop Drive - Brookside Street to Foothills Road $ 51,092
Maizeland Road - Academy Blvd to Murray Blvd $ 805,023
Oro Blanco Drive - Carefree Circle N to Carefree Circle S $ 878,687
Rockrimmon Blvd - Vindicator Drive to Pro Rodeo Drive - Concrete $ 1,086,808
Rockrimmon Blvd - Vindicator Drive to Pro Rodeo Drive - Paving $ 841,483
Street Rehabilitation/ Reconstruction $ 21,000,000
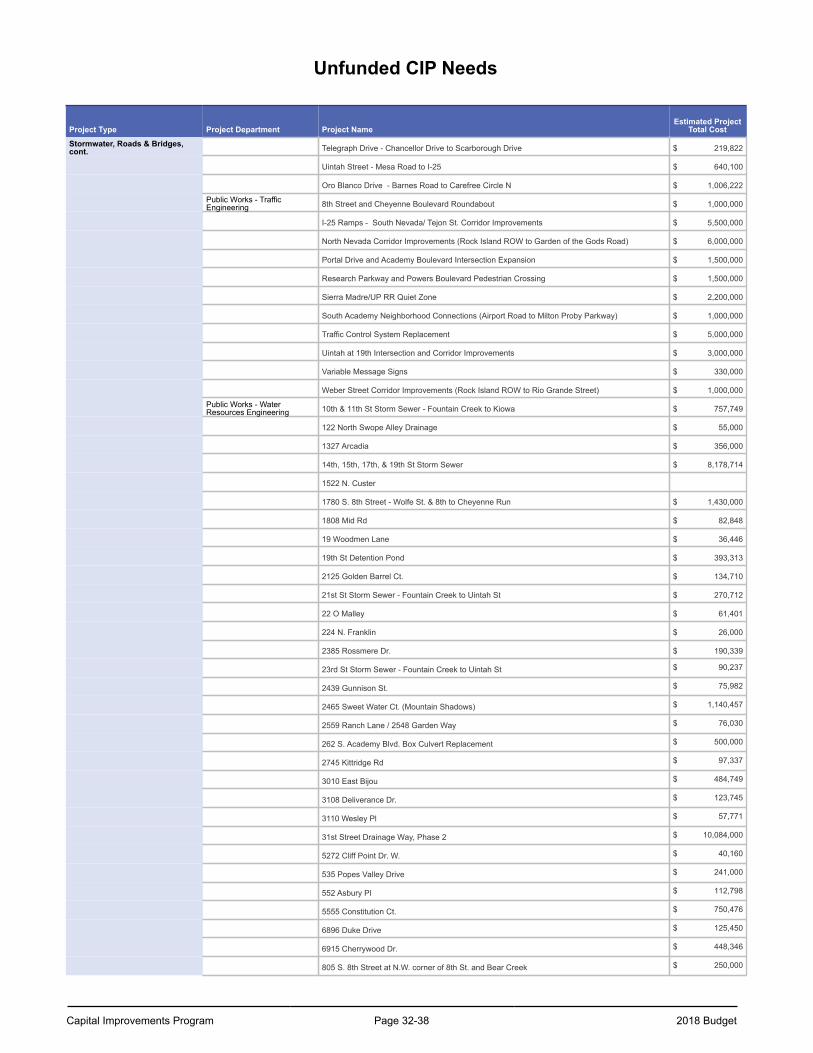
Capital Improvements Program Page 32-38 2018 Budget
Unfunded CIP Needs
Project Type Project Department Project NameEstimated Project
Total Cost
Stormwater, Roads & Bridges,cont. Telegraph Drive - Chancellor Drive to Scarborough Drive $ 219,822
Uintah Street - Mesa Road to I-25 $ 640,100
Oro Blanco Drive - Barnes Road to Carefree Circle N $ 1,006,222
Public Works - TrafficEngineering 8th Street and Cheyenne Boulevard Roundabout $ 1,000,000
I-25 Ramps - South Nevada/ Tejon St. Corridor Improvements $ 5,500,000
North Nevada Corridor Improvements (Rock Island ROW to Garden of the Gods Road) $ 6,000,000
Portal Drive and Academy Boulevard Intersection Expansion $ 1,500,000
Research Parkway and Powers Boulevard Pedestrian Crossing $ 1,500,000
Sierra Madre/UP RR Quiet Zone $ 2,200,000
South Academy Neighborhood Connections (Airport Road to Milton Proby Parkway) $ 1,000,000
Traffic Control System Replacement $ 5,000,000
Uintah at 19th Intersection and Corridor Improvements $ 3,000,000
Variable Message Signs $ 330,000
Weber Street Corridor Improvements (Rock Island ROW to Rio Grande Street) $ 1,000,000
Public Works - WaterResources Engineering 10th & 11th St Storm Sewer - Fountain Creek to Kiowa $ 757,749
122 North Swope Alley Drainage $ 55,000
1327 Arcadia $ 356,000
14th, 15th, 17th, & 19th St Storm Sewer $ 8,178,714
1522 N. Custer
1780 S. 8th Street - Wolfe St. & 8th to Cheyenne Run $ 1,430,000
1808 Mid Rd $ 82,848
19 Woodmen Lane $ 36,446
19th St Detention Pond $ 393,313
2125 Golden Barrel Ct. $ 134,710
21st St Storm Sewer - Fountain Creek to Uintah St $ 270,712
22 O Malley $ 61,401
224 N. Franklin $ 26,000
2385 Rossmere Dr. $ 190,339
23rd St Storm Sewer - Fountain Creek to Uintah St $ 90,237
2439 Gunnison St. $ 75,982
2465 Sweet Water Ct. (Mountain Shadows) $ 1,140,457
2559 Ranch Lane / 2548 Garden Way $ 76,030
262 S. Academy Blvd. Box Culvert Replacement $ 500,000
2745 Kittridge Rd $ 97,337
3010 East Bijou $ 484,749
3108 Deliverance Dr. $ 123,745
3110 Wesley Pl $ 57,771
31st Street Drainage Way, Phase 2 $ 10,084,000
5272 Cliff Point Dr. W. $ 40,160
535 Popes Valley Drive $ 241,000
552 Asbury Pl $ 112,798
5555 Constitution Ct. $ 750,476
6896 Duke Drive $ 125,450
6915 Cherrywood Dr. $ 448,346
805 S. 8th Street at N.W. corner of 8th St. and Bear Creek $ 250,000
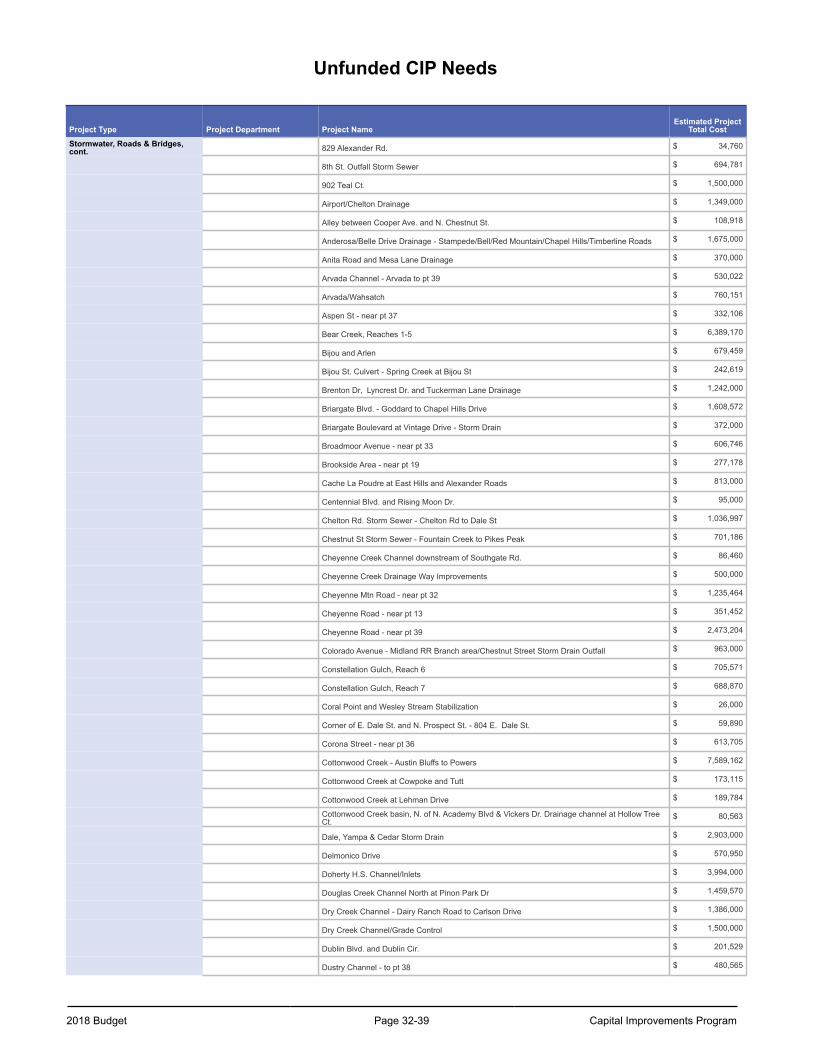
2018 Budget Page 32-39 Capital Improvements Program
Unfunded CIP Needs
Project Type Project Department Project NameEstimated Project
Total Cost
Stormwater, Roads & Bridges,cont. 829 Alexander Rd. $ 34,760
8th St. Outfall Storm Sewer $ 694,781
902 Teal Ct. $ 1,500,000
Airport/Chelton Drainage $ 1,349,000
Alley between Cooper Ave. and N. Chestnut St. $ 108,918
Anderosa/Belle Drive Drainage - Stampede/Bell/Red Mountain/Chapel Hills/Timberline Roads $ 1,675,000
Anita Road and Mesa Lane Drainage $ 370,000
Arvada Channel - Arvada to pt 39 $ 530,022
Arvada/Wahsatch $ 760,151
Aspen St - near pt 37 $ 332,106
Bear Creek, Reaches 1-5 $ 6,389,170
Bijou and Arlen $ 679,459
Bijou St. Culvert - Spring Creek at Bijou St $ 242,619
Brenton Dr, Lyncrest Dr. and Tuckerman Lane Drainage $ 1,242,000
Briargate Blvd. - Goddard to Chapel Hills Drive $ 1,608,572
Briargate Boulevard at Vintage Drive - Storm Drain $ 372,000
Broadmoor Avenue - near pt 33 $ 606,746
Brookside Area - near pt 19 $ 277,178
Cache La Poudre at East Hills and Alexander Roads $ 813,000
Centennial Blvd. and Rising Moon Dr. $ 95,000
Chelton Rd. Storm Sewer - Chelton Rd to Dale St $ 1,036,997
Chestnut St Storm Sewer - Fountain Creek to Pikes Peak $ 701,186
Cheyenne Creek Channel downstream of Southgate Rd. $ 86,460
Cheyenne Creek Drainage Way Improvements $ 500,000
Cheyenne Mtn Road - near pt 32 $ 1,235,464
Cheyenne Road - near pt 13 $ 351,452
Cheyenne Road - near pt 39 $ 2,473,204
Colorado Avenue - Midland RR Branch area/Chestnut Street Storm Drain Outfall $ 963,000
Constellation Gulch, Reach 6 $ 705,571
Constellation Gulch, Reach 7 $ 688,870
Coral Point and Wesley Stream Stabilization $ 26,000
Corner of E. Dale St. and N. Prospect St. - 804 E. Dale St. $ 59,890
Corona Street - near pt 36 $ 613,705
Cottonwood Creek - Austin Bluffs to Powers $ 7,589,162
Cottonwood Creek at Cowpoke and Tutt $ 173,115
Cottonwood Creek at Lehman Drive $ 189,784
Cottonwood Creek basin, N. of N. Academy Blvd & Vickers Dr. Drainage channel at Hollow TreeCt.
$ 80,563
Dale, Yampa & Cedar Storm Drain $ 2,903,000
Delmonico Drive $ 570,950
Doherty H.S. Channel/Inlets $ 3,994,000
Douglas Creek Channel North at Pinon Park Dr $ 1,459,570
Dry Creek Channel - Dairy Ranch Road to Carlson Drive $ 1,386,000
Dry Creek Channel/Grade Control $ 1,500,000
Dublin Blvd. and Dublin Cir. $ 201,529
Dustry Channel - to pt 38 $ 480,565
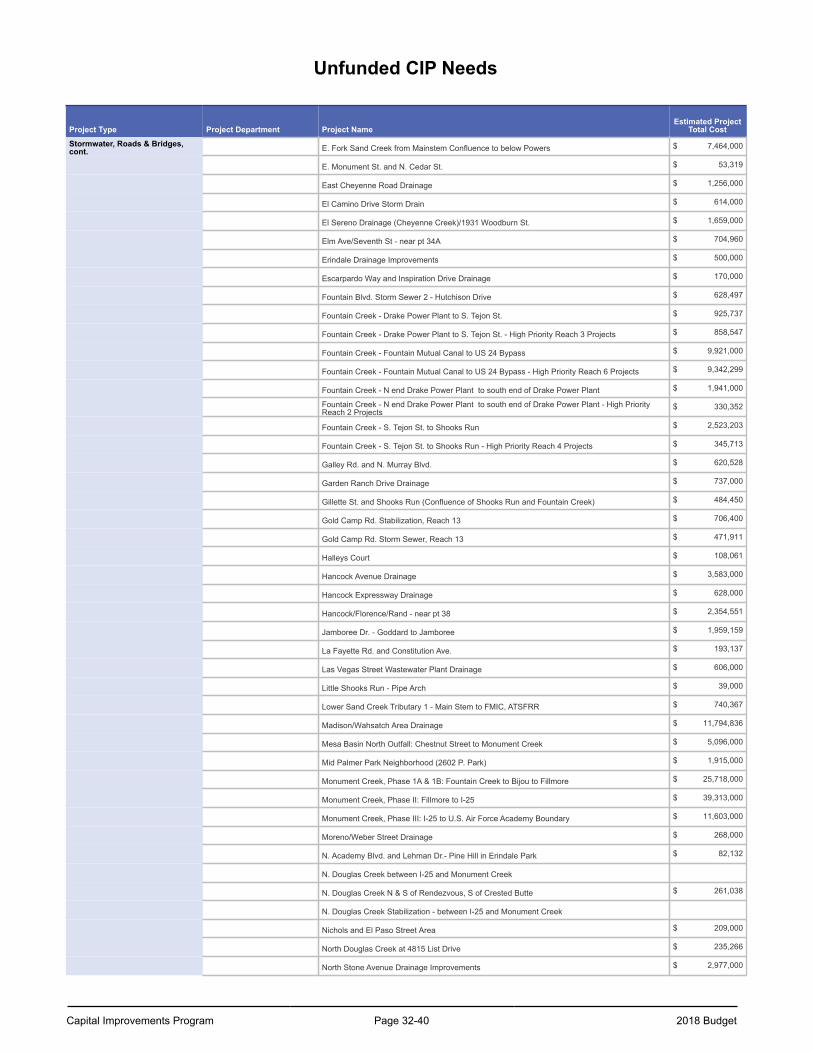
Capital Improvements Program Page 32-40 2018 Budget
Unfunded CIP Needs
Project Type Project Department Project NameEstimated Project
Total Cost
Stormwater, Roads & Bridges,cont. E. Fork Sand Creek from Mainstem Confluence to below Powers $ 7,464,000
E. Monument St. and N. Cedar St. $ 53,319
East Cheyenne Road Drainage $ 1,256,000
El Camino Drive Storm Drain $ 614,000
El Sereno Drainage (Cheyenne Creek)/1931 Woodburn St. $ 1,659,000
Elm Ave/Seventh St - near pt 34A $ 704,960
Erindale Drainage Improvements $ 500,000
Escarpardo Way and Inspiration Drive Drainage $ 170,000
Fountain Blvd. Storm Sewer 2 - Hutchison Drive $ 628,497
Fountain Creek - Drake Power Plant to S. Tejon St. $ 925,737
Fountain Creek - Drake Power Plant to S. Tejon St. - High Priority Reach 3 Projects $ 858,547
Fountain Creek - Fountain Mutual Canal to US 24 Bypass $ 9,921,000
Fountain Creek - Fountain Mutual Canal to US 24 Bypass - High Priority Reach 6 Projects $ 9,342,299
Fountain Creek - N end Drake Power Plant to south end of Drake Power Plant $ 1,941,000
Fountain Creek - N end Drake Power Plant to south end of Drake Power Plant - High PriorityReach 2 Projects
$ 330,352
Fountain Creek - S. Tejon St. to Shooks Run $ 2,523,203
Fountain Creek - S. Tejon St. to Shooks Run - High Priority Reach 4 Projects $ 345,713
Galley Rd. and N. Murray Blvd. $ 620,528
Garden Ranch Drive Drainage $ 737,000
Gillette St. and Shooks Run (Confluence of Shooks Run and Fountain Creek) $ 484,450
Gold Camp Rd. Stabilization, Reach 13 $ 706,400
Gold Camp Rd. Storm Sewer, Reach 13 $ 471,911
Halleys Court $ 108,061
Hancock Avenue Drainage $ 3,583,000
Hancock Expressway Drainage $ 628,000
Hancock/Florence/Rand - near pt 38 $ 2,354,551
Jamboree Dr. - Goddard to Jamboree $ 1,959,159
La Fayette Rd. and Constitution Ave. $ 193,137
Las Vegas Street Wastewater Plant Drainage $ 606,000
Little Shooks Run - Pipe Arch $ 39,000
Lower Sand Creek Tributary 1 - Main Stem to FMIC, ATSFRR $ 740,367
Madison/Wahsatch Area Drainage $ 11,794,836
Mesa Basin North Outfall: Chestnut Street to Monument Creek $ 5,096,000
Mid Palmer Park Neighborhood (2602 P. Park) $ 1,915,000
Monument Creek, Phase 1A & 1B: Fountain Creek to Bijou to Fillmore $ 25,718,000
Monument Creek, Phase II: Fillmore to I-25 $ 39,313,000
Monument Creek, Phase III: I-25 to U.S. Air Force Academy Boundary $ 11,603,000
Moreno/Weber Street Drainage $ 268,000
N. Academy Blvd. and Lehman Dr.- Pine Hill in Erindale Park $ 82,132
N. Douglas Creek between I-25 and Monument Creek
N. Douglas Creek N & S of Rendezvous, S of Crested Butte $ 261,038
N. Douglas Creek Stabilization - between I-25 and Monument Creek
Nichols and El Paso Street Area $ 209,000
North Douglas Creek at 4815 List Drive $ 235,266
North Stone Avenue Drainage Improvements $ 2,977,000
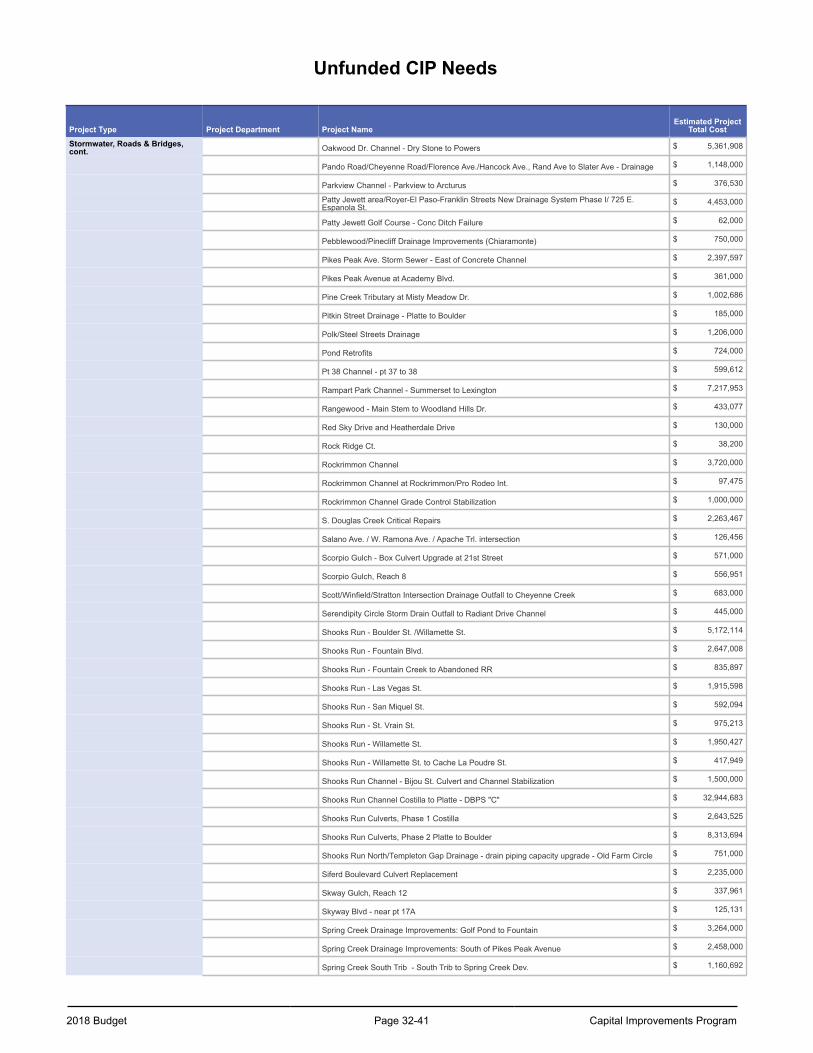
2018 Budget Page 32-41 Capital Improvements Program
Unfunded CIP Needs
Project Type Project Department Project NameEstimated Project
Total Cost
Stormwater, Roads & Bridges,cont. Oakwood Dr. Channel - Dry Stone to Powers $ 5,361,908
Pando Road/Cheyenne Road/Florence Ave./Hancock Ave., Rand Ave to Slater Ave - Drainage $ 1,148,000
Parkview Channel - Parkview to Arcturus $ 376,530
Patty Jewett area/Royer-El Paso-Franklin Streets New Drainage System Phase I/ 725 E.Espanola St.
$ 4,453,000
Patty Jewett Golf Course - Conc Ditch Failure $ 62,000
Pebblewood/Pinecliff Drainage Improvements (Chiaramonte) $ 750,000
Pikes Peak Ave. Storm Sewer - East of Concrete Channel $ 2,397,597
Pikes Peak Avenue at Academy Blvd. $ 361,000
Pine Creek Tributary at Misty Meadow Dr. $ 1,002,686
Pitkin Street Drainage - Platte to Boulder $ 185,000
Polk/Steel Streets Drainage $ 1,206,000
Pond Retrofits $ 724,000
Pt 38 Channel - pt 37 to 38 $ 599,612
Rampart Park Channel - Summerset to Lexington $ 7,217,953
Rangewood - Main Stem to Woodland Hills Dr. $ 433,077
Red Sky Drive and Heatherdale Drive $ 130,000
Rock Ridge Ct. $ 38,200
Rockrimmon Channel $ 3,720,000
Rockrimmon Channel at Rockrimmon/Pro Rodeo Int. $ 97,475
Rockrimmon Channel Grade Control Stabilization $ 1,000,000
S. Douglas Creek Critical Repairs $ 2,263,467
Salano Ave. / W. Ramona Ave. / Apache Trl. intersection $ 126,456
Scorpio Gulch - Box Culvert Upgrade at 21st Street $ 571,000
Scorpio Gulch, Reach 8 $ 556,951
Scott/Winfield/Stratton Intersection Drainage Outfall to Cheyenne Creek $ 683,000
Serendipity Circle Storm Drain Outfall to Radiant Drive Channel $ 445,000
Shooks Run - Boulder St. /Willamette St. $ 5,172,114
Shooks Run - Fountain Blvd. $ 2,647,008
Shooks Run - Fountain Creek to Abandoned RR $ 835,897
Shooks Run - Las Vegas St. $ 1,915,598
Shooks Run - San Miquel St. $ 592,094
Shooks Run - St. Vrain St. $ 975,213
Shooks Run - Willamette St. $ 1,950,427
Shooks Run - Willamette St. to Cache La Poudre St. $ 417,949
Shooks Run Channel - Bijou St. Culvert and Channel Stabilization $ 1,500,000
Shooks Run Channel Costilla to Platte - DBPS "C" $ 32,944,683
Shooks Run Culverts, Phase 1 Costilla $ 2,643,525
Shooks Run Culverts, Phase 2 Platte to Boulder $ 8,313,694
Shooks Run North/Templeton Gap Drainage - drain piping capacity upgrade - Old Farm Circle $ 751,000
Siferd Boulevard Culvert Replacement $ 2,235,000
Skway Gulch, Reach 12 $ 337,961
Skyway Blvd - near pt 17A $ 125,131
Spring Creek Drainage Improvements: Golf Pond to Fountain $ 3,264,000
Spring Creek Drainage Improvements: South of Pikes Peak Avenue $ 2,458,000
Spring Creek South Trib - South Trib to Spring Creek Dev. $ 1,160,692
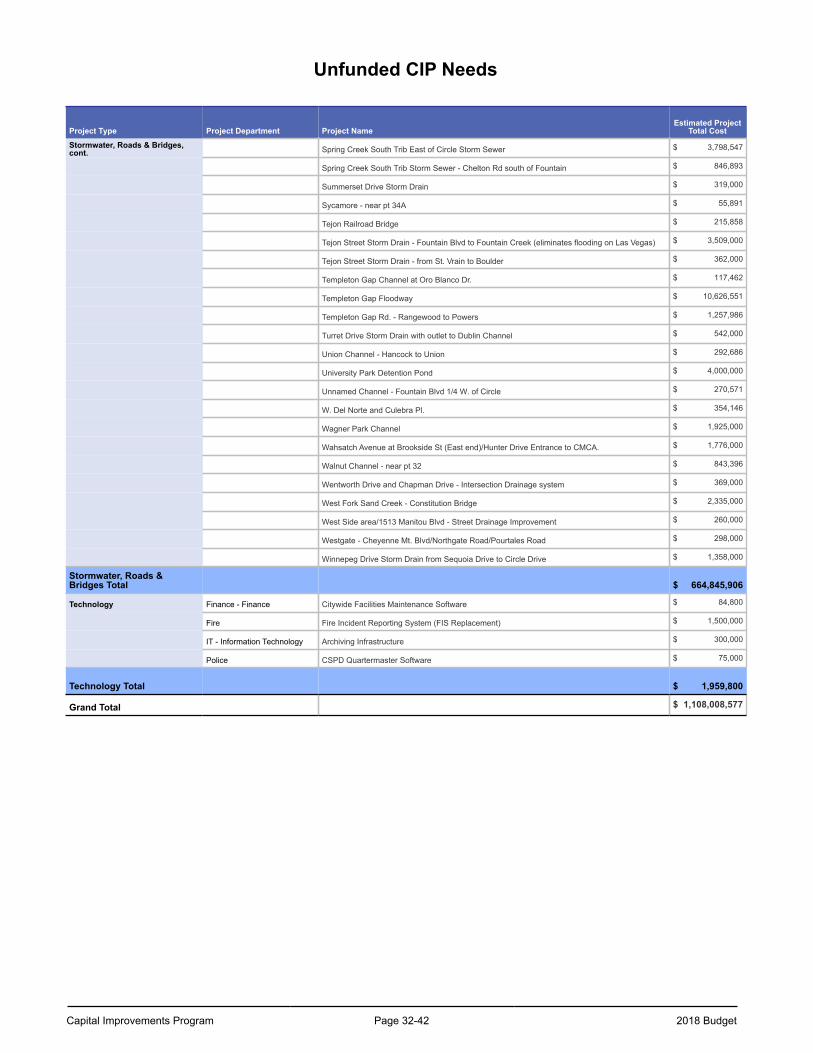
Capital Improvements Program Page 32-42 2018 Budget
Unfunded CIP Needs
Project Type Project Department Project NameEstimated Project
Total Cost
Stormwater, Roads & Bridges,cont. Spring Creek South Trib East of Circle Storm Sewer $ 3,798,547
Spring Creek South Trib Storm Sewer - Chelton Rd south of Fountain $ 846,893
Summerset Drive Storm Drain $ 319,000
Sycamore - near pt 34A $ 55,891
Tejon Railroad Bridge $ 215,858
Tejon Street Storm Drain - Fountain Blvd to Fountain Creek (eliminates flooding on Las Vegas) $ 3,509,000
Tejon Street Storm Drain - from St. Vrain to Boulder $ 362,000
Templeton Gap Channel at Oro Blanco Dr. $ 117,462
Templeton Gap Floodway $ 10,626,551
Templeton Gap Rd. - Rangewood to Powers $ 1,257,986
Turret Drive Storm Drain with outlet to Dublin Channel $ 542,000
Union Channel - Hancock to Union $ 292,686
University Park Detention Pond $ 4,000,000
Unnamed Channel - Fountain Blvd 1/4 W. of Circle $ 270,571
W. Del Norte and Culebra Pl. $ 354,146
Wagner Park Channel $ 1,925,000
Wahsatch Avenue at Brookside St (East end)/Hunter Drive Entrance to CMCA. $ 1,776,000
Walnut Channel - near pt 32 $ 843,396
Wentworth Drive and Chapman Drive - Intersection Drainage system $ 369,000
West Fork Sand Creek - Constitution Bridge $ 2,335,000
West Side area/1513 Manitou Blvd - Street Drainage Improvement $ 260,000
Westgate - Cheyenne Mt. Blvd/Northgate Road/Pourtales Road $ 298,000
Winnepeg Drive Storm Drain from Sequoia Drive to Circle Drive $ 1,358,000
Stormwater, Roads &Bridges Total $ 664,845,906
Technology Finance - Finance Citywide Facilities Maintenance Software $ 84,800
Fire Fire Incident Reporting System (FIS Replacement) $ 1,500,000
IT - Information Technology Archiving Infrastructure $ 300,000
Police CSPD Quartermaster Software $ 75,000
Technology Total $ 1,959,800
Grand Total $ 1,108,008,577
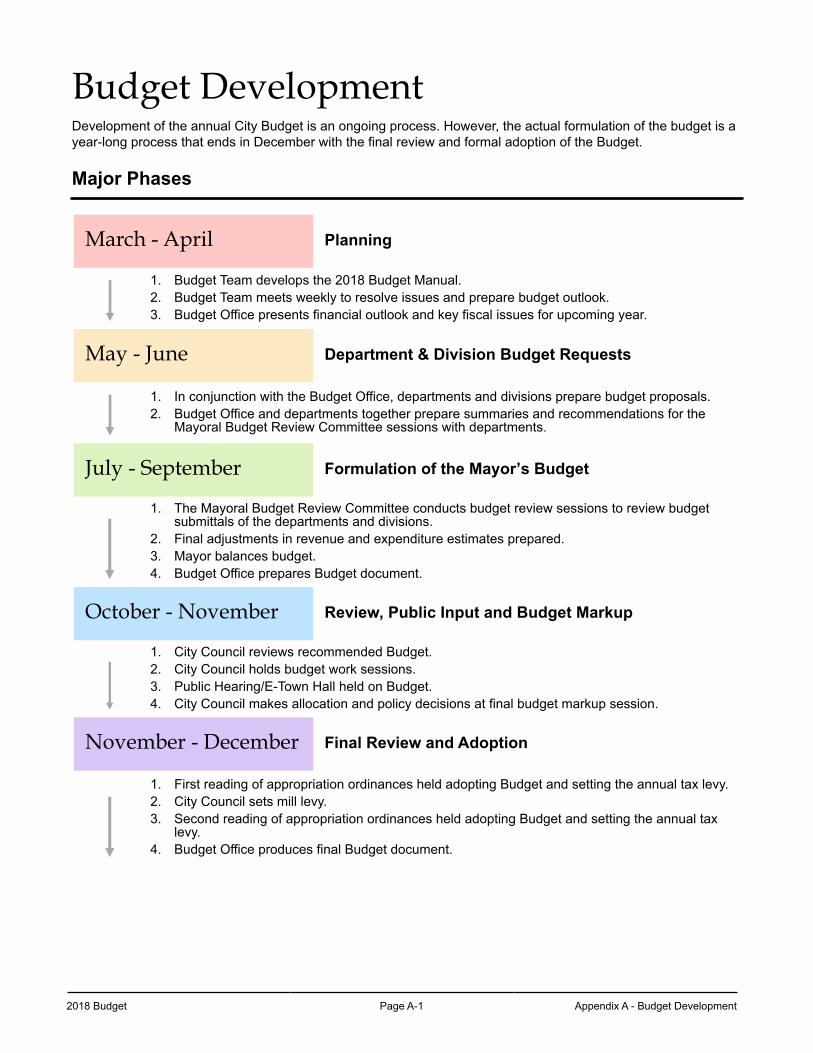
2018 Budget Page A-1 Appendix A - Budget Development
Budget DevelopmentDevelopment of the annual City Budget is an ongoing process. However, the actual formulation of the budget is a year-long process that ends in December with the final review and formal adoption of the Budget.
Major Phases
March - April Planning
1. Budget Team develops the 2018 Budget Manual.2. Budget Team meets weekly to resolve issues and prepare budget outlook.3. Budget Office presents financial outlook and key fiscal issues for upcoming year.
May - June Department & Division Budget Requests
1. In conjunction with the Budget Office, departments and divisions prepare budget proposals.2. Budget Office and departments together prepare summaries and recommendations for the
Mayoral Budget Review Committee sessions with departments.
July - September Formulation of the Mayor’s Budget
1. The Mayoral Budget Review Committee conducts budget review sessions to review budget submittals of the departments and divisions.
2. Final adjustments in revenue and expenditure estimates prepared.3. Mayor balances budget.4. Budget Office prepares Budget document.
October - November Review, Public Input and Budget Markup
1. City Council reviews recommended Budget.2. City Council holds budget work sessions.3. Public Hearing/E-Town Hall held on Budget.4. City Council makes allocation and policy decisions at final budget markup session.
November - December Final Review and Adoption
1. First reading of appropriation ordinances held adopting Budget and setting the annual tax levy.2. City Council sets mill levy.3. Second reading of appropriation ordinances held adopting Budget and setting the annual tax
levy.4. Budget Office produces final Budget document.
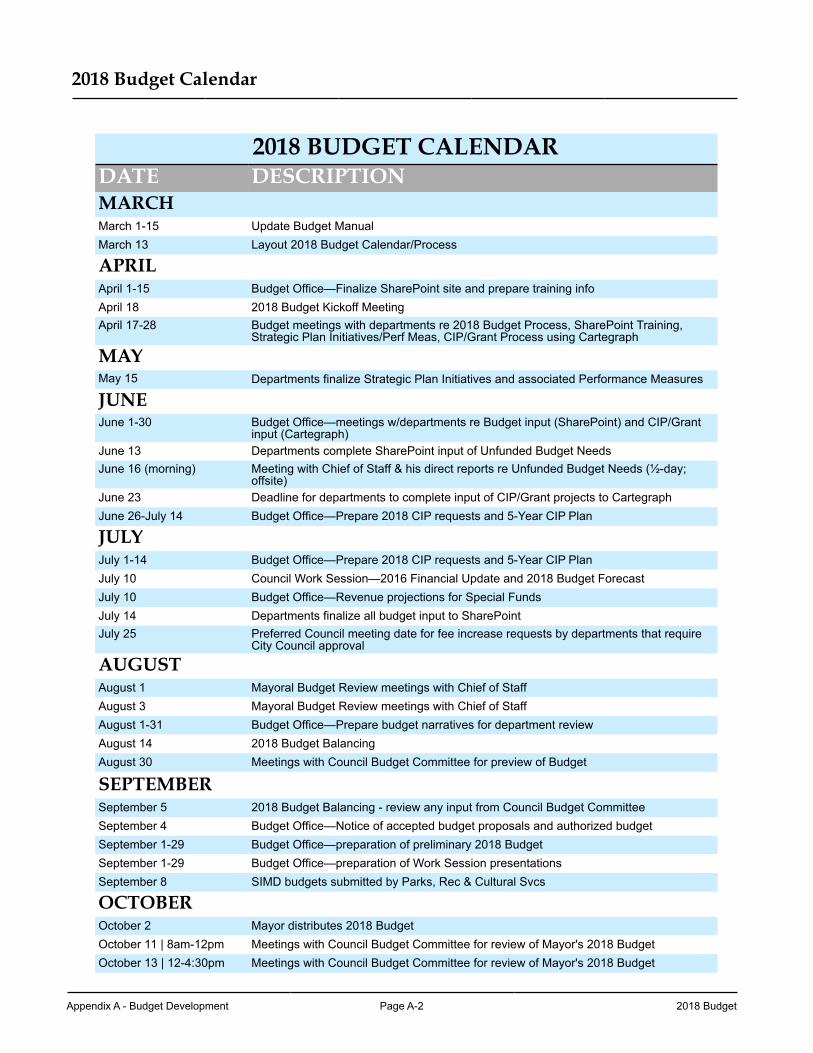
Appendix A - Budget Development Page A-2 2018 Budget
2018 Budget Calendar
2018 BUDGET CALENDARDATE DESCRIPTIONMARCHMarch 1-15 Update Budget ManualMarch 13 Layout 2018 Budget Calendar/Process
APRILApril 1-15 Budget Office—Finalize SharePoint site and prepare training infoApril 18 2018 Budget Kickoff MeetingApril 17-28 Budget meetings with departments re 2018 Budget Process, SharePoint Training,
Strategic Plan Initiatives/Perf Meas, CIP/Grant Process using Cartegraph
MAYMay 15 Departments finalize Strategic Plan Initiatives and associated Performance Measures
JUNEJune 1-30 Budget Office—meetings w/departments re Budget input (SharePoint) and CIP/Grant
input (Cartegraph)June 13 Departments complete SharePoint input of Unfunded Budget NeedsJune 16 (morning) Meeting with Chief of Staff & his direct reports re Unfunded Budget Needs (½-day;
offsite)June 23 Deadline for departments to complete input of CIP/Grant projects to CartegraphJune 26-July 14 Budget Office—Prepare 2018 CIP requests and 5-Year CIP Plan
JULYJuly 1-14 Budget Office—Prepare 2018 CIP requests and 5-Year CIP PlanJuly 10 Council Work Session—2016 Financial Update and 2018 Budget ForecastJuly 10 Budget Office—Revenue projections for Special FundsJuly 14 Departments finalize all budget input to SharePointJuly 25 Preferred Council meeting date for fee increase requests by departments that require
City Council approval
AUGUSTAugust 1 Mayoral Budget Review meetings with Chief of StaffAugust 3 Mayoral Budget Review meetings with Chief of StaffAugust 1-31 Budget Office—Prepare budget narratives for department reviewAugust 14 2018 Budget BalancingAugust 30 Meetings with Council Budget Committee for preview of Budget
SEPTEMBERSeptember 5 2018 Budget Balancing - review any input from Council Budget CommitteeSeptember 4 Budget Office—Notice of accepted budget proposals and authorized budgetSeptember 1-29 Budget Office—preparation of preliminary 2018 BudgetSeptember 1-29 Budget Office—preparation of Work Session presentationsSeptember 8 SIMD budgets submitted by Parks, Rec & Cultural Svcs
OCTOBEROctober 2 Mayor distributes 2018 BudgetOctober 11 | 8am-12pm Meetings with Council Budget Committee for review of Mayor's 2018 BudgetOctober 13 | 12-4:30pm Meetings with Council Budget Committee for review of Mayor's 2018 Budget
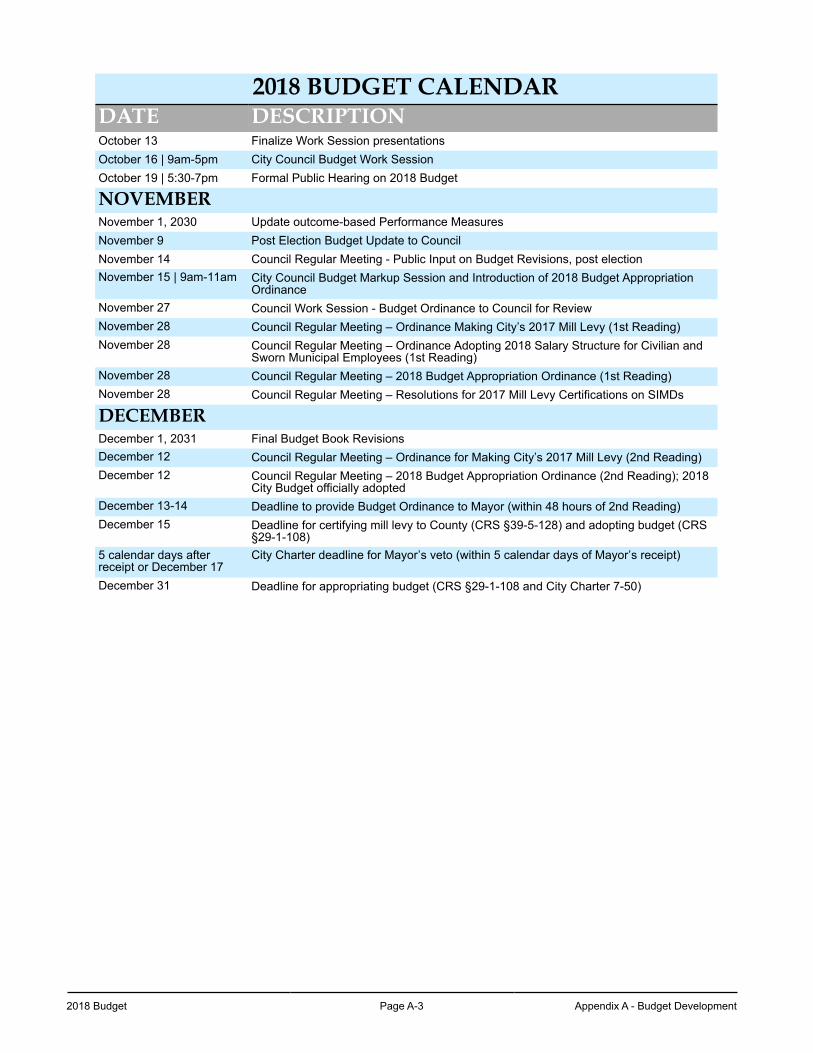
2018 Budget Page A-3 Appendix A - Budget Development
2018 BUDGET CALENDARDATE DESCRIPTIONOctober 13 Finalize Work Session presentationsOctober 16 | 9am-5pm City Council Budget Work SessionOctober 19 | 5:30-7pm Formal Public Hearing on 2018 Budget
NOVEMBERNovember 1, 2030 Update outcome-based Performance MeasuresNovember 9 Post Election Budget Update to CouncilNovember 14 Council Regular Meeting - Public Input on Budget Revisions, post electionNovember 15 | 9am-11am City Council Budget Markup Session and Introduction of 2018 Budget Appropriation
OrdinanceNovember 27 Council Work Session - Budget Ordinance to Council for ReviewNovember 28 Council Regular Meeting – Ordinance Making City’s 2017 Mill Levy (1st Reading)November 28 Council Regular Meeting – Ordinance Adopting 2018 Salary Structure for Civilian and
Sworn Municipal Employees (1st Reading)November 28 Council Regular Meeting – 2018 Budget Appropriation Ordinance (1st Reading)November 28 Council Regular Meeting – Resolutions for 2017 Mill Levy Certifications on SIMDs
DECEMBERDecember 1, 2031 Final Budget Book RevisionsDecember 12 Council Regular Meeting – Ordinance for Making City’s 2017 Mill Levy (2nd Reading)December 12 Council Regular Meeting – 2018 Budget Appropriation Ordinance (2nd Reading); 2018
City Budget officially adoptedDecember 13-14 Deadline to provide Budget Ordinance to Mayor (within 48 hours of 2nd Reading)December 15 Deadline for certifying mill levy to County (CRS §39-5-128) and adopting budget (CRS
§29-1-108)5 calendar days afterreceipt or December 17
City Charter deadline for Mayor’s veto (within 5 calendar days of Mayor’s receipt)
December 31 Deadline for appropriating budget (CRS §29-1-108 and City Charter 7-50)
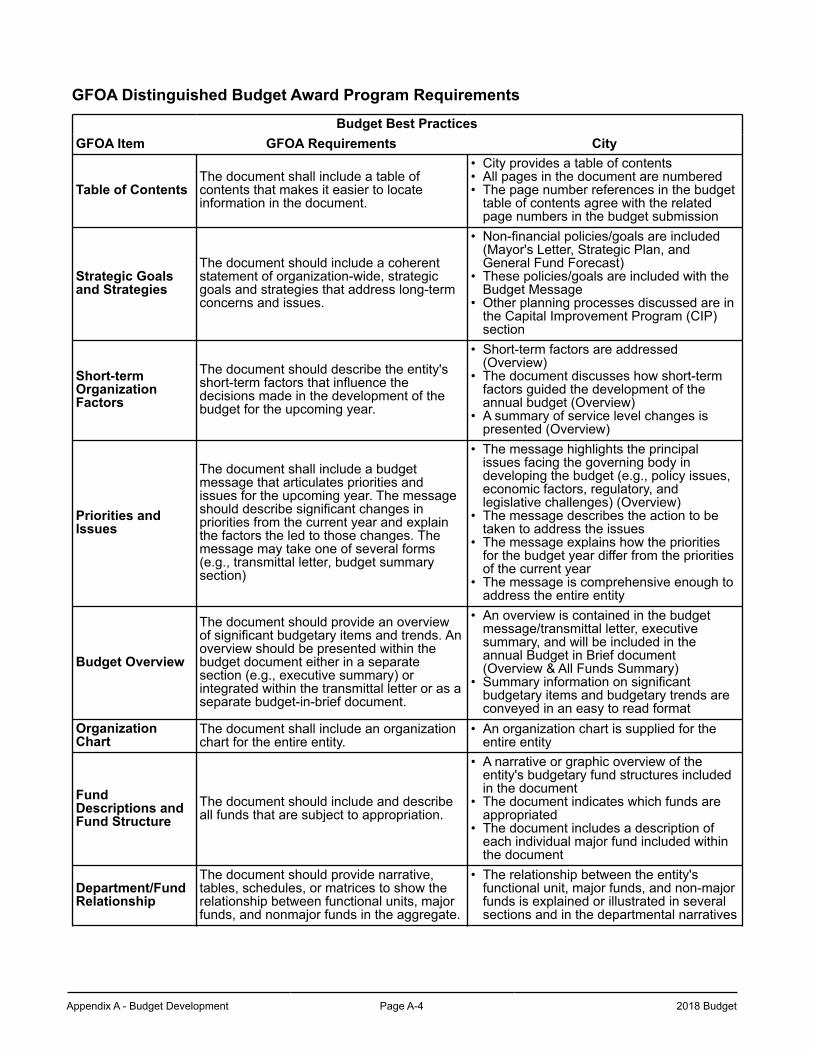
Appendix A - Budget Development Page A-4 2018 Budget
GFOA Distinguished Budget Award Program Requirements
Budget Best PracticesGFOA Item GFOA Requirements City
Table of ContentsThe document shall include a table ofcontents that makes it easier to locateinformation in the document.
• City provides a table of contents• All pages in the document are numbered• The page number references in the budget
table of contents agree with the related page numbers in the budget submission
Strategic Goalsand Strategies
The document should include a coherentstatement of organization-wide, strategicgoals and strategies that address long-termconcerns and issues.
• Non-financial policies/goals are included (Mayor's Letter, Strategic Plan, and General Fund Forecast)
• These policies/goals are included with the Budget Message
• Other planning processes discussed are in the Capital Improvement Program (CIP) section
Short-termOrganizationFactors
The document should describe the entity'sshort-term factors that influence thedecisions made in the development of thebudget for the upcoming year.
• Short-term factors are addressed (Overview)
• The document discusses how short-term factors guided the development of the annual budget (Overview)
• A summary of service level changes is presented (Overview)
Priorities andIssues
The document shall include a budgetmessage that articulates priorities andissues for the upcoming year. The messageshould describe significant changes inpriorities from the current year and explainthe factors the led to those changes. Themessage may take one of several forms(e.g., transmittal letter, budget summarysection)
• The message highlights the principal issues facing the governing body in developing the budget (e.g., policy issues, economic factors, regulatory, and legislative challenges) (Overview)
• The message describes the action to be taken to address the issues
• The message explains how the priorities for the budget year differ from the priorities of the current year
• The message is comprehensive enough to address the entire entity
Budget Overview
The document should provide an overviewof significant budgetary items and trends. Anoverview should be presented within thebudget document either in a separatesection (e.g., executive summary) orintegrated within the transmittal letter or as aseparate budget-in-brief document.
• An overview is contained in the budget message/transmittal letter, executive summary, and will be included in the annual Budget in Brief document (Overview & All Funds Summary)
• Summary information on significant budgetary items and budgetary trends are conveyed in an easy to read format
OrganizationChart
The document shall include an organizationchart for the entire entity.
• An organization chart is supplied for the entire entity
FundDescriptions andFund Structure
The document should include and describeall funds that are subject to appropriation.
• A narrative or graphic overview of the entity's budgetary fund structures included in the document
• The document indicates which funds are appropriated
• The document includes a description of each individual major fund included within the document
Department/FundRelationship
The document should provide narrative,tables, schedules, or matrices to show therelationship between functional units, majorfunds, and nonmajor funds in the aggregate.
• The relationship between the entity's functional unit, major funds, and non-major funds is explained or illustrated in several sections and in the departmental narratives
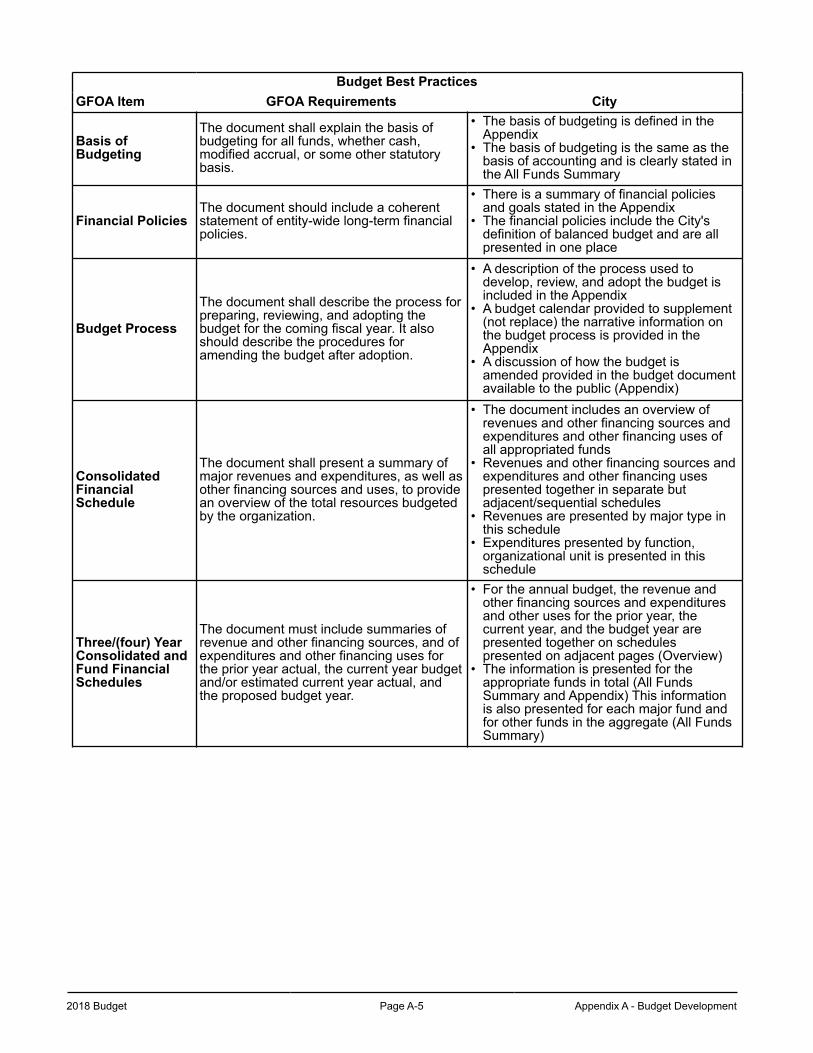
2018 Budget Page A-5 Appendix A - Budget Development
Budget Best PracticesGFOA Item GFOA Requirements City
Basis ofBudgeting
The document shall explain the basis ofbudgeting for all funds, whether cash,modified accrual, or some other statutorybasis.
• The basis of budgeting is defined in the Appendix
• The basis of budgeting is the same as the basis of accounting and is clearly stated in the All Funds Summary
Financial PoliciesThe document should include a coherentstatement of entity-wide long-term financialpolicies.
• There is a summary of financial policies and goals stated in the Appendix
• The financial policies include the City's definition of balanced budget and are all presented in one place
Budget Process
The document shall describe the process forpreparing, reviewing, and adopting thebudget for the coming fiscal year. It alsoshould describe the procedures foramending the budget after adoption.
• A description of the process used to develop, review, and adopt the budget is included in the Appendix
• A budget calendar provided to supplement (not replace) the narrative information on the budget process is provided in the Appendix
• A discussion of how the budget is amended provided in the budget document available to the public (Appendix)
ConsolidatedFinancialSchedule
The document shall present a summary ofmajor revenues and expenditures, as well asother financing sources and uses, to providean overview of the total resources budgetedby the organization.
• The document includes an overview of revenues and other financing sources and expenditures and other financing uses of all appropriated funds
• Revenues and other financing sources and expenditures and other financing uses presented together in separate but adjacent/sequential schedules
• Revenues are presented by major type in this schedule
• Expenditures presented by function, organizational unit is presented in this schedule
Three/(four) YearConsolidated andFund FinancialSchedules
The document must include summaries ofrevenue and other financing sources, and ofexpenditures and other financing uses forthe prior year actual, the current year budgetand/or estimated current year actual, andthe proposed budget year.
• For the annual budget, the revenue and other financing sources and expenditures and other uses for the prior year, the current year, and the budget year are presented together on schedules presented on adjacent pages (Overview)
• The information is presented for the appropriate funds in total (All Funds Summary and Appendix) This information is also presented for each major fund and for other funds in the aggregate (All Funds Summary)
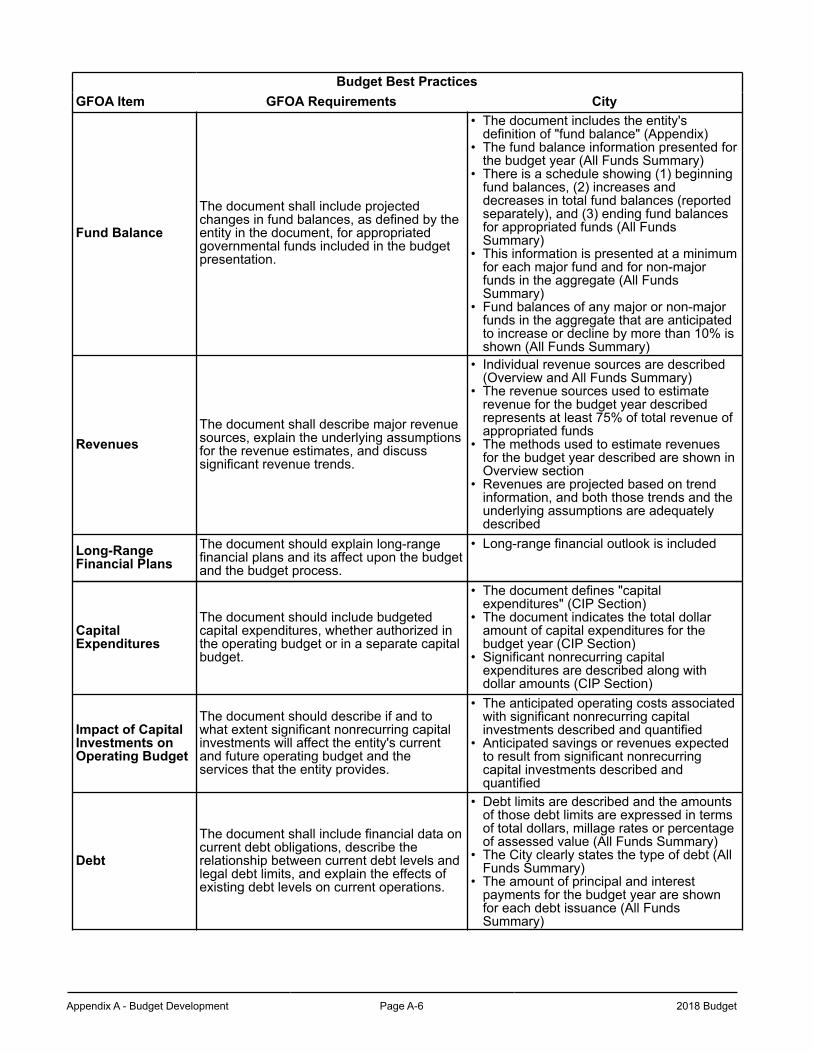
Appendix A - Budget Development Page A-6 2018 Budget
Budget Best PracticesGFOA Item GFOA Requirements City
Fund Balance
The document shall include projectedchanges in fund balances, as defined by theentity in the document, for appropriatedgovernmental funds included in the budgetpresentation.
• The document includes the entity's definition of "fund balance" (Appendix)
• The fund balance information presented for the budget year (All Funds Summary)
• There is a schedule showing (1) beginning fund balances, (2) increases and decreases in total fund balances (reported separately), and (3) ending fund balances for appropriated funds (All Funds Summary)
• This information is presented at a minimum for each major fund and for non-major funds in the aggregate (All Funds Summary)
• Fund balances of any major or non-major funds in the aggregate that are anticipated to increase or decline by more than 10% is shown (All Funds Summary)
RevenuesThe document shall describe major revenuesources, explain the underlying assumptionsfor the revenue estimates, and discusssignificant revenue trends.
• Individual revenue sources are described (Overview and All Funds Summary)
• The revenue sources used to estimate revenue for the budget year described represents at least 75% of total revenue of appropriated funds
• The methods used to estimate revenues for the budget year described are shown in Overview section
• Revenues are projected based on trend information, and both those trends and the underlying assumptions are adequately described
Long-RangeFinancial Plans
The document should explain long-rangefinancial plans and its affect upon the budgetand the budget process.
• Long-range financial outlook is included
CapitalExpenditures
The document should include budgetedcapital expenditures, whether authorized inthe operating budget or in a separate capitalbudget.
• The document defines "capital expenditures" (CIP Section)
• The document indicates the total dollar amount of capital expenditures for the budget year (CIP Section)
• Significant nonrecurring capital expenditures are described along with dollar amounts (CIP Section)
Impact of CapitalInvestments onOperating Budget
The document should describe if and towhat extent significant nonrecurring capitalinvestments will affect the entity's currentand future operating budget and theservices that the entity provides.
• The anticipated operating costs associated with significant nonrecurring capital investments described and quantified
• Anticipated savings or revenues expected to result from significant nonrecurring capital investments described and quantified
Debt
The document shall include financial data oncurrent debt obligations, describe therelationship between current debt levels andlegal debt limits, and explain the effects ofexisting debt levels on current operations.
• Debt limits are described and the amounts of those debt limits are expressed in terms of total dollars, millage rates or percentage of assessed value (All Funds Summary)
• The City clearly states the type of debt (All Funds Summary)
• The amount of principal and interest payments for the budget year are shown for each debt issuance (All Funds Summary)
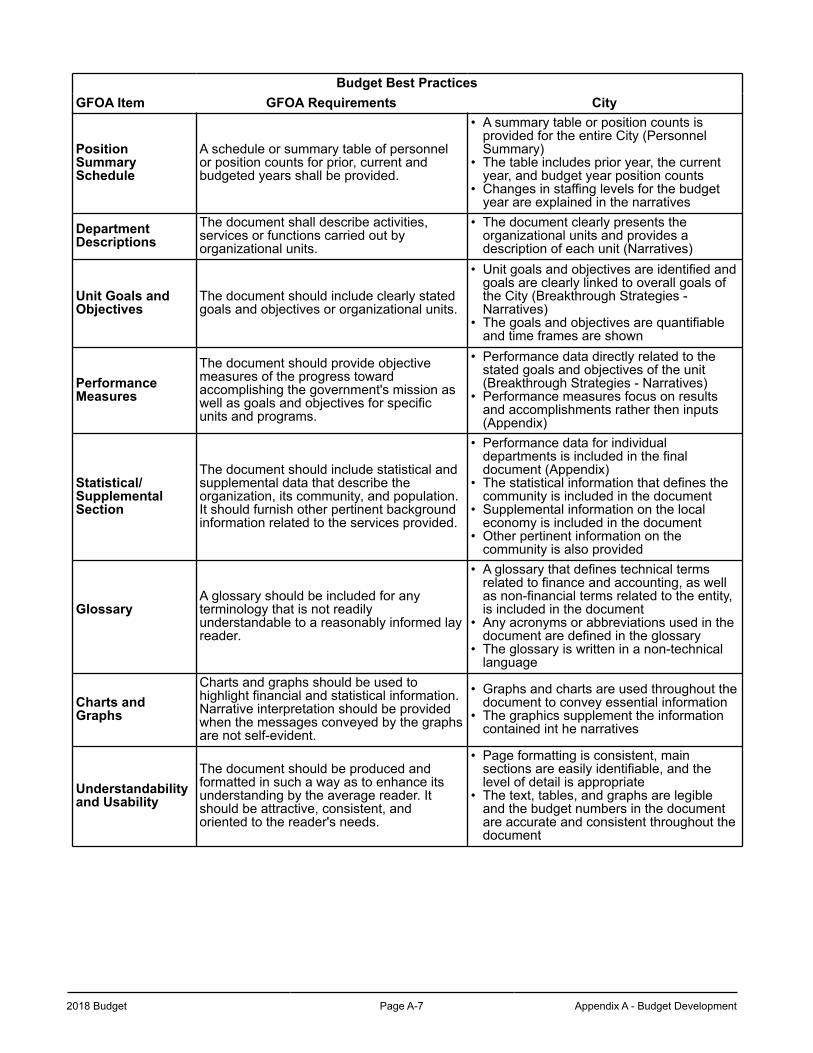
2018 Budget Page A-7 Appendix A - Budget Development
Budget Best PracticesGFOA Item GFOA Requirements City
PositionSummarySchedule
A schedule or summary table of personnelor position counts for prior, current andbudgeted years shall be provided.
• A summary table or position counts is provided for the entire City (Personnel Summary)
• The table includes prior year, the current year, and budget year position counts
• Changes in staffing levels for the budget year are explained in the narratives
DepartmentDescriptions
The document shall describe activities,services or functions carried out byorganizational units.
• The document clearly presents the organizational units and provides a description of each unit (Narratives)
Unit Goals andObjectives
The document should include clearly statedgoals and objectives or organizational units.
• Unit goals and objectives are identified and goals are clearly linked to overall goals of the City (Breakthrough Strategies - Narratives)
• The goals and objectives are quantifiable and time frames are shown
PerformanceMeasures
The document should provide objectivemeasures of the progress towardaccomplishing the government's mission aswell as goals and objectives for specificunits and programs.
• Performance data directly related to the stated goals and objectives of the unit (Breakthrough Strategies - Narratives)
• Performance measures focus on results and accomplishments rather then inputs (Appendix)
Statistical/SupplementalSection
The document should include statistical andsupplemental data that describe theorganization, its community, and population.It should furnish other pertinent backgroundinformation related to the services provided.
• Performance data for individual departments is included in the final document (Appendix)
• The statistical information that defines the community is included in the document
• Supplemental information on the local economy is included in the document
• Other pertinent information on the community is also provided
GlossaryA glossary should be included for anyterminology that is not readilyunderstandable to a reasonably informed layreader.
• A glossary that defines technical terms related to finance and accounting, as well as non-financial terms related to the entity, is included in the document
• Any acronyms or abbreviations used in the document are defined in the glossary
• The glossary is written in a non-technical language
Charts andGraphs
Charts and graphs should be used tohighlight financial and statistical information.Narrative interpretation should be providedwhen the messages conveyed by the graphsare not self-evident.
• Graphs and charts are used throughout the document to convey essential information
• The graphics supplement the information contained int he narratives
Understandabilityand Usability
The document should be produced andformatted in such a way as to enhance itsunderstanding by the average reader. Itshould be attractive, consistent, andoriented to the reader's needs.
• Page formatting is consistent, main sections are easily identifiable, and the level of detail is appropriate
• The text, tables, and graphs are legible and the budget numbers in the document are accurate and consistent throughout the document

Appendix A - Budget Development Page A-8 2018 Budget
This page left blank intentionally.
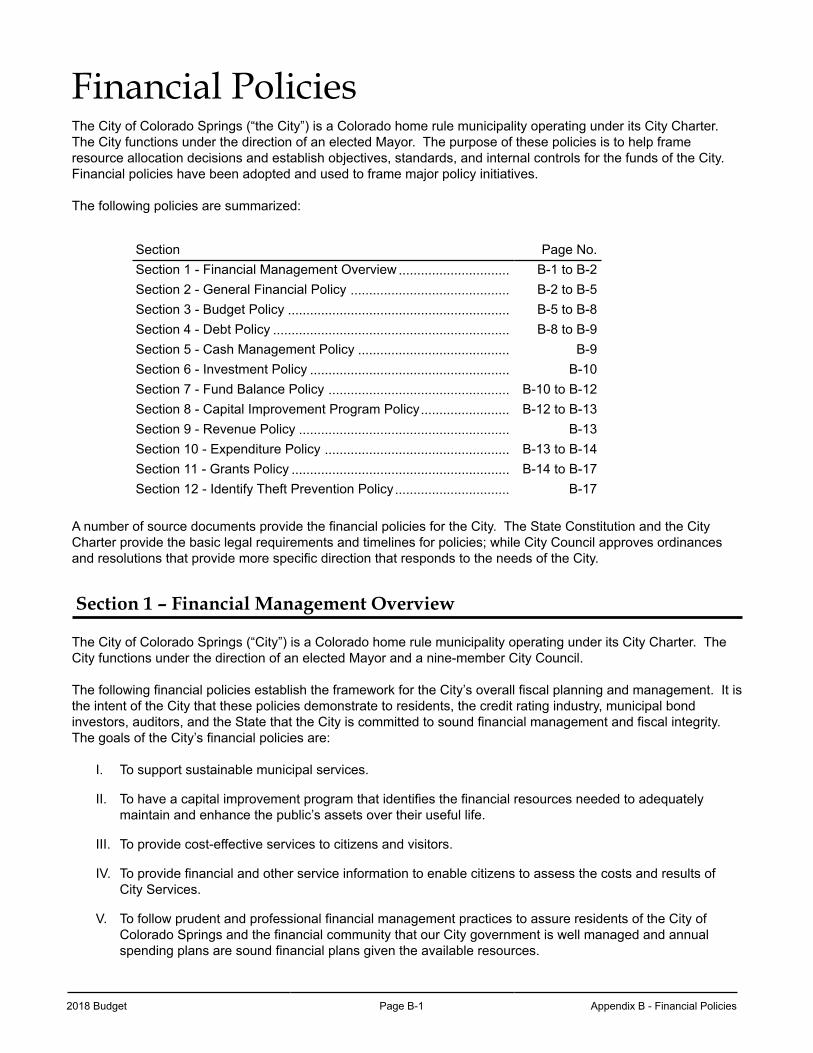
2018 Budget Page B-1 Appendix B - Financial Policies
Financial PoliciesThe City of Colorado Springs (“the City”) is a Colorado home rule municipality operating under its City Charter. The City functions under the direction of an elected Mayor. The purpose of these policies is to help frame resource allocation decisions and establish objectives, standards, and internal controls for the funds of the City. Financial policies have been adopted and used to frame major policy initiatives.
The following policies are summarized:
Section Page No.Section 1 - Financial Management Overview .............................. B-1 to B-2Section 2 - General Financial Policy ........................................... B-2 to B-5Section 3 - Budget Policy ............................................................ B-5 to B-8Section 4 - Debt Policy ................................................................ B-8 to B-9Section 5 - Cash Management Policy ......................................... B-9Section 6 - Investment Policy ...................................................... B-10Section 7 - Fund Balance Policy ................................................. B-10 to B-12Section 8 - Capital Improvement Program Policy........................ B-12 to B-13Section 9 - Revenue Policy ......................................................... B-13Section 10 - Expenditure Policy .................................................. B-13 to B-14Section 11 - Grants Policy ........................................................... B-14 to B-17Section 12 - Identify Theft Prevention Policy............................... B-17
A number of source documents provide the financial policies for the City. The State Constitution and the City Charter provide the basic legal requirements and timelines for policies; while City Council approves ordinances and resolutions that provide more specific direction that responds to the needs of the City.
Section 1 – Financial Management Overview
The City of Colorado Springs (“City”) is a Colorado home rule municipality operating under its City Charter. The City functions under the direction of an elected Mayor and a nine-member City Council.
The following financial policies establish the framework for the City’s overall fiscal planning and management. It is the intent of the City that these policies demonstrate to residents, the credit rating industry, municipal bond investors, auditors, and the State that the City is committed to sound financial management and fiscal integrity. The goals of the City’s financial policies are:
I. To support sustainable municipal services.
II. To have a capital improvement program that identifies the financial resources needed to adequately maintain and enhance the public’s assets over their useful life.
III. To provide cost-effective services to citizens and visitors.
IV. To provide financial and other service information to enable citizens to assess the costs and results of City Services.
V. To follow prudent and professional financial management practices to assure residents of the City of Colorado Springs and the financial community that our City government is well managed and annual spending plans are sound financial plans given the available resources.
Appendix B - Financial Policies Page B-2 2018 Budget
This document is intended to be an overview of various financial policies and is not meant to be a detailed procedures source or detailed department specific source. If the material in this document does not answer a specific question, please contact the Finance Department.
Detailed City department policies provide more specific direction on how to achieve identified goals and are the basis for consistent actions that move the community and organization toward sound financial management decisions.
Section 2 – General Financial Policy
I. Fund Accounting
A fund is a separate, self-balancing set of accounts used to account for resources that are segregated for specific purposes in accordance with special regulations, restrictions or limitations.
The separation of the City’s activities into funds allows the City to maintain the appropriate (required) controls over expenditures for each activity and to report on specific activities to interested citizens.
Fund Types: All funds are classified into six (6) fund types. These fund types, and the purpose of each are:
a. General Fund – To account for the administrative, police and fire protection, parks, recreation, community development, infrastructure, and technology functions of the City. Principal sources of revenue consists of property taxes, franchise and occupancy taxes, sales and use taxes, licenses and permits, grants, charges for services, intergovernmental revenue, interest earnings, and operating transfers from other funds. Major expenditures are for personnel costs, materials and supplies, purchased services, capital outlay, and transfers to other funds.
b. Special Revenue Funds – To account for and report the proceeds of specific revenue sources that are restricted or committed to expenditure for specified purposes other than debt service or capital projects. One or more specific restricted or committed revenues should comprise a substantial portion of the fund’s resources but may also include other restricted, committed, and assigned resources.
c. Capital Projects Fund – To account for and report financial resources that are restricted, committed, or assigned to expenditure for capital outlays, including the acquisition or construction of capital facilities and other capital assets. Outflows financed by proprietary funds and assets held in trust are excluded.
d. Debt Service Fund – To account for and report financial resources that are restricted, committed, or assigned to expenditure for principal and interest.
e. Enterprise Funds (also called Business or Proprietary Funds) – To account for operations that are financed and operated in a manner similar to private business enterprises, where the intent of the governing body is that the costs (expenses including depreciation) of providing goods or services to the general public on a continuing basis be financed or recovered primarily through user determination of revenues earned, expenses incurred, and/or net income as appropriate for capital maintenance, public policy, management control, accountability, or other purposes.
f. Fiduciary Funds – To account for resources received and held by the City in a fiduciary capacity. Disbursements from these funds are made in accordance with the trust or other agreements or conditions of the trust for the particular source of funds.
2018 Budget Page B-3 Appendix B - Financial Policies
II. Accounting and Auditing Policies
The City maintains a system for financial monitoring, control and reporting for all operations, funds and agencies in order to provide effective means to ensure that overall City goals and objectives are met and to instill confidence in the City’s partners and investors that the City is well-managed and fiscally sound.
The City maintains its accounting records and reports on its financial condition and results of operations in accordance with state and federal law and regulations and generally accepted accounting principles in the United States (GAAP), which are set by the Governmental Accounting Standards Board (GASB) and the Financial Accounting Standards Board (FASB).
Annually, an independent firm of certified public accountants performs a financial and compliance audit of the City’s financial statements. Their opinions are included in the City’s Comprehensive Annual Financial Report (CAFR) and the Single Audit Report as required by Subpart F-Audit Requirements in 2 CFR 200, Office of Management and Budget Uniform Administrative Requirements, Cost Principles, and Audit Requirements for Federal Awards. See Section 11 – Grants Policy for additional information.
III. Basis of Accounting and Reporting Focus
The term “basis of accounting” refers to when revenues, expenses, expenditures – and the related assets and liabilities – are recognized in the accounts and reported in the financial statements. Specifically, it relates to the timing of the measurements made. The following are the basis of accounting available for use by the City:
a. Cash Basis – Transactions are recognized only when cash is received or disbursed.
b. Accrual Basis – Transactions are recognized when the economic event occurs, regardless of whether or not cash is received or paid. Proprietary funds, which encompass the enterprise funds, use the accrual basis of accounting. These funds have an income measurement/capital maintenance focus. The accrual basis of accounting is used by private enterprises as well.
c. Modified Accrual Basis – Expenditure transactions are recognized when incurred. Revenues are recognized when they are both measurable and available to finance the expenditures of the current period. Governmental funds, including general, special revenue, debt service, and capital projects, use the modified accrual basis of accounting. For a revenue to be recognized in a governmental fund, it must be “measurable” (the amount must be known or be reasonably estimated), and it must be “available” to finance the expenditures of the same fiscal period for which the revenue is recorded. “Available,” in this case, means collectible in the current period or soon enough thereafter to be used to pay liabilities of the current period. For purposes of consistency, that time-frame shall be thirty (30) days for all sales tax transactions or within sixty (60) days for all other transactions.
Reporting Focus (Budget vs. GAAP) – This concept is used to refer to the way transactions are recorded and reported for compliance with Colorado Budget Law as opposed to financial statement presentation in conformance with GAAP.
a. Budget Basis – The City’s monthly statement of revenues and expenditures are reported during the fiscal year on what is informally called a “budget basis.” The City’s transactions are recorded throughout the year in accordance with the financial statement requirements as set forth within the Colorado Revised Statutes. By recording the transactions in general compliance with this law, the revenues and expenditures can be more easily monitored on a monthly basis to ensure compliance with the legal requirements as set forth within the Colorado Revised Statutes.
b. GAAP – At the end of the fiscal year, adjustments are made to present the financial information in a format that is comparable to that used by other local government units around the country. The standards for this reporting are referred to as “generally accepted accounting principles” (or GAAP basis). The adjustments to convert the City’s financial records from “budget basis” to “GAAP basis” are made to ensure that the City’s financial statements are fairly and consistently presented in conformance with GAAP.
Appendix B - Financial Policies Page B-4 2018 Budget
IV. Internal Control Structure
The City maintains an internal control structure consisting of the following three elements:
a. Control Environment – an overall attitude and awareness of actions as they influence the City.
b. Accounting System – an effective accounting system that results in identification and recording of all valid transactions, description on a timely basis of the type of transaction in sufficient detail to permit proper classification of the transaction for reporting purposes, recording of the transaction in the correct time period, and proper presentation of all transactions and related disclosures in the financial statements.
c. Control Procedures – proper authorization of transactions and activities, adequate segregation of duties, adequate documentation and records, adequate safeguards regarding access and use of assets and records, and independent checks on performance.
Funds are categorized by standard GAAP functional classifications; and the development of new funds, departments, programs, and accounts shall be approved by the Finance Department.
Each fund in the City’s budget will have an introductory statement of purpose which shall consist of the intent of the fund, sources of revenue and restricted revenues, if any, and required reserves and justification for such reserves.
V. Financial Monitoring
The Budget Manager is charged with the primary responsibility for monitoring the fiscal implementation of the approved budget. In addition, the Budget Office and Finance Department will work closely with other departments to apprise them of their financial status and of any potential issues that may affect their budgets. The Budget Office and the Finance Department may review fiscal issues affecting any part of the City organization. This activity supports the monitoring role and focuses on the protection of City assets and the legal, efficient, and effective use of City resources. Together the Budget Manager and the Chief Financial Officer will provide City Council with regular reports on the City’s finances including a financial report containing budget versus actual revenue and expense information. These reports fulfill a requirement in City Charter §3-140.
Individual departments are responsible for monitoring and managing their resources to ensure that the legal and administrative appropriation to the department is not overspent and that all expenditures and uses of City resources are in conformity with City, state, and federal ordinances, statutes, policies, and regulations.
a. Legal Appropriation – Each department is responsible for ensuring that expenditures do not exceed the legal appropriation level for their department within each fund, operating and capital expenditures combined.
b. Revenues – Each department is responsible for monitoring revenues that are collected as a result of programs administered. If a significant change in the estimate for the current or future fiscal year’s results, the department must contact the Budget Office to advise of the change.
VI. Audit
The Charter and Code of the City of Colorado Springs, State of Colorado statutes, and federal laws and regulations will be followed wherever they apply to the financial activities of the City. The source of historical financial information about the City will be the central accounting system as operated and maintained by the Finance Department. The source of all current and future budget information, including spending plans, revenues, and expenditures, is the annual budget document.
2018 Budget Page B-5 Appendix B - Financial Policies
a. Internal Audit – The City of Colorado Springs Office of the City Auditor evaluates the adequacy of financial controls, systems, records, and organizational operations. They provide Council, management and employees objective analysis, appraisals and recommendations for improving systems and activities.
b. External Audit – In accordance with City Charter §3-160, an annual external audit will be performed by an independent public accounting firm with the subsequent issuance of a financial report and opinion.
c. Single Audit –The City contracts with an external firm to conduct a single audit on an annual basis as per 2 CFR 200. See Section 11 – Grants Policy for additional information on audit requirements.
Section 3 – Budget Policy
I. Overview
The annual budget is an operational plan that provides the Mayor and City Council with the financial information necessary to guide resource allocation to accomplish the goals and objectives of the City. The budget details how municipal services will be provided. The budget, along with the annual appropriation ordinance and any supplemental appropriations, provide the basis for the control of expenditures and set the financial guidelines for the City. The basic legal requirements and budget process are defined by the State Constitution and City Charter.
II. Budget Philosophy
The City is committed to developing a sound financial plan for the operations and capital improvements that meet the City’s Strategic Plan goals. The City provides a wide variety of services to residents and visitors. It is the responsibility of the City Council to adopt a budget and the Mayor’s responsibility to manage the available resources to best meet the service needs for the overall good of the community. To achieve this, the City:
a. Utilizes conservative growth and revenue forecasts;
b. Prepares plans for operations and capital improvements;
c. Allows staff to manage the operating and capital budgets, with City Council approving the allocations for both;
d. Adopts financial policies;
d. Establishes budgets for all funds based on adopted policies;
e. Appropriates the budget in accordance with the City Charter and State Constitution; and
f. Develops a budget that minimizes adverse impacts to the community.
III. Budget Preparation Process
The City identifies important community outcomes and develops a financial and service delivery plan to achieve those outcomes. City Council allocates funding based on current priorities and results, and does not simply increase the prior year’s budget. Each year, the Budget Office prepares a forecast for the following year’s budget. In May, the Budget Office prepares a budget manual with the Mayor’s budget objectives and guidelines for developing the following year’s budget for the departments use. In June and July, departments develop revenue and expense projections for the following year and submit them to the Budget Office. In July, departments present their budget to the Budget Review Committee for review and analysis. Not later than the first Monday in October, the Mayor submits a preliminary budget to City Council for review. In October, the citizens of Colorado Springs provide their feedback on the proposed
Appendix B - Financial Policies Page B-6 2018 Budget
budget and City Council holds work sessions on each department’s proposed budget. In November, City Council may amend the Mayor’s proposed budget. In December, City Council approves the budget and appropriations ordinances. The Mayor may then veto specific lines of the budget. The City Council can override the Mayor’s vetoes with six votes. By December 31st City Council must adopt the following year’s budget.
IV. State Statutory Requirements
The State Statute indicates that no later than October 15 of each year, the budget shall be submitted to the governing body. As a result, the Mayor presents the recommended budget for the ensuing fiscal year to City Council no later than October 15 of each year.
V. Colorado Springs City Charter Requirements
a. Budget Fiscal Year – Colorado Springs City Charter §7-10.
The fiscal year of the City shall commence on the first day of January and end on the last day of December of each year (1909; 1977).
b. Mayor’s Powers and Duties – Colorado Springs City Charter §3-70(e).
Every ordinance finally passed by the Council shall be presented to the Mayor within forty-eight hours thereafter for final adoption. If the Mayor approves such ordinance, he or she shall finally adopt it by signing it within five days after receiving it. If the Mayor disapproves, the ordinance shall be returned to the Council within five days with the Mayor’s objections in writing. If then six (6) of the members vote to pass the same over the Mayor’s veto, it shall become a finally adopted ordinance, notwithstanding the objections of the Mayor. If the Mayor does not return the ordinance with written objections within the time specified, it shall become finally adopted as if the Mayor had approved it. (2010)
(1) In any ordinance appropriating funds, the Mayor may disapprove specific line items without disapproving the entire ordinance. After disapproval of specific line items, the ordinance shall be returned to Council to complete the over-ride process as outlined above as to each line item vetoed. (2010)
(2) Notwithstanding the foregoing subsections, the Mayor shall not have power to disapprove by veto the following listed types of ordinances, this limitation applying only to the following specifically identified ordinances: an ordinance accomplishing any quasi-judicial act; an ordinance approving bonds to be issued by any City enterprise; an ordinance pertaining to Article VI, “Utilities,” of this Charter; an ordinance submitting a Charter amendment to a vote of the qualified electors; or an ordinance proposing a Charter convention. (2010)
c. Specific Powers and Duties of the Mayor – Colorado Springs City Charter §4-40 (i).
(i) On or before the first Monday in October in each year, the Mayor shall furnish to the Council estimates in writing of the probable expenses to be incurred in the several departments of the City for the ensuing fiscal year, specifying in detail probable expenditures, including a statement of the salaries of all administrative officers and employees, and certify the amount of money to be raised by taxation during the ensuing fiscal year to make payment of interest, sinking fund, and principal of bonded indebtedness and also the estimated amount of revenue from all sources other than tax levy. At the same time or on such later date in each year as shall be fixed by the Council, the Mayor shall prepare and present to the Council the annual budget for the ensuing fiscal year, which shall include interest and sinking fund on the bonded debt. The budget so prepared shall be in such detail as to the aggregate sum and the items thereof allowed to each department, office, board, or commission as the Mayor may deem advisable except such as are fixed by law. (2010)
2018 Budget Page B-7 Appendix B - Financial Policies
d. City Council Duties – Strategic Plan – Colorado Springs City Charter §3-10(c).
To provide for the future of the City, Council shall maintain a strategic plan which prioritizes goals for the City Council and establishes measurable outcomes. The plan process shall consider public input. Council shall provide the plan and goals to the Mayor for consideration in the development of the municipal administrative budget. (1909; 1920; 1977; 1993; 2005; 2010)
e. Budget Process – Colorado Springs City Charter §7-30.
The City Council shall, upon receipt of the budget, adopt the budget with or without amendment. In amending the budget, the City Council may add or increase programs or amounts and may delete or decrease any programs or amounts, except amounts required by law or for debt service on general obligation bonds or for estimated cash deficit provided, however, that no amendment to the budget shall increase the authorized expenditures to an amount greater than the total of estimated income. (1909; 1977)
In adopting the budget, the City Council shall also estimate and declare the amount of money necessary to be raised by tax levy. The estimate shall take into account the amounts available from other sources to meet the expenses of the City for the ensuing fiscal year. The budget and estimate as finally adopted shall be signed by the Mayor and City Clerk and filed with the Chief Financial Officer. (1909; 1977) (Ed. Note: Formerly section 41)
The budget shall include all stipends and other expenses of City Council and the salary of the Mayor and the budget shall declare the amount of money necessary to fund the budget. Subject to any pre-existing bond covenants, the City Council’s budget shall be apportioned among the City’s general fund, its Utilities funds and its health system fund as a reflection of City Council’s direct responsibilities for all municipal and Utilities matters as well as City Council’s general supervision and control of health system matters based upon such reasonable allocation methodology as City Council may determine. (2005; 2010)
A public hearing is held on the fourth Thursday in October of each fiscal year to allow public comment upon the proposed budget.
f. Appropriations – Colorado Springs City Charter §7-50.
Upon the basis of the budget as adopted and filed, the several sums shall forthwith be appropriated by ordinance to the several purposes therein named for the ensuing fiscal year. Said ordinance shall be adopted not later than the thirty-first day of December in each year, and shall be entitled “The Annual Appropriation Ordinance.” (1909; 1977) (Ed. Note: Formerly Section 43)
VI. Colorado Springs City Code Requirements
City Code §1.5 Financial Management Procedures details required financial management procedures. This section defines appropriation, budget, department, and special fund. It outlines procedures for the creation of accounts, amendments to the appropriation and tax levy ordinance, transfers of funds within departments or special funds, transfers of funds between departments or special funds, transfer of funds from contingency account, special projects abandonment or partial abandonment, special projects transfer of funds, special projects non-lapse of appropriations, and filing of inventories.
All appropriations not spent or encumbered at the end of the fiscal year lapse into the fund balance applicable to the specific fund, except for:
a. Capital Projects – appropriations for capital projects, which do not lapse until the project is completed and/or closed out;
b. Grant Funds – appropriations for all grants, which do not lapse until the expiration of the grant.
The annual operating budget will normally provide for adequate funding of City retirement systems, adequate maintenance and/or replacement of capital plant and equipment, and adequate maintenance of
Appendix B - Financial Policies Page B-8 2018 Budget
an insurance fund, providing for self-insurance or using other acceptable insurance methods. If adequate funding cannot be budgeted, these differences shall be disclosed.
The budget includes appropriations for debt service payments and reserve requirements for all outstanding debt and for debt anticipated to be issued within the ensuing budget year.
Section 4 – Debt Policy
I. Overview
The City recognizes the primary purpose of facilities is to support provision of services to its residents. The City must balance debt financing and “pay-as-you-go” methods to meet the capital needs of the community. The City realizes failure to meet the demands of growth may inhibit its continued economic viability but also realizes too much debt has detrimental effects. Historically, the City’s total bonded indebtedness as a percentage of total general obligation debt limits has been minimal. Since 2009, the City has no general obligation debt.
The City uses lease purchase financing for several purposes, which include the acquisition of real property and the replacement of equipment and vehicles. Lease purchases decrease the impact of the cost to a department by spreading the costs over several years, and are subject to annual appropriation by City Council.
II. Colorado Springs City Charter Requirements Debt Limitations – Colorado Springs City Charter §7-80.
a. No bonds or other evidences of indebtedness, payable in whole or in part from the proceeds of ad valorem property taxes or to which the full faith and credit of the City are pledged in writing or otherwise shall be issued, except in pursuance of an ordinance authorizing the same, and unless the question of the issuance of the bonds shall at any special or general municipal election be submitted to a vote of the qualified electors of the City and approved by a majority of those voting on the question. However, City Council pursuant to ordinance and without election may:
(1) Issue local improvement district bonds;
(2) Borrow money or issue bonds for the purpose of acquiring, constructing, extending or improving water, electric, gas, sewer, or other public utilities or income-producing projects provided, further, that said borrowing shall be repaid and said bonds shall be made payable solely out of the net revenue derived from the operation of the utility, utilities, or other income-producing projects, or any or all thereof. Net revenue shall mean gross revenue less all operation and maintenance expenses of the project for which the money has been borrowed or bonds issued.
b. The City shall not become indebted for any purpose or in any manner to an amount which, including existing indebtedness, shall exceed 10% of the assessed valuation of the taxable property within the City as shown by the last preceding assessment for City purposes provided; however, that in determining the amount of indebtedness, there shall not be included within the computation of indebtedness local improvement district bonds, revenue bonds, or general obligation bonds or other evidences of indebtedness issued for the acquisition, construction, extension, or improvement of water facilities or supplies, or both. (1909; 1922; 1951; 1965; 1977) (Ed. note: Formerly section 47.)
III. Security and Exchange Commission (SEC) Rule 15c2-12 “Municipal Securities Disclosure” Requirements
As a means reasonably designed to prevent fraudulent, deceptive, or manipulative acts or practices, it shall be unlawful for any participating underwriter (broker, dealer, or municipal securities dealer) to act as an underwriter in a primary offering of municipal securities with an aggregate principal amount of $1 million or more unless the participating underwriter complies with SEC Rule 15c2-12 requirements or is exempted from the provisions of the Rule.
2018 Budget Page B-9 Appendix B - Financial Policies
The City is committed to providing timely and consistent dissemination of financial information with SEC regulatory requirements. It is imperative that disclosure be accomplished in a timely fashion in accordance SEC required SEC Rule 15c2-12 compliance and the City’s Disclosure Dissemination Agent Agreement (DDAA).
This disclosure policy confirms the City’s commitment to fair disclosure. Its goal is to develop and maintain guidelines for presenting related financial reports and events to interested third parties, financial institutions and the general public.
This policy covers all City employees and elected officials of the City. It covers disclosure documents filed with the SEC, statements made in the City’s CAFR, and any unaudited interim reports.
IV. Establishment of a Disclosure Working Group
Through authority of the Finance Department of the City, the City has authorized the establishment of a Disclosure Working Group (DWG) consisting of the Chief Financial Officer, Mayor and City Attorney. As a group, the DWG will decide when material developments justify release and meet as conditions dictate.
The role of the DWG is to systematically review filings, reports and other public statements to determine whether any updating or correcting of information is appropriate. The DWG will review and update, if necessary, the disclosure policy on an annual basis. The DWG will react quickly to negative developments and events that affect the City and notify SEC, when appropriate.
The City’s primary spokesperson related to Audited Financial Statements, other financial reports, and events is the Chief Financial Officer. The Mayor and City Attorney are designated alternative spokespersons and will be fully apprised of City’s financial developments. Others within the City or its agencies may, from time to time, be designated by the Chief Financial Officer as spokespersons on behalf of the City and respond to specific inquiries. It is essential that the DWG be fully apprised of all material developments of the City in order to evaluate, discuss those events and determine the appropriateness and timing for release.
The City or its designated agent must provide continuing disclosure documents and related information to the Municipal Securities Rulemaking Board’s EMMA (a regulator) website at http://dataport.emma.msrb.org.
Section 5 – Cash Management Policy
I. Scope
The City recognizes that effective cash management is an integral component of sound financial management. Therefore it is the policy of the City that funds deemed idle, based on projected cash flow, shall be invested in a manner that seeks to maximize their productivity until such time as they are needed for the operation of the City. (Refer to Section 6 – Investment Policy)
II. Cash Deposits and Receipts
a. Departments collecting cash receipts, whether in cash or other forms of payment, must turn in such receipts to the Finance Department on a daily basis together with records required to verify accuracy of such collections.
b. Departments authorized to make deposits should promptly submit bank deposit receipts and daily cash reports to the Finance Department to verify the accuracy of collections.
c. The Finance Department will set forth general cash handling procedures to be followed for all City departments. Departments may have more restrictive policies but will not have less restrictive policies as set forth from the Finance Department.
Appendix B - Financial Policies Page B-10 2018 Budget
Section 6 – Investment Policy
I. Investment Policy – Operating and Reserve Accounts
Existing Colorado State Statutes provide home rule municipalities with legal authority to promulgate and implement local standards for cash and investment management operations. City Code 1.6.102 states that the City will invest in securities in a manner authorized by Colorado statutes and as directed by City Council. The purpose of the City’s Investment Policy is to establish the investment scope, objectives, delegation of authority, standards of prudence, reporting requirements, internal controls, eligible investments and transactions, diversification requirements, risk tolerance, and safekeeping and custodial procedures for the investment of the funds of the City.
The Investment Policy was adopted by the City Council of the City of Colorado Springs by resolution on September 28, 1993. It was revised on November 8, 1994, February 27, 1996; October 8, 1996; October 26, 1999; February 12, 2002; March 9, 2004; May 24, 2005; July 11, 2006; April 24, 2007; June 24, 2008; May 26, 2009; May 25, 2010; November 22, 2011; December 10, 2013; November 10, 2014; and November 22, 2016. It replaces any previous investment guidelines formulated by members of City staff.
III. Cemetery Endowment Fund Investment Policy
City Code §1.6.102(B): The Chief Financial Officer may establish other trusts or accounts to invest assets of the cemetery endowment fund, assets of the C.D. Smith trust fund and other nontax funds in investments other than those listed in Colorado statutes. These funds shall be subject to the standards of the City investment policy as approved by City Council and investment guidelines established by the Chief Financial Officer for each trust fund or account.
The Cemetery Endowment Investment Policy was last adopted by the City Council of the City of Colorado Springs by Resolution No. 2-16 on January 26, 2016. The purpose of the Cemetery Endowment Fund is to provide perpetual maintenance of the cemeteries under the jurisdiction of the City. The type of investment assets held by the Fund shall vary from time to time in response to changes in the economy and prospects for achieving the Endowment’s objectives commensurate with prudent risk.
IV. Investment Advisory Committee
City Council created the Investment Advisory Committee for the City of Colorado Springs by Resolution No. 157-91 on September 24, 1991. The Investment Advisory Committee shall advise City Staff and as deemed necessary make recommendations to the City Council as to the investment policies and procedures of the City. The citizen members shall be selected for their skills in investment and finance. However, this Committee is not responsible for advice for investment of the Utilities Fund as that operation has existing Boards or Commissions for this purpose.
Section 7 – Fund Balance Policy
I. Overview
The City’s Fund Balance is the accumulated difference between assets and liabilities within governmental funds. A sufficient fund balance allows the City to meet its contractual obligations, provide funds for new and existing programs established by City Council, mitigate negative revenue implications of federal or state budget actions, mitigate economic downturns, fund disaster or emergency costs, provide funds for cash flow timing discrepancies and fund non-recurring expenses identified as necessary by City Council.
2018 Budget Page B-11 Appendix B - Financial Policies
II. Governmental Fund Balance Type Definitions
The Governmental Accounting Standards Board (GASB) issued Statement Number 54, “Fund Balance Reporting and Governmental Fund Type Definitions” effective for periods after June 15, 2010. The objective of this Statement was to enhance the usefulness of fund balance information by providing clearer fund balance classifications that can be more consistently applied and by clarifying the existing governmental fund type definitions. This Statement establishes limitations on the purposes for which fund balances can be used.
a. Non-spendable Fund Balance – Some assets reported in governmental funds may be inherently non-spendable from the vantage point of the current period.
• Assets that will never convert to cash such as prepaid items or inventories,
• Assets that will not convert to cash soon enough to affect the current period such as non-financial assets held for resale,
• Resources that must be maintained intact pursuant to legal or contractual requirements such as capital of a revolving loan fund.
b. Restricted Fund Balance – This represents the portion of fund balance that is subject to externally enforceable legal restrictions. Such restrictions are typically imposed by parties altogether outside the City such as creditors, grantors, contributors or other governments. Restrictions can also arise when the authorization to raise revenues is conditioned upon the revenue being used for a particular purpose.
c. Committed Fund Balance – This represents the portion of fund balance whose use is constrained by limitations that the City imposes on itself by City Council (highest decision making level) and remains binding unless removed in the same manner. The City does not use committed funds in its normal course of business.
• Requires action by City Council to commit fund balance
• Formal City Council action is necessary to impose, remove or modify a constraint reflected in the committed fund balance
d. Assigned Fund Balance – This describes the portion of fund balance that reflects the City’s intended use of resources. This authority rests with the Mayor and is delegated to staff through the use of encumbrances.
III. General Fund Unrestricted Fund Balance
A top priority goal of the Mayor is to improve the long-term fiscal health of the City. Revenue projections are conservative and authorized expenditures are closely monitored. In stable economic times, the combination of these two strategies leads to revenue collections higher than actual expenditures.
Net revenue (actual revenue collections less actual expenditures) is available to first fund the Taxpayer’s Bill of Rights (TABOR) reserve for emergencies required under Article X, §20 of the Colorado State Constitution and then to the designated reserves. Year-end balances in the undesignated reserves may be used as a funding source in the next budget year.
The City’s policy is to accumulate adequate reserves to protect the City during economic downturns or large scale emergencies. The City also maintains reserves that are required by law or contract and that serve a specific purpose. These types of reserves are considered restricted and are not available for other uses. Within specific funds, additional reserves may be maintained according to adopted policies.
The Government Finance Officers Association (GFOA) is a professional association of state and local finance officers in the US and Canada whose members are dedicated to the sound management of
Appendix B - Financial Policies Page B-12 2018 Budget
government financial resources. GFOA recommends that “governments establish a formal policy on the level of unrestricted fund balance that should be maintained in the general fund.”
The GFOA recommends, at a minimum, that general-purpose governments, regardless of size, incorporate in its financial policies that unrestricted fund balance in their general fund be no less than two months of regular general fund operating revenues or regular general fund operating expenditures.
The City’s goal target range for General Fund Reserve – Unrestricted Fund Balance is 16.67 % to 25% of the following year’s expenditure budget. The target for the unrestricted General Fund balance would exclude the TABOR emergency reserves but include other categories of fund balance that are committed, assigned or unassigned.
IV. The Taxpayer’s Bill of Rights City Charter §7-90(e) – Emergency Reserves
For use in declared emergencies only, the City shall reserve in 1991 one percent (1%) or more, in 1992 two percent (2%) or more, and in all later years three percent (3%) or more of fiscal year spending. An unused reserve shall apply to the next year's reserve. (1991)
“Emergency” is defined to exclude economic conditions, revenue shortfalls, or City salary or fringe benefit increases.
V. Other Funds
a. Enterprise and some Special Revenue Funds – These reserves provide for unexpected revenue losses or unanticipated expenditures during the year. A portion of these reserves may be appropriated as part of the annual budget and may be utilized at the end of the fiscal year if necessary.
b. Internal Services Funds – Internal Services Funds are expressly designed to function on a cost-reimbursement basis and should not accumulate a significant reserve. A small reserve is appropriate to allow for differences in timing of revenues and expenditures.
c. Self Insured Fund Reserves – As required by the State of Colorado Self Insurer’s Reserve Trust Agreement, the City maintains a fund balance reserve for liability and workers’ compensation.
VI. Debt Reserves
Debt reserves are established to protect bond holders from payment defaults. Adequate debt reserves are essential in maintaining good bond ratings and the marketability of bonds. The amount of debt reserves are established by bond ordinance for each fund in association with each bond issuance. At times, it may be desirable to use bond insurance rather than debt reserves. This is usually based on the recommendation from the City’s Financial Advisor.
VII. Use of Fund Balances
Available fund balances shall not be used for ongoing operating expenditures.
Section 8 – Capital Improvement Program Policy
I. Overview
The City has a significant investment in its streets, facilities, parks, natural areas and other capital improvements. In past years, the City Council and the residents of Colorado Springs through their actions have demonstrated a firm commitment to and investment in City capital projects.
2018 Budget Page B-13 Appendix B - Financial Policies
II. City Charter Requirement §4-40(b)(1), – Five-Year Capital Improvement Program (CIP) Plan
The strategic plan shall include the Comprehensive Plan and a five-year capital improvements plan for municipal needs.
III. Funding Sources and Requirements
a. All City capital improvements will be constructed and expenditures incurred for the purpose as approved by City Council, with funds rolled over from year to year until a project is deemed complete.
b. The City will use a variety of different sources to fund capital projects, with an emphasis on the “pay-as-you-go” philosophy.
c. Funding for operating and maintenance costs for approved capital projects must be identified at the time projects are approved.
IV. Transfer of Funds
Funds cannot be transferred from one active CIP project to another without City Council’s approval.
Section 9 – Revenue Policy
The City shall strive to maintain a balanced and diversified revenue structure to protect the City from fluctuations in any one source due to changes in local economic conditions which adversely impact that source.
Revenue estimates will be conservative and based upon trend analysis, economic conditions and other factors. Estimates will be established by the Budget Office and reviewed by the Mayor, Chief of Staff, and Executive Team.
Non-recurring revenues and other financing sources will not be used to finance ongoing operations with the exception of the use of approved grants or the use of fund balance in accordance with fund balance policies.
Federal aid, state aid, gifts, and grants will be accepted only after an assessment is made of potential cost implications.
a. Grants will be spent for the purposes intended and will not be relied on for basic General Fund services.
b. The City will review grants for operating programs on an individual basis to determine suitability of accepting the grants from a sustainable long-term financial perspective.
c. The City will vigorously pursue grants for capital projects that fit long-range community improvement goals.
d. All potential grants will be carefully examined for matching requirements; both dollar and level-of-effort matches.
The City will review its fees and other charges for services annually to ensure that revenues are meeting intended program goals and are keeping pace with inflation, other cost increases and any applicable competitive rate. The City will evaluate cost recovery and align fees with cost recovery goals.
Enterprise and Internal Service operations will be self-supporting.
Section 10 – Expenditure Policy
The City will pursue goals of efficiency and effectiveness by balancing short-term and long-term community needs.
Appendix B - Financial Policies Page B-14 2018 Budget
Current operating expenditures will be funded with current operating revenues, approved grants, or the use of fund balance in accordance with fund balance policies. The Budget Office and Finance Department will monitor revenues and expenditures during the year to provide an opportunity for actions to be taken to bring expenditures in line with revenues received.
The City will undertake periodic reviews of City programs for both efficiency and effectiveness. Privatization and contracting with other governmental agencies will be evaluated as alternatives to services delivery. Programs that are determined to be inefficient and/or ineffective shall be reduced in scope and eliminated.
Section 11 – Grants Policy
I. Conflict of Interest
No employee or official of the City shall have any interest, financial or otherwise, direct or indirect, or have any arrangement concerning prospective employment that will, or may be reasonably expected to, bias the design, conduct, or reporting of a grant funded project on which he or she is working.
It shall be the responsibility of the Grant Administrator for each particular grant-funded project to ensure that in the use of sponsored funds, officials or employees of the City and nongovernmental recipients or sub-recipients shall avoid any action that might result in, or create the appearance of:
a. Using his or her official position for private gain
b. Giving preferential treatment to any person or organization
c. Losing complete independence or impartiality
d. Making an official decision outside official channels
e. Affecting adversely public confidence in the grant funded program in particular and the City in general
II. Grant Identification and Application
a. Every department/agency intending to apply for grant funding from a federal, state, local government or private source, or expecting to receive funds from a formula grant or TIP allocation shall timely notify the Finance Department of its intent to apply for grant funds.
b. Departments shall designate a person to receive and respond to grant opportunities for their agency and to serve as a primary contact person between the agency/department and the City’s Finance Department.
c. The Finance Department shall review all grant applications and notifications, other than for independent agencies, to:
i. Determine whether applications are consistent with City priorities;
ii. Facilitate coordination with existing City programs where appropriate; and
iii. Evaluate the immediate and long term financial consequences of accepting funding (particularly for match requirements and in-kind contributions).
III. Strategic Alignment
Applications for grants and financial assistance and their awards shall align with existing City strategic plans and processes. Awards typically support activities in two categories:
2018 Budget Page B-15 Appendix B - Financial Policies
a. Capital: Applications and awards for capital should align with the City’s 5-Year Capital Improvement Program Plan or Strategic Plan.
b. Operating: Applications and awards for operating and program support should align with other existing plans, or the City’s Strategic Plan
IV. Accounting and Reporting
a. The accounting system will separate revenues and expenditures by funding source for all grants. The accounting system will break down revenues and expenditures for each individual grant via the project system and supporting documentation will be maintained in the financial system for all grant expenditures, as is required of all expenditures.
b. The accounting system has a project system that tracks all revenues and expenditures by the specific grant or project by line item or by broad category as may be included in a grant application budget. Grant Administrators will reconcile on a regular basis to ensure all revenues and expenditures are being appropriately coded to the correct grant. Project system reports can be run to accommodate different grant time periods that may differ from calendar year reporting.
c. Federal grant funds will not be commingled with funds from other Federal grants or other local match money. When applicable, any matching funds for a grant will be tracked by the department who is responsible for the grant and will only include items that directly correlate to an approved activity identified in the grant proposal.
d. Capital assets are tracked through the fixed asset system and, if a grant has purchased a capital asset, will be noted in the fixed asset system using the project system identified above. The City also tracks related award information as required per 2 CFR §200.313(d), Management Requirements.
e. Only allowable costs will be allocated to a grant.
f. Grants will only be budgeted when a grant award letter or statement of grant award has been received. The budget will be allocated from the annual Grants Appropriation included in the annual budget, and any additional appropriation approved by City Council each fiscal year.
g. City departments are responsible for all aspects of the grant process including planning for grant acquisition, preparing and submitting grant proposals, preparing Resolution requests to accept funds, developing grant implementation plans, managing grant programs, preparing and submitting reports to grantors, and properly closing out grant projects. Department staff and Finance staff will maintain a close working relationship with respect to any grant activity to ensure a clear understanding of the project status.
V. Documentation
All grant expenses must comply with the terms set forth in the grant application, grant award letter, city procurement policies and the guidelines in the Office of Management and Budget Uniform Administrative Requirements, Cost Principles, and Audit Requirements for Federal Awards (Uniform Guidance), 2 CFR 200.
a. Documentation for all expenditures must be retained by the department for audit purposes and should include:
i. Time sheets certified or signed by the employee and approved by their supervisor for all payroll expenses,
ii. City, state or governmental agreement number,
Appendix B - Financial Policies Page B-16 2018 Budget
iii. Formal bids for all purchases requiring such a process per City or Federal regulation, and price or rate quotation documentation for all purchases that do not exceed the Simplified Acquisition Threshold on Federally funded grants per 2 CFR 200, §200.320(b),
iv. Detailed receipts or invoices,
v. General Ledger detail showing revenue and expenditure activity, reviewed on a regular basis, and reconciled to detail provided to granting agencies,
vi. Asset records supporting use, maintenance, and proper disposal of grant funded equipment as identified in 2 CFR §200.313 and 2 CFR §200.439,
vii. Proper classification of and documentation for subrecipient determination, including but not limited to risk assessments, monitoring plans, correspondence, and results of audits both external and City led, and;
viii. Additional supporting documents including, but not limited to, environmental clearances, permits, and supporting correspondence.
b. The City’s Finance Department, with the assistance of specific grantee City departments, shall maintain the following information:
i. Identify, through a project and account structure, all federal awards received and expended and the federal programs under which they were received. All awards should be identifiable by the Catalog of Federal Domestic Assistance (CFDA) title and number, award number, award year, name of federal agency, and the name of the pass-through agency (if applicable).
ii. Maintain internal control over federal programs that provides reasonable assurance that the grantee is managing the award in compliance with the laws, regulations, and the provisions of the contract or grant agreement.
iii. Comply with laws, regulations and the provisions of contract or grant agreements related to each grant award.
iv. Prepare required financial statements, including financial statements that reflect the entity’s financial position, results of operations or changes in net position, and where appropriate, cash flows for the fiscal year audited. In addition, a schedule of federal assistance will be prepared for the external auditors which include all federal grants.
c. Grant documents should be read carefully to ensure compliance with all grant requirements. Additional documentation may be required under the terms and conditions of the specific grant award to include, but not limited to, procurement justification, grant reconciliation frequency, cash match calculation and tracking, and records retention.
d. Grant administrators are responsible for confirming that the information in the financial system is accurate as outlined above.
VI. Personally Identifiable Information
a. All grant documentation must maintain, to the maximum extent allowable, the confidentiality of Personally Identifiable Information (“PII”) as set forth in the Office of Management and Budget Uniform Administrative Requirements, Cost Principles, and Audit Requirements for Federal Awards (Uniform Guidance), 2 CFR §200. PII is defined as:
2018 Budget Page B-17 Appendix B - Financial Policies
1. An individual’s first name or first initial and last name in combination with any one or more of types of information, including, but not limited to social security number, passport number, credit card numbers, clearances, bank numbers, biometrics, date and place of birth, mother’s maiden name, criminal, medical, and financial records, and educational transcripts.
2. This does not include PII that is required by law to be disclosed.
VII. Audit
Per OMB Uniform Administrative Requirements, Cost Principles, and Audit Requirements for Federal Awards, 2 CFR 200 §200.501, all non-federal entities that expend $750,000 or more in a year on Federal awards, either as the grantee or the sub-grantee, shall have a single or program-specific audit conducted for that year in accordance with the provisions of the Uniform Guidance. The single audit encompasses both the entity’s financial statements and the Federal awards received by the entity; whereas a program-specific audit will audit one Federal program and can only be used when the grantee receives grant awards only from one Federal program. The City contracts with an external firm to conduct a single audit on an annual basis. The awarding agency may also specify additional audit requirements in the grant award letter or grant guidance.
The Finance Department, with the assistance of the specific grantee City departments, shall follow up and take corrective action on all audit findings.
Section 12 – Identify Theft Prevention Policy
In 2008, Congress directed the Federal Trade Commission (FTC) and other agencies to develop regulations requiring “creditors” and “financial institutions” to address the risk of identity theft. The resulting Red Flag Rules requires all such entities that have “covered accounts” to develop and implement written identify theft prevention programs.
The FTC defined “creditors” as businesses or organizations that regularly defer payment for goods or services and bill customers later. This includes nearly any organization extending credit, whether by granting loans, making credit decisions, etc.
Pursuant to the FTC enforcement policy of the Identify Theft Red Flags Rule, the City of Colorado Springs has evaluated risk factors to develop a policy designed to help identify, detect, and respond to patterns, practices, or specific activities – known as “red flags” – that could indicate identify theft.

Appendix B - Financial Policies Page B-18 2018 Budget
This page left blank intentionally.
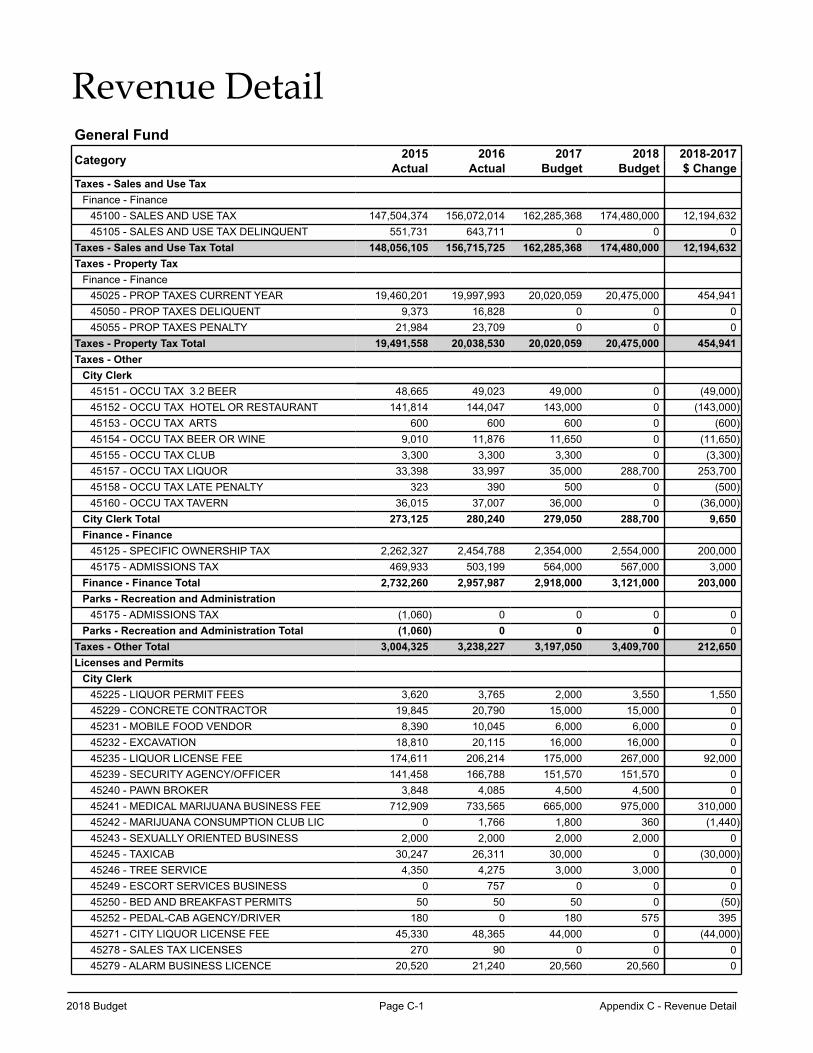
2018 Budget Page C-1 Appendix C - Revenue Detail
Revenue DetailGeneral FundCategory 2015 2016 2017 2018 2018-2017
Actual Actual Budget Budget $ ChangeTaxes - Sales and Use Tax
Finance - Finance45100 - SALES AND USE TAX 147,504,374 156,072,014 162,285,368 174,480,000 12,194,63245105 - SALES AND USE TAX DELINQUENT 551,731 643,711 0 0 0
Taxes - Sales and Use Tax Total 148,056,105 156,715,725 162,285,368 174,480,000 12,194,632Taxes - Property Tax
Finance - Finance45025 - PROP TAXES CURRENT YEAR 19,460,201 19,997,993 20,020,059 20,475,000 454,94145050 - PROP TAXES DELIQUENT 9,373 16,828 0 0 045055 - PROP TAXES PENALTY 21,984 23,709 0 0 0
Taxes - Property Tax Total 19,491,558 20,038,530 20,020,059 20,475,000 454,941Taxes - Other
City Clerk45151 - OCCU TAX 3.2 BEER 48,665 49,023 49,000 0 (49,000)45152 - OCCU TAX HOTEL OR RESTAURANT 141,814 144,047 143,000 0 (143,000)45153 - OCCU TAX ARTS 600 600 600 0 (600)45154 - OCCU TAX BEER OR WINE 9,010 11,876 11,650 0 (11,650)45155 - OCCU TAX CLUB 3,300 3,300 3,300 0 (3,300)45157 - OCCU TAX LIQUOR 33,398 33,997 35,000 288,700 253,70045158 - OCCU TAX LATE PENALTY 323 390 500 0 (500)45160 - OCCU TAX TAVERN 36,015 37,007 36,000 0 (36,000)
City Clerk Total 273,125 280,240 279,050 288,700 9,650Finance - Finance
45125 - SPECIFIC OWNERSHIP TAX 2,262,327 2,454,788 2,354,000 2,554,000 200,00045175 - ADMISSIONS TAX 469,933 503,199 564,000 567,000 3,000
Finance - Finance Total 2,732,260 2,957,987 2,918,000 3,121,000 203,000Parks - Recreation and Administration
45175 - ADMISSIONS TAX (1,060) 0 0 0 0Parks - Recreation and Administration Total (1,060) 0 0 0 0
Taxes - Other Total 3,004,325 3,238,227 3,197,050 3,409,700 212,650Licenses and Permits
City Clerk45225 - LIQUOR PERMIT FEES 3,620 3,765 2,000 3,550 1,55045229 - CONCRETE CONTRACTOR 19,845 20,790 15,000 15,000 045231 - MOBILE FOOD VENDOR 8,390 10,045 6,000 6,000 045232 - EXCAVATION 18,810 20,115 16,000 16,000 045235 - LIQUOR LICENSE FEE 174,611 206,214 175,000 267,000 92,00045239 - SECURITY AGENCY/OFFICER 141,458 166,788 151,570 151,570 045240 - PAWN BROKER 3,848 4,085 4,500 4,500 045241 - MEDICAL MARIJUANA BUSINESS FEE 712,909 733,565 665,000 975,000 310,00045242 - MARIJUANA CONSUMPTION CLUB LIC 0 1,766 1,800 360 (1,440)45243 - SEXUALLY ORIENTED BUSINESS 2,000 2,000 2,000 2,000 045245 - TAXICAB 30,247 26,311 30,000 0 (30,000)45246 - TREE SERVICE 4,350 4,275 3,000 3,000 045249 - ESCORT SERVICES BUSINESS 0 757 0 0 045250 - BED AND BREAKFAST PERMITS 50 50 50 0 (50)45252 - PEDAL-CAB AGENCY/DRIVER 180 0 180 575 39545271 - CITY LIQUOR LICENSE FEE 45,330 48,365 44,000 0 (44,000)45278 - SALES TAX LICENSES 270 90 0 0 045279 - ALARM BUSINESS LICENCE 20,520 21,240 20,560 20,560 0
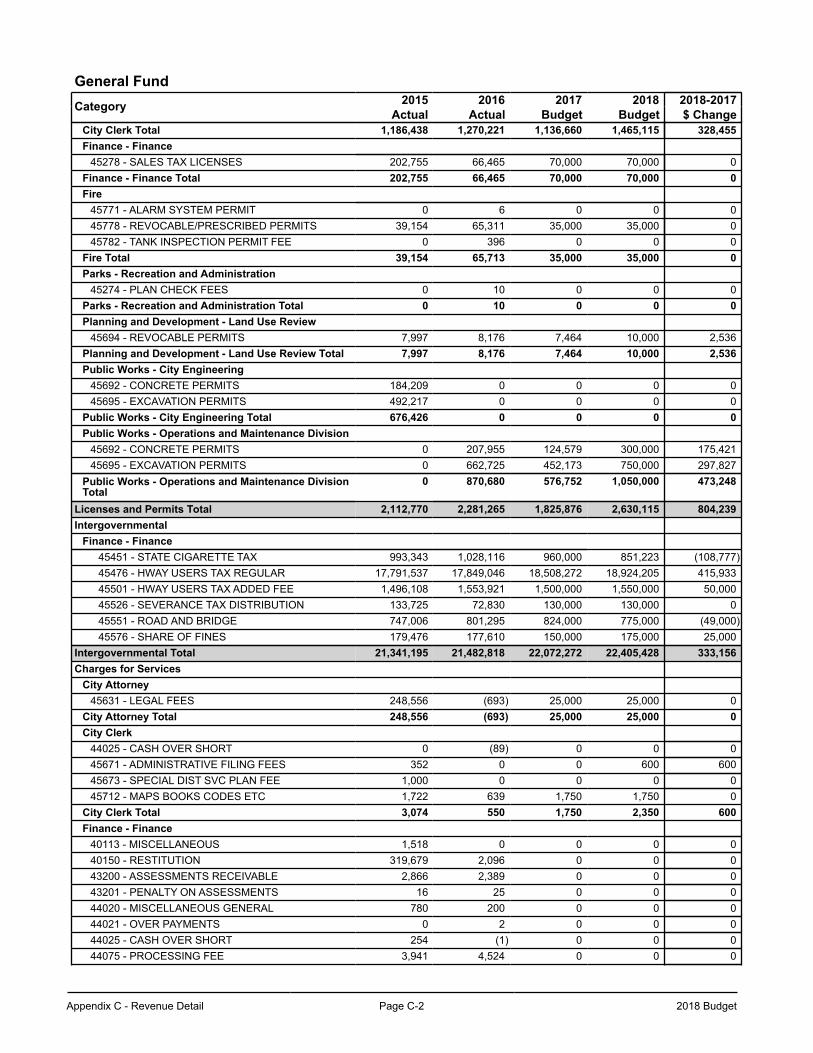
Appendix C - Revenue Detail Page C-2 2018 Budget
General FundCategory 2015 2016 2017 2018 2018-2017
Actual Actual Budget Budget $ ChangeCity Clerk Total 1,186,438 1,270,221 1,136,660 1,465,115 328,455Finance - Finance
45278 - SALES TAX LICENSES 202,755 66,465 70,000 70,000 0Finance - Finance Total 202,755 66,465 70,000 70,000 0Fire
45771 - ALARM SYSTEM PERMIT 0 6 0 0 045778 - REVOCABLE/PRESCRIBED PERMITS 39,154 65,311 35,000 35,000 045782 - TANK INSPECTION PERMIT FEE 0 396 0 0 0
Fire Total 39,154 65,713 35,000 35,000 0Parks - Recreation and Administration
45274 - PLAN CHECK FEES 0 10 0 0 0Parks - Recreation and Administration Total 0 10 0 0 0Planning and Development - Land Use Review
45694 - REVOCABLE PERMITS 7,997 8,176 7,464 10,000 2,536Planning and Development - Land Use Review Total 7,997 8,176 7,464 10,000 2,536Public Works - City Engineering
45692 - CONCRETE PERMITS 184,209 0 0 0 045695 - EXCAVATION PERMITS 492,217 0 0 0 0
Public Works - City Engineering Total 676,426 0 0 0 0Public Works - Operations and Maintenance Division
45692 - CONCRETE PERMITS 0 207,955 124,579 300,000 175,42145695 - EXCAVATION PERMITS 0 662,725 452,173 750,000 297,827
Public Works - Operations and Maintenance DivisionTotal
0 870,680 576,752 1,050,000 473,248
Licenses and Permits Total 2,112,770 2,281,265 1,825,876 2,630,115 804,239Intergovernmental
Finance - Finance45451 - STATE CIGARETTE TAX 993,343 1,028,116 960,000 851,223 (108,777)45476 - HWAY USERS TAX REGULAR 17,791,537 17,849,046 18,508,272 18,924,205 415,93345501 - HWAY USERS TAX ADDED FEE 1,496,108 1,553,921 1,500,000 1,550,000 50,00045526 - SEVERANCE TAX DISTRIBUTION 133,725 72,830 130,000 130,000 045551 - ROAD AND BRIDGE 747,006 801,295 824,000 775,000 (49,000)45576 - SHARE OF FINES 179,476 177,610 150,000 175,000 25,000
Intergovernmental Total 21,341,195 21,482,818 22,072,272 22,405,428 333,156Charges for Services
City Attorney45631 - LEGAL FEES 248,556 (693) 25,000 25,000 0
City Attorney Total 248,556 (693) 25,000 25,000 0City Clerk
44025 - CASH OVER SHORT 0 (89) 0 0 045671 - ADMINISTRATIVE FILING FEES 352 0 0 600 60045673 - SPECIAL DIST SVC PLAN FEE 1,000 0 0 0 045712 - MAPS BOOKS CODES ETC 1,722 639 1,750 1,750 0
City Clerk Total 3,074 550 1,750 2,350 600Finance - Finance
40113 - MISCELLANEOUS 1,518 0 0 0 040150 - RESTITUTION 319,679 2,096 0 0 043200 - ASSESSMENTS RECEIVABLE 2,866 2,389 0 0 043201 - PENALTY ON ASSESSMENTS 16 25 0 0 044020 - MISCELLANEOUS GENERAL 780 200 0 0 044021 - OVER PAYMENTS 0 2 0 0 044025 - CASH OVER SHORT 254 (1) 0 0 044075 - PROCESSING FEE 3,941 4,524 0 0 0
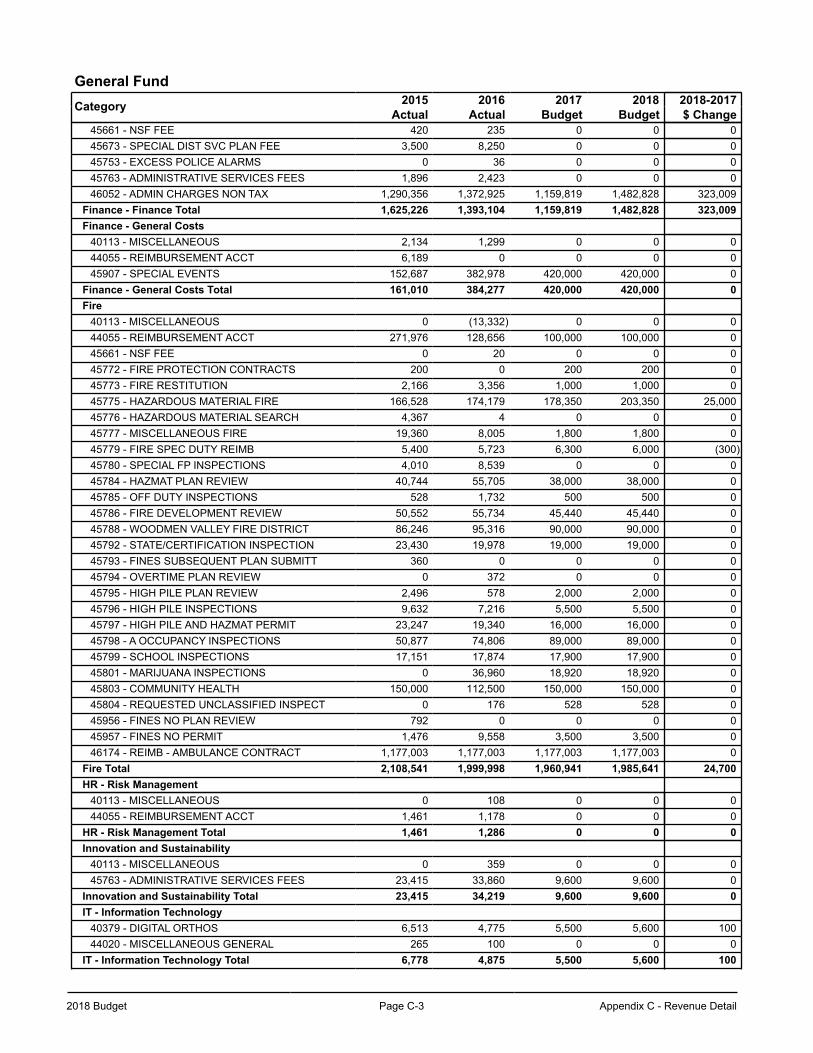
2018 Budget Page C-3 Appendix C - Revenue Detail
General FundCategory 2015 2016 2017 2018 2018-2017
Actual Actual Budget Budget $ Change45661 - NSF FEE 420 235 0 0 045673 - SPECIAL DIST SVC PLAN FEE 3,500 8,250 0 0 045753 - EXCESS POLICE ALARMS 0 36 0 0 045763 - ADMINISTRATIVE SERVICES FEES 1,896 2,423 0 0 046052 - ADMIN CHARGES NON TAX 1,290,356 1,372,925 1,159,819 1,482,828 323,009
Finance - Finance Total 1,625,226 1,393,104 1,159,819 1,482,828 323,009Finance - General Costs
40113 - MISCELLANEOUS 2,134 1,299 0 0 044055 - REIMBURSEMENT ACCT 6,189 0 0 0 045907 - SPECIAL EVENTS 152,687 382,978 420,000 420,000 0
Finance - General Costs Total 161,010 384,277 420,000 420,000 0Fire
40113 - MISCELLANEOUS 0 (13,332) 0 0 044055 - REIMBURSEMENT ACCT 271,976 128,656 100,000 100,000 045661 - NSF FEE 0 20 0 0 045772 - FIRE PROTECTION CONTRACTS 200 0 200 200 045773 - FIRE RESTITUTION 2,166 3,356 1,000 1,000 045775 - HAZARDOUS MATERIAL FIRE 166,528 174,179 178,350 203,350 25,00045776 - HAZARDOUS MATERIAL SEARCH 4,367 4 0 0 045777 - MISCELLANEOUS FIRE 19,360 8,005 1,800 1,800 045779 - FIRE SPEC DUTY REIMB 5,400 5,723 6,300 6,000 (300)45780 - SPECIAL FP INSPECTIONS 4,010 8,539 0 0 045784 - HAZMAT PLAN REVIEW 40,744 55,705 38,000 38,000 045785 - OFF DUTY INSPECTIONS 528 1,732 500 500 045786 - FIRE DEVELOPMENT REVIEW 50,552 55,734 45,440 45,440 045788 - WOODMEN VALLEY FIRE DISTRICT 86,246 95,316 90,000 90,000 045792 - STATE/CERTIFICATION INSPECTION 23,430 19,978 19,000 19,000 045793 - FINES SUBSEQUENT PLAN SUBMITT 360 0 0 0 045794 - OVERTIME PLAN REVIEW 0 372 0 0 045795 - HIGH PILE PLAN REVIEW 2,496 578 2,000 2,000 045796 - HIGH PILE INSPECTIONS 9,632 7,216 5,500 5,500 045797 - HIGH PILE AND HAZMAT PERMIT 23,247 19,340 16,000 16,000 045798 - A OCCUPANCY INSPECTIONS 50,877 74,806 89,000 89,000 045799 - SCHOOL INSPECTIONS 17,151 17,874 17,900 17,900 045801 - MARIJUANA INSPECTIONS 0 36,960 18,920 18,920 045803 - COMMUNITY HEALTH 150,000 112,500 150,000 150,000 045804 - REQUESTED UNCLASSIFIED INSPECT 0 176 528 528 045956 - FINES NO PLAN REVIEW 792 0 0 0 045957 - FINES NO PERMIT 1,476 9,558 3,500 3,500 046174 - REIMB - AMBULANCE CONTRACT 1,177,003 1,177,003 1,177,003 1,177,003 0
Fire Total 2,108,541 1,999,998 1,960,941 1,985,641 24,700HR - Risk Management
40113 - MISCELLANEOUS 0 108 0 0 044055 - REIMBURSEMENT ACCT 1,461 1,178 0 0 0
HR - Risk Management Total 1,461 1,286 0 0 0Innovation and Sustainability
40113 - MISCELLANEOUS 0 359 0 0 045763 - ADMINISTRATIVE SERVICES FEES 23,415 33,860 9,600 9,600 0
Innovation and Sustainability Total 23,415 34,219 9,600 9,600 0IT - Information Technology
40379 - DIGITAL ORTHOS 6,513 4,775 5,500 5,600 10044020 - MISCELLANEOUS GENERAL 265 100 0 0 0
IT - Information Technology Total 6,778 4,875 5,500 5,600 100
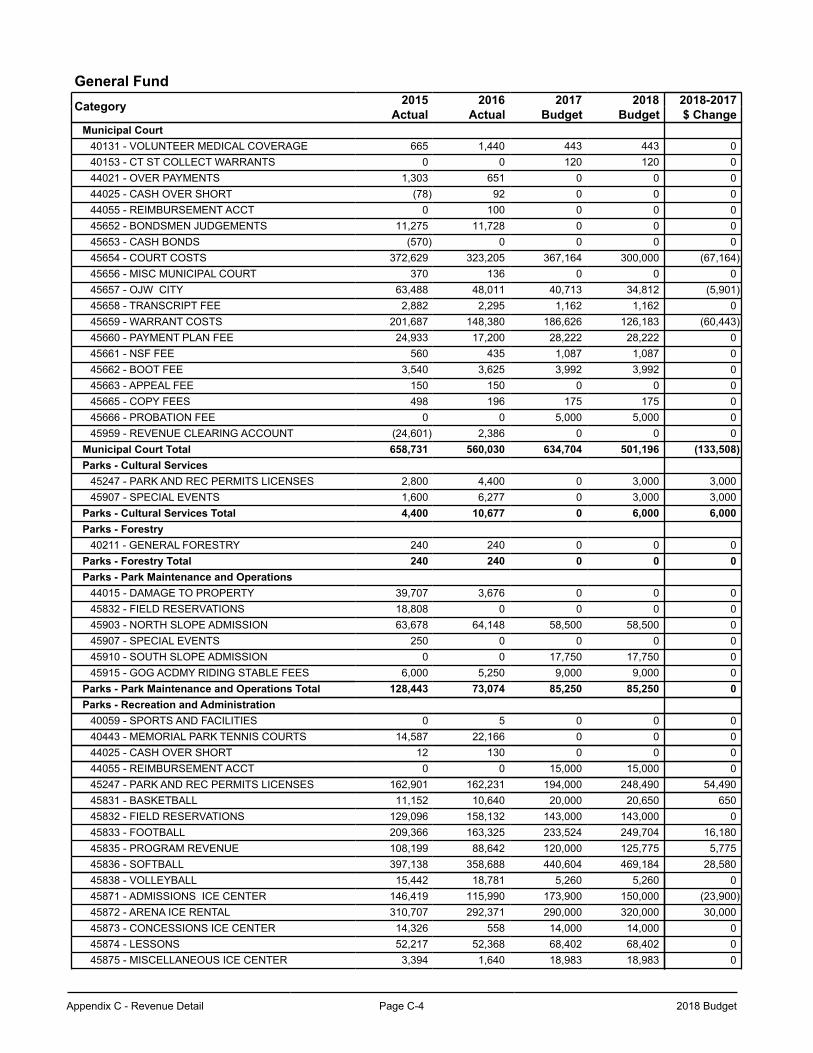
Appendix C - Revenue Detail Page C-4 2018 Budget
General FundCategory 2015 2016 2017 2018 2018-2017
Actual Actual Budget Budget $ ChangeMunicipal Court
40131 - VOLUNTEER MEDICAL COVERAGE 665 1,440 443 443 040153 - CT ST COLLECT WARRANTS 0 0 120 120 044021 - OVER PAYMENTS 1,303 651 0 0 044025 - CASH OVER SHORT (78) 92 0 0 044055 - REIMBURSEMENT ACCT 0 100 0 0 045652 - BONDSMEN JUDGEMENTS 11,275 11,728 0 0 045653 - CASH BONDS (570) 0 0 0 045654 - COURT COSTS 372,629 323,205 367,164 300,000 (67,164)45656 - MISC MUNICIPAL COURT 370 136 0 0 045657 - OJW CITY 63,488 48,011 40,713 34,812 (5,901)45658 - TRANSCRIPT FEE 2,882 2,295 1,162 1,162 045659 - WARRANT COSTS 201,687 148,380 186,626 126,183 (60,443)45660 - PAYMENT PLAN FEE 24,933 17,200 28,222 28,222 045661 - NSF FEE 560 435 1,087 1,087 045662 - BOOT FEE 3,540 3,625 3,992 3,992 045663 - APPEAL FEE 150 150 0 0 045665 - COPY FEES 498 196 175 175 045666 - PROBATION FEE 0 0 5,000 5,000 045959 - REVENUE CLEARING ACCOUNT (24,601) 2,386 0 0 0
Municipal Court Total 658,731 560,030 634,704 501,196 (133,508)Parks - Cultural Services
45247 - PARK AND REC PERMITS LICENSES 2,800 4,400 0 3,000 3,00045907 - SPECIAL EVENTS 1,600 6,277 0 3,000 3,000
Parks - Cultural Services Total 4,400 10,677 0 6,000 6,000Parks - Forestry
40211 - GENERAL FORESTRY 240 240 0 0 0Parks - Forestry Total 240 240 0 0 0Parks - Park Maintenance and Operations
44015 - DAMAGE TO PROPERTY 39,707 3,676 0 0 045832 - FIELD RESERVATIONS 18,808 0 0 0 045903 - NORTH SLOPE ADMISSION 63,678 64,148 58,500 58,500 045907 - SPECIAL EVENTS 250 0 0 0 045910 - SOUTH SLOPE ADMISSION 0 0 17,750 17,750 045915 - GOG ACDMY RIDING STABLE FEES 6,000 5,250 9,000 9,000 0
Parks - Park Maintenance and Operations Total 128,443 73,074 85,250 85,250 0Parks - Recreation and Administration
40059 - SPORTS AND FACILITIES 0 5 0 0 040443 - MEMORIAL PARK TENNIS COURTS 14,587 22,166 0 0 044025 - CASH OVER SHORT 12 130 0 0 044055 - REIMBURSEMENT ACCT 0 0 15,000 15,000 045247 - PARK AND REC PERMITS LICENSES 162,901 162,231 194,000 248,490 54,49045831 - BASKETBALL 11,152 10,640 20,000 20,650 65045832 - FIELD RESERVATIONS 129,096 158,132 143,000 143,000 045833 - FOOTBALL 209,366 163,325 233,524 249,704 16,18045835 - PROGRAM REVENUE 108,199 88,642 120,000 125,775 5,77545836 - SOFTBALL 397,138 358,688 440,604 469,184 28,58045838 - VOLLEYBALL 15,442 18,781 5,260 5,260 045871 - ADMISSIONS ICE CENTER 146,419 115,990 173,900 150,000 (23,900)45872 - ARENA ICE RENTAL 310,707 292,371 290,000 320,000 30,00045873 - CONCESSIONS ICE CENTER 14,326 558 14,000 14,000 045874 - LESSONS 52,217 52,368 68,402 68,402 045875 - MISCELLANEOUS ICE CENTER 3,394 1,640 18,983 18,983 0
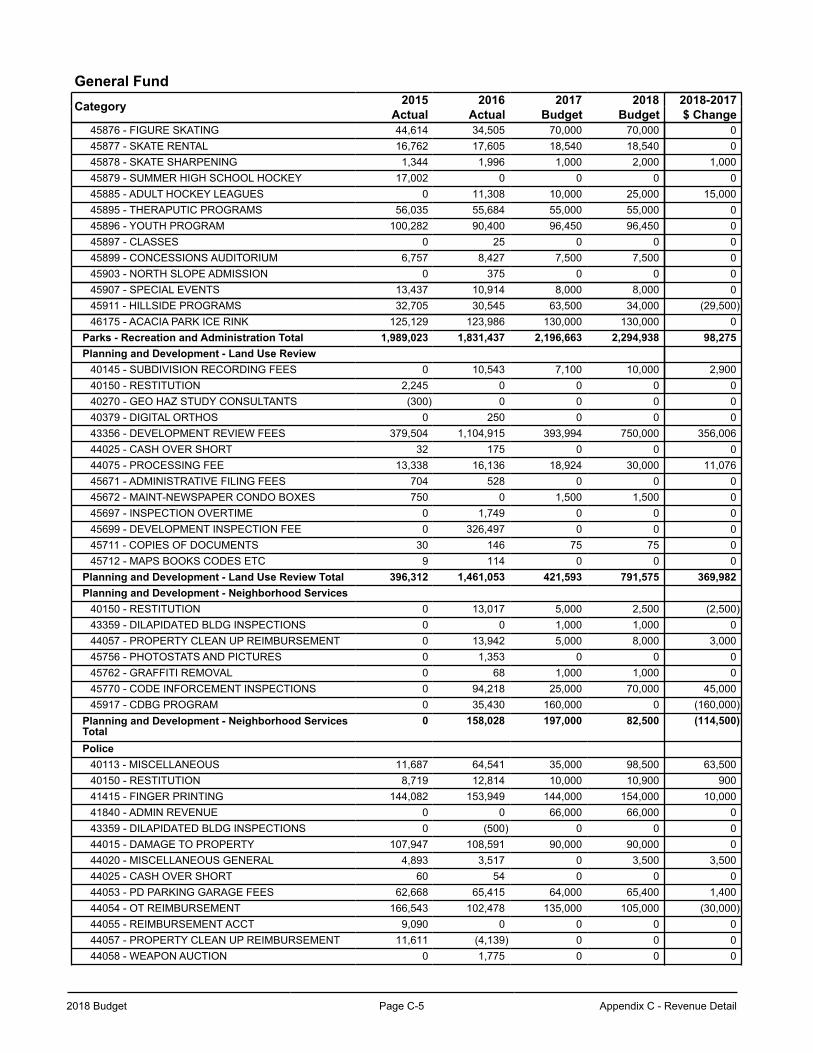
2018 Budget Page C-5 Appendix C - Revenue Detail
General FundCategory 2015 2016 2017 2018 2018-2017
Actual Actual Budget Budget $ Change45876 - FIGURE SKATING 44,614 34,505 70,000 70,000 045877 - SKATE RENTAL 16,762 17,605 18,540 18,540 045878 - SKATE SHARPENING 1,344 1,996 1,000 2,000 1,00045879 - SUMMER HIGH SCHOOL HOCKEY 17,002 0 0 0 045885 - ADULT HOCKEY LEAGUES 0 11,308 10,000 25,000 15,00045895 - THERAPUTIC PROGRAMS 56,035 55,684 55,000 55,000 045896 - YOUTH PROGRAM 100,282 90,400 96,450 96,450 045897 - CLASSES 0 25 0 0 045899 - CONCESSIONS AUDITORIUM 6,757 8,427 7,500 7,500 045903 - NORTH SLOPE ADMISSION 0 375 0 0 045907 - SPECIAL EVENTS 13,437 10,914 8,000 8,000 045911 - HILLSIDE PROGRAMS 32,705 30,545 63,500 34,000 (29,500)46175 - ACACIA PARK ICE RINK 125,129 123,986 130,000 130,000 0
Parks - Recreation and Administration Total 1,989,023 1,831,437 2,196,663 2,294,938 98,275Planning and Development - Land Use Review
40145 - SUBDIVISION RECORDING FEES 0 10,543 7,100 10,000 2,90040150 - RESTITUTION 2,245 0 0 0 040270 - GEO HAZ STUDY CONSULTANTS (300) 0 0 0 040379 - DIGITAL ORTHOS 0 250 0 0 043356 - DEVELOPMENT REVIEW FEES 379,504 1,104,915 393,994 750,000 356,00644025 - CASH OVER SHORT 32 175 0 0 044075 - PROCESSING FEE 13,338 16,136 18,924 30,000 11,07645671 - ADMINISTRATIVE FILING FEES 704 528 0 0 045672 - MAINT-NEWSPAPER CONDO BOXES 750 0 1,500 1,500 045697 - INSPECTION OVERTIME 0 1,749 0 0 045699 - DEVELOPMENT INSPECTION FEE 0 326,497 0 0 045711 - COPIES OF DOCUMENTS 30 146 75 75 045712 - MAPS BOOKS CODES ETC 9 114 0 0 0
Planning and Development - Land Use Review Total 396,312 1,461,053 421,593 791,575 369,982Planning and Development - Neighborhood Services
40150 - RESTITUTION 0 13,017 5,000 2,500 (2,500)43359 - DILAPIDATED BLDG INSPECTIONS 0 0 1,000 1,000 044057 - PROPERTY CLEAN UP REIMBURSEMENT 0 13,942 5,000 8,000 3,00045756 - PHOTOSTATS AND PICTURES 0 1,353 0 0 045762 - GRAFFITI REMOVAL 0 68 1,000 1,000 045770 - CODE INFORCEMENT INSPECTIONS 0 94,218 25,000 70,000 45,00045917 - CDBG PROGRAM 0 35,430 160,000 0 (160,000)
Planning and Development - Neighborhood ServicesTotal
0 158,028 197,000 82,500 (114,500)
Police40113 - MISCELLANEOUS 11,687 64,541 35,000 98,500 63,50040150 - RESTITUTION 8,719 12,814 10,000 10,900 90041415 - FINGER PRINTING 144,082 153,949 144,000 154,000 10,00041840 - ADMIN REVENUE 0 0 66,000 66,000 043359 - DILAPIDATED BLDG INSPECTIONS 0 (500) 0 0 044015 - DAMAGE TO PROPERTY 107,947 108,591 90,000 90,000 044020 - MISCELLANEOUS GENERAL 4,893 3,517 0 3,500 3,50044025 - CASH OVER SHORT 60 54 0 0 044053 - PD PARKING GARAGE FEES 62,668 65,415 64,000 65,400 1,40044054 - OT REIMBURSEMENT 166,543 102,478 135,000 105,000 (30,000)44055 - REIMBURSEMENT ACCT 9,090 0 0 0 044057 - PROPERTY CLEAN UP REIMBURSEMENT 11,611 (4,139) 0 0 044058 - WEAPON AUCTION 0 1,775 0 0 0
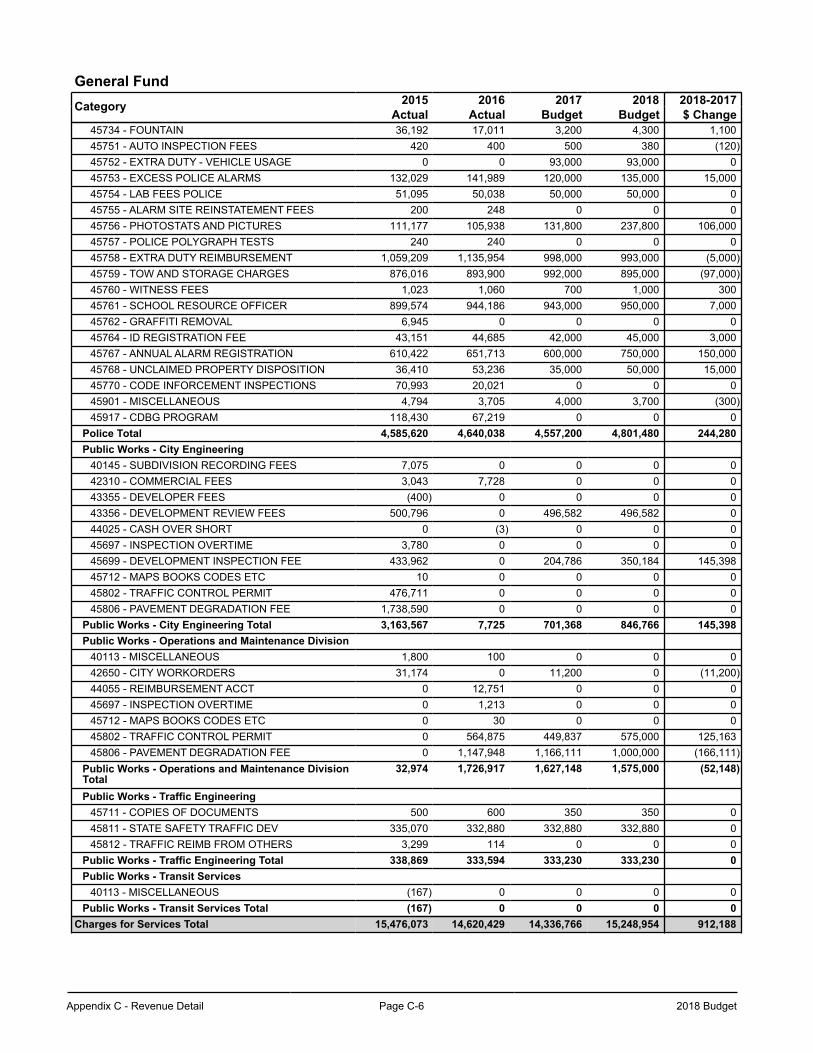
Appendix C - Revenue Detail Page C-6 2018 Budget
General FundCategory 2015 2016 2017 2018 2018-2017
Actual Actual Budget Budget $ Change45734 - FOUNTAIN 36,192 17,011 3,200 4,300 1,10045751 - AUTO INSPECTION FEES 420 400 500 380 (120)45752 - EXTRA DUTY - VEHICLE USAGE 0 0 93,000 93,000 045753 - EXCESS POLICE ALARMS 132,029 141,989 120,000 135,000 15,00045754 - LAB FEES POLICE 51,095 50,038 50,000 50,000 045755 - ALARM SITE REINSTATEMENT FEES 200 248 0 0 045756 - PHOTOSTATS AND PICTURES 111,177 105,938 131,800 237,800 106,00045757 - POLICE POLYGRAPH TESTS 240 240 0 0 045758 - EXTRA DUTY REIMBURSEMENT 1,059,209 1,135,954 998,000 993,000 (5,000)45759 - TOW AND STORAGE CHARGES 876,016 893,900 992,000 895,000 (97,000)45760 - WITNESS FEES 1,023 1,060 700 1,000 30045761 - SCHOOL RESOURCE OFFICER 899,574 944,186 943,000 950,000 7,00045762 - GRAFFITI REMOVAL 6,945 0 0 0 045764 - ID REGISTRATION FEE 43,151 44,685 42,000 45,000 3,00045767 - ANNUAL ALARM REGISTRATION 610,422 651,713 600,000 750,000 150,00045768 - UNCLAIMED PROPERTY DISPOSITION 36,410 53,236 35,000 50,000 15,00045770 - CODE INFORCEMENT INSPECTIONS 70,993 20,021 0 0 045901 - MISCELLANEOUS 4,794 3,705 4,000 3,700 (300)45917 - CDBG PROGRAM 118,430 67,219 0 0 0
Police Total 4,585,620 4,640,038 4,557,200 4,801,480 244,280Public Works - City Engineering
40145 - SUBDIVISION RECORDING FEES 7,075 0 0 0 042310 - COMMERCIAL FEES 3,043 7,728 0 0 043355 - DEVELOPER FEES (400) 0 0 0 043356 - DEVELOPMENT REVIEW FEES 500,796 0 496,582 496,582 044025 - CASH OVER SHORT 0 (3) 0 0 045697 - INSPECTION OVERTIME 3,780 0 0 0 045699 - DEVELOPMENT INSPECTION FEE 433,962 0 204,786 350,184 145,39845712 - MAPS BOOKS CODES ETC 10 0 0 0 045802 - TRAFFIC CONTROL PERMIT 476,711 0 0 0 045806 - PAVEMENT DEGRADATION FEE 1,738,590 0 0 0 0
Public Works - City Engineering Total 3,163,567 7,725 701,368 846,766 145,398Public Works - Operations and Maintenance Division
40113 - MISCELLANEOUS 1,800 100 0 0 042650 - CITY WORKORDERS 31,174 0 11,200 0 (11,200)44055 - REIMBURSEMENT ACCT 0 12,751 0 0 045697 - INSPECTION OVERTIME 0 1,213 0 0 045712 - MAPS BOOKS CODES ETC 0 30 0 0 045802 - TRAFFIC CONTROL PERMIT 0 564,875 449,837 575,000 125,16345806 - PAVEMENT DEGRADATION FEE 0 1,147,948 1,166,111 1,000,000 (166,111)
Public Works - Operations and Maintenance DivisionTotal
32,974 1,726,917 1,627,148 1,575,000 (52,148)
Public Works - Traffic Engineering45711 - COPIES OF DOCUMENTS 500 600 350 350 045811 - STATE SAFETY TRAFFIC DEV 335,070 332,880 332,880 332,880 045812 - TRAFFIC REIMB FROM OTHERS 3,299 114 0 0 0
Public Works - Traffic Engineering Total 338,869 333,594 333,230 333,230 0Public Works - Transit Services
40113 - MISCELLANEOUS (167) 0 0 0 0Public Works - Transit Services Total (167) 0 0 0 0
Charges for Services Total 15,476,073 14,620,429 14,336,766 15,248,954 912,188
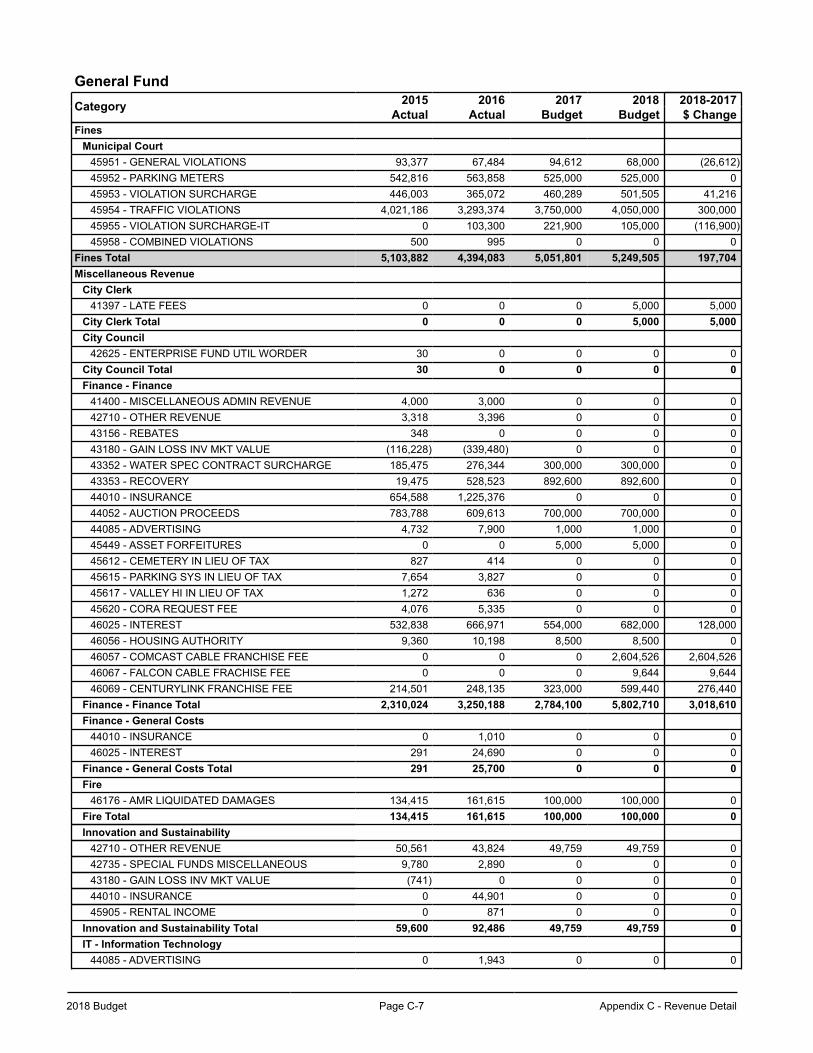
2018 Budget Page C-7 Appendix C - Revenue Detail
General FundCategory 2015 2016 2017 2018 2018-2017
Actual Actual Budget Budget $ ChangeFines
Municipal Court45951 - GENERAL VIOLATIONS 93,377 67,484 94,612 68,000 (26,612)45952 - PARKING METERS 542,816 563,858 525,000 525,000 045953 - VIOLATION SURCHARGE 446,003 365,072 460,289 501,505 41,21645954 - TRAFFIC VIOLATIONS 4,021,186 3,293,374 3,750,000 4,050,000 300,00045955 - VIOLATION SURCHARGE-IT 0 103,300 221,900 105,000 (116,900)45958 - COMBINED VIOLATIONS 500 995 0 0 0
Fines Total 5,103,882 4,394,083 5,051,801 5,249,505 197,704Miscellaneous Revenue
City Clerk41397 - LATE FEES 0 0 0 5,000 5,000
City Clerk Total 0 0 0 5,000 5,000City Council
42625 - ENTERPRISE FUND UTIL WORDER 30 0 0 0 0City Council Total 30 0 0 0 0Finance - Finance
41400 - MISCELLANEOUS ADMIN REVENUE 4,000 3,000 0 0 042710 - OTHER REVENUE 3,318 3,396 0 0 043156 - REBATES 348 0 0 0 043180 - GAIN LOSS INV MKT VALUE (116,228) (339,480) 0 0 043352 - WATER SPEC CONTRACT SURCHARGE 185,475 276,344 300,000 300,000 043353 - RECOVERY 19,475 528,523 892,600 892,600 044010 - INSURANCE 654,588 1,225,376 0 0 044052 - AUCTION PROCEEDS 783,788 609,613 700,000 700,000 044085 - ADVERTISING 4,732 7,900 1,000 1,000 045449 - ASSET FORFEITURES 0 0 5,000 5,000 045612 - CEMETERY IN LIEU OF TAX 827 414 0 0 045615 - PARKING SYS IN LIEU OF TAX 7,654 3,827 0 0 045617 - VALLEY HI IN LIEU OF TAX 1,272 636 0 0 045620 - CORA REQUEST FEE 4,076 5,335 0 0 046025 - INTEREST 532,838 666,971 554,000 682,000 128,00046056 - HOUSING AUTHORITY 9,360 10,198 8,500 8,500 046057 - COMCAST CABLE FRANCHISE FEE 0 0 0 2,604,526 2,604,52646067 - FALCON CABLE FRACHISE FEE 0 0 0 9,644 9,64446069 - CENTURYLINK FRANCHISE FEE 214,501 248,135 323,000 599,440 276,440
Finance - Finance Total 2,310,024 3,250,188 2,784,100 5,802,710 3,018,610Finance - General Costs
44010 - INSURANCE 0 1,010 0 0 046025 - INTEREST 291 24,690 0 0 0
Finance - General Costs Total 291 25,700 0 0 0Fire
46176 - AMR LIQUIDATED DAMAGES 134,415 161,615 100,000 100,000 0Fire Total 134,415 161,615 100,000 100,000 0Innovation and Sustainability
42710 - OTHER REVENUE 50,561 43,824 49,759 49,759 042735 - SPECIAL FUNDS MISCELLANEOUS 9,780 2,890 0 0 043180 - GAIN LOSS INV MKT VALUE (741) 0 0 0 044010 - INSURANCE 0 44,901 0 0 045905 - RENTAL INCOME 0 871 0 0 0
Innovation and Sustainability Total 59,600 92,486 49,759 49,759 0IT - Information Technology
44085 - ADVERTISING 0 1,943 0 0 0
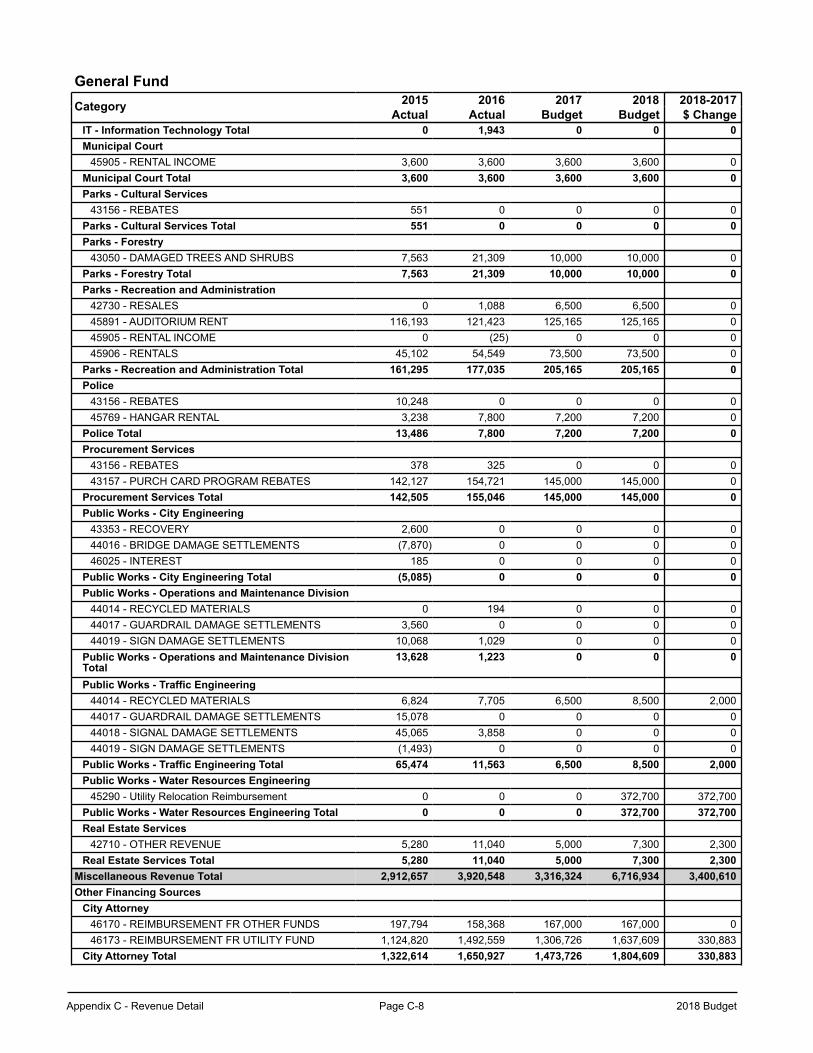
Appendix C - Revenue Detail Page C-8 2018 Budget
General FundCategory 2015 2016 2017 2018 2018-2017
Actual Actual Budget Budget $ ChangeIT - Information Technology Total 0 1,943 0 0 0Municipal Court
45905 - RENTAL INCOME 3,600 3,600 3,600 3,600 0Municipal Court Total 3,600 3,600 3,600 3,600 0Parks - Cultural Services
43156 - REBATES 551 0 0 0 0Parks - Cultural Services Total 551 0 0 0 0Parks - Forestry
43050 - DAMAGED TREES AND SHRUBS 7,563 21,309 10,000 10,000 0Parks - Forestry Total 7,563 21,309 10,000 10,000 0Parks - Recreation and Administration
42730 - RESALES 0 1,088 6,500 6,500 045891 - AUDITORIUM RENT 116,193 121,423 125,165 125,165 045905 - RENTAL INCOME 0 (25) 0 0 045906 - RENTALS 45,102 54,549 73,500 73,500 0
Parks - Recreation and Administration Total 161,295 177,035 205,165 205,165 0Police
43156 - REBATES 10,248 0 0 0 045769 - HANGAR RENTAL 3,238 7,800 7,200 7,200 0
Police Total 13,486 7,800 7,200 7,200 0Procurement Services
43156 - REBATES 378 325 0 0 043157 - PURCH CARD PROGRAM REBATES 142,127 154,721 145,000 145,000 0
Procurement Services Total 142,505 155,046 145,000 145,000 0Public Works - City Engineering
43353 - RECOVERY 2,600 0 0 0 044016 - BRIDGE DAMAGE SETTLEMENTS (7,870) 0 0 0 046025 - INTEREST 185 0 0 0 0
Public Works - City Engineering Total (5,085) 0 0 0 0Public Works - Operations and Maintenance Division
44014 - RECYCLED MATERIALS 0 194 0 0 044017 - GUARDRAIL DAMAGE SETTLEMENTS 3,560 0 0 0 044019 - SIGN DAMAGE SETTLEMENTS 10,068 1,029 0 0 0
Public Works - Operations and Maintenance DivisionTotal
13,628 1,223 0 0 0
Public Works - Traffic Engineering44014 - RECYCLED MATERIALS 6,824 7,705 6,500 8,500 2,00044017 - GUARDRAIL DAMAGE SETTLEMENTS 15,078 0 0 0 044018 - SIGNAL DAMAGE SETTLEMENTS 45,065 3,858 0 0 044019 - SIGN DAMAGE SETTLEMENTS (1,493) 0 0 0 0
Public Works - Traffic Engineering Total 65,474 11,563 6,500 8,500 2,000Public Works - Water Resources Engineering
45290 - Utility Relocation Reimbursement 0 0 0 372,700 372,700Public Works - Water Resources Engineering Total 0 0 0 372,700 372,700Real Estate Services
42710 - OTHER REVENUE 5,280 11,040 5,000 7,300 2,300Real Estate Services Total 5,280 11,040 5,000 7,300 2,300
Miscellaneous Revenue Total 2,912,657 3,920,548 3,316,324 6,716,934 3,400,610Other Financing Sources
City Attorney46170 - REIMBURSEMENT FR OTHER FUNDS 197,794 158,368 167,000 167,000 046173 - REIMBURSEMENT FR UTILITY FUND 1,124,820 1,492,559 1,306,726 1,637,609 330,883
City Attorney Total 1,322,614 1,650,927 1,473,726 1,804,609 330,883
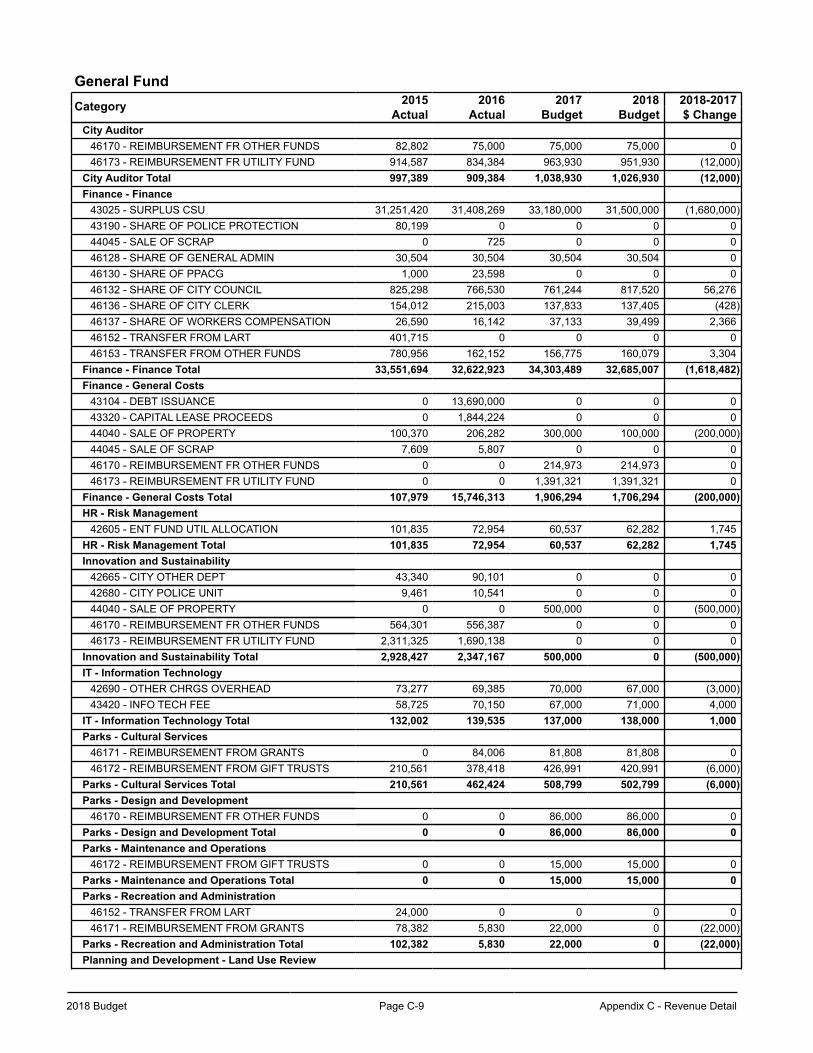
2018 Budget Page C-9 Appendix C - Revenue Detail
General FundCategory 2015 2016 2017 2018 2018-2017
Actual Actual Budget Budget $ ChangeCity Auditor
46170 - REIMBURSEMENT FR OTHER FUNDS 82,802 75,000 75,000 75,000 046173 - REIMBURSEMENT FR UTILITY FUND 914,587 834,384 963,930 951,930 (12,000)
City Auditor Total 997,389 909,384 1,038,930 1,026,930 (12,000)Finance - Finance
43025 - SURPLUS CSU 31,251,420 31,408,269 33,180,000 31,500,000 (1,680,000)43190 - SHARE OF POLICE PROTECTION 80,199 0 0 0 044045 - SALE OF SCRAP 0 725 0 0 046128 - SHARE OF GENERAL ADMIN 30,504 30,504 30,504 30,504 046130 - SHARE OF PPACG 1,000 23,598 0 0 046132 - SHARE OF CITY COUNCIL 825,298 766,530 761,244 817,520 56,27646136 - SHARE OF CITY CLERK 154,012 215,003 137,833 137,405 (428)46137 - SHARE OF WORKERS COMPENSATION 26,590 16,142 37,133 39,499 2,36646152 - TRANSFER FROM LART 401,715 0 0 0 046153 - TRANSFER FROM OTHER FUNDS 780,956 162,152 156,775 160,079 3,304
Finance - Finance Total 33,551,694 32,622,923 34,303,489 32,685,007 (1,618,482)Finance - General Costs
43104 - DEBT ISSUANCE 0 13,690,000 0 0 043320 - CAPITAL LEASE PROCEEDS 0 1,844,224 0 0 044040 - SALE OF PROPERTY 100,370 206,282 300,000 100,000 (200,000)44045 - SALE OF SCRAP 7,609 5,807 0 0 046170 - REIMBURSEMENT FR OTHER FUNDS 0 0 214,973 214,973 046173 - REIMBURSEMENT FR UTILITY FUND 0 0 1,391,321 1,391,321 0
Finance - General Costs Total 107,979 15,746,313 1,906,294 1,706,294 (200,000)HR - Risk Management
42605 - ENT FUND UTIL ALLOCATION 101,835 72,954 60,537 62,282 1,745HR - Risk Management Total 101,835 72,954 60,537 62,282 1,745Innovation and Sustainability
42665 - CITY OTHER DEPT 43,340 90,101 0 0 042680 - CITY POLICE UNIT 9,461 10,541 0 0 044040 - SALE OF PROPERTY 0 0 500,000 0 (500,000)46170 - REIMBURSEMENT FR OTHER FUNDS 564,301 556,387 0 0 046173 - REIMBURSEMENT FR UTILITY FUND 2,311,325 1,690,138 0 0 0
Innovation and Sustainability Total 2,928,427 2,347,167 500,000 0 (500,000)IT - Information Technology
42690 - OTHER CHRGS OVERHEAD 73,277 69,385 70,000 67,000 (3,000)43420 - INFO TECH FEE 58,725 70,150 67,000 71,000 4,000
IT - Information Technology Total 132,002 139,535 137,000 138,000 1,000Parks - Cultural Services
46171 - REIMBURSEMENT FROM GRANTS 0 84,006 81,808 81,808 046172 - REIMBURSEMENT FROM GIFT TRUSTS 210,561 378,418 426,991 420,991 (6,000)
Parks - Cultural Services Total 210,561 462,424 508,799 502,799 (6,000)Parks - Design and Development
46170 - REIMBURSEMENT FR OTHER FUNDS 0 0 86,000 86,000 0Parks - Design and Development Total 0 0 86,000 86,000 0Parks - Maintenance and Operations
46172 - REIMBURSEMENT FROM GIFT TRUSTS 0 0 15,000 15,000 0Parks - Maintenance and Operations Total 0 0 15,000 15,000 0Parks - Recreation and Administration
46152 - TRANSFER FROM LART 24,000 0 0 0 046171 - REIMBURSEMENT FROM GRANTS 78,382 5,830 22,000 0 (22,000)
Parks - Recreation and Administration Total 102,382 5,830 22,000 0 (22,000)Planning and Development - Land Use Review
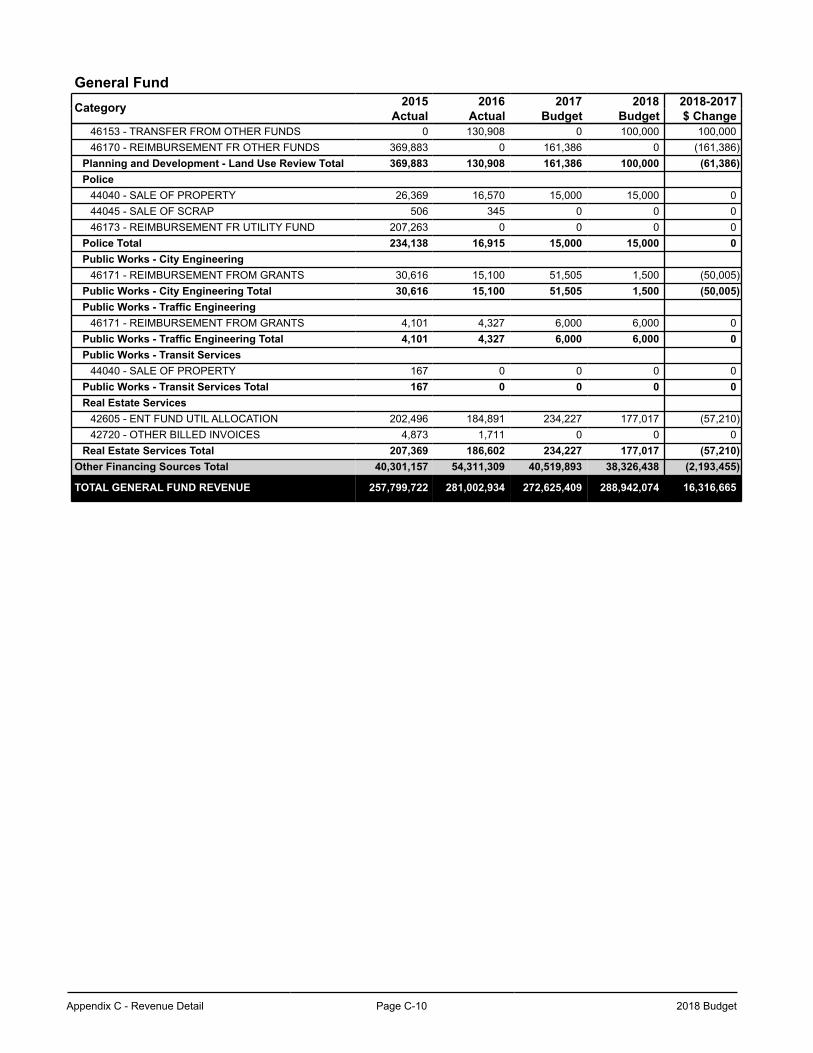
Appendix C - Revenue Detail Page C-10 2018 Budget
General FundCategory 2015 2016 2017 2018 2018-2017
Actual Actual Budget Budget $ Change46153 - TRANSFER FROM OTHER FUNDS 0 130,908 0 100,000 100,00046170 - REIMBURSEMENT FR OTHER FUNDS 369,883 0 161,386 0 (161,386)
Planning and Development - Land Use Review Total 369,883 130,908 161,386 100,000 (61,386)Police
44040 - SALE OF PROPERTY 26,369 16,570 15,000 15,000 044045 - SALE OF SCRAP 506 345 0 0 046173 - REIMBURSEMENT FR UTILITY FUND 207,263 0 0 0 0
Police Total 234,138 16,915 15,000 15,000 0Public Works - City Engineering
46171 - REIMBURSEMENT FROM GRANTS 30,616 15,100 51,505 1,500 (50,005)Public Works - City Engineering Total 30,616 15,100 51,505 1,500 (50,005)Public Works - Traffic Engineering
46171 - REIMBURSEMENT FROM GRANTS 4,101 4,327 6,000 6,000 0Public Works - Traffic Engineering Total 4,101 4,327 6,000 6,000 0Public Works - Transit Services
44040 - SALE OF PROPERTY 167 0 0 0 0Public Works - Transit Services Total 167 0 0 0 0Real Estate Services
42605 - ENT FUND UTIL ALLOCATION 202,496 184,891 234,227 177,017 (57,210)42720 - OTHER BILLED INVOICES 4,873 1,711 0 0 0
Real Estate Services Total 207,369 186,602 234,227 177,017 (57,210)Other Financing Sources Total 40,301,157 54,311,309 40,519,893 38,326,438 (2,193,455)
TOTAL GENERAL FUND REVENUE 257,799,722 281,002,934 272,625,409 288,942,074 16,316,665
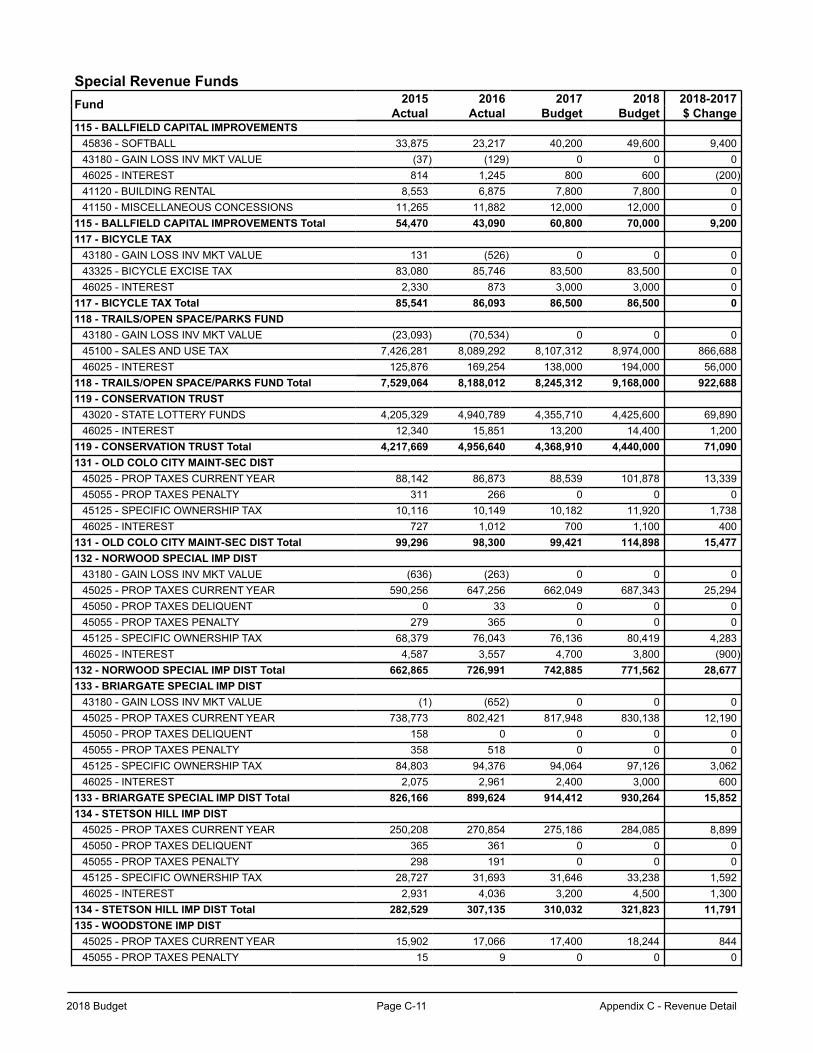
2018 Budget Page C-11 Appendix C - Revenue Detail
Special Revenue FundsFund 2015 2016 2017 2018 2018-2017
Actual Actual Budget Budget $ Change115 - BALLFIELD CAPITAL IMPROVEMENTS
45836 - SOFTBALL 33,875 23,217 40,200 49,600 9,40043180 - GAIN LOSS INV MKT VALUE (37) (129) 0 0 046025 - INTEREST 814 1,245 800 600 (200)41120 - BUILDING RENTAL 8,553 6,875 7,800 7,800 041150 - MISCELLANEOUS CONCESSIONS 11,265 11,882 12,000 12,000 0
115 - BALLFIELD CAPITAL IMPROVEMENTS Total 54,470 43,090 60,800 70,000 9,200117 - BICYCLE TAX
43180 - GAIN LOSS INV MKT VALUE 131 (526) 0 0 043325 - BICYCLE EXCISE TAX 83,080 85,746 83,500 83,500 046025 - INTEREST 2,330 873 3,000 3,000 0
117 - BICYCLE TAX Total 85,541 86,093 86,500 86,500 0118 - TRAILS/OPEN SPACE/PARKS FUND
43180 - GAIN LOSS INV MKT VALUE (23,093) (70,534) 0 0 045100 - SALES AND USE TAX 7,426,281 8,089,292 8,107,312 8,974,000 866,68846025 - INTEREST 125,876 169,254 138,000 194,000 56,000
118 - TRAILS/OPEN SPACE/PARKS FUND Total 7,529,064 8,188,012 8,245,312 9,168,000 922,688119 - CONSERVATION TRUST
43020 - STATE LOTTERY FUNDS 4,205,329 4,940,789 4,355,710 4,425,600 69,89046025 - INTEREST 12,340 15,851 13,200 14,400 1,200
119 - CONSERVATION TRUST Total 4,217,669 4,956,640 4,368,910 4,440,000 71,090131 - OLD COLO CITY MAINT-SEC DIST
45025 - PROP TAXES CURRENT YEAR 88,142 86,873 88,539 101,878 13,33945055 - PROP TAXES PENALTY 311 266 0 0 045125 - SPECIFIC OWNERSHIP TAX 10,116 10,149 10,182 11,920 1,73846025 - INTEREST 727 1,012 700 1,100 400
131 - OLD COLO CITY MAINT-SEC DIST Total 99,296 98,300 99,421 114,898 15,477132 - NORWOOD SPECIAL IMP DIST
43180 - GAIN LOSS INV MKT VALUE (636) (263) 0 0 045025 - PROP TAXES CURRENT YEAR 590,256 647,256 662,049 687,343 25,29445050 - PROP TAXES DELIQUENT 0 33 0 0 045055 - PROP TAXES PENALTY 279 365 0 0 045125 - SPECIFIC OWNERSHIP TAX 68,379 76,043 76,136 80,419 4,28346025 - INTEREST 4,587 3,557 4,700 3,800 (900)
132 - NORWOOD SPECIAL IMP DIST Total 662,865 726,991 742,885 771,562 28,677133 - BRIARGATE SPECIAL IMP DIST
43180 - GAIN LOSS INV MKT VALUE (1) (652) 0 0 045025 - PROP TAXES CURRENT YEAR 738,773 802,421 817,948 830,138 12,19045050 - PROP TAXES DELIQUENT 158 0 0 0 045055 - PROP TAXES PENALTY 358 518 0 0 045125 - SPECIFIC OWNERSHIP TAX 84,803 94,376 94,064 97,126 3,06246025 - INTEREST 2,075 2,961 2,400 3,000 600
133 - BRIARGATE SPECIAL IMP DIST Total 826,166 899,624 914,412 930,264 15,852134 - STETSON HILL IMP DIST
45025 - PROP TAXES CURRENT YEAR 250,208 270,854 275,186 284,085 8,89945050 - PROP TAXES DELIQUENT 365 361 0 0 045055 - PROP TAXES PENALTY 298 191 0 0 045125 - SPECIFIC OWNERSHIP TAX 28,727 31,693 31,646 33,238 1,59246025 - INTEREST 2,931 4,036 3,200 4,500 1,300
134 - STETSON HILL IMP DIST Total 282,529 307,135 310,032 321,823 11,791135 - WOODSTONE IMP DIST
45025 - PROP TAXES CURRENT YEAR 15,902 17,066 17,400 18,244 84445055 - PROP TAXES PENALTY 15 9 0 0 0
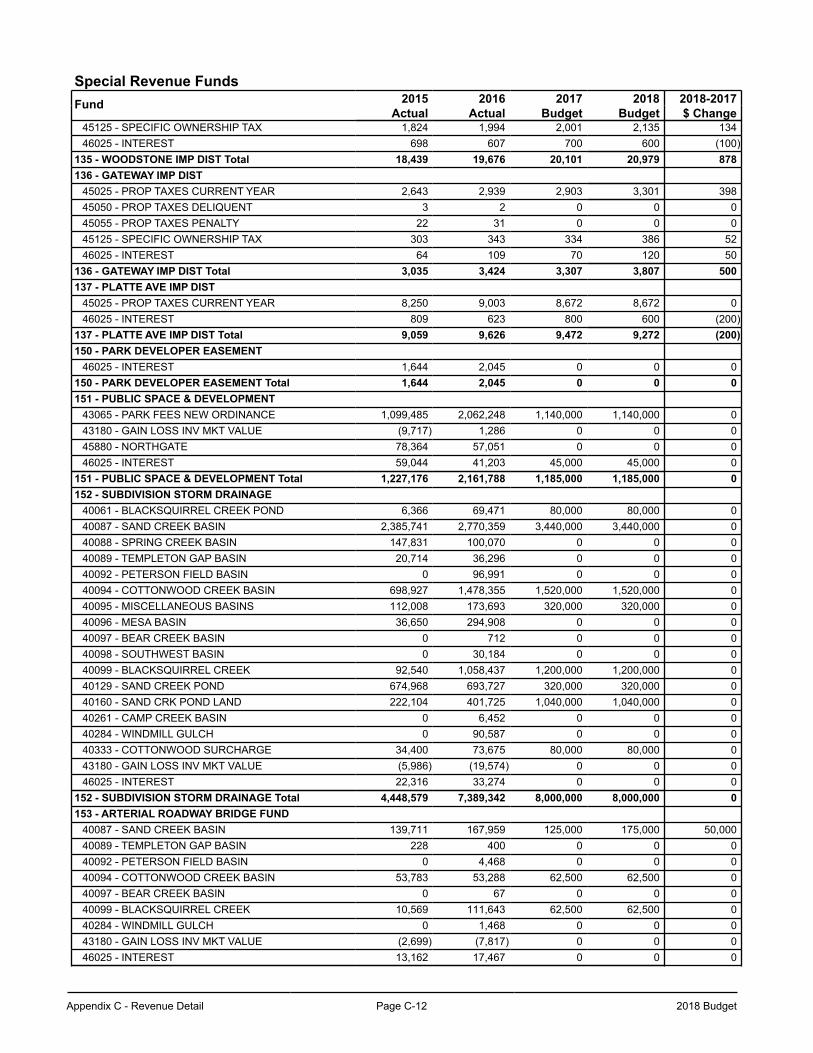
Appendix C - Revenue Detail Page C-12 2018 Budget
Special Revenue FundsFund 2015 2016 2017 2018 2018-2017
Actual Actual Budget Budget $ Change45125 - SPECIFIC OWNERSHIP TAX 1,824 1,994 2,001 2,135 13446025 - INTEREST 698 607 700 600 (100)
135 - WOODSTONE IMP DIST Total 18,439 19,676 20,101 20,979 878136 - GATEWAY IMP DIST
45025 - PROP TAXES CURRENT YEAR 2,643 2,939 2,903 3,301 39845050 - PROP TAXES DELIQUENT 3 2 0 0 045055 - PROP TAXES PENALTY 22 31 0 0 045125 - SPECIFIC OWNERSHIP TAX 303 343 334 386 5246025 - INTEREST 64 109 70 120 50
136 - GATEWAY IMP DIST Total 3,035 3,424 3,307 3,807 500137 - PLATTE AVE IMP DIST
45025 - PROP TAXES CURRENT YEAR 8,250 9,003 8,672 8,672 046025 - INTEREST 809 623 800 600 (200)
137 - PLATTE AVE IMP DIST Total 9,059 9,626 9,472 9,272 (200)150 - PARK DEVELOPER EASEMENT
46025 - INTEREST 1,644 2,045 0 0 0150 - PARK DEVELOPER EASEMENT Total 1,644 2,045 0 0 0151 - PUBLIC SPACE & DEVELOPMENT
43065 - PARK FEES NEW ORDINANCE 1,099,485 2,062,248 1,140,000 1,140,000 043180 - GAIN LOSS INV MKT VALUE (9,717) 1,286 0 0 045880 - NORTHGATE 78,364 57,051 0 0 046025 - INTEREST 59,044 41,203 45,000 45,000 0
151 - PUBLIC SPACE & DEVELOPMENT Total 1,227,176 2,161,788 1,185,000 1,185,000 0152 - SUBDIVISION STORM DRAINAGE
40061 - BLACKSQUIRREL CREEK POND 6,366 69,471 80,000 80,000 040087 - SAND CREEK BASIN 2,385,741 2,770,359 3,440,000 3,440,000 040088 - SPRING CREEK BASIN 147,831 100,070 0 0 040089 - TEMPLETON GAP BASIN 20,714 36,296 0 0 040092 - PETERSON FIELD BASIN 0 96,991 0 0 040094 - COTTONWOOD CREEK BASIN 698,927 1,478,355 1,520,000 1,520,000 040095 - MISCELLANEOUS BASINS 112,008 173,693 320,000 320,000 040096 - MESA BASIN 36,650 294,908 0 0 040097 - BEAR CREEK BASIN 0 712 0 0 040098 - SOUTHWEST BASIN 0 30,184 0 0 040099 - BLACKSQUIRREL CREEK 92,540 1,058,437 1,200,000 1,200,000 040129 - SAND CREEK POND 674,968 693,727 320,000 320,000 040160 - SAND CRK POND LAND 222,104 401,725 1,040,000 1,040,000 040261 - CAMP CREEK BASIN 0 6,452 0 0 040284 - WINDMILL GULCH 0 90,587 0 0 040333 - COTTONWOOD SURCHARGE 34,400 73,675 80,000 80,000 043180 - GAIN LOSS INV MKT VALUE (5,986) (19,574) 0 0 046025 - INTEREST 22,316 33,274 0 0 0
152 - SUBDIVISION STORM DRAINAGE Total 4,448,579 7,389,342 8,000,000 8,000,000 0153 - ARTERIAL ROADWAY BRIDGE FUND
40087 - SAND CREEK BASIN 139,711 167,959 125,000 175,000 50,00040089 - TEMPLETON GAP BASIN 228 400 0 0 040092 - PETERSON FIELD BASIN 0 4,468 0 0 040094 - COTTONWOOD CREEK BASIN 53,783 53,288 62,500 62,500 040097 - BEAR CREEK BASIN 0 67 0 0 040099 - BLACKSQUIRREL CREEK 10,569 111,643 62,500 62,500 040284 - WINDMILL GULCH 0 1,468 0 0 043180 - GAIN LOSS INV MKT VALUE (2,699) (7,817) 0 0 046025 - INTEREST 13,162 17,467 0 0 0
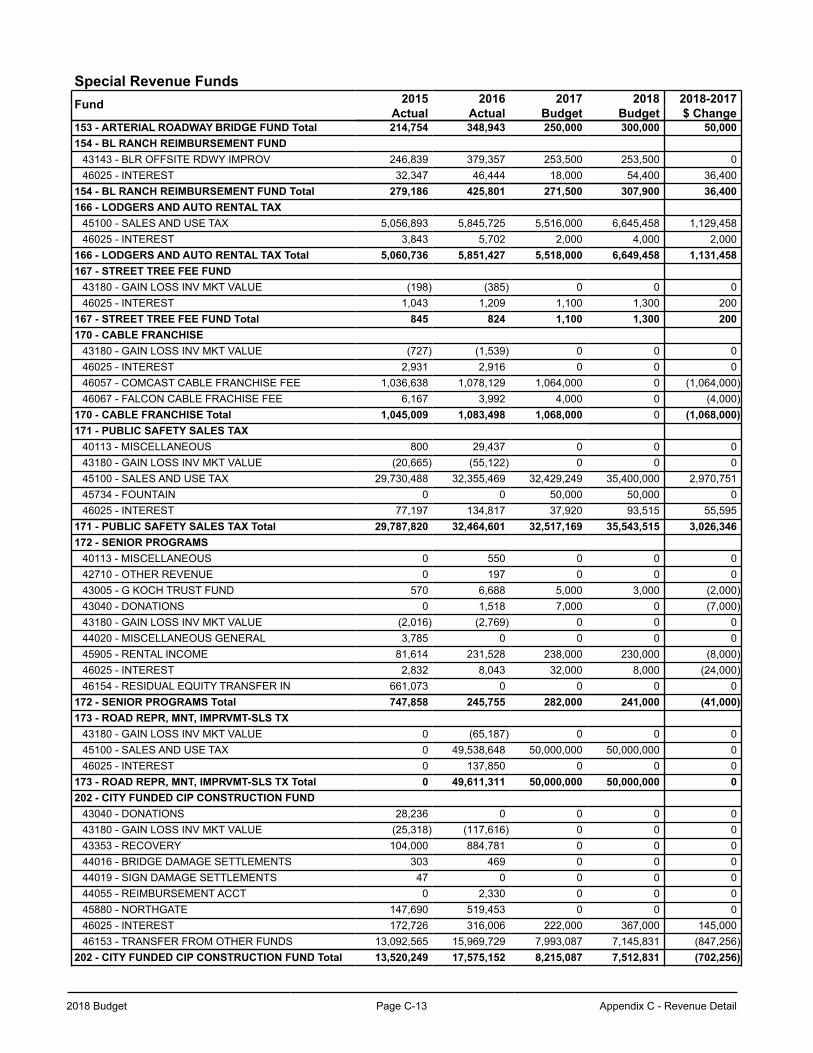
2018 Budget Page C-13 Appendix C - Revenue Detail
Special Revenue FundsFund 2015 2016 2017 2018 2018-2017
Actual Actual Budget Budget $ Change153 - ARTERIAL ROADWAY BRIDGE FUND Total 214,754 348,943 250,000 300,000 50,000154 - BL RANCH REIMBURSEMENT FUND
43143 - BLR OFFSITE RDWY IMPROV 246,839 379,357 253,500 253,500 046025 - INTEREST 32,347 46,444 18,000 54,400 36,400
154 - BL RANCH REIMBURSEMENT FUND Total 279,186 425,801 271,500 307,900 36,400166 - LODGERS AND AUTO RENTAL TAX
45100 - SALES AND USE TAX 5,056,893 5,845,725 5,516,000 6,645,458 1,129,45846025 - INTEREST 3,843 5,702 2,000 4,000 2,000
166 - LODGERS AND AUTO RENTAL TAX Total 5,060,736 5,851,427 5,518,000 6,649,458 1,131,458167 - STREET TREE FEE FUND
43180 - GAIN LOSS INV MKT VALUE (198) (385) 0 0 046025 - INTEREST 1,043 1,209 1,100 1,300 200
167 - STREET TREE FEE FUND Total 845 824 1,100 1,300 200170 - CABLE FRANCHISE
43180 - GAIN LOSS INV MKT VALUE (727) (1,539) 0 0 046025 - INTEREST 2,931 2,916 0 0 046057 - COMCAST CABLE FRANCHISE FEE 1,036,638 1,078,129 1,064,000 0 (1,064,000)46067 - FALCON CABLE FRACHISE FEE 6,167 3,992 4,000 0 (4,000)
170 - CABLE FRANCHISE Total 1,045,009 1,083,498 1,068,000 0 (1,068,000)171 - PUBLIC SAFETY SALES TAX
40113 - MISCELLANEOUS 800 29,437 0 0 043180 - GAIN LOSS INV MKT VALUE (20,665) (55,122) 0 0 045100 - SALES AND USE TAX 29,730,488 32,355,469 32,429,249 35,400,000 2,970,75145734 - FOUNTAIN 0 0 50,000 50,000 046025 - INTEREST 77,197 134,817 37,920 93,515 55,595
171 - PUBLIC SAFETY SALES TAX Total 29,787,820 32,464,601 32,517,169 35,543,515 3,026,346172 - SENIOR PROGRAMS
40113 - MISCELLANEOUS 0 550 0 0 042710 - OTHER REVENUE 0 197 0 0 043005 - G KOCH TRUST FUND 570 6,688 5,000 3,000 (2,000)43040 - DONATIONS 0 1,518 7,000 0 (7,000)43180 - GAIN LOSS INV MKT VALUE (2,016) (2,769) 0 0 044020 - MISCELLANEOUS GENERAL 3,785 0 0 0 045905 - RENTAL INCOME 81,614 231,528 238,000 230,000 (8,000)46025 - INTEREST 2,832 8,043 32,000 8,000 (24,000)46154 - RESIDUAL EQUITY TRANSFER IN 661,073 0 0 0 0
172 - SENIOR PROGRAMS Total 747,858 245,755 282,000 241,000 (41,000)173 - ROAD REPR, MNT, IMPRVMT-SLS TX
43180 - GAIN LOSS INV MKT VALUE 0 (65,187) 0 0 045100 - SALES AND USE TAX 0 49,538,648 50,000,000 50,000,000 046025 - INTEREST 0 137,850 0 0 0
173 - ROAD REPR, MNT, IMPRVMT-SLS TX Total 0 49,611,311 50,000,000 50,000,000 0202 - CITY FUNDED CIP CONSTRUCTION FUND
43040 - DONATIONS 28,236 0 0 0 043180 - GAIN LOSS INV MKT VALUE (25,318) (117,616) 0 0 043353 - RECOVERY 104,000 884,781 0 0 044016 - BRIDGE DAMAGE SETTLEMENTS 303 469 0 0 044019 - SIGN DAMAGE SETTLEMENTS 47 0 0 0 044055 - REIMBURSEMENT ACCT 0 2,330 0 0 045880 - NORTHGATE 147,690 519,453 0 0 046025 - INTEREST 172,726 316,006 222,000 367,000 145,00046153 - TRANSFER FROM OTHER FUNDS 13,092,565 15,969,729 7,993,087 7,145,831 (847,256)
202 - CITY FUNDED CIP CONSTRUCTION FUND Total 13,520,249 17,575,152 8,215,087 7,512,831 (702,256)
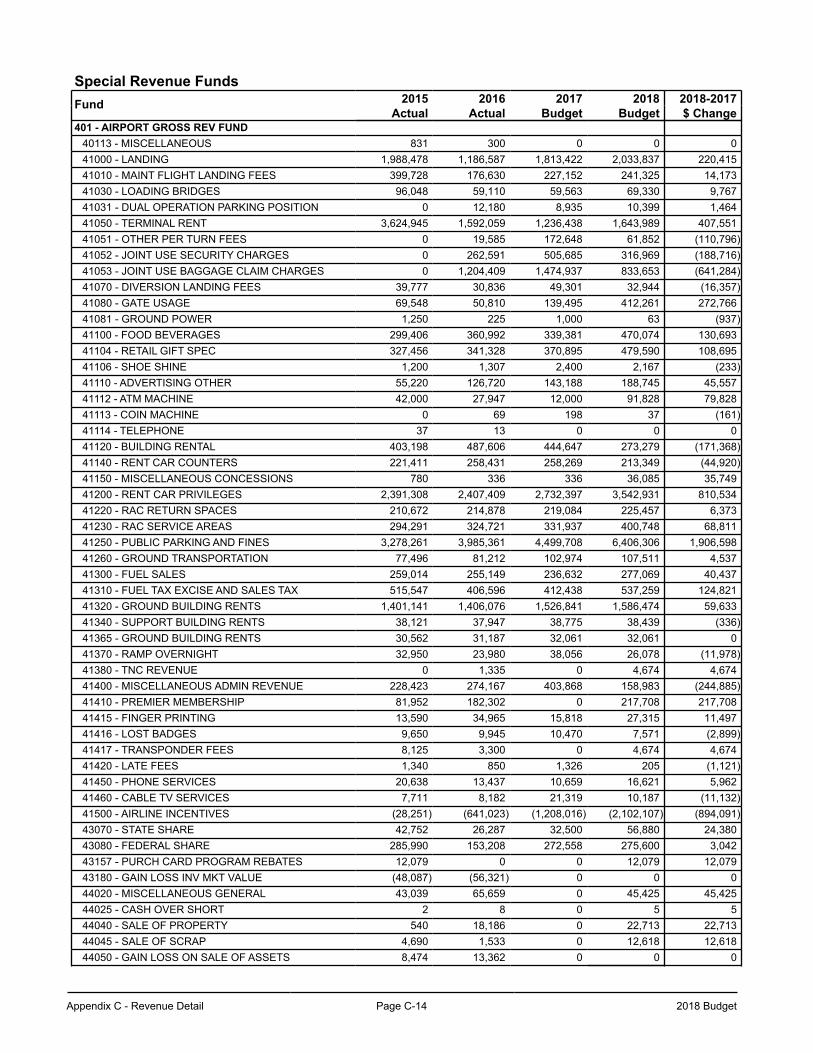
Appendix C - Revenue Detail Page C-14 2018 Budget
Special Revenue FundsFund 2015 2016 2017 2018 2018-2017
Actual Actual Budget Budget $ Change401 - AIRPORT GROSS REV FUND
40113 - MISCELLANEOUS 831 300 0 0 041000 - LANDING 1,988,478 1,186,587 1,813,422 2,033,837 220,41541010 - MAINT FLIGHT LANDING FEES 399,728 176,630 227,152 241,325 14,17341030 - LOADING BRIDGES 96,048 59,110 59,563 69,330 9,76741031 - DUAL OPERATION PARKING POSITION 0 12,180 8,935 10,399 1,46441050 - TERMINAL RENT 3,624,945 1,592,059 1,236,438 1,643,989 407,55141051 - OTHER PER TURN FEES 0 19,585 172,648 61,852 (110,796)41052 - JOINT USE SECURITY CHARGES 0 262,591 505,685 316,969 (188,716)41053 - JOINT USE BAGGAGE CLAIM CHARGES 0 1,204,409 1,474,937 833,653 (641,284)41070 - DIVERSION LANDING FEES 39,777 30,836 49,301 32,944 (16,357)41080 - GATE USAGE 69,548 50,810 139,495 412,261 272,76641081 - GROUND POWER 1,250 225 1,000 63 (937)41100 - FOOD BEVERAGES 299,406 360,992 339,381 470,074 130,69341104 - RETAIL GIFT SPEC 327,456 341,328 370,895 479,590 108,69541106 - SHOE SHINE 1,200 1,307 2,400 2,167 (233)41110 - ADVERTISING OTHER 55,220 126,720 143,188 188,745 45,55741112 - ATM MACHINE 42,000 27,947 12,000 91,828 79,82841113 - COIN MACHINE 0 69 198 37 (161)41114 - TELEPHONE 37 13 0 0 041120 - BUILDING RENTAL 403,198 487,606 444,647 273,279 (171,368)41140 - RENT CAR COUNTERS 221,411 258,431 258,269 213,349 (44,920)41150 - MISCELLANEOUS CONCESSIONS 780 336 336 36,085 35,74941200 - RENT CAR PRIVILEGES 2,391,308 2,407,409 2,732,397 3,542,931 810,53441220 - RAC RETURN SPACES 210,672 214,878 219,084 225,457 6,37341230 - RAC SERVICE AREAS 294,291 324,721 331,937 400,748 68,81141250 - PUBLIC PARKING AND FINES 3,278,261 3,985,361 4,499,708 6,406,306 1,906,59841260 - GROUND TRANSPORTATION 77,496 81,212 102,974 107,511 4,53741300 - FUEL SALES 259,014 255,149 236,632 277,069 40,43741310 - FUEL TAX EXCISE AND SALES TAX 515,547 406,596 412,438 537,259 124,82141320 - GROUND BUILDING RENTS 1,401,141 1,406,076 1,526,841 1,586,474 59,63341340 - SUPPORT BUILDING RENTS 38,121 37,947 38,775 38,439 (336)41365 - GROUND BUILDING RENTS 30,562 31,187 32,061 32,061 041370 - RAMP OVERNIGHT 32,950 23,980 38,056 26,078 (11,978)41380 - TNC REVENUE 0 1,335 0 4,674 4,67441400 - MISCELLANEOUS ADMIN REVENUE 228,423 274,167 403,868 158,983 (244,885)41410 - PREMIER MEMBERSHIP 81,952 182,302 0 217,708 217,70841415 - FINGER PRINTING 13,590 34,965 15,818 27,315 11,49741416 - LOST BADGES 9,650 9,945 10,470 7,571 (2,899)41417 - TRANSPONDER FEES 8,125 3,300 0 4,674 4,67441420 - LATE FEES 1,340 850 1,326 205 (1,121)41450 - PHONE SERVICES 20,638 13,437 10,659 16,621 5,96241460 - CABLE TV SERVICES 7,711 8,182 21,319 10,187 (11,132)41500 - AIRLINE INCENTIVES (28,251) (641,023) (1,208,016) (2,102,107) (894,091)43070 - STATE SHARE 42,752 26,287 32,500 56,880 24,38043080 - FEDERAL SHARE 285,990 153,208 272,558 275,600 3,04243157 - PURCH CARD PROGRAM REBATES 12,079 0 0 12,079 12,07943180 - GAIN LOSS INV MKT VALUE (48,087) (56,321) 0 0 044020 - MISCELLANEOUS GENERAL 43,039 65,659 0 45,425 45,42544025 - CASH OVER SHORT 2 8 0 5 544040 - SALE OF PROPERTY 540 18,186 0 22,713 22,71344045 - SALE OF SCRAP 4,690 1,533 0 12,618 12,61844050 - GAIN LOSS ON SALE OF ASSETS 8,474 13,362 0 0 0
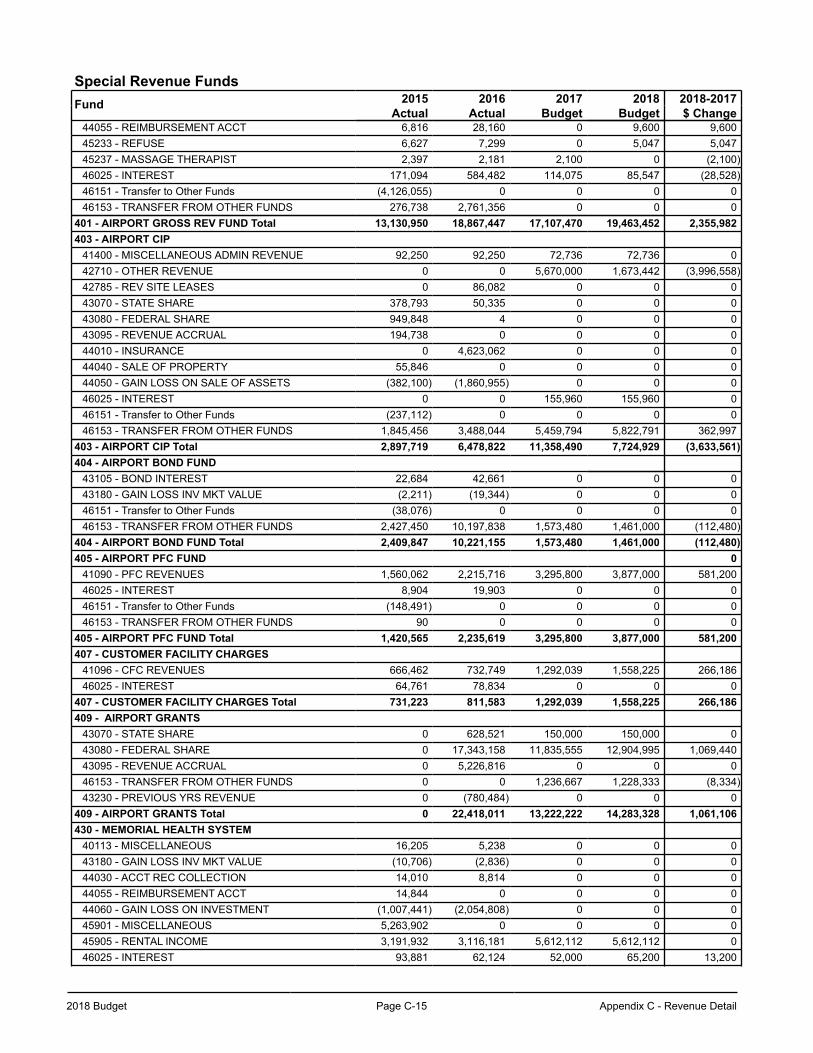
2018 Budget Page C-15 Appendix C - Revenue Detail
Special Revenue FundsFund 2015 2016 2017 2018 2018-2017
Actual Actual Budget Budget $ Change44055 - REIMBURSEMENT ACCT 6,816 28,160 0 9,600 9,60045233 - REFUSE 6,627 7,299 0 5,047 5,04745237 - MASSAGE THERAPIST 2,397 2,181 2,100 0 (2,100)46025 - INTEREST 171,094 584,482 114,075 85,547 (28,528)46151 - Transfer to Other Funds (4,126,055) 0 0 0 046153 - TRANSFER FROM OTHER FUNDS 276,738 2,761,356 0 0 0
401 - AIRPORT GROSS REV FUND Total 13,130,950 18,867,447 17,107,470 19,463,452 2,355,982403 - AIRPORT CIP
41400 - MISCELLANEOUS ADMIN REVENUE 92,250 92,250 72,736 72,736 042710 - OTHER REVENUE 0 0 5,670,000 1,673,442 (3,996,558)42785 - REV SITE LEASES 0 86,082 0 0 043070 - STATE SHARE 378,793 50,335 0 0 043080 - FEDERAL SHARE 949,848 4 0 0 043095 - REVENUE ACCRUAL 194,738 0 0 0 044010 - INSURANCE 0 4,623,062 0 0 044040 - SALE OF PROPERTY 55,846 0 0 0 044050 - GAIN LOSS ON SALE OF ASSETS (382,100) (1,860,955) 0 0 046025 - INTEREST 0 0 155,960 155,960 046151 - Transfer to Other Funds (237,112) 0 0 0 046153 - TRANSFER FROM OTHER FUNDS 1,845,456 3,488,044 5,459,794 5,822,791 362,997
403 - AIRPORT CIP Total 2,897,719 6,478,822 11,358,490 7,724,929 (3,633,561)404 - AIRPORT BOND FUND
43105 - BOND INTEREST 22,684 42,661 0 0 043180 - GAIN LOSS INV MKT VALUE (2,211) (19,344) 0 0 046151 - Transfer to Other Funds (38,076) 0 0 0 046153 - TRANSFER FROM OTHER FUNDS 2,427,450 10,197,838 1,573,480 1,461,000 (112,480)
404 - AIRPORT BOND FUND Total 2,409,847 10,221,155 1,573,480 1,461,000 (112,480)405 - AIRPORT PFC FUND 0
41090 - PFC REVENUES 1,560,062 2,215,716 3,295,800 3,877,000 581,20046025 - INTEREST 8,904 19,903 0 0 046151 - Transfer to Other Funds (148,491) 0 0 0 046153 - TRANSFER FROM OTHER FUNDS 90 0 0 0 0
405 - AIRPORT PFC FUND Total 1,420,565 2,235,619 3,295,800 3,877,000 581,200407 - CUSTOMER FACILITY CHARGES
41096 - CFC REVENUES 666,462 732,749 1,292,039 1,558,225 266,18646025 - INTEREST 64,761 78,834 0 0 0
407 - CUSTOMER FACILITY CHARGES Total 731,223 811,583 1,292,039 1,558,225 266,186409 - AIRPORT GRANTS
43070 - STATE SHARE 0 628,521 150,000 150,000 043080 - FEDERAL SHARE 0 17,343,158 11,835,555 12,904,995 1,069,44043095 - REVENUE ACCRUAL 0 5,226,816 0 0 046153 - TRANSFER FROM OTHER FUNDS 0 0 1,236,667 1,228,333 (8,334)43230 - PREVIOUS YRS REVENUE 0 (780,484) 0 0 0
409 - AIRPORT GRANTS Total 0 22,418,011 13,222,222 14,283,328 1,061,106430 - MEMORIAL HEALTH SYSTEM
40113 - MISCELLANEOUS 16,205 5,238 0 0 043180 - GAIN LOSS INV MKT VALUE (10,706) (2,836) 0 0 044030 - ACCT REC COLLECTION 14,010 8,814 0 0 044055 - REIMBURSEMENT ACCT 14,844 0 0 0 044060 - GAIN LOSS ON INVESTMENT (1,007,441) (2,054,808) 0 0 045901 - MISCELLANEOUS 5,263,902 0 0 0 045905 - RENTAL INCOME 3,191,932 3,116,181 5,612,112 5,612,112 046025 - INTEREST 93,881 62,124 52,000 65,200 13,200
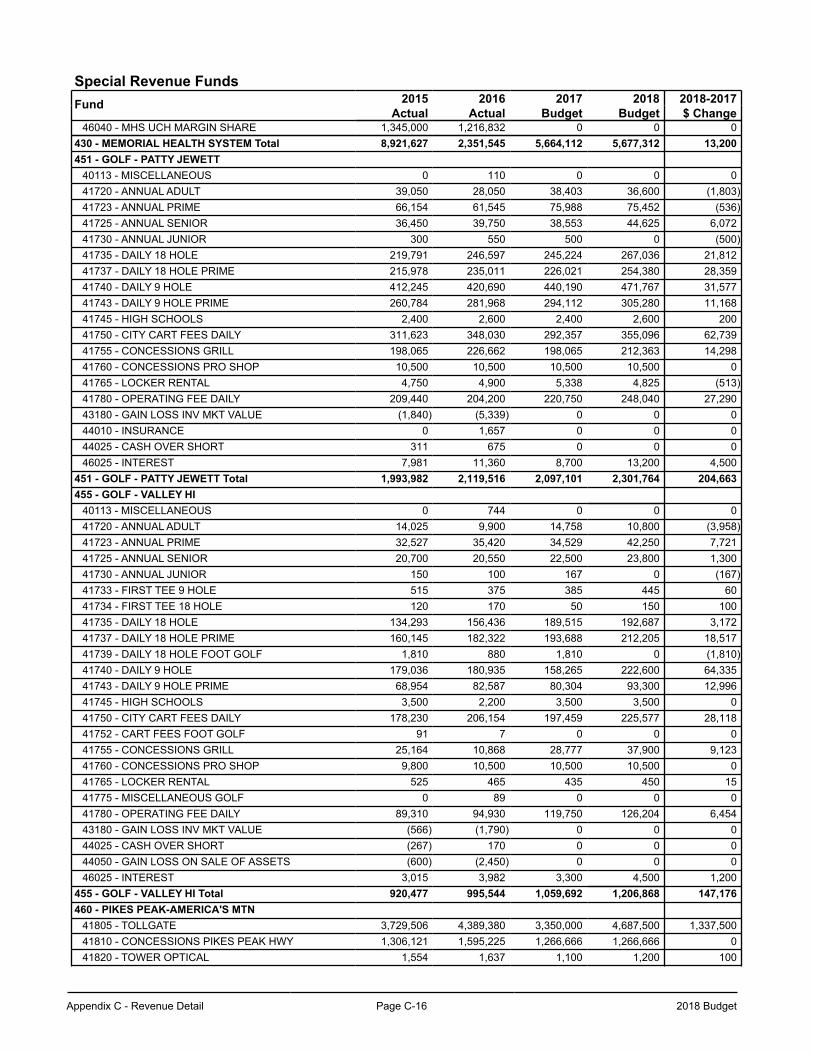
Appendix C - Revenue Detail Page C-16 2018 Budget
Special Revenue FundsFund 2015 2016 2017 2018 2018-2017
Actual Actual Budget Budget $ Change46040 - MHS UCH MARGIN SHARE 1,345,000 1,216,832 0 0 0
430 - MEMORIAL HEALTH SYSTEM Total 8,921,627 2,351,545 5,664,112 5,677,312 13,200451 - GOLF - PATTY JEWETT
40113 - MISCELLANEOUS 0 110 0 0 041720 - ANNUAL ADULT 39,050 28,050 38,403 36,600 (1,803)41723 - ANNUAL PRIME 66,154 61,545 75,988 75,452 (536)41725 - ANNUAL SENIOR 36,450 39,750 38,553 44,625 6,07241730 - ANNUAL JUNIOR 300 550 500 0 (500)41735 - DAILY 18 HOLE 219,791 246,597 245,224 267,036 21,81241737 - DAILY 18 HOLE PRIME 215,978 235,011 226,021 254,380 28,35941740 - DAILY 9 HOLE 412,245 420,690 440,190 471,767 31,57741743 - DAILY 9 HOLE PRIME 260,784 281,968 294,112 305,280 11,16841745 - HIGH SCHOOLS 2,400 2,600 2,400 2,600 20041750 - CITY CART FEES DAILY 311,623 348,030 292,357 355,096 62,73941755 - CONCESSIONS GRILL 198,065 226,662 198,065 212,363 14,29841760 - CONCESSIONS PRO SHOP 10,500 10,500 10,500 10,500 041765 - LOCKER RENTAL 4,750 4,900 5,338 4,825 (513)41780 - OPERATING FEE DAILY 209,440 204,200 220,750 248,040 27,29043180 - GAIN LOSS INV MKT VALUE (1,840) (5,339) 0 0 044010 - INSURANCE 0 1,657 0 0 044025 - CASH OVER SHORT 311 675 0 0 046025 - INTEREST 7,981 11,360 8,700 13,200 4,500
451 - GOLF - PATTY JEWETT Total 1,993,982 2,119,516 2,097,101 2,301,764 204,663455 - GOLF - VALLEY HI
40113 - MISCELLANEOUS 0 744 0 0 041720 - ANNUAL ADULT 14,025 9,900 14,758 10,800 (3,958)41723 - ANNUAL PRIME 32,527 35,420 34,529 42,250 7,72141725 - ANNUAL SENIOR 20,700 20,550 22,500 23,800 1,30041730 - ANNUAL JUNIOR 150 100 167 0 (167)41733 - FIRST TEE 9 HOLE 515 375 385 445 6041734 - FIRST TEE 18 HOLE 120 170 50 150 10041735 - DAILY 18 HOLE 134,293 156,436 189,515 192,687 3,17241737 - DAILY 18 HOLE PRIME 160,145 182,322 193,688 212,205 18,51741739 - DAILY 18 HOLE FOOT GOLF 1,810 880 1,810 0 (1,810)41740 - DAILY 9 HOLE 179,036 180,935 158,265 222,600 64,33541743 - DAILY 9 HOLE PRIME 68,954 82,587 80,304 93,300 12,99641745 - HIGH SCHOOLS 3,500 2,200 3,500 3,500 041750 - CITY CART FEES DAILY 178,230 206,154 197,459 225,577 28,11841752 - CART FEES FOOT GOLF 91 7 0 0 041755 - CONCESSIONS GRILL 25,164 10,868 28,777 37,900 9,12341760 - CONCESSIONS PRO SHOP 9,800 10,500 10,500 10,500 041765 - LOCKER RENTAL 525 465 435 450 1541775 - MISCELLANEOUS GOLF 0 89 0 0 041780 - OPERATING FEE DAILY 89,310 94,930 119,750 126,204 6,45443180 - GAIN LOSS INV MKT VALUE (566) (1,790) 0 0 044025 - CASH OVER SHORT (267) 170 0 0 044050 - GAIN LOSS ON SALE OF ASSETS (600) (2,450) 0 0 046025 - INTEREST 3,015 3,982 3,300 4,500 1,200
455 - GOLF - VALLEY HI Total 920,477 995,544 1,059,692 1,206,868 147,176460 - PIKES PEAK-AMERICA'S MTN
41805 - TOLLGATE 3,729,506 4,389,380 3,350,000 4,687,500 1,337,50041810 - CONCESSIONS PIKES PEAK HWY 1,306,121 1,595,225 1,266,666 1,266,666 041820 - TOWER OPTICAL 1,554 1,637 1,100 1,200 100
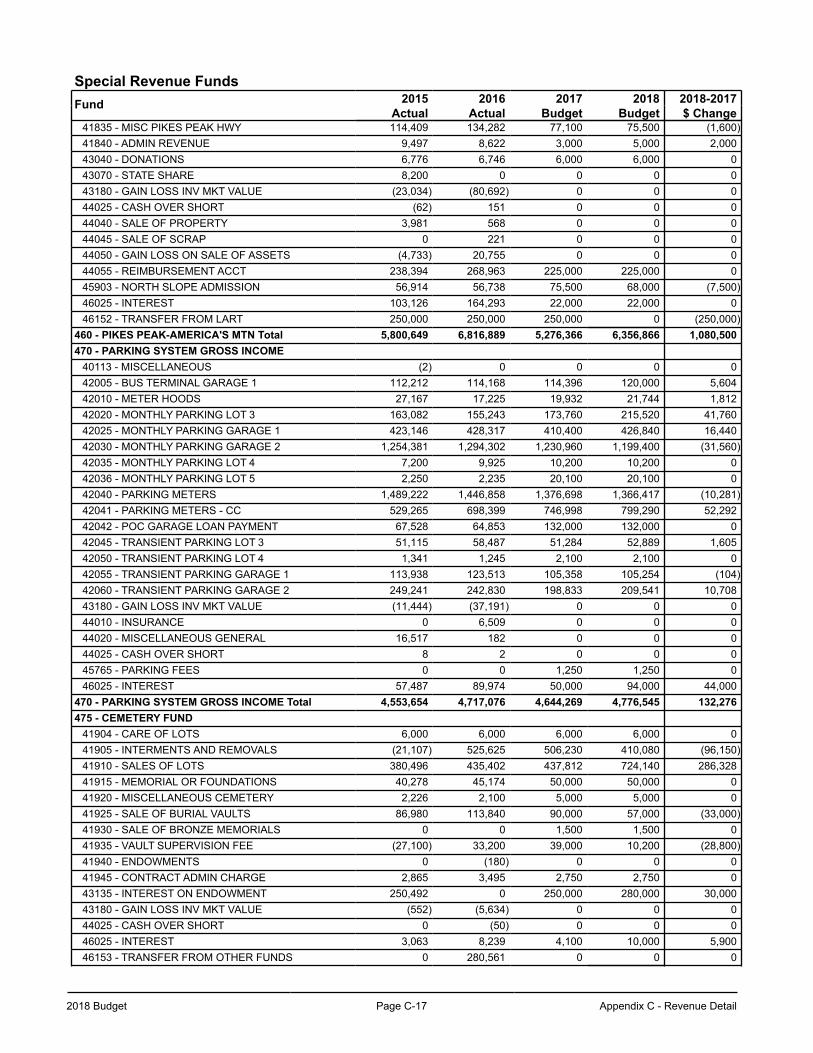
2018 Budget Page C-17 Appendix C - Revenue Detail
Special Revenue FundsFund 2015 2016 2017 2018 2018-2017
Actual Actual Budget Budget $ Change41835 - MISC PIKES PEAK HWY 114,409 134,282 77,100 75,500 (1,600)41840 - ADMIN REVENUE 9,497 8,622 3,000 5,000 2,00043040 - DONATIONS 6,776 6,746 6,000 6,000 043070 - STATE SHARE 8,200 0 0 0 043180 - GAIN LOSS INV MKT VALUE (23,034) (80,692) 0 0 044025 - CASH OVER SHORT (62) 151 0 0 044040 - SALE OF PROPERTY 3,981 568 0 0 044045 - SALE OF SCRAP 0 221 0 0 044050 - GAIN LOSS ON SALE OF ASSETS (4,733) 20,755 0 0 044055 - REIMBURSEMENT ACCT 238,394 268,963 225,000 225,000 045903 - NORTH SLOPE ADMISSION 56,914 56,738 75,500 68,000 (7,500)46025 - INTEREST 103,126 164,293 22,000 22,000 046152 - TRANSFER FROM LART 250,000 250,000 250,000 0 (250,000)
460 - PIKES PEAK-AMERICA'S MTN Total 5,800,649 6,816,889 5,276,366 6,356,866 1,080,500470 - PARKING SYSTEM GROSS INCOME
40113 - MISCELLANEOUS (2) 0 0 0 042005 - BUS TERMINAL GARAGE 1 112,212 114,168 114,396 120,000 5,60442010 - METER HOODS 27,167 17,225 19,932 21,744 1,81242020 - MONTHLY PARKING LOT 3 163,082 155,243 173,760 215,520 41,76042025 - MONTHLY PARKING GARAGE 1 423,146 428,317 410,400 426,840 16,44042030 - MONTHLY PARKING GARAGE 2 1,254,381 1,294,302 1,230,960 1,199,400 (31,560)42035 - MONTHLY PARKING LOT 4 7,200 9,925 10,200 10,200 042036 - MONTHLY PARKING LOT 5 2,250 2,235 20,100 20,100 042040 - PARKING METERS 1,489,222 1,446,858 1,376,698 1,366,417 (10,281)42041 - PARKING METERS - CC 529,265 698,399 746,998 799,290 52,29242042 - POC GARAGE LOAN PAYMENT 67,528 64,853 132,000 132,000 042045 - TRANSIENT PARKING LOT 3 51,115 58,487 51,284 52,889 1,60542050 - TRANSIENT PARKING LOT 4 1,341 1,245 2,100 2,100 042055 - TRANSIENT PARKING GARAGE 1 113,938 123,513 105,358 105,254 (104)42060 - TRANSIENT PARKING GARAGE 2 249,241 242,830 198,833 209,541 10,70843180 - GAIN LOSS INV MKT VALUE (11,444) (37,191) 0 0 044010 - INSURANCE 0 6,509 0 0 044020 - MISCELLANEOUS GENERAL 16,517 182 0 0 044025 - CASH OVER SHORT 8 2 0 0 045765 - PARKING FEES 0 0 1,250 1,250 046025 - INTEREST 57,487 89,974 50,000 94,000 44,000
470 - PARKING SYSTEM GROSS INCOME Total 4,553,654 4,717,076 4,644,269 4,776,545 132,276475 - CEMETERY FUND
41904 - CARE OF LOTS 6,000 6,000 6,000 6,000 041905 - INTERMENTS AND REMOVALS (21,107) 525,625 506,230 410,080 (96,150)41910 - SALES OF LOTS 380,496 435,402 437,812 724,140 286,32841915 - MEMORIAL OR FOUNDATIONS 40,278 45,174 50,000 50,000 041920 - MISCELLANEOUS CEMETERY 2,226 2,100 5,000 5,000 041925 - SALE OF BURIAL VAULTS 86,980 113,840 90,000 57,000 (33,000)41930 - SALE OF BRONZE MEMORIALS 0 0 1,500 1,500 041935 - VAULT SUPERVISION FEE (27,100) 33,200 39,000 10,200 (28,800)41940 - ENDOWMENTS 0 (180) 0 0 041945 - CONTRACT ADMIN CHARGE 2,865 3,495 2,750 2,750 043135 - INTEREST ON ENDOWMENT 250,492 0 250,000 280,000 30,00043180 - GAIN LOSS INV MKT VALUE (552) (5,634) 0 0 044025 - CASH OVER SHORT 0 (50) 0 0 046025 - INTEREST 3,063 8,239 4,100 10,000 5,90046153 - TRANSFER FROM OTHER FUNDS 0 280,561 0 0 0
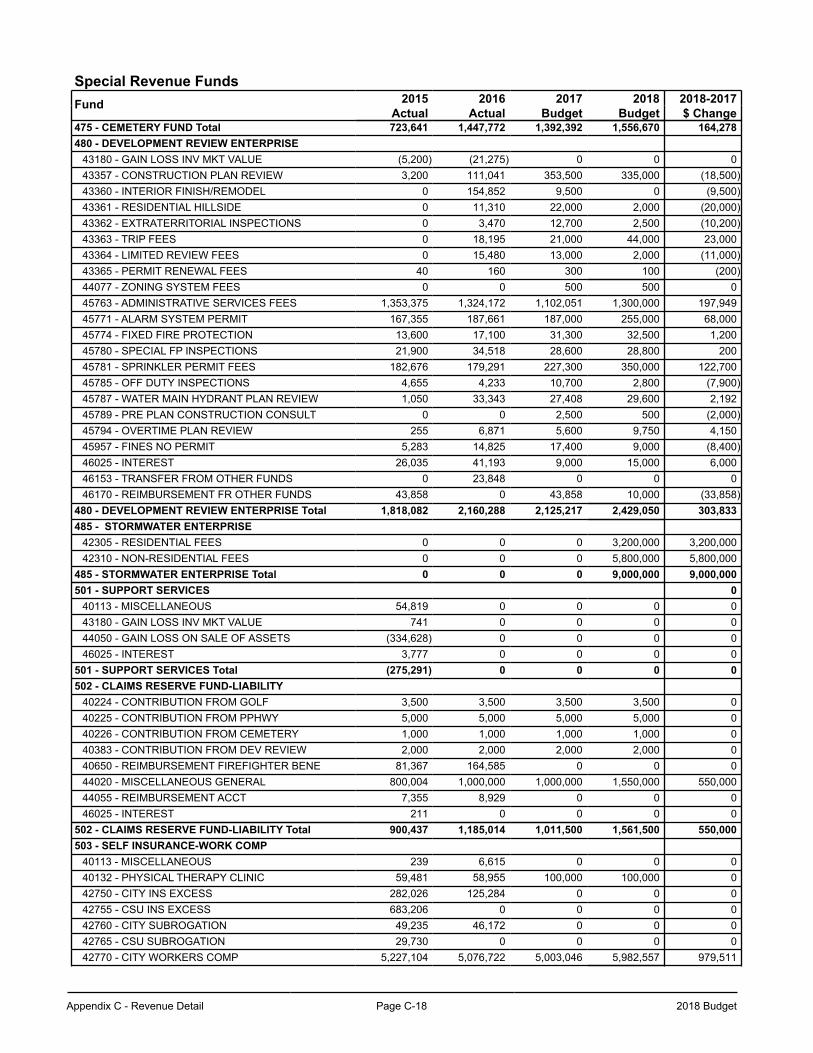
Appendix C - Revenue Detail Page C-18 2018 Budget
Special Revenue FundsFund 2015 2016 2017 2018 2018-2017
Actual Actual Budget Budget $ Change475 - CEMETERY FUND Total 723,641 1,447,772 1,392,392 1,556,670 164,278480 - DEVELOPMENT REVIEW ENTERPRISE
43180 - GAIN LOSS INV MKT VALUE (5,200) (21,275) 0 0 043357 - CONSTRUCTION PLAN REVIEW 3,200 111,041 353,500 335,000 (18,500)43360 - INTERIOR FINISH/REMODEL 0 154,852 9,500 0 (9,500)43361 - RESIDENTIAL HILLSIDE 0 11,310 22,000 2,000 (20,000)43362 - EXTRATERRITORIAL INSPECTIONS 0 3,470 12,700 2,500 (10,200)43363 - TRIP FEES 0 18,195 21,000 44,000 23,00043364 - LIMITED REVIEW FEES 0 15,480 13,000 2,000 (11,000)43365 - PERMIT RENEWAL FEES 40 160 300 100 (200)44077 - ZONING SYSTEM FEES 0 0 500 500 045763 - ADMINISTRATIVE SERVICES FEES 1,353,375 1,324,172 1,102,051 1,300,000 197,94945771 - ALARM SYSTEM PERMIT 167,355 187,661 187,000 255,000 68,00045774 - FIXED FIRE PROTECTION 13,600 17,100 31,300 32,500 1,20045780 - SPECIAL FP INSPECTIONS 21,900 34,518 28,600 28,800 20045781 - SPRINKLER PERMIT FEES 182,676 179,291 227,300 350,000 122,70045785 - OFF DUTY INSPECTIONS 4,655 4,233 10,700 2,800 (7,900)45787 - WATER MAIN HYDRANT PLAN REVIEW 1,050 33,343 27,408 29,600 2,19245789 - PRE PLAN CONSTRUCTION CONSULT 0 0 2,500 500 (2,000)45794 - OVERTIME PLAN REVIEW 255 6,871 5,600 9,750 4,15045957 - FINES NO PERMIT 5,283 14,825 17,400 9,000 (8,400)46025 - INTEREST 26,035 41,193 9,000 15,000 6,00046153 - TRANSFER FROM OTHER FUNDS 0 23,848 0 0 046170 - REIMBURSEMENT FR OTHER FUNDS 43,858 0 43,858 10,000 (33,858)
480 - DEVELOPMENT REVIEW ENTERPRISE Total 1,818,082 2,160,288 2,125,217 2,429,050 303,833485 - STORMWATER ENTERPRISE
42305 - RESIDENTIAL FEES 0 0 0 3,200,000 3,200,00042310 - NON-RESIDENTIAL FEES 0 0 0 5,800,000 5,800,000
485 - STORMWATER ENTERPRISE Total 0 0 0 9,000,000 9,000,000501 - SUPPORT SERVICES 0
40113 - MISCELLANEOUS 54,819 0 0 0 043180 - GAIN LOSS INV MKT VALUE 741 0 0 0 044050 - GAIN LOSS ON SALE OF ASSETS (334,628) 0 0 0 046025 - INTEREST 3,777 0 0 0 0
501 - SUPPORT SERVICES Total (275,291) 0 0 0 0502 - CLAIMS RESERVE FUND-LIABILITY
40224 - CONTRIBUTION FROM GOLF 3,500 3,500 3,500 3,500 040225 - CONTRIBUTION FROM PPHWY 5,000 5,000 5,000 5,000 040226 - CONTRIBUTION FROM CEMETERY 1,000 1,000 1,000 1,000 040383 - CONTRIBUTION FROM DEV REVIEW 2,000 2,000 2,000 2,000 040650 - REIMBURSEMENT FIREFIGHTER BENE 81,367 164,585 0 0 044020 - MISCELLANEOUS GENERAL 800,004 1,000,000 1,000,000 1,550,000 550,00044055 - REIMBURSEMENT ACCT 7,355 8,929 0 0 046025 - INTEREST 211 0 0 0 0
502 - CLAIMS RESERVE FUND-LIABILITY Total 900,437 1,185,014 1,011,500 1,561,500 550,000503 - SELF INSURANCE-WORK COMP
40113 - MISCELLANEOUS 239 6,615 0 0 040132 - PHYSICAL THERAPY CLINIC 59,481 58,955 100,000 100,000 042750 - CITY INS EXCESS 282,026 125,284 0 0 042755 - CSU INS EXCESS 683,206 0 0 0 042760 - CITY SUBROGATION 49,235 46,172 0 0 042765 - CSU SUBROGATION 29,730 0 0 0 042770 - CITY WORKERS COMP 5,227,104 5,076,722 5,003,046 5,982,557 979,511
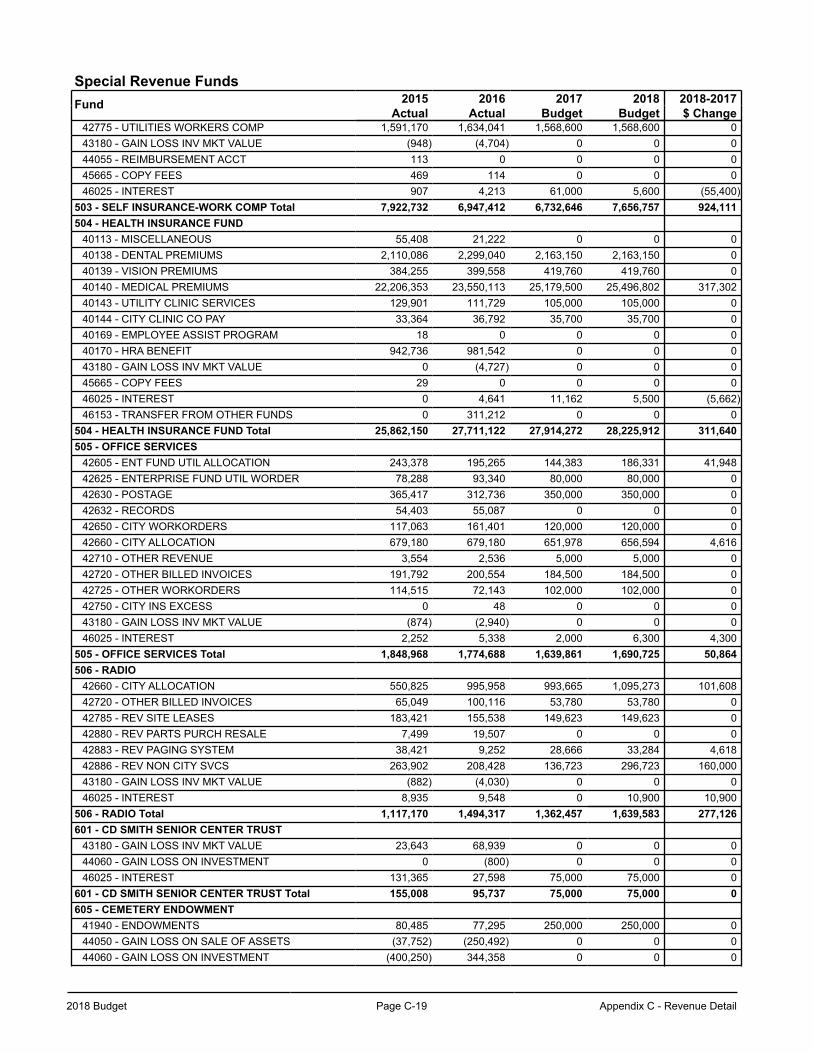
2018 Budget Page C-19 Appendix C - Revenue Detail
Special Revenue FundsFund 2015 2016 2017 2018 2018-2017
Actual Actual Budget Budget $ Change42775 - UTILITIES WORKERS COMP 1,591,170 1,634,041 1,568,600 1,568,600 043180 - GAIN LOSS INV MKT VALUE (948) (4,704) 0 0 044055 - REIMBURSEMENT ACCT 113 0 0 0 045665 - COPY FEES 469 114 0 0 046025 - INTEREST 907 4,213 61,000 5,600 (55,400)
503 - SELF INSURANCE-WORK COMP Total 7,922,732 6,947,412 6,732,646 7,656,757 924,111504 - HEALTH INSURANCE FUND
40113 - MISCELLANEOUS 55,408 21,222 0 0 040138 - DENTAL PREMIUMS 2,110,086 2,299,040 2,163,150 2,163,150 040139 - VISION PREMIUMS 384,255 399,558 419,760 419,760 040140 - MEDICAL PREMIUMS 22,206,353 23,550,113 25,179,500 25,496,802 317,30240143 - UTILITY CLINIC SERVICES 129,901 111,729 105,000 105,000 040144 - CITY CLINIC CO PAY 33,364 36,792 35,700 35,700 040169 - EMPLOYEE ASSIST PROGRAM 18 0 0 0 040170 - HRA BENEFIT 942,736 981,542 0 0 043180 - GAIN LOSS INV MKT VALUE 0 (4,727) 0 0 045665 - COPY FEES 29 0 0 0 046025 - INTEREST 0 4,641 11,162 5,500 (5,662)46153 - TRANSFER FROM OTHER FUNDS 0 311,212 0 0 0
504 - HEALTH INSURANCE FUND Total 25,862,150 27,711,122 27,914,272 28,225,912 311,640505 - OFFICE SERVICES
42605 - ENT FUND UTIL ALLOCATION 243,378 195,265 144,383 186,331 41,94842625 - ENTERPRISE FUND UTIL WORDER 78,288 93,340 80,000 80,000 042630 - POSTAGE 365,417 312,736 350,000 350,000 042632 - RECORDS 54,403 55,087 0 0 042650 - CITY WORKORDERS 117,063 161,401 120,000 120,000 042660 - CITY ALLOCATION 679,180 679,180 651,978 656,594 4,61642710 - OTHER REVENUE 3,554 2,536 5,000 5,000 042720 - OTHER BILLED INVOICES 191,792 200,554 184,500 184,500 042725 - OTHER WORKORDERS 114,515 72,143 102,000 102,000 042750 - CITY INS EXCESS 0 48 0 0 043180 - GAIN LOSS INV MKT VALUE (874) (2,940) 0 0 046025 - INTEREST 2,252 5,338 2,000 6,300 4,300
505 - OFFICE SERVICES Total 1,848,968 1,774,688 1,639,861 1,690,725 50,864506 - RADIO
42660 - CITY ALLOCATION 550,825 995,958 993,665 1,095,273 101,60842720 - OTHER BILLED INVOICES 65,049 100,116 53,780 53,780 042785 - REV SITE LEASES 183,421 155,538 149,623 149,623 042880 - REV PARTS PURCH RESALE 7,499 19,507 0 0 042883 - REV PAGING SYSTEM 38,421 9,252 28,666 33,284 4,61842886 - REV NON CITY SVCS 263,902 208,428 136,723 296,723 160,00043180 - GAIN LOSS INV MKT VALUE (882) (4,030) 0 0 046025 - INTEREST 8,935 9,548 0 10,900 10,900
506 - RADIO Total 1,117,170 1,494,317 1,362,457 1,639,583 277,126601 - CD SMITH SENIOR CENTER TRUST
43180 - GAIN LOSS INV MKT VALUE 23,643 68,939 0 0 044060 - GAIN LOSS ON INVESTMENT 0 (800) 0 0 046025 - INTEREST 131,365 27,598 75,000 75,000 0
601 - CD SMITH SENIOR CENTER TRUST Total 155,008 95,737 75,000 75,000 0605 - CEMETERY ENDOWMENT
41940 - ENDOWMENTS 80,485 77,295 250,000 250,000 044050 - GAIN LOSS ON SALE OF ASSETS (37,752) (250,492) 0 0 044060 - GAIN LOSS ON INVESTMENT (400,250) 344,358 0 0 0
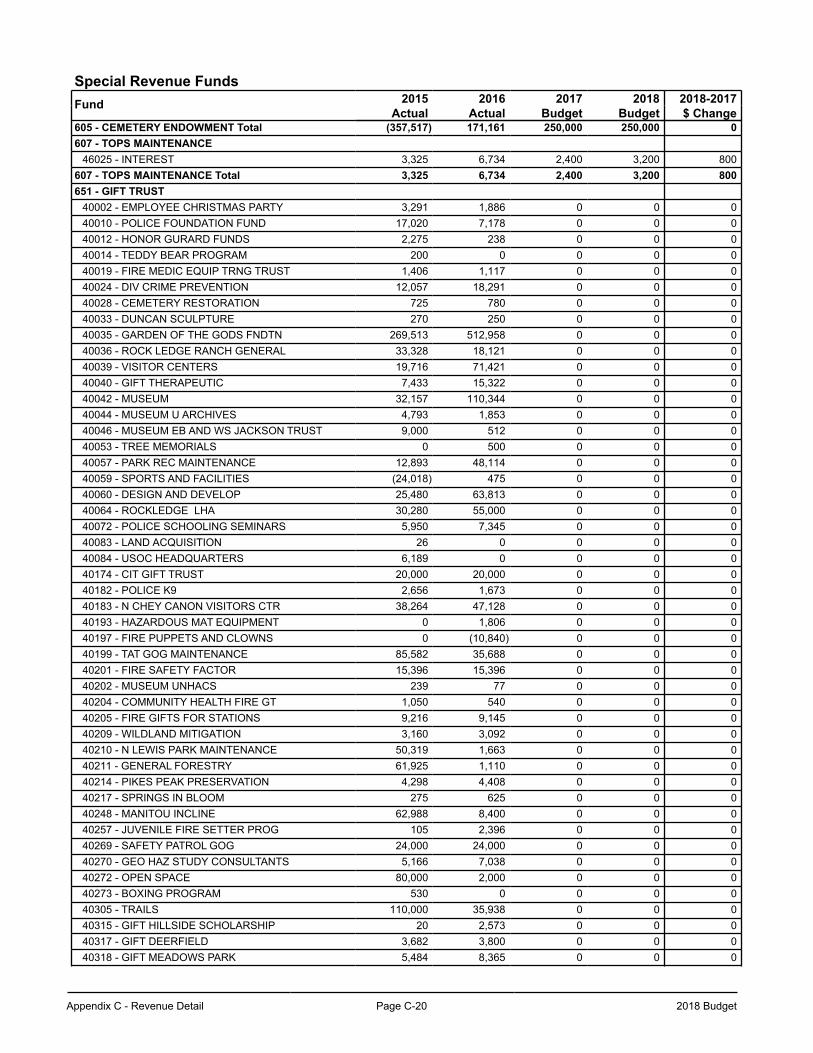
Appendix C - Revenue Detail Page C-20 2018 Budget
Special Revenue FundsFund 2015 2016 2017 2018 2018-2017
Actual Actual Budget Budget $ Change605 - CEMETERY ENDOWMENT Total (357,517) 171,161 250,000 250,000 0607 - TOPS MAINTENANCE
46025 - INTEREST 3,325 6,734 2,400 3,200 800607 - TOPS MAINTENANCE Total 3,325 6,734 2,400 3,200 800651 - GIFT TRUST
40002 - EMPLOYEE CHRISTMAS PARTY 3,291 1,886 0 0 040010 - POLICE FOUNDATION FUND 17,020 7,178 0 0 040012 - HONOR GURARD FUNDS 2,275 238 0 0 040014 - TEDDY BEAR PROGRAM 200 0 0 0 040019 - FIRE MEDIC EQUIP TRNG TRUST 1,406 1,117 0 0 040024 - DIV CRIME PREVENTION 12,057 18,291 0 0 040028 - CEMETERY RESTORATION 725 780 0 0 040033 - DUNCAN SCULPTURE 270 250 0 0 040035 - GARDEN OF THE GODS FNDTN 269,513 512,958 0 0 040036 - ROCK LEDGE RANCH GENERAL 33,328 18,121 0 0 040039 - VISITOR CENTERS 19,716 71,421 0 0 040040 - GIFT THERAPEUTIC 7,433 15,322 0 0 040042 - MUSEUM 32,157 110,344 0 0 040044 - MUSEUM U ARCHIVES 4,793 1,853 0 0 040046 - MUSEUM EB AND WS JACKSON TRUST 9,000 512 0 0 040053 - TREE MEMORIALS 0 500 0 0 040057 - PARK REC MAINTENANCE 12,893 48,114 0 0 040059 - SPORTS AND FACILITIES (24,018) 475 0 0 040060 - DESIGN AND DEVELOP 25,480 63,813 0 0 040064 - ROCKLEDGE LHA 30,280 55,000 0 0 040072 - POLICE SCHOOLING SEMINARS 5,950 7,345 0 0 040083 - LAND ACQUISITION 26 0 0 0 040084 - USOC HEADQUARTERS 6,189 0 0 0 040174 - CIT GIFT TRUST 20,000 20,000 0 0 040182 - POLICE K9 2,656 1,673 0 0 040183 - N CHEY CANON VISITORS CTR 38,264 47,128 0 0 040193 - HAZARDOUS MAT EQUIPMENT 0 1,806 0 0 040197 - FIRE PUPPETS AND CLOWNS 0 (10,840) 0 0 040199 - TAT GOG MAINTENANCE 85,582 35,688 0 0 040201 - FIRE SAFETY FACTOR 15,396 15,396 0 0 040202 - MUSEUM UNHACS 239 77 0 0 040204 - COMMUNITY HEALTH FIRE GT 1,050 540 0 0 040205 - FIRE GIFTS FOR STATIONS 9,216 9,145 0 0 040209 - WILDLAND MITIGATION 3,160 3,092 0 0 040210 - N LEWIS PARK MAINTENANCE 50,319 1,663 0 0 040211 - GENERAL FORESTRY 61,925 1,110 0 0 040214 - PIKES PEAK PRESERVATION 4,298 4,408 0 0 040217 - SPRINGS IN BLOOM 275 625 0 0 040248 - MANITOU INCLINE 62,988 8,400 0 0 040257 - JUVENILE FIRE SETTER PROG 105 2,396 0 0 040269 - SAFETY PATROL GOG 24,000 24,000 0 0 040270 - GEO HAZ STUDY CONSULTANTS 5,166 7,038 0 0 040272 - OPEN SPACE 80,000 2,000 0 0 040273 - BOXING PROGRAM 530 0 0 0 040305 - TRAILS 110,000 35,938 0 0 040315 - GIFT HILLSIDE SCHOLARSHIP 20 2,573 0 0 040317 - GIFT DEERFIELD 3,682 3,800 0 0 040318 - GIFT MEADOWS PARK 5,484 8,365 0 0 0
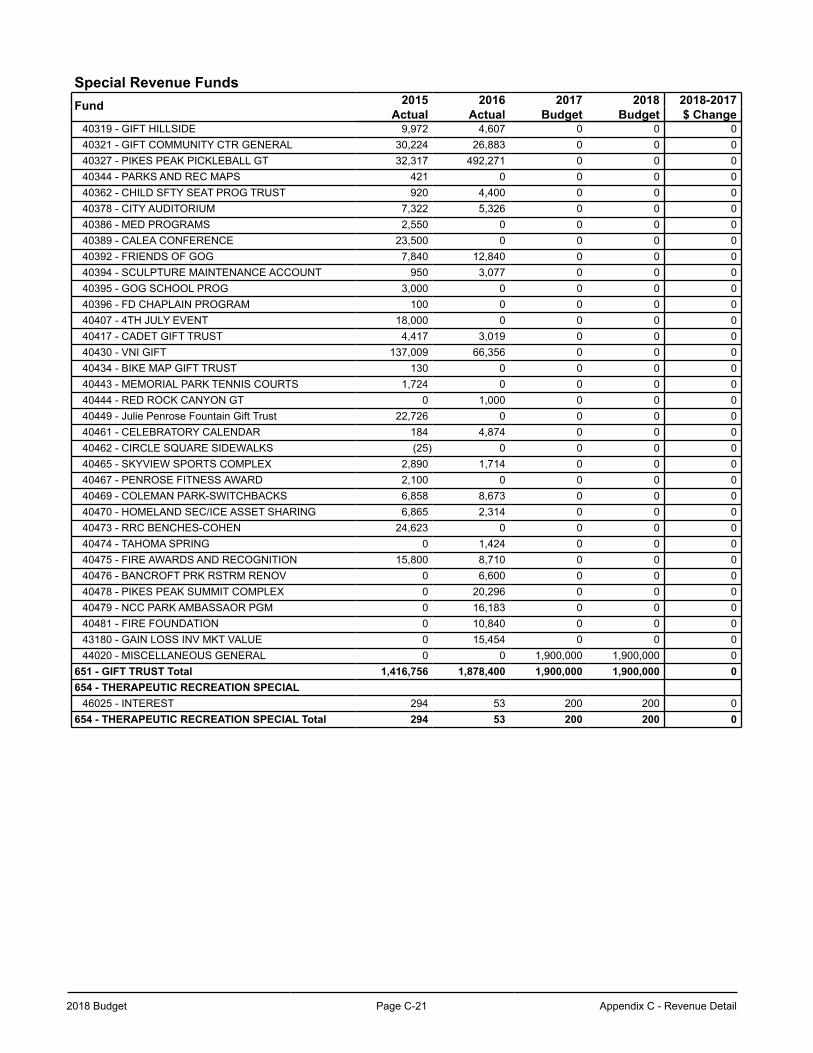
2018 Budget Page C-21 Appendix C - Revenue Detail
Special Revenue FundsFund 2015 2016 2017 2018 2018-2017
Actual Actual Budget Budget $ Change40319 - GIFT HILLSIDE 9,972 4,607 0 0 040321 - GIFT COMMUNITY CTR GENERAL 30,224 26,883 0 0 040327 - PIKES PEAK PICKLEBALL GT 32,317 492,271 0 0 040344 - PARKS AND REC MAPS 421 0 0 0 040362 - CHILD SFTY SEAT PROG TRUST 920 4,400 0 0 040378 - CITY AUDITORIUM 7,322 5,326 0 0 040386 - MED PROGRAMS 2,550 0 0 0 040389 - CALEA CONFERENCE 23,500 0 0 0 040392 - FRIENDS OF GOG 7,840 12,840 0 0 040394 - SCULPTURE MAINTENANCE ACCOUNT 950 3,077 0 0 040395 - GOG SCHOOL PROG 3,000 0 0 0 040396 - FD CHAPLAIN PROGRAM 100 0 0 0 040407 - 4TH JULY EVENT 18,000 0 0 0 040417 - CADET GIFT TRUST 4,417 3,019 0 0 040430 - VNI GIFT 137,009 66,356 0 0 040434 - BIKE MAP GIFT TRUST 130 0 0 0 040443 - MEMORIAL PARK TENNIS COURTS 1,724 0 0 0 040444 - RED ROCK CANYON GT 0 1,000 0 0 040449 - Julie Penrose Fountain Gift Trust 22,726 0 0 0 040461 - CELEBRATORY CALENDAR 184 4,874 0 0 040462 - CIRCLE SQUARE SIDEWALKS (25) 0 0 0 040465 - SKYVIEW SPORTS COMPLEX 2,890 1,714 0 0 040467 - PENROSE FITNESS AWARD 2,100 0 0 0 040469 - COLEMAN PARK-SWITCHBACKS 6,858 8,673 0 0 040470 - HOMELAND SEC/ICE ASSET SHARING 6,865 2,314 0 0 040473 - RRC BENCHES-COHEN 24,623 0 0 0 040474 - TAHOMA SPRING 0 1,424 0 0 040475 - FIRE AWARDS AND RECOGNITION 15,800 8,710 0 0 040476 - BANCROFT PRK RSTRM RENOV 0 6,600 0 0 040478 - PIKES PEAK SUMMIT COMPLEX 0 20,296 0 0 040479 - NCC PARK AMBASSAOR PGM 0 16,183 0 0 040481 - FIRE FOUNDATION 0 10,840 0 0 043180 - GAIN LOSS INV MKT VALUE 0 15,454 0 0 044020 - MISCELLANEOUS GENERAL 0 0 1,900,000 1,900,000 0
651 - GIFT TRUST Total 1,416,756 1,878,400 1,900,000 1,900,000 0654 - THERAPEUTIC RECREATION SPECIAL
46025 - INTEREST 294 53 200 200 0654 - THERAPEUTIC RECREATION SPECIAL Total 294 53 200 200 0

Appendix C - Revenue Detail Page C-22 2018 Budget
This page left blank intentionally.
2018 Budget Page D-1 Appendix D - Glossary of Terms
Glossary of TermsAccrual Basis of Accounting – The basis of accounting that records revenue at the time earned and expenses when incurred, rather than when collected or paid.
Affordable Care Act – On March 23, 2010, President Obama signed comprehensive health reform, the Patient Protection and Affordable Care Act, into law. The law, and changes made to the law by subsequent legislation, focuses on provisions to expand coverage, control health care costs, and improve health care delivery system. Due to the complexity of the changes, requirements have been phased in over the last 4 years and additional requirements must be met for 2015 and beyond.
Allocated Administrative Costs – Allocates the cost of general administrative departments that are required to manage the City and provide support to all funds.
Annual Budget – A plan for the coordination of resources and expenditures. The budget is the financial plan for the City's allocation of resources to provide services, accomplish the City's goals and objectives, and perform activities.
Appropriation – The legal authorization given by City Council to spend funds that have been designated for a specific purpose.
American Recovery and Reinvestment Act – The American Recovery and Reinvestment Act (ARRA) was instituted in February of 2009 as a direct response to the economic crisis. This funding was designed to stimulate economic activity and long-term growth, create and retain jobs, and provide transparency for government spending.
Arterial Roadway Fund – Fees paid by landowners provide funding for the cost of constructing/ expanding freeway, expressway, and major or minor arterial roadway bridges.
Assigned Fund Balance – This describes the portion of fund balance that reflects the City’s intended use of resources. This authority rests with the Mayor and is delegated to staff through the use of encumbrances.
Balanced Budget – A budget in which revenue sources are identified to balance with expenditures for services provided in a specific fiscal year.
Ballfield Capital Improvements Fund – Fees paid by softball and baseball teams upon league registration provide funding for maintenance and improvements to baseball and softball fields throughout the city.
Banning Lewis Ranch Fund – General Annexor Obligation Fee, BLR Parkway, or Interchange Fees provide funding to reimburse those annexors who construct shared infrastructure or who fulfill Annexation Agreement obligations identified as reimbursable shared obligations within the BLR Annexor Shared Infrastructure Study.
Basis of Accounting – The City’s annual budget is developed using the generally accepted accounting principles (GAAP) and the budgetary basis of accounting. GAAP is determined on a modified accrual basis and budgetary is determined on an accrual basis.
Beginning Fund Balance – The unexpended amount in a fund at fiscal year-end that is available for appropriation in the next fiscal year.
Bicycle Tax Fund – A sales tax on the purchase of all new and used bicycles purchased in the city provides funding for maintenance repair and expansion of the city’s bikeway system.
Business Improvement District (BID) – District created under Colorado Revised Statutes § 31-25-1201 et. seq. to finance public improvements and/or provide services within identified primarily non-residential areas. BIDs typically derive most of their revenue from a property tax, and they have the authority to issue debt.
Cable Franchise – Pursuant to franchise agreements approved by City Council, cable subscriber fees provide funding to the City for information technology strategic needs; to Southern Colorado Educational Televisions Consortium (SCETC) to continue operating their network and production truck; and to SpringsTV for implementation, equipment maintenance, staffing and communication needs.
Appendix D - Glossary of Terms Page D-2 2018 Budget
Capital Improvement – A project of relatively high monetary value (at least $50,000), long life (at least five years), and the outcome of the project results in the creation of a fixed asset or a significant revitalization that upgrades and extends the useful life of a fixed asset.
Capital Improvements Program (CIP) – An annual updated plan of capital expenditures for public facilities and infrastructure (buildings, streets, etc.) with estimated costs, sources of funding, and schedule of work over a five-year period. A five-year plan is included as required by the Charter.
Capital Outlay – A major object category that includes expenditures for land purchase, buildings (purchase or construction), improvements other than building (purchase or construction), or equipment and furniture with a unit cost in excess of $500.
Certificates of Participation (COPs) – A type of financing in which an investor purchases a share of the lease revenue of an agreement made by a municipal or governmental entity, rather than the bond being secured by those revenue.
City Health Foundation – Lease payments made to the City’s Memorial Health System Fund by the University of Colorado Health system provide funding to the City Health Foundation to address health issues in the City of Colorado Springs.
Committed Fund Balance – This represents the portion of fund balance whose use is constrained by limitations that the City imposes on itself by City Council (highest decision making level) and remains binding unless removed in the same manner. The City does not use committed funds in its normal course of business.
• Requires action by City Council to commit fund balance• Formal City Council action is necessary to impose, remove or modify a constraint reflected in the
committed fund balance
Community Development Block Grant (CDBG) – Federal grant funds dedicated for programs and activities which primarily benefit low and moderate-income families, individuals, and neighborhoods. Programs include but are not limited to housing rehabilitation, affordable housing development and preservation, human service activities, and capital improvement activities.
Comprehensive Annual Financial Report (CAFR) – This report is commonly known as the annual Audit and is completed by an independent certified public accounting firm for the Finance Department. It contains information regarding all general-purpose financial statements for revenue and expenditures, selected financial and demographic information, and amortization of long-term debt and selected investment portfolio data.
Conservation Trust Fund (CTF) – This fund provides funding that can be used for the acquisition, development, and maintenance of new conservation sites or for capital improvements or maintenance for recreational purposes on any public site. This fund gets its money from the Colorado Lottery.
Contingency – An account established for the purpose of meeting unanticipated requirements.
Cost Allocation Plan – A cost allocation plan is a financial model that identifies and distributes citywide indirect costs to benefiting departments. These indirect costs are those expenses that benefit multiple departments, programs, or activities. Examples of these indirect costs include Accounting, Human Resources, and Information Technology.
Debt Service – Payment of interest and principal on an obligation resulting from the issuance of bonds.
Development Authority – The Colorado Springs Downtown Development Authority, which has been created under Colorado Revised Statutes § 31-25-801 et. seq. to provide public facilities and service specific to an identified downtown area. DDAs have the authority to levy property taxes, issue debt and utilize tax increment financing (TIF).
Efficiency – A ratio between input (resources) and output (production).
Emergency Shelter Act Grant (ESG) – Federal grant funds dedicated for programs and activities which primarily benefit low and moderate-income families, individuals, and neighborhoods. Programs include but are not limited to housing rehabilitation, affordable housing development and preservation, human service activities, and capital improvement activities.
Enterprise Fund – A fund that pays for its costs of operations, predominantly from user fees, and does not generally receive property tax support.
2018 Budget Page D-3 Appendix D - Glossary of Terms
Expenditure – The actual outlay of or obligation to pay cash.
FDC – Fire Department Complex
Fiscal Year – A 12-month period at the beginning of which the City implements a new budget based on expected revenue and expenditures and at the end of which the City determines its financial positions and the results of its operations. The City of Colorado Springs' fiscal year coincides with the calendar year January 1 through December 31.
Full-Time Equivalent (FTE) – 40-hour per week position on an ongoing basis that is specifically authorized for ongoing funding by classification in the annual budget. Two half-time positions equal one FTE.
Fund – A budgetary and fiscal accounting mechanism for designating a sum of money or other resources set aside for the purpose of providing services and achieving objectives in accordance with state and local laws, regulations, or other limitations. Each fund constitutes an independent budgetary, fiscal, and accounting entity.
Fund Balance – The balance remaining in a fund after expenditures have been subtracted from revenue.
Geographic Information System (GIS) – A computer-based mapping and analytical tool. GIS technology integrates common database operations such as query and statistical analysis with the unique visualization and geographic analysis benefits offered by maps. These abilities distinguish GIS from other information systems and make it valuable to a wide range of public and private enterprises for explaining events, predicting outcomes, and planning strategies.
General Fund – A fund used to account for all general purpose activities of the City supported by City taxes and other non-dedicated revenue such as license and permit fees, user charges, etc. This fund includes all traditional municipal expenditures such as Public Safety, Parks, and Transportation with the exception of those accounted for elsewhere.
General Improvement District (GID) – District created under Colorado Revised Statutes § 31-25-601 et. seq. to finance public improvements in commercial or residential areas. GIDs are governed by City Council as their ex officio board. They ordinarily derive their revenue from a property tax, and they have the authority to issue debt.
General Obligation Bonds (GO Bonds) – These bonds are typically issued to finance government improvements benefiting the community as a whole and are secured by an unlimited tax levy of the issuer.
Gift Trust Fund – Donations made to the City by private individuals or businesses provide funding for the specific purpose designated by the donor.
Goals – A defined goal of a department/division objective with outcomes measured or completed by a determined time frame that achieve the Mayor’s goals for the City.
Government Finance Officers Association (GFOA) – The purpose of the GFOA is to enhance and promote the professional management of governments for the public benefit by identifying and developing financial policies and best practices and promoting their use through education, training, facilitation of member networking, and leadership.
Grants Fund – Various grants as well as any anticipated interest earnings including SAFETEA-LU and FTA grant funds, among others, provide funding for grant activities as approved by City Council, plus interest earnings for those grants eligible to earn and spend interest income.
Highway Users Tax Fund (HUTF) – A State fund that receives revenue from the State-imposed excise taxes on gasoline and special fuels as well as various motor vehicle registration, title, and license fees and taxes.
Home Investment Partnership Act (HOME) – Federal grant funds dedicated for programs and activities which primarily benefit low and moderate-income families, individuals, and neighborhoods. Programs include but are not limited to housing rehabilitation, affordable housing development and preservation, human service activities, and capital improvement activities.
HOPE III – Federal grant funds dedicated for home ownership programs to benefit low and moderate-income families.
Human Services – These programs address emergency care and shelter, youth, and self-sufficiency services. The City currently funds these community programs with the City’s General Fund and Community Development Block Grant (CDBG) funds.
Appendix D - Glossary of Terms Page D-4 2018 Budget
Infrastructure – The underlying foundation or basic framework of the City’s physical assets, buildings, roadways, etc.
Internal Service Funds – Internal Service Funds are used to account for the financing of goods or services provided by one department to other City departments on a cost-reimbursement basis. The divisions include Fleet, Office Services, and Radio.
Key Measures – An indicator that measures the degree of accomplishment of a department’s or division’s mission. The major types are as follows:
Output Measure - A quantity of work performedEfficiency Measure - A ratio of the amount of input (or cost) to the amount of output (or outcome)Outcome Measure - Events, occurrences, or conditions that indicate progress towards achievement of
the mission and objectives of a program
Lease-Purchase Agreement – An agreement between the governmental agency and a private sector vendor to purchase or lease equipment or facilities rather than purchase them outright.
Level of Effort – The level of funding the City committed to maintain for public safety, transportation-related maintenance, and transit after the passage of the Public Safety Sales Tax (PSST) in November 2001 and the Pikes Peak Rural Transportation Authority (PPRTA) in November 2004.
Levy – The total amount of taxes, special assessments, or service charges imposed by a government.
Local Improvement District (LID) – District authorized under City Code (Chapter 3, Article 5) for the purpose of assessing certain properties in order to finance specified public improvements that benefit them. LIDs are component entities of the City and its budget.
Lodgers and Automobile Rental Tax (LART) Fund – Revenue resulting from the City’s 2% lodging and 1% automobile rental tax are deposited into the LART Fund. Revenue not otherwise obligated may be used for the acquisition, construction, maintenance, and operation of public infrastructure or public improvements; which constitute, in part, visitor or tourist attractions. Revenue may also be appropriated for economic development activities as determined by City Council.
Lottery – See Conservation Trust Fund.
Memorial Health System Enterprise Fund – Lease payments received from University of Colorado Health system provide funding to the City Health Foundation to address health issues in the City of Colorado Springs.
Metropolitan District – A district with two or more purposes created under Colorado Revised Statutes § 32-1-101 et. seq. for commercial or residential areas and chartered by a service plan approved by City Council. Subject to the service plan, metropolitan districts have broad potential authorities including the levying of property taxes, issuance of debt for public improvements, and operations and maintenance.
Mill – A mill is equal to one one-thousandth (1/1,000) of a dollar of assessed valuation of property.
Modified Accrual Basis of Accounting – A type of accounting which records revenue when measurable and available and expenses when the liability is incurred.
Municipal Separate Storm Sewer System (MS4) Permit (aka Municipal Stormwater Discharge Permit) – In response to the impacts of urbanization on Water Quality, the United States Congress passed the Clean Water Act of 1972, as amended, which prohibits the discharge of pollutants into waters of the United States unless said discharges are compliant with a National Pollutant Discharge Elimination System (NPDES) permit. The City of Colorado Springs was issued a municipal stormwater discharge permit from the Colorado Department of Public Health and Environment (CDPHE) on October 12, 1997, which allows the City to convey stormwater through its Municipal Separate Storm Sewer Systems (MS4s).
Objective – A desired result of a group of related activities performed by a department or division in which the achievement satisfies part or all of the department’s or division’s mission.
Old City Hall – Until December 1997, this facility was the location of the Municipal Court operations. Funding was obtained in 2000 to renovate this historic building for occupancy late in 2001. The building houses the City Council and the City Auditor’s Office.
2018 Budget Page D-5 Appendix D - Glossary of Terms
Operating Budget – The annual expenditures for the routine, ongoing activities and work program of a department or division as opposed to budgets which may also be established for capital projects, grant-funded projects, and other activities of a nonpermanent nature.
Outsourcing – Contracting with private companies to provide the same level of services while reducing personnel costs.
Overmatch Funding – The Pikes Peak Area of Council Governments (PPACG) engages in a process to prioritize projects for state and federal transportation funding; and in 2007, an overmatch component was added. Overmatch is funding in excess of the required match (typically 20%) that local communities are willing to put toward their high priority transportation-related projects. Because there is reduced state and federal funding available, competition for these funds is greater. In order to get the most projects with the available state and federal funds, PPACG now considers overmatch funds when determining where these dollars will be dedicated.
Park Land Dedication Ordinance (PLDO) – Commonly referred to as PLDO for the City Council ordinance (City Code 7.7.12) that provides for the policy and fees paid by developers in lieu of land dedication for the development of parks and open space in new subdivisions.
Pay-as-You-Go for Capital Improvements – A process in which capital improvements are paid from current revenue.
Permanent Funds – These funds account for assets held by the City in a trustee capacity or as an agent for other agencies, individuals, private organizations, or governmental units. Included in this category are non-expendable trust funds and agency funds.
POC – Police Operations Center
PPRDC – Pikes Peak Regional Development Center
Pikes Peak Rural Transportation Authority (PPRTA) – Authority approved by voters in November 2004, which resulted in a 1% sales and use tax increase effective January 1, 2005, for the City of Colorado Springs, the unincorporated areas of El Paso County, Manitou Springs, Green Mountain Falls, and the Town of Ramah to fund transportation capital projects and maintenance. In November 2012, Voters approved an extension of PPRTA to 2024. PPRTA may be also referenced as RTA throughout the Budget document.
Public Safety Sales Tax Fund (PSST) – On November 6, 2001, voters approved Ballot Question 4, which authorized a City of Colorado Springs Sales and Use Tax rate increase of 0.4% to be used to fund public safety operating and capital improvement needs.
Public Space and Development Fund – The fund for collection of fees paid by developers in lieu of land dedication for the development parks and open space in new subdivisions (commonly referred to as PLDO).
Rebudgeted Revenue – The amount of revenue from the previous year due to the receipt of unbudgeted revenue and/or the receipt of revenue exceeding the budgeted amount.
Restricted Fund Balance – This represents the portion of fund balance that is subject to externally enforceable legal restrictions. Such restrictions are typically imposed by parties altogether outside the City such as creditors, grantors, contributors or other governments. Restrictions can also arise when the authorization to raise revenues is conditioned upon the revenue being used for a particular purpose.
Retailers Fee – The reimbursement for sales tax collections. This was budgeted for the first time in 2006 and is the result of an accounting change. This expenditure is offset by a matching increase in revenue. This is also referred to as the Vendors Fee.
Revenue – Money received by the City during the fiscal year, which includes taxes, fees, charges, special assessments, grants, and other funds collected that support the services the City provides.
Revenue Bonds – Bonds issued by a public agency authorized to build, acquire, or improve a revenue-producing property and payable out of revenue derived from such property.
Road and Bridge Tax – A County fund that receives revenue from all taxable property located within the county (El Paso County) and subsequently disburses the allotted share to the municipalities located within the county for the specific purpose of construction and maintenance of roads and streets located within its corporate boundaries (see Colorado Revised Statues [C.R.S. 43-2-202, 203]).
Appendix D - Glossary of Terms Page D-6 2018 Budget
RTA – See PPRTA.
Safe, Accountable, Flexible, Efficient Transportation Equity Act-Legacy for Users (SAFETEA-LU) – The federal and state governments provide grants to local governments for approved regional transportation-related projects such as bridge replacement, installation of additional traffic signals, road widening, etc. These grants usually award 80% of the total project cost - provided the City can fund the local 20% share. This program was originally authorized in 1996 and was called the Intermodal Surface Transportation Efficiency Act (ISTEA). It was then reauthorized as the Transportation Equity Act for the 21st Century (TEA-21) in 1998 and reauthorized again in 2004 as SAFETEA-LU.
Sales Tax Revenue Bonds – Those bonds issued to finance various capital improvement projects that have a definable revenue base. These bonds are secured by the City Sales Tax revenue.
Special District – A general term intended to encompass a variety of special purpose districts including but not limited to metropolitan districts, general improvement districts (GIDs), business improvement districts (BIDs), limited improvement districts (LIDs), and special improvement maintenance districts (SIMDs).
Special Improvement Maintenance District (SIMD) – District authorized under City Code (Chapter 3, Article 7) formed primarily by developers and business owners to provide for maintenance of public improvements of general benefit to the residents or owners within their boundaries. Most SIMDs levy a property tax, and they cannot issue debt.
Special Revenue Funds – Special Revenue Funds are used to account for the proceeds of specific revenue sources (other than major capital projects) that are legally restricted to expenditures for specific purposes.
Springs Community Improvements Program (SCIP) – A capital improvements process implemented in 1998 that engaged citizens in identifying, prioritizing, and funding over $110 million in infrastructure projects to improve the community.
Strategic Plans (previously known as the Strategic Action Plan) – The Mayor’s Strategic Plan is comprised of goals and objectives that set priorities for resource allocation, establishes policy guidelines, and provides governance direction. Also as directed in the City Charter, each year, City Council determines its areas of priority for the following year and provides them to the Mayor for consideration in the development of the municipal budget.
Street Tree Fund – Owner and developer fees collected at the time a building permit is issued along with a City match provide funding for a program to plant and care for new trees in previously underdeveloped lots.
Subdivision Drainage Fund – Fees charged to subdivision developers provide funding for the construction of storm sewers and other facilities in the designated subdivision for the drainage and flood control of surface water.
Surplus Utility Revenue – In accordance with the City Charter, surplus revenue generated by sales of electric and gas services inside the City shall be transferred to the City’s General Fund.
TABOR (Taxpayer’s Bill of Rights) – An amendment to the Colorado Constitution (also referred to as Amendment I) approved by voters in 1992 that essentially limits annual growth in local government revenue to the combined percentage change in the Denver/Boulder/Greeley Consumer Price Index (CPI) and the net change in the local property tax base due to new construction. Revenue received above and beyond the annual revenue cap established by TABOR must either be refunded to city residents or retained upon voter approval.
Tax Increment Financing (TIF) – Tax increment financing is a method of redistributing tax collections within a designated area to finance public infrastructure improvements within the specified geographic area. Infrastructure improvements may include upgraded on-site drainage systems, adjacent intersection/roadway capacity/pedestrian improvements, etc.
Trails, Open Space, Parks (TOPS) Initiative – The Trails, Open Space, and Parks (TOPS) revenue is generated from a 0.1% sales and use tax adopted by voters in April 1997, extended by voters in 2003, and set to expire in 2025. The majority of funds are designated for open space purchases and associated maintenance, development and maintenance of trails, and development and maintenance of parks.
Unrestricted Fund Balance –The GFOA recommended, at a minimum, that general-purpose governments, regardless of size, incorporate in its financial policies that unrestricted fund balance in their general fund be no less than two months of regular General Fund operating revenues or regular General Fund operating expenditures. The City’s goal target range for General Fund Reserve – Unrestricted Fund Balance is 16.67 % to
2018 Budget Page D-7 Appendix D - Glossary of Terms
25% of the following year’s expenditure budget. The target for the unrestricted General Fund balance would exclude the TABOR emergency reserves but include other categories of fund balance that are committed, assigned or unassigned.
User Fees – The payment of a fee for direct receipt of a public service by the person benefiting from the service.
Utilities Staff Share – The portion of a General Fund function, department, or unit cost chargeable to Colorado Springs Utilities.
Vendors Fee – See Retailers Fee.

Appendix D - Glossary of Terms Page D-8 2018 Budget
This page left blank intentionally.
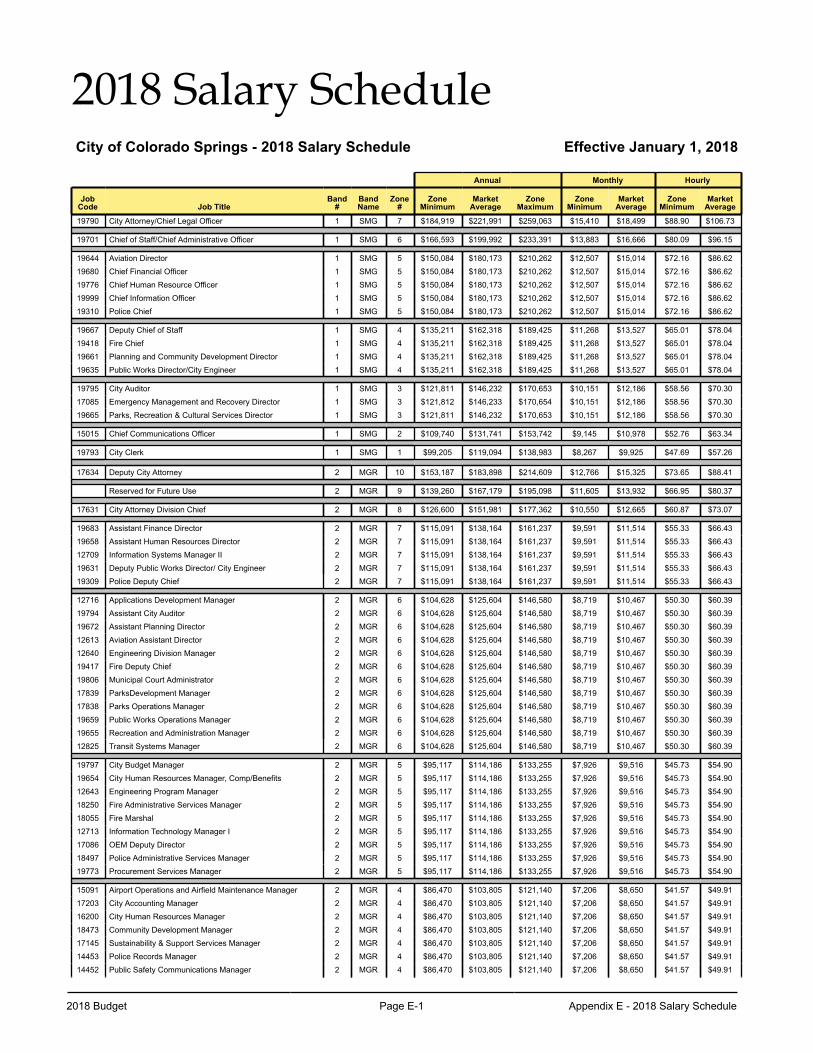
2018 Budget Page E-1 Appendix E - 2018 Salary Schedule
2018 Salary ScheduleCity of Colorado Springs - 2018 Salary Schedule Effective January 1, 2018
Annual Monthly Hourly
JobCode Job Title
Band#
BandName
Zone#
ZoneMinimum
MarketAverage
ZoneMaximum
ZoneMinimum
MarketAverage
ZoneMinimum
MarketAverage
19790 City Attorney/Chief Legal Officer 1 SMG 7 $184,919 $221,991 $259,063 $15,410 $18,499 $88.90 $106.73
19701 Chief of Staff/Chief Administrative Officer 1 SMG 6 $166,593 $199,992 $233,391 $13,883 $16,666 $80.09 $96.15
19644 Aviation Director 1 SMG 5 $150,084 $180,173 $210,262 $12,507 $15,014 $72.16 $86.62
19680 Chief Financial Officer 1 SMG 5 $150,084 $180,173 $210,262 $12,507 $15,014 $72.16 $86.62
19776 Chief Human Resource Officer 1 SMG 5 $150,084 $180,173 $210,262 $12,507 $15,014 $72.16 $86.62
19999 Chief Information Officer 1 SMG 5 $150,084 $180,173 $210,262 $12,507 $15,014 $72.16 $86.62
19310 Police Chief 1 SMG 5 $150,084 $180,173 $210,262 $12,507 $15,014 $72.16 $86.62
19667 Deputy Chief of Staff 1 SMG 4 $135,211 $162,318 $189,425 $11,268 $13,527 $65.01 $78.04
19418 Fire Chief 1 SMG 4 $135,211 $162,318 $189,425 $11,268 $13,527 $65.01 $78.04
19661 Planning and Community Development Director 1 SMG 4 $135,211 $162,318 $189,425 $11,268 $13,527 $65.01 $78.04
19635 Public Works Director/City Engineer 1 SMG 4 $135,211 $162,318 $189,425 $11,268 $13,527 $65.01 $78.04
19795 City Auditor 1 SMG 3 $121,811 $146,232 $170,653 $10,151 $12,186 $58.56 $70.30
17085 Emergency Management and Recovery Director 1 SMG 3 $121,812 $146,233 $170,654 $10,151 $12,186 $58.56 $70.30
19665 Parks, Recreation & Cultural Services Director 1 SMG 3 $121,811 $146,232 $170,653 $10,151 $12,186 $58.56 $70.30
15015 Chief Communications Officer 1 SMG 2 $109,740 $131,741 $153,742 $9,145 $10,978 $52.76 $63.34
19793 City Clerk 1 SMG 1 $99,205 $119,094 $138,983 $8,267 $9,925 $47.69 $57.26
17634 Deputy City Attorney 2 MGR 10 $153,187 $183,898 $214,609 $12,766 $15,325 $73.65 $88.41
Reserved for Future Use 2 MGR 9 $139,260 $167,179 $195,098 $11,605 $13,932 $66.95 $80.37
17631 City Attorney Division Chief 2 MGR 8 $126,600 $151,981 $177,362 $10,550 $12,665 $60.87 $73.07
19683 Assistant Finance Director 2 MGR 7 $115,091 $138,164 $161,237 $9,591 $11,514 $55.33 $66.43
19658 Assistant Human Resources Director 2 MGR 7 $115,091 $138,164 $161,237 $9,591 $11,514 $55.33 $66.43
12709 Information Systems Manager II 2 MGR 7 $115,091 $138,164 $161,237 $9,591 $11,514 $55.33 $66.43
19631 Deputy Public Works Director/ City Engineer 2 MGR 7 $115,091 $138,164 $161,237 $9,591 $11,514 $55.33 $66.43
19309 Police Deputy Chief 2 MGR 7 $115,091 $138,164 $161,237 $9,591 $11,514 $55.33 $66.43
12716 Applications Development Manager 2 MGR 6 $104,628 $125,604 $146,580 $8,719 $10,467 $50.30 $60.39
19794 Assistant City Auditor 2 MGR 6 $104,628 $125,604 $146,580 $8,719 $10,467 $50.30 $60.39
19672 Assistant Planning Director 2 MGR 6 $104,628 $125,604 $146,580 $8,719 $10,467 $50.30 $60.39
12613 Aviation Assistant Director 2 MGR 6 $104,628 $125,604 $146,580 $8,719 $10,467 $50.30 $60.39
12640 Engineering Division Manager 2 MGR 6 $104,628 $125,604 $146,580 $8,719 $10,467 $50.30 $60.39
19417 Fire Deputy Chief 2 MGR 6 $104,628 $125,604 $146,580 $8,719 $10,467 $50.30 $60.39
19806 Municipal Court Administrator 2 MGR 6 $104,628 $125,604 $146,580 $8,719 $10,467 $50.30 $60.39
17839 ParksDevelopment Manager 2 MGR 6 $104,628 $125,604 $146,580 $8,719 $10,467 $50.30 $60.39
17838 Parks Operations Manager 2 MGR 6 $104,628 $125,604 $146,580 $8,719 $10,467 $50.30 $60.39
19659 Public Works Operations Manager 2 MGR 6 $104,628 $125,604 $146,580 $8,719 $10,467 $50.30 $60.39
19655 Recreation and Administration Manager 2 MGR 6 $104,628 $125,604 $146,580 $8,719 $10,467 $50.30 $60.39
12825 Transit Systems Manager 2 MGR 6 $104,628 $125,604 $146,580 $8,719 $10,467 $50.30 $60.39
19797 City Budget Manager 2 MGR 5 $95,117 $114,186 $133,255 $7,926 $9,516 $45.73 $54.90
19654 City Human Resources Manager, Comp/Benefits 2 MGR 5 $95,117 $114,186 $133,255 $7,926 $9,516 $45.73 $54.90
12643 Engineering Program Manager 2 MGR 5 $95,117 $114,186 $133,255 $7,926 $9,516 $45.73 $54.90
18250 Fire Administrative Services Manager 2 MGR 5 $95,117 $114,186 $133,255 $7,926 $9,516 $45.73 $54.90
18055 Fire Marshal 2 MGR 5 $95,117 $114,186 $133,255 $7,926 $9,516 $45.73 $54.90
12713 Information Technology Manager I 2 MGR 5 $95,117 $114,186 $133,255 $7,926 $9,516 $45.73 $54.90
17086 OEM Deputy Director 2 MGR 5 $95,117 $114,186 $133,255 $7,926 $9,516 $45.73 $54.90
18497 Police Administrative Services Manager 2 MGR 5 $95,117 $114,186 $133,255 $7,926 $9,516 $45.73 $54.90
19773 Procurement Services Manager 2 MGR 5 $95,117 $114,186 $133,255 $7,926 $9,516 $45.73 $54.90
15091 Airport Operations and Airfield Maintenance Manager 2 MGR 4 $86,470 $103,805 $121,140 $7,206 $8,650 $41.57 $49.91
17203 City Accounting Manager 2 MGR 4 $86,470 $103,805 $121,140 $7,206 $8,650 $41.57 $49.91
16200 City Human Resources Manager 2 MGR 4 $86,470 $103,805 $121,140 $7,206 $8,650 $41.57 $49.91
18473 Community Development Manager 2 MGR 4 $86,470 $103,805 $121,140 $7,206 $8,650 $41.57 $49.91
17145 Sustainability & Support Services Manager 2 MGR 4 $86,470 $103,805 $121,140 $7,206 $8,650 $41.57 $49.91
14453 Police Records Manager 2 MGR 4 $86,470 $103,805 $121,140 $7,206 $8,650 $41.57 $49.91
14452 Public Safety Communications Manager 2 MGR 4 $86,470 $103,805 $121,140 $7,206 $8,650 $41.57 $49.91
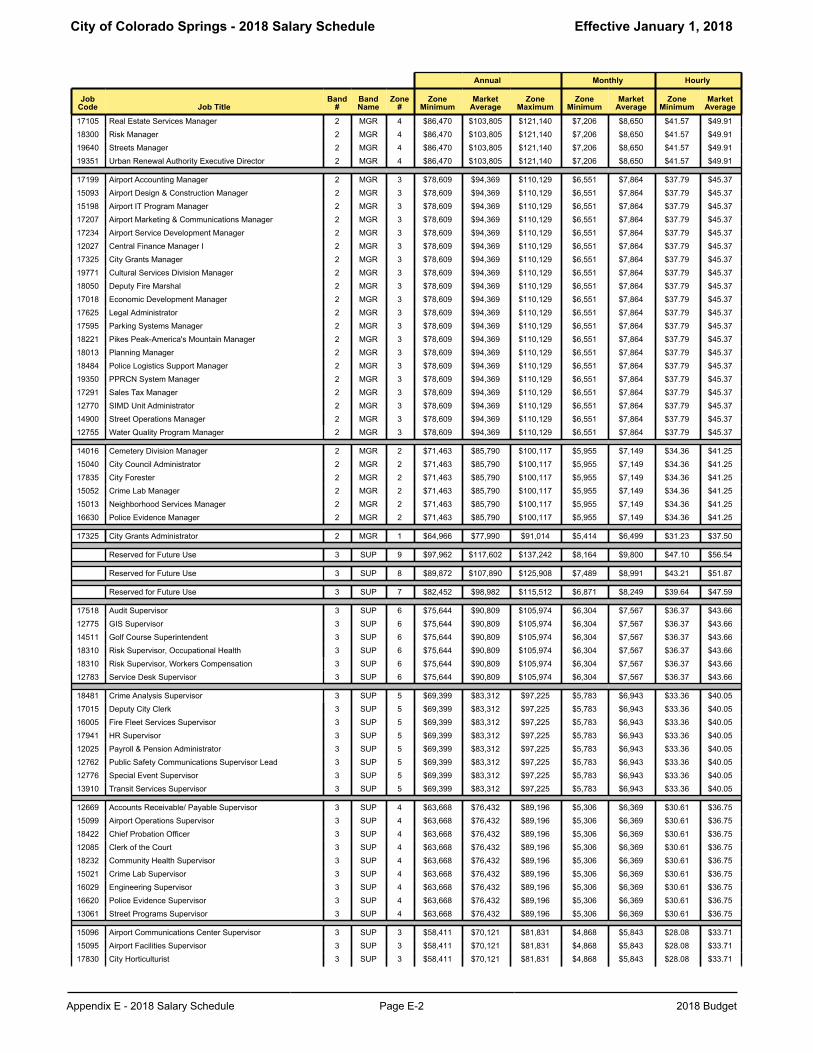
City of Colorado Springs - 2018 Salary Schedule Effective January 1, 2018
Appendix E - 2018 Salary Schedule Page E-2 2018 Budget
Annual Monthly Hourly
JobCode Job Title
Band#
BandName
Zone#
ZoneMinimum
MarketAverage
ZoneMaximum
ZoneMinimum
MarketAverage
ZoneMinimum
MarketAverage
17105 Real Estate Services Manager 2 MGR 4 $86,470 $103,805 $121,140 $7,206 $8,650 $41.57 $49.91
18300 Risk Manager 2 MGR 4 $86,470 $103,805 $121,140 $7,206 $8,650 $41.57 $49.91
19640 Streets Manager 2 MGR 4 $86,470 $103,805 $121,140 $7,206 $8,650 $41.57 $49.91
19351 Urban Renewal Authority Executive Director 2 MGR 4 $86,470 $103,805 $121,140 $7,206 $8,650 $41.57 $49.91
17199 Airport Accounting Manager 2 MGR 3 $78,609 $94,369 $110,129 $6,551 $7,864 $37.79 $45.37
15093 Airport Design & Construction Manager 2 MGR 3 $78,609 $94,369 $110,129 $6,551 $7,864 $37.79 $45.37
15198 Airport IT Program Manager 2 MGR 3 $78,609 $94,369 $110,129 $6,551 $7,864 $37.79 $45.37
17207 Airport Marketing & Communications Manager 2 MGR 3 $78,609 $94,369 $110,129 $6,551 $7,864 $37.79 $45.37
17234 Airport Service Development Manager 2 MGR 3 $78,609 $94,369 $110,129 $6,551 $7,864 $37.79 $45.37
12027 Central Finance Manager I 2 MGR 3 $78,609 $94,369 $110,129 $6,551 $7,864 $37.79 $45.37
17325 City Grants Manager 2 MGR 3 $78,609 $94,369 $110,129 $6,551 $7,864 $37.79 $45.37
19771 Cultural Services Division Manager 2 MGR 3 $78,609 $94,369 $110,129 $6,551 $7,864 $37.79 $45.37
18050 Deputy Fire Marshal 2 MGR 3 $78,609 $94,369 $110,129 $6,551 $7,864 $37.79 $45.37
17018 Economic Development Manager 2 MGR 3 $78,609 $94,369 $110,129 $6,551 $7,864 $37.79 $45.37
17625 Legal Administrator 2 MGR 3 $78,609 $94,369 $110,129 $6,551 $7,864 $37.79 $45.37
17595 Parking Systems Manager 2 MGR 3 $78,609 $94,369 $110,129 $6,551 $7,864 $37.79 $45.37
18221 Pikes Peak-America's Mountain Manager 2 MGR 3 $78,609 $94,369 $110,129 $6,551 $7,864 $37.79 $45.37
18013 Planning Manager 2 MGR 3 $78,609 $94,369 $110,129 $6,551 $7,864 $37.79 $45.37
18484 Police Logistics Support Manager 2 MGR 3 $78,609 $94,369 $110,129 $6,551 $7,864 $37.79 $45.37
19350 PPRCN System Manager 2 MGR 3 $78,609 $94,369 $110,129 $6,551 $7,864 $37.79 $45.37
17291 Sales Tax Manager 2 MGR 3 $78,609 $94,369 $110,129 $6,551 $7,864 $37.79 $45.37
12770 SIMD Unit Administrator 2 MGR 3 $78,609 $94,369 $110,129 $6,551 $7,864 $37.79 $45.37
14900 Street Operations Manager 2 MGR 3 $78,609 $94,369 $110,129 $6,551 $7,864 $37.79 $45.37
12755 Water Quality Program Manager 2 MGR 3 $78,609 $94,369 $110,129 $6,551 $7,864 $37.79 $45.37
14016 Cemetery Division Manager 2 MGR 2 $71,463 $85,790 $100,117 $5,955 $7,149 $34.36 $41.25
15040 City Council Administrator 2 MGR 2 $71,463 $85,790 $100,117 $5,955 $7,149 $34.36 $41.25
17835 City Forester 2 MGR 2 $71,463 $85,790 $100,117 $5,955 $7,149 $34.36 $41.25
15052 Crime Lab Manager 2 MGR 2 $71,463 $85,790 $100,117 $5,955 $7,149 $34.36 $41.25
15013 Neighborhood Services Manager 2 MGR 2 $71,463 $85,790 $100,117 $5,955 $7,149 $34.36 $41.25
16630 Police Evidence Manager 2 MGR 2 $71,463 $85,790 $100,117 $5,955 $7,149 $34.36 $41.25
17325 City Grants Administrator 2 MGR 1 $64,966 $77,990 $91,014 $5,414 $6,499 $31.23 $37.50
Reserved for Future Use 3 SUP 9 $97,962 $117,602 $137,242 $8,164 $9,800 $47.10 $56.54
Reserved for Future Use 3 SUP 8 $89,872 $107,890 $125,908 $7,489 $8,991 $43.21 $51.87
Reserved for Future Use 3 SUP 7 $82,452 $98,982 $115,512 $6,871 $8,249 $39.64 $47.59
17518 Audit Supervisor 3 SUP 6 $75,644 $90,809 $105,974 $6,304 $7,567 $36.37 $43.66
12775 GIS Supervisor 3 SUP 6 $75,644 $90,809 $105,974 $6,304 $7,567 $36.37 $43.66
14511 Golf Course Superintendent 3 SUP 6 $75,644 $90,809 $105,974 $6,304 $7,567 $36.37 $43.66
18310 Risk Supervisor, Occupational Health 3 SUP 6 $75,644 $90,809 $105,974 $6,304 $7,567 $36.37 $43.66
18310 Risk Supervisor, Workers Compensation 3 SUP 6 $75,644 $90,809 $105,974 $6,304 $7,567 $36.37 $43.66
12783 Service Desk Supervisor 3 SUP 6 $75,644 $90,809 $105,974 $6,304 $7,567 $36.37 $43.66
18481 Crime Analysis Supervisor 3 SUP 5 $69,399 $83,312 $97,225 $5,783 $6,943 $33.36 $40.05
17015 Deputy City Clerk 3 SUP 5 $69,399 $83,312 $97,225 $5,783 $6,943 $33.36 $40.05
16005 Fire Fleet Services Supervisor 3 SUP 5 $69,399 $83,312 $97,225 $5,783 $6,943 $33.36 $40.05
17941 HR Supervisor 3 SUP 5 $69,399 $83,312 $97,225 $5,783 $6,943 $33.36 $40.05
12025 Payroll & Pension Administrator 3 SUP 5 $69,399 $83,312 $97,225 $5,783 $6,943 $33.36 $40.05
12762 Public Safety Communications Supervisor Lead 3 SUP 5 $69,399 $83,312 $97,225 $5,783 $6,943 $33.36 $40.05
12776 Special Event Supervisor 3 SUP 5 $69,399 $83,312 $97,225 $5,783 $6,943 $33.36 $40.05
13910 Transit Services Supervisor 3 SUP 5 $69,399 $83,312 $97,225 $5,783 $6,943 $33.36 $40.05
12669 Accounts Receivable/ Payable Supervisor 3 SUP 4 $63,668 $76,432 $89,196 $5,306 $6,369 $30.61 $36.75
15099 Airport Operations Supervisor 3 SUP 4 $63,668 $76,432 $89,196 $5,306 $6,369 $30.61 $36.75
18422 Chief Probation Officer 3 SUP 4 $63,668 $76,432 $89,196 $5,306 $6,369 $30.61 $36.75
12085 Clerk of the Court 3 SUP 4 $63,668 $76,432 $89,196 $5,306 $6,369 $30.61 $36.75
18232 Community Health Supervisor 3 SUP 4 $63,668 $76,432 $89,196 $5,306 $6,369 $30.61 $36.75
15021 Crime Lab Supervisor 3 SUP 4 $63,668 $76,432 $89,196 $5,306 $6,369 $30.61 $36.75
16029 Engineering Supervisor 3 SUP 4 $63,668 $76,432 $89,196 $5,306 $6,369 $30.61 $36.75
16620 Police Evidence Supervisor 3 SUP 4 $63,668 $76,432 $89,196 $5,306 $6,369 $30.61 $36.75
13061 Street Programs Supervisor 3 SUP 4 $63,668 $76,432 $89,196 $5,306 $6,369 $30.61 $36.75
15096 Airport Communications Center Supervisor 3 SUP 3 $58,411 $70,121 $81,831 $4,868 $5,843 $28.08 $33.71
15095 Airport Facilities Supervisor 3 SUP 3 $58,411 $70,121 $81,831 $4,868 $5,843 $28.08 $33.71
17830 City Horticulturist 3 SUP 3 $58,411 $70,121 $81,831 $4,868 $5,843 $28.08 $33.71
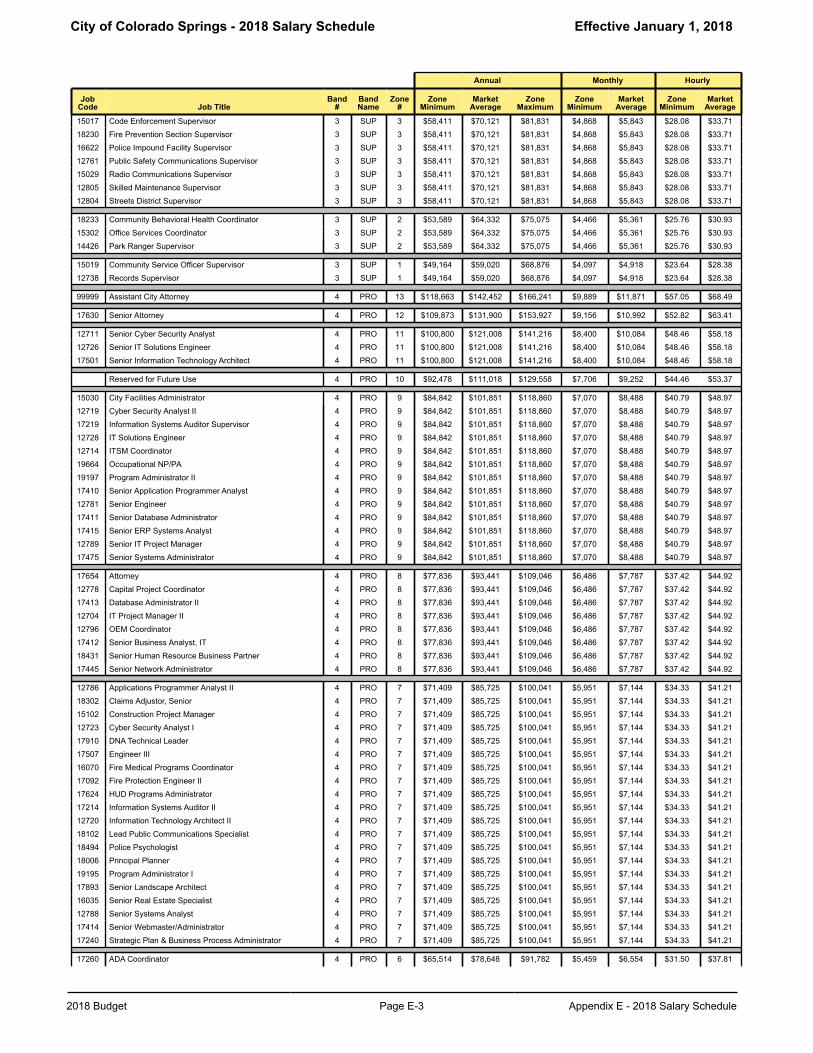
City of Colorado Springs - 2018 Salary Schedule Effective January 1, 2018
2018 Budget Page E-3 Appendix E - 2018 Salary Schedule
Annual Monthly Hourly
JobCode Job Title
Band#
BandName
Zone#
ZoneMinimum
MarketAverage
ZoneMaximum
ZoneMinimum
MarketAverage
ZoneMinimum
MarketAverage
15017 Code Enforcement Supervisor 3 SUP 3 $58,411 $70,121 $81,831 $4,868 $5,843 $28.08 $33.71
18230 Fire Prevention Section Supervisor 3 SUP 3 $58,411 $70,121 $81,831 $4,868 $5,843 $28.08 $33.71
16622 Police Impound Facility Supervisor 3 SUP 3 $58,411 $70,121 $81,831 $4,868 $5,843 $28.08 $33.71
12761 Public Safety Communications Supervisor 3 SUP 3 $58,411 $70,121 $81,831 $4,868 $5,843 $28.08 $33.71
15029 Radio Communications Supervisor 3 SUP 3 $58,411 $70,121 $81,831 $4,868 $5,843 $28.08 $33.71
12805 Skilled Maintenance Supervisor 3 SUP 3 $58,411 $70,121 $81,831 $4,868 $5,843 $28.08 $33.71
12804 Streets District Supervisor 3 SUP 3 $58,411 $70,121 $81,831 $4,868 $5,843 $28.08 $33.71
18233 Community Behavioral Health Coordinator 3 SUP 2 $53,589 $64,332 $75,075 $4,466 $5,361 $25.76 $30.93
15302 Office Services Coordinator 3 SUP 2 $53,589 $64,332 $75,075 $4,466 $5,361 $25.76 $30.93
14426 Park Ranger Supervisor 3 SUP 2 $53,589 $64,332 $75,075 $4,466 $5,361 $25.76 $30.93
15019 Community Service Officer Supervisor 3 SUP 1 $49,164 $59,020 $68,876 $4,097 $4,918 $23.64 $28.38
12738 Records Supervisor 3 SUP 1 $49,164 $59,020 $68,876 $4,097 $4,918 $23.64 $28.38
99999 Assistant City Attorney 4 PRO 13 $118,663 $142,452 $166,241 $9,889 $11,871 $57.05 $68.49
17630 Senior Attorney 4 PRO 12 $109,873 $131,900 $153,927 $9,156 $10,992 $52.82 $63.41
12711 Senior Cyber Security Analyst 4 PRO 11 $100,800 $121,008 $141,216 $8,400 $10,084 $48.46 $58.18
12726 Senior IT Solutions Engineer 4 PRO 11 $100,800 $121,008 $141,216 $8,400 $10,084 $48.46 $58.18
17501 Senior Information Technology Architect 4 PRO 11 $100,800 $121,008 $141,216 $8,400 $10,084 $48.46 $58.18
Reserved for Future Use 4 PRO 10 $92,478 $111,018 $129,558 $7,706 $9,252 $44.46 $53.37
15030 City Facilities Administrator 4 PRO 9 $84,842 $101,851 $118,860 $7,070 $8,488 $40.79 $48.97
12719 Cyber Security Analyst II 4 PRO 9 $84,842 $101,851 $118,860 $7,070 $8,488 $40.79 $48.97
17219 Information Systems Auditor Supervisor 4 PRO 9 $84,842 $101,851 $118,860 $7,070 $8,488 $40.79 $48.97
12728 IT Solutions Engineer 4 PRO 9 $84,842 $101,851 $118,860 $7,070 $8,488 $40.79 $48.97
12714 ITSM Coordinator 4 PRO 9 $84,842 $101,851 $118,860 $7,070 $8,488 $40.79 $48.97
19664 Occupational NP/PA 4 PRO 9 $84,842 $101,851 $118,860 $7,070 $8,488 $40.79 $48.97
19197 Program Administrator II 4 PRO 9 $84,842 $101,851 $118,860 $7,070 $8,488 $40.79 $48.97
17410 Senior Application Programmer Analyst 4 PRO 9 $84,842 $101,851 $118,860 $7,070 $8,488 $40.79 $48.97
12781 Senior Engineer 4 PRO 9 $84,842 $101,851 $118,860 $7,070 $8,488 $40.79 $48.97
17411 Senior Database Administrator 4 PRO 9 $84,842 $101,851 $118,860 $7,070 $8,488 $40.79 $48.97
17415 Senior ERP Systems Analyst 4 PRO 9 $84,842 $101,851 $118,860 $7,070 $8,488 $40.79 $48.97
12789 Senior IT Project Manager 4 PRO 9 $84,842 $101,851 $118,860 $7,070 $8,488 $40.79 $48.97
17475 Senior Systems Administrator 4 PRO 9 $84,842 $101,851 $118,860 $7,070 $8,488 $40.79 $48.97
17654 Attorney 4 PRO 8 $77,836 $93,441 $109,046 $6,486 $7,787 $37.42 $44.92
12778 Capital Project Coordinator 4 PRO 8 $77,836 $93,441 $109,046 $6,486 $7,787 $37.42 $44.92
17413 Database Administrator II 4 PRO 8 $77,836 $93,441 $109,046 $6,486 $7,787 $37.42 $44.92
12704 IT Project Manager II 4 PRO 8 $77,836 $93,441 $109,046 $6,486 $7,787 $37.42 $44.92
12796 OEM Coordinator 4 PRO 8 $77,836 $93,441 $109,046 $6,486 $7,787 $37.42 $44.92
17412 Senior Business Analyst, IT 4 PRO 8 $77,836 $93,441 $109,046 $6,486 $7,787 $37.42 $44.92
18431 Senior Human Resource Business Partner 4 PRO 8 $77,836 $93,441 $109,046 $6,486 $7,787 $37.42 $44.92
17445 Senior Network Administrator 4 PRO 8 $77,836 $93,441 $109,046 $6,486 $7,787 $37.42 $44.92
12786 Applications Programmer Analyst II 4 PRO 7 $71,409 $85,725 $100,041 $5,951 $7,144 $34.33 $41.21
18302 Claims Adjustor, Senior 4 PRO 7 $71,409 $85,725 $100,041 $5,951 $7,144 $34.33 $41.21
15102 Construction Project Manager 4 PRO 7 $71,409 $85,725 $100,041 $5,951 $7,144 $34.33 $41.21
12723 Cyber Security Analyst I 4 PRO 7 $71,409 $85,725 $100,041 $5,951 $7,144 $34.33 $41.21
17910 DNA Technical Leader 4 PRO 7 $71,409 $85,725 $100,041 $5,951 $7,144 $34.33 $41.21
17507 Engineer III 4 PRO 7 $71,409 $85,725 $100,041 $5,951 $7,144 $34.33 $41.21
16070 Fire Medical Programs Coordinator 4 PRO 7 $71,409 $85,725 $100,041 $5,951 $7,144 $34.33 $41.21
17092 Fire Protection Engineer II 4 PRO 7 $71,409 $85,725 $100,041 $5,951 $7,144 $34.33 $41.21
17624 HUD Programs Administrator 4 PRO 7 $71,409 $85,725 $100,041 $5,951 $7,144 $34.33 $41.21
17214 Information Systems Auditor II 4 PRO 7 $71,409 $85,725 $100,041 $5,951 $7,144 $34.33 $41.21
12720 Information Technology Architect II 4 PRO 7 $71,409 $85,725 $100,041 $5,951 $7,144 $34.33 $41.21
18102 Lead Public Communications Specialist 4 PRO 7 $71,409 $85,725 $100,041 $5,951 $7,144 $34.33 $41.21
18494 Police Psychologist 4 PRO 7 $71,409 $85,725 $100,041 $5,951 $7,144 $34.33 $41.21
18006 Principal Planner 4 PRO 7 $71,409 $85,725 $100,041 $5,951 $7,144 $34.33 $41.21
19195 Program Administrator I 4 PRO 7 $71,409 $85,725 $100,041 $5,951 $7,144 $34.33 $41.21
17893 Senior Landscape Architect 4 PRO 7 $71,409 $85,725 $100,041 $5,951 $7,144 $34.33 $41.21
16035 Senior Real Estate Specialist 4 PRO 7 $71,409 $85,725 $100,041 $5,951 $7,144 $34.33 $41.21
12788 Senior Systems Analyst 4 PRO 7 $71,409 $85,725 $100,041 $5,951 $7,144 $34.33 $41.21
17414 Senior Webmaster/Administrator 4 PRO 7 $71,409 $85,725 $100,041 $5,951 $7,144 $34.33 $41.21
17240 Strategic Plan & Business Process Administrator 4 PRO 7 $71,409 $85,725 $100,041 $5,951 $7,144 $34.33 $41.21
17260 ADA Coordinator 4 PRO 6 $65,514 $78,648 $91,782 $5,459 $6,554 $31.50 $37.81
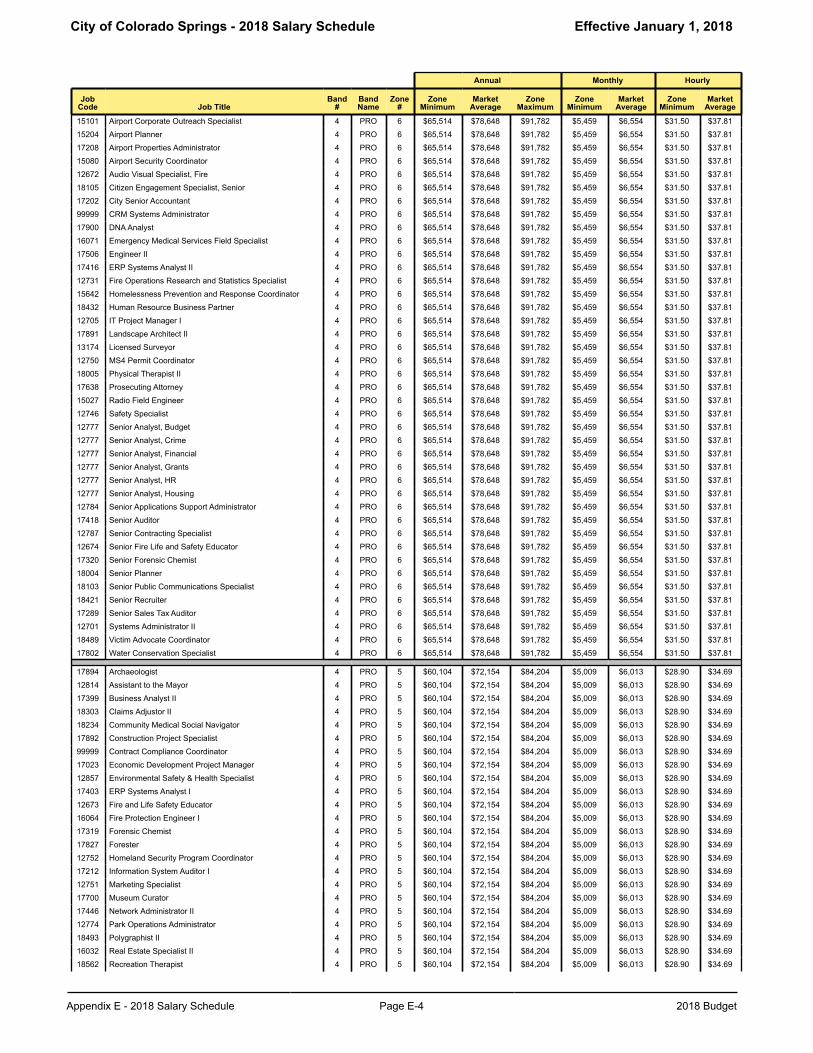
City of Colorado Springs - 2018 Salary Schedule Effective January 1, 2018
Appendix E - 2018 Salary Schedule Page E-4 2018 Budget
Annual Monthly Hourly
JobCode Job Title
Band#
BandName
Zone#
ZoneMinimum
MarketAverage
ZoneMaximum
ZoneMinimum
MarketAverage
ZoneMinimum
MarketAverage
15101 Airport Corporate Outreach Specialist 4 PRO 6 $65,514 $78,648 $91,782 $5,459 $6,554 $31.50 $37.81
15204 Airport Planner 4 PRO 6 $65,514 $78,648 $91,782 $5,459 $6,554 $31.50 $37.81
17208 Airport Properties Administrator 4 PRO 6 $65,514 $78,648 $91,782 $5,459 $6,554 $31.50 $37.81
15080 Airport Security Coordinator 4 PRO 6 $65,514 $78,648 $91,782 $5,459 $6,554 $31.50 $37.81
12672 Audio Visual Specialist, Fire 4 PRO 6 $65,514 $78,648 $91,782 $5,459 $6,554 $31.50 $37.81
18105 Citizen Engagement Specialist, Senior 4 PRO 6 $65,514 $78,648 $91,782 $5,459 $6,554 $31.50 $37.81
17202 City Senior Accountant 4 PRO 6 $65,514 $78,648 $91,782 $5,459 $6,554 $31.50 $37.81
99999 CRM Systems Administrator 4 PRO 6 $65,514 $78,648 $91,782 $5,459 $6,554 $31.50 $37.81
17900 DNA Analyst 4 PRO 6 $65,514 $78,648 $91,782 $5,459 $6,554 $31.50 $37.81
16071 Emergency Medical Services Field Specialist 4 PRO 6 $65,514 $78,648 $91,782 $5,459 $6,554 $31.50 $37.81
17506 Engineer II 4 PRO 6 $65,514 $78,648 $91,782 $5,459 $6,554 $31.50 $37.81
17416 ERP Systems Analyst II 4 PRO 6 $65,514 $78,648 $91,782 $5,459 $6,554 $31.50 $37.81
12731 Fire Operations Research and Statistics Specialist 4 PRO 6 $65,514 $78,648 $91,782 $5,459 $6,554 $31.50 $37.81
15642 Homelessness Prevention and Response Coordinator 4 PRO 6 $65,514 $78,648 $91,782 $5,459 $6,554 $31.50 $37.81
18432 Human Resource Business Partner 4 PRO 6 $65,514 $78,648 $91,782 $5,459 $6,554 $31.50 $37.81
12705 IT Project Manager I 4 PRO 6 $65,514 $78,648 $91,782 $5,459 $6,554 $31.50 $37.81
17891 Landscape Architect II 4 PRO 6 $65,514 $78,648 $91,782 $5,459 $6,554 $31.50 $37.81
13174 Licensed Surveyor 4 PRO 6 $65,514 $78,648 $91,782 $5,459 $6,554 $31.50 $37.81
12750 MS4 Permit Coordinator 4 PRO 6 $65,514 $78,648 $91,782 $5,459 $6,554 $31.50 $37.81
18005 Physical Therapist II 4 PRO 6 $65,514 $78,648 $91,782 $5,459 $6,554 $31.50 $37.81
17638 Prosecuting Attorney 4 PRO 6 $65,514 $78,648 $91,782 $5,459 $6,554 $31.50 $37.81
15027 Radio Field Engineer 4 PRO 6 $65,514 $78,648 $91,782 $5,459 $6,554 $31.50 $37.81
12746 Safety Specialist 4 PRO 6 $65,514 $78,648 $91,782 $5,459 $6,554 $31.50 $37.81
12777 Senior Analyst, Budget 4 PRO 6 $65,514 $78,648 $91,782 $5,459 $6,554 $31.50 $37.81
12777 Senior Analyst, Crime 4 PRO 6 $65,514 $78,648 $91,782 $5,459 $6,554 $31.50 $37.81
12777 Senior Analyst, Financial 4 PRO 6 $65,514 $78,648 $91,782 $5,459 $6,554 $31.50 $37.81
12777 Senior Analyst, Grants 4 PRO 6 $65,514 $78,648 $91,782 $5,459 $6,554 $31.50 $37.81
12777 Senior Analyst, HR 4 PRO 6 $65,514 $78,648 $91,782 $5,459 $6,554 $31.50 $37.81
12777 Senior Analyst, Housing 4 PRO 6 $65,514 $78,648 $91,782 $5,459 $6,554 $31.50 $37.81
12784 Senior Applications Support Administrator 4 PRO 6 $65,514 $78,648 $91,782 $5,459 $6,554 $31.50 $37.81
17418 Senior Auditor 4 PRO 6 $65,514 $78,648 $91,782 $5,459 $6,554 $31.50 $37.81
12787 Senior Contracting Specialist 4 PRO 6 $65,514 $78,648 $91,782 $5,459 $6,554 $31.50 $37.81
12674 Senior Fire Life and Safety Educator 4 PRO 6 $65,514 $78,648 $91,782 $5,459 $6,554 $31.50 $37.81
17320 Senior Forensic Chemist 4 PRO 6 $65,514 $78,648 $91,782 $5,459 $6,554 $31.50 $37.81
18004 Senior Planner 4 PRO 6 $65,514 $78,648 $91,782 $5,459 $6,554 $31.50 $37.81
18103 Senior Public Communications Specialist 4 PRO 6 $65,514 $78,648 $91,782 $5,459 $6,554 $31.50 $37.81
18421 Senior Recruiter 4 PRO 6 $65,514 $78,648 $91,782 $5,459 $6,554 $31.50 $37.81
17289 Senior Sales Tax Auditor 4 PRO 6 $65,514 $78,648 $91,782 $5,459 $6,554 $31.50 $37.81
12701 Systems Administrator II 4 PRO 6 $65,514 $78,648 $91,782 $5,459 $6,554 $31.50 $37.81
18489 Victim Advocate Coordinator 4 PRO 6 $65,514 $78,648 $91,782 $5,459 $6,554 $31.50 $37.81
17802 Water Conservation Specialist 4 PRO 6 $65,514 $78,648 $91,782 $5,459 $6,554 $31.50 $37.81
17894 Archaeologist 4 PRO 5 $60,104 $72,154 $84,204 $5,009 $6,013 $28.90 $34.69
12814 Assistant to the Mayor 4 PRO 5 $60,104 $72,154 $84,204 $5,009 $6,013 $28.90 $34.69
17399 Business Analyst II 4 PRO 5 $60,104 $72,154 $84,204 $5,009 $6,013 $28.90 $34.69
18303 Claims Adjustor II 4 PRO 5 $60,104 $72,154 $84,204 $5,009 $6,013 $28.90 $34.69
18234 Community Medical Social Navigator 4 PRO 5 $60,104 $72,154 $84,204 $5,009 $6,013 $28.90 $34.69
17892 Construction Project Specialist 4 PRO 5 $60,104 $72,154 $84,204 $5,009 $6,013 $28.90 $34.69
99999 Contract Compliance Coordinator 4 PRO 5 $60,104 $72,154 $84,204 $5,009 $6,013 $28.90 $34.69
17023 Economic Development Project Manager 4 PRO 5 $60,104 $72,154 $84,204 $5,009 $6,013 $28.90 $34.69
12857 Environmental Safety & Health Specialist 4 PRO 5 $60,104 $72,154 $84,204 $5,009 $6,013 $28.90 $34.69
17403 ERP Systems Analyst I 4 PRO 5 $60,104 $72,154 $84,204 $5,009 $6,013 $28.90 $34.69
12673 Fire and Life Safety Educator 4 PRO 5 $60,104 $72,154 $84,204 $5,009 $6,013 $28.90 $34.69
16064 Fire Protection Engineer I 4 PRO 5 $60,104 $72,154 $84,204 $5,009 $6,013 $28.90 $34.69
17319 Forensic Chemist 4 PRO 5 $60,104 $72,154 $84,204 $5,009 $6,013 $28.90 $34.69
17827 Forester 4 PRO 5 $60,104 $72,154 $84,204 $5,009 $6,013 $28.90 $34.69
12752 Homeland Security Program Coordinator 4 PRO 5 $60,104 $72,154 $84,204 $5,009 $6,013 $28.90 $34.69
17212 Information System Auditor I 4 PRO 5 $60,104 $72,154 $84,204 $5,009 $6,013 $28.90 $34.69
12751 Marketing Specialist 4 PRO 5 $60,104 $72,154 $84,204 $5,009 $6,013 $28.90 $34.69
17700 Museum Curator 4 PRO 5 $60,104 $72,154 $84,204 $5,009 $6,013 $28.90 $34.69
17446 Network Administrator II 4 PRO 5 $60,104 $72,154 $84,204 $5,009 $6,013 $28.90 $34.69
12774 Park Operations Administrator 4 PRO 5 $60,104 $72,154 $84,204 $5,009 $6,013 $28.90 $34.69
18493 Polygraphist II 4 PRO 5 $60,104 $72,154 $84,204 $5,009 $6,013 $28.90 $34.69
16032 Real Estate Specialist II 4 PRO 5 $60,104 $72,154 $84,204 $5,009 $6,013 $28.90 $34.69
18562 Recreation Therapist 4 PRO 5 $60,104 $72,154 $84,204 $5,009 $6,013 $28.90 $34.69
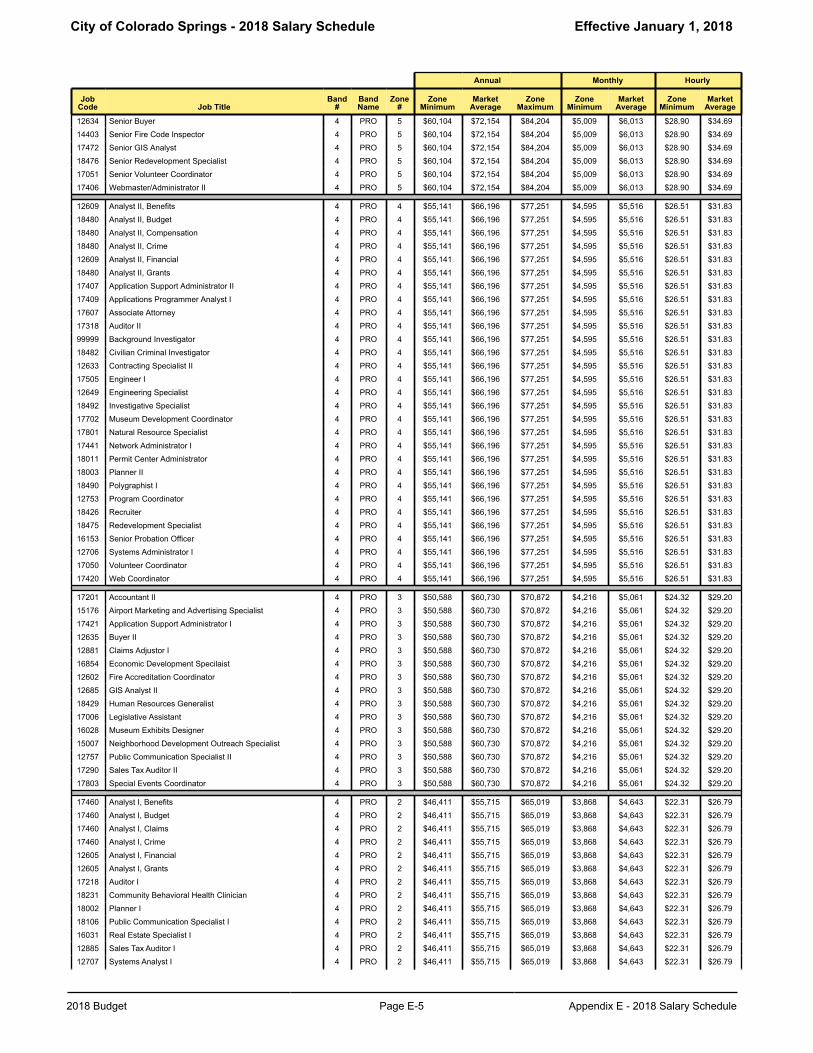
City of Colorado Springs - 2018 Salary Schedule Effective January 1, 2018
2018 Budget Page E-5 Appendix E - 2018 Salary Schedule
Annual Monthly Hourly
JobCode Job Title
Band#
BandName
Zone#
ZoneMinimum
MarketAverage
ZoneMaximum
ZoneMinimum
MarketAverage
ZoneMinimum
MarketAverage
12634 Senior Buyer 4 PRO 5 $60,104 $72,154 $84,204 $5,009 $6,013 $28.90 $34.69
14403 Senior Fire Code Inspector 4 PRO 5 $60,104 $72,154 $84,204 $5,009 $6,013 $28.90 $34.69
17472 Senior GIS Analyst 4 PRO 5 $60,104 $72,154 $84,204 $5,009 $6,013 $28.90 $34.69
18476 Senior Redevelopment Specialist 4 PRO 5 $60,104 $72,154 $84,204 $5,009 $6,013 $28.90 $34.69
17051 Senior Volunteer Coordinator 4 PRO 5 $60,104 $72,154 $84,204 $5,009 $6,013 $28.90 $34.69
17406 Webmaster/Administrator II 4 PRO 5 $60,104 $72,154 $84,204 $5,009 $6,013 $28.90 $34.69
12609 Analyst II, Benefits 4 PRO 4 $55,141 $66,196 $77,251 $4,595 $5,516 $26.51 $31.83
18480 Analyst II, Budget 4 PRO 4 $55,141 $66,196 $77,251 $4,595 $5,516 $26.51 $31.83
18480 Analyst II, Compensation 4 PRO 4 $55,141 $66,196 $77,251 $4,595 $5,516 $26.51 $31.83
18480 Analyst II, Crime 4 PRO 4 $55,141 $66,196 $77,251 $4,595 $5,516 $26.51 $31.83
12609 Analyst II, Financial 4 PRO 4 $55,141 $66,196 $77,251 $4,595 $5,516 $26.51 $31.83
18480 Analyst II, Grants 4 PRO 4 $55,141 $66,196 $77,251 $4,595 $5,516 $26.51 $31.83
17407 Application Support Administrator II 4 PRO 4 $55,141 $66,196 $77,251 $4,595 $5,516 $26.51 $31.83
17409 Applications Programmer Analyst I 4 PRO 4 $55,141 $66,196 $77,251 $4,595 $5,516 $26.51 $31.83
17607 Associate Attorney 4 PRO 4 $55,141 $66,196 $77,251 $4,595 $5,516 $26.51 $31.83
17318 Auditor II 4 PRO 4 $55,141 $66,196 $77,251 $4,595 $5,516 $26.51 $31.83
99999 Background Investigator 4 PRO 4 $55,141 $66,196 $77,251 $4,595 $5,516 $26.51 $31.83
18482 Civilian Criminal Investigator 4 PRO 4 $55,141 $66,196 $77,251 $4,595 $5,516 $26.51 $31.83
12633 Contracting Specialist II 4 PRO 4 $55,141 $66,196 $77,251 $4,595 $5,516 $26.51 $31.83
17505 Engineer I 4 PRO 4 $55,141 $66,196 $77,251 $4,595 $5,516 $26.51 $31.83
12649 Engineering Specialist 4 PRO 4 $55,141 $66,196 $77,251 $4,595 $5,516 $26.51 $31.83
18492 Investigative Specialist 4 PRO 4 $55,141 $66,196 $77,251 $4,595 $5,516 $26.51 $31.83
17702 Museum Development Coordinator 4 PRO 4 $55,141 $66,196 $77,251 $4,595 $5,516 $26.51 $31.83
17801 Natural Resource Specialist 4 PRO 4 $55,141 $66,196 $77,251 $4,595 $5,516 $26.51 $31.83
17441 Network Administrator I 4 PRO 4 $55,141 $66,196 $77,251 $4,595 $5,516 $26.51 $31.83
18011 Permit Center Administrator 4 PRO 4 $55,141 $66,196 $77,251 $4,595 $5,516 $26.51 $31.83
18003 Planner II 4 PRO 4 $55,141 $66,196 $77,251 $4,595 $5,516 $26.51 $31.83
18490 Polygraphist I 4 PRO 4 $55,141 $66,196 $77,251 $4,595 $5,516 $26.51 $31.83
12753 Program Coordinator 4 PRO 4 $55,141 $66,196 $77,251 $4,595 $5,516 $26.51 $31.83
18426 Recruiter 4 PRO 4 $55,141 $66,196 $77,251 $4,595 $5,516 $26.51 $31.83
18475 Redevelopment Specialist 4 PRO 4 $55,141 $66,196 $77,251 $4,595 $5,516 $26.51 $31.83
16153 Senior Probation Officer 4 PRO 4 $55,141 $66,196 $77,251 $4,595 $5,516 $26.51 $31.83
12706 Systems Administrator I 4 PRO 4 $55,141 $66,196 $77,251 $4,595 $5,516 $26.51 $31.83
17050 Volunteer Coordinator 4 PRO 4 $55,141 $66,196 $77,251 $4,595 $5,516 $26.51 $31.83
17420 Web Coordinator 4 PRO 4 $55,141 $66,196 $77,251 $4,595 $5,516 $26.51 $31.83
17201 Accountant II 4 PRO 3 $50,588 $60,730 $70,872 $4,216 $5,061 $24.32 $29.20
15176 Airport Marketing and Advertising Specialist 4 PRO 3 $50,588 $60,730 $70,872 $4,216 $5,061 $24.32 $29.20
17421 Application Support Administrator I 4 PRO 3 $50,588 $60,730 $70,872 $4,216 $5,061 $24.32 $29.20
12635 Buyer II 4 PRO 3 $50,588 $60,730 $70,872 $4,216 $5,061 $24.32 $29.20
12881 Claims Adjustor I 4 PRO 3 $50,588 $60,730 $70,872 $4,216 $5,061 $24.32 $29.20
16854 Economic Development Specilaist 4 PRO 3 $50,588 $60,730 $70,872 $4,216 $5,061 $24.32 $29.20
12602 Fire Accreditation Coordinator 4 PRO 3 $50,588 $60,730 $70,872 $4,216 $5,061 $24.32 $29.20
12685 GIS Analyst II 4 PRO 3 $50,588 $60,730 $70,872 $4,216 $5,061 $24.32 $29.20
18429 Human Resources Generalist 4 PRO 3 $50,588 $60,730 $70,872 $4,216 $5,061 $24.32 $29.20
17006 Legislative Assistant 4 PRO 3 $50,588 $60,730 $70,872 $4,216 $5,061 $24.32 $29.20
16028 Museum Exhibits Designer 4 PRO 3 $50,588 $60,730 $70,872 $4,216 $5,061 $24.32 $29.20
15007 Neighborhood Development Outreach Specialist 4 PRO 3 $50,588 $60,730 $70,872 $4,216 $5,061 $24.32 $29.20
12757 Public Communication Specialist II 4 PRO 3 $50,588 $60,730 $70,872 $4,216 $5,061 $24.32 $29.20
17290 Sales Tax Auditor II 4 PRO 3 $50,588 $60,730 $70,872 $4,216 $5,061 $24.32 $29.20
17803 Special Events Coordinator 4 PRO 3 $50,588 $60,730 $70,872 $4,216 $5,061 $24.32 $29.20
17460 Analyst I, Benefits 4 PRO 2 $46,411 $55,715 $65,019 $3,868 $4,643 $22.31 $26.79
17460 Analyst I, Budget 4 PRO 2 $46,411 $55,715 $65,019 $3,868 $4,643 $22.31 $26.79
17460 Analyst I, Claims 4 PRO 2 $46,411 $55,715 $65,019 $3,868 $4,643 $22.31 $26.79
17460 Analyst I, Crime 4 PRO 2 $46,411 $55,715 $65,019 $3,868 $4,643 $22.31 $26.79
12605 Analyst I, Financial 4 PRO 2 $46,411 $55,715 $65,019 $3,868 $4,643 $22.31 $26.79
12605 Analyst I, Grants 4 PRO 2 $46,411 $55,715 $65,019 $3,868 $4,643 $22.31 $26.79
17218 Auditor I 4 PRO 2 $46,411 $55,715 $65,019 $3,868 $4,643 $22.31 $26.79
18231 Community Behavioral Health Clinician 4 PRO 2 $46,411 $55,715 $65,019 $3,868 $4,643 $22.31 $26.79
18002 Planner I 4 PRO 2 $46,411 $55,715 $65,019 $3,868 $4,643 $22.31 $26.79
18106 Public Communication Specialist I 4 PRO 2 $46,411 $55,715 $65,019 $3,868 $4,643 $22.31 $26.79
16031 Real Estate Specialist I 4 PRO 2 $46,411 $55,715 $65,019 $3,868 $4,643 $22.31 $26.79
12885 Sales Tax Auditor I 4 PRO 2 $46,411 $55,715 $65,019 $3,868 $4,643 $22.31 $26.79
12707 Systems Analyst I 4 PRO 2 $46,411 $55,715 $65,019 $3,868 $4,643 $22.31 $26.79
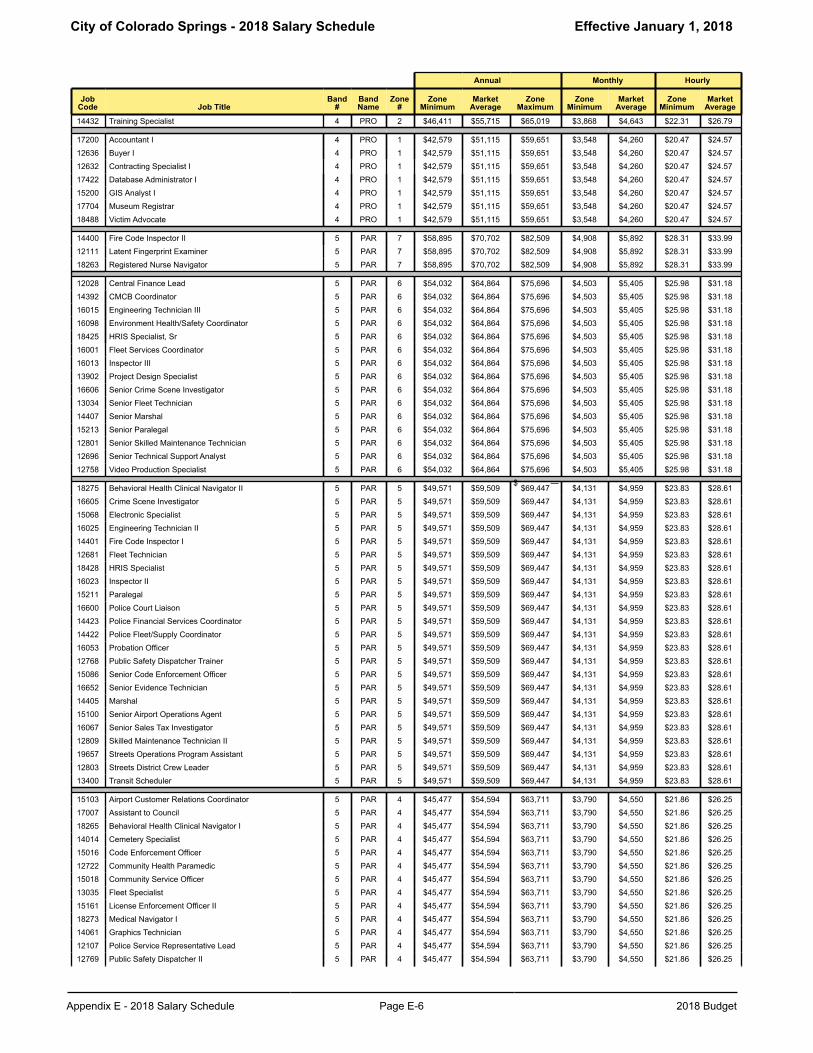
City of Colorado Springs - 2018 Salary Schedule Effective January 1, 2018
Appendix E - 2018 Salary Schedule Page E-6 2018 Budget
Annual Monthly Hourly
JobCode Job Title
Band#
BandName
Zone#
ZoneMinimum
MarketAverage
ZoneMaximum
ZoneMinimum
MarketAverage
ZoneMinimum
MarketAverage
14432 Training Specialist 4 PRO 2 $46,411 $55,715 $65,019 $3,868 $4,643 $22.31 $26.79
17200 Accountant I 4 PRO 1 $42,579 $51,115 $59,651 $3,548 $4,260 $20.47 $24.57
12636 Buyer I 4 PRO 1 $42,579 $51,115 $59,651 $3,548 $4,260 $20.47 $24.57
12632 Contracting Specialist I 4 PRO 1 $42,579 $51,115 $59,651 $3,548 $4,260 $20.47 $24.57
17422 Database Administrator I 4 PRO 1 $42,579 $51,115 $59,651 $3,548 $4,260 $20.47 $24.57
15200 GIS Analyst I 4 PRO 1 $42,579 $51,115 $59,651 $3,548 $4,260 $20.47 $24.57
17704 Museum Registrar 4 PRO 1 $42,579 $51,115 $59,651 $3,548 $4,260 $20.47 $24.57
18488 Victim Advocate 4 PRO 1 $42,579 $51,115 $59,651 $3,548 $4,260 $20.47 $24.57
14400 Fire Code Inspector II 5 PAR 7 $58,895 $70,702 $82,509 $4,908 $5,892 $28.31 $33.99
12111 Latent Fingerprint Examiner 5 PAR 7 $58,895 $70,702 $82,509 $4,908 $5,892 $28.31 $33.99
18263 Registered Nurse Navigator 5 PAR 7 $58,895 $70,702 $82,509 $4,908 $5,892 $28.31 $33.99
12028 Central Finance Lead 5 PAR 6 $54,032 $64,864 $75,696 $4,503 $5,405 $25.98 $31.18
14392 CMCB Coordinator 5 PAR 6 $54,032 $64,864 $75,696 $4,503 $5,405 $25.98 $31.18
16015 Engineering Technician III 5 PAR 6 $54,032 $64,864 $75,696 $4,503 $5,405 $25.98 $31.18
16098 Environment Health/Safety Coordinator 5 PAR 6 $54,032 $64,864 $75,696 $4,503 $5,405 $25.98 $31.18
18425 HRIS Specialist, Sr 5 PAR 6 $54,032 $64,864 $75,696 $4,503 $5,405 $25.98 $31.18
16001 Fleet Services Coordinator 5 PAR 6 $54,032 $64,864 $75,696 $4,503 $5,405 $25.98 $31.18
16013 Inspector III 5 PAR 6 $54,032 $64,864 $75,696 $4,503 $5,405 $25.98 $31.18
13902 Project Design Specialist 5 PAR 6 $54,032 $64,864 $75,696 $4,503 $5,405 $25.98 $31.18
16606 Senior Crime Scene Investigator 5 PAR 6 $54,032 $64,864 $75,696 $4,503 $5,405 $25.98 $31.18
13034 Senior Fleet Technician 5 PAR 6 $54,032 $64,864 $75,696 $4,503 $5,405 $25.98 $31.18
14407 Senior Marshal 5 PAR 6 $54,032 $64,864 $75,696 $4,503 $5,405 $25.98 $31.18
15213 Senior Paralegal 5 PAR 6 $54,032 $64,864 $75,696 $4,503 $5,405 $25.98 $31.18
12801 Senior Skilled Maintenance Technician 5 PAR 6 $54,032 $64,864 $75,696 $4,503 $5,405 $25.98 $31.18
12696 Senior Technical Support Analyst 5 PAR 6 $54,032 $64,864 $75,696 $4,503 $5,405 $25.98 $31.18
12758 Video Production Specialist 5 PAR 6 $54,032 $64,864 $75,696 $4,503 $5,405 $25.98 $31.18$ —
18275 Behavioral Health Clinical Navigator II 5 PAR 5 $49,571 $59,509 $69,447 $4,131 $4,959 $23.83 $28.61
16605 Crime Scene Investigator 5 PAR 5 $49,571 $59,509 $69,447 $4,131 $4,959 $23.83 $28.61
15068 Electronic Specialist 5 PAR 5 $49,571 $59,509 $69,447 $4,131 $4,959 $23.83 $28.61
16025 Engineering Technician II 5 PAR 5 $49,571 $59,509 $69,447 $4,131 $4,959 $23.83 $28.61
14401 Fire Code Inspector I 5 PAR 5 $49,571 $59,509 $69,447 $4,131 $4,959 $23.83 $28.61
12681 Fleet Technician 5 PAR 5 $49,571 $59,509 $69,447 $4,131 $4,959 $23.83 $28.61
18428 HRIS Specialist 5 PAR 5 $49,571 $59,509 $69,447 $4,131 $4,959 $23.83 $28.61
16023 Inspector II 5 PAR 5 $49,571 $59,509 $69,447 $4,131 $4,959 $23.83 $28.61
15211 Paralegal 5 PAR 5 $49,571 $59,509 $69,447 $4,131 $4,959 $23.83 $28.61
16600 Police Court Liaison 5 PAR 5 $49,571 $59,509 $69,447 $4,131 $4,959 $23.83 $28.61
14423 Police Financial Services Coordinator 5 PAR 5 $49,571 $59,509 $69,447 $4,131 $4,959 $23.83 $28.61
14422 Police Fleet/Supply Coordinator 5 PAR 5 $49,571 $59,509 $69,447 $4,131 $4,959 $23.83 $28.61
16053 Probation Officer 5 PAR 5 $49,571 $59,509 $69,447 $4,131 $4,959 $23.83 $28.61
12768 Public Safety Dispatcher Trainer 5 PAR 5 $49,571 $59,509 $69,447 $4,131 $4,959 $23.83 $28.61
15086 Senior Code Enforcement Officer 5 PAR 5 $49,571 $59,509 $69,447 $4,131 $4,959 $23.83 $28.61
16652 Senior Evidence Technician 5 PAR 5 $49,571 $59,509 $69,447 $4,131 $4,959 $23.83 $28.61
14405 Marshal 5 PAR 5 $49,571 $59,509 $69,447 $4,131 $4,959 $23.83 $28.61
15100 Senior Airport Operations Agent 5 PAR 5 $49,571 $59,509 $69,447 $4,131 $4,959 $23.83 $28.61
16067 Senior Sales Tax Investigator 5 PAR 5 $49,571 $59,509 $69,447 $4,131 $4,959 $23.83 $28.61
12809 Skilled Maintenance Technician II 5 PAR 5 $49,571 $59,509 $69,447 $4,131 $4,959 $23.83 $28.61
19657 Streets Operations Program Assistant 5 PAR 5 $49,571 $59,509 $69,447 $4,131 $4,959 $23.83 $28.61
12803 Streets District Crew Leader 5 PAR 5 $49,571 $59,509 $69,447 $4,131 $4,959 $23.83 $28.61
13400 Transit Scheduler 5 PAR 5 $49,571 $59,509 $69,447 $4,131 $4,959 $23.83 $28.61
15103 Airport Customer Relations Coordinator 5 PAR 4 $45,477 $54,594 $63,711 $3,790 $4,550 $21.86 $26.25
17007 Assistant to Council 5 PAR 4 $45,477 $54,594 $63,711 $3,790 $4,550 $21.86 $26.25
18265 Behavioral Health Clinical Navigator I 5 PAR 4 $45,477 $54,594 $63,711 $3,790 $4,550 $21.86 $26.25
14014 Cemetery Specialist 5 PAR 4 $45,477 $54,594 $63,711 $3,790 $4,550 $21.86 $26.25
15016 Code Enforcement Officer 5 PAR 4 $45,477 $54,594 $63,711 $3,790 $4,550 $21.86 $26.25
12722 Community Health Paramedic 5 PAR 4 $45,477 $54,594 $63,711 $3,790 $4,550 $21.86 $26.25
15018 Community Service Officer 5 PAR 4 $45,477 $54,594 $63,711 $3,790 $4,550 $21.86 $26.25
13035 Fleet Specialist 5 PAR 4 $45,477 $54,594 $63,711 $3,790 $4,550 $21.86 $26.25
15161 License Enforcement Officer II 5 PAR 4 $45,477 $54,594 $63,711 $3,790 $4,550 $21.86 $26.25
18273 Medical Navigator I 5 PAR 4 $45,477 $54,594 $63,711 $3,790 $4,550 $21.86 $26.25
14061 Graphics Technician 5 PAR 4 $45,477 $54,594 $63,711 $3,790 $4,550 $21.86 $26.25
12107 Police Service Representative Lead 5 PAR 4 $45,477 $54,594 $63,711 $3,790 $4,550 $21.86 $26.25
12769 Public Safety Dispatcher II 5 PAR 4 $45,477 $54,594 $63,711 $3,790 $4,550 $21.86 $26.25
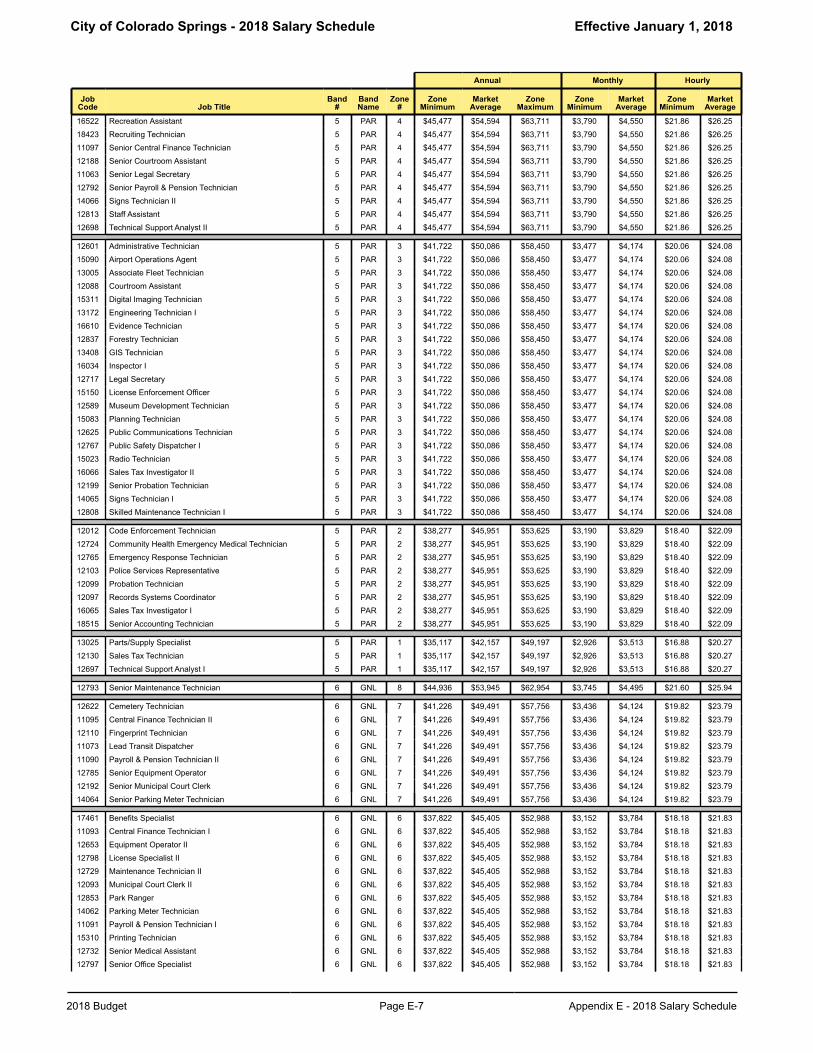
City of Colorado Springs - 2018 Salary Schedule Effective January 1, 2018
2018 Budget Page E-7 Appendix E - 2018 Salary Schedule
Annual Monthly Hourly
JobCode Job Title
Band#
BandName
Zone#
ZoneMinimum
MarketAverage
ZoneMaximum
ZoneMinimum
MarketAverage
ZoneMinimum
MarketAverage
16522 Recreation Assistant 5 PAR 4 $45,477 $54,594 $63,711 $3,790 $4,550 $21.86 $26.25
18423 Recruiting Technician 5 PAR 4 $45,477 $54,594 $63,711 $3,790 $4,550 $21.86 $26.25
11097 Senior Central Finance Technician 5 PAR 4 $45,477 $54,594 $63,711 $3,790 $4,550 $21.86 $26.25
12188 Senior Courtroom Assistant 5 PAR 4 $45,477 $54,594 $63,711 $3,790 $4,550 $21.86 $26.25
11063 Senior Legal Secretary 5 PAR 4 $45,477 $54,594 $63,711 $3,790 $4,550 $21.86 $26.25
12792 Senior Payroll & Pension Technician 5 PAR 4 $45,477 $54,594 $63,711 $3,790 $4,550 $21.86 $26.25
14066 Signs Technician II 5 PAR 4 $45,477 $54,594 $63,711 $3,790 $4,550 $21.86 $26.25
12813 Staff Assistant 5 PAR 4 $45,477 $54,594 $63,711 $3,790 $4,550 $21.86 $26.25
12698 Technical Support Analyst II 5 PAR 4 $45,477 $54,594 $63,711 $3,790 $4,550 $21.86 $26.25
12601 Administrative Technician 5 PAR 3 $41,722 $50,086 $58,450 $3,477 $4,174 $20.06 $24.08
15090 Airport Operations Agent 5 PAR 3 $41,722 $50,086 $58,450 $3,477 $4,174 $20.06 $24.08
13005 Associate Fleet Technician 5 PAR 3 $41,722 $50,086 $58,450 $3,477 $4,174 $20.06 $24.08
12088 Courtroom Assistant 5 PAR 3 $41,722 $50,086 $58,450 $3,477 $4,174 $20.06 $24.08
15311 Digital Imaging Technician 5 PAR 3 $41,722 $50,086 $58,450 $3,477 $4,174 $20.06 $24.08
13172 Engineering Technician I 5 PAR 3 $41,722 $50,086 $58,450 $3,477 $4,174 $20.06 $24.08
16610 Evidence Technician 5 PAR 3 $41,722 $50,086 $58,450 $3,477 $4,174 $20.06 $24.08
12837 Forestry Technician 5 PAR 3 $41,722 $50,086 $58,450 $3,477 $4,174 $20.06 $24.08
13408 GIS Technician 5 PAR 3 $41,722 $50,086 $58,450 $3,477 $4,174 $20.06 $24.08
16034 Inspector I 5 PAR 3 $41,722 $50,086 $58,450 $3,477 $4,174 $20.06 $24.08
12717 Legal Secretary 5 PAR 3 $41,722 $50,086 $58,450 $3,477 $4,174 $20.06 $24.08
15150 License Enforcement Officer 5 PAR 3 $41,722 $50,086 $58,450 $3,477 $4,174 $20.06 $24.08
12589 Museum Development Technician 5 PAR 3 $41,722 $50,086 $58,450 $3,477 $4,174 $20.06 $24.08
15083 Planning Technician 5 PAR 3 $41,722 $50,086 $58,450 $3,477 $4,174 $20.06 $24.08
12625 Public Communications Technician 5 PAR 3 $41,722 $50,086 $58,450 $3,477 $4,174 $20.06 $24.08
12767 Public Safety Dispatcher I 5 PAR 3 $41,722 $50,086 $58,450 $3,477 $4,174 $20.06 $24.08
15023 Radio Technician 5 PAR 3 $41,722 $50,086 $58,450 $3,477 $4,174 $20.06 $24.08
16066 Sales Tax Investigator II 5 PAR 3 $41,722 $50,086 $58,450 $3,477 $4,174 $20.06 $24.08
12199 Senior Probation Technician 5 PAR 3 $41,722 $50,086 $58,450 $3,477 $4,174 $20.06 $24.08
14065 Signs Technician I 5 PAR 3 $41,722 $50,086 $58,450 $3,477 $4,174 $20.06 $24.08
12808 Skilled Maintenance Technician I 5 PAR 3 $41,722 $50,086 $58,450 $3,477 $4,174 $20.06 $24.08
12012 Code Enforcement Technician 5 PAR 2 $38,277 $45,951 $53,625 $3,190 $3,829 $18.40 $22.09
12724 Community Health Emergency Medical Technician 5 PAR 2 $38,277 $45,951 $53,625 $3,190 $3,829 $18.40 $22.09
12765 Emergency Response Technician 5 PAR 2 $38,277 $45,951 $53,625 $3,190 $3,829 $18.40 $22.09
12103 Police Services Representative 5 PAR 2 $38,277 $45,951 $53,625 $3,190 $3,829 $18.40 $22.09
12099 Probation Technician 5 PAR 2 $38,277 $45,951 $53,625 $3,190 $3,829 $18.40 $22.09
12097 Records Systems Coordinator 5 PAR 2 $38,277 $45,951 $53,625 $3,190 $3,829 $18.40 $22.09
16065 Sales Tax Investigator I 5 PAR 2 $38,277 $45,951 $53,625 $3,190 $3,829 $18.40 $22.09
18515 Senior Accounting Technician 5 PAR 2 $38,277 $45,951 $53,625 $3,190 $3,829 $18.40 $22.09
13025 Parts/Supply Specialist 5 PAR 1 $35,117 $42,157 $49,197 $2,926 $3,513 $16.88 $20.27
12130 Sales Tax Technician 5 PAR 1 $35,117 $42,157 $49,197 $2,926 $3,513 $16.88 $20.27
12697 Technical Support Analyst I 5 PAR 1 $35,117 $42,157 $49,197 $2,926 $3,513 $16.88 $20.27
12793 Senior Maintenance Technician 6 GNL 8 $44,936 $53,945 $62,954 $3,745 $4,495 $21.60 $25.94
12622 Cemetery Technician 6 GNL 7 $41,226 $49,491 $57,756 $3,436 $4,124 $19.82 $23.79
11095 Central Finance Technician II 6 GNL 7 $41,226 $49,491 $57,756 $3,436 $4,124 $19.82 $23.79
12110 Fingerprint Technician 6 GNL 7 $41,226 $49,491 $57,756 $3,436 $4,124 $19.82 $23.79
11073 Lead Transit Dispatcher 6 GNL 7 $41,226 $49,491 $57,756 $3,436 $4,124 $19.82 $23.79
11090 Payroll & Pension Technician II 6 GNL 7 $41,226 $49,491 $57,756 $3,436 $4,124 $19.82 $23.79
12785 Senior Equipment Operator 6 GNL 7 $41,226 $49,491 $57,756 $3,436 $4,124 $19.82 $23.79
12192 Senior Municipal Court Clerk 6 GNL 7 $41,226 $49,491 $57,756 $3,436 $4,124 $19.82 $23.79
14064 Senior Parking Meter Technician 6 GNL 7 $41,226 $49,491 $57,756 $3,436 $4,124 $19.82 $23.79
17461 Benefits Specialist 6 GNL 6 $37,822 $45,405 $52,988 $3,152 $3,784 $18.18 $21.83
11093 Central Finance Technician I 6 GNL 6 $37,822 $45,405 $52,988 $3,152 $3,784 $18.18 $21.83
12653 Equipment Operator II 6 GNL 6 $37,822 $45,405 $52,988 $3,152 $3,784 $18.18 $21.83
12798 License Specialist II 6 GNL 6 $37,822 $45,405 $52,988 $3,152 $3,784 $18.18 $21.83
12729 Maintenance Technician II 6 GNL 6 $37,822 $45,405 $52,988 $3,152 $3,784 $18.18 $21.83
12093 Municipal Court Clerk II 6 GNL 6 $37,822 $45,405 $52,988 $3,152 $3,784 $18.18 $21.83
12853 Park Ranger 6 GNL 6 $37,822 $45,405 $52,988 $3,152 $3,784 $18.18 $21.83
14062 Parking Meter Technician 6 GNL 6 $37,822 $45,405 $52,988 $3,152 $3,784 $18.18 $21.83
11091 Payroll & Pension Technician I 6 GNL 6 $37,822 $45,405 $52,988 $3,152 $3,784 $18.18 $21.83
15310 Printing Technician 6 GNL 6 $37,822 $45,405 $52,988 $3,152 $3,784 $18.18 $21.83
12732 Senior Medical Assistant 6 GNL 6 $37,822 $45,405 $52,988 $3,152 $3,784 $18.18 $21.83
12797 Senior Office Specialist 6 GNL 6 $37,822 $45,405 $52,988 $3,152 $3,784 $18.18 $21.83
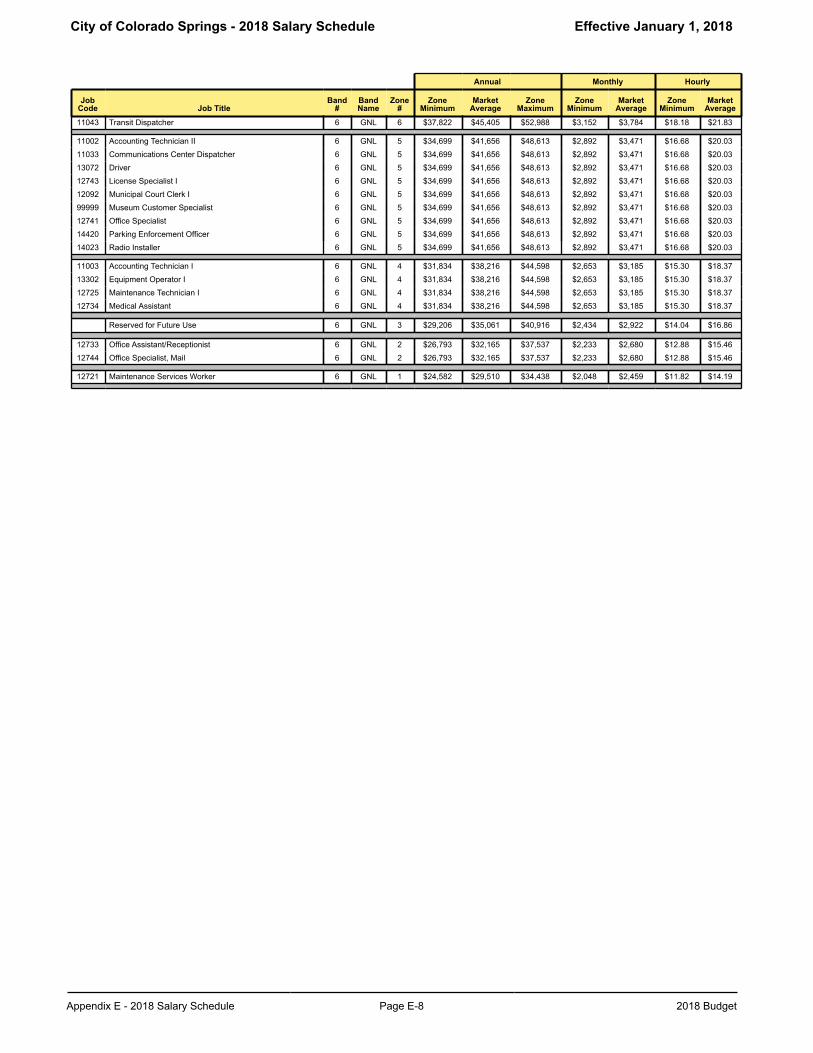
City of Colorado Springs - 2018 Salary Schedule Effective January 1, 2018
Appendix E - 2018 Salary Schedule Page E-8 2018 Budget
Annual Monthly Hourly
JobCode Job Title
Band#
BandName
Zone#
ZoneMinimum
MarketAverage
ZoneMaximum
ZoneMinimum
MarketAverage
ZoneMinimum
MarketAverage
11043 Transit Dispatcher 6 GNL 6 $37,822 $45,405 $52,988 $3,152 $3,784 $18.18 $21.83
11002 Accounting Technician II 6 GNL 5 $34,699 $41,656 $48,613 $2,892 $3,471 $16.68 $20.03
11033 Communications Center Dispatcher 6 GNL 5 $34,699 $41,656 $48,613 $2,892 $3,471 $16.68 $20.03
13072 Driver 6 GNL 5 $34,699 $41,656 $48,613 $2,892 $3,471 $16.68 $20.03
12743 License Specialist I 6 GNL 5 $34,699 $41,656 $48,613 $2,892 $3,471 $16.68 $20.03
12092 Municipal Court Clerk I 6 GNL 5 $34,699 $41,656 $48,613 $2,892 $3,471 $16.68 $20.03
99999 Museum Customer Specialist 6 GNL 5 $34,699 $41,656 $48,613 $2,892 $3,471 $16.68 $20.03
12741 Office Specialist 6 GNL 5 $34,699 $41,656 $48,613 $2,892 $3,471 $16.68 $20.03
14420 Parking Enforcement Officer 6 GNL 5 $34,699 $41,656 $48,613 $2,892 $3,471 $16.68 $20.03
14023 Radio Installer 6 GNL 5 $34,699 $41,656 $48,613 $2,892 $3,471 $16.68 $20.03
11003 Accounting Technician I 6 GNL 4 $31,834 $38,216 $44,598 $2,653 $3,185 $15.30 $18.37
13302 Equipment Operator I 6 GNL 4 $31,834 $38,216 $44,598 $2,653 $3,185 $15.30 $18.37
12725 Maintenance Technician I 6 GNL 4 $31,834 $38,216 $44,598 $2,653 $3,185 $15.30 $18.37
12734 Medical Assistant 6 GNL 4 $31,834 $38,216 $44,598 $2,653 $3,185 $15.30 $18.37
Reserved for Future Use 6 GNL 3 $29,206 $35,061 $40,916 $2,434 $2,922 $14.04 $16.86
12733 Office Assistant/Receptionist 6 GNL 2 $26,793 $32,165 $37,537 $2,233 $2,680 $12.88 $15.46
12744 Office Specialist, Mail 6 GNL 2 $26,793 $32,165 $37,537 $2,233 $2,680 $12.88 $15.46
12721 Maintenance Services Worker 6 GNL 1 $24,582 $29,510 $34,438 $2,048 $2,459 $11.82 $14.19
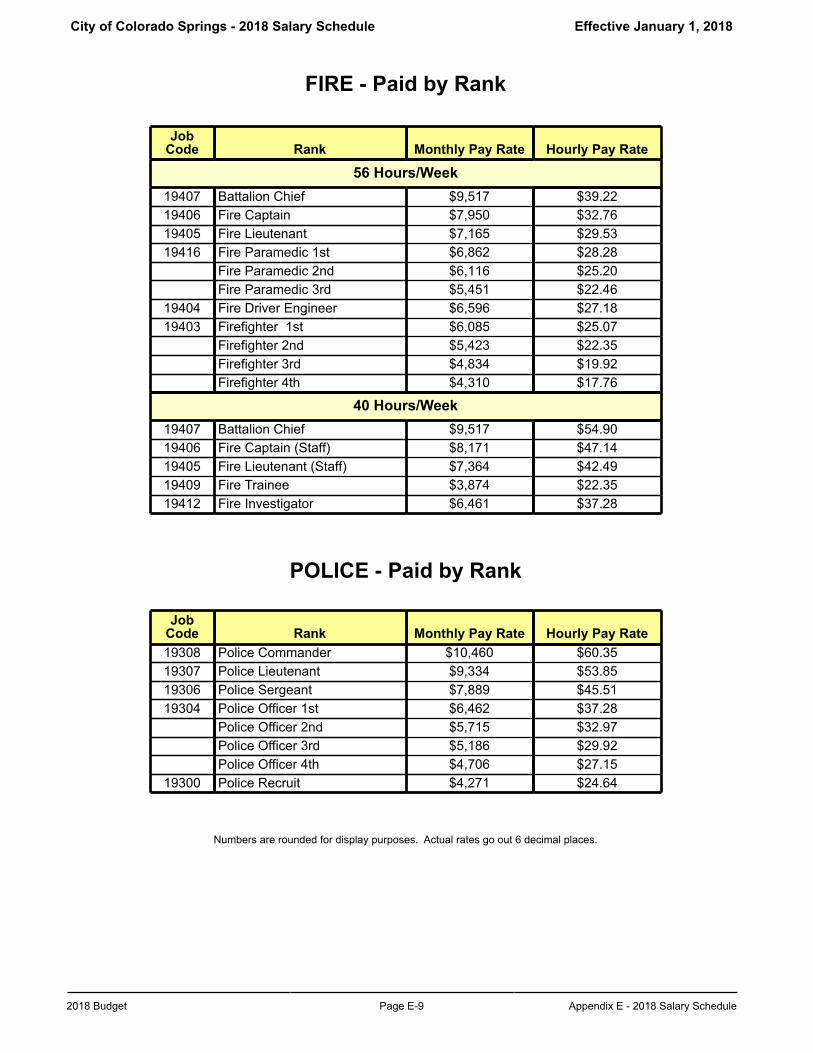
City of Colorado Springs - 2018 Salary Schedule Effective January 1, 2018
2018 Budget Page E-9 Appendix E - 2018 Salary Schedule
FIRE - Paid by Rank
JobCode Rank Monthly Pay Rate Hourly Pay Rate
56 Hours/Week19407 Battalion Chief $9,517 $39.2219406 Fire Captain $7,950 $32.7619405 Fire Lieutenant $7,165 $29.5319416 Fire Paramedic 1st $6,862 $28.28
Fire Paramedic 2nd $6,116 $25.20Fire Paramedic 3rd $5,451 $22.46
19404 Fire Driver Engineer $6,596 $27.1819403 Firefighter 1st $6,085 $25.07
Firefighter 2nd $5,423 $22.35Firefighter 3rd $4,834 $19.92Firefighter 4th $4,310 $17.76
40 Hours/Week19407 Battalion Chief $9,517 $54.9019406 Fire Captain (Staff) $8,171 $47.1419405 Fire Lieutenant (Staff) $7,364 $42.4919409 Fire Trainee $3,874 $22.3519412 Fire Investigator $6,461 $37.28
POLICE - Paid by Rank
JobCode Rank Monthly Pay Rate Hourly Pay Rate19308 Police Commander $10,460 $60.3519307 Police Lieutenant $9,334 $53.8519306 Police Sergeant $7,889 $45.5119304 Police Officer 1st $6,462 $37.28
Police Officer 2nd $5,715 $32.97Police Officer 3rd $5,186 $29.92Police Officer 4th $4,706 $27.15
19300 Police Recruit $4,271 $24.64
Numbers are rounded for display purposes. Actual rates go out 6 decimal places.
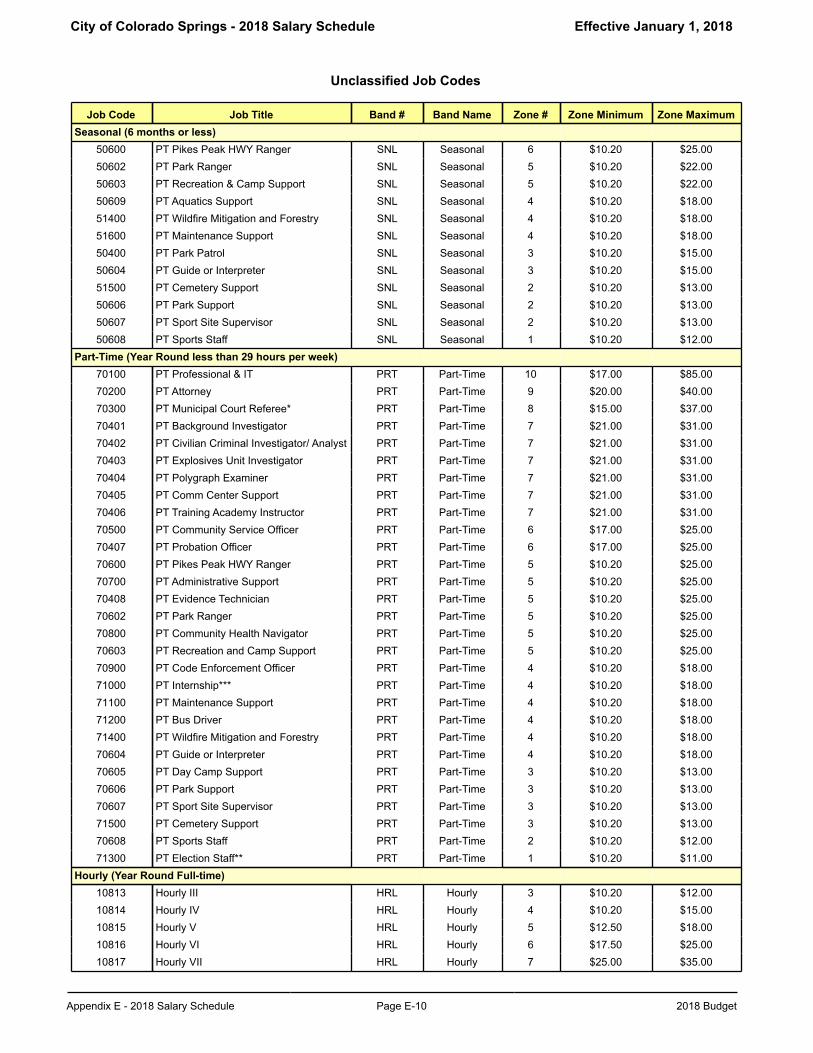
City of Colorado Springs - 2018 Salary Schedule Effective January 1, 2018
Appendix E - 2018 Salary Schedule Page E-10 2018 Budget
Unclassified Job Codes
Job Code Job Title Band # Band Name Zone # Zone Minimum Zone MaximumSeasonal (6 months or less)
50600 PT Pikes Peak HWY Ranger SNL Seasonal 6 $10.20 $25.0050602 PT Park Ranger SNL Seasonal 5 $10.20 $22.0050603 PT Recreation & Camp Support SNL Seasonal 5 $10.20 $22.0050609 PT Aquatics Support SNL Seasonal 4 $10.20 $18.0051400 PT Wildfire Mitigation and Forestry SNL Seasonal 4 $10.20 $18.0051600 PT Maintenance Support SNL Seasonal 4 $10.20 $18.0050400 PT Park Patrol SNL Seasonal 3 $10.20 $15.0050604 PT Guide or Interpreter SNL Seasonal 3 $10.20 $15.0051500 PT Cemetery Support SNL Seasonal 2 $10.20 $13.0050606 PT Park Support SNL Seasonal 2 $10.20 $13.0050607 PT Sport Site Supervisor SNL Seasonal 2 $10.20 $13.0050608 PT Sports Staff SNL Seasonal 1 $10.20 $12.00
Part-Time (Year Round less than 29 hours per week)70100 PT Professional & IT PRT Part-Time 10 $17.00 $85.0070200 PT Attorney PRT Part-Time 9 $20.00 $40.0070300 PT Municipal Court Referee* PRT Part-Time 8 $15.00 $37.0070401 PT Background Investigator PRT Part-Time 7 $21.00 $31.0070402 PT Civilian Criminal Investigator/ Analyst PRT Part-Time 7 $21.00 $31.0070403 PT Explosives Unit Investigator PRT Part-Time 7 $21.00 $31.0070404 PT Polygraph Examiner PRT Part-Time 7 $21.00 $31.0070405 PT Comm Center Support PRT Part-Time 7 $21.00 $31.0070406 PT Training Academy Instructor PRT Part-Time 7 $21.00 $31.0070500 PT Community Service Officer PRT Part-Time 6 $17.00 $25.0070407 PT Probation Officer PRT Part-Time 6 $17.00 $25.0070600 PT Pikes Peak HWY Ranger PRT Part-Time 5 $10.20 $25.0070700 PT Administrative Support PRT Part-Time 5 $10.20 $25.0070408 PT Evidence Technician PRT Part-Time 5 $10.20 $25.0070602 PT Park Ranger PRT Part-Time 5 $10.20 $25.0070800 PT Community Health Navigator PRT Part-Time 5 $10.20 $25.0070603 PT Recreation and Camp Support PRT Part-Time 5 $10.20 $25.0070900 PT Code Enforcement Officer PRT Part-Time 4 $10.20 $18.0071000 PT Internship*** PRT Part-Time 4 $10.20 $18.0071100 PT Maintenance Support PRT Part-Time 4 $10.20 $18.0071200 PT Bus Driver PRT Part-Time 4 $10.20 $18.0071400 PT Wildfire Mitigation and Forestry PRT Part-Time 4 $10.20 $18.0070604 PT Guide or Interpreter PRT Part-Time 4 $10.20 $18.0070605 PT Day Camp Support PRT Part-Time 3 $10.20 $13.0070606 PT Park Support PRT Part-Time 3 $10.20 $13.0070607 PT Sport Site Supervisor PRT Part-Time 3 $10.20 $13.0071500 PT Cemetery Support PRT Part-Time 3 $10.20 $13.0070608 PT Sports Staff PRT Part-Time 2 $10.20 $12.0071300 PT Election Staff** PRT Part-Time 1 $10.20 $11.00
Hourly (Year Round Full-time)10813 Hourly III HRL Hourly 3 $10.20 $12.0010814 Hourly IV HRL Hourly 4 $10.20 $15.0010815 Hourly V HRL Hourly 5 $12.50 $18.0010816 Hourly VI HRL Hourly 6 $17.50 $25.0010817 Hourly VII HRL Hourly 7 $25.00 $35.00
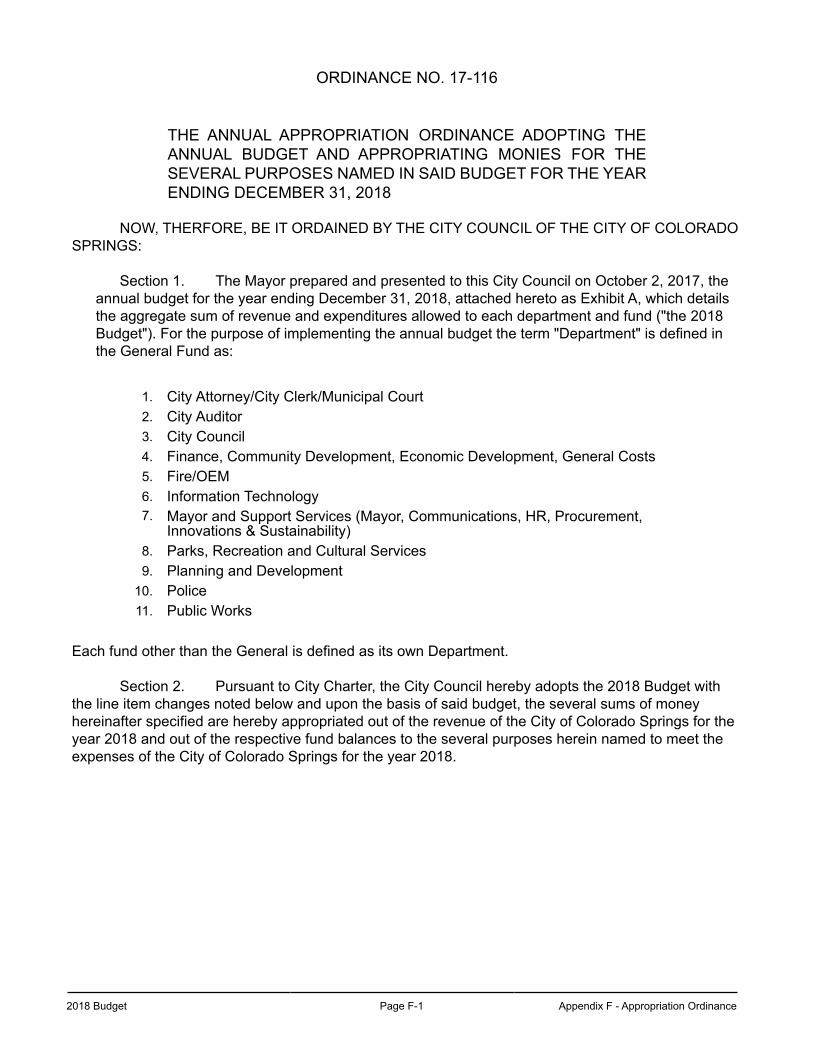
2018 Budget Page F-1 Appendix F - Appropriation Ordinance
ORDINANCE NO. 17-116
THE ANNUAL APPROPRIATION ORDINANCE ADOPTING THE ANNUAL BUDGET AND APPROPRIATING MONIES FOR THE SEVERAL PURPOSES NAMED IN SAID BUDGET FOR THE YEAR ENDING DECEMBER 31, 2018
NOW, THERFORE, BE IT ORDAINED BY THE CITY COUNCIL OF THE CITY OF COLORADO SPRINGS:
Section 1. The Mayor prepared and presented to this City Council on October 2, 2017, the annual budget for the year ending December 31, 2018, attached hereto as Exhibit A, which details the aggregate sum of revenue and expenditures allowed to each department and fund ("the 2018 Budget"). For the purpose of implementing the annual budget the term "Department" is defined in the General Fund as:
1. City Attorney/City Clerk/Municipal Court2. City Auditor3. City Council4. Finance, Community Development, Economic Development, General Costs5. Fire/OEM6. Information Technology7. Mayor and Support Services (Mayor, Communications, HR, Procurement,
Innovations & Sustainability)8. Parks, Recreation and Cultural Services9. Planning and Development
10. Police11. Public Works
Each fund other than the General is defined as its own Department.
Section 2. Pursuant to City Charter, the City Council hereby adopts the 2018 Budget with the line item changes noted below and upon the basis of said budget, the several sums of money hereinafter specified are hereby appropriated out of the revenue of the City of Colorado Springs for the year 2018 and out of the respective fund balances to the several purposes herein named to meet the expenses of the City of Colorado Springs for the year 2018.
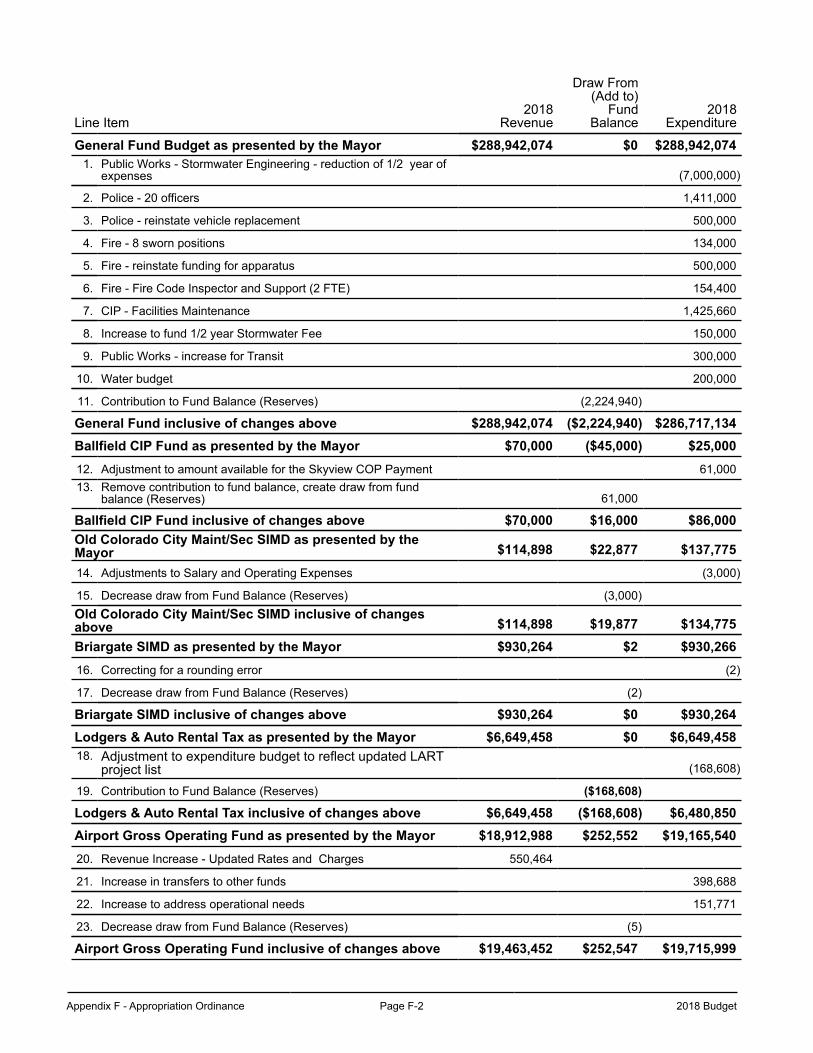
Appendix F - Appropriation Ordinance Page F-2 2018 Budget
Line Item2018
Revenue
Draw From (Add to)
Fund Balance
2018Expenditure
General Fund Budget as presented by the Mayor $288,942,074 $0 $288,942,0741. Public Works - Stormwater Engineering - reduction of 1/2 year of
expenses (7,000,000)
2. Police - 20 officers 1,411,000
3. Police - reinstate vehicle replacement 500,000
4. Fire - 8 sworn positions 134,000
5. Fire - reinstate funding for apparatus 500,000
6. Fire - Fire Code Inspector and Support (2 FTE) 154,400
7. CIP - Facilities Maintenance 1,425,660
8. Increase to fund 1/2 year Stormwater Fee 150,000
9. Public Works - increase for Transit 300,000
10. Water budget 200,000
11. Contribution to Fund Balance (Reserves) (2,224,940)
General Fund inclusive of changes above $288,942,074 ($2,224,940) $286,717,134Ballfield CIP Fund as presented by the Mayor $70,000 ($45,000) $25,00012. Adjustment to amount available for the Skyview COP Payment 61,00013. Remove contribution to fund balance, create draw from fund
balance (Reserves) 61,000
Ballfield CIP Fund inclusive of changes above $70,000 $16,000 $86,000Old Colorado City Maint/Sec SIMD as presented by theMayor $114,898 $22,877 $137,77514. Adjustments to Salary and Operating Expenses (3,000)
15. Decrease draw from Fund Balance (Reserves) (3,000)Old Colorado City Maint/Sec SIMD inclusive of changesabove $114,898 $19,877 $134,775Briargate SIMD as presented by the Mayor $930,264 $2 $930,26616. Correcting for a rounding error (2)
17. Decrease draw from Fund Balance (Reserves) (2)
Briargate SIMD inclusive of changes above $930,264 $0 $930,264Lodgers & Auto Rental Tax as presented by the Mayor $6,649,458 $0 $6,649,45818. Adjustment to expenditure budget to reflect updated LART
project list (168,608)
19. Contribution to Fund Balance (Reserves) ($168,608)
Lodgers & Auto Rental Tax inclusive of changes above $6,649,458 ($168,608) $6,480,850Airport Gross Operating Fund as presented by the Mayor $18,912,988 $252,552 $19,165,54020. Revenue Increase - Updated Rates and Charges 550,464
21. Increase in transfers to other funds 398,688
22. Increase to address operational needs 151,771
23. Decrease draw from Fund Balance (Reserves) (5)
Airport Gross Operating Fund inclusive of changes above $19,463,452 $252,547 $19,715,999
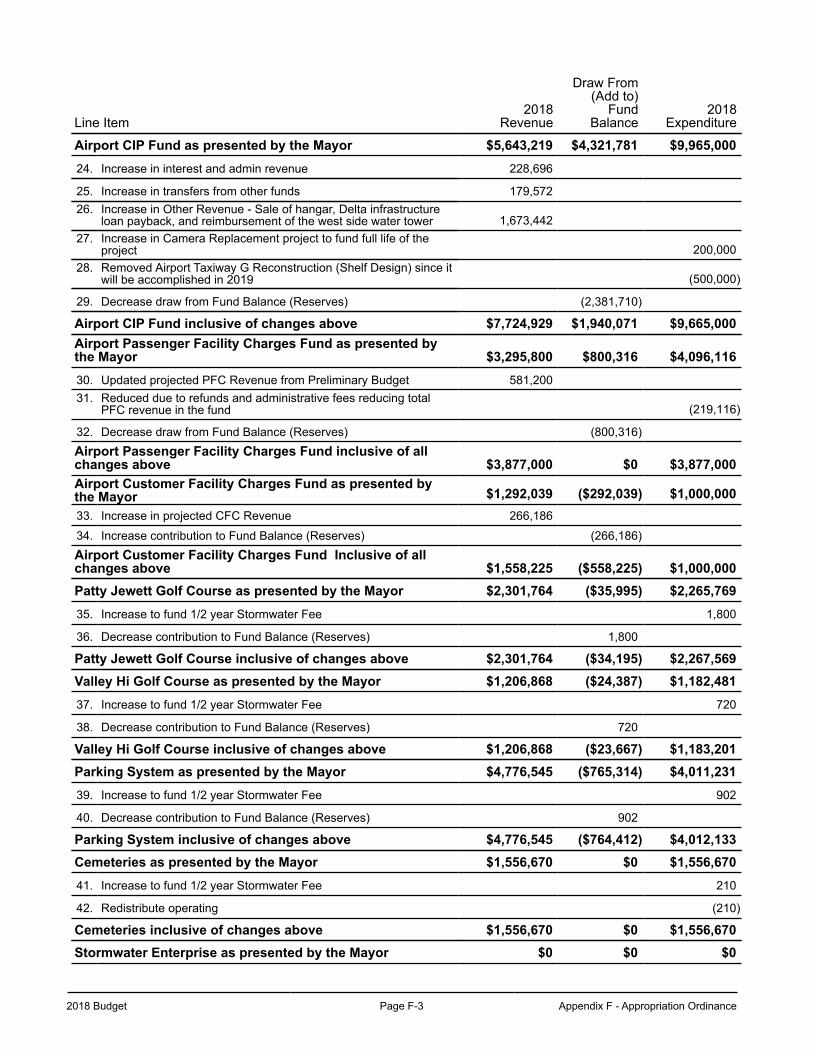
2018 Budget Page F-3 Appendix F - Appropriation Ordinance
Line Item2018
Revenue
Draw From (Add to)
Fund Balance
2018Expenditure
Airport CIP Fund as presented by the Mayor $5,643,219 $4,321,781 $9,965,00024. Increase in interest and admin revenue 228,696
25. Increase in transfers from other funds 179,57226. Increase in Other Revenue - Sale of hangar, Delta infrastructure
loan payback, and reimbursement of the west side water tower 1,673,44227. Increase in Camera Replacement project to fund full life of the
project 200,00028. Removed Airport Taxiway G Reconstruction (Shelf Design) since it
will be accomplished in 2019 (500,000)
29. Decrease draw from Fund Balance (Reserves) (2,381,710)
Airport CIP Fund inclusive of changes above $7,724,929 $1,940,071 $9,665,000Airport Passenger Facility Charges Fund as presented bythe Mayor $3,295,800 $800,316 $4,096,11630. Updated projected PFC Revenue from Preliminary Budget 581,20031. Reduced due to refunds and administrative fees reducing total
PFC revenue in the fund (219,116)
32. Decrease draw from Fund Balance (Reserves) (800,316)Airport Passenger Facility Charges Fund inclusive of allchanges above $3,877,000 $0 $3,877,000Airport Customer Facility Charges Fund as presented bythe Mayor $1,292,039 ($292,039) $1,000,00033. Increase in projected CFC Revenue 266,186
34. Increase contribution to Fund Balance (Reserves) (266,186)Airport Customer Facility Charges Fund Inclusive of allchanges above $1,558,225 ($558,225) $1,000,000Patty Jewett Golf Course as presented by the Mayor $2,301,764 ($35,995) $2,265,76935. Increase to fund 1/2 year Stormwater Fee 1,800
36. Decrease contribution to Fund Balance (Reserves) 1,800
Patty Jewett Golf Course inclusive of changes above $2,301,764 ($34,195) $2,267,569Valley Hi Golf Course as presented by the Mayor $1,206,868 ($24,387) $1,182,48137. Increase to fund 1/2 year Stormwater Fee 720
38. Decrease contribution to Fund Balance (Reserves) 720
Valley Hi Golf Course inclusive of changes above $1,206,868 ($23,667) $1,183,201Parking System as presented by the Mayor $4,776,545 ($765,314) $4,011,23139. Increase to fund 1/2 year Stormwater Fee 902
40. Decrease contribution to Fund Balance (Reserves) 902
Parking System inclusive of changes above $4,776,545 ($764,412) $4,012,133Cemeteries as presented by the Mayor $1,556,670 $0 $1,556,67041. Increase to fund 1/2 year Stormwater Fee 210
42. Redistribute operating (210)
Cemeteries inclusive of changes above $1,556,670 $0 $1,556,670Stormwater Enterprise as presented by the Mayor $0 $0 $0
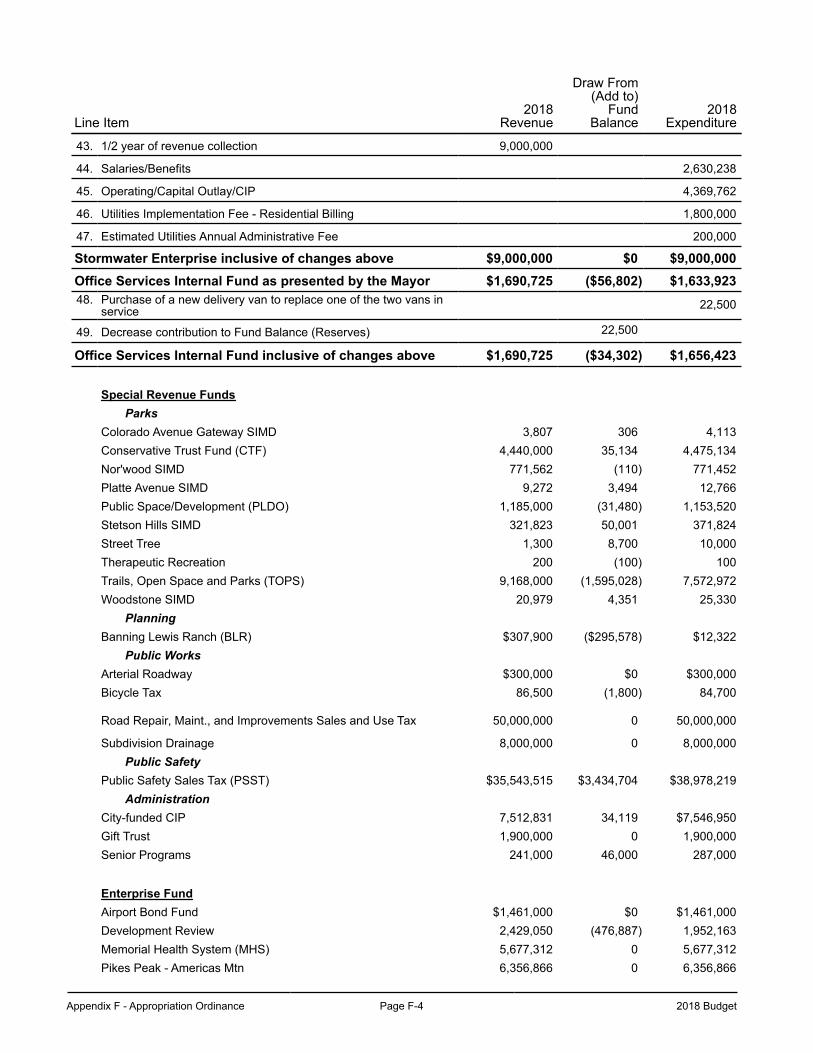
Appendix F - Appropriation Ordinance Page F-4 2018 Budget
Line Item2018
Revenue
Draw From (Add to)
Fund Balance
2018Expenditure
43. 1/2 year of revenue collection 9,000,000
44. Salaries/Benefits 2,630,238
45. Operating/Capital Outlay/CIP 4,369,762
46. Utilities Implementation Fee - Residential Billing 1,800,000
47. Estimated Utilities Annual Administrative Fee 200,000
Stormwater Enterprise inclusive of changes above $9,000,000 $0 $9,000,000Office Services Internal Fund as presented by the Mayor $1,690,725 ($56,802) $1,633,92348. Purchase of a new delivery van to replace one of the two vans in
service 22,500
49. Decrease contribution to Fund Balance (Reserves) 22,500
Office Services Internal Fund inclusive of changes above $1,690,725 ($34,302) $1,656,423
Special Revenue FundsParks
Colorado Avenue Gateway SIMD 3,807 306 4,113Conservative Trust Fund (CTF) 4,440,000 35,134 4,475,134Nor'wood SIMD 771,562 (110) 771,452Platte Avenue SIMD 9,272 3,494 12,766Public Space/Development (PLDO) 1,185,000 (31,480) 1,153,520Stetson Hills SIMD 321,823 50,001 371,824Street Tree 1,300 8,700 10,000Therapeutic Recreation 200 (100) 100Trails, Open Space and Parks (TOPS) 9,168,000 (1,595,028) 7,572,972Woodstone SIMD 20,979 4,351 25,330
PlanningBanning Lewis Ranch (BLR) $307,900 ($295,578) $12,322
Public WorksArterial Roadway $300,000 $0 $300,000Bicycle Tax 86,500 (1,800) 84,700
Road Repair, Maint., and Improvements Sales and Use Tax 50,000,000 0 50,000,000
Subdivision Drainage 8,000,000 0 8,000,000Public Safety
Public Safety Sales Tax (PSST) $35,543,515 $3,434,704 $38,978,219Administration
City-funded CIP 7,512,831 34,119 $7,546,950Gift Trust 1,900,000 0 1,900,000Senior Programs 241,000 46,000 287,000
Enterprise FundAirport Bond Fund $1,461,000 $0 $1,461,000Development Review 2,429,050 (476,887) 1,952,163Memorial Health System (MHS) 5,677,312 0 5,677,312Pikes Peak - Americas Mtn 6,356,866 0 6,356,866
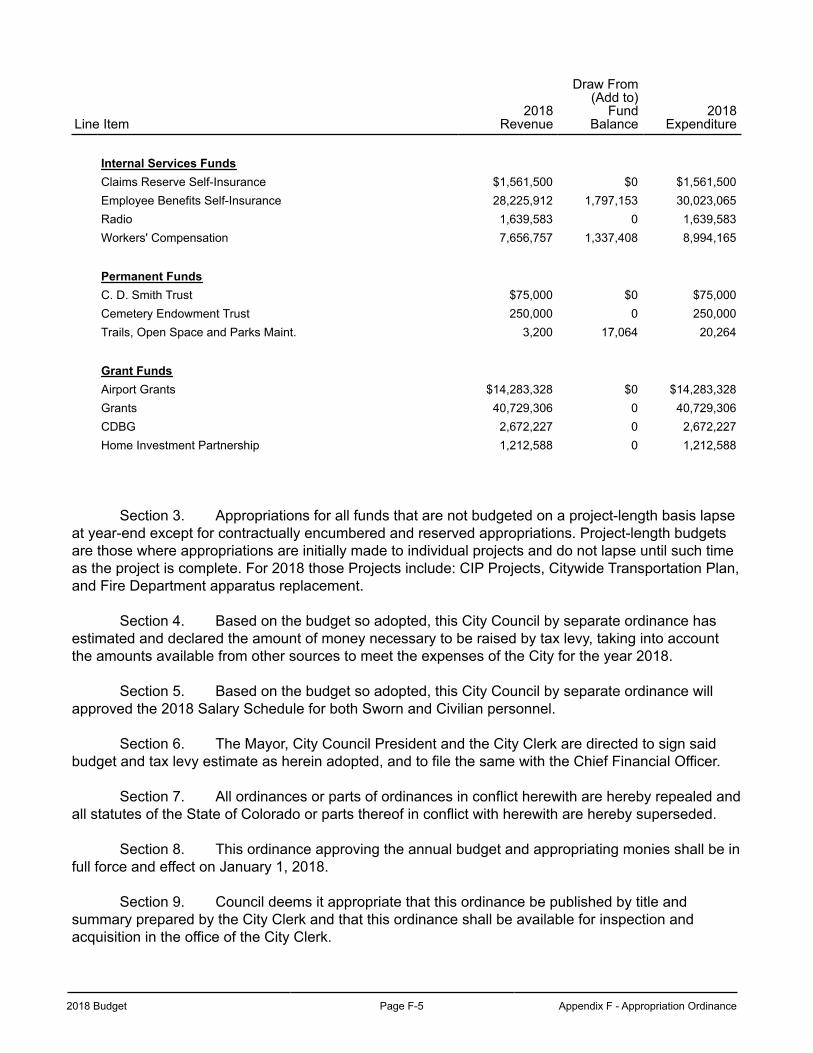
2018 Budget Page F-5 Appendix F - Appropriation Ordinance
Line Item2018
Revenue
Draw From (Add to)
Fund Balance
2018Expenditure
Internal Services FundsClaims Reserve Self-Insurance $1,561,500 $0 $1,561,500Employee Benefits Self-Insurance 28,225,912 1,797,153 30,023,065Radio 1,639,583 0 1,639,583Workers' Compensation 7,656,757 1,337,408 8,994,165
Permanent FundsC. D. Smith Trust $75,000 $0 $75,000Cemetery Endowment Trust 250,000 0 250,000Trails, Open Space and Parks Maint. 3,200 17,064 20,264
Grant FundsAirport Grants $14,283,328 $0 $14,283,328Grants 40,729,306 0 40,729,306CDBG 2,672,227 0 2,672,227Home Investment Partnership 1,212,588 0 1,212,588
Section 3. Appropriations for all funds that are not budgeted on a project-length basis lapse at year-end except for contractually encumbered and reserved appropriations. Project-length budgets are those where appropriations are initially made to individual projects and do not lapse until such time as the project is complete. For 2018 those Projects include: CIP Projects, Citywide Transportation Plan, and Fire Department apparatus replacement.
Section 4. Based on the budget so adopted, this City Council by separate ordinance has estimated and declared the amount of money necessary to be raised by tax levy, taking into account the amounts available from other sources to meet the expenses of the City for the year 2018.
Section 5. Based on the budget so adopted, this City Council by separate ordinance will approved the 2018 Salary Schedule for both Sworn and Civilian personnel.
Section 6. The Mayor, City Council President and the City Clerk are directed to sign said budget and tax levy estimate as herein adopted, and to file the same with the Chief Financial Officer.
Section 7. All ordinances or parts of ordinances in conflict herewith are hereby repealed and all statutes of the State of Colorado or parts thereof in conflict with herewith are hereby superseded.
Section 8. This ordinance approving the annual budget and appropriating monies shall be in full force and effect on January 1, 2018.
Section 9. Council deems it appropriate that this ordinance be published by title and summary prepared by the City Clerk and that this ordinance shall be available for inspection and acquisition in the office of the City Clerk.
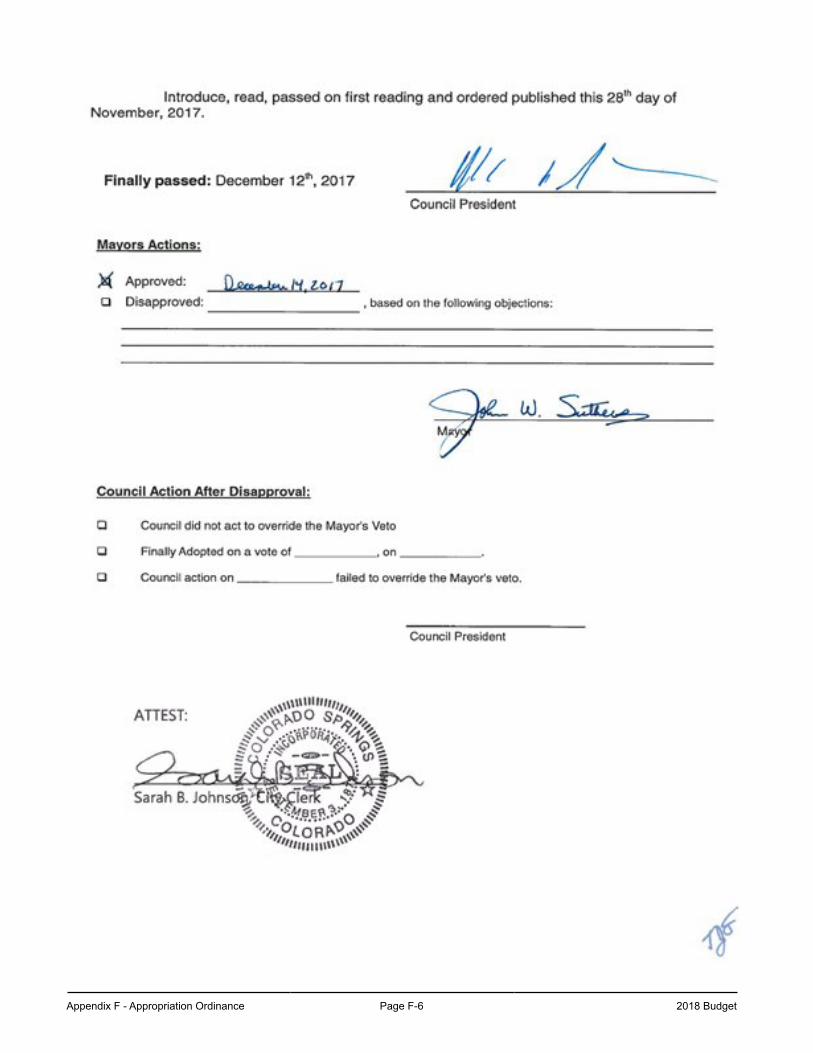
Appendix F - Appropriation Ordinance Page F-6 2018 Budget
2018 Budget Page F-7 Appendix F - Appropriation Ordinance
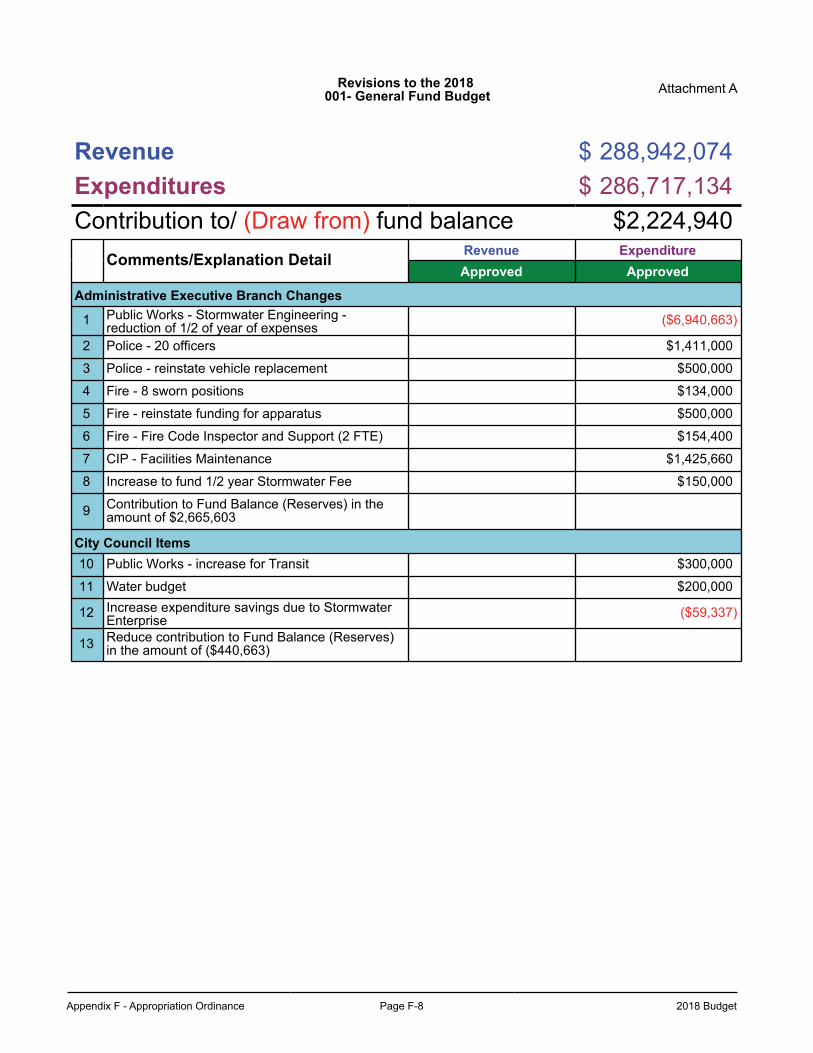
Appendix F - Appropriation Ordinance Page F-8 2018 Budget
Revisions to the 2018 001- General Fund Budget Attachment A
Revenue $ 288,942,074Expenditures $ 286,717,134Contribution to/ (Draw from) fund balance $2,224,940
Comments/Explanation Detail Revenue ExpenditureApproved Approved
Administrative Executive Branch Changes
1 Public Works - Stormwater Engineering -reduction of 1/2 of year of expenses ($6,940,663)
2 Police - 20 officers $1,411,000
3 Police - reinstate vehicle replacement $500,000
4 Fire - 8 sworn positions $134,000
5 Fire - reinstate funding for apparatus $500,000
6 Fire - Fire Code Inspector and Support (2 FTE) $154,400
7 CIP - Facilities Maintenance $1,425,660
8 Increase to fund 1/2 year Stormwater Fee $150,000
9 Contribution to Fund Balance (Reserves) in theamount of $2,665,603
City Council Items10 Public Works - increase for Transit $300,000
11 Water budget $200,000
12 Increase expenditure savings due to StormwaterEnterprise ($59,337)
13 Reduce contribution to Fund Balance (Reserves)in the amount of ($440,663)
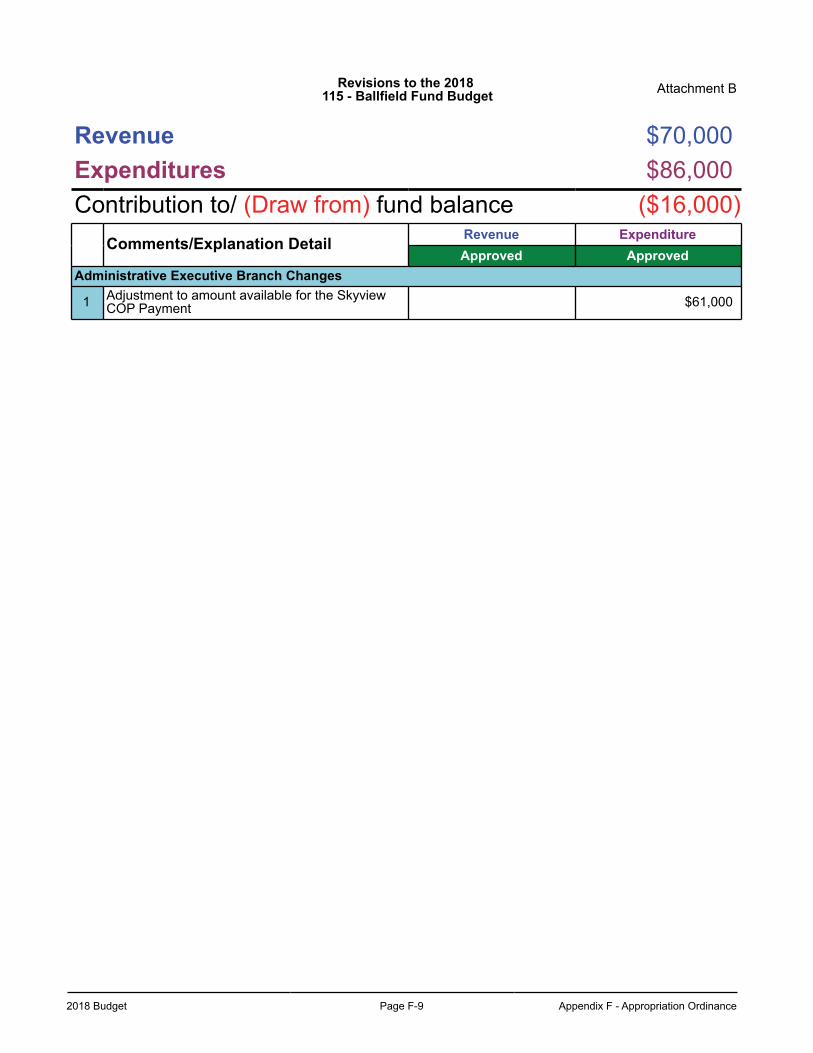
2018 Budget Page F-9 Appendix F - Appropriation Ordinance
Revisions to the 2018 115 - Ballfield Fund Budget Attachment B
Revenue $70,000Expenditures $86,000Contribution to/ (Draw from) fund balance ($16,000)
Comments/Explanation Detail Revenue ExpenditureApproved Approved
Administrative Executive Branch Changes
1 Adjustment to amount available for the SkyviewCOP Payment $61,000
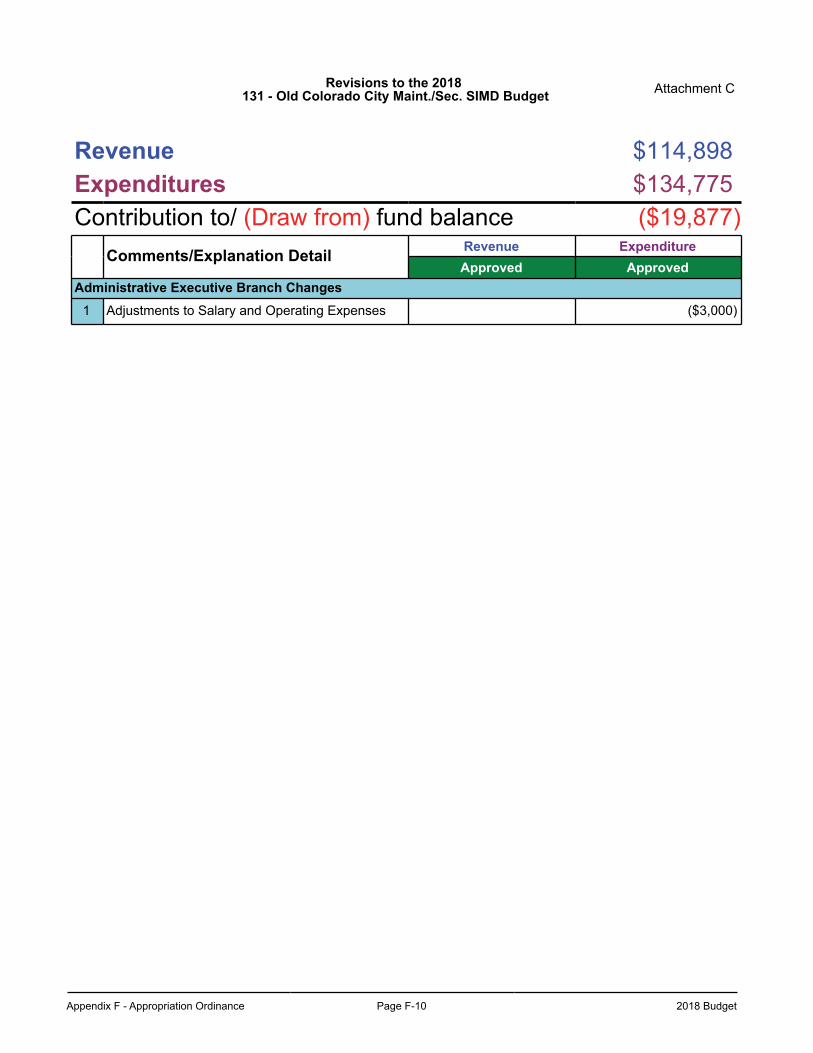
Appendix F - Appropriation Ordinance Page F-10 2018 Budget
Revisions to the 2018 131 - Old Colorado City Maint./Sec. SIMD Budget Attachment C
Revenue $114,898Expenditures $134,775Contribution to/ (Draw from) fund balance ($19,877)
Comments/Explanation Detail Revenue ExpenditureApproved Approved
Administrative Executive Branch Changes1 Adjustments to Salary and Operating Expenses ($3,000)
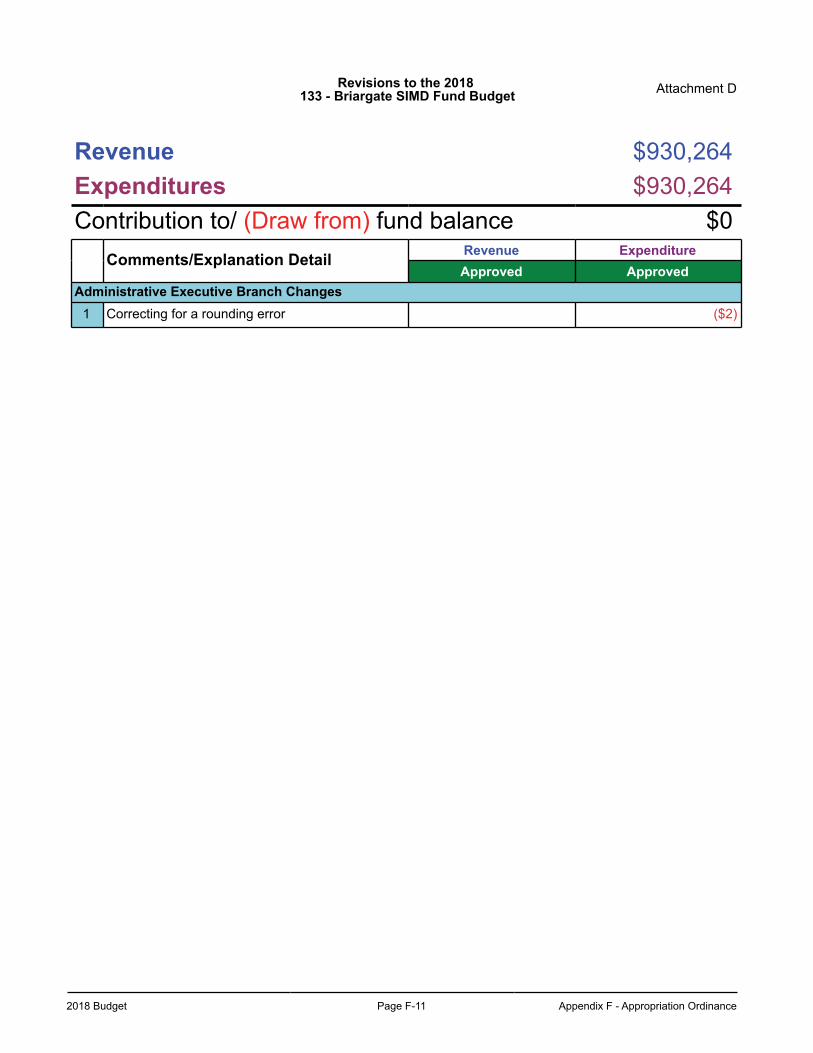
2018 Budget Page F-11 Appendix F - Appropriation Ordinance
Revisions to the 2018 133 - Briargate SIMD Fund Budget Attachment D
Revenue $930,264Expenditures $930,264Contribution to/ (Draw from) fund balance $0
Comments/Explanation Detail Revenue ExpenditureApproved Approved
Administrative Executive Branch Changes1 Correcting for a rounding error ($2)
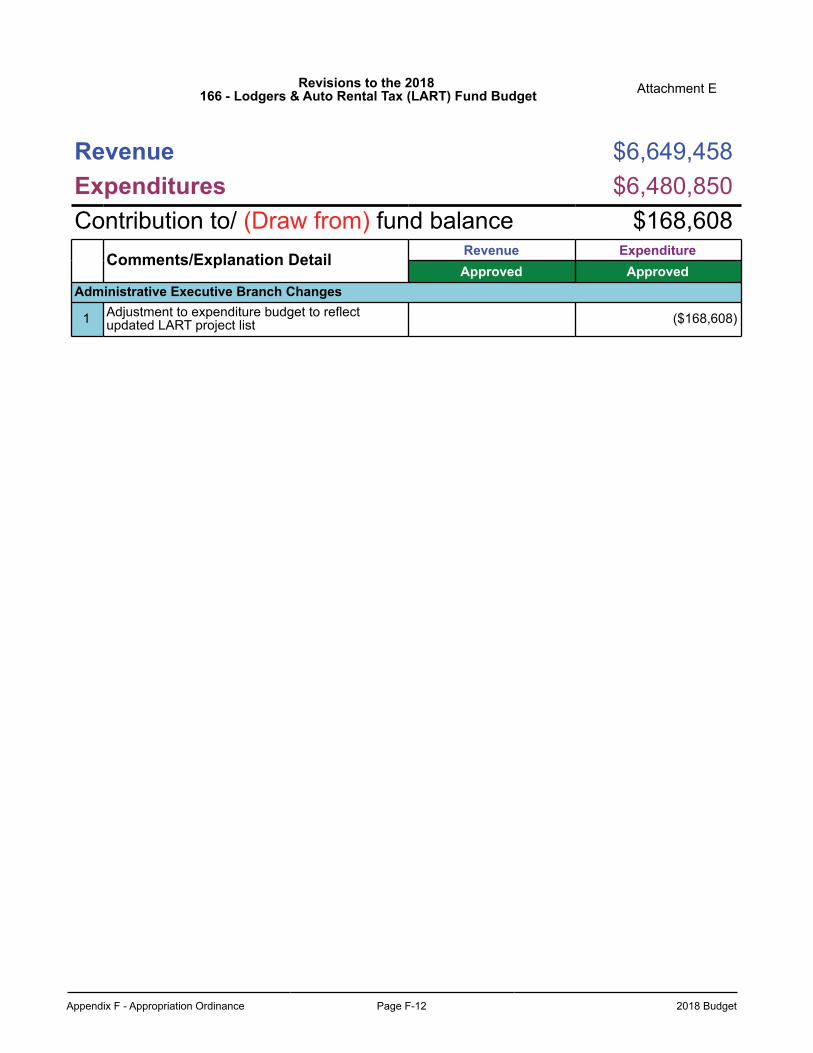
Appendix F - Appropriation Ordinance Page F-12 2018 Budget
Revisions to the 2018 166 - Lodgers & Auto Rental Tax (LART) Fund Budget Attachment E
Revenue $6,649,458Expenditures $6,480,850Contribution to/ (Draw from) fund balance $168,608
Comments/Explanation Detail Revenue ExpenditureApproved Approved
Administrative Executive Branch Changes
1 Adjustment to expenditure budget to reflectupdated LART project list ($168,608)
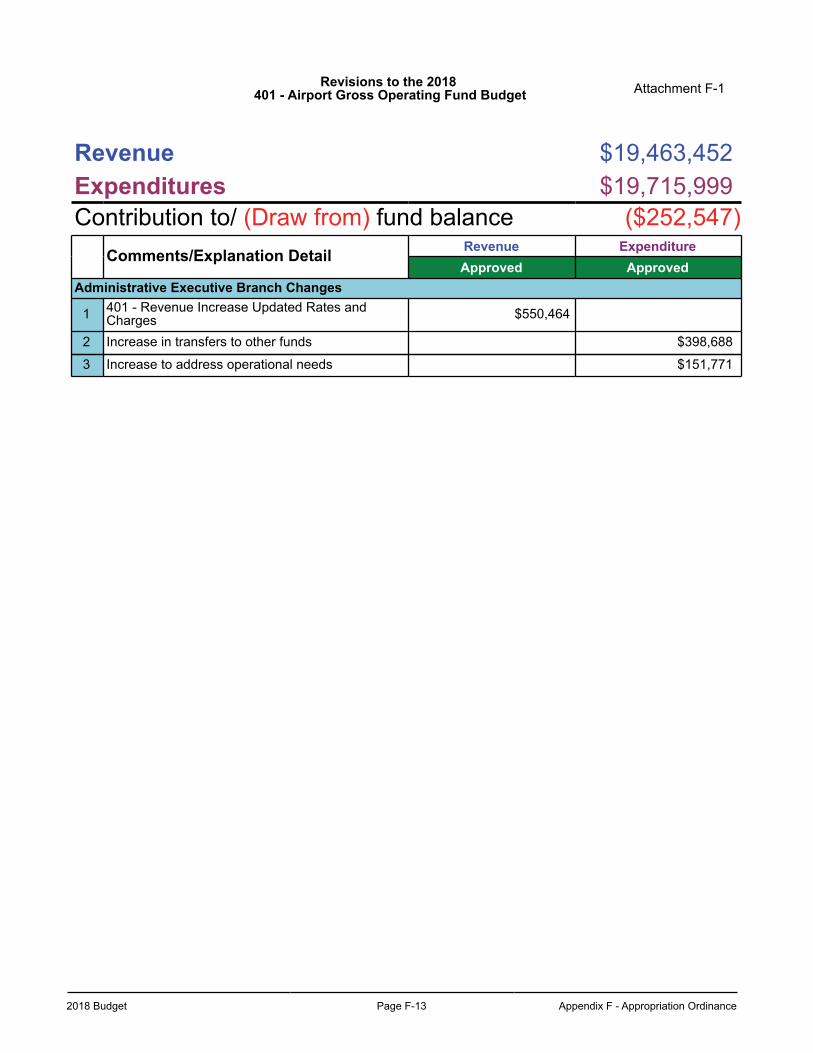
2018 Budget Page F-13 Appendix F - Appropriation Ordinance
Revisions to the 2018 401 - Airport Gross Operating Fund Budget Attachment F-1
Revenue $19,463,452Expenditures $19,715,999Contribution to/ (Draw from) fund balance ($252,547)
Comments/Explanation Detail Revenue ExpenditureApproved Approved
Administrative Executive Branch Changes
1 401 - Revenue Increase Updated Rates andCharges $550,464
2 Increase in transfers to other funds $398,688
3 Increase to address operational needs $151,771
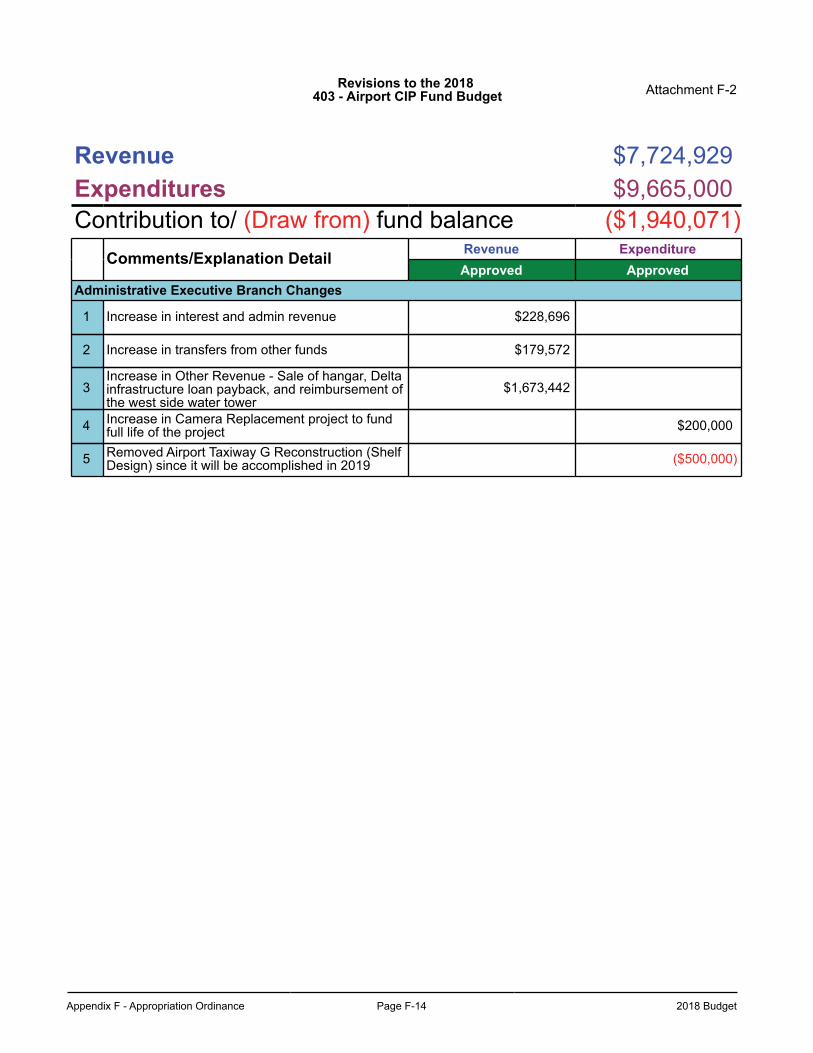
Appendix F - Appropriation Ordinance Page F-14 2018 Budget
Revisions to the 2018 403 - Airport CIP Fund Budget Attachment F-2
Revenue $7,724,929Expenditures $9,665,000Contribution to/ (Draw from) fund balance ($1,940,071)
Comments/Explanation Detail Revenue ExpenditureApproved Approved
Administrative Executive Branch Changes
1 Increase in interest and admin revenue $228,696
2 Increase in transfers from other funds $179,572
3Increase in Other Revenue - Sale of hangar, Deltainfrastructure loan payback, and reimbursement ofthe west side water tower
$1,673,442
4 Increase in Camera Replacement project to fundfull life of the project $200,000
5 Removed Airport Taxiway G Reconstruction (ShelfDesign) since it will be accomplished in 2019 ($500,000)
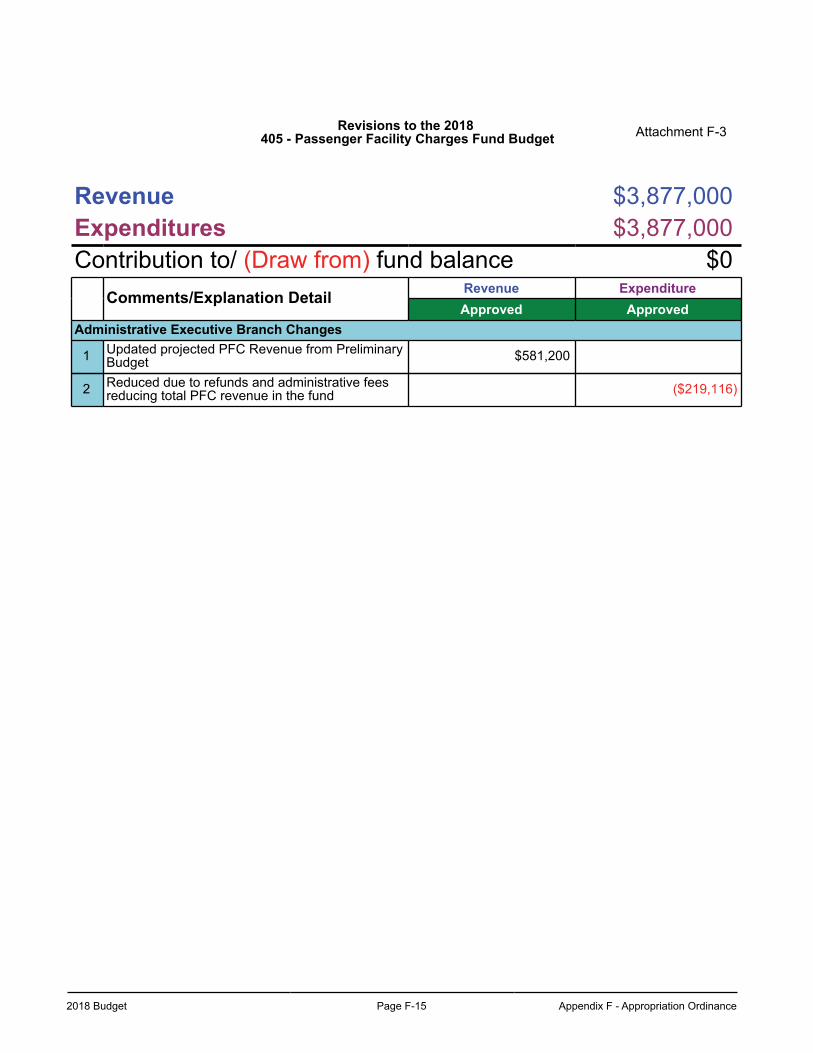
2018 Budget Page F-15 Appendix F - Appropriation Ordinance
Revisions to the 2018 405 - Passenger Facility Charges Fund Budget Attachment F-3
Revenue $3,877,000Expenditures $3,877,000Contribution to/ (Draw from) fund balance $0
Comments/Explanation Detail Revenue ExpenditureApproved Approved
Administrative Executive Branch Changes
1 Updated projected PFC Revenue from PreliminaryBudget $581,200
2 Reduced due to refunds and administrative feesreducing total PFC revenue in the fund ($219,116)
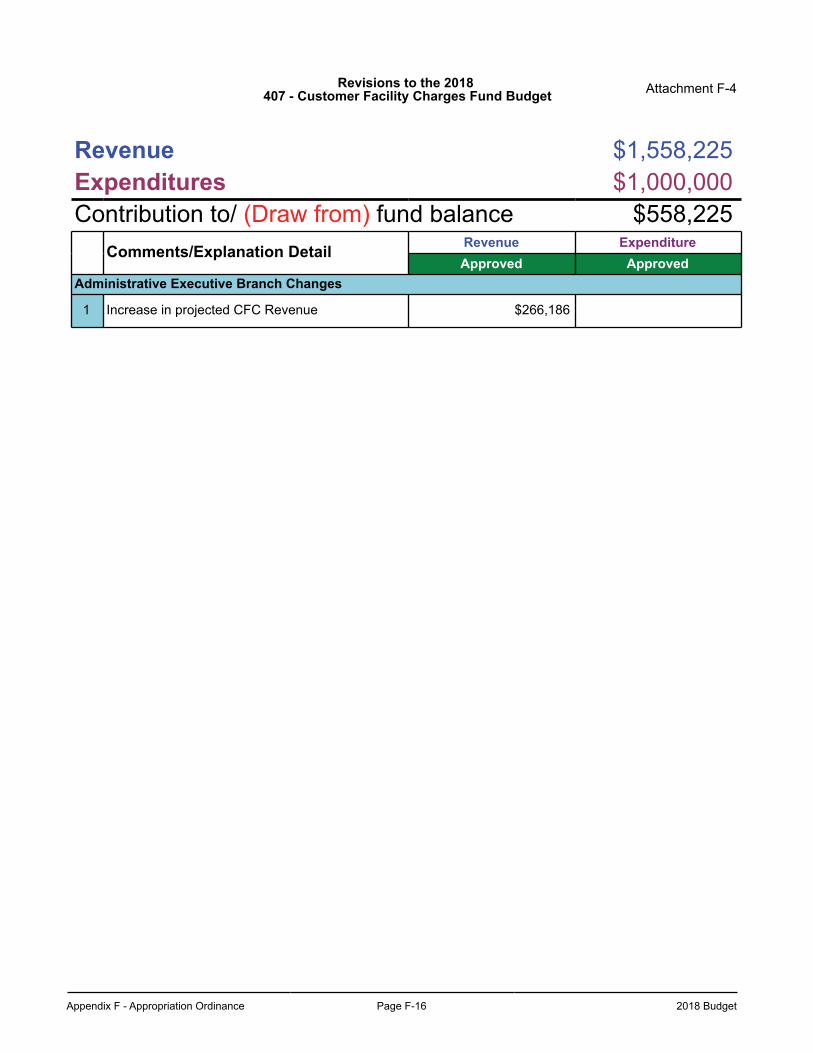
Appendix F - Appropriation Ordinance Page F-16 2018 Budget
Revisions to the 2018 407 - Customer Facility Charges Fund Budget Attachment F-4
Revenue $1,558,225Expenditures $1,000,000Contribution to/ (Draw from) fund balance $558,225
Comments/Explanation Detail Revenue ExpenditureApproved Approved
Administrative Executive Branch Changes
1 Increase in projected CFC Revenue $266,186
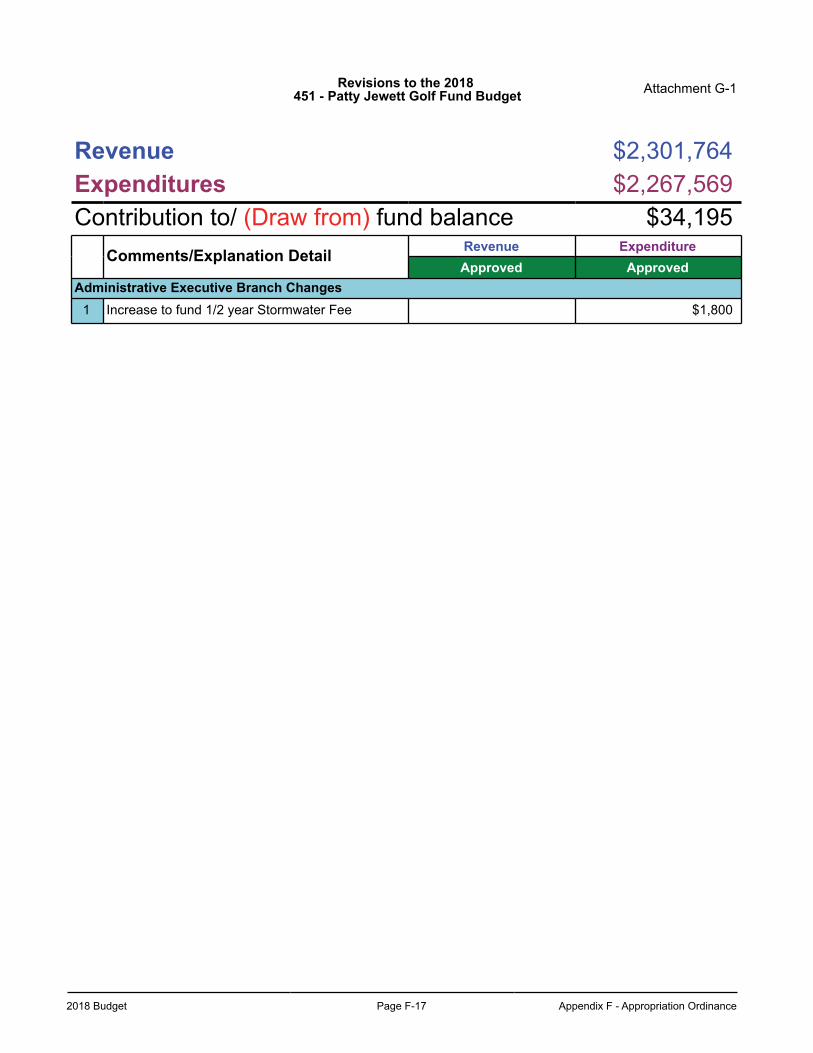
2018 Budget Page F-17 Appendix F - Appropriation Ordinance
Revisions to the 2018 451 - Patty Jewett Golf Fund Budget Attachment G-1
Revenue $2,301,764Expenditures $2,267,569Contribution to/ (Draw from) fund balance $34,195
Comments/Explanation Detail Revenue ExpenditureApproved Approved
Administrative Executive Branch Changes1 Increase to fund 1/2 year Stormwater Fee $1,800
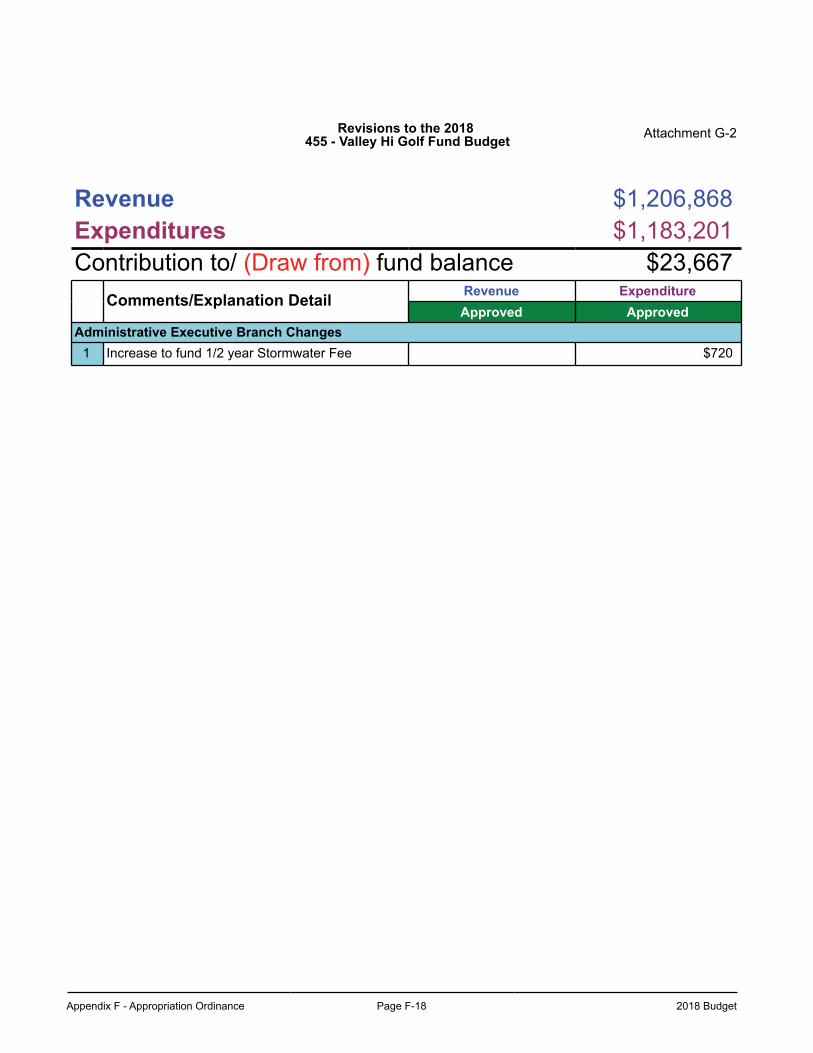
Appendix F - Appropriation Ordinance Page F-18 2018 Budget
Revisions to the 2018 455 - Valley Hi Golf Fund Budget Attachment G-2
Revenue $1,206,868Expenditures $1,183,201Contribution to/ (Draw from) fund balance $23,667
Comments/Explanation Detail Revenue ExpenditureApproved Approved
Administrative Executive Branch Changes1 Increase to fund 1/2 year Stormwater Fee $720
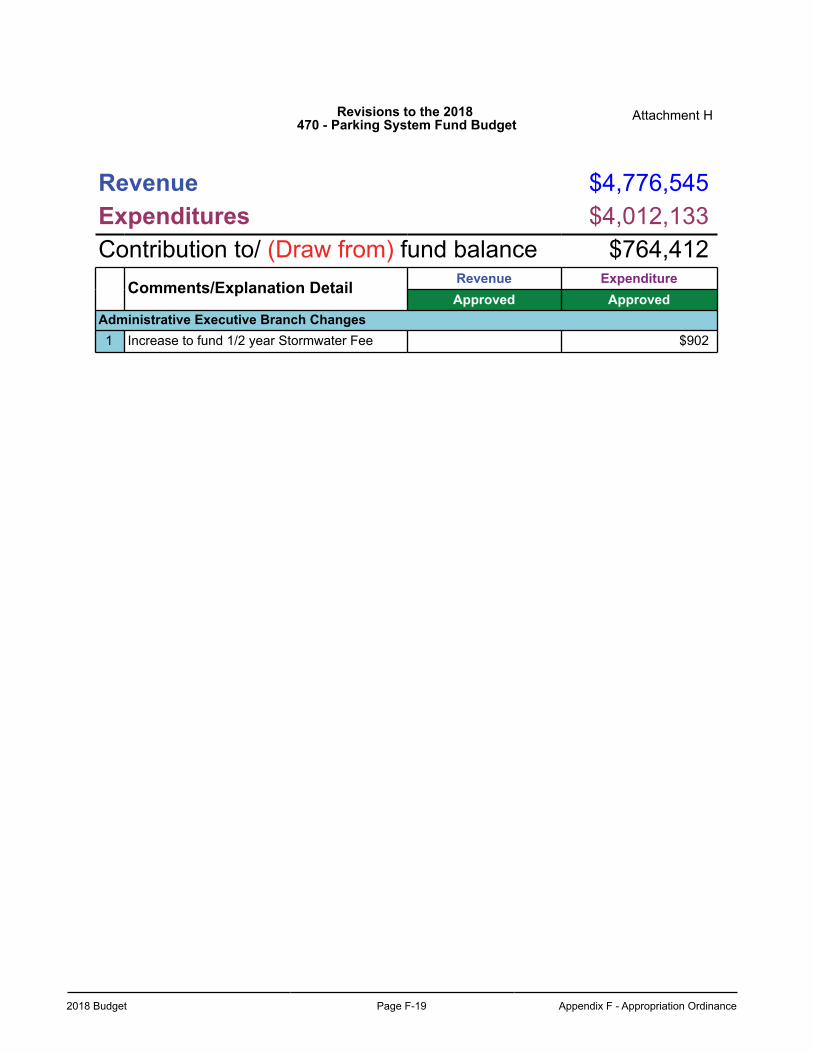
2018 Budget Page F-19 Appendix F - Appropriation Ordinance
Revisions to the 2018 470 - Parking System Fund Budget
Attachment H
Revenue $4,776,545Expenditures $4,012,133Contribution to/ (Draw from) fund balance $764,412
Comments/Explanation Detail Revenue ExpenditureApproved Approved
Administrative Executive Branch Changes1 Increase to fund 1/2 year Stormwater Fee $902
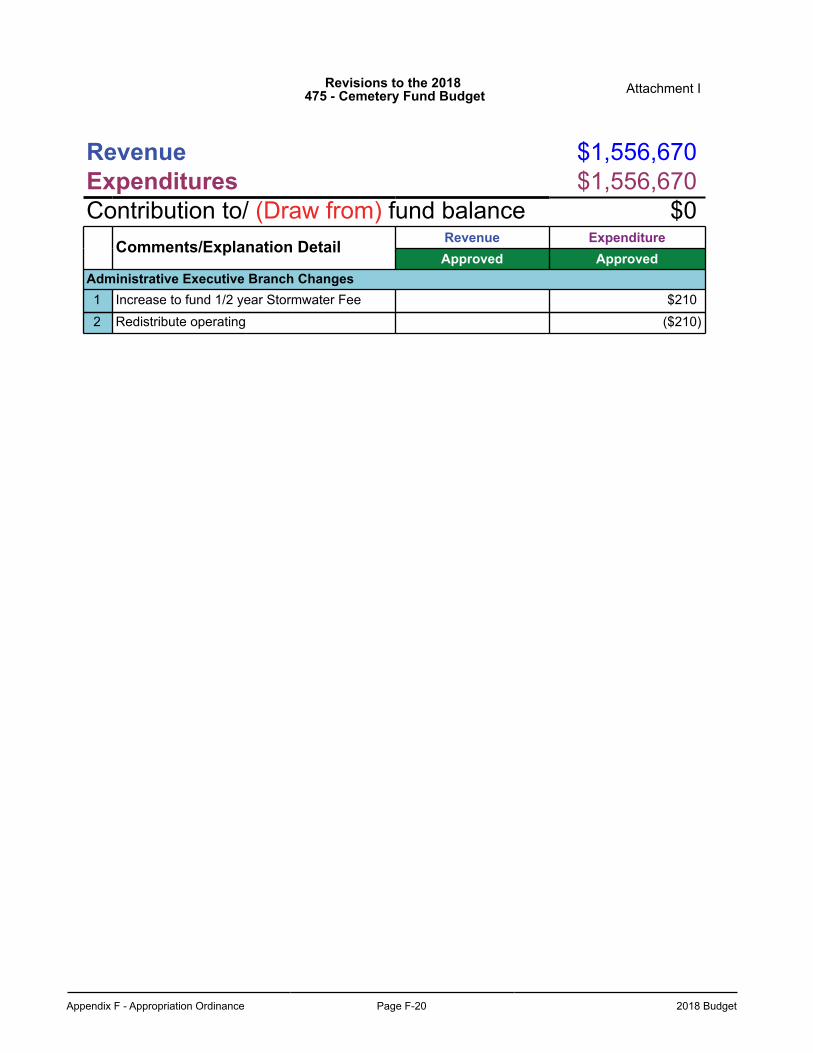
Appendix F - Appropriation Ordinance Page F-20 2018 Budget
Revisions to the 2018 475 - Cemetery Fund Budget Attachment I
Revenue $1,556,670Expenditures $1,556,670Contribution to/ (Draw from) fund balance $0
Comments/Explanation Detail Revenue ExpenditureApproved Approved
Administrative Executive Branch Changes1 Increase to fund 1/2 year Stormwater Fee $2102 Redistribute operating ($210)
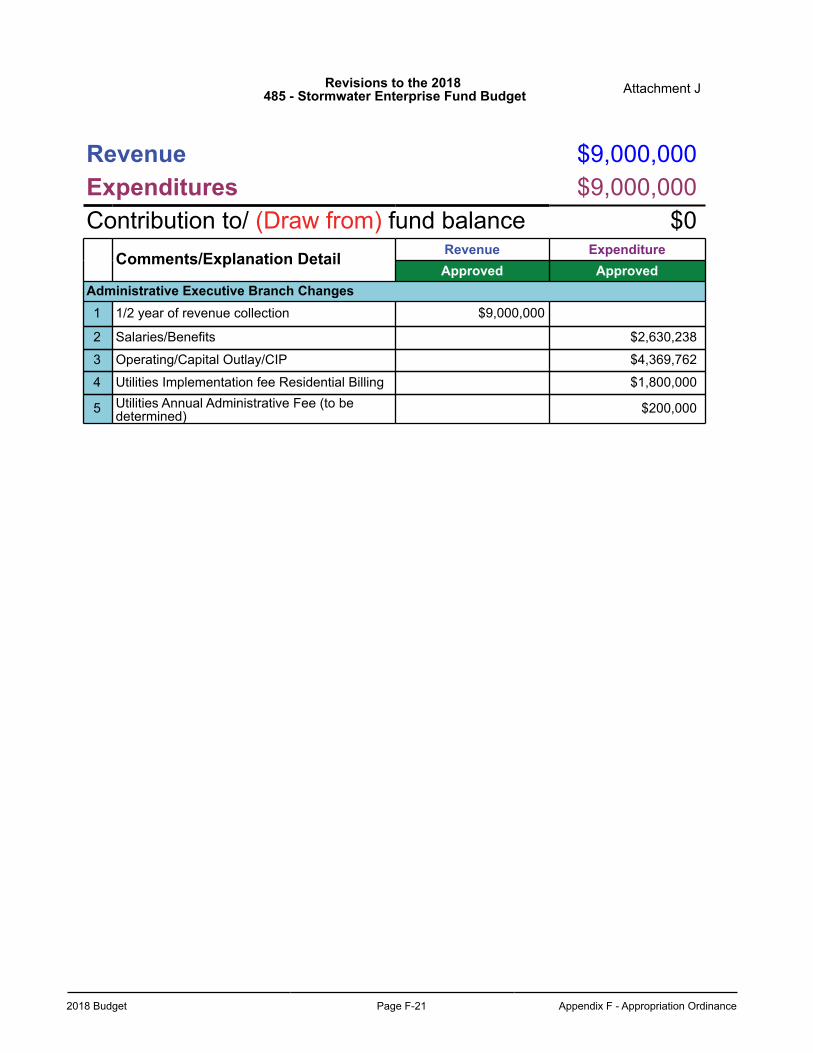
2018 Budget Page F-21 Appendix F - Appropriation Ordinance
Revisions to the 2018 485 - Stormwater Enterprise Fund Budget Attachment J
Revenue $9,000,000Expenditures $9,000,000Contribution to/ (Draw from) fund balance $0
Comments/Explanation Detail Revenue ExpenditureApproved Approved
Administrative Executive Branch Changes1 1/2 year of revenue collection $9,000,000
2 Salaries/Benefits $2,630,238
3 Operating/Capital Outlay/CIP $4,369,762
4 Utilities Implementation fee Residential Billing $1,800,000
5 Utilities Annual Administrative Fee (to bedetermined) $200,000
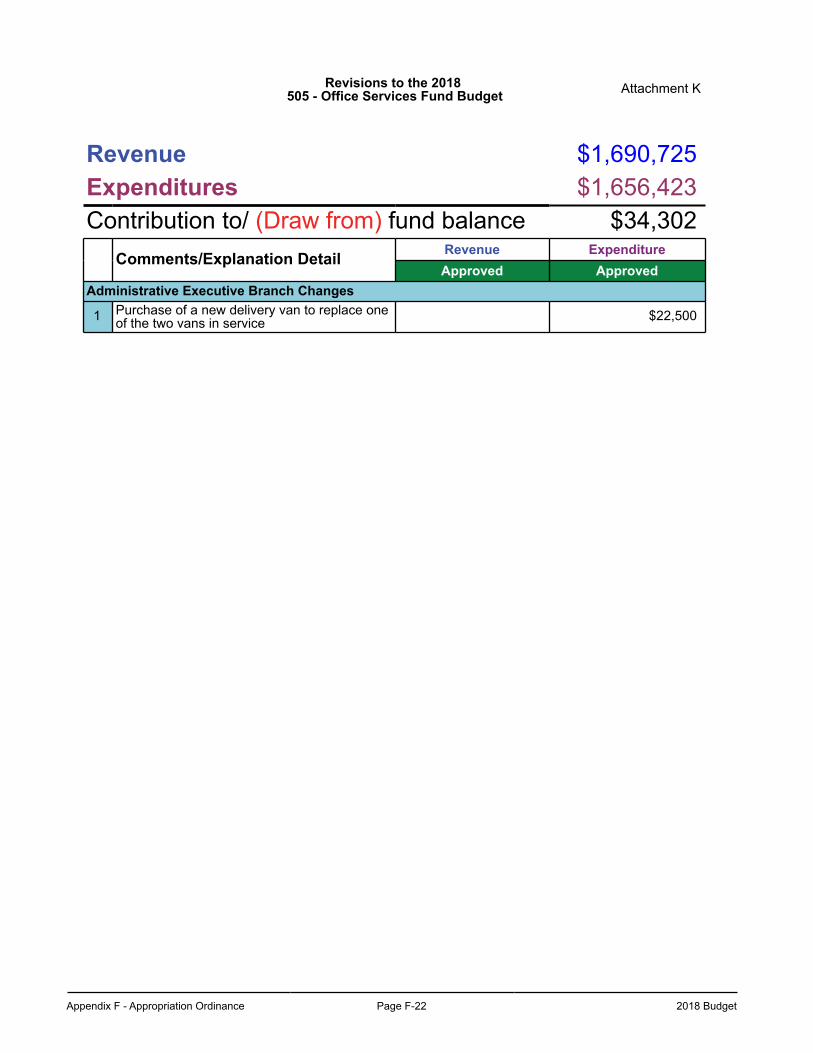
Appendix F - Appropriation Ordinance Page F-22 2018 Budget
Revisions to the 2018 505 - Office Services Fund Budget Attachment K
Revenue $1,690,725Expenditures $1,656,423Contribution to/ (Draw from) fund balance $34,302
Comments/Explanation Detail Revenue ExpenditureApproved Approved
Administrative Executive Branch Changes
1 Purchase of a new delivery van to replace oneof the two vans in service $22,500
2018 Budget Page G-1 Appendix G - Index
IndexAirport ........................................................................................................ 2-15, 2-32, 2-35, 2-57, 2-73, 24-1Airport Grants Fund .............................................................................................................. 2-36, 2-55, 24-1All Funds Summary .................................................................................................................................... 2-35Allocations and Internal Services Charges ................................................................................................. 11-1Arterial Roadway Fund ................................................................................................................... 2-36, 2-45Ballfield Capital Improvements Fund .............................................................................................. 2-36, 2-40Banning Lewis Ranch Fund ........................................................................................................... 2-36, 2-45Bicycle Tax Fund .................................................................................................................. 2-36, 2-45, 23-21Briargate SIMD Fund ........................................................................................................... 2-18, 2-36, 20-32Budget Development ...................................................................................................................... Appendix A-1C.D. Smith Trust Fund ................................................................................................................................ 2-54Cable Franchise Fund ............................................................................... 2-36, 2-49, 2-73, 14-1, 15-1, 16-1Capital Improvements Program (CIP) ............................................................................................ 2-47, 32-1Cemetery Enterprise ...................................................................................................................... 2-35, 25-1Cemetery Endowment Fund ....................................................................................................................... 2-54City Attorney ............................................................................................................................................... 3-1City Auditor ................................................................................................................................................. 6-1City Clerk .................................................................................................................................................... 4-1City Council ................................................................................................................................................ iv, 7-1City Engineering ......................................................................................................................................... 23-3City Leadership .......................................................................................................................................... iiiCity Organizational Chart ........................................................................................................................... ixClaims Reserve Fund ..................................................................................................................... 2-35, 17-13Code Enforcement (see Neighborhood Services) ...................................................................................... 21-11Colorado Avenue Gateway SIMD Fund ......................................................................................... 2-36, 20-36Communications ........................................................................................................................................ 16-1Community Development (f/k/a Housing) ................................................................................................... 9-1Community Development Block Grant (CDBG) Fund .......................................................... 2-36, 2-55, 9-4Community Profile ...................................................................................................................................... xiiContract Compliance & Sustainability (see Innovation & Sustainability) .................................................... 18-1Conservation Trust ...................................................................................................... 2-36, 2-40, 20-2, 20-21Cultural Services ........................................................................................................................................ 20-3Debt Overview ............................................................................................................................................ 2-57Development Review Enterprise .................................................................................................... 2-15, 26-1Economic Development ............................................................................................................................. 10-1Economic Overview .................................................................................................................................... 2-29Emergency Shelter Act Grant (ESG) .............................................................................................. 2-55, 9-5Employee Benefits Self-Insurance Fund ........................................................................................ 2-37, 17-3Employment Services ................................................................................................................................. 17-3Expenditure Overview ................................................................................................................................ 2-3Expenditure Summary Table ...................................................................................................................... 2-9Finance ...................................................................................................................................................... 8-1
Appendix G - Index Page G-2 2018 Budget
Financial Policies ........................................................................................................................... Appendix B-1Fire ............................................................................................................................................................. 12-1Forestry ...................................................................................................................................................... 20-21General Costs ............................................................................................................................................ 11-1General Fund Financial Forecast ............................................................................................................... 2-1Gift Trust Fund ..................................................................................................................... 2-36, 2-50, 20-2Glossary of Terms .......................................................................................................................... Appendix D-1Golf Enterprise ............................................................................................................................... 2-16, 27-1Government Finance Officers Association Award ....................................................................................... xivGrants Overview ........................................................................................................................................ 2-65HOME Grant ........................................................................................................................ 2-36, 2-55, 9-3Housing (see Community Development) .................................................................................................... 9-1Human Resources ..................................................................................................................................... 17-1Information Technology .............................................................................................................................. 14-1Innovation & Sustainability ......................................................................................................................... 18-1Internal Service Funds ................................................................................................................... 2-37, 2-54Land Use Review ....................................................................................................................................... 21-3Level of Effort Overview ............................................................................................................................. 2-27Lodgers and Automobile Rental Tax (LART) Fund.............................................. 2-31, 2-36, 2-50, 2-51, 30-1Mayor's Office ............................................................................................................................................ 15-1Mayor's Letter ............................................................................................................................................. vMemorial Health System Enterprise Fund ...................................................................................... 2-15, 28-1Municipal Court .......................................................................................................................................... 5-1Neighborhood Services (f/k/a Code Enforcement) ..................................................................................... 21-11Norwood SIMD Fund ............................................................................................................ 2-41, 20-36Office Services Fund ...................................................................................................................... 2-17, 18-1Office of Emergency Management ............................................................................................................. 13-1Old Colorado City Maintenance & Security District SIMD Fund ........................................... 2-18, 2-41, 20-36Park Land Dedication Ordinance (PLDO) ...................................................................................... 2-36, 2-42Park Planning and Development ................................................................................................................ 21-1Parking System Enterprise ............................................................................................................. 2-16, 29-1Parks, Recreation and Cultural Services .................................................................................................... 20-1Performance Measures .............................................................................................................................. 1-27Permanent Funds ....................................................................................................................................... 2-35Personnel Overview ................................................................................................................................... 2-69Pikes Peak – America’s Mountain ........................................................................................ 2-16, 2-37, 30-1Pikes Peak Rural Transportation Authority (PPRTA) ................ 20-11, 20-17, 23-3, 23-11, 23-21, 23-29, 32-2Planning and Development ........................................................................................................................ 21-1Platte Avenue SIMD ............................................................................................................. 2-18, 2-36, 20-36Police ......................................................................................................................................................... 22-1
Public Safety Sales Tax (PSST) ............................................... 2-14, 2-27, 2-36, 2-47, 2-69, 12-1, 22-1, 32-7Public Works .............................................................................................................................................. 23-1Public Works Operations and Maintenance (f/k/a Streets) ......................................................................... 23-11Radio Fund .................................................................................................................. 2-17, 2-37, 2-54, 14-1Real Estate Services .................................................................................................................................. 21-19
2018 Budget Page G-3 Appendix G - Index
Recreation and Administration ................................................................................................................... 20-57Revenue Detail ............................................................................................................................... Appendix C-1Revenue Overview ..................................................................................................................................... 2-21Risk Management ...................................................................................................................................... 17-13Road Repair, Maintenance and Improvements Sales and Use Tax Fund........... 2-36, 2-45, 23-2, 23-11, 32-7Salary Structure - 2018 .................................................................................................................. Appendix E-1Senior Programs Fund ................................................................................................................... 2-36, 2-52Special Improvement Maintenance District (SIMD) .............................................................. 2-18, 2-40, 20-30Special Revenue Funds ............................................................................. Appendix C-11, 2-17, 2-35, 2-73Springs at a Glance .................................................................................................................................... xiStetson Hills SIMD Fund ...................................................................................................... 2-19, 2-36, 20-36Stormwater Enterprise ................................................................................................................................Strategic Plan ............................................................................................................................................. 1-1Street Tree Fund .................................................................................................................. 2-36, 2-42, 20-24Streets (see Public Works Operations & Maintenance) .............................................................................. 23-11Subdivision Drainage Fund ............................................................................................................ 2-36, 2-46Table of Contents ....................................................................................................................................... iTaxpayer’s Bill of Rights (TABOR) Calculation ........................................................................................... 2-25Therapeutic Recreation ........................................................................................................ 2-36, 2-42, 20-58Traffic Engineering ..................................................................................................................................... 23-21Transit ........................................................................................................................................................ 23-29Trails, Open Space and Parks (TOPS) ...................................................... 2-17, 2-36, 20-7, 20-11, 20-29, 32-1Water Resources Engineering .................................................................................................................... 23-39Woodstone SIMD Fund ............................................................................................... 2-19, 2-36, 2-44, 20-36Workers’ Compensation Fund .............................................................................................. 2-18, 2-37, 17-13
31-1

Appendix G - Index Page G-4 2018 Budget
This page left blank intentionally.


