Embed Size (px)
Citation preview
VENTURA COUNTY EMPLOYEES’ RETIREMENT ASSOCIATION
BOARD OF RETIREMENT
DISABILITY MEETING
February 1, 2016
AGENDA PLACE: Ventura County Government Center
Hall of Administration- 3rd Floor Multipurpose Room 800 S. Victoria Ave. Ventura, CA 93003
TIME: 9:00 a.m. Members of the public may comment on any item under the Board’s jurisdiction by filling out a speaker form and presenting it to the Clerk. Unless otherwise directed by the Chair, comments related to items on the agenda will be heard when the Board considers that item. Comments related to items not on the agenda will generally be heard at the time designated for Public Comment.
ITEM:
I. CALL TO ORDER Master Page No.
II. APPROVAL OF AGENDA
1 – 4
III. APPROVAL OF MINUTES
A. Business Meeting of January 25, 2016.
5 – 13
IV. RECEIVE AND FILE PENDING DISABILITY APPLICATION STATUS REPORT
14 – 47
V. APPLICATIONS FOR DISABILITY RETIREMENT
A. Application for Service Connected Disability Retirement, Adan Lara (Deceased); Case No. 15-025
48 – 100
1. Application for Service Connected Disability Retirement and Supporting Documentation
2. Hearing Notice served on January 22, 2016.
MASTER PAGE NO. 1
BOARD OF RETIREMENT FEBRUARY 1, 2016 AGENDA DISABILITY MEETING PAGE 2 V. APPLICATIONS FOR DISABILITY RETIREMENT (continued)
B. Application for Non-Service Connected Disability Retirement, Anthony Aguirre (Deceased); Case No. 15-022
101 – 134
1. Application for Non-Service Connected Disability Retirement and Supporting Documentation.
2. Hearing Notice served on January 22, 2016.
C. Application for Service Connected Disability Retirement, Richard Hamilton; Case No. 14-014
135 – 347
1. Application for Service Connected Disability Retirement and Supporting Documentation
2. Hearing Notice served on January 25, 2016.
D. Application for Non-Service Connected Disability Retirement, Elizabeth Barbic; Case No. 14-019.
348 – 433
1. Application for Non-Service Connected Disability Retirement and Supporting Documentation.
2. Hearing Notice served on January 13, 2016.
E. Application for Service Connected Disability Retirement, Josie Garcia; Case No. 15-025
434 – 502
1. Summary of Evidence, Conclusion of Law, and Recommendation, submitted by Hearing Officer Louis M. Zigman, dated December 4, 2015.
2. Hearing Notice served on December 28, 2015.
F. Application for Service Connected Disability Retirement, Glenn Garcia; Case No. 13-034
503 – 539
1. Summary of Evidence, Suggested Findings of Fact and Conclusions of Law, and Recommendation, submitted by Hearing Officer Deborah Z. Wissley, dated January 4, 2016.
2. Hearing Notice served on January 21, 2016.
G. Application for Service Connected Disability Retirement, Jeffrey Titcher; Case No. 13-017
540 – 592
MASTER PAGE NO. 2
BOARD OF RETIREMENT FEBRUARY 1, 2016 AGENDA DISABILITY MEETING PAGE 3 V. APPLICATIONS FOR DISABILITY RETIREMENT (continued)
G. 1. Petition for Reconsideration, submitted by applicant Jeffrey Titcher, dated January 11, 2016.
2. Hearing Notice served on January 12, 2016.
VI. COMPREHENSIVE ANNUAL FINANCIAL REPORT (CAFR)
A. June 30, 2015 Comprehensive Financial Report (CAFR) – Brown Armstrong, Andrew Paulson, Partner. RECOMMENDED ACTION: Approve
593 – 684
1. Brown Armstrong Presentation Agenda Presenter Andrew Paulden, CPA
685
2. Independent Auditor’s Report
686 – 688
3. Auditor’s Report to Management, Year Ending June 30, 2015
689 – 695
VII. NEW BUSINESS
A. Ventura County Employees’ Retirement Information System (VCERIS) Pension Administration Project – Brian Colker, Linea Solutions, Inc.
696 – 697
1. VCERIS Project Quarterly Status Update RECOMMENDED ACTION: Receive and file.
698 – 709
2. VCERIS Project Monthly Status Update- October 2015 RECOMMENDED ACTION: Receive and file.
710 – 711
3. VCERIS Project Monthly Status Update- November 2015 RECOMMENDED ACTION: Receive and file.
712
4. VCERIS Project Monthly Status Update- December 2015 RECOMMENDED ACTION: Receive and file.
713
B. Discussion of Meal Reimbursement Policy
1. Staff Letter
714
2. SACRS Systems’ Travel Policy Excerpts
715 – 723
C. Quarterly Retirement Administrator’s Report for October – December, 2015. RECOMMENDED ACTION: Receive and file.
724 – 725
MASTER PAGE NO. 3
BOARD OF RETIREMENT FEBRUARY 1, 2016 AGENDA DISABILITY MEETING PAGE 4 VIII. PUBLIC COMMENT
IX. STAFF COMMENT
X. BOARD MEMBER COMMENT
XI. ADJOURNMENT
MASTER PAGE NO. 4
VENTURA COUNTY EMPLOYEES’ RETIREMENT ASSOCIATION
BOARD OF RETIREMENT
BUSINESS MEETING
January 25, 2016
MINUTES DIRECTORS PRESENT:
Tracy Towner, Chair, Alternate Safety Employee Member William W. Wilson, Vice Chair, Public Member Steven Hintz, Treasurer-Tax Collector Peter C. Foy, Public Member Mike Sedell, Public Member Joseph Henderson, Public Member Craig Winter, General Employee Member Chris Johnston, Safety Employee Member Arthur E. Goulet, Retiree Member Will Hoag, Alternate Retiree Member
DIRECTORS ABSENT:
Deanna McCormick, General Employee Member
STAFF PRESENT:
Linda Webb, Retirement Administrator Lori Nemiroff, Assistant County Counsel Dan Gallagher, Chief Investment Officer Chantell Garcia, Retirement Benefits Specialist Stephanie Caiazza, Program Assistant
PLACE:
Ventura County Employees' Retirement Association Second Floor Boardroom 1190 South Victoria Avenue Ventura, CA 93003
TIME:
9:00 a.m.
MASTER PAGE NO. 5

BOARD OF RETIREMENT JANUARY 25, 2016 MINUTES BUSINESS MEETING PAGE 2 ITEM:
I. CALL TO ORDER Chair Towner called the Business Meeting of January 25, 2016, to order at 9:05 a.m.
II. APPROVAL OF AGENDA MOTION: Approve. Moved by Goulet, seconded by Hintz. Vote: Motion carried Yes: Goulet, Hintz, Foy, Johnston, Henderson, Sedell, Winter, Wilson, Towner No: - Absent: McCormick
III. APPROVAL OF MINUTES
A. Disability Meeting of January 4, 2016. MOTION: Approve. Moved by Wilson, seconded by Johnston. Vote: Motion carried Yes: Goulet, Hintz, Foy, Johnston, Henderson, Winter, Wilson, Towner No: - Absent: McCormick Abstain: Sedell
IV. CONSENT AGENDA
A. Approve Regular and Deferred Retirements and Survivors Continuances for the Month of December 2015.
B. Receive and File Report of Checks Disbursed in December 2015.
C. Receive and File Budget Summary for FY 2015-16 Month Ending December 31, 2015.
MASTER PAGE NO. 6
BOARD OF RETIREMENT JANUARY 25, 2016 MINUTES BUSINESS MEETING PAGE 3 MOTION: Approve the Consent Agenda.
Moved by Wilson, seconded by Henderson. Vote: Motion carried Yes: Goulet, Hintz, Foy, Johnston, Henderson, Sedell, Winter, Wilson, Towner No: - Absent: McCormick
V. INVESTMENT INFORMATION
A. NEPC – Allan Martin, Partner Dan Gallagher, VCERA Chief Investment Officer
1. Preliminary Performance Report Month Ending December 31, 2015 RECOMMENDED ACTION: Receive and file. After discussion by the Board and Mr. Martin, the following motion was made: MOTION: Receive and file. Moved by Winter, seconded by Goulet. Vote: Motion carried Yes: Goulet, Hintz, Foy, Johnston, Henderson, Sedell, Winter, Wilson, Towner No: - Absent: McCormick
VI. ACTUARIAL INFORMATION
A. Review and Approval of Annual Actuarial Information Report as of June 30, 2015 – The Segal Company, Paul Angelo and John Monroe.
1. June 30, 2015 Actuarial Valuation Report In response to a question from Catherine Rodriguez, Ventura County Chief Financial Officer, regarding the effective date of the new contribution rates, Ms. Nemiroff stated that the changes must be implemented within 90 days of the start of the fiscal year. After discussion by the Board and consultants, the following motion was made:
MASTER PAGE NO. 7
BOARD OF RETIREMENT JANUARY 25, 2016 MINUTES BUSINESS MEETING PAGE 4
MOTION: Approve. Moved by Goulet, seconded by Henderson. Vote: Motion carried Yes: Goulet, Hintz, Foy, Johnston, Henderson, Sedell, Winter, Wilson, Towner No: - Absent: McCormick
2. June 30, 2015 GAS 67 Actuarial Valuation Report MOTION: Approve. Moved by Hintz, seconded by Winter. Vote: Motion carried Yes: Goulet, Hintz, Foy, Johnston, Henderson, Sedell, Winter, Wilson, Towner No: - Absent: McCormick
B. Recommendation to Approve PEPRA Annual Compensation Limit
1. Staff Letter
2. California Actuarial Advisory Panel PEPRA Pension Compensation Limits for the Calendar Year 2016 MOTION: Adopt the 2016 PEPRA Compensation Limits of $117,020 and $140,424 as calculated by the California Actuarial Advisory Panel (CAAP). Moved by Wilson, seconded by Winter. Vote: Motion carried Yes: Goulet, Hintz, Foy, Johnston, Henderson, Sedell, Winter, Wilson, Towner No: - Absent: McCormick
VII. OLD BUSINESS
A. Adoption of Resolution Pursuant to AB1291
1. Staff Letter
MASTER PAGE NO. 8

BOARD OF RETIREMENT JANUARY 25, 2016 MINUTES BUSINESS MEETING PAGE 5
2. Draft Resolution
MOTION: Adopt proposed Resolution re: District Status and Application of Government Code Section 31522.10 in Ventura County. Moved by Hintz, seconded by Sedell. Vote: Motion carried Yes: Goulet, Hintz, Foy, Johnston, Henderson, Sedell, Winter, Wilson, Towner No: - Absent: McCormick
B. Discussion of CPI Methodology, Trustee Johnston
1. Staff Letter
2. CPI Basis for Annual COLA Adjustments (Segal)
3. VCERA COLA as of April 1, 2015 (Segal)
4. Statutory COLA Provision
5. CERL System Methodology Survey Table
6. Bureau of Labor Statistics Table Through December 2015
7. Year End Volatility Spreadsheet (Trustee Johnston) After discussion by the Board, staff, and consultants, the following motion was made: MOTION: Change the Consumer Price Index (CPI) measurement used to determine retiree COLA adjustments to an average annual CPI measure from year to year. Moved by Johnston, seconded by Hintz. Following discussion by the Board, Trustee Johnston withdrew his motion. The following motion was made: MOTION: Continue this matter at the business meeting of March 21, 2016, to allow time for feedback from stakeholders. Moved by Sedell, seconded by Hintz.
MASTER PAGE NO. 9
BOARD OF RETIREMENT JANUARY 25, 2016 MINUTES BUSINESS MEETING PAGE 6
Vote: Motion carried Yes: Goulet, Hintz, Foy, Johnston, Henderson, Sedell, Winter, Wilson, Towner No: - Absent: McCormick
C. Adoption of Corrected IRS Model Regulation for IRC Code §401(a) and Board Resolution Adopting Tax Compliance Regulations RECOMMENDED ACTION: Approve.
1. Staff Letter
2. Model Regulation: 401(a) – Distribution Limits (Corrected) MOTION: Adopt the provided 401(A) Distribution Limits Regulation, which includes the establishment of a bona fide separation from service period of 60 days. Moved by Foy, seconded by Sedell. Vote: Motion carried Yes: Goulet, Hintz, Foy, Johnston, Henderson, Sedell, Winter, Wilson, Towner No: - Absent: McCormick
3. Board Resolution Adopting Tax Compliance Regulations RECOMMENDED ACTION: Approve. MOTION: Approve. Moved by Goulet, seconded by Henderson. Vote: Motion carried Yes: Goulet, Hintz, Foy, Johnston, Henderson, Sedell, Winter, Wilson, Towner No: - Absent: McCormick Ms. Webb stated that this resolution will be effective once adopted by the Board of Supervisors. Ms. Webb informed the Board that this resolution will be on the agenda for the Board of Supervisors meeting on January 26, 2016, and that she will be present at the meeting to answer any questions.
MASTER PAGE NO. 10
BOARD OF RETIREMENT JANUARY 25, 2016 MINUTES BUSINESS MEETING PAGE 7
D. Consideration and Possible Approval of Merit Increase for Linda Webb,
Retirement Administrator This item was previously considered by the Board in Closed Session at the disability meeting of January 4, 2016. The following motion was made: MOTION: Approve merit increase of 5% for Retirement Administrator Linda Webb. Moved by Goulet, seconded by Wilson. Vote: Motion carried Yes: Goulet, Hintz, Foy, Johnston, Henderson, Sedell, Winter, Wilson, Towner No: - Absent: McCormick
VIII. NEW BUSINESS
A. Request to Retroactively Approve Chair Towner and Chief Investment Officer Dan Gallagher’s Attendance at 2016 NEPC Public Funds Workshop from January 11 – 12, 2016 in Tempe, AZ.
1. NEPC Public Funds Workshop Report, Submitted by Chair Towner and CIO Dan Gallagher MOTION: Retroactively approve attendance at NEPC’s 2016 Public Funds Workshop and reimbursement of travel expenses for VCERA Board Chair Tracy Towner and CIO Dan Gallagher. Moved by Sedell, seconded by Johnston. Vote: Motion carried Yes: Goulet, Hintz, Foy, Johnston, Henderson, Sedell, Winter, Wilson, Towner No: - Absent: McCormick
X. INFORMATIONAL
A. CORPaTH Summit Report, Submitted by Trustee McCormick After discussion by the Board, the following motion was made:
MASTER PAGE NO. 11
BOARD OF RETIREMENT JANUARY 25, 2016 MINUTES BUSINESS MEETING PAGE 8
MOTION: Receive and file. Moved by Winter, seconded by Johnston. Vote: Motion carried Yes: Goulet, Hintz, Foy, Johnston, Henderson, Sedell, Winter, Wilson, Towner No: - Absent: McCormick
B. State Street Servicing of US Public Retirement Plans Update MOTION: Receive and file. Moved by Foy, seconded by Sedell. Vote: Motion carried Yes: Goulet, Hintz, Foy, Johnston, Henderson, Sedell, Winter, Wilson, Towner No: - Absent: McCormick
XI. XII.
PUBLIC COMMENT None. STAFF COMMENT Mr. Gallagher and Ms. Webb had several updates and announcements to provide to the Board. Mr. Gallagher informed the Board of State Street’s settlement with the SEC regarding a pay to play issue that occurred in 2010 and 2011. Mr. Gallagher updated the Board on the liquidation of VCERA’s global bond portfolios with PIMCO and Loomis Sayles. Mr. Gallagher requested that the trustees inform him if they are interested in attending a meeting with David Rubenstein, Co-Founder and Co-CEO of The Carlyle Group, on February 3, 2016. Trustee Johnston expressed interest in attending the meeting.
MASTER PAGE NO. 12
BOARD OF RETIREMENT JANUARY 25, 2016 MINUTES BUSINESS MEETING PAGE 9 Mr. Gallagher informed the Board that a due diligence visit to Pantheon and
NEPC in San Francisco was tentatively scheduled for February 29, 2016. Trustee Sedell and Trustee Wilson expressed interest in attending. Ms. Webb stated that Brian Colker of Linea Solutions will be present at the February 1, 2016 disability meeting to provide an update on the VCERIS pension administration system project. She indicated that User Acceptance Training (UAT) was progressing well. Ms. Webb informed the Board that iPads for viewing meeting materials will likely be available for the trustees by the February 22, 2016 business meeting. Ms. Webb informed the Board that the IRS Qualification filing documents were being completed and submitted that week. Lastly, Ms. Webb announced that the remaining Board of Retirement meetings through April 2016 are scheduled to take place off-site in the Multipurpose Room, located in the Hall of Administration at the Ventura County Government Center.
XIII. BOARD MEMBER COMMENT None.
XIV. ADJOURNMENT The Chairman adjourned the meeting from closed session at 11:19 a.m. Respectfully submitted,
___________________________________ LINDA WEBB, Retirement Administrator Approved, ___________________________ TRACY TOWNER, Chairman
MASTER PAGE NO. 13

destinations
VENTURA COUNTY EMPLOYEES’ RETIREMENT
ASSOCIATION2015 ANNUAL REPORTPension Trust Fund for the County of Ventura, California
Comprehensive Annual Financial Report for the Fiscal Year ended June 30, 2015
MASTER PAGE NO. 593

Comprehensive Annual Financial Report for the Fiscal Year Ended June 30, 2015
Issued by:Linda Webb
Retirement Administrator
VCERAPension Trust Fund for the County of Ventura,
Ventura County Courts and two Special Districts
1190 South Victoria Avenue, Suite 200, Ventura, CA 93003-6572805.339.4250 • 805.339.4269 (fax) • www.vcera.org
VENTURA COUNTY EMPLOYEES’ RETIREMENT
ASSOCIATION2015 ANNUAL REPORT
Destinations Abound in Ventura County Ventura County is truly blessed with a host of beautiful and engaging destination
choices. This year’s annual report presents just a small sampling of what's available for all ages and tastes. Whether you are exploring our vast natural resources or attending one of the year-round festivals and events, there is virtually no end to the list of things
to see and do in beautiful Ventura County.
MASTER PAGE NO. 594
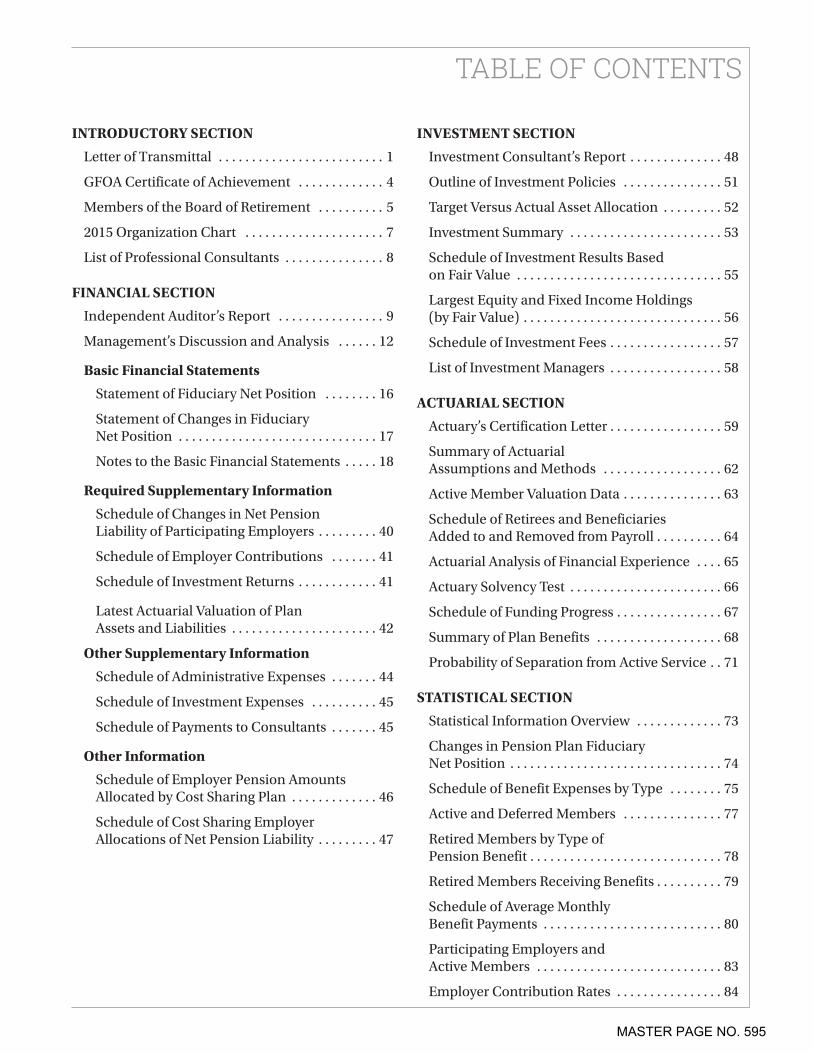
TABLE OF CONTENTS
INTRODUCTORY SECTION
Letter of Transmittal . . . . . . . . . . . . . . . . . . . . . . . . . 1
GFOA Certificate of Achievement . . . . . . . . . . . . . 4
Members of the Board of Retirement . . . . . . . . . . 5
2015 Organization Chart . . . . . . . . . . . . . . . . . . . . . 7
List of Professional Consultants . . . . . . . . . . . . . . . 8
FINANCIAL SECTION
Independent Auditor’s Report . . . . . . . . . . . . . . . . 9
Management’s Discussion and Analysis . . . . . . 12
Basic Financial Statements
Statement of Fiduciary Net Position . . . . . . . . 16
Statement of Changes in Fiduciary Net Position . . . . . . . . . . . . . . . . . . . . . . . . . . . . . . 17
Notes to the Basic Financial Statements . . . . . 18
Required Supplementary Information
Schedule of Changes in Net Pension Liability of Participating Employers . . . . . . . . . 40
Schedule of Employer Contributions . . . . . . . 41
Schedule of Investment Returns . . . . . . . . . . . . 41
Latest Actuarial Valuation of Plan Assets and Liabilities . . . . . . . . . . . . . . . . . . . . . . 42
Other Supplementary Information
Schedule of Administrative Expenses . . . . . . . 44
Schedule of Investment Expenses . . . . . . . . . . 45
Schedule of Payments to Consultants . . . . . . . 45
Other Information
Schedule of Employer Pension Amounts Allocated by Cost Sharing Plan . . . . . . . . . . . . . 46
Schedule of Cost Sharing Employer Allocations of Net Pension Liability . . . . . . . . . 47
INVESTMENT SECTION
Investment Consultant’s Report . . . . . . . . . . . . . . 48
Outline of Investment Policies . . . . . . . . . . . . . . . 51
Target Versus Actual Asset Allocation . . . . . . . . . 52
Investment Summary . . . . . . . . . . . . . . . . . . . . . . . 53
Schedule of Investment Results Based on Fair Value . . . . . . . . . . . . . . . . . . . . . . . . . . . . . . . 55
Largest Equity and Fixed Income Holdings (by Fair Value) . . . . . . . . . . . . . . . . . . . . . . . . . . . . . . 56
Schedule of Investment Fees . . . . . . . . . . . . . . . . . 57
List of Investment Managers . . . . . . . . . . . . . . . . . 58
ACTUARIAL SECTION
Actuary’s Certification Letter . . . . . . . . . . . . . . . . . 59
Summary of Actuarial Assumptions and Methods . . . . . . . . . . . . . . . . . . 62
Active Member Valuation Data . . . . . . . . . . . . . . . 63
Schedule of Retirees and Beneficiaries Added to and Removed from Payroll . . . . . . . . . . 64
Actuarial Analysis of Financial Experience . . . . 65
Actuary Solvency Test . . . . . . . . . . . . . . . . . . . . . . . 66
Schedule of Funding Progress . . . . . . . . . . . . . . . . 67
Summary of Plan Benefits . . . . . . . . . . . . . . . . . . . 68
Probability of Separation from Active Service . . 71
STATISTICAL SECTION
Statistical Information Overview . . . . . . . . . . . . . 73
Changes in Pension Plan Fiduciary Net Position . . . . . . . . . . . . . . . . . . . . . . . . . . . . . . . . 74
Schedule of Benefit Expenses by Type . . . . . . . . 75
Active and Deferred Members . . . . . . . . . . . . . . . 77
Retired Members by Type of Pension Benefit . . . . . . . . . . . . . . . . . . . . . . . . . . . . . 78
Retired Members Receiving Benefits . . . . . . . . . . 79
Schedule of Average Monthly Benefit Payments . . . . . . . . . . . . . . . . . . . . . . . . . . . 80
Participating Employers and Active Members . . . . . . . . . . . . . . . . . . . . . . . . . . . . 83
Employer Contribution Rates . . . . . . . . . . . . . . . . 84
MASTER PAGE NO. 595

INTRODUCTORY SECTION
Hiking and backpacking are some of the more popular activities throughout all of Ventura County. From lush forests to mountain vistas and expansive valleys, there is something for everyone. Near the southern edge of the county, the Sandstone Peak Trail in the Santa Monica Mountains National Recreation Area is a popular hiking location for residents of both Ventura County and neighboring Los Angeles County.
PHOTO BY JOE VERNIG
MASTER PAGE NO. 596

INTRODUCTORY SECTION
2015 COMPREHENSIVE ANNUAL FINANCIAL REPORT 1
January 27, 2016
Board of RetirementVentura County Employees’ Retirement Association1190 South Victoria Avenue, Suite 200Ventura, CA 93003
Dear Board of Retirement Trustees:
It is with pleasure that I submit to you the Comprehensive Annual Financial Report (CAFR) of the Ventura County Employees’ Retirement Association (VCERA, Association, Fund or Plan) for the fiscal year ended June 30, 2015, the 68th year of operation . The report is intended to provide a detailed review of the Association’s financial, actuarial, and investment status . VCERA has the duty and authority to administer plan benefits for employees of the County of Ventura, Ventura County Courts, Ventura County Air Pollution Control District, and Ventura Regional Sanitation District .
VCERA and Its ServicesThe Ventura County Employees’ Retirement Association was established by the County of Ventura in 1947 . VCERA is administered by the Board of Retirement and governed by the County Employees’ Retirement Law of 1937 (California Government Code Section 31450 et . seq .) and the California Public Employees’ Pension Reform Act of 2013 (“PEPRA,” California Government Code Section 7522 et seq .)
The Board of Retirement (Board) is responsible for the general management of VCERA and for determining VCERA’s investment objectives, strategies, and policies . The Board appoints a Retirement Administrator, to whom is delegated the responsibility for overseeing day-to-day management of VCERA and developing its annual budget . Adoption of the budget is subject to approval by the Board .
VCERA is a public employee retirement system whose main function is to provide service retirement, disability, death, and survivor benefits to the safety and general members employed by the County of Ventura . VCERA also provides retirement benefits to the employee members of the Ventura County Courts, Ventura County Air Pollution Control District, and Ventura Regional Sanitation District .
Financial InformationManagement is responsible for the accuracy of the data as well as the completeness and fairness of the presentation of financial information . This includes preparing retirement system financial statements, notes to financial statements, supplementary disclosures, and establishing and maintaining an adequate internal control structure designed to ensure retirement system assets are protected . Management recognizes that even sound internal controls have inherent limitations . Our internal controls are designed to provide reasonable, but not absolute, assurance that these objectives are met . The concept of reasonable assurance recognizes that the cost of a control should not exceed the benefits likely to be derived, and that cost-benefit analysis requires estimates and judgments by management .
LETTER OF TRANSMITTAL
MASTER PAGE NO. 597

INTRODUCTORY SECTION
2015 COMPREHENSIVE ANNUAL FINANCIAL REPORT 2
Brown Armstrong Accountancy Corporation was retained by the Board to perform the annual audit as of June 30, 2015 . The financial audit states that VCERA’s financial statements are prepared in conformity with generally accepted accounting principles and are free of material misstatement .
An overview of VCERA’s fiscal operations is presented in the Management Discussion & Analysis (MD&A) preceding the financial statements . This transmittal letter, when taken into consideration with the MD&A, provides an enhanced picture of the activities of the organization .
Investment ActivitiesThe Board of Retirement’s Investment Policy provides the framework for the management and oversight of VCERA’s investments . The Investment Policy establishes VCERA’s investment objectives and defines the principal duties of the Board, staff, custodian, investment managers, and consultants .
A pension fund’s asset allocation policy implemented in a consistent and disciplined manner is generally recognized to have the most impact on a fund’s performance . The asset allocation process determines a fund’s optimal long-term asset class mix (target allocation), which is expected to achieve a specific set of investment objectives . In March 2015 the Board adopted a revised asset allocation plan, but opted to keep the prior asset allocation targets in place subject to further review .
For the one-year period ending June 30, 2015, the net of fees investment return for the publicly traded U .S . equity portfolio was 7 .3%, non-U .S . equity and global equity returned -5 .1% and -1 .7%, respectively, and private equity returned 13 .6% . U .S . fixed income and global fixed income portfolios returned 0 .7% and -5 .0%, respectively, real estate returned 12 .6%, while liquid alternatives returned -5 .7% . The total Fund returned 1 .7% for the year, underperforming the Policy Benchmark of 3 .4% . Over the five-year and ten-year periods ended June 30, 2015, the total Fund’s annualized return was 11 .6% and 6 .5%, respectively . The chart below compares the actual and policy investment returns for one, five, and ten years .
Actuarial Funding StatusVCERA’s funding objective is to meet long-term benefit requirements by maintaining a well-funded plan . Characteristics of a well-funded plan include a high ratio of accumulated plan assets to meet accrued actuarial liabilities . Sources of funding include employer and employee contributions, and investment income . As of June 30, 2015, VCERA’s value of actuarial assets was approximately $4 .3 billion resulting in a funding status of 83 .1% .
LETTER OF TRANSMITTAL CONTINUED
15 .0%
10 .0%
5 .0%
0 .0%1 YEAR
3 .4%
1 .7%
11 .2% 11 .6%
6 .7% 6 .5%
5 YEAR 10 YEAR
PolicyActual
MASTER PAGE NO. 598
INTRODUCTORY SECTION
2015 COMPREHENSIVE ANNUAL FINANCIAL REPORT 3
LETTER OF TRANSMITTAL CONTINUED
Annually, VCERA retains an independent actuarial firm to conduct an actuarial valuation . Segal Consulting performed the June 30, 2015 valuation . Triennially, VCERA will request its actuary to analyze the appropriateness of all economic and non-economic assumptions used in the annual valuations . Recommendations for assumption changes are presented to the Board for their consideration .
The latest triennial investigation was completed on April 14, 2015, and recommended assumption changes were adopted on May 18, 2015 . The latest assumptions are incorporated into the June 30, 2015 valuation .
Significant Events, Accomplishments and ObjectivesThe 2014-2015 fiscal year saw changes in the operation and administration of the retirement system by the Board of Retirement (Board) and staff . Some of the more significant events and accomplishments of the past year are summarized below:
• Appointed Retirement Administrator and Chief Investment Officer for the Plan .• Completed an Asset Liability Study and adopted a new Investment Asset Allocation .• Completed Triennial Actuarial Experience study .• Reached the 82% completion level for the new Pension Administration System (PAS) .
Objectives for the coming year include:• Conduct an Actuarial Audit of the Actuarial Valuation .• Begin User Acceptance Testing for PAS, with a goal to complete the project by April 2016 .
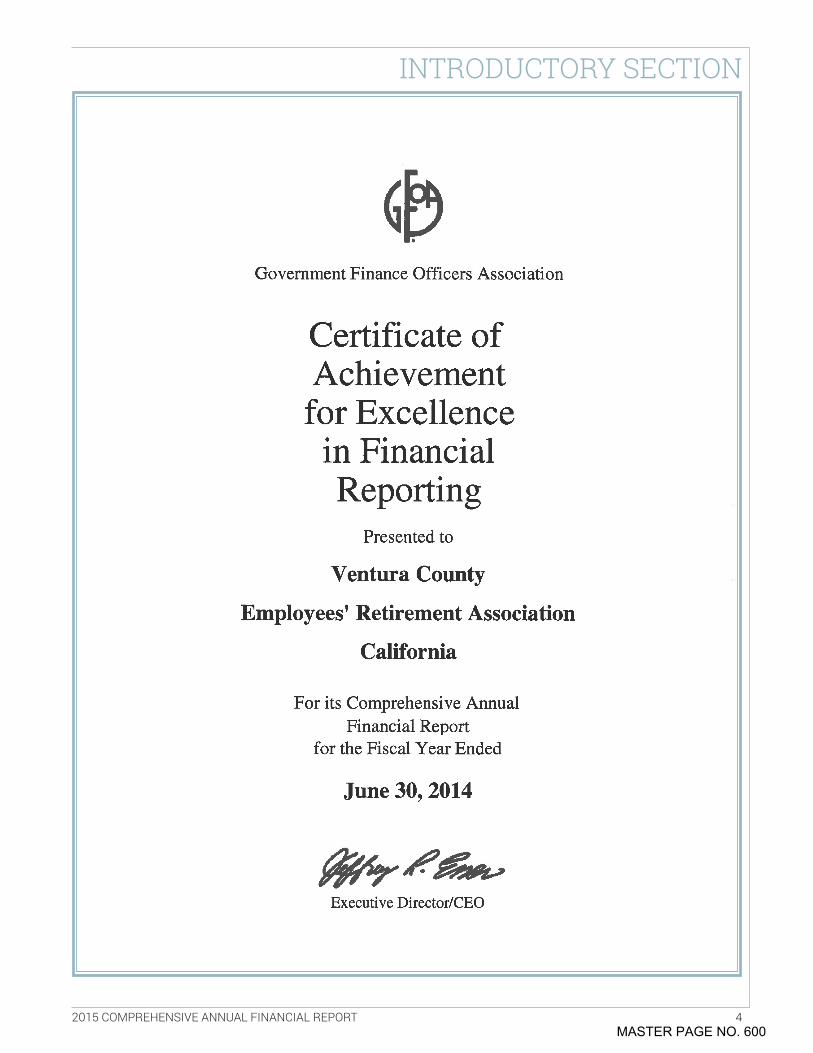
Certificate of AchievementThe Government Finance Officers Association of the United States and Canada (GFOA) awarded a Certificate of Achievement for Excellence in Financial Reporting to the Ventura County Employees’ Retirement Association for its comprehensive annual financial report for the fiscal year ended June 30, 2014 . In order to be awarded a Certificate of Achievement, a government must publish an easily readable and efficiently organized comprehensive annual financial report . This report must satisfy both generally accepted accounting principles and applicable legal requirements .
A Certificate of Achievement is valid for a period of one year only . We believe that our current Comprehensive Annual Financial Report continues to meet the Certificate of Achievement Program’s requirements and we are submitting it to the GFOA to determine its eligibility for another certificate .
AcknowledgementsThe preparation of this Comprehensive Annual Financial Report is made possible by the dedicated teamwork of VCERA staff under the leadership, dedication, and support of the VCERA Board . I am grateful to the VCERA staff as well as to all of our professional service providers, who perform so diligently to ensure successful operation and financial soundness of VCERA .
Finally, on behalf of VCERA staff, I want to thank the Board for its continued support . The Board leadership and support has contributed to the overall success of our retirement system .
Linda WebbRetirement Administrator
MASTER PAGE NO. 599
INTRODUCTORY SECTION
2015 COMPREHENSIVE ANNUAL FINANCIAL REPORT 4MASTER PAGE NO. 600

INTRODUCTORY SECTION
2015 COMPREHENSIVE ANNUAL FINANCIAL REPORT 5
MEMBERS OF THE BOARD OF RETIREMENT
TRACY TOWNERChair
Alternate Elected by Safety Members
PETER C. FOYAppointed by Board of Supervisors
WILLIAM W. WILSONVice-Chair
Appointed by Board of Supervisors
JOESEPH HENDERSONAppointed by Board of Supervisors
STEVEN HINTZEx-Officio Member
Treasurer-Tax CollectorCounty of Ventura
MICHAEL SEDELLAppointed by Board of Supervisors
MASTER PAGE NO. 601

INTRODUCTORY SECTION
2015 COMPREHENSIVE ANNUAL FINANCIAL REPORT 6
MEMBERS OF THE BOARD OF RETIREMENT CONTINUED
CRAIG WINTERElected by General Members
EDWARD JOHNSONElected by Safety Members
DEANNA McCORMICKElected by General Members
WILLIAM HOAGAlternate Elected by
Retired Members
ARTHUR E. GOULETElected by Retired Members
MASTER PAGE NO. 602

INTRODUCTORY SECTION
2015 COMPREHENSIVE ANNUAL FINANCIAL REPORT 7
2015 ORGANIZATION CHART
BOARD OF RETIREMENT
Retirement Administrator
LINDA WEBB
Chief Financial Officer HENRY SOLIS
Chief Operations Officer JULIE STALLINGS
Chief Investment Officer DAN GALLAGHER
Retirement Benefits Manager
Retirement Benefits Manager
Program Assistant/Board Clerk STEPHANIE CAIAZZA
Accounting Officer
Technology Services Manager
Fiscal Manager
Office Assistant
Benefits Specialist
Benefits Specialist
Benefits Specialist
Benefits Specialist
Benefits Specialist
Benefits Specialist
Benefits Specialist
Benefits Specialist
Benefits Specialist
Benefits Specialist
Benefits Specialist
Benefits Specialist
Benefits Specialist
Benefits Specialist
Office Assistant
MASTER PAGE NO. 603
INTRODUCTORY SECTION
2015 COMPREHENSIVE ANNUAL FINANCIAL REPORT 8
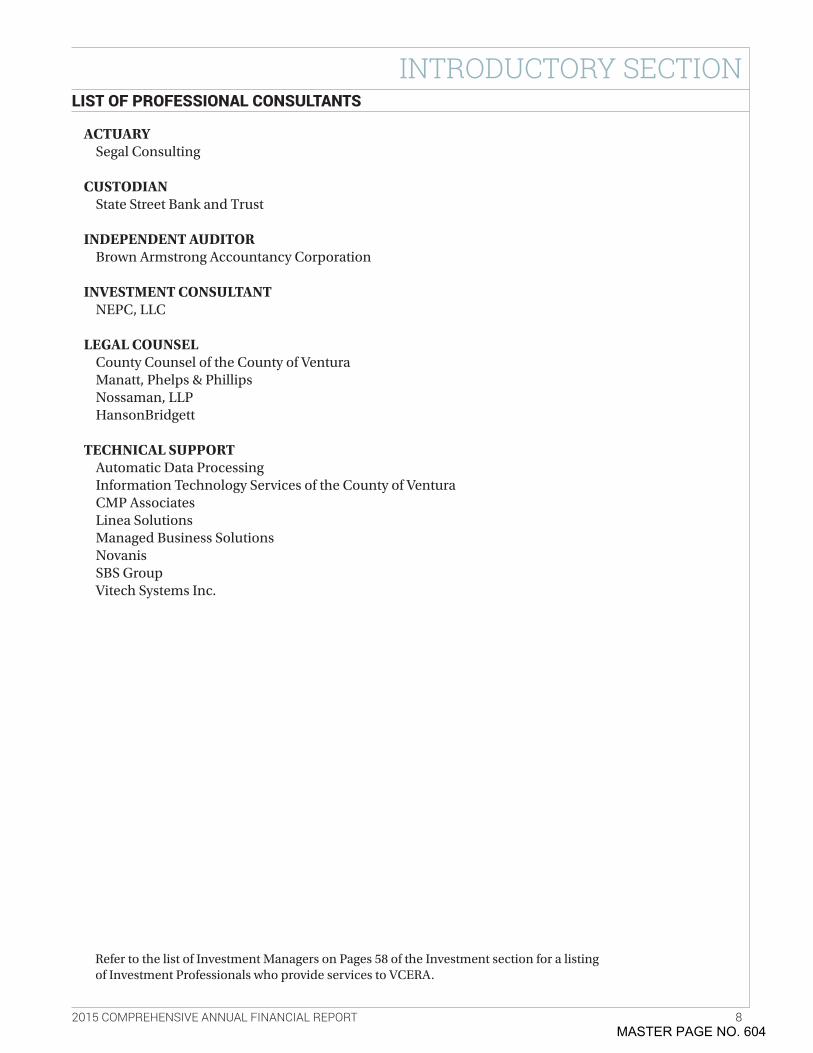
LIST OF PROFESSIONAL CONSULTANTS
ACTUARYSegal Consulting
CUSTODIANState Street Bank and Trust
INDEPENDENT AUDITORBrown Armstrong Accountancy Corporation
INVESTMENT CONSULTANTNEPC, LLC
LEGAL COUNSELCounty Counsel of the County of VenturaManatt, Phelps & Phillips Nossaman, LLPHansonBridgett
TECHNICAL SUPPORTAutomatic Data ProcessingInformation Technology Services of the County of VenturaCMP AssociatesLinea SolutionsManaged Business SolutionsNovanisSBS GroupVitech Systems Inc .
Refer to the list of Investment Managers on Pages 58 of the Investment section for a listing of Investment Professionals who provide services to VCERA .
MASTER PAGE NO. 604

FINANCIAL SECTION
The annual Oxnard Salsa Festival can’t be beat when it comes to great music, delicious food, and of course dancing! Make your plans for this destination with a latin twist during the month of July for an experience you will never forget.
PHOTO BY JOE VERNIG
MASTER PAGE NO. 605

2015 COMPREHENSIVE ANNUAL FINANCIAL REPORT 9
FINANCIAL SECTION
1
INDEPENDENT AUDITOR’S REPORT
Board of Retirement Ventura County Employees’ Retirement Association Ventura, California
Report on the Financial Statements
We have audited the accompanying Statement of Fiduciary Net Position of Ventura County Employees’ Retirement Association (VCERA) as of June 30, 2015 and the related Statement of Changes in Fiduciary Net Position for the year then ended, and the related notes to the financial statements, which collectively comprise VCERA’s basic financial statements as listed in the table of contents. We have also audited the schedule of cost sharing employer allocations of net pension liability and schedule of employer pension amounts allocated by cost sharing plan total for all entities of the column titled net pension liability, total deferred outflows or resources, total deferred inflows of resources, and total employer pension expense (specified column totals), listed as other information in the table of contents.
Management’s Responsibility for the Financial Statements
Management is responsible for the preparation and the fair presentation of these financial statements in accordance with accounting principles generally accepted in the United States of America; this includes the design, implementation, and maintenance of internal control relevant to the preparation and fair presentation of financial statements that are free from material misstatement, whether due to fraud or error.
Auditor’s Responsibility
Our responsibility is to express an opinion on these financial statements based on our audit. We conducted our audit in accordance with the auditing standards generally accepted in the United States of America and the standards applicable to financial audits contained in Government Auditing Standards, issued by the Comptroller General of the United States. Those standards require that we plan and perform the audit to obtain reasonable assurance about whether the financial statements are free of material misstatement.
An audit involves performing procedures to obtain audit evidence about the amounts and disclosures in the financial statements. The procedures selected depend on the auditor’s judgment, including the assessment of the risks of material misstatement of the financial statements, whether due to fraud or error. In making those risk assessments, the auditor considers internal control relevant to VCERA’s preparation and fair presentation of the financial statements in order to design audit procedures that are appropriate in the circumstances, but not for the purpose of expressing an opinion on the effectiveness of VCERA’s internal control. Accordingly, we express no such opinion. An audit also includes evaluating the appropriateness of accounting policies used and the reasonableness of significant accounting estimates made by management, as well as evaluating the overall presentation of the basic financial statements.
MASTER PAGE NO. 606
2015 COMPREHENSIVE ANNUAL FINANCIAL REPORT 10
FINANCIAL SECTION
2
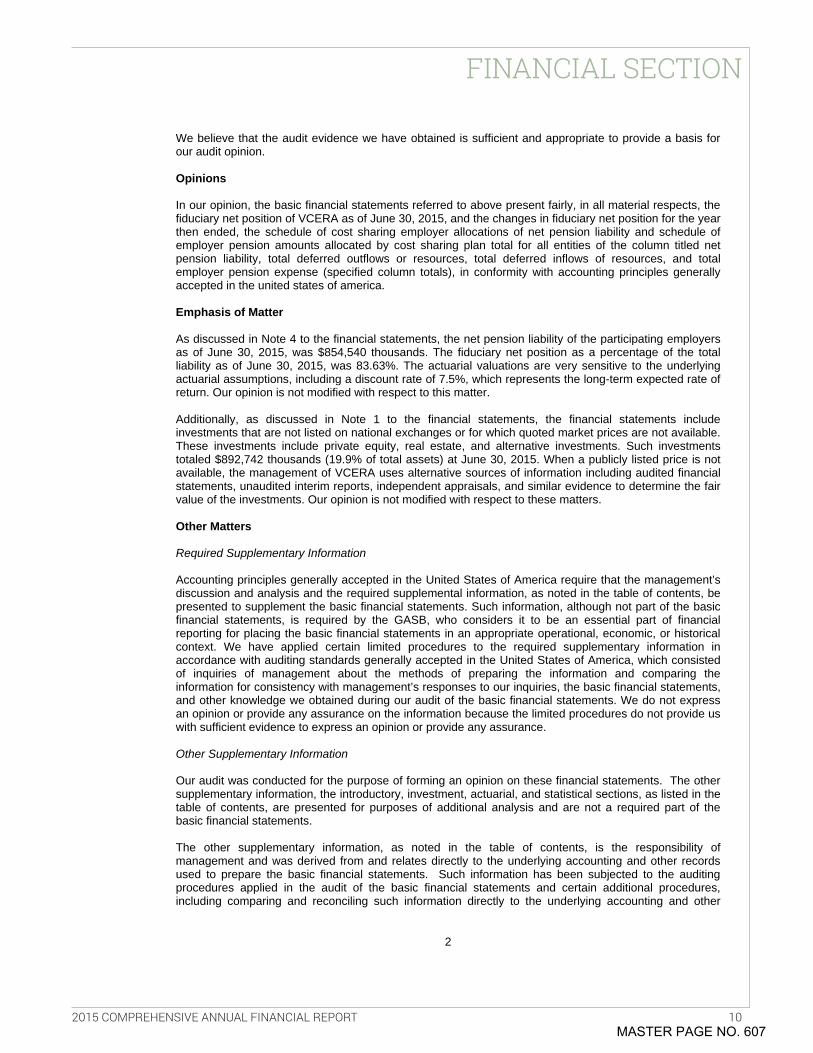
We believe that the audit evidence we have obtained is sufficient and appropriate to provide a basis for our audit opinion.
Opinions
In our opinion, the basic financial statements referred to above present fairly, in all material respects, the fiduciary net position of VCERA as of June 30, 2015, and the changes in fiduciary net position for the year then ended, the schedule of cost sharing employer allocations of net pension liability and schedule of employer pension amounts allocated by cost sharing plan total for all entities of the column titled net pension liability, total deferred outflows or resources, total deferred inflows of resources, and total employer pension expense (specified column totals), in conformity with accounting principles generally accepted in the united states of america.
Emphasis of Matter
As discussed in Note 4 to the financial statements, the net pension liability of the participating employers as of June 30, 2015, was $854,540 thousands. The fiduciary net position as a percentage of the total liability as of June 30, 2015, was 83.63%. The actuarial valuations are very sensitive to the underlying actuarial assumptions, including a discount rate of 7.5%, which represents the long-term expected rate of return. Our opinion is not modified with respect to this matter.
Additionally, as discussed in Note 1 to the financial statements, the financial statements include investments that are not listed on national exchanges or for which quoted market prices are not available. These investments include private equity, real estate, and alternative investments. Such investments totaled $892,742 thousands (19.9% of total assets) at June 30, 2015. When a publicly listed price is not available, the management of VCERA uses alternative sources of information including audited financial statements, unaudited interim reports, independent appraisals, and similar evidence to determine the fair value of the investments. Our opinion is not modified with respect to these matters.
Other Matters
Required Supplementary Information
Accounting principles generally accepted in the United States of America require that the management’s discussion and analysis and the required supplemental information, as noted in the table of contents, be presented to supplement the basic financial statements. Such information, although not part of the basic financial statements, is required by the GASB, who considers it to be an essential part of financial reporting for placing the basic financial statements in an appropriate operational, economic, or historical context. We have applied certain limited procedures to the required supplementary information in accordance with auditing standards generally accepted in the United States of America, which consisted of inquiries of management about the methods of preparing the information and comparing the information for consistency with management’s responses to our inquiries, the basic financial statements, and other knowledge we obtained during our audit of the basic financial statements. We do not express an opinion or provide any assurance on the information because the limited procedures do not provide us with sufficient evidence to express an opinion or provide any assurance.
Other Supplementary Information
Our audit was conducted for the purpose of forming an opinion on these financial statements. The other supplementary information, the introductory, investment, actuarial, and statistical sections, as listed in the table of contents, are presented for purposes of additional analysis and are not a required part of the basic financial statements.
The other supplementary information, as noted in the table of contents, is the responsibility of management and was derived from and relates directly to the underlying accounting and other records used to prepare the basic financial statements. Such information has been subjected to the auditing procedures applied in the audit of the basic financial statements and certain additional procedures, including comparing and reconciling such information directly to the underlying accounting and other
MASTER PAGE NO. 607
2015 COMPREHENSIVE ANNUAL FINANCIAL REPORT 11
FINANCIAL SECTION
3
records used to prepare the basic financial statements or to the basic financial statements themselves, and other additional procedures in accordance with auditing standards generally accepted in the United States of America. In our opinion, the other supplementary information is fairly stated, in all material respects, in relation to the basic financial statements as a whole.
The introductory, investment, actuarial, and statistical sections, as noted in the table of contents, have not been subjected to the auditing procedures applied in the audit of the basic financial statements and, accordingly, we do not express an opinion or provide any assurance on them.
Report on Summarized Comparative Information
We have previously audited VCERA’s June 30, 2014 financial statements, and our report dated December 31, 2014, expressed an unmodified opinion on those audited financial statements. In our opinion, the summarized comparative information presented herein as of and for the year ended June 30, 2014, is consistent in all material respects, with the audited financial statements from which it has been derived.
Other Reporting Required by Government Auditing Standards
In accordance with Government Auditing Standards, we have also issued our report dated January 27, 2016, on our consideration of VCERA’s internal control over financial reporting and on our tests of its compliance with certain provisions of laws, regulations, contracts, and other matters. The purpose of that report is to describe the scope of our testing of internal control over financial reporting and compliance and the results of that testing, and not to provide an opinion on the internal control over financial reporting or on compliance. That report is an integral part of an audit performed in accordance with Government Auditing Standards in considering VCERA’s internal control over financial reporting on compliance and should be considered in assessing the results of our audit.
BROWN ARMSTRONG ACCOUNTANCY CORPORATION
Bakersfield, California January 27, 2016
MASTER PAGE NO. 608
2015 COMPREHENSIVE ANNUAL FINANCIAL REPORT 12
FINANCIAL SECTION
The following review of the results of Ventura County Employees’ Retirement Association’s (VCERA or Plan) operations and financial condition for the year ended June 30, 2015, should be read in conjunction with the Letter of Transmittal found in the Introductory Section of the report and with the required financial statements that follow this discussion and analysis .
Highlights• The Net Position Restricted for Pensions (Net Position) at the close of the June 30, 2015 fiscal year
is $4 .4 billion . All of the net position is available to meet VCERA’s ongoing obligations to plan participants and their beneficiaries .
• VCERA’s total Net Position Restricted for Pensions increased by $90 .0 million or 2 .1% . The increase in 2015 is primarily a result of positive investment returns .
• Total Deductions as reflected in the Statement of Changes in Fiduciary Net Position increased to $237 .5 million or 4 .4% from the prior year .
• VCERA’s funding status, as measured by the actuarial value of assets divided by the actuarial value of accrued liabilities, improved slightly from 82 .7% to 83 .1% .
The Financial Section of the Comprehensive Annual Financial ReportThe Financial Section of this Comprehensive Annual Financial Report consists of two financial statements, required supplementary information, other supplementary information, and other information . The Statement of Fiduciary Net Position includes information, as of the end of the fiscal year, about VCERA’s assets, liabilities, and net position on a fair value basis . The Statement of Changes in Fiduciary Net Position includes information about the additions to, deductions from, and net increase/decrease for the year in plan net position . The required supplementary information provides historical trend information about the net pension liability of the Plan’s participating employers, annual required employer contributions, and annual investment returns . The other supplementary information provides details of administrative expenses, investment expenses, and payments to consultants . The other information provides participating employer pension amounts allocated by the cost sharing plan and an allocation of the Net Pension Liability .
Financial AnalysisDuring the fiscal year, the Plan’s assets returned 1 .7%, less than the Plan’s 7 .75% assumed rate of return . The private equity portfolio outperformed all other VCERA asset classes with a positive return of 13 .6% . The U .S . equities portfolio gained 7 .3% . The Non-U .S . equity portfolio returned -5 .1% and global equity returned -1 .7% . The U .S . and global fixed income portfolios returned 0 .7% and -5 .0%, respectively . The real estate portfolio gained 12 .6%, while the liquid alternatives portfolio returned -5 .7% .
MANAGEMENT’S DISCUSSION AND ANALYSIS
MASTER PAGE NO. 609
2015 COMPREHENSIVE ANNUAL FINANCIAL REPORT 13
FINANCIAL SECTION
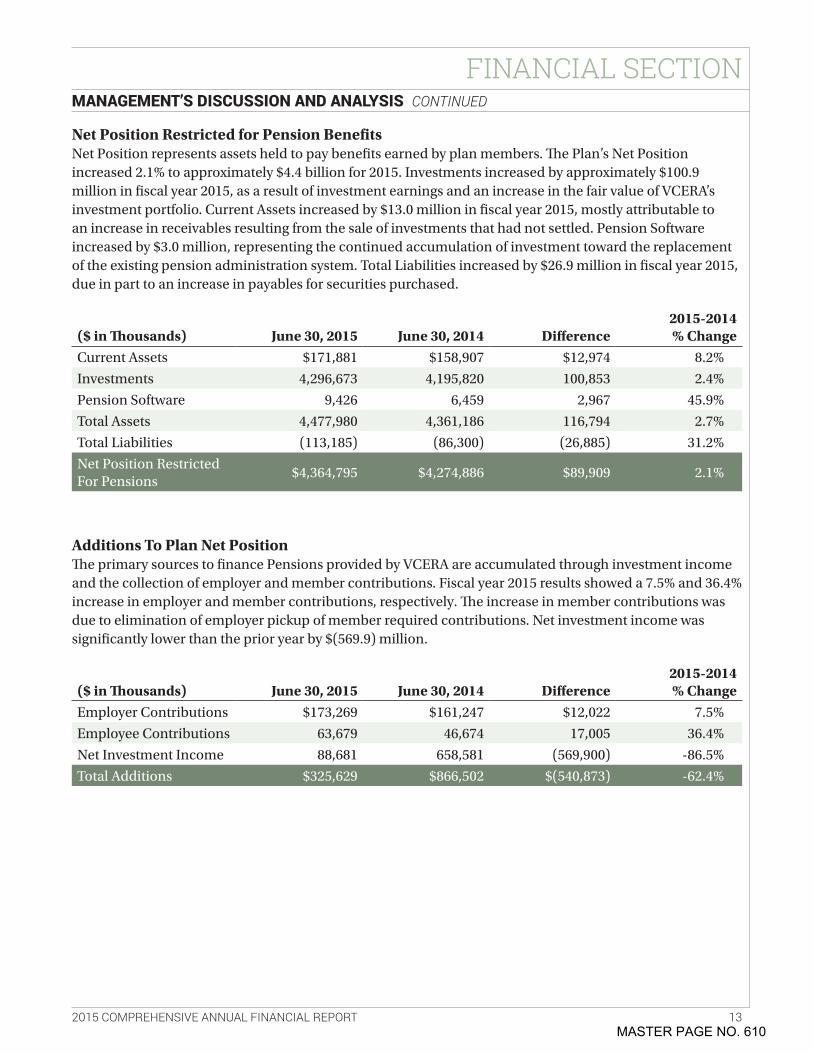
Net Position Restricted for Pension BenefitsNet Position represents assets held to pay benefits earned by plan members . The Plan’s Net Position increased 2 .1% to approximately $4 .4 billion for 2015 . Investments increased by approximately $100 .9 million in fiscal year 2015, as a result of investment earnings and an increase in the fair value of VCERA’s investment portfolio . Current Assets increased by $13 .0 million in fiscal year 2015, mostly attributable to an increase in receivables resulting from the sale of investments that had not settled . Pension Software increased by $3 .0 million, representing the continued accumulation of investment toward the replacement of the existing pension administration system . Total Liabilities increased by $26 .9 million in fiscal year 2015, due in part to an increase in payables for securities purchased .
Additions To Plan Net PositionThe primary sources to finance Pensions provided by VCERA are accumulated through investment income and the collection of employer and member contributions . Fiscal year 2015 results showed a 7 .5% and 36 .4% increase in employer and member contributions, respectively . The increase in member contributions was due to elimination of employer pickup of member required contributions . Net investment income was significantly lower than the prior year by $(569 .9) million .
($ in Thousands) June 30, 2015 June 30, 2014 Difference2015-2014% Change
Current Assets $171,881 $158,907 $12,974 8 .2%
Investments 4,296,673 4,195,820 100,853 2 .4%
Pension Software 9,426 6,459 2,967 45 .9%
Total Assets 4,477,980 4,361,186 116,794 2 .7%
Total Liabilities (113,185) (86,300) (26,885) 31 .2%
Net Position Restricted For Pensions
$4,364,795 $4,274,886 $89,909 2 .1%
($ in Thousands) June 30, 2015 June 30, 2014 Difference2015-2014 % Change
Employer Contributions $173,269 $161,247 $12,022 7 .5%
Employee Contributions 63,679 46,674 17,005 36 .4%
Net Investment Income 88,681 658,581 (569,900) -86 .5%
Total Additions $325,629 $866,502 $(540,873) -62 .4%
MANAGEMENT’S DISCUSSION AND ANALYSIS CONTINUED
MASTER PAGE NO. 610
2015 COMPREHENSIVE ANNUAL FINANCIAL REPORT 14
FINANCIAL SECTION
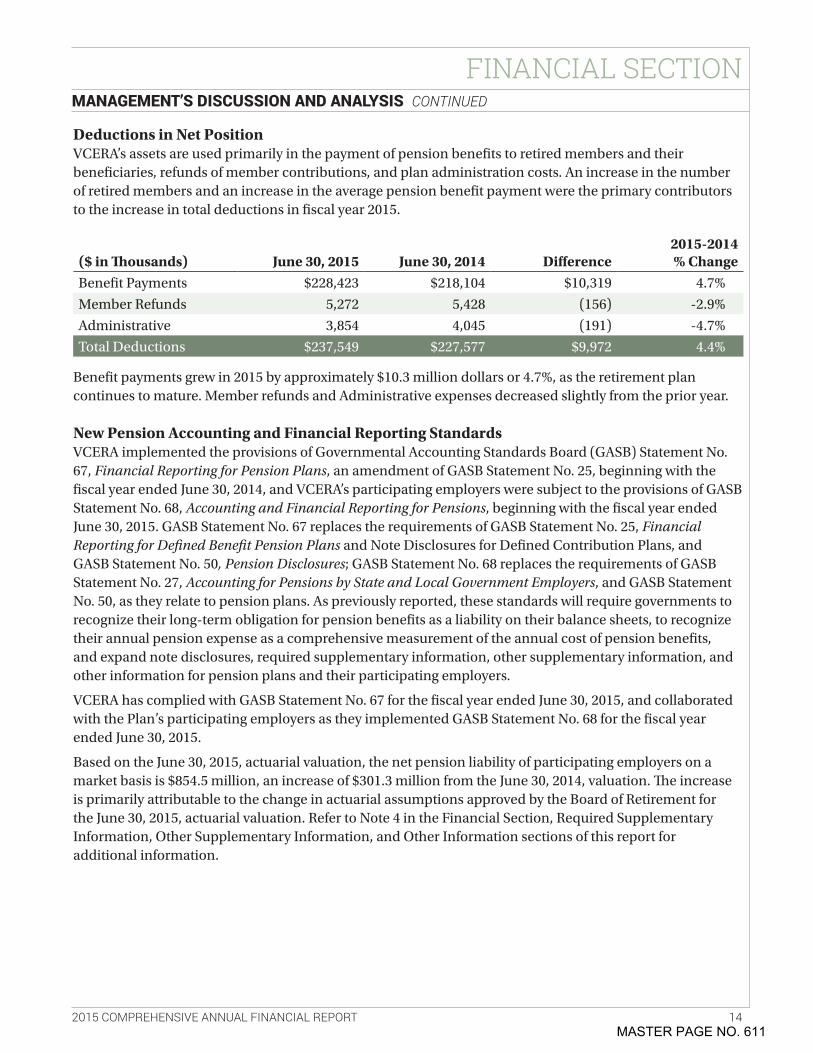
Deductions in Net PositionVCERA’s assets are used primarily in the payment of pension benefits to retired members and their beneficiaries, refunds of member contributions, and plan administration costs . An increase in the number of retired members and an increase in the average pension benefit payment were the primary contributors to the increase in total deductions in fiscal year 2015 .
Benefit payments grew in 2015 by approximately $10 .3 million dollars or 4 .7%, as the retirement plan continues to mature . Member refunds and Administrative expenses decreased slightly from the prior year .
New Pension Accounting and Financial Reporting StandardsVCERA implemented the provisions of Governmental Accounting Standards Board (GASB) Statement No . 67, Financial Reporting for Pension Plans, an amendment of GASB Statement No . 25, beginning with the fiscal year ended June 30, 2014, and VCERA’s participating employers were subject to the provisions of GASB Statement No . 68, Accounting and Financial Reporting for Pensions, beginning with the fiscal year ended June 30, 2015 . GASB Statement No . 67 replaces the requirements of GASB Statement No . 25, Financial Reporting for Defined Benefit Pension Plans and Note Disclosures for Defined Contribution Plans, and GASB Statement No . 50, Pension Disclosures; GASB Statement No . 68 replaces the requirements of GASB Statement No . 27, Accounting for Pensions by State and Local Government Employers, and GASB Statement No . 50, as they relate to pension plans . As previously reported, these standards will require governments to recognize their long-term obligation for pension benefits as a liability on their balance sheets, to recognize their annual pension expense as a comprehensive measurement of the annual cost of pension benefits, and expand note disclosures, required supplementary information, other supplementary information, and other information for pension plans and their participating employers .
VCERA has complied with GASB Statement No . 67 for the fiscal year ended June 30, 2015, and collaborated with the Plan’s participating employers as they implemented GASB Statement No . 68 for the fiscal year ended June 30, 2015 .
Based on the June 30, 2015, actuarial valuation, the net pension liability of participating employers on a market basis is $854 .5 million, an increase of $301 .3 million from the June 30, 2014, valuation . The increase is primarily attributable to the change in actuarial assumptions approved by the Board of Retirement for the June 30, 2015, actuarial valuation . Refer to Note 4 in the Financial Section, Required Supplementary Information, Other Supplementary Information, and Other Information sections of this report for additional information .
($ in Thousands) June 30, 2015 June 30, 2014 Difference2015-2014 % Change
Benefit Payments $228,423 $218,104 $10,319 4 .7%
Member Refunds 5,272 5,428 (156) -2 .9%
Administrative 3,854 4,045 (191) -4 .7%
Total Deductions $237,549 $227,577 $9,972 4 .4%
MANAGEMENT’S DISCUSSION AND ANALYSIS CONTINUED
MASTER PAGE NO. 611
2015 COMPREHENSIVE ANNUAL FINANCIAL REPORT 15
FINANCIAL SECTION
Requests for InformationThe financial report is designed to provide the Board of Retirement, our membership, and other interested third parties with a general overview of VCERA’s finances and to show accountability for the funds it receives .
Address questions regarding this report and/or requests for additional information to: Chief Financial Officer, VCERA1190 South Victoria Avenue, Suite 200 Ventura, CA 93003 VCERA .Info@Ventura .org
Respectfully submitted,
Henry C . Solis, CPAChief Financial Officer
MANAGEMENT’S DISCUSSION AND ANALYSIS CONTINUED
MASTER PAGE NO. 612
2015 COMPREHENSIVE ANNUAL FINANCIAL REPORT 16
FINANCIAL SECTIONBASIC FINANCIAL STATEMENTS
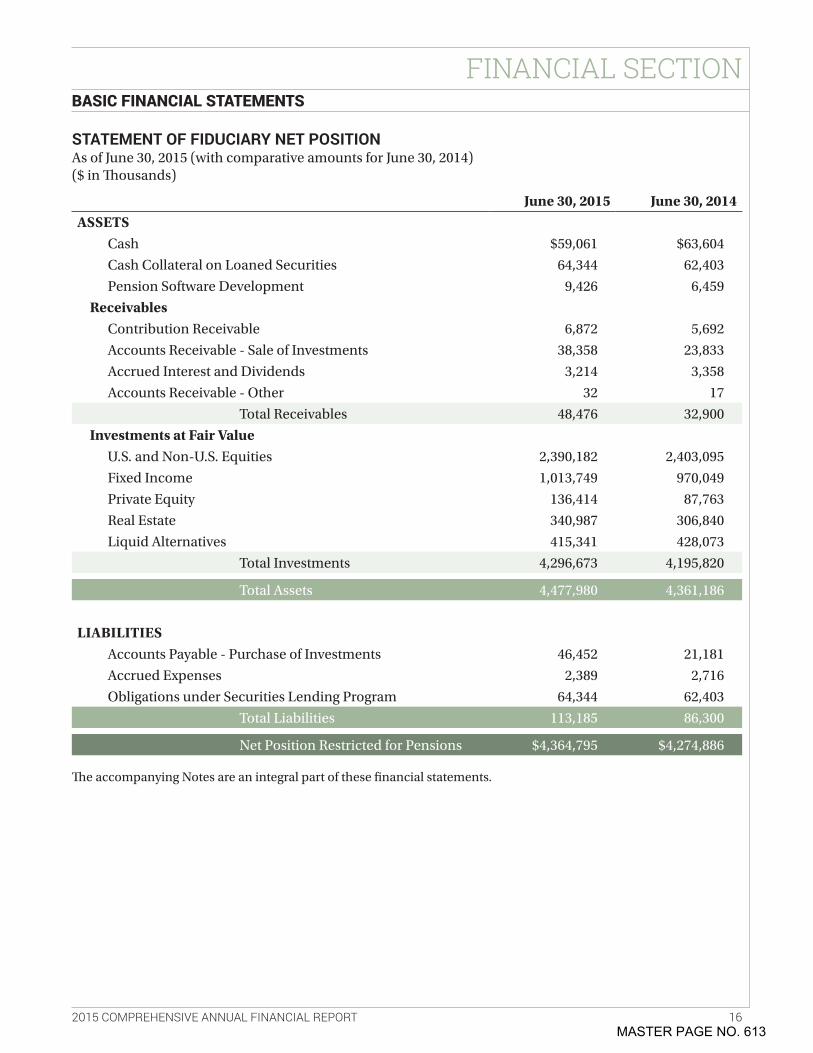
STATEMENT OF FIDUCIARY NET POSITIONAs of June 30, 2015 (with comparative amounts for June 30, 2014)($ in Thousands)
June 30, 2015 June 30, 2014ASSETS
Cash $59,061 $63,604
Cash Collateral on Loaned Securities 64,344 62,403
Pension Software Development 9,426 6,459
ReceivablesContribution Receivable 6,872 5,692
Accounts Receivable - Sale of Investments 38,358 23,833
Accrued Interest and Dividends 3,214 3,358
Accounts Receivable - Other 32 17
Total Receivables 48,476 32,900
Investments at Fair ValueU .S . and Non-U .S . Equities 2,390,182 2,403,095
Fixed Income 1,013,749 970,049
Private Equity 136,414 87,763
Real Estate 340,987 306,840
Liquid Alternatives 415,341 428,073
Total Investments 4,296,673 4,195,820
Total Assets 4,477,980 4,361,186
LIABILITIESAccounts Payable - Purchase of Investments 46,452 21,181
Accrued Expenses 2,389 2,716
Obligations under Securities Lending Program 64,344 62,403
Total Liabilities 113,185 86,300
Net Position Restricted for Pensions $4,364,795 $4,274,886
The accompanying Notes are an integral part of these financial statements .
MASTER PAGE NO. 613
2015 COMPREHENSIVE ANNUAL FINANCIAL REPORT 17
FINANCIAL SECTIONBASIC FINANCIAL STATEMENTS CONTINUED
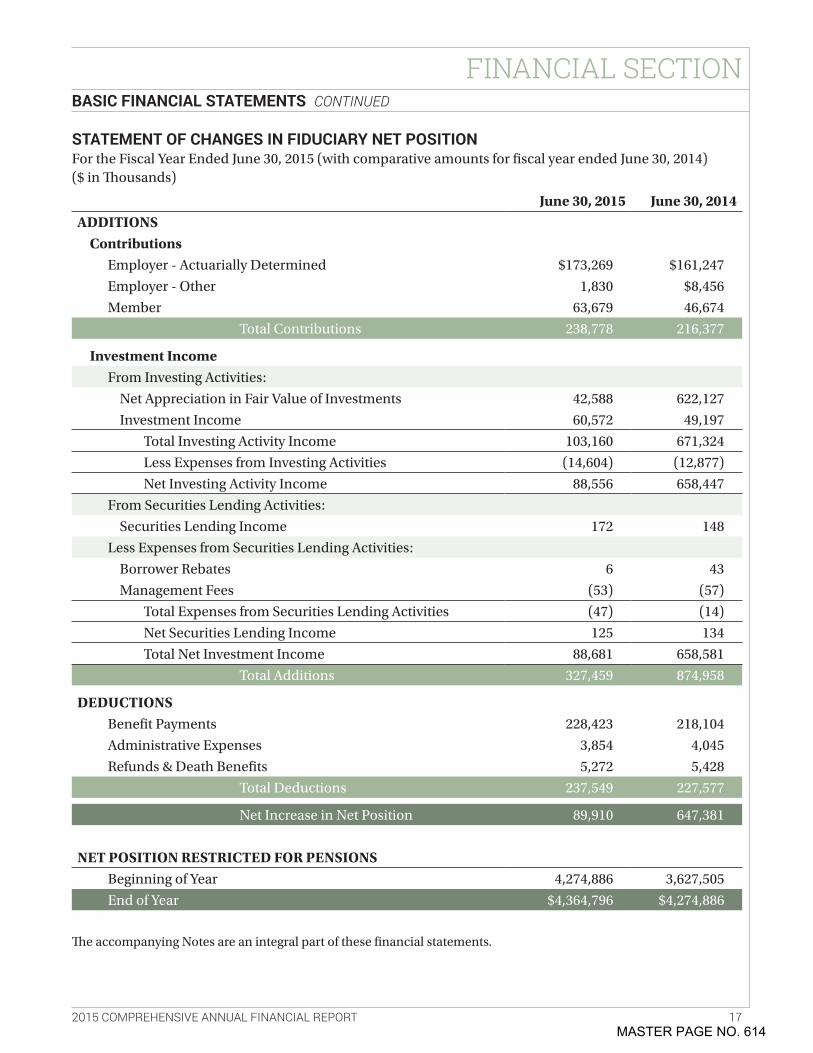
STATEMENT OF CHANGES IN FIDUCIARY NET POSITIONFor the Fiscal Year Ended June 30, 2015 (with comparative amounts for fiscal year ended June 30, 2014)($ in Thousands)
June 30, 2015 June 30, 2014ADDITIONS
ContributionsEmployer - Actuarially Determined $173,269 $161,247
Employer - Other 1,830 $8,456
Member 63,679 46,674
Total Contributions 238,778 216,377
Investment IncomeFrom Investing Activities:
Net Appreciation in Fair Value of Investments 42,588 622,127
Investment Income 60,572 49,197
Total Investing Activity Income 103,160 671,324
Less Expenses from Investing Activities (14,604) (12,877)
Net Investing Activity Income 88,556 658,447
From Securities Lending Activities:
Securities Lending Income 172 148
Less Expenses from Securities Lending Activities:
Borrower Rebates 6 43
Management Fees (53) (57)
Total Expenses from Securities Lending Activities (47) (14)
Net Securities Lending Income 125 134
Total Net Investment Income 88,681 658,581
Total Additions 327,459 874,958
DEDUCTIONSBenefit Payments 228,423 218,104
Administrative Expenses 3,854 4,045
Refunds & Death Benefits 5,272 5,428
Total Deductions 237,549 227,577
Net Increase in Net Position 89,910 647,381
NET POSITION RESTRICTED FOR PENSIONSBeginning of Year 4,274,886 3,627,505
End of Year $4,364,796 $4,274,886
The accompanying Notes are an integral part of these financial statements .
MASTER PAGE NO. 614
2015 COMPREHENSIVE ANNUAL FINANCIAL REPORT 18
FINANCIAL SECTIONNOTES TO THE BASIC FINANCIAL STATEMENTS
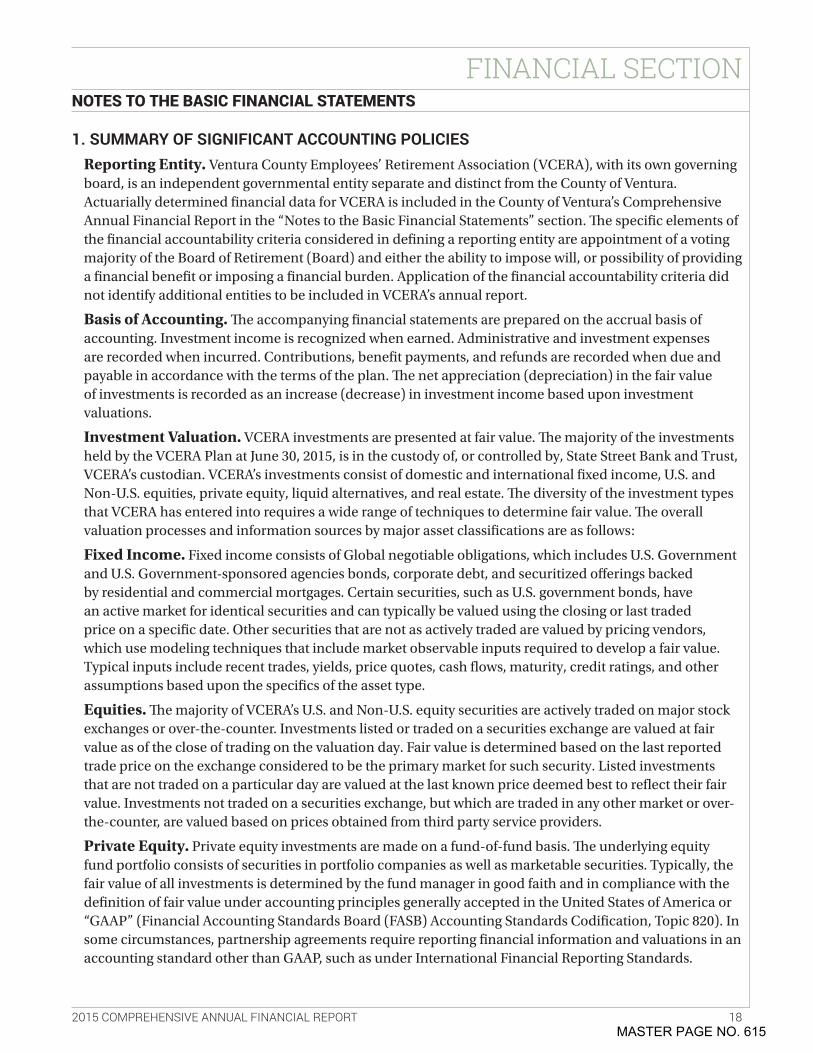
1. SUMMARY OF SIGNIFICANT ACCOUNTING POLICIESReporting Entity. Ventura County Employees’ Retirement Association (VCERA), with its own governing board, is an independent governmental entity separate and distinct from the County of Ventura . Actuarially determined financial data for VCERA is included in the County of Ventura’s Comprehensive Annual Financial Report in the “Notes to the Basic Financial Statements” section . The specific elements of the financial accountability criteria considered in defining a reporting entity are appointment of a voting majority of the Board of Retirement (Board) and either the ability to impose will, or possibility of providing a financial benefit or imposing a financial burden . Application of the financial accountability criteria did not identify additional entities to be included in VCERA’s annual report .
Basis of Accounting. The accompanying financial statements are prepared on the accrual basis of accounting . Investment income is recognized when earned . Administrative and investment expenses are recorded when incurred . Contributions, benefit payments, and refunds are recorded when due and payable in accordance with the terms of the plan . The net appreciation (depreciation) in the fair value of investments is recorded as an increase (decrease) in investment income based upon investment valuations .
Investment Valuation. VCERA investments are presented at fair value . The majority of the investments held by the VCERA Plan at June 30, 2015, is in the custody of, or controlled by, State Street Bank and Trust, VCERA’s custodian . VCERA’s investments consist of domestic and international fixed income, U .S . and Non-U .S . equities, private equity, liquid alternatives, and real estate . The diversity of the investment types that VCERA has entered into requires a wide range of techniques to determine fair value . The overall valuation processes and information sources by major asset classifications are as follows:
Fixed Income. Fixed income consists of Global negotiable obligations, which includes U .S . Government and U .S . Government-sponsored agencies bonds, corporate debt, and securitized offerings backed by residential and commercial mortgages . Certain securities, such as U .S . government bonds, have an active market for identical securities and can typically be valued using the closing or last traded price on a specific date . Other securities that are not as actively traded are valued by pricing vendors, which use modeling techniques that include market observable inputs required to develop a fair value . Typical inputs include recent trades, yields, price quotes, cash flows, maturity, credit ratings, and other assumptions based upon the specifics of the asset type .
Equities. The majority of VCERA’s U .S . and Non-U .S . equity securities are actively traded on major stock exchanges or over-the-counter . Investments listed or traded on a securities exchange are valued at fair value as of the close of trading on the valuation day . Fair value is determined based on the last reported trade price on the exchange considered to be the primary market for such security . Listed investments that are not traded on a particular day are valued at the last known price deemed best to reflect their fair value . Investments not traded on a securities exchange, but which are traded in any other market or over-the-counter, are valued based on prices obtained from third party service providers .
Private Equity. Private equity investments are made on a fund-of-fund basis . The underlying equity fund portfolio consists of securities in portfolio companies as well as marketable securities . Typically, the fair value of all investments is determined by the fund manager in good faith and in compliance with the definition of fair value under accounting principles generally accepted in the United States of America or “GAAP” (Financial Accounting Standards Board (FASB) Accounting Standards Codification, Topic 820) . In some circumstances, partnership agreements require reporting financial information and valuations in an accounting standard other than GAAP, such as under International Financial Reporting Standards .
MASTER PAGE NO. 615
2015 COMPREHENSIVE ANNUAL FINANCIAL REPORT 19
FINANCIAL SECTIONNOTES TO THE BASIC FINANCIAL STATEMENTS CONTINUED
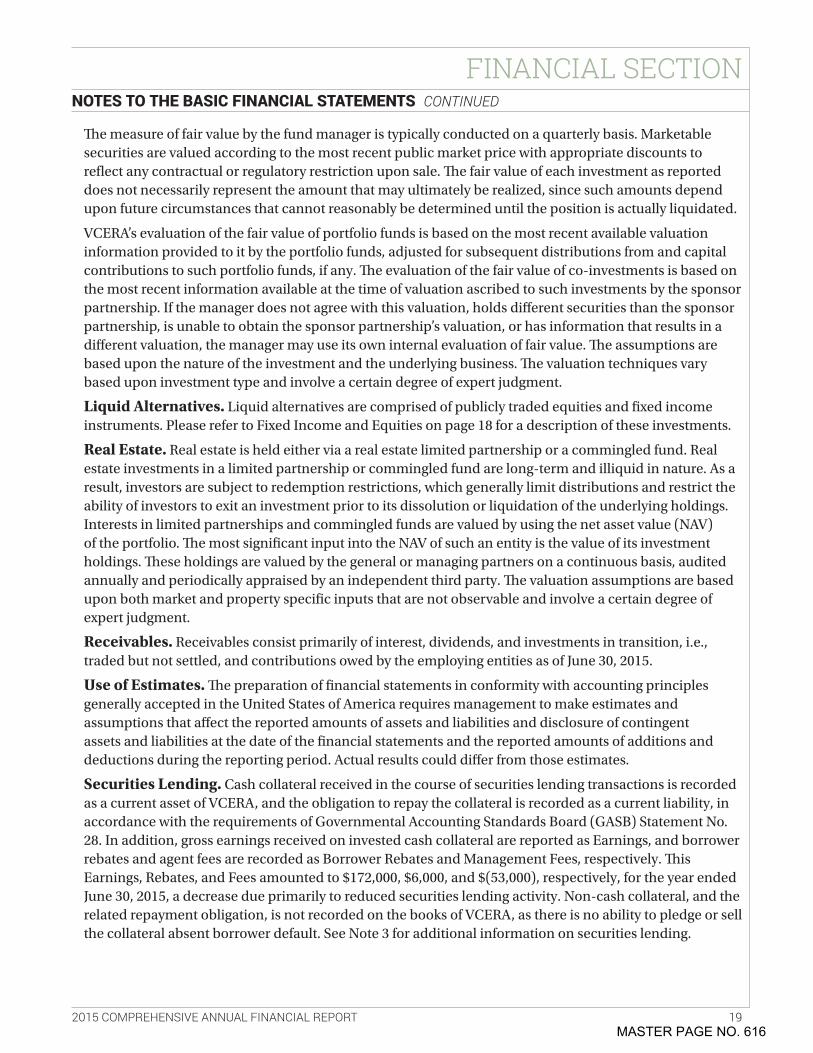
The measure of fair value by the fund manager is typically conducted on a quarterly basis . Marketable securities are valued according to the most recent public market price with appropriate discounts to reflect any contractual or regulatory restriction upon sale . The fair value of each investment as reported does not necessarily represent the amount that may ultimately be realized, since such amounts depend upon future circumstances that cannot reasonably be determined until the position is actually liquidated .
VCERA’s evaluation of the fair value of portfolio funds is based on the most recent available valuation information provided to it by the portfolio funds, adjusted for subsequent distributions from and capital contributions to such portfolio funds, if any . The evaluation of the fair value of co-investments is based on the most recent information available at the time of valuation ascribed to such investments by the sponsor partnership . If the manager does not agree with this valuation, holds different securities than the sponsor partnership, is unable to obtain the sponsor partnership’s valuation, or has information that results in a different valuation, the manager may use its own internal evaluation of fair value . The assumptions are based upon the nature of the investment and the underlying business . The valuation techniques vary based upon investment type and involve a certain degree of expert judgment .
Liquid Alternatives. Liquid alternatives are comprised of publicly traded equities and fixed income instruments . Please refer to Fixed Income and Equities on page 18 for a description of these investments .
Real Estate. Real estate is held either via a real estate limited partnership or a commingled fund . Real estate investments in a limited partnership or commingled fund are long-term and illiquid in nature . As a result, investors are subject to redemption restrictions, which generally limit distributions and restrict the ability of investors to exit an investment prior to its dissolution or liquidation of the underlying holdings . Interests in limited partnerships and commingled funds are valued by using the net asset value (NAV) of the portfolio . The most significant input into the NAV of such an entity is the value of its investment holdings . These holdings are valued by the general or managing partners on a continuous basis, audited annually and periodically appraised by an independent third party . The valuation assumptions are based upon both market and property specific inputs that are not observable and involve a certain degree of expert judgment .
Receivables. Receivables consist primarily of interest, dividends, and investments in transition, i .e ., traded but not settled, and contributions owed by the employing entities as of June 30, 2015 .
Use of Estimates. The preparation of financial statements in conformity with accounting principles generally accepted in the United States of America requires management to make estimates and assumptions that affect the reported amounts of assets and liabilities and disclosure of contingent assets and liabilities at the date of the financial statements and the reported amounts of additions and deductions during the reporting period . Actual results could differ from those estimates .
Securities Lending. Cash collateral received in the course of securities lending transactions is recorded as a current asset of VCERA, and the obligation to repay the collateral is recorded as a current liability, in accordance with the requirements of Governmental Accounting Standards Board (GASB) Statement No . 28 . In addition, gross earnings received on invested cash collateral are reported as Earnings, and borrower rebates and agent fees are recorded as Borrower Rebates and Management Fees, respectively . This Earnings, Rebates, and Fees amounted to $172,000, $6,000, and $(53,000), respectively, for the year ended June 30, 2015, a decrease due primarily to reduced securities lending activity . Non-cash collateral, and the related repayment obligation, is not recorded on the books of VCERA, as there is no ability to pledge or sell the collateral absent borrower default . See Note 3 for additional information on securities lending .
MASTER PAGE NO. 616

2015 COMPREHENSIVE ANNUAL FINANCIAL REPORT 20
FINANCIAL SECTION
Income Taxes. The Internal Revenue Service (IRS) has ruled that plans such as VCERA qualify under Section 401(a) of the Internal Revenue Code and are not subject to tax under present income tax laws . On January 29, 2014, the IRS issued VCERA a favorable Tax Determination Letter . Accordingly, no provision for income taxes has been made in the accompanying basic financial statements, as the plan is exempt from federal and state income taxes under provisions of the Internal Revenue Code, Section 401, and the California Revenue and Taxation Code, section 23701, respectively .
Implementation of new Accounting Pronouncement.During the fiscal year ending June 30, 2015, VCERA implemented the following standards:
GASB Statement No. 68 – Accounting and Financial Reporting for Pensions - an amendment of GASB Statement No. 27. The provisions of GASB Statement No . 68 are effective for financial statements beginning after June 15, 2014 . VCERA has implemented the provisions of GASB Statement No . 68 in the current year .
GASB Statement No. 69 – Government Combinations and Disposals of Government Operations. The provisions of GASB Statement No . 69 are effective for financial statements beginning after December 15, 2013 . There was no effect on the VCERA accounting or financial reporting as a result of implementing this standard .
GASB Statement No. 71 – Pension Transition for Contributions Made Subsequent to the Measurement Date- an amendment of GASB Statement No. 68. The provisions of this statement will be applied simultaneously with the provisions of GASB Statement No . 68 . There was no effect on VCERA’s accounting or financial reporting as a result of implementing this standard .
New Accounting Pronouncements.Recently released standards by GASB affecting future fiscal years are as follows:
GASB Statement No. 72 – Fair Value Measurement and Application. The provisions of this statement are effective for financial statements for reporting periods beginning after June 15, 2015 . The Plan has not fully judged the effect of the implementation of GASB Statement No . 72 as of the date of the basic financial statements .
GASB Statement No. 73 – Accounting and Financial Reporting for Pensions and Related Assets that are not within the Scope of GASB Statement No. 68, and Amendments to Certain Provisions of GASB Statements No. 67 and 68. The provisions of this statement are effective for fiscal years beginning after June 15, 2015 – except those provisions that address employers and governmental non-employer contributing entities for pensions that are not within the scope of GASB Statement No . 68, which are effective for fiscal years beginning after June 15, 2016 . The Plan has not fully judged the effect of the implementation of GASB Statement No . 73 as of the date of the basic financial statements .
GASB Statement No. 74 – Financial Reporting for Postemployment Benefits Other than Pension Plans. The provisions of this statement are effective for fiscal years beginning after June 15, 2016 . The Plan has not fully judged the effect of the implementation of GASB Statement No . 74 as of the date of the basic financial statements .
GASB Statement No. 75 – Accounting and Financial Reporting for Postemployment Benefits Other than Pension Plans. The provisions of this statement are effective for fiscal years beginning after June 15, 2017 . The Plan has not fully judged the effect of the implementation of GASB Statement No . 75 as of the date of the basic financial statements .
NOTES TO THE BASIC FINANCIAL STATEMENTS CONTINUED
MASTER PAGE NO. 617
2015 COMPREHENSIVE ANNUAL FINANCIAL REPORT 21
FINANCIAL SECTION
GASB Statement No. 76 – Hierarchy of Generally Accepted Accounting Principles for State and Local Governments. The provisions of this statement are effective for fiscal years beginning after June 15, 2015 . VCERA has not fully judged the effect of the implementation of GASB Statement No . 76 as of the date of the basic financial statements .
GASB Statement No. 77 – Tax Abatement Disclosures. The requirements of this Statement are effective for reporting periods beginning after December 15, 2015 . VCERA has not fully judged the effect of the implementation of GASB Statement No . 77 as of the date of the basic financial statements .
2. PLAN DESCRIPTIONVCERA was established under the provisions of the California Government Code (Code) Sections 31450 through 31899, known collectively as the County Employees’ Retirement Law of 1937 . In September 2012, Governor Brown signed the California Public Employees’ Pension Reform Act of 2013 (PEPRA), Code Section 7522 et seq ., and the provisions of Assembly Bill (AB) 197 . This new law applies to new employees who became first time VCERA members on or after January 1, 2013 . VCERA operates a cost sharing multi-employer defined benefit pension plan (Plan) that includes employees of the County of Ventura, Ventura County Courts, Air Pollution Control District, a special district, and Ventura Regional Sanitation District, a special district, (the latter three employers are not under the County of Ventura Board of Supervisors) . VCERA is a pension trust fund of the County of Ventura .
VCERA provides retirement, disability, cost of living, death, and survivor benefits to its members and qualified beneficiaries .
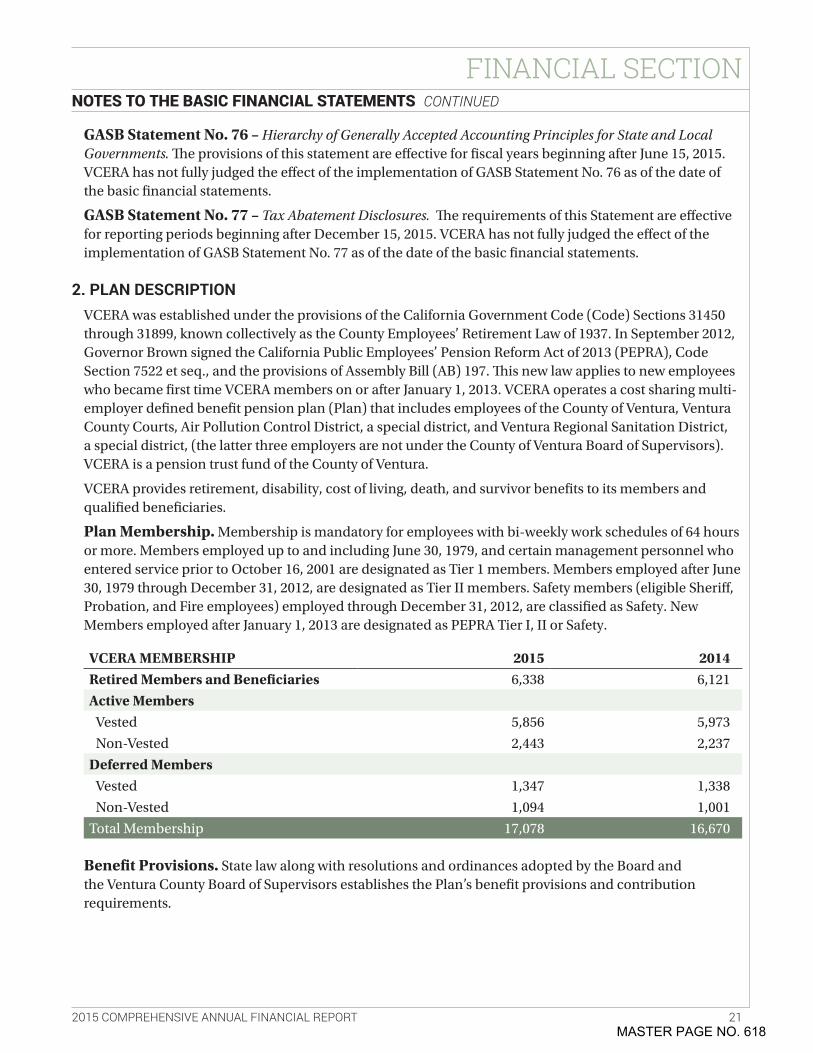
Plan Membership. Membership is mandatory for employees with bi-weekly work schedules of 64 hours or more . Members employed up to and including June 30, 1979, and certain management personnel who entered service prior to October 16, 2001 are designated as Tier 1 members . Members employed after June 30, 1979 through December 31, 2012, are designated as Tier II members . Safety members (eligible Sheriff, Probation, and Fire employees) employed through December 31, 2012, are classified as Safety . New Members employed after January 1, 2013 are designated as PEPRA Tier I, II or Safety .
VCERA MEMBERSHIP 2015 2014Retired Members and Beneficiaries 6,338 6,121
Active MembersVested 5,856 5,973
Non-Vested 2,443 2,237
Deferred MembersVested 1,347 1,338
Non-Vested 1,094 1,001
Total Membership 17,078 16,670
Benefit Provisions. State law along with resolutions and ordinances adopted by the Board and the Ventura County Board of Supervisors establishes the Plan’s benefit provisions and contribution requirements .
NOTES TO THE BASIC FINANCIAL STATEMENTS CONTINUED
MASTER PAGE NO. 618
2015 COMPREHENSIVE ANNUAL FINANCIAL REPORT 22
FINANCIAL SECTION
Retirement Allowances. Employees with membership prior to January 1, 2013, with ten or more years of service are entitled to an annual retirement allowance beginning at age 50 . General Member employees with membership on or after January 1, 2013, with five or more years of service are entitled to an annual retirement allowance beginning at age 52 . Safety Member employees with membership on or after January 1, 2013, with five or more years of service are entitled to an annual retirement allowance at age 50 . Allowances are based upon members’ ages at retirement, final compensation, and total years of service .
Disability Benefits. A member who becomes permanently disabled from the performance of their duties may be granted a disability retirement allowance payable for life . If the disability is the result of a job-related injury or illness, the member may be granted a service-connected disability retirement . If the disability is not the result of a job-related injury or illness, the member may receive a non-service-connected disability retirement allowance .
Death Benefits. VCERA pays a basic death benefit, which consists of the member’s accumulated contributions plus an amount equal to an average month’s salary to a maximum of six months’ salary . If the deceased member was vested, a surviving spouse may elect, in lieu of the basic death benefit, a monthly allowance equal to 60 percent of the monthly retirement allowance to which the deceased member would have been entitled, had the member been retired for non-service-connected disability as of the date of death . Benefits payable to a surviving spouse or other beneficiary of a member who dies after retirement depend upon the retirement option selected by the member at the time of retirement and whether the member’s retirement was a regular service retirement, a non-service-connected disability retirement, or a service-connected disability retirement . In addition, a lump sum death benefit of $5,000 is also payable to the named beneficiary of a deceased retired member .
Supplemental Benefits. On January 15, 1991, the Ventura County Board of Supervisors adopted a resolution to make operative Government Code Section 31682 . Adoption of this section permitted the Board of Retirement to adopt a resolution to provide a vested supplemental benefit of $108 .44 per month to all eligible retirees . Effective March 17, 2003, the Board adopted a resolution providing an additional $27 .50 per month to eligible retirees receiving the vested supplemental benefit described above . The additional non-vested supplemental benefit is provided pursuant to Government Code Sections 31691 .1 and 31692 .
Cost of Living Adjustment. Cost of living adjustments, based upon changes in the Consumer Price Index for the Los Angeles area, of up to 3% per annum are made for all Tier I and Safety retirees . On February 28, 2005, the Board adopted regulations pursuant to Government Code Section 31627 to provide a cost of living adjustment to a majority of Tier II general members represented by Service Employees International Union (SEIU) Local 721 . The cost of living adjustment is fixed at 2% annually and is funded by employee contributions .
Terminations. Effective January 1, 2003, members with less than five years of service may elect to leave their accumulated member contributions on deposit until first eligible to receive benefits in accordance with Government Code Section 31628 .
3. INVESTMENTSInvestment Policy. VCERA, in accordance with state statutes, invests in any form or type of investment, financial instrument, or financial transaction deemed prudent in the informed opinion of the Board . State Street Bank and Trust serves as the master custodian for the majority of VCERA’s assets .
While VCERA recognizes the importance of capital preservation, it also adheres to the principle that varying degrees of investment risk are generally rewarded with compensating returns . The Board’s
NOTES TO THE BASIC FINANCIAL STATEMENTS CONTINUED
MASTER PAGE NO. 619
2015 COMPREHENSIVE ANNUAL FINANCIAL REPORT 23
FINANCIAL SECTION
investment policy allows investments to the entire Global fixed income market (maturities 1 to 30 years) including Treasury and government agency bonds, corporate debt, mortgages, asset-backed securities, international and emerging markets . The fixed income portfolio is largely comprised of investment grade issues (rating of BBB- {Standard & Poor’s} and Baa3 {Moody’s} or higher) and may include, subject to limits, opportunistic investment in non-dollar and high yield bonds . VCERA’s investment policy recognizes that in the long-run equity returns will be greater than fixed income returns, but with expected greater volatility over shorter periods . Both domestic and international equity investing is permitted with exposure, subject to limits, to both the large and small capitalization ranges . Discretion is also permitted to international managers to invest, with limits, opportunistically in emerging market equities . Real Estate investing is also allowed with the goal to provide competitive risk adjusted returns as well as diversification benefits to VCERA’s portfolio .
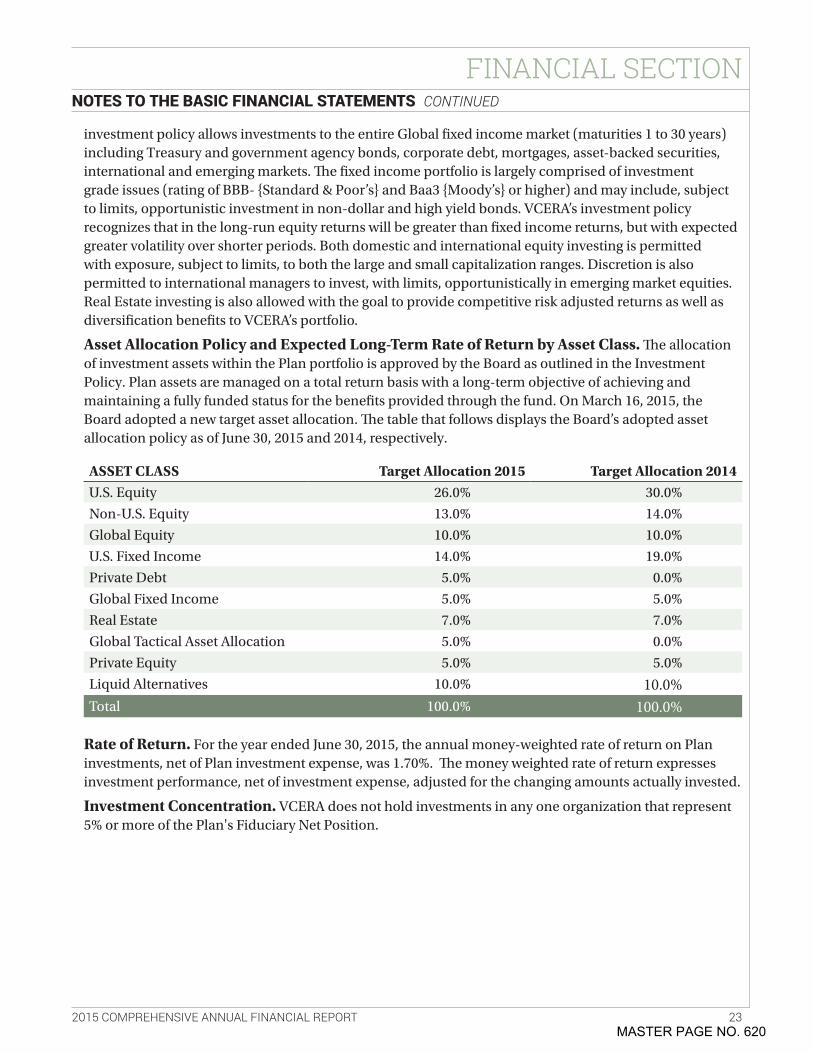
Asset Allocation Policy and Expected Long-Term Rate of Return by Asset Class. The allocation of investment assets within the Plan portfolio is approved by the Board as outlined in the Investment Policy . Plan assets are managed on a total return basis with a long-term objective of achieving and maintaining a fully funded status for the benefits provided through the fund . On March 16, 2015, the Board adopted a new target asset allocation . The table that follows displays the Board’s adopted asset allocation policy as of June 30, 2015 and 2014, respectively .
ASSET CLASS Target Allocation 2015 Target Allocation 2014U .S . Equity 26 .0% 30 .0%
Non-U .S . Equity 13 .0% 14 .0%
Global Equity 10 .0% 10 .0%
U .S . Fixed Income 14 .0% 19 .0%
Private Debt 5 .0% 0 .0%
Global Fixed Income 5 .0% 5 .0%
Real Estate 7 .0% 7 .0%
Global Tactical Asset Allocation 5 .0% 0 .0%
Private Equity 5 .0% 5 .0%
Liquid Alternatives 10 .0% 10.0%Total 100 .0% 100.0%
Rate of Return. For the year ended June 30, 2015, the annual money-weighted rate of return on Plan investments, net of Plan investment expense, was 1 .70% . The money weighted rate of return expresses investment performance, net of investment expense, adjusted for the changing amounts actually invested .
Investment Concentration. VCERA does not hold investments in any one organization that represent 5% or more of the Plan's Fiduciary Net Position .
NOTES TO THE BASIC FINANCIAL STATEMENTS CONTINUED
MASTER PAGE NO. 620
2015 COMPREHENSIVE ANNUAL FINANCIAL REPORT 24
FINANCIAL SECTION
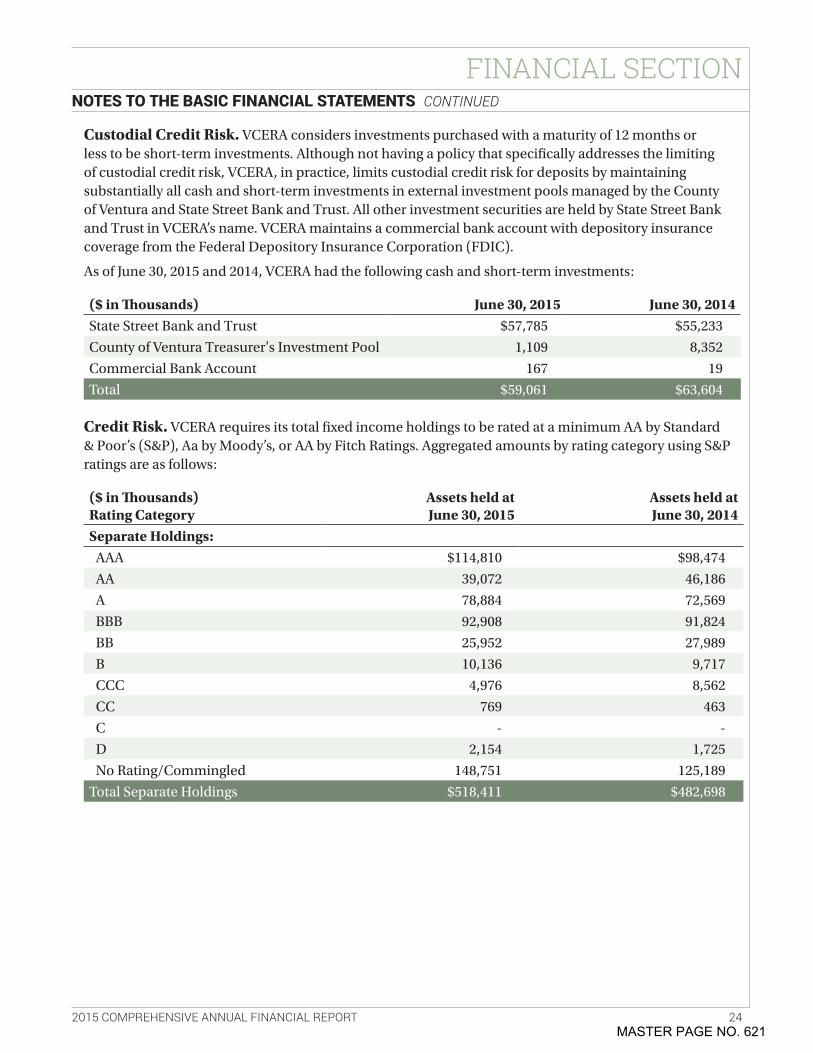
Custodial Credit Risk. VCERA considers investments purchased with a maturity of 12 months or less to be short-term investments . Although not having a policy that specifically addresses the limiting of custodial credit risk, VCERA, in practice, limits custodial credit risk for deposits by maintaining substantially all cash and short-term investments in external investment pools managed by the County of Ventura and State Street Bank and Trust . All other investment securities are held by State Street Bank and Trust in VCERA’s name . VCERA maintains a commercial bank account with depository insurance coverage from the Federal Depository Insurance Corporation (FDIC) .
As of June 30, 2015 and 2014, VCERA had the following cash and short-term investments:
($ in Thousands) June 30, 2015 June 30, 2014State Street Bank and Trust $57,785 $55,233
County of Ventura Treasurer's Investment Pool 1,109 8,352
Commercial Bank Account 167 19
Total $59,061 $63,604
Credit Risk. VCERA requires its total fixed income holdings to be rated at a minimum AA by Standard & Poor’s (S&P), Aa by Moody’s, or AA by Fitch Ratings . Aggregated amounts by rating category using S&P ratings are as follows:
($ in Thousands) Rating Category
Assets held at June 30, 2015
Assets held at June 30, 2014
Separate Holdings:AAA $114,810 $98,474
AA 39,072 46,186
A 78,884 72,569
BBB 92,908 91,824
BB 25,952 27,989
B 10,136 9,717
CCC 4,976 8,562
CC 769 463
C - -
D 2,154 1,725
No Rating/Commingled 148,751 125,189
Total Separate Holdings $518,411 $482,698
NOTES TO THE BASIC FINANCIAL STATEMENTS CONTINUED
MASTER PAGE NO. 621
2015 COMPREHENSIVE ANNUAL FINANCIAL REPORT 25
FINANCIAL SECTION
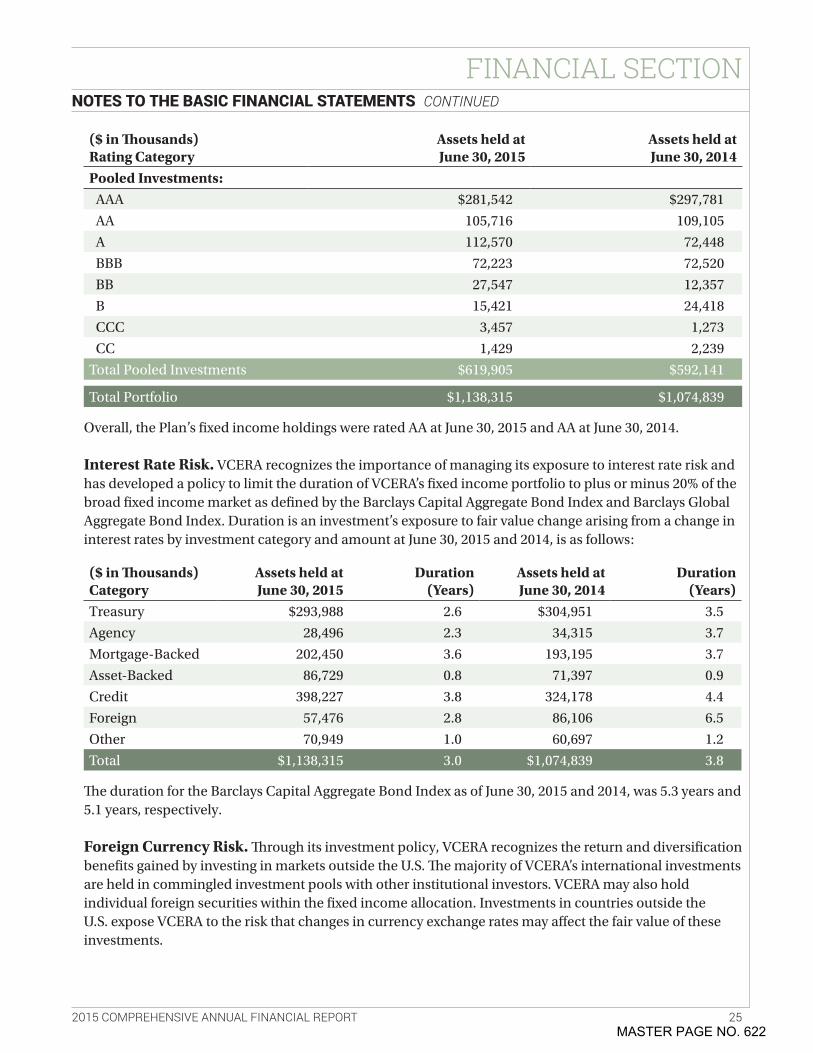
($ in Thousands) Rating Category
Assets held at June 30, 2015
Assets held at June 30, 2014
Pooled Investments:AAA $281,542 $297,781
AA 105,716 109,105
A 112,570 72,448
BBB 72,223 72,520
BB 27,547 12,357
B 15,421 24,418
CCC 3,457 1,273
CC 1,429 2,239
Total Pooled Investments $619,905 $592,141
Total Portfolio $1,138,315 $1,074,839
Overall, the Plan’s fixed income holdings were rated AA at June 30, 2015 and AA at June 30, 2014 .
Interest Rate Risk. VCERA recognizes the importance of managing its exposure to interest rate risk and has developed a policy to limit the duration of VCERA’s fixed income portfolio to plus or minus 20% of the broad fixed income market as defined by the Barclays Capital Aggregate Bond Index and Barclays Global Aggregate Bond Index . Duration is an investment’s exposure to fair value change arising from a change in interest rates by investment category and amount at June 30, 2015 and 2014, is as follows:
($ in Thousands) Category
Assets held at June 30, 2015
Duration (Years)
Assets held at June 30, 2014
Duration (Years)
Treasury $293,988 2 .6 $304,951 3 .5
Agency 28,496 2 .3 34,315 3 .7
Mortgage-Backed 202,450 3 .6 193,195 3 .7
Asset-Backed 86,729 0 .8 71,397 0 .9
Credit 398,227 3 .8 324,178 4 .4
Foreign 57,476 2 .8 86,106 6 .5
Other 70,949 1 .0 60,697 1 .2
Total $1,138,315 3 .0 $1,074,839 3 .8
The duration for the Barclays Capital Aggregate Bond Index as of June 30, 2015 and 2014, was 5 .3 years and 5 .1 years, respectively . Foreign Currency Risk. Through its investment policy, VCERA recognizes the return and diversification benefits gained by investing in markets outside the U .S . The majority of VCERA’s international investments are held in commingled investment pools with other institutional investors . VCERA may also hold individual foreign securities within the fixed income allocation . Investments in countries outside the U .S . expose VCERA to the risk that changes in currency exchange rates may affect the fair value of these investments .
NOTES TO THE BASIC FINANCIAL STATEMENTS CONTINUED
MASTER PAGE NO. 622
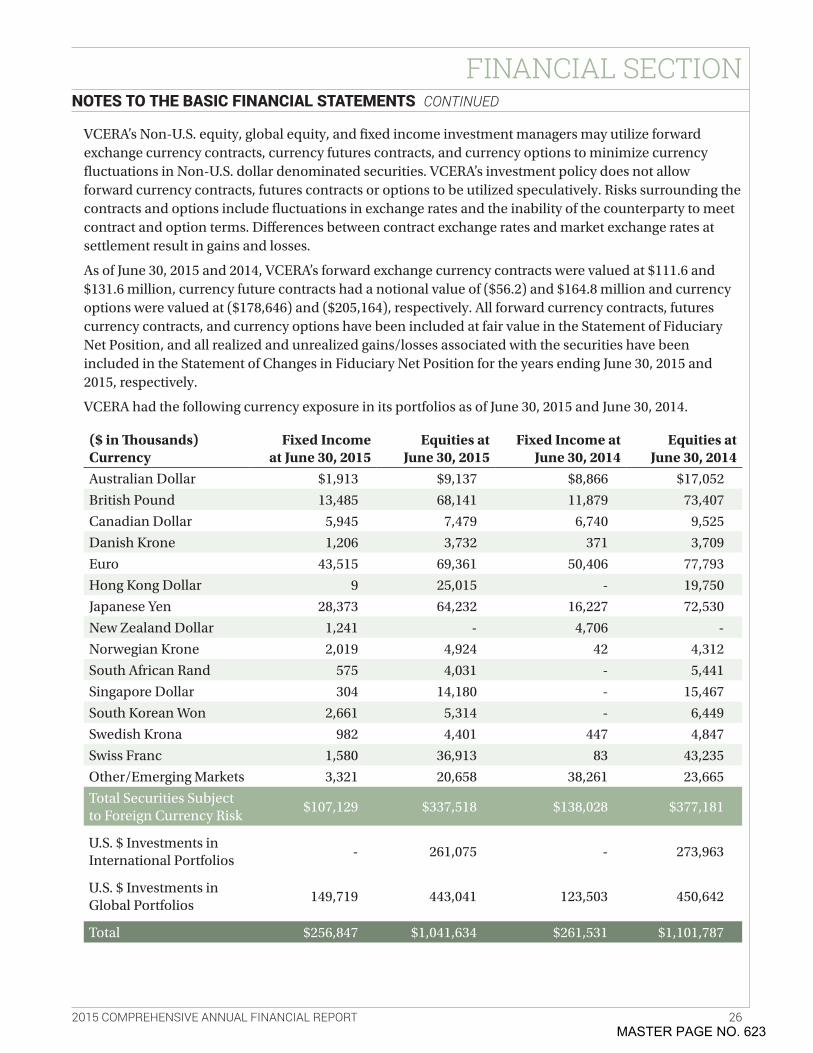
2015 COMPREHENSIVE ANNUAL FINANCIAL REPORT 26
FINANCIAL SECTION
VCERA’s Non-U .S . equity, global equity, and fixed income investment managers may utilize forward exchange currency contracts, currency futures contracts, and currency options to minimize currency fluctuations in Non-U .S . dollar denominated securities . VCERA’s investment policy does not allow forward currency contracts, futures contracts or options to be utilized speculatively . Risks surrounding the contracts and options include fluctuations in exchange rates and the inability of the counterparty to meet contract and option terms . Differences between contract exchange rates and market exchange rates at settlement result in gains and losses .
As of June 30, 2015 and 2014, VCERA’s forward exchange currency contracts were valued at $111 .6 and $131 .6 million, currency future contracts had a notional value of ($56 .2) and $164 .8 million and currency options were valued at ($178,646) and ($205,164), respectively . All forward currency contracts, futures currency contracts, and currency options have been included at fair value in the Statement of Fiduciary Net Position, and all realized and unrealized gains/losses associated with the securities have been included in the Statement of Changes in Fiduciary Net Position for the years ending June 30, 2015 and 2015, respectively .
VCERA had the following currency exposure in its portfolios as of June 30, 2015 and June 30, 2014 .
($ in Thousands) Currency
Fixed Income at June 30, 2015
Equities at June 30, 2015
Fixed Income at June 30, 2014
Equities at June 30, 2014
Australian Dollar $1,913 $9,137 $8,866 $17,052
British Pound 13,485 68,141 11,879 73,407
Canadian Dollar 5,945 7,479 6,740 9,525
Danish Krone 1,206 3,732 371 3,709
Euro 43,515 69,361 50,406 77,793
Hong Kong Dollar 9 25,015 - 19,750
Japanese Yen 28,373 64,232 16,227 72,530
New Zealand Dollar 1,241 - 4,706 -
Norwegian Krone 2,019 4,924 42 4,312
South African Rand 575 4,031 - 5,441
Singapore Dollar 304 14,180 - 15,467
South Korean Won 2,661 5,314 - 6,449
Swedish Krona 982 4,401 447 4,847
Swiss Franc 1,580 36,913 83 43,235
Other/Emerging Markets 3,321 20,658 38,261 23,665
Total Securities Subject to Foreign Currency Risk
$107,129 $337,518 $138,028 $377,181
U .S . $ Investments in International Portfolios
- 261,075 - 273,963
U .S . $ Investments in Global Portfolios
149,719 443,041 123,503 450,642
Total $256,847 $1,041,634 $261,531 $1,101,787
NOTES TO THE BASIC FINANCIAL STATEMENTS CONTINUED
MASTER PAGE NO. 623
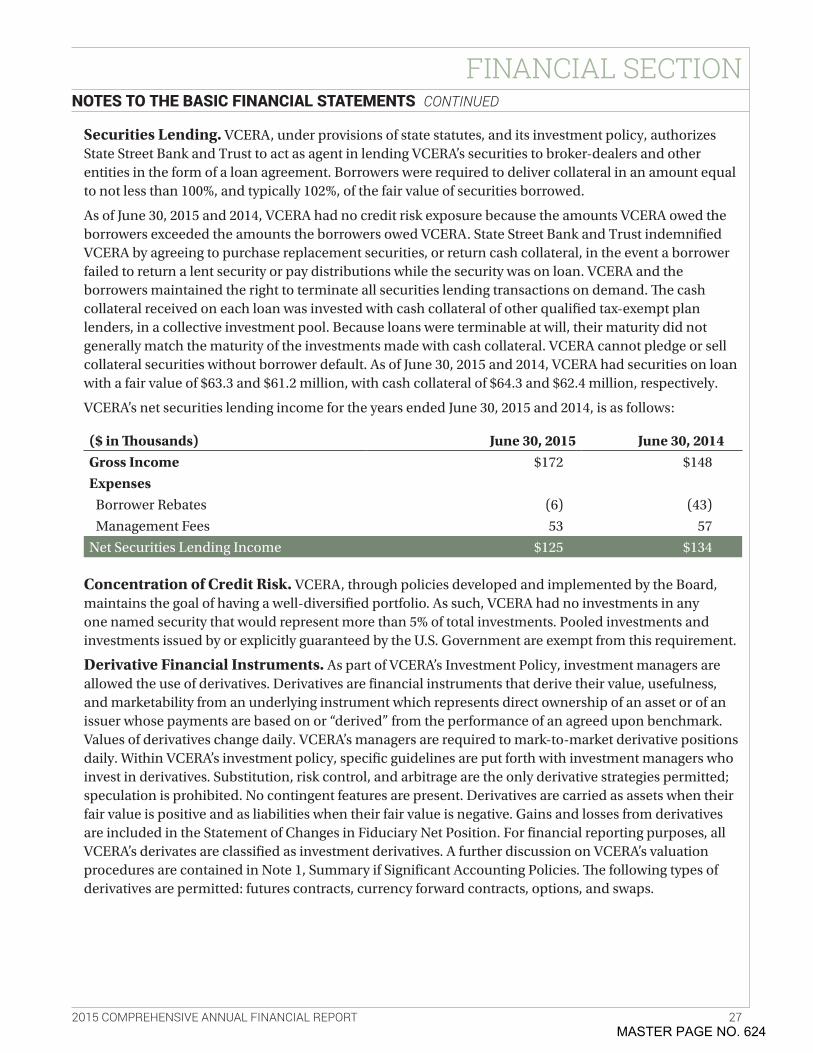
2015 COMPREHENSIVE ANNUAL FINANCIAL REPORT 27
FINANCIAL SECTION
Securities Lending. VCERA, under provisions of state statutes, and its investment policy, authorizes State Street Bank and Trust to act as agent in lending VCERA’s securities to broker-dealers and other entities in the form of a loan agreement . Borrowers were required to deliver collateral in an amount equal to not less than 100%, and typically 102%, of the fair value of securities borrowed .
As of June 30, 2015 and 2014, VCERA had no credit risk exposure because the amounts VCERA owed the borrowers exceeded the amounts the borrowers owed VCERA . State Street Bank and Trust indemnified VCERA by agreeing to purchase replacement securities, or return cash collateral, in the event a borrower failed to return a lent security or pay distributions while the security was on loan . VCERA and the borrowers maintained the right to terminate all securities lending transactions on demand . The cash collateral received on each loan was invested with cash collateral of other qualified tax-exempt plan lenders, in a collective investment pool . Because loans were terminable at will, their maturity did not generally match the maturity of the investments made with cash collateral . VCERA cannot pledge or sell collateral securities without borrower default . As of June 30, 2015 and 2014, VCERA had securities on loan with a fair value of $63 .3 and $61 .2 million, with cash collateral of $64 .3 and $62 .4 million, respectively .
VCERA’s net securities lending income for the years ended June 30, 2015 and 2014, is as follows:
($ in Thousands) June 30, 2015 June 30, 2014Gross Income $172 $148
ExpensesBorrower Rebates (6) (43)
Management Fees 53 57
Net Securities Lending Income $125 $134
Concentration of Credit Risk. VCERA, through policies developed and implemented by the Board, maintains the goal of having a well-diversified portfolio . As such, VCERA had no investments in any one named security that would represent more than 5% of total investments . Pooled investments and investments issued by or explicitly guaranteed by the U .S . Government are exempt from this requirement .
Derivative Financial Instruments. As part of VCERA’s Investment Policy, investment managers are allowed the use of derivatives . Derivatives are financial instruments that derive their value, usefulness, and marketability from an underlying instrument which represents direct ownership of an asset or of an issuer whose payments are based on or “derived” from the performance of an agreed upon benchmark . Values of derivatives change daily . VCERA’s managers are required to mark-to-market derivative positions daily . Within VCERA’s investment policy, specific guidelines are put forth with investment managers who invest in derivatives . Substitution, risk control, and arbitrage are the only derivative strategies permitted; speculation is prohibited . No contingent features are present . Derivatives are carried as assets when their fair value is positive and as liabilities when their fair value is negative . Gains and losses from derivatives are included in the Statement of Changes in Fiduciary Net Position . For financial reporting purposes, all VCERA’s derivates are classified as investment derivatives . A further discussion on VCERA’s valuation procedures are contained in Note 1, Summary if Significant Accounting Policies . The following types of derivatives are permitted: futures contracts, currency forward contracts, options, and swaps .
NOTES TO THE BASIC FINANCIAL STATEMENTS CONTINUED
MASTER PAGE NO. 624
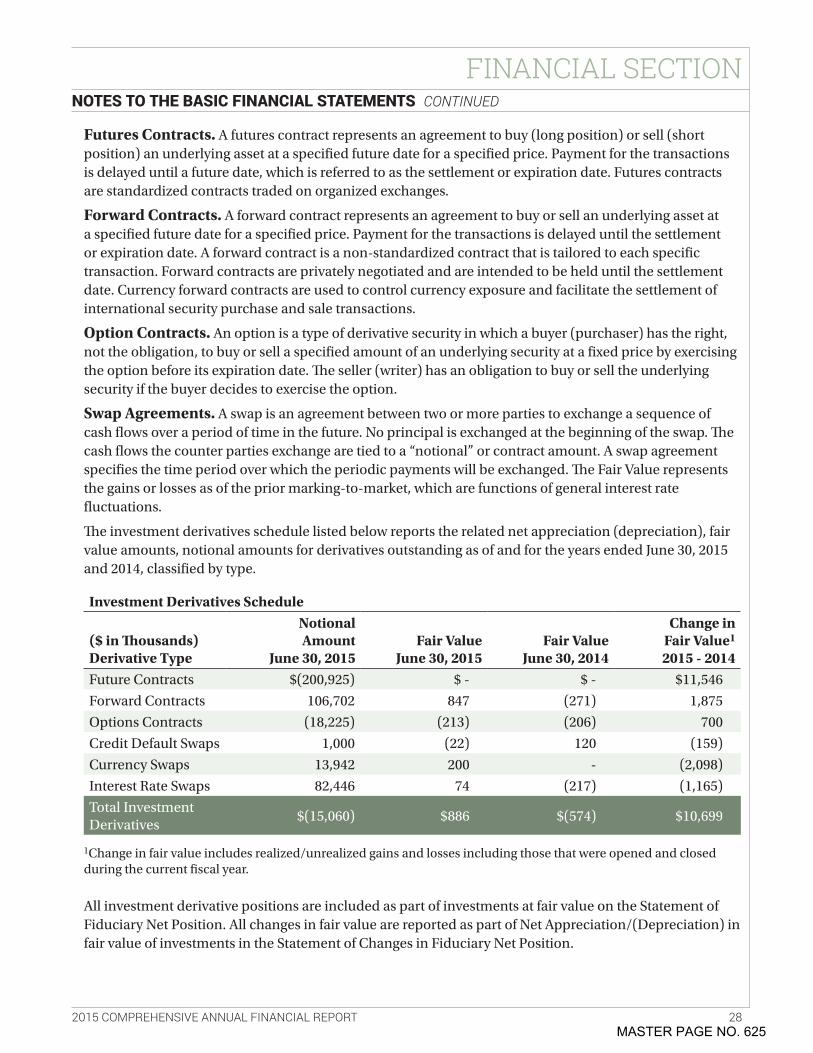
2015 COMPREHENSIVE ANNUAL FINANCIAL REPORT 28
FINANCIAL SECTION
Futures Contracts. A futures contract represents an agreement to buy (long position) or sell (short position) an underlying asset at a specified future date for a specified price . Payment for the transactions is delayed until a future date, which is referred to as the settlement or expiration date . Futures contracts are standardized contracts traded on organized exchanges .
Forward Contracts. A forward contract represents an agreement to buy or sell an underlying asset at a specified future date for a specified price . Payment for the transactions is delayed until the settlement or expiration date . A forward contract is a non-standardized contract that is tailored to each specific transaction . Forward contracts are privately negotiated and are intended to be held until the settlement date . Currency forward contracts are used to control currency exposure and facilitate the settlement of international security purchase and sale transactions .
Option Contracts. An option is a type of derivative security in which a buyer (purchaser) has the right, not the obligation, to buy or sell a specified amount of an underlying security at a fixed price by exercising the option before its expiration date . The seller (writer) has an obligation to buy or sell the underlying security if the buyer decides to exercise the option .
Swap Agreements. A swap is an agreement between two or more parties to exchange a sequence of cash flows over a period of time in the future . No principal is exchanged at the beginning of the swap . The cash flows the counter parties exchange are tied to a “notional” or contract amount . A swap agreement specifies the time period over which the periodic payments will be exchanged . The Fair Value represents the gains or losses as of the prior marking-to-market, which are functions of general interest rate fluctuations .
The investment derivatives schedule listed below reports the related net appreciation (depreciation), fair value amounts, notional amounts for derivatives outstanding as of and for the years ended June 30, 2015 and 2014, classified by type .
Investment Derivatives Schedule
($ in Thousands) Derivative Type
Notional Amount
June 30, 2015Fair Value
June 30, 2015Fair Value
June 30, 2014
Change in Fair Value1 2015 - 2014
Future Contracts $(200,925) $ - $ - $11,546
Forward Contracts 106,702 847 (271) 1,875
Options Contracts (18,225) (213) (206) 700
Credit Default Swaps 1,000 (22) 120 (159)
Currency Swaps 13,942 200 - (2,098)
Interest Rate Swaps 82,446 74 (217) (1,165)
Total Investment Derivatives
$(15,060) $886 $(574) $10,699
1Change in fair value includes realized/unrealized gains and losses including those that were opened and closed during the current fiscal year .
All investment derivative positions are included as part of investments at fair value on the Statement of Fiduciary Net Position . All changes in fair value are reported as part of Net Appreciation/(Depreciation) in fair value of investments in the Statement of Changes in Fiduciary Net Position .
NOTES TO THE BASIC FINANCIAL STATEMENTS CONTINUED
MASTER PAGE NO. 625
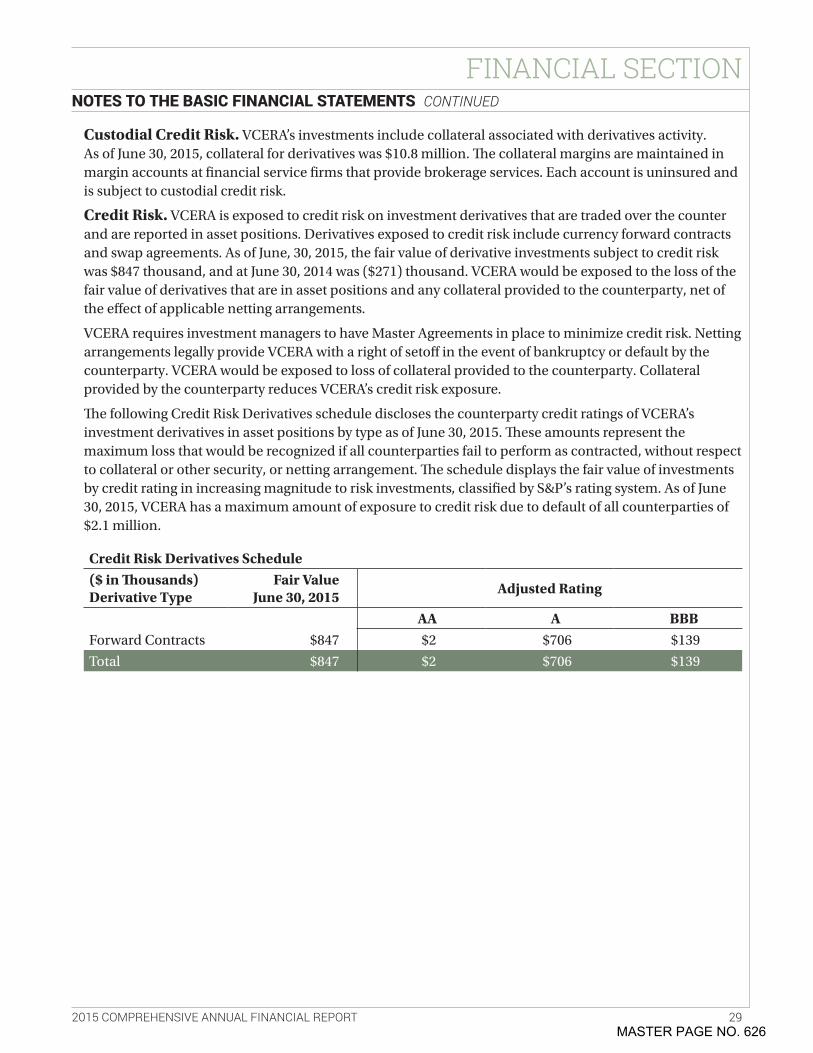
2015 COMPREHENSIVE ANNUAL FINANCIAL REPORT 29
FINANCIAL SECTION
Custodial Credit Risk. VCERA’s investments include collateral associated with derivatives activity . As of June 30, 2015, collateral for derivatives was $10 .8 million . The collateral margins are maintained in margin accounts at financial service firms that provide brokerage services . Each account is uninsured and is subject to custodial credit risk .
Credit Risk. VCERA is exposed to credit risk on investment derivatives that are traded over the counter and are reported in asset positions . Derivatives exposed to credit risk include currency forward contracts and swap agreements . As of June, 30, 2015, the fair value of derivative investments subject to credit risk was $847 thousand, and at June 30, 2014 was ($271) thousand . VCERA would be exposed to the loss of the fair value of derivatives that are in asset positions and any collateral provided to the counterparty, net of the effect of applicable netting arrangements .
VCERA requires investment managers to have Master Agreements in place to minimize credit risk . Netting arrangements legally provide VCERA with a right of setoff in the event of bankruptcy or default by the counterparty . VCERA would be exposed to loss of collateral provided to the counterparty . Collateral provided by the counterparty reduces VCERA’s credit risk exposure .
The following Credit Risk Derivatives schedule discloses the counterparty credit ratings of VCERA’s investment derivatives in asset positions by type as of June 30, 2015 . These amounts represent the maximum loss that would be recognized if all counterparties fail to perform as contracted, without respect to collateral or other security, or netting arrangement . The schedule displays the fair value of investments by credit rating in increasing magnitude to risk investments, classified by S&P’s rating system . As of June 30, 2015, VCERA has a maximum amount of exposure to credit risk due to default of all counterparties of $2 .1 million .
Credit Risk Derivatives Schedule($ in Thousands) Derivative Type
Fair Value June 30, 2015
Adjusted Rating
AA A BBBForward Contracts $847 $2 $706 $139
Total $847 $2 $706 $139
NOTES TO THE BASIC FINANCIAL STATEMENTS CONTINUED
MASTER PAGE NO. 626
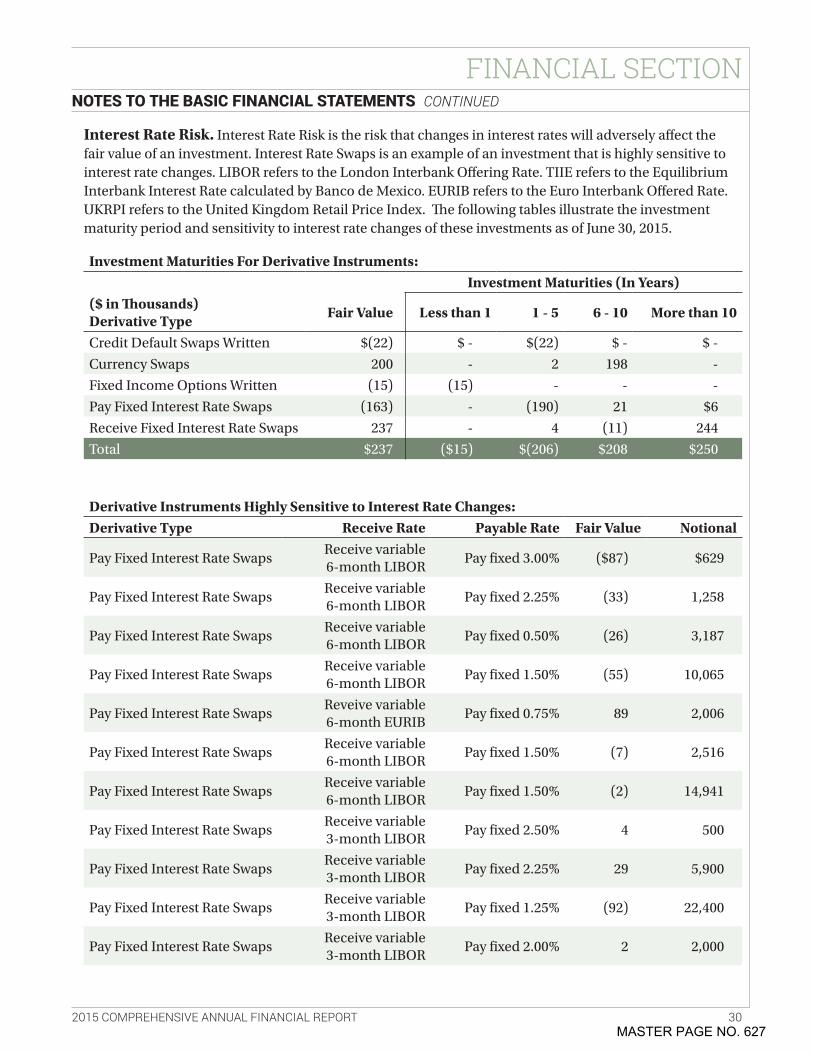
2015 COMPREHENSIVE ANNUAL FINANCIAL REPORT 30
FINANCIAL SECTION
Interest Rate Risk. Interest Rate Risk is the risk that changes in interest rates will adversely affect the fair value of an investment . Interest Rate Swaps is an example of an investment that is highly sensitive to interest rate changes . LIBOR refers to the London Interbank Offering Rate . TIIE refers to the Equilibrium Interbank Interest Rate calculated by Banco de Mexico . EURIB refers to the Euro Interbank Offered Rate . UKRPI refers to the United Kingdom Retail Price Index . The following tables illustrate the investment maturity period and sensitivity to interest rate changes of these investments as of June 30, 2015 .
Investment Maturities For Derivative Instruments:Investment Maturities (In Years)
($ in Thousands) Derivative Type
Fair Value Less than 1 1 - 5 6 - 10 More than 10
Credit Default Swaps Written $(22) $ - $(22) $ - $ -
Currency Swaps 200 - 2 198 -
Fixed Income Options Written (15) (15) - - -
Pay Fixed Interest Rate Swaps (163) - (190) 21 $6
Receive Fixed Interest Rate Swaps 237 - 4 (11) 244
Total $237 ($15) $(206) $208 $250
Derivative Instruments Highly Sensitive to Interest Rate Changes:Derivative Type Receive Rate Payable Rate Fair Value Notional
Pay Fixed Interest Rate SwapsReceive variable 6-month LIBOR
Pay fixed 3 .00% ($87) $629
Pay Fixed Interest Rate SwapsReceive variable 6-month LIBOR
Pay fixed 2 .25% (33) 1,258
Pay Fixed Interest Rate SwapsReceive variable 6-month LIBOR
Pay fixed 0 .50% (26) 3,187
Pay Fixed Interest Rate SwapsReceive variable 6-month LIBOR
Pay fixed 1 .50% (55) 10,065
Pay Fixed Interest Rate SwapsReveive variable 6-month EURIB
Pay fixed 0 .75% 89 2,006
Pay Fixed Interest Rate SwapsReceive variable 6-month LIBOR
Pay fixed 1 .50% (7) 2,516
Pay Fixed Interest Rate SwapsReceive variable 6-month LIBOR
Pay fixed 1 .50% (2) 14,941
Pay Fixed Interest Rate SwapsReceive variable 3-month LIBOR
Pay fixed 2 .50% 4 500
Pay Fixed Interest Rate SwapsReceive variable 3-month LIBOR
Pay fixed 2 .25% 29 5,900
Pay Fixed Interest Rate SwapsReceive variable 3-month LIBOR
Pay fixed 1 .25% (92) 22,400
Pay Fixed Interest Rate SwapsReceive variable 3-month LIBOR
Pay fixed 2 .00% 2 2,000
NOTES TO THE BASIC FINANCIAL STATEMENTS CONTINUED
MASTER PAGE NO. 627
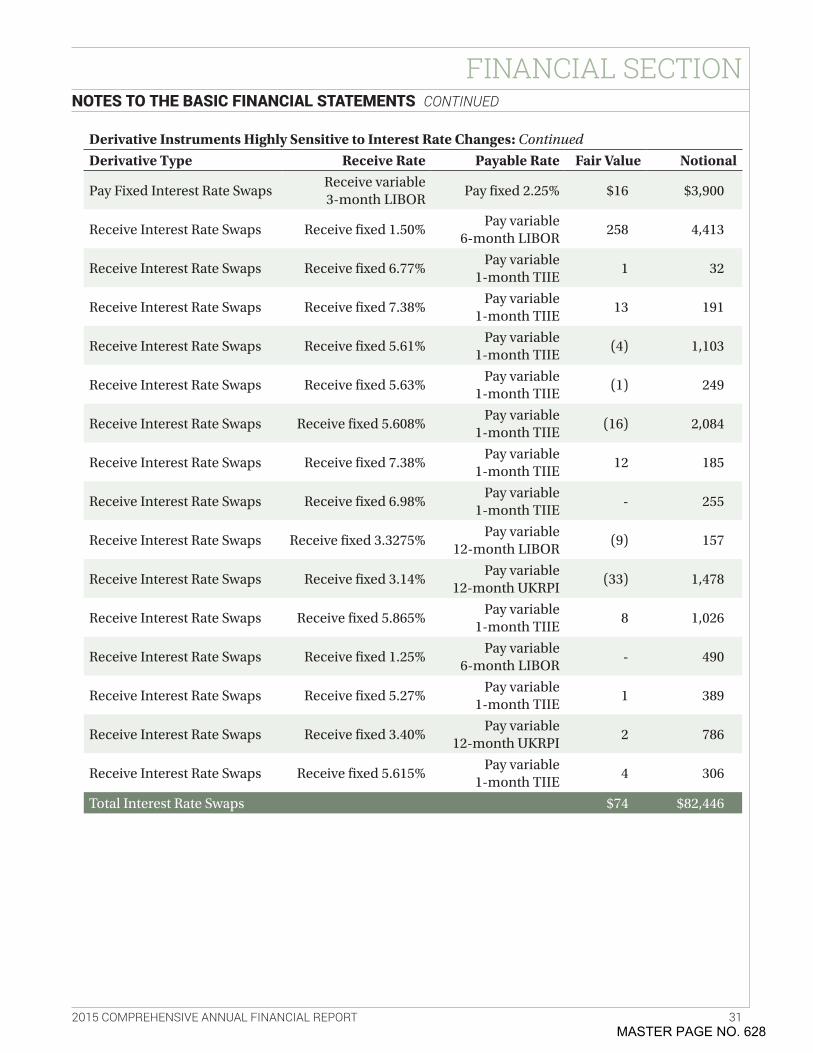
2015 COMPREHENSIVE ANNUAL FINANCIAL REPORT 31
FINANCIAL SECTION
Derivative Instruments Highly Sensitive to Interest Rate Changes: Continued
Derivative Type Receive Rate Payable Rate Fair Value Notional
Pay Fixed Interest Rate SwapsReceive variable 3-month LIBOR
Pay fixed 2 .25% $16 $3,900
Receive Interest Rate Swaps Receive fixed 1 .50%Pay variable
6-month LIBOR 258 4,413
Receive Interest Rate Swaps Receive fixed 6 .77%Pay variable
1-month TIIE 1 32
Receive Interest Rate Swaps Receive fixed 7 .38%Pay variable
1-month TIIE 13 191
Receive Interest Rate Swaps Receive fixed 5 .61%Pay variable
1-month TIIE (4) 1,103
Receive Interest Rate Swaps Receive fixed 5 .63%Pay variable
1-month TIIE (1) 249
Receive Interest Rate Swaps Receive fixed 5 .608%Pay variable
1-month TIIE (16) 2,084
Receive Interest Rate Swaps Receive fixed 7 .38%Pay variable
1-month TIIE 12 185
Receive Interest Rate Swaps Receive fixed 6 .98%Pay variable
1-month TIIE - 255
Receive Interest Rate Swaps Receive fixed 3 .3275%Pay variable
12-month LIBOR (9) 157
Receive Interest Rate Swaps Receive fixed 3 .14%Pay variable
12-month UKRPI (33) 1,478
Receive Interest Rate Swaps Receive fixed 5 .865%Pay variable
1-month TIIE 8 1,026
Receive Interest Rate Swaps Receive fixed 1 .25%Pay variable
6-month LIBOR - 490
Receive Interest Rate Swaps Receive fixed 5 .27%Pay variable
1-month TIIE 1 389
Receive Interest Rate Swaps Receive fixed 3 .40%Pay variable
12-month UKRPI 2 786
Receive Interest Rate Swaps Receive fixed 5 .615%Pay variable
1-month TIIE 4 306
Total Interest Rate Swaps $74 $82,446
NOTES TO THE BASIC FINANCIAL STATEMENTS CONTINUED
MASTER PAGE NO. 628
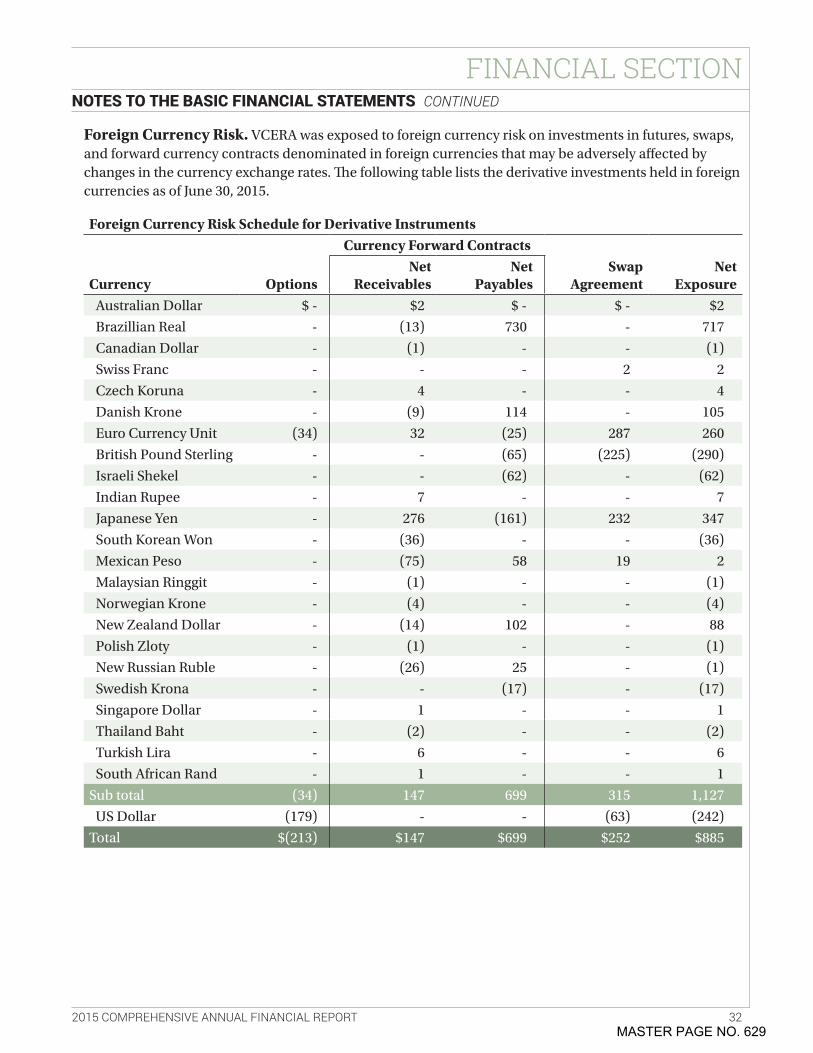
2015 COMPREHENSIVE ANNUAL FINANCIAL REPORT 32
FINANCIAL SECTION
Foreign Currency Risk. VCERA was exposed to foreign currency risk on investments in futures, swaps, and forward currency contracts denominated in foreign currencies that may be adversely affected by changes in the currency exchange rates . The following table lists the derivative investments held in foreign currencies as of June 30, 2015 .
Foreign Currency Risk Schedule for Derivative InstrumentsCurrency Forward Contracts
Currency OptionsNet
ReceivablesNet
PayablesSwap
AgreementNet
ExposureAustralian Dollar $ - $2 $ - $ - $2
Brazillian Real - (13) 730 - 717
Canadian Dollar - (1) - - (1)
Swiss Franc - - - 2 2
Czech Koruna - 4 - - 4
Danish Krone - (9) 114 - 105
Euro Currency Unit (34) 32 (25) 287 260
British Pound Sterling - - (65) (225) (290)
Israeli Shekel - - (62) - (62)
Indian Rupee - 7 - - 7
Japanese Yen - 276 (161) 232 347
South Korean Won - (36) - - (36)
Mexican Peso - (75) 58 19 2
Malaysian Ringgit - (1) - - (1)
Norwegian Krone - (4) - - (4)
New Zealand Dollar - (14) 102 - 88
Polish Zloty - (1) - - (1)
New Russian Ruble - (26) 25 - (1)
Swedish Krona - - (17) - (17)
Singapore Dollar - 1 - - 1
Thailand Baht - (2) - - (2)
Turkish Lira - 6 - - 6
South African Rand - 1 - - 1
Sub total (34) 147 699 315 1,127
US Dollar (179) - - (63) (242)
Total $(213) $147 $699 $252 $885
NOTES TO THE BASIC FINANCIAL STATEMENTS CONTINUED
MASTER PAGE NO. 629
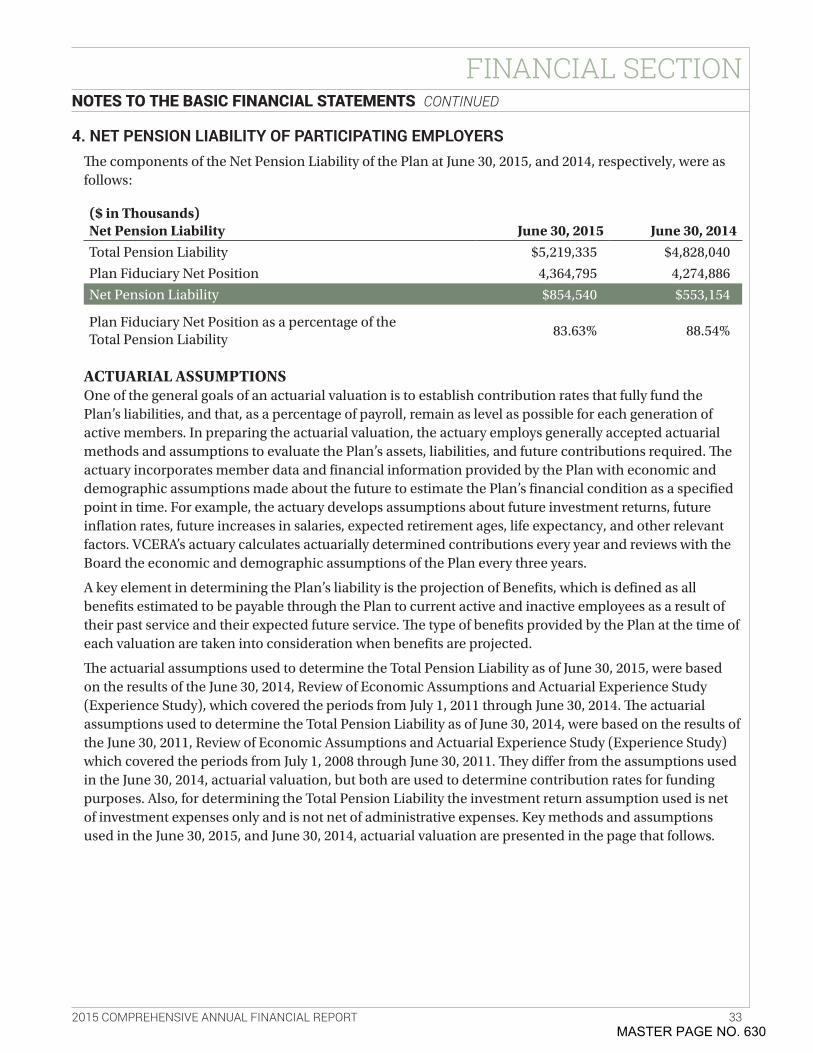
2015 COMPREHENSIVE ANNUAL FINANCIAL REPORT 33
FINANCIAL SECTION
4. NET PENSION LIABILITY OF PARTICIPATING EMPLOYERSThe components of the Net Pension Liability of the Plan at June 30, 2015, and 2014, respectively, were as follows:
($ in Thousands) Net Pension Liability June 30, 2015 June 30, 2014Total Pension Liability $5,219,335 $4,828,040
Plan Fiduciary Net Position 4,364,795 4,274,886
Net Pension Liability $854,540 $553,154
Plan Fiduciary Net Position as a percentage of the Total Pension Liability
83 .63% 88 .54%
ACTUARIAL ASSUMPTIONSOne of the general goals of an actuarial valuation is to establish contribution rates that fully fund the Plan’s liabilities, and that, as a percentage of payroll, remain as level as possible for each generation of active members . In preparing the actuarial valuation, the actuary employs generally accepted actuarial methods and assumptions to evaluate the Plan’s assets, liabilities, and future contributions required . The actuary incorporates member data and financial information provided by the Plan with economic and demographic assumptions made about the future to estimate the Plan’s financial condition as a specified point in time . For example, the actuary develops assumptions about future investment returns, future inflation rates, future increases in salaries, expected retirement ages, life expectancy, and other relevant factors . VCERA’s actuary calculates actuarially determined contributions every year and reviews with the Board the economic and demographic assumptions of the Plan every three years .
A key element in determining the Plan’s liability is the projection of Benefits, which is defined as all benefits estimated to be payable through the Plan to current active and inactive employees as a result of their past service and their expected future service . The type of benefits provided by the Plan at the time of each valuation are taken into consideration when benefits are projected .
The actuarial assumptions used to determine the Total Pension Liability as of June 30, 2015, were based on the results of the June 30, 2014, Review of Economic Assumptions and Actuarial Experience Study (Experience Study), which covered the periods from July 1, 2011 through June 30, 2014 . The actuarial assumptions used to determine the Total Pension Liability as of June 30, 2014, were based on the results of the June 30, 2011, Review of Economic Assumptions and Actuarial Experience Study (Experience Study) which covered the periods from July 1, 2008 through June 30, 2011 . They differ from the assumptions used in the June 30, 2014, actuarial valuation, but both are used to determine contribution rates for funding purposes . Also, for determining the Total Pension Liability the investment return assumption used is net of investment expenses only and is not net of administrative expenses . Key methods and assumptions used in the June 30, 2015, and June 30, 2014, actuarial valuation are presented in the page that follows .
NOTES TO THE BASIC FINANCIAL STATEMENTS CONTINUED
MASTER PAGE NO. 630
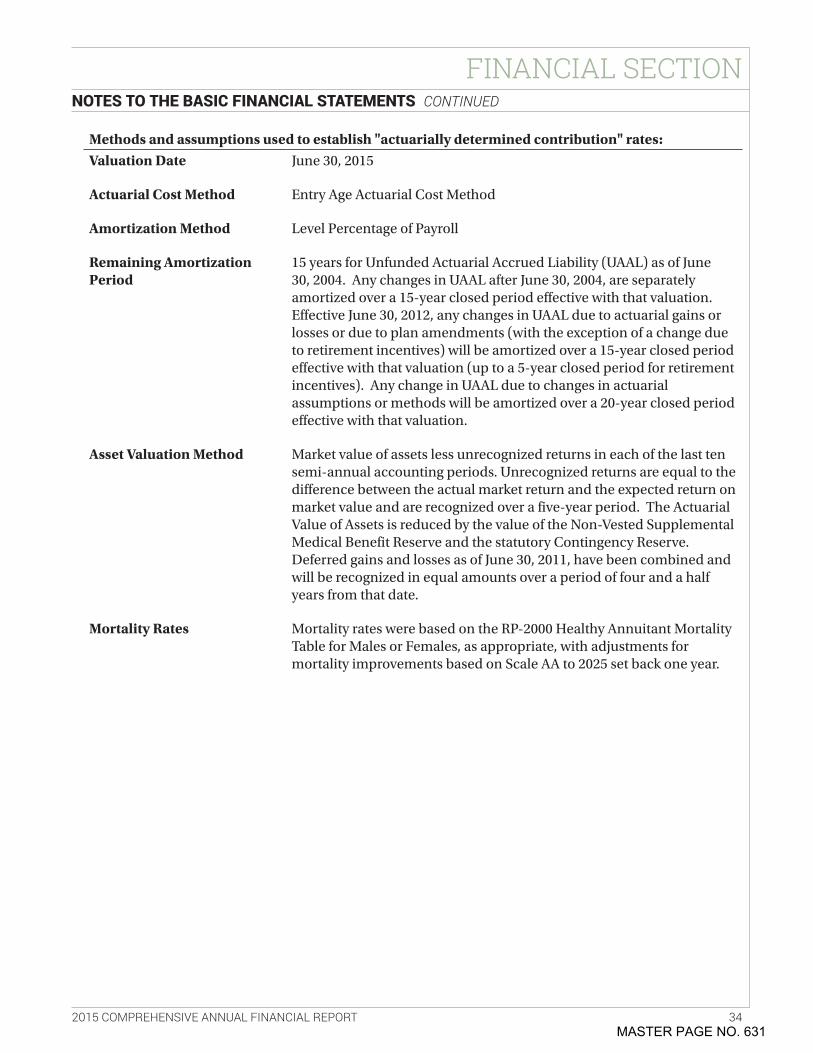
2015 COMPREHENSIVE ANNUAL FINANCIAL REPORT 34
FINANCIAL SECTION
Methods and assumptions used to establish "actuarially determined contribution" rates:Valuation Date June 30, 2015
Actuarial Cost Method Entry Age Actuarial Cost Method
Amortization Method Level Percentage of Payroll
Remaining Amortization Period
15 years for Unfunded Actuarial Accrued Liability (UAAL) as of June 30, 2004 . Any changes in UAAL after June 30, 2004, are separately amortized over a 15-year closed period effective with that valuation . Effective June 30, 2012, any changes in UAAL due to actuarial gains or losses or due to plan amendments (with the exception of a change due to retirement incentives) will be amortized over a 15-year closed period effective with that valuation (up to a 5-year closed period for retirement incentives) . Any change in UAAL due to changes in actuarial assumptions or methods will be amortized over a 20-year closed period effective with that valuation .
Asset Valuation Method Market value of assets less unrecognized returns in each of the last ten semi-annual accounting periods . Unrecognized returns are equal to the difference between the actual market return and the expected return on market value and are recognized over a five-year period . The Actuarial Value of Assets is reduced by the value of the Non-Vested Supplemental Medical Benefit Reserve and the statutory Contingency Reserve . Deferred gains and losses as of June 30, 2011, have been combined and will be recognized in equal amounts over a period of four and a half years from that date .
Mortality Rates Mortality rates were based on the RP-2000 Healthy Annuitant Mortality Table for Males or Females, as appropriate, with adjustments for mortality improvements based on Scale AA to 2025 set back one year .
NOTES TO THE BASIC FINANCIAL STATEMENTS CONTINUED
MASTER PAGE NO. 631
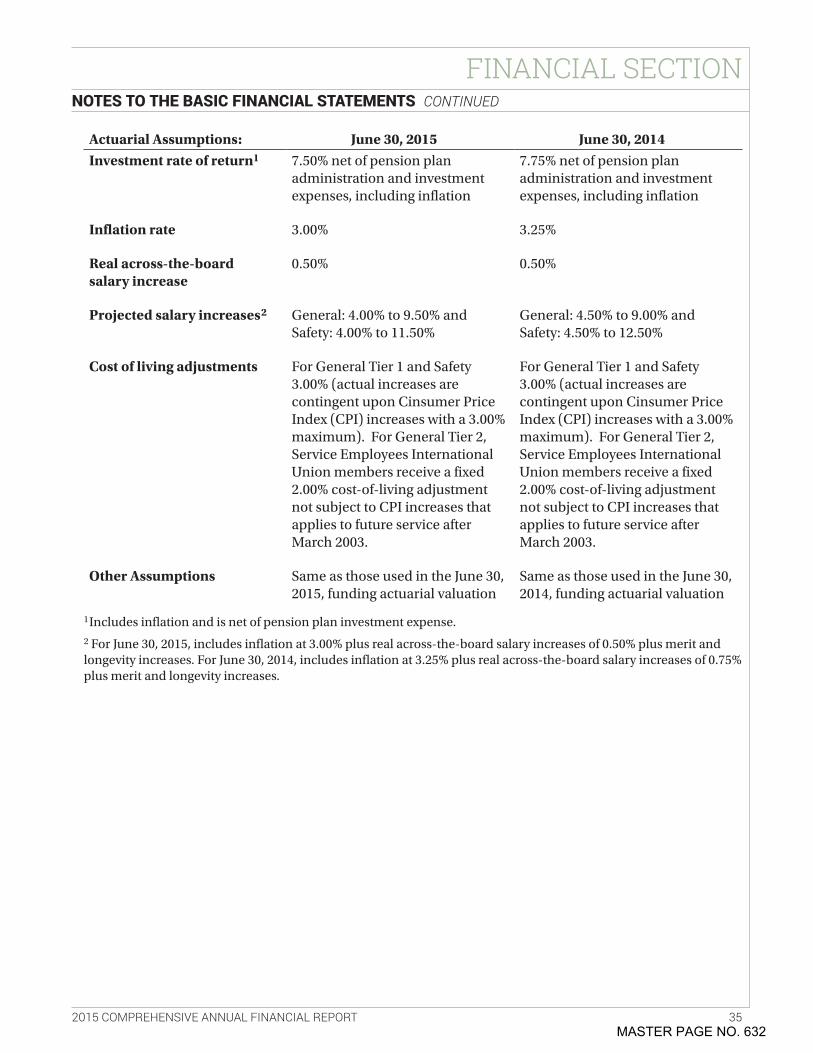
2015 COMPREHENSIVE ANNUAL FINANCIAL REPORT 35
FINANCIAL SECTION
Actuarial Assumptions: June 30, 2015 June 30, 2014Investment rate of return1 7 .50% net of pension plan
administration and investment expenses, including inflation
7 .75% net of pension plan administration and investment expenses, including inflation
Inflation rate 3 .00% 3 .25%
Real across-the-board salary increase
0 .50% 0 .50%
Projected salary increases2 General: 4 .00% to 9 .50% and Safety: 4 .00% to 11 .50%
General: 4 .50% to 9 .00% and Safety: 4 .50% to 12 .50%
Cost of living adjustments For General Tier 1 and Safety 3 .00% (actual increases are contingent upon Cinsumer Price Index (CPI) increases with a 3 .00% maximum) . For General Tier 2, Service Employees International Union members receive a fixed 2 .00% cost-of-living adjustment not subject to CPI increases that applies to future service after March 2003 .
For General Tier 1 and Safety 3 .00% (actual increases are contingent upon Cinsumer Price Index (CPI) increases with a 3 .00% maximum) . For General Tier 2, Service Employees International Union members receive a fixed 2 .00% cost-of-living adjustment not subject to CPI increases that applies to future service after March 2003 .
Other Assumptions Same as those used in the June 30, 2015, funding actuarial valuation
Same as those used in the June 30, 2014, funding actuarial valuation
1Includes inflation and is net of pension plan investment expense .2 For June 30, 2015, includes inflation at 3 .00% plus real across-the-board salary increases of 0 .50% plus merit and longevity increases . For June 30, 2014, includes inflation at 3 .25% plus real across-the-board salary increases of 0 .75% plus merit and longevity increases .
NOTES TO THE BASIC FINANCIAL STATEMENTS CONTINUED
MASTER PAGE NO. 632
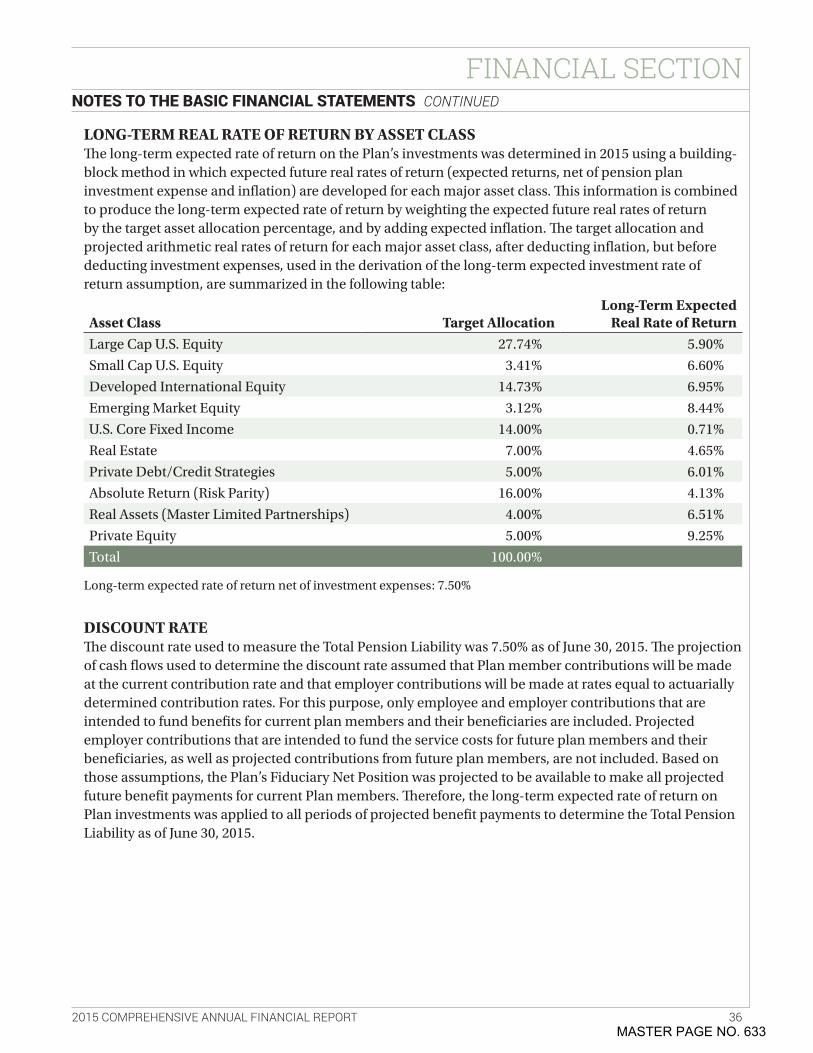
2015 COMPREHENSIVE ANNUAL FINANCIAL REPORT 36
FINANCIAL SECTION
LONG-TERM REAL RATE OF RETURN BY ASSET CLASSThe long-term expected rate of return on the Plan’s investments was determined in 2015 using a building-block method in which expected future real rates of return (expected returns, net of pension plan investment expense and inflation) are developed for each major asset class . This information is combined to produce the long-term expected rate of return by weighting the expected future real rates of return by the target asset allocation percentage, and by adding expected inflation . The target allocation and projected arithmetic real rates of return for each major asset class, after deducting inflation, but before deducting investment expenses, used in the derivation of the long-term expected investment rate of return assumption, are summarized in the following table:
Asset Class Target AllocationLong-Term Expected
Real Rate of ReturnLarge Cap U .S . Equity 27 .74% 5 .90%
Small Cap U .S . Equity 3 .41% 6 .60%
Developed International Equity 14 .73% 6 .95%
Emerging Market Equity 3 .12% 8 .44%
U .S . Core Fixed Income 14 .00% 0 .71%
Real Estate 7 .00% 4 .65%
Private Debt/Credit Strategies 5 .00% 6 .01%
Absolute Return (Risk Parity) 16 .00% 4 .13%
Real Assets (Master Limited Partnerships) 4 .00% 6 .51%
Private Equity 5 .00% 9 .25%
Total 100 .00%
Long-term expected rate of return net of investment expenses: 7 .50%
DISCOUNT RATEThe discount rate used to measure the Total Pension Liability was 7 .50% as of June 30, 2015 . The projection of cash flows used to determine the discount rate assumed that Plan member contributions will be made at the current contribution rate and that employer contributions will be made at rates equal to actuarially determined contribution rates . For this purpose, only employee and employer contributions that are intended to fund benefits for current plan members and their beneficiaries are included . Projected employer contributions that are intended to fund the service costs for future plan members and their beneficiaries, as well as projected contributions from future plan members, are not included . Based on those assumptions, the Plan’s Fiduciary Net Position was projected to be available to make all projected future benefit payments for current Plan members . Therefore, the long-term expected rate of return on Plan investments was applied to all periods of projected benefit payments to determine the Total Pension Liability as of June 30, 2015 .
NOTES TO THE BASIC FINANCIAL STATEMENTS CONTINUED
MASTER PAGE NO. 633
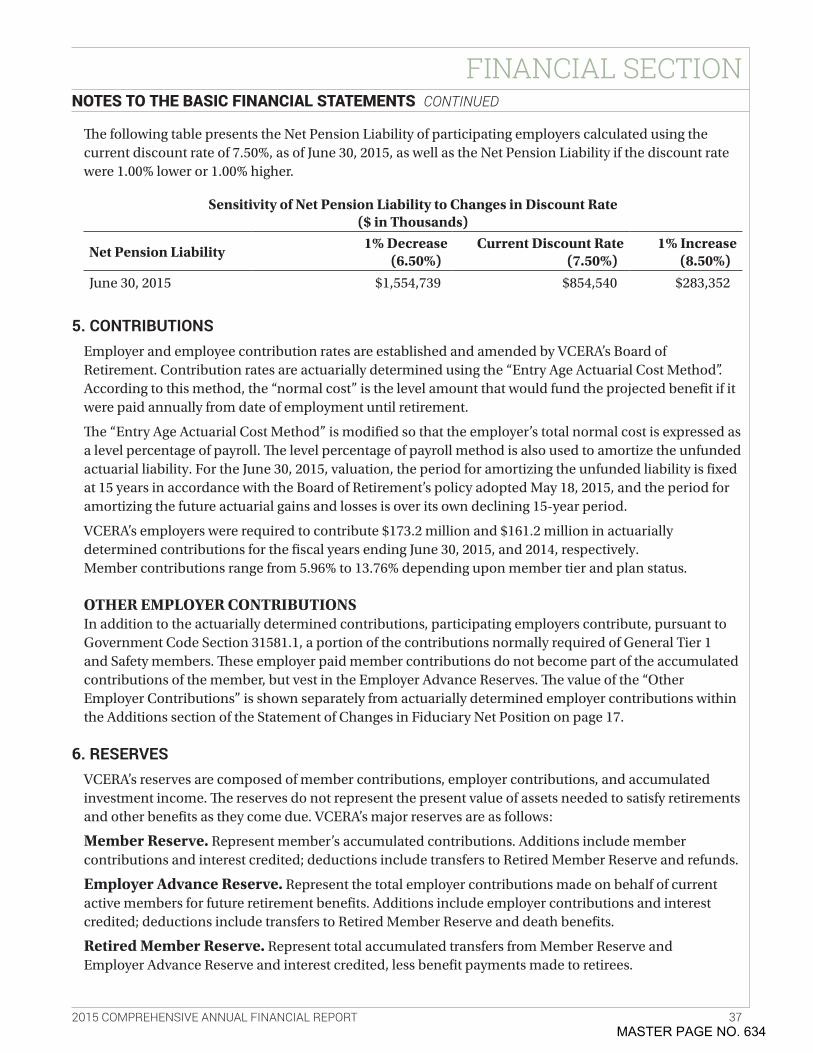
2015 COMPREHENSIVE ANNUAL FINANCIAL REPORT 37
FINANCIAL SECTION
The following table presents the Net Pension Liability of participating employers calculated using the current discount rate of 7 .50%, as of June 30, 2015, as well as the Net Pension Liability if the discount rate were 1 .00% lower or 1 .00% higher .
Sensitivity of Net Pension Liability to Changes in Discount Rate ($ in Thousands)
Net Pension Liability1% Decrease
(6.50%)Current Discount Rate
(7.50%)1% Increase
(8.50%)
June 30, 2015 $1,554,739 $854,540 $283,352
5. CONTRIBUTIONSEmployer and employee contribution rates are established and amended by VCERA’s Board of Retirement . Contribution rates are actuarially determined using the “Entry Age Actuarial Cost Method” . According to this method, the “normal cost” is the level amount that would fund the projected benefit if it were paid annually from date of employment until retirement .
The “Entry Age Actuarial Cost Method” is modified so that the employer’s total normal cost is expressed as a level percentage of payroll . The level percentage of payroll method is also used to amortize the unfunded actuarial liability . For the June 30, 2015, valuation, the period for amortizing the unfunded liability is fixed at 15 years in accordance with the Board of Retirement’s policy adopted May 18, 2015, and the period for amortizing the future actuarial gains and losses is over its own declining 15-year period .
VCERA’s employers were required to contribute $173 .2 million and $161 .2 million in actuarially determined contributions for the fiscal years ending June 30, 2015, and 2014, respectively .Member contributions range from 5 .96% to 13 .76% depending upon member tier and plan status .
OTHER EMPLOYER CONTRIBUTIONSIn addition to the actuarially determined contributions, participating employers contribute, pursuant to Government Code Section 31581 .1, a portion of the contributions normally required of General Tier 1 and Safety members . These employer paid member contributions do not become part of the accumulated contributions of the member, but vest in the Employer Advance Reserves . The value of the “Other Employer Contributions” is shown separately from actuarially determined employer contributions within the Additions section of the Statement of Changes in Fiduciary Net Position on page 17 .
6. RESERVESVCERA’s reserves are composed of member contributions, employer contributions, and accumulated investment income . The reserves do not represent the present value of assets needed to satisfy retirements and other benefits as they come due . VCERA’s major reserves are as follows:
Member Reserve. Represent member’s accumulated contributions . Additions include member contributions and interest credited; deductions include transfers to Retired Member Reserve and refunds .
Employer Advance Reserve. Represent the total employer contributions made on behalf of current active members for future retirement benefits . Additions include employer contributions and interest credited; deductions include transfers to Retired Member Reserve and death benefits .
Retired Member Reserve. Represent total accumulated transfers from Member Reserve andEmployer Advance Reserve and interest credited, less benefit payments made to retirees .
NOTES TO THE BASIC FINANCIAL STATEMENTS CONTINUED
MASTER PAGE NO. 634
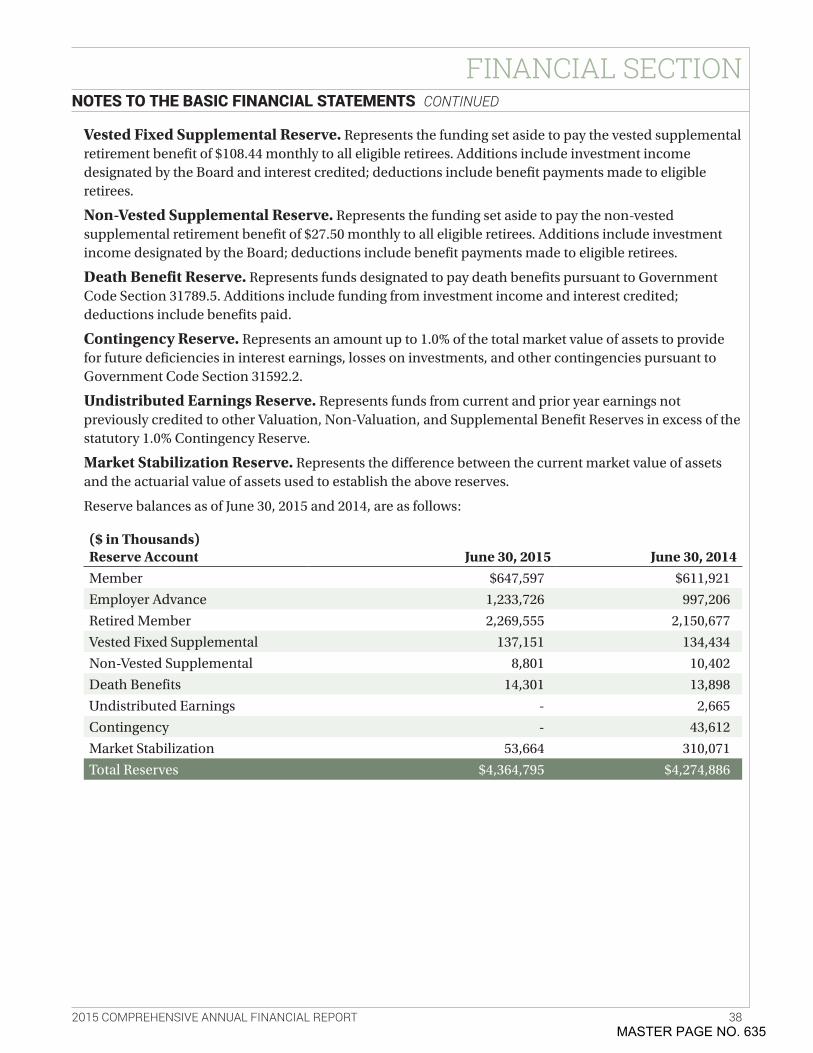
2015 COMPREHENSIVE ANNUAL FINANCIAL REPORT 38
FINANCIAL SECTION
Vested Fixed Supplemental Reserve. Represents the funding set aside to pay the vested supplemental retirement benefit of $108 .44 monthly to all eligible retirees . Additions include investment income designated by the Board and interest credited; deductions include benefit payments made to eligible retirees .
Non-Vested Supplemental Reserve. Represents the funding set aside to pay the non-vested supplemental retirement benefit of $27 .50 monthly to all eligible retirees . Additions include investment income designated by the Board; deductions include benefit payments made to eligible retirees .
Death Benefit Reserve. Represents funds designated to pay death benefits pursuant to Government Code Section 31789 .5 . Additions include funding from investment income and interest credited; deductions include benefits paid .
Contingency Reserve. Represents an amount up to 1 .0% of the total market value of assets to provide for future deficiencies in interest earnings, losses on investments, and other contingencies pursuant to Government Code Section 31592 .2 .
Undistributed Earnings Reserve. Represents funds from current and prior year earnings not previously credited to other Valuation, Non-Valuation, and Supplemental Benefit Reserves in excess of the statutory 1 .0% Contingency Reserve .
Market Stabilization Reserve. Represents the difference between the current market value of assets and the actuarial value of assets used to establish the above reserves .
Reserve balances as of June 30, 2015 and 2014, are as follows:
($ in Thousands) Reserve Account June 30, 2015 June 30, 2014Member $647,597 $611,921
Employer Advance 1,233,726 997,206
Retired Member 2,269,555 2,150,677
Vested Fixed Supplemental 137,151 134,434
Non-Vested Supplemental 8,801 10,402
Death Benefits 14,301 13,898
Undistributed Earnings - 2,665
Contingency - 43,612
Market Stabilization 53,664 310,071
Total Reserves $4,364,795 $4,274,886
NOTES TO THE BASIC FINANCIAL STATEMENTS CONTINUED
MASTER PAGE NO. 635
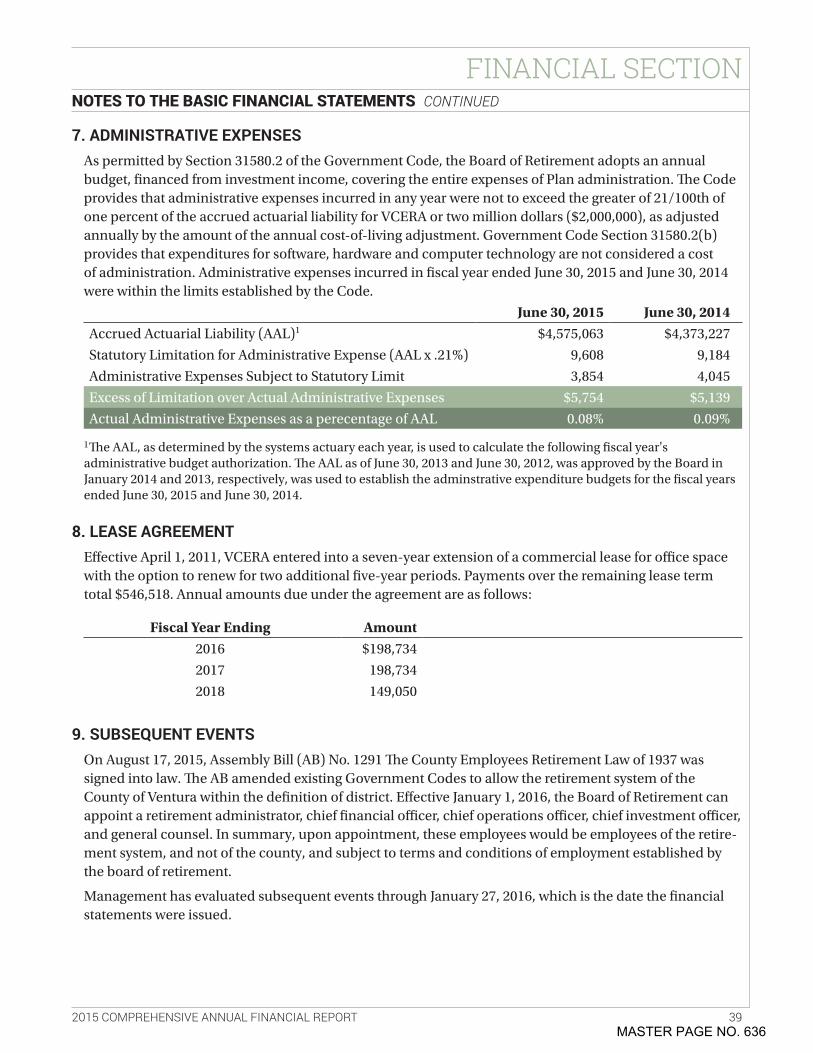
2015 COMPREHENSIVE ANNUAL FINANCIAL REPORT 39
FINANCIAL SECTION
7. ADMINISTRATIVE EXPENSESAs permitted by Section 31580 .2 of the Government Code, the Board of Retirement adopts an annual budget, financed from investment income, covering the entire expenses of Plan administration . The Code provides that administrative expenses incurred in any year were not to exceed the greater of 21/100th of one percent of the accrued actuarial liability for VCERA or two million dollars ($2,000,000), as adjusted annually by the amount of the annual cost-of-living adjustment . Government Code Section 31580 .2(b) provides that expenditures for software, hardware and computer technology are not considered a cost of administration . Administrative expenses incurred in fiscal year ended June 30, 2015 and June 30, 2014 were within the limits established by the Code .
June 30, 2015 June 30, 2014Accrued Actuarial Liability (AAL)1 $4,575,063 $4,373,227
Statutory Limitation for Administrative Expense (AAL x .21%) 9,608 9,184
Administrative Expenses Subject to Statutory Limit 3,854 4,045
Excess of Limitation over Actual Administrative Expenses $5,754 $5,139
Actual Administrative Expenses as a perecentage of AAL 0 .08% 0 .09%
1The AAL, as determined by the systems actuary each year, is used to calculate the following fiscal year's administrative budget authorization . The AAL as of June 30, 2013 and June 30, 2012, was approved by the Board in January 2014 and 2013, respectively, was used to establish the adminstrative expenditure budgets for the fiscal years ended June 30, 2015 and June 30, 2014 .
8. LEASE AGREEMENT
Effective April 1, 2011, VCERA entered into a seven-year extension of a commercial lease for office space with the option to renew for two additional five-year periods . Payments over the remaining lease term total $546,518 . Annual amounts due under the agreement are as follows:
Fiscal Year Ending Amount2016 $198,734
2017 198,734
2018 149,050
9. SUBSEQUENT EVENTSOn August 17, 2015, Assembly Bill (AB) No . 1291 The County Employees Retirement Law of 1937 was signed into law . The AB amended existing Government Codes to allow the retirement system of the County of Ventura within the definition of district . Effective January 1, 2016, the Board of Retirement can appoint a retirement administrator, chief financial officer, chief operations officer, chief investment officer, and general counsel . In summary, upon appointment, these employees would be employees of the retire-ment system, and not of the county, and subject to terms and conditions of employment established by the board of retirement .
Management has evaluated subsequent events through January 27, 2016, which is the date the financial statements were issued .
NOTES TO THE BASIC FINANCIAL STATEMENTS CONTINUED
MASTER PAGE NO. 636
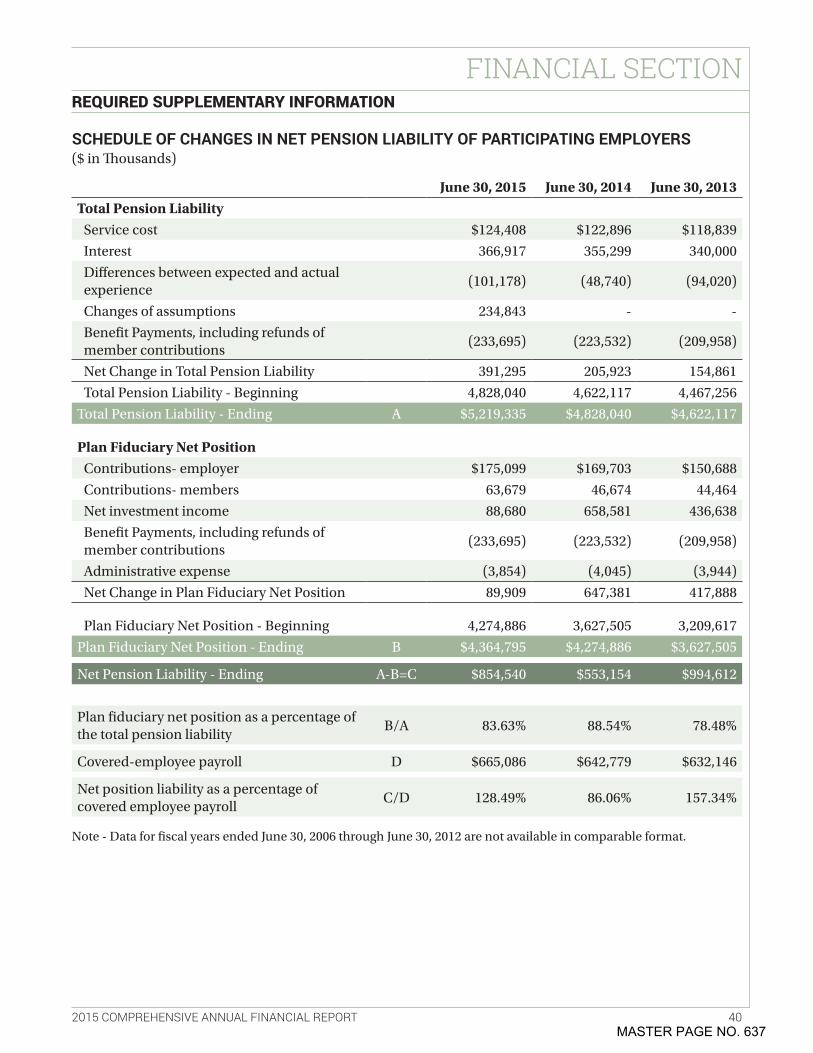
2015 COMPREHENSIVE ANNUAL FINANCIAL REPORT 40
FINANCIAL SECTIONREQUIRED SUPPLEMENTARY INFORMATION
SCHEDULE OF CHANGES IN NET PENSION LIABILITY OF PARTICIPATING EMPLOYERS($ in Thousands)
June 30, 2015 June 30, 2014 June 30, 2013Total Pension Liability
Service cost $124,408 $122,896 $118,839
Interest 366,917 355,299 340,000
Differences between expected and actual experience
(101,178) (48,740) (94,020)
Changes of assumptions 234,843 - -
Benefit Payments, including refunds of member contributions
(233,695) (223,532) (209,958)
Net Change in Total Pension Liability 391,295 205,923 154,861
Total Pension Liability - Beginning 4,828,040 4,622,117 4,467,256
Total Pension Liability - Ending A $5,219,335 $4,828,040 $4,622,117
Plan Fiduciary Net PositionContributions- employer $175,099 $169,703 $150,688
Contributions- members 63,679 46,674 44,464
Net investment income 88,680 658,581 436,638
Benefit Payments, including refunds of member contributions
(233,695) (223,532) (209,958)
Administrative expense (3,854) (4,045) (3,944)
Net Change in Plan Fiduciary Net Position 89,909 647,381 417,888
Plan Fiduciary Net Position - Beginning 4,274,886 3,627,505 3,209,617
Plan Fiduciary Net Position - Ending B $4,364,795 $4,274,886 $3,627,505
Net Pension Liability - Ending A-B=C $854,540 $553,154 $994,612
Plan fiduciary net position as a percentage of the total pension liability
B/A 83 .63% 88 .54% 78 .48%
Covered-employee payroll D $665,086 $642,779 $632,146
Net position liability as a percentage of covered employee payroll
C/D 128 .49% 86 .06% 157 .34%
Note - Data for fiscal years ended June 30, 2006 through June 30, 2012 are not available in comparable format .
MASTER PAGE NO. 637
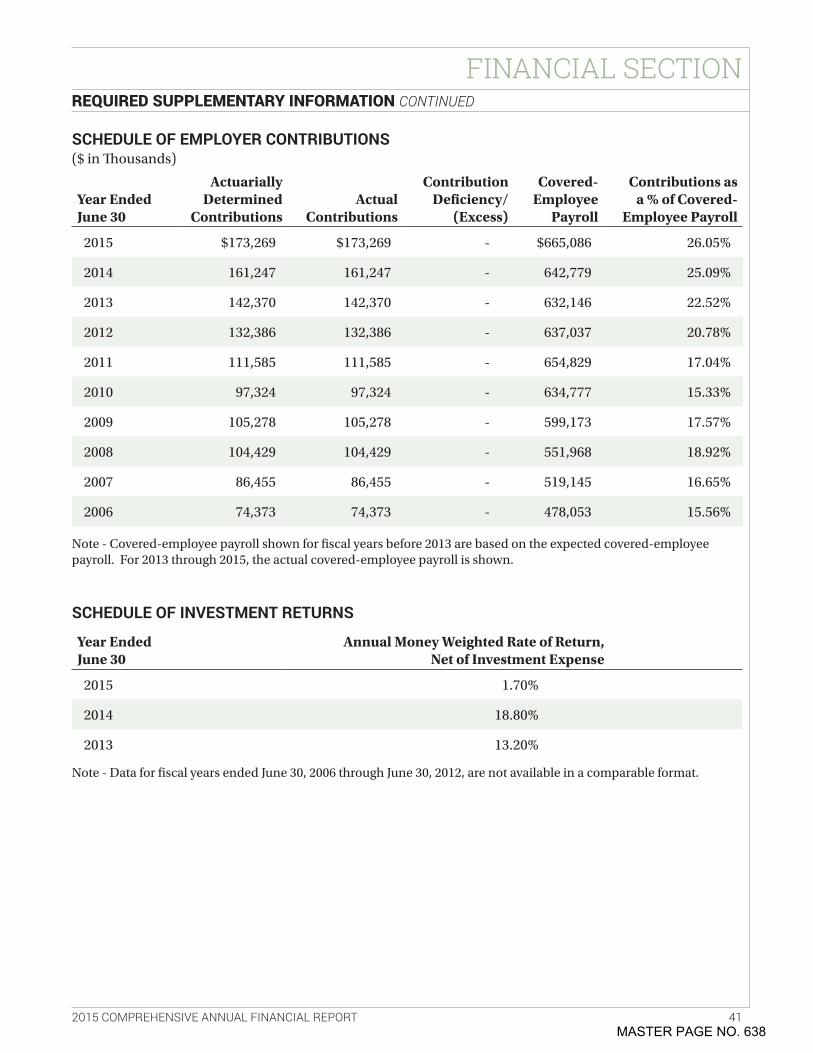
2015 COMPREHENSIVE ANNUAL FINANCIAL REPORT 41
FINANCIAL SECTIONREQUIRED SUPPLEMENTARY INFORMATION CONTINUED
SCHEDULE OF EMPLOYER CONTRIBUTIONS($ in Thousands)
SCHEDULE OF INVESTMENT RETURNS
Year Ended June 30
Actuarially Determined
ContributionsActual
Contributions
Contribution Deficiency/
(Excess)
Covered- Employee
Payroll
Contributions as a % of Covered-
Employee Payroll
2015 $173,269 $173,269 - $665,086 26 .05%
2014 161,247 161,247 - 642,779 25 .09%
2013 142,370 142,370 - 632,146 22 .52%
2012 132,386 132,386 - 637,037 20 .78%
2011 111,585 111,585 - 654,829 17 .04%
2010 97,324 97,324 - 634,777 15 .33%
2009 105,278 105,278 - 599,173 17 .57%
2008 104,429 104,429 - 551,968 18 .92%
2007 86,455 86,455 - 519,145 16 .65%
2006 74,373 74,373 - 478,053 15 .56%
Year Ended June 30
Annual Money Weighted Rate of Return, Net of Investment Expense
2015 1 .70%
2014 18 .80%
2013 13 .20%
Note - Covered-employee payroll shown for fiscal years before 2013 are based on the expected covered-employee payroll . For 2013 through 2015, the actual covered-employee payroll is shown .
Note - Data for fiscal years ended June 30, 2006 through June 30, 2012, are not available in a comparable format .
MASTER PAGE NO. 638
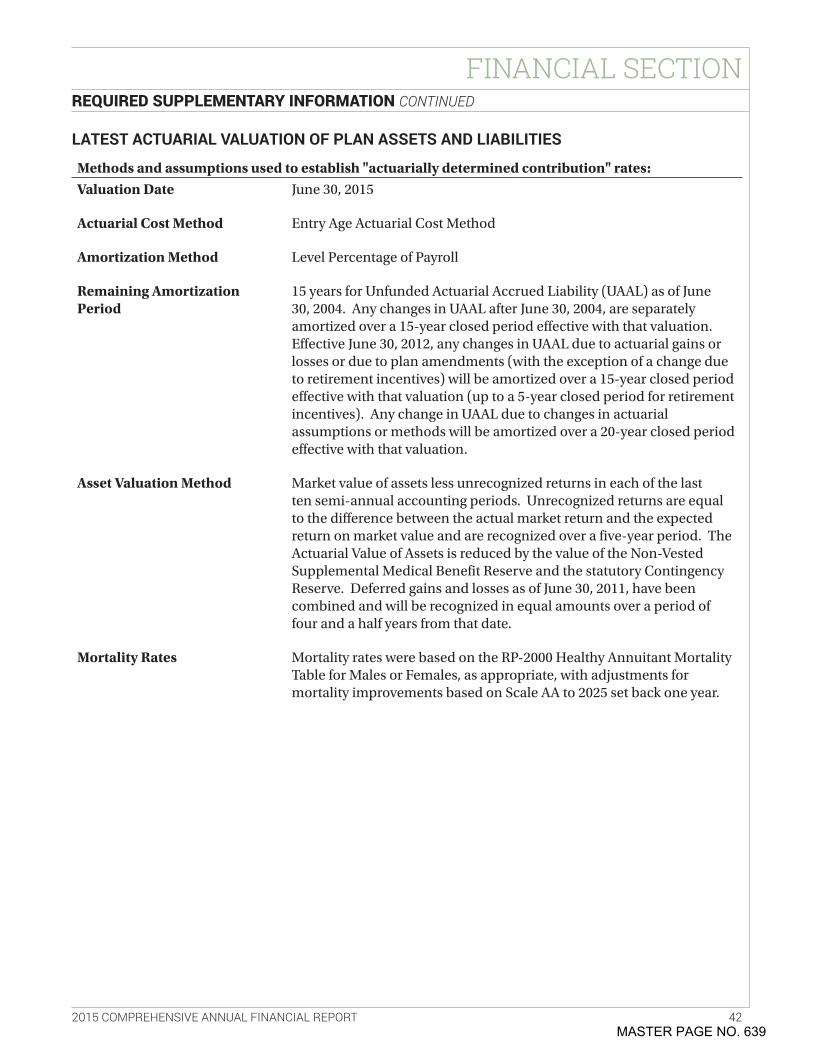
2015 COMPREHENSIVE ANNUAL FINANCIAL REPORT 42
FINANCIAL SECTIONREQUIRED SUPPLEMENTARY INFORMATION CONTINUED
LATEST ACTUARIAL VALUATION OF PLAN ASSETS AND LIABILITIES
Methods and assumptions used to establish "actuarially determined contribution" rates:Valuation Date June 30, 2015
Actuarial Cost Method Entry Age Actuarial Cost Method
Amortization Method Level Percentage of Payroll
Remaining Amortization Period
15 years for Unfunded Actuarial Accrued Liability (UAAL) as of June 30, 2004 . Any changes in UAAL after June 30, 2004, are separately amortized over a 15-year closed period effective with that valuation . Effective June 30, 2012, any changes in UAAL due to actuarial gains or losses or due to plan amendments (with the exception of a change due to retirement incentives) will be amortized over a 15-year closed period effective with that valuation (up to a 5-year closed period for retirement incentives) . Any change in UAAL due to changes in actuarial assumptions or methods will be amortized over a 20-year closed period effective with that valuation .
Asset Valuation Method Market value of assets less unrecognized returns in each of the last ten semi-annual accounting periods . Unrecognized returns are equal to the difference between the actual market return and the expected return on market value and are recognized over a five-year period . The Actuarial Value of Assets is reduced by the value of the Non-Vested Supplemental Medical Benefit Reserve and the statutory Contingency Reserve . Deferred gains and losses as of June 30, 2011, have been combined and will be recognized in equal amounts over a period of four and a half years from that date .
Mortality Rates Mortality rates were based on the RP-2000 Healthy Annuitant Mortality Table for Males or Females, as appropriate, with adjustments for mortality improvements based on Scale AA to 2025 set back one year .
MASTER PAGE NO. 639
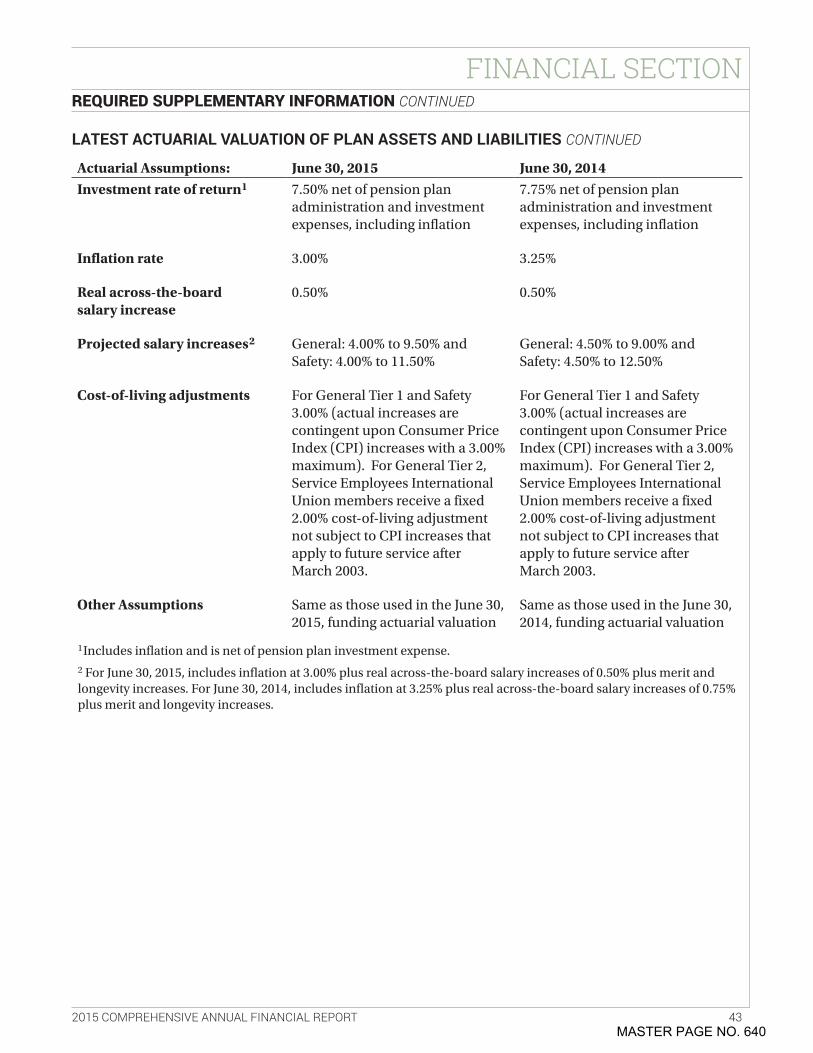
2015 COMPREHENSIVE ANNUAL FINANCIAL REPORT 43
FINANCIAL SECTION
Actuarial Assumptions: June 30, 2015 June 30, 2014Investment rate of return1 7 .50% net of pension plan
administration and investment expenses, including inflation
7 .75% net of pension plan administration and investment expenses, including inflation
Inflation rate 3 .00% 3 .25%
Real across-the-board salary increase
0 .50% 0 .50%
Projected salary increases2 General: 4 .00% to 9 .50% and Safety: 4 .00% to 11 .50%
General: 4 .50% to 9 .00% and Safety: 4 .50% to 12 .50%
Cost-of-living adjustments For General Tier 1 and Safety 3 .00% (actual increases are contingent upon Consumer Price Index (CPI) increases with a 3 .00% maximum) . For General Tier 2, Service Employees International Union members receive a fixed 2 .00% cost-of-living adjustment not subject to CPI increases that apply to future service after March 2003 .
For General Tier 1 and Safety 3 .00% (actual increases are contingent upon Consumer Price Index (CPI) increases with a 3 .00% maximum) . For General Tier 2, Service Employees International Union members receive a fixed 2 .00% cost-of-living adjustment not subject to CPI increases that apply to future service after March 2003 .
Other Assumptions Same as those used in the June 30, 2015, funding actuarial valuation
Same as those used in the June 30, 2014, funding actuarial valuation
1Includes inflation and is net of pension plan investment expense .2 For June 30, 2015, includes inflation at 3 .00% plus real across-the-board salary increases of 0 .50% plus merit and longevity increases . For June 30, 2014, includes inflation at 3 .25% plus real across-the-board salary increases of 0 .75% plus merit and longevity increases .
REQUIRED SUPPLEMENTARY INFORMATION CONTINUED
LATEST ACTUARIAL VALUATION OF PLAN ASSETS AND LIABILITIES CONTINUED
MASTER PAGE NO. 640
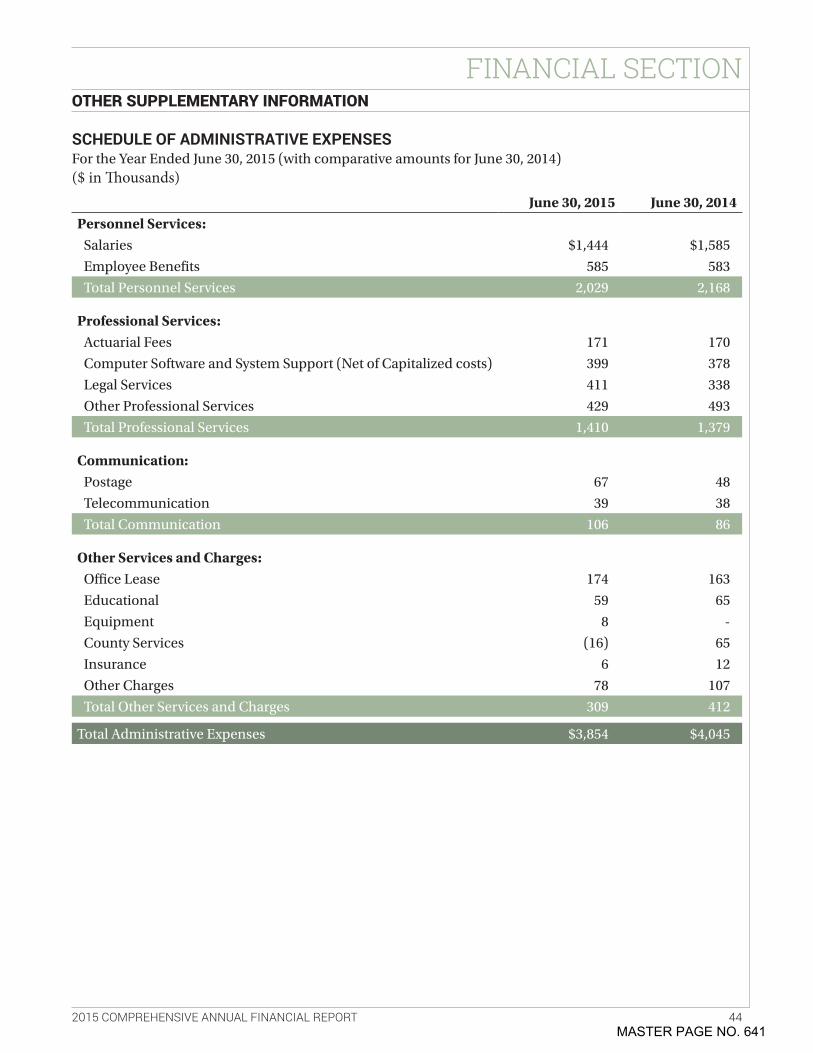
2015 COMPREHENSIVE ANNUAL FINANCIAL REPORT 44
FINANCIAL SECTIONOTHER SUPPLEMENTARY INFORMATION
SCHEDULE OF ADMINISTRATIVE EXPENSESFor the Year Ended June 30, 2015 (with comparative amounts for June 30, 2014)($ in Thousands)
June 30, 2015 June 30, 2014Personnel Services:
Salaries $1,444 $1,585
Employee Benefits 585 583
Total Personnel Services 2,029 2,168
Professional Services:Actuarial Fees 171 170
Computer Software and System Support (Net of Capitalized costs) 399 378
Legal Services 411 338
Other Professional Services 429 493
Total Professional Services 1,410 1,379
Communication:Postage 67 48
Telecommunication 39 38
Total Communication 106 86
Other Services and Charges:Office Lease 174 163
Educational 59 65
Equipment 8 -
County Services (16) 65
Insurance 6 12
Other Charges 78 107
Total Other Services and Charges 309 412
Total Administrative Expenses $3,854 $4,045
MASTER PAGE NO. 641
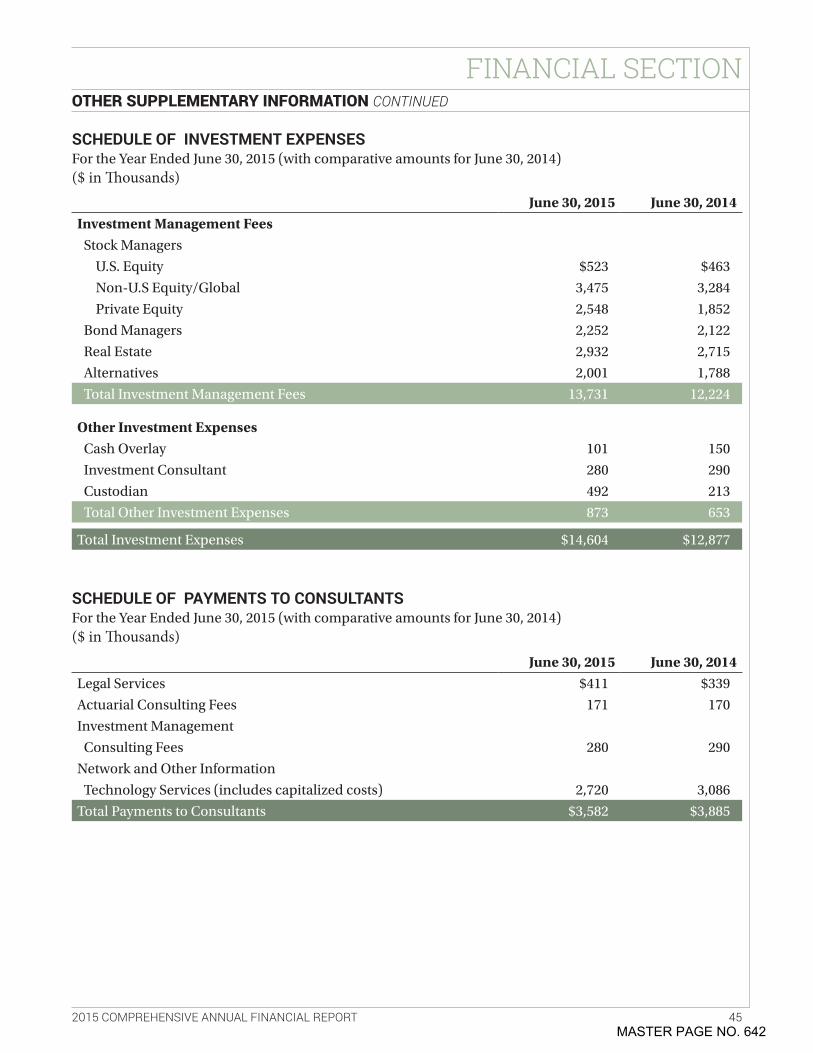
2015 COMPREHENSIVE ANNUAL FINANCIAL REPORT 45
FINANCIAL SECTIONOTHER SUPPLEMENTARY INFORMATION CONTINUED
SCHEDULE OF INVESTMENT EXPENSESFor the Year Ended June 30, 2015 (with comparative amounts for June 30, 2014)($ in Thousands)
SCHEDULE OF PAYMENTS TO CONSULTANTSFor the Year Ended June 30, 2015 (with comparative amounts for June 30, 2014)($ in Thousands)
June 30, 2015 June 30, 2014Investment Management Fees
Stock Managers
U .S . Equity $523 $463
Non-U .S Equity/Global 3,475 3,284
Private Equity 2,548 1,852
Bond Managers 2,252 2,122
Real Estate 2,932 2,715
Alternatives 2,001 1,788
Total Investment Management Fees 13,731 12,224
Other Investment ExpensesCash Overlay 101 150
Investment Consultant 280 290
Custodian 492 213
Total Other Investment Expenses 873 653
Total Investment Expenses $14,604 $12,877
June 30, 2015 June 30, 2014Legal Services $411 $339
Actuarial Consulting Fees 171 170
Investment Management
Consulting Fees 280 290
Network and Other Information
Technology Services (includes capitalized costs) 2,720 3,086
Total Payments to Consultants $3,582 $3,885
MASTER PAGE NO. 642
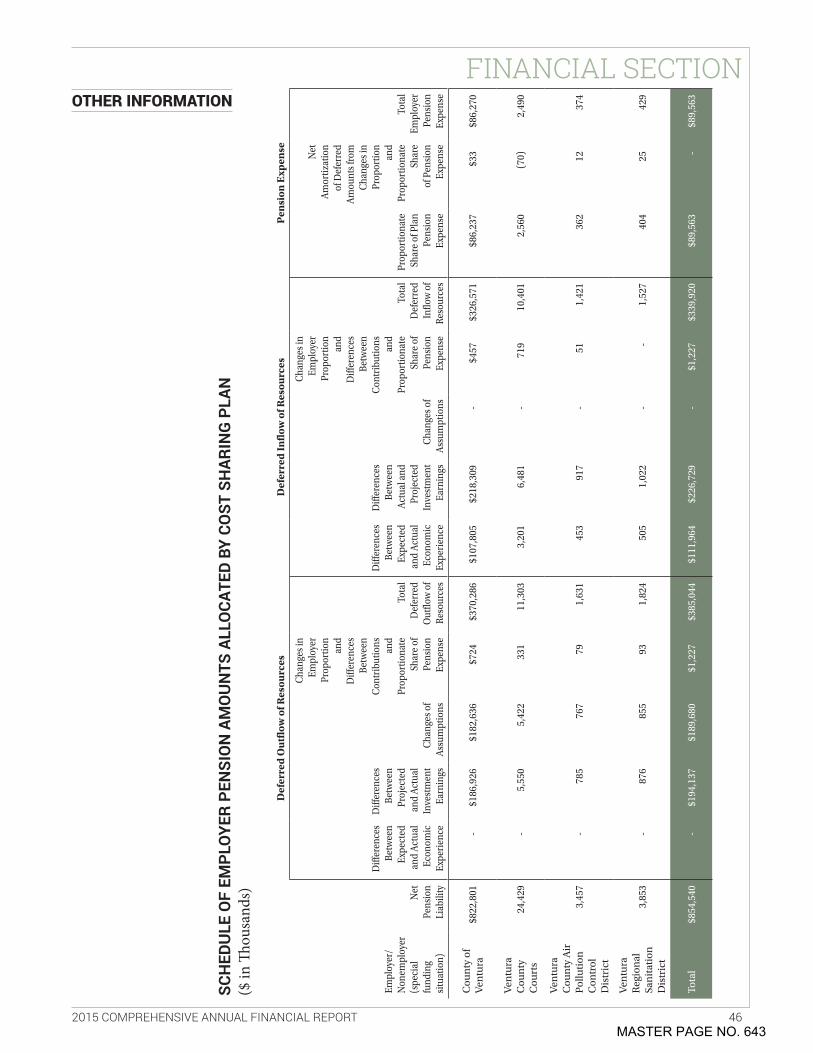
2015 COMPREHENSIVE ANNUAL FINANCIAL REPORT 46
FINANCIAL SECTION
SCH
EDU
LE O
F EM
PLOY
ER P
ENSI
ON
AM
OU
NTS
ALL
OCA
TED
BY C
OST
SH
ARIN
G P
LAN
($ in
Thou
sand
s)
Def
erre
d O
utf
low
of R
esou
rces
Def
erre
d In
flow
of R
esou
rces
Pen
sion
Exp
ense
Empl
oyer
/ N
onem
ploy
er
(spe
cial
fu
ndin
g si
tuat
ion)
Net
Pe
nsio
n Li
abili
ty
Diff
eren
ces
Betw
een
Expe
cted
an
d A
ctua
l Ec
onom
ic
Expe
rien
ce
Diff
eren
ces
Betw
een
Proj
ecte
d an
d A
ctua
l In
vest
men
t Ea
rnin
gsC
hang
es o
f A
ssum
ptio
ns
Cha
nges
in
Empl
oyer
Pr
opor
tion
and
Diff
eren
ces
Betw
een
Con
trib
utio
ns
and
Prop
ortio
nate
Sh
are
of
Pens
ion
Expe
nse
Tota
l D
efer
red
Out
flow
of
Reso
urce
s
Diff
eren
ces
Betw
een
Expe
cted
an
d A
ctua
l Ec
onom
ic
Expe
rien
ce
Diff
eren
ces
Betw
een
Act
ual a
nd
Proj
ecte
d In
vest
men
t Ea
rnin
gsC
hang
es o
f A
ssum
ptio
ns
Cha
nges
in
Empl
oyer
Pr
opor
tion
and
Diff
eren
ces
Betw
een
Con
trib
utio
ns
and
Prop
ortio
nate
Sh
are
of
Pens
ion
Expe
nse
Tota
l D
efer
red
Inflo
w o
f Re
sour
ces
Prop
ortio
nate
Sh
are
of P
lan
Pens
ion
Expe
nse
Net
A
mor
tizat
ion
of D
efer
red
Am
ount
s fro
m
Cha
nges
in
Prop
ortio
n an
d Pr
opor
tiona
te
Shar
e of
Pen
sion
Ex
pens
e
Tota
l Em
ploy
er
Pens
ion
Expe
nse
Cou
nty
of
Ven
tura
$82
2,80
1 -
$18
6,92
6 $
182,
636
$72
4 $3
70,2
86
$10
7,80
5 $
218,
309
- $
457
$32
6,57
1 $
86,2
37
$33
$
86,2
70
Ven
tura
C
oun
ty
Cou
rts
24,
429
- 5
,550
5
,422
3
31
11,
303
3,2
01
6,4
81
- 7
19
10,
401
2,5
60
(70)
2,4
90
Ven
tura
C
oun
ty A
ir
Pol
luti
on
Con
trol
D
istr
ict
3,4
57
- 7
85
767
7
9 1
,631
4
53
917
-
51
1,4
21
362
1
2 3
74
Ven
tura
R
egio
nal
Sa
nit
atio
n
Dis
tric
t
3,8
53
- 8
76
855
9
3 1
,824
5
05
1,0
22
- -
1,5
27
404
2
5 4
29
Tota
l$8
54,5
40
- $
194,
137
$18
9,68
0 $
1,22
7 $
385,
044
$11
1,96
4 $
226,
729
- $
1,22
7 $
339,
920
$89
,563
-
$89
,563
OTHER INFORMATION
MASTER PAGE NO. 643
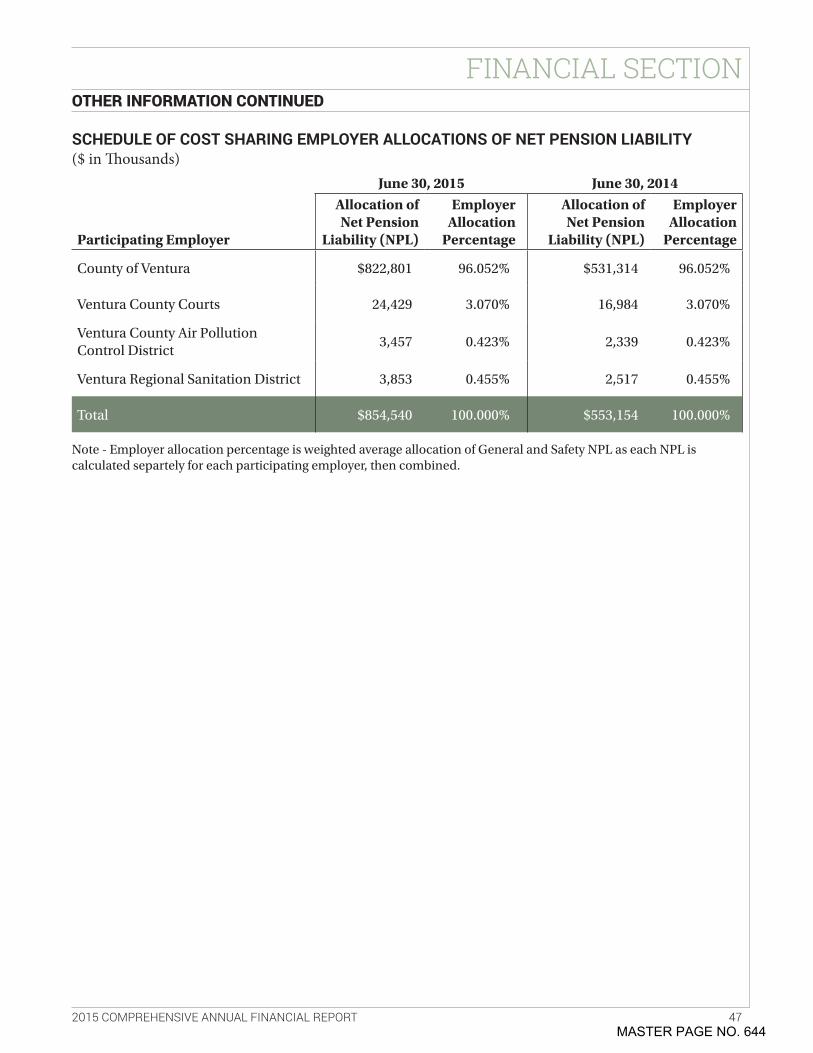
2015 COMPREHENSIVE ANNUAL FINANCIAL REPORT 47
FINANCIAL SECTIONOTHER INFORMATION CONTINUED
SCHEDULE OF COST SHARING EMPLOYER ALLOCATIONS OF NET PENSION LIABILITY($ in Thousands)
June 30, 2015 June 30, 2014
Participating Employer
Allocation of Net Pension
Liability (NPL)
Employer Allocation
Percentage
Allocation of Net Pension
Liability (NPL)
Employer Allocation
Percentage
County of Ventura $822,801 96 .052% $531,314 96 .052%
Ventura County Courts 24,429 3 .070% 16,984 3 .070%
Ventura County Air Pollution Control District
3,457 0 .423% 2,339 0 .423%
Ventura Regional Sanitation District 3,853 0 .455% 2,517 0 .455%
Total $854,540 100 .000% $553,154 100 .000%
Note - Employer allocation percentage is weighted average allocation of General and Safety NPL as each NPL is calculated separtely for each participating employer, then combined .
MASTER PAGE NO. 644

INVESTMENT SECTION
Did we mention beaches? Hundreds of miles of coastline in Ventura County provide an endless array of activities with many destinations ready to accommodate beach enthusiasts of all ages. Here, windsurfers prepare their rigs for a day of exhilarating excitement at Surfers’ Point at Ventura Beach.
PHOTO BY JOE VERNIG
MASTER PAGE NO. 645
2015 COMPREHENSIVE ANNUAL FINANCIAL REPORT 48
INVESTMENT SECTION
1
ALLAN MARTIN PARTNER January 26, 2016 Mr. Dan Gallagher Chief Investment Officer Ventura County Employees' Retirement Association 1190 South Victoria Avenue, Suite 200 Ventura, CA 93003 Dear Mr. Gallagher, The overall objective of the Ventura County Employees’ Retirement Association Plan (“VCERA” or the “Plan”) is to ensure continued access to retirement, disability and survivor benefits for current and future VCERA participants. To ensure a solid foundation for the future of the Plan, VCERA carefully plans and implements an investment program designed to produce superior long-term investment returns, while prudently managing the risk of the portfolio. Investment policy and asset allocation are reviewed and revised by the Board of Retirement, at least annually, to reflect the Plan’s actuarial assumptions, the accrued liabilities, and the investment outlook. The following is a report on the performance of the Plan for the fiscal year ending June 30, 2015. Although investment manager performance is a key component of the future “success” of the Plan, the overall asset allocation policy will be the primary determinant of such “success”. Modern Portfolio Theory maintains that long-term investors, who assume prudent levels of risk, will be rewarded with incremental returns above lower returning, risk-free assets (i.e. T-Bills). The Plan, in its asset allocation policy, is required to satisfy the need to pay accumulated/earned retirement benefits today while preparing for “uncertain” future benefits. This balancing of short-term versus long-term needs is a key consideration in the overall portfolio construction process. To facilitate the balance of short-term versus long-term objectives, the Board of Retirement has adopted a diversified asset allocation structure that includes traditional asset classes such as U.S. and non-U.S. equities and fixed income, as well as alternative asset classes such as private equity, absolute return strategies or hedge funds, real estate, real assets, and opportunistic investment strategies across global credit markets. Fiscal Year 2015 Market Review The multi-year valuation expansion in growth assets continued throughout fiscal year 2015. Markets were resilient to domestic and global political tensions, geopolitical conflicts in Eastern Europe and the Middle East, oil’s precipitous price drop, unsustainable debt loads in Greece and the threat of a slowing Chinese economy. Central banks continued their influence in markets, with the Federal Reserve navigating an end to unprecedented monetary stimulus in the U.S., the European Central Bank beginning expansionary monetary policy of a €1 trillion bond-purchase program, the People’s Bank of China cutting interest rates by 0.25% and the Swiss National Bank removing its Euro peg. Domestic equities, as measured by the S&P 500 Index, posted its sixth consecutive yearly gain, returning 7.4%. Fixed income investments experienced divergent performance across debt instrument types as risk averse investors bid up higher credit quality issues, resulting in high yield bonds (-0.4%) underperforming investment grade bonds (+1.9%). International
MASTER PAGE NO. 646
2015 COMPREHENSIVE ANNUAL FINANCIAL REPORT 49
INVESTMENT SECTION developed markets equities underperformed domestic equities by nearly 13% as the relative strength of the U.S. Dollar and sluggish economic growth weighed on the non-U.S. markets. Emerging markets equities also trailed domestic stocks by 13%, and underperformed developed non-U.S. equities markets by approximately 1%. In preparing our performance analysis for the Plan, we rely on the accuracy of financial data provided by the Plan’s custodian bank and investment managers. The information that follows is presented using market values provided from these external sources, which VCERA considers to be fair value. Investment performance analysis and comparisons produced by NEPC have been calculated using standard performance evaluation methodologies and are consistent with industry standards. Performance results are calculated using a time-weighted return methodology. The Plan’s goal of achieving market rates of returns, while mitigating unwarranted risk, is measured against appropriate benchmarks and comparative universes on a quarterly basis. Performance is measured on a most recent quarter, year-to-date, and accumulated trailing annual periods, as well as three- and five-year periods (full market cycle). Risk-adjusted performance on an absolute basis and a comparative basis is also measured. This review process allows the Plan to evaluate and determine whether established goals and objectives are being achieved. The Plan returned 1.7%, net of fees (2.0% gross of fees), for the fiscal year ending June 30, 2015. By comparison, the median fund in the universe returned 2.6% for the period1. Contributing positively to performance during the fiscal year was the Plan’s allocation to Non-US Equity, Global Fixed Income, and Private Equity relative to their respective performance. The largest detractor to the Plan’s performance over the past year has been the allocation to Liquid Alternatives, which returned -5.2% gross of fees, over the past year. For the five-year period ending June 30, 2015, the Plan returned 11.6% net of fees per annum, outperforming the Plan’s actuarial target of 7.75%.
1 As of June 30, 2015, the InvestorForce Public Funds Greater than $1 Billion Universe was comprised of 52 total funds with approximately $500 billion in assets. Universe rankings are based on gross of fee performance. The Plan’s net of fee performance was -1.0% and 7.7% for the one- and five-year annualized periods ending June 30, 2015, respectively.
MASTER PAGE NO. 647
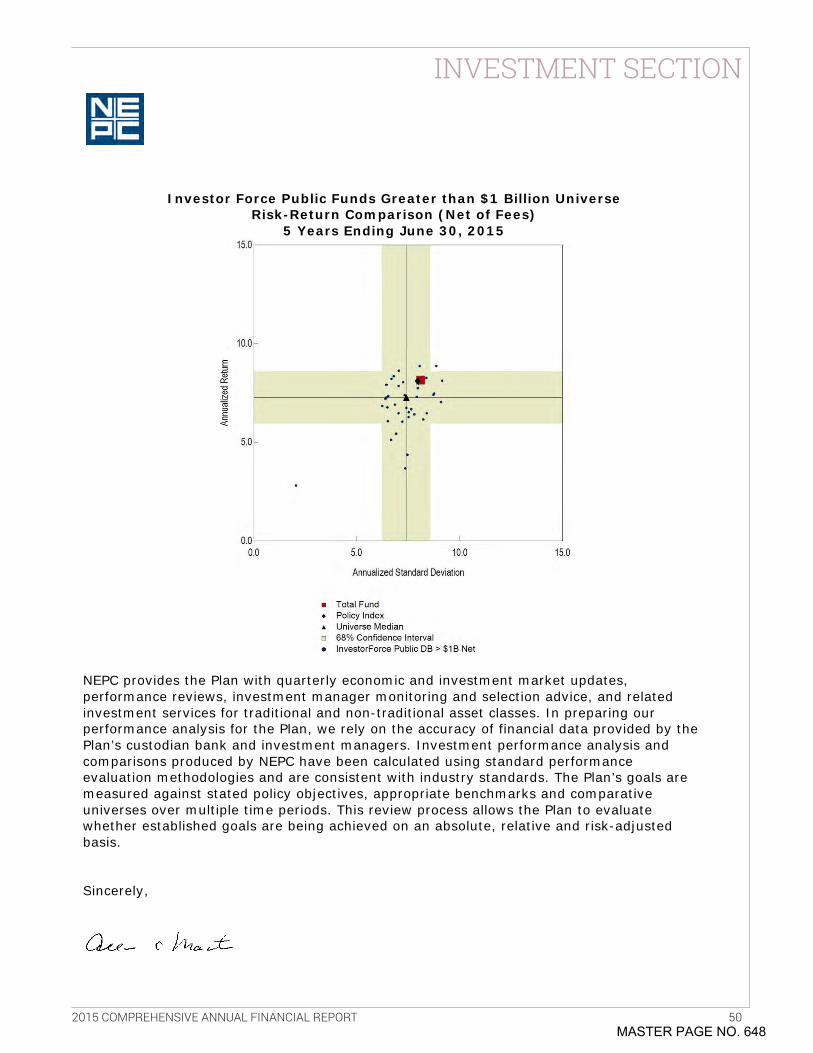
2015 COMPREHENSIVE ANNUAL FINANCIAL REPORT 50
INVESTMENT SECTION
Investor Force Public Funds Greater than $1 Billion Universe Risk-Return Comparison (Net of Fees)
5 Years Ending June 30, 2015
NEPC provides the Plan with quarterly economic and investment market updates, performance reviews, investment manager monitoring and selection advice, and related investment services for traditional and non-traditional asset classes. In preparing our performance analysis for the Plan, we rely on the accuracy of financial data provided by the Plan’s custodian bank and investment managers. Investment performance analysis and comparisons produced by NEPC have been calculated using standard performance evaluation methodologies and are consistent with industry standards. The Plan’s goals are measured against stated policy objectives, appropriate benchmarks and comparative universes over multiple time periods. This review process allows the Plan to evaluate whether established goals are being achieved on an absolute, relative and risk-adjusted basis. Sincerely,
MASTER PAGE NO. 648
2015 COMPREHENSIVE ANNUAL FINANCIAL REPORT 51
INVESTMENT SECTIONOUTLINE OF INVESTMENT POLICIES
GeneralThe Board of Retirement (Board) established an investment policy in accordance with the provisions of the County Employees’ Retirement Law of 1937 (Government Code Sections 31450 et . seq .) . Ventura County Employee’s Retirement Association (VCERA) is considered a separate entity and is administered by a Board consisting of nine members, plus two alternates . VCERA’s Board and its officers and employees shall discharge their duties as provided for in Government Code Section 31595:
• Solely in the interest of, and for the exclusive purpose of, providing benefits to participants and their beneficiaries, minimizing employer contributions thereto, and defraying reasonable expenses of administering the system .
• With the care, skill, prudence, and diligence under the circumstances then prevailing that a prudent person acting in a like capacity and familiar with these matters would use in the conduct of an enterprise of a like character with like aims .
• Shall diversify the investments of the system so as to minimize the risk of loss and to maximize the rate of return, unless under the circumstances it is clearly not prudent to do so .
VCERA’s assets are managed on a total return basis . While VCERA recognizes the importance of the preservation of capital, it also adheres to the principle that varying degrees of investment risk are generally rewarded with compensating returns .
External professional investment firms manage VCERA’s assets . VCERA’s staff, along with the investment consultants, monitors managers’ activity and assists the Board with the implementation of investment policies and strategies .
Asset Allocation PolicyVCERA has a long-term investment horizon, and utilizes an asset allocation, which encompasses a strategic long-term perspective of capital markets . It is recognized that a strategic long-run asset allocation plan implemented in a consistent and disciplined manner will be the major determinant of VCERA’s investment performance .
Effective March 2015, the Board adopted a new allocation plan, but deferred its implementation subject to further analysis, that was predicated on a number of factors including:
a . The actuarially projected liabilities, benefit payments, and the cost to both covered employees and employers .
b . Historical and long-term capital market risk and return behavior .
c . The perception of future economic conditions, including inflation and interest rate levels .
d . The relationship between current and projected assets of the Plan and its actuarial requirements .
A systematic rebalancing procedure is used to maintain asset allocations within their appropriate ranges .
MASTER PAGE NO. 649

2015 COMPREHENSIVE ANNUAL FINANCIAL REPORT 52
INVESTMENT SECTIONTARGET VERSUS ACTUAL ASSET ALLOCATION As of June 30, 2015
ACTUAL1
TARGET2
1The actual Allocation is based upon Investment Summary on pages 53 and 542Represents Allocation targets in place as of June 30, 2015
U .S . Equity 30 .6%
Non-U .S . Equity 14 .2%
Global Equity 10 .2%Private Equity 3 .2%
U .S . Fixed Income 17 .3%
Global Fixed Income 5 .9%
Real Estate 7 .7%
Liquid Alternatives 9 .6%Short Term/Cash 1 .3%
U .S . Equity 30 .0%
Non-U .S . Equity 14 .0%
Global Equity 10 .0%Private Equity 5 .0%
U .S . Fixed Income 19 .0%
Global Fixed Income 5 .0%
Real Estate 7 .0%
Liquid Alternatives 10 .0% Short Term/Cash 0 .0%
MASTER PAGE NO. 650
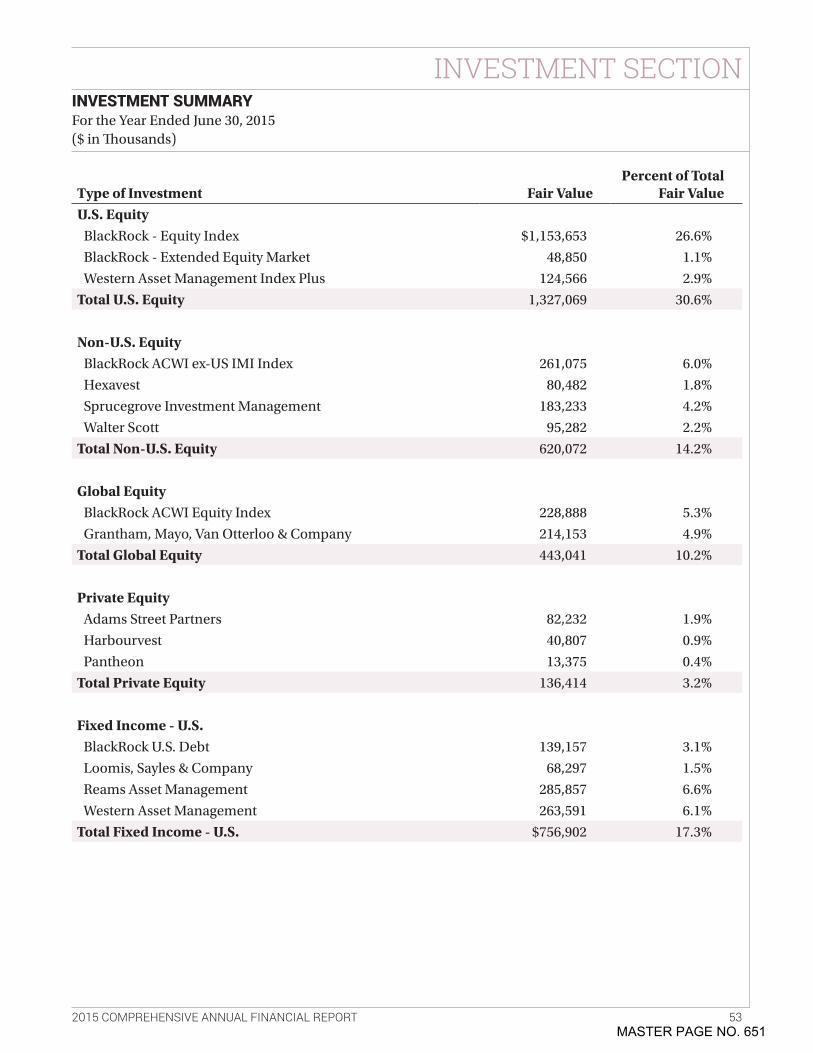
2015 COMPREHENSIVE ANNUAL FINANCIAL REPORT 53
INVESTMENT SECTIONINVESTMENT SUMMARY For the Year Ended June 30, 2015 ($ in Thousands)
Type of Investment Fair ValuePercent of Total
Fair ValueU.S. Equity
BlackRock - Equity Index $1,153,653 26 .6%
BlackRock - Extended Equity Market 48,850 1 .1%
Western Asset Management Index Plus 124,566 2 .9%
Total U.S. Equity 1,327,069 30 .6%
Non-U.S. EquityBlackRock ACWI ex-US IMI Index 261,075 6 .0%
Hexavest 80,482 1 .8%
Sprucegrove Investment Management 183,233 4 .2%
Walter Scott 95,282 2 .2%
Total Non-U.S. Equity 620,072 14 .2%
Global EquityBlackRock ACWI Equity Index 228,888 5 .3%
Grantham, Mayo, Van Otterloo & Company 214,153 4 .9%
Total Global Equity 443,041 10 .2%
Private EquityAdams Street Partners 82,232 1 .9%
Harbourvest 40,807 0 .9%
Pantheon 13,375 0 .4%
Total Private Equity 136,414 3 .2%
Fixed Income - U.S.BlackRock U .S . Debt 139,157 3 .1%
Loomis, Sayles & Company 68,297 1 .5%
Reams Asset Management 285,857 6 .6%
Western Asset Management 263,591 6 .1%
Total Fixed Income - U.S. $756,902 17 .3%
MASTER PAGE NO. 651
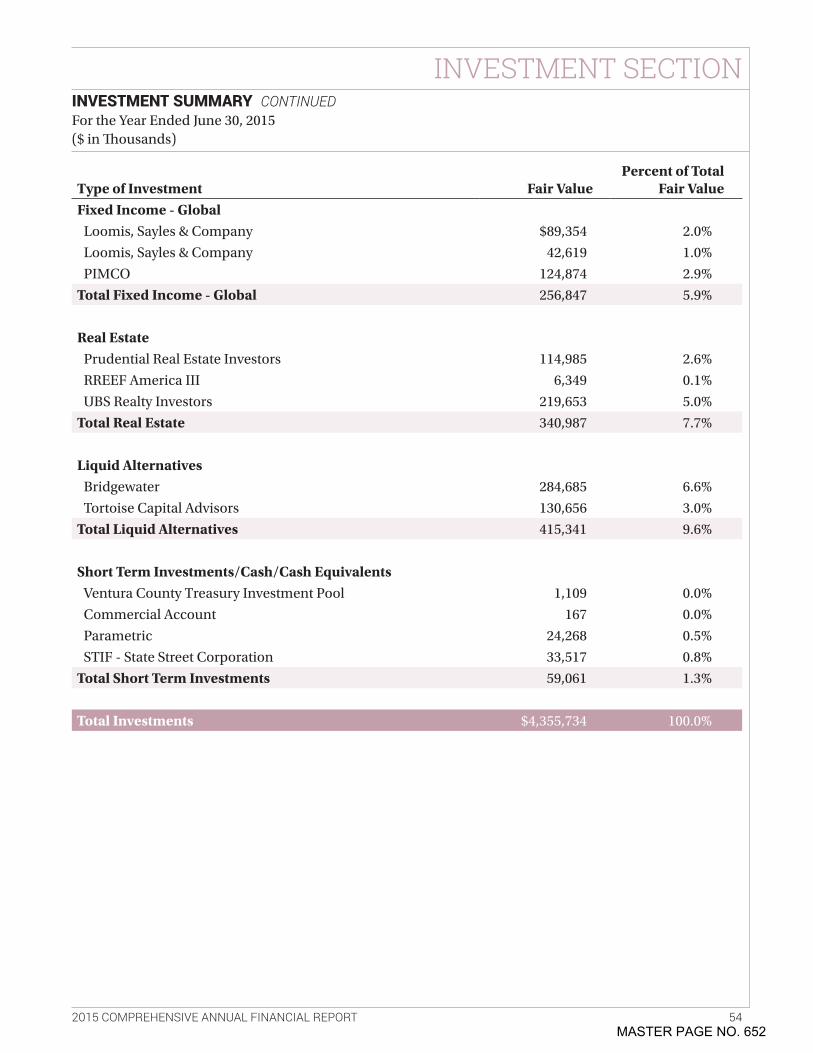
2015 COMPREHENSIVE ANNUAL FINANCIAL REPORT 54
INVESTMENT SECTIONINVESTMENT SUMMARY CONTINUED For the Year Ended June 30, 2015 ($ in Thousands)
Type of Investment Fair ValuePercent of Total
Fair ValueFixed Income - Global
Loomis, Sayles & Company $89,354 2 .0%
Loomis, Sayles & Company 42,619 1 .0%
PIMCO 124,874 2 .9%
Total Fixed Income - Global 256,847 5 .9%
Real EstatePrudential Real Estate Investors 114,985 2 .6%
RREEF America III 6,349 0 .1%
UBS Realty Investors 219,653 5 .0%
Total Real Estate 340,987 7 .7%
Liquid AlternativesBridgewater 284,685 6 .6%
Tortoise Capital Advisors 130,656 3 .0%
Total Liquid Alternatives 415,341 9 .6%
Short Term Investments/Cash/Cash EquivalentsVentura County Treasury Investment Pool 1,109 0 .0%
Commercial Account 167 0 .0%
Parametric 24,268 0 .5%
STIF - State Street Corporation 33,517 0 .8%
Total Short Term Investments 59,061 1 .3%
Total Investments $4,355,734 100 .0%
MASTER PAGE NO. 652
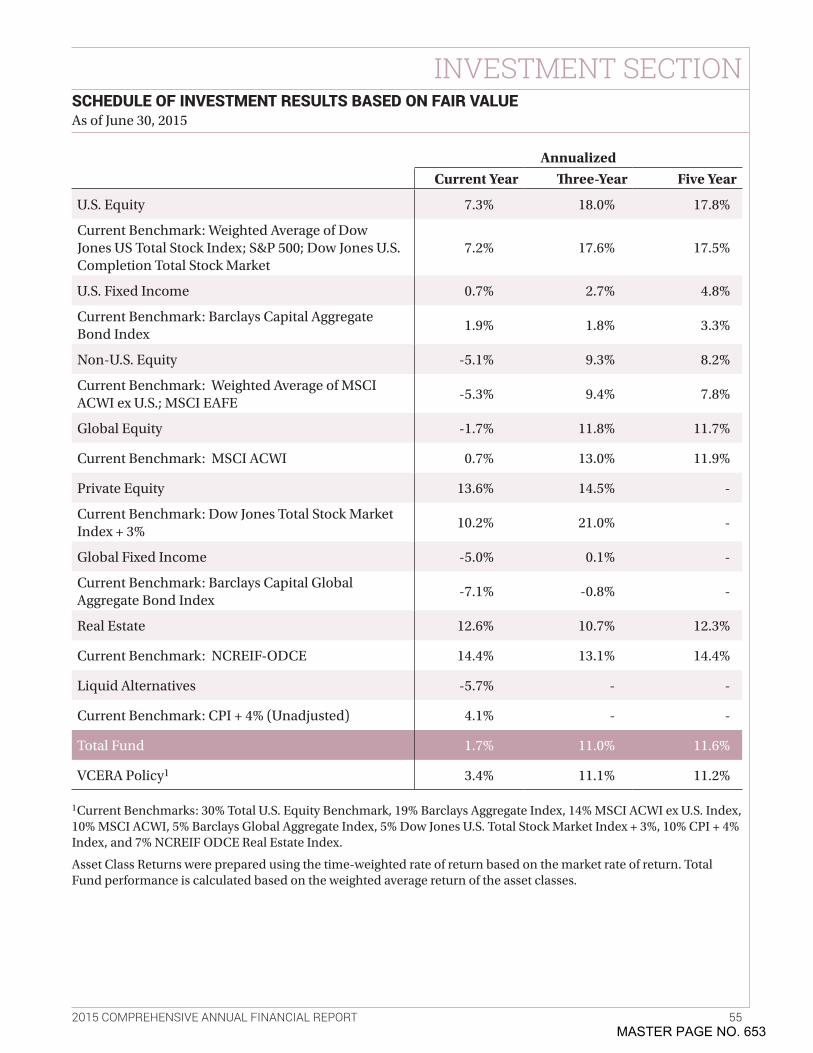
2015 COMPREHENSIVE ANNUAL FINANCIAL REPORT 55
INVESTMENT SECTIONSCHEDULE OF INVESTMENT RESULTS BASED ON FAIR VALUE As of June 30, 2015
AnnualizedCurrent Year Three-Year Five Year
U .S . Equity 7 .3% 18 .0% 17 .8%
Current Benchmark: Weighted Average of Dow Jones US Total Stock Index; S&P 500; Dow Jones U .S . Completion Total Stock Market
7 .2% 17 .6% 17 .5%
U .S . Fixed Income 0 .7% 2 .7% 4 .8%
Current Benchmark: Barclays Capital Aggregate Bond Index
1 .9% 1 .8% 3 .3%
Non-U .S . Equity -5 .1% 9 .3% 8 .2%
Current Benchmark: Weighted Average of MSCI ACWI ex U .S .; MSCI EAFE
-5 .3% 9 .4% 7 .8%
Global Equity -1 .7% 11 .8% 11 .7%
Current Benchmark: MSCI ACWI 0 .7% 13 .0% 11 .9%
Private Equity 13 .6% 14 .5% -
Current Benchmark: Dow Jones Total Stock Market Index + 3%
10 .2% 21 .0% -
Global Fixed Income -5 .0% 0 .1% -
Current Benchmark: Barclays Capital Global Aggregate Bond Index
-7 .1% -0 .8% -
Real Estate 12 .6% 10 .7% 12 .3%
Current Benchmark: NCREIF-ODCE 14 .4% 13 .1% 14 .4%
Liquid Alternatives -5 .7% - -
Current Benchmark: CPI + 4% (Unadjusted) 4 .1% - -
Total Fund 1 .7% 11 .0% 11 .6%
VCERA Policy1 3 .4% 11 .1% 11 .2%
1Current Benchmarks: 30% Total U .S . Equity Benchmark, 19% Barclays Aggregate Index, 14% MSCI ACWI ex U .S . Index, 10% MSCI ACWI, 5% Barclays Global Aggregate Index, 5% Dow Jones U .S . Total Stock Market Index + 3%, 10% CPI + 4% Index, and 7% NCREIF ODCE Real Estate Index .
Asset Class Returns were prepared using the time-weighted rate of return based on the market rate of return . Total Fund performance is calculated based on the weighted average return of the asset classes .
MASTER PAGE NO. 653
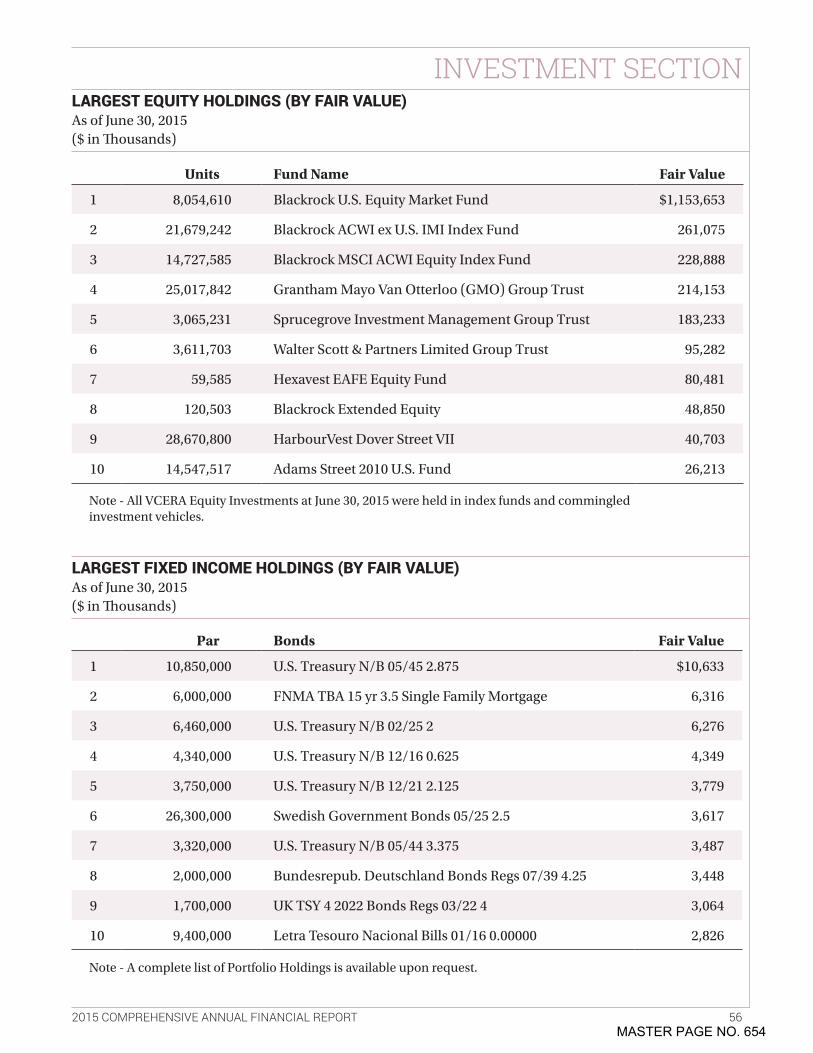
2015 COMPREHENSIVE ANNUAL FINANCIAL REPORT 56
INVESTMENT SECTIONLARGEST EQUITY HOLDINGS (BY FAIR VALUE) As of June 30, 2015 ($ in Thousands)
LARGEST FIXED INCOME HOLDINGS (BY FAIR VALUE) As of June 30, 2015 ($ in Thousands)
Units Fund Name Fair Value
1 8,054,610 Blackrock U .S . Equity Market Fund $1,153,653
2 21,679,242 Blackrock ACWI ex U .S . IMI Index Fund 261,075
3 14,727,585 Blackrock MSCI ACWI Equity Index Fund 228,888
4 25,017,842 Grantham Mayo Van Otterloo (GMO) Group Trust 214,153
5 3,065,231 Sprucegrove Investment Management Group Trust 183,233
6 3,611,703 Walter Scott & Partners Limited Group Trust 95,282
7 59,585 Hexavest EAFE Equity Fund 80,481
8 120,503 Blackrock Extended Equity 48,850
9 28,670,800 HarbourVest Dover Street VII 40,703
10 14,547,517 Adams Street 2010 U .S . Fund 26,213
Par Bonds Fair Value
1 10,850,000 U .S . Treasury N/B 05/45 2 .875 $10,633
2 6,000,000 FNMA TBA 15 yr 3 .5 Single Family Mortgage 6,316
3 6,460,000 U .S . Treasury N/B 02/25 2 6,276
4 4,340,000 U .S . Treasury N/B 12/16 0 .625 4,349
5 3,750,000 U .S . Treasury N/B 12/21 2 .125 3,779
6 26,300,000 Swedish Government Bonds 05/25 2 .5 3,617
7 3,320,000 U .S . Treasury N/B 05/44 3 .375 3,487
8 2,000,000 Bundesrepub . Deutschland Bonds Regs 07/39 4 .25 3,448
9 1,700,000 UK TSY 4 2022 Bonds Regs 03/22 4 3,064
10 9,400,000 Letra Tesouro Nacional Bills 01/16 0 .00000 2,826
Note - All VCERA Equity Investments at June 30, 2015 were held in index funds and commingled investment vehicles .
Note - A complete list of Portfolio Holdings is available upon request .
MASTER PAGE NO. 654
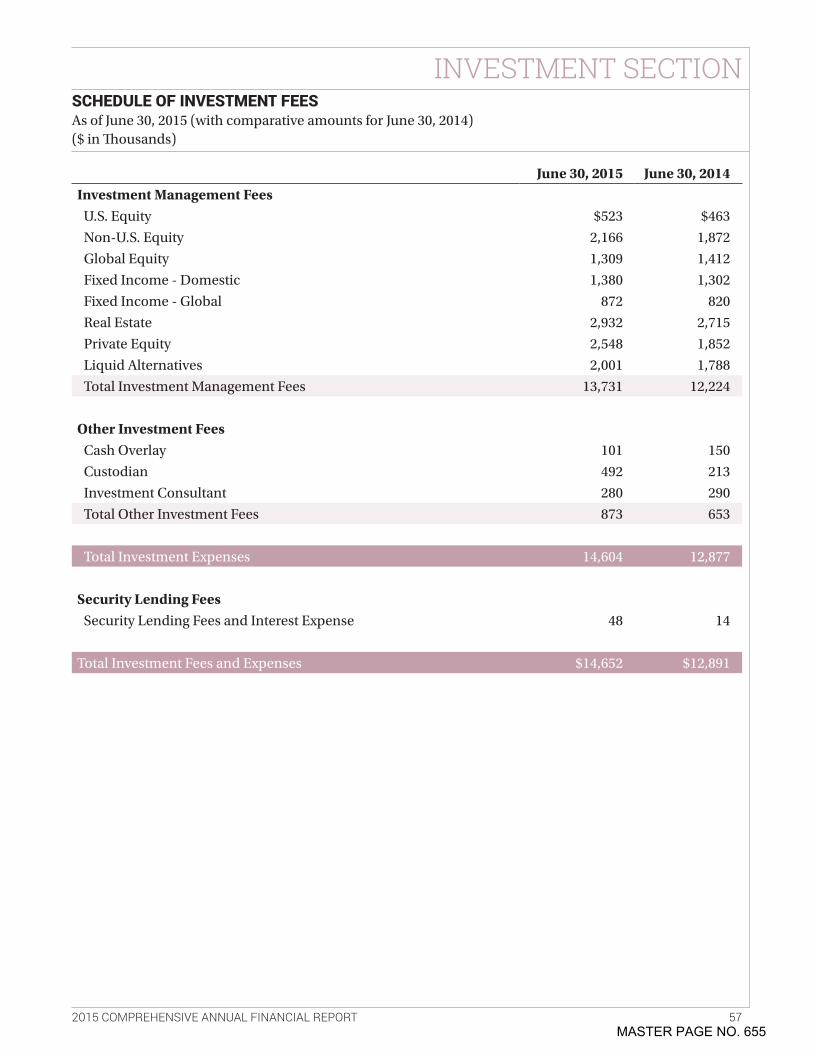
2015 COMPREHENSIVE ANNUAL FINANCIAL REPORT 57
INVESTMENT SECTIONSCHEDULE OF INVESTMENT FEES As of June 30, 2015 (with comparative amounts for June 30, 2014) ($ in Thousands)
June 30, 2015 June 30, 2014Investment Management Fees
U .S . Equity $523 $463
Non-U .S . Equity 2,166 1,872
Global Equity 1,309 1,412
Fixed Income - Domestic 1,380 1,302
Fixed Income - Global 872 820
Real Estate 2,932 2,715
Private Equity 2,548 1,852
Liquid Alternatives 2,001 1,788
Total Investment Management Fees 13,731 12,224
Other Investment FeesCash Overlay 101 150
Custodian 492 213
Investment Consultant 280 290
Total Other Investment Fees 873 653
Total Investment Expenses 14,604 12,877
Security Lending FeesSecurity Lending Fees and Interest Expense 48 14
Total Investment Fees and Expenses $14,652 $12,891
MASTER PAGE NO. 655

2015 COMPREHENSIVE ANNUAL FINANCIAL REPORT 58
INVESTMENT SECTIONINVESTMENT MANAGERS
Equities - U.S.BlackRockWestern Asset Management
Equities - Non-U.S.Sprucegrove Investment ManagementBlackRockHexavest, Inc .Walter Scott
Global EquityGrantham, Mayo, Van Otterloo & Co .BlackRock
Private EquityAdams Street PartnersHarbourVestPantheon
Fixed IncomeBlackRockLoomis, Sayles & CompanyReams Asset ManagementWestern Asset Management
Global Fixed IncomeLoomis, Sayles & CompanyPIMCO
Real EstatePrudential Real Estate InvestorsUBS Realty InvestorsRREEF America III
AlternativesBridgewaterTortoise Capital Investors
Investment ConsultantNEPC, LLC
Cash OverlayParametric
MASTER PAGE NO. 656
ACTUARIAL SECTION
“Thar she blows!” Whale watching in Ventura County has attracted visitors from around the world. For our local residents, the opportunity to see some of the most magnificent creatures on the planet is right in their own backyard.
PHOTO BY JOE VERNIG
MASTER PAGE NO. 657
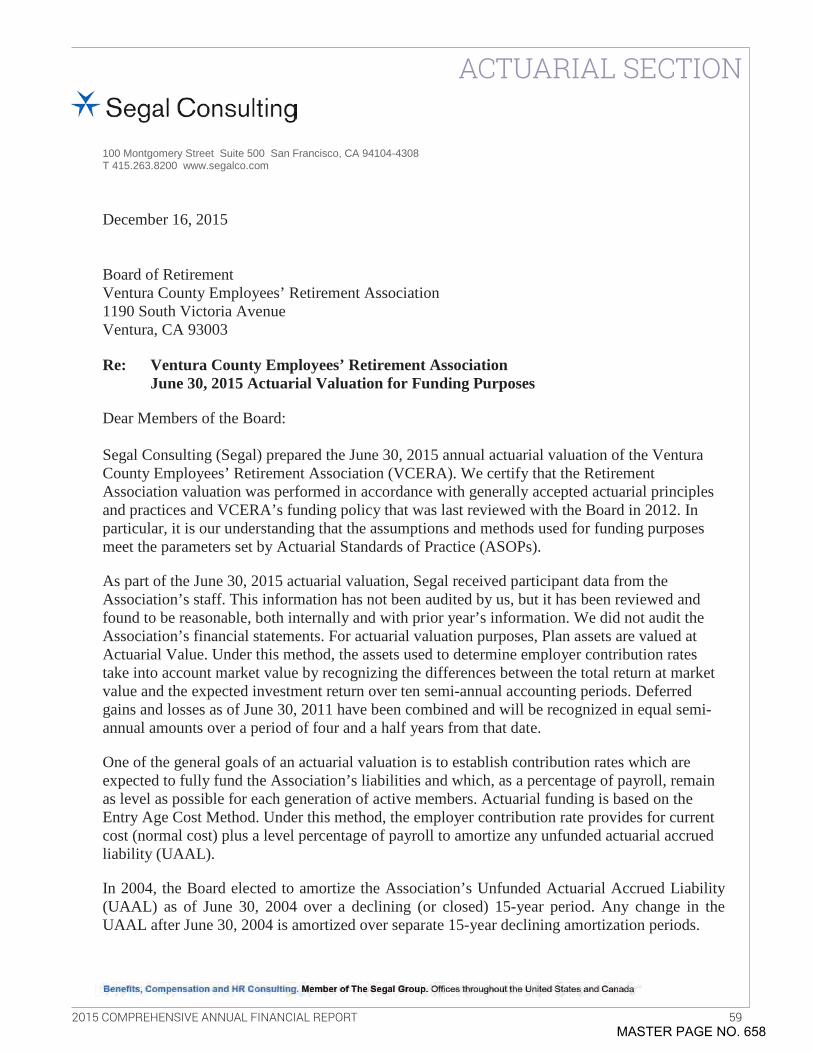
ACTUARIAL SECTION
2015 COMPREHENSIVE ANNUAL FINANCIAL REPORT 59
100 Montgomery Street Suite 500 San Francisco, CA 94104-4308 T 415.263.8200 www.segalco.com
Benefits, Compensation and HR Consulting. Member of The Segal Group. Offices throughout the United States and Canada
December 16, 2015 Board of Retirement Ventura County Employees’ Retirement Association 1190 South Victoria Avenue Ventura, CA 93003 Re: Ventura County Employees’ Retirement Association June 30, 2015 Actuarial Valuation for Funding Purposes Dear Members of the Board: Segal Consulting (Segal) prepared the June 30, 2015 annual actuarial valuation of the Ventura County Employees’ Retirement Association (VCERA). We certify that the Retirement Association valuation was performed in accordance with generally accepted actuarial principles and practices and VCERA’s funding policy that was last reviewed with the Board in 2012. In particular, it is our understanding that the assumptions and methods used for funding purposes meet the parameters set by Actuarial Standards of Practice (ASOPs).
As part of the June 30, 2015 actuarial valuation, Segal received participant data from the Association’s staff. This information has not been audited by us, but it has been reviewed and found to be reasonable, both internally and with prior year’s information. We did not audit the Association’s financial statements. For actuarial valuation purposes, Plan assets are valued at Actuarial Value. Under this method, the assets used to determine employer contribution rates take into account market value by recognizing the differences between the total return at market value and the expected investment return over ten semi-annual accounting periods. Deferred gains and losses as of June 30, 2011 have been combined and will be recognized in equal semi-annual amounts over a period of four and a half years from that date.
One of the general goals of an actuarial valuation is to establish contribution rates which are expected to fully fund the Association’s liabilities and which, as a percentage of payroll, remain as level as possible for each generation of active members. Actuarial funding is based on the Entry Age Cost Method. Under this method, the employer contribution rate provides for current cost (normal cost) plus a level percentage of payroll to amortize any unfunded actuarial accrued liability (UAAL).
In 2004, the Board elected to amortize the Association’s Unfunded Actuarial Accrued Liability (UAAL) as of June 30, 2004 over a declining (or closed) 15-year period. Any change in the UAAL after June 30, 2004 is amortized over separate 15-year declining amortization periods.
MASTER PAGE NO. 658
ACTUARIAL SECTION
2015 COMPREHENSIVE ANNUAL FINANCIAL REPORT 60
Board of Retirement Ventura County Employees’ Retirement Association December 16, 2015 Page 2
5406175v1/05325.002
Effective with the June 30, 2012 valuation, any change in the UAAL that arises due to assumption changes is amortized over separate 20-year declining amortization periods. In addition, any change in the UAAL that arises due to retirement incentives is amortized over a separate declining period of up to 5 years. The progress being made towards meeting the funding objective through June 30, 2015 is illustrated in the Actuarial Solvency Test. Certain information found in the Notes to Basic Financial Statements and the Required Supplementary Information (RSI) included in the Financial Section was prepared by the Association based on the results of the Governmental Accounting Standards (GAS) 67 actuarial valuation as of June 30, 2015 prepared by Segal. For the Financial Section of the Comprehensive Annual Financial Report (CAFR), Segal provided the Schedule of Changes in Net Pension Liability and Schedule of Employer Contributions as shown in the RSI. A listing of the other schedules prepared by the Association based on the results of the actuarial valuation as of June 30, 2015 for funding purposes is listed below.
1. Summary of Actuarial Assumptions and Methods as of June 30, 2015
2. Active Member Valuation Data
3. Schedule of Retirees and Beneficiaries Added to and Removed from the Rolls
4. Actuarial Analysis of Financial Experience
5. Actuary Solvency Test
6. Probability of Occurrence
The valuation assumptions included in the Actuarial Section were adopted by the Retirement Board based on our recommendations following the June 30, 2014 Actuarial Experience Study and the June 30, 2015 Review of Economic Actuarial Assumptions. It is our opinion that the assumptions used in the June 30, 2015 valuation produce results which, in the aggregate, anticipate the expected future experience of the Plan. Actuarial valuations are performed on an annual basis. An experience analysis is performed every three years and the next experience analysis is due to be performed as of June 30, 2017. In the June 30, 2015 valuation, the ratio of the valuation value of assets to actuarial accrued liabilities increased from 82.7% to 83.1% and the average employer contribution rate decreased from 28.11% of payroll to 27.77% of payroll. The valuation value of assets included $54 million in deferred investment gains, which represented about 1.2% of the market value of assets. If these deferred investment gains were recognized immediately in the valuation value of assets, the funded percentage would have increased from 83.1% to 84.1% and the aggregate employer contribution rate, expressed as a percent of payroll, would have decreased from 27.77% to about 27.06%.
MASTER PAGE NO. 659
ACTUARIAL SECTION
2015 COMPREHENSIVE ANNUAL FINANCIAL REPORT 61
Board of Retirement Ventura County Employees’ Retirement Association December 16, 2015 Page 3
5406175v1/05325.002
We are members of the American Academy of Actuaries and we meet the Qualification Standards of the American Academy of Actuaries to render the actuarial opinion herein. Sincerely,
Paul Angelo, FSA, MAAA, FCA, EA John Monroe, ASA, MAAA, EA Senior Vice President and Actuary Vice President and Actuary
AW/hy
MASTER PAGE NO. 660
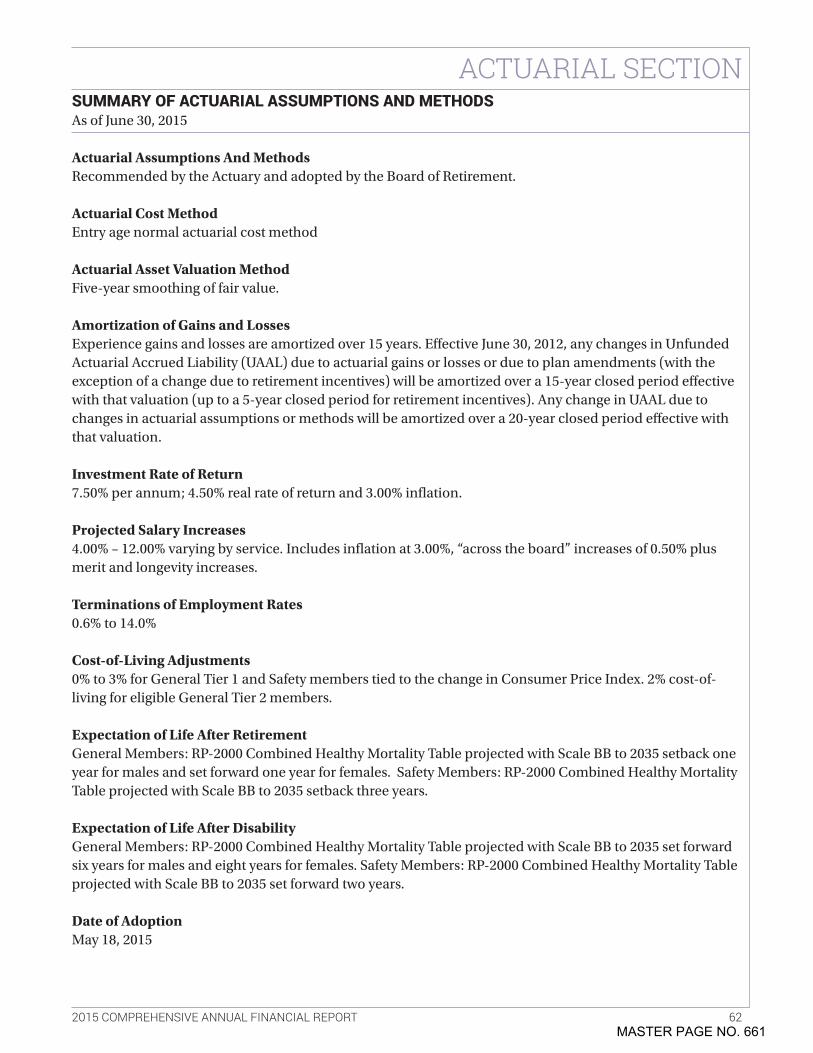
ACTUARIAL SECTION
2015 COMPREHENSIVE ANNUAL FINANCIAL REPORT 62
SUMMARY OF ACTUARIAL ASSUMPTIONS AND METHODS As of June 30, 2015
Actuarial Assumptions And MethodsRecommended by the Actuary and adopted by the Board of Retirement .
Actuarial Cost MethodEntry age normal actuarial cost method
Actuarial Asset Valuation MethodFive-year smoothing of fair value .
Amortization of Gains and LossesExperience gains and losses are amortized over 15 years . Effective June 30, 2012, any changes in Unfunded Actuarial Accrued Liability (UAAL) due to actuarial gains or losses or due to plan amendments (with the exception of a change due to retirement incentives) will be amortized over a 15-year closed period effective with that valuation (up to a 5-year closed period for retirement incentives) . Any change in UAAL due to changes in actuarial assumptions or methods will be amortized over a 20-year closed period effective with that valuation .
Investment Rate of Return7 .50% per annum; 4 .50% real rate of return and 3 .00% inflation .
Projected Salary Increases4 .00% – 12 .00% varying by service . Includes inflation at 3 .00%, “across the board” increases of 0 .50% plus merit and longevity increases .
Terminations of Employment Rates0 .6% to 14 .0%
Cost-of-Living Adjustments0% to 3% for General Tier 1 and Safety members tied to the change in Consumer Price Index . 2% cost-of-living for eligible General Tier 2 members .
Expectation of Life After RetirementGeneral Members: RP-2000 Combined Healthy Mortality Table projected with Scale BB to 2035 setback one year for males and set forward one year for females . Safety Members: RP-2000 Combined Healthy Mortality Table projected with Scale BB to 2035 setback three years .
Expectation of Life After DisabilityGeneral Members: RP-2000 Combined Healthy Mortality Table projected with Scale BB to 2035 set forward six years for males and eight years for females . Safety Members: RP-2000 Combined Healthy Mortality Table projected with Scale BB to 2035 set forward two years .
Date of AdoptionMay 18, 2015
MASTER PAGE NO. 661
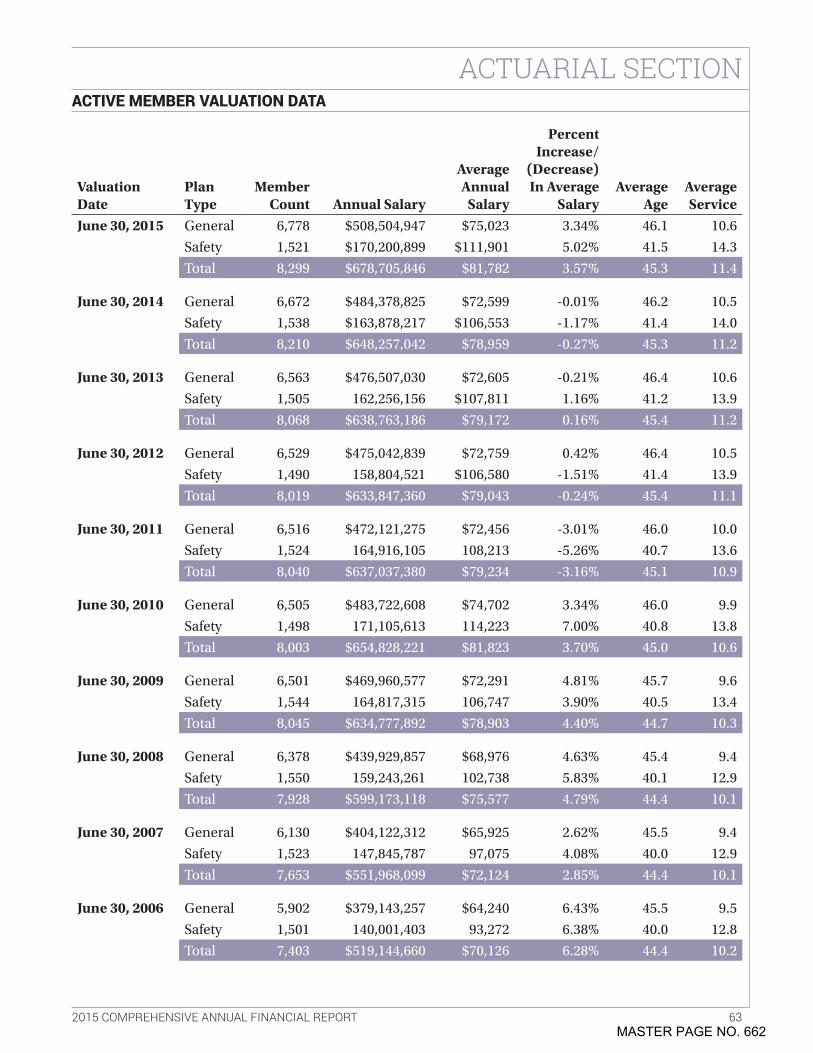
ACTUARIAL SECTION
2015 COMPREHENSIVE ANNUAL FINANCIAL REPORT 63
ACTIVE MEMBER VALUATION DATA
Valuation Date
Plan Type
Member Count Annual Salary
Average Annual
Salary
Percent Increase/
(Decrease) In Average
SalaryAverage
AgeAverage Service
June 30, 2015 General 6,778 $508,504,947 $75,023 3 .34% 46 .1 10 .6
Safety 1,521 $170,200,899 $111,901 5 .02% 41 .5 14 .3
Total 8,299 $678,705,846 $81,782 3 .57% 45 .3 11 .4
June 30, 2014 General 6,672 $484,378,825 $72,599 -0 .01% 46 .2 10 .5
Safety 1,538 $163,878,217 $106,553 -1 .17% 41 .4 14 .0
Total 8,210 $648,257,042 $78,959 -0 .27% 45 .3 11 .2
June 30, 2013 General 6,563 $476,507,030 $72,605 -0 .21% 46 .4 10 .6
Safety 1,505 162,256,156 $107,811 1 .16% 41 .2 13 .9
Total 8,068 $638,763,186 $79,172 0 .16% 45 .4 11 .2
June 30, 2012 General 6,529 $475,042,839 $72,759 0 .42% 46 .4 10 .5
Safety 1,490 158,804,521 $106,580 -1 .51% 41 .4 13 .9
Total 8,019 $633,847,360 $79,043 -0 .24% 45 .4 11 .1
June 30, 2011 General 6,516 $472,121,275 $72,456 -3 .01% 46 .0 10 .0
Safety 1,524 164,916,105 108,213 -5 .26% 40 .7 13 .6
Total 8,040 $637,037,380 $79,234 -3 .16% 45 .1 10 .9
June 30, 2010 General 6,505 $483,722,608 $74,702 3 .34% 46 .0 9 .9
Safety 1,498 171,105,613 114,223 7 .00% 40 .8 13 .8
Total 8,003 $654,828,221 $81,823 3 .70% 45 .0 10 .6
June 30, 2009 General 6,501 $469,960,577 $72,291 4 .81% 45 .7 9 .6
Safety 1,544 164,817,315 106,747 3 .90% 40 .5 13 .4
Total 8,045 $634,777,892 $78,903 4 .40% 44 .7 10 .3
June 30, 2008 General 6,378 $439,929,857 $68,976 4 .63% 45 .4 9 .4
Safety 1,550 159,243,261 102,738 5 .83% 40 .1 12 .9
Total 7,928 $599,173,118 $75,577 4 .79% 44 .4 10 .1
June 30, 2007 General 6,130 $404,122,312 $65,925 2 .62% 45 .5 9 .4
Safety 1,523 147,845,787 97,075 4 .08% 40 .0 12 .9
Total 7,653 $551,968,099 $72,124 2 .85% 44 .4 10 .1
June 30, 2006 General 5,902 $379,143,257 $64,240 6 .43% 45 .5 9 .5
Safety 1,501 140,001,403 93,272 6 .38% 40 .0 12 .8
Total 7,403 $519,144,660 $70,126 6 .28% 44 .4 10 .2
MASTER PAGE NO. 662
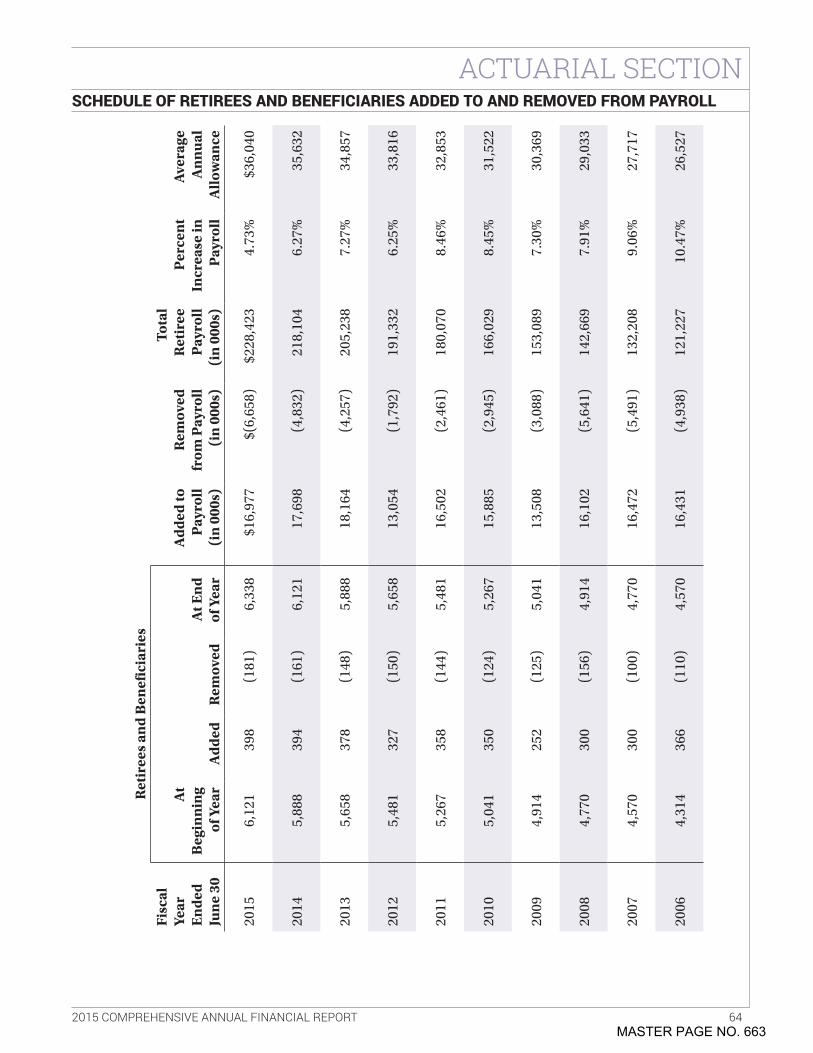
ACTUARIAL SECTION
2015 COMPREHENSIVE ANNUAL FINANCIAL REPORT 64
Ret
iree
s an
d B
enefi
ciar
ies
Fisc
al
Year
E
nde
d Ju
ne
30
At
Beg
inn
ing
of Y
ear
Add
edR
emov
edA
t En
d of
Yea
r
Add
ed to
P
ayro
ll
(in
000
s)
Rem
oved
fr
om P
ayro
ll
(in
000
s)
Tota
l R
etir
ee
Pay
roll
(i
n 0
00s)
Per
cen
t In
crea
se in
P
ayro
ll
Ave
rage
A
nn
ual
A
llow
ance
2015
6,1
21
398
(
181)
6,3
38
$16
,977
$(
6,65
8) $
228,
423
4 .73
% $
36,0
40
2014
5,8
88
394
(
161)
6,1
21
17,
698
(4,
832)
218
,104
6 .
27%
35,
632
2013
5,6
58
378
(
148)
5,8
88
18,
164
(4,
257)
205
,238
7 .
27%
34,
857
2012
5,4
81
327
(
150)
5,6
58
13,
054
(1,
792)
191
,332
6 .
25%
33,
816
2011
5,2
67
358
(
144)
5,4
81
16,
502
(2,
461)
180
,070
8 .
46%
32,
853
2010
5,0
41
350
(
124)
5,2
67
15,
885
(2,
945)
166
,029
8 .
45%
31,
522
2009
4,9
14
252
(
125)
5,0
41
13,
508
(3,
088)
153
,089
7 .
30%
30,
369
2008
4,7
70
300
(
156)
4,9
14
16,
102
(5,
641)
142
,669
7 .
91%
29,
033
2007
4,5
70
300
(
100)
4,7
70
16,
472
(5,
491)
132
,208
9 .
06%
27,
717
2006
4,3
14
366
(
110)
4,5
70
16,
431
(4,
938)
121
,227
10
.47%
26,
527
SCHEDULE OF RETIREES AND BENEFICIARIES ADDED TO AND REMOVED FROM PAYROLL
MASTER PAGE NO. 663
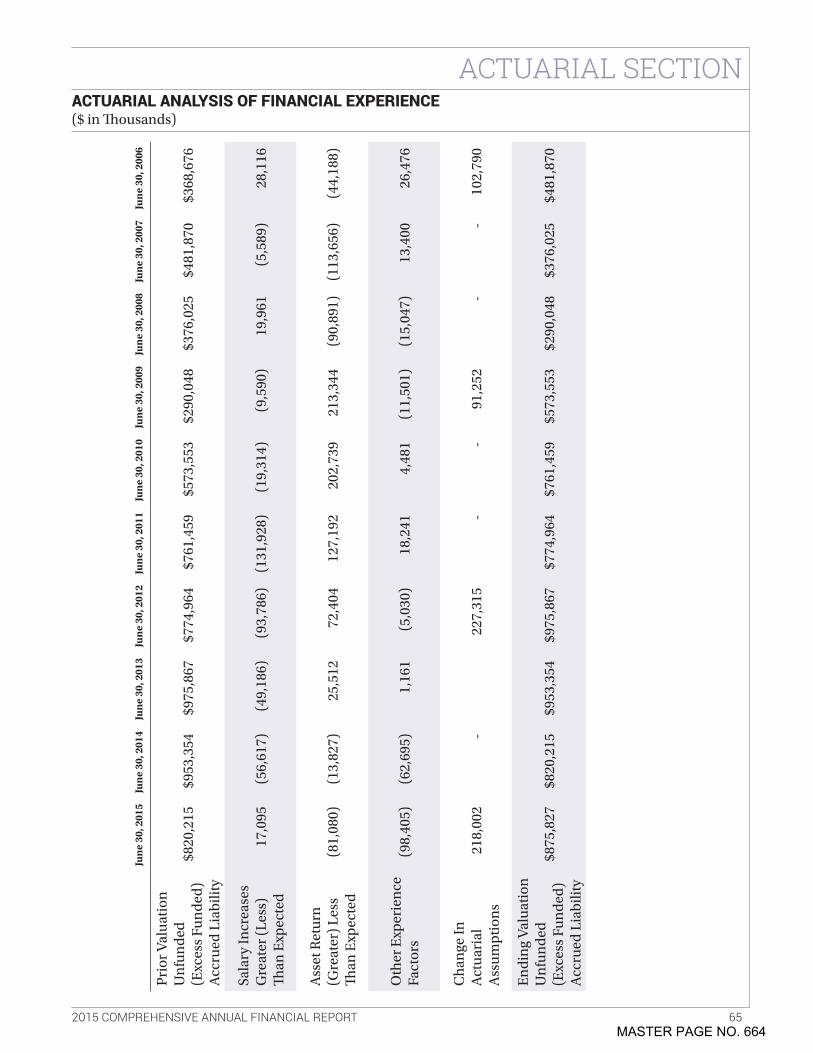
ACTUARIAL SECTION
2015 COMPREHENSIVE ANNUAL FINANCIAL REPORT 65
ACTUARIAL ANALYSIS OF FINANCIAL EXPERIENCE ($ in Thousands)
Jun
e 30
, 201
5Ju
ne
30, 2
014
Jun
e 30
, 201
3Ju
ne
30, 2
012
Jun
e 30
, 201
1Ju
ne
30, 2
010
Jun
e 30
, 200
9Ju
ne
30, 2
008
Jun
e 30
, 200
7Ju
ne
30, 2
006
Pri
or V
alu
atio
n
Un
fun
ded
(E
xces
s Fu
nd
ed)
Acc
rued
Lia
bili
ty
$820
,215
$953
,354
$975
,867
$774
,964
$761
,459
$573
,553
$290
,048
$376
,025
$481
,870
$368
,676
Sala
ry In
crea
ses
Gre
ater
(L
ess)
Th
an E
xpec
ted
17,
095
(56
,617
) (
49,1
86)
(93
,786
)(1
31,9
28)
(19
,314
) (
9,59
0) 1
9,96
1 (
5,58
9) 2
8,11
6
Ass
et R
etu
rn
(Gre
ater
) L
ess
Th
an E
xpec
ted
(81
,080
) (
13,8
27)
25,
512
72,
404
127
,192
2
02,7
39
213
,344
(
90,8
91)
(113
,656
) (
44,1
88)
Oth
er E
xper
ien
ce
Fact
ors
(98
,405
) (
62,6
95)
1,1
61
(5,
030)
18,
241
4,4
81
(11
,501
) (
15,0
47)
13,
400
26,
476
Ch
ange
In
Act
uar
ial
Ass
um
pti
ons
218
,002
-
2
27,3
15
-
-
91,
252
-
-
102
,790
En
din
g V
alu
atio
n
Un
fun
ded
(E
xces
s Fu
nd
ed)
Acc
rued
Lia
bili
ty
$875
,827
$820
,215
$953
,354
$975
,867
$774
,964
$761
,459
$573
,553
$290
,048
$376
,025
$481
,870
MASTER PAGE NO. 664
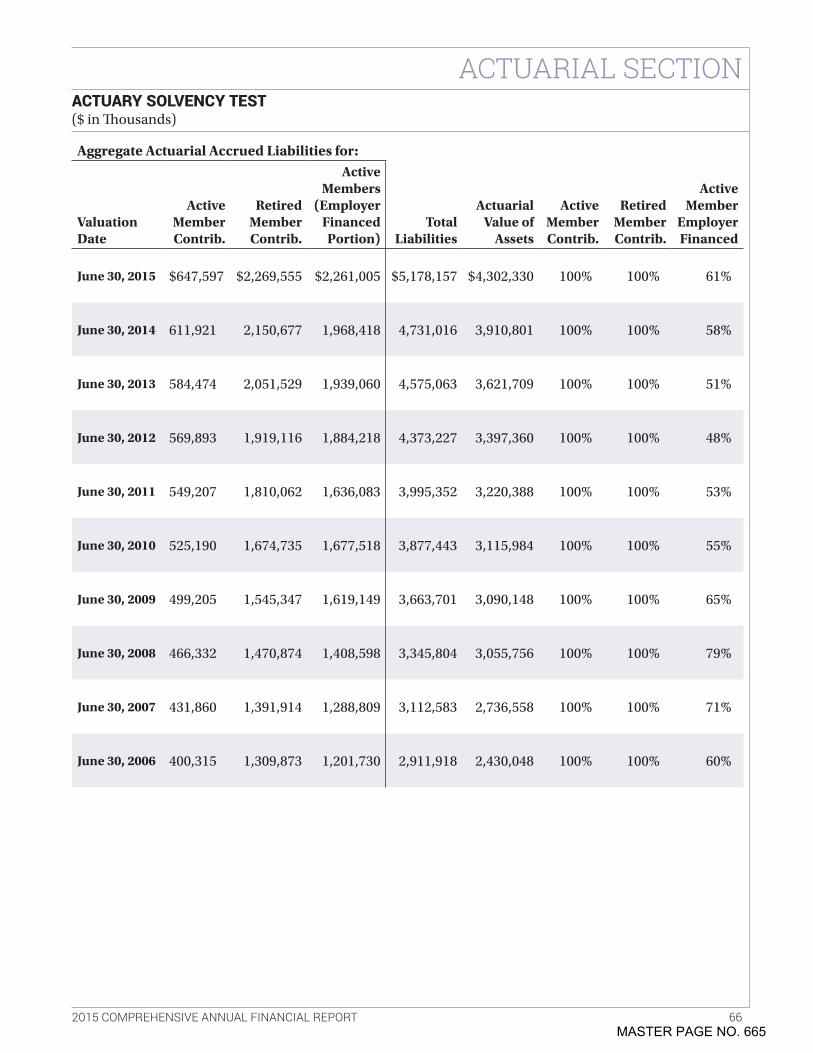
ACTUARIAL SECTION
2015 COMPREHENSIVE ANNUAL FINANCIAL REPORT 66
Aggregate Actuarial Accrued Liabilities for:
Valuation Date
Active Member Contrib.
Retired Member Contrib.
Active Members
(Employer Financed Portion)
Total Liabilities
Actuarial Value of
Assets
Active Member Contrib.
Retired Member Contrib.
Active Member
Employer Financed
June 30, 2015 $647,597 $2,269,555 $2,261,005 $5,178,157 $4,302,330 100% 100% 61%
June 30, 2014 611,921 2,150,677 1,968,418 4,731,016 3,910,801 100% 100% 58%
June 30, 2013 584,474 2,051,529 1,939,060 4,575,063 3,621,709 100% 100% 51%
June 30, 2012 569,893 1,919,116 1,884,218 4,373,227 3,397,360 100% 100% 48%
June 30, 2011 549,207 1,810,062 1,636,083 3,995,352 3,220,388 100% 100% 53%
June 30, 2010 525,190 1,674,735 1,677,518 3,877,443 3,115,984 100% 100% 55%
June 30, 2009 499,205 1,545,347 1,619,149 3,663,701 3,090,148 100% 100% 65%
June 30, 2008 466,332 1,470,874 1,408,598 3,345,804 3,055,756 100% 100% 79%
June 30, 2007 431,860 1,391,914 1,288,809 3,112,583 2,736,558 100% 100% 71%
June 30, 2006 400,315 1,309,873 1,201,730 2,911,918 2,430,048 100% 100% 60%
ACTUARY SOLVENCY TEST ($ in Thousands)
MASTER PAGE NO. 665
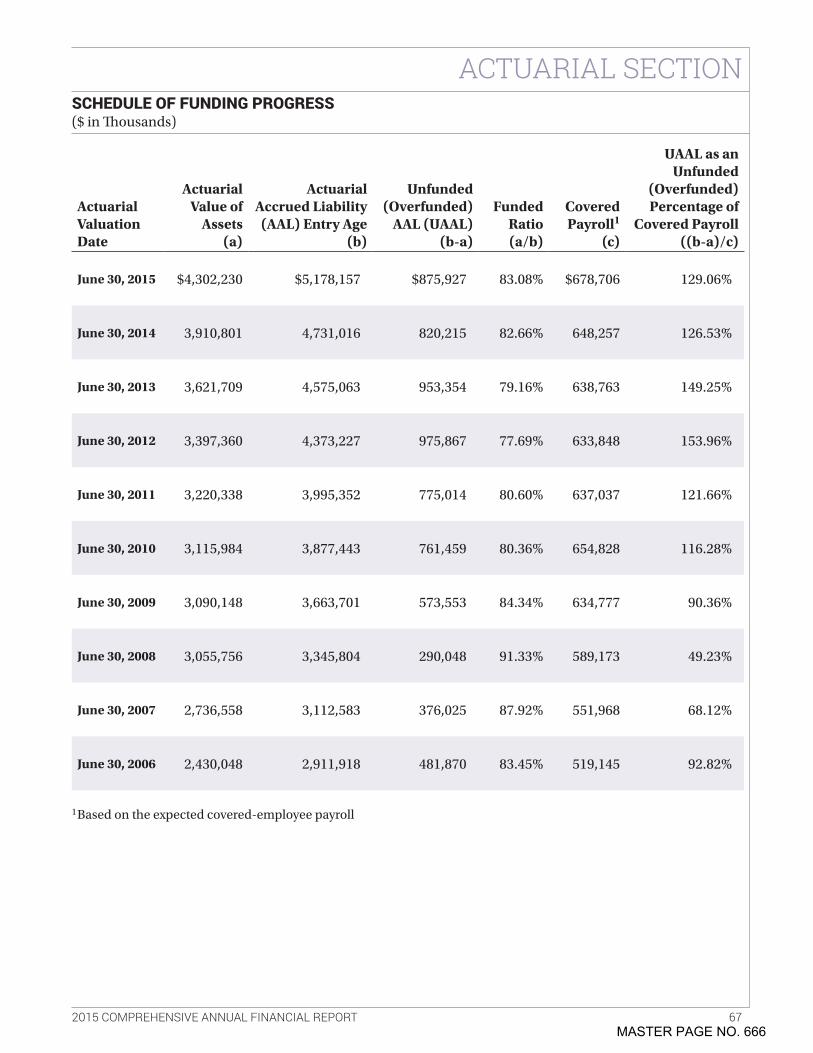
ACTUARIAL SECTION
2015 COMPREHENSIVE ANNUAL FINANCIAL REPORT 67
Actuarial Valuation Date
Actuarial Value of
Assets (a)
Actuarial Accrued Liability (AAL) Entry Age
(b)
Unfunded (Overfunded)
AAL (UAAL) (b-a)
Funded Ratio (a/b)
Covered Payroll1
(c)
UAAL as an Unfunded
(Overfunded) Percentage of
Covered Payroll ((b-a)/c)
June 30, 2015 $4,302,230 $5,178,157 $875,927 83 .08% $678,706 129 .06%
June 30, 2014 3,910,801 4,731,016 820,215 82 .66% 648,257 126 .53%
June 30, 2013 3,621,709 4,575,063 953,354 79 .16% 638,763 149 .25%
June 30, 2012 3,397,360 4,373,227 975,867 77 .69% 633,848 153 .96%
June 30, 2011 3,220,338 3,995,352 775,014 80 .60% 637,037 121 .66%
June 30, 2010 3,115,984 3,877,443 761,459 80 .36% 654,828 116 .28%
June 30, 2009 3,090,148 3,663,701 573,553 84 .34% 634,777 90 .36%
June 30, 2008 3,055,756 3,345,804 290,048 91 .33% 589,173 49 .23%
June 30, 2007 2,736,558 3,112,583 376,025 87 .92% 551,968 68 .12%
June 30, 2006 2,430,048 2,911,918 481,870 83 .45% 519,145 92 .82%
SCHEDULE OF FUNDING PROGRESS ($ in Thousands)
1Based on the expected covered-employee payroll
MASTER PAGE NO. 666
ACTUARIAL SECTION
2015 COMPREHENSIVE ANNUAL FINANCIAL REPORT 68
SUMMARY OF PLAN BENEFITS
Summarized below are some of the more significant provisions of the County Employees’ Retirement Law of 1937 that are presently applicable to the Ventura County Employees’ Retirement Association (VCERA) .
MembershipAll permanent employees of the County of Ventura or contracting district who work a regular schedule of 64 or more hours per bi-weekly pay period become members of VCERA upon appointment . There are separate retirement plans for safety and general member employees . Safety membership is extended to those involved in active law enforcement, fire suppression, and probation . Any new Safety Member who becomes a member on or after January 1, 2013, is designated PEPRA Safety and is subject to the provisions of California’s Public Employees’ Pension Reform Act of 2013 (PEPRA), California Government Code 7522 et seq . and Assembly Bill (AB) 197 . All other employees are classified as general members . Those hired prior to June 30, 1979, and certain management personnel who entered service prior to October 16, 2001, are included in Tier I . Those hired after that date are included in Tier II . New Members employed after January 1, 2013, are designated as PEPRA Tier I or II and are subject to the provisions of California Government Code 7522 et seq . and AB 197 .
VestingA member is fully vested upon accruing five years of retirement service credit under VCERA, or combined service under VCERA and a reciprocal retirement system .
Employer ContributionsThe County of Ventura and contracting districts contribute to the retirement plan based upon actuarially determined contribution rates adopted by the Board of Retirement . Employer contribution rates are adopted annually based upon recommendations received from VCERA’s actuary after the completion of the annual actuarial valuation .
Member ContributionsAll members are required to make contributions to VCERA regardless of the retirement plan or tier in which they are included . The contribution rate applicable to the member is applied to total compensation earnable . The employer, as a result of provisions contained in individual collective bargaining agreements, may pay a portion of the member contribution .
Contributions are deducted from the member’s bi-weekly payroll check and credited to the member’s account . Interest is credited to the member’s account semiannually on June 30 and December 31, based upon the total contributions on deposit . Upon separation from service, a member may elect a refund of all accumulated contributions and interest credited .
MASTER PAGE NO. 667
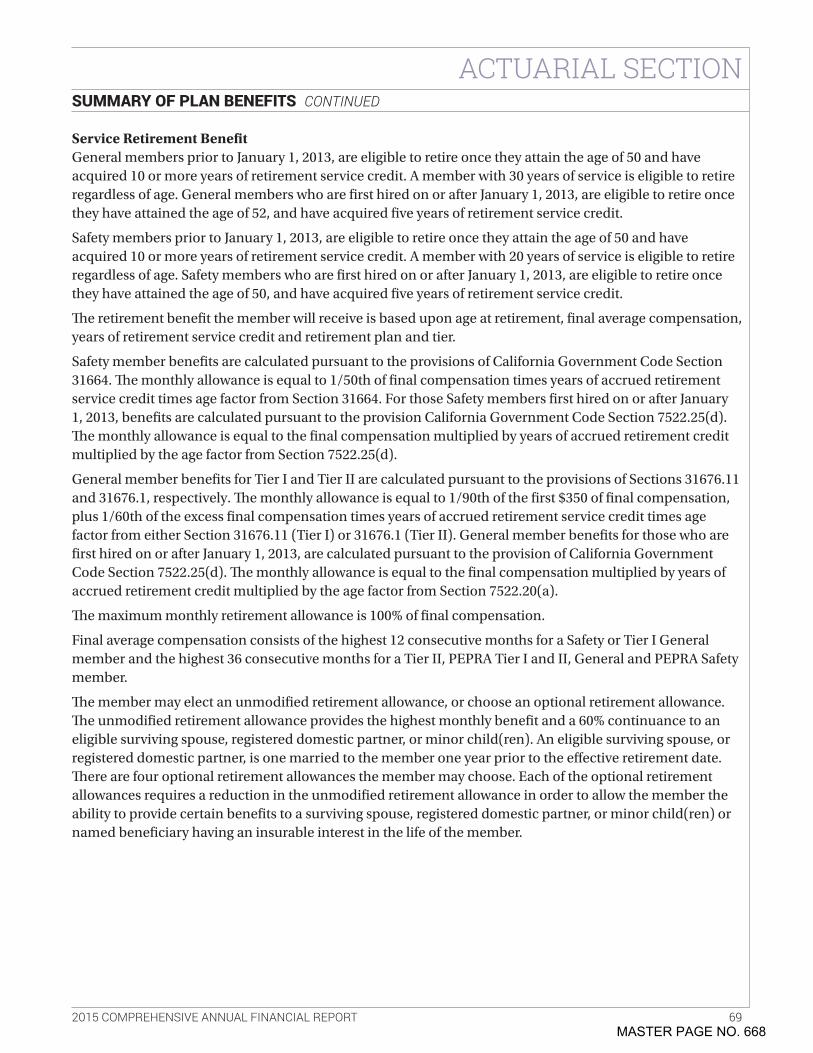
ACTUARIAL SECTION
2015 COMPREHENSIVE ANNUAL FINANCIAL REPORT 69
Service Retirement BenefitGeneral members prior to January 1, 2013, are eligible to retire once they attain the age of 50 and have acquired 10 or more years of retirement service credit . A member with 30 years of service is eligible to retire regardless of age . General members who are first hired on or after January 1, 2013, are eligible to retire once they have attained the age of 52, and have acquired five years of retirement service credit .
Safety members prior to January 1, 2013, are eligible to retire once they attain the age of 50 and have acquired 10 or more years of retirement service credit . A member with 20 years of service is eligible to retire regardless of age . Safety members who are first hired on or after January 1, 2013, are eligible to retire once they have attained the age of 50, and have acquired five years of retirement service credit .
The retirement benefit the member will receive is based upon age at retirement, final average compensation, years of retirement service credit and retirement plan and tier .
Safety member benefits are calculated pursuant to the provisions of California Government Code Section 31664 . The monthly allowance is equal to 1/50th of final compensation times years of accrued retirement service credit times age factor from Section 31664 . For those Safety members first hired on or after January 1, 2013, benefits are calculated pursuant to the provision California Government Code Section 7522 .25(d) . The monthly allowance is equal to the final compensation multiplied by years of accrued retirement credit multiplied by the age factor from Section 7522 .25(d) .
General member benefits for Tier I and Tier II are calculated pursuant to the provisions of Sections 31676 .11 and 31676 .1, respectively . The monthly allowance is equal to 1/90th of the first $350 of final compensation, plus 1/60th of the excess final compensation times years of accrued retirement service credit times age factor from either Section 31676 .11 (Tier I) or 31676 .1 (Tier II) . General member benefits for those who are first hired on or after January 1, 2013, are calculated pursuant to the provision of California Government Code Section 7522 .25(d) . The monthly allowance is equal to the final compensation multiplied by years of accrued retirement credit multiplied by the age factor from Section 7522 .20(a) .
The maximum monthly retirement allowance is 100% of final compensation .
Final average compensation consists of the highest 12 consecutive months for a Safety or Tier I General member and the highest 36 consecutive months for a Tier II, PEPRA Tier I and II, General and PEPRA Safety member .
The member may elect an unmodified retirement allowance, or choose an optional retirement allowance . The unmodified retirement allowance provides the highest monthly benefit and a 60% continuance to an eligible surviving spouse, registered domestic partner, or minor child(ren) . An eligible surviving spouse, or registered domestic partner, is one married to the member one year prior to the effective retirement date . There are four optional retirement allowances the member may choose . Each of the optional retirement allowances requires a reduction in the unmodified retirement allowance in order to allow the member the ability to provide certain benefits to a surviving spouse, registered domestic partner, or minor child(ren) or named beneficiary having an insurable interest in the life of the member .
SUMMARY OF PLAN BENEFITS CONTINUED
MASTER PAGE NO. 668
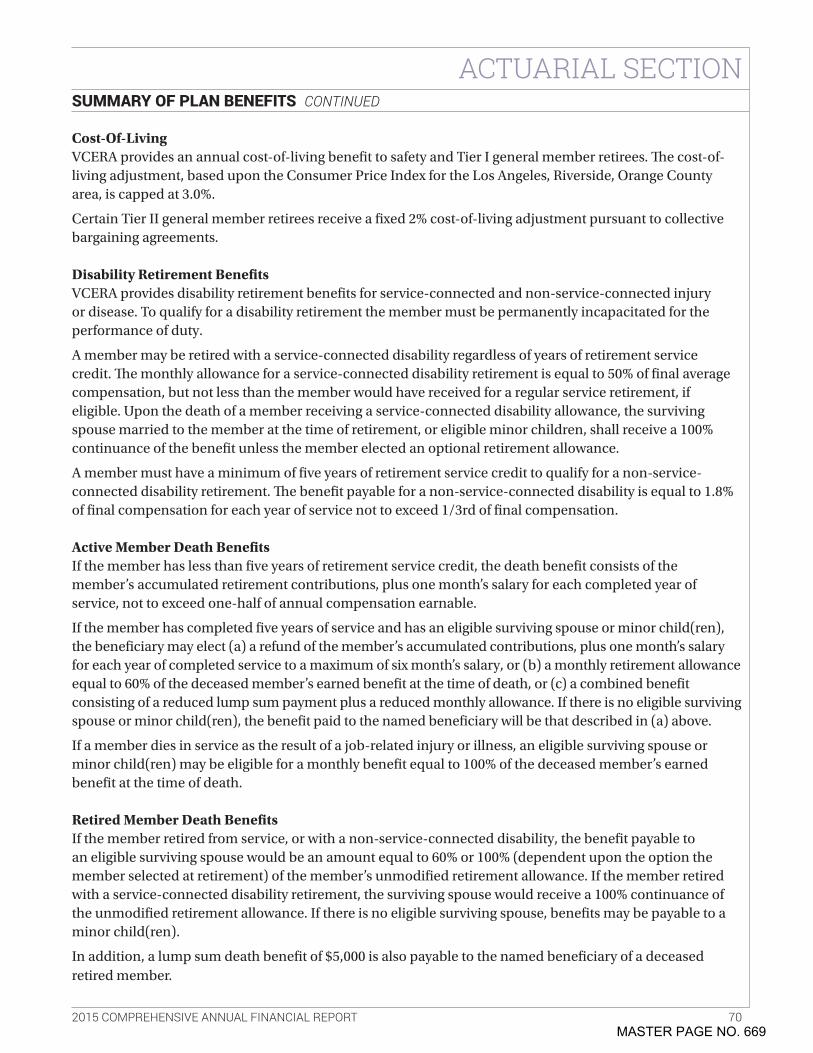
ACTUARIAL SECTION
2015 COMPREHENSIVE ANNUAL FINANCIAL REPORT 70
Cost-Of-LivingVCERA provides an annual cost-of-living benefit to safety and Tier I general member retirees . The cost-of-living adjustment, based upon the Consumer Price Index for the Los Angeles, Riverside, Orange County area, is capped at 3 .0% .
Certain Tier II general member retirees receive a fixed 2% cost-of-living adjustment pursuant to collective bargaining agreements .
Disability Retirement BenefitsVCERA provides disability retirement benefits for service-connected and non-service-connected injury or disease . To qualify for a disability retirement the member must be permanently incapacitated for the performance of duty .
A member may be retired with a service-connected disability regardless of years of retirement service credit . The monthly allowance for a service-connected disability retirement is equal to 50% of final average compensation, but not less than the member would have received for a regular service retirement, if eligible . Upon the death of a member receiving a service-connected disability allowance, the surviving spouse married to the member at the time of retirement, or eligible minor children, shall receive a 100% continuance of the benefit unless the member elected an optional retirement allowance .
A member must have a minimum of five years of retirement service credit to qualify for a non-service-connected disability retirement . The benefit payable for a non-service-connected disability is equal to 1 .8% of final compensation for each year of service not to exceed 1/3rd of final compensation .
Active Member Death BenefitsIf the member has less than five years of retirement service credit, the death benefit consists of the member’s accumulated retirement contributions, plus one month’s salary for each completed year of service, not to exceed one-half of annual compensation earnable .
If the member has completed five years of service and has an eligible surviving spouse or minor child(ren), the beneficiary may elect (a) a refund of the member’s accumulated contributions, plus one month’s salary for each year of completed service to a maximum of six month’s salary, or (b) a monthly retirement allowance equal to 60% of the deceased member’s earned benefit at the time of death, or (c) a combined benefit consisting of a reduced lump sum payment plus a reduced monthly allowance . If there is no eligible surviving spouse or minor child(ren), the benefit paid to the named beneficiary will be that described in (a) above .
If a member dies in service as the result of a job-related injury or illness, an eligible surviving spouse or minor child(ren) may be eligible for a monthly benefit equal to 100% of the deceased member’s earned benefit at the time of death .
Retired Member Death BenefitsIf the member retired from service, or with a non-service-connected disability, the benefit payable to an eligible surviving spouse would be an amount equal to 60% or 100% (dependent upon the option the member selected at retirement) of the member’s unmodified retirement allowance . If the member retired with a service-connected disability retirement, the surviving spouse would receive a 100% continuance of the unmodified retirement allowance . If there is no eligible surviving spouse, benefits may be payable to a minor child(ren) .
In addition, a lump sum death benefit of $5,000 is also payable to the named beneficiary of a deceased retired member .
SUMMARY OF PLAN BENEFITS CONTINUED
MASTER PAGE NO. 669
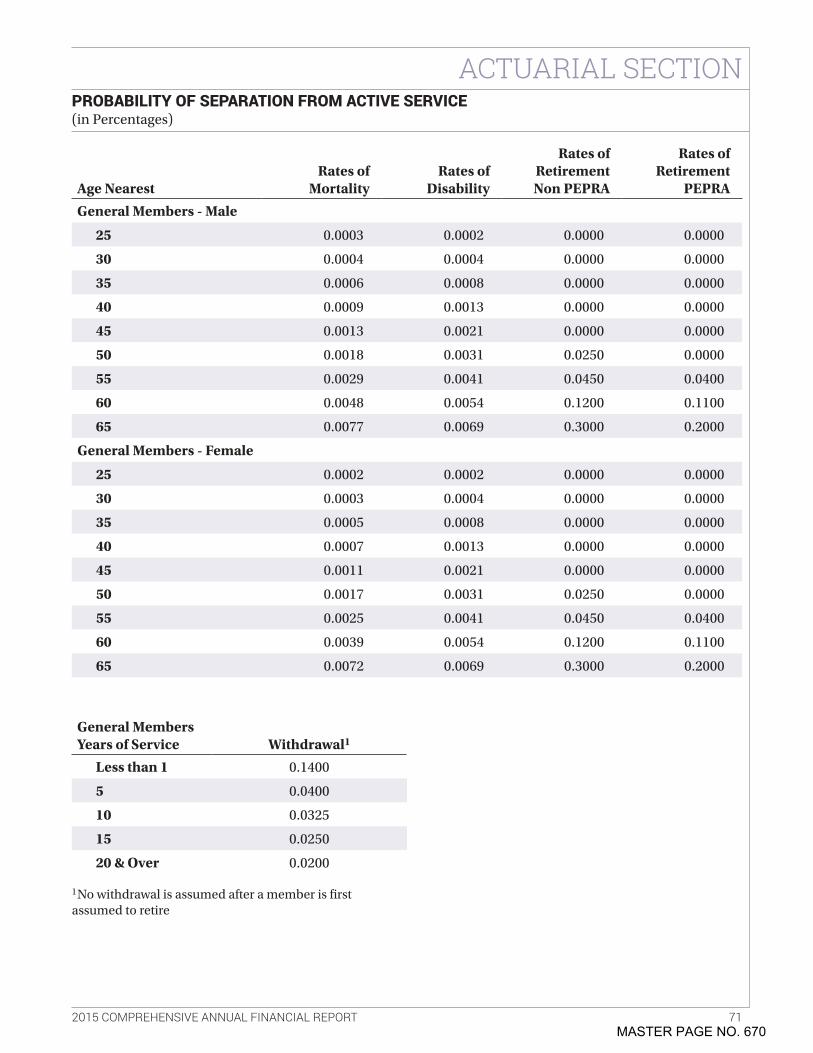
ACTUARIAL SECTION
2015 COMPREHENSIVE ANNUAL FINANCIAL REPORT 71
Age NearestRates of
MortalityRates of
Disability
Rates of Retirement Non PEPRA
Rates of Retirement
PEPRA
General Members - Male
25 0 .0003 0 .0002 0 .0000 0 .0000
30 0 .0004 0 .0004 0 .0000 0 .0000
35 0 .0006 0 .0008 0 .0000 0 .0000
40 0 .0009 0 .0013 0 .0000 0 .0000
45 0 .0013 0 .0021 0 .0000 0 .0000
50 0 .0018 0 .0031 0 .0250 0 .0000
55 0 .0029 0 .0041 0 .0450 0 .0400
60 0 .0048 0 .0054 0 .1200 0 .1100
65 0 .0077 0 .0069 0 .3000 0 .2000
General Members - Female
25 0 .0002 0 .0002 0 .0000 0 .0000
30 0 .0003 0 .0004 0 .0000 0 .0000
35 0 .0005 0 .0008 0 .0000 0 .0000
40 0 .0007 0 .0013 0 .0000 0 .0000
45 0 .0011 0 .0021 0 .0000 0 .0000
50 0 .0017 0 .0031 0 .0250 0 .0000
55 0 .0025 0 .0041 0 .0450 0 .0400
60 0 .0039 0 .0054 0 .1200 0 .1100
65 0 .0072 0 .0069 0 .3000 0 .2000
PROBABILITY OF SEPARATION FROM ACTIVE SERVICE (in Percentages)
General MembersYears of Service Withdrawal1
Less than 1 0 .1400
5 0 .0400
10 0 .0325
15 0 .0250
20 & Over 0 .0200
1No withdrawal is assumed after a member is first assumed to retire
MASTER PAGE NO. 670

ACTUARIAL SECTION
2015 COMPREHENSIVE ANNUAL FINANCIAL REPORT 72
Age NearestRates of
MortalityRates of
Disability
Rates of Retirement Non PEPRA
Rates of Retirement
PEPRA
Safety Members - Male
25 0 .0003 0 .0011 0 .0000 0 .0000
30 0 .0003 0 .0024 0 .0000 0 .0000
35 0 .0005 0 .0036 0 .0000 0 .0000
40 0 .0008 0 .0058 0 .0100 0 .0000
45 0 .0011 0 .0088 0 .0100 0 .0000
50 0 .0016 0 .0148 0 .0250 0 .0500
55 0 .0024 0 .0288 0 .2200 0 .2000
60 0 .0041 0 .0504 0 .2200 0 .2500
65 0 .0064 0 .0000 1 .0000 1 .0000
Safety Members - Female
25 0 .0002 0 .0011 0 .0000 0 .0000
30 0 .0002 0 .0024 0 .0000 0 .0000
35 0 .0003 0 .0036 0 .0000 0 .0000
40 0 .0005 0 .0058 0 .0100 0 .0000
45 0 .0008 0 .0088 0 .0100 0 .0000
50 0 .0012 0 .0148 0 .0250 0 .0500
55 0 .0018 0 .0288 0 .2200 0 .2000
60 0 .0027 0 .0504 0 .2200 0 .2500
65 0 .0044 0 .0000 1 .0000 1 .0000
Safety MembersYears of Service Withdrawal1
Less than 1 0 .1000
5 0 .0275
10 0 .0140
15 0 .0085
20 & Over 0 .0060
PROBABILITY OF SEPARATION FROM ACTIVE SERVICE CONTINUED (in Percentages)
1No withdrawal is assumed after a member is first assumed to retire
MASTER PAGE NO. 671

STATISTICAL SECTION
Sailing or boating opportunities are endless in Ventura County. On your next visit, set your destination for a jaunt out into the Pacific or explore one of the multitudes of inlets and canals all along the coast. Don't have a boat? Outfitters are available everywhere to make sure you don't miss out.
PHOTO BY JOE VERNIG
MASTER PAGE NO. 672
STATISTICAL SECTION
2015 COMPREHENSIVE ANNUAL FINANCIAL REPORT 73
STATISTICAL INFORMATION OVERVIEW
The objective of the Statistical Section is to provide historical perspective, context, and detail in order to provide a more comprehensive understanding of the Financial Statements, Notes to the Financial Statements, and supplementary information, which cover the Pension Plan . This section also includes multi-year trend of financial and operating information to facilitate comprehensive understanding of how the organization’s financial position and performance has changed over time . More specifically, the financial and operating information provides contextual data of VCERA’s changes in fiduciary net position, benefits, refunds, contribution rates and retirement benefits . The financial and operating trend information is located on the following pages .
Financial Trends Information is intended to assist readers in understanding how VCERA’s financial position has changed over time . The Changes in Pension Plan Fiduciary Net Position presents additions by source, deductions by type, and the total change in fiduciary net position for each year . The Schedule of Pension Benefit Expenses by Type presents benefit and member refunds and death benefits deductions by type of benefit and by member type .
Operating Information is intended to provide contextual information about VCERA’s operations and membership to assist readers in using financial statement information to comprehend and evaluate VCERA’s fiscal condition . The Active and Deferred Members provides membership statistics for active vested and non-vested members as well as deferred members . The Retired Members by Type of Pension Benefit reflects the number of retired members, average monthly benefit, and type of benefit as of June 30, 2015 . The Schedule of Average Monthly Benefit Payments reflects the number of newly retired members, average monthly benefit and average final salary, shown in five-year increments . The Participating Employers and Active Members presents the employers and their corresponding covered employees . The Employer Contribution Rates are also provided as additional information .
MASTER PAGE NO. 673
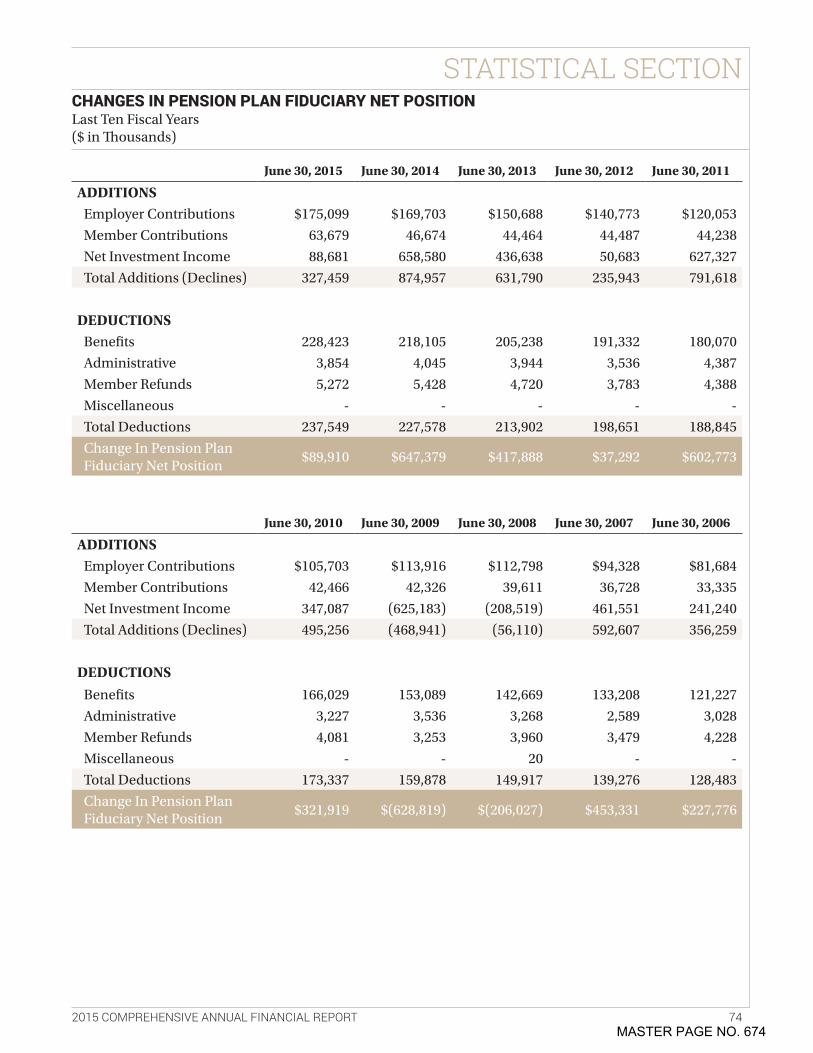
STATISTICAL SECTION
2015 COMPREHENSIVE ANNUAL FINANCIAL REPORT 74
June 30, 2015 June 30, 2014 June 30, 2013 June 30, 2012 June 30, 2011
ADDITIONSEmployer Contributions $175,099 $169,703 $150,688 $140,773 $120,053
Member Contributions 63,679 46,674 44,464 44,487 44,238
Net Investment Income 88,681 658,580 436,638 50,683 627,327
Total Additions (Declines) 327,459 874,957 631,790 235,943 791,618
DEDUCTIONSBenefits 228,423 218,105 205,238 191,332 180,070
Administrative 3,854 4,045 3,944 3,536 4,387
Member Refunds 5,272 5,428 4,720 3,783 4,388
Miscellaneous - - - - -
Total Deductions 237,549 227,578 213,902 198,651 188,845
Change In Pension Plan Fiduciary Net Position
$89,910 $647,379 $417,888 $37,292 $602,773
June 30, 2010 June 30, 2009 June 30, 2008 June 30, 2007 June 30, 2006
ADDITIONSEmployer Contributions $105,703 $113,916 $112,798 $94,328 $81,684
Member Contributions 42,466 42,326 39,611 36,728 33,335
Net Investment Income 347,087 (625,183) (208,519) 461,551 241,240
Total Additions (Declines) 495,256 (468,941) (56,110) 592,607 356,259
DEDUCTIONS
Benefits 166,029 153,089 142,669 133,208 121,227
Administrative 3,227 3,536 3,268 2,589 3,028
Member Refunds 4,081 3,253 3,960 3,479 4,228
Miscellaneous - - 20 - -
Total Deductions 173,337 159,878 149,917 139,276 128,483
Change In Pension Plan Fiduciary Net Position
$321,919 $(628,819) $(206,027) $453,331 $227,776
CHANGES IN PENSION PLAN FIDUCIARY NET POSITION Last Ten Fiscal Years ($ in Thousands)
MASTER PAGE NO. 674

STATISTICAL SECTION
2015 COMPREHENSIVE ANNUAL FINANCIAL REPORT 75
June 30, 2015 June 30, 2014 June 30, 2013 June 30, 2012 June 30, 2011
Service RetirementGeneral $116,593 $110,052 $103,665 $96,889 $91,046
Safety 61,918 58,404 54,789 49,706 45,010
Total 178,511 168,456 158,454 146,595 136,056
Disability RetirementGeneral 9,711 10,172 9,639 9,585 9,484
Safety 24,426 24,332 22,890 21,808 21,331
Total 34,137 34,504 32,529 31,393 30,815
Survivor ContinuancesGeneral 9,335 9,141 8,513 8,017 7,909
Safety 6,440 6,003 5,742 5,328 5,291
Total 15,775 15,144 14,255 13,345 13,200
Total Retired MembersGeneral 135,639 129,365 121,817 114,491 108,439
Safety 92,784 88,739 83,421 76,842 71,632
Total $228,423 $218,104 $205,238 $191,333 $180,071
Member Refunds & Death BenefitsGeneral $4,703 $5,094 $4,263 $3,379 $3,859
Safety 569 334 457 404 530
Total $5,272 $5,428 $4,720 $3,783 $4,389
TOTAL PLAN NET POSITION
SCHEDULE OF PENSION BENEFIT EXPENSES BY TYPE Last Ten Fiscal Years ($ in Thousands)
$5,000
$4,500
$4,000
$3,500
$3,000
$2,500
$2,000
$1,500
$1,000
$500
$02006
AM
OU
NT
IN T
HO
USA
ND
S
2007 2008 2009 2010 2011 2012 2013 2014 2015
MASTER PAGE NO. 675
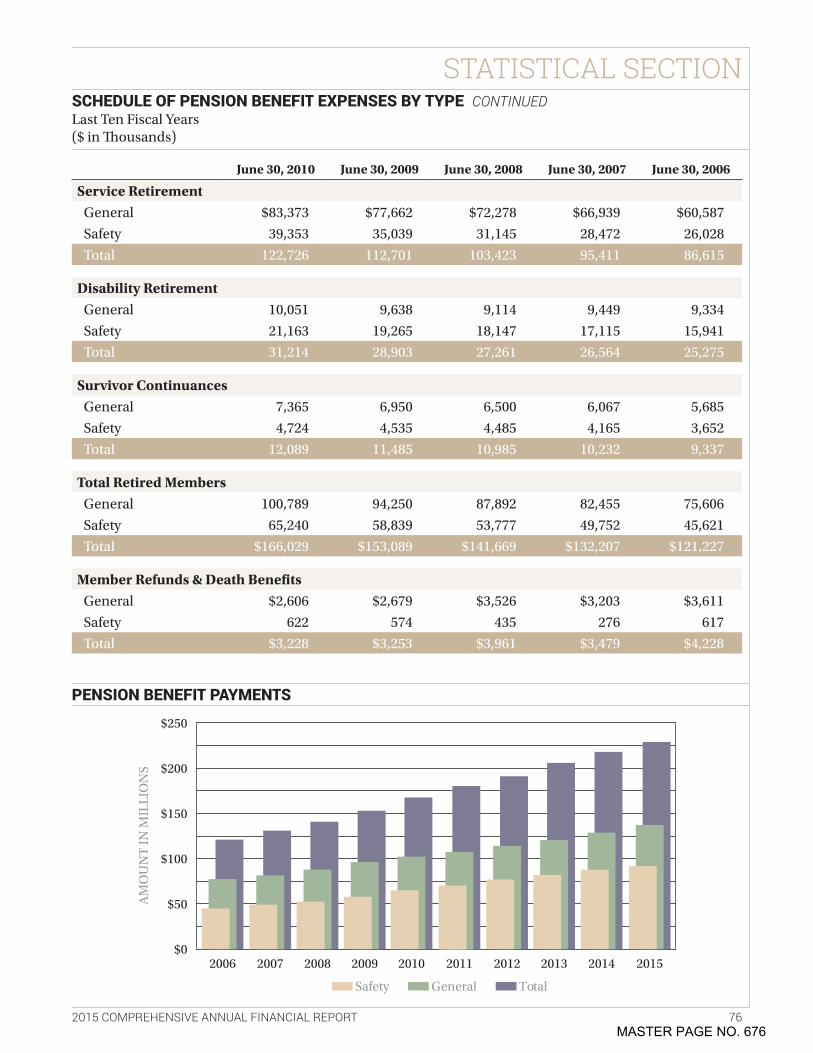
STATISTICAL SECTION
2015 COMPREHENSIVE ANNUAL FINANCIAL REPORT 76
June 30, 2010 June 30, 2009 June 30, 2008 June 30, 2007 June 30, 2006
Service RetirementGeneral $83,373 $77,662 $72,278 $66,939 $60,587
Safety 39,353 35,039 31,145 28,472 26,028
Total 122,726 112,701 103,423 95,411 86,615
Disability RetirementGeneral 10,051 9,638 9,114 9,449 9,334
Safety 21,163 19,265 18,147 17,115 15,941
Total 31,214 28,903 27,261 26,564 25,275
Survivor ContinuancesGeneral 7,365 6,950 6,500 6,067 5,685
Safety 4,724 4,535 4,485 4,165 3,652
Total 12,089 11,485 10,985 10,232 9,337
Total Retired MembersGeneral 100,789 94,250 87,892 82,455 75,606
Safety 65,240 58,839 53,777 49,752 45,621
Total $166,029 $153,089 $141,669 $132,207 $121,227
Member Refunds & Death BenefitsGeneral $2,606 $2,679 $3,526 $3,203 $3,611
Safety 622 574 435 276 617
Total $3,228 $3,253 $3,961 $3,479 $4,228
SCHEDULE OF PENSION BENEFIT EXPENSES BY TYPE CONTINUED Last Ten Fiscal Years ($ in Thousands)
PENSION BENEFIT PAYMENTS
$250
$200
$150
$100
$50
$02006
AM
OU
NT
IN M
ILLI
ON
S
General
2007 2008 2009 2010 2011 2012 2013 2014 2015
Safety Total
MASTER PAGE NO. 676
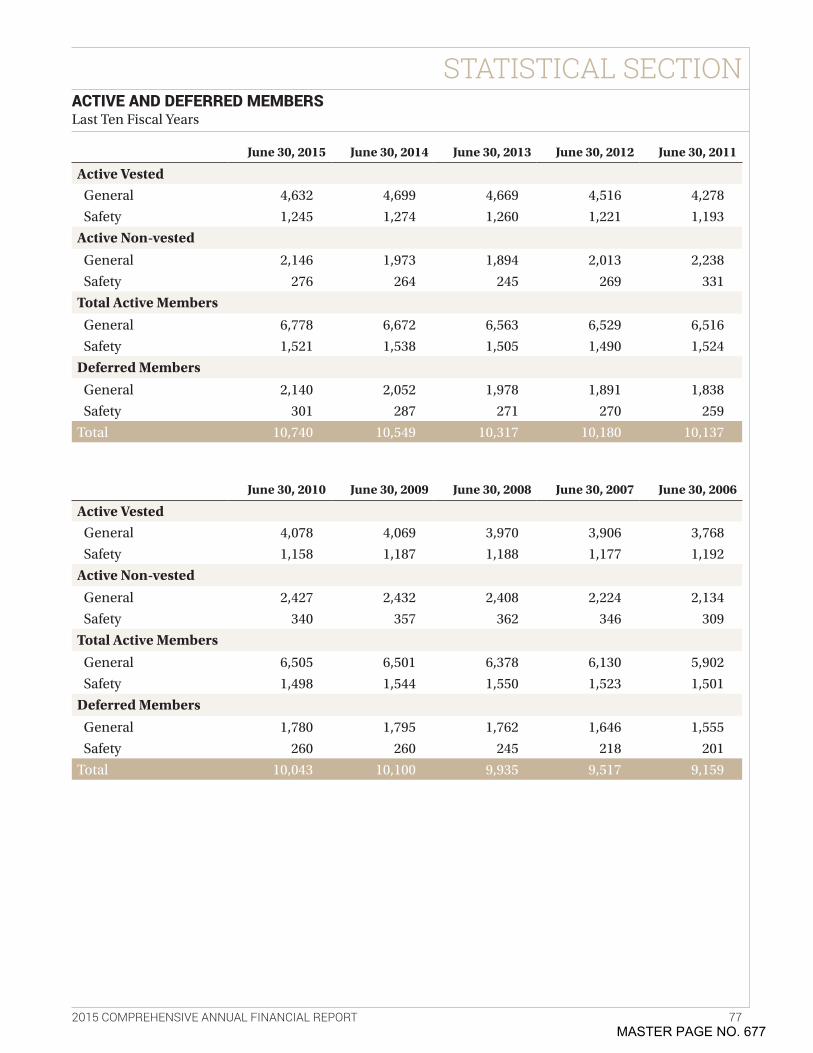
STATISTICAL SECTION
2015 COMPREHENSIVE ANNUAL FINANCIAL REPORT 77
June 30, 2015 June 30, 2014 June 30, 2013 June 30, 2012 June 30, 2011
Active VestedGeneral 4,632 4,699 4,669 4,516 4,278
Safety 1,245 1,274 1,260 1,221 1,193
Active Non-vested
General 2,146 1,973 1,894 2,013 2,238
Safety 276 264 245 269 331
Total Active Members
General 6,778 6,672 6,563 6,529 6,516
Safety 1,521 1,538 1,505 1,490 1,524
Deferred Members
General 2,140 2,052 1,978 1,891 1,838
Safety 301 287 271 270 259
Total 10,740 10,549 10,317 10,180 10,137
June 30, 2010 June 30, 2009 June 30, 2008 June 30, 2007 June 30, 2006
Active VestedGeneral 4,078 4,069 3,970 3,906 3,768
Safety 1,158 1,187 1,188 1,177 1,192
Active Non-vested
General 2,427 2,432 2,408 2,224 2,134
Safety 340 357 362 346 309
Total Active Members
General 6,505 6,501 6,378 6,130 5,902
Safety 1,498 1,544 1,550 1,523 1,501
Deferred Members
General 1,780 1,795 1,762 1,646 1,555
Safety 260 260 245 218 201
Total 10,043 10,100 9,935 9,517 9,159
ACTIVE AND DEFERRED MEMBERS Last Ten Fiscal Years
MASTER PAGE NO. 677
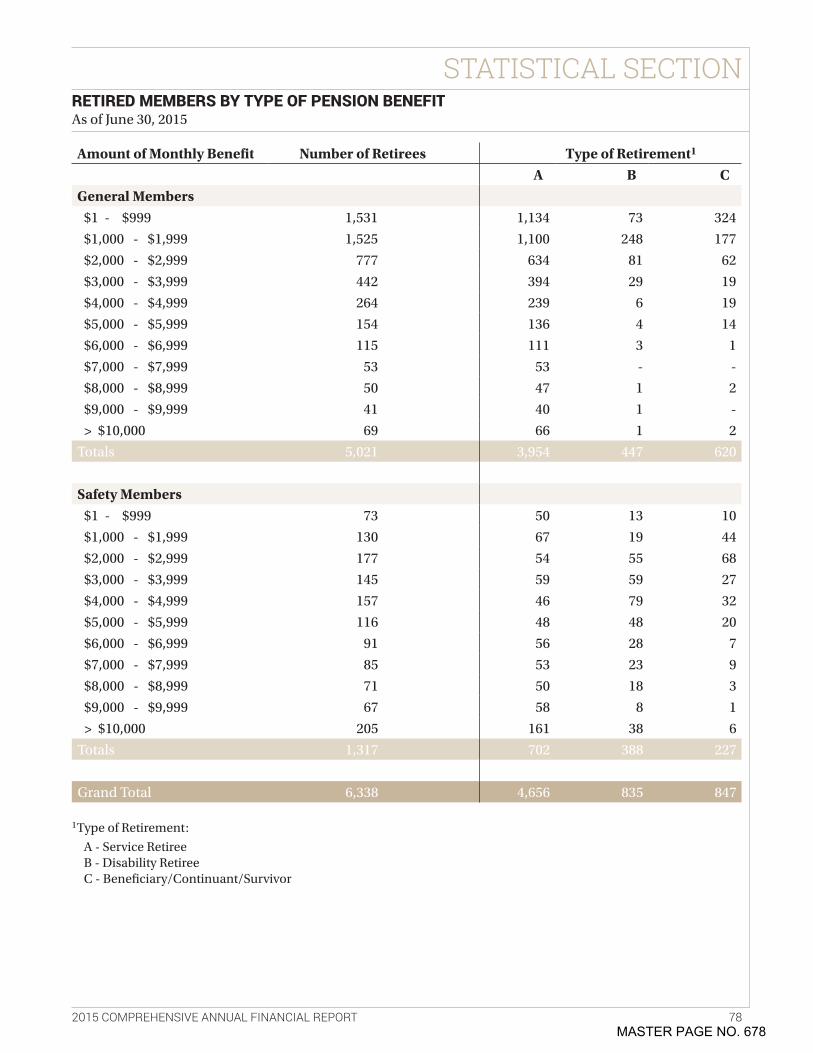
STATISTICAL SECTION
2015 COMPREHENSIVE ANNUAL FINANCIAL REPORT 78
Amount of Monthly Benefit Number of Retirees Type of Retirement1
A B CGeneral Members
$1 - $999 1,531 1,134 73 324
$1,000 - $1,999 1,525 1,100 248 177
$2,000 - $2,999 777 634 81 62
$3,000 - $3,999 442 394 29 19
$4,000 - $4,999 264 239 6 19
$5,000 - $5,999 154 136 4 14
$6,000 - $6,999 115 111 3 1
$7,000 - $7,999 53 53 - -
$8,000 - $8,999 50 47 1 2
$9,000 - $9,999 41 40 1 -
> $10,000 69 66 1 2
Totals 5,021 3,954 447 620
Safety Members$1 - $999 73 50 13 10
$1,000 - $1,999 130 67 19 44
$2,000 - $2,999 177 54 55 68
$3,000 - $3,999 145 59 59 27
$4,000 - $4,999 157 46 79 32
$5,000 - $5,999 116 48 48 20
$6,000 - $6,999 91 56 28 7
$7,000 - $7,999 85 53 23 9
$8,000 - $8,999 71 50 18 3
$9,000 - $9,999 67 58 8 1
> $10,000 205 161 38 6
Totals 1,317 702 388 227
Grand Total 6,338 4,656 835 847
RETIRED MEMBERS BY TYPE OF PENSION BENEFIT As of June 30, 2015
1Type of Retirement:
A - Service RetireeB - Disability RetireeC - Beneficiary/Continuant/Survivor
MASTER PAGE NO. 678
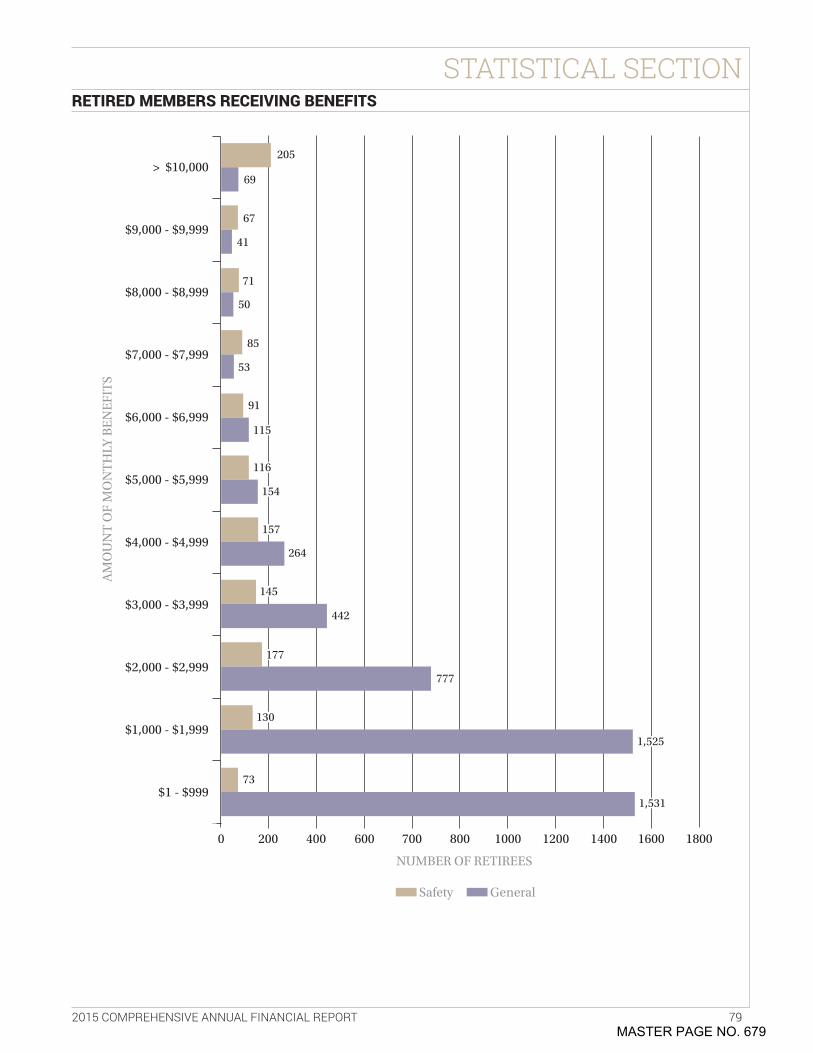
STATISTICAL SECTION
2015 COMPREHENSIVE ANNUAL FINANCIAL REPORT 79
RETIRED MEMBERS RECEIVING BENEFITS
> $10,000
$9,000 - $9,999
$8,000 - $8,999
$7,000 - $7,999
$6,000 - $6,999
$5,000 - $5,999
$4,000 - $4,999
$3,000 - $3,999
$2,000 - $2,999
$1,000 - $1,999
$1 - $999
0
AM
OU
NT
OF
MO
NT
HLY
BE
NE
FIT
S
General
200 400 600 700 800 1000 1200 1400 1600 1800
Safety
NUMBER OF RETIREES
205
69
67
41
71
50
85
53
91
264
442
777
73
115
116
154
157
145
177
130
1,525
1,531
MASTER PAGE NO. 679
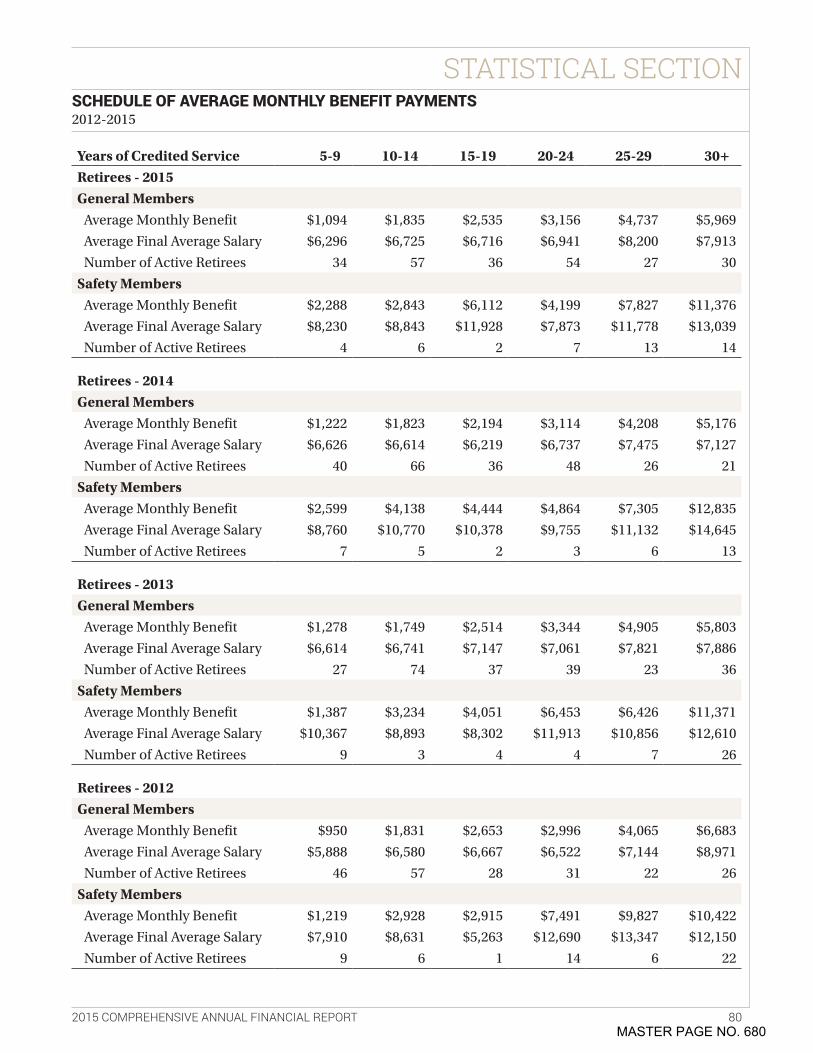
STATISTICAL SECTION
2015 COMPREHENSIVE ANNUAL FINANCIAL REPORT 80
SCHEDULE OF AVERAGE MONTHLY BENEFIT PAYMENTS 2012-2015
Years of Credited Service 5-9 10-14 15-19 20-24 25-29 30+Retirees - 2015General Members
Average Monthly Benefit $1,094 $1,835 $2,535 $3,156 $4,737 $5,969
Average Final Average Salary $6,296 $6,725 $6,716 $6,941 $8,200 $7,913
Number of Active Retirees 34 57 36 54 27 30
Safety MembersAverage Monthly Benefit $2,288 $2,843 $6,112 $4,199 $7,827 $11,376
Average Final Average Salary $8,230 $8,843 $11,928 $7,873 $11,778 $13,039
Number of Active Retirees 4 6 2 7 13 14
Retirees - 2014General Members
Average Monthly Benefit $1,222 $1,823 $2,194 $3,114 $4,208 $5,176
Average Final Average Salary $6,626 $6,614 $6,219 $6,737 $7,475 $7,127
Number of Active Retirees 40 66 36 48 26 21
Safety MembersAverage Monthly Benefit $2,599 $4,138 $4,444 $4,864 $7,305 $12,835
Average Final Average Salary $8,760 $10,770 $10,378 $9,755 $11,132 $14,645
Number of Active Retirees 7 5 2 3 6 13
Retirees - 2013General Members
Average Monthly Benefit $1,278 $1,749 $2,514 $3,344 $4,905 $5,803
Average Final Average Salary $6,614 $6,741 $7,147 $7,061 $7,821 $7,886
Number of Active Retirees 27 74 37 39 23 36
Safety MembersAverage Monthly Benefit $1,387 $3,234 $4,051 $6,453 $6,426 $11,371
Average Final Average Salary $10,367 $8,893 $8,302 $11,913 $10,856 $12,610
Number of Active Retirees 9 3 4 4 7 26
Retirees - 2012General Members
Average Monthly Benefit $950 $1,831 $2,653 $2,996 $4,065 $6,683
Average Final Average Salary $5,888 $6,580 $6,667 $6,522 $7,144 $8,971
Number of Active Retirees 46 57 28 31 22 26
Safety MembersAverage Monthly Benefit $1,219 $2,928 $2,915 $7,491 $9,827 $10,422
Average Final Average Salary $7,910 $8,631 $5,263 $12,690 $13,347 $12,150
Number of Active Retirees 9 6 1 14 6 22
MASTER PAGE NO. 680
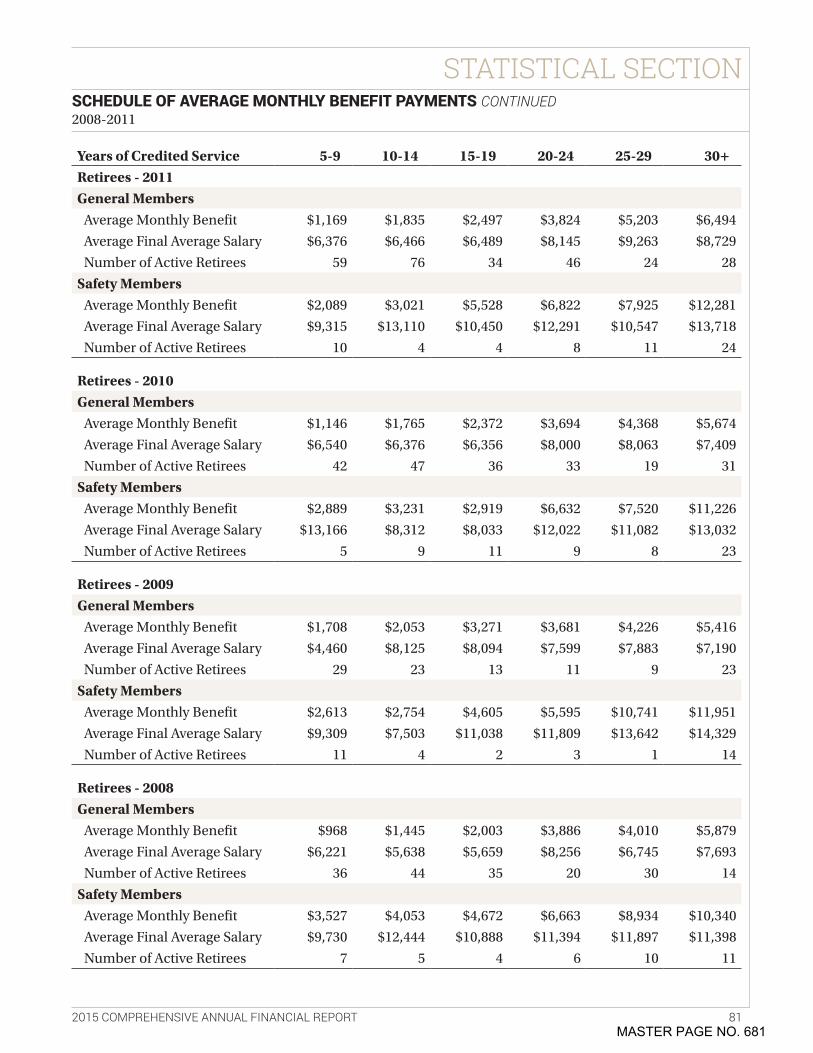
STATISTICAL SECTION
2015 COMPREHENSIVE ANNUAL FINANCIAL REPORT 81
Years of Credited Service 5-9 10-14 15-19 20-24 25-29 30+Retirees - 2011General Members
Average Monthly Benefit $1,169 $1,835 $2,497 $3,824 $5,203 $6,494
Average Final Average Salary $6,376 $6,466 $6,489 $8,145 $9,263 $8,729
Number of Active Retirees 59 76 34 46 24 28
Safety MembersAverage Monthly Benefit $2,089 $3,021 $5,528 $6,822 $7,925 $12,281
Average Final Average Salary $9,315 $13,110 $10,450 $12,291 $10,547 $13,718
Number of Active Retirees 10 4 4 8 11 24
Retirees - 2010General Members
Average Monthly Benefit $1,146 $1,765 $2,372 $3,694 $4,368 $5,674
Average Final Average Salary $6,540 $6,376 $6,356 $8,000 $8,063 $7,409
Number of Active Retirees 42 47 36 33 19 31
Safety MembersAverage Monthly Benefit $2,889 $3,231 $2,919 $6,632 $7,520 $11,226
Average Final Average Salary $13,166 $8,312 $8,033 $12,022 $11,082 $13,032
Number of Active Retirees 5 9 11 9 8 23
Retirees - 2009General Members
Average Monthly Benefit $1,708 $2,053 $3,271 $3,681 $4,226 $5,416
Average Final Average Salary $4,460 $8,125 $8,094 $7,599 $7,883 $7,190
Number of Active Retirees 29 23 13 11 9 23
Safety MembersAverage Monthly Benefit $2,613 $2,754 $4,605 $5,595 $10,741 $11,951
Average Final Average Salary $9,309 $7,503 $11,038 $11,809 $13,642 $14,329
Number of Active Retirees 11 4 2 3 1 14
Retirees - 2008General Members
Average Monthly Benefit $968 $1,445 $2,003 $3,886 $4,010 $5,879
Average Final Average Salary $6,221 $5,638 $5,659 $8,256 $6,745 $7,693
Number of Active Retirees 36 44 35 20 30 14
Safety MembersAverage Monthly Benefit $3,527 $4,053 $4,672 $6,663 $8,934 $10,340
Average Final Average Salary $9,730 $12,444 $10,888 $11,394 $11,897 $11,398
Number of Active Retirees 7 5 4 6 10 11
SCHEDULE OF AVERAGE MONTHLY BENEFIT PAYMENTS CONTINUED 2008-2011
MASTER PAGE NO. 681
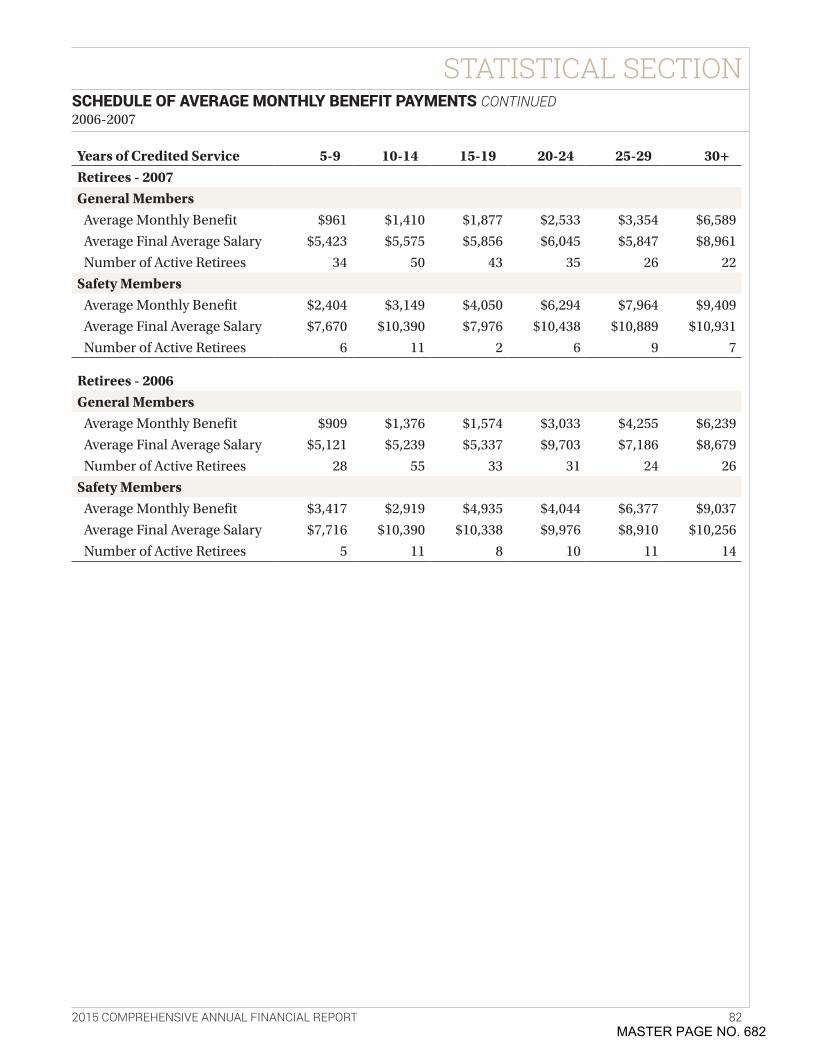
STATISTICAL SECTION
2015 COMPREHENSIVE ANNUAL FINANCIAL REPORT 82
Years of Credited Service 5-9 10-14 15-19 20-24 25-29 30+Retirees - 2007General Members
Average Monthly Benefit $961 $1,410 $1,877 $2,533 $3,354 $6,589
Average Final Average Salary $5,423 $5,575 $5,856 $6,045 $5,847 $8,961
Number of Active Retirees 34 50 43 35 26 22
Safety MembersAverage Monthly Benefit $2,404 $3,149 $4,050 $6,294 $7,964 $9,409
Average Final Average Salary $7,670 $10,390 $7,976 $10,438 $10,889 $10,931
Number of Active Retirees 6 11 2 6 9 7
Retirees - 2006General Members
Average Monthly Benefit $909 $1,376 $1,574 $3,033 $4,255 $6,239
Average Final Average Salary $5,121 $5,239 $5,337 $9,703 $7,186 $8,679
Number of Active Retirees 28 55 33 31 24 26
Safety MembersAverage Monthly Benefit $3,417 $2,919 $4,935 $4,044 $6,377 $9,037
Average Final Average Salary $7,716 $10,390 $10,338 $9,976 $8,910 $10,256
Number of Active Retirees 5 11 8 10 11 14
SCHEDULE OF AVERAGE MONTHLY BENEFIT PAYMENTS CONTINUED 2006-2007
MASTER PAGE NO. 682
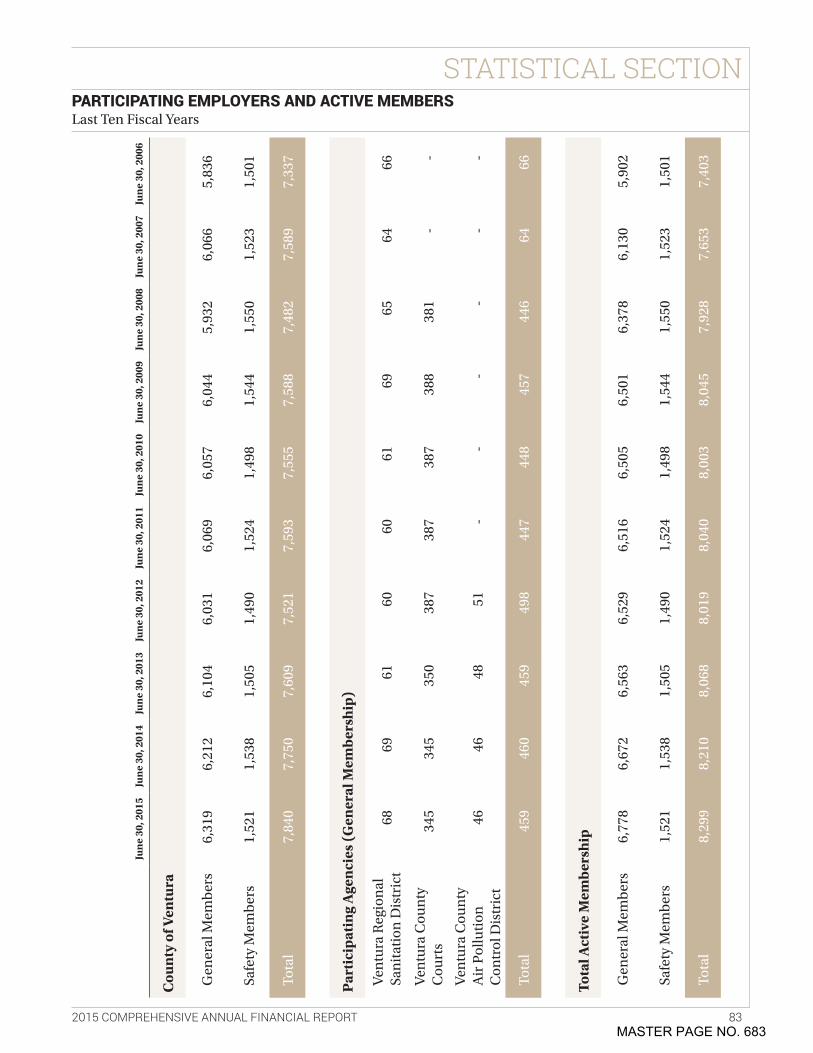
STATISTICAL SECTION
2015 COMPREHENSIVE ANNUAL FINANCIAL REPORT 83
Jun
e 30
, 201
5Ju
ne
30, 2
014
Jun
e 30
, 201
3Ju
ne
30, 2
012
Jun
e 30
, 201
1Ju
ne
30, 2
010
Jun
e 30
, 200
9Ju
ne
30, 2
008
Jun
e 30
, 200
7Ju
ne
30, 2
006
Cou
nty
of V
entu
ra
Gen
eral
Mem
ber
s6,
319
6,21
26,
104
6,03
16,
069
6,05
76,
044
5,93
26,
066
5,83
6
Safe
ty M
emb
ers
1,52
11,
538
1,50
51,
490
1,52
41,
498
1,54
41,
550
1,52
31,
501
Tota
l7,
840
7,75
07,
609
7,52
17,
593
7,55
57,
588
7,48
27,
589
7,33
7
Par
tici
pati
ng
Age
nci
es (
Gen
eral
Mem
bers
hip
)
Ven
tura
Reg
ion
al
San
itat
ion
Dis
tric
t68
6961
6060
6169
6564
66
Ven
tura
Cou
nty
C
ourt
s34
534
535
038
738
738
738
838
1-
-
Ven
tura
Cou
nty
A
ir P
ollu
tion
C
ontr
ol D
istr
ict
4646
4851
--
--
--
Tota
l45
946
045
949
844
744
845
744
664
66
Tota
l Act
ive
Mem
bers
hip
Gen
eral
Mem
ber
s6,
778
6,67
26,
563
6,52
96,
516
6,50
56,
501
6,37
86,
130
5,90
2
Safe
ty M
emb
ers
1,52
11,
538
1,50
51,
490
1,52
41,
498
1,54
41,
550
1,52
31,
501
Tota
l 8,
299
8,21
08,
068
8,01
98,
040
8,00
38,
045
7,92
87,
653
7,40
3
PARTICIPATING EMPLOYERS AND ACTIVE MEMBERS Last Ten Fiscal Years
MASTER PAGE NO. 683
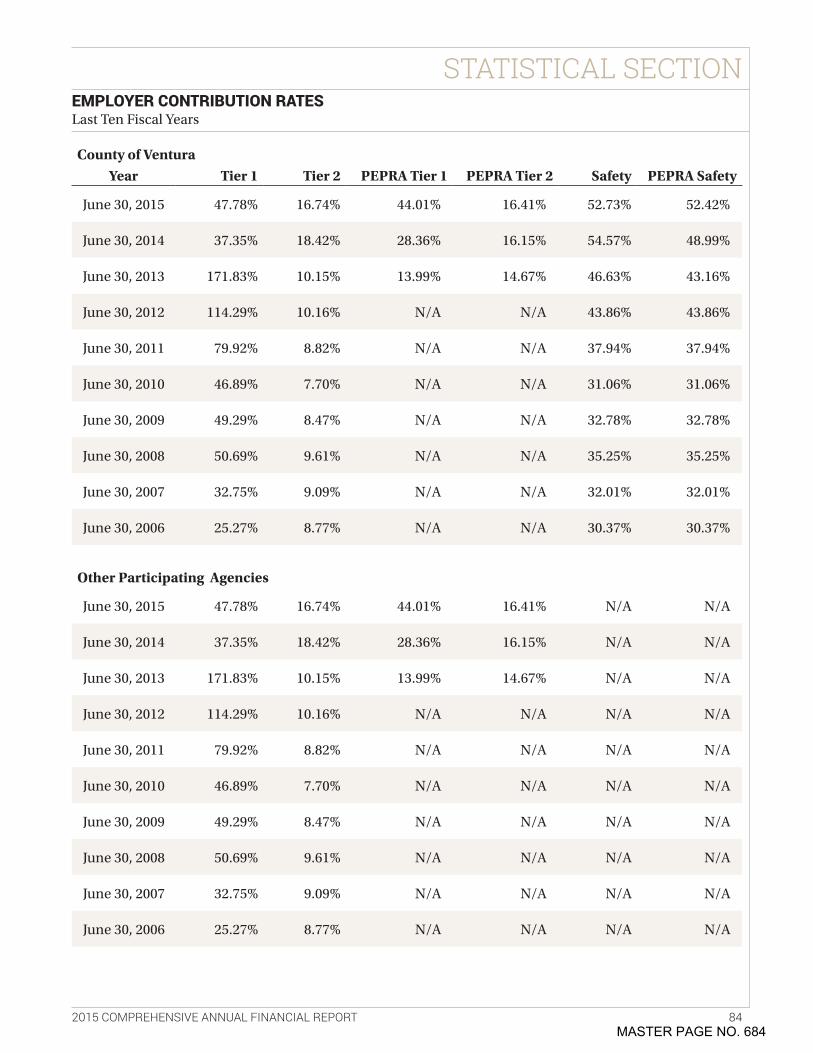
STATISTICAL SECTION
2015 COMPREHENSIVE ANNUAL FINANCIAL REPORT 84
EMPLOYER CONTRIBUTION RATES Last Ten Fiscal Years
County of VenturaYear Tier 1 Tier 2 PEPRA Tier 1 PEPRA Tier 2 Safety PEPRA Safety
June 30, 2015 47 .78% 16 .74% 44 .01% 16 .41% 52 .73% 52 .42%
June 30, 2014 37 .35% 18 .42% 28 .36% 16 .15% 54 .57% 48 .99%
June 30, 2013 171 .83% 10 .15% 13 .99% 14 .67% 46 .63% 43 .16%
June 30, 2012 114 .29% 10 .16% N/A N/A 43 .86% 43 .86%
June 30, 2011 79 .92% 8 .82% N/A N/A 37 .94% 37 .94%
June 30, 2010 46 .89% 7 .70% N/A N/A 31 .06% 31 .06%
June 30, 2009 49 .29% 8 .47% N/A N/A 32 .78% 32 .78%
June 30, 2008 50 .69% 9 .61% N/A N/A 35 .25% 35 .25%
June 30, 2007 32 .75% 9 .09% N/A N/A 32 .01% 32 .01%
June 30, 2006 25 .27% 8 .77% N/A N/A 30 .37% 30 .37%
Other Participating Agencies
June 30, 2015 47 .78% 16 .74% 44 .01% 16 .41% N/A N/A
June 30, 2014 37 .35% 18 .42% 28 .36% 16 .15% N/A N/A
June 30, 2013 171 .83% 10 .15% 13 .99% 14 .67% N/A N/A
June 30, 2012 114 .29% 10 .16% N/A N/A N/A N/A
June 30, 2011 79 .92% 8 .82% N/A N/A N/A N/A
June 30, 2010 46 .89% 7 .70% N/A N/A N/A N/A
June 30, 2009 49 .29% 8 .47% N/A N/A N/A N/A
June 30, 2008 50 .69% 9 .61% N/A N/A N/A N/A
June 30, 2007 32 .75% 9 .09% N/A N/A N/A N/A
June 30, 2006 25 .27% 8 .77% N/A N/A N/A N/A
MASTER PAGE NO. 684
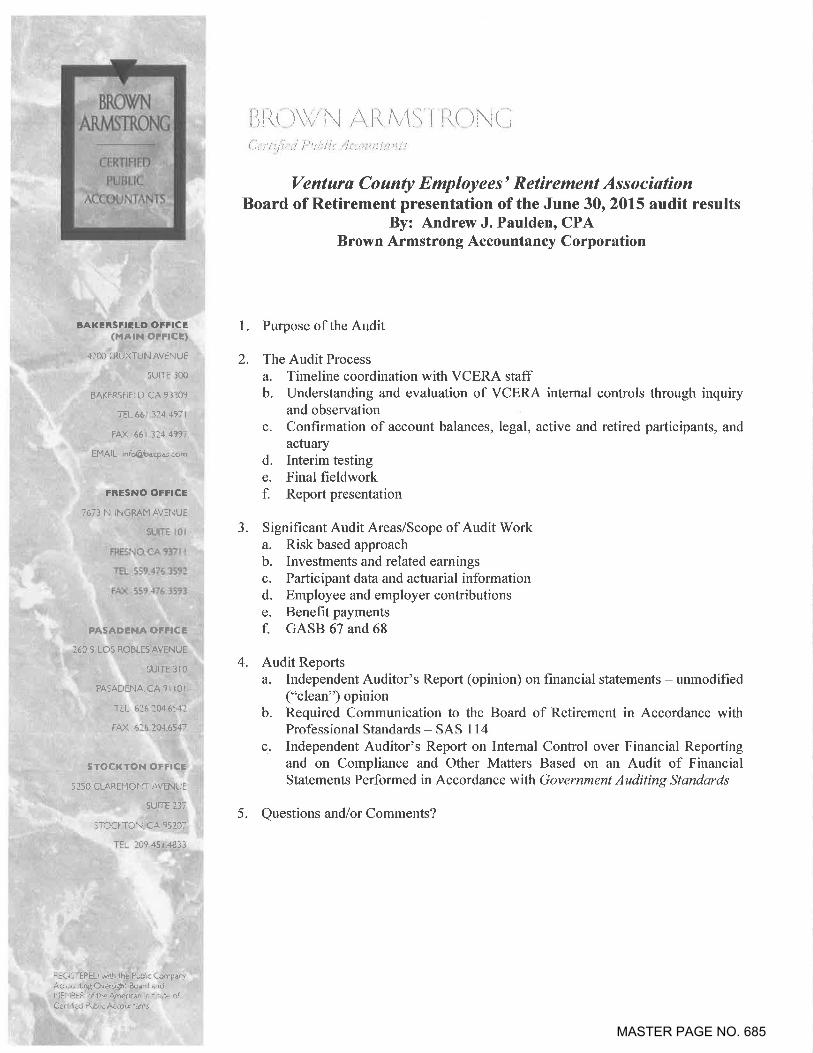
MASTER PAGE NO. 685
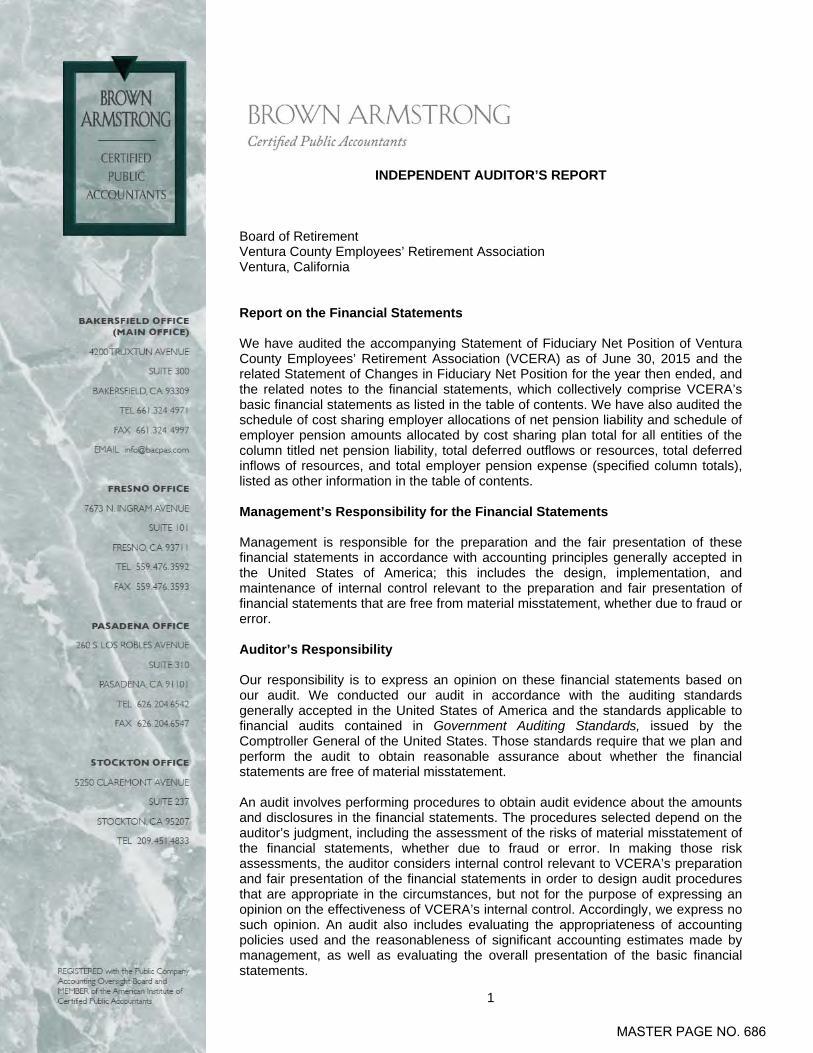
1
INDEPENDENT AUDITOR’S REPORT Board of Retirement Ventura County Employees’ Retirement Association Ventura, California Report on the Financial Statements We have audited the accompanying Statement of Fiduciary Net Position of Ventura County Employees’ Retirement Association (VCERA) as of June 30, 2015 and the related Statement of Changes in Fiduciary Net Position for the year then ended, and the related notes to the financial statements, which collectively comprise VCERA’s basic financial statements as listed in the table of contents. We have also audited the schedule of cost sharing employer allocations of net pension liability and schedule of employer pension amounts allocated by cost sharing plan total for all entities of the column titled net pension liability, total deferred outflows or resources, total deferred inflows of resources, and total employer pension expense (specified column totals), listed as other information in the table of contents. Management’s Responsibility for the Financial Statements Management is responsible for the preparation and the fair presentation of these financial statements in accordance with accounting principles generally accepted in the United States of America; this includes the design, implementation, and maintenance of internal control relevant to the preparation and fair presentation of financial statements that are free from material misstatement, whether due to fraud or error. Auditor’s Responsibility Our responsibility is to express an opinion on these financial statements based on our audit. We conducted our audit in accordance with the auditing standards generally accepted in the United States of America and the standards applicable to financial audits contained in Government Auditing Standards, issued by the Comptroller General of the United States. Those standards require that we plan and perform the audit to obtain reasonable assurance about whether the financial statements are free of material misstatement. An audit involves performing procedures to obtain audit evidence about the amounts and disclosures in the financial statements. The procedures selected depend on the auditor’s judgment, including the assessment of the risks of material misstatement of the financial statements, whether due to fraud or error. In making those risk assessments, the auditor considers internal control relevant to VCERA’s preparation and fair presentation of the financial statements in order to design audit procedures that are appropriate in the circumstances, but not for the purpose of expressing an opinion on the effectiveness of VCERA’s internal control. Accordingly, we express no such opinion. An audit also includes evaluating the appropriateness of accounting policies used and the reasonableness of significant accounting estimates made by management, as well as evaluating the overall presentation of the basic financial statements.
MASTER PAGE NO. 686
2
We believe that the audit evidence we have obtained is sufficient and appropriate to provide a basis for our audit opinion. Opinions In our opinion, the basic financial statements referred to above present fairly, in all material respects, the fiduciary net position of VCERA as of June 30, 2015, and the changes in fiduciary net position for the year then ended, the schedule of cost sharing employer allocations of net pension liability and schedule of employer pension amounts allocated by cost sharing plan total for all entities of the column titled net pension liability, total deferred outflows or resources, total deferred inflows of resources, and total employer pension expense (specified column totals), in conformity with accounting principles generally accepted in the united states of america. Emphasis of Matter As discussed in Note 4 to the financial statements, the net pension liability of the participating employers as of June 30, 2015, was $854,540 thousands. The fiduciary net position as a percentage of the total liability as of June 30, 2015, was 83.63%. The actuarial valuations are very sensitive to the underlying actuarial assumptions, including a discount rate of 7.5%, which represents the long-term expected rate of return. Our opinion is not modified with respect to this matter. Additionally, as discussed in Note 1 to the financial statements, the financial statements include investments that are not listed on national exchanges or for which quoted market prices are not available. These investments include private equity, real estate, and alternative investments. Such investments totaled $892,742 thousands (19.9% of total assets) at June 30, 2015. When a publicly listed price is not available, the management of VCERA uses alternative sources of information including audited financial statements, unaudited interim reports, independent appraisals, and similar evidence to determine the fair value of the investments. Our opinion is not modified with respect to these matters. Other Matters Required Supplementary Information Accounting principles generally accepted in the United States of America require that the management’s discussion and analysis and the required supplemental information, as noted in the table of contents, be presented to supplement the basic financial statements. Such information, although not part of the basic financial statements, is required by the GASB, who considers it to be an essential part of financial reporting for placing the basic financial statements in an appropriate operational, economic, or historical context. We have applied certain limited procedures to the required supplementary information in accordance with auditing standards generally accepted in the United States of America, which consisted of inquiries of management about the methods of preparing the information and comparing the information for consistency with management’s responses to our inquiries, the basic financial statements, and other knowledge we obtained during our audit of the basic financial statements. We do not express an opinion or provide any assurance on the information because the limited procedures do not provide us with sufficient evidence to express an opinion or provide any assurance. Other Supplementary Information Our audit was conducted for the purpose of forming an opinion on these financial statements. The other supplementary information, the introductory, investment, actuarial, and statistical sections, as listed in the table of contents, are presented for purposes of additional analysis and are not a required part of the basic financial statements. The other supplementary information, as noted in the table of contents, is the responsibility of management and was derived from and relates directly to the underlying accounting and other records used to prepare the basic financial statements. Such information has been subjected to the auditing procedures applied in the audit of the basic financial statements and certain additional procedures, including comparing and reconciling such information directly to the underlying accounting and other
MASTER PAGE NO. 687
3
records used to prepare the basic financial statements or to the basic financial statements themselves, and other additional procedures in accordance with auditing standards generally accepted in the United States of America. In our opinion, the other supplementary information is fairly stated, in all material respects, in relation to the basic financial statements as a whole. The introductory, investment, actuarial, and statistical sections, as noted in the table of contents, have not been subjected to the auditing procedures applied in the audit of the basic financial statements and, accordingly, we do not express an opinion or provide any assurance on them. Report on Summarized Comparative Information We have previously audited VCERA’s June 30, 2014 financial statements, and our report dated December 31, 2014, expressed an unmodified opinion on those audited financial statements. In our opinion, the summarized comparative information presented herein as of and for the year ended June 30, 2014, is consistent in all material respects, with the audited financial statements from which it has been derived. Other Reporting Required by Government Auditing Standards In accordance with Government Auditing Standards, we have also issued our report dated January 27, 2016, on our consideration of VCERA’s internal control over financial reporting and on our tests of its compliance with certain provisions of laws, regulations, contracts, and other matters. The purpose of that report is to describe the scope of our testing of internal control over financial reporting and compliance and the results of that testing, and not to provide an opinion on the internal control over financial reporting or on compliance. That report is an integral part of an audit performed in accordance with Government Auditing Standards in considering VCERA’s internal control over financial reporting on compliance and should be considered in assessing the results of our audit. BROWN ARMSTRONG ACCOUNTANCY CORPORATION Bakersfield, California January 27, 2016
MASTER PAGE NO. 688
MASTER PAGE NO. 689

MASTER PAGE NO. 690
MASTER PAGE NO. 691
MASTER PAGE NO. 692
MASTER PAGE NO. 693
MASTER PAGE NO. 694
MASTER PAGE NO. 695
VENTURA COUNTY EMPLOYEES’ RETIREMENT ASSOCIATION
1190 South Victoria Avenue, Suite 200 Ventura, CA 93003-6572
(805) 339-4250 • Fax: (805) 339-4269 http://www.ventura.org/vcera
February 1, 2016 Board of Retirement Ventura County Employees’ Retirement Association 1190 South Victoria Avenue, Suite 200 Ventura, CA 93003 SUBJECT: VENTURA COUNTY EMPLOYEES’ RETIREMENT INFORMATION SYSTEM (VCERIS) PROJECT QUARTERLY REPORT FOR 4th QUARTER, 2015
Dear Board Members: Attached is the Ventura County Employees’ Retirement Information System (“VCERIS”) project Quarterly Report (Attachment A).
Project Status
As detailed in the VCERIS Quarterly Report, as of 12/31/2015, the effort to implement the system, excluding member web, was approximately 92% complete. The project is on track for the April 2016 go-live for rollout #1.
The Auditor-Controller is participating in User Acceptance Testing (UAT) as the final step in validating the active payroll interface prior to go-live. Although there are still issues that the teams are analyzing, none will delay go-live. More importantly, the teams are discussing the post-go-live issue correction process. VCERA is requesting that this process is automated, so that it is as efficient as possible. Auditor-Controller has not yet agreed to this method of correction.
VRSD has also provided the final payroll files as part of the User Acceptance Testing process. To date, there are no reported issues with their files.
Design and development of V3 completed as of the end of November. Vitech issued a User Acceptance Testing Readiness Notice on 12/31/2015, indicating the system was prepared for testing by VCERA staff. VCERA responded on 1/14/2016 with an agreement to enter into this testing phase, along with a listing of known defects that Vitech is obligated to remediate. The project team determined that these defects would not impede the UAT effort.
The second to last data conversion cycle completed as of December 31, 2016. All legacy data, with the exception of newly collected beneficiary data (as discussed at the
MASTER PAGE NO. 696
PENSION ADMINISTRATION SYSTEM (PAS) PROJECT UPDATE February 1, 2016 Page 2 of 2
November Board meeting), was successfully loaded into V3 for UAT. The final conversion will be performed at cut-over in April, prior to go-live.
As of January 25th, 2016, 22 VCERA staff members are participating in UAT. They have executed 569 tests, identifying 56 defects, 23 of which are open. Staff has identified 4 critical errors, or 7.1% of the total defects. Only one of these critical defects is still open. The project team believes that the defect rate to date is acceptable, and does not anticipate the UAT period being extended beyond the planned three months. Vitech will remediate all defects identified during UAT.
As shown in the attached quarterly report, the project’s budget remains $11.18 million. There have not been any additional change orders in the fourth quarter. No change orders are anticipated for the current quarter.
RECOMMENDATION: RECEIVE AND FILE ATTACHMENT A – VCERIS QUARTERLY REPORT FOR OCTOBER - DECEMBER 2015.
We would be pleased to respond to any questions during the Board meeting.
Sincerely,
LINDA WEBB BRIAN COLKER Retirement Administrator Linea Solutions, Inc. Attachments (1)
MASTER PAGE NO. 697

Attachment A: Ventura County Employees’ Retirement Information
System Quarterly Status Report
Reporting to: Board of Retirement Report Date: 1/20/2016 Written by: Brian Colker
Board of Retirement Ventura County Employees’ Retirement Information System (VCERIS) Report
Reporting period: October 1st, 2015 – December 31st, 2015
Current Project Plan DATA AS OF 12/31/15: Rollout 1: Active Member & Retiree Combined Rollout 2: Member Web Actual % Complete: 91.84% Actual % Complete: N/A Planned % Complete: 91.84% Planned % Complete: N/A Variance: 0% Variance: N/A Rollout Timeline, Initial: July 2012 – October 2013 Rollout Timeline, Initial: January
2015 – June 2015 Rollout Timeline, Revised: July 2012 – September 2015
Rollout Timeline, Revised: September 2015 – December 2015
Rollout Timeline, Revised: July 2012 – April 2016
Rollout timeline, Revised: April 2016 – August 2016
Initial Plan Rollout 1: Active Member Rollout 2: Retiree Rollout 3: Member Web Rollout Timeline, Initial: July 2012 – October 2013
Rollout Timeline, Initial: November 2013 – April 2015
Rollout Timeline, Initial: January 2015 – June 2015
Page 1 of 12 MASTER PAGE NO. 698
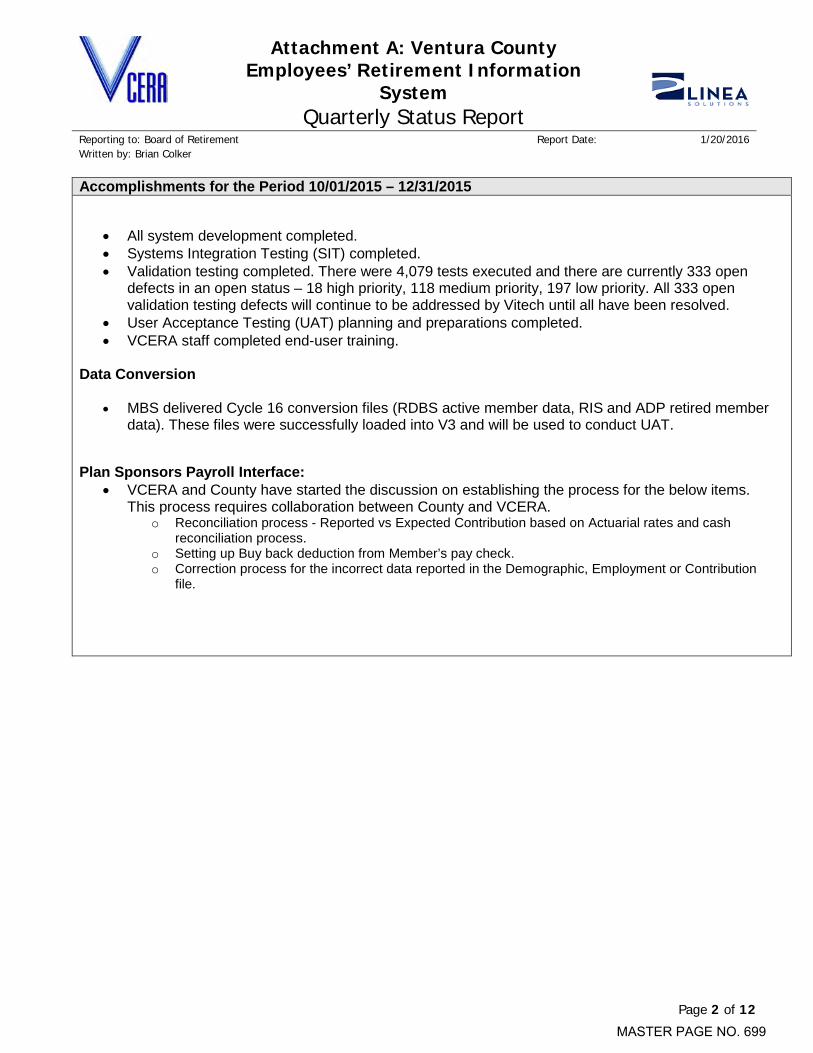
Attachment A: Ventura County Employees’ Retirement Information
System Quarterly Status Report
Reporting to: Board of Retirement Report Date: 1/20/2016 Written by: Brian Colker
Accomplishments for the Period 10/01/2015 – 12/31/2015
• All system development completed. • Systems Integration Testing (SIT) completed. • Validation testing completed. There were 4,079 tests executed and there are currently 333 open
defects in an open status – 18 high priority, 118 medium priority, 197 low priority. All 333 open validation testing defects will continue to be addressed by Vitech until all have been resolved.
• User Acceptance Testing (UAT) planning and preparations completed. • VCERA staff completed end-user training.
Data Conversion
• MBS delivered Cycle 16 conversion files (RDBS active member data, RIS and ADP retired member data). These files were successfully loaded into V3 and will be used to conduct UAT.
Plan Sponsors Payroll Interface:
• VCERA and County have started the discussion on establishing the process for the below items. This process requires collaboration between County and VCERA.
o Reconciliation process - Reported vs Expected Contribution based on Actuarial rates and cash reconciliation process.
o Setting up Buy back deduction from Member’s pay check. o Correction process for the incorrect data reported in the Demographic, Employment or Contribution
file.
Page 2 of 12 MASTER PAGE NO. 699
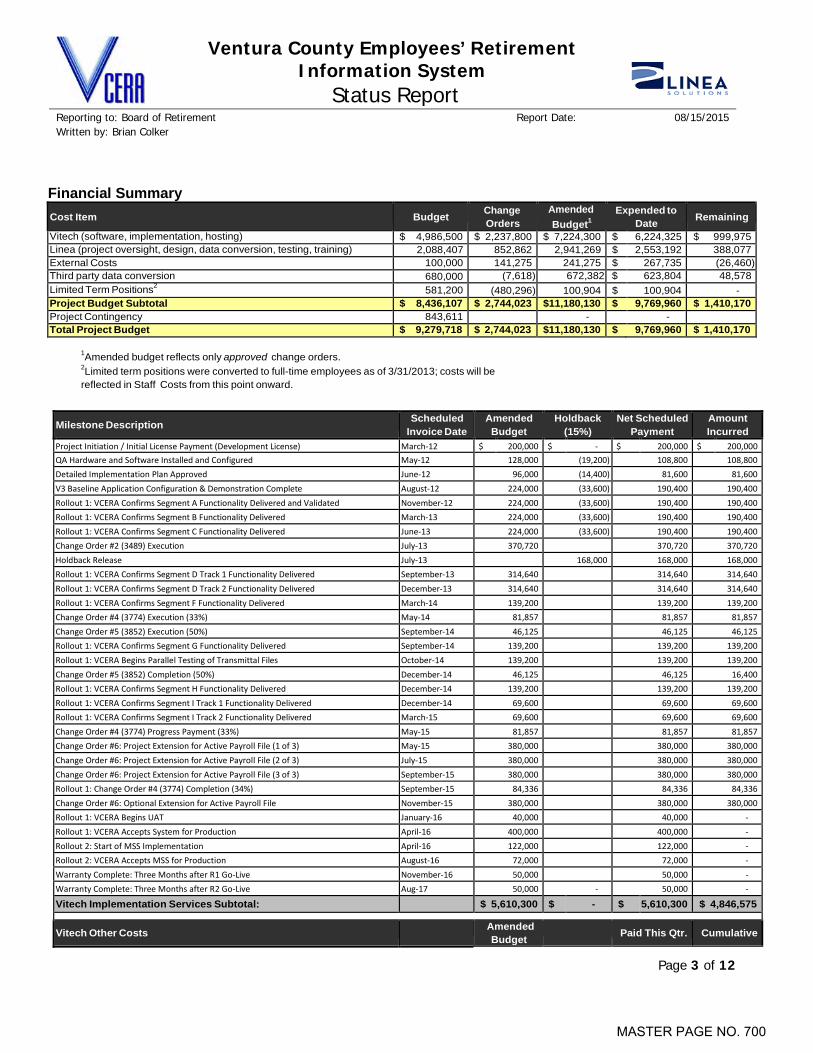
Ventura County Employees’ Retirement Information System
Status Report
Reporting to: Board of Retirement Report Date: 08/15/2015 Written by: Brian Colker
Financial Summary
Cost Item Budget Change Orders
Amended Budget1
Expended to Date Remaining
Vitech (software, implementation, hosting) $ 4,986,500 $ 2,237,800 $ 7,224,300 $ 6,224,325 $ 999,975 Linea (project oversight, design, data conversion, testing, training) 2,088,407 852,862 2,941,269 $ 2,553,192 388,077 External Costs 100,000 141,275 241,275 $ 267,735 (26,460) Third party data conversion 680,000 (7,618) 672,382 $ 623,804 48,578 Limited Term Positions2
581,200 (480,296) 100,904 $ 100,904 - Project Budget Subtotal $ 8,436,107 $ 2,744,023 $11,180,130 $ 9,769,960 $ 1,410,170 Project Contingency 843,611 - - Total Project Budget $ 9,279,718 $ 2,744,023 $11,180,130 $ 9,769,960 $ 1,410,170
1Amended budget reflects only approved change orders. 2Limited term positions were converted to full-time employees as of 3/31/2013; costs will be reflected in Staff Costs from this point onward.
Milestone Description
Scheduled Invoice Date
Amended Budget
Holdback (15%)
Net Scheduled Payment
Amount Incurred
Project Initiation / Initial License Payment (Development License) March‐12 $ 200,000 $ ‐ $ 200,000 $ 200,000 QA Hardware and Software Installed and Configured May‐12 128,000 (19,200) 108,800 108,800 Detailed Implementation Plan Approved June‐12 96,000 (14,400) 81,600 81,600 V3 Baseline Application Configuration & Demonstration Complete August‐12 224,000 (33,600) 190,400 190,400 Rollout 1: VCERA Confirms Segment A Functionality Delivered and Validated November‐12 224,000 (33,600) 190,400 190,400 Rollout 1: VCERA Confirms Segment B Functionality Delivered March‐13 224,000 (33,600) 190,400 190,400 Rollout 1: VCERA Confirms Segment C Functionality Delivered June‐13 224,000 (33,600) 190,400 190,400 Change Order #2 (3489) Execution July‐13 370,720 370,720 370,720 Holdback Release July‐13 168,000 168,000 168,000 Rollout 1: VCERA Confirms Segment D Track 1 Functionality Delivered September‐13 314,640 314,640 314,640 Rollout 1: VCERA Confirms Segment D Track 2 Functionality Delivered December‐13 314,640 314,640 314,640 Rollout 1: VCERA Confirms Segment F Functionality Delivered March‐14 139,200 139,200 139,200 Change Order #4 (3774) Execution (33%) May‐14 81,857 81,857 81,857 Change Order #5 (3852) Execution (50%) September‐14 46,125 46,125 46,125 Rollout 1: VCERA Confirms Segment G Functionality Delivered September‐14 139,200 139,200 139,200 Rollout 1: VCERA Begins Parallel Testing of Transmittal Files October‐14 139,200 139,200 139,200 Change Order #5 (3852) Completion (50%) December‐14 46,125 46,125 16,400 Rollout 1: VCERA Confirms Segment H Functionality Delivered December‐14 139,200 139,200 139,200 Rollout 1: VCERA Confirms Segment I Track 1 Functionality Delivered December‐14 69,600 69,600 69,600 Rollout 1: VCERA Confirms Segment I Track 2 Functionality Delivered March‐15 69,600 69,600 69,600 Change Order #4 (3774) Progress Payment (33%) May‐15 81,857 81,857 81,857 Change Order #6: Project Extension for Active Payroll File (1 of 3) May‐15 380,000 380,000 380,000 Change Order #6: Project Extension for Active Payroll File (2 of 3) July‐15 380,000 380,000 380,000 Change Order #6: Project Extension for Active Payroll File (3 of 3) September‐15 380,000 380,000 380,000 Rollout 1: Change Order #4 (3774) Completion (34%) September‐15 84,336 84,336 84,336 Change Order #6: Optional Extension for Active Payroll File November‐15 380,000 380,000 380,000 Rollout 1: VCERA Begins UAT January‐16 40,000 40,000 ‐ Rollout 1: VCERA Accepts System for Production April‐16 400,000 400,000 ‐ Rollout 2: Start of MSS Implementation April‐16 122,000 122,000 ‐ Rollout 2: VCERA Accepts MSS for Production August‐16 72,000 72,000 ‐ Warranty Complete: Three Months after R1 Go‐Live November‐16 50,000 50,000 ‐ Warranty Complete: Three Months after R2 Go‐Live Aug‐17 50,000 ‐ 50,000 ‐
Vitech Implementation Services Subtotal: $ 5,610,300 $ - $ 5,610,300 $ 4,846,575
Vitech Other Costs Amended
Budget Paid This Qtr. Cumulative
Page 3 of 12
MASTER PAGE NO. 700
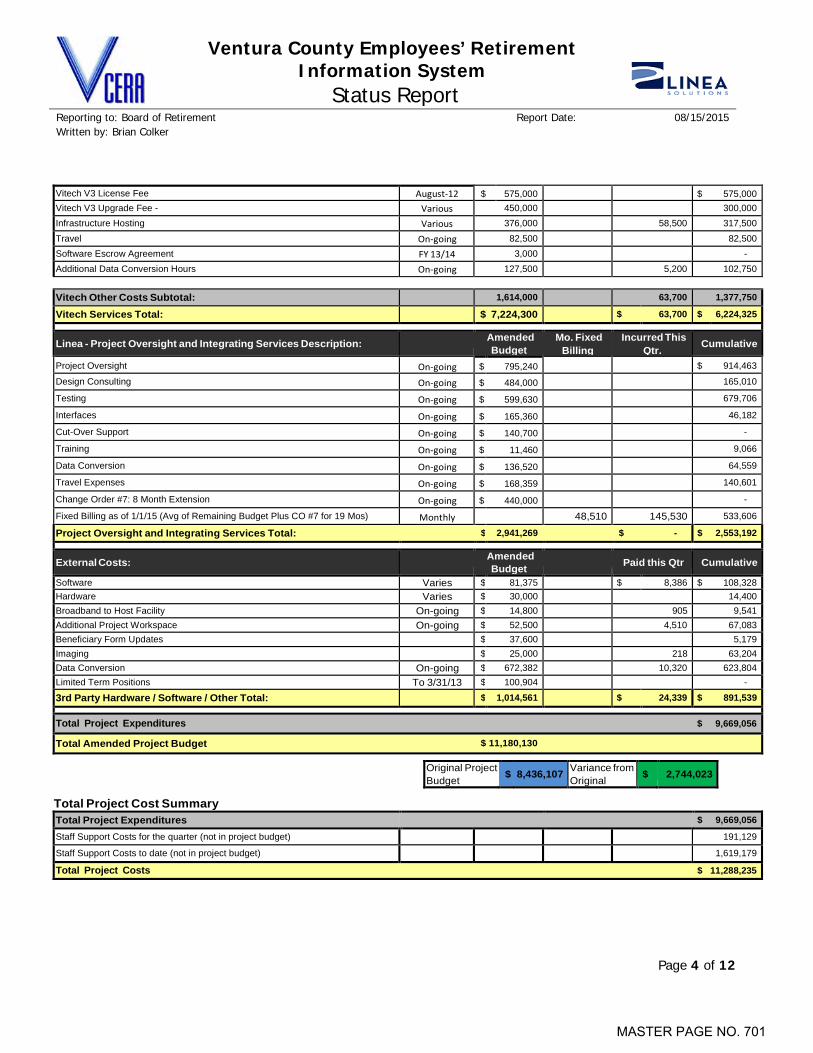
Ventura County Employees’ Retirement Information System
Status Report
Reporting to: Board of Retirement Report Date: 08/15/2015 Written by: Brian Colker
Vitech V3 License Fee August‐12 $ 575,000 $ 575,000 Vitech V3 Upgrade Fee - Various 450,000 300,000 Infrastructure Hosting Various 376,000 58,500 317,500 Travel On‐going 82,500 82,500 Software Escrow Agreement FY 13/14 3,000 - Additional Data Conversion Hours On‐going 127,500 5,200 102,750
Vitech Other Costs Subtotal: 1,614,000 63,700 1,377,750
Vitech Services Total: $ 7,224,300 $ 63,700 $ 6,224,325
Linea - Project Oversight and Integrating Services Description: Amended
Budget Mo. Fixed
Billing Incurred This
Qtr. Cumulative
Project Oversight On‐going $ 795,240 $ 914,463
Design Consulting On‐going $ 484,000 165,010
Testing On‐going $ 599,630 679,706
Interfaces On‐going $ 165,360 46,182
Cut-Over Support On‐going $ 140,700 -
Training On‐going $ 11,460 9,066
Data Conversion On‐going $ 136,520 64,559
Travel Expenses On‐going $ 168,359 140,601
Change Order #7: 8 Month Extension On‐going $ 440,000 -
Fixed Billing as of 1/1/15 (Avg of Remaining Budget Plus CO #7 for 19 Mos) Monthly 48,510 145,530 533,606
Project Oversight and Integrating Services Total: $ 2,941,269 $ - $ 2,553,192
External Costs: Amended
Budget Paid this Qtr Cumulative
Software Varies $ 81,375 $ 8,386 $ 108,328 Hardware Varies $ 30,000 14,400 Broadband to Host Facility On-going $ 14,800 905 9,541 Additional Project Workspace On-going $ 52,500 4,510 67,083 Beneficiary Form Updates $ 37,600 5,179 Imaging $ 25,000 218 63,204 Data Conversion On-going $ 672,382 10,320 623,804 Limited Term Positions To 3/31/13 $ 100,904 -
3rd Party Hardware / Software / Other Total: $ 1,014,561 $ 24,339 $ 891,539
Total Project Expenditures $ 9,669,056
Total Amended Project Budget $ 11,180,130
Original Project Budget $ 8,436,107 Variance from
Original $ 2,744,023
Total Project Cost Summary Total Project Expenditures $ 9,669,056
Staff Support Costs for the quarter (not in project budget) 191,129
Staff Support Costs to date (not in project budget) 1,619,179
Total Project Costs $ 11,288,235
Page 4 of 12
MASTER PAGE NO. 701

Ventura County Employees’ Retirement Information System
Status Report
Reporting to: Board of Retirement Report Date: 08/15/2015 Written by: Brian Colker
Change Orders This Period
N/A
Approved Change Orders (All To Date)
Cost Item Name Description Cost Impact Budget Year
Vitech
Vitech Change Order #6 – Revised Implementation Plan
Vitech submitted a change order adjusting the implementation schedule to extend the overall project by 8 months. They changed the payment milestones as part of the negotiation.
$1,580,000
FY’14-FY’15: $380,000 FY’15-FY’16: $1,200,000
Vitech
Vitech Change Order #5 – Additional Interfaces
VCERA requested four additional system interfaces to be provide by Vitech. Vitech requires an additional 600 hours to deliver these interfaces. Vitech assigned their CO #3852 for this.
$92,250 FY’14-FY’15
Vitech Vitech Change Order #4 - CalPEPRA
Vitech submitted a change order to add 1,210 hours for programming new CalPEPRA requirements. Vitech assigned their CO #3774 for this.
$248,050
FY’13-FY’14: $81,857 FY’14-FY’15: $81,857 FY’15-FY’16: $84,336
Vitech
Vitech Change Order #3 – Additional Data Conversion Hours
VCERA requested Vitech provide an additional 675 hours for data conversion activities. Vitech assigned their CO #3773 for this.
$67,500
FY’13-FY’14: $15,000 FY’14-FY’15: $45,000 FY’15-FY’16: $7,500
Page 5 of 12
MASTER PAGE NO. 702
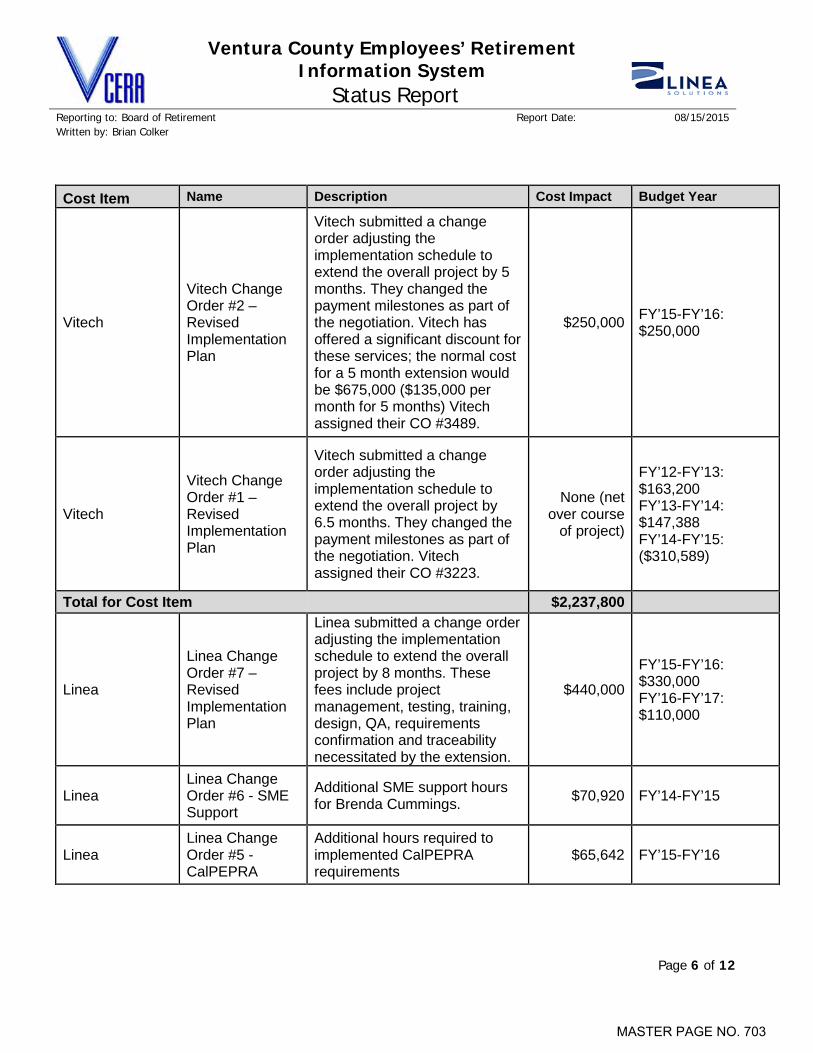
Ventura County Employees’ Retirement Information System
Status Report
Reporting to: Board of Retirement Report Date: 08/15/2015 Written by: Brian Colker
Cost Item Name Description Cost Impact Budget Year
Vitech
Vitech Change Order #2 – Revised Implementation Plan
Vitech submitted a change order adjusting the implementation schedule to extend the overall project by 5 months. They changed the payment milestones as part of the negotiation. Vitech has offered a significant discount for these services; the normal cost for a 5 month extension would be $675,000 ($135,000 per month for 5 months) Vitech assigned their CO #3489.
$250,000 FY’15-FY’16: $250,000
Vitech
Vitech Change Order #1 – Revised Implementation Plan
Vitech submitted a change order adjusting the implementation schedule to extend the overall project by 6.5 months. They changed the payment milestones as part of the negotiation. Vitech assigned their CO #3223.
None (net over course
of project)
FY’12-FY’13: $163,200 FY’13-FY’14: $147,388 FY’14-FY’15: ($310,589)
Total for Cost Item $2,237,800
Linea
Linea Change Order #7 – Revised Implementation Plan
Linea submitted a change order adjusting the implementation schedule to extend the overall project by 8 months. These fees include project management, testing, training, design, QA, requirements confirmation and traceability necessitated by the extension.
$440,000
FY’15-FY’16: $330,000 FY’16-FY’17: $110,000
Linea Linea Change Order #6 - SME Support
Additional SME support hours for Brenda Cummings. $70,920 FY’14-FY’15
Linea Linea Change Order #5 - CalPEPRA
Additional hours required to implemented CalPEPRA requirements
$65,642 FY’15-FY’16
Page 6 of 12
MASTER PAGE NO. 703
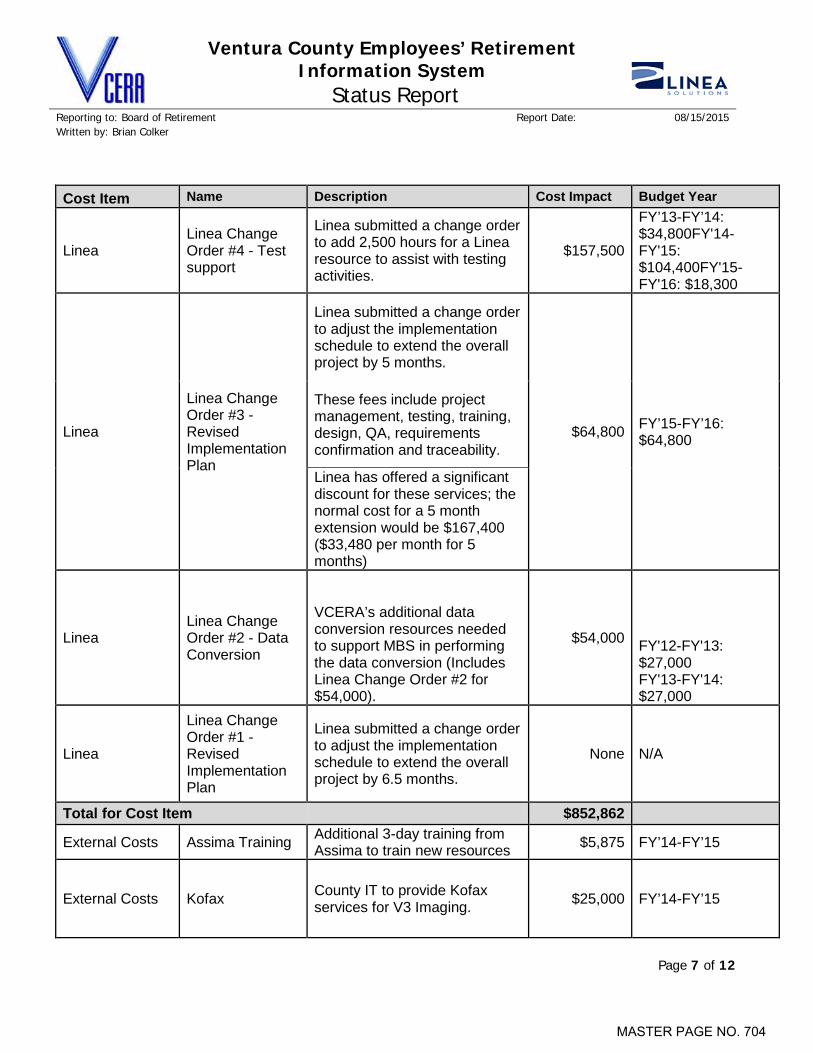
Ventura County Employees’ Retirement Information System
Status Report
Reporting to: Board of Retirement Report Date: 08/15/2015 Written by: Brian Colker
Cost Item Name Description Cost Impact Budget Year
Linea Linea Change Order #4 - Test support
Linea submitted a change order to add 2,500 hours for a Linea resource to assist with testing activities.
$157,500
FY’13-FY’14: $34,800FY'14-FY'15: $104,400FY'15-FY'16: $18,300
Linea
Linea Change Order #3 - Revised Implementation Plan
Linea submitted a change order to adjust the implementation schedule to extend the overall project by 5 months.
$64,800 FY’15-FY’16: $64,800
These fees include project management, testing, training, design, QA, requirements confirmation and traceability.
Linea has offered a significant discount for these services; the normal cost for a 5 month extension would be $167,400 ($33,480 per month for 5 months)
Linea Linea Change Order #2 - Data Conversion
VCERA’s additional data conversion resources needed to support MBS in performing the data conversion (Includes Linea Change Order #2 for $54,000).
$54,000 FY'12-FY'13: $27,000 FY'13-FY'14: $27,000
Linea
Linea Change Order #1 - Revised Implementation Plan
Linea submitted a change order to adjust the implementation schedule to extend the overall project by 6.5 months.
None N/A
Total for Cost Item $852,862
External Costs Assima Training Additional 3-day training from Assima to train new resources $5,875 FY’14-FY’15
External Costs Kofax County IT to provide Kofax services for V3 Imaging. $25,000 FY’14-FY’15
Page 7 of 12
MASTER PAGE NO. 704

Ventura County Employees’ Retirement Information System
Status Report
Reporting to: Board of Retirement Report Date: 08/15/2015 Written by: Brian Colker
Cost Item Name Description Cost Impact Budget Year
External Costs Additional project workspace
The project team has determined that there is considerable advantage to in-person meetings.
$49,500
FY’12-FY’13: $13,500 FY'13-FY'14: $18,000 FY'14-FY'15: $18,000
External Costs Increased cost of Broadband to Host Facility
The secure point-to-point connection from VCERA to Vitech’s hosting facility is considerably more expensive than anticipated.
$68,100
FY’13-FY’14: $3,300 FY'14-FY'15: $32,400 FY'15-FY'16: $32,400
External Costs Additional Project Software
This change covers the purchase of the Assima training tool.
$43,900
FY’12-FY’13: $22,900 FY'13-FY'14: $7,000 FY'14-FY'15: $7,000 FY'15-FY'16: $7,000
External Costs County providing Broadband
County ITS was able to provide a secure broadband connection to Vitech’s hosting facility, considerably decreasing the required cost for this service.
($101,300)
FY'12-FY'13: $(7000)FY'13-FY'14: $(31,100)FY'14-FY'15: $(31,100)FY'15-FY'16: $(31,100)
External Costs Construction costs for project office space
The additional leased office space on the first floor needs to be modified in order to accommodate the increase in Vitech and Linea resources that will be moving into the space after the first of the year.
$3,000 FY’13-FY’14: $3,000
External Costs Additional Assima License
This license will be needed to create training scripts for UAT testing. VCERA currently does not have enough licenses for the SMEs for this purpose.
$9,600 FY’14-FY’15: $9,600
Page 8 of 12
MASTER PAGE NO. 705
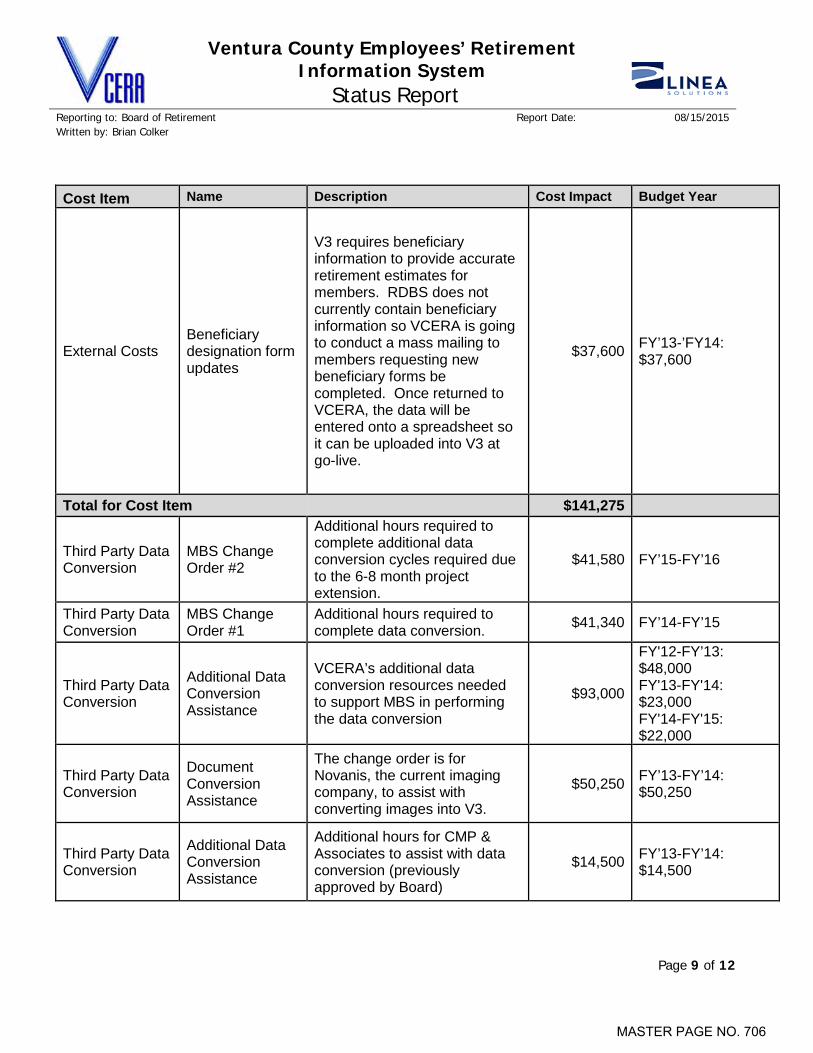
Ventura County Employees’ Retirement Information System
Status Report
Reporting to: Board of Retirement Report Date: 08/15/2015 Written by: Brian Colker
Cost Item Name Description Cost Impact Budget Year
External Costs Beneficiary designation form updates
V3 requires beneficiary information to provide accurate retirement estimates for members. RDBS does not currently contain beneficiary information so VCERA is going to conduct a mass mailing to members requesting new beneficiary forms be completed. Once returned to VCERA, the data will be entered onto a spreadsheet so it can be uploaded into V3 at go-live.
$37,600 FY’13-’FY14: $37,600
Total for Cost Item $141,275
Third Party Data Conversion
MBS Change Order #2
Additional hours required to complete additional data conversion cycles required due to the 6-8 month project extension.
$41,580 FY’15-FY’16
Third Party Data Conversion
MBS Change Order #1
Additional hours required to complete data conversion. $41,340 FY’14-FY’15
Third Party Data Conversion
Additional Data Conversion Assistance
VCERA’s additional data conversion resources needed to support MBS in performing the data conversion
$93,000
FY'12-FY’13: $48,000 FY'13-FY'14: $23,000 FY'14-FY'15: $22,000
Third Party Data Conversion
Document Conversion Assistance
The change order is for Novanis, the current imaging company, to assist with converting images into V3.
$50,250 FY’13-FY’14: $50,250
Third Party Data Conversion
Additional Data Conversion Assistance
Additional hours for CMP & Associates to assist with data conversion (previously approved by Board)
$14,500 FY’13-FY’14: $14,500
Page 9 of 12
MASTER PAGE NO. 706
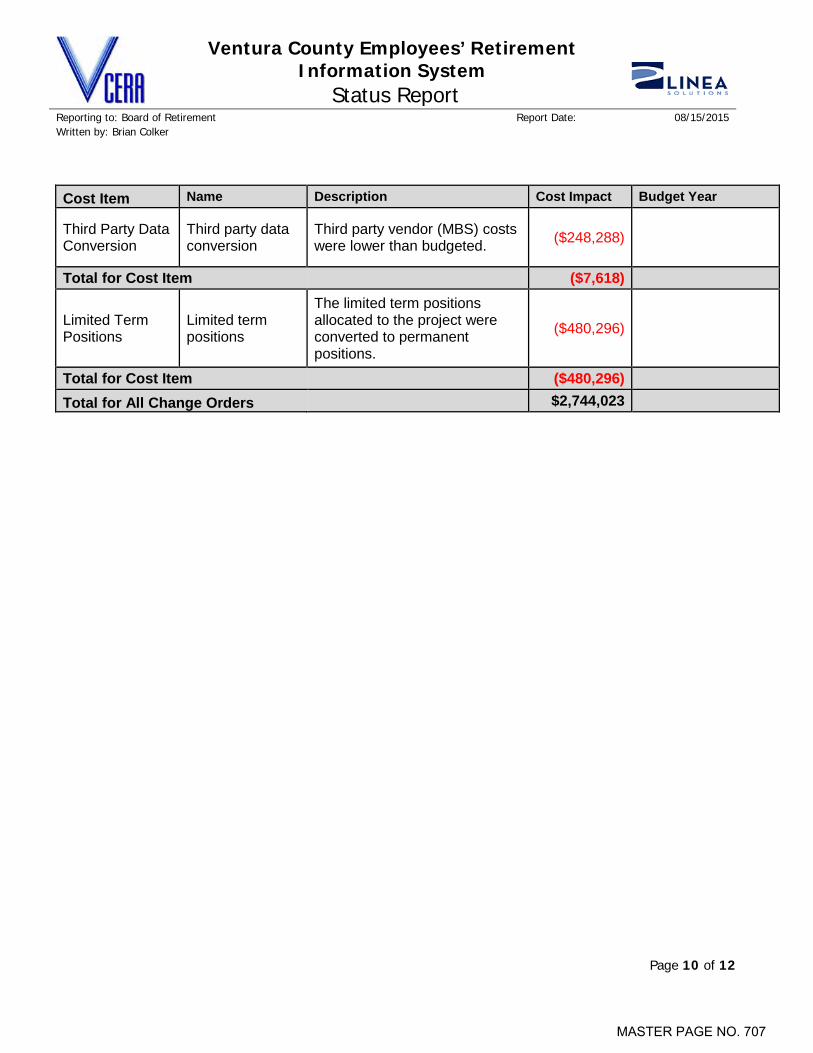
Ventura County Employees’ Retirement Information System
Status Report
Reporting to: Board of Retirement Report Date: 08/15/2015 Written by: Brian Colker
Cost Item Name Description Cost Impact Budget Year
Third Party Data Conversion
Third party data conversion
Third party vendor (MBS) costs were lower than budgeted. ($248,288)
Total for Cost Item ($7,618)
Limited Term Positions
Limited term positions
The limited term positions allocated to the project were converted to permanent positions.
($480,296)
Total for Cost Item ($480,296) Total for All Change Orders $2,744,023
Page 10 of 12
MASTER PAGE NO. 707
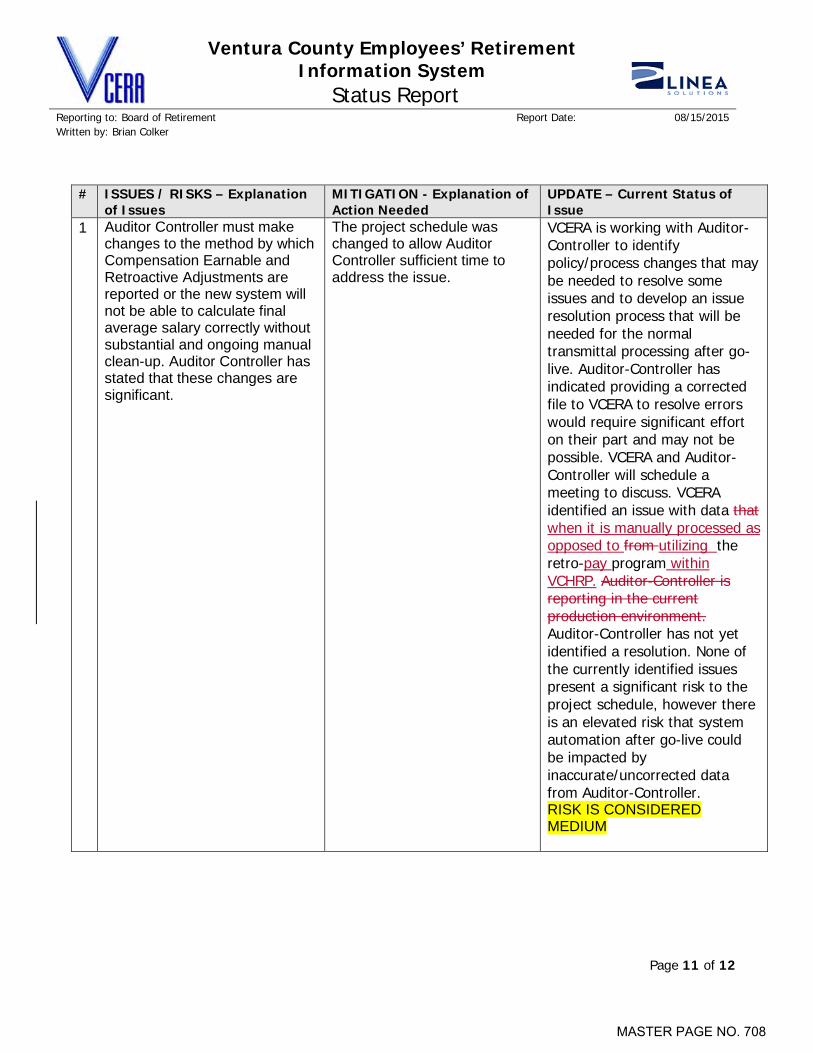
Ventura County Employees’ Retirement Information System
Status Report
Reporting to: Board of Retirement Report Date: 08/15/2015 Written by: Brian Colker
# ISSUES / RISKS – Explanation
of Issues MITIGATION - Explanation of Action Needed
UPDATE – Current Status of Issue
1 Auditor Controller must make changes to the method by which Compensation Earnable and Retroactive Adjustments are reported or the new system will not be able to calculate final average salary correctly without substantial and ongoing manual clean-up. Auditor Controller has stated that these changes are significant.
The project schedule was changed to allow Auditor Controller sufficient time to address the issue.
VCERA is working with Auditor-Controller to identify policy/process changes that may be needed to resolve some issues and to develop an issue resolution process that will be needed for the normal transmittal processing after go-live. Auditor-Controller has indicated providing a corrected file to VCERA to resolve errors would require significant effort on their part and may not be possible. VCERA and Auditor-Controller will schedule a meeting to discuss. VCERA identified an issue with data that when it is manually processed as opposed to from utilizing the retro-pay program within VCHRP. Auditor-Controller is reporting in the current production environment. Auditor-Controller has not yet identified a resolution. None of the currently identified issues present a significant risk to the project schedule, however there is an elevated risk that system automation after go-live could be impacted by inaccurate/uncorrected data from Auditor-Controller. RISK IS CONSIDERED MEDIUM
Page 11 of 12
MASTER PAGE NO. 708
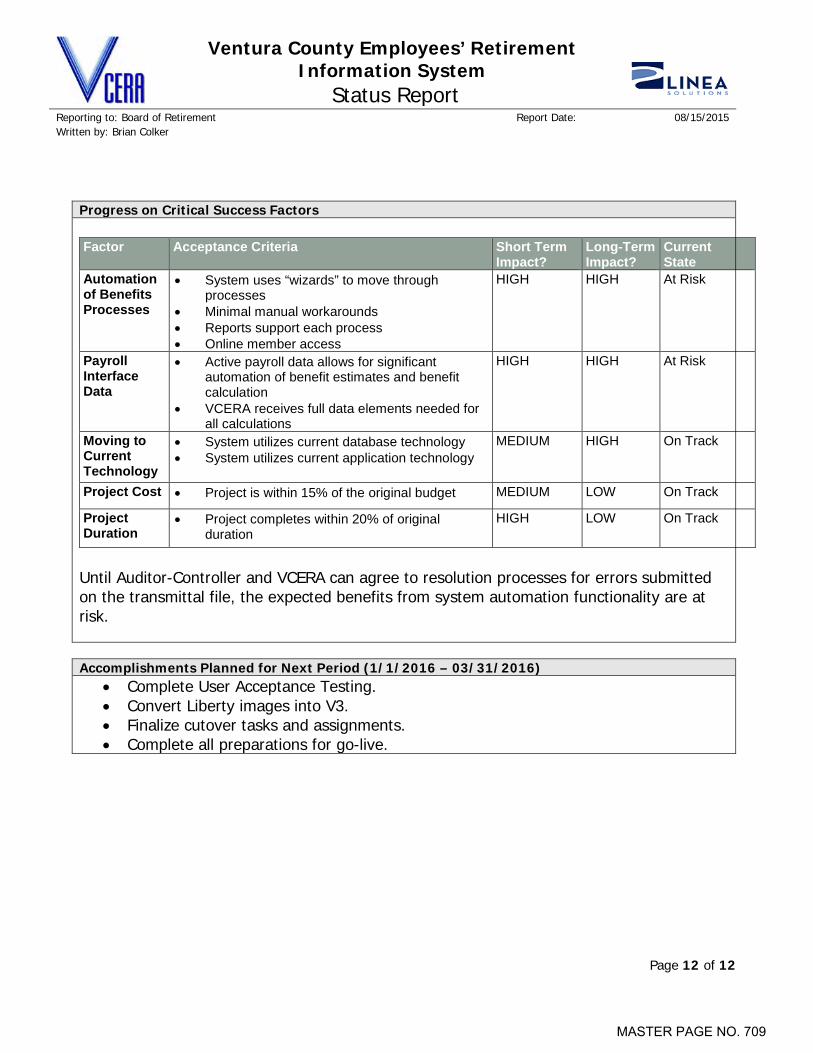
Ventura County Employees’ Retirement Information System
Status Report
Reporting to: Board of Retirement Report Date: 08/15/2015 Written by: Brian Colker
Progress on Critical Success Factors Factor Acceptance Criteria Short Term
Impact? Long-Term Impact?
Current State
Automation of Benefits Processes
• System uses “wizards” to move through processes
• Minimal manual workarounds • Reports support each process • Online member access
HIGH HIGH At Risk
Payroll Interface Data
• Active payroll data allows for significant automation of benefit estimates and benefit calculation
• VCERA receives full data elements needed for all calculations
HIGH HIGH At Risk
Moving to Current Technology
• System utilizes current database technology • System utilizes current application technology
MEDIUM HIGH On Track
Project Cost • Project is within 15% of the original budget MEDIUM LOW On Track
Project Duration
• Project completes within 20% of original duration
HIGH LOW On Track
Until Auditor-Controller and VCERA can agree to resolution processes for errors submitted on the transmittal file, the expected benefits from system automation functionality are at risk.
Accomplishments Planned for Next Period (1/1/2016 – 03/31/2016)
• Complete User Acceptance Testing. • Convert Liberty images into V3. • Finalize cutover tasks and assignments. • Complete all preparations for go-live.
Page 12 of 12
MASTER PAGE NO. 709
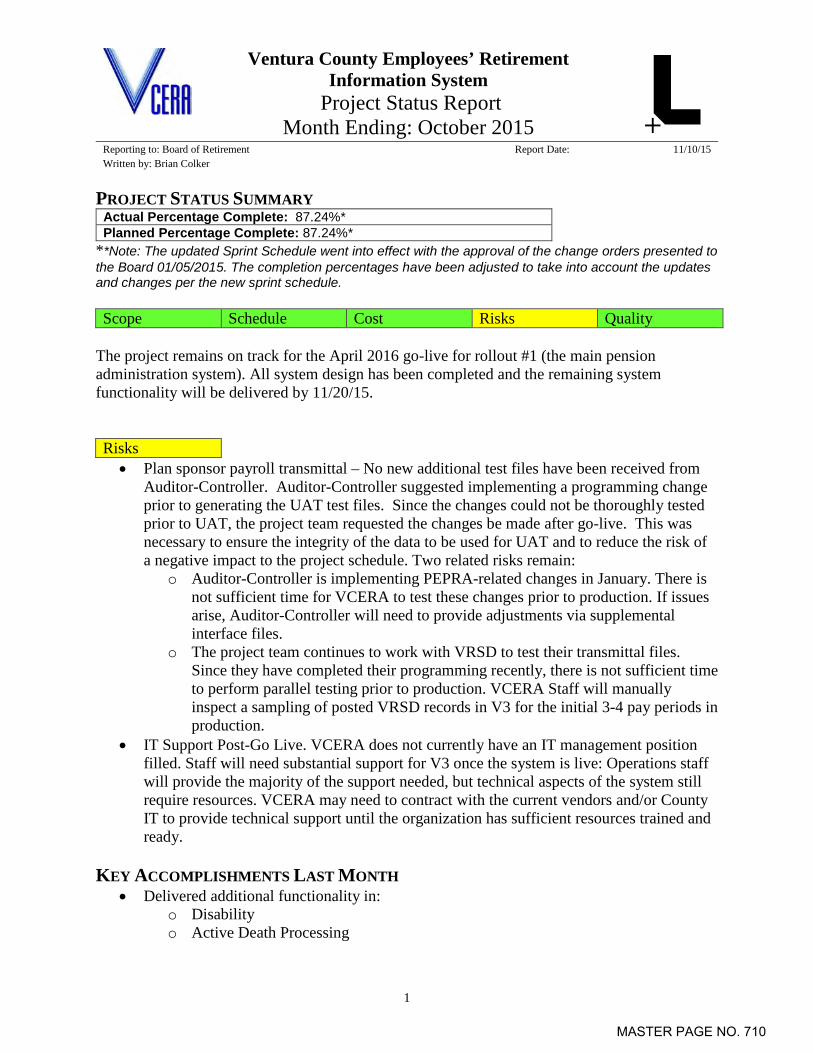
Ventura County Employees’ Retirement Information System
Project Status Report Month Ending: October 2015
Reporting to: Board of Retirement Report Date: 11/10/15 Written by: Brian Colker
PROJECT STATUS SUMMARY
Actual Percentage Complete: 87.24%* Planned Percentage Complete: 87.24%*
**Note: The updated Sprint Schedule went into effect with the approval of the change orders presented to the Board 01/05/2015. The completion percentages have been adjusted to take into account the updates and changes per the new sprint schedule. Scope Schedule Cost Risks Quality
The project remains on track for the April 2016 go-live for rollout #1 (the main pension administration system). All system design has been completed and the remaining system functionality will be delivered by 11/20/15. Risks • Plan sponsor payroll transmittal – No new additional test files have been received from
Auditor-Controller. Auditor-Controller suggested implementing a programming change prior to generating the UAT test files. Since the changes could not be thoroughly tested prior to UAT, the project team requested the changes be made after go-live. This was necessary to ensure the integrity of the data to be used for UAT and to reduce the risk of a negative impact to the project schedule. Two related risks remain:
o Auditor-Controller is implementing PEPRA-related changes in January. There is not sufficient time for VCERA to test these changes prior to production. If issues arise, Auditor-Controller will need to provide adjustments via supplemental interface files.
o The project team continues to work with VRSD to test their transmittal files. Since they have completed their programming recently, there is not sufficient time to perform parallel testing prior to production. VCERA Staff will manually inspect a sampling of posted VRSD records in V3 for the initial 3-4 pay periods in production.
• IT Support Post-Go Live. VCERA does not currently have an IT management position filled. Staff will need substantial support for V3 once the system is live: Operations staff will provide the majority of the support needed, but technical aspects of the system still require resources. VCERA may need to contract with the current vendors and/or County IT to provide technical support until the organization has sufficient resources trained and ready.
KEY ACCOMPLISHMENTS LAST MONTH
• Delivered additional functionality in: o Disability o Active Death Processing
1
MASTER PAGE NO. 710
Ventura County Employees’ Retirement Information System
Project Status Report Month Ending: October 2015
Reporting to: Board of Retirement Report Date: 11/10/15 Written by: Brian Colker
o Retired Death Processing o DRO Processing – Alt Payee o Member Correspondence
• Executed 236 tests. There have been 3,984 tests executed to date and there are currently 433 defects in an open status – 67 high priority, 156 medium priority, 210 low priority. Vitech and VCERA are working together to identify and resolve material defects prior to 11/20/15, the date of the system freeze prior to User Acceptance Testing (UAT). Staff remains confident that the system will be ready for UAT, which is scheduled to begin in early January.
2
MASTER PAGE NO. 711
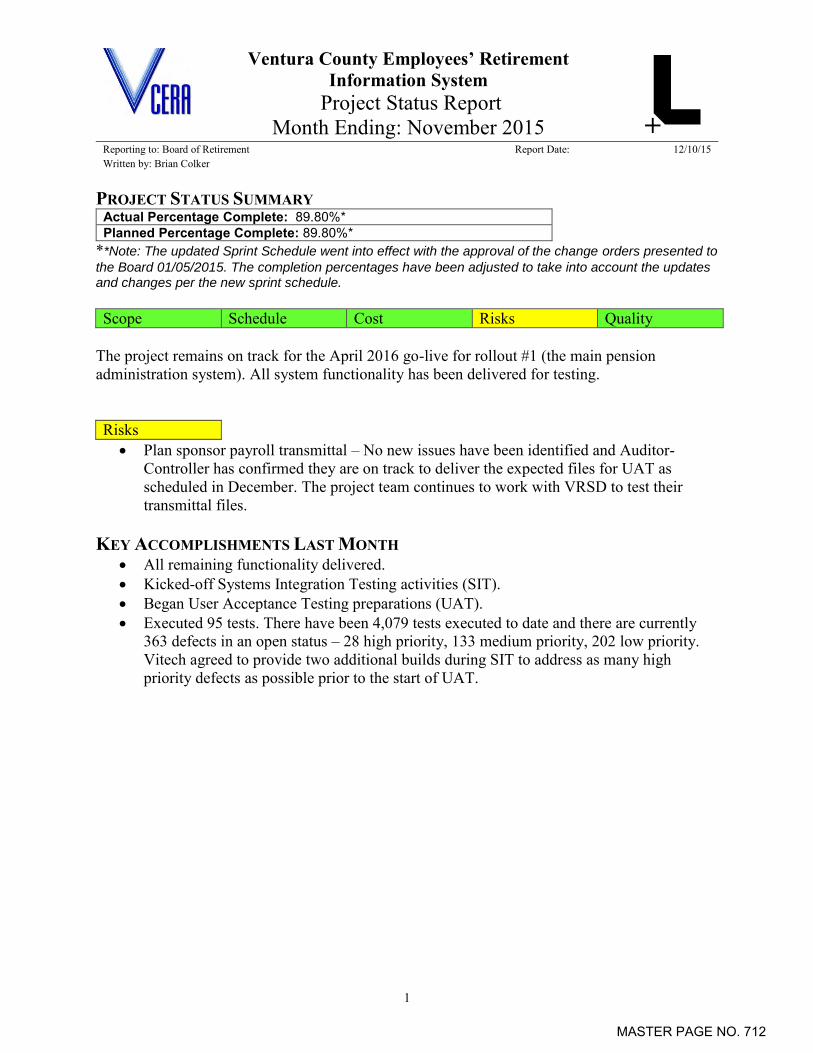
Ventura County Employees’ Retirement Information System
Project Status Report Month Ending: November 2015
Reporting to: Board of Retirement Report Date: 12/10/15 Written by: Brian Colker
1
PROJECT STATUS SUMMARY Actual Percentage Complete: 89.80%* Planned Percentage Complete: 89.80%*
**Note: The updated Sprint Schedule went into effect with the approval of the change orders presented to
the Board 01/05/2015. The completion percentages have been adjusted to take into account the updates and changes per the new sprint schedule. Scope Schedule Cost Risks Quality
The project remains on track for the April 2016 go-live for rollout #1 (the main pension administration system). All system functionality has been delivered for testing. Risks Plan sponsor payroll transmittal – No new issues have been identified and Auditor-
Controller has confirmed they are on track to deliver the expected files for UAT as scheduled in December. The project team continues to work with VRSD to test their transmittal files.
KEY ACCOMPLISHMENTS LAST MONTH
All remaining functionality delivered. Kicked-off Systems Integration Testing activities (SIT). Began User Acceptance Testing preparations (UAT). Executed 95 tests. There have been 4,079 tests executed to date and there are currently
363 defects in an open status – 28 high priority, 133 medium priority, 202 low priority. Vitech agreed to provide two additional builds during SIT to address as many high priority defects as possible prior to the start of UAT.
MASTER PAGE NO. 712
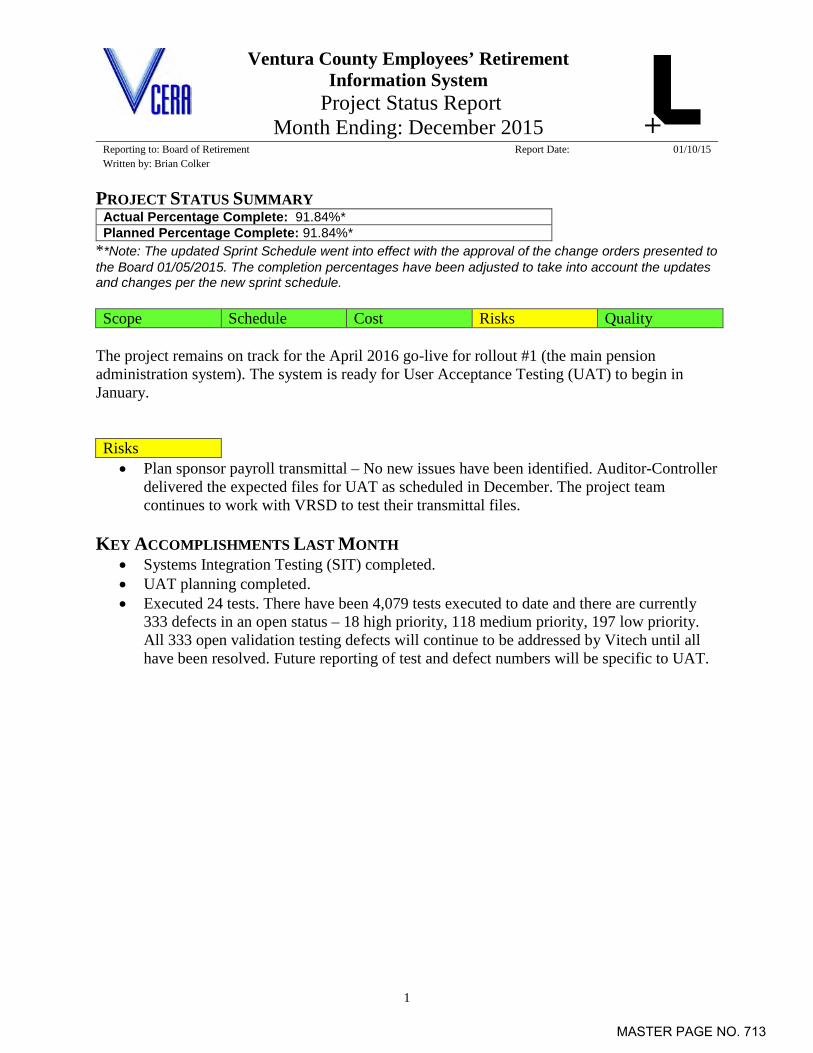
Ventura County Employees’ Retirement Information System
Project Status Report Month Ending: December 2015
Reporting to: Board of Retirement Report Date: 01/10/15 Written by: Brian Colker
PROJECT STATUS SUMMARY
Actual Percentage Complete: 91.84%* Planned Percentage Complete: 91.84%*
**Note: The updated Sprint Schedule went into effect with the approval of the change orders presented to the Board 01/05/2015. The completion percentages have been adjusted to take into account the updates and changes per the new sprint schedule. Scope Schedule Cost Risks Quality
The project remains on track for the April 2016 go-live for rollout #1 (the main pension administration system). The system is ready for User Acceptance Testing (UAT) to begin in January. Risks • Plan sponsor payroll transmittal – No new issues have been identified. Auditor-Controller
delivered the expected files for UAT as scheduled in December. The project team continues to work with VRSD to test their transmittal files.
KEY ACCOMPLISHMENTS LAST MONTH
• Systems Integration Testing (SIT) completed. • UAT planning completed. • Executed 24 tests. There have been 4,079 tests executed to date and there are currently
333 defects in an open status – 18 high priority, 118 medium priority, 197 low priority. All 333 open validation testing defects will continue to be addressed by Vitech until all have been resolved. Future reporting of test and defect numbers will be specific to UAT.
1
MASTER PAGE NO. 713
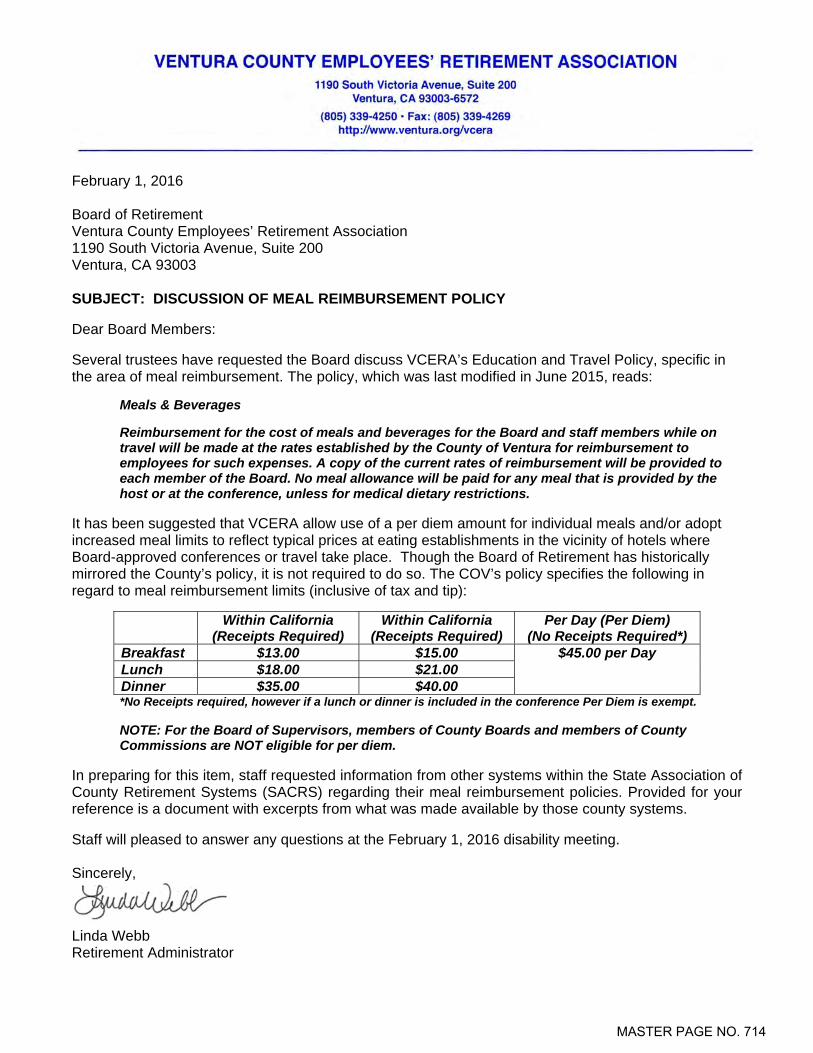
February 1, 2016 Board of Retirement Ventura County Employees’ Retirement Association 1190 South Victoria Avenue, Suite 200 Ventura, CA 93003 SUBJECT: DISCUSSION OF MEAL REIMBURSEMENT POLICY Dear Board Members: Several trustees have requested the Board discuss VCERA’s Education and Travel Policy, specific in the area of meal reimbursement. The policy, which was last modified in June 2015, reads:
Meals & Beverages
Reimbursement for the cost of meals and beverages for the Board and staff members while on travel will be made at the rates established by the County of Ventura for reimbursement to employees for such expenses. A copy of the current rates of reimbursement will be provided to each member of the Board. No meal allowance will be paid for any meal that is provided by the host or at the conference, unless for medical dietary restrictions.
It has been suggested that VCERA allow use of a per diem amount for individual meals and/or adopt increased meal limits to reflect typical prices at eating establishments in the vicinity of hotels where Board-approved conferences or travel take place. Though the Board of Retirement has historically mirrored the County’s policy, it is not required to do so. The COV’s policy specifies the following in regard to meal reimbursement limits (inclusive of tax and tip):
Within California (Receipts Required)
Within California (Receipts Required)
Per Day (Per Diem) (No Receipts Required*)
Breakfast $13.00 $15.00 $45.00 per Day Lunch $18.00 $21.00 Dinner $35.00 $40.00 *No Receipts required, however if a lunch or dinner is included in the conference Per Diem is exempt. NOTE: For the Board of Supervisors, members of County Boards and members of County Commissions are NOT eligible for per diem.
In preparing for this item, staff requested information from other systems within the State Association of County Retirement Systems (SACRS) regarding their meal reimbursement policies. Provided for your reference is a document with excerpts from what was made available by those county systems. Staff will pleased to answer any questions at the February 1, 2016 disability meeting. Sincerely,
Linda Webb Retirement Administrator
MASTER PAGE NO. 714

SACRS Systems’ Travel Policy Excerpts
ACERA Alameda County Employees’ Retirement Association
ACERA will reimburse for meals during business‐related travel (as distinguished from local business meals covered below in Section VII) at a rate not to exceed $100 per person, per day; however, receipts for all meals are required. As a general rule, travelers are expected to incur no additional cost for meals while attending conferences, workshops, etc. Dietary restrictions may affect the cost of a meal or meal availability or incur additional costs above the covered rate; consequently, if any of these is the case, the traveler may be reimbursed for the meal(s).
CCCERA Contra Costa County Employees’ Retirement Association
C. Meals
1. Actual and reasonable expenses for meals will be reimbursed while in travel status, not to exceed $100.00 per day, excluding taxes, tips and service charges.
2. Tips to a maximum of 20% are reimbursable. 3. No claims will be reimbursed for alcoholic beverages. 4. It is expected that CCCERA employees will not seek reimbursement for meals purchased in lieu of meals
provided by a conference unless medical dietary restrictions apply, subject to any existing MOUs applicable to a particular employee.
FCERA Fresno County Employees’ Retirement Association
7. Travelers will be reimbursed for the cost of meals at a flat rate in accordance with the current fiscal year U.S.
General Services Administration Per Diem Rates. Receipts shall not be required for per diem reimbursement.
8. Reimbursement for less than three meals per day will be at a flat rate, in accordance with the Per Diem Rate
Shown in the table below.
Meal Travel begins on
or before Travel ends on
or before
Portion of Per Diem traveler is entitled
to receive
Breakfast 6:00 a.m. 8:00 a.m. 20% Lunch 11:00 a.m. 1:00 p.m. 25% Dinner 5:00 p.m. 7:00 p.m. 55%
MAXIMUM TOTAL DAILY ALLOWANCE 100%
MASTER PAGE NO. 715
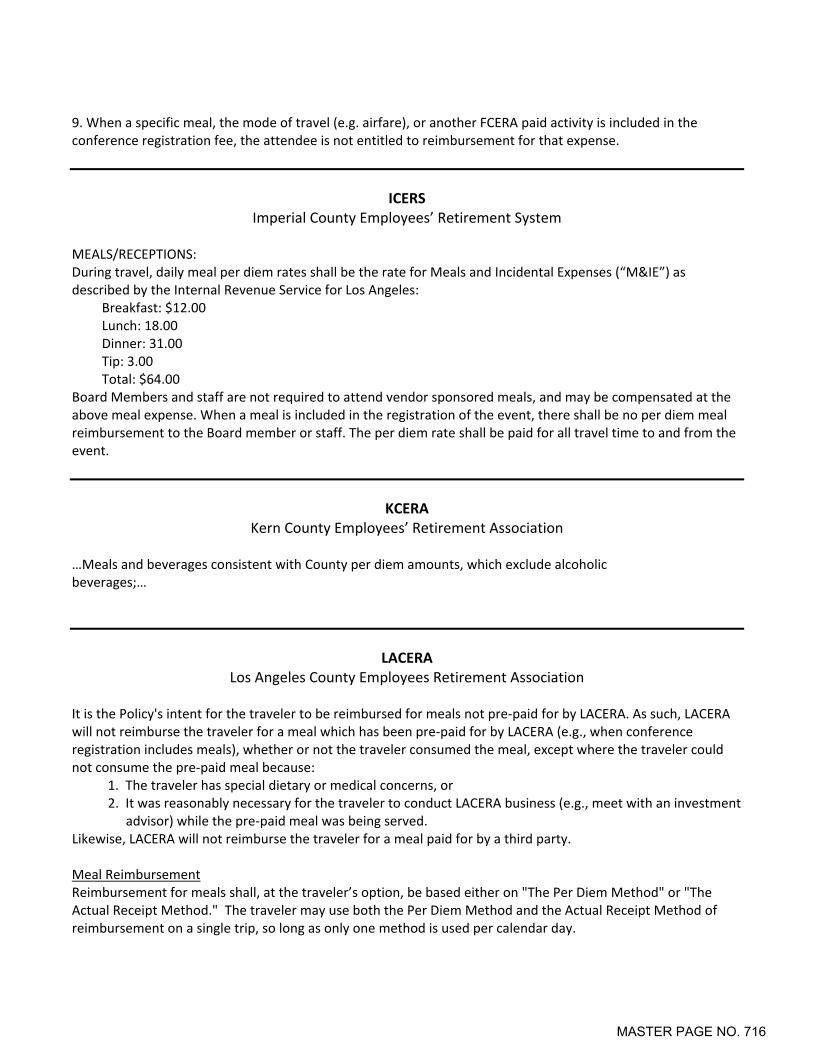
9. When a specific meal, the mode of travel (e.g. airfare), or another FCERA paid activity is included in the conference registration fee, the attendee is not entitled to reimbursement for that expense.
ICERS Imperial County Employees’ Retirement System
MEALS/RECEPTIONS: During travel, daily meal per diem rates shall be the rate for Meals and Incidental Expenses (“M&IE”) as described by the Internal Revenue Service for Los Angeles:
Breakfast: $12.00 Lunch: 18.00 Dinner: 31.00 Tip: 3.00 Total: $64.00
Board Members and staff are not required to attend vendor sponsored meals, and may be compensated at the above meal expense. When a meal is included in the registration of the event, there shall be no per diem meal reimbursement to the Board member or staff. The per diem rate shall be paid for all travel time to and from the event.
KCERA Kern County Employees’ Retirement Association
…Meals and beverages consistent with County per diem amounts, which exclude alcoholic beverages;…
LACERA Los Angeles County Employees Retirement Association
It is the Policy's intent for the traveler to be reimbursed for meals not pre‐paid for by LACERA. As such, LACERA will not reimburse the traveler for a meal which has been pre‐paid for by LACERA (e.g., when conference registration includes meals), whether or not the traveler consumed the meal, except where the traveler could not consume the pre‐paid meal because:
1. The traveler has special dietary or medical concerns, or 2. It was reasonably necessary for the traveler to conduct LACERA business (e.g., meet with an investment
advisor) while the pre‐paid meal was being served. Likewise, LACERA will not reimburse the traveler for a meal paid for by a third party. Meal Reimbursement Reimbursement for meals shall, at the traveler’s option, be based either on "The Per Diem Method" or "The Actual Receipt Method." The traveler may use both the Per Diem Method and the Actual Receipt Method of reimbursement on a single trip, so long as only one method is used per calendar day.
MASTER PAGE NO. 716
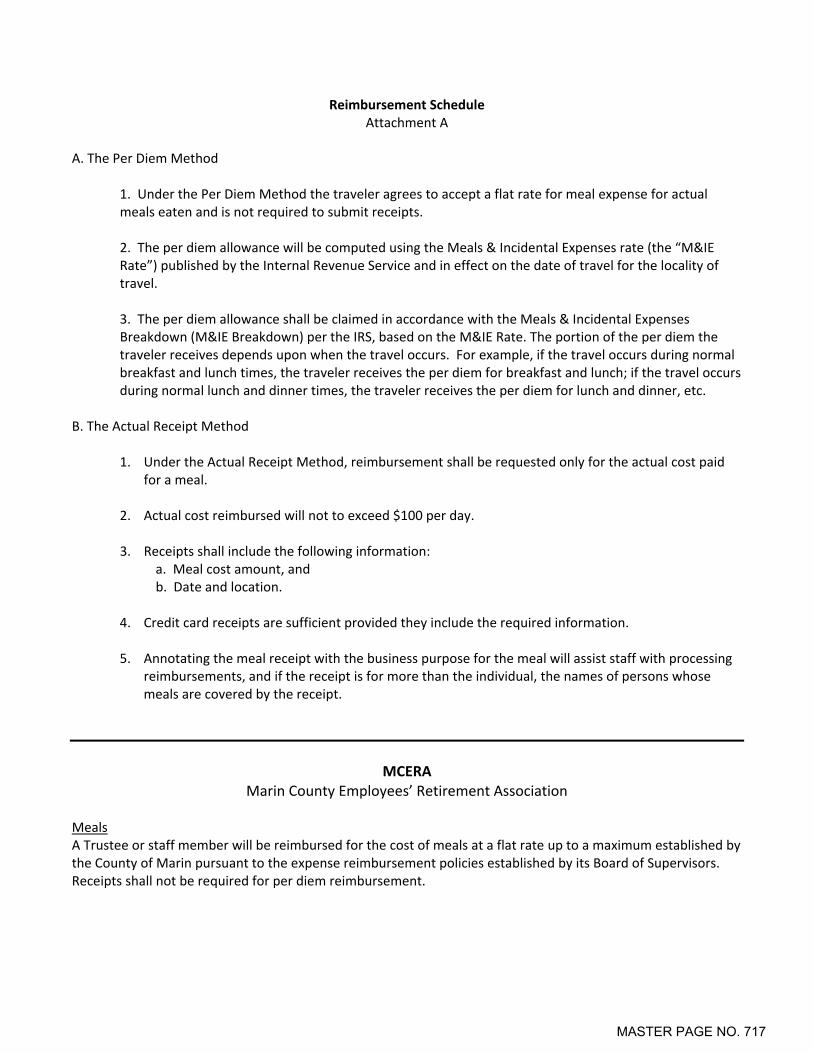
Reimbursement Schedule Attachment A
A. The Per Diem Method
1. Under the Per Diem Method the traveler agrees to accept a flat rate for meal expense for actual meals eaten and is not required to submit receipts. 2. The per diem allowance will be computed using the Meals & Incidental Expenses rate (the “M&IE Rate”) published by the Internal Revenue Service and in effect on the date of travel for the locality of travel. 3. The per diem allowance shall be claimed in accordance with the Meals & Incidental Expenses Breakdown (M&IE Breakdown) per the IRS, based on the M&IE Rate. The portion of the per diem the traveler receives depends upon when the travel occurs. For example, if the travel occurs during normal breakfast and lunch times, the traveler receives the per diem for breakfast and lunch; if the travel occurs during normal lunch and dinner times, the traveler receives the per diem for lunch and dinner, etc.
B. The Actual Receipt Method
1. Under the Actual Receipt Method, reimbursement shall be requested only for the actual cost paid for a meal.
2. Actual cost reimbursed will not to exceed $100 per day. 3. Receipts shall include the following information:
a. Meal cost amount, and b. Date and location.
4. Credit card receipts are sufficient provided they include the required information. 5. Annotating the meal receipt with the business purpose for the meal will assist staff with processing
reimbursements, and if the receipt is for more than the individual, the names of persons whose meals are covered by the receipt.
MCERA
Marin County Employees’ Retirement Association Meals A Trustee or staff member will be reimbursed for the cost of meals at a flat rate up to a maximum established by the County of Marin pursuant to the expense reimbursement policies established by its Board of Supervisors. Receipts shall not be required for per diem reimbursement.
MASTER PAGE NO. 717
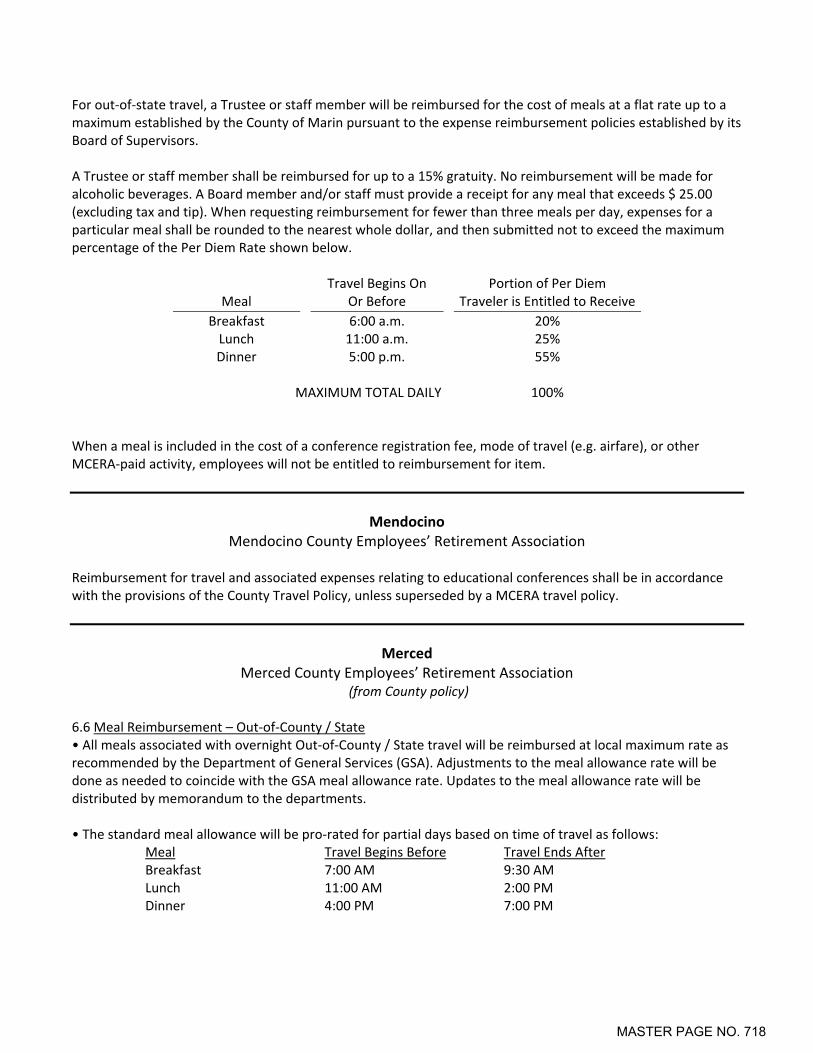
For out‐of‐state travel, a Trustee or staff member will be reimbursed for the cost of meals at a flat rate up to a maximum established by the County of Marin pursuant to the expense reimbursement policies established by its Board of Supervisors. A Trustee or staff member shall be reimbursed for up to a 15% gratuity. No reimbursement will be made for alcoholic beverages. A Board member and/or staff must provide a receipt for any meal that exceeds $ 25.00 (excluding tax and tip). When requesting reimbursement for fewer than three meals per day, expenses for a particular meal shall be rounded to the nearest whole dollar, and then submitted not to exceed the maximum percentage of the Per Diem Rate shown below.
Meal Travel Begins On
Or Before Portion of Per Diem
Traveler is Entitled to Receive
Breakfast 6:00 a.m. 20% Lunch 11:00 a.m. 25% Dinner 5:00 p.m. 55%
MAXIMUM TOTAL DAILY 100%
When a meal is included in the cost of a conference registration fee, mode of travel (e.g. airfare), or other MCERA‐paid activity, employees will not be entitled to reimbursement for item.
Mendocino Mendocino County Employees’ Retirement Association
Reimbursement for travel and associated expenses relating to educational conferences shall be in accordance with the provisions of the County Travel Policy, unless superseded by a MCERA travel policy.
Merced Merced County Employees’ Retirement Association
(from County policy) 6.6 Meal Reimbursement – Out‐of‐County / State • All meals associated with overnight Out‐of‐County / State travel will be reimbursed at local maximum rate as recommended by the Department of General Services (GSA). Adjustments to the meal allowance rate will be done as needed to coincide with the GSA meal allowance rate. Updates to the meal allowance rate will be distributed by memorandum to the departments. • The standard meal allowance will be pro‐rated for partial days based on time of travel as follows:
Meal Travel Begins Before Travel Ends After Breakfast 7:00 AM 9:30 AM Lunch 11:00 AM 2:00 PM Dinner 4:00 PM 7:00 PM
MASTER PAGE NO. 718
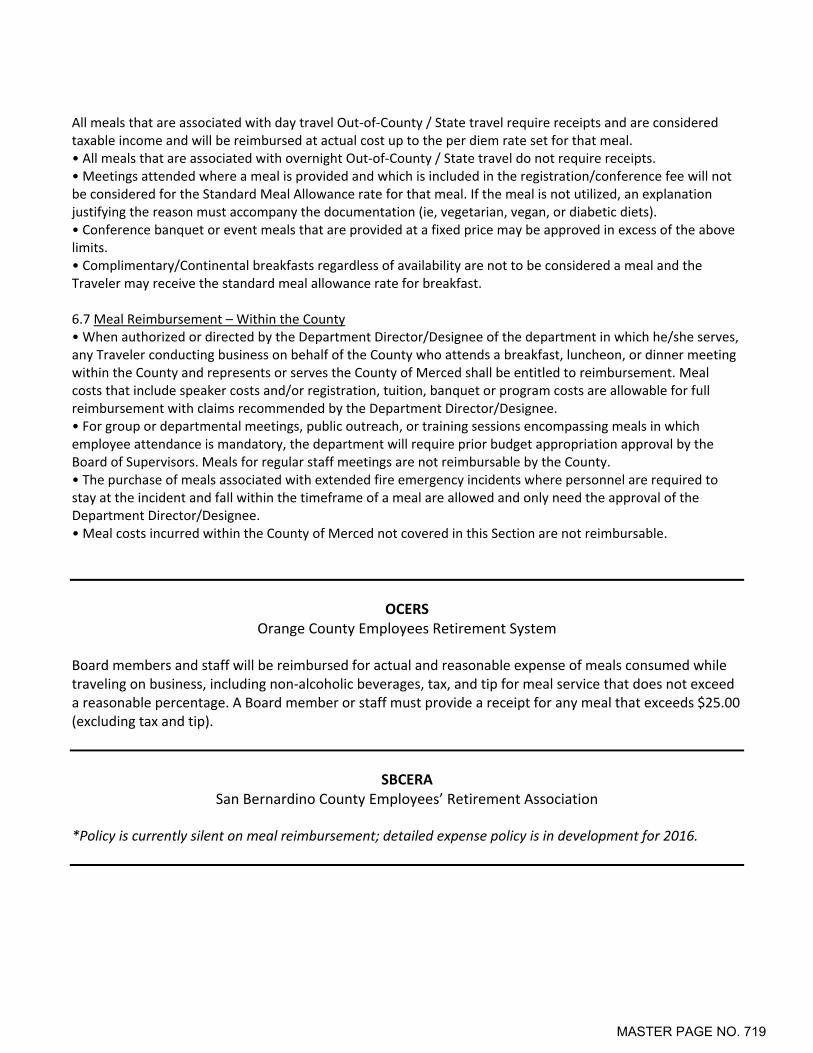
All meals that are associated with day travel Out‐of‐County / State travel require receipts and are considered taxable income and will be reimbursed at actual cost up to the per diem rate set for that meal. • All meals that are associated with overnight Out‐of‐County / State travel do not require receipts. • Meetings attended where a meal is provided and which is included in the registration/conference fee will not be considered for the Standard Meal Allowance rate for that meal. If the meal is not utilized, an explanation justifying the reason must accompany the documentation (ie, vegetarian, vegan, or diabetic diets). • Conference banquet or event meals that are provided at a fixed price may be approved in excess of the above limits. • Complimentary/Continental breakfasts regardless of availability are not to be considered a meal and the Traveler may receive the standard meal allowance rate for breakfast. 6.7 Meal Reimbursement – Within the County • When authorized or directed by the Department Director/Designee of the department in which he/she serves, any Traveler conducting business on behalf of the County who attends a breakfast, luncheon, or dinner meeting within the County and represents or serves the County of Merced shall be entitled to reimbursement. Meal costs that include speaker costs and/or registration, tuition, banquet or program costs are allowable for full reimbursement with claims recommended by the Department Director/Designee. • For group or departmental meetings, public outreach, or training sessions encompassing meals in which employee attendance is mandatory, the department will require prior budget appropriation approval by the Board of Supervisors. Meals for regular staff meetings are not reimbursable by the County. • The purchase of meals associated with extended fire emergency incidents where personnel are required to stay at the incident and fall within the timeframe of a meal are allowed and only need the approval of the Department Director/Designee. • Meal costs incurred within the County of Merced not covered in this Section are not reimbursable.
OCERS Orange County Employees Retirement System
Board members and staff will be reimbursed for actual and reasonable expense of meals consumed while traveling on business, including non‐alcoholic beverages, tax, and tip for meal service that does not exceed a reasonable percentage. A Board member or staff must provide a receipt for any meal that exceeds $25.00 (excluding tax and tip).
SBCERA San Bernardino County Employees’ Retirement Association
*Policy is currently silent on meal reimbursement; detailed expense policy is in development for 2016.
MASTER PAGE NO. 719
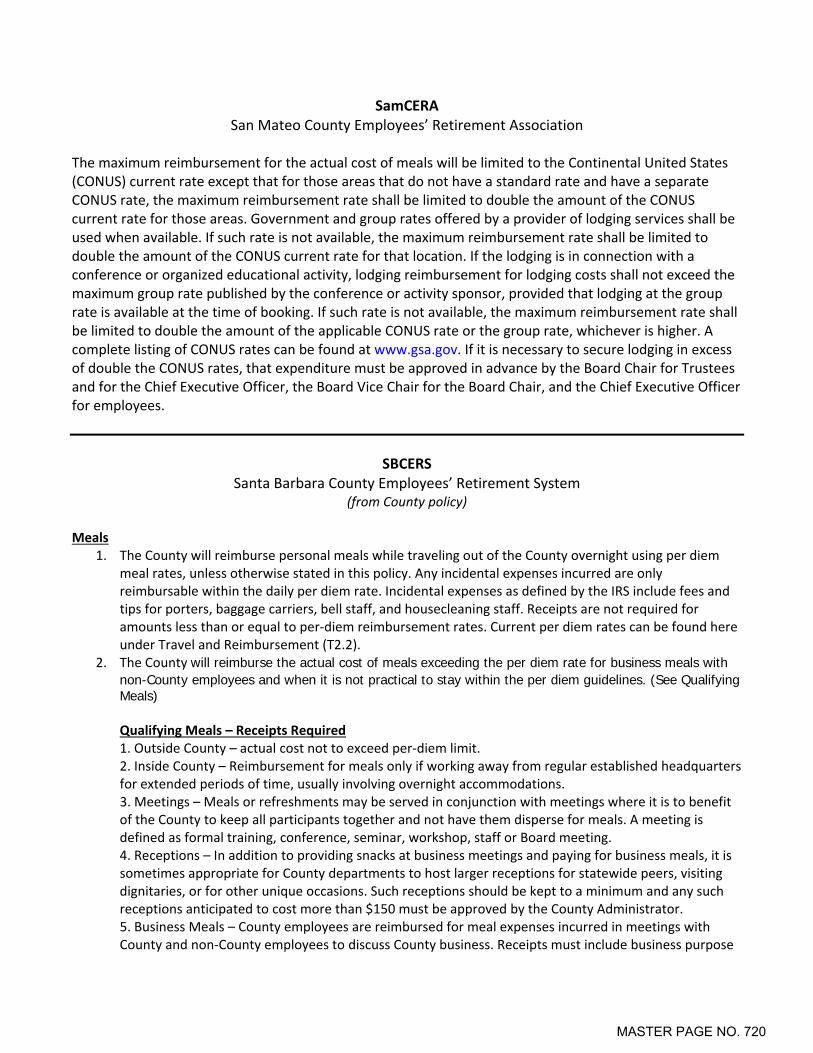
SamCERA San Mateo County Employees’ Retirement Association
The maximum reimbursement for the actual cost of meals will be limited to the Continental United States (CONUS) current rate except that for those areas that do not have a standard rate and have a separate CONUS rate, the maximum reimbursement rate shall be limited to double the amount of the CONUS current rate for those areas. Government and group rates offered by a provider of lodging services shall be used when available. If such rate is not available, the maximum reimbursement rate shall be limited to double the amount of the CONUS current rate for that location. If the lodging is in connection with a conference or organized educational activity, lodging reimbursement for lodging costs shall not exceed the maximum group rate published by the conference or activity sponsor, provided that lodging at the group rate is available at the time of booking. If such rate is not available, the maximum reimbursement rate shall be limited to double the amount of the applicable CONUS rate or the group rate, whichever is higher. A complete listing of CONUS rates can be found at www.gsa.gov. If it is necessary to secure lodging in excess of double the CONUS rates, that expenditure must be approved in advance by the Board Chair for Trustees and for the Chief Executive Officer, the Board Vice Chair for the Board Chair, and the Chief Executive Officer for employees.
SBCERS Santa Barbara County Employees’ Retirement System
(from County policy) Meals
1. The County will reimburse personal meals while traveling out of the County overnight using per diem meal rates, unless otherwise stated in this policy. Any incidental expenses incurred are only reimbursable within the daily per diem rate. Incidental expenses as defined by the IRS include fees and tips for porters, baggage carriers, bell staff, and housecleaning staff. Receipts are not required for amounts less than or equal to per‐diem reimbursement rates. Current per diem rates can be found here under Travel and Reimbursement (T2.2).
2. The County will reimburse the actual cost of meals exceeding the per diem rate for business meals with non-County employees and when it is not practical to stay within the per diem guidelines. (See Qualifying Meals)
Qualifying Meals – Receipts Required 1. Outside County – actual cost not to exceed per‐diem limit. 2. Inside County – Reimbursement for meals only if working away from regular established headquarters for extended periods of time, usually involving overnight accommodations. 3. Meetings – Meals or refreshments may be served in conjunction with meetings where it is to benefit of the County to keep all participants together and not have them disperse for meals. A meeting is defined as formal training, conference, seminar, workshop, staff or Board meeting. 4. Receptions – In addition to providing snacks at business meetings and paying for business meals, it is sometimes appropriate for County departments to host larger receptions for statewide peers, visiting dignitaries, or for other unique occasions. Such receptions should be kept to a minimum and any such receptions anticipated to cost more than $150 must be approved by the County Administrator. 5. Business Meals – County employees are reimbursed for meal expenses incurred in meetings with County and non‐County employees to discuss County business. Receipts must include business purpose
MASTER PAGE NO. 720
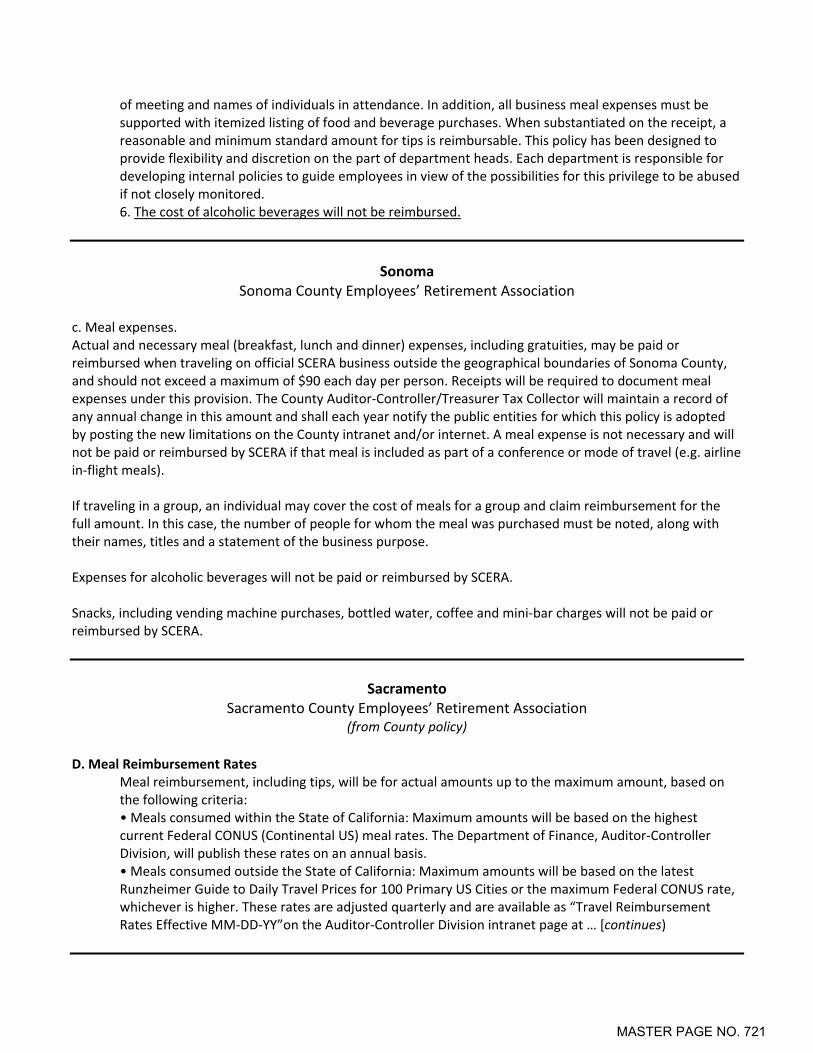
of meeting and names of individuals in attendance. In addition, all business meal expenses must be supported with itemized listing of food and beverage purchases. When substantiated on the receipt, a reasonable and minimum standard amount for tips is reimbursable. This policy has been designed to provide flexibility and discretion on the part of department heads. Each department is responsible for developing internal policies to guide employees in view of the possibilities for this privilege to be abused if not closely monitored. 6. The cost of alcoholic beverages will not be reimbursed.
Sonoma
Sonoma County Employees’ Retirement Association c. Meal expenses. Actual and necessary meal (breakfast, lunch and dinner) expenses, including gratuities, may be paid or reimbursed when traveling on official SCERA business outside the geographical boundaries of Sonoma County, and should not exceed a maximum of $90 each day per person. Receipts will be required to document meal expenses under this provision. The County Auditor‐Controller/Treasurer Tax Collector will maintain a record of any annual change in this amount and shall each year notify the public entities for which this policy is adopted by posting the new limitations on the County intranet and/or internet. A meal expense is not necessary and will not be paid or reimbursed by SCERA if that meal is included as part of a conference or mode of travel (e.g. airline in‐flight meals). If traveling in a group, an individual may cover the cost of meals for a group and claim reimbursement for the full amount. In this case, the number of people for whom the meal was purchased must be noted, along with their names, titles and a statement of the business purpose. Expenses for alcoholic beverages will not be paid or reimbursed by SCERA. Snacks, including vending machine purchases, bottled water, coffee and mini‐bar charges will not be paid or reimbursed by SCERA.
Sacramento Sacramento County Employees’ Retirement Association
(from County policy)
D. Meal Reimbursement Rates
Meal reimbursement, including tips, will be for actual amounts up to the maximum amount, based on the following criteria: • Meals consumed within the State of California: Maximum amounts will be based on the highest current Federal CONUS (Continental US) meal rates. The Department of Finance, Auditor‐Controller Division, will publish these rates on an annual basis. • Meals consumed outside the State of California: Maximum amounts will be based on the latest Runzheimer Guide to Daily Travel Prices for 100 Primary US Cities or the maximum Federal CONUS rate, whichever is higher. These rates are adjusted quarterly and are available as “Travel Reimbursement Rates Effective MM‐DD‐YY”on the Auditor‐Controller Division intranet page at … [continues)
MASTER PAGE NO. 721
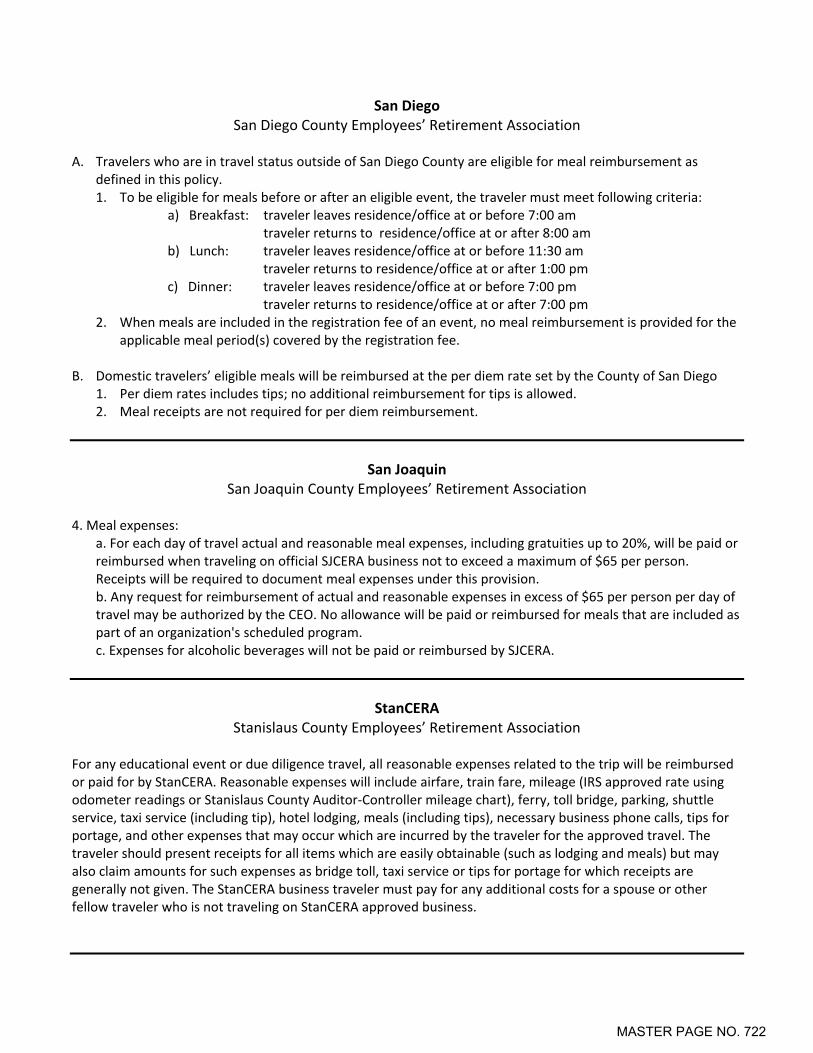
San Diego San Diego County Employees’ Retirement Association
A. Travelers who are in travel status outside of San Diego County are eligible for meal reimbursement as
defined in this policy. 1. To be eligible for meals before or after an eligible event, the traveler must meet following criteria:
a) Breakfast: traveler leaves residence/office at or before 7:00 am traveler returns to residence/office at or after 8:00 am
b) Lunch: traveler leaves residence/office at or before 11:30 am traveler returns to residence/office at or after 1:00 pm
c) Dinner: traveler leaves residence/office at or before 7:00 pm traveler returns to residence/office at or after 7:00 pm
2. When meals are included in the registration fee of an event, no meal reimbursement is provided for the applicable meal period(s) covered by the registration fee.
B. Domestic travelers’ eligible meals will be reimbursed at the per diem rate set by the County of San Diego
1. Per diem rates includes tips; no additional reimbursement for tips is allowed. 2. Meal receipts are not required for per diem reimbursement.
San Joaquin San Joaquin County Employees’ Retirement Association
4. Meal expenses:
a. For each day of travel actual and reasonable meal expenses, including gratuities up to 20%, will be paid or reimbursed when traveling on official SJCERA business not to exceed a maximum of $65 per person. Receipts will be required to document meal expenses under this provision. b. Any request for reimbursement of actual and reasonable expenses in excess of $65 per person per day of travel may be authorized by the CEO. No allowance will be paid or reimbursed for meals that are included as part of an organization's scheduled program. c. Expenses for alcoholic beverages will not be paid or reimbursed by SJCERA.
StanCERA Stanislaus County Employees’ Retirement Association
For any educational event or due diligence travel, all reasonable expenses related to the trip will be reimbursed or paid for by StanCERA. Reasonable expenses will include airfare, train fare, mileage (IRS approved rate using odometer readings or Stanislaus County Auditor‐Controller mileage chart), ferry, toll bridge, parking, shuttle service, taxi service (including tip), hotel lodging, meals (including tips), necessary business phone calls, tips for portage, and other expenses that may occur which are incurred by the traveler for the approved travel. The traveler should present receipts for all items which are easily obtainable (such as lodging and meals) but may also claim amounts for such expenses as bridge toll, taxi service or tips for portage for which receipts are generally not given. The StanCERA business traveler must pay for any additional costs for a spouse or other fellow traveler who is not traveling on StanCERA approved business.
MASTER PAGE NO. 722
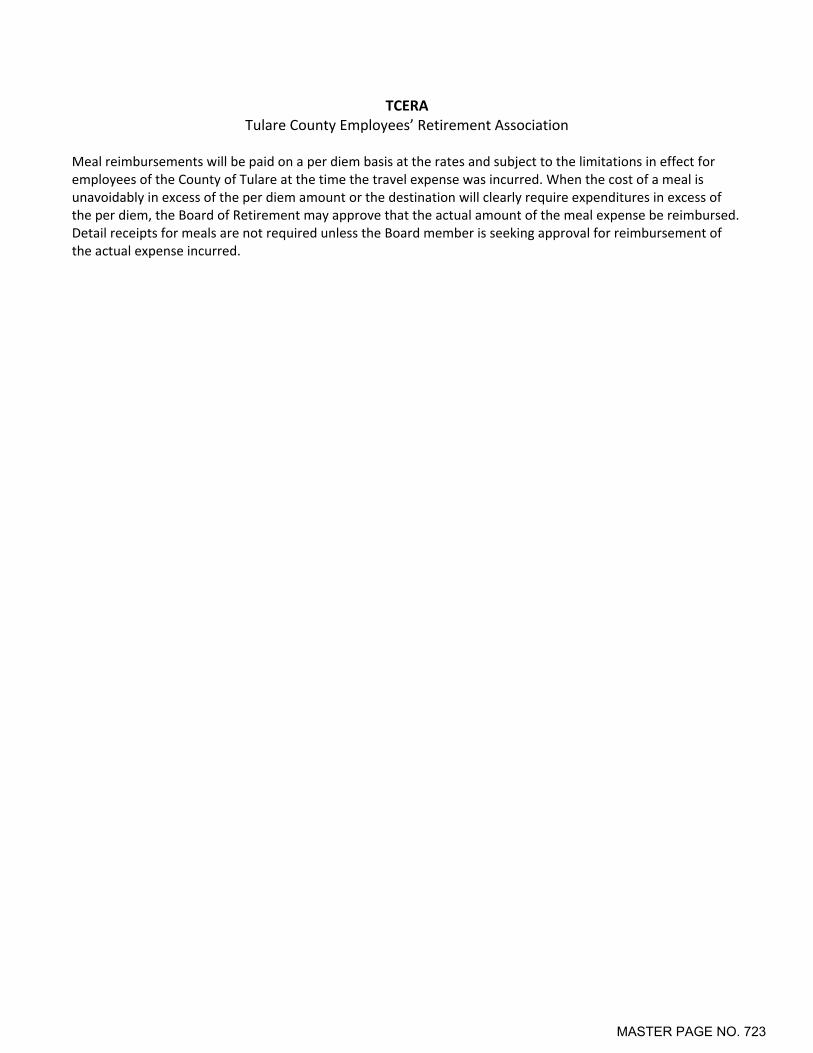
TCERA Tulare County Employees’ Retirement Association
Meal reimbursements will be paid on a per diem basis at the rates and subject to the limitations in effect for employees of the County of Tulare at the time the travel expense was incurred. When the cost of a meal is unavoidably in excess of the per diem amount or the destination will clearly require expenditures in excess of the per diem, the Board of Retirement may approve that the actual amount of the meal expense be reimbursed. Detail receipts for meals are not required unless the Board member is seeking approval for reimbursement of the actual expense incurred.
MASTER PAGE NO. 723
February 1, 2016 Board of Retirement Ventura County Employees’ Retirement Association 1190 South Victoria Avenue, Suite 200 Ventura, CA 93003 SUBJECT: QUARTERLY RETIREMENT ADMINISTRATOR’S REPORT Dear Board Members: In compliance with VCERA’s Monitoring & Reporting Policy, this report will include information regarding travel, training, key meetings and media communications, as well as other key issues for October through December of 2015. Travel & Training I attended the SACRS Fall Conference November 17-20 in San Diego. As always, I found this conference extremely informative, particularly the breakout sessions with my fellow administrators and the legislative updates. Board/Policy/Compliance Pensionable Compensation under PEPRA. As the 4th quarter of 2015 began, the final preparations were completed for the report on pensionable compensation that was presented to the Board at the October 19, 2015 business meeting. This involved finalizing the documents, responding to stakeholder questions and categorizing pay codes. Once the Board took action at the meeting, we then followed up to communicate the results to the stakeholders and answer questions. Model Regulations and IRS Determination Filing. We prepared and presented the contract with Hanson Bridgett for the IRS determination filing work, and began the research and analysis required for that project. This effort continued through the entire quarter, and involved the presenting of model regulations to the Board in November. (Our application was timely filed with the IRS this month.) Collaboration with the Auditor-Controller on Compensation Limits. Beginning in September but continuing throughout the quarter, I worked with the Auditor-Controller’s office to resolve an issue with regard to certain members exceeding the mandatory compensation caps, both for PEPRA and IRS 401(a)17 limits. For both circumstances, contributions were withheld and remitted to VCERA after the member had exceeded the applicable cap. In addition to identifying the members, their excess earnings and overpayment amounts of both the employee and employer contributions, we also identified members who were projected to exceed the limit in 2015 and provided the projected pay period where this would occur.
MASTER PAGE NO. 724
February 1, 2016 RA Quarterly Report Page 2 of 2
During the course of our discussions with the Auditor-Controller and his staff, they inquired whether VCERA could apply the 401(a)17 limits on a calendar year basis, consistent with the PEPRA cap measurement period, to simplify the programming requirements needed to prevent exceeding the limits in the future. VCERA tax counsel Hanson Bridgett confirmed that this could be done by applying a pro-rated measuring period for the last half of 2015 (applying a separate test). The Auditor-Controller’s staff made programming changes to allow for the caps to be applied in the future, and in December sent notices to the identified members and refunded the excess contributions withheld. Media In October, I spoke to the Ventura County Star regarding the Board action on pay codes for pensionable compensation. General Other general business in the 4th quarter included coordination of the SACRS-offered dental plan to retirees, research on the CPI methodology for retiree COLAs, and initial review and distribution to stakeholders of the actuarial valuation from Segal. We also conducted some initial surveys of staff and the Board on potential newsletter names and logo designs. Key Meetings October On October 7th, I was a presenter at the County’s “Planning for a Successful Retirement” workshop. Also in October, staff had several meetings and conference calls to complete the pensionable compensation work. I met with vendors to choose one to assist in the design of the CAFR publication, and we had meetings to discuss the ongoing beneficiary data research project in relation to PAS. November Other staff and I met with Auditor-Controller staff about the PEPRA cap issue described earlier in this report. I also was a presenter at the New Employee Orientation on the 18th. December On the 4th, the CFO and I met with HR representatives to discuss the CPS fiscal study and its impact on VCERA fiscal staff. I completed a staff performance evaluation that day as well. On the 7th, senior staff had a conference call with Segal to discuss review of the drafted actuarial valuation. On the 8th, I attended a REAVC board luncheon and answered questions. There was another retirement planning seminar on the 14th and a new employee seminar on the 16th. Please let me know if you have any questions or concerns regarding the information provided in this report. Sincerely,
Linda Webb Retirement Administrator
MASTER PAGE NO. 725


