Embed Size (px)
Citation preview
1
1. INTRODUCTION
1.1 Background
Nepal is a small country sandwiched between two giant nations,India and China. Nepal has a nearly population of 23.2 million and 13million of them are below the group of 30 years. Its economy ispredominantly based on agriculture. As a land-locked country situated ata distance of about 700 miles from the nearest sea-port, Nepal has to facemany problems and difficulties on based economy with a slow pace ofindustrialization.
According to 1991 census, about 81.33% of the population ofNepal is engaged in agriculture. The agricultural sector contributed toabout 42.4% of GDP in 1993/94. Nepal is one at the poorest country inthe world with annual per capita income growth rate of only 3.4%.1
During 1965 to 1995, the growth in per capita income was even less at0.8% per annum, while the population growth rate was more than 2.3%. Itshows economic performance during the past has not been veryencouraging.2
The industrial sector is expected to grow and contribute to the GDPand the per capita income of the people in the 21st century. Severalindustries catering to the home market and export market have beenestablished in Nepal. The Nepalese market is also becoming complex dayby day. Competition in every sector is increasing rapidly. In this situation,companies especially manufacturing companies find the situation verytough to sell their product in the market smoothly. So, businessmen areusing various tools and techniques to sell their products.
The research area selected for this study is Front of Himal Iron andSteel PVT. LTD., Parwanipur and around, which is one of the Industrialcenters of Nepal. Parwanipur is situated in Parsa district of Narayanizone. It is also the fastest growing VDC of Parsa district. It lies on thehighway of Birgunj to Pathlaiya.
Parwanipur is a Industrial center of Parsa and Bara district andmany people come to this area with business point of view. Manyindustries are situated in Parwanipur VDC including Dabur Nepal. This
.1 International Programmed on the Elimination of Child Labour (IPEC, 1995, P. 3)2 National Planning Commission, 1995, P.N 2
2
Company manufactures the Real juice cold drinks and is directcompetition with Bottlers Nepal and Pepsi Cola products. Bottlers Nepaland Pepsi Cola companies the former has captured more than 70% marketshare of aerated cold drink both in the national market. Though theintense competition between two cola giants with consolidated marketshare of 90% of total branded soft drink have created a strong entrybarrier to potential entrants. Beside these two giants, there are some otherbrands like Frooti, Rio, Juicy and Real selling in the cold drink market inparwanipur.
1.2 Focus of the Study
The present study tries to focus on the marketing of cold drinks inParwanipur VDC. Generally cold drink stands for alcohol-less drink.Cold drinks are sold in bottles, plastic, containers or cans. Most people inNepal, contrary to the people of developed countries, perceive cold drinkas a drink to be used in the hot season only. That's why demand of colddrink in Nepal goes comparatively high in the hot summer season.Parwanipur is situated in Terai, which has a very hot climate.
Marketing is true sense helps to increase effective demand for aproduct through the reeducation of distribution cost and also help toexplore markets for new products. The role of marketing with regard todissemination of information is very important for consumer as well asproducers to buy and produce goods. It helps in bringing marketscompetitive this increasing efficiency of resources use. Likewise, its rolewith regard to satisfying consumers and making inputs available atreasonable price as services has its own importance. Therefore, theimpact of marketing is deep and far reaching. A national developmentprogrammed that concentrates only on production will be less effectivethan a programmed that recognizes the contribution of marketing.
This study will examine the present marketing strategies of colddrinks in Parwanipur and try to find out the marketing variables affectingthe cold drinks.
1.3 Statement of the Problem
The stiff competition in the marketing of cold drink has forced themarkets to adopt a variety of marketing tools and techniques in the
3
market place. Different types of an advertisement are used by themanufacturers in a variety of media. From competition of new establishedcompanies, industries are developing rapidly. This development in theindustrial sector has provided varieties of different type of product,different brands of even a single product, to the Nepalese consumers.Nepalese consumers are provided with different brands and they are quitefree to choose the one they think the best. We can see different brand ofcold drinks in market just as Pepsi, Coke, Mirinda, Fanta, Sprite, 7'up,Slice, Lemon Fanta etc. The competition is very tough in the cold drinkmarket. Demands of cold drinks are increasing day by day and many newcompanies are emerging to fulfill the demand. However, the new brandsthey are not in the stage to compete with Coca-cola and Pepsi products.
Cold drinks are one of the heavily advertised products. Largeamount of money is spent on the promotion of cold drinks. Yet very fewcompanies are found to measure the effects of their advertisements. It isessential for companies to know about their consumers, their choice andpreferences. For regular sales and distribution of cold drinks we mustknow about 'which is the best advertising media'. Which advertisingmedia can be more effective? Therefore, the problems encompassed bythis study are as follows:
1. What is the consumers' perception and consumption behavior ofcold drinks in Parwanipur?
2. What type of distribution network exists in the study area formarketing of cold drinks?
3. What marketing strategies are adopted by the marketers of colddrinks in the study area?
4. What type of impacts have the advertisements made on thedales of cold drinks in study area?
5. What are the effects of sales promotion schemes on sales ofcold drinks in the study area?
1.4 Objectives of the Study
The present study purports to examine the marketing of cold drinksin Parwanipur.
The specific objectives of the study are as following:1. To examine the consumers' perception and behavior in the
purchase of cold drink in Parwanipur.2. To evaluate the distribution network and marketing strategies of
cold drink companies in Parwanipur.
4
3. To evaluate the impact of advertisement and sales promotionschemes on sales of cold drinks in the study area.
4. To identify consumers profile and their preference of cold drinkin the study area.
5. To measure the effect of sales promotion schemes on the salesof cold drinks in study area.
1.5 Importance of the study
Success of an industry is the function of successful marketing of itsproducts. In an area of cutthroat competition, successful marketing of theproducts demands a through understanding of consumers' taste, choice,preference, loyalty and consumption behavior. The findings from thisstudy may be used by manufacturers and marketers of cold drinks tobetter understand their consumers and thereby design a better marketingstrategy for the study area.
1.6 Limitations of the Study
This study has been strictly limited to Parwanipur and the findingsfrom this study do not reflect a national character. The study has beenpredominantly based on primary information collected through aquestionnaire survey of limited number of individuals and retailers.Therefore, the findings of this study are affected to some extent by thesmall size of the sample.
1.7 Organization of the study
The study has been organized into five chapters. The introductionchapter deals on the background of the study, statement of the problem,objectives of the study, importance of the study, and limitations of thestudy. The second chapter provides review of literature. Researchmethodology utilized for the study has been incorporated in the thirdchapter. The fourth chapter presents the data analysis and interpretation.The last chapter presents the summary, conclusions and recommendationsof the study. The bibliography and appendices are presented at the end ofthe study report.
5
2. REIVIEW OF LITRATURE
2.1 The Market
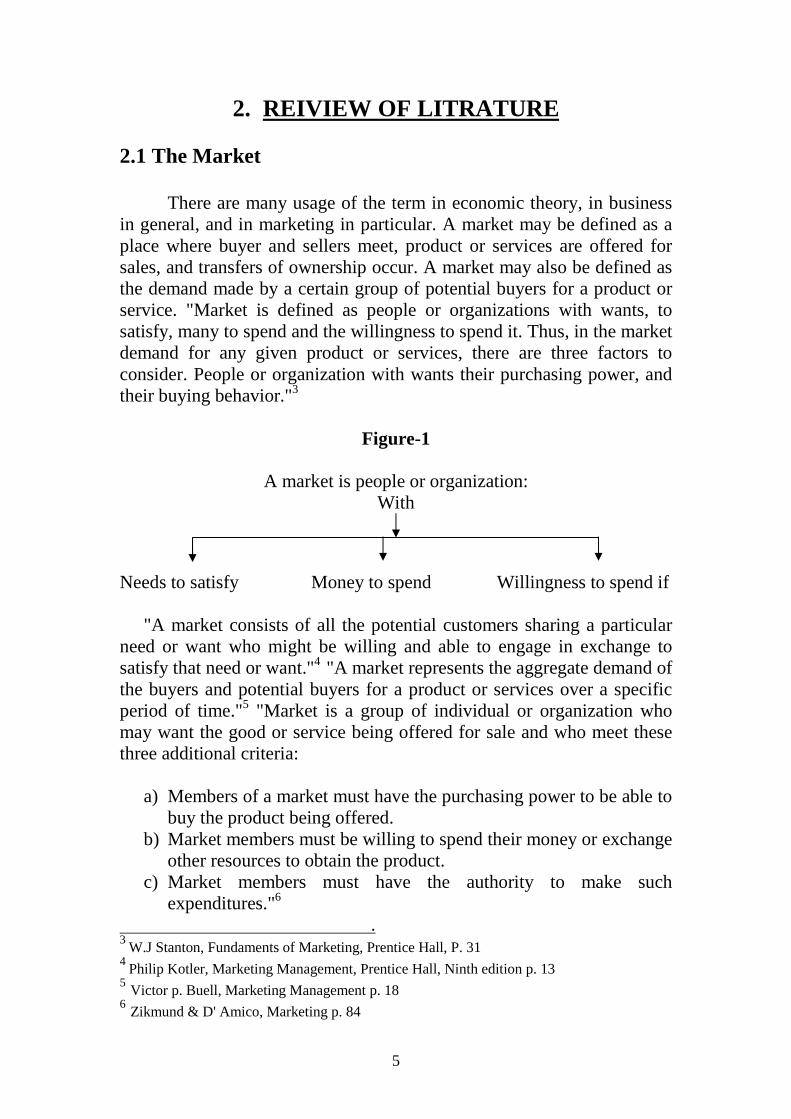
There are many usage of the term in economic theory, in businessin general, and in marketing in particular. A market may be defined as aplace where buyer and sellers meet, product or services are offered forsales, and transfers of ownership occur. A market may also be defined asthe demand made by a certain group of potential buyers for a product orservice. "Market is defined as people or organizations with wants, tosatisfy, many to spend and the willingness to spend it. Thus, in the marketdemand for any given product or services, there are three factors toconsider. People or organization with wants their purchasing power, andtheir buying behavior."3
Figure-1
A market is people or organization:With
Needs to satisfy Money to spend Willingness to spend if
"A market consists of all the potential customers sharing a particularneed or want who might be willing and able to engage in exchange tosatisfy that need or want."4 "A market represents the aggregate demand ofthe buyers and potential buyers for a product or services over a specificperiod of time."5 "Market is a group of individual or organization whomay want the good or service being offered for sale and who meet thesethree additional criteria:
a) Members of a market must have the purchasing power to be able tobuy the product being offered.
b) Market members must be willing to spend their money or exchangeother resources to obtain the product.
c) Market members must have the authority to make suchexpenditures."6
.3
W.J Stanton, Fundaments of Marketing, Prentice Hall, P. 314
Philip Kotler, Marketing Management, Prentice Hall, Ninth edition p. 135
Victor p. Buell, Marketing Management p. 186
Zikmund & D' Amico, Marketing p. 84
6
2.2 Marketing
"Marketing consists of all business activities involved in the flowof goods and services from the point of initial production unit they are inthe hands of the ultimate consumer. Thus, agricultural marketing is aprocess by which the producer and buyer of agricultural goods arebrought together."7
"The marketing process establishes forward linkages foragricultural activities, that is, it provides economic rewards for theproduction process. It includes not only storage and transportationactivities of the middlemen but also encompasses all activities linking theconsumer and the producer."8
"Marketing is the process of planning and executing theconception, pricing, promotion, and distribution of goods, services, andideas to create exchanges with target groups that satisfy customer andorganizational objectives."9
A marketing programmer plays a crucial role in the physicaldistribution of any product. Therefore each and every firm should havemarketing system for channel the product to the market to satisfycustomer needs and wants. Sometimes they have to face the marketingproblems of capturing the market and creating goodwill.
A more modem definition in tune with greatly expanded productivecapacity might emphasize the adaptation of production facilities to themarket. Specifically marketing might be defined as the response ofbusinessmen to consumer demand through adjustments in productioncapabilities. Adjusting production, accounting, finance and marketing inthe light of the changing needs of consumers who are affluent enough tohave varied buying choices.
"Marketing is concerned with designing an efficient and fairsystem which will direct an economy's flow of goods and service fromproducers to consumers and accomplish the objective of the society."10
.7
Macmillan Dictionary of Modern Economic, Fourth Edition p. 1178
Ibid. p. 1179
Philip Kotler, Op. Cit (8th ed.), p.1310
E. Jerome McCarthy, Basic Marketing, Fifth Edition p. 18
7
"Marketing is a social and managerial process by which individualsand group obtain what they need and want through creating, offering andexchanging products of value with others."11 Marketing can be defined ina simple manner as the activities done by the company to deliver theproduct from the place of production to the place of consumption. Itmeans that marketing is the process of the transfer of ownership of theproduct in exchange of something of value.
Different authorities define marketing in different ways."Marketing is the exchange taking place between consuming groups onthe one hand and supplying groups on the other."12 "Marketing isconcerned with regular the level, timing and character of demand for onemore products of an organization."13 "Marketing is human activitydirected at satisfying needs and wants through exchange process."14
"Marketing is the anticipation, stimulation, facilitation, regulation andsatisfaction of consumer and publics demand for products, services,organization, people, place and ideas through the exchange process."15
According to Stanton "Marketing is defined as total system of businessactivities designed to plan, price, promote and distribute want satisfyinggoods and service to present and potential customers."
In light of above definitions, it can be concluded that marketing is aprocess of delivering goods and services produced to satisfy the needs ofconsumers to the consumers in an effective way so that the objectives ofthe produces are fulfilled. Marketing thus satisfies objectives of theproducers by making it possible to sell their products on the market inone hand and on the other hand helps consumer to get the maximum ofsatisfaction by providing goods and services for their consumption.
In the modern marketing era every marketers should understand theconsumer needs. Successful marketing understand consumer taste, qualityand choice. If there is no satisfaction of consumer that product doesn'tgive good result. For consumer satisfaction, the product that is availableeasily and everywhere customer attract in that product easily.
.11
Kotler, Op. Cit. p.912
Wroe Alderson, Marketing Behavior and Executive Action, Home wood, Richard D. Irwin,1957, p. 4213
Philip Kotler, "The Tasks of Marketing Management", Journal of Marketing, vol. 37Oct.1973, p. 4214
Kotler, Op. Cit. (4th ed.) p. 1915
Joel R. Evans & Barry Berman, Marketing, p. 7
8
2.3 Marketing System
A system is a set of units with relationships among them.Marketing is a total system of business activities designed to plan, price,promote and distribute want-satisfying product to target market toachieve organizational objectives.
"The concept of marketing system is given by the system approachto marketing based upon the work of Bertlanfy."16 The term 'marketingsystem' consists of two separate words "marketing" and "system".Marketing is a human activity directly at satisfying needs and wantsthrough exchange processes. On the other, the term "system" meansregularly interacting group of activities forming a unified whole. In otherwords, system means systematic or regular flow of any thing directly atfulfilling basic goals.
"Marketing system deals with the smooth functioning of themarketing activities for the fulfillment of the consumer needs and wants.If a marketer fails to do so, then one must know that there is somethingwrong with the marketing organization. And, in this situation no marketercan work successfully. So, the marketing manager must be able toanalyze the marketing system in a systematic manner."17
2.4 Marketing Environment
"Environment is an outside organization but potentially relevant tothe firm's market and marketing activities. It consists of the factors thataffect the firm's ability to develop and maintain both the successfultransactions and the relationships with its target customers."18 Themarketing environment consists of external forces that directly orindirectly influence on organization's acquisition of inputs and generationof outputs. Examples of inputs include skilled personnel, financialresources, raw materials and information. The marketing environment asconsisting of six categories of forces: political, legal, regulatory, societal,economic and competitive and technological."19 Marketing activities andcontrol. In this sense, marketing environment lays upon limits orconstraints on the firm's marketing activities, such as, marketinginformation system, marketing planning system, implementation system,
.16
K.D. Koirala, M.K. publishers, 1992, p. 1117
Shyam K. Shrestha, Marketing Strategy and Management, p. 718
Terry, George R, Principles of Management, Bombay: Taraporevala publishing,1997, p. 5619 Pride & Ferrell "Marketing Concepts and Strategies, 6th Ed. P. 41
9
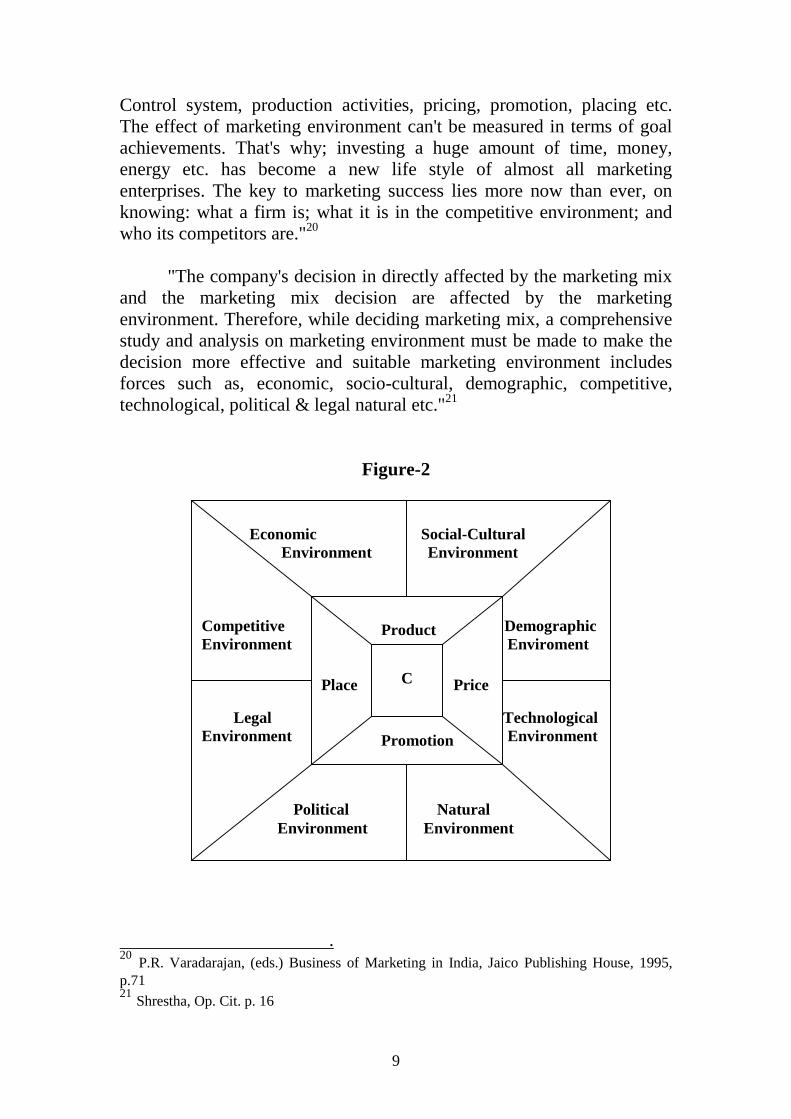
Control system, production activities, pricing, promotion, placing etc.The effect of marketing environment can't be measured in terms of goalachievements. That's why; investing a huge amount of time, money,energy etc. has become a new life style of almost all marketingenterprises. The key to marketing success lies more now than ever, onknowing: what a firm is; what it is in the competitive environment; andwho its competitors are."20
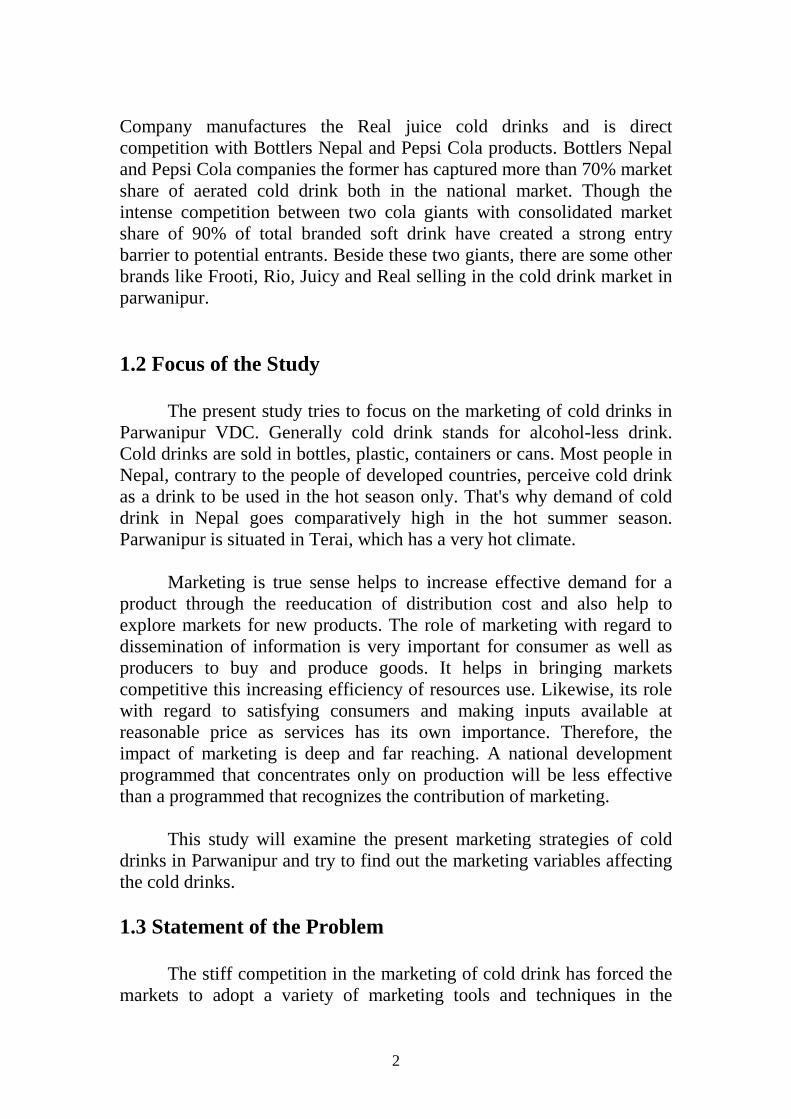
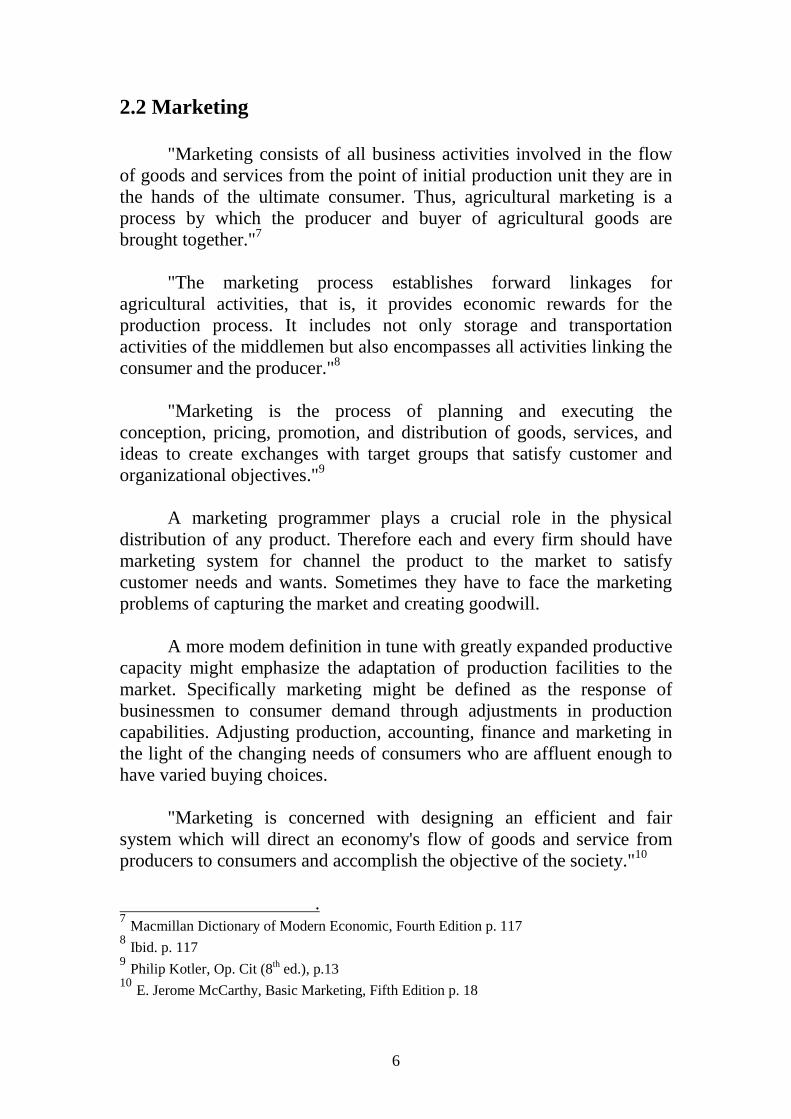
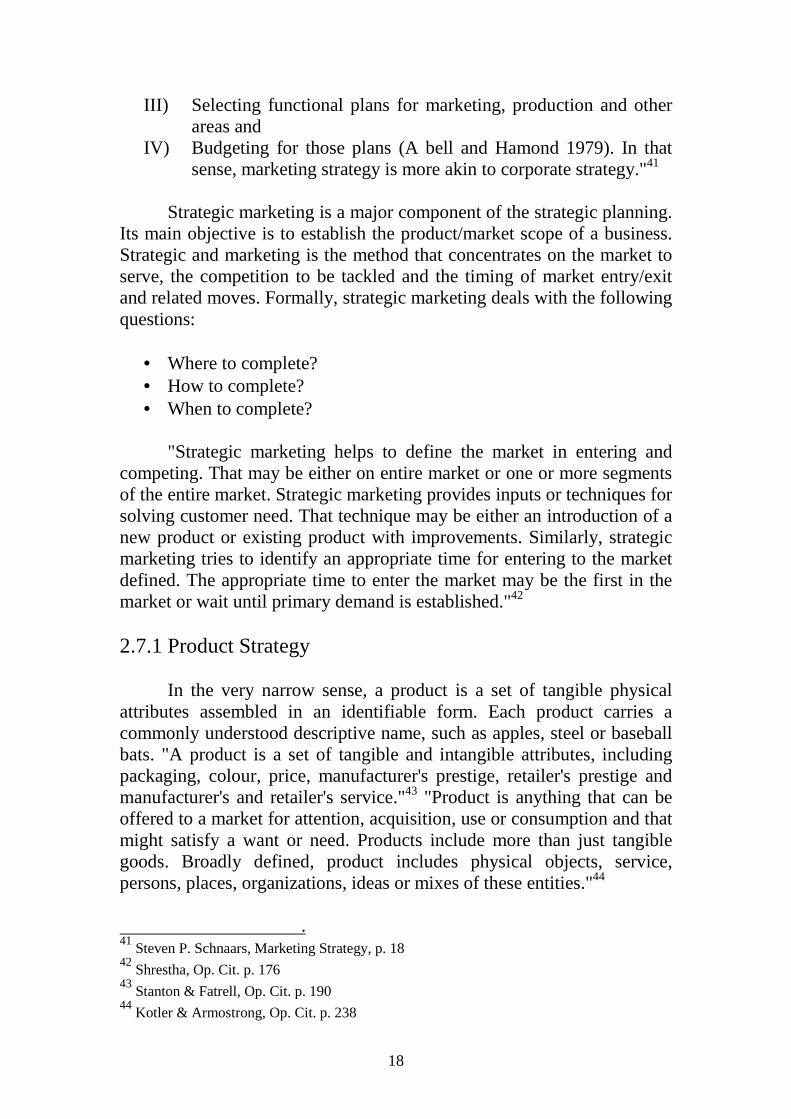
"The company's decision in directly affected by the marketing mixand the marketing mix decision are affected by the marketingenvironment. Therefore, while deciding marketing mix, a comprehensivestudy and analysis on marketing environment must be made to make thedecision more effective and suitable marketing environment includesforces such as, economic, socio-cultural, demographic, competitive,technological, political & legal natural etc."21
Figure-2
.20
P.R. Varadarajan, (eds.) Business of Marketing in India, Jaico Publishing House, 1995,p.7121
Shrestha, Op. Cit. p. 16
Economic Social-CulturalEnvironment Environment
Competitive DemographicEnvironment Enviroment
Legal TechnologicalEnvironment Environment
Political NaturalEnvironment Environment
Product
Place Price
Promotion
C
10
The importance of marketing environment to the management hasbeen increasing these days than even before, because there are severalopportunities and threats or challenges within the marketing environmentwhich should be forecasted and rightly analyzed by the marketingmanager to enjoy the opportunities. A successful marketer is one who canappropriately analyze these forces. A successful marketer can acquireseveral opportunities through these forces and successful run his business.
2.5 Role of Marketing in Industrialization
Industrialization is the impetus of overall development of country.Today industrialization is considered as synonymous to development.The countries, which are industrialized, are developed too and vice versa.Many countries which we say the most developed countries like U.K.,U.S.A., Japan, china etc have been fully industrialized and the countrieswhich are under developed or developing are also stepping graduallyahead toward that direction. All Nepal, a developing country, too is notexception to this phenomenon of the world.
Marketing plays a very significant role in accelerating the pace ofindustrialization, which in turn, aims at making the economy developedand strong. In this connection, it is significant to note that marketing isthe most important multiplier of economic development. Thedevelopment of marketing makes possible economic integration and thefullest utilization of assets and productive capacity an economy alreadypossesses. It mobilizes latent economic energy and finally contributes tothe greatest needs: that for the rapid development of entrepreneurs andmanagers.22
Marketing plays important role in the process of industrialization.The process of industrialization, the proceeds of industrial activity arepassed on to the society through the process of marketing. Hence, thesuccess or failure of business largely hinges upon the art and science ofmarketing, which is composed of explorative knowledge, tact, and talentof veteran practitioners. In the global market, the multinationalcompanies like Sony, Hitachi, Toshiba, Philips, Proctor and Gamble,Johnson and Nicholsom, and many others have been permeatingthroughout the world with the help of modern marketing practices and
.22
Kelley, Egene J and Lazar William, Managerial Marketing, Richard D. Irwin INC, 1972 p.616
11
methods. So are Tata the Birla, the Bajaj India, and STC, Thai Food(RaRa noodles), Bottlers Nepal and panchakanya Iron in Nepal.Marketing in this sense has made the producers as well as the customersmore conscious toward comparative service, values, safety, satisfactionand convenience.
2.6 The Marketing Mix
The marketing mix is one of the most fundamental conceptsassociated with the marketing process. It is well understand by mostmodern marketers and is systematically applied in many industriesespecially those that deal with physical products. Yet it is easy to assumethat, because most managers have heard about it and / or use it, there isno need to mention it again a book on marketing.
The sad truth is that quite often the precise role and scope of theconcept and its underlying principles are not fully appreciated by thosewho tack about it or use it. It is regarded by many managers as no morethan a theoretical model that helps in understanding the breath ofactivities encompassed by the marketing task. In many situation it isconsidered as no more that an aid to highlighting the fact that 'marketing'is a much broader concept that just 'selling' and 'prompting'.
A brief review of the main principles surrounding the marketingmix can help to clarify its true role in the development and execution ofan effective marketing effort.
"The marketing mix is the set of marketing variables which theorganization blends to achieve the marketing goal in a defined targetmarket. The marketing mix consists of everything the organization can doinfluence the demand for its product in the target market."23
As stated earlier the marketing mix represents as assemblage oftasks and subtasks which ultimately will help to satisfy the customer'srequirements in such a way as to enable the firm to attain its objectives inan optimum fashion. The subtle part of the concept is that differentcompanies in the same business may opt to develop different 'mixes'. Infact it is this difference that may provide one company with a competitiveadvantage over its competitors.
.23
McCarthy, Op. Cit.
12
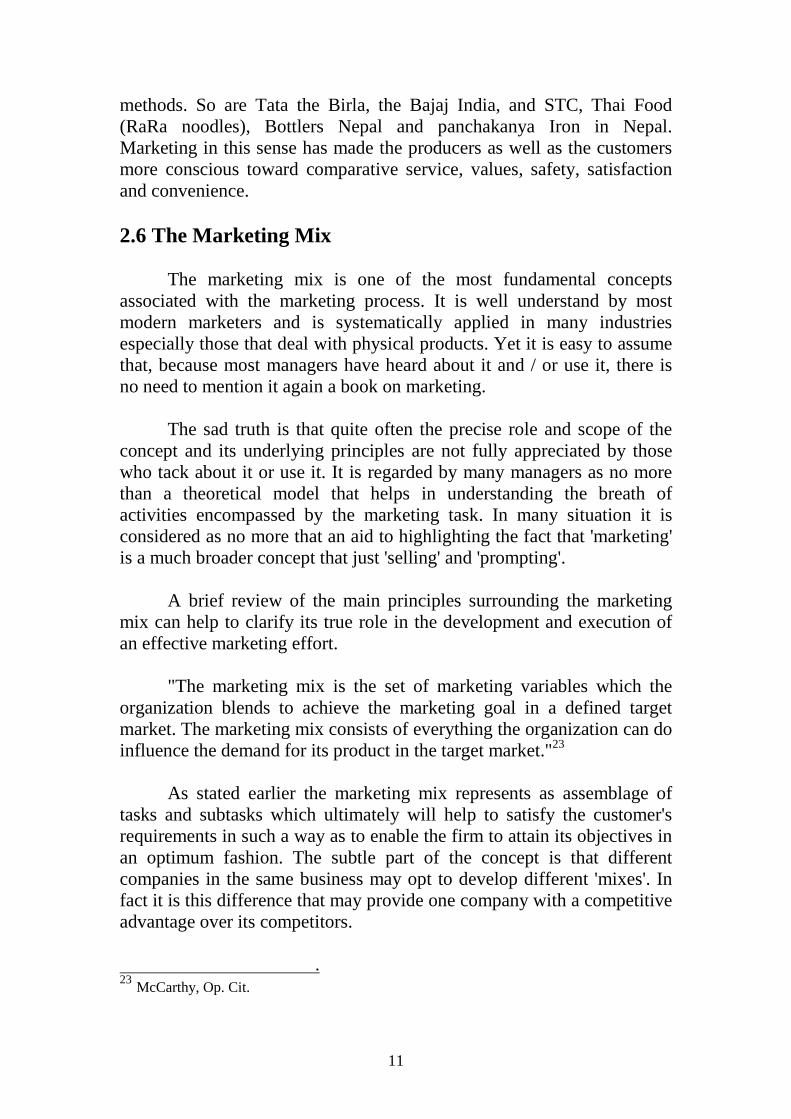
"The concept of the marketing mix essentially premises that thedecision making executive must analyze certain market forces and certainelements of marketing if the executive is ultimately to determine a sound"mix" of marketing elements which promises to be effective andprofitable."24 The 'four Ps model" of the marketing mix has probablygained acceptance because of its elegance rather than its validity in allsituations. Regrettably, what has been gained in simplicity has beensacrificed in universal appropriateness. It is easy to find examples ofmarketing programmers, which do not outset that this model is not ofuniversal validity.
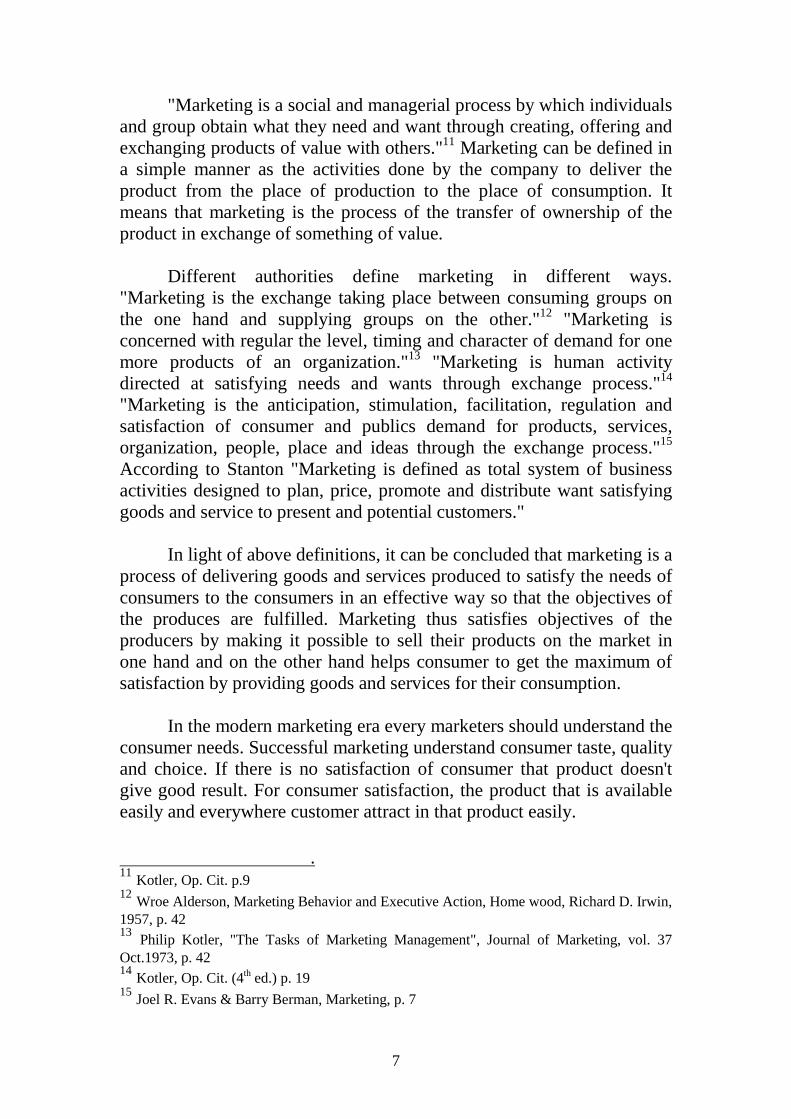
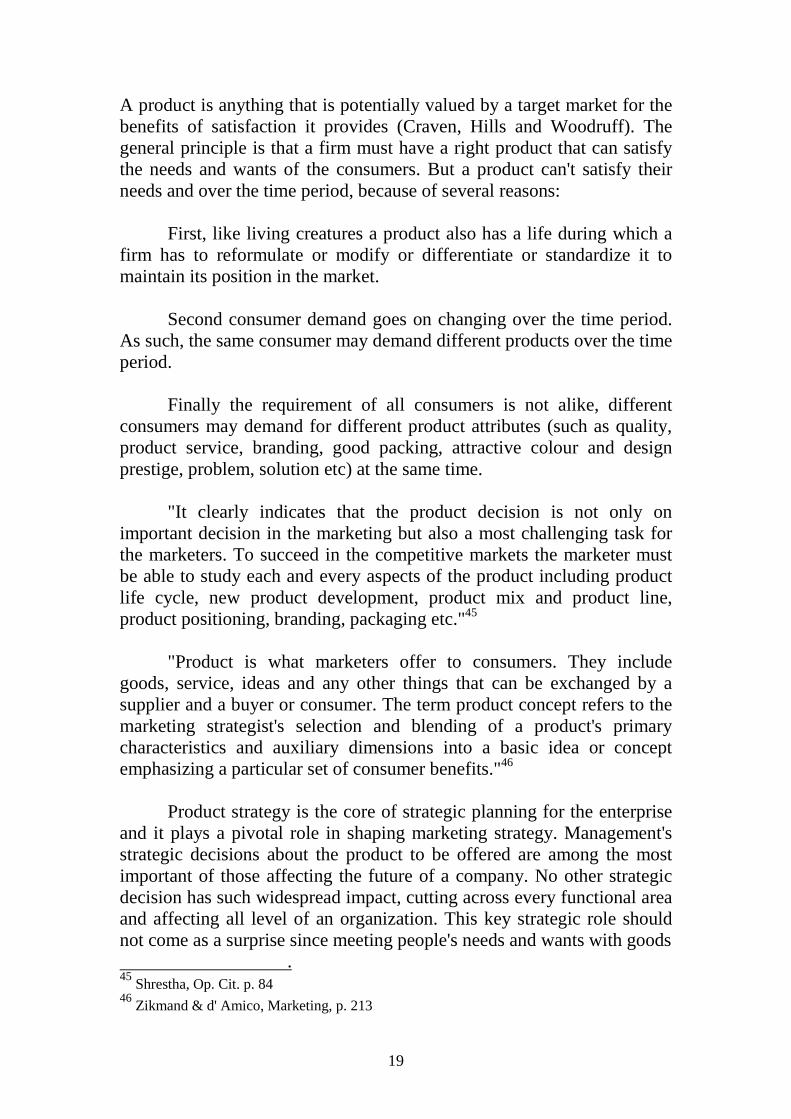
The theory underlying the four Ps is that, if one manager to achievethe right product at the right price with the appropriate promotion, and inthe right place, the marketing programmed will be effective andsuccessful. However, one must bear in mind that each of the four Ps canbe broken down into a number of subcomponents. "Marketing Mix is theset of marketing tools that the firm uses to pursue its marketing objectivesin the target market."25
Figure-3
Product Variety List price Sales promotion ChannelsQuality Discount Advertising CoverageDesign Allowances Sales force AssortmentsFeatures Payment period Public relation LocationsBrand name Credit terms Direct marketing InventoryPackaging TransportSizesServicesWarrantiesReturns
.24
Neil H. Borden and Martin V. Marsall, Advertising Management, Irwin, Homewood, III.1959, p. 2325
Kotler, Op. Cit. p. 92
Marketing Mix
Price PromotionProduct Place
13
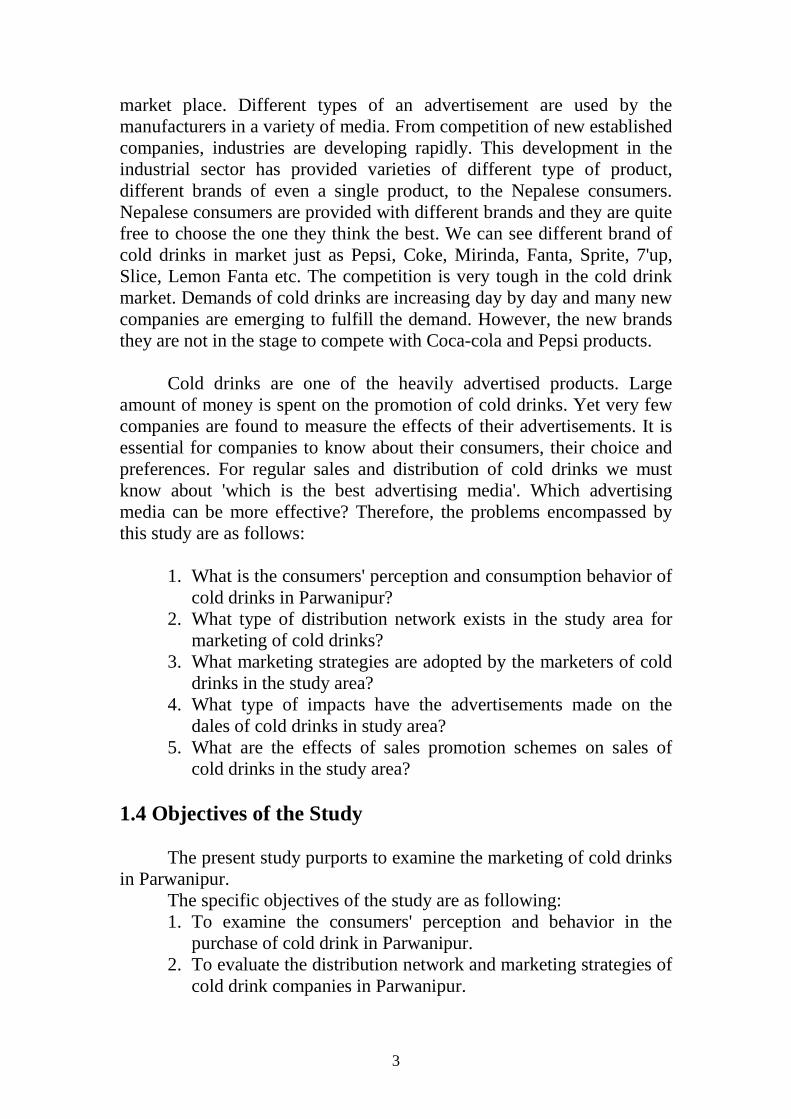
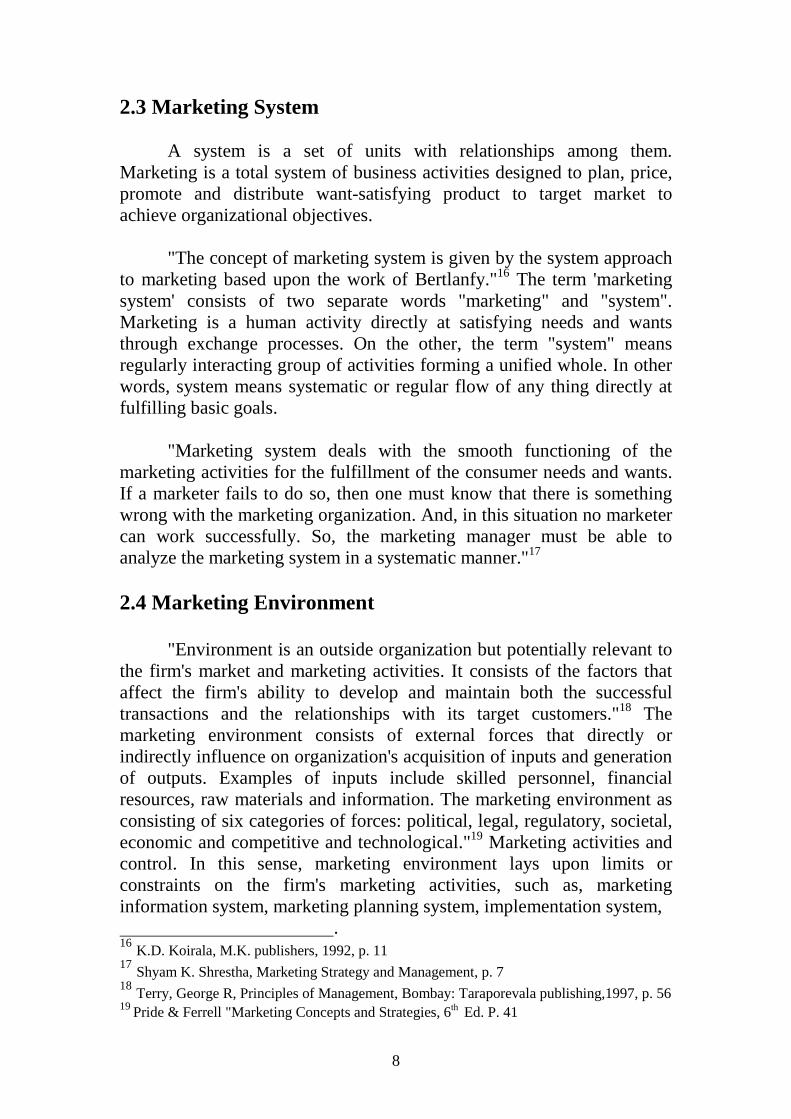
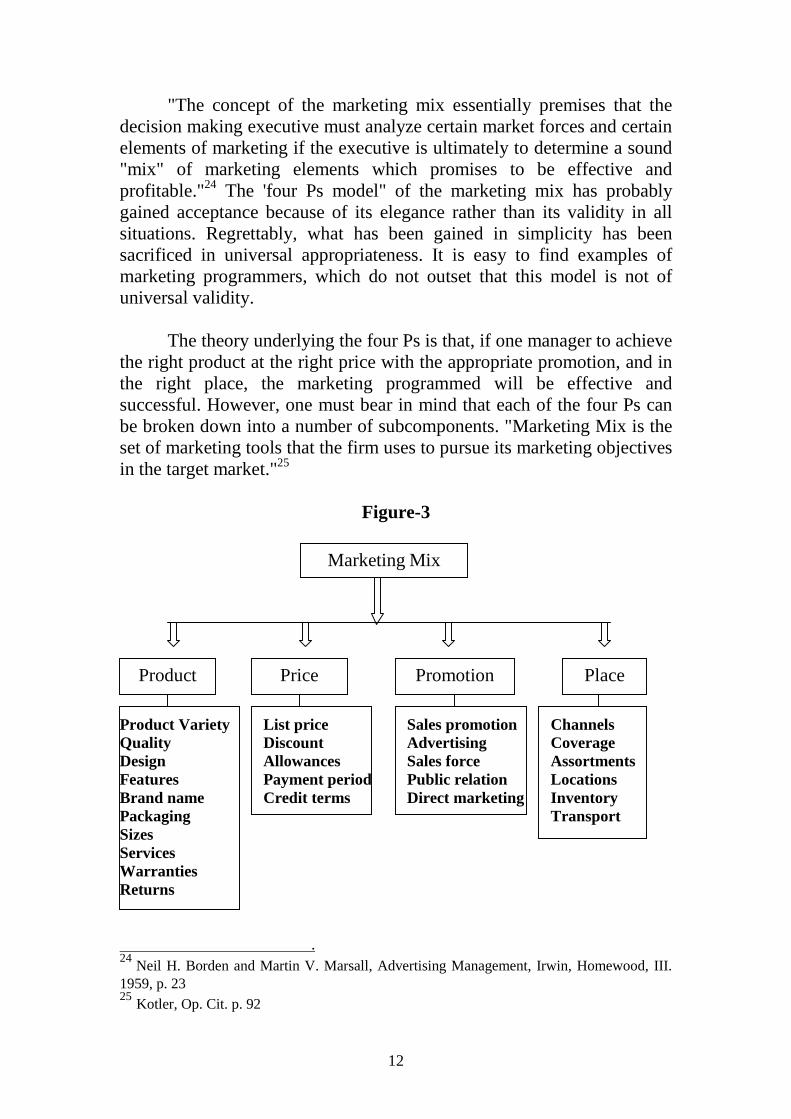
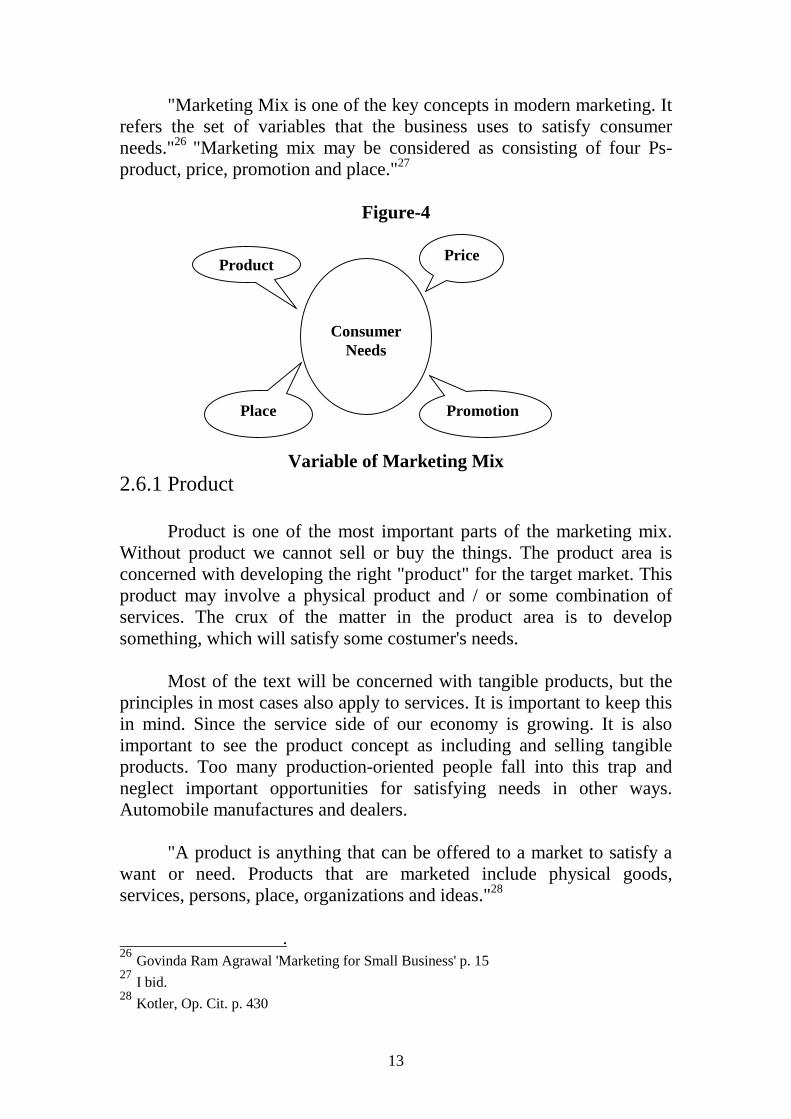
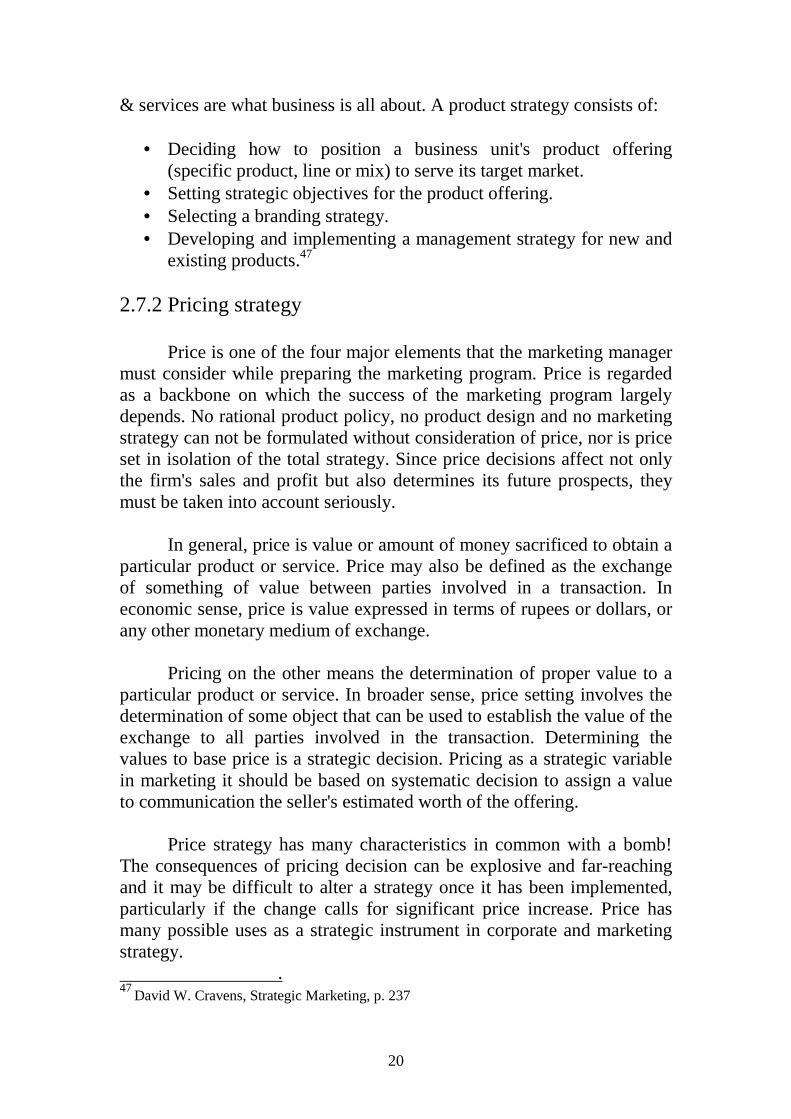
"Marketing Mix is one of the key concepts in modern marketing. Itrefers the set of variables that the business uses to satisfy consumerneeds."26 "Marketing mix may be considered as consisting of four Ps-product, price, promotion and place."27
Figure-4
Variable of Marketing Mix2.6.1 Product
Product is one of the most important parts of the marketing mix.Without product we cannot sell or buy the things. The product area isconcerned with developing the right "product" for the target market. Thisproduct may involve a physical product and / or some combination ofservices. The crux of the matter in the product area is to developsomething, which will satisfy some costumer's needs.
Most of the text will be concerned with tangible products, but theprinciples in most cases also apply to services. It is important to keep thisin mind. Since the service side of our economy is growing. It is alsoimportant to see the product concept as including and selling tangibleproducts. Too many production-oriented people fall into this trap andneglect important opportunities for satisfying needs in other ways.Automobile manufactures and dealers.
"A product is anything that can be offered to a market to satisfy awant or need. Products that are marketed include physical goods,services, persons, place, organizations and ideas."28
.26
Govinda Ram Agrawal 'Marketing for Small Business' p. 1527
I bid.28
Kotler, Op. Cit. p. 430
ConsumerNeeds
Price
PromotionPlace
Product
14
"The product offered by an organization is what the business (or nobusiness) entity is all about. While we tend to think of product as objectswe can see and touch the term product may be used in referring tointangible services and ideas as well. So product is a market's offering asperceived by the market."29 "Product mix includes decisions on productline and mix, product quality, variety, design features, branding,packaging, labeling etc. It also includes important activities such asproduct planning and development."30
2.6.2 Place
A product is not much good to a customer if it is not availablewhen and where he wants it. We must consider where, when and bywhom the goods and services are to be offered for sale.
Goods and services do not flow from products to consumersautomatically. They move through channels of distribution where a greatdeal of marketing work is done. Channel members may or may nothandle the goods. Some may own them and transfer title, while others doneither. Some may provide return and repair services, while also storingand transporting them. And others may be primarily concerned withtransmitting money and information. In the other words, a number ofthings besides goods, flow through a channel both ways.
"Place or distribution mix includes design of the distributionchannels, distribution networks, dealer, promotion and motivationsystems, and physical distribution of the product."31 Any sequence ofmarketing institution, from product to final user or consumer, includingany number of middlemen is called a channel of distribution. Marketingmanagers must work in and through such channels and so our study ofplace will be very important to marketing strategy planning.
"Even though marketing intermediaries are primarily a noncontrollable environmental factor, a marketing executive has considerablelatitude when working with them. Management's responsibility is:
.29
Buell, Op. Cit. p. 2330
Koirala, Op. Cit. p. 1431
Ibid. p. 15
15
1. To select and manage the trade channels through which theproducts will reach the right market at the right time and
2. To develop a distribution system for physically handling andtransporting the products through these channels."32
2.6.3 Promotion
Promotion, one of the four major variables with which themarketing manager works, is communicating information between sellerand buyer with a view to changing attitudes and behavior. The marketingmanager's job is to tell target customers that the right product is availableat the right place at the right price.
"Promotion is the ingredient used to inform and persuade themarket regarding a company's product. Advertising personal selling andsales promotion are the major promotional activities."33
The major promotional methods include personal selling, massselling and sales promotion. Personal selling involves direct face-to-facerelationships between sellers and potential customers. Mass selling isdesigned to communicate with large numbers of customers at the sametime. Advertising is the main form of mass selling, but it also involvespublicity. Sales promotion refers to specific activities that complementpersonal and mass selling such as point of purchase displays booklets,leaflets and direct mailing.
"Companies face the task of distributing the total promotion budgetover the five promotional tools advertising, sales promotion, publicrelations and publicity, sales force and direct marketing. Within the sameindustry, companies can differ considerably in how they allocate theirpromotional budget. It is possible to achieve a given sales level withvarying promotional mixes."34
"It is the variable that communicates to the consumer about othervariable of marketing mix for their need satisfaction. It consists ofadvertising, publicity, personal selling and sales promotion."35
.32
"technological Antecedents of the Modern Marketing Mix", Journal of Macro Marketing,spring p. 1733
W.J Stanton & Futrell, Fundamentals of Marketing p. 5634
Kotler, Op. Cit. p. 62235
Agrawal, Op. Cit. p. 16
16
2.6.4 Price
Price is also one of the major parts of the marketing mix. While themarketing manager is developing the right product and promotion, healso must decide on the right price. One of that will round out hismarketing mix and make it as attractive as possible. In setting the price,he must consider the nature of competition in his target market as well asthe existing practices on markups, discounts and terms of sale. He alsomust consider legal restrictions affecting prices.
"Price mix includes such as analysis of competitors' prices,formulation of pricing objectives, setting the price, determining terms andconditions of sales, discounts and commission etc."36 "In pricing,management must determine the right base price for its products. It mustthen decide on strategies concerning discounts, freight payments, andmany other price related variables."37
"In economic theory, we learn that price, value and utility arerelated concepts. Utility is the attribute of on item that makes it capable ofsatisfying human wants. Value is the quantitative measure of the worth ofa product to attract other products in exchange. Price is value expressedin terms of dollars and cents, or any other monetary medium of exchange.In pricing we must consider more than the physical product alone. Aseller usually is pricing a combination of the physical product and severalservices and want-satisfying benefits. Price is the value placed on goodsand services. Price is the amount of and/or product that are needed toacquire some combination of another product and its accompanyingservices."38
"It is the variable that creates sales revenue. Consumers pay priceto buy products for their need satisfaction. It may be fixed on the basis ofcost, demand or competition. It may involve discounts, allowances, creditfacilities etc. Price has become the second most important variable ofmarketing mix because of inflationary pressures in recent years."39
.36
Koirala, Op. Cit. p. 1537
Stanton, Op. Cit. p. 5638
Ibid. p. 26039
Agrawal, Op. Cit. p. 16
17
2.7 Marketing Strategy
Marketing strategy is both unique and commonplace. That mightsound like a contradiction of terms but it is not. The term "Strategy" iswidely used to describe a seemingly endless number of marketingactivities. Today, everything in marketing seems to be "Strategic." Thereis strategic pricing, strategic market entry, strategic advertising and maybe even strategic strategy. The glut, of competition has focused moreattention on performing traditional marketing actions strategically with aneye towards beating the completion. In that sense, marketing strategy iscommonplace. In recent years it seems to have been appended to nearlyevery marketing action.
Marketing strategy is also unique. There is not be one unifieddefinition upon which marketers agree. Marketing strategy is a commonlyused term, but no one is really sure what it means. "A strategic sector isone in which you can obtain a competitive advantage and exploit strategicsectors are the key to strategy because each sector's frame of reference iscompetition. The largest competitor in an industry can be unprofitable ifthe individual strategic sectors are dominated by smaller competitors."40
Boyd and Larreche (1978) had found in the history of marketing strategythat tremendous confusion over just what strategy is. The term "Strategy"as used in marketing, has been applied to at least three types of issues,each at a different level of aggregation.
At the macro level, there are marketing strategies, which focus, onmanipulations of the marketing mix variables-product, price, place andpromotion. According to that definition, setting a strategy for a productconsists of selecting a price for a product, designing an advertisingcampaign, and then deciding on a plan of distribution. Finally, there areproduct market entry strategies, which include strategies that look atspecific marketing decisions. Strategies that call for a firm to built markershare, harvest profit (and share) or defend share from competitors.Another widely used definition of strategy in marketing emphasizes thebroader perspective of strategy in management. That definition viewsstrategic market planning as a four-step process.
I) Defining the businessII) Setting a mission
.40
Subhash Jain, The Evolution of Strategic Marketing. P. 81
18
III) Selecting functional plans for marketing, production and otherareas and
IV) Budgeting for those plans (A bell and Hamond 1979). In thatsense, marketing strategy is more akin to corporate strategy."41
Strategic marketing is a major component of the strategic planning.Its main objective is to establish the product/market scope of a business.Strategic and marketing is the method that concentrates on the market toserve, the competition to be tackled and the timing of market entry/exitand related moves. Formally, strategic marketing deals with the followingquestions:
Where to complete? How to complete? When to complete?
"Strategic marketing helps to define the market in entering andcompeting. That may be either on entire market or one or more segmentsof the entire market. Strategic marketing provides inputs or techniques forsolving customer need. That technique may be either an introduction of anew product or existing product with improvements. Similarly, strategicmarketing tries to identify an appropriate time for entering to the marketdefined. The appropriate time to enter the market may be the first in themarket or wait until primary demand is established."42
2.7.1 Product Strategy
In the very narrow sense, a product is a set of tangible physicalattributes assembled in an identifiable form. Each product carries acommonly understood descriptive name, such as apples, steel or baseballbats. "A product is a set of tangible and intangible attributes, includingpackaging, colour, price, manufacturer's prestige, retailer's prestige andmanufacturer's and retailer's service."43 "Product is anything that can beoffered to a market for attention, acquisition, use or consumption and thatmight satisfy a want or need. Products include more than just tangiblegoods. Broadly defined, product includes physical objects, service,persons, places, organizations, ideas or mixes of these entities."44
.41
Steven P. Schnaars, Marketing Strategy, p. 1842
Shrestha, Op. Cit. p. 17643
Stanton & Fatrell, Op. Cit. p. 19044
Kotler & Armostrong, Op. Cit. p. 238
19
A product is anything that is potentially valued by a target market for thebenefits of satisfaction it provides (Craven, Hills and Woodruff). Thegeneral principle is that a firm must have a right product that can satisfythe needs and wants of the consumers. But a product can't satisfy theirneeds and over the time period, because of several reasons:
First, like living creatures a product also has a life during which afirm has to reformulate or modify or differentiate or standardize it tomaintain its position in the market.
Second consumer demand goes on changing over the time period.As such, the same consumer may demand different products over the timeperiod.
Finally the requirement of all consumers is not alike, differentconsumers may demand for different product attributes (such as quality,product service, branding, good packing, attractive colour and designprestige, problem, solution etc) at the same time.
"It clearly indicates that the product decision is not only onimportant decision in the marketing but also a most challenging task forthe marketers. To succeed in the competitive markets the marketer mustbe able to study each and every aspects of the product including productlife cycle, new product development, product mix and product line,product positioning, branding, packaging etc."45
"Product is what marketers offer to consumers. They includegoods, service, ideas and any other things that can be exchanged by asupplier and a buyer or consumer. The term product concept refers to themarketing strategist's selection and blending of a product's primarycharacteristics and auxiliary dimensions into a basic idea or conceptemphasizing a particular set of consumer benefits."46
Product strategy is the core of strategic planning for the enterpriseand it plays a pivotal role in shaping marketing strategy. Management'sstrategic decisions about the product to be offered are among the mostimportant of those affecting the future of a company. No other strategicdecision has such widespread impact, cutting across every functional areaand affecting all level of an organization. This key strategic role shouldnot come as a surprise since meeting people's needs and wants with goods
.45
Shrestha, Op. Cit. p. 8446
Zikmand & d' Amico, Marketing, p. 213
20
& services are what business is all about. A product strategy consists of:
Deciding how to position a business unit's product offering(specific product, line or mix) to serve its target market.
Setting strategic objectives for the product offering. Selecting a branding strategy. Developing and implementing a management strategy for new and
existing products.47
2.7.2 Pricing strategy
Price is one of the four major elements that the marketing managermust consider while preparing the marketing program. Price is regardedas a backbone on which the success of the marketing program largelydepends. No rational product policy, no product design and no marketingstrategy can not be formulated without consideration of price, nor is priceset in isolation of the total strategy. Since price decisions affect not onlythe firm's sales and profit but also determines its future prospects, theymust be taken into account seriously.
In general, price is value or amount of money sacrificed to obtain aparticular product or service. Price may also be defined as the exchangeof something of value between parties involved in a transaction. Ineconomic sense, price is value expressed in terms of rupees or dollars, orany other monetary medium of exchange.
Pricing on the other means the determination of proper value to aparticular product or service. In broader sense, price setting involves thedetermination of some object that can be used to establish the value of theexchange to all parties involved in the transaction. Determining thevalues to base price is a strategic decision. Pricing as a strategic variablein marketing it should be based on systematic decision to assign a valueto communication the seller's estimated worth of the offering.
Price strategy has many characteristics in common with a bomb!The consequences of pricing decision can be explosive and far-reachingand it may be difficult to alter a strategy once it has been implemented,particularly if the change calls for significant price increase. Price hasmany possible uses as a strategic instrument in corporate and marketingstrategy.
.47
David W. Cravens, Strategic Marketing, p. 237
21
We define a price strategy as: "Deciding how to position price within the range of feasible prices; establishing whether price shall be used asan active or passive element in the marketing program; setting thespecific objectives to be accomplished by price; and establishing policiesand structure for guiding pricing decisions."48
2.7.3 Distribution Strategy
Distribution is one of the major marketing functions. Without it'seffective and efficient mgmt the whole marketing system may be failed.So that, clever marketing manager should have given due attentiontowards its better functioning. Simply speaking, distribution is thedelivery of the products to the right time, place and consumer. Such aschannel of distribution, transportation, warehousing and inventory controletc.
Most producer work with marketing intermediaries to bring theirproduct to market, they try to forget a distribution channel. A producershould decide how many middlemen he should seek at each level ofdistribution. He will determine the numbers of retailers, wholesalers,agents and so on.
"Distribution may be defined as an operation or a series ofoperation which physically bring the goods manufactured or produced byany particular manufactures in to the hands of the final consumer orusers."49 "Distribution channels are major factors in the effectivesdevelopment of the market share, internationally to maintain quality andensure services, direct distribution is also undertaken by manymanufactures, Also, the use of multiple channels will expand and includetale-marketing direct response marketing, mail-order and computerassisted buying."50
Distribution is concerned with the activities involved intransferring goods from producers to final buyers and users. It includesnot only physical activities, such as transporting and storing goods, butalso the legal promotional, and financial activities performed in thecourse of transferring ownership. Since a succession of enterprises isgenerally involved in the distribution process leading to the final sale to
.48
David W. Cravents, Op. Cit. p. 29449
R.S. Daver, Modern Marketing Management, Bombay, Progressive Cor. (p) Ltd. P. 4050
Willliam Lazer, et. Al. Marketing 2000 and Beyond, Chicago, American MarketingAssociaton, 1990, p. 164
22
the consumer or user, to understand distribution one must analyze boththe different kind of marketing institutions and the marketing channels inwhich they operate.
The means of distribution have a very significant effect upon theprices of goods and a single means is not enough due to the geographicaldiversity. Where is single system this has led to the rise in the price ofcommodities on the one hand and the non-availability of them in time, onthe other hand? These problems have pointed to the necessity of a newmanagement in the means of distribution which specially considers thefactors like the nature of the commodity, the behavior of the customers,effectiveness of time, education and social values.
The distribution channel moves goods from producers toconsumers. It's overcomes time, place and possession gaps that separatesgoods and services from those who would use them. The differentdistribution channels are useful for receiving information, finding andcommunicating with perspective buyers, attempting to agree on price andthe other terms that the transfer of ownership possession can happen.
In today is mass production economy; most producers do not selltheir goods directly to the final users. Distribution channels are among themost complete business organization. "The channel and physicaldistribution programmer are developed to deliver right products at theright place at the right time at the lower cost."51
"Effective control of distribution costs can give an organization anadvantage, if the organization can't control distribution costs profit will beimpaired in the short run and survival may be threatened in the longrun."52
Most producers do not sell their product directly to the finalconsumers that are why; they use a variety of intermediaries, Channelsare the medium for taking the goods and services to ultimate buyers.These organization and agencies are grouped together in variouscombinations linking particular producing units through the channels ofdistribution.
.51
Burr W. Hupp, "Inventory Policy is a Top Mgmt Responsibility" in Donald L. Buwrsox(ed) Reading in Physical Distribution Management, New York: Macmillan company, 1969 p.17952 Ronald J. Lewis, "Strengthening Control of Physical distribution cost" Ibid. p. 316
23
"In today's economy most of the producer of goods and services donot sell their goods directly to the final users. Between them and the finalusers stands a host of marketing intermediaries performing in a variety offunctions and bearing a variety of names. Some middlemen such aswholesalers and retailer buy, take title to, and re-sell the merchandise.They are called merchant middlemen other such as brokers,manufacturers and may negotiate on behalf of the producer but do nottake title to the goods. They are agent middlemen.53
After the product has been produced, producers must distribute orsupply these products to the target markets. In most of the cases,producers use several middlemen or channels of distribution to supplygoods and service to the consumption point.
A channel of distribution shall be considered to comprise a set ofinstitutions, which perform all of the activities utilized to move a productand its title from production to consumption (Bucklin). Channels ofdistribution is an organized network of agencies and institutions which incombination, perform all the activities required to link producers withusers and, users with producers to accomplish the marketing task(Craven, Hills & Woodruff).
These intermediaries or channels of distribution tend to be used forseveral reasons:
I) The number of sellers and buyers and the distance of productmovement are relatively large;
II) The frequency of purchase is high;III) The lot sizes needed by end users are small;IV) Markets are decentralized.
CHANNEL STRUCTURE
There are three levels of marketing channels:I) Direct channelsII) Indirect channelsIII) Mixed channels
.53
Kotler, Op. Cit. p. 175
24
Under direct channel, producer himself distribution goods andservices to the users. No intermediaries are used in this case. Underindirect channel, several intermediaries such as wholesalers, retailer'sdealers, agents etc are used to supply goods and services from productionpoint to the consumption point. Under mixed channel, producer usesdirect as well as indirect channels at the same time for the purpose.
Here, intermediaries or middlemen can be divided into twocategories:
a) Merchant Middlemen; andb) Agents
Merchant middlemen purchase outright and actually take title tothe goods. Merchant middlemen include wholesalers, retailers etc. Agentacts in an agency capacity on behalf of clients and do not take title to thegoods which they deal. They usually charge certain commission in termsof percentage or lump sum.
PHYSICAL DISTRIBUTION
Physical distribution is concerned with the management of physicalflow of goods from the points of suppliers to the points of purchasers.Cravens, Hills and woodruff define physical distribution management asthe process of strategically managing the movement and storage ofmaterials, parts and finished inventory from suppliers, between enterprisefacilities and to customers.54 "Stanton defines physical distribution as theactivities concerned with the movement of the right amount of the rightproducts to the right place of the right time."55
The main objective of physical distribution is getting the rightproduct safely to the right places at the right time at the least possiblecost. More specifically, the objectives of physical distribution are:
a) To provide customer serviceb) To distribute goods more safelyc) To minimize the total costd) To supply goods to the right target market
.54
Kotler, Op. Cit. p. 43355
Stanton, Op. Cit. p. 379
25
Function of physical distribution
A physical distribution system consists of a sell of interrelatedfunctions with specific boundaries. The interrelated functions include thefollowing element:
a) Transportationb) Warehousingc) Inventory Management and controld) Other processinge) Material Handling
Transportation is the element of the physical distribution systemthat links geographically separated markets and facilities. There are fivemodels of transportation:
a) Rail transportb) Highway transportc) Water transportd) Pipe-line transporte) Air transport
Warehousing decision determines the number, size and location ofstorage facilities needed to service customer demand. Developingeffective warehousing strategy includes the decisions regarding thefollowing elements:
Location of warehouse Determine the type of warehouse i.e., private or public warehouse. Evaluate developments in warehousing.
Inventory decisions are concerned with balancing the costs ofcarrying inventory, ordering products from suppliers and controllingother inventory costs to achieve a desired level of consumer satisfaction.Inventory accumulation is expensive, yet availability is essential tohaving satisfied customers.
Ordering processing constitutes the communication linkage thatstimulates a physical distribution system into action. In other words, orderprocessing regards to all those activities involved in collection, checkingand transmitting sales-order information. It is the handling of all paperwork associated with the sale of goods and services offered by anorganization.
26
Material handling, also called the physical handling of goods, is anactivity that is important in inventory, warehousing and transportation.The characteristics of a product determine to a large extent how it will behandled.
2.7.4 Promotional Strategy
Promotional strategy is also one of the most important marketingstrategies. There is various type of promotion. These include advertising,personal selling, sales promotion and various miscellaneous efforts.When management has a message to pass to target consumer's promotionis the proper vehicle.
"Like other marketing tools, both business and non businessorganizations use promotion. The state of Louisiana has been promotingfamily planning since 1965"56 "Promotion can be used to improve theimage of police work as a career"57
A company needs to make marketing decisions only in the areas ofsegmentation, product offering, pricing and distribution but also in thearea of promotion. Promotion is "any marketing effort whose function isto inform or persuade actual or potential consumers about the merits of a(given) product or service for the purpose of inducing a consumer eitherto continue or to start purchasing the firm's product or service at some(given) price."58
Promotion is persuasive communication. It is a highly visibleelement in the marketing mix. It tells the target customers about product,price and place. It is also known as marketing communication."Promotion is applied communication used by marketers to exchangepersuasive messages and information between buyers and sellers."59
"Promotion represents the various communications to inform andpersuade people that a firm directs towards its market target, channelorganization and the public at large. These communications consists of
.56
Adel I. EI-Ansry and Oscar E. Kramer, Jr, "Social Marketing: The Family PlanningExperience" Journal of Marketing p. 37 (1973, July)57
Richard W. Hansen, et. al., "An Application of Marketing Concepts in the Public Sector; Acase study," 1974 Combined Proceeding American Marketing Association (Chicago:American Marketing Association) p. 25258
Wroe Alderson and Paul E. Green, Planning and Problem Solving in marketing, Homewood, II. Richard D. Irwin, Inc., 1964, p. 27059
Zikmund & d' Amico, Op. Cit. p. 473
27
advertising, personal selling and sales promotion activities. Increasingly,marketing management is finding it profitable to combine advertising,personal selling, packaging, point of purchase, direct mail, productsampling, publicity and public relations decisions into an integratedpromotion strategy for communicating with buyers and other involved inmarketing purchasing decision. Since each type of promotion has certainstrengths and short comings, the strategy adopted should capitalize uponthe advantages of every component in shaping a cost effectivecommunications mix."60
There are various promotion methods.
Advertising:"Unlike personal selling and some sales promotion and public
relation techniques, advertising is an impersonal means ofcommunication. Advertising is an impersonal promotion to groups that ispaid for by an identified sponsor. It focuses upon group of persons, ratherthan upon individuals."61 "Advertising can be described as any paid fromof non-personal communication by a sponsor."62 "Advertising includesany persuasive message carried by a mass medium and paid for by asponsor who sings the message."63
Personal Selling:"Personal selling can be a very intense means of promotion.
Personal selling consists of person-to-person communication betweensales persons and their prospects. Unlike advertising, it involves personalinteraction between the source and the destination."64 "Personal sellingrefers to oral presentation to one or more customers in a face-to-facesituation for stimulating demand for products and services or enhancingcompany image."65 "Personal selling is a person-to-person dialoguebetween buyer and seller where the purpose of the interaction, whetherface-to-face or over the phone, is to persuade to buyer to accept a point ofview or to convince the buyer to take a specific course of action."66
.60
David W. Cravens, Op. Cit. p. 31961
Robin Peterson, Marketing A Contemporary Introduction, p. 43962
Dholakia, Khurana, Bhandari and Jain, Marketing Management: Cases & Concepts. p. 35363
Douglass Johnson, Advertising Today, Chicago III, Science Research Associates, 1978 p. 164 and 65
Ibid. p. 35366
Zikmund & d' Amico, Op.Cit. p. 475
28
Sales Promotion:"According to the American Marketing Association, sales
promotion is," Those marketing activities, other than personal selling,advertising and publicity that stimulate consumer purchasing and dealereffectiveness, such as displays, shows and expositions, demonstrationsand various no recurrent selling efforts not in the ordinary routine."67
Sales promotion activities are impersonal and usually nonrecurring andare directed to supplement the advertising and personal selling efforts.Examples of sales promotion are free product samples, trading stamps,store displays, premiums, coupons and trade shows. "Sales promotion canbe defined as those promotional activities other than personal selling,advertising and publicity that are intended to stimulate buyer purchases orleader effectiveness in a specific time period."68
Publicity:"Publicity is a means of promoting to the mass market. Publicity is
similar to advertising, except that it is free, is found in the editorialportion of news media and pertains to newsworthy events, The mostcommon types of publicity are news released (also called press releases),photographs and feature stories."69 "Publicity is similar to advertisingexcept that it involves an unpaid and unsigned message, even though itmay use the same mass media as advertising does."70
Public Relations:"Marketers engage in public relations in order to develop a
favorable image of their organizations and products in the eyes of thepublic, they direct this activity to parties other than target consumers.These 'others' include the public at large labour union, the press andenvironmentalist groups. Public relations activities include sponsoringfloats in parades, lobbying and using promotion messages to persuademembers of the public to take a desired position."71
. .67
Committee on Definitions, American Marketing Association, Marketing Definition; AGlossary of Marketing, 1960 p. 2068
Zikmund & d' Amico, Op. Cit. p. 47769
Rollie Tillman and C.A. Kirkpatrick, Promotion: Persuasive Communication in Marketing,Homewood, I II: Richard D. Irwin, Inc, 1968 p. 36570
Zikmund & d' Amico, Op. Cit. p. 47671
Robin Peterson, Marketing A Contemporary Introduction, p. 443
29
PROMOTION STRATEGIES
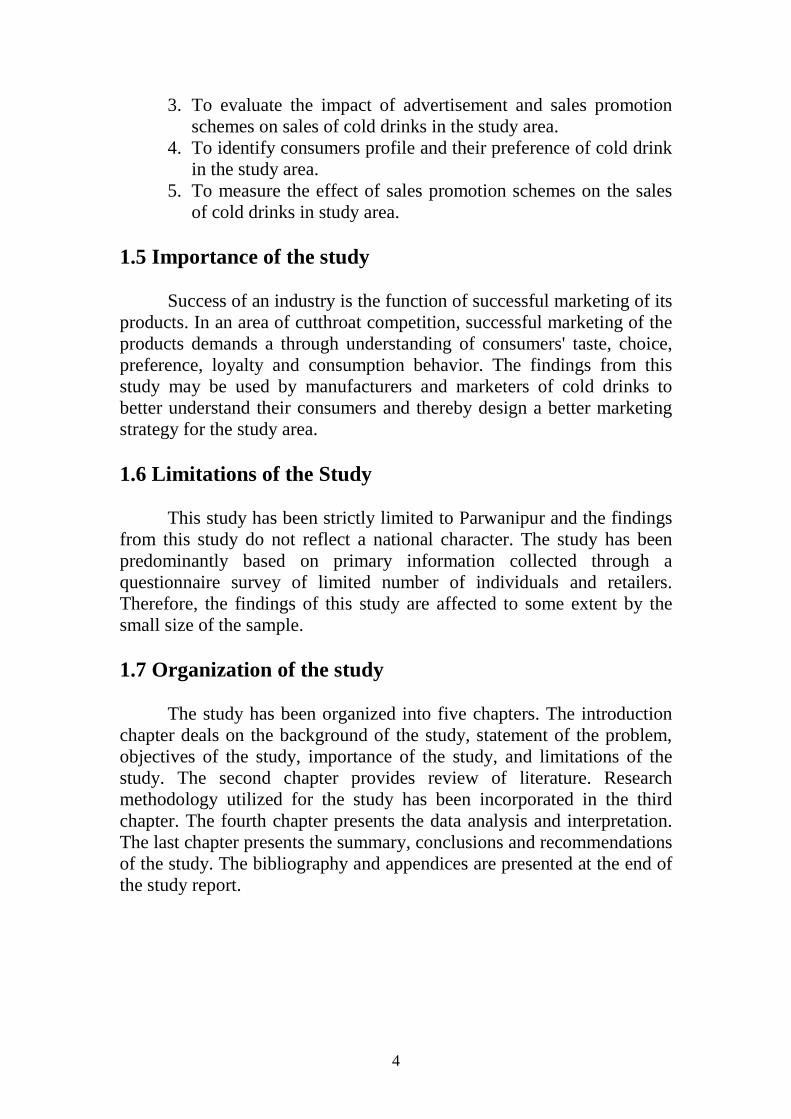
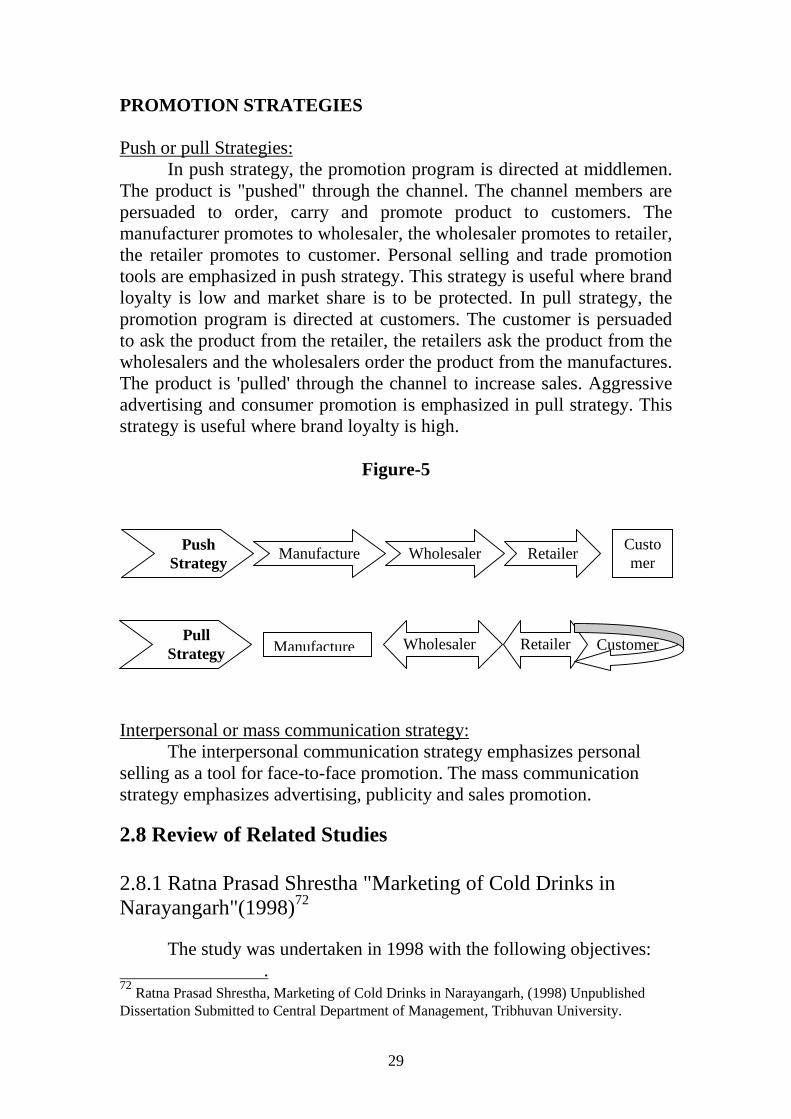
Push or pull Strategies:In push strategy, the promotion program is directed at middlemen.
The product is "pushed" through the channel. The channel members arepersuaded to order, carry and promote product to customers. Themanufacturer promotes to wholesaler, the wholesaler promotes to retailer,the retailer promotes to customer. Personal selling and trade promotiontools are emphasized in push strategy. This strategy is useful where brandloyalty is low and market share is to be protected. In pull strategy, thepromotion program is directed at customers. The customer is persuadedto ask the product from the retailer, the retailers ask the product from thewholesalers and the wholesalers order the product from the manufactures.The product is 'pulled' through the channel to increase sales. Aggressiveadvertising and consumer promotion is emphasized in pull strategy. Thisstrategy is useful where brand loyalty is high.
Figure-5
Interpersonal or mass communication strategy:The interpersonal communication strategy emphasizes personal
selling as a tool for face-to-face promotion. The mass communicationstrategy emphasizes advertising, publicity and sales promotion.
2.8 Review of Related Studies
2.8.1 Ratna Prasad Shrestha "Marketing of Cold Drinks inNarayangarh"(1998)72
The study was undertaken in 1998 with the following objectives:.
72Ratna Prasad Shrestha, Marketing of Cold Drinks in Narayangarh, (1998) Unpublished
Dissertation Submitted to Central Department of Management, Tribhuvan University.
WholesalerManufacture RetailerCustomer
PushStrategy
PullStrategy Manufacture RetailerWholesaler Customer
30
a) To examine the potential consumers in purchasing cold drinks.b) To identify the purchases behavior of consumers who purchase
cold drinks.c) To estimate demand of cold drinks in Narayangarh.d) To identify the best choice of consumers on cold drinks on the
basis of selecting brands advertising habitual testing, askingquestion & personal inspection.
e) To find the relationship between the brand preference andadvertising.
f) To find out the popular media of advertising for the cold drinks,which can easily attract the potential consumers on each company,branded cold drink.
g) To estimate sales of cold drinks in Narayangarh.
The study has concluded that advertising is considered as theprimary source of information. The advertisement of Coke, Pepsi andother branded cold drinks are found in Narayangarh. Coca cola brand ismore popular than other brand. Consumer gives more preference to thebrand but less preference to quality and test. Television is the mostlyfavorite media for advertisement. The major reasons of brand switchingare the taste of the product.
The study has recommended that advertising should be morebelievable and effective, so manufactures are suggested to advertise theirproduct through television and other media. Most of consumer are foundbrand. So the marketers are suggested to give proper attention on theirdistribution system. It is suggested that the manufactures of cold drink,should try to fulfill consumer's demand on cold drinks of their choice.
2.8.2 Krishna Prasad Pathak, in 1998 conducted the study on"Coffee Marketing System in Nepal" with the followingobjectives: 73
a) To analyze the present phenomena, for the farmers engaged incoffee farming.
b) To assess the existing coffee marketing system.c) To analyze the challenges, problems and profitability of farming,
processing and marketing of coffee and professional standards.d) To recommend measure for improvement.
.73
Krishna Prasad pathak, Coffee Marketing in Nepal, (1998), Unpublished DissertationSubmitted to Central Department of Management, Tribhuvan University.
31
From this study, the following conclusions have been deduced. Nepalesefarmers are motivated to plant coffee for better yield and they needtechnical support and training for professional farming skills. There is nosupport to farmers. In put supply and sales security were very weak.Recently emerging community activities show better symptoms in thisrespect. Pricing to support formers was effective due to increasedcompetition. Market promotion is weak and packing is the first place tostart promotional campaign. Now push sales is the only measure and nopromotions are done. Distribution system components are assemblytransportation, processing and order processing. Through Nepalesedomestic production covers only 22.9 percent of domestic market,Nepalese coffee is worth exporting and Nepalese consumers preferinstant coffee mainly imported from India. It shows that Nepal candevelop coffee, as an important cash crop to generate exports, whichshould help in economic growth, employment generation and mitigatingthe ever-increasing unfavorable balance of trade, for this professional andinstitutional approach, is warranted for.
The study has recommended that select better seeds appropriate forNepalese landscape and climate should be conducted. Interest rate 17% isnot appropriate for farming and is very high. Enterprising farmers shouldbe trained so as to make them the bridge between the ordinary farmersand technical experts. Wet pulping should be introduced and farmersshould be facilitated to pulp, hull and grade the beans and green beansshould be introduced in trade. There should be improved in packing ofroasted coffee. Demonstration farms should be developed as the catalyststo incorporate rural people in modern business ethics. Professionalizeshould be encouraged in coffee marketing.
2.8.3 Shree Chandra, in 1998 conducted a study on "SalesPromotion and its Effect on Sales"
A case study of Beer Market of Nepal with the objectives ofanalyzing the sales promotion and its effect on sales especially in case ofbeer market of Nepal.74 Through the concept of sales promotion isrelatively new in Nepal. There are lots of thinks to be researched and findout on the practice of sales promotion. The study had the followingspecific objectives:
.74
Shree Cahandra Bhatta, Sales Promotion and Its Effects on Sales: A Case Study of BeerMarket of Nepal, (1998), Unpublished Dissertation Submitted to Central Department ofManagement, Tribhuvan University.
32
a) To find out whether the sales promotion does impact on sales ofbeer.
b) To find out what mode of sales promotion is more acceptable bythe Nepalese consumers.
c) To find out what mode is more wisely used by the manufacturersas a sales promotion tools.
d) To evaluate effectiveness of sales promotion activities in the salesof beer in Nepal.
e) To find out which media is suitable to advertise about the salespromotion.
f) To predict the sales of coming year if every factors would be thesame.
On the basis of analysis of the consumers view point and sales dataseparately. The following finding is drawn. The people with high-incomegroup highly educated and from business people tend to drink beers more.The people drink beer at restaurants for relaxation rather than other cause.The people prefer San Miguel brand than other beers. In the case of Salespromotion people are insisted by the cash prizes out of all the tools. Inadvertising, electronic media is very popular among the people. If theexpenses on sales promotion increase the sales increase in a high speed.From the regression it is clearly seen that if the expenses on the salespromotion increases the sales of the product will be increases. It isconcluded that sales promotion works as a starter to the beer drinkers.Most people, who are not so educated, are not loyal to wards anyparticular brand. Due to this, the sales promotions easily quench theattention of those beer drinkers and as a result the sales of the beer willincrease.
The people who drink beers accept electronic media most. So farsales promotion purpose, the electronic media is very suitable. The salespromotion is very powerful tools which can easily boots the sales. Thestudy has recommended that low-income group as well as low educationgroup should be launched the beer. In advertising, the electronic media isvery popular. So the heavy media coverage should be acquired. Peoplelike cash prizes so company should cut down the prize like motorcycles,fridge, TV etc. Findings proved that the sales promotion have positiveimpacts on the sales of the beers. But the companies launched the salespromotion programmers for only 3 months. It is strongly advised thatsales promotion programmers should be launched at least for 6 months.At last, sales promotion is very important if the use would be in a properway.
33
3. RESEARCH METHODOLOGY
3.1 Introduction
The objective of this study is to examine the marketing of colddrinks in Parwanipur. In this study, the necessary relevant data have beencollected from the sample consumers and retailers. To achieve thisobjective, the study follows a research methodology, which has beendescribed as the following.
3.2 Research Design
This study is based on a survey research design. A limited scalesurvey has been conducted among the consumers and retailers of colddrink in Parwanipur. Two sets of questionnaire have been administered inorder to generate data and other information relating to the researchquestions adopted for this study.
3.3 Population and Sample
As the total population of cold drink users of presently availablebrands is hard to find in number, the study takes the population as thetotal consumers of cold drinks in Parwanipur VDC. The study hasincluded 150 consumers and 15 retailers of cold drinks based on studyarea. Though the sample size is very small in comparison to the totalpopulation, sufficient efforts have been made to make the samplerepresentative by including consumers from the different professions, agegroup, educational backgrounds and sex.
3.4 Nature and Sources of Data
This study is based mainly on primary data collected directly formthe respondents. The respondents for this study are the consumers and theretailers of cold drink in parwanipur. Most information has been collectedfrom the primary source through the questionnaires and oral conversationwith concerned distributors and consumers. The questionnaires weredistributed to the consumers and retailers of front of Himal Iron and SteelP.Ltd., Parwanipur and around for collecting necessary information.
34
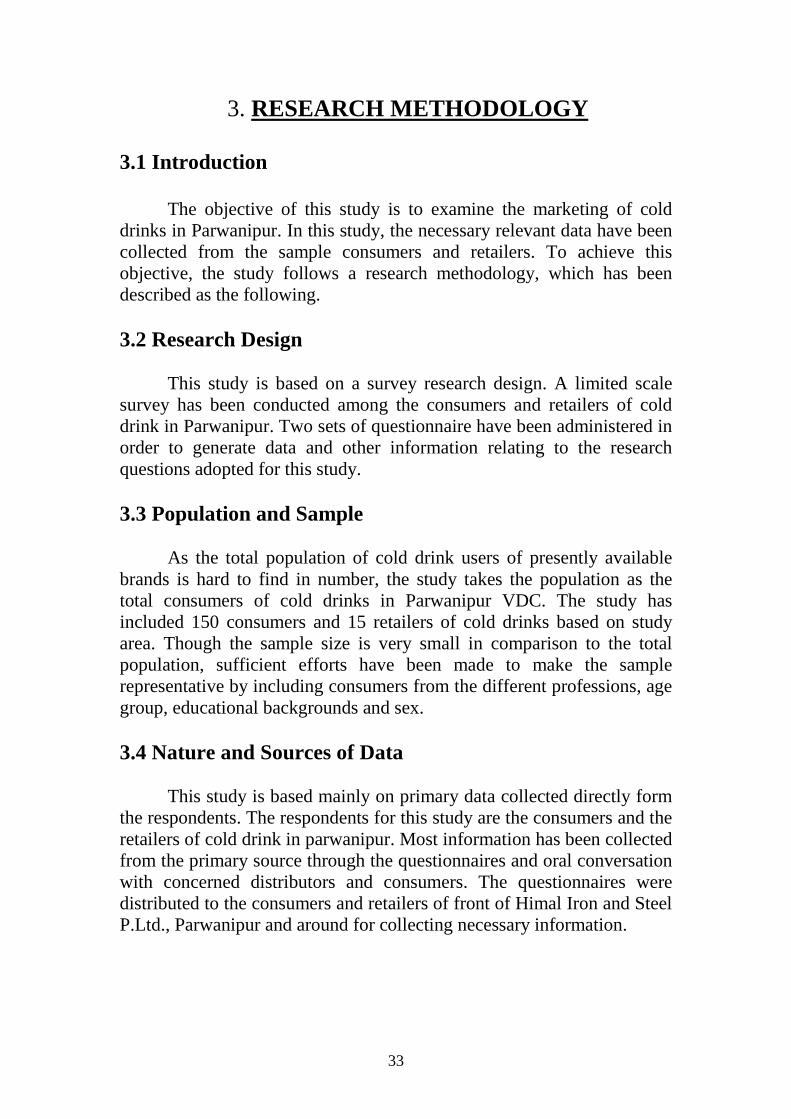
Table- 3.1
The Size of sample and ResponsesRespondents Sample Size Questionnaires % Question
ReturnConsumer 150 150 100Retailers 15 15 100
Total 165 165 100
As shown in table 3.1, 150 consumers and 15 retailers wereinterviewed by the research with the help of two different sets ofstructured questionnaires. Apart from the data collected through thequestionnaire, some supplementary primary data provided by thedistributors have been used in this study. The questionnaires used in thisstudy are presented in the appendix.
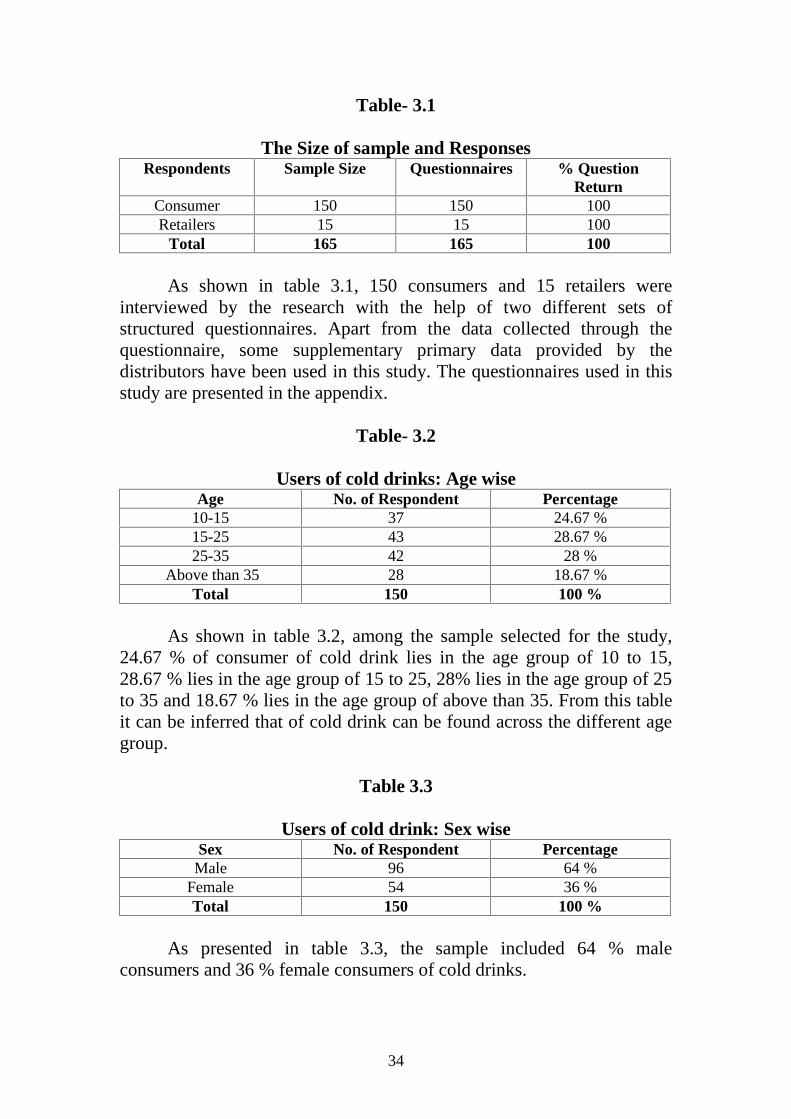
Table- 3.2
Users of cold drinks: Age wiseAge No. of Respondent Percentage
10-15 37 24.67 %15-25 43 28.67 %25-35 42 28 %
Above than 35 28 18.67 %Total 150 100 %
As shown in table 3.2, among the sample selected for the study,24.67 % of consumer of cold drink lies in the age group of 10 to 15,28.67 % lies in the age group of 15 to 25, 28% lies in the age group of 25to 35 and 18.67 % lies in the age group of above than 35. From this tableit can be inferred that of cold drink can be found across the different agegroup.
Table 3.3
Users of cold drink: Sex wiseSex No. of Respondent Percentage
Male 96 64 %Female 54 36 %Total 150 100 %
As presented in table 3.3, the sample included 64 % maleconsumers and 36 % female consumers of cold drinks.
35
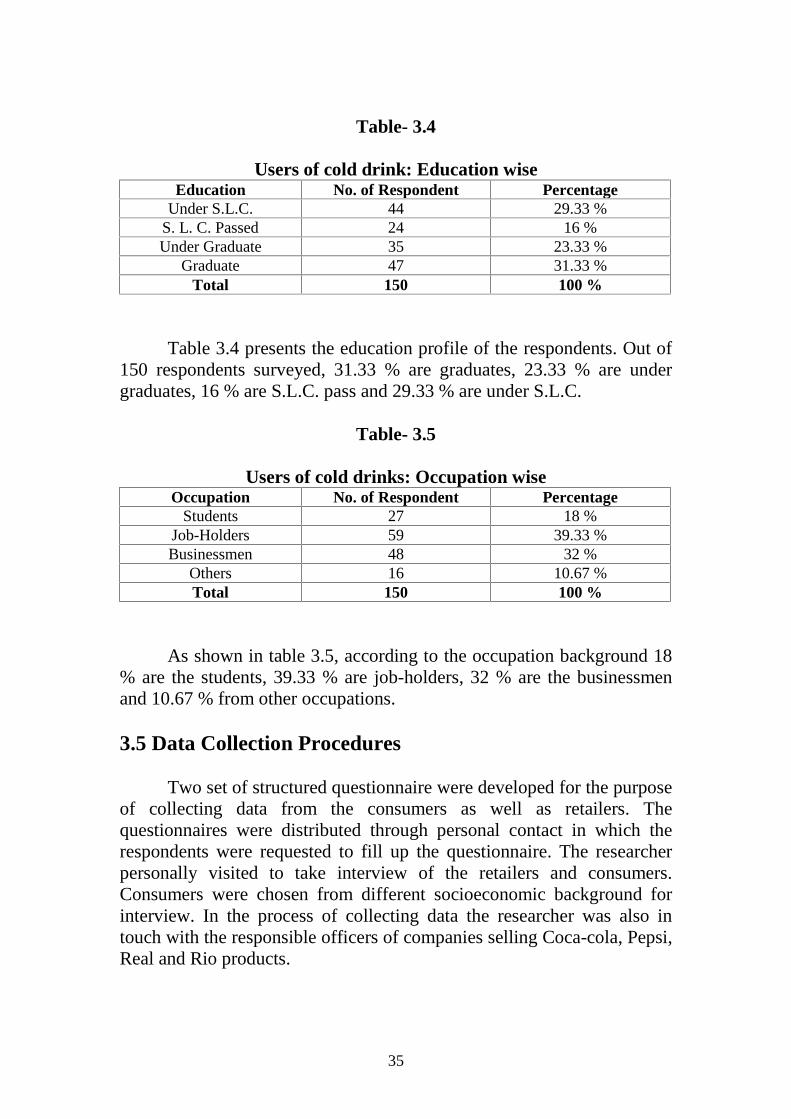
Table- 3.4
Users of cold drink: Education wiseEducation No. of Respondent Percentage
Under S.L.C. 44 29.33 %S. L. C. Passed 24 16 %Under Graduate 35 23.33 %
Graduate 47 31.33 %Total 150 100 %
Table 3.4 presents the education profile of the respondents. Out of150 respondents surveyed, 31.33 % are graduates, 23.33 % are undergraduates, 16 % are S.L.C. pass and 29.33 % are under S.L.C.
Table- 3.5
Users of cold drinks: Occupation wiseOccupation No. of Respondent Percentage
Students 27 18 %Job-Holders 59 39.33 %Businessmen 48 32 %
Others 16 10.67 %Total 150 100 %
As shown in table 3.5, according to the occupation background 18% are the students, 39.33 % are job-holders, 32 % are the businessmenand 10.67 % from other occupations.
3.5 Data Collection Procedures
Two set of structured questionnaire were developed for the purposeof collecting data from the consumers as well as retailers. Thequestionnaires were distributed through personal contact in which therespondents were requested to fill up the questionnaire. The researcherpersonally visited to take interview of the retailers and consumers.Consumers were chosen from different socioeconomic background forinterview. In the process of collecting data the researcher was also intouch with the responsible officers of companies selling Coca-cola, Pepsi,Real and Rio products.
36
3.6 Data Processing and Analysis
The raw data collected through the questionnaire have beenmanually processed and presented in the form of tables. Once the data arearranged sequentially, simple statistical tools were used for analysis. Theprocessed data have also been presented graph, bar diagram and pie chart.All the questionnaires were distributed and collected by the researcherherself. So there was no delay in collection of the questionnairesdistributed to the consumers. Every questionnaire was thoroughlychecked after the collection.
37
4. DATA PRESENTATION AND ANALYSIS
This chapter incorporates data presentation and analysis. The data andinformation collected from the consumers and retailers have beenpresented, analyzed and interpreted in this chapter for attaining the statedobjectives of the study. This chapter first presents the consumer levelsurvey and then the retailer level survey. After analysis and interpretation,the major findings of the study are included at the end of this chapter.
4.1 Consumer Survey
Table 4.1
Cold drink Users and their Favorite BrandBrand No. of Respondent PercentageCoke 104 69.33 %Fanta 9 6 %Sprite 9 6 %Pepsi 6 4 %Real 17 11.33 %Rio 2 1.33 %
Mirinda 3 2 %150 100
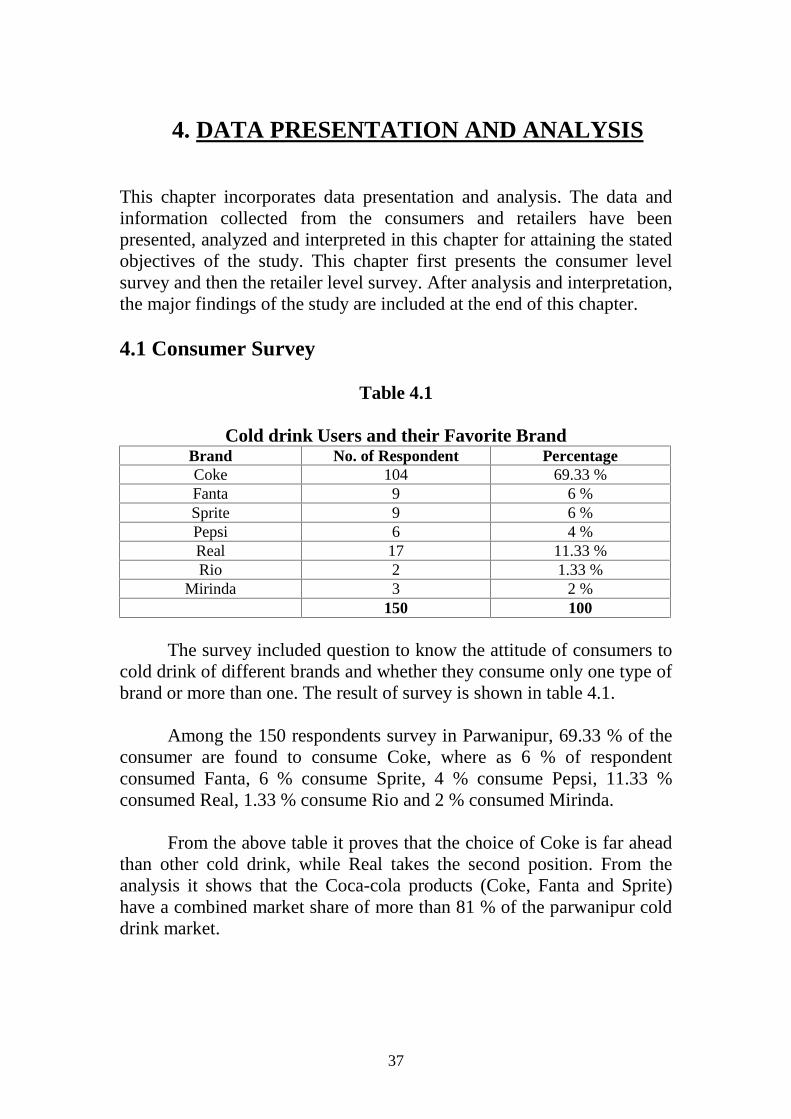
The survey included question to know the attitude of consumers tocold drink of different brands and whether they consume only one type ofbrand or more than one. The result of survey is shown in table 4.1.
Among the 150 respondents survey in Parwanipur, 69.33 % of theconsumer are found to consume Coke, where as 6 % of respondentconsumed Fanta, 6 % consume Sprite, 4 % consume Pepsi, 11.33 %consumed Real, 1.33 % consume Rio and 2 % consumed Mirinda.
From the above table it proves that the choice of Coke is far aheadthan other cold drink, while Real takes the second position. From theanalysis it shows that the Coca-cola products (Coke, Fanta and Sprite)have a combined market share of more than 81 % of the parwanipur colddrink market.
38
Table- 4.2
Suitable time for taking cold drinkOptions No. of Respondent Percentage
Before Lunch 8 5.33 %After Lunch 11 18.33 %
Tiffin Time (day) 108 67.5 %Evening 19 12.67 %
Before Dinner 2 1.33 %After Dinner 2 1.33 %
Total 150 100 %
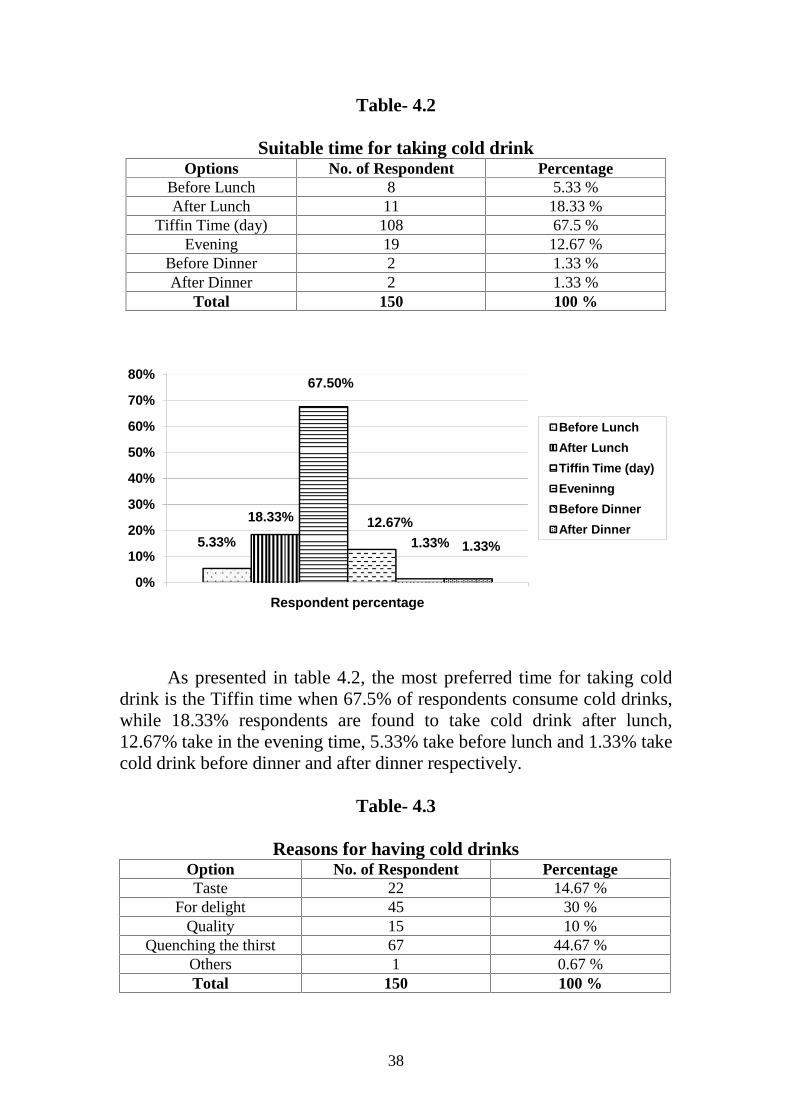
As presented in table 4.2, the most preferred time for taking colddrink is the Tiffin time when 67.5% of respondents consume cold drinks,while 18.33% respondents are found to take cold drink after lunch,12.67% take in the evening time, 5.33% take before lunch and 1.33% takecold drink before dinner and after dinner respectively.
Table- 4.3
Reasons for having cold drinksOption No. of Respondent PercentageTaste 22 14.67 %
For delight 45 30 %Quality 15 10 %
Quenching the thirst 67 44.67 %Others 1 0.67 %Total 150 100 %
5.33%
18.33%
67.50%
12.67%1.33% 1.33%
0%
10%
20%
30%
40%
50%
60%
70%
80%
Respondent percentage
Before LunchAfter LunchTiffin Time (day)EveninngBefore DinnerAfter Dinner
39
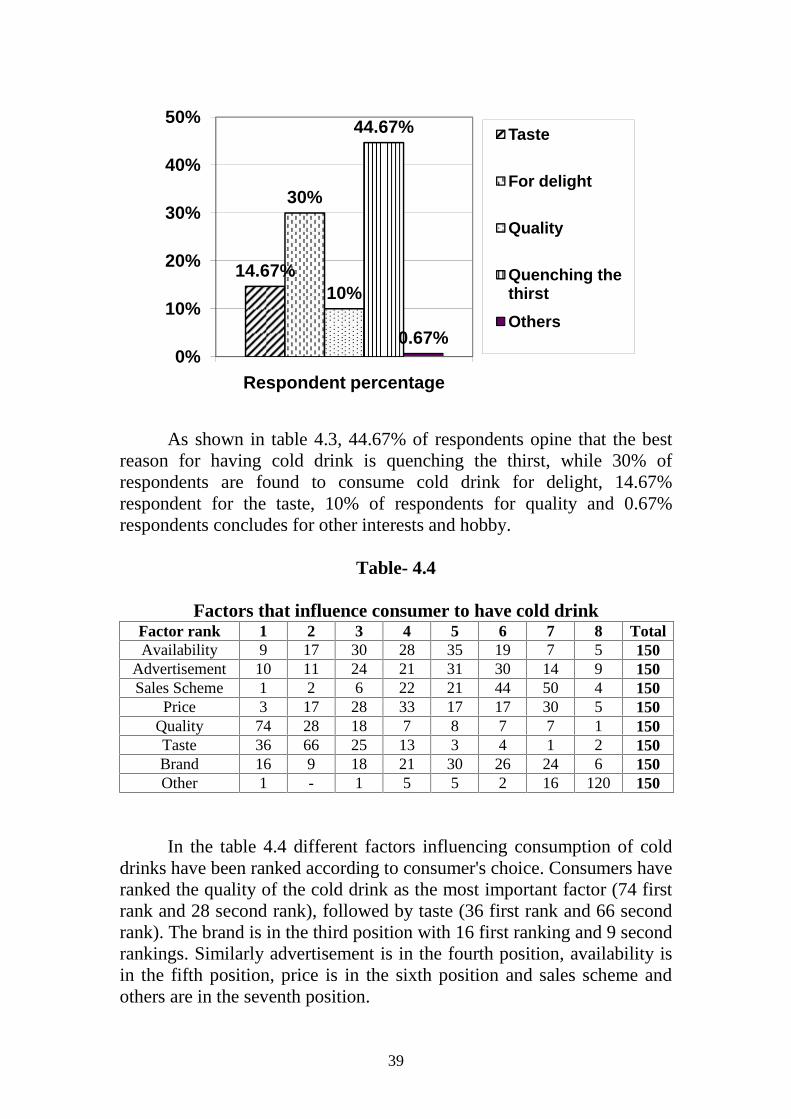
As shown in table 4.3, 44.67% of respondents opine that the bestreason for having cold drink is quenching the thirst, while 30% ofrespondents are found to consume cold drink for delight, 14.67%respondent for the taste, 10% of respondents for quality and 0.67%respondents concludes for other interests and hobby.
Table- 4.4
Factors that influence consumer to have cold drinkFactor rank 1 2 3 4 5 6 7 8 TotalAvailability 9 17 30 28 35 19 7 5 150
Advertisement 10 11 24 21 31 30 14 9 150Sales Scheme 1 2 6 22 21 44 50 4 150
Price 3 17 28 33 17 17 30 5 150Quality 74 28 18 7 8 7 7 1 150Taste 36 66 25 13 3 4 1 2 150Brand 16 9 18 21 30 26 24 6 150Other 1 - 1 5 5 2 16 120 150
In the table 4.4 different factors influencing consumption of colddrinks have been ranked according to consumer's choice. Consumers haveranked the quality of the cold drink as the most important factor (74 firstrank and 28 second rank), followed by taste (36 first rank and 66 secondrank). The brand is in the third position with 16 first ranking and 9 secondrankings. Similarly advertisement is in the fourth position, availability isin the fifth position, price is in the sixth position and sales scheme andothers are in the seventh position.
14.67%
30%
10%
44.67%
0.67%0%
10%
20%
30%
40%
50%
Respondent percentage
Taste
For delight
Quality
Quenching thethirstOthers
40
This indicates that consumers give higher preference to the quality,taste and brand name in the choice of cold drink, moderate levelpreference to availability, advertisement and price factors and lowerpreference to the sales scheme and other factors.
Table- 4.5
Suitable place for having cold drinkOptions No. of Respondent Percentage
Own house 48 32 %Store and Restaurant 84 56 %
Picnic 7 4.67 %Festival 6 4 %Others 5 3.33 %Total 150 100 %
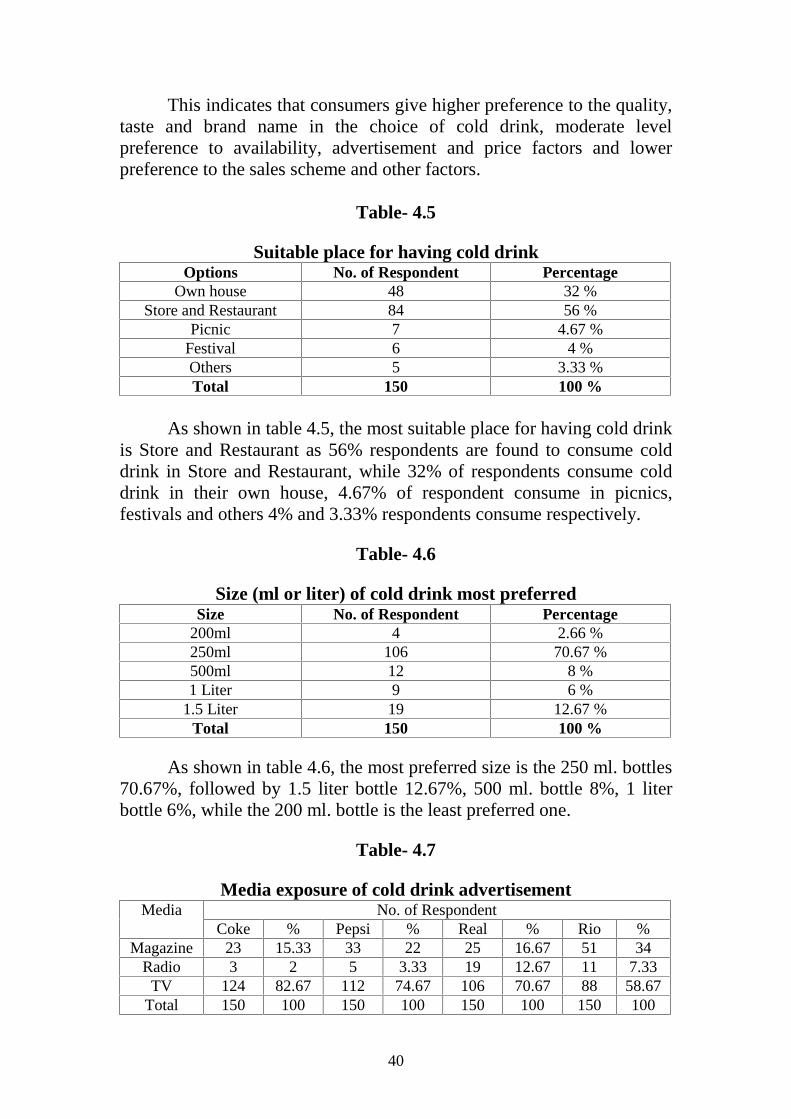
As shown in table 4.5, the most suitable place for having cold drinkis Store and Restaurant as 56% respondents are found to consume colddrink in Store and Restaurant, while 32% of respondents consume colddrink in their own house, 4.67% of respondent consume in picnics,festivals and others 4% and 3.33% respondents consume respectively.
Table- 4.6
Size (ml or liter) of cold drink most preferredSize No. of Respondent Percentage
200ml 4 2.66 %250ml 106 70.67 %500ml 12 8 %1 Liter 9 6 %
1.5 Liter 19 12.67 %Total 150 100 %
As shown in table 4.6, the most preferred size is the 250 ml. bottles70.67%, followed by 1.5 liter bottle 12.67%, 500 ml. bottle 8%, 1 literbottle 6%, while the 200 ml. bottle is the least preferred one.
Table- 4.7
Media exposure of cold drink advertisementMedia No. of Respondent
Coke % Pepsi % Real % Rio %Magazine 23 15.33 33 22 25 16.67 51 34
Radio 3 2 5 3.33 19 12.67 11 7.33TV 124 82.67 112 74.67 106 70.67 88 58.67
Total 150 100 150 100 150 100 150 100
41
From the table 4.7, it has been found that the consumers have moreexposure of cold drink advertisements through the television as this figurefor Coke, Pepsi, Real and Rio are 82.67%, 74.67%, 70.67% and 58.67%respectively. The second most important exposure is provided bymagazines, while exposure through radio is found to be very low.
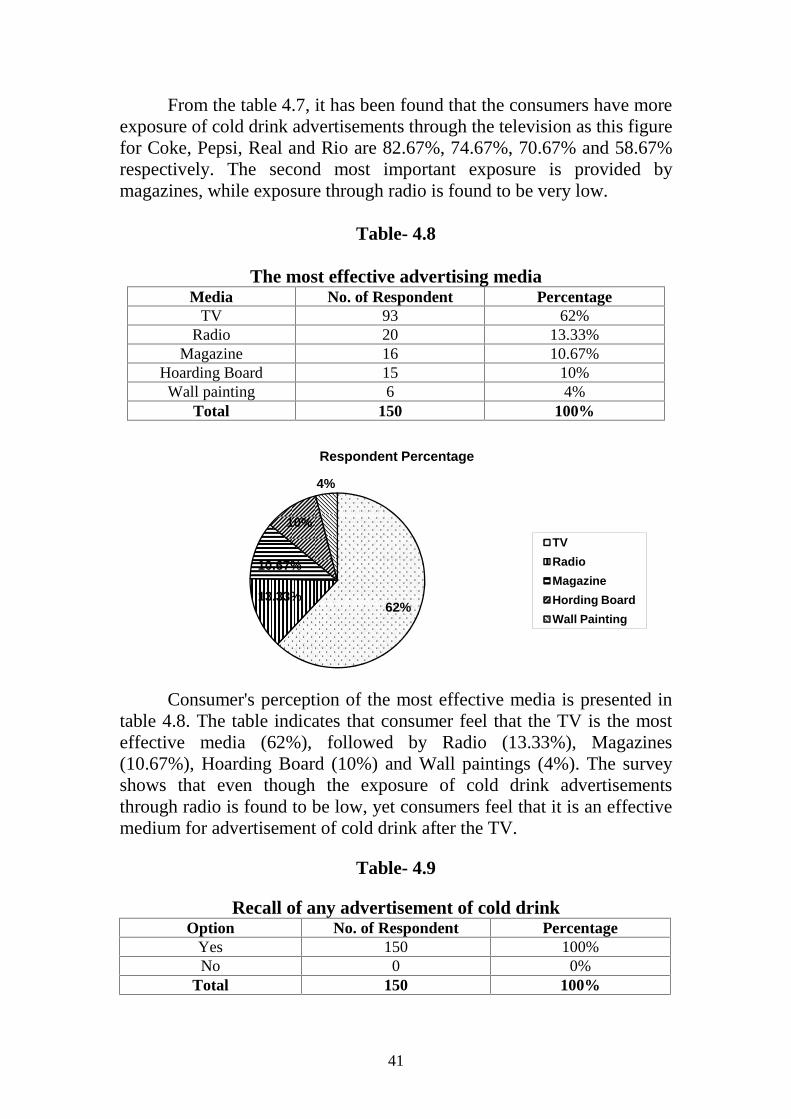
Table- 4.8
The most effective advertising mediaMedia No. of Respondent Percentage
TV 93 62%Radio 20 13.33%
Magazine 16 10.67%Hoarding Board 15 10%Wall painting 6 4%
Total 150 100%
Consumer's perception of the most effective media is presented intable 4.8. The table indicates that consumer feel that the TV is the mosteffective media (62%), followed by Radio (13.33%), Magazines(10.67%), Hoarding Board (10%) and Wall paintings (4%). The surveyshows that even though the exposure of cold drink advertisementsthrough radio is found to be low, yet consumers feel that it is an effectivemedium for advertisement of cold drink after the TV.
Table- 4.9
Recall of any advertisement of cold drinkOption No. of Respondent Percentage
Yes 150 100%No 0 0%
Total 150 100%
62%13.33%
10.67%
10%
4%
Respondent Percentage
TVRadioMagazineHording BoardWall Painting
42
From the above table, 100% of respondents are found to recall theadvertisement of cold drink. This indicates that cold drink advertisementshave not only higher level of exposure but also a very high recall value.
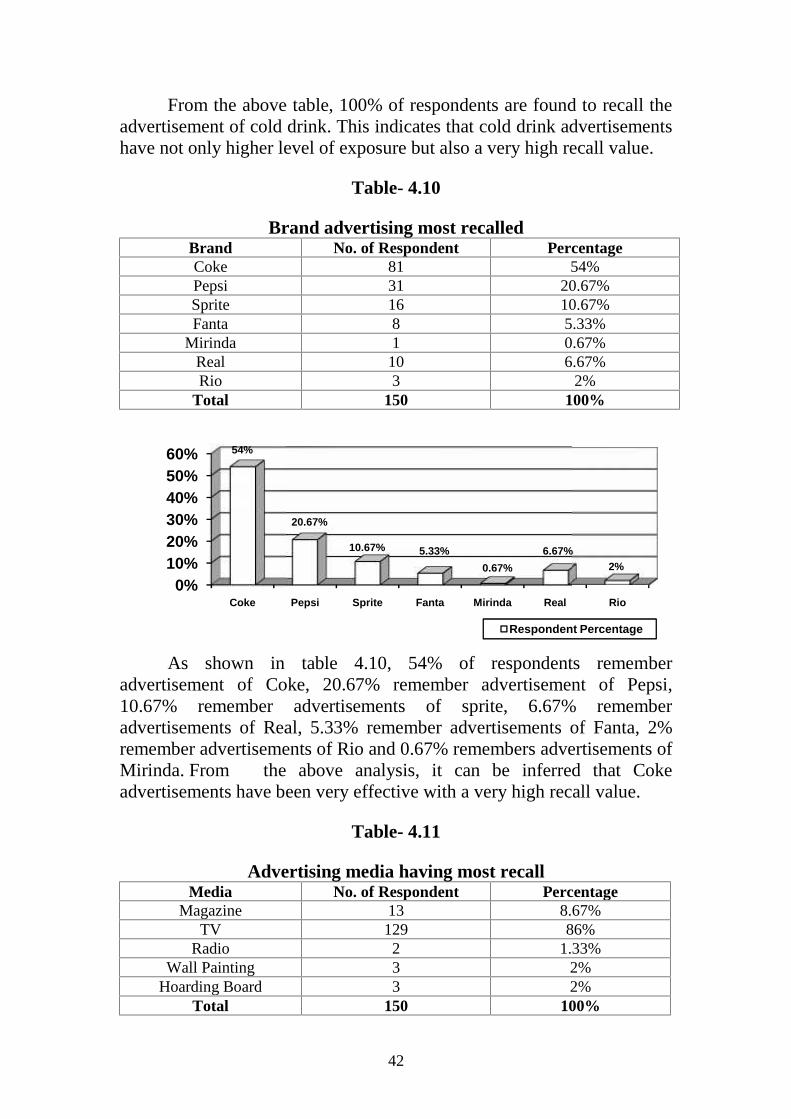
Table- 4.10
Brand advertising most recalledBrand No. of Respondent PercentageCoke 81 54%Pepsi 31 20.67%Sprite 16 10.67%Fanta 8 5.33%
Mirinda 1 0.67%Real 10 6.67%Rio 3 2%
Total 150 100%
As shown in table 4.10, 54% of respondents rememberadvertisement of Coke, 20.67% remember advertisement of Pepsi,10.67% remember advertisements of sprite, 6.67% rememberadvertisements of Real, 5.33% remember advertisements of Fanta, 2%remember advertisements of Rio and 0.67% remembers advertisements ofMirinda. From the above analysis, it can be inferred that Cokeadvertisements have been very effective with a very high recall value.
Table- 4.11
Advertising media having most recallMedia No. of Respondent Percentage
Magazine 13 8.67%TV 129 86%
Radio 2 1.33%Wall Painting 3 2%
Hoarding Board 3 2%Total 150 100%
0%10%20%30%40%50%60%
Coke Pepsi
54%
20.67%
42
From the above table, 100% of respondents are found to recall theadvertisement of cold drink. This indicates that cold drink advertisementshave not only higher level of exposure but also a very high recall value.
Table- 4.10
Brand advertising most recalledBrand No. of Respondent PercentageCoke 81 54%Pepsi 31 20.67%Sprite 16 10.67%Fanta 8 5.33%
Mirinda 1 0.67%Real 10 6.67%Rio 3 2%
Total 150 100%
As shown in table 4.10, 54% of respondents rememberadvertisement of Coke, 20.67% remember advertisement of Pepsi,10.67% remember advertisements of sprite, 6.67% rememberadvertisements of Real, 5.33% remember advertisements of Fanta, 2%remember advertisements of Rio and 0.67% remembers advertisements ofMirinda. From the above analysis, it can be inferred that Cokeadvertisements have been very effective with a very high recall value.
Table- 4.11
Advertising media having most recallMedia No. of Respondent Percentage
Magazine 13 8.67%TV 129 86%
Radio 2 1.33%Wall Painting 3 2%
Hoarding Board 3 2%Total 150 100%
Pepsi Sprite Fanta Mirinda Real
20.67%
10.67% 5.33%0.67%
6.67%
Respondent Percentage
42
From the above table, 100% of respondents are found to recall theadvertisement of cold drink. This indicates that cold drink advertisementshave not only higher level of exposure but also a very high recall value.
Table- 4.10
Brand advertising most recalledBrand No. of Respondent PercentageCoke 81 54%Pepsi 31 20.67%Sprite 16 10.67%Fanta 8 5.33%
Mirinda 1 0.67%Real 10 6.67%Rio 3 2%
Total 150 100%
As shown in table 4.10, 54% of respondents rememberadvertisement of Coke, 20.67% remember advertisement of Pepsi,10.67% remember advertisements of sprite, 6.67% rememberadvertisements of Real, 5.33% remember advertisements of Fanta, 2%remember advertisements of Rio and 0.67% remembers advertisements ofMirinda. From the above analysis, it can be inferred that Cokeadvertisements have been very effective with a very high recall value.
Table- 4.11
Advertising media having most recallMedia No. of Respondent Percentage
Magazine 13 8.67%TV 129 86%
Radio 2 1.33%Wall Painting 3 2%
Hoarding Board 3 2%Total 150 100%
Real Rio
6.67%2%
Respondent Percentage
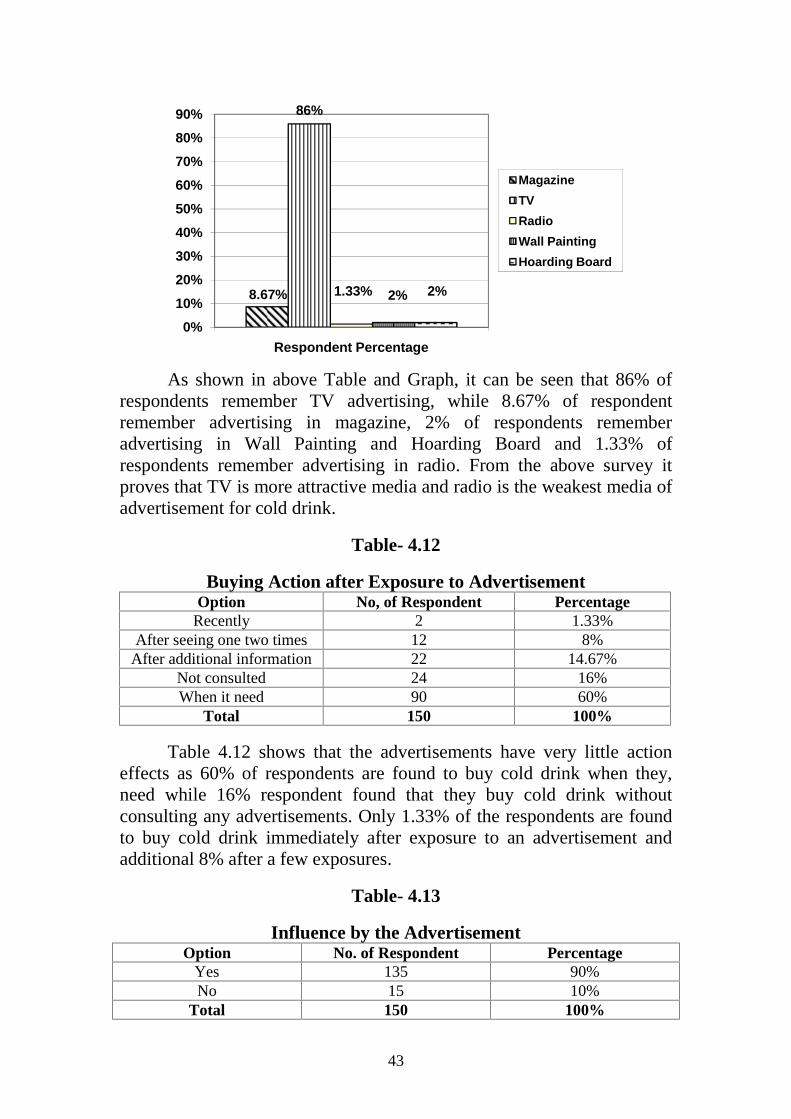
43
As shown in above Table and Graph, it can be seen that 86% ofrespondents remember TV advertising, while 8.67% of respondentremember advertising in magazine, 2% of respondents rememberadvertising in Wall Painting and Hoarding Board and 1.33% ofrespondents remember advertising in radio. From the above survey itproves that TV is more attractive media and radio is the weakest media ofadvertisement for cold drink.
Table- 4.12
Buying Action after Exposure to AdvertisementOption No, of Respondent Percentage
Recently 2 1.33%After seeing one two times 12 8%
After additional information 22 14.67%Not consulted 24 16%When it need 90 60%
Total 150 100%
Table 4.12 shows that the advertisements have very little actioneffects as 60% of respondents are found to buy cold drink when they,need while 16% respondent found that they buy cold drink withoutconsulting any advertisements. Only 1.33% of the respondents are foundto buy cold drink immediately after exposure to an advertisement andadditional 8% after a few exposures.
Table- 4.13
Influence by the AdvertisementOption No. of Respondent Percentage
Yes 135 90%No 15 10%
Total 150 100%
8.67%
86%
1.33% 2% 2%
0%
10%
20%
30%
40%
50%
60%
70%
80%
90%
Respondent Percentage
MagazineTVRadioWall PaintingHoarding Board
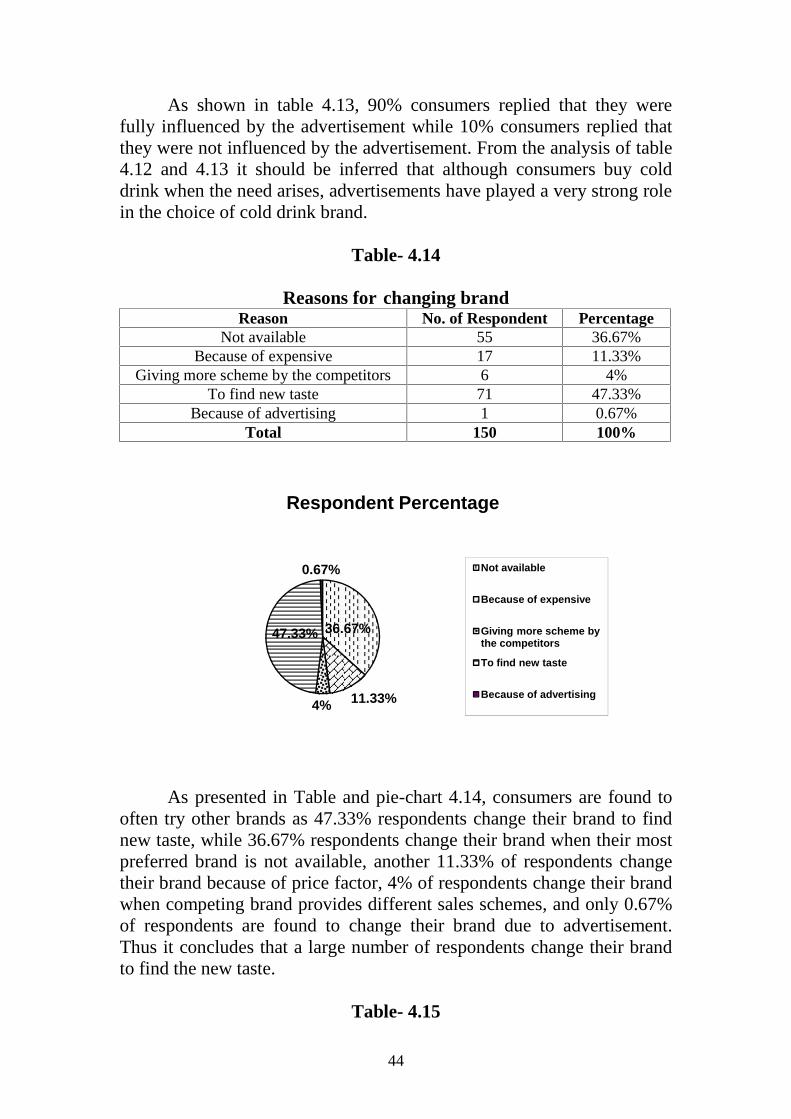
44
As shown in table 4.13, 90% consumers replied that they werefully influenced by the advertisement while 10% consumers replied thatthey were not influenced by the advertisement. From the analysis of table4.12 and 4.13 it should be inferred that although consumers buy colddrink when the need arises, advertisements have played a very strong rolein the choice of cold drink brand.
Table- 4.14
Reasons for changing brandReason No. of Respondent Percentage
Not available 55 36.67%Because of expensive 17 11.33%
Giving more scheme by the competitors 6 4%To find new taste 71 47.33%
Because of advertising 1 0.67%Total 150 100%
As presented in Table and pie-chart 4.14, consumers are found tooften try other brands as 47.33% respondents change their brand to findnew taste, while 36.67% respondents change their brand when their mostpreferred brand is not available, another 11.33% of respondents changetheir brand because of price factor, 4% of respondents change their brandwhen competing brand provides different sales schemes, and only 0.67%of respondents are found to change their brand due to advertisement.Thus it concludes that a large number of respondents change their brandto find the new taste.
Table- 4.15
36.67%
11.33%4%
47.33%
0.67%
Respondent Percentage
Not available
Because of expensive
Giving more scheme bythe competitors
To find new taste
Because of advertising
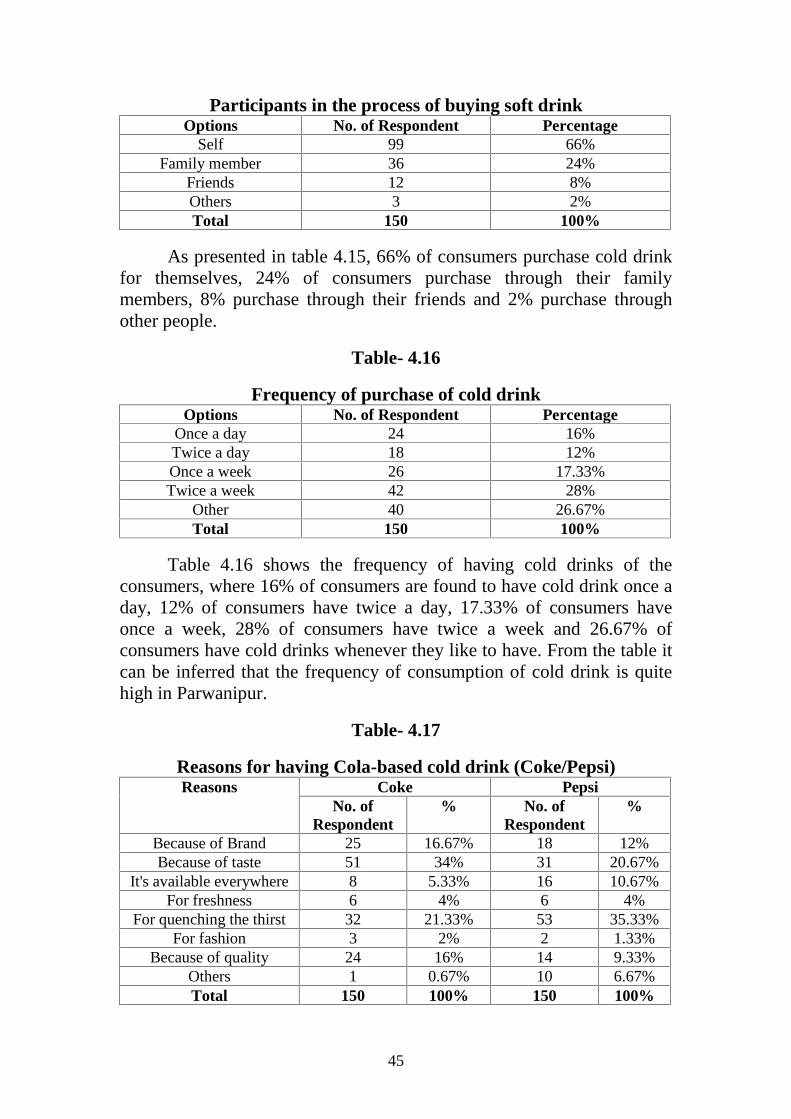
45
Participants in the process of buying soft drinkOptions No. of Respondent Percentage
Self 99 66%Family member 36 24%
Friends 12 8%Others 3 2%Total 150 100%
As presented in table 4.15, 66% of consumers purchase cold drinkfor themselves, 24% of consumers purchase through their familymembers, 8% purchase through their friends and 2% purchase throughother people.
Table- 4.16
Frequency of purchase of cold drinkOptions No. of Respondent Percentage
Once a day 24 16%Twice a day 18 12%Once a week 26 17.33%Twice a week 42 28%
Other 40 26.67%Total 150 100%
Table 4.16 shows the frequency of having cold drinks of theconsumers, where 16% of consumers are found to have cold drink once aday, 12% of consumers have twice a day, 17.33% of consumers haveonce a week, 28% of consumers have twice a week and 26.67% ofconsumers have cold drinks whenever they like to have. From the table itcan be inferred that the frequency of consumption of cold drink is quitehigh in Parwanipur.
Table- 4.17
Reasons for having Cola-based cold drink (Coke/Pepsi)Reasons Coke Pepsi
No. ofRespondent
% No. ofRespondent
%
Because of Brand 25 16.67% 18 12%Because of taste 51 34% 31 20.67%
It's available everywhere 8 5.33% 16 10.67%For freshness 6 4% 6 4%
For quenching the thirst 32 21.33% 53 35.33%For fashion 3 2% 2 1.33%
Because of quality 24 16% 14 9.33%Others 1 0.67% 10 6.67%Total 150 100% 150 100%
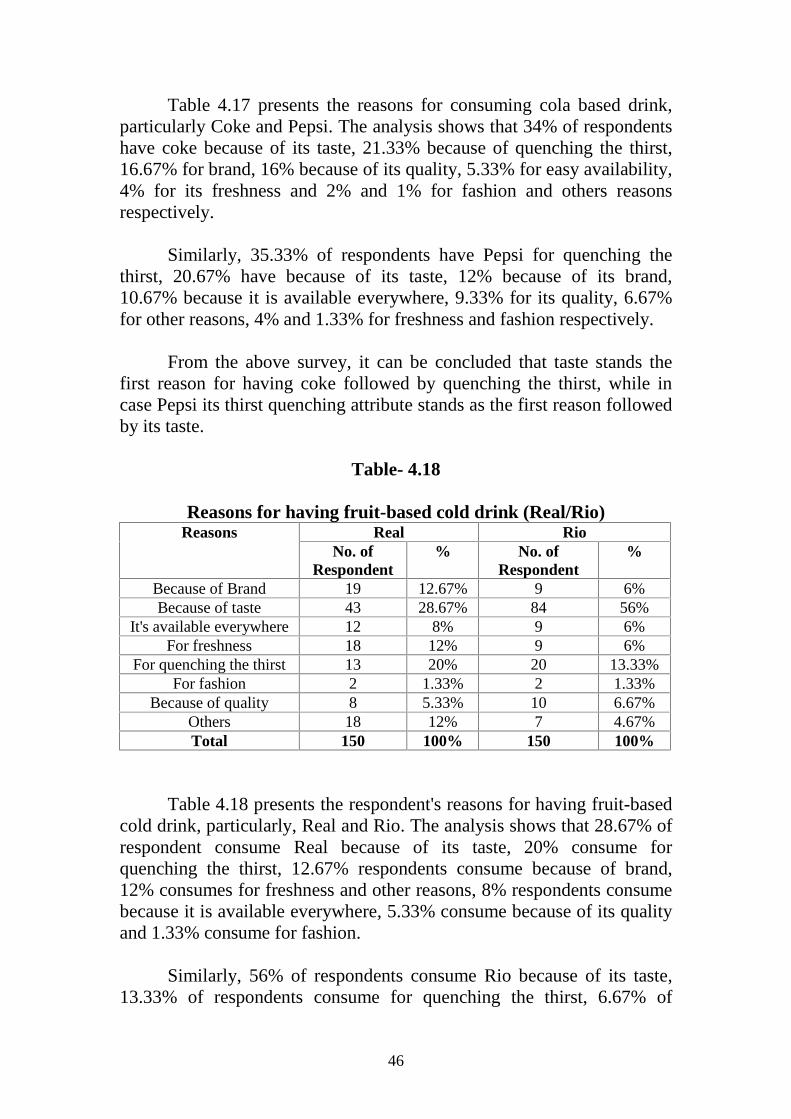
46
Table 4.17 presents the reasons for consuming cola based drink,particularly Coke and Pepsi. The analysis shows that 34% of respondentshave coke because of its taste, 21.33% because of quenching the thirst,16.67% for brand, 16% because of its quality, 5.33% for easy availability,4% for its freshness and 2% and 1% for fashion and others reasonsrespectively.
Similarly, 35.33% of respondents have Pepsi for quenching thethirst, 20.67% have because of its taste, 12% because of its brand,10.67% because it is available everywhere, 9.33% for its quality, 6.67%for other reasons, 4% and 1.33% for freshness and fashion respectively.
From the above survey, it can be concluded that taste stands thefirst reason for having coke followed by quenching the thirst, while incase Pepsi its thirst quenching attribute stands as the first reason followedby its taste.
Table- 4.18
Reasons for having fruit-based cold drink (Real/Rio)Reasons Real Rio
No. ofRespondent
% No. ofRespondent
%
Because of Brand 19 12.67% 9 6%Because of taste 43 28.67% 84 56%
It's available everywhere 12 8% 9 6%For freshness 18 12% 9 6%
For quenching the thirst 13 20% 20 13.33%For fashion 2 1.33% 2 1.33%
Because of quality 8 5.33% 10 6.67%Others 18 12% 7 4.67%Total 150 100% 150 100%
Table 4.18 presents the respondent's reasons for having fruit-basedcold drink, particularly, Real and Rio. The analysis shows that 28.67% ofrespondent consume Real because of its taste, 20% consume forquenching the thirst, 12.67% respondents consume because of brand,12% consumes for freshness and other reasons, 8% respondents consumebecause it is available everywhere, 5.33% consume because of its qualityand 1.33% consume for fashion.
Similarly, 56% of respondents consume Rio because of its taste,13.33% of respondents consume for quenching the thirst, 6.67% of
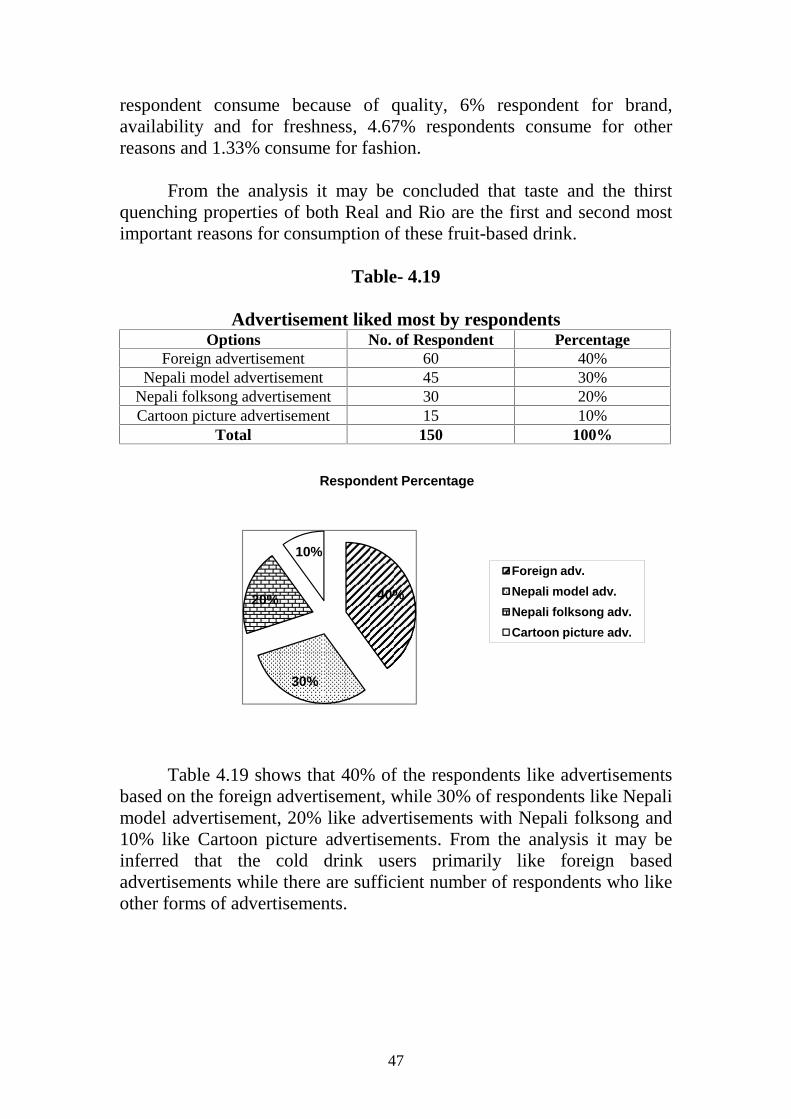
47
respondent consume because of quality, 6% respondent for brand,availability and for freshness, 4.67% respondents consume for otherreasons and 1.33% consume for fashion.
From the analysis it may be concluded that taste and the thirstquenching properties of both Real and Rio are the first and second mostimportant reasons for consumption of these fruit-based drink.
Table- 4.19
Advertisement liked most by respondentsOptions No. of Respondent Percentage
Foreign advertisement 60 40%Nepali model advertisement 45 30%
Nepali folksong advertisement 30 20%Cartoon picture advertisement 15 10%
Total 150 100%
Table 4.19 shows that 40% of the respondents like advertisementsbased on the foreign advertisement, while 30% of respondents like Nepalimodel advertisement, 20% like advertisements with Nepali folksong and10% like Cartoon picture advertisements. From the analysis it may beinferred that the cold drink users primarily like foreign basedadvertisements while there are sufficient number of respondents who likeother forms of advertisements.
40%
30%
20%
10%
Respondent Percentage
Foreign adv.Nepali model adv.Nepali folksong adv.Cartoon picture adv.
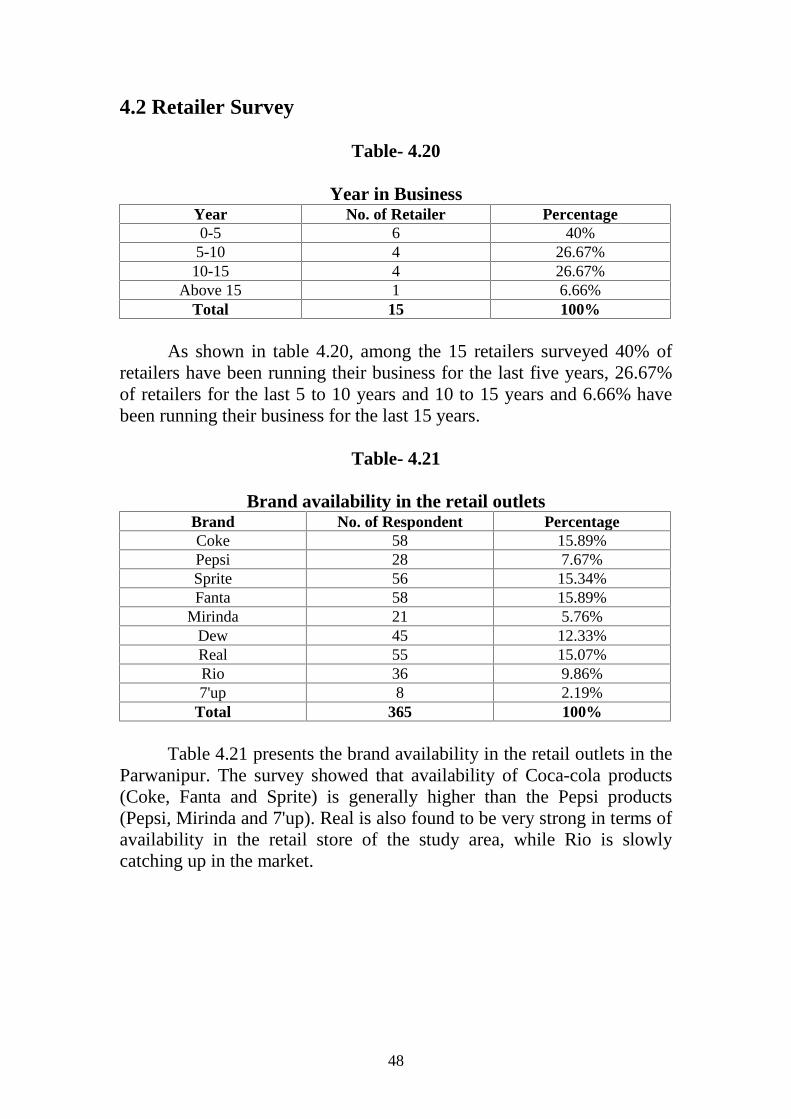
48
4.2 Retailer Survey
Table- 4.20
Year in BusinessYear No. of Retailer Percentage0-5 6 40%5-10 4 26.67%10-15 4 26.67%
Above 15 1 6.66%Total 15 100%
As shown in table 4.20, among the 15 retailers surveyed 40% ofretailers have been running their business for the last five years, 26.67%of retailers for the last 5 to 10 years and 10 to 15 years and 6.66% havebeen running their business for the last 15 years.
Table- 4.21
Brand availability in the retail outletsBrand No. of Respondent PercentageCoke 58 15.89%Pepsi 28 7.67%Sprite 56 15.34%Fanta 58 15.89%
Mirinda 21 5.76%Dew 45 12.33%Real 55 15.07%Rio 36 9.86%7'up 8 2.19%
Total 365 100%
Table 4.21 presents the brand availability in the retail outlets in theParwanipur. The survey showed that availability of Coca-cola products(Coke, Fanta and Sprite) is generally higher than the Pepsi products(Pepsi, Mirinda and 7'up). Real is also found to be very strong in terms ofavailability in the retail store of the study area, while Rio is slowlycatching up in the market.
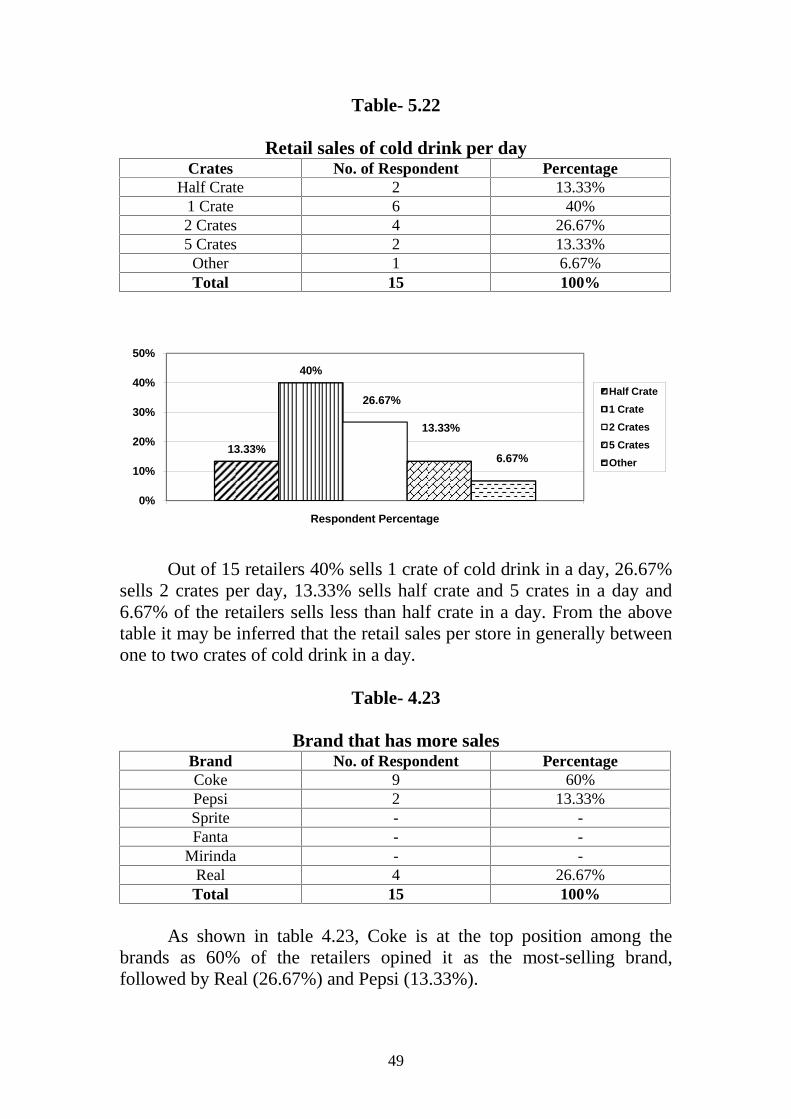
49
Table- 5.22
Retail sales of cold drink per dayCrates No. of Respondent Percentage
Half Crate 2 13.33%1 Crate 6 40%2 Crates 4 26.67%5 Crates 2 13.33%
Other 1 6.67%Total 15 100%
Out of 15 retailers 40% sells 1 crate of cold drink in a day, 26.67%sells 2 crates per day, 13.33% sells half crate and 5 crates in a day and6.67% of the retailers sells less than half crate in a day. From the abovetable it may be inferred that the retail sales per store in generally betweenone to two crates of cold drink in a day.
Table- 4.23
Brand that has more salesBrand No. of Respondent PercentageCoke 9 60%Pepsi 2 13.33%Sprite - -Fanta - -
Mirinda - -Real 4 26.67%Total 15 100%
As shown in table 4.23, Coke is at the top position among thebrands as 60% of the retailers opined it as the most-selling brand,followed by Real (26.67%) and Pepsi (13.33%).
13.33%
40%
26.67%
13.33%
6.67%
0%
10%
20%
30%
40%
50%
Respondent Percentage
Half Crate1 Crate2 Crates5 CratesOther
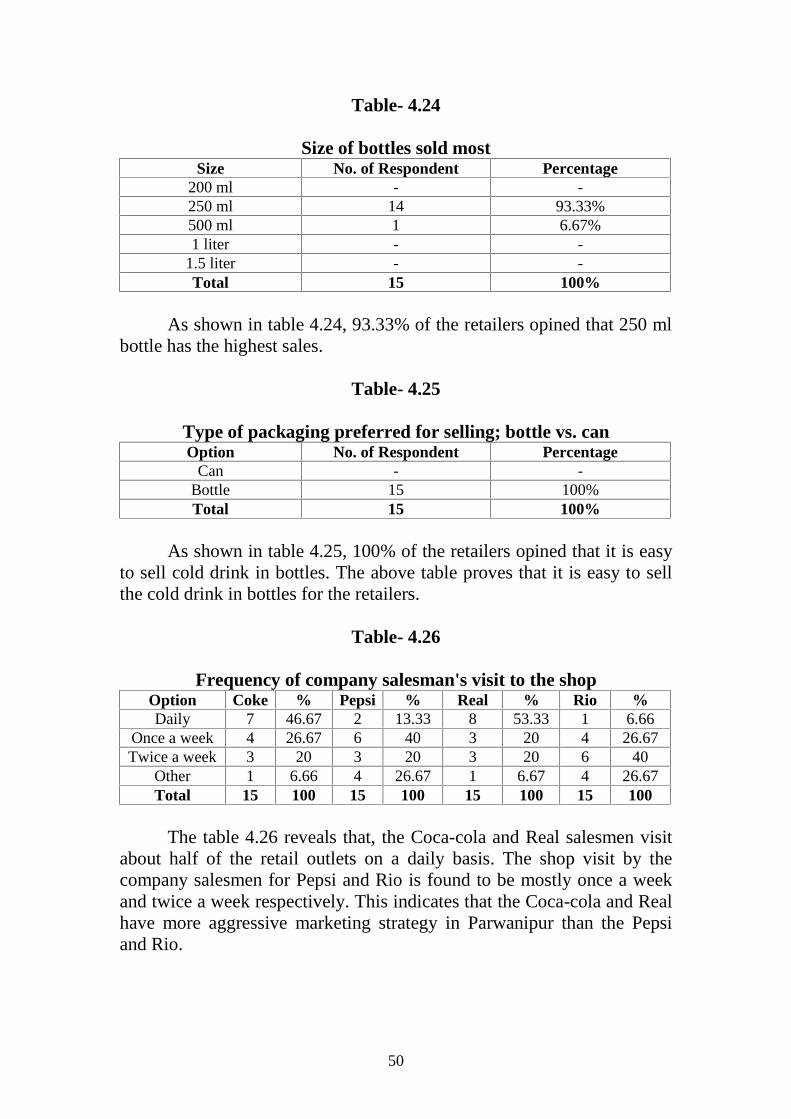
50
Table- 4.24
Size of bottles sold mostSize No. of Respondent Percentage
200 ml - -250 ml 14 93.33%500 ml 1 6.67%1 liter - -
1.5 liter - -Total 15 100%
As shown in table 4.24, 93.33% of the retailers opined that 250 mlbottle has the highest sales.
Table- 4.25
Type of packaging preferred for selling; bottle vs. canOption No. of Respondent Percentage
Can - -Bottle 15 100%Total 15 100%
As shown in table 4.25, 100% of the retailers opined that it is easyto sell cold drink in bottles. The above table proves that it is easy to sellthe cold drink in bottles for the retailers.
Table- 4.26
Frequency of company salesman's visit to the shopOption Coke % Pepsi % Real % Rio %Daily 7 46.67 2 13.33 8 53.33 1 6.66
Once a week 4 26.67 6 40 3 20 4 26.67Twice a week 3 20 3 20 3 20 6 40
Other 1 6.66 4 26.67 1 6.67 4 26.67Total 15 100 15 100 15 100 15 100
The table 4.26 reveals that, the Coca-cola and Real salesmen visitabout half of the retail outlets on a daily basis. The shop visit by thecompany salesmen for Pepsi and Rio is found to be mostly once a weekand twice a week respectively. This indicates that the Coca-cola and Realhave more aggressive marketing strategy in Parwanipur than the Pepsiand Rio.
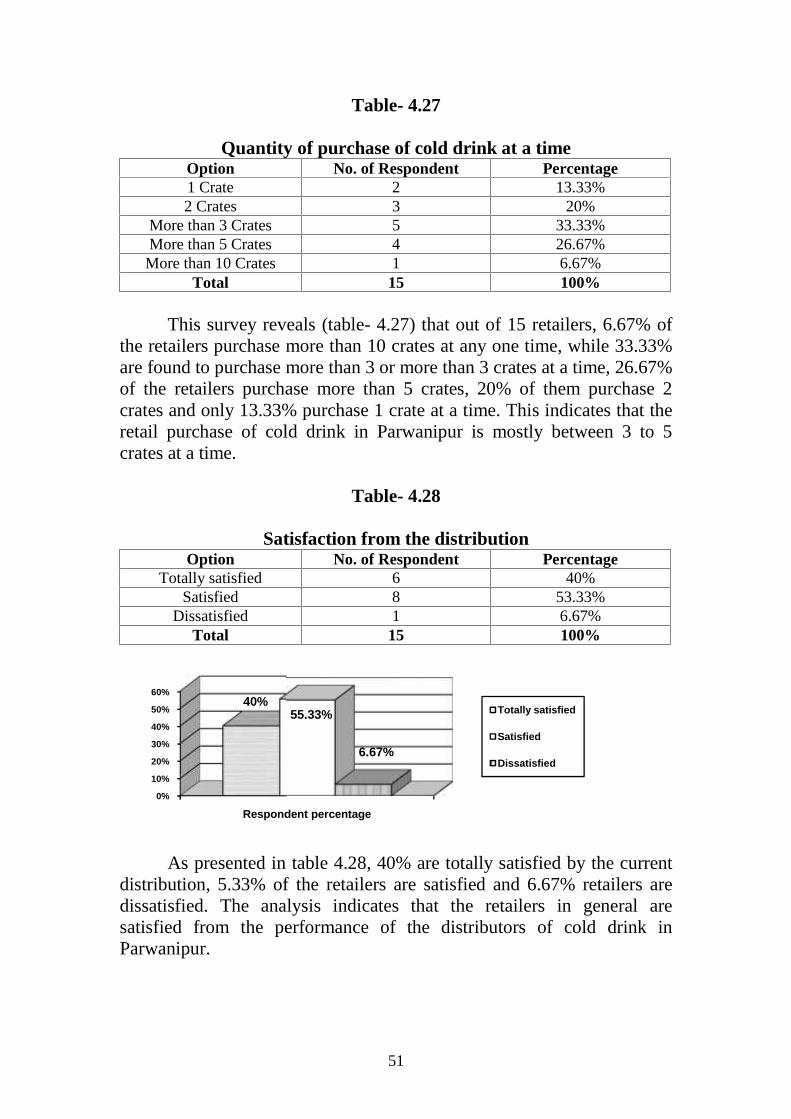
51
Table- 4.27
Quantity of purchase of cold drink at a timeOption No. of Respondent Percentage1 Crate 2 13.33%2 Crates 3 20%
More than 3 Crates 5 33.33%More than 5 Crates 4 26.67%More than 10 Crates 1 6.67%
Total 15 100%
This survey reveals (table- 4.27) that out of 15 retailers, 6.67% ofthe retailers purchase more than 10 crates at any one time, while 33.33%are found to purchase more than 3 or more than 3 crates at a time, 26.67%of the retailers purchase more than 5 crates, 20% of them purchase 2crates and only 13.33% purchase 1 crate at a time. This indicates that theretail purchase of cold drink in Parwanipur is mostly between 3 to 5crates at a time.
Table- 4.28
Satisfaction from the distributionOption No. of Respondent Percentage
Totally satisfied 6 40%Satisfied 8 53.33%
Dissatisfied 1 6.67%Total 15 100%
As presented in table 4.28, 40% are totally satisfied by the currentdistribution, 5.33% of the retailers are satisfied and 6.67% retailers aredissatisfied. The analysis indicates that the retailers in general aresatisfied from the performance of the distributors of cold drink inParwanipur.
0%
10%
20%
30%
40%
50%
60%
Respondent percentage
40%55.33%
51
Table- 4.27
Quantity of purchase of cold drink at a timeOption No. of Respondent Percentage1 Crate 2 13.33%2 Crates 3 20%
More than 3 Crates 5 33.33%More than 5 Crates 4 26.67%More than 10 Crates 1 6.67%
Total 15 100%
This survey reveals (table- 4.27) that out of 15 retailers, 6.67% ofthe retailers purchase more than 10 crates at any one time, while 33.33%are found to purchase more than 3 or more than 3 crates at a time, 26.67%of the retailers purchase more than 5 crates, 20% of them purchase 2crates and only 13.33% purchase 1 crate at a time. This indicates that theretail purchase of cold drink in Parwanipur is mostly between 3 to 5crates at a time.
Table- 4.28
Satisfaction from the distributionOption No. of Respondent Percentage
Totally satisfied 6 40%Satisfied 8 53.33%
Dissatisfied 1 6.67%Total 15 100%
As presented in table 4.28, 40% are totally satisfied by the currentdistribution, 5.33% of the retailers are satisfied and 6.67% retailers aredissatisfied. The analysis indicates that the retailers in general aresatisfied from the performance of the distributors of cold drink inParwanipur.
Respondent percentage
55.33%
6.67%
Totally satisfied
Satisfied
Dissatisfied
51
Table- 4.27
Quantity of purchase of cold drink at a timeOption No. of Respondent Percentage1 Crate 2 13.33%2 Crates 3 20%
More than 3 Crates 5 33.33%More than 5 Crates 4 26.67%More than 10 Crates 1 6.67%
Total 15 100%
This survey reveals (table- 4.27) that out of 15 retailers, 6.67% ofthe retailers purchase more than 10 crates at any one time, while 33.33%are found to purchase more than 3 or more than 3 crates at a time, 26.67%of the retailers purchase more than 5 crates, 20% of them purchase 2crates and only 13.33% purchase 1 crate at a time. This indicates that theretail purchase of cold drink in Parwanipur is mostly between 3 to 5crates at a time.
Table- 4.28
Satisfaction from the distributionOption No. of Respondent Percentage
Totally satisfied 6 40%Satisfied 8 53.33%
Dissatisfied 1 6.67%Total 15 100%
As presented in table 4.28, 40% are totally satisfied by the currentdistribution, 5.33% of the retailers are satisfied and 6.67% retailers aredissatisfied. The analysis indicates that the retailers in general aresatisfied from the performance of the distributors of cold drink inParwanipur.
Totally satisfied
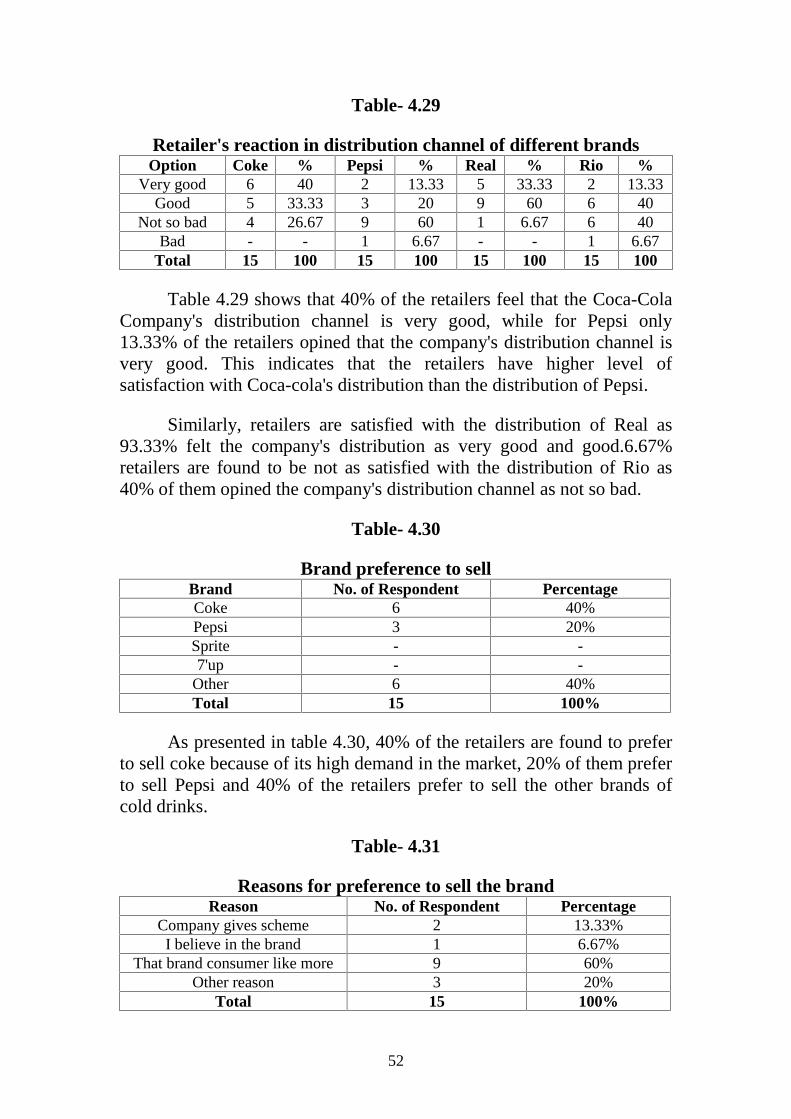
52
Table- 4.29
Retailer's reaction in distribution channel of different brandsOption Coke % Pepsi % Real % Rio %
Very good 6 40 2 13.33 5 33.33 2 13.33Good 5 33.33 3 20 9 60 6 40
Not so bad 4 26.67 9 60 1 6.67 6 40Bad - - 1 6.67 - - 1 6.67
Total 15 100 15 100 15 100 15 100
Table 4.29 shows that 40% of the retailers feel that the Coca-ColaCompany's distribution channel is very good, while for Pepsi only13.33% of the retailers opined that the company's distribution channel isvery good. This indicates that the retailers have higher level ofsatisfaction with Coca-cola's distribution than the distribution of Pepsi.
Similarly, retailers are satisfied with the distribution of Real as93.33% felt the company's distribution as very good and good.6.67%retailers are found to be not as satisfied with the distribution of Rio as40% of them opined the company's distribution channel as not so bad.
Table- 4.30
Brand preference to sellBrand No. of Respondent PercentageCoke 6 40%Pepsi 3 20%Sprite - -7'up - -
Other 6 40%Total 15 100%
As presented in table 4.30, 40% of the retailers are found to preferto sell coke because of its high demand in the market, 20% of them preferto sell Pepsi and 40% of the retailers prefer to sell the other brands ofcold drinks.
Table- 4.31
Reasons for preference to sell the brandReason No. of Respondent Percentage
Company gives scheme 2 13.33%I believe in the brand 1 6.67%
That brand consumer like more 9 60%Other reason 3 20%
Total 15 100%
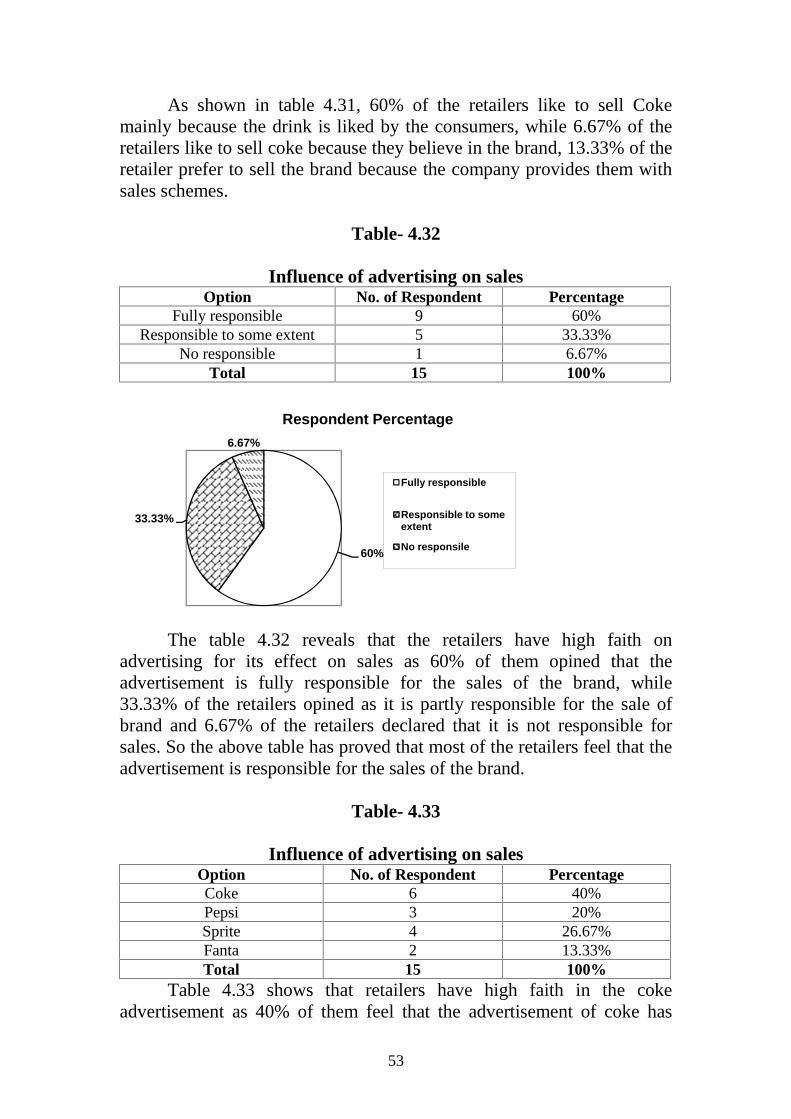
53
As shown in table 4.31, 60% of the retailers like to sell Cokemainly because the drink is liked by the consumers, while 6.67% of theretailers like to sell coke because they believe in the brand, 13.33% of theretailer prefer to sell the brand because the company provides them withsales schemes.
Table- 4.32
Influence of advertising on salesOption No. of Respondent Percentage
Fully responsible 9 60%Responsible to some extent 5 33.33%
No responsible 1 6.67%Total 15 100%
The table 4.32 reveals that the retailers have high faith onadvertising for its effect on sales as 60% of them opined that theadvertisement is fully responsible for the sales of the brand, while33.33% of the retailers opined as it is partly responsible for the sale ofbrand and 6.67% of the retailers declared that it is not responsible forsales. So the above table has proved that most of the retailers feel that theadvertisement is responsible for the sales of the brand.
Table- 4.33
Influence of advertising on salesOption No. of Respondent PercentageCoke 6 40%Pepsi 3 20%Sprite 4 26.67%Fanta 2 13.33%Total 15 100%
Table 4.33 shows that retailers have high faith in the cokeadvertisement as 40% of them feel that the advertisement of coke has
60%
33.33%
6.67%
Respondent Percentage
Fully responsible
Responsible to someextent
No responsile
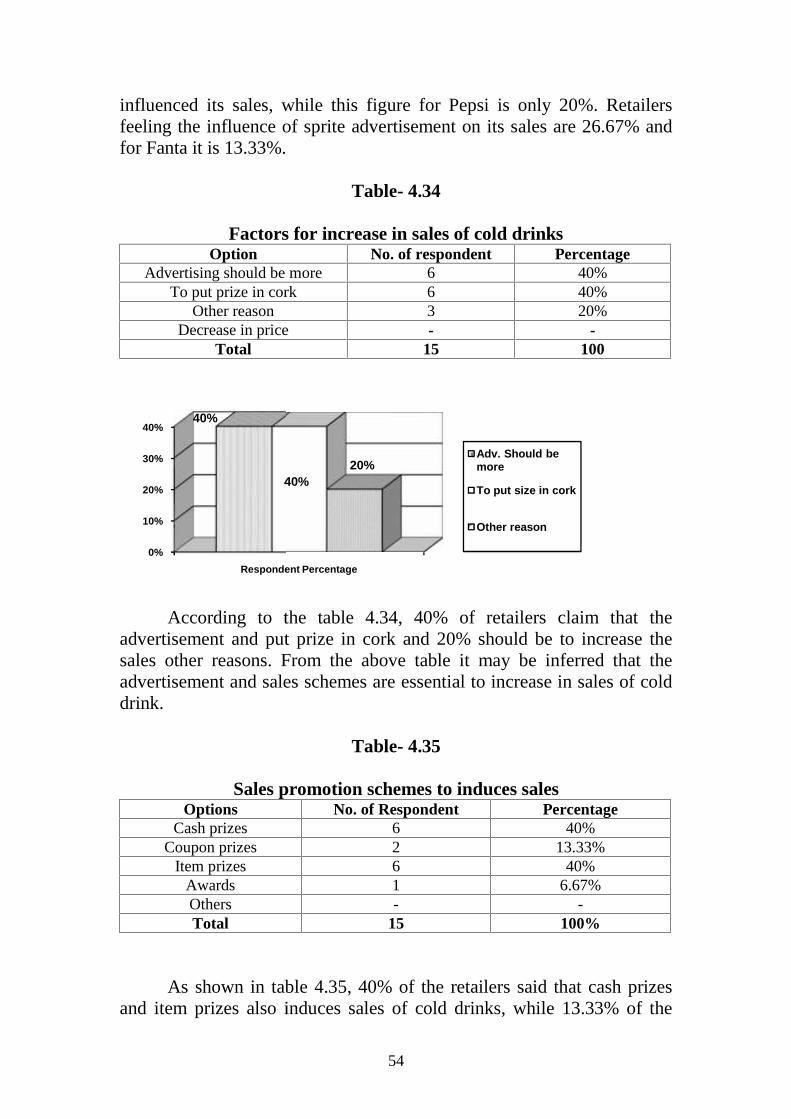
54
influenced its sales, while this figure for Pepsi is only 20%. Retailersfeeling the influence of sprite advertisement on its sales are 26.67% andfor Fanta it is 13.33%.
Table- 4.34
Factors for increase in sales of cold drinksOption No. of respondent Percentage
Advertising should be more 6 40%To put prize in cork 6 40%
Other reason 3 20%Decrease in price - -
Total 15 100
According to the table 4.34, 40% of retailers claim that theadvertisement and put prize in cork and 20% should be to increase thesales other reasons. From the above table it may be inferred that theadvertisement and sales schemes are essential to increase in sales of colddrink.
Table- 4.35
Sales promotion schemes to induces salesOptions No. of Respondent Percentage
Cash prizes 6 40%Coupon prizes 2 13.33%
Item prizes 6 40%Awards 1 6.67%Others - -Total 15 100%
As shown in table 4.35, 40% of the retailers said that cash prizesand item prizes also induces sales of cold drinks, while 13.33% of the
0%
10%
20%
30%
40%
Respondent Percentage
40%
40%
54
influenced its sales, while this figure for Pepsi is only 20%. Retailersfeeling the influence of sprite advertisement on its sales are 26.67% andfor Fanta it is 13.33%.
Table- 4.34
Factors for increase in sales of cold drinksOption No. of respondent Percentage
Advertising should be more 6 40%To put prize in cork 6 40%
Other reason 3 20%Decrease in price - -
Total 15 100
According to the table 4.34, 40% of retailers claim that theadvertisement and put prize in cork and 20% should be to increase thesales other reasons. From the above table it may be inferred that theadvertisement and sales schemes are essential to increase in sales of colddrink.
Table- 4.35
Sales promotion schemes to induces salesOptions No. of Respondent Percentage
Cash prizes 6 40%Coupon prizes 2 13.33%
Item prizes 6 40%Awards 1 6.67%Others - -Total 15 100%
As shown in table 4.35, 40% of the retailers said that cash prizesand item prizes also induces sales of cold drinks, while 13.33% of the
Respondent Percentage
40%20%
Adv. Should bemore
To put size in cork
Other reason
54
influenced its sales, while this figure for Pepsi is only 20%. Retailersfeeling the influence of sprite advertisement on its sales are 26.67% andfor Fanta it is 13.33%.
Table- 4.34
Factors for increase in sales of cold drinksOption No. of respondent Percentage
Advertising should be more 6 40%To put prize in cork 6 40%
Other reason 3 20%Decrease in price - -
Total 15 100
According to the table 4.34, 40% of retailers claim that theadvertisement and put prize in cork and 20% should be to increase thesales other reasons. From the above table it may be inferred that theadvertisement and sales schemes are essential to increase in sales of colddrink.
Table- 4.35
Sales promotion schemes to induces salesOptions No. of Respondent Percentage
Cash prizes 6 40%Coupon prizes 2 13.33%
Item prizes 6 40%Awards 1 6.67%Others - -Total 15 100%
As shown in table 4.35, 40% of the retailers said that cash prizesand item prizes also induces sales of cold drinks, while 13.33% of the
To put size in cork
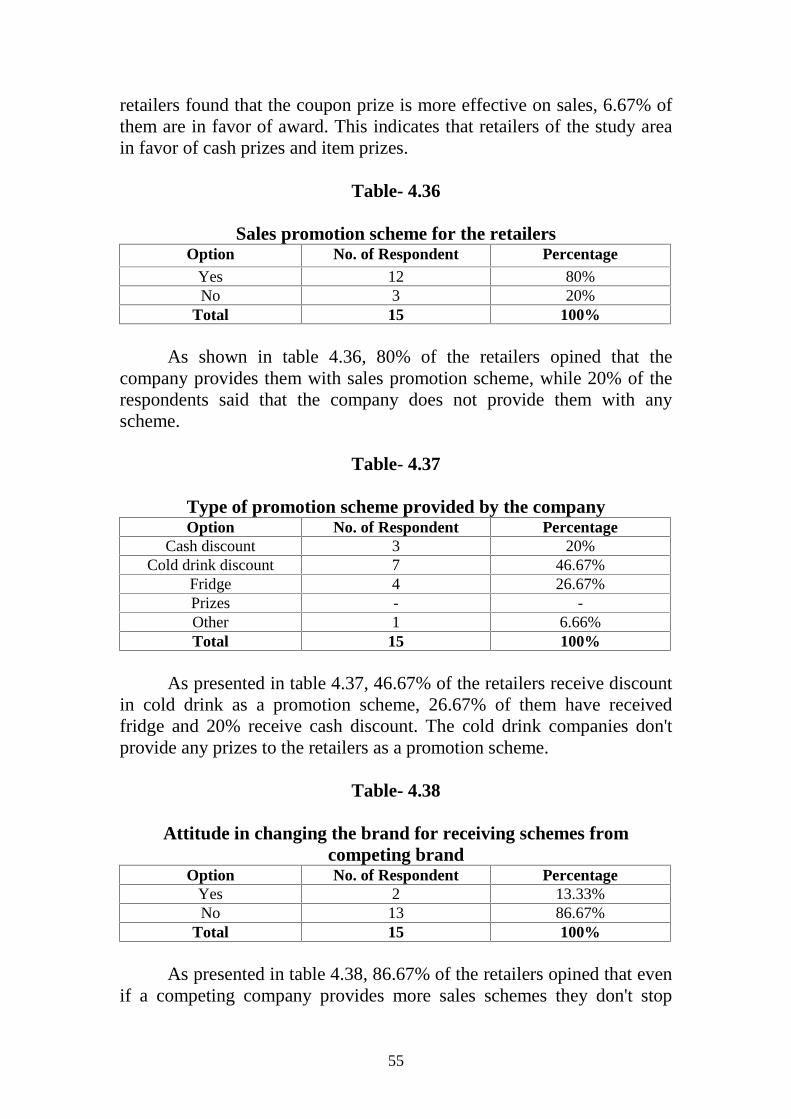
55
retailers found that the coupon prize is more effective on sales, 6.67% ofthem are in favor of award. This indicates that retailers of the study areain favor of cash prizes and item prizes.
Table- 4.36
Sales promotion scheme for the retailersOption No. of Respondent Percentage
Yes 12 80%No 3 20%
Total 15 100%
As shown in table 4.36, 80% of the retailers opined that thecompany provides them with sales promotion scheme, while 20% of therespondents said that the company does not provide them with anyscheme.
Table- 4.37
Type of promotion scheme provided by the companyOption No. of Respondent Percentage
Cash discount 3 20%Cold drink discount 7 46.67%
Fridge 4 26.67%Prizes - -Other 1 6.66%Total 15 100%
As presented in table 4.37, 46.67% of the retailers receive discountin cold drink as a promotion scheme, 26.67% of them have receivedfridge and 20% receive cash discount. The cold drink companies don'tprovide any prizes to the retailers as a promotion scheme.
Table- 4.38
Attitude in changing the brand for receiving schemes fromcompeting brand
Option No. of Respondent PercentageYes 2 13.33%No 13 86.67%
Total 15 100%
As presented in table 4.38, 86.67% of the retailers opined that evenif a competing company provides more sales schemes they don't stop
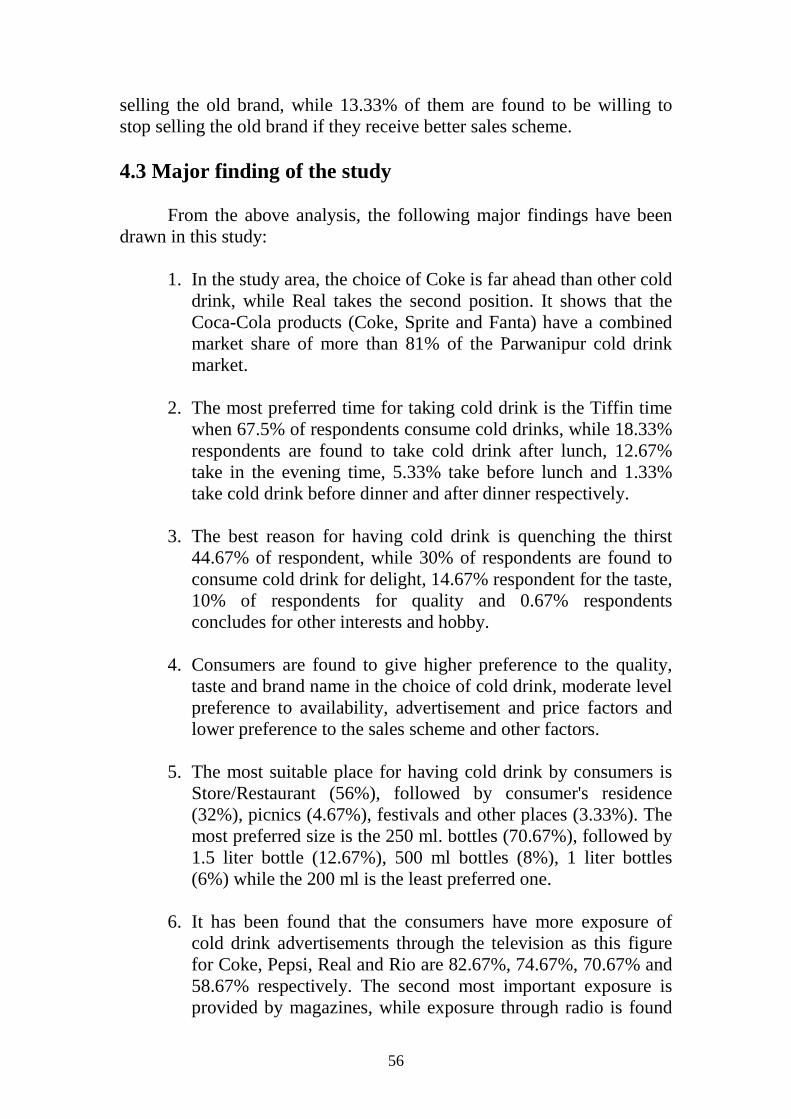
56
selling the old brand, while 13.33% of them are found to be willing tostop selling the old brand if they receive better sales scheme.
4.3 Major finding of the study
From the above analysis, the following major findings have beendrawn in this study:
1. In the study area, the choice of Coke is far ahead than other colddrink, while Real takes the second position. It shows that theCoca-Cola products (Coke, Sprite and Fanta) have a combinedmarket share of more than 81% of the Parwanipur cold drinkmarket.
2. The most preferred time for taking cold drink is the Tiffin timewhen 67.5% of respondents consume cold drinks, while 18.33%respondents are found to take cold drink after lunch, 12.67%take in the evening time, 5.33% take before lunch and 1.33%take cold drink before dinner and after dinner respectively.
3. The best reason for having cold drink is quenching the thirst44.67% of respondent, while 30% of respondents are found toconsume cold drink for delight, 14.67% respondent for the taste,10% of respondents for quality and 0.67% respondentsconcludes for other interests and hobby.
4. Consumers are found to give higher preference to the quality,taste and brand name in the choice of cold drink, moderate levelpreference to availability, advertisement and price factors andlower preference to the sales scheme and other factors.
5. The most suitable place for having cold drink by consumers isStore/Restaurant (56%), followed by consumer's residence(32%), picnics (4.67%), festivals and other places (3.33%). Themost preferred size is the 250 ml. bottles (70.67%), followed by1.5 liter bottle (12.67%), 500 ml bottles (8%), 1 liter bottles(6%) while the 200 ml is the least preferred one.
6. It has been found that the consumers have more exposure ofcold drink advertisements through the television as this figurefor Coke, Pepsi, Real and Rio are 82.67%, 74.67%, 70.67% and58.67% respectively. The second most important exposure isprovided by magazines, while exposure through radio is found
57
to be very low. In term of consumer's perception of the mosteffective media, the TV is the cost effective media (62%)followed by (13.33%), magazines (10.67%), Hoarding board(10%) and wall painting (4%). The survey shows that eventhough the exposure of cold drink advertisements through radiois found to be low, yet consumers feel that it is an effectivemedium for advertisement of cold drink after the TV.
7. All respondents are found to recall the advertisement of colddrink. This indicates that cold drink advertisements have notonly higher level of exposure but also a very high recall value.The study found that 54% of respondents rememberadvertisement of Coke, 20.67% remember advertisement ofPepsi, 10.67% remember advertisements of Sprite, 6.67%remember advertisements of Real, 5.33% rememberadvertisements of Fanta, 2% remember advertisement of Rioand 0.67% remembers advertisements of Mirinda. From theabove analysis, it can be inferred that Coke advertisements havebeen very effective with a very high recall value.
8. The study also found that 86% of respondents remember TVadvertising, while 8.67% of respondents remember advertisingin magazine, 2% of respondents remember advertisement inwall painting and Hoarding Board and 1.33% respondentsremember advertising in radio. From the above survey it provesthat TV is more attractive media and radio is the weakest mediaof advertisement for cold drink.
9. The advertisements have very little action effects as 60% ofrespondents are found to buy cold drink when they need, while16% respondent found that they buy cold drink withoutconsulting any advertisements. Only 1.33% of the respondentsare found to buy cold drink immediately after exposure to anadvertisement and additional 8% after a few exposures.However, 90% consumers replied that they were fullyinfluenced by the advertisement while 10% consumers repliedthat they were not influenced by the advertisement. From this, itshould be inferred that although consumers buy cold drink whenthe need arises, advertisements have played a very strong role inthe choice of cold drink brand.
10. Consumers are found to often try other brands as 47.33%respondents change their brand to find new taste, while 36.67%
58
respondents change their brand when their most preferred brandis not available, another 11.33% of respondents change theirbrand because of price factor, 4% of respondents change theirbrand when competing brand provides different sales schemesand only 0.67% of respondents are found to change their branddue to advertisement. Thus it concludes that a large number ofrespondents change their brand to find the new taste.
11. In the study area, 66% of consumers purchase cold drink forthemselves, 24% of consumers purchase through their familymembers, 8% purchase through their friends and 2% purchasethrough other people. Similarly, 16% of consumers are found tohave cold drink once a day, 12% of consumers have twice aday, 28% of consumers have cold drink twice a week, 17.33%of consumers have once a week and 26.67% of consumers havecold drinks whenever they like to have. From this, it can beinferred that the frequency of consumption of cold drink is quitehigh in Parwanipur.
12. In terms of the reasons for consuming cola based drink,particularly Coke and Pepsi, 34% of respondents have Cokebecause of its taste, 16% because of quality, 21.33% forquenching the thirst, 16.67% because of its brand name, 4% forits freshness, 2% have for fashion, 5.33% because it is availableeverywhere and 0.67% for other reasons. Similarly, 35.33% ofrespondents have Pepsi for quenching the thirst, 20.67% havebecause of its taste, 12% because of its brand name, 10.67%because it is available everywhere, 9.33% for its quality, 4% forfreshness, 6.67% for other reasons and 1.33% have for fashion.From this study, it can be concluded that taste stands the firstreason for having coke followed by quenching the thirst, whilein case of Pepsi its thirst quenching attribute stands as the firstreason followed by its taste.
13. In terms of the respondent's reasons for having the fruit-basedcold drink, particularly, Real and Rio, 28.68% respondentsconsume Real because of its taste, 20% consume for quenchingthe thirst, 12.67% respondents consume because of brand, 12%consumes for freshness and other reasons, 8% respondentsconsume because it is available everywhere, 5.33% consumebecause of its quality and 1.33% consume for fashion.Similarly, 56% of respondents consume Rio because of its taste,13.33% of respondents consume for quenching the thirst, 6.67%
59
of respondent consume because of quality, 6% respondent forbrand, availability and for freshness, 4.67% respondentsconsume for other reasons and 1.33% consume for fashion.From this study, it may be concluded that taste and the thirst-quenching properties of both Real and Rio are the first and thesecond most important reasons for consumption of these fruit-based drink.
14. The study shows that 40% of the respondents likeadvertisements based on the foreign advertisement, while 30%of respondents like Nepali model advertisement, 20% likeadvertisements with Nepali folksong advertisement and 10%like Cartoon picture advertisements. From the analysis it maybe inferred that the cold drink users primarily like foreign basedadvertisements while there are sufficient number of respondentswho like other forms of advertisements.
15. Among the 15 retailers surveyed 40% of retailers have beenrunning their business for the last five years, 26.67% of retailersfor the last 5 to 10 years and 10 to 15 years and 6.67% havebeen running their business for the last 15 years.
16. The study showed that availability of Coca-cola products(Coke, Fanta and Sprite) is generally higher than the Pepsiproducts (Pepsi, Mirinda and 7'up). Real is also found to be verystrong in terms of availability in the retail stores of the studyarea, while Rio is slowly catching up in the market.
17. Out of 15 retailers 40% sells 1 crates of cold drink in a day,26.67% sells 2 crates per day, 13.33% sells half crates and 5crates per day and 6.67% of the retailers sell less than half cratein a day. From this, it may be inferred that the retail sales perstore in generally between one to two crates of cold drink in aday.
18. The Coke is at the top position among the brands as 60% of theretailers opined it as the most selling brand, followed by Real26.67% and Pepsi 13.33%. In the study, 93.33% of the retailersopined that 250 ml bottle has the highest sales, and 100% of theretailers opined that it is easy to sell cold drink in bottles. Thisinfers that it is easy to sell the cold drinks in bottles for theretailers.
60
19. The Coca-cola and Real salesmen visit about half of the retailoutlets on a daily basis. The shop visit by the companysalesmen for Pepsi and Rio is found to be mostly any day. Thisindicates that the Coca-cola and Real have more aggressivemarketing strategy in Parwanipur than the Pepsi and Rio.
20. This study reveals that out of 15 retailers, 6.67% of the retailerspurchase more than 10 crates at any one time, while 33.33% arefound to purchase more than 3 crates at a time, 26.67% of theretailers purchase more than 5 crates at a time, 20% of thempurchase 2 crates, and only 13.33% purchase 1 crate at a time.This indicates that the retail purchase of cold drink inParwanipur is mostly between 3 to 5 crates at a time.
21. The study found that 40% of the retailers are totally satisfiedwith the current distribution, 53.33% of the retailers aresatisfied, while 6.67% retailers are dissatisfied. The analysisindicates that the retailers that the retailers in general aresatisfied from the performance of the distributors of cold drinkin Parwanipur. About 40% of the retailers feel that the Coca-Cola Company's distribution channel is very good, while forPepsi only 13.33% of the retailers opined that the company'sdistribution channel is very good. This indicates that theretailers have higher level of satisfaction with Coca-cola'sdistribution than the distribution of Pepsi. Similarly, retailersare satisfied with the distribution of Real as 93.33% felt theCompany's distribution as very good and good. Retailers arefound to be not-so-satisfied with the distribution of Rio as 40%of them opined the Company's distribution channel as not-so-bad.
22. In the study, 40% of the retailers are found to prefer to sellCoke because of its high demand in the market, 20% of themprefer to sell Pepsi and 40% of the retailer prefers to sell theother brands of cold drinks. Similarly, 60% of the retailers liketo sell Coke mainly because the drink is liked by the consumers,while 6.67% of the retailers like to sell Coke because theybelieve in the brand and 13.33% of the retailer prefers to sell thebrand because the company provides them with sales schemes.
23. The study reveals that the retailers have high faith onadvertising for its effect on sales as 60% of them opined that theadvertisement is fully responsible for the sales of the brand,
61
while 33.33% of the retailers opined as it is partly responsiblefor the sale of brand, 6.67% of the retailers declared that it is notresponsible. So the study indicates that most of the retailers feelthat the advertisement is responsible for the sales of the brand.
24. The study shows that retailers have high faith in the Cokeadvertisement as 40% of them feel that the advertisement ofCoke has influenced its sales, while this figure for Pepsi is only20% retailers feeling the influence of Fanta advertisement on itssales is 13.33% and for Sprite it is 26.67%. However, 40% ofretailers claim that the advertisement and to put prize in cork toincrease the sales, 20% of the retailers said the other reasonsshould be increased. From this, it may be inferred that thequality and sales schemes are essential to increase in sales ofcold drink. In this study, 40% of the retailers said that cashprizes and item prize induces sales of cold drinks, while 13.33%of the retailers found that the coupon prize is more effective onsales and 6.67% of them are in favor of awards. This indicatesthat retailers of the study area are in favor of cash prizes.
25. In the study, 80% of the retailers opined that the companyprovides them with sales promotion schemes, while 20% of therespondents said that the company does not provide them withany scheme. It was found that 46.67% of the retailers receivediscount in cold drink as a promotion scheme, 26.67% of themhave received Fridge and 20% receive cash discount. The colddrink companies do not provide any prizes to the retailers as apromotion scheme.
26. In the study, 86.67% of the retailers opined that even if acompeting company provides more sales schemes they don'tstop selling the old brand, while 13.33% of them are found to bewilling to stop selling the old brand if they receive better salesschemes. This indicates that more than four-fifth of the retailersis brand loyal.
62
5. SUMMARY, CONCLUSIONS ANDRECOMMENDATIONS
5.1 Summary
In the modern time industries are developing rapidly in Nepal.Every year new fields of industrial importance are being uncovered.Similarly the number of units at different types of industries is alsoincreasing in the country. All these, have introduced a tough competitionin the Nepalese market. Today, a product not only needs qualityenhancement but also better promotion and presentation in the market.The product should be presented with right price, at suitable place, withgood brand promotion, label and package. The product should be able towin the heart of consumers to be successful in the market.
Marketing plays a very significant role in accelerating the pace ofindustrialization, which, in turn, aims, of making the economy developedand strong. Indeed, marketing is the mist significant multiplier ofeconomic development. The development of marketing makes possibleeconomic integration and the perfect utilization of whatever assets andproductive capacity that and economy has already possessed. It mobilizeslatent economic energy and finally contributes to the greatest need; thatfor the rapid development at entrepreneurs and managers.
The rapid urbanization in Nepal has induced a culture of drinkingcold drink by the people. Moreover, population density has been creatinghot climate, which in turn, has increased the demand for cold drink. Thevariety of cold drink brands sold in the Nepalese market has alsoincreased in recent years. The modern bottled cold drink was firstintroduced in Nepal in 1976 when Coca-cola was established, followedby Pepsi in 1986. Since then, several industries have been established inNepal to meet the ever-increasing demand. Thus, the cold drink markethas become very competitive in Nepal and it is essential for everycompany to set up effective marketing mechanisms to exploit marketpotential.
This study has been conducted with the objective of examining themarketing of cold drinks in Parwanipur. This study has been conducted toexamine the consumer's perception and behavior in the purchase of colddrink in the study area and evaluate the distribution network andmarketing strategies of cold drink companies. It aims to evaluate the
63
impact of advertisement and sales promotion schemes on sales of colddrinks and identify consumers profile and their preference of cold drinkin the study area. It also aims to measure the effect of sales promotionschemes on the sales of cold drinks and identify consumers profile andtheir preference of cold drink. The study has been conducted through asurvey of consumers and retailers. All together, 150 consumers and 15retailers' opinions have been collected by administering questionnaires.
5.2 Conclusions
From the study the following conclusions have been drawn:
1. The Coca-cola products (Coke, Fanta and Sprite) have acombined market share of more than 81% of the Parwanipur colddrink market.
2. Consumers are generally found to consume cold drink during theTiffin time. The best reason for having cold drink is "quenchingthe thirst" of respondent, while of respondents are found toconsume cold drink "for delight", respondent "for the taste", ofrespondents "for quality" and respondents concludes for other"interests and hobby". Consumers are found to give higherpreference to the quality, taste and brand name in the choice ofcold drink, moderate level preference to availability,advertisement and price factors and lower preference to the salesscheme and other factors. The most common place for havingcold drink by consumers is Store/ restaurant, followed byconsumer's residence, picnics and festivals and other places. Themost preferred size is the 250 ml bottles, followed by 1.5 literbottle, 500 ml bottle, one liter bottle, while the 200 ml bottle isthe least preferred one.
3. Consumers have more exposure of cold drink advertisementsthrough the television. The second most important exposure isprovided by magazines, while exposure through radio is found tobe very low. In terms of consumer's perception of the mosteffective media, the TV is the most effective media, followed bymagazine, Hoarding board, wall paintings and radio. Even thoughthe exposure of cold drink advertisements through radio is foundto be low, yet consumers feel that it is an effective medium foradvertisement of cold drink after the TV.
64
4. All respondents are found to recall the advertisement of colddrink. This indicates that cold drink advertisements have not onlyhigher level of exposure but also a very high recall value. Therecall value of Coke advertisements was highest, followed byPepsi, Sprite, Real, Fanta, Rio and Mirinda. A very large numberof respondents remember TV advertising. The study showed thatTV is more attractive media and radio is the weakest media ofadvertisement for cold drink.
5. The advertisements have very little action effects as a largenumber of respondents are found to buy cold drink when theyneed. The study however showed that although consumers buycold drink when the need arises, advertisements have played avery strong role in the choice of cold drink brand.
6. Consumers are found to often try other brands as almost half ofthe respondents changed their brand to find new taste; more thanone-third changed their brand when their most preferred brandwas not available. Some consumers are found to change theirbrand because of price factor, or when competing brand provideddifferent sales scheme and very few due to advertisement.
7. The frequency of consumption of cold drink is quite high inParwanipur. Consumers who take cold drink daily are about moreconsumers generally purchase cold drink for themselves orthrough their family members.
8. The taste stands the first reason for having Coke followed bytaste, while in case of Pepsi, its thirst-quenhing attribute stands asthe first reason followed by its brand name and availability. Thetaste properties of both Real and Rio are the first and second mostimportant reasons for consumption of this fruit-based drink.
9. Cold drink users primarily like foreign based advertisementswhile there are sufficient numbers of respondents who like otherforms of advertisements.
10. The study showed that availability of Coca-Cola products (Coke,Fanta and Sprite) is generally higher than Pepsi products (Pepsi,Mirinda and 7'up). Real is also found to be very strong in terms ofavailability in the retail stores or the study area, while Rio isslowly catching up in the market.
65
11. The Coke is at the top position among the brands as two-third ofthe retailers opined it as the most-selling brand, followed byFanta and Pepsi. In the study, most of the retailers opined that250 ml bottle has the highest sales and that it is easy to sell colddrink in bottles.
12. The Coco-cola and Real salesmen visit about half of the retailoutlets on a daily basis. The shop visit by the company salesmenfor Pepsi and Rio is found to be mostly any day. This indicatesthat the Coca-cola and Real have more aggressive marketingstrategy in Parwanipur than the Pepsi and Rio.
13. The study indicates that the retailers in general are satisfied fromthe performance of the distributors of cold drink in Parwanipur.About half of the retailers feel that the Coca-Cola Company'sdistribution channel is very good, while for Pepsi only 13.33% ofthe retailers opined that the company's distribution channel isvery good. This indicates that the retailers have higher level ofsatisfaction with Coca-Cola's distribution than the distribution ofPepsi. Similarly, retailers are satisfied with the distribution ofReal and Rio. The retailers are found to prefer to sell Cokebecause of its high demand in the market.
14. The study reveals that the retailers have high faith on advertisingfor its effect on sales. It also shows that retailers have high faithin the Coke advertisement as one-third of them feel that theadvertisement of Coke has influenced its sales, while this figurefor Pepsi is only 20%. However, 40% of retailers claim that thePrize and advertisement should be better to increase the sales,about one-third of the retailers want the prize in cork, and one-third of the retailers said the advertisement should be increased.From this, it may be inferred that the prize and advertisement areessential to increase the sales of cold drink. Retailers are found toprefer cash prizes to induce sales of cold drinks, followed by itemprizes, coupon prizes and awards.
15. Half of retailers receive sales promotion schemes from thecompanies in the form of discount in cold drink, followed by freefridge and cash discount. The cold drink companies do notprovide any prizes to the retailers as a promotion scheme. Morethan four-fifth of the retailers are brand loyal as more than of theretailers opined that even if a competing company provides moresales schemes they don't stop selling the cold brand.
66
5.3 Recommendations
Based on the conclusions derived from this study, the followingrecommendations have been suggested to the companies selling colddrink in Parwanipur.
1. Since Coca-Cola products (Coke, Fanta and Sprite) have acombined market share of more than 81% of the cold drinkmarket and also has a very aggressive marketing strategy, it isnecessary for other cold drink companies to review and revisetheir respective marketing strategies in Parwanipur.
2. Since consumers are found to give high weight age to "quenchingthe thirst" and "for delight", the advertisements of the cold drinksshould be built around these two major attributes. As consumersare found to give higher preference to the taste, quality and brandname in the choice of cold drink, the advertisements should alsobe focused on these important aspects.
3. As consumers have more exposure of cold drink advertisementsthrough the TV and magazines, these media should beextensively utilized.
4. The recall value of Fanta, Rio and Mirinda advertisements wasvery low and these advertisements need corrections. The studyshowed that although consumers buy cold drink when the needarises, advertisements have played a very strong role in thechoice of cold drink brand.
5. Since brand switching is very common among the consumersmainly to new taste, or unavailability of the most preferred brand,companies should focus on a better availability of their brands.Pepsi products (Pepsi, Mirinda and 7'up) need to improve on itsavailability factor.
6. Since cold drink users primarily like Foreign basedadvertisements, companies should increase advertisements onNepalese advertisements.
7. Pepsi and Rio have to improve their retail marketing strategies asthe satisfaction level of retailers is found to be low.
67
8. The taste and sales schemes are essential to increase the sales ofcold drink. Retailers are found to prefer cash prizes to inducesales of cold drinks, followed by item prizes, coupon prizes andawards. Companies should focus on these sales promotionschemes.
68
BIBLIOGRAPHY
BOOKS
1. Agrawal, Govinda Ram, "Marketing for Small Business" 1982,CEDA, T.U., Kirtipur
2. Alderson, Wroe and Green, Paul E. "Planning and Problem Solvingin Marketing" 1964, Homewood II, Richard D. Irwin Inc.
3. Alderson, Wroe; "Marketing Behaviour and Executive Action"1957, Homewood III: Richard D. Irwin.
4. Ansary, Adel I El. And Kramer, Oscar E. "Social Marketing: Thefamily planning experience" Journal of Marketing Vol. 37, no. 3,July 1973:1
5. Borden, Neil H and Marshal, Martin V, "AdvertisingManagement", 1959, Irwin, Homewood III.
6. Buell, Victor p; "Marketing Management" 1984, Mc Graw HillBook company, USA
7. Carvens, David W; Hills Gerald E, Woodruff Robert B,"Marketing Marnagement" 1996, Richard D. Irwin Inc. USA
8. Committee on Definitions 1960, American Marketing Association,Chicago.
9. Daver, Rustams "Modern Marketing Management" 1977, Bombay:Progressive Corporation (P) Ltd.
10.Dholakia, Khurana, Bhandari and Jain, "Marketing Management"1998, New Delhi: Macmillan India Ltd.
11.Duglass Johson "Advertising Today" 1978, Chicago III, ScienceResearch Associates.
12.Evans, Joel R, Barry Bermann, "Marketing" 1982, New York:Mcmillan Publishing Company, Inc.
13.Evans, Joel R; Berman, Barry; "Marketing" 1982, 3rd edition,Mcmillan Publishing Co. Inc. New York 10022
14.Hansen, Richard W; Cocanougher, A. Benton and Harvey, MichaelG. "An application of marketing concept in the public sector",Chicago American Marketing association
15.Hupp, Burr W "Inventory Policy is a top ManagementResponsibility" 1969, New York: Macmillan Company
16.Jain, Subhash C., "The Evolution of Strategic Marketing" 1986,CBS Publisher and Distributors, New Delhi
17.Kelly, Egene J and Lazal William, "Managerial Marketing" 1972,Richard D. Irwin Inc.
18.Koirala, Kundan Dutta; "Marketing Management" 2057, M.K.Publishers and Distributors, Kathmandu, Nepal
69
19.Kotler, Philip "Marketing Management" 1998, 9th edition, PrenticeHall of India (P) Ltd. New Delhi- 110001
20.Kotler, Philip "Marketing Management: Analysis PlanningImplementation and Control", 1991, New Delhi: Prentice Hall ofIndia, (P) Ltd
21.Kotler, Philip "The Tasks of Marketing Management", Journal ofMarketing, vol. 37 Oct. 1973
22.Kotler, Philip, "Marketing Management: Planning Analysis andControl" 1980, 4th edition, Englewood Cliffs, N.J: Prntice Hall
23.Kotler, Philip; "Marketing Management" 1999, 8th edition, PrenticeHall of India (P) Ltd., New Delhi-110001
24.Kotler, Philip; Armstrong; Gray "Principle of Marketing" 1999, 8th
edition, Prentice Hall of India (P) Ltd., New Delhi-11000125.Lazer, William; Labarbara, Priscilla; Maclachlah, James and
Smith, Allen "Marketing 2000" 1990, Beyond Chicago AmericanMarketing Association
26.Lewis Ronald J. "Strengthening Control of Physical DistributionCost" 1969, New York; Macmillan Company
27.Macmillan Dictionary of modern Economics, 4th edition28.McCarthy, E. Jerome; "Basic Marketing" 1996, Homewood, IL
Irwin29.Pererson, Robin "Marketing: a contemporary Introduction" 1977,
Weley Hamilton Publication30.Schnaars, Steven P. "Marketing Strategy" 1991, Maxwel
Macmillan, Canada Inc.31.Stanton, W.J; Futrell charles; "Fundamentals of Marketing", 8th
edition, Mc Graw Hill International Edition, Marketing Series32.Stanton, W.J; Futrell, Charles; "Fundamentals of Marketing", 8th
edition, Mc Graw Hill International Edition, Marketing Series33.Terry, George R., "Principles of Managemet", 1977, Bombay,
Taraporevala publishing34.Tilman, Rollie and Kirkpatrick, C.A. "Promotion: Persuasive
Communication in Marketing" 1968, Homewood III, Richard D.Irwin Inc.
35.Varda, Rajan P.R., (eds) "Business of Marketing India", 1995,Jaico Publishing House
36.Zikmund and D, Damico "Marketing" 1986, 2nd edition, New York,John Wiley Inc.
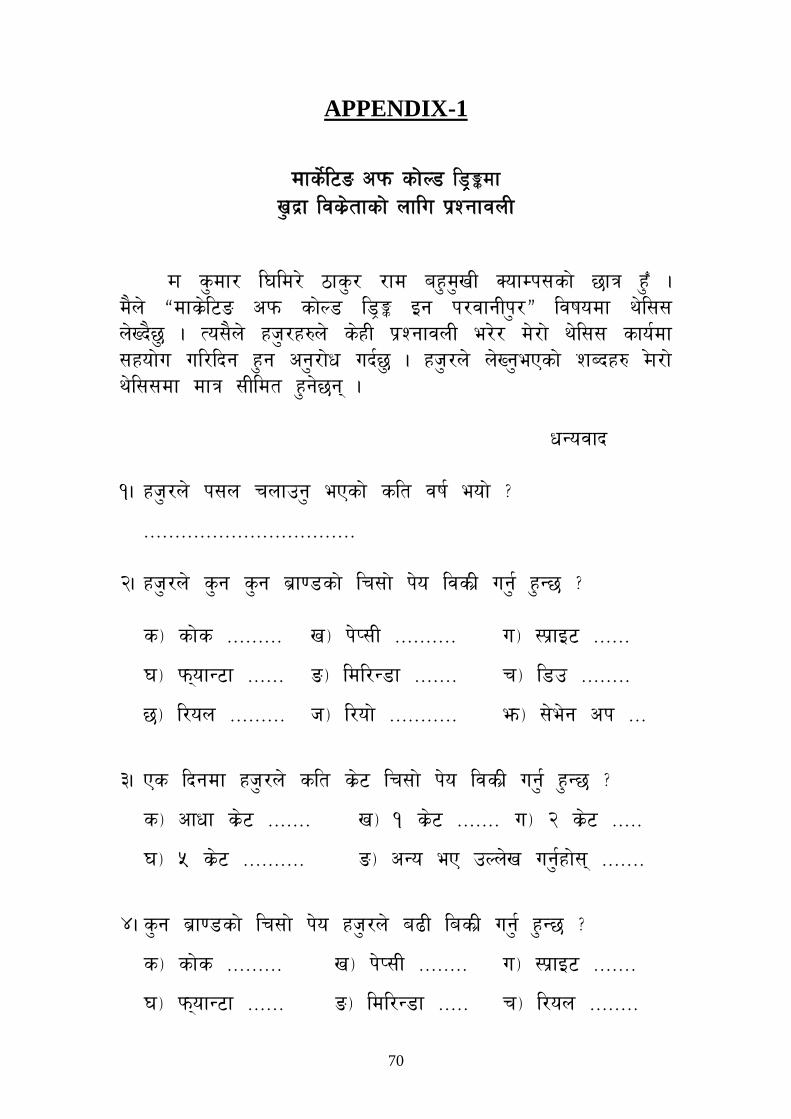
70
APPENDIX-1
Dffs]{l6ª ckm sf]N8 l*««°dfV'fb|f ljs|]tfsf] nflu k|ZgfjnL
Df s'df/ l#ld/] &fs'/ /fd ax'd'vL SofDk;sf] %fq x¤' .d}n] ædfs|]l^ª ckm sf]N* l*«° Og k/jfgLk'/Æ ljifodf y]l;;n]Vb}%' . To;}n] xh'/x?n] s]xL k|ZgfjnL e/]/ d]/f] y]l;; sfo{df;xof]u ul/lbg x'g cg'/f]w ub{%' . xh'/n] n]Vg'ePsf] zAbx? D]f/f]y]l;;df dfq ;Lldt x'g]%g\ .
wGojfb
1. xh'/n] k;n rnfpg' ePsf] slt jif{ eof] <
==================================
2. xh'/n] s'g s'g a|f)*sf] lr;f] k]o ljsL| ug{' x'G% <
s_ sf]s ========= v_ k]K;L ========== u_ :k|fO^ ======
#_ km\ofG^f ====== ª_ ldl/G*f ======= r_ l*p ========
%_ l/on ========= h_ l/of] =========== em_ ;]e]g ck ===
3. Ps lbgdf xh'/n] slt s|]^ lr;f] k]o ljsL| ug{' x'G% <
s_ cfwf s|]^ ======= v_ 1 s|]^ ======= u_ 2 s|]^ =====
#_ 5 s|]^ ========== ª_ cGo eP pNn]v ug'{xf];\ =======
4. s'g a|f)*sf] lr;f] k]o xh'/n] a(L lasL| ug{' x'G% <
s_ sf]s ========= v_ k]K;L ======== u_ :k|fO^ =======
#_ km\ofG^f ====== ª_ ldl/G*f ===== r_ l/on ========
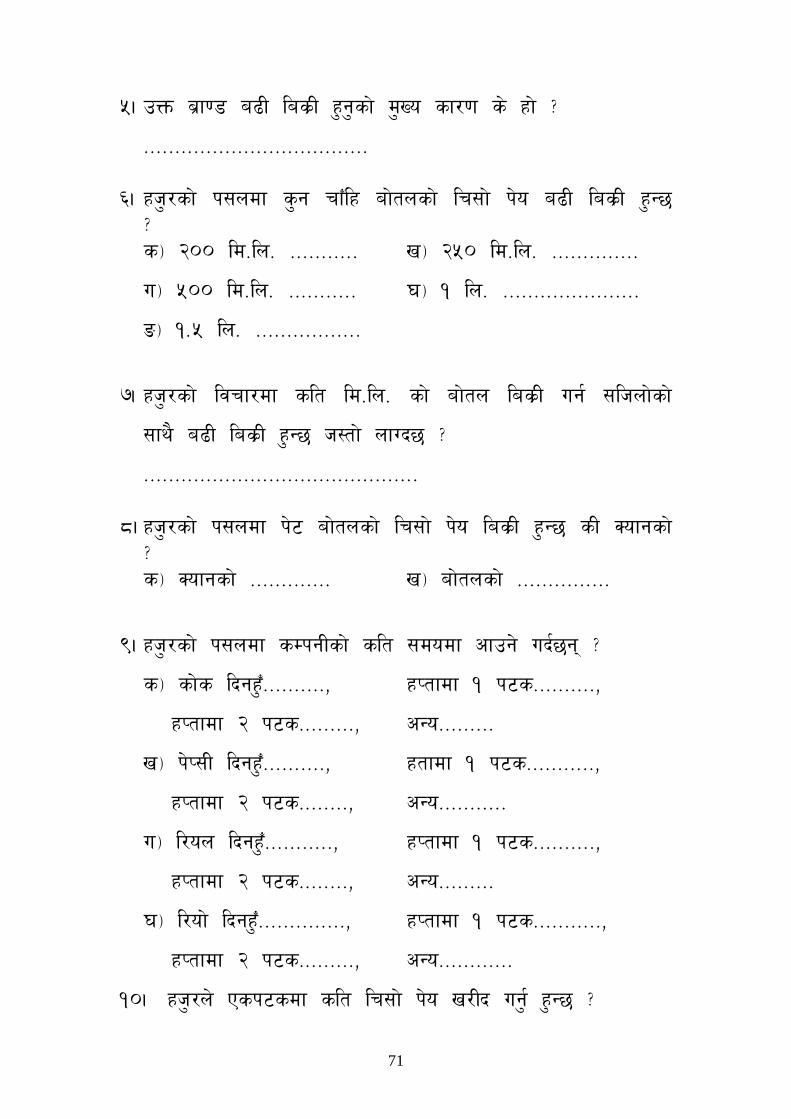
71
5. pQm a|f)* a(L las|L x'g'sf] d'Vo sf/)f s] xf] <
====================================
6. xh'/sf] k;ndf s'g rf¤lx af]tnsf] lr;f] k]o a(L las|L x'G%<s_ 200 ld=ln= =========== v_ 250 ld=ln= ==============
u_ 500 ld=ln= =========== #_ 1 ln= ======================
ª_ 1=5 ln= =================
7. xh'/sf] ljrf/df slt ld=ln= sf] af]tn las|L ug{ ;lhnf]sf]
;fy} a(L las|L x'G% h:tf] nfUb% <
============================================
8. xh'/sf] k;ndf k]^ af]tnsf] lr;f] k]o las|L x'G% sL Sofgsf]<s_ Sofgsf] ============= v_ af]tnsf] ===============
9. xh'/sf] k;ndf sDkgLsf] slt ;dodf cfpg] ub{%g\ <
s_ sf]s lbgx¤'==========, xKtfdf 1 k^s==========,
xKtfdf 2 k^s=========, cGo=========
v_ k]K;L lbgx¤'==========, xtfdf 1 k^s===========,
xKtfdf 2 k^s========, cGo===========
u_ l/on lbgx¤'===========, xKtfdf 1 k^s==========,
xKtfdf 2 k^s========, cGo=========
#_ l/of] lbgx¤'==============, xKtfdf 1 k^s===========,
xKtfdf 2 k^s=========, cGo============
10. xh'/n] Psk^sdf slt lr;f] k]o v/Lb ug'{ x'G% <
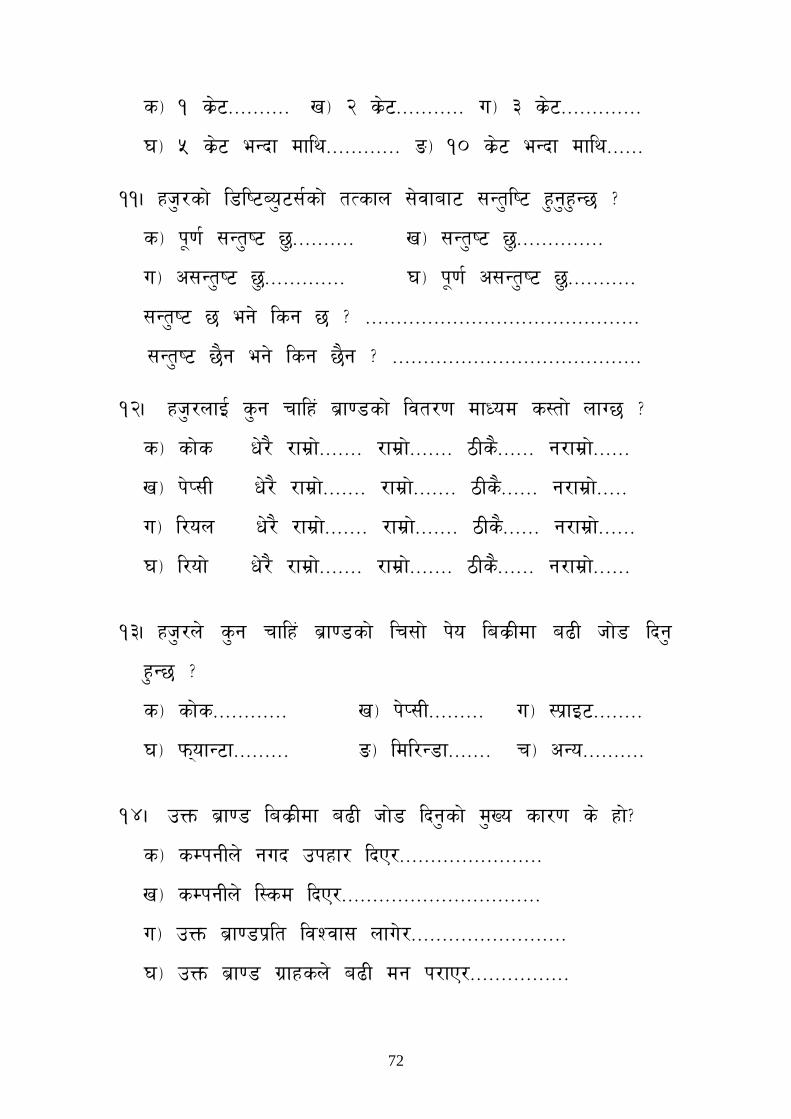
72
s_ 1 s|]^========== v_ 2 s|]^=========== u_ 3 s|]^=============
#_ 5 s|]^ eGbf dfly============ ª_ 10 s|]^ eGbf dfly======
11. xh'/sf] l*li^Ao'^;{sf] tTsfn ;]jfaf^ ;Gt'li^ x'g'x'G% <
s_ k")f{ ;Gt'i^ %'========== v_ ;Gt'i^ %'==============
u_ c;Gt'i^ %'============= #_ k")f{ c;Gt'i^ %'===========
;Gt'i^ % eg] lsg % < ============================================
;Gt'i^ %}g eg] lsg %}g < ========================================
12. xh'/nfO{ s'g rflx+ a|f)*sf] ljt/)f dfWod s:tf] nfU% <
s_ sf]s w]/} /fd|f]======= /fd|f]======= &Ls}====== g/fd|f]======
v_ k]K;L w]/} /fd|f]======= /fd|f]======= &Ls}====== g/fd|f]=====
u_ l/on w]/} /fd|f]======= /fd|f]======= &Ls}====== g/fd|f]======
#_ l/of] w]/} /fd|f]======= /fd|f]======= &Ls}====== g/fd|f]======
13. xh'/n] s'g rflx+ a|f)*sf] lr;f] k]o las|Ldf a(L hf]* lbg'
x'G% <
s_ sf]s============ v_ k]K;L========= u_ :k|fO^========
#_ km\ofG^f========= ª_ ldl/G*f======= r_ cGo==========
14. pQm a|f)* las|Ldf a(L hf]* lbg'sf] d'Vo sf/)f s] xf]<
s_ sDkgLn] gub pkxf/ lbP/=======================
v_ sDkgLn] l:sd lbP/================================
u_ pQm a|f)*k|lt ljZjf; nfu]/=========================
#_ pQm a|f)* u|fxsn] a(L dg k/fP/================
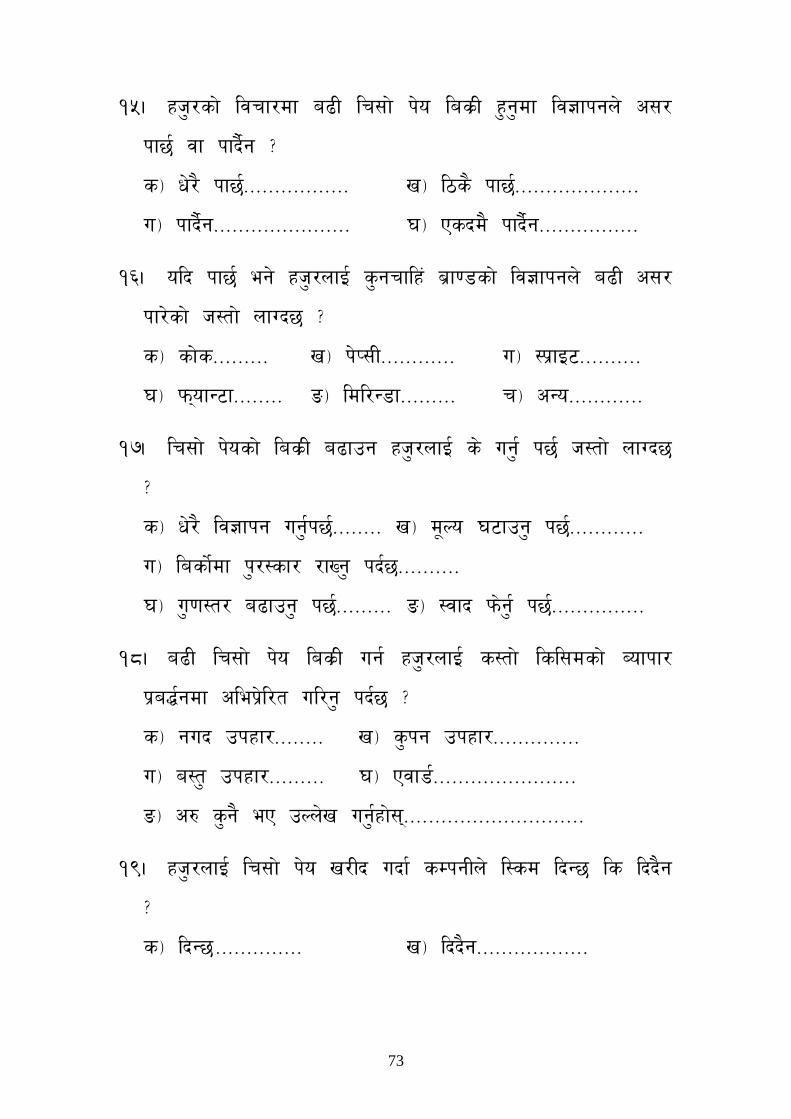
73
15. xh'/sf] ljrf/df a(L lr;f] k]o las|L x'g'df lj!fkgn] c;/
kf%{ jf kfb}{g <
s_ w]/} kf%{================= v_ l&s} kf%{====================
u_ kfb}{g====================== #_ Psbd} kfb}{g================
16. olb kf%{ eg] xh'/nfO{ s'grflx+ a|f)*sf] lj!fkgn] a(L c;/
kf/]sf] h:tf] nfUb% <
s_ sf]s========= v_ k]K;L============ u_ :k|fO^==========
#_ km\ofG^f======== ª_ ldl/G*f========= r_ cGo============
17. lr;f] k]osf] las|L a(fpg xh'/nfO{ s] ug'{ k%{ h:tf] nfUb%
<
s_ w]/} lj!fkg ug'{k%{======== v_ d"No #^fpg' k%{============
u_ lasf]{df k'/:sf/ /fVg' kb{%==========
#_ u')f:t/ a(fpg' k%{========= ª_ :jfb km]g'{ k%{===============
18. a(L lr;f] k]o las|L ug{ xh'/nfO{ s:tf] lsl;dsf] Aofkf/
k|a${gdf clek|]l/t ul/g' kb{% <
s_ gub pkxf/======== v_ s'kg pkxf/==============
u_ a:t' pkxf/========= #_ Pjf*{=======================
ª_ c? s'g} eP pNn]v ug'{xf];\=============================
19. xh'/nfO{ lr;f] k]o v/Lb ubf{ sDkgLn] l:sd lbG% ls lbb}g
<
s_ lbG%============== v_ lbb}g==================
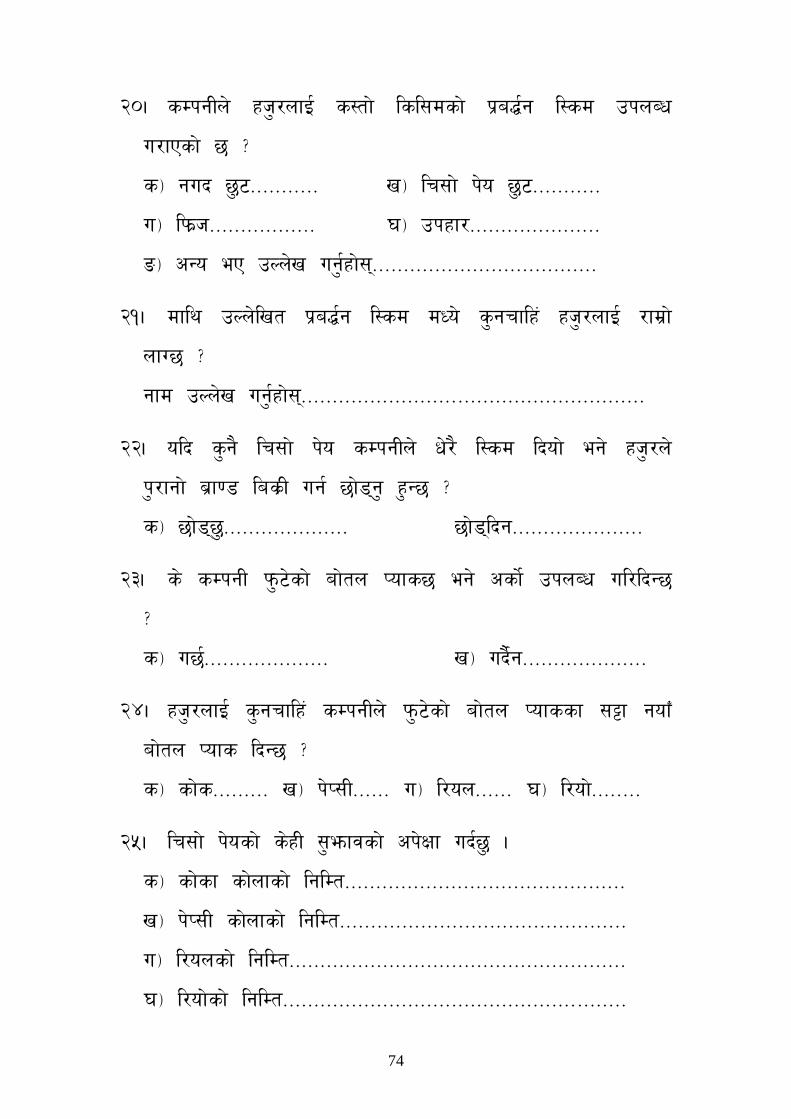
74
20. sDkgLn] xh'/nfO{ s:tf] lsl;dsf] k|a${g l:sd pknAw
u/fPsf] % <
s_ gub %'^=========== v_ lr;f] k]o %'^===========
u_ lkm|h================= #_ pkxf/=====================
ª_ cGo eP pNn]v ug'{xf];\====================================
21. dfly pNn]lvt k|a${g l:sd dWo] s'grflx+ xh'/nfO{ /fd|f]
nfU% <
gfd pNn]v ug'{xf];\=======================================================
22. olb s'g} lr;f] k]o sDkgLn] w]/} l:sd lbof] eg] xh'/n]
k'/fgf] a|f)* las|L ug{ %f]*\g' x'G% <
s_ %f]*\%'==================== %f]*\lbg=====================
23. s] sDkgL km'^]sf] af]tn Kofs% eg] csf]{ pknAw ul/lbG%
<
s_ u%{==================== v_ ub}{g====================
24. xh'/nfO{ s'grflx+ sDkgLn] km'^]sf] af]tn Kofssf ;§f gof¤
af]tn Kofs lbG% <
s_ sf]s========= v_ k]K;L====== u_ l/on====== #_ l/of]========
25. lr;f] k]osf] s]xL ;'emfjsf] ck]Iff ub{%' .
s_ sf]sf sf]nfsf] lglDt=============================================
v_ k]K;L sf]nfsf] lglDt==============================================
u_ l/onsf] lglDt======================================================
#_ l/of]sf] lglDt=======================================================
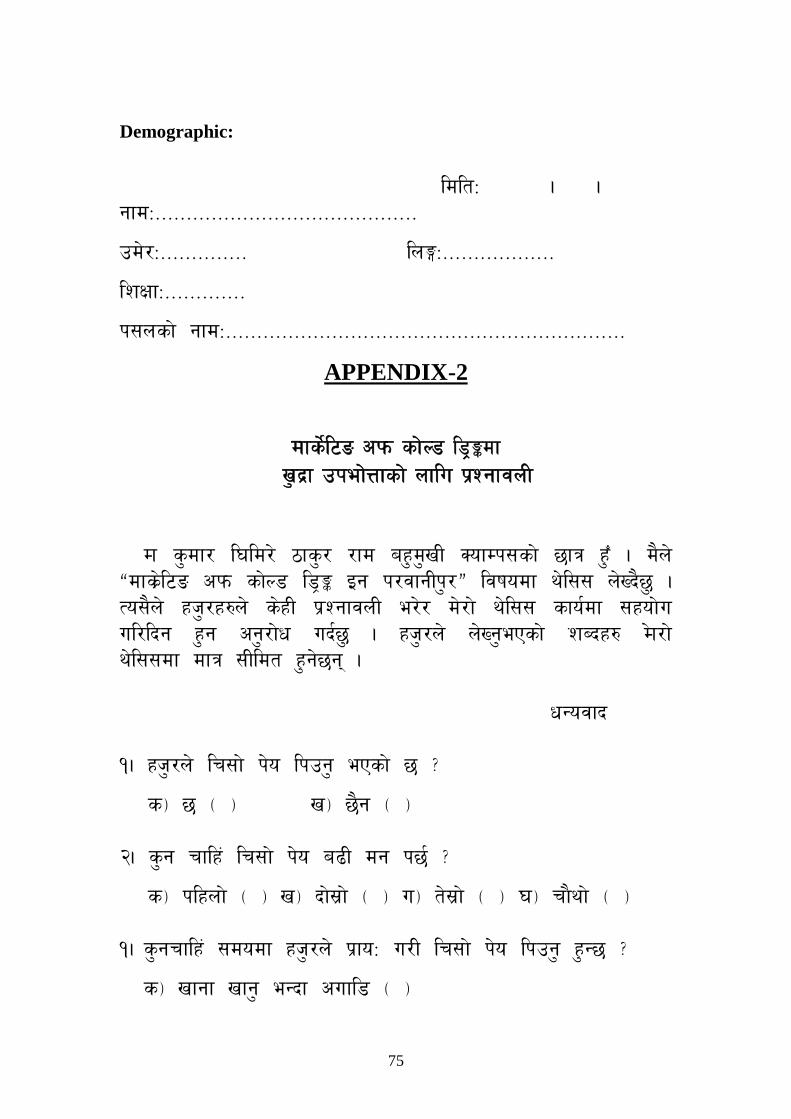
75
Demographic:
ldltM . .gfdM==========================================
pd]/M============== lnéM==================
lzIffM=============
k;nsf] gfdM================================================================
APPENDIX-2
Dffs]{l6ª ckm sf]N8 l*««°dfV'fb|f pkef]Qfsf] nflu k|ZgfjnL
Df s'df/ l#ld/] &fs'/ /fd ax'd'vL SofDk;sf] %fq x¤' . d}n]ædfs|]l^ª ckm sf]N* l*«° Og k/jfgLk'/Æ ljifodf y]l;; n]Vb}%' .To;}n] xh'/x?n] s]xL k|ZgfjnL e/]/ d]/f] y]l;; sfo{df ;xof]uul/lbg x'g cg'/f]w ub{%' . xh'/n] n]Vg'ePsf] zAbx? D]f/f]y]l;;df dfq ;Lldt x'g]%g\ .
wGojfb
1. xh'/n] lr;f] k]o lkpg' ePsf] % <
s_ % - _ v_ %}g - _
2. s'g rflx+ lr;f] k]o a(L dg k%{ <
s_ klxnf] - _ v_ bf];|f] - _ u_ t];|f] - _ #_ rf}yf] - _
1. s'grflx+ ;dodf xh'/n] k|foM u/L lr;f] k]o lkpg' x'G% <
s_ vfgf vfg' eGbf cufl* - _
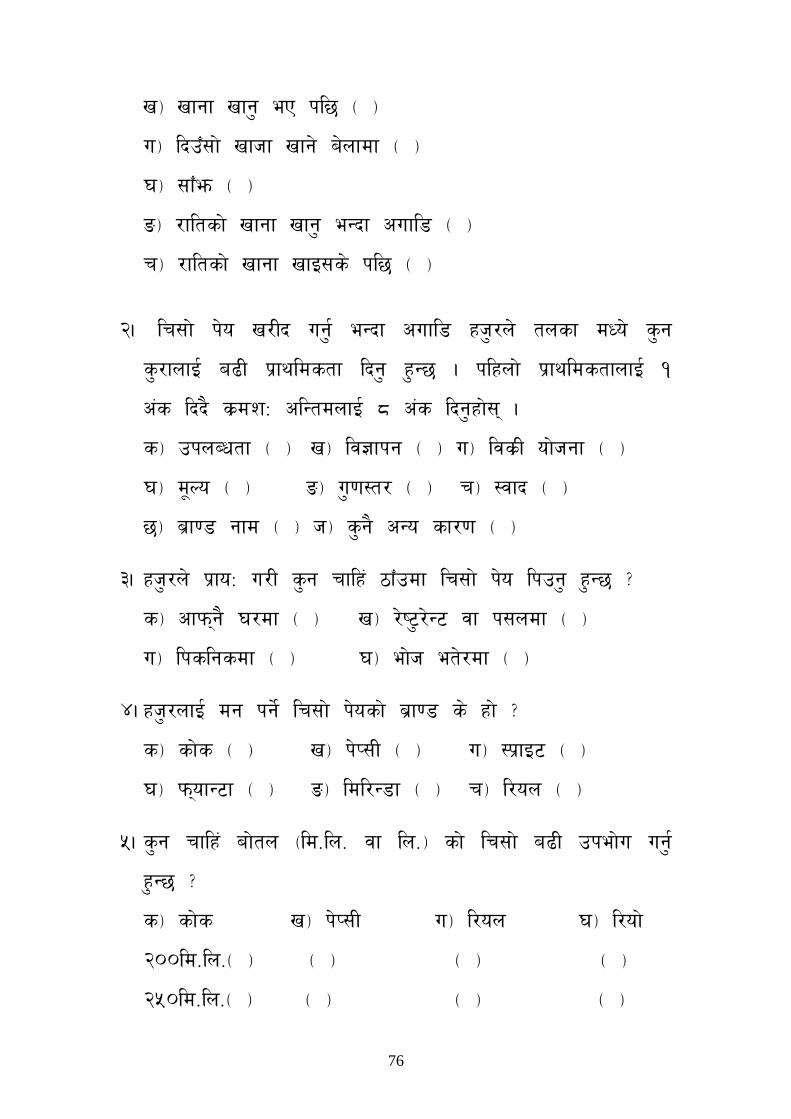
76
v_ vfgf vfg' eP kl% - _
u_ lbp¤;f] vfhf vfg] a]nfdf - _
#_ ;f¤em - _
ª_ /fltsf] vfgf vfg' eGbf cufl* - _
r_ /fltsf] vfgf vfO;s] kl% - _
2. lr;f] k]o v/Lb ug'{ eGbf cufl* xh'/n] tnsf dWo] s'g
s'/fnfO{ a(L k|fyldstf lbg' x'G% . klxnf] k|fyldstfnfO{ 1
c+s lbb} s|dzM clGtdnfO{ 8 c+s lbg'xf];\ .
s_ pknAwtf - _ v_ lj!fkg - _ u_ ljs|L of]hgf - _
#_ d"No - _ ª_ u')f:t/ - _ r_ :jfb - _
%_ a|f)* gfd - _ h_ s'g} cGo sf/)f - _
3. xh'/n] k|foM u/L s'g rflx+ &f¤pdf lr;f] k]o lkpg' x'G% <
s_ cfkm\g} #/df - _ v_ /]i '̂/]G^ jf k;ndf - _
u_ lkslgsdf - _ #_ ef]h et]/df - _
4. xh'/nfO{ dg kg]{ lr;f] k]osf] a|f)* s] xf] <
s_ sf]s - _ v_ k]K;L - _ u_ :k|fO^ - _
#_ km\ofG^f - _ ª_ ldl/G*f - _ r_ l/on - _
5. s'g rflx+ af]tn -ld=ln= jf ln=_ sf] lr;f] a(L pkef]u ug'{
x'G% <
s_ sf]s v_ k]K;L u_ l/on #_ l/of]
200ld=ln=- _ - _ - _ - _
250ld=ln=- _ - _ - _ - _
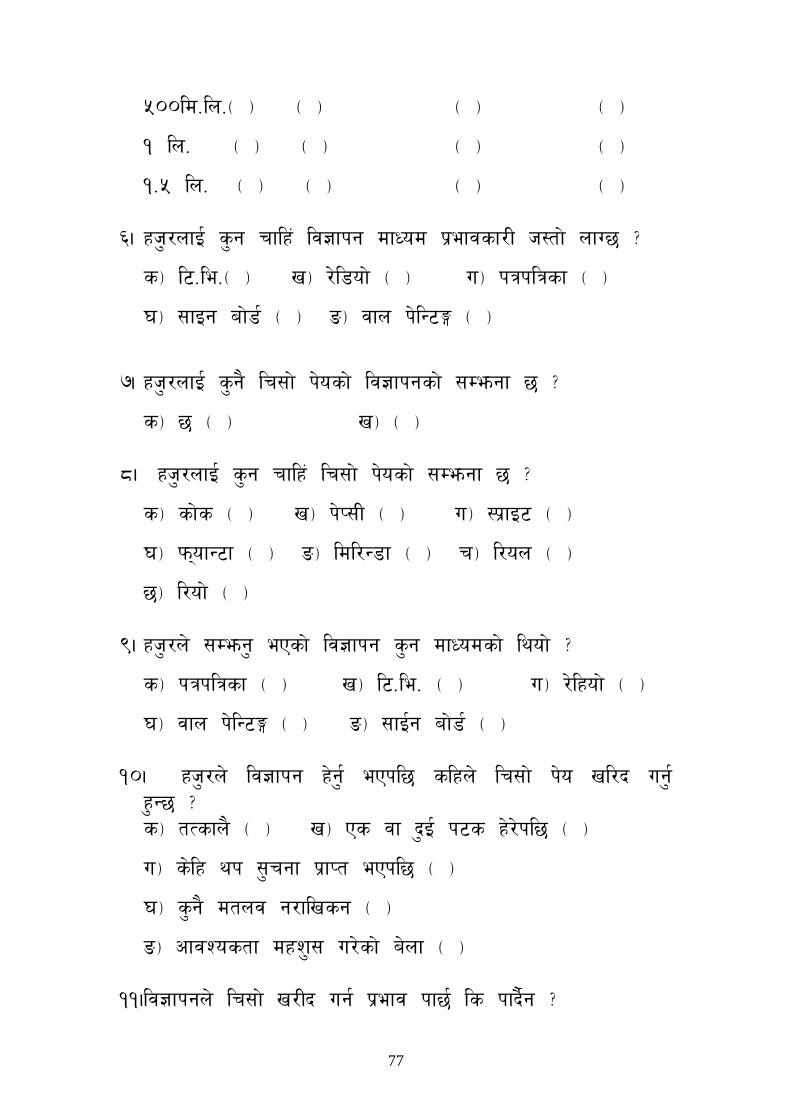
77
500ld=ln=- _ - _ - _ - _
1 ln= - _ - _ - _ - _
1=5 ln= - _ - _ - _ - _
6. xh'/nfO{ s'g rflx+ lj!fkg dfWod k|efjsf/L h:tf] nfU% <
s_ l^=le=- _ v_ /]l*of] - _ u_ kqklqsf - _
#_ ;fOg af]*{ - _ ª_ jfn k]lG^é - _
7. xh'/nfO{ s'g} lr;f] k]osf] lj!fkgsf] ;Demgf % <
s_ % - _ v_ - _
8. xh'/nfO{ s'g rflx+ lr;f] k]osf] ;Demgf % <
s_ sf]s - _ v_ k]K;L - _ u_ :k|fO^ - _
#_ km\ofG^F - _ ª_ ldl/G*f - _ r_ l/on - _
%_ l/of] - _
9. xh'/n] ;Demg' ePsf] lj!fkg s'g dfWodsf] lyof] <
s_ kqklqsf - _ v_ l^=le= - _ u_ /]lxof] - _
#_ jfn k]lG^é - _ ª_ ;fO{g af]*{ - _
10. xh'/n] lj!fkg x]g'{ ePkl% slxn] lr;f] k]o vl/b ug'{x'G% <s_ tTsfn} - _ v_ Ps jf b'O{ k^s x]/]kl% - _
u_ s]lx yk ;'rgf k|fKt ePkl% - _
#_ s'g} dtnj g/flvsg - _
ª_ cfjZostf dxz'; u/]sf] a]nf - _
11.lj!fkgn] lr;f] v/Lb ug{ k|efj kf%{ ls kfb}{g <
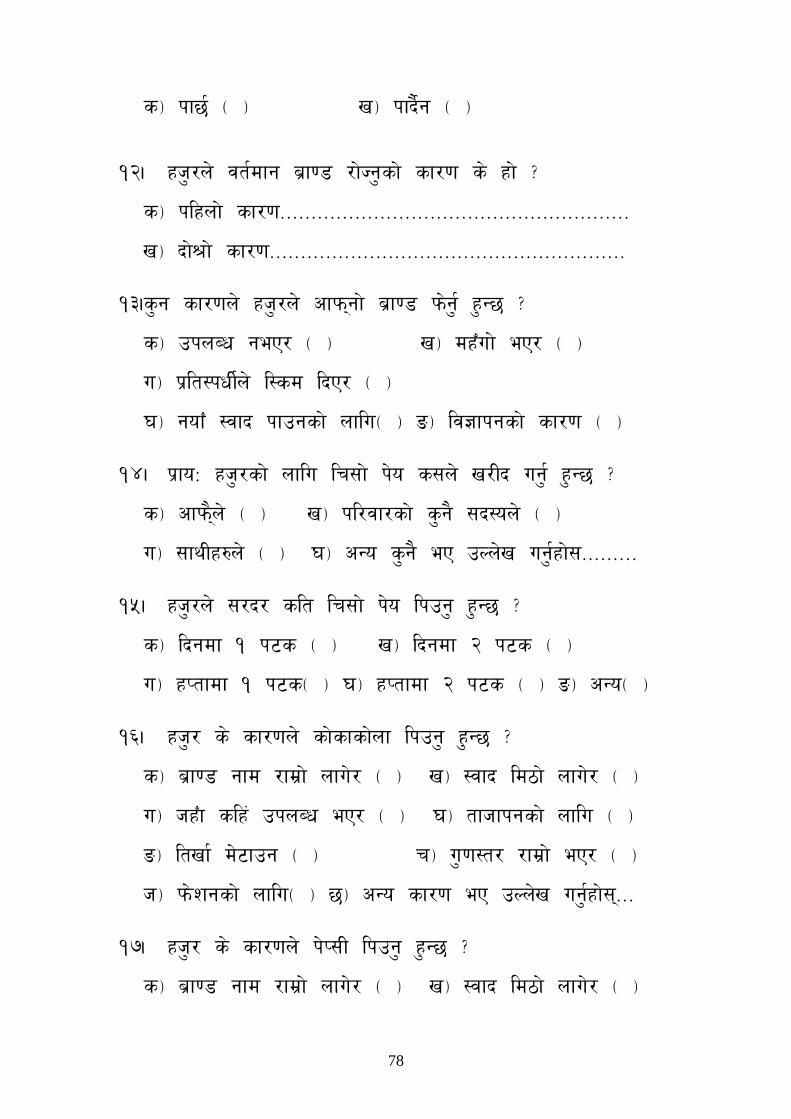
78
s_ kf%{ - _ v_ kfb}{g - _
12. xh'/n] jt{dfg a|f)* /f]Hg'sf] sf/)f s] xf] <
s_ klxnf] sf/)f========================================================
v_ bf]>f] sf/)f=========================================================
13.s'g sf/)fn] xh'/n] cfkm\gf] a|f)* km]g{' x'G% <
s_ pknAw geP/ - _ v_ dx¤uf] eP/ - _
u_ k|lt:kwL{n] l:sd lbP/ - _
#_ gof¤ :jfb kfpgsf] nflu- _ ª_ lj!fkgsf] sf/)f - _
14. k|foM xh'/sf] nflu lr;f] k]o s;n] v/Lb ug'{ x'G% <
s_ cfkm\}n] - _ v_ kl/jf/sf] s'g} ;b:on] - _
u_ ;fyLx?n] - _ #_ cGo s'g} eP pNn]v ug'{xf];=========
15. xh'/n] ;/b/ slt lr;f] k]o lkpg' x'G% <
s_ lbgdf 1 k^s - _ v_ lbgdf 2 k^s - _
u_ xKtfdf 1 k^s- _ #_ xKtfdf 2 k^s - _ ª_ cGo- _
16. xh'/ s] sf/)fn] sf]sfsf]nf lkpg' x'G% <
s_ a|f)* gfd /fd|f] nfu]/ - _ v_ :jfb ld&f] nfu]/ - _
u_ hx¤f slx+ pknAw eP/ - _ #_ tfhfkgsf] nflu - _
ª_ ltvf{ d]^fpg - _ r_ u')f:t/ /fd|f] eP/ - _
h_ km]zgsf] nflu- _ %_ cGo sf/)f eP pNn]v ug'{xf];\===
17. xh'/ s] sf/)fn] k]K;L lkpg' x'G% <
s_ a|f)* gfd /fd|f] nfu]/ - _ v_ :jfb ld&f] nfu]/ - _
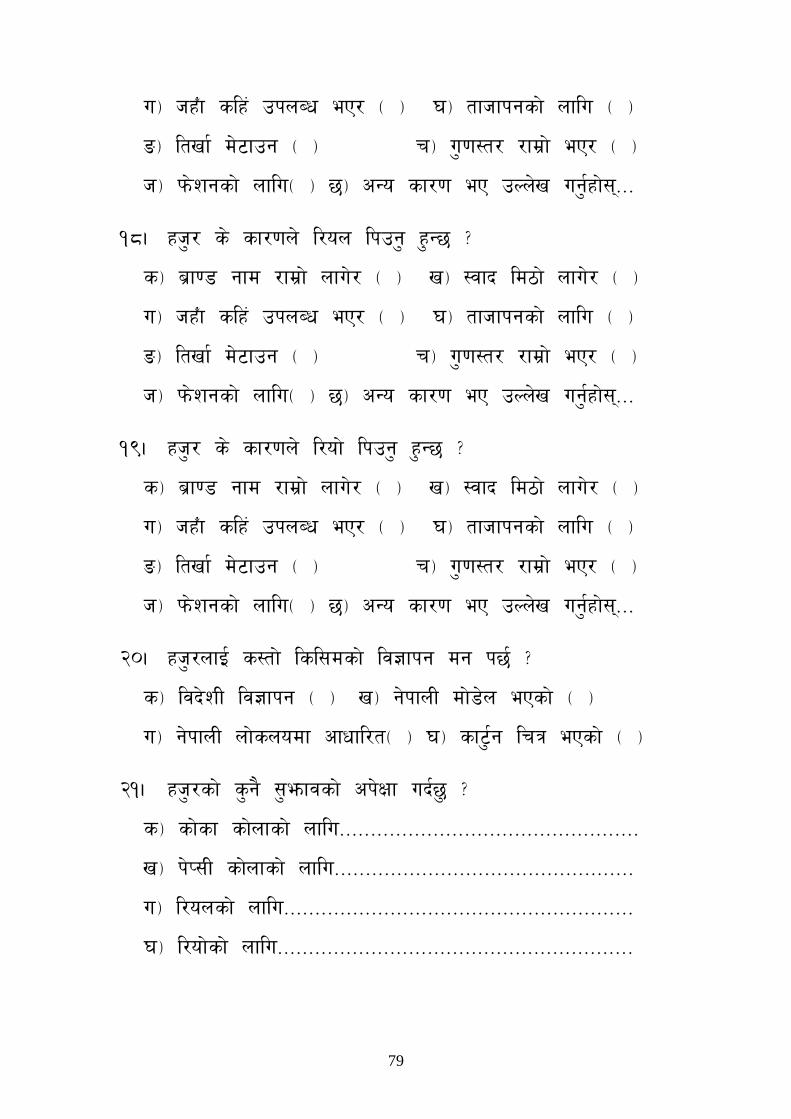
79
u_ hx¤f slx+ pknAw eP/ - _ #_ tfhfkgsf] nflu - _
ª_ ltvf{ d]^fpg - _ r_ u')f:t/ /fd|f] eP/ - _
h_ km]zgsf] nflu- _ %_ cGo sf/)f eP pNn]v ug'{xf];\===
18. xh'/ s] sf/)fn] l/on lkpg' x'G% <
s_ a|f)* gfd /fd|f] nfu]/ - _ v_ :jfb ld&f] nfu]/ - _
u_ hx¤f slx+ pknAw eP/ - _ #_ tfhfkgsf] nflu - _
ª_ ltvf{ d]^fpg - _ r_ u')f:t/ /fd|f] eP/ - _
h_ km]zgsf] nflu- _ %_ cGo sf/)f eP pNn]v ug'{xf];\===
19. xh'/ s] sf/)fn] l/of] lkpg' x'G% <
s_ a|f)* gfd /fd|f] nfu]/ - _ v_ :jfb ld&f] nfu]/ - _
u_ hx¤f slx+ pknAw eP/ - _ #_ tfhfkgsf] nflu - _
ª_ ltvf{ d]^fpg - _ r_ u')f:t/ /fd|f] eP/ - _
h_ km]zgsf] nflu- _ %_ cGo sf/)f eP pNn]v ug'{xf];\===
20. xh'/nfO{ s:tf] lsl;dsf] lj!fkg dg k%{ <
s_ ljb]zL lj!fkg - _ v_ g]kfnL df]*]n ePsf] - _
u_ g]kfnL nf]snodf cfwfl/t- _ #_ sf^{'g lrq ePsf] - _
21. xh'/sf] s'g} ;'emfjsf] ck]Iff ub{%' <
s_ sf]sf sf]nfsf] nflu================================================
v_ k]K;L sf]nfsf] nflu================================================
u_ l/onsf] nflu========================================================
#_ l/of]sf] nflu=========================================================
80
Demographics:
ldltM
gfdM=============================================
pd]/M============== lnéM==================
lzIffM=============
k]zfM=================================================================


