Embed Size (px)
Citation preview
1
CHAPTER – I
INTRODUCTION
1.1 Background of the Study
Nepal is adopting the mixed economic system. “This system is the mix of free
market and centrally planned economies where both public-private co-exist.”
It’s called public-private-partnership model with 290 per capital income. It has
a poor economy. More than 80 percent of people involved in agriculture
actively. But this sector contribution is only 40-44 percent of GDP. It is major
sources of employment and income of rural people. For the Nepalese
economics the public sector plays a strategic role through the ownership and
control of basic industries including utilities. The private sector owns
agriculture and small, medium and large industries but is regulated by the state.
In an agricultural country like Nepal, effective mobilization of the agricultural
resource is essential for the economic development of country and
simultaneously industrial sector must be developed. Rapid and sound economic
development is neither possible only from the side of private nor public sector.
Participation of both sectors is essential for economic development of the
country. Different public and private manufacturing industries were established
with the object of balance regional development, public welfare, employment
generation, import substitution and to export promotion for dissemination of
development activities according to national priorities.
Industrialization is the fundamental goal of the most of the developing as well
as developed countries. The prevailing sate of under development is commonly
contributed to lack of adequate industrialization. It is so because most of the
economically advance nations of the contemporary world reached their high
standards of living through successful thrust of industrialization.
Industrialization is the focus point of economic development of backward
countries like Nepal. It is one of the major tools with the aid of which the
vicious of backwardness and poverty can be minimized. Industrialization helps
the unemployment persons especially from agriculture sector to find alternative
2
models of productive activity and more into much more productive activities.
This reduces the unemployment problem and utilizes the resources which helps
the countries for economic development.
Modern manufacturing enterprises in Nepal have a history of about 73 years.
It was in 1935 that the first modern industry of Nepal Biratnagar Jute Mill
established in the joint venture of Nepal and India. In order to reap quick
benefit from the shortage of consumer, goods created by the Second World
War. Nineteen other mills were established haphazardly till 1945. They
consisted of sugar, match, rice, Oil, cotton, ceramics, cigarette, glass,
chemicals bobbins, plywood, hydropower, furniture, soap, paper and
Ayurvedic medicines etc. after the end of the Second World War, Biratnagar
Jute Mill and Juddha Match factory at Birjung-continued operation
successfully. Most other modern industries either closed down or declined.
Nepal entered the era of planned development in 1956. The growth of
industries various plan has been mixed.
Now a days, many people have transfer industrial sector from agriculture.
People have felt that without industrialization or develop of industry economic
improvement is impossible which also show from world history because there
were not the industrialization, Japan America, Britain would not the rich
country or strong economic condition. So the Nepal also has followed them.
Now pace of industrialization is increasing Nepal has become the member of
WTO. So the policy of government is free now. It promotes the privatization to
increase the participation of general public for industrial development.
Production and sale planning is an important tools of profit planning and
control. It provide information about behavior of production and sales activities
like production planning schedule, inventory level, cost level, actual and
budgeted production and sales, manpower planning and administration profit
due to variable output. Production and sales planning analysis may therefore by
define as managerial tools showing the relationship between various
ingredients of profit planning.
3
Finally it can be conclude that production and sales planning analysis and its
effectiveness is the base of manufacturing organization. So I will analyze how
production and sales planning analysis affect in profit planning and control
organization and also the relationship and efficiency of utilization in research
work.
1.2 Profile of Sita Ram Gokul Milk (Kathmandu) Limited SGML:
1.2.1 Introduction of Sita Ram Gokul Milk (Kathmandu) limited (SGML)
Sita Ram Gokul Milk (Kathmandu) Ltd. was established on July 18, 1996. It is
the private limited company and promoted by kedia organization. The
enterprise does not have any collaboration. The paid of capital of the company
is NRS. 61.25 million. The main products of this enterprise are pasteurized
milk, cream butter, ghee and yoghurt. The company is perceived as pioneer in
the modern dairy industry from the private sector.
SGML has been collecting cow and Buffalo milk with the farmers to
cooperative centers at the price fixed by the enterprise, then brought to chilling
centers. The company has 13 chilling centers around Butwal area (about 259
km distance from the Kathmandu) in Rupandehi District in Western
Development Region of the country.
To provide packaged drinking milk conforming to relevant specification,
Incorporating Hazard Analysis and Critical Control Points (HACCP)
requirements at to provide at competitive price to meet or exceeds requirements
and satisfaction of valued customers, which should be achieved through
continues improvements in quality of work, enhancing employee participation
at all levels and by using best available resources. The Nepal Burean of
standards and Metrology (NBSM) has fixed the quantity of milk. e.g fat,
S.M.F. contents. The enterprise follows the quality standards and metrology set
by Nepal Bureau of standards and Metrology. The enterprise is the process of
acquiring ISO- 9000.
4
The sale of packaged drinking milk confirming to relevant specification,
following HAACP requirements to some extent to provide at competitive price
to meet or exceed requirements and satisfaction of valued customers is done
through 620 dealers and 1143 sub- dealers in Kathmandu Valley. Among them
443 Dealer and 871 sub dealer in Kathmandu, 131 Dealer and 217 sub dealer in
Lailtpur and 46 Dealer and 55 sub dealer are in Bhaktapur. The company has
accounting software and computers and it has 450 KVA capacities Diesel
Generator set for self-backup source of power. The enterprise sells the
pasteurized milk in half-liter plastic pouch through dealers and sub- dealers.
1.2.2 PRODUCT OF THE COMPANY
Sita Ram Gokul Milk (Kathmandu) Ltd. produces the following product:
i. Pasteurised (processed) Milk, Chocolate milks, Health milk etc.
ii. Butter and Ghee
iii. Cheese
iv. Curd
v. Yoghurt
Production capacity of this product on hourly basis and annual basis shows in
Appendix.
1.2.3 Organization Chart of Sita Ram Gokul Milk (Kathmandu) Ltd.
Sita Ram Gokul Milk (Kathmandu) Ltd. organization chart indicates that Chief
executive officer is the head of director’s board. Under the Chief executive
officer and general manager the company being operates. Four divisions are
under the General Manager (i.e. Production, Finance, Marketing and
Administration) under this division, various department and section in the
company. The organization chart shows in Appendix.
1.3. Statement of the Problem
5
The industrialization process in Nepal is being developed very slowly. In spite
of various attractive policies of the government in respect of industrialization,
new investment made on industrial sector is not satisfactory manufacturing
industries is also not good. Most of the industries are operating in losses and
such condition of the established industries discourages the new investment,
both in manufacturing and non manufacturing sector. There may be various and
different reasons for the poor performance of manufacturing industries.
Such reason should be investigated and should be taken corrective measures for
the improvement of their performance.
Sita Ram Gokul milk is private Limited established in Nepal to fulfill the need
of people by supply quality milk at reasonable price. It also expected to be
financially sound and contribute surplus to GDP. Due to the lack of authority
and communication of goals and objectives from top to lower level
management more over them they don’t maintaining responsibilities and co-
ordination between various developments and responsibilities center, many
enterprise can’t achieve their pre-established objectives and goals.
This study attempts to address minutes relation to management and practice to
sales and production planning in Sita Ram Gokul Milk (Kathmandu) ltd.
How does SGml adopting the PPC at presents?
How to analyze the sales and production planning prepared by SGMl?
Why does there fluctuation at inventory level? (Production)?
Why does there different between budgeted and actual achievement?
1.4 The Objectives of the Study
The main objective of this is to evaluate and examine the techniques of profit
planning and control applied by Sita Ram Gliul Milk (ktm) ltd. The specific
objectives are as follows.
To review the present PPc adopted (using tools of PPc ie. Sales and
production budget) by SGML.
To analyze the sales production planning and inventory policies.
To analyze the financial performance of SGML.
To provide the suggestions and recommendations for improving the
production and sales planning for SGML.
1.5 Significance of the Study
6
The main objective of profit plan is to forecast the future events to overcome
the risk from uncertainties. Very few studies have been made in relation to the
tools of profit planning in Nepalese context and most of the studies are related
to profit planning and control of the public enterprises. Where sales and
production planning as a one tools of PPC is hardly studied. This study is
significance in the sense that it has treated to study. The sales and production
planning analysis of the manufacturing company which is one of the most
importance tools of PPC. The researcher will think that the study will be very
importance to improve the performance of Sita Ram Gokul Milk (ktm) ltd. The
significances of this study are as follows.
The study will be useful to concern bodies to keep their attention on
reducing account irregularities.
This study will be helpful in profit planning system so that it controls
the necessary expenses of the firm.
This study focuses on the application of systematic approaches of profit
planning and analyzes the effectiveness, problem and solution of the
problem.
1.6. Limitations of the Study
These studies only focus of the sales and production planning of the firm.
Where arises different practical and technical problem for the research which is
listed below.
Sales and production planning analysis cover of the five last year (ie.
F/Y 2057/58 to 2061/62).
Analysis is concerned only for the sales and production planning
analysis. It doesn’t analyze the other sector of the company.
The study is based on primary data as well as secondary data. (i.e.
Questionnaire, and financial statement, annual report and publication
journal etc.)
Being a researcher as student and due to the limited time and resources
constraints, the study is neither comprehensive nor extensive.
7
Chapter - II
REVIEW OF LITERATURE
2.1 Conceptual Framework
2.1.1 Profit
There are several interpretations of the profit. An economist says the profit is
reward for entrepreneurship for his risk bearing so on other’s says about the
different definition of profit. It is a primary objective of business. Profit is a
signal for the allocation of resources and a yard stick for judging managerial
efficiency (Kulkarni, 1990: 245). The survival measure of the effective
performance of a business is profit. Profits are the primary measure of success
of the business enterprises. Profits are the acid test of business enterprises
performance. Simply, profit is the excess of income over cost of production”.
The entrepreneur earns profit for organizing and coordinating the other factors
of production land labour and capital of the purpose of producing goods.
Various economists have different views in respect of the term profit.
According to Howley, Profit is the reward for risk taking in business.
Schumpter opines that an entrepreneur earn profits as rewards for his
introducing innovation. J.M. Keynes held the view that profit resulted from
favorable movements of the general price level. Mrs. Joan Robinson and
Chamberlain opined that the greater the degree of monopoly poner the greater
the profits made by the entrepreneur (Joshi, 1993: 170-171).
Finally, it should be noted that profits are residual income left after the
payment of the contractual rewards to other factor of production. The
difference between outflow and inflow is profit. Inflow means the income from
sales or other’s receipt and outflow means the cost of producing and selling the
product. Profit as the reward of bearing risk, uncertainties and the reward of
successful innovation, it is obtained by subtracting the cost from revenue.
Profit = Total Revenue – Total Cost of Production and Selling
8
2.1.2 Planning
Planning is deciding in advance what is to be done in future. Planning is the
feed forward process to reduce uncertainty about the future. The planning
process is the feed forward process to reduce uncertainty about future. The
planning process is based on the conviction that management can plan its
activities and conditions the state of the enterprise determines its destiny
(Pandey, 1994: 554). Planning is a systematic method of thinking out acts and
purpose before hand. It is the first essence of management and all other
functions are performed within the framework of planning. It is the basis
foundation of profit plans.
Planning should start by deciding and defining the objectives of the company,
making sure in the process that there are compatible with the skills and
resources of the under taking. Planning is essential to accomplish goals. It
reduces uncertainty and provides right direction to the employees by
determining the course of action in advance. Formal planning indicates the
responsibility of management and provides an alternative to grouping without
direction. Planning on the other hand, involves the determination of what
should be done, how the goal may be reached and what individual units are to
assume responsibility and be held accountable (Grace, 2001: 102).
Planning is the process of developing enterprise objectives and selecting future
courses of action to accomplish them. It includes.
I. Establishing enterprises objectives.
II. Developing premises about the environment in which they are to be
accomplished.
III. Selecting a course of action for accomplishing the objectives.
IV. Initiating activities necessary to translate plans into action plan.
V. Current re-planning to correct current deficiencies (Glenn et al. 1992: 3).
9
Planning and forecasting are also not same things. Forecasting is a component
of planning or it is a prediction of future event, condition or situation. But
plan includes a program of intended future actions and desired result.
Forecasting is a prediction of what will happen on the basis of certain
assumptions. Planning can be performed under conditions of certainty,
uncertainty or ignorance about future. It is in those situations involving
uncertainty and forecasting provides the maximum help to planners. When
certain exist, forecasting does not require much more effort since prediction
about the future is trivial. When there is ignorance the most that forecasting
can do provide some clues about future possibilities.
However, such clues cannot be provided unless some information is available
and which the forecast can be based. In many organizations the major purpose
of forecasting is to reduce uncertainty and minimize ignorance.
In this way planning is an intellectual process rational way, a systematic way,
goal oriented task, primary function of management and it directs all
managerial activities and it is directed towards efficiency.
2.1.3 Profit Planning
After discussing about the profit and planning, it becomes easier to know that
what profit planning is. Simply profit planning is planning for future operation
in such a way as to maximize the profit. It is a managerial process, which helps
management to perform planning function effectively. A comprehensive profit
planning is also known as broad budgeting schedule developed in financial
statement. Profit planning deals with the development of objectives,
specification of short-term goals, and development of strategic and tactical
profit plan. It is an importance approach developed to facilitate the effective
performance of management process.
“The concept of comprehensive profit planning encompasses systematic
integrated approaches of profit planning and strategic planning. The
descriptive term comprehensive profit planning used other term in the some
context are business budgeting, managerial budgeting and others budgeting”
(Glenn, 1990: 31).
10
Profit planning means the development and acceptance of objectives and goals
and moving or organization efficiency to achieve the objectives and goals.
Profit planning is not a separate technique that can be through of the separated
independently of the total management process. The broad concept of profit
planning entails on integration of numerous managerial approaches and the
techniques that might be exploited such as sales forecasting, sales quota system
capital budgeting, cash flow analysis, cost volume profit analysis variable cost
budget etc. profit plan or budget is a comprehensive statement of the intention,
expressed in financial terms, for the operations of the firm for a short period. It
is a plan of the firm’s expectations and used as a basis for measuring and
controlling the actual performance of manager and their units.
“Profit planning or budgeting is a forward planning and involves the
preparation in advance of quantities as well as financial statement to indicate
the intention of management in respect of various aspects of the business.
Profit planning in fact is a managerial techniques and it is a written plan in
which all aspects of business operation with respect to define future period are
included. It is a formed statement of policy, plan, objectives and goals
established by the top management in respect of some future period, profit
planning is predetermined detail plan action developed and distributed as a
guide the current operation as performed. Thus, we can say that profit planning
is a tool which may be used by the manager in planning the future course of
action and in controlling the actual performance” (Gupta, 1992: 521).
“The profit planning and control involves:
Development and application of broad and long term objectives of the
enterprises.
The specification of enterprise goals.
Development of strategic long-range profit plan in broad terms.
Specification of a tactical short range profit plan detailed by assigned
responsibilities (division, department products).
Establishment of a system of periodic performance reports detailed by
assigned responsibilities.
Development follows up procedures (Glenn et al., 1990: 30).
11
At last we conclude profit planning refers to the organization techniques and
procedures were by long range, short range plan are formulated, considered and
approved, responsibility for execution is delegated, flexibility to meet changing
is provided, progress in working the reported deviation in operations are
analyzed and corrective action requires to reach the desired objectives is taken.
2.1.4 Planning Levels
2.1.4.1 Strategic Long-Term Planning
Long range planning covers five years and more varying with the enterprises
sometimes extended beyond 10 years. Long range planning is one of the most
difficult time spans involved in planning. As many problems in short range
planning cannot be treated due to the absence of clear sense of direction and the
practices, which a comprehensive long-range plan provides.
“To be successful a long range plan provides achieve the following objectives:
In corporate the engineering department’s development and support
expenses for new product features.
Review the plant capacity, personal requirement in light of start up
products and existing plant capitalization.
Identify future capital requirement for developing departments, the
manufacturing process and support departments such as management
information system and the building structures.
Reflect changes in cash requirement for salaries, materials, capital etc.
Consider what impact will be in inflation fringle, benefits, product cost
and in overseas operations, the projected impact of exchange will have
on the long-range profitability of plant (Glenn et al., 1990: 82-83).
2.1.4.2 Medium Term Planning
The medium term planning covers of 2 to 3 years. Medium term planning is
used mainly to determine the allocation of resources among completing
activities and to revise.
12
Medium term planning often takes the forms of budgeting in which each
division department or unit is allocated certain resources during the coming
years. These allocations are based in fact on forecasting of demand, cost,
financial position and competition. The important and frequency of medium
term planning make it worth while to spend more effort and employ more
elaborate prediction than in the case for shorter time horizons. Often it may
be wise to use more than one method in order to check and compare the
accuracy of results.
2.1.4.3 Short Term Planning
It is also called tactical plan. It is to be developed for short period of time. The
short term planning is selected to confirm to fiscal quarters or year. Because of
practical needed for conforming plans of according periods and the some what
arbitrary limitation of the long range to three to five years is usually based as
been indicated on the certainty over long period makes planning of
questionable value. Short-range planning is a limited five dimension usually it
covers one year time period. Management uses it as a substantial part of long
range and medium range plan.
2.1.5 Profit Planning Process
Profit planning process should involve periodic consistent and depth replanning
so that all operations should carefully re-examined and re-evaluated. There are
several steps in profit planning process which is discussed below.
2.1.5.1 Identification and Evaluation of External Variables
It is basic function of profit planning process. In this stage the profit planning
process focuses on (a) identifying and (b) evaluating the impact or effect of
external environment, which will have significant impact on the enterprises. As
the management planning focuses on the best possible manipulation of
controllable and non-controllable variables are considered separately. This is
done in order to minimize the potential unfavorable impact.
13
A particularly significant phase of this analysis includes the evaluation of the
present strength and weakness of the enterprise. Planning must start with
objectives and realistic understanding of the present status of products,
services, markets, profit and return on investments, cash flow, availability of
capital, production capabilities and the competences of both management and
non management personnel. So, analysis and evaluation of the environmental
variables must be a continuing concern of management. These activities should
involve all executive managers, who in turn should export carious staff groups
to provide data and recommendations (Glenn et al., 1990: 74-75).
2.5.1.2 Developing of the Broad Objectives of the Enterprise
In this stage of the statement of objectives should express the mission, vision
and ethical character of the enterprise. Its purpose is to provide identity,
continuity of purpose and definition. However, the statement of broad
objectives normally should not specify the quantitative goals. Rather, it should
be narrative expression of the purpose, objectives and philosophical character
of the business. It should be signed for wide dissemination and should be
believable, which means, in the long run the company’s action must be
harmony with the statement (Glenn et al. 1990: 75-76).
2.1.5.3 Development of Specific Goals for the Enterprise
In this stage of process bring the statement of broad objectives into sharper
focus and to move from the realm of general information to more specific
planning information it provide both narrative and quantitative goals that are
definite and measurable. There are specific goals that relate to the enterprise as
a whole and to the major responsibility centers. Executive management should
exercise leadership in this planning phase so that there will be realistic and
clearly articulated framework within which operations will be conducted
towards common goals. This statement of specific goals should define such
operational goals as expansion or contraction of products and services lines,
geographical areas, share of the market by major products service lines, growth
trends, production goals, profit goal’s, profit margins, return on investment and
14
case flow. When the goals are specific they could offer basis for performance
measurement (Glenn et al., 1990: 77-78).
2.1.5.4 Development and Evaluation of Company Strategy
The purpose of developing and disseminating enterprises is to find the best
alternatives for attaining the planned broad objectives and specific goals.
Strategic focus on “how”, therefore they outline a plan of action for the
enterprise. Executive management must be creative and directly involved in the
development of new strategies and in the adaptation of currently on going
strategies in harmony with the relevant variable with which management must
cope. While developing the basic enterprise, the executive must focus on
identification of the critical areas that influence the long-range success of the
enterprise. Critical area should be pinpointed through evaluation concern to
executive management, periodic reassessment of the strategies is essential in
the light of a careful analysis of all relevant variables and their probable future
impact on the enterprise (Glenn et al., 1990: 78-79).
2.1.5.5 Executive Management Planning Instructions
This phase involves communication of the substantive plan to middle and
lower management level. It explains the broad objectives, enterprise goals,
strategies and any other to develop the strategic and tactical profit plans. The
executive planning instruction issues by the top management communicate the
planning foundation that is necessary for the participation of all levels of
tactical profit plans for the upcoming budget year. At this point of planning
process, the foundation has been established to articulate the broad and specific
objectives of the enterprise and the strategic that facilitate their attainment
(Glenn et al., 1990: 79).
2.1.5.6 Preparation and Evaluation of Project Plans
Project plans encompass periodic plans and project plan for improvement of
present products, new and expanded physical facilities, entrance into new
industries, exit from products and industries, new technology and other major
activities that can be separately identified for planning purpose.
15
The nature of projects is such that they must be planned as separate units. In
planning for a project, the time span considered must normally be the
anticipated life span of the project. Projects approved must then be timed into
the strategic and tactical profit plans. In addition to any going projects,
management should encourage on a continuing basis project proposals from
any source within the enterprise. Consistent with the approach, during the
formal planning cycle, management must evaluate and decide upon the plans
status or each project in process and select any new projects to be initiated
during time dimensions covered by the upcoming strategic and tactical profit
plans (Glenn et al., 1990: 79-80).
2.1.5.7 Development and Approval of Strategic and Tactical Plans
When the managers of the various responsibility centers in the enterprise
receive the executive management planning instructions and the project plans,
they can begin intensive activities to develop their respective strategic and
tactical profit plan. The strategic long-range plan and the tactical short-range
profit plan are usually developed at the same time. It is generally seen that the
executive management develops the strategic and tactical profit plans but the
backlash of this practice is that this denies the full participation by middle
managers in the planning process. And this can give rise to unfavorable
behavioral effects. So, here we assume a participatory planning and the
manager of each responsibility centers have received instructions of the
executive managements. Now the manager of each responsibility center to
develop a strategic long-range profit plan and in harmony with the long range
plan, a tactical short range profit plan. However, a certain format and
procedural instructions should be provided by a centralized source to establish
the general format, amount of detail, and other relevant procedural and format
requirement essential for aggregation of the plans of the responsibility centers
into the overall profit plans.
After the completion of the two profits plans the approval must be initiated.
This process involves approval, disapproval or revision based on action by
16
executive management or presentation and justification by the managers of
the responsibility centers to the next higher level of authority (Glenn, et al.,
1990: 80-81).
2.1.5.8 Implementation of Profit Plan
Implementation of management plans that have been developed and approved
in planning process involves the management function of leading subordinates
in attaining enterprise objectives and goals. Thus effective management at all
levels requires that enterprise objectives, goals, strategies and policies be
communicated and understood by subordinates. There are many facets involved
in management leadership. However, a comprehensive profit planning and
control programme may aid substantially in performing this function. plans,
strategies and policies developed through significant participation establish to
foundation for effective communication.
The plans should have been developed with the managerial conviction that they
are going to be met or exceeded in all major respects. If these principles are
effective in the development process, the various executive and supervisors
will have a level of clear understanding of their responsibilities and the
expected level of performance, which will ultimately lead to effective
implementation of profit plans (Glenn, et al., 1990: 84-85).
2.1.5.9 Use of Periodic Performance Reports
As profit plan are being implemented during the period of time specified in
the tactical plan, periodic performance reports are needed. These
performance reports are prepared by the accounting department on a monthly
basis. Also some special performance reports are prepared more often on “as
needed” basis. These performance reports (a) compare actual performance
with planned performance and (b) show each difference as a favourable
performance variation.
A clear distinction must be made between external and internal financial
reports. Internal report can be further classified as (a) statistical reports that
17
give the basic quantitative internal statistics about the operation of the
enterprise; (b) special managerial reports about non-recurring and special
problems; and (c) periodic performance reports. The latter reports focus on
dynamic and continuous control tailored to the assigned managerial
responsibilities. These reports are primarily repetitive, short-term reports
developed for each of the responsibility centers. Short-term performance
reporting is essential for effective control.
2.1.5.10 Use of Flexible Expenses Budget
The flexible expenses budget is also referred to as the variable budget, sliding
scale budget, expenses control budget and formula budget, which applies only
to expenses. It is completely different from profit plan but it is used to
complement it. It gives realistic information about expenses that make it
possible to compute budget amount for various output volumes or rates of
activities in each responsibility center. To do this the flexible budget provides a
formula for each expense in each responsibility center. The formula gives the
relationship of each expense to output in the center. Each formula includes a
constant expenses factor and a variable expenses rate. To apply this concept in
a department, each expense must be classified into the three categories (a) fixed
expenses, (b) variable expenses, (c) semi-variable expenses. In the case of a
fixed expenses the variable rate is zero and in the case of a variable expenses,
the constant factor is zero and in the case semi-variable expenses, there is a
value for both the constant factor and the variable rate.
Flexible expenses budget formulas can be used in two phases of the PPC
process (tactical profit plan). If the flexible expenses formulas are developed
concurrently with the strategic and tactical profit plan, they are used to
computer the budgeted expenses amounts in the tactical profit plan. This is
done by multiplying the planned output or activity of each responsibility center
by the related variable expenses rate for each center and then adding any fixed
cost for the center. Flexible expenses budgets are usually constructed early in
18
the budget planning period because, as indicated, they provide cost data for the
tactical profit plan (Glenn, et al., 1990: 86-87).
2.1.5.11 Implementation of Follow-up
Follow-up is an important part of effective control. Because performance
reports are based on assigned responsibilities, they are the basis for effective
follow-up action. It is important to distinguish between the causes and effect.
The performance variation are effects (the result) and the management must
determine the underlying causes. The identification of cause is primarily a
responsibility of line management. Analysis to determine the underlying causes
of both favourable and unfavourable performance variances, should be given
immediate priority. In the case of favourable performance variance, after
identifying the basic cause as opposed to the results, an alternative for
corrective action must be selected and the corrective actions be implemented. If
performance variances are favourable, the underlying causes should be
identified and this is helpful improving efficiency (Glenn, et al. 1990: 88).
2.1.6 Importance and Limitation of Profit Planning and Control
2.1.6.1 Importance
After knowing the meaning and process of profit planning control it is useful to
know about it’s importance. It can be adopted to any business at any condition.
It is very important to emphasize on developing positive reinforcement,
improving motivation, developing goals copying with the effect of budgetary
pressure, resolving budget padding problems and using budget control. There
are some importance of profit planning and control, which are shown below
(Glenn, et al., 1990: 60-61).
1. It focuses early consideration of basic policies.
2. It requires adequate and sound organization structure: that is there must
be a definite assignment of responsibility for each function of enterprise.
3. It compels all member of management from topdown, to participate in
the establishment of goals and plans.
19
4. It compels departmental managers to make plans in harmony with the
plans of other departments and of the entire enterprise.
5. It requires that management put down in figures what is necessary for
satisfactory performance.
6. It requires adequate and appropriate historical accounting data.
7. It compels management to plan for the most economical use of labour,
material and capital.
8. It instills at all levels of management the habit of timely, careful and
adequate consideration of the relevant factors before reaching important
decisions.
9. It reduces cost by increasing the span of control because fewer
supervision are needed.
10. It frees executives from many day-to-day interval problems thought
predetermined policies and clear-cut authority relationship. It thereby
provides more executive time for planning and creative thinking.
11. It tends to remove the cloud of uncertainty that exists in many
organizations, especially among lower levels of management, relative to
basic policies and enterprise objectives.
12. It pinpoints efficiency and inefficiency.
13. It promotes understanding among members of management of their co-
workers problems.
14. It forces management to give adequate attention to the effect of general
business conditions.
15. It forces a periodic self-analysis of the company.
16. It aids in obtaining bank credit; banks commonly require a projection of
future operations and cash flows to support large loan.
17. It checks progress or lack of progress toward the objectives of the
enterprises.
18. It forces recognition and corrective action (including rewards).
19. It rewards high performance and seeks to correct unfavourable
performance.
20. It forces management to consider expected future tends and conditions.
20
2.1.6.2 Limitations
The following main arguments are usually given against profit planning
and control or they are main limitation of profit planning and control
(Glenn, et al., 1990: 60).
1. It is difficult, if not possible, to estimates revenues and expenses in our
company realistically.
2. Our management has not interest in all the estimates and schedules. Our
strictly informal system is better and work well.
3. It is not realistic to write out and distribute our goals, policies and
guidelines to all the supervisors.
4. Budgeting places too great a demand on management time, especially to
revise budgets constantly. Too much paper work is required.
5. It takes away management flexibility.
6. It creates all kinds of behavioural problems.
7. It places the management in a strait jacket.
8. It adds a level of complexity that is not needed.
9. It is too costly, aside from management time.
10. The managers, supervisors and other employees hate budgets.
2.1.7 Development of Profit Plan
The management decisions in developing the profit plan were the statements of
broad objectives, specific goals and basic strategies. The profit plans are based
on structured planning process that includes a series of different sub-plans.
1. The sales plan or budget.
2. The production plan or budget.
3. The material plan or budget.
4. The direct labour plan or budget.
21
5. Expenses plan or overhead budget.
6. Flexible expenses plan or budget.
7. Capital expenditure plan or budget.
8. Cash budget.
2.1.7.1 The Sales Plan or Budget
Sales planning are the foundation of all other budgets. It is most important but
difficult to prepare. Sales plan provides basic management decision about
marketing. Marketing decision are the basic approaches for developing a
comprehensive sales plan. Since, the sales planning process is a necessary part
of Profit Planning and Control (PPC).
A sales plan should be realistic. If it is not realistic, most other parts of the
overall profit plan also are not realistic. So, management should develop a
realistic sales plan. If management cannot develop realistic sales plan, it will be
little justified. Similarly, if it is difficult to assess the future revenues of
business, there are little incentives for investment.
A comprehensive sales planning includes strategic and tactical sales plans. A
sales plan incorporates such management decision as objectives, goals
strategies etc. These translate into planning decisions about planed volume of
goods, services price, promotion and the other sales effect.
The purposes of a comprehensive sales plan are as follows:
1. It reduces future uncertainty about future revenue.
2. It incorporates management judgment and decisions in planning process.
3. It facilitates management to control of sales activities.
22
Factor Consideration in Sales Planning
The following factors should be considered while preparing sales plan:
General economic conditions.
Sales trends of specific products.
Anticipated results of advertising and promotional campaigns.
Effect of proposed price change.
Entrance of competitor in market.
Shifting of market.
Introduction of new, improved, substitute products by company of its
competitors.
Company’s productive capacity.
Government rules and regulations etc.
Sales Planning and Forecasting
It is important to make distinction between sales planning and forecasting
because they are confusing and ambiguous. A forecast is not a plan. It is a
statement of future condition about a particular subject based assumptions. It
may be accepted or rejected or modified or rejected by management. Therefore,
it is only one input of a compressive sales plan. A sales plan incorporates all
management decision that are based on forecast, other inputs and management
judgment about such related items as sales volume, price production, financing.
Therefore, a sales plan is not conditional but forecast is conditional. It is also
technical staff function.
The difference between sales plan (budget) and sales forecast can be explained
as follows:
Forecasts are merely well educated estimates or inference about future
probable events whereas a budget relates to planned events and is the
quantitative expression of business plan and policies to be pursued in
future.
23
Budgeting begins where forecasting ends. In fact, forecasting provides
the logical basis for preparing the budgets.
A budget provides standard for comparison with the results actually
achieved, thus, it is an important control device of management,
whereas forecasting represents merely a probable event over which no
control can be exercised.
Long-range and Short-range Sales Plan
Long range sales plan is known as strategic sales plan. Usually it is of 5 to 10
years. It is to be developed in broad and general management policies and
assumptions by year and annual amount. Usually it is prepared by considering
future market potentials, population changes, state of economy, industry
projections, company objectives and long-term strategies because they affect in
such area as pricing development of new product line, innovation of product,
expansion of distribution channel, cost patterns.
Short-range Sales Plan is also called tactical sales plan. It is to be developed
for short period of time detailed by products, months and quarters for future 12
months. Tactical sales plan includes detailed plan for each major products and
for grouping of minor products. Short-term sales plans are usually developed in
terms of physical units of jobs and in sales or dollars. For planning and
controlling purposes, short-term sales plans must be developed by sales
responsibility. Because short-term profit plan provides major considerations for
planning and controlling purposes, it is also necessary for completing other
components of profit plan.
Development of Comprehensive Sales Plan
The following process should be followed to develop a comprehensive sales
plan:
Step -1 Development management guidelines specify to sales planning
including the sales planning process and planning responsibilities.
24
Step - 2 Prepare one or more sales forecast consistent with specified
forecasting guidelines including assumption.
Step - 3 Assemble all the other data that will be relevant in developing a
comprehensive sales plan.
Step - 4 Based on above steps apply management evaluation and judgment to
develop a comprehensive sales plan.
Step - 5 Secure managerial commitment to attain the goal specified in the
comprehensive sales plan.
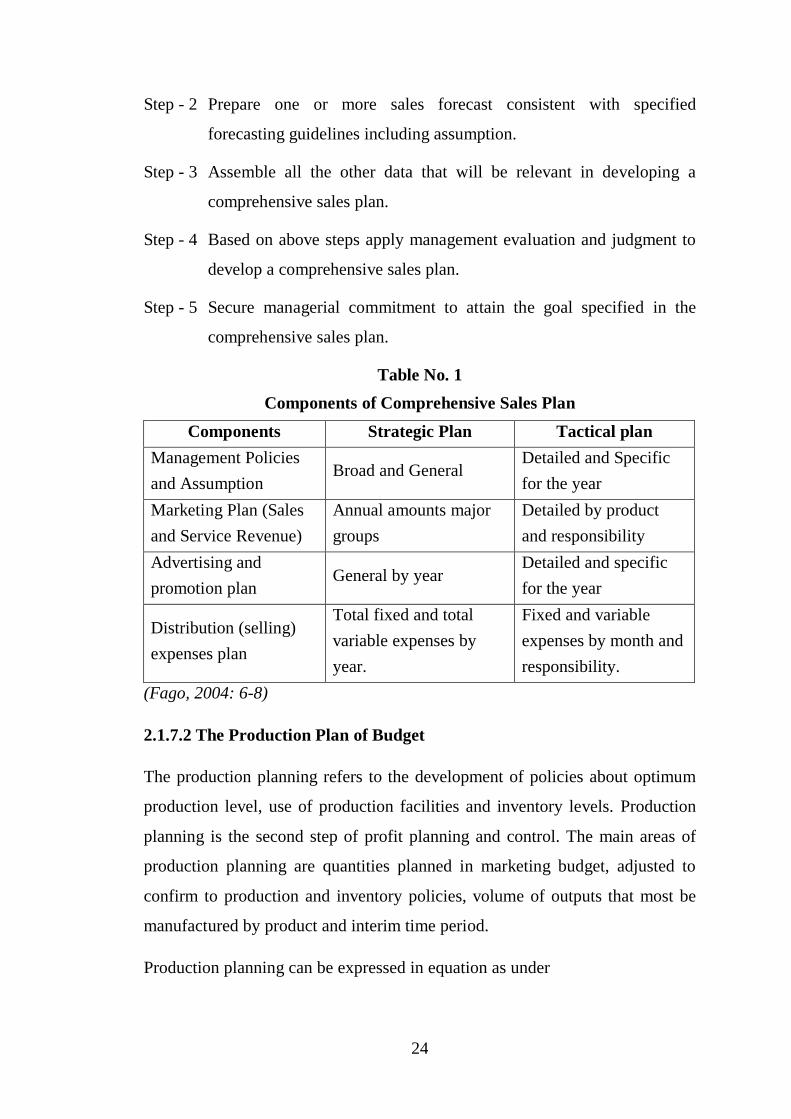
Table No. 1
Components of Comprehensive Sales Plan
Components Strategic Plan Tactical plan
Management Policies
and Assumption Broad and General
Detailed and Specific
for the year
Marketing Plan (Sales
and Service Revenue)
Annual amounts major
groups
Detailed by product
and responsibility
Advertising and
promotion plan General by year
Detailed and specific
for the year
Distribution (selling)
expenses plan
Total fixed and total
variable expenses by
year.
Fixed and variable
expenses by month and
responsibility.
(Fago, 2004: 6-8)
2.1.7.2 The Production Plan of Budget
The production planning refers to the development of policies about optimum
production level, use of production facilities and inventory levels. Production
planning is the second step of profit planning and control. The main areas of
production planning are quantities planned in marketing budget, adjusted to
confirm to production and inventory policies, volume of outputs that most be
manufactured by product and interim time period.
Production planning can be expressed in equation as under
25
Production unit = planned sales + Final inventory – Initial Inventory
Therefore, the main components of production budget are production finished
goods inventory, work in – process inventory.
So on a production budget is a quantity budget which lays down the quantity
of units to be produced during budget period. The main purpose of this
budget is to maintain optimum balance between sales, production and
inventory position of the firm. The following steps should be followed to
develop a production budget.
Step 1: To establish policies for inventory level.
Step 2: To plan the total quantity of each product that is to be manufactured
during the budget period where the sales unit should be considered.
Step 3: To schedule this production by interim period when the production
plan has been completed by a production manager, (i.e. monthly,
quarterly etc.) it should be provided to the executive committee for
evaluation and then to present for tentative approval period to use as a
basis for developing the direct material, direct labour and factory
overhead.
The production planning has different areas which can be explained as below:
Direct Market Sales: When the production is based only with market demand,
the production process starts after the demand of goods. In case of job or, unit
production system production budget is not necessary. The quantity produced
is always equal to the quantity sold.
For Inventory: When the nature of product is scarce, firm can manufacture
goods in full capacity. In other words, when demand is higher than supply, the
firm can produce goods as much as possible. Therefore, production budget is
not necessary. The quantity produced is always equal to the quantity sold.
26
For Sales and Inventory: Production budget is importance when goods are
produced for either selling or storing purpose. In this case, budgeted sales and
inventory affects the production volume of the firm. Therefore, the objective of
the production should be clear.
Responsibility for Production Planning
Different people have different responsibility for preparing production planning
in manufacturing industry which is explained below.
i. Chief Executive: The responsibility of chief executive is to formulate
objectives and policies of organization. They are as follows:
Production policy: Stable production policy vs unstable production
policy.
Inventory policy: Stable inventory policy vs unstable inventory policy.
Flexibility in both production and inventory policy.
ii. Sales Manager: Production plan bases on the sales budget. The
accuracy of production budget depends on the accuracy of sales plan.
The sales manager is responsible to provide accurate sales budget in
time.
iii. Production Manager: The production manager is responsible to
prepare production plan for the company. Production planning,
scheduling, dispatching of goods in time are the functions of the
production manager. Therefore, production manager prepares the
production budget considering availability of personal, plant capacity,
raw materials and parts and technology.
iv. Production Supervisor: Production supervisor makes a tactical
production plan. He/She must know about standard rate of direct
material and direct labour production hours, strike, seasonal variation
and other areas of tactical plan.
v. Administrative Manager: Administrative manager must appoint the
required number of labour and personal. The appointment must be
27
optimal and the required skilled manpower must be provided in time.
Therefore, personal policy affects the production policy of organization.
vi. Financial Manager: The financial manager must provide standard rate,
historical data and capital additional plan in time. The financial position
must be strengthened before production to pay the wages to the
labourers, cost of raw material, overhead expenses and purchase the
additional plant and tools.
Factors Consideration in Production Planning
The following factors are to be considered for production planning:
Plant capacity.
Availability of raw materials.
Types of raw materials.
Availability of capital.
Availability of labour.
Timing of production.
Establishment costs.
Economic lot size.
Production Policies
There are three types of production policy which are given below:
Stable Production Policy or Unstable Inventory Policy: In this policy, fixed
units are to be produced equally in every month or specified period while the
final inventories of finished goods are to be unstable. Therefore, budgeted sales
of that period are unequal. There are several advantage and disadvantages for
applying this policy which are as under:
28
Advantages
It utilizes the full capacity.
It reduces labour turn over.
It ensures regular supply of raw materials.
It ensures availability of skilled manpower.
It ensures stability of employment.
It increases in efficiency.
It attracts better employees.
It reduces in training expenses.
It ensures volume discount or raw material purchase.
It avoids idle capacity.
Disadvantages
It needs high storage facility.
It needs high capital requirement.
It has high risk on inventory.
Unstable Production Policy or Stable Inventory Policy: In this policy units
of final inventory are to be stable at the end of each period and production units
are to be fluctuated in each budget period. The number of units produced and
budgeted sales are directly related. This policy have also some advantages and
disadvantages which are as under.
Advantages
It has low storage problems.
It requires low capital requirement.
It has low inventory cost.
It ensures proper preservation of inventory.
It has less obsolescence due to lack of inventory.
29
Disadvantages
It has low efficiency of employee.
It has high labour turn over.
It needs high training expenses.
It cannot ensure regular supply of raw material.
It ensures increase idle capacity.
Flexible in Both Inventory and Production: In this policy, production
unit and inventory level differ from time to time in the specified budget
period. This policy is useful when the market (factor effecting of sales) is
fluctuating time to time.
Production Control
The production control system is an importance part of production plan. It is an
important tool used for managerial control of cost, time, quantity and quality of
goods. The major procedures of production control are given below:
Material Control
Analysis of production process by responsibility centers in the
production division.
Routing
Scheduling
Dispatching
Follow-up (Fago, 2004: 30-35)
2.1.7.3 The Material Plan or Budget
Planning and controlling of material purchase and material use is a
comprehensive profit, planning and controlling of raw material and parts
involved in production process. In other word, material budget co-ordinates
raw material and part required for production, inventory level of raw material
and parts that must be purchased. Raw material budget is prepared after the
planned production. The objectives of material budget are as follows:
30
To provide quantity data for purchase of material and parts.
To provide quantity data to compute material cost per unit.
To establish effective inventory policy.
To prepare effective cash budget.
To introduce effective control system on material use.
The followings are the main components of material budget:
Material and Parts Budget
It helps to determine the quantities of materials and parts needed for
production. It is determined as under.
Material budget = planned production × standard usage rate.
Material and Parts Purchase Budget: It includes the quantities of materials
to be purchased, estimated price and the required inventory level for seasonal
variations. Timing for purchase and quantity to be purchased can be determined
as follows.
Timing for purchase/Re-order point = Replacement Stock + Safety Stock
Quantity to be purchased (Economic order quantity)
c
Ao2EOQ
Where,
A = Annual requirement in unit.
o = Ordering cost per order.
c = Carrying cost of carrying one unit of inventory for one year.
Purchase of material can be determined as follows:
Purchase = Material usage + closing stock of raw material – opening stock of
raw materials
31
Materials/Parts Inventory Budget: Material inventory budget refers the
budgeted level of material and parts inventory in terms of units and cost. In other
word material inventory budget deals with the difference between the required
quantities budget and purchased unit budget. It can be computed as follows.
Closing stock of raw materials = Opening stock of raw material + purchase of
raw material – material usage of raw material.
Cost of Materials and Parts Budget: Cost of material and parts budget is
planned cost of the materials parts used in production process. It should be
computed as follows:
Material cost = Material usage × Material cost per unit
(Fago, 2004: 67-68)
2.1.7.4 The Direct Labour Plan or Budget
Planning and controlling labour costs involve major and complex areas (1)
human resource needs, (2) recruitment, (3) training, (4) job evaluation and
specification, (5) performance evaluation, (6) union negotiations, and (7) wage
and salary administration. Labour costs are composed of all expenditures
incurred for employees: top executives, middle management personnel, staff
officers, supervisor, foremen, skilled workers and unskilled workers. It is
necessary to consider separately the different types of labour cost.
Direct labour budget is also developed from the production budget. Direct
labour requirements can be computed by multiplying product to be produced in
each period by the number of direct labour-hours required to produce each unit.
Components of Direct Labour Budget
Basically, there are three components of direct labour budget.
(i) Direct Labour Hour Budget: It estimates the total direct labour hours
required for each product by time and responsibility. It is computed as:
32
Total direct labour hour required = Planned production × standard time
required per unit of output.
(ii) Manpower Budget: It estimates the number of each kind of manpower by
department and time.
Number of labour = Total labour hour required working hour per period per
time (month)
Working hour per person per month = Normal working hours per person per
day × working days in a time (month)
(iii) Direct Labour Cost Budget: It estimates the total direct labour costs by
product, time and responsibility. To get direct labour cost budget, first estimate
the average wage rates by department, cost center or operation. Then,
multiplication of the standard time per unit of product by the average wage
rates gives the labour cost per unit of production for department, cost center or
operation. The multiplication of the department’s cost center’s or operation’s
total unit by the unit labour cost rate gives the total direct labour cost for each
product.
Approaches Used in Planning Direct Labour Time
Time and Motion Studies: It is made by industrial engineers. They analyze
the operations required on a product and determine a standard time for each
specific operation. So this study provides reliable information about labour
time needed to perform each specific operation.
Standard Costs: Standard cost accounting system also provides information
on direct labour have requirements per unit of production.
Direct Estimate by Supervisor: Some production supervisors estimate.
Standard direct labour hour base on their judgment, recent past performance of
the department, assistance from the next level of management and technical
staff personnel.
33
Statistical Estimates by a Staff Group: In this approaches historical cost
records are used to obtain useful information for converting production
requirements to direct labour hour. It is used by producing department. The
historical ratio of direct labour hours to some measure of physical output is
computed and then adjusted for planned changes in the responsibility center
(Goet, et al., 2063: 6-6.3).
2.1.7.5 Expenses Plan or Overhead Budget
Planning and control of expenses are necessary to maintain reasonable
expenses level to support the objectives and planned program of the enterprise.
It should not focus on reducing expenses but rather on better utilization of
limited resources. So, it should focus on the relationship between expenditures
and benefits derived from those expenditures. The two terms cost and expenses
are often used in the same sense. But for financial accounting purposes, cost is
defined as an expenditure that entirely recorded as an assets and becomes
expenditure when it is used up in the future. So on for management accounting
purposes, these terms are however, not rigidly defined. They are used
interchangeably.
All costs do not show the same behaviour throughout the operation. There
exists a relationship between costs and volume of activity.
Variable Cost
Variable costs are the costs that tend to vary in direct proportion and same
direction to changes in production activity, sales activity or some other
measures of volume of cost driver. So, we conclude that
Total variable costs are proportionately related to operating activity
levels.
Variable cost per unit remains constant.
Variable costs can be regulated and controlled in the same responsibility
center and in the short run as well.
Cost that changes proportionately in total but remains fixed per unit is
variable.
34
Fixed Cost
Fixed costs remain constant whether activity increase or decrease or it is
subject to change over a period of time. They key features of fixed costs are as
follows:
Total fixed cost are constant.
Fixed costs per unit are variable.
Fixed costs are either capacity cost or the time costs or the committed
costs.
Fixed costs are regulated and controlled in a short-term period and by
the lower level responsibility center.
Semi-variable Costs
Semi-variable costs are also known as mixed costs as they consist both of fixed
costs and variable costs. The first part will not be affected by the changes in the
volume/activity. But the later part will be affected by the change in activity.
Cost Reduction and Cost Control
Cost reduction programs are directed towards specific efforts to reduce cost
by improving methods, work arrangements and products.
Cost control, in a narrow sense, may be through of as to attain cost goals
within a particular operational unit. In a broad sense, cost control includes cost
reduction. Programme (without reducing the utility). To exercise control so that
desired benefits (i.e. cost goals) could be obtained from the given level of
expenses.
Three broad categories of expenses are included in the overhead.
A. Manufacturing Overhead:
It is a part of total production cost. It consists of indirect material, indirect
labour and all the miscellaneous factory expenses such as taxes, insurance,
35
depreciation, repair etc. Following steps should be taken for developing the
manufacturing overhead budget.
Select the appropriate activity base.
Compute total volume of work/activity for each department.
Compute overhead rate for each production department.
Computer overhead cost per unit for each product.
Compute the cost of goods manufactured.
B. Selling and Distribution Expenses Budget:
This includes all cost relating to selling distribution and delivery of product to
customers. It’s main aspects are:
Planning and Co-ordination: Marketing executive are directly responsible
for planning the optimum economic balance between sales budget,
advertising budget and distribution expenses budget. PPC views them as
three separate problems.
Control of Distribution Cost: Distribution include head office expenses and
field expenses for the planning and control point of view, these expenses must
be planned by responsibility center. These expenses are not product costs. They
are not allocated to special products. So, separate distribution expenses plan
should be developed for each responsibility center.
C. Administrative Expenses Budget
Expenses other than manufacturing and distribution expenses are
administrating expenses. These cost are incurred in the responsibility centers
that provide supervision of and service to all functions of the enterprise. They
include large portions of fixed costs than variable cost (Goit et al., 2004: 7-7.8).
2.1.7.6 Flexible Expenses Budget
Flexible budget is prepared at different level of activities. It will furnish the
budgeted figures for any level of activity which a company may actually
36
attain. It reflects costs revenues and profit at the various level of budgeted
activity. It is prepared on the basis of time, demand of product, cost of
product, availability of demand of product, season and availability of factor
of production.
A flexible budget can be used comfortable to reduce the margin of deviation
between estimation and actual performance. It is used as a yardstick to
measure the efficiency at the level of performance achieved and tool for
controlling the cost.
In this way it is differ from the static budget. It will be very useful when the all
factors of market are not static or they are dynamics. So on it is very
importance tool for decision making on uncertain environment.
Preparation of Flexible Budget
We can develop the flexible budget with two methods.
1. Tabular Method: Here, the budget prepared at different level of activities
within the range of output. The factors to be taken into consideration for
preparing the flexible budget under this method are follows:
(a) Determination of Level of Activity
The activity levels are determined on the basis of units of output or machine
hours, labour hours used in production process.
(b) Estimation of Cost and its behaviour for each level of activity:
The costs and estimated for each element of cost together with the cost center
at the level of output determined. The organization should determine cost
behaviour, fixed variable and semi-variable (About this I already explained in
overhead budget part).
(c) Determination of units at the level of activities:
The unit of output to be produced at different level of activities are determined
for estimating the budget.
37
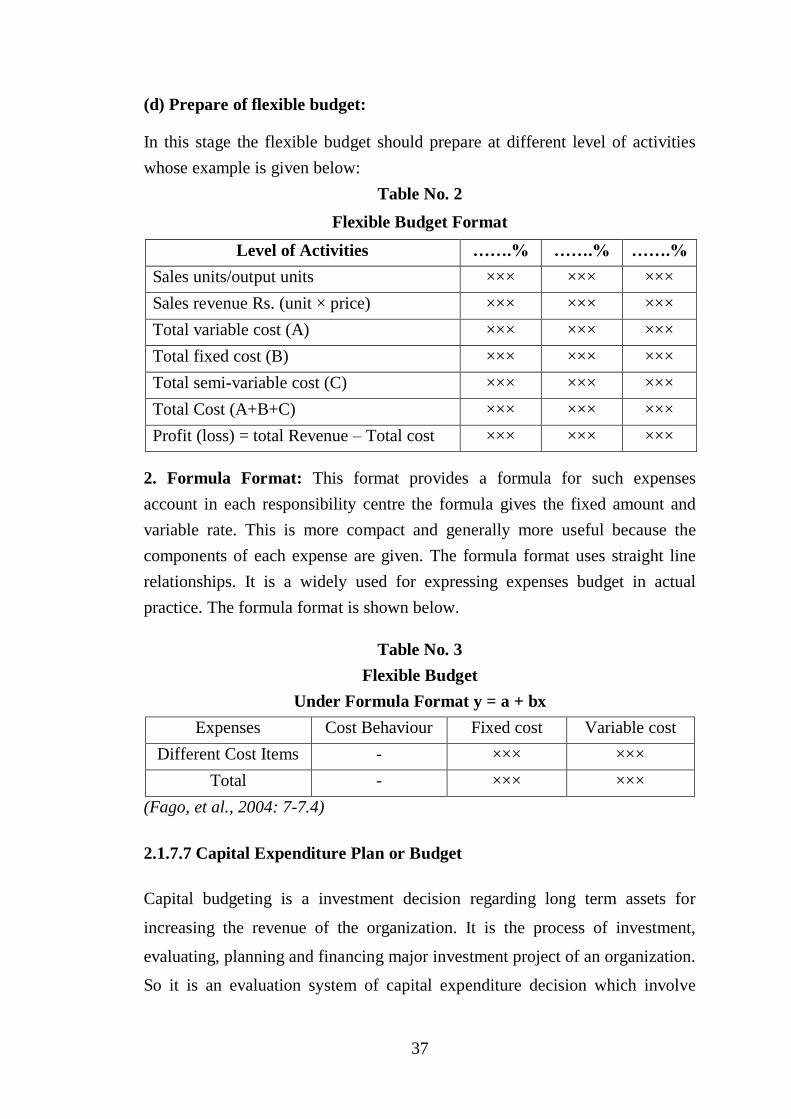
(d) Prepare of flexible budget:
In this stage the flexible budget should prepare at different level of activities
whose example is given below:
Table No. 2
Flexible Budget Format
Level of Activities …….% …….% …….%
Sales units/output units ××× ××× ×××
Sales revenue Rs. (unit × price) ××× ××× ×××
Total variable cost (A) ××× ××× ×××
Total fixed cost (B) ××× ××× ×××
Total semi-variable cost (C) ××× ××× ×××
Total Cost (A+B+C) ××× ××× ×××
Profit (loss) = total Revenue – Total cost ××× ××× ×××
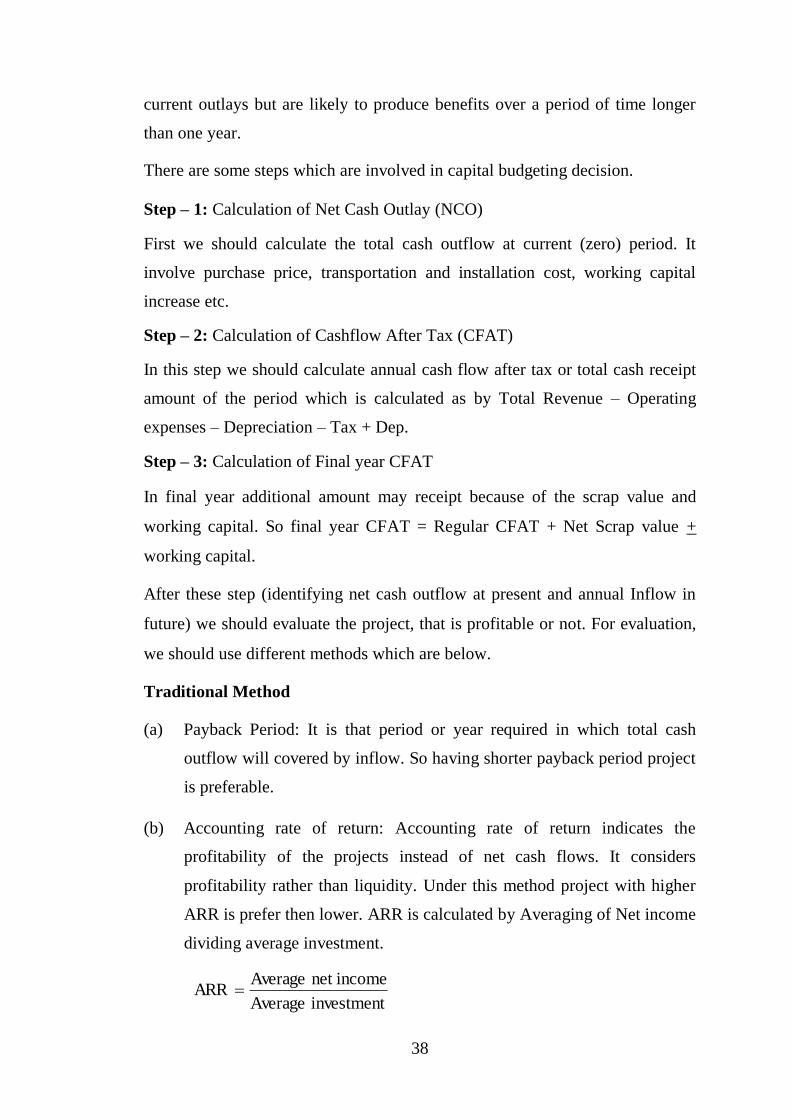
2. Formula Format: This format provides a formula for such expenses
account in each responsibility centre the formula gives the fixed amount and
variable rate. This is more compact and generally more useful because the
components of each expense are given. The formula format uses straight line
relationships. It is a widely used for expressing expenses budget in actual
practice. The formula format is shown below.
Table No. 3
Flexible Budget
Under Formula Format y = a + bx
Expenses Cost Behaviour Fixed cost Variable cost
Different Cost Items - ××× ×××
Total - ××× ×××
(Fago, et al., 2004: 7-7.4)
2.1.7.7 Capital Expenditure Plan or Budget
Capital budgeting is a investment decision regarding long term assets for
increasing the revenue of the organization. It is the process of investment,
evaluating, planning and financing major investment project of an organization.
So it is an evaluation system of capital expenditure decision which involve
38
current outlays but are likely to produce benefits over a period of time longer
than one year.
There are some steps which are involved in capital budgeting decision.
Step – 1: Calculation of Net Cash Outlay (NCO)
First we should calculate the total cash outflow at current (zero) period. It
involve purchase price, transportation and installation cost, working capital
increase etc.
Step – 2: Calculation of Cashflow After Tax (CFAT)
In this step we should calculate annual cash flow after tax or total cash receipt
amount of the period which is calculated as by Total Revenue – Operating
expenses – Depreciation – Tax + Dep.
Step – 3: Calculation of Final year CFAT
In final year additional amount may receipt because of the scrap value and
working capital. So final year CFAT = Regular CFAT + Net Scrap value +
working capital.
After these step (identifying net cash outflow at present and annual Inflow in
future) we should evaluate the project, that is profitable or not. For evaluation,
we should use different methods which are below.
Traditional Method
(a) Payback Period: It is that period or year required in which total cash
outflow will covered by inflow. So having shorter payback period project
is preferable.
(b) Accounting rate of return: Accounting rate of return indicates the
profitability of the projects instead of net cash flows. It considers
profitability rather than liquidity. Under this method project with higher
ARR is prefer then lower. ARR is calculated by Averaging of Net income
dividing average investment.
investment Average
incomenet AverageARR
39
Discounted Cash Flow Method
Traditional methods do not consider the time value of money so this
method have developed. This method considers the time value of money.
Before evaluation any project under this method the future cash flow must
be converted into present value. The following methods are used to
evaluate the projects.
(a) Net Present Value
The net present value is the net benefit at present value of an investment. It is
the net differences between present value of cash outflow and present value of
an investment. It is the net differences between present value of cash outflow
and present value of cash inflow. It can be presented in the following equation.
Net present value = Total present value – Net cash outlay.
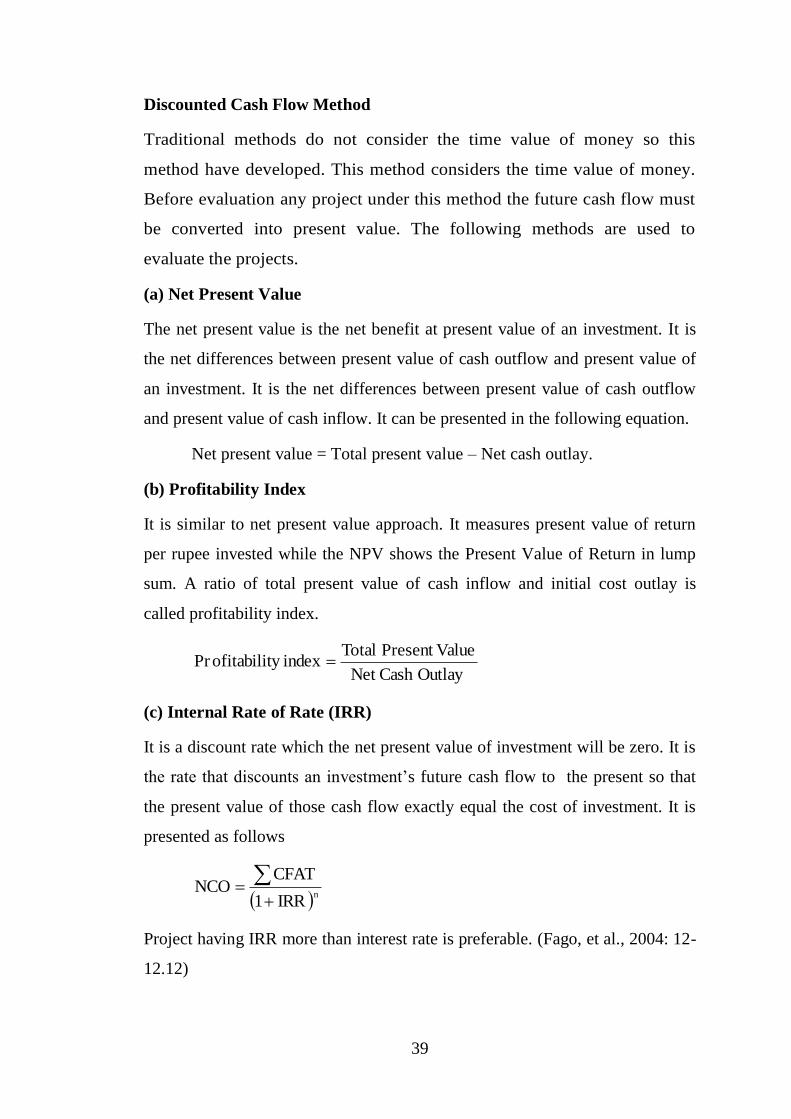
(b) Profitability Index
It is similar to net present value approach. It measures present value of return
per rupee invested while the NPV shows the Present Value of Return in lump
sum. A ratio of total present value of cash inflow and initial cost outlay is
called profitability index.
Outlay Cash Net
ValuePresent Totalindex yofitabilitPr
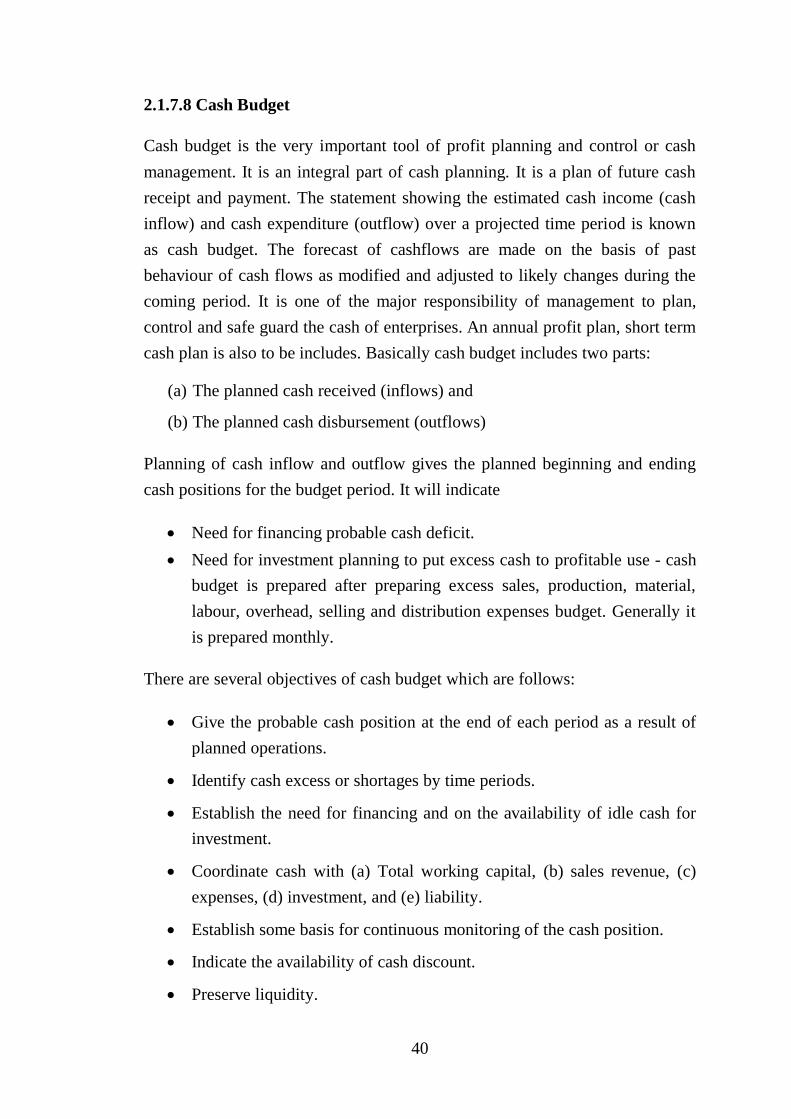
(c) Internal Rate of Rate (IRR)
It is a discount rate which the net present value of investment will be zero. It is
the rate that discounts an investment’s future cash flow to the present so that
the present value of those cash flow exactly equal the cost of investment. It is
presented as follows
n
IRR1
CFATNCO
Project having IRR more than interest rate is preferable. (Fago, et al., 2004: 12-
12.12)
40
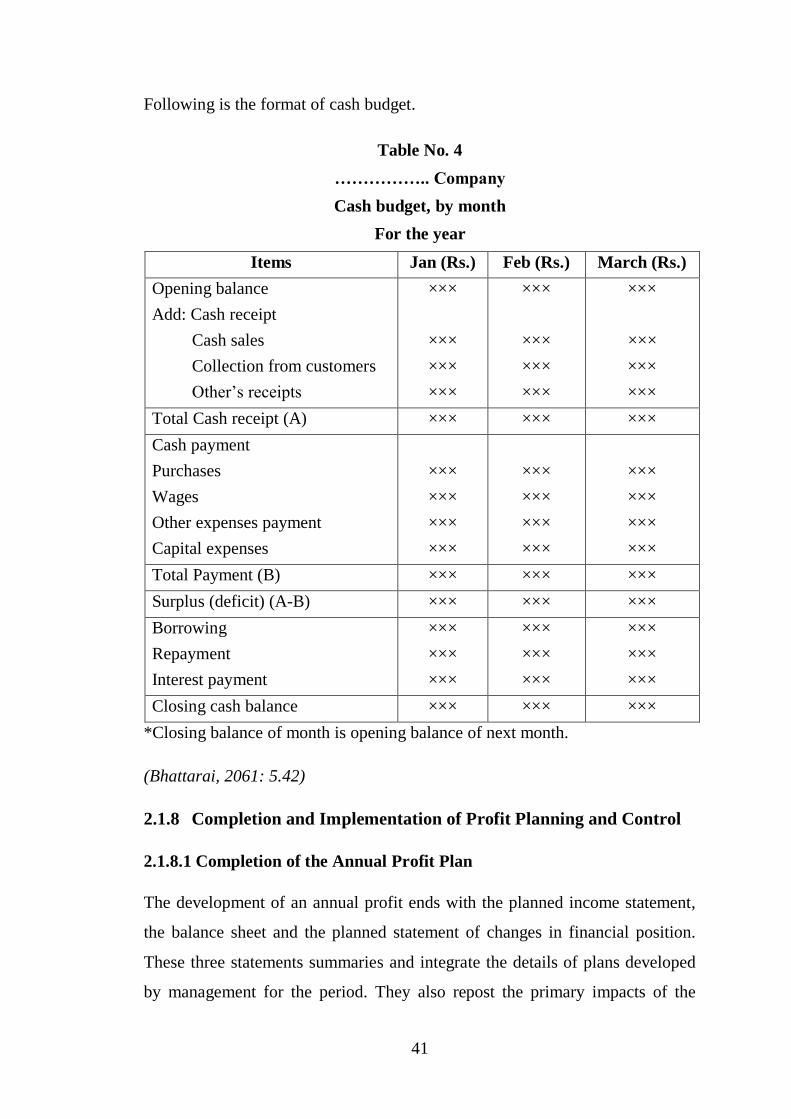
2.1.7.8 Cash Budget
Cash budget is the very important tool of profit planning and control or cash
management. It is an integral part of cash planning. It is a plan of future cash
receipt and payment. The statement showing the estimated cash income (cash
inflow) and cash expenditure (outflow) over a projected time period is known
as cash budget. The forecast of cashflows are made on the basis of past
behaviour of cash flows as modified and adjusted to likely changes during the
coming period. It is one of the major responsibility of management to plan,
control and safe guard the cash of enterprises. An annual profit plan, short term
cash plan is also to be includes. Basically cash budget includes two parts:
(a) The planned cash received (inflows) and
(b) The planned cash disbursement (outflows)
Planning of cash inflow and outflow gives the planned beginning and ending
cash positions for the budget period. It will indicate
Need for financing probable cash deficit.
Need for investment planning to put excess cash to profitable use - cash
budget is prepared after preparing excess sales, production, material,
labour, overhead, selling and distribution expenses budget. Generally it
is prepared monthly.
There are several objectives of cash budget which are follows:
Give the probable cash position at the end of each period as a result of
planned operations.
Identify cash excess or shortages by time periods.
Establish the need for financing and on the availability of idle cash for
investment.
Coordinate cash with (a) Total working capital, (b) sales revenue, (c)
expenses, (d) investment, and (e) liability.
Establish some basis for continuous monitoring of the cash position.
Indicate the availability of cash discount.
Preserve liquidity.
41
Following is the format of cash budget.
Table No. 4
…………….. Company
Cash budget, by month
For the year
Items Jan (Rs.) Feb (Rs.) March (Rs.)
Opening balance
Add: Cash receipt
Cash sales
Collection from customers
Other’s receipts
×××
×××
×××
×××
×××
×××
×××
×××
×××
×××
×××
×××
Total Cash receipt (A) ××× ××× ×××
Cash payment
Purchases
Wages
Other expenses payment
Capital expenses
×××
×××
×××
×××
×××
×××
×××
×××
×××
×××
×××
×××
Total Payment (B) ××× ××× ×××
Surplus (deficit) (A-B) ××× ××× ×××
Borrowing
Repayment
Interest payment
×××
×××
×××
×××
×××
×××
×××
×××
×××
Closing cash balance ××× ××× ×××
*Closing balance of month is opening balance of next month.
(Bhattarai, 2061: 5.42)
2.1.8 Completion and Implementation of Profit Planning and Control
2.1.8.1 Completion of the Annual Profit Plan
The development of an annual profit ends with the planned income statement,
the balance sheet and the planned statement of changes in financial position.
These three statements summaries and integrate the details of plans developed
by management for the period. They also repost the primary impacts of the
42
detailed plans developed by management for the period. They also report the
primary impacts of the detailed plans on the financial characteristics of the
firm. Before redistributing the completed profit plan, is generally desirable to
recast certain budget schedules so that technical accounting mechanics and
Jargon are avoids as much as possible. The redesigned budget schedules should
be assembled in one logical order, reproduced and distributed before the first
day of the up-coming budget period. The profit plan completion date is
important. Issuance of a profit after the beginning of the budget period is one
sure way of destroying much of tic budget potential. Timely copulation to the
planning budget suggests the needs for a nudged manner.
2.1.8.2 Implementing the Profit Plan
The final test of whether the effort and cost in developing a profit plan are
worthwhile is its usefulness to management. The plan should be developed
with the conviction that the enterprises in going to exceed all major objectives.
Participations enhance communication. If this principle is to be effective the
curious executives and supervisors should have a clear understand of their
responsibilities. The copied of the complete profit plan should be prepared and
distributed to the members of executive management. Normally, distribution of
the completed plan should be limit to vice presidents and to the heads of the
certain staff groups. The guiding principle in establishing the distribution
policy might be expressed to provide one copy to each member of the
management term according to his or her overall responsibilities, taking into
account the problem of security. The distribution policy should allow
distribution of pars, or segments, of the profit plan to middle and lower
management. For example, a sales district supervisor would not be given a
copy of the entire budget. But should receive those parts that apply to his
particular responsibility, such as the sales budget, and advertising budget for
his district, after distribution of the profit, plan, a series of profit plan
conferences should be held. The top executive discusses comprehensively the
plans, expectation and steps in implementation. At this top-level meeting the
importance of action flexibility and continuous control may well be
43
emphasized. In particular, it must be realized by each manager, that the budget
is a tool for their use. The profit plan, no matter how well designed and how
well carefully drawn cannot manage, in the final analysis people, not budgets
perform the management functions use of a profit plan as a guide to action and
performance, directed toward attaining or bettering the goals qualified in the
annual profit plan required continuous management effort and attention.
Similar conference should be conducted until all levels of management are
reached. Each executive and supervisor must clearly understand his particular
responsibilities. This conference should and, if conducted properly, will tend to
ensure action support for the objectives. Basically, this is a phase of
communication from the top down a generally neglected phase in management.
The profit plan provides the managers of each responsibility center an
approved operating plan for his center, thus the planning budget becomes the
basis for current operation and exert considerable coordinating and controlling
effects.
Performance must be measured and reported to management. Execution of the
plan is assured through control. Procedures must be established so that
accomplishment, or failure, is immediately known. On this basis action can be
taken to correct or minimize any undesirable effects. Short-term performance
reposting is essential.
The flexibility of the key aspect of the budget implementation. To view the
profit plan as an inflexible blueprint of operations is to invite trouble.
Obviously, it is impossible during the planning phase to anticipate all
contingencies each day may present contingencies not anticipate in the plans.
Therefore, current adjustments must be made in operating plans despite the
ordinary budget. The budget should not be viewed as restrictive influence but
rather as a specification of the goals of the entity. Certainly every advantage
should be taken as it arises despite its not having been anticipated in the
budget. Taking advantage of favorable opportunities as they arise is primary
responsibility of the management.
44
2.1.9 Performance Report
The performance report is an effective controlling tool for profit planning and
control. The performance reporting phase of comprehensive profit planning and
control program significantly influences the extent to which the organization’s
plan, goals and objectives.
To indicate the extensive reporting requirements a business must fulfill and to
focus on performance reporting the following broad classification of reports is
presented and briefly explained.
External Reporting
These are reports to government agencies, regulatory commissions, creditors,
investigative agencies and other groups external to the active management,
frequently, these reports are quite extensive and comprise a significant portion
of the overall reporting activities of the business.
Report to Owners
These are reports prepared with in the company for internal use only. They may
be considered confidential reports, they do not have to meet the needs of
external groups nor the text of generally accepted according but rather the text
of internal management needs.
All companies regardless of size have reporting requirements for all the
categories listed above. In the smaller company most of the basic reporting
needs may be accomplished with a single general purpose report. However, as
the size and complexity of the company increases, there is greater need for
regimentation of the reporting as suggested above.
Essential Features of Performance Reports
Performance reports should be:
(a) Tailored to the organization structured and controllability.
(b) Designed to implement the exception principle in management.
45
(c) Repetitive and relate to short time spans.
(d) Adapted to the requirement of the principle use.
(e) Simple, understandable and report only essential information.
(f) Accurate and expressive of significant distinctions.
(g) Prepared and presented promptly.
(h) Constructive in tone.
The extent to which the various managers utilize their performance reports
depends upon many factors, some behavioural and some technical. One
important factor is to extent to which the performance reports serve the
evaluation and decision-making needs of the user. Communication is a subtle
problem, if the different needs and experiences of the user are taken into
account. A foreman responds differently than a vice president.
Top management must have reports that give a complete and readily
comprehensible summary of the overall aspects of operations and an
identification of major events. The summaries must be supported by sufficient
detail to facilitate tracing unfavourable situations to their source.
Middle management is usually defined as those members of the major sub-
division of the business, such as sales, production and finance; middle
management is responsible for carrying out the responsibilities assigned to be
sub-divisions with in the broad policies and objectives established by top
management. Performance reports for middle management, although including
summary data, also are characterized by detailed data on day-to-day operations.
Lower level management is principle concerned with coordination and control
of day-to-day operation, therefore, control reports must be designed
accordingly. These reports are principally concerned with production and cost
control. Reports to foremen and supervisors must be detailed, simple,
understandable, and limited to items having a direct bearing on the supervisor’s
operational responsibilities.
46
2.1.10 Analysis of Budget Variance
Comparison of actual performance and planned performance has been
emphasized as an integral part of the control process. A basic features of
performance reports is the reporting of variances between actual results and
planned or budget goals. If a variance is significant, a careful management
study should be made to determine the underlying causes. The underlying
causes, rather that the actual results, should lead to remedies through
appropriate corrective action by management. There are numerous ways to
study or investing variances to determine the underlying causes. Some of the
primary approaches are the following.
(a) Conference with responsibility centre managers and supervisors and
other employees in the particular responsibility centre involved.
(b) Analysis of the work situation including the flow of work, coordination
of activities, effectiveness of supervision and other prevailing
circumstances.
(c) Direct observation.
(d) On the spot investigations by line managers.
(e) Special studies.
(f) Investigations by staff groups.
(g) Variance analysis
Variance analysis involves a mathematical analysis of two sets of data in order
to gain insight into the underlying causes of a variance. One amount is treated
as the base, standard or reference point. Variance analysis has wide application
in financial reporting. Variance are analyzed in the following areas:
(a) Raw materials variances
(b) Labour variances
(c) Overhead variances
(d) Sales variances
(e) Profit variances
47
Variance is the deviation between actual and budgeted or standard results.
Following are the basic steps in analyzing variances:
(a) Setting standards
(b) Measurement of actual performance.
(c) Analyzing variances.
(d) Taking corrective action or feedback.
Variance should be broadly grouped under two categories; favourable and
unfavourable variances, further should be classified as controllable and non-
controllable. If unfavourable variance are arise due to controllable causes, then
related centre or management should be accounted for responsibility.
2.2 Review of Previous Related Studies
During the research work the previous study about it is the very importance
because they provide bases for the present study. In other words, there has to be
continuity in research. This continuity in research is ensured by linking the
present study with the past research studies. Literature review is basically a
stock taking of available literature in the field of research.
The main purpose of literature review is to find out what studies have been
done in the field of study and what remains to be done. It provides the
foundation for developing a comprehensive theoretical framework and
minimize the risk of pursuing the dead-ends in research. Thus different
books, reports and journals research studies published by different
organization submitted by master level students in the topic of profit
planning have been reviewed.
Bishowkarma, has conducted a research entitled “ A study on Profit Planning
and Control of Kathmandu Milk Supply Scheme”. His research was in partial
fulfillment of MBA, submitted to the central Department of Management,
Tribhuvan University. The study covered only five years period of time from
fiscal year 20550/51 to 2054/55. This study had mainly focused in examining
the technique of comprehensive profit planning system applied by KMSS.
48
Necessary data and other information have been collected from both the
secondary and primary sources of data. In his research, Mr. Bishowakarma had
pointed out various findings. Some remarkable finding of research were:
No proper practice of segregating cost into fixed and variable.
There is no periodic report.
There are no specific goals and objectives.
(Bishowkarma 1996)
Bhattarai has conducted a research about “Sales and Production Planning in
DDC” in his research. He has tried to point out some feature and problem of
profit planning in Nepalese manufacturing public enterprises. For this study
one enterprises has been selected for study of “Daily Development
Corporation”. He has discussed some features and problem of profit planning.
The main objectives of this research work are:
(a) To analyze the sales and production planning adopted in those DDC.
(b) To examine the capacity utilization of DDC.
(c) To assess the financial performance of DDC working BEP analysis.
(d) To provide some useful recommendation.
Major Findings
(a) DDC has practiced short term planning rather then long term planning.
(b) The corporation has no proper practice of segregating cost into fixed
and variable.
(c) There is not separate planning development and expert planner is
prepared on tradition and adhoc basis.
(d) No proper management to supply milk in the urban areas because of
the difficult in collecting surplus milk in rural market.
(e) Financial position of the DDC has not good.
(f) DDC has problem of maintaining the quality of the products.
49
Recommendations
1. DDC should develop its specific goal for coming budget. Such goal may
be not profit on sales, net profit on capital employed.
2. DDC should from long term planning on specific and practicable basis.
3. At decision making level, competent and capable persons should be
involved for this political interference should be avoided.
4. The storing system of milk should be made more effective.
5. There should be good transportation system for collection rural milks.
(Bhattarai, 2004)
Gyawali has studied about “Profit and Sales Plan and their achievement in
DDC with special reference to milk production.” The main objectives of this
study were achievement of sales and production budget of milk, analyze
material and labour budget and variance between targets and actual
achievement of DDC.
Major Findings
(a) Not preparation of strategic (long range) profit plan, not clear objectives,
lack of budgeting experts, planners, no effective program to attain goal.
(b) Sales budget are not prepare, profit pattern is poor, faculty financial and
investment decision, improper management, unscientific milk collection
and distribution policy etc. so on low utilization of capacity.
Recommendations
(a) Formulate strategic plan and programme, prepare of different budget.
(b) Optimum capacity utilization, proper management system and policies,
establish separate costing selection etc.
(Gyawali, 1997)
Thapa has studied about “Profit planning in manufacturing enterprises in
Nepal (A Comparative Study in Daily Development Corporation and Sitaram
Daily Industry). The main objectives of this study were to analysis to
functional budgets on sales and production sector of the concern, to analyze
50
various accounting ratios to measure the profitability and efficiency of concern,
to study of present process to find its usefulness and limitation and to analyze
of budget target and its achievement along with reason of deviation if any etc.
Major Findings
(a) DDC has concentrates its whole effort to the survival of the company
and SRD has been trying to minimize the loss. Both industries have no
in depth analysis of company’s strength and weakness.
(b) Employees are more careful of their duties and responsibility in SRD
than DDC. No fair system of reward and punishment to them on the
basis of their performance is maintained in both industries.
(c) SRD’s capacity utilization is proper than DDC’s capability utilization.
(d) Both companies are positive correlation between target and actual sales.
(e) Both companies have not proposed profit planning except sales and
production plan.
Recommendation
1. Long-term objectives should be clearly formulated so as to make a clear
distinction between profit motive and social motive and
entrepreneurship is the firms requirement for any business success.
2. HMG, Intervention should not be made full for function aspect of
enterprise management should be given full authority, responsibility and
accountability for routine and major operation.
3. These companies are facing the problem of under capitalization by
which production is affected. So, to enhance the production capacity the
necessary financial arrangement should be over viewed.
4. Periodic review of financial health of the corporation should be made by
using financial analysis tools and techniques like ratio analysis, fund
flow analysis, trend analysis etc. This helps the top management to
evaluate the effects of its financial policies/strategies and to take
necessary steps to avoid risk on time.
(Thapa, 1999)
51
Dahal have studied about “A study on demand and supply situation of Dairy
products in Kathmandu with reference to Dairy Development Corporation”.
The main objectives of this study were now DDC has available the necessaries
dairy product for Kathmandu resident.
Major Findings
1. The major problem faced by the corporation is lack of the sufficient raw
material.
2. The farmers and booth centers are attracted toward private sector due to
the high price and commission being altered by the private dairy firm.
3. It is also assumed that supply and sales may be decreased due to the
emergence of private sectors.
Recommendation
1. A few animals must be purchased and provided to farmers because at
present most of the animals are poor in production and veterinary
services should be enlarged in order to increase the productivity of
animals.
2. DDC must attract the farmers by giving production price incentives. In
this situation, farmers should be paid more money per unit of milk or fat
so it could complete with daily enterprises in private sector.
3. The commission paid per packet to booth centers by corporation should
be increased. At present, it is found that private sector pays more
commission per packet of milk or booth centres. This has influenced
them to sale more private dairy products.
4. At present, some of dairy firms supply their products without standard.
DDC can contribute through the measures such as advertising marketing
people conscious about their health, awareness of unhygienic milk.
These can promote the sales of DDC.
(Dahal, 2002)
Subedi has studied about “A study on milk collection and distribution by DDC
in Kathamndu”. The main objectives of this study were how the DDC is
52
efficience for collection the rural milk and distribution its product in urban
market (Kathmandu).
Major Findings
1. Lack of training in dairy technology and dairy business management and
quality maintenance.
2. The overall very poor sales and distribution system, especially as
regards other milk products, is an important problem to the development
of dairy industry.
3. No timely revision of milk price by DDC.
4. DDC has consistently carried excess staff mainly due to political
pressure on management.
5. There is lack of marketing information system on DDC.
6. Lack of understanding between dairy entrepreneurs and dairy farming.
Recommendations
1. Training of daily technology, dairy business management and quality
maintenance should be provided.
2. Point of sales promotional materials should be displayed at either
booths, dealers or shops of DDC.
3. Clear government policy regarding dairy farming should be formulated.
(Subedi, 2004)
The Research Gap
In this way there are more studies done by previous researcher about different
Organization, whose has separate objectives, findings and recommendation.
But they are not sufficient for how to implement these recommendations. So on
how to improve the management system of SGML. But the researcher has tried
to give the optimal solution to implement the recommendation and improve the
management system of SGML.
53
CHAPTER – III
3.1 General Introduction
Research methodology is the way to solve scientific process and systemically
about research problem. “Research methodology refers to various sequential
steps. To adopt by research in studying a problem with certain objective in
view” (Kothari 2009. 39). In other words research is a careful investigation of
inquiry especially through search for new facts in any branch of knowledge.
Research methodology helps to analyze, examine and interpret various aspects
of research works such as sale and production planning and other aspects
related to profit planning in the research work. Its way of basic objectives and
other sub objective are also formulated and research methodology is followed
to achieve the objectives of the research paper. Major contents of research
methodology followed in the study are as below.
3.2 Research Design
Research design is the plan structure and strategy of investigations conceived
so as to obtain answers to research question and to control variance (Kerlinger)
In other word make any type of research to necessary for fulfills the objective
of the study and problem. Generally research design means definition
procedure and technique that guide to study and foundation way for research
through analysis data. This study is an examination and evaluation of budgeting
procedures in the process of profit planning of SGML. Therefore, analytical as
well as descriptive approach has been considerable adapted to present data.
This study is closely related with various functional budgets and their actual
performance as well as other according statement. The available information
from primary and secondary sources is used to examine, explain and evaluate
the profit planning system of Sita Ram Gokul Milk ltd.
54
3.3 Period Covered
Profit planning and control basically for two dimensions such as short range
and long range. For short range planning it has analyzed one year’s period
actives of SGML. Long range trend for analyze from fiscal year 2057/58 to
2061/62.
3.4 Nature and Sources of Data
Actual Data is very important of any research work to achieve the objective of
problem. I have been used primary as well as secondary data. Primary data are
collected through interviews with official and worker to help developed some
supplementary questionnaire.
Secondary data has been collected from the different reports and published
document of SGML, magazine, publication of National planning Commission,
Statistical Survey, Unpublished dissertation and the official accounting and
planning record of SGML. The questionnaires will be shown in the appendix at
the end of this study that is used for collecting information about SGML.
3.5 Research Variables
The research variable of this study is mainly related with the accounting
statement of SGML sale, production, inventory, purchases, profit/loss
statement, balance sheet, capital utilization, capital expenditure and cash flow
related to long-term and short-term period of SGML are main research
variables of this study.
3.6 Statistical Tools Used
The research variables of the study are mainly related with the accounting
statement of SGML. Sales and production are the main variable of this study
and other variable are also used here as necessary. Data collected from various
sources are managed, analyzed and presented in proper table and format.
Interpretation and explanation are made whatever necessary. To analyze the
55
collected data financial and statistical tools are used. Financial tools are mainly
used for cost-volume profit analysis, ratio analysis and flexible budget.
Similarly the statistical tools are used for mean, correlation, regression,
coefficient of variance, standard deviation, percentage graphs and diagrams.
Some Formulae
i) Arithmetic mean (�̅�) = ∑ 𝑥
𝑁
ii) Standard Deviation (𝑆𝐷𝑥) = √∑(𝑥−�̅�)2
𝑁
iii) Correlation Coefficient (𝑟) = ∑ 𝑥𝑦
√(∑ 𝑥2)(∑ 𝑦2)
iv) Coefficient of Variation (𝐶. 𝑉. ) = 𝑆𝐷𝑥
�̅�
v) Regression Equation: y = a + bx
Where,
X = Independent variable
Y = Dependent variable
SDx = Standard deviation of variable
N = Number of sample
x = Total sum of variable x
3.7 Research Procedure
For a successful research work, several procedures should follow
systematically. In this research work I have been followed different procedures
systematically which are follows.
1) Collection of various books and other publication relevant about study.
2) Assimilation of useful secondary data.
3) Description and analysis of collected data in light of theoretical basis.
4) Tabulation and presentation of data through table, charts and graphs.
5) Analysis of data by using statistical and financial tools.
6) Finding the valuable conclusion and recommendation.
CHAPTER - IV
56
DATA PRESENTATION AND ANALYSIS
4.1 Introduction
The one important part of planning and control is implementation of effective
management performance. The main purpose of profit planning is any business
is to increase the chances of making profit. Budgeting or comprehensive profit
planning and control to operate continues in the organization. Planning
involves the control and manipulation of relevant components controllable and
non-controllable to clear definition and reduced the uncertainty, So that the
enterprise could be saved from the profit at short term and long term.
Profit planning and control have wide application in any individual business
Government unit and any types of business enterprise. It should be regarded
not as a master plan but as some time its become secondary business planning.
management planning and profit planning are integrated to each other or they
are supplement of effective planning process of organization.
The main purpose of this studies is to analyze the sale and production planning
(a tools of profit planning and control) of SGML. To gain this purpose in this
chapter, I will analyze the various aspects of profit planning and their actual
achievement. Profit planning is the managerial tools, which is applied in every
business either manufacturing in trading enterprises. So the profit planning is
the formal expression of the enterprises, plan goals and objectives stated in
financial term for specific future period of time moreover various strategies,
policies, plan and programs are applied by management for achieving
prescribed objectives at a competitive business environment.
Profit planning is a managerial technique and profit plan is a written plan, in
which all aspects of the business operation with respect of defined future period
are included. It is formal statement of policy, plan, objectives and goals
established by the top management is respect of some future period. Profit
57
planning is predetermined detailed plan of action developed and as a partial
basis for the subsequent, evaluation of performance. So profit planning is a
tools which may be used by management in planning the future course of
action and the controlling the actual performance.
Budgeting or profit planning is a numerical plan of action, which gradually
covers the area of revenue and expenditure or production and sales. Profit is
main element of cash and every business for its survival, further development
and fulfilling the social expectation. Organizational effectiveness and
efficiency measure by earning power. Generally organizational adopt two
types of plan structure and long run. This studies cannot cover two plan
because cost and time constraints. Therefore these studies mainly focused in
tactical short run profit plan of SGML. So the sales, production and other
related figure of previous result are also presented and financial trend of
SGML. For this purpose study five years’ data from fiscal year data from
fiscal year 2057/58 to 2061/62 BS.
The short run profit plan is analyzed by taking relevant figure from various
functional budgets on each year. Figure of one fiscal year may represent the
techniques, process and other procedure of preparing budget. Their use for
profit planning, comparison with actual achievement and analysis of variance
for the year because such process are some for every year and repeated each
year in the time of preparing and analyzing budget. For this fiscal year 061/62
has been takes as representatives year to analyze short-term profit plan. Various
functional budgets of fiscal year 2061/62 and their basis of preparation actual
achievement and actual are analyze in detailed. Attempt is made to point out
the reason the deviation between budgeted and actual. Some recommendations
have been made after analyzing this study.
58
4.2 The Objectives and Goals as Basic Elements of Profit Planning In
SGML
SMART objectives and goals is very important for operating any enterprises.
S = Suitable
M = Measurable
A = Agreeable
R = Reasonable
T = Timely
Every enterprise is established to attain described level of objectives. So
organization necessary specified the objectives in broad terms. In a present
context reasonable profit approach has been becoming at a strong position. In
other words for survival growth and maintaining social expectation, reasonable
profit must be earned or existence profit is basic element of profit planning.
For the analyzing the organization resources and management co-ordinate all
resources of organization for formulating the SMART goals and objectives. So
clear goal and objectives help to organization to be successfully operating out
more challenging and competitive environment.
Nepalese business enterprises are systematic management system is very
traditional. Goals and objectives are specified on the planning but not adopted
by development of enterprises. Manager haven’t any knowledge of analyzing
the risk, environment situation, goals, effective planning strategies, resources
analysis etc. without effective implementation of planning there is no
fulfillment of objectives and goals. So fulfillment of objectives and goals of
SCML effective planning is very necessary, which includes sales planning,
production, planning, inventory, manpower capacity utilization, flexible
budgeting planning etc. which is defining clearly below.
59
4.3 Sales Planning or Sales Budget
Sales planning or budgeting is the basic function of all other profit planning. It
provides basic management decision about marketing. Sales is primary sources
of cash inflow and all other functional budget or planning which are prepared
on the basis of sales plan. It is directly related with all business activities. So
sale plan prepared realistic and proper. Sales planning are prepared in the basis
of sales forecasting which depend on different factor of market situation. The
preparation of sale plan involves the different steps that are as follows.
1. The marketing plan
2. The advertising and promoting plan
3. The selling expenses budget.
Sales budget is prepared by product, by period and sales territory. Overall
responsibility of preparing sales budget is upon the sales manager, although
chief executive should also be involved in such activities. Generally a
comprehensive sale plan includes both strategic and technical sales plan.
SGML has only short-range sales plan for coming fiscal year. Sales budget is
prepared by product by region and by times. SGML has produces different
products that can be measure in litters, and kilograms. For example the
production of milk yoghurt and ice cream can be measure in litters and other
product can measure in kilograms. SGML has supplied its production from 620
dealer and 1143 sub dealer in Kathmandu.
The following table Butter, Ghee and Cheese shows the budgeted and actual
sale for the SGML in quantity.
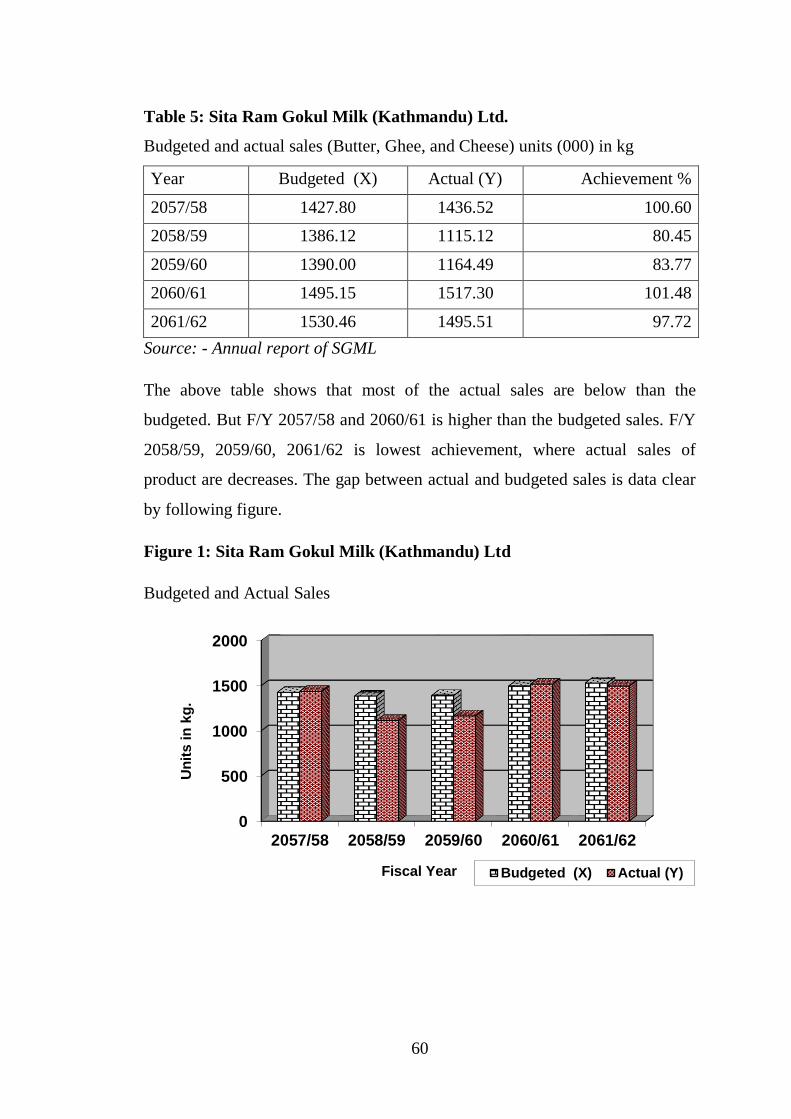
60
Table 5: Sita Ram Gokul Milk (Kathmandu) Ltd.
Budgeted and actual sales (Butter, Ghee, and Cheese) units (000) in kg
Year Budgeted (X) Actual (Y) Achievement %
2057/58 1427.80 1436.52 100.60
2058/59 1386.12 1115.12 80.45
2059/60 1390.00 1164.49 83.77
2060/61 1495.15 1517.30 101.48
2061/62 1530.46 1495.51 97.72
Source: - Annual report of SGML
The above table shows that most of the actual sales are below than the
budgeted. But F/Y 2057/58 and 2060/61 is higher than the budgeted sales. F/Y
2058/59, 2059/60, 2061/62 is lowest achievement, where actual sales of
product are decreases. The gap between actual and budgeted sales is data clear
by following figure.
Figure 1: Sita Ram Gokul Milk (Kathmandu) Ltd
Budgeted and Actual Sales
0
500
1000
1500
2000
2057/58 2058/59 2059/60 2060/61 2061/62
Un
its in
kg
.
Fiscal Year Budgeted (X) Actual (Y)
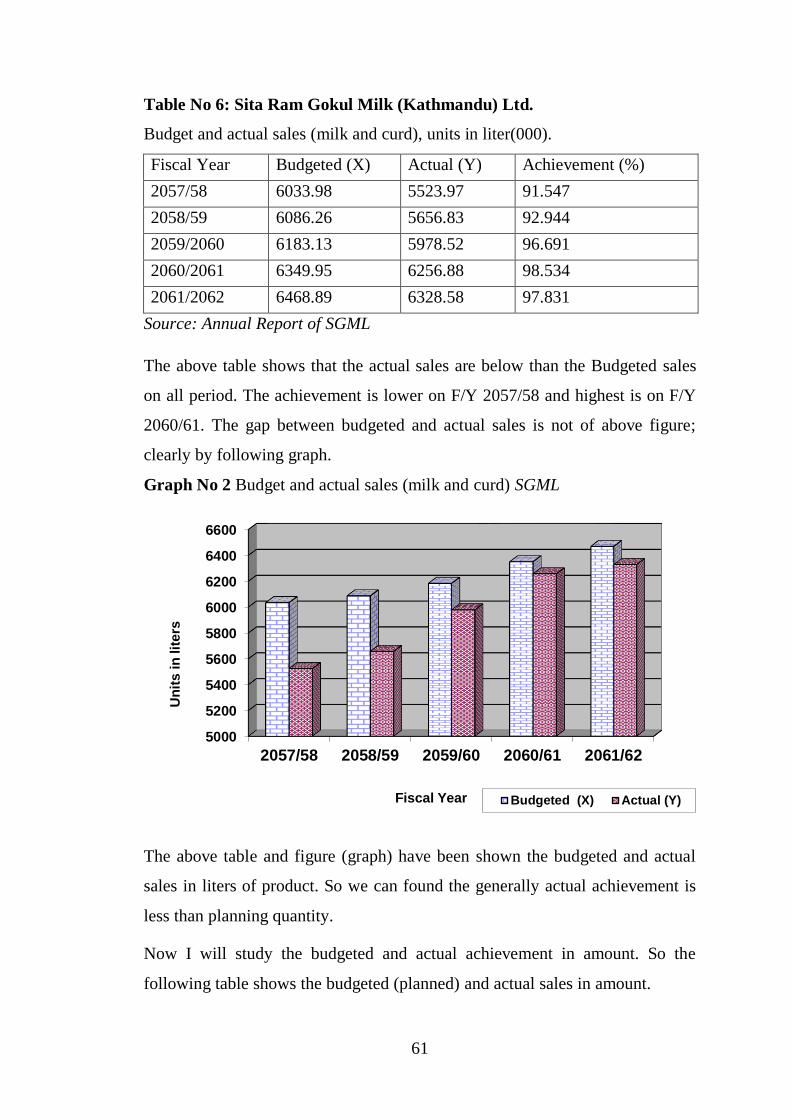
61
Table No 6: Sita Ram Gokul Milk (Kathmandu) Ltd.
Budget and actual sales (milk and curd), units in liter(000).
Fiscal Year Budgeted (X) Actual (Y) Achievement (%)
2057/58 6033.98 5523.97 91.547
2058/59 6086.26 5656.83 92.944
2059/2060 6183.13 5978.52 96.691
2060/2061 6349.95 6256.88 98.534
2061/2062 6468.89 6328.58 97.831
Source: Annual Report of SGML
The above table shows that the actual sales are below than the Budgeted sales
on all period. The achievement is lower on F/Y 2057/58 and highest is on F/Y
2060/61. The gap between budgeted and actual sales is not of above figure;
clearly by following graph.
Graph No 2 Budget and actual sales (milk and curd) SGML
The above table and figure (graph) have been shown the budgeted and actual
sales in liters of product. So we can found the generally actual achievement is
less than planning quantity.
Now I will study the budgeted and actual achievement in amount. So the
following table shows the budgeted (planned) and actual sales in amount.
5000
5200
5400
5600
5800
6000
6200
6400
6600
2057/58 2058/59 2059/60 2060/61 2061/62
Un
its i
n lit
ers
Fiscal Year Budgeted (X) Actual (Y)
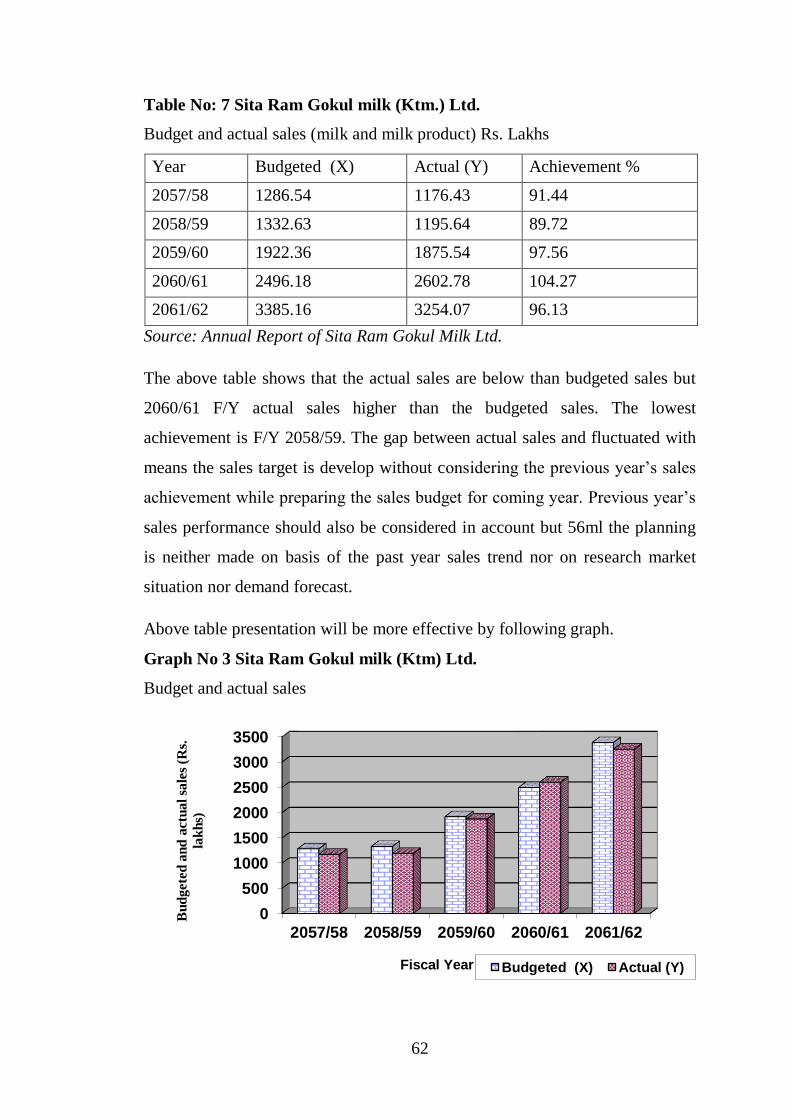
62
Table No: 7 Sita Ram Gokul milk (Ktm.) Ltd.
Budget and actual sales (milk and milk product) Rs. Lakhs
Year Budgeted (X) Actual (Y) Achievement %
2057/58 1286.54 1176.43 91.44
2058/59 1332.63 1195.64 89.72
2059/60 1922.36 1875.54 97.56
2060/61 2496.18 2602.78 104.27
2061/62 3385.16 3254.07 96.13
Source: Annual Report of Sita Ram Gokul Milk Ltd.
The above table shows that the actual sales are below than budgeted sales but
2060/61 F/Y actual sales higher than the budgeted sales. The lowest
achievement is F/Y 2058/59. The gap between actual sales and fluctuated with
means the sales target is develop without considering the previous year’s sales
achievement while preparing the sales budget for coming year. Previous year’s
sales performance should also be considered in account but 56ml the planning
is neither made on basis of the past year sales trend nor on research market
situation nor demand forecast.
Above table presentation will be more effective by following graph.
Graph No 3 Sita Ram Gokul milk (Ktm) Ltd.
Budget and actual sales
0
500
1000
1500
2000
2500
3000
3500
2057/58 2058/59 2059/60 2060/61 2061/62
Bu
dgete
d a
nd
actu
al
sale
s (R
s.
lak
hs)
Fiscal Year Budgeted (X) Actual (Y)
63
For finding out of the nature of variability, we can calculate different types of
statistical tools like mean, Standard deviation coefficient of variation and
correlation. The detail calculation of their figures are shown in appendix-I that
summarizing result is shown below.
Particular Budgeted (X) Sales Actual sales
Mean 2084.57 2028.89
Standard deviation 786.07 821.52
Coefficient of Variation 37.70 40.49
From the above calculations, it is clear that the actual sales is more variable
than budgeted sales or budgeted sales is more constant or homogeneous than
actual sales because C.V. of actual sales is higher than budgeted sales.
The relationship between two (i.e. dependent and independent) variable are
called simple correlation. The most important methods of measuring the
correlation between the two variable is “Karls Pearsons” coefficient of
correlation. This is a mathematical method of measuring the degree of
association between the two variables say X and Y. (Shrestha et al. 2057.318).
Here statistical tool correlation of coefficient (r) can be used to analyze the
relationship between budgeted sales and actual sales. For this purpose budgeted
sales X is assumed that to an independent variable and actual sales Y is
assumed that to dependent variable. It is assumed that actual sales will increase
if budgeted sales are increase vice-versa. It means there is positive correlation
between budgeted and actual sales.
The probable error (PE) of correlation is applicable for the measurement of
reliability of the computed value of the correlation coefficient ‘r’.
If r<PE the value of ‘r’ is not significant no matter how high ‘r’ value is ie
there is no evidence of correlation between the variables.
If r> PE the value of ‘r’ is significant i.e. there is evidence of correlation
between the variables (Shrestha et al. 2057: 325)
64
The details calculation of r and PE is presented in Appendix – I. here we can
calculate in summarize from of ‘r’ and PE in following way.
Calculation of Karl Person’s correlation coefficient r= 0.341.
Calculation of probable error (PE) of correlation coefficient r = 0.27.
This figure of the value of ‘r’ shows that there is positive correlation between
budgeted and actual sales. The actual sales will change in same direction of the
change in the budgeted sales. Here r> PE r = (0.314) > PE (0.27), so the value
of r is definitely significant. So it can be said that actual sales will go on same
direction of budgeted sales.
Some assumption of Karl Pearson’s correlation coefficient ‘r’ the numerical
measurement of relationship between the two variables is donated by the
symbol of ‘r’ which value range from – 1, 0, +1.
If ‘r’ = 0 there is no relationship between the variable.
If ‘r’ <0 there is negative relationship between the variables.
If ‘> 0 there is positive relationship between the variables.
If r = +1 the relationship perfectly positive.
If r = -1 the relationship is perfectly negative.
(Source of Shrestha et al. 2057; 318)
4.4. Production Plan or Production Budget
About the production plan 1 already discussed in the reviews of literature
chapter. It refers the developing of policies about efficient production level, use
of production facilities and inventory level. Preparation of production plan is
second step developing profit plan.
Production unit = Planned sales + final inventory – initial inventory.
The following table 8 and 9 presents the budgeted production and actual
production of previous years.
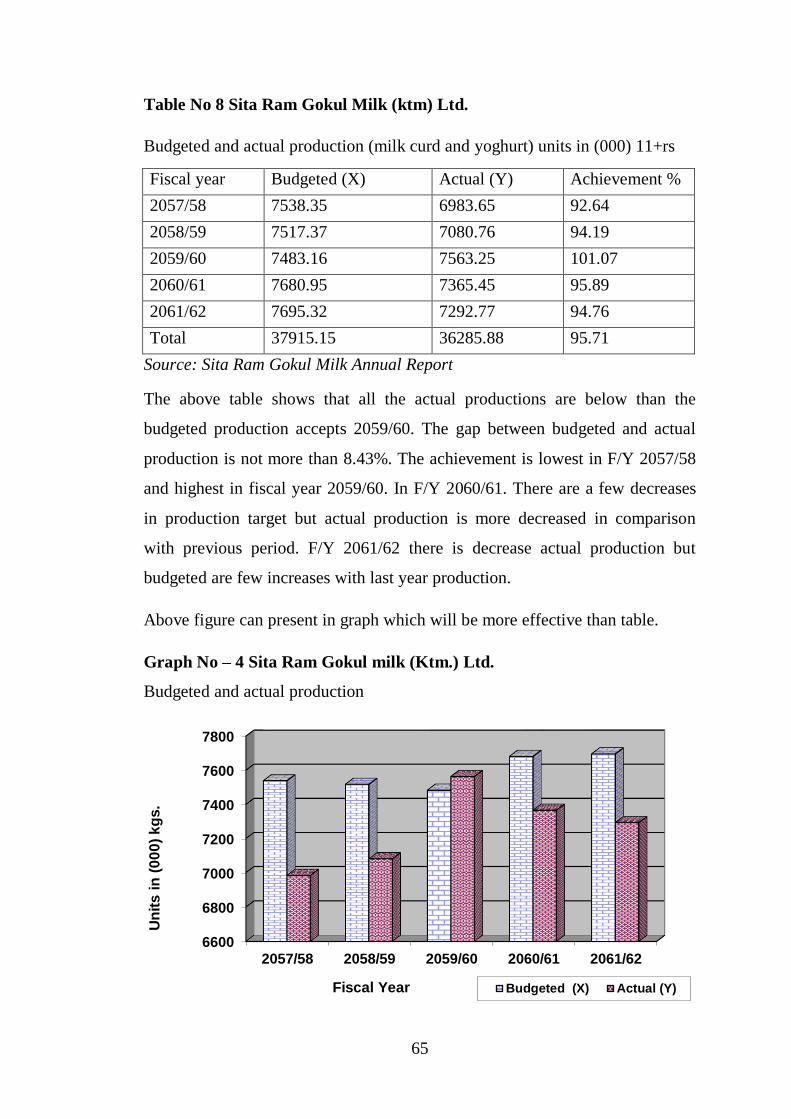
65
Table No 8 Sita Ram Gokul Milk (ktm) Ltd.
Budgeted and actual production (milk curd and yoghurt) units in (000) 11+rs
Fiscal year Budgeted (X) Actual (Y) Achievement %
2057/58 7538.35 6983.65 92.64
2058/59 7517.37 7080.76 94.19
2059/60 7483.16 7563.25 101.07
2060/61 7680.95 7365.45 95.89
2061/62 7695.32 7292.77 94.76
Total 37915.15 36285.88 95.71
Source: Sita Ram Gokul Milk Annual Report
The above table shows that all the actual productions are below than the
budgeted production accepts 2059/60. The gap between budgeted and actual
production is not more than 8.43%. The achievement is lowest in F/Y 2057/58
and highest in fiscal year 2059/60. In F/Y 2060/61. There are a few decreases
in production target but actual production is more decreased in comparison
with previous period. F/Y 2061/62 there is decrease actual production but
budgeted are few increases with last year production.
Above figure can present in graph which will be more effective than table.
Graph No – 4 Sita Ram Gokul milk (Ktm.) Ltd.
Budgeted and actual production
6600
6800
7000
7200
7400
7600
7800
2057/58 2058/59 2059/60 2060/61 2061/62
Un
its i
n (
00
0)
kg
s.
Fiscal Year Budgeted (X) Actual (Y)
66
For finding out of the natural of variability, we can calculate different types of
statistical tools like mean, standard deviation, coefficient of variance, and
correlation of coefficient. The calculation of these figures is shown in
appendex-2 & the summarizing result of appendix -2 is below.
Particular Budgeted production Actual production
Mean 7583.03 7257.17
Standard deviation 87.75 206.20
Coefficient of variation 1.16 28.42%
From the above calculation, it is clear that budgeted production are more
consult than actual production and actual production are more fluctuation then
budgeted production because c.v. of actual production is higher than budgeted
production.
A statistical tools correlation of coefficient [r] can be used to analyze the
relationship between budgeted and actual production. For this purpose
budgeted production [x] are assumed to be independent variable and actual
production[y] are assumed to be dependent variable. It is assumed that actual
production will increase if budgeted production increased or vice-versa. It
means there is positive correlation between budgeted and actual production.
The probable error [P. E.] of the correlation coefficient is applicable for the
measurement of reliability of the compute value of the correlation coefficient (r).
If ‘r’< PE the value of ‘r’ is not significant no matter how high ‘r’ value is i.e.
There is evidence of correlation between the variables. If ‘r’ >PE the value of
‘r’ is significant i.e. correlation is significant.
The details calculation of ‘r’ and “PE” are presented in appendix-2. Here we
can state is summarizing from of r and PE values.
Calculation of Karl parsons correlation coefficient r = 0.126
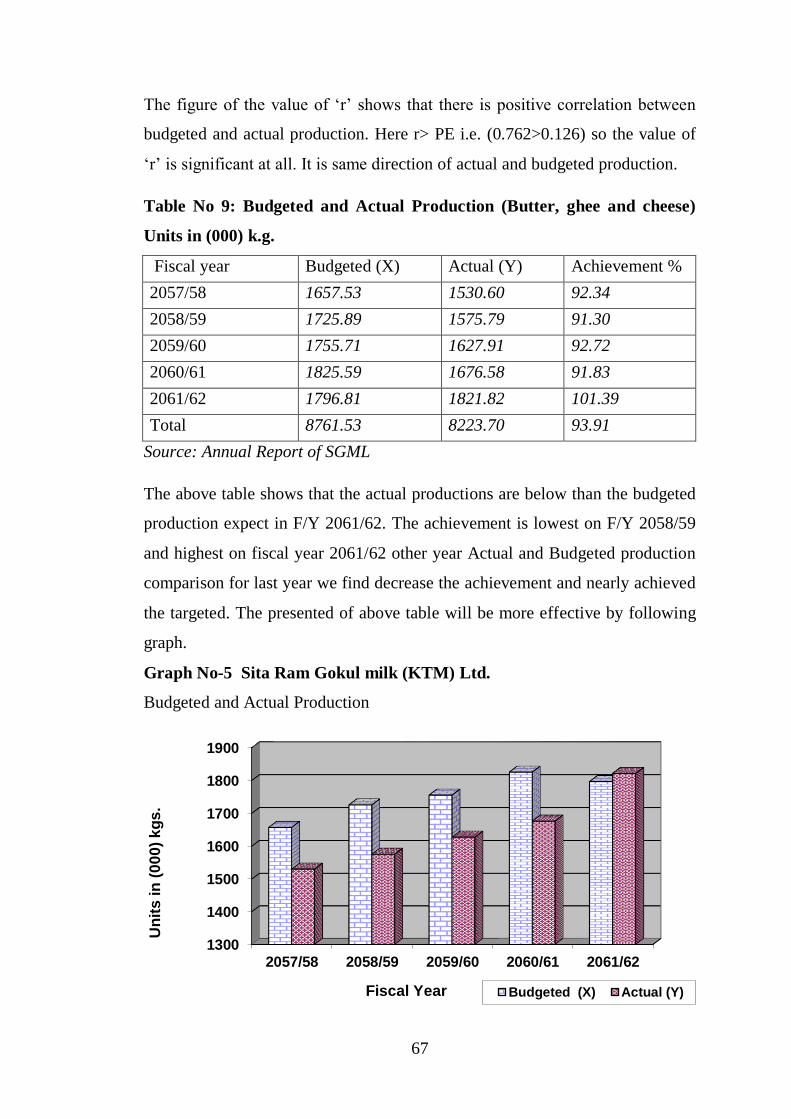
67
The figure of the value of ‘r’ shows that there is positive correlation between
budgeted and actual production. Here r> PE i.e. (0.762>0.126) so the value of
‘r’ is significant at all. It is same direction of actual and budgeted production.
Table No 9: Budgeted and Actual Production (Butter, ghee and cheese)
Units in (000) k.g.
Fiscal year Budgeted (X) Actual (Y) Achievement %
2057/58 1657.53 1530.60 92.34
2058/59 1725.89 1575.79 91.30
2059/60 1755.71 1627.91 92.72
2060/61 1825.59 1676.58 91.83
2061/62 1796.81 1821.82 101.39
Total 8761.53 8223.70 93.91
Source: Annual Report of SGML
The above table shows that the actual productions are below than the budgeted
production expect in F/Y 2061/62. The achievement is lowest on F/Y 2058/59
and highest on fiscal year 2061/62 other year Actual and Budgeted production
comparison for last year we find decrease the achievement and nearly achieved
the targeted. The presented of above table will be more effective by following
graph.
Graph No-5 Sita Ram Gokul milk (KTM) Ltd.
Budgeted and Actual Production
1300
1400
1500
1600
1700
1800
1900
2057/58 2058/59 2059/60 2060/61 2061/62
Un
its
in
(0
00
) k
gs
.
Fiscal Year Budgeted (X) Actual (Y)
68
For finding out of the nature of variability, we can calculate different types of
statistical tools like mean, standard deviation, coefficient of variation and
correlation of coefficient. The detail calculations of these figures are shown in
Appendix: 3. Now summarizing result of Appendix: 3 we have,
Particulars Budgeted Production Actual Production
Mean 1752.30 1646.54
Standard Deviation 58.38 100.41
Coefficient of Variation CV 3.34 6.09
From the above calculations it is clear that actual production are more variable
than budgeted production. Hence the coefficient variation of actual production
is higher which means the budgeted production is more constant.
A statistical tool, correlation of coefficient (r) can be used to analyze the
relationship between budgeted and actual production. For this purpose
budgeted production (X) are assumed to be independent variable and actual
production (Y) are assumed to be dependent variable. It is assumed that actual
production will increase if budgeted production is increase or vice versa. It
means there is positive correlation between budgeted and actual production.
The details calculation of ‘r’ and PE of ‘r’ is presented in Appendix-3. Here we
can calculate is summarizing from of ‘r’ and PE in the following way. Karl
Pearson’s correlation coefficient (r) =0.78 probable error PE of correlation
coefficient (r) = 0.118.
The figure of the value of ‘r’ shows that there is positive correlation between
budgeted and actual production. In others words if plan is increased the
performance would improve. So the actual achievement also increases. Here
r>PE (0.78>0.118) so value of ‘r’ is significant at all. So it is go on same
direction of budgeted production at all condition.
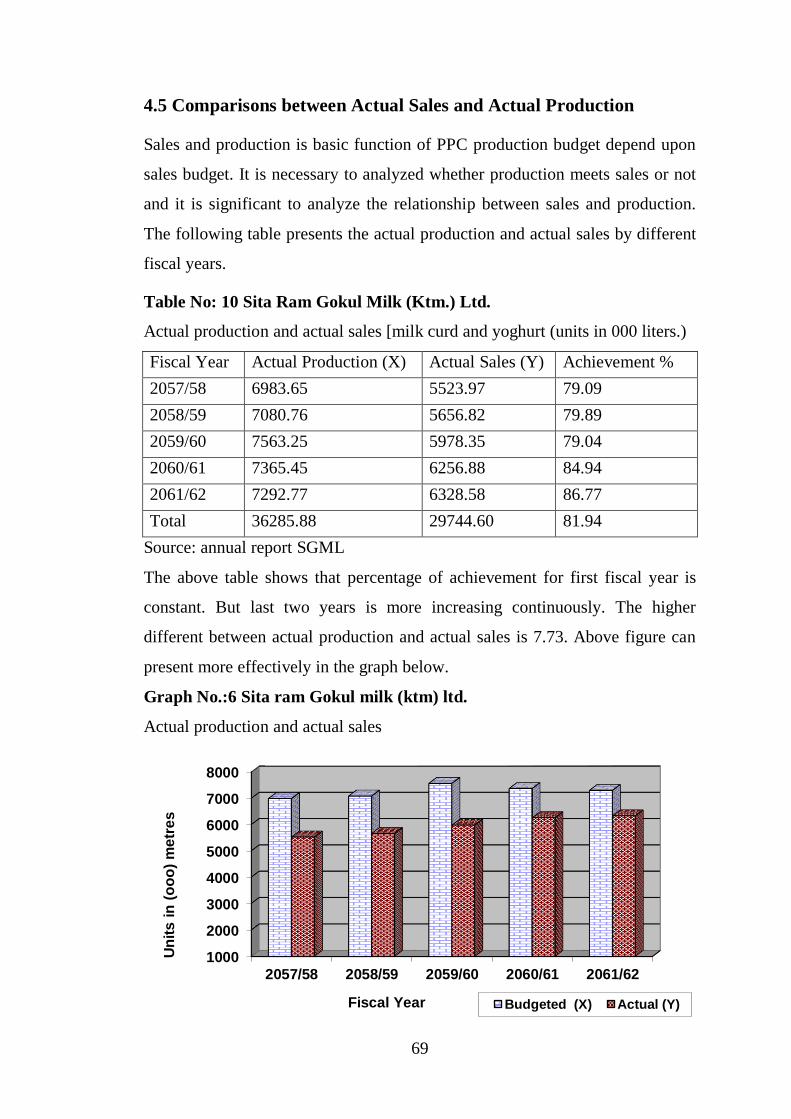
69
4.5 Comparisons between Actual Sales and Actual Production
Sales and production is basic function of PPC production budget depend upon
sales budget. It is necessary to analyzed whether production meets sales or not
and it is significant to analyze the relationship between sales and production.
The following table presents the actual production and actual sales by different
fiscal years.
Table No: 10 Sita Ram Gokul Milk (Ktm.) Ltd.
Actual production and actual sales [milk curd and yoghurt (units in 000 liters.)
Fiscal Year Actual Production (X) Actual Sales (Y) Achievement %
2057/58 6983.65 5523.97 79.09
2058/59 7080.76 5656.82 79.89
2059/60 7563.25 5978.35 79.04
2060/61 7365.45 6256.88 84.94
2061/62 7292.77 6328.58 86.77
Total 36285.88 29744.60 81.94
Source: annual report SGML
The above table shows that percentage of achievement for first fiscal year is
constant. But last two years is more increasing continuously. The higher
different between actual production and actual sales is 7.73. Above figure can
present more effectively in the graph below.
Graph No.:6 Sita ram Gokul milk (ktm) ltd.
Actual production and actual sales
1000
2000
3000
4000
5000
6000
7000
8000
2057/58 2058/59 2059/60 2060/61 2061/62
Un
its i
n (
oo
o)
me
tre
s
Fiscal Year Budgeted (X) Actual (Y)
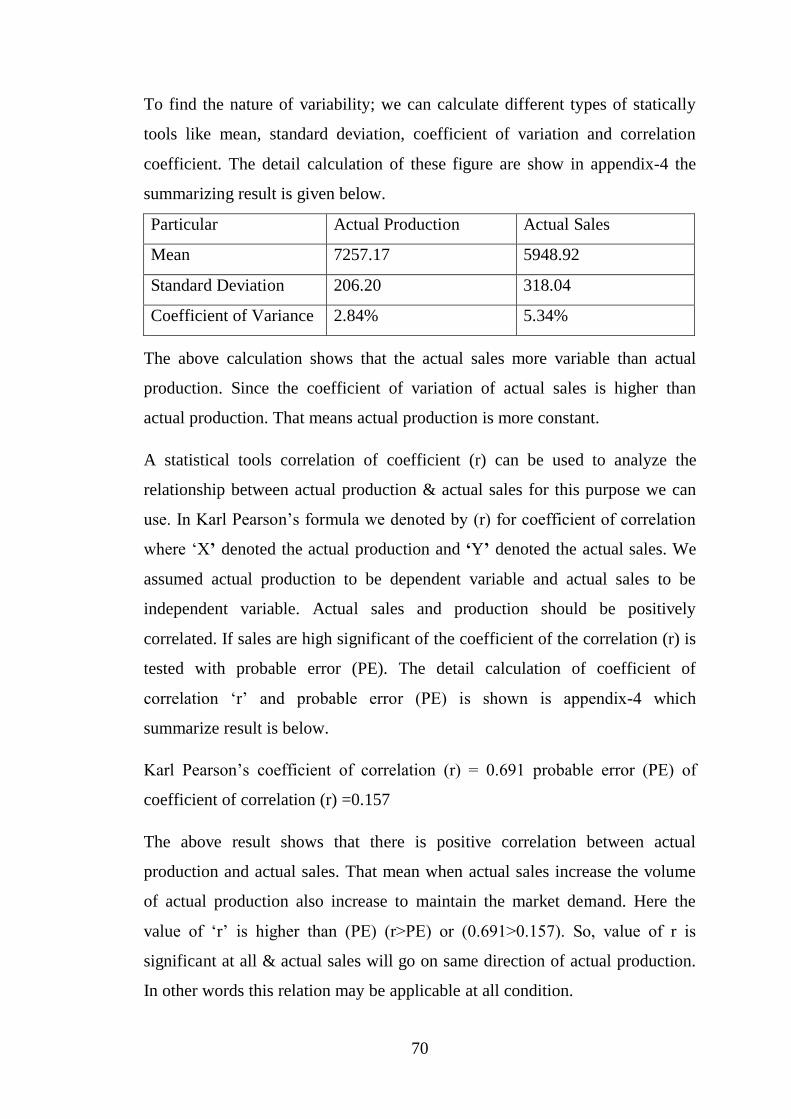
70
To find the nature of variability; we can calculate different types of statically
tools like mean, standard deviation, coefficient of variation and correlation
coefficient. The detail calculation of these figure are show in appendix-4 the
summarizing result is given below.
Particular Actual Production Actual Sales
Mean 7257.17 5948.92
Standard Deviation 206.20 318.04
Coefficient of Variance 2.84% 5.34%
The above calculation shows that the actual sales more variable than actual
production. Since the coefficient of variation of actual sales is higher than
actual production. That means actual production is more constant.
A statistical tools correlation of coefficient (r) can be used to analyze the
relationship between actual production & actual sales for this purpose we can
use. In Karl Pearson’s formula we denoted by (r) for coefficient of correlation
where ‘X’ denoted the actual production and ‘Y’ denoted the actual sales. We
assumed actual production to be dependent variable and actual sales to be
independent variable. Actual sales and production should be positively
correlated. If sales are high significant of the coefficient of the correlation (r) is
tested with probable error (PE). The detail calculation of coefficient of
correlation ‘r’ and probable error (PE) is shown is appendix-4 which
summarize result is below.
Karl Pearson’s coefficient of correlation (r) = 0.691 probable error (PE) of
coefficient of correlation (r) =0.157
The above result shows that there is positive correlation between actual
production and actual sales. That mean when actual sales increase the volume
of actual production also increase to maintain the market demand. Here the
value of ‘r’ is higher than (PE) (r>PE) or (0.691>0.157). So, value of r is
significant at all & actual sales will go on same direction of actual production.
In other words this relation may be applicable at all condition.
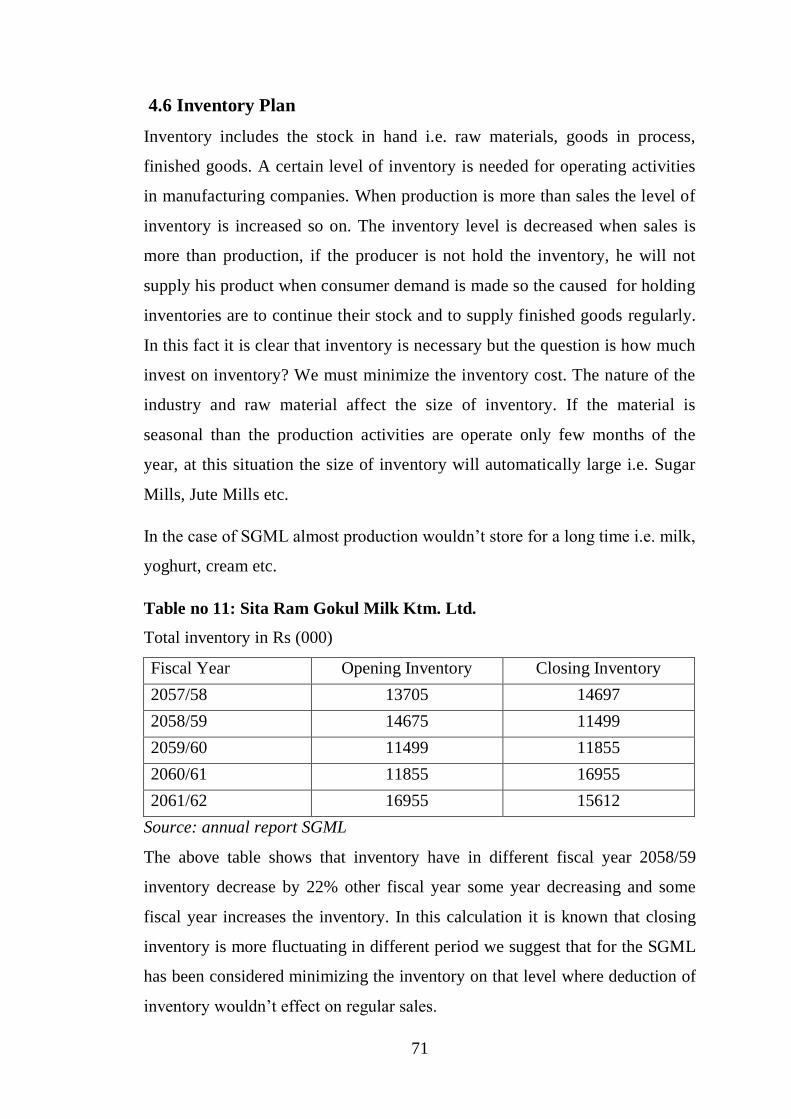
71
4.6 Inventory Plan
Inventory includes the stock in hand i.e. raw materials, goods in process,
finished goods. A certain level of inventory is needed for operating activities
in manufacturing companies. When production is more than sales the level of
inventory is increased so on. The inventory level is decreased when sales is
more than production, if the producer is not hold the inventory, he will not
supply his product when consumer demand is made so the caused for holding
inventories are to continue their stock and to supply finished goods regularly.
In this fact it is clear that inventory is necessary but the question is how much
invest on inventory? We must minimize the inventory cost. The nature of the
industry and raw material affect the size of inventory. If the material is
seasonal than the production activities are operate only few months of the
year, at this situation the size of inventory will automatically large i.e. Sugar
Mills, Jute Mills etc.
In the case of SGML almost production wouldn’t store for a long time i.e. milk,
yoghurt, cream etc.
Table no 11: Sita Ram Gokul Milk Ktm. Ltd.
Total inventory in Rs (000)
Fiscal Year Opening Inventory Closing Inventory
2057/58 13705 14697
2058/59 14675 11499
2059/60 11499 11855
2060/61 11855 16955
2061/62 16955 15612
Source: annual report SGML
The above table shows that inventory have in different fiscal year 2058/59
inventory decrease by 22% other fiscal year some year decreasing and some
fiscal year increases the inventory. In this calculation it is known that closing
inventory is more fluctuating in different period we suggest that for the SGML
has been considered minimizing the inventory on that level where deduction of
inventory wouldn’t effect on regular sales.
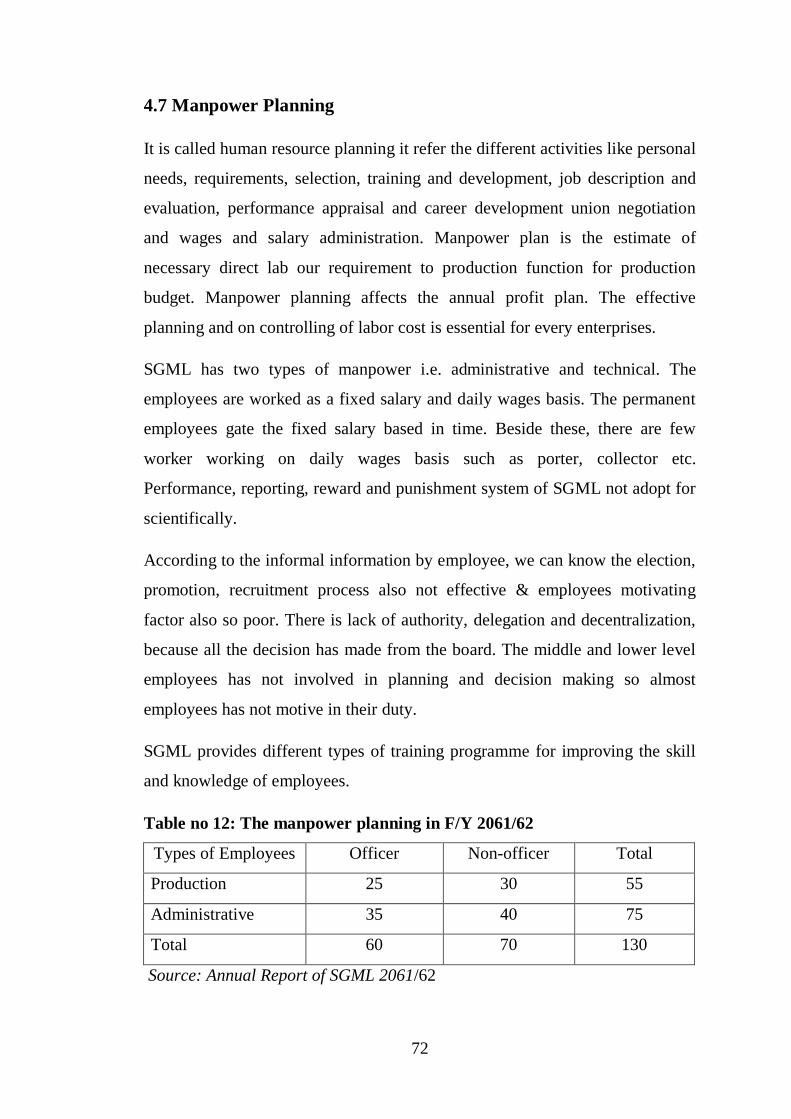
72
4.7 Manpower Planning
It is called human resource planning it refer the different activities like personal
needs, requirements, selection, training and development, job description and
evaluation, performance appraisal and career development union negotiation
and wages and salary administration. Manpower plan is the estimate of
necessary direct lab our requirement to production function for production
budget. Manpower planning affects the annual profit plan. The effective
planning and on controlling of labor cost is essential for every enterprises.
SGML has two types of manpower i.e. administrative and technical. The
employees are worked as a fixed salary and daily wages basis. The permanent
employees gate the fixed salary based in time. Beside these, there are few
worker working on daily wages basis such as porter, collector etc.
Performance, reporting, reward and punishment system of SGML not adopt for
scientifically.
According to the informal information by employee, we can know the election,
promotion, recruitment process also not effective & employees motivating
factor also so poor. There is lack of authority, delegation and decentralization,
because all the decision has made from the board. The middle and lower level
employees has not involved in planning and decision making so almost
employees has not motive in their duty.
SGML provides different types of training programme for improving the skill
and knowledge of employees.
Table no 12: The manpower planning in F/Y 2061/62
Types of Employees Officer Non-officer Total
Production 25 30 55
Administrative 35 40 75
Total 60 70 130
Source: Annual Report of SGML 2061/62
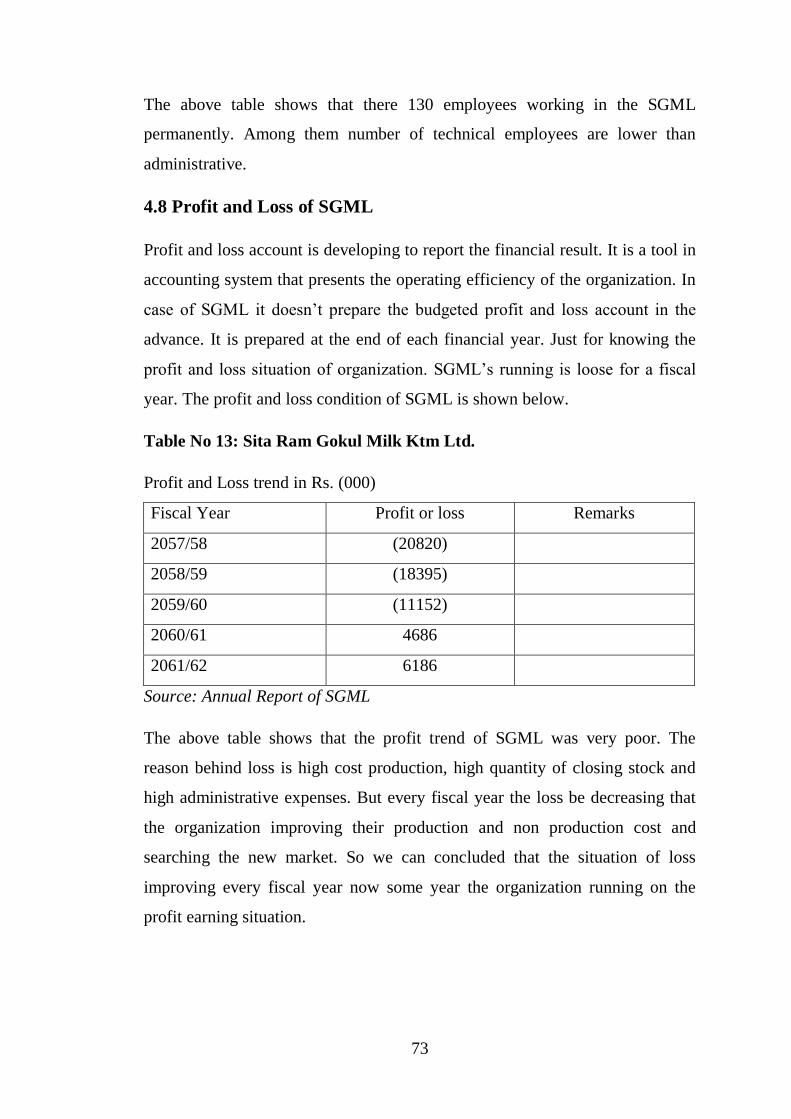
73
The above table shows that there 130 employees working in the SGML
permanently. Among them number of technical employees are lower than
administrative.
4.8 Profit and Loss of SGML
Profit and loss account is developing to report the financial result. It is a tool in
accounting system that presents the operating efficiency of the organization. In
case of SGML it doesn’t prepare the budgeted profit and loss account in the
advance. It is prepared at the end of each financial year. Just for knowing the
profit and loss situation of organization. SGML’s running is loose for a fiscal
year. The profit and loss condition of SGML is shown below.
Table No 13: Sita Ram Gokul Milk Ktm Ltd.
Profit and Loss trend in Rs. (000)
Fiscal Year Profit or loss Remarks
2057/58 (20820)
2058/59 (18395)
2059/60 (11152)
2060/61 4686
2061/62 6186
Source: Annual Report of SGML
The above table shows that the profit trend of SGML was very poor. The
reason behind loss is high cost production, high quantity of closing stock and
high administrative expenses. But every fiscal year the loss be decreasing that
the organization improving their production and non production cost and
searching the new market. So we can concluded that the situation of loss
improving every fiscal year now some year the organization running on the
profit earning situation.
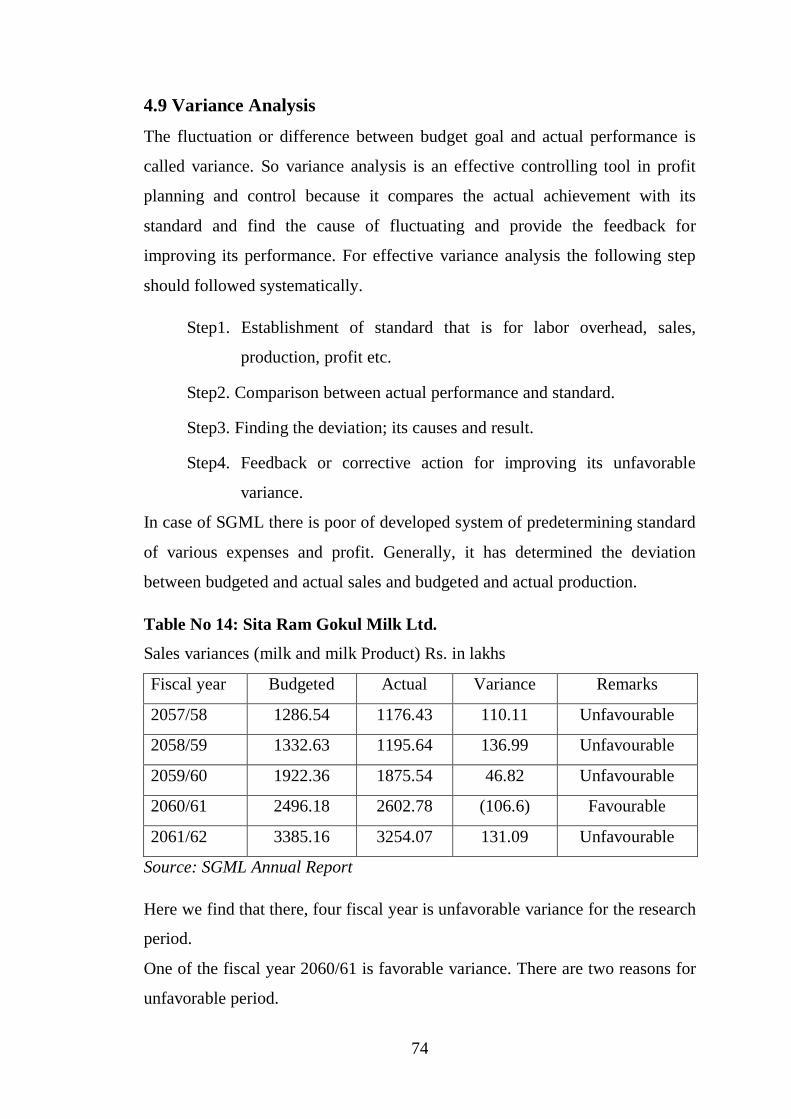
74
4.9 Variance Analysis
The fluctuation or difference between budget goal and actual performance is
called variance. So variance analysis is an effective controlling tool in profit
planning and control because it compares the actual achievement with its
standard and find the cause of fluctuating and provide the feedback for
improving its performance. For effective variance analysis the following step
should followed systematically.
Step1. Establishment of standard that is for labor overhead, sales,
production, profit etc.
Step2. Comparison between actual performance and standard.
Step3. Finding the deviation; its causes and result.
Step4. Feedback or corrective action for improving its unfavorable
variance.
In case of SGML there is poor of developed system of predetermining standard
of various expenses and profit. Generally, it has determined the deviation
between budgeted and actual sales and budgeted and actual production.
Table No 14: Sita Ram Gokul Milk Ltd.
Sales variances (milk and milk Product) Rs. in lakhs
Fiscal year Budgeted Actual Variance Remarks
2057/58 1286.54 1176.43 110.11 Unfavourable
2058/59 1332.63 1195.64 136.99 Unfavourable
2059/60 1922.36 1875.54 46.82 Unfavourable
2060/61 2496.18 2602.78 (106.6) Favourable
2061/62 3385.16 3254.07 131.09 Unfavourable
Source: SGML Annual Report
Here we find that there, four fiscal year is unfavorable variance for the research
period.
One of the fiscal year 2060/61 is favorable variance. There are two reasons for
unfavorable period.
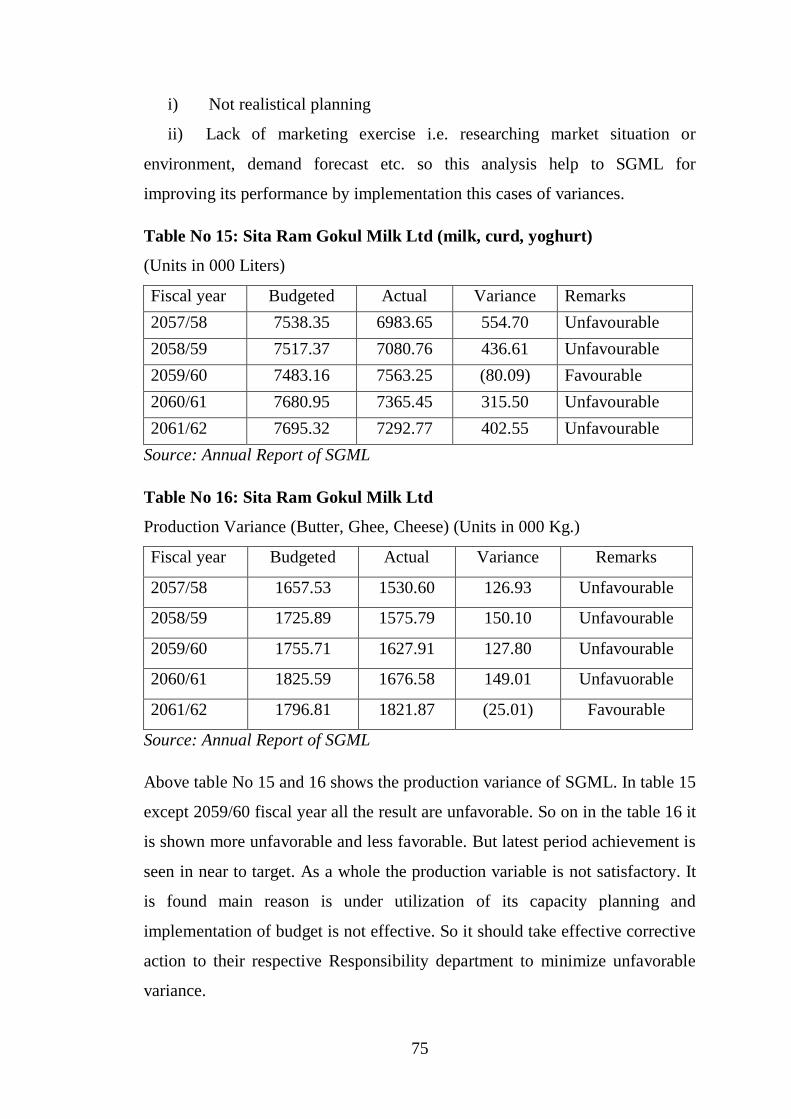
75
i) Not realistical planning
ii) Lack of marketing exercise i.e. researching market situation or
environment, demand forecast etc. so this analysis help to SGML for
improving its performance by implementation this cases of variances.
Table No 15: Sita Ram Gokul Milk Ltd (milk, curd, yoghurt)
(Units in 000 Liters)
Fiscal year Budgeted Actual Variance Remarks
2057/58 7538.35 6983.65 554.70 Unfavourable
2058/59 7517.37 7080.76 436.61 Unfavourable
2059/60 7483.16 7563.25 (80.09) Favourable
2060/61 7680.95 7365.45 315.50 Unfavourable
2061/62 7695.32 7292.77 402.55 Unfavourable
Source: Annual Report of SGML
Table No 16: Sita Ram Gokul Milk Ltd
Production Variance (Butter, Ghee, Cheese) (Units in 000 Kg.)
Fiscal year Budgeted Actual Variance Remarks
2057/58 1657.53 1530.60 126.93 Unfavourable
2058/59 1725.89 1575.79 150.10 Unfavourable
2059/60 1755.71 1627.91 127.80 Unfavourable
2060/61 1825.59 1676.58 149.01 Unfavuorable
2061/62 1796.81 1821.87 (25.01) Favourable
Source: Annual Report of SGML
Above table No 15 and 16 shows the production variance of SGML. In table 15
except 2059/60 fiscal year all the result are unfavorable. So on in the table 16 it
is shown more unfavorable and less favorable. But latest period achievement is
seen in near to target. As a whole the production variable is not satisfactory. It
is found main reason is under utilization of its capacity planning and
implementation of budget is not effective. So it should take effective corrective
action to their respective Responsibility department to minimize unfavorable
variance.
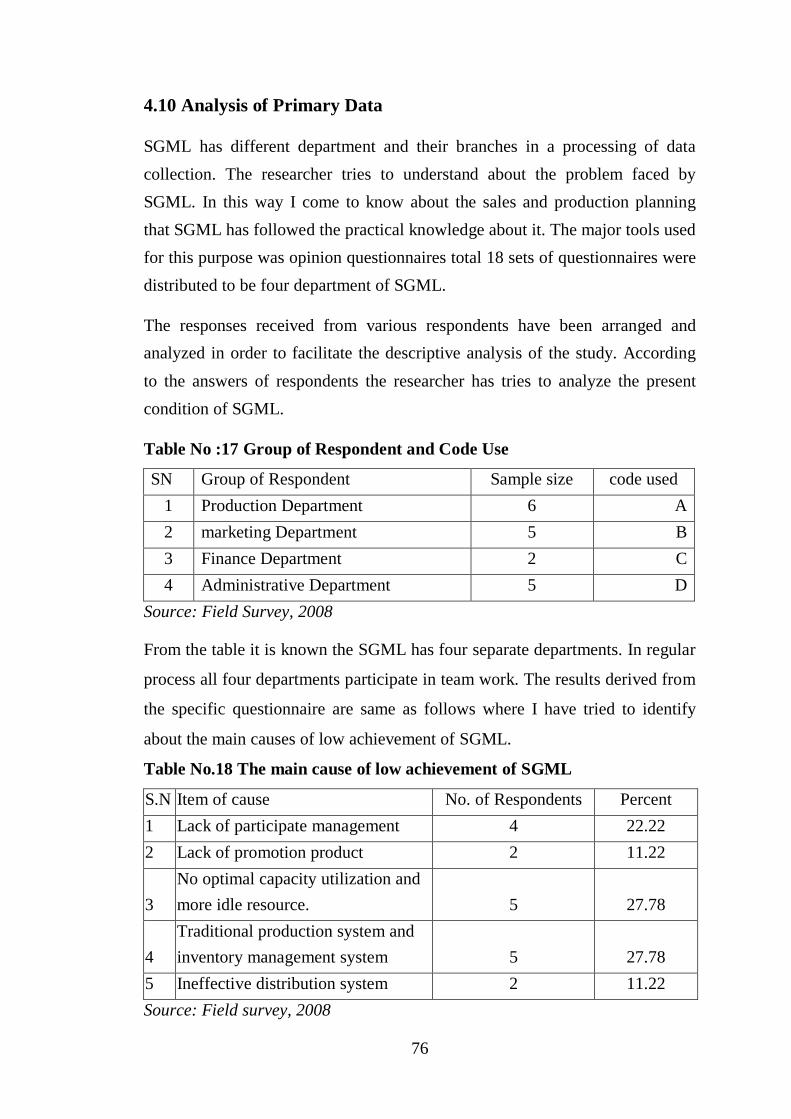
76
4.10 Analysis of Primary Data
SGML has different department and their branches in a processing of data
collection. The researcher tries to understand about the problem faced by
SGML. In this way I come to know about the sales and production planning
that SGML has followed the practical knowledge about it. The major tools used
for this purpose was opinion questionnaires total 18 sets of questionnaires were
distributed to be four department of SGML.
The responses received from various respondents have been arranged and
analyzed in order to facilitate the descriptive analysis of the study. According
to the answers of respondents the researcher has tries to analyze the present
condition of SGML.
Table No :17 Group of Respondent and Code Use
SN Group of Respondent Sample size code used
1 Production Department 6 A
2 marketing Department 5 B
3 Finance Department 2 C
4 Administrative Department 5 D
Source: Field Survey, 2008
From the table it is known the SGML has four separate departments. In regular
process all four departments participate in team work. The results derived from
the specific questionnaire are same as follows where I have tried to identify
about the main causes of low achievement of SGML.
Table No.18 The main cause of low achievement of SGML
S.N Item of cause No. of Respondents Percent
1 Lack of participate management 4 22.22
2 Lack of promotion product 2 11.22
3
No optimal capacity utilization and
more idle resource. 5 27.78
4
Traditional production system and
inventory management system 5 27.78
5 Ineffective distribution system 2 11.22
Source: Field survey, 2008
77
After analysis of the internal condition of SGML it is known that why actual
achievements of SGML i.e. actual sales and actual production are low than
budgeted. There are many problem of SGML. The main problem of SGML is
no optimal capacity utilization and more idea source and traditional production
system and inventory management system which both viewed by 25 percent
respondents. So on 20 percent respondents reply that lack of participative
management and distribution channel it is also a major problem of SGML.
Because of this problem the lower level employs can’t motive. So on lack of
effective promotion and ineffective distribution system also the causes of low
achievement.
In this way after analysis of primary data it is found that main causes of
deviation of budgeted and actual achievement on production and sales.
4.11 Major Findings
1. Demand of milk and milk product in urban area is very high.
2. SGML have no long range (strategic) profit plan objectives are not
SMART, lack of budgeting experts and no effective program to attain
goal.
3. There is lack of participative management and MBO (management by
objectives) in SGML.
4. SGML has not collected all milks offered by the farmer and not able to
provide the loan to the farmer’s requirement.
5. SGML can’t able to its network covered widely.
6. There are other private and public dairies are competiting with SGML.
7. SGML is fully own by the private owner. The government not interferes
for SGML activities.
8. SGML has not applied effective inventory policy but being the more
demand of milk product, there is not problem for over stocking.
9. SGML was suffering from loss on beginning period of research work
but latest period it is operating at gain but possibility of making profit is
more than this if SGML improves its weakness.
10. The gap of actual production and actual sales is high.
78
11. SGML has not practice of statistical tool applied.
12. There is not optimal capacity utilization of machine.
13. There is not find effective motive manpower and lack of manpower
planning.
14. The high deviation of actual sales and BEP sales.
79
Chapter V
SUMMARY, CONCLUSION AND RECOMMENDATIONS
5.1 Summary
Nepal is adopting the mixed economy system “This system is a mix of free and
centrally planned economies where both public and private sector must be
developed. Which helps to economic development and mobilization of
unutilized resources many established manufacturing sector industry face the
numerous problems. These are situation of physical, infrastructure, instability,
lack of capital etc. but now a day the industrial sector developed slowly.
Profit planning is most important tools of management for planning,
implementing and controlling of any business activities. So on sales and
production planning is a basic function of profit planning and control. I have
divided this study in 5 chapters. In first chapter I have studied about SGML and
its objectives, statement of problem, its significant and limitation. In second
chapter I have studied different concepts of PPC and its basic term and I have
studied different research work that has already done. I third chapter I have
studied about the research methodology that how can research made
effectively. In forth chapter, I have studied the budgeted and actual
performance of SGML. The statistical tool like percentage, mean, standard
deviation, variance, correlation used and financial tools like variance analysis,
cost-volume-profit have been used to analyze the data. Lastly, in fifth chapter, I
have studied the result or outcome of 4 chapters i.e. summary, conclusion and
recommendation.
80
5.2 Conclusion
After studying this problem, I have concluded some points that are listed
below.
1. Industrialization is most important factor for economic growth for Nepal
in context of being member of WTO and age of globalization.
2. PPC is most important tools of measuring performance evaluation of
manufacturing enterprises. But many enterprises manager have not
proper knowledge and skill for applying PPC. Which we find out from
SGML.
3. Due to lack of budgeting system; the actual data could not be compared
with the planned for the variable analysis has not been done.
4. SGML has high fixed cost, employee expenses has played the key role
of to increase the administrative fixed cost. Due to high fixed cost
associated with interest and depreciation a BEP sale is very high for the
industry.
5. As a decision making power is concentrated in top-level management,
participative management approach to set the goals is rarely found in the
organization.
6. Under-utilization of capacity has become a big issue for the company.
5.3 Recommendations
After analyzing the overall aspect of SGML, I feel I could suggest for some
recommendation that which will be very useful to SGML for improving it’s
weakness and identifying its opportunities to get success in competitive
environment. To have strategic advantage over the competitions, Nepalese
industries required the various tools of accounting and the relevant aspects
should be analyzed and applied. Sita Ram Gokul Milk (Ktm.) Ltd. has a lot of
potential not only within Kathmandu valley but also in out of valley and
different town. There are various factors/ aspects to be recognized by the
management of the industry. On the basic of the findings of the research study,
81
the following recommendations are given to improve the present condition of
the company.
1. SGML should follow the participative management for planning and
decision making and also applied MBO.
2. The company does not have any practice of budgeting. SGML should
develop budgeting practice which is one of profit planning. SGML
should define short-term and long-term planning and its problems,
strategies, goals, targets etc.
3. SGML should expand the collection and distribution scheme all over the
country. And it should provide the loan for rural poor farmer to keep
cattle.
4. SGML should consider demand of its products market survey at the time
of making plan and it also should consider the price, supply, capacities
and policies of other dairies.
5. SGML is bearing huge amount of fixed cost for employee expenses,
which is not good for the organization. Therefore, the industry should
initiate the cost control program.
6. There should be effective advertising policies to inform about the dairy
product and its quality for consumers.
7. To keep optimal inventory, SGML should applied scientific inventory
system.
8. SGML should consider the break-even analysis at planning time, so on it
should consider variance analysis to find the cause of fluctuation and
correct it.
9. The industry is facing the problem of poor communication among
production, administration technical, marketing department the strong
need of co-ordination among various departments.
10. The performance evaluation system should be established by using
different approaches of management.
11. SGML should consider the sales plan on the time of planning
production. It should co-ordinate between sales and production unit.
82
12. Finally, to strength the competativeness to carry out PPC activities of
the industry, the use of profit planning and controlling tools are
recommended for planning activities tools like budgeting, sales and
production planning analysis etc. it is recommended to analyze cost and
benefit of tools.
83
BIBLIOGRAPHY
Acharya Kashi Raj (2003). Financial Analysis of Daily Development
Corporation. Master Degree Thesis, Shanker Dev Campus.
Bajracharya, B.C. (2055). Business Statistics and Mathematics. Kathmandu:
M.K. Publishers and Distributors.
Bhattarai, D.R. (2061). Management Accounting. Kathmandu: Khanal books
and Stationary.
Bhattarai, Manoj (2062). Business Policy and Strategic Management.
Kathmandu: Dhaulagiri Books and Stationary.
Bhattarai, Tilak (2004). Sales and Production Planning in DDC. Master
Degree Thesis, T.U. Kirtipur.
Dahal Soniya (2002). A Study on Demand and Supply situation of Dairy
products in Kathmandu with reference to Dairy Development
Corporation. Master degree thesis, Shanker Dev Campus.
Dairy Development Corporation (2064). Sinhabalokan.
Dairy Development Corporation, (2006). A Glimps.
Dairy Development Corporation, (2064). Barsik Pratibedan 2063/64.
Dangol, R.M. (2056). Management Accounting. Kathmandu: Taleju Prakashan.
Fago, Ghanendra, (2004). Profit Planning & Control. Kathmandu: Buddha
Academic Publishers & Distributors. Pvt. Ltd.
Fago, Ghanendra, Dhurba P. Subedi, Achyut Gyawali, (2004). Management
Accounting. Kathmandu: Buddha Academic Publishers and Distributors
Pvt. Ltd.
Frenger, James M. (1973). Accounting for Managerial Analysis. Homewood
III: Richard D. Irwan Inc.
84
Guet, Joginder, Ishwor Bhattarai, Akshay Gautam (2063). Budgeting: Profit
Planning and Control. Kathmandu: Smita Books Publishers and
Distributors.
Gupta, S.P. (1990). Statistical Methods. New Delhi: Tata Mc. Graw Hill
Publishing Co.
Gyawali, Achyut (1997). Profit and Sales plans and their Achievement in
DDC with reference to milk production. Master Degree Thesis, T.U.
Kirtipur.
Joshi, P.R. (2001). Research Methodology. Kathmandu: Buddha Academic
Publishers and Distributors Pvt. Ltd.
Joshi, Shyam (2061). Public Enterprises Management. Kathmandu: Taleju
Prakashan.
Kothari, C.R. (2000). Research Methodology: Method and Techniques. New
Delhi: Vishwa Prakashan.
Kushum G.P. and D.K. Shrestha (2005). Business Environment in Nepal.
Kathmandu: Dhavlagiri Books and Stationary.
National Dairy Development Board April (2001). History of Dairy
Development in Nepal.
Pokhrel, Saurav (2064). Samanyagyan Bhandar. Kathmandu: Bidharthi Pustak
Bhandar.
Shrestha, Dr. Smity and Dhurba Prasad Silwal (2057). Statistical Methods in
Management. Kathmandu: Taleju Prakashan.
Shrestha, Jagannath (2050). Production Management. Kathmandu: Taleju
Prakashan.
Subedi Bishwa Raj (2004). A study of milk collection and distribution by the
DDC in Kathmandu. Master degree thesis, T.U. Kirtipur.
Thapa, Pukar (1999). Profit Planning in manufacturing enterprises in Nepal, A
Comparative Study in Dairy Development Corporation and Sitaram
Dairy Industry. Master Degree Thesis, T.U. Kirtipur.

85
Welsch, Glenn A., Ronald W. Hilton and Paul N. Gordon (1990). Budgeting:
Profit Planning and Control. New Delhi: Prentice Hall of India Private
Limited.
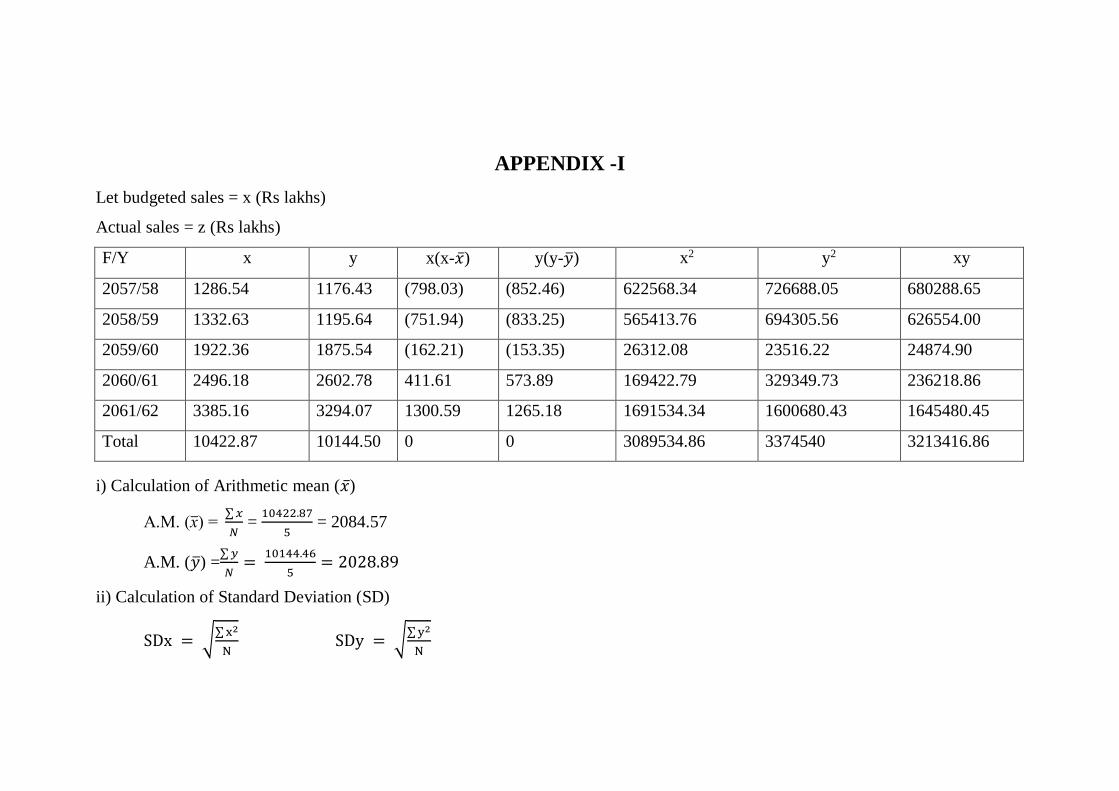
86
APPENDIX -I
Let budgeted sales = x (Rs lakhs)
Actual sales = z (Rs lakhs)
F/Y x y x(x-�̅�) y(y-�̅�) x2 y2 xy
2057/58 1286.54 1176.43 (798.03) (852.46) 622568.34 726688.05 680288.65
2058/59 1332.63 1195.64 (751.94) (833.25) 565413.76 694305.56 626554.00
2059/60 1922.36 1875.54 (162.21) (153.35) 26312.08 23516.22 24874.90
2060/61 2496.18 2602.78 411.61 573.89 169422.79 329349.73 236218.86
2061/62 3385.16 3294.07 1300.59 1265.18 1691534.34 1600680.43 1645480.45
Total 10422.87 10144.50 0 0 3089534.86 3374540 3213416.86
i) Calculation of Arithmetic mean (�̅�)
A.M. (x̅) = ∑ 𝑥
𝑁 =
10422.87
5 = 2084.57
A.M. (�̅�) =∑ 𝑦
𝑁=
10144.46
5= 2028.89
ii) Calculation of Standard Deviation (SD)
SDx = √∑ x2
N SDy = √
∑ y2
N
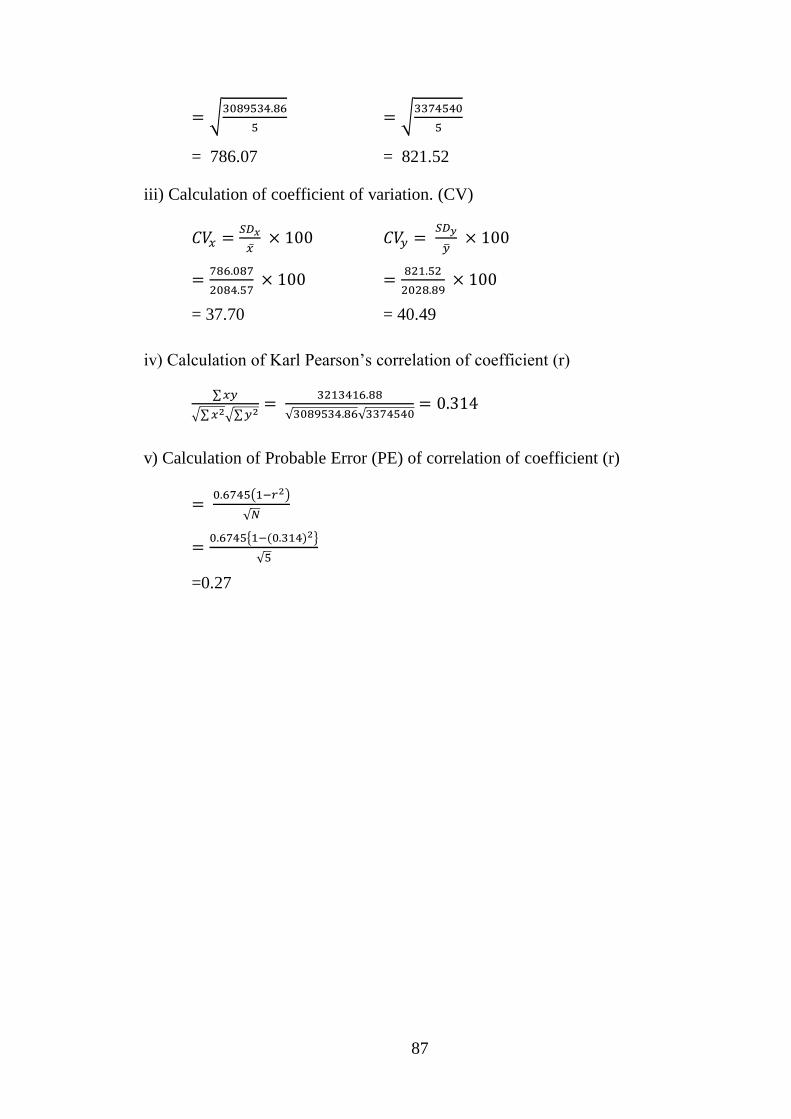
87
= √3089534.86
5 = √
3374540
5
= 786.07 = 821.52
iii) Calculation of coefficient of variation. (CV)
𝐶𝑉𝑥 =𝑆𝐷𝑥
�̅� × 100 𝐶𝑉𝑦 =
𝑆𝐷𝑦
�̅� × 100
=786.087
2084.57 × 100 =
821.52
2028.89 × 100
= 37.70 = 40.49
iv) Calculation of Karl Pearson’s correlation of coefficient (r)
∑ 𝑥𝑦
√∑ 𝑥2√∑ 𝑦2=
3213416.88
√3089534.86√3374540= 0.314
v) Calculation of Probable Error (PE) of correlation of coefficient (r)
= 0.6745(1−𝑟2)
√𝑁
=0.6745{1−(0.314)2}
√5
=0.27
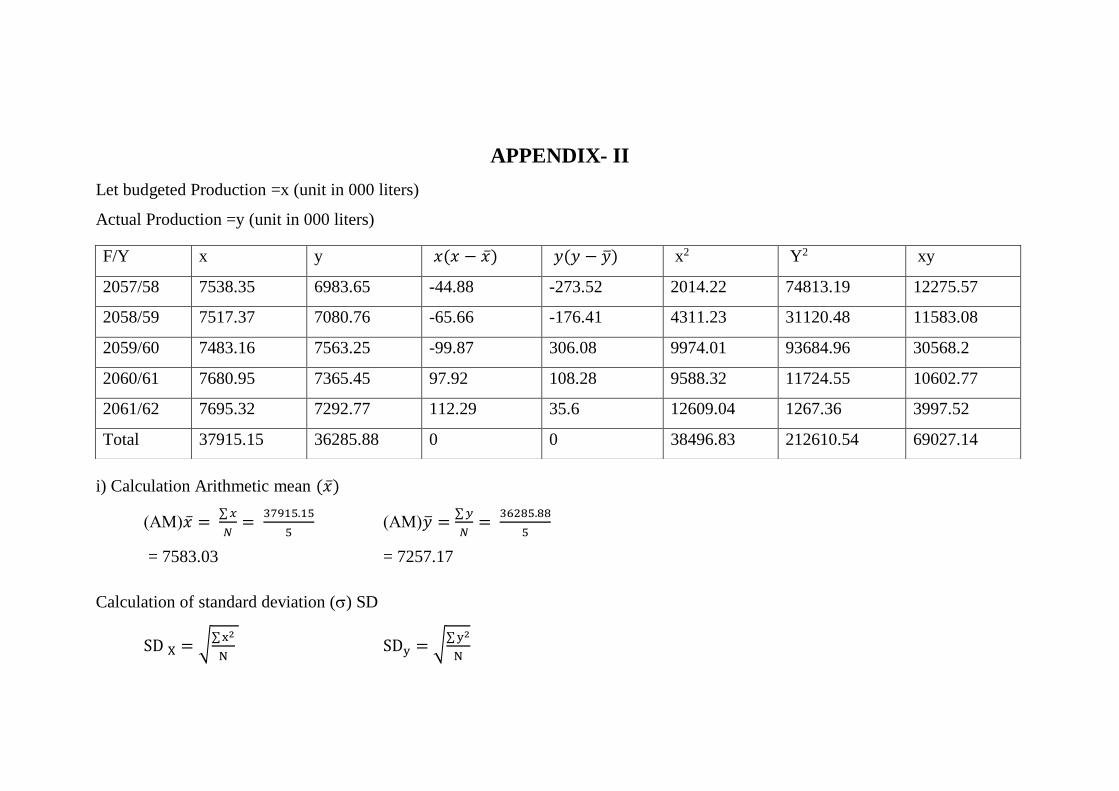
88
APPENDIX- II
Let budgeted Production =x (unit in 000 liters)
Actual Production =y (unit in 000 liters)
i) Calculation Arithmetic mean (�̅�)
(AM)�̅� = ∑ 𝑥
𝑁=
37915.15
5 (AM)�̅� =
∑ 𝑦
𝑁=
36285.88
5
= 7583.03 = 7257.17
Calculation of standard deviation () SD
SD X = √∑ x2
N SDy = √
∑ y2
N
F/Y x y 𝑥(𝑥 − �̅�) 𝑦(𝑦 − �̅�) x2 Y2 xy
2057/58 7538.35 6983.65 -44.88 -273.52 2014.22 74813.19 12275.57
2058/59 7517.37 7080.76 -65.66 -176.41 4311.23 31120.48 11583.08
2059/60 7483.16 7563.25 -99.87 306.08 9974.01 93684.96 30568.2
2060/61 7680.95 7365.45 97.92 108.28 9588.32 11724.55 10602.77
2061/62 7695.32 7292.77 112.29 35.6 12609.04 1267.36 3997.52
Total 37915.15 36285.88 0 0 38496.83 212610.54 69027.14
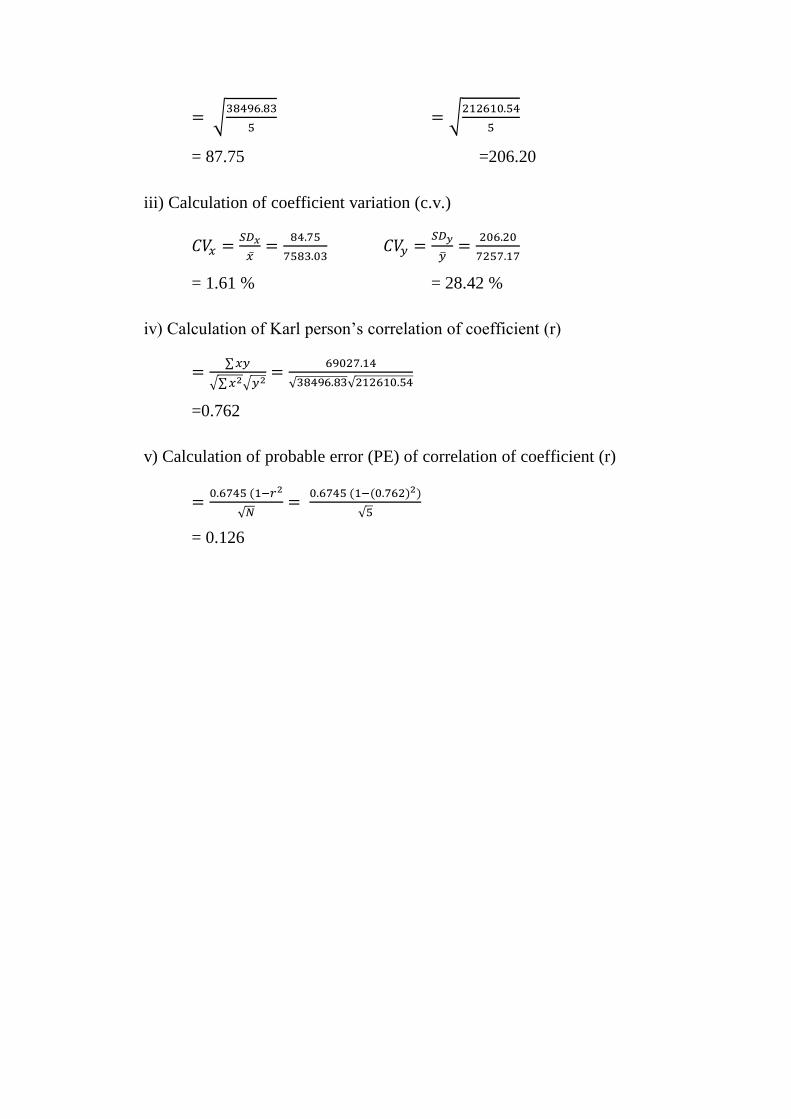
89
= √38496.83
5 = √
212610.54
5
= 87.75 =206.20
iii) Calculation of coefficient variation (c.v.)
𝐶𝑉𝑥 =𝑆𝐷𝑥
�̅�=
84.75
7583.03 𝐶𝑉𝑦 =
𝑆𝐷𝑦
�̅�=
206.20
7257.17
= 1.61 % = 28.42 %
iv) Calculation of Karl person’s correlation of coefficient (r)
=∑ 𝑥𝑦
√∑ 𝑥2√𝑦2=
69027.14
√38496.83√212610.54
=0.762
v) Calculation of probable error (PE) of correlation of coefficient (r)
=0.6745 (1−𝑟2
√𝑁=
0.6745 (1−(0.762)2)
√5
= 0.126
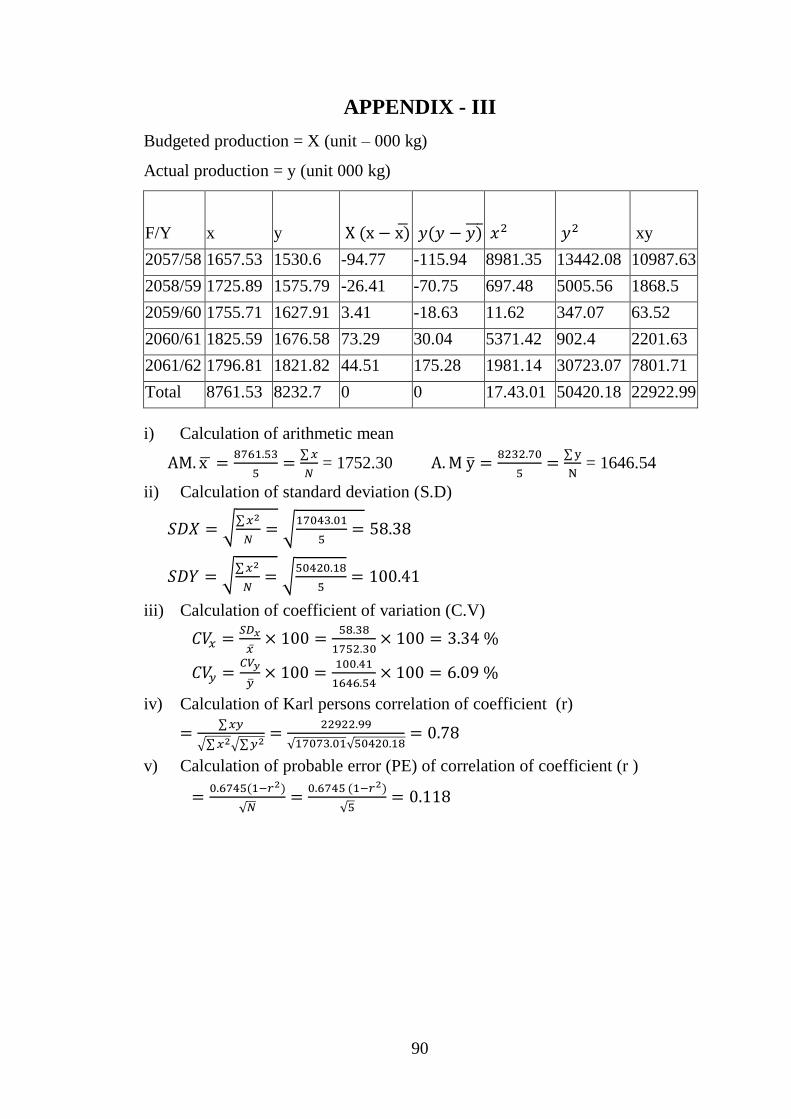
90
APPENDIX - III
Budgeted production = X (unit – 000 kg)
Actual production = y (unit 000 kg)
F/Y x y X (x − x)̅ 𝑦(𝑦 − 𝑦)̅̅ ̅ 𝑥2 𝑦2 xy
2057/58 1657.53 1530.6 -94.77 -115.94 8981.35 13442.08 10987.63
2058/59 1725.89 1575.79 -26.41 -70.75 697.48 5005.56 1868.5
2059/60 1755.71 1627.91 3.41 -18.63 11.62 347.07 63.52
2060/61 1825.59 1676.58 73.29 30.04 5371.42 902.4 2201.63
2061/62 1796.81 1821.82 44.51 175.28 1981.14 30723.07 7801.71
Total 8761.53 8232.7 0 0 17.43.01 50420.18 22922.99
i) Calculation of arithmetic mean
AM. x ̅ =8761.53
5=
∑ 𝑥
𝑁 = 1752.30 A. M y̅ =
8232.70
5=
∑ y
N = 1646.54
ii) Calculation of standard deviation (S.D)
𝑆𝐷𝑋 = √∑ 𝑥2
𝑁= √
17043.01
5= 58.38
𝑆𝐷𝑌 = √∑ 𝑥2
𝑁= √
50420.18
5= 100.41
iii) Calculation of coefficient of variation (C.V)
𝐶𝑉𝑥 =𝑆𝐷𝑥
�̅�× 100 =
58.38
1752.30× 100 = 3.34 %
𝐶𝑉𝑦 =𝐶𝑉𝑦
�̅�× 100 =
100.41
1646.54× 100 = 6.09 %
iv) Calculation of Karl persons correlation of coefficient (r)
=∑ 𝑥𝑦
√∑ 𝑥2√∑ 𝑦2=
22922.99
√17073.01√50420.18= 0.78
v) Calculation of probable error (PE) of correlation of coefficient (r )
=0.6745(1−𝑟2)
√𝑁=
0.6745 (1−𝑟2)
√5= 0.118
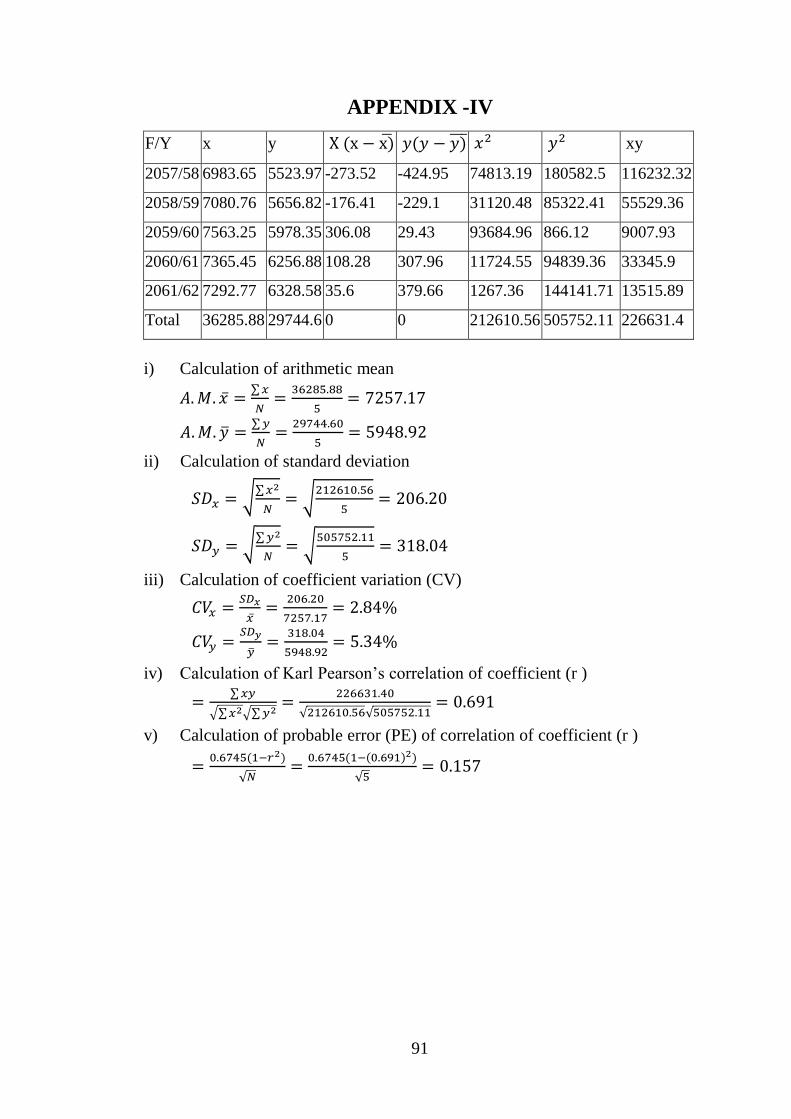
91
APPENDIX -IV
F/Y x y X (x − x)̅ 𝑦(𝑦 − 𝑦)̅̅ ̅ 𝑥2 𝑦2 xy
2057/58 6983.65 5523.97 -273.52 -424.95 74813.19 180582.5 116232.32
2058/59 7080.76 5656.82 -176.41 -229.1 31120.48 85322.41 55529.36
2059/60 7563.25 5978.35 306.08 29.43 93684.96 866.12 9007.93
2060/61 7365.45 6256.88 108.28 307.96 11724.55 94839.36 33345.9
2061/62 7292.77 6328.58 35.6 379.66 1267.36 144141.71 13515.89
Total 36285.88 29744.6 0 0 212610.56 505752.11 226631.4
i) Calculation of arithmetic mean
𝐴. 𝑀. �̅� =∑ 𝑥
𝑁=
36285.88
5= 7257.17
𝐴. 𝑀. �̅� =∑ 𝑦
𝑁=
29744.60
5= 5948.92
ii) Calculation of standard deviation
𝑆𝐷𝑥 = √∑ 𝑥2
𝑁= √
212610.56
5= 206.20
𝑆𝐷𝑦 = √∑ 𝑦2
𝑁= √
505752.11
5= 318.04
iii) Calculation of coefficient variation (CV)
𝐶𝑉𝑥 =𝑆𝐷𝑥
�̅�=
206.20
7257.17= 2.84%
𝐶𝑉𝑦 =𝑆𝐷𝑦
�̅�=
318.04
5948.92= 5.34%
iv) Calculation of Karl Pearson’s correlation of coefficient (r )
=∑ 𝑥𝑦
√∑ 𝑥2√∑ 𝑦2=
226631.40
√212610.56√505752.11= 0.691
v) Calculation of probable error (PE) of correlation of coefficient (r )
=0.6745(1−𝑟2)
√𝑁=
0.6745(1−(0.691)2)
√5= 0.157
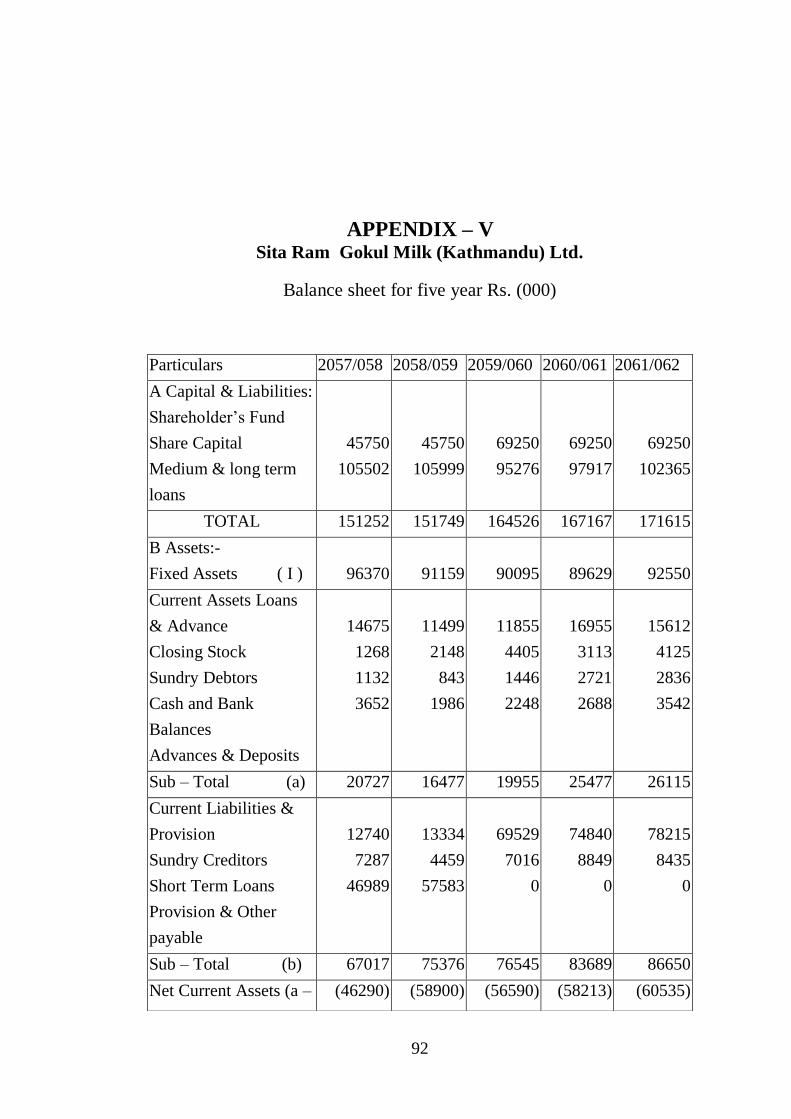
92
APPENDIX – V Sita Ram Gokul Milk (Kathmandu) Ltd.
Balance sheet for five year Rs. (000)
Particulars 2057/058 2058/059 2059/060 2060/061 2061/062
A Capital & Liabilities:
Shareholder’s Fund
Share Capital
Medium & long term
loans
45750
105502
45750
105999
69250
95276
69250
97917
69250
102365
TOTAL 151252 151749 164526 167167 171615
B Assets:-
Fixed Assets ( I )
96370
91159
90095
89629
92550
Current Assets Loans
& Advance
Closing Stock
Sundry Debtors
Cash and Bank
Balances
Advances & Deposits
14675
1268
1132
3652
11499
2148
843
1986
11855
4405
1446
2248
16955
3113
2721
2688
15612
4125
2836
3542
Sub – Total (a) 20727 16477 19955 25477 26115
Current Liabilities &
Provision
Sundry Creditors
Short Term Loans
Provision & Other
payable
12740
7287
46989
13334
4459
57583
69529
7016
0
74840
8849
0
78215
8435
0
Sub – Total (b) 67017 75376 76545 83689 86650
Net Current Assets (a – (46290) (58900) (56590) (58213) (60535)
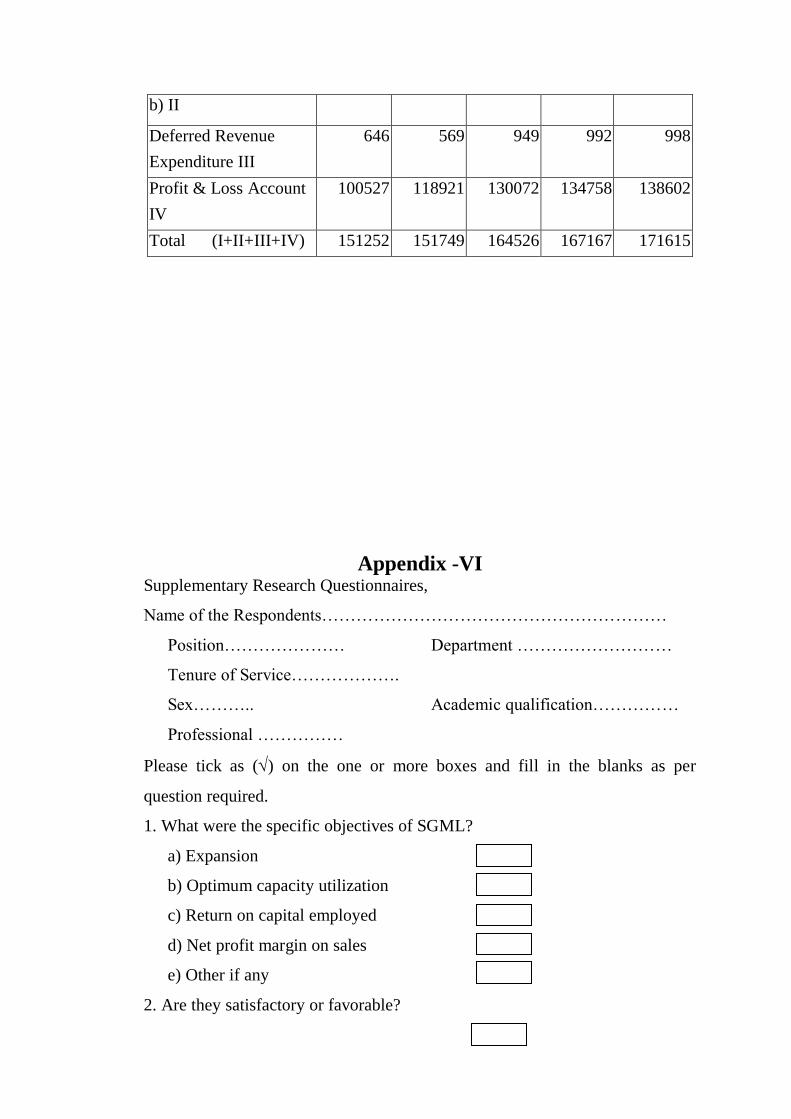
93
Appendix -VI Supplementary Research Questionnaires,
Name of the Respondents……………………………………………………
Position………………… Department ………………………
Tenure of Service……………….
Sex……….. Academic qualification……………
Professional ……………
Please tick as () on the one or more boxes and fill in the blanks as per
question required.
1. What were the specific objectives of SGML?
a) Expansion
b) Optimum capacity utilization
c) Return on capital employed
d) Net profit margin on sales
e) Other if any
2. Are they satisfactory or favorable?
b) II
Deferred Revenue
Expenditure III
646 569 949 992 998
Profit & Loss Account
IV
100527 118921 130072 134758 138602
Total (I+II+III+IV) 151252 151749 164526 167167 171615
94
Yes. No.
3. Would you state of the main cause of low achievement? If any please give
some reason.
a)………………………………………………………………………
………………………………………………………………………
b)………………………………………………………………………
………………………………………………………………………
c)………………………………………………………………………
………………………………………………………………………
d)………………………………………………………………………
………………………………………………………………………
4. Would you maintain the financial position of SGML?
a) Very good b) good
c) Satisfactory d) poor
5. If poor, would you mention the cause?
a) ……………………… b)……………………
c) …………………… d)……………………
6. What management systems are applied in SGML in phase of planning,
decision making and controlling?
a) Participated management
b) Management by objectives
c) Centralize Decision
d) Autocratic management
7. On what basis sales and production budget is prepared?
a) Long range b) short range
8. Who are responsible for preparing sales plan?
a)…………………………… b)………………………………
c)…………………………… d)………………………………
9. What pricing methods are accepted?
a) Cost plus pricing
b) Marginal pricing
c) Other methods
95
10. How does SGML sales its product?
a) Cash
b) Credit
c) Both
11. What is the distribution channel of SGML?
a) Producer - Costumers
b) Booth man - Costumer
c) Producer - Wholesaler - Retailer - Consumer
d) Producer - Agent - Wholesaler - Retailer - Consumer
12. What are the promotion mix used by SGML to inform its Product and its
quality to consumer?
a) Advertisement b) Sales Promotion
c) Personal selling d) Publicity
13. What are the main problems in production process by SGML?
a) Old machinery b) Process able Raw material
c) Not excellent workers d) Old management system
14. What are the SGML products?
a)………………………… b)………………………….
c)………………………… d)…………………………
e)…………………………. f)…………………………
15. What inventory policy has been adopted?
Raw material Finished Goods stock
a) Stable a) Stable
b) Fluctuating b) Fluctuating
c) Average c) Average
16. Which production policy has been adopted?
a) Seasonal b) Flexible
c) Stable d) Other
17. From which market raw milk is purchased?
a) Farmers b) Domestic market
18. What is the wages payment system?

96
a) Time basis b) work basis
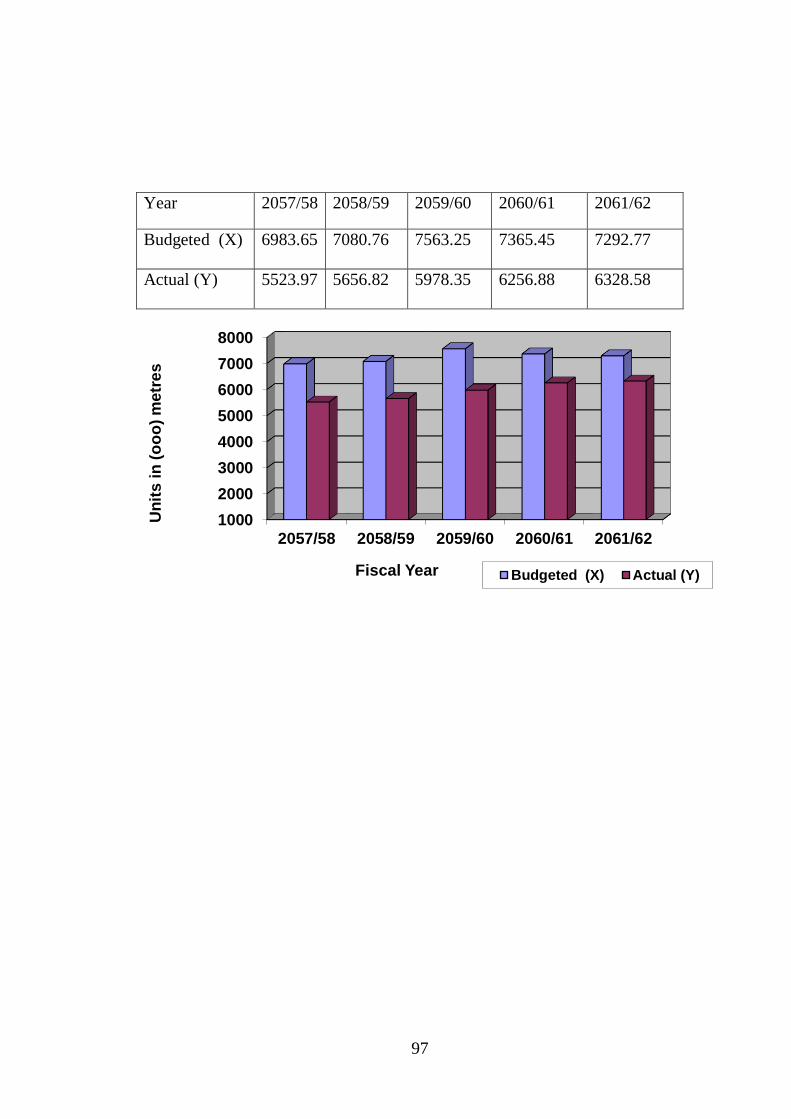
97
Year 2057/58 2058/59 2059/60 2060/61 2061/62
Budgeted (X) 6983.65 7080.76 7563.25 7365.45 7292.77
Actual (Y) 5523.97 5656.82 5978.35 6256.88 6328.58
1000
2000
3000
4000
5000
6000
7000
8000
2057/58 2058/59 2059/60 2060/61 2061/62
Un
its
in
(o
oo
) m
etr
es
Fiscal Year Budgeted (X) Actual (Y)


