Embed Size (px)
Citation preview
& & RELATIONSHIP BETWEEN ORAL HEALTH STATUS MARITAL QUALITY AND WORK STRESS.
by
Wagner Segura Marcenes
A report submitted for the degree of Doctor of Philosophy in the Faculty of Medicine of the
University of London
Department of Community Dental Health and Dental Practice,
University College of London 66-72 Gower Street,London WC1E 6EA.
December 1990

ProQuest Number: 10797684
All rights reserved
INFORMATION TO ALL USERS The quality of this reproduction is dependent upon the quality of the copy submitted.
In the unlikely event that the author did not send a com p le te manuscript and there are missing pages, these will be noted. Also, if material had to be removed,
a note will indicate the deletion.
uestProQuest 10797684
Published by ProQuest LLC(2018). Copyright of the Dissertation is held by the Author.
All rights reserved.This work is protected against unauthorized copying under Title 17, United States C ode
Microform Edition © ProQuest LLC.
ProQuest LLC.789 East Eisenhower Parkway
P.O. Box 1346 Ann Arbor, Ml 48106- 1346

To Guiomar (in memorium), Dalton and Wilson.
2
ABSTRACTThis study aims to investigate whether oral health
status is associated with work stress and marital quality. The term stress was applied to define the stimuli themselves and not to the body reaction in response to a variety of physical or psychological stimuli. Marital quality is defined as the subjective evaluation of a married couple's relationship on a number of dimensions and evaluations (Spanier and Lewis, 1980).
The hypothesis is that a given set of psychosocial factors, if favourable, will predispose family members to oral health, or alternatively, if unfavourable, will predispose to oral disease. It is hypothesised that families whose members experienced high levels of communication, companionship, and satisfaction with the partner and children are more likely to show better oral health status than families whose members experienced low levels of communication, companionship and satisfaction with the partner and children. In adition, fathers who experienced low levels of stress at work tend to have a better oral health status than fathers who experienced high levels of stress at work.
The study was conducted in Belo Horizonte, Brasil. 164 families, equally distributed over four socio-economic groups, were randomly selected from children from private and state schools. The parents' age ranged from 35 to 44 years old. Each family had a child aged 13 years old.
Data were analysed using multiple regression analysis
3
(dental caries data) and logistic regression analysis (periodontal data). Age, socio-economic status, gender, dental attendance, toothbrushing frequency, sugar consumption and type of toothpaste were considered in the analysis.
The results showed a highly significant linear relationship between marital quality and the father's, mother's and child's dental caries status. Work related mental demand, work control, and work variety were not significantly associated with fathers' dental caries status. A significant relationship between periodontal health status and marital quality was found for fathers and mothers and a significant relationship between work related mental demand and fathers' periodontal health status was also found.
It was concluded that marital quality is an important determinant of oral health status - dental caries and periodontal disease - and that work related mental demand is an important determinant of periodontal health status.
4
CONTENTS PAGEABSTRACT 3CHAPTER is LITERATURE REVIEW 101.1. Family, marital quality and health 111.2. Work stress and health 211.3. Aims and objectives 30CHAPTER 2 : RESEARCH DESIGN 332.1. Geographic location of the study 332.2. Pilot study 332.2.1. Description 3 32.2.2. Response rate 362.2.3. Discussion 362.3. Main study population 412.3.1. Sample selection methods 432.3.2. Response rate 482.4. Data collection 492.4.1. Social, economical, psychological and behavioural data 502.4.2. Clinical data 522.5. Data analysis 532.5.1. Statistical method 532.5.2. Construction of measures 562.5.2.1. Marital quality measurement 562.5.2.2. Work stress measurement 672.5.3. Outcome Variables 762.5.3.1. Dental caries status indicators 762.5.3.2. Periodontal health status indicator 782.5.4. Confounding variables 792.6. Consistency of interviews and clinical exams 812.6.1. Consistency of interviews 812.6.2. Consistency of clinical exams 822.7. Research team personnel 83CHAPTER 3 : FINDINGS, DISCUSSION AND CONCLUSIONS 853.1. Descriptive data 853.2. Marital quality, work stress and dental caries status 933.2.1. Marital quality, work stress and fathers' dental caries status 933.2.2. Marital quality and mothers' dental cariesstatus 1093.2.3. Marital quality and the 13-year-old children's dental caries status 1173.3. Marital quality, work stress and periodontalhealth status 1253.3.1. Marital quality, work stress and fathers' periodontal health status 1263.3.2. Marital quality and mothers' periodontal health status 129
5
3.4. Discussion3.5. Summary and conclusion3.6. Implication for further researchesACKNOWLEDGEMENTSREFERENCESAPPENDICESAppendix 1: Development of questionnaires Appendix 2: Clinical dataAppendix 3: Aba-Abipeme criterion of socio-economic classificationAppendix 4: List of schools selected and number of studentsAppendix 5: Consistency of clinical examinations Appendix 6: Social characteristics of the sample Appendix 7: Identification questionnaire Appendix 8: Parents questionnaire - part 1.Appendix 9: Parents questionnaire - part 2.Appendix 10: 13-year-old children questionnaire Appendix 11: Siblings questionnaire Appendix 12: Oral health assessment formLIST OF TABLESTable 2.5.2.1.1. Correlation between self-reported answers to five marital quality questions by fathers Table 2.5.2.1.2. Correlation between self-reported answers to five marital quality questions by mothers Table 2.5.2.2.1. Correlation between self-reported answers to 10 questions about work characteristics, by fathers.Table 2.5.2.2.2. Results of principal components analyses after rotation using varimax method to 10 questions about work characteristics of fathers. Table 2.5.4.1. Model constructed to study the relationship between marital quality and work stress, and caries status.Table 2.5.4.2. Model constructed to study the relationship between marital quality and work stress, and periodontal health status.Table 3.1.1. Frequency distribution of marital quality in sample: 164 families.Table 3.1.2. Frequency distribution work related mental demand, work control and work variety in sample: 164 fathers.Table 3.1.3. Frequency distribution of socio-economic groups, dental attendance, type of toothpaste, last visit to the dentist and periodontal health status in sample: 164 families.Table 3.1.4. Mean, minimum, quartiles and maximum values of age, toothbrushing frequency, sugar consumption, DMFS, number of sound tooth surfaces,
6
132152156160161173173189200203206209223229253282303312
6566
74
75
80
8188
88
89
I
T-Health, proportion of teeth with gums bleeding after probing and proportion of teeth with pockets: 164 adult males (fathers).Table 3.1.5. Mean, minimum, quartiles and maximum values of age, toothbrushing frequency, sugar consumption, DMFS, number of sound tooth surfaces, T-Health, proportion of teeth with gumis bleeding after probing and proportion of teeth with pockets: 164 adult females (mothers).Table 3.1.6. Mean, minimum, quartiles and maximum values of toothbrushing frequency, sugar consumption, DMFS, number of sound tooth surfaces, T-Health, proportion of teeth with gums bleeding after probing and proportion of teeth with pockets: 164 male and female children (13-year-old children).Table 3.2.1.1. Correlation matrix of age, socioeconomic status, toothbrushing frequency, sugar consumption, dental attendance, type of toothpaste, marital quality, work related mental demand, work control, work variety, DMFS, number of sound tooth surfaces and T-Health indicator: sample of 164 fathers.Table 3.2.1.2. Statistics of the variables selected to be in the regression equation after backward elimination (outcome variable: DMFS): sample of 164 fathers.Table 3.2.1.3. Statistics of the variables selected to be in the regression equation after backward elimination (outcome variable: number of sound tooth surfaces): sample of 164 fathers.Table 3.2.1.4. Statistics of the variables selected to be in the regression equation after backward elimination (outcome variable: T-Health indicator): sample of 164 fathers.Table 3.2.1.5. Difference in the fathers' DMFS depending marital quality, sugar consumption, socioeconomic groups and age.Table 3.2.2.1. Correlation matrix of age, socioeconomic status, toothbrushing frequency, sugar consumption, dental attendance, type of toothpaste, marital quality, work related mental demand, work control, work variety, DMFS, number of sound tooth surfaces and T-Health indicator: sample of 164 mothers.Table 3.2.2.2. Statistics of the variables selected to be in the regression equation after backward elimination (outcome variable: DMFS): sample of 164 mothers.Table 3.2.2.3. Statistics of the variables selected to be in the regression equation after backward elimination (outcome variable: number of sound tooth surfaces): sample of 164 mothers.Table 3.2.2.4. Statistics of the variables selected to be in the regression equation after backward elimination (outcome variable: T-Health indicator):
90
91
92
106
107
107
108
108
114
115
115
7
sample of 164 mothers.Table 3.2.2.5. Difference in the mothers' DMFS depending on marital quality and socio-economic status.Table 3.2.3.1. Correlation matrix of gender, socioeconomic status, toothbrushing frequency, sugar consumption, dental attendance, type of toothpaste, marital quality, DMFS, number of sound tooth surfaces and T-Health indicator: sample of 164 the 13-year- old children.Table 3.2.3.2. Statistics of the variables selected to be in the regression equation after backward elimination (outcome variable: DMFS): sample of 164 13-year-old children.Table 3.2.3.3. Statistics of the variables selected to be in the regression equation after backward elimination (outcome variable: number of sound tooth surfaces): sample of 164 13-year-old children.Table 3.2.3.4. Difference in the 13-year-old children's DMFS depending on marital quality and sugar consumption.Table 3.3.1.1. Maximum likelihood fit of a logistic regression model with marital quality, work related mental demand and socio-economic status on 155 fathers - odds ratios, 95% confidence interval and significance level.Table 3.3.2.1. Maximum likelihood fit of a logistic regression model with marital quality, socio-economic status and dental attendance on 155 mothers - odds ratio, 95% confidence interval and significance level.
LIST OF TABLES (APPENDICES)Table AP3.1. Indicators used by the Aba-Abipeme criterion of socio-economic classification and the number of points assigned to each indicator: resources.Table AP3.2. Indicators used by the Aba-Abipeme criterion of socio-economic classification and the number of points assigned to each indicator: educational level of the head of the family.Table AP3.3. Socio-economic groups definition and the final score assigned to each of them.Table AP3.4. Socio-economic groups distribution in the cities of Sao Paulo and Rio de Janeiro.Table AP6.1. Social characteristics: Family distribution according to socio-economic groups and area of residence.Table AP6.2. Social characteristics: level of education of parents, by socio-economic groups. Table AP6.3. Social characteristics: level of education of parents, by socio-economic groups and gender.
116
116
121
122
122
122
129
130
201
201202202
210213
214
8
Table AP6.4. Social characteristics: family distribution, by income and socio-economic groups. Table AP6.5. Social characteristics: distribution of working mothers, by socio-economic groups.Table AP6.6. Social characteristics: number of children per family, by socio-economic groups.Table AP6.7. Social characteristics: age distribution of siblings.Table AP6.8. Social characteristics: distribution of children, by gender.
217218219220 221
9
CHAPTER 1
LITERATURE REVIEW
INTRODUCTIONThere is an increasing recognition that disease is
psychosocial in origin. It is estimated that 60 to 90 percent of visits to health-care professionals result from stress-related disorders (Brodsky, 1989). However, there is little knowledge about whether psychosocial factors predispose people towards contracting oral disease, and how these factors may affect oral health. In exploring the aetiologic factors which might contribute to the explanation of oral disease occurrence, researchers have concentrated on the biological and behavioural causes of dental caries and periodontal disease. Extensive research has been carried out in these areas, but a significant proportion of oral disease occurrence remains unexplained. This may be because important explanatory variables, such as psychosocial factors, have not been taken into account. In fact, oral disease aetiology is a complex process that involves biological, behavioural, social and possibly psychological factors. Nevertheless, researchers are far from identifying all psychosocial factors which affect oral health status and from developing an integrated framework which explains the differences and similarities in oral health status among different groups in the population. Thus, further studies on this area are
10
necessary.Assuming that the three major sectors in the life of an
adult man and woman are family, work and leisure (Haavio- Mannila, 1971), their potential effect on oral health should be studied. The following literature review will deal with two of these sectors of people's life: family and work.
1.1. FAMILY, MARITAL QUALITY AND HEALTHIt is well known that there is a marked tendency for
members of the same family to experience similar patterns of oral health. In the 1940s, a series of classical studies published by Klein showed that similar oral health patterns occurred in members of the same family (Klein and Palmer, 1940; Klein and Shimizu, 1945; Klein, 1946;Klein, 1947).
In a study of the dental caries status of brothers and sisters of two selected groups of children, one composed of relatively caries-immune children and the other of relatively high caries-susceptible children, Klein and Palmer (1940) showed that brothers and sisters of susceptible children had over twice as many caries in both the permanent and deciduous teeth as did brothers and sisters of the immune children. Klein and Shimizu (1945) also showed that there is an association between dental caries experience of husbands and their wives, and suggested that this similarity is due to persons who have
11
high levels of dental caries tending to marry persons who also have high levels of dental caries. Klein (1946), in a further study, compared dental disease experience in parents and offspring, and showed a consistent tendency for children to reflect, in their own caries experience rates, the DMF experience already demonstrated by their parents. Moreover, exposure to ah environmental factor such as fluoride in drinking water reduced the amount of caries attack, but was not sufficient to obscure the influence of the familial factor (Klein, 1947).
More recently, other authors have confirmed Klein's findings. Ringelberg et al (1974) revived and repeated Klein's studies of familial immunity to dental caries locating families that took part in the original Klein studies. In addition, they tested whether children's experience of caries was similar to that their parents' experience in their childhood and if the familial aggregation in dental caries experience persisted through three generations of families (Ringelberg et al, 1974). The results confirmed that children's DMFS were significantly more similar within families than between families, and that children's DMFS was associated significantly with the DMFS scores of their parents. A tendency for children to reflect more closely their mothers' DMFS than their fathers' DMFS was also reported. However, no significant association was found between the DMFS scores of children and the DMFS scores of their parents during their childhood or with the DMFS scores of their grandparents. Finally, a
12
significant merging of a married pair's scores for dental caries was shown after marriage.
Beck and Drake (1975) compared members of the same household with individuals of the same age, race, sex and socio-economic status who were drawn at random and placed in artificially created household groups. They found that husband and wives, as well as parents and children, were more alike in their caries patterns than the members of the artificially created household. Nevertheless, the difference in the number of families where the children were more like the mother than the father was not statistically significant. Garn et al (1976) have also shown parent-child similarities in dental caries experience and corroborated the findings that mother-child similarities in the DMFT scores are higher than father- child similarities. Garn et al (1977) observed that husband and wife have similarities in dental caries experience. Martinsson and Petersson (1972) compared the dental condition of parents of a group of children with high and low caries frequency and reported considerable differences in dental condition. The most evident difference was the total loss of teeth, 31.6% of fathers and 36.3% of mothers of high caries frequency children compared with 6.9% of fathers and 9.8% of mothers of low caries frequency children. For parents with natural teeth, the parents of children with low caries scores presented a smaller mean number of teeth, a higher percentage of
13
endodontically treated teeth and periapical osteitis, a higher gingival index, and, though less marked, a higher mean number of restored and carious tooth surfaces, and a higher distal alveolar bone score. Shaw and Murray (1980) compared the caries status of the parents and siblings of a group of caries-resistant and caries-susceptible children and reported that only 11% of parents of the caries- resistant children were edentulous compared with 37% of parents of caries-susceptible children. Moreover, the mean DMFS scores of dentate parents of caries-resistant children was 43.6 and the mean DMFS scores of dentate parents of caries-susceptible children was 64.2. Comparing siblings, the mean DMFS score was 7.6 and 21.3 for siblings of caries-resistant and caries-susceptible children.
This review of the literature has shown rather conclusively a marked and consistent tendency for members of the same family to experience similar patterns of oral health. Nonetheless, there is no satisfactory explanation for the aggregation of oral disease within families.
Klein (1946) stated that the remarkably consistent way in which the DMF experience of offspring is related to the DMF levels of parents makes it difficult to exclude the view that dental disease susceptibility in children involves strong familial vectors which are very likely have a genetic basis, perhaps sex-linked. In fact, the genetic explanation should not be discarded. Nevertheless, it does not explain completely the similarities found, for example, the husband-wife similarities. Klein (1945) justified the
14
husband-wife similarity arguing that the well-to-do tend to marry one another. Thus, those who have better opportunities for dental care, and therefore have fewer decayed, missing and filled teeth, tend to marry people who have the same opportunities and, thus with a similar pattern of dental caries.
For further elucidation of this problem, Mansbridge (1959) compared similarities in dental caries-experience of monozygous and dizygous twins, as well as between unrelated pairs of children and between each type of twin. The results showed that resemblance in caries-experience between identical twins is greater than between fraternal twins, and that the unrelated pairs of children showed less resemblance than either type of twin. It was concluded that, while environmental factors clearly constitute a major factor in the aetiology of dental disease, genetic factors may also contribute to the causation of this disease.
The major influence of the environment is supported by the significant merging of dental caries-experience of partners after marriage (Ringelberg et al, 1974).Ringelberg et al (1974) suggested that the role of oral bacteria is an important factor in producing similar caries-experience within families through a similar type of cariogenic oral flora in the mouths of family members. Nevertheless, cariogenic bacteria are not the only determinant of oral disease. The interplay between the
15
human being and micro-organisms can result in disease or be compatible with the maintenance of health, depending upon the environmental circumstances under which the encounter between them takes place (Dubos, 1980, p. 193). The other factors mentioned, such as consumption of a similar diet, similar amount of dental treatment received, similar oral hygiene and fluoride use may explain husband-wife similarities in dental caries status. Finally, the indirect effects of genetic factors such as similar form of teeth, similar tooth spacing, similar resistence and the possibility that a type of immune-response which resists cariogenic organisms may be passed down from parent to child should not be discounted in explaining similar caries-experience within families (Ringelberg et al,1974) .
For further elucidation of this question, Shaw and Murray ( 1980 ) conducted a study in which they assessed not only the caries status of caries-resistant and caries- susceptible children's families but also their dietary, toothbrushing and dental attendance habits, and observed that, despite showing a significant difference in dental caries experience between the two groups, no significant differences in diet, toothbrushing frequency and dental attendance were found. Shaw and Murray ( 1980 ) stated that these results discredit the hypothesis that similarities are due to sharing the same diet, oral hygiene and dental attendance, and suggested that genetic factors or other factors not assessed may play a significant role in the
16
caries process.Taking into account all the causative factors
mentioned, family similarities in dental caries led researchers into the areas of genetics, bacteriology, nutrition and immunology. Nevertheless, little attention has been paid to the psychosocial environment shared by family members.
The lack of a satisfactory explanation for the aggregation of dental caries within families reflects a gap in knowledge on caries aetiology and justifies further studies of the role of the family in oral health status. Furthermore, it seems that other factors related to the environment shared by members of the same family should be studied. That is not to say that nutritional, genetic, bacteriological, and immunological factors do not affect oral health, but that psychosocial factors may also play a role in oral disease aetiology.
Osterberg, Hedegard and Sater (1983) studied the variation in dental health status of 70-year-old men and women, and pointed out that married men tend to have a better level of oral health than other men, while the reverse was true for women. Hunt et al (1985) reported that married people consistently had a lower edentulism rate than did unmarried people in the same age and educational group. Moreover, they confirmed previous findings that husbands and wives had a similar dental status (Hunt et al, 1985).
17
These findings are in accordance with the medical literature, since the overwhelming majority of the comparisons between the married and the unmarried people showed that married people were happier, in better mental and physical health, less inclined to suicide and had lower mortality rates than the unmarried people (Crago, 1972; Verbrugge, 1979; Bloom, Asher and White, 1978; Doherty and Jacobson, 1982; Gove, Hughes and Style, 1983).
These differences between married and unmarried people may indicate that there are some factors related to the marriage that influence health.
Zeldow and Pavlou (1984) studied out-patients with diagnosed multiple sclerosis and reported that marriage appears to serve as a buffer in preserving a sense of wellbeing in the face of both physical disability and life stress. In fact, marriage can function as a protective barrier against the distressful consequences of external threats. Marriage does not prevent economic and social problems from invading life, but it apparently can help people fend off the psychological assaults that such problems otherwise create, that is, marriage protects people from the full impact of external strains (Pearlin and Johnson, 1977, p. 714).
Despite the fact that dental researchers have studied the incidence and prevalence of dental caries within the family and the effect of marital status on oral health status, none of them have attempted to assess the effect of the quality of marriage. However, medical researchers have
18
reported that it is not marriage per se, but the quality of marriage which is related to health (Renne, 1971, 1977? Gove, Hughes and Style, 1983). Renne (1971, 1977) found that people who are dissatisfied with their marriages were in poorer health than were most people in the various unmarried statuses. She reported that people who had an unhappy marriage were more susceptible than happily married people and divorced people to have physical and psychological health problems. Moreover, if the data were handled in the same way as other studies did (by marital status), married people would have shown better health than divorced people. Similar results were reported by Gove, Hughes and Style (1983). They reported that marital status was a powerful predictor of mental health. Furthermore, they observed that unhappily married people were in poorer mental health than people in any other unmarried categories (never married, widowed and divorced). Gove, Hughes and Style (1983) suggested that the relationship between marital status and health appears because the vast majority of respondents described their marriages as happy (Gove, Hughes and Style, 1983). This explanation finds support in Renne's data (1971, 1977) where only one marriage in five was unhappy. v
Several medical researchers have shown a significant relationship between marital satisfaction and physical and mental health status (Aved, 1976? Weiss and Aved, 1978?Roy, 1979, 1981? Hobbs et al, 1985).
19
The extent to which the various dimensions of marital satisfaction are associated with differences in health status have also been studied (Pratt, 1976? Burke and Weir, 1977; Schmoldt, Pope and Hibbard, 1989). Pratt (1976) found a correlation between the pattern of health, health behaviour and family interaction. She demonstrated that families, with high levels of interaction and autonomy, have a more positive health behaviour and a higher level of health than families with low levels of interaction and autonomy (Pratt, 1976).
Burke and Weir (1977) looked at the process which goes on between husbands and wives in helping one another deal with problems and tensions and reported that the husband- wife helping process moderates the effect of pressures and strains in life and work situations. It was evident that high satisfaction with spouse's help was associated with higher marital and life satisfaction, and with mental and physical well-being.
Schmoldt, Pope and Hibbard ( 1989 ) assessed four dimensions of marital quality - cohesion, companionship, co-operation and consensus - and examined their association with health status. The results showed that for both spouses, highly cohesive, co-operative, and companionable marriages were significantly related to higher levels of health. However, consensus was not significantly related to health.
20
SummaryA review of the dental literature has shown a marked
and consistent tendency for members of the same family to experience similar patterns of oral health. Dental researchers have suggested several explanations for these similarities: genetic, bacteriological, immunological and nutritional. However, a complete explanation for the aggregation of oral disease within families has not been given. A number of questions remains unanswered and justifies further study. Given that the psychosocial environment shared by family members, such as quality of marriage, has been reported to have a significant relationship with health, it was hypothesised that marital quality and oral health status were associated. That hypothesis will be tested in this thesis.
1.2. WORK STRESS AND HEALTHStress at work is another psychosocial factor that may
affect oral health status. Although dental researchers have not assessed its importance, medical researchers have reported associations between work characteristics and mental health (Gardell, 1971? Karasek, 1979? Lam et al,1987), gastrointestinal, respiratory and musculoskeletal problems (Winkleby, Ragland and Syme, 1988), hospitalisation (Alfredsson, Spetz and Theorell, 1985), and mortality (Astrand, Hanson and Isacsson, 1989? Johnson,Hall and Theorell, 1989). The relationship with cardiovascular disease is the most frequently cited
21
(Coburn, 1979; Karasek et al, 1981? Johnson and Hall, 1988? Frankenhaeuser, 1989? Johansson, 1989).
Gardell (1971) suggested that the main focus in the relationship between work and mental health is the extent to which various aspects of an indiviual's job fulfil his or her ego needs, or fail to do so. Gardell (1971) assessed the effect of alienation, defined as a lack of variety in work, on mental health and found that complex and varied work goes with good mental health. He concluded that perception of work as interesting or monotonous proved to be important in mediating the relationship between objective work complexity and mental health (Gardell,1971). Johansson, Aronsson and Lindstrom (1978) also reported that repetitive, machine-paced, and attention- demanding work as well as the combination of monotony and mental overload work may contribute to a high frequency of illness. Coburn (1979) analysed the relationship between alienation (expressed as low control over work, low autonomy, monotonous and repetitive work) and psychological and physical well-being. He found that alienating work was related to lower general psychological and physical wellbeing. Men who felt they were in highly monotonous and unchallenging jobs were over four times as likely to be in poor psychological health and over twice as likely to be in poor physical health as men who found their jobs interesting and challenging. Although a relationship was found, alienation was a weak explanation of the variance in
22
health, which suggests that there may be other work characteristics associated with health. Lam et al (1987) reported that mental health was strongly associated with three work characteristics. These are: problem with coping (ability/resources of an individual to handle stress), problems with context (dissatisfaction with work environment), and problems with stressors (specific factors related to the nature of work). Johansson (1989) reviewed the literature related to monotony and confirmed that work monotony is a threat to health. Moreover, he suggested a different organic reaction to repetitive and uneventful work conditions.
Karasek (1979) proposed a model which postulates that stress results from the interaction of two types of job characteristics. Stress, and subsequent physiological illness occurs when the psychologic demands of the work are high and the person's ability to deal with those demands is simultaneously low (see Chapter 2, section 2.5.2.2 for further elucidation of Karasek's job strain model). Karasek (1979) tested his hypothesis using representative data from two industrialised countries, United States and Sweden. The results confirmed that the job strain model predicts significant variations in mental strain (Karasek, 1979). The ability of the Karasek definition of job strain to predict coronary heart disease in a 6 year follow-up was also tested using data from a large random sample of the Swedish working male population collected in 1968 and 1974. In addition, a case-control study was used to test
23
the association between Karasek's job strain model and cardiovascular-cerebrovascular death risk (CHD-CVD). The result of both studies showed that psychologically stressful work demands were significantly related with subsequent CVD. Low intellectual discretion was significantly associated with the development of CHD symptoms and signs, but not with CHD-CVD death. On the contrary, low personal schedule freedom was significantly associated with CVD-CVD death, but not with CHD symptoms and signs. The combination of high demand and low personal schedule freedom was significantly associated with CHD-CVD death but not with the CHD indicators. The effect of the combination of high demand and low intellectual discretion could not be calculated because there was no exposed control or unexposed case in at least one cell. In short, the results showed that high work demand significantly increases the risk of developing CHD symptoms and signs as well as increasing CHD-CVD death. Low control over work appears to be an independent CHD risk factor, which may be a stress-moderator with risk-reducing consequences instead of being a work stressor.
The job strain model developed by Karasek (1979) has been tested and confirmed by other studies (Alfredsson, Karasek and Theorell, 1982; Alfredsson, Spetz and Theorell, 1985? Karasek at al, 1988? Aronsson, 1989). Using a system for classification of occupations which includes physical and psychosocial job descriptive variables, Alfredsson,
24
Spetz and Theorell (1985) studied the relationship between type of occupation and hospitalisation. They reported that male subjects employed in hectic work with few learning possibilities were more frequently hospitalised for myocardial infarction than other working men. Stronger associations between the type of occupation studied and the rate of hospitalisation for other illnesses was also presented. Similarly, a study which assigns a score to each job based on their work characteristics showed that occupations involving low decision latitude and high psychological workload were associated with myocardial infarction prevalence for males workers (Karasek et al,1988). Another study, which analysed a randomly selected group of 1,442 full-time bus/train/tram drivers and guard personnel, found a strong connection between job demand, resources for control and health conditions (mental and physical exhaustion, back and joint pains, stomach trouble, difficulties in sleeping, slight mental stress, and absence due to illness). Moreover, a tendency was also found for the association between higher level of work demands and illness to be modified by resources for control (Aronsson,1989).
Frankenhaeuser (1989) proposed a new model - the effort-affeet model - which is also based on personal control and workload. Like Karasek's formulation, the effort-affeet model, emphasises the significance of personal control as a buffer against harmful stress effects. The difference is that the effort-affeet model
25
added a physiological dimension, that is, the model included a physiological-hormonal pathway to explain the health outcome. In short, the new model corroborated Karasek's formulation of work stress and, further, elucidated how work stress affects health.
Although several researchers have shown that disease would occur when the psychological demands of the job exceed the resources for control, other investigators reported different results (Winkleby, Ragland and Syme, 1988; Reed at al, 1989? Astrand, Hanson and Isacsson,1989). Winkleby, Ragland and Syme (1988) reported an inverse association between psychosocial stressors and hypertension. Reed et al (1989) tested Karasek's definition of job strain in a population of Japanese descent living on Oahu Island, Hawaii, and found no association between exposure to work stress and coronary heart disease. Likewise, another study conducted in Sweden reported a lack of predictive power of the Karasek's job strain model (Astrand, Hanson and Isacsson, 1989). Astrand, Hanson and Isacsson (1989) found that only work decision and work decision combined with work support (relations to superiors and fellow workers) were significantly associated with mortality. Work demand did not show any influence on mortality in this study. Moreover, a combination of job demand with job decision, in accordance with Karasek's definition of job strain, did not show a better prediction of mortality than job decision alone (Astrand, Hanson and
26
Isacsson, 1989). A possible explanation for these different results may be the follow-up time. While Karasek (1981) used 6-year follow-up, Reed et al (1989) and Astrand, Hanson and Isacsson (1989) used a longer period of follow- up (18-years and 22-years, respectively). Another explanation could be the disregard of an important variable, which interacts with demand, control, or both.In summary, these results provide an opportunity to make further evaluations and modifications of the Karasek's model.
Social support can balance the influence of different sources of stress - including occupational stress - in health (Cassel, 1976; LaRocco, House and French, 1980). Harenstam, Palm and Theorell (1988) studied the relationship between health and work characteristics comparing subjects from a representative sample of prison staff in Sweden. They concluded that there were clear differences between prisons in relation to both objective and self-reported working conditions, and that these differences were reflected in health status. Furthermore, they pointed out that a pro-active management style, goal consensus among staff, a high degree of decision latitude, satisfaction with work performance and a supportive psychosocial climate may counteract the effects of stress at work. Johnson and Hall (1988) corroborated the basic predictions of the demand-control formulation, and showed that work-related social support clearly affects the impact of work stress. They found that workers with the
27
lowest levels of social support had the highest prevalence rates and ratios of cardiovascular disease at each level of Karasek's job strain model. Based on these findings, they expanded Karasek's model and added a social support dimension to the demand-control formulation. Another study conducted by Johnson (1989) investigated whether social support from co-workers is another structural factor which moderates the impact of psychological work stress. He found that when social isolation, lack of control and high demand occur simultaneously there is a substantial increase in observed cardiovascular disease prevalence risk. Moreover, he suggested that a combination of both high control and high support is necessary to moderate the impact of work related mental stress on cardiovascular disease risk, since alone neither control nor support appeared to be sufficient to moderate the impact of work stress. Furthermore, the combination of social isolation at work and low control functioned as an independent risk factor. Likewise, Johnson, Hall and Theorell (1989) examined the effect of combined exposure to high demand, low control and low support (social support from coworkers ). The results corroborated those that showed that people in jobs with low levels of demand, high control, and high support were very healthy as shown by a very slow progression of cardiovascular morbidity and mortality. Furthermore, these findings were consistent for blue and white-collar workers.
28
Astrand, Hanson and Isacsson (1989) tested the longterm predictive power of the expanded concept of job strain (work demand, work control and work support) and reported that the interaction of work demand, work control and work support had no better predictive power than job decision alone or the interaction of work control and work support. The results also showed that high control combined with high social support (relations to superiors and fellow workers) gave the best survival rate. These results suggested that work support has a powerful stress moderator effect.
SummaryAlthough dental researchers have not attempted to
assess the importance of the relationship between work stress and oral health, a review of literature has shown conclusively that there is a significant association between health and work stress. Specific work characteristics have been shown to be independently related to health, and moreover, theoretical frameworks have been formulated to conceptualise stress and elucidate its relationship with health. Furthermore, there is increasing evidence that a combination of demand, control and support from co-workers or social network may function as a psychosocial risk complex with respect to health. It was decided to investigate whether work stress and oral health status are associated.
29
1.3. AIMS AND OBJECTIVESThe present research aims to investigate whether there
is a relationship between oral health status and two psychosocial factors, marital quality and work stress. The review of literature has shown that marital quality and work stress are significantly associated with health. In addition, researchers have considered stress as having relatively non-specific effects, that is, stress is associated with a wide variety of diseases (House, 1974). Thus it is justified to study the relationship between oral health, and marital quality and work stress.
The hypothesis to be tested is that a given set of psychosocial factors, if favourable, will predispose family members to better oral health, or alternatively if unfavourable, will predispose to more oral disease. It is hypothesised that families whose members experienced high levels of communication, companionship, and satisfaction with the partner and children are more likely to show better oral health status than families whose members experienced low levels of communication, companionship and satisfaction with the partner and children. In addition, fathers who experienced low levels of stress at work will tend to have a better oral health status than fathers who experienced high levels of stress at work.
Data on preventive oral health behaviour - sugar consumption, toothbrushing frequency, type of toothpaste and dental attendance (preventive dimension) - will be
30
collected to test if marital quality and work stress are either directly, indirectly, or directly and indirectly associated with oral health status. As Marmot (1988, p.692) pointed out "psychosocial factors may exert their effects on disease rate in a number of ways, all of which should be the focus of research questions. Questions of aetiology should be of at least three types: (i) what are the psychosocial determinants of risk-related behaviours such as diet, smoking, or sedentary life-style ?; (ii) independent of these behaviours, do psychosocial factors affect the level of physiological measures considered to be risk factors such as blood pressure or haemostatic factors?; and (iii) do psychosocial factors affect disease incidence by pathways other than the established risk factors ?"
Finally, socio-economic status will be studied because of its well known significant association with oral disease (Sheiham, 1969? Todd & Walker, 1980? Todd, Walker and Dodd, 1982; Demers et al, 1990? Petersen, 1990).
In summary, three research questions were addressed by this study:1. Do members of families which experienced high levels of marital quality have better oral health than members of families which experienced low levels of marital quality ?2. Do fathers exposed to mentally adverse work conditions (high work stress) have worse oral health status than those not so exposed (low work stress) ?3. If oral health status is associated with marital quality
31
and work stress, are they associated through risk-related behaviours or do they affect oral health status by pathways other than the established risk factors?
The identification of psychosocial factors related to oral health may significantly contribute to the explanation of oral disease aetiology. This extra dimension may contribute to the elaboration of more effective preventive oral health programmes and explain the lack of success of others.
32
CHAPTER 2
RESEARCH DESIGN
2.1. GEOGRAPHICAL LOCATION OF THE STUDY:The study was conducted in Belo Horizonte, the state
capital of Minas Gerais, Brasil. Belo Horizonte is an industrial city with a population of about four million inhabitants, drawn from a wide range of socio-economic backgrounds.
Belo Horizonte has had fluoridated water since 1975 (COPASA, 1987). The mean DMFT score of children at the age of 12 from Belo Horizonte was 4.7 (COPASA, 1987), whereas the mean DMFT score for Brazilian 12 year olds as a whole was 6.7 (MINISTERIO DA SAUDE, 1988).
2.2. PILOT STUDY:2.2.1. Description:
The pilot study was designed to test the feasibility of the methods to be used in the main study, namely: the sample selection methods? the questionnaires; the interviews; and the clinical examination criteria for assessing oral hygiene patterns, oral health status and treatment needs.
The sample consisted of 20 families each one comprising: a man, a woman and at least one child aged 13, living together. Ten of these families were from the upper socio-economic groups; the other ten were from the lower
33
socio-economic groups.Considering that the simplest method of identification
of the families would be through the child and that the identification of children through schools is an efficient identification method, four schools, three state and one private school, were selected to participate in the pilot study. A school roster of all 13-year-old students attending the school was compiled at the four schools.
The children who were on the list were contacted in their classes, where a brief explanation of the research was given. Each 13-year-old child was then given an initial identification questionnaire and a letter addressed to their parents containing an explanation of the purpose of the research. This identification questionnaire was taken home by the child with the request for it to be answered by one of the parents. On the following two days the researchers returned to each class and collected the questionnaires. The purpose of the identification questionnaire was to select the families which would fulfil the basic requirements for taking part in the study, for example parental age (35-44 years), marital status (man and woman living together) and employment status (father in paid job).
The families eligible for the study were listed and approached according to the home facilities. The procedure for those having a telephone involved an initial request, by telephone, to attend for a dental inspection and
34
interview on a date most suitable for the family. For those families not owning a telephone, invitation was made at the door and the interview and dental examination were conducted at that time, if convenient.
Interviews and clinical examinations were conducted with 60 subjects: the parents and the 13-year-old child, at the participants' home. Considering that long questionnaires were being answered, it was decided to conduct the interview in two parts. The families were first visited by the researcher (W.S.M.), who carried out the dental examination followed by the first part of the interview. A few days later, a collaborator (I.A.P.) conducted the second part of the interview.
The first interview with the parents lasted on average 90 minutes for each parent. One hundred and four questions were tested. Data on work characteristics, community participation, leisure activity, family interaction, general health and oral health behaviour were collected.
The first interview with the 13-year-old child lasted on average 30 minutes. Sixty-five questions on family interaction and oral health behaviour were tested.
The oral examinations, as previously mentioned, were carried out during the first visit to the participants' home and were always carried out before the interview. The criteria used for the clinical examination was adapted from WHO (1987). Each exam took an average of 10 minutes. The clinical examination was recorded on a special form (Appendix 12).
35
During the second part of the interview, each parent was interviewed for an average of 90 minutes. One-hundred and twenty questions on oral health behaviours (diet, oral hygiene habits and pattern of dental attendance) and oral health beliefs were tested. The second interview of the 13- year-old child lasted an average of 45 minutes. Sixty questions on oral health behaviour (diet, oral hygiene habits and pattern of dental attendance) and oral health beliefs were tested.
All the interviews were tape-recorded.2.2.2. Response rate:
All four schools agreed to participate in the pilot study. Of the 262 13-year-old children registered at the schools, 29 were absent from class on the three days the researchers were visiting the school and, therefore, were not contacted. Of the 233 identification questionnaires handed out, 147 were returned, representing a response rate of 63%.
After analysis of the identification questionnaire, 40 families were eligible to participate in the pilot study.Of the 21 families approached, only one declined to take part.
2.2.3. Discussion:On the whole the research design proved to be
satisfactory. However, some adjustments had to be made. These improvements will be now discussed.
36
Socio-economic status:At first the study was designed to study families
coming from two socio-economic groups, upper and lower socio-economic groups, representing the two extremes of the socio-economic groups distribution. However, during the pilot study, it was realised that grouping families into two socio-economic groups would not be sufficient for the measurement of families socio-economic status. It was decided to refine the socio-economic groups distribution and to divide families into four groups: socio-economic groups A, B, C and D. This procedure would not only lead to a more detailed analysis of the data but also represent about 95% of the Brazilian population.
Socio-economic group E, which is very close to absolute poverty and is mainly composed of homeless people, was not included in the study. There were three reasons for excluding them. The first and foremost was the fact that the economic barriers, which members of this socio-economic group face, would be the strongest determinant of behaviour and condition. The second reason was the difficulty in contacting this socio-economic group. The third was the f^ct that this socio-economic group represents a very small percentage of the total population, only 5% in the city of Sao Paulo and 6% in the city of Rio de Janeiro (ABA- ABIPEME, 1978)Location of interviews:
The study was first designed to interview the members of the families separately. However, most of the families
37
from the lower socio-economic group did not have sufficient space at home for the interviews to be held separately. Furthermore, some families, in spite of having enough space at home for their members to be interviewed separately, preferred to be interviewed together. Therefore, it was decided that the interviews would be carried out separately or together, according to the home environment and respondents' disposition.
Questionnaires:The identification questionnaire needed minor changes.
It was shortened, and simpler questions, containing the same variables, were developed. This was because most of the parents from the lower socio-economic groups had only one or two years of formal education and had difficulties in answering some of the questions.
The two questionnaires developed for the interview with parents needed small changes mostly related to the order of sections and the sequence of questions. A few questions were also excluded, for example those which were used to check the validity of the main questions. Finally, the personal and, therefore, most sensitive questions were rephrased to develop a more relaxing interview for the participants.
The two questionnaires designed for the 13-year-old child went through more radical changes. The first and the major change was concerned with the questionnaire designed to collect information on the family relationship. It was
38
decided not to use this questionnaire since it was noticed that the 13-year-old child felt most embarrassed to talk frankly about family relations in the presence of his/her/their parent/s. As mentioned previously, most of the families from the lower socio-economic groups lived in small houses, where privacy during the interview could not be obtained; therefore, this condition could not be standardised and bias was most likely to occur. On account of this and since it was felt that parents were giving frank reports on their life and behaviour, the child/parent relationship was measured according to the parents' report. Thus, the questions addressed to the 13-year-old child were rephrased and included in the parents' questionnaire.
The second questionnaire developed for the 13-year-old child, that designed to collect information on oral health behaviour and beliefs was changed to a minor degree. These changes were related to the ordering of sections, sequence of some questions and exclusion of those questions which were developed to check the validity of the main questions.
A detailed description of the development of the questionnaires used in the study is presented in Appendix 1.Clinical examination:
The clinical examination did not need any modification since the clinical criteria, adapted from WHO (1987), proved to be most applicable to the purpose of the study.
A detailed description of the clinical criteria used in
39
this study is given in Appendix 2.Response rate:
Two aspects concerning the identification questionnaire must be discussed. First, the high number of absentees found. Second, the "low" response rate encountered. Both aspects will be discussed together since the explanation for both of them are very similar.
Visits to the four schools taking part in the pilot study were carried out during the last two weeks of November and the first week of December, which is the end of the school year in Brasil. This is the time when the students are sitting final exams or preparing for supplementary exams. Therefore, it is not the most suitable time to contact students. The high number of absentees found may be due to the fact that some students were not attending classes any more because they had already passed their exams. The 11 low” response rate in returning the identification questionnaire may also be explained by the stress students were going through during the final weeks of the school year.
The second explanation for the 11 low” response rate to the identification questionnaire may have been because the parents from the lower socio-economic groups had difficulties in understanding it. Parents from these socioeconomic groups showed very low literacy rates. The majority of them had up to 4 years of formal education.
40
2.3. MAIN STUDY POPULATION:One-hundred and sixty-four families took part in the
study. Since socio-economic status plays an important role in the determination of health status (Townsend, Davidson and Whitehead, 1988) and oral health (Todd & Walker, 1980; Todd, Walker and Dodd, 1982; Demers et al, 1990; Petersen, 1990), the families were divided into four socio-economic groups: A, B, C and D.
Each socio-economic group was composed of 41 families. There are two main reasons for selection of this sample size. Firstly, the minimum accepted number of units/cell for an adequate statistical analysis is 30 units in each cell (Bland, 1987). Therefore, the number of 41 units/cell was an adequate number for statistical purposes and, furthermore, it would avoid working with the exact minimum number. Secondly, because the researchers had twelve months to do the fieldwork (selection of schools, permission to contact students, selection of families, development of pilot study and main study) and that all the data were gathered by the researchers themselves, time had to be allowed for the interviewing and examining of 164 families (861 clinical examinations and 777 interviews) for the main study.
As oral health is strongly related to age (Todd & Walker, 1980), this variable was controlled. For parents, the age ranged from 35-44 years. According to WHO (1987), "This age group is the standard monitoring group for the health conditions of adults. The full effect of dental
41
caries, the level of periodontal disease, and general effects of care provided can be monitored using data for this age group” (WHO, 1987, p. 8). Moreover, edentulousness rates are low for this age group.
For the child, the age of 13 was chosen. WHO (1987) recommends that 12 year olds should be used as a global monitoring age for caries for international comparisons and monitoring of disease trends because it is generally the age at which children leave primary school, and thus in most countries, is the last age at which a reliable sample may be obtained easily through the school system (WHO,1987). In this study, however, the age of 13 was selected for two main reasons. First, Brazilian children finish their studies at the age of 14 and after this age, the children from families from low socio-economic groups tend to stop schooling. Second, 13 years old provides a more accurate picture of the caries prevalence for children since all the permanent teeth have been present in the mouth for at least 1 year - a period when teeth are most susceptible to developing dental caries (Takeuchi, 1961).
Among other variables which may influence oral health Status, working conditions was one of the variables analysed in this study. Therefore, all the fathers were in paid work during the study.
A detailed description of the social characterisitics of the sample is presented in Appendix 6.
42
2.3.1. Sample selection methods:The sample was selected from private and state schools
in Belo Horizonte - a practical and adequate approach for the identification of children in an epidemiological survey (WHO, 1987).
Permission was obtained from the Department of Education for selecting the sample from schools. There were 238 schools in Belo Horizonte, 111 state and 127 private schools (CEDINE, 1985).
To select the sample according to socio-economic groups, the area where the school was located was the first criterion to be taken into account. The areas were chosen according to the criteria developed by PLAMBEL (1984) to categorise the residential areas of the metropolitan region of Belo Horizonte by socio-economic group. These criteria are the result of several years of study of the development of the metropolitan region of Belo Horizonte. The determination of these residential areas was based on several factors: historical aspects, physical environment, socio-economic group distribution, economic activities and cultural factors.
The metropolitan region of Belo Horizonte was divided into eight areas (hereafter referred to as macro-units). These macro-units were then divided into sub-units (PLAMBEL, 1984).
The reasoning for the division of the metropolitan region of Belo Horizonte into these macro-units is based on the concept of "centrality", for example the central area
43
shows a concentration of resources while a dispersion of resources is observed in the areas further away from the central area.
Since the purpose of this investigation was to study the population of the city of Belo Horizonte and not its whole metropolitan region, only five macro-units were selected: "nucleo central”, "area pericentral", "pampulha", "eixo industrial" and "periferias". For this study, however, these macro-units were grouped into two areas - the central area ("nucleo central") and the suburban areas ("area pericentral", "pampulha", "eixo industrial" and "periferias").
On the whole, the central area was composed of the upper socio-economic groups while the lower socio-economic groups reside in the other areas. Therefore, the central area represents the "middle-class" areas and the suburban represents the "poor" areas. However, there are some lower socio-economic group pockets located in the central area and some upper socio-economic group pockets in the suburban area.
As a rough guide for the selection of families according to socio-economic groups, the schools located in central Belo Horizonte were divided into 2 groups: those located in the central area ("middle-class" area) and those located in the suburban area ("poor" area). The former group consisted of 52 schools, 13 state and 39 private? while the latter was composed of 184 schools, 98 state and
44

86 private.The schools had an average of 100 13-year-old students
(CEDINE, 1985). Considering that in the pilot study, only 19% of the students contacted in the schools were eligible to participate in the study, it was assumed that at least 980 13-year-old children should be contacted, for example at least 10 schools, in order to get a sample of 164 children. All the schools were then given a number. Since it was decided to over-sample, twice as many schools were randomly selected - ten schools from each area. It was decided that the schools would be contacted in the order established during the random selection. The schools randomly selected to participate in the study are listed in Appendix 4.
The total number of students and the number of 13- year-old students from each school was obtained from the records of the Information Centre of the Department of Education ( CEDINE, 1985 ). As the most complete records in CEDINE were from 1985, the researchers, using the information available at each school registrar's office, developed an updated list of all the 13-year-olds, with their full names, date of birth, class and period of attending school (morning, afternoon or evening).
As the schools were visited following the order in which they were selected and that all the schools selected agreed to participate in the study,the first six schools located in the "middle-class" areas and the three schools in the "poor" areas were sufficient for the sample. The
45

schools which took part in the study, with the updated number of 13-year-old students attending each school, are listed in Appendix 4.
Permission to contact the students was obtained in two ways. For state schools, the Department of Education communicated directly with the headteacher of the schools. For private schools, a letter signed by the Dean of Dental School (F.O.U.F.M.G.), explaining the purpose of the study and introducing the researchers, was sent to the headteacher.
A meeting was held with each school headteacher - from both state and private schools - at the school. The study as well as the role of the school in the study was explained. The final permission to contact the students was finally given by the school headteacher.
The students were then contacted in their own classrooms, where a brief explanation of the study was given to all the students. For the purpose of selecting families and classifying them into socio-economic groups, an identification questionnaire (Appendix 7) was handed out for answering by one of their parents at home. A total of 1,068 questionnaires were distributed, 465 in the "middle- class" schools and 603 in the "poor" schools. On the following three days, one of the researchers visited all the classrooms to collect the questionnaires.
A total of 233 families were selected, 123 from the schools located in the "middle-class" areas and 110 from
46
those located in the "poor" areas. The criteria for selection were based upon: parental age (35-44 years of age), marital status (context of family: man and woman living together), employment (father/man in paid job) and socio-economic group (A, B, C and D).
Considering that there are some lower socio-economic group pockets located in the "middle-class" areas, for example the slums, and some upper socio-economic group pockets located in the "poor" areas, some children from the lower socio-economic groups attended classes in the schools located in "middle-class" areas and some children from upper socio-economic groups attended classes in schools located in "poor" areas. Refinement of the socio-economic groups distribution of the families was necessary. The ABA- ABIPEME criteria for socio-economic classification were utilised for this purpose (Appendix 3).
The ABA-ABIPEME criteria are based on eight socioeconomic indicators: number of television sets, radios, bathrooms, motor-cars, maids, vacuum cleaners washing machines at home, and the educational level of the head of the family. The socio-economic indicator are measured by a set of points, and a final score defines the households' socio-economic group - A, B, C, D and E.
The reorganisation of the groups led to 15 families being socially reclassified: 5 families from schools located in "middle-class" areas were reclassified in the lower socio-economic groups (C and D)? while 10 families from schools located in "poor" areas were reclassified in
47
the upper socio-economic groups (A and B).As a more detailed statistical analysis was to be done,
the ABA-ABIPEME criteria were also used in the subdivision of the two socio-economic groups. The upper socio-economic group was composed of the subgroups: socio-economic groups "A" and "B". The lower socio-economic group was subdivided into socio-economic groups "C" and "D". Therefore, the 233 selected families were finally redistributed as follows: 84 families from socio-economic group "A", 44 families from socio-economic group "B", 55 families from socio-economic group "C" and 50 families from socio-economic group ”DM. From these, 41 families from each group were included in the study.
The 233 eligible families were listed separately according to the school of origin. The families were approached at random following the order established by the random selection of schools. Once a sufficient number in each of the 4 cells (A, B, C, and D - 41 families) was obtained, the remaining families from the completed cell were not contacted.2.3.2. Response rate:
1068 identification questionnaires were distributed to the 13-year-old students in their classrooms; 920 questionnaires (86%) were returned to the school by the students.
Of the 920 questionnaires returned, only one-quarter (233) of the families fulfilled the basic requirements
48
established and were eligible to participate in the study. Of these, 175 families were actually invited to participate in the study. As the sample cells were filled (41 families in each cell), other families from that cell were not contacted.
Of the 175 families approached, 164 agreed to take part representing a response rate of just over 93%. The response rate, in spite of being high in all socio-economic groups, varied from one cell to another. Socio-economic group A showed the lowest response (85.5%), while the highest was observed in socio-economic group D (100%). Socio-economic groups B and C had responses of 97.6% and 93.2%, respectively.
2.4. DATA COLLECTION:After the sample selection, the eligible families were
contacted according to whether they had a telephone or not. For the families from the upper socio-economic groups, who often had a telephone, the purpose of the study was explained, and the request to participate in the study was made by telephone. If permission was obtained, an appointment to visit the family was agreed. Attempts to interview and examine all family members on the same date were made.
For families from the lower socio-economic groups, who often did not have a telephone, the purpose of the study and the invitation to take part in the study were made by personal contact. If consent was given, the interview and
49
the dental examination were conducted with the family members present at that time, if convenient. An appointment to interview and examine other family members was set up on a date most suitable for them. It was common to visit each family several times in order to interview and examine all members.
The data collected were of five types: clinical, social, economical, psychological and behavioural. They were collected using dental examinations combined with structured and standardised questionnaires. All the interviews and the clinical examinations were carried out in the participants' home.
Interviews were conducted with the parents, the 13- year-old child, and all the brothers and sisters aged on 10 years and above - a total of 777 interviews were carried out. The clinical examination was carried out on all the family members - 861 subjects were examined.
The following two sections will describe the collection of the data.
2.4.1. Social, economical, psychological and behavioural data:
Social, economical, psychological and behavioural data were collected through the identification questionnaires and interviews (for a detailed description of the development of questionnaires, see Appendix 1).
At first, information to select the sample and determine the socio-economic classification of families was
50
collected through the identification questionnaire. This questionnaire was distributed to the 13-year-old child at school and answered at home by one of the parents. It contained questions on family members' names, ages and kinship; family address; marital status; father's occupation; parents' educational level; and socio-economic indicators (number of television sets, radios, bathrooms, motor-cars, maids, vacuum-cleaners and washing machines at home) (Appendix 3).
The identification questionnaire was validated during the first visit to the family, when a question on father's income was included. Since this is a delicate question to ask, it was not included in the identification questionnaire.
Data on psychological and behavioural aspects were collected during the interviews. The interviews were divided in two sections.
The first interview was carried out by W.S.M., when parents were questioned on work characteristics, community participation, leisure activity, family structure and general health behaviour (Parents' questionnaires - Part I (Appendix 8)). These interviews lasted, on average, 30 minutes for each parent.
The second interview was carried out by I.A.P., when parents, the 13-year-old child, and all the brothers and sisters aged on 10 years or above were interviewed.
The parents and the 13-year-old child were questioned
51
on their oral health behaviour - diet, hygiene and pattern of dental attendance - and their oral health beliefs (Parents' questionnaire - Part II (Appendix 9) and 13-year- old child's questionnaire (Appendix 10)). The parents' interviews were, on average, 30 minutes long, while the interviews with the 13-year-old child lasted, on average,20 minutes.
A much shorter interview, which lasted 10 minutes on average, was carried out with the brothers and sisters. Questions on their oral health behaviours (diet, hygiene and pattern of dental attendance) were asked (Siblings' questionnaire (Appendix 11)).
2.4.2. Clinical data:The oral examinations were carried out during the first
visit to the participants' home and before the interview. All the dental examinations were carried out by the researcher (W.S.M.), taking an average of 10 minutes for each subject.
The clinical criteria used were adapted from WHO (1987) (Appendix 2). The oral examination included an assessment of oral hygiene status, dental caries, periodontal and prosthetic status, and treatment needs.The clinical data were recorded on a special form (Appendix 12) .
Consistency of exams was assessed throughout the field work. Every tenth subject was re-examined.
52
2.5. DATA ANALYSIS:As stated earlier, this study investigated whether
marital quality and work stress are associated with oral health status. Only the data related to the hypothesis to be tested were analysed.
Data from both the interviews and the clinical examinations were coded. The data relating to closed questions were pre-coded whilst the data relating to open questions were subsequently coded.
Following the coding procedure, all data were entered into a computer. Analysis was carried out using the Statistical Package for Social Sciences (SPSS/PC+ - version 2, 1988) and the Epidemiological Graphics, Estimation, and Testing package (EGRET, 1988) programmes.
2.5.1. Statistical methodData were analysed using multiple regression analysis
and logistic regression analysis.Considering that oral health status may be affected by
several factors, data on known risk-related factors were collected and included in the data analysis as confounding variables. This often happens in epidemiological surveys and calls for a multiple regression analysis test to see how the outcome variable - oral health status - varies with the explanatory variables - marital quality and work stress (Healy, Osborn and Hills, 1988-89).
In fact, the multiple regression analysis allows
53
assessment of the unique contribution of a particular variable. An apparent relationship between two variables could be due to a third variable. Ideally, the study should control all confounding variables. However, this is not possible. The solution is to include these variables in the regression (Healy, Osborn and Hills, 1988-89). The inclusion of confounding variables in a multiple regression analysis of variance adjusts the effect of the explanatory variable - marital quality - on the outcome variable - oral health status - in relation to the confounding variables included in the regression (Healy, Osborn and Hills, 1988-89).
An apparent relationship between marital quality or work stress and oral health status could be due to the age of the subject, socio-economic status, sugar consumption, dental attendance, toothbrushing frequency or the type of toothpaste used, among others. Alternatively, the relationship between them could be obscured by these confounding variables. For example, if one set of subjects older than another experiences a low level of marital quality, the effect of age may be the explanation for the relationship. Alternatively, the opposite situation would obscure the relationship (Healy, Osborn and Hills, 1988- 89) .
Since the periodontal health status measurement is a proportion (or percentage) rather than a continuous measurement (such as dental caries status), multiple regression analysis is not the appropriate statistical test
54
to use (Healy, Osborn and Hills, 1988-89). Proportion presents some features which violate the necessary assumptions of multiple regression analysis. First, the probability distributions are binomial rather than normal. Nevertheless, the non-normality matters very little since the binomial distribution is very close to normality unless the expected values are small (Healy, Osborn and Hills, 1988-89). Second, when proportions are related to other variables through regression analysis care should be taken that the true proportion cannot go outside the range 0 to 1, thus the straight line will not fit the data very well (Healy, Osborn and Hills, 1988-89). Finally, the assumption of constant variance cannot be made. The variance of proportions is estimated as p (1 - p) / n, thus the variance is largest when p = 0.5 and smaller when p is near0 or 1 (Healy, Osborn and Hills, 1988-89). The way to overcome these problems is to transform the data. To do this, logistic regression, which involves logit transformation, was used. (Healy, Osborn and Hills,1988-89).
In the logistic regression, the fixed boundaries at 0 and 1 are removed through two transformations. The boundary1 is removed transforming the proportion in the correspondent odds ratio and the other calculating the log odds. These procedures fit the points in the straight line (Healy, Osborn and Hills, 1988-89).
Finally, the assumption of constant variance is met
55
using a weighted regression, giving relatively little weight to high or low proportions. (Healy, Osborn and Hills, 1988-89).
In summary, multiple regression was adopted for the analysis of dental caries status and logistic regression for the analysis of periodontal health status.
2.5.2. Construction of measuresMarital quality and work stress are abstract concepts
and difficult to be measured directly by respondents' answers to a unique question in the interview. Thus, the approach taken by the present study was to ask questions about specific pleasurable and stressful experiences, and, then combine these specific questions into a composite measure, which represents the broad concept.
2.5.2.1. Marital quality measurementResearchers studying the family have not agreed on the
conceptual definition, the number of components, or dimensions that constitute marital quality or the best and most adequate way of measuring marital quality. Marital quality is a subject that has been extensively studied. However, no one has yet succeeded in developing a fully adequate theory of marital quality (Leslie and Korman,1985, p. 402). What all agree on is that marital quality is an extremely complex phenomenon, difficult to measure and even liarder to conceptualise (Clayton, 1975, p. 382).
The measurement of marital quality has a history dating
56
back to the pioneering research of Hamilton (1929) and classic scales developed by Burgess and Cottrell (1936, 1939), Terman (1938) and Locke and his colleagues (Locke, 1947; Locke and Karlsson, 1952; Locke and Williamson, 1955; and Locke and Wallace, 1959).
The concept implicit in these classical scales, thus the dimensions adopted to measure marital quality, are: (1) husband-wife agreement about critical issues; (2) common interests and joint activities; (3) demonstration of affection and mutual confidences; (4) numbet of complaints about their marriages; and (5) presence or absence of loneliness, misery, irritability and self-confidence (Burgess and Cottrell, 1939, ch. 4).
The concept of a well-adjusted marriage implicit in these scales was criticised by Kolb (1948, 1950). For him, certain criteria of successful marriage set up by these scales is fundamentally in conflict with that complex of democratic values which measures the validity of institutions and social groups by their contribution to personal growth and expanding experience through freedom. A well-adjusted marriage would be the one that reflects conformity to the established norms of various groups (Kolb, 1948, 1950). Thus, criteria such as husband-wife agreement about critical issues, common interest and joint activities, and number of complaints about their marriages seem inadequate to measure marital quality.
In fact, if the family is viewed as a social
57
institution concerned with the survival of social norms, it may be adequate to adopt the concept of a well-adjusted marriage set up by classical scales. However, if the family is viewed as a social group judged by the way it contributes to human freedom and personal development this concept is inadequate (Kolb, 1948).
A number of studies have tested the classical scales mentioned above and expanded the concept of well-adjusted marriage established by them.
Hicks and Platt ( 1970 ) reviewed the studies done during the 1960s in relation to marital happiness and marital stability and reported that the main findings from research during the 1960s have corroborated some concepts established by the previous studies, and have also identified few new variables related to marital happiness. One of the most important findings was the tendency for the institutional marriage, which is featured by traditional role specifications and customs, to be replaced by the companionship marriage, where emphasis is placed on personality interaction and on the affective aspects of the relationship (Hicks and Platt, 1970). It has never been suggested that affective factors were not important in the institutional marriage. Nevertheless, greater emphasis was placed on these aspects in the companionship marriage (Hicks and Platt, 1970).
The variables correlating to institutional marriage were congruence of role perceptions, compatibility of role expectations and performance, wife's employment,
58
traditional socialization and presence of children (Hicks and Platt, 1970). Except for the presence of children, all other variables identified are in conflict with personal growth and expanding experience through freedom. Thus, they seem inadeguate to measure marital quality.
It is important to mention that the popular assumption that children and marital happiness go together has received little or no support. It seems that except for unsatisfactory marriages, where children were reported as the only source of happiness, children tend to detract from rather than contribute to the marital quality of the parents (Hicks and Platt, 1970).
The variables identified as correlating to the companionship marriage were feelings of affection, sexual enjoyment, companionship, communication and personality factors such as adaptability and flexibility (Hicks and Platt, 1970).
One of the most important studies done during the 1960s was conducted by Orden and Bradburn (1968). They carried out a cluster analysis of responses to two checklists pertaining to recent pleasurable experience and disagreements and developed a two-dimension model of marriage happiness called the "Marriage Adjustment Balance Scale". This model assumed that marriage happiness may be viewed as the result of two independent and opposite dimensions - a dimension of tension and a dimension of satisfaction, which was composed by companionship and
59
sociability.Ten years after Hicks and Platt reviewed the literature
on the areas of marital happiness and marital stability, Spanier and Lewis (1980) reviewed the research done during the 1970s. They reported that one of the more significant developments in marital research in the 1970s was the implicit recognition that the quality of marriage involves multidimensional phenomena (Spanier and Lewis, 1980). Therefore, marital quality as a concept has gained greater usage among marriage and family researchers, since it includes the entire range of variables which have been traditionally the dependent variables in marital research (Spanier and Lewis, 1980).
Another topic which received consistent interest during the 1970s was the effect of children on marital quality (Spanier and Lewis, 1980). Spanier and Lewis (1980), as well as Hicks and Platt (1970), reported that the presence of dependent children in the home resulted in a decrease in the marital satisfaction of parents.
Spanier (1976) also carried out one of the most important studies during the 1970s. He identified all items ever used in any scale measuring marital adjustment approximately 300 items - and with a careful method, selected the best 40 potential items for the scale, and performed a factor analysis. The result was a 32-item scale called the "Dyadic Adjustment Scale". The new scale suggested the existence of four empirical dimensions of marital quality: satisfaction, cohesion, consensus and
60
affectionate expression. Spanier (1976) labelled "satisfaction” and "cohesion" the dimensions previously named "happiness" and "companionship", respectively.
The weakness of the Dyadic Adjustment Scale is that consensus is inappropriate to measure marital quality, as previously discussed.
Another contribution to the measurement of marital quality was made by Brannen and Collard (1982, p. 51), who explored the perceptions and processes whereby people became clients of agencies for marital problems, and the factors which shaped their decisions and actions. They reported that sex, on the one hand, and communication and demonstrativeness, on the other, seem to be the most problematic areas of marriage.
In conclusion, several scales have been developed with different purposes (Fredman and Sherman, 1987). Variables which are useful for prediction may not be useful for diagnosis and analysis. Also, if researchers are interested in the study of family as a social institution or social group, different variables would be selected. Based on the review of literature and on the purposes of this study, which is to study the family as a social group, the dimensions happiness, companionship, communication, demonstration of affection, sexual enjoyment and the role of children were adopted to compose the marital quality measurement. However, demonstration of affection and sexual enjoyment were excluded after the pilot test of
61
questionnaires because respondents felt embarrassed to answer the questions related to these two dimensions.
The following 5 questions representing four dimensions of marital quality - communication, companionship, satisfaction with marriage and satisfaction with children - were used to measure marital quality (Parents Questionnaire - Part 1 ( Appendix 9 )):
62
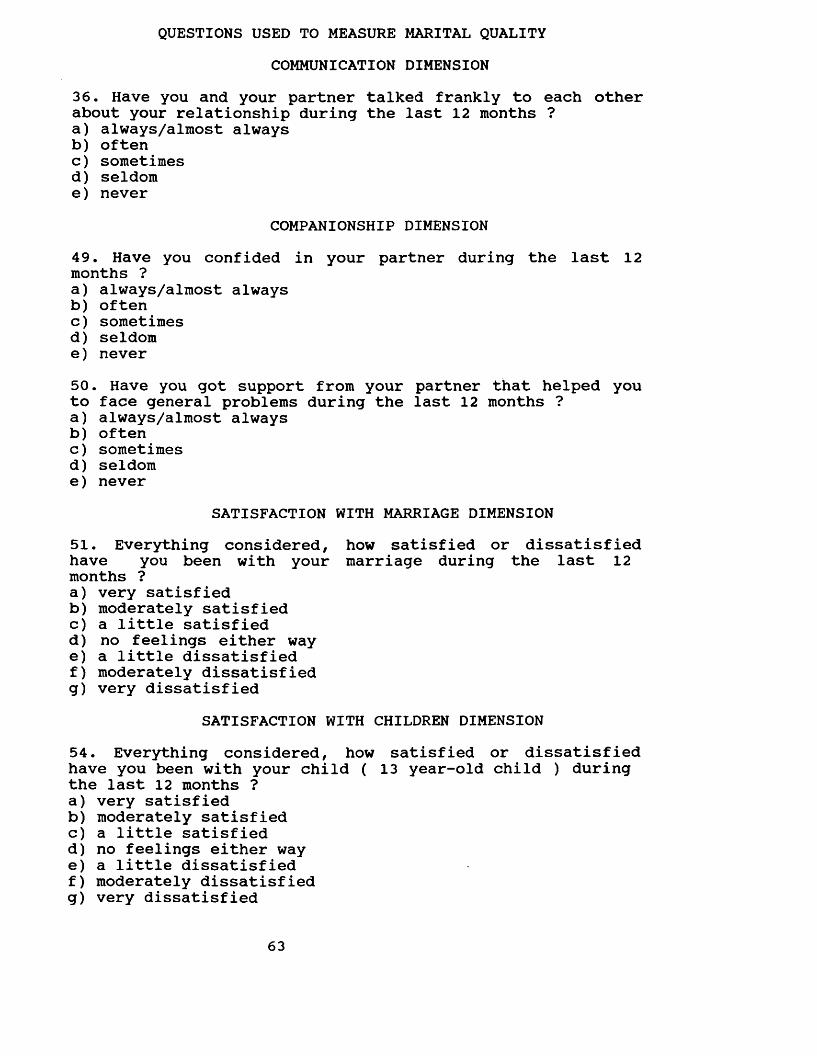
QUESTIONS USED TO MEASURE MARITAL QUALITYCOMMUNICATION DIMENSION
36. Have you and your partner talked frankly to each other about your relationship during the last 12 months ?a) always/almost alwaysb) oftenc) sometimesd) seldome) never
COMPANIONSHIP DIMENSION49. Have you confided in your partner during the last 12 months ?a) always/almost alwaysb) oftenc) sometimesd) seldome) never50. Have you got support from your partner that helped you to face general problems during the last 12 months ?a) always/almost alwaysb) oftenc) sometimesd) seldome) never
SATISFACTION WITH MARRIAGE DIMENSION51. Everything considered, how satisfied or dissatisfied have you been with your marriage during the last 12 months ?a) very satisfiedb) moderately satisfiedc) a little satisfiedd) no feelings either waye) a little dissatisfiedf) moderately dissatisfiedg) very dissatisfied
SATISFACTION WITH CHILDREN DIMENSION54. Everything considered, how satisfied or dissatisfied have you been with your child ( 13 year-old child ) during the last 12 months ?a) very satisfiedb) moderately satisfiedc) a little satisfiedd) no feelings either waye) a little dissatisfiedf) moderately dissatisfiedg) very dissatisfied
63
The questions in the marital quality measure had already been used with different wording by other studies. Question 36 was adapted from the Abbreviated Barrett- Lennard Relationship inventory (Shumm, Bollman and Jurich, 1981), and the McMaster Family Assessment Devijce (Epstein, Baldwin and Bishop, 1983). Question 50 was adapted from the Marital Adjustment Test (Locke and Wallace, 1959), the Caring Relationship Inventory (Shostron, 1975), the Dyadic Adjustment Scale (Spanier, 1976), the Dyadic Trust Scale (Larzelere and Huston, 1980), the Marital Satisfaction Scale: Form B (Roach, Frazier and Bowden, 1981) and the McMaster Family Assessment Devise (Epstein, Baldwin and Bishop, 1983). Question 51 was adapted from the Dyadic Trust Scale (Larzelere and Huston, 1980), the McMaster Family Assessment Device (Epstein, Baldwin and Bishop,1983), and the Whitehall II study of British civil servents (Marmot, unpublished). Question 49 was adapted from the Marital Adjustment Test (Locke and Wallace, 1959), the Dyadic Adjustment Scale (Spanier, 1976), and the Quality of Life Scale (Olson and Barnes, 1985). Question 54 was adapted from the Dual-Career Family Scale (Pendleton,Poloma and Garland, 1980) and the Quality of Life Scale (Olson and Barnes, 1985).
A correlation matrix to check the construction of the measure was carried out for fathers and mothers self- reported answers. Inter-item correlations was used to check the grouping of questions. If the correlations between
64
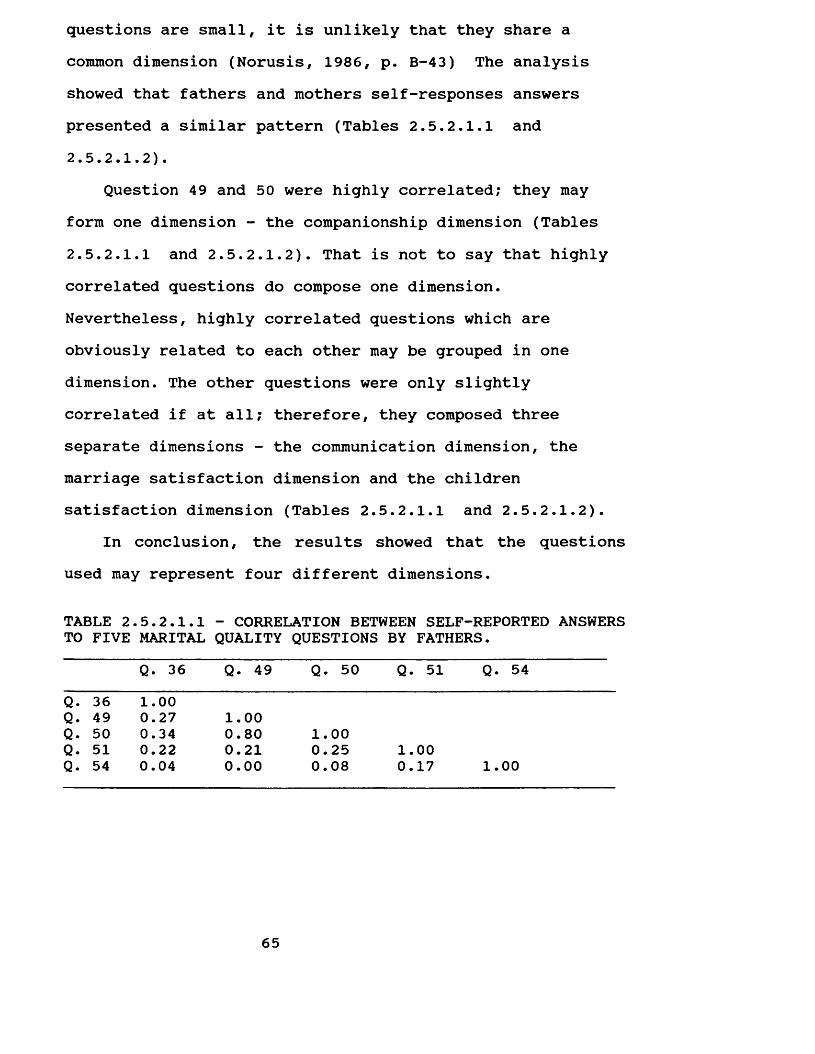
questions are small, it is unlikely that they share a common dimension (Norusis, 1986, p. B-43) The analysis showed that fathers and mothers self-responses answers presented a similar pattern (Tables 2.5.2.1.1 and2.5.2.1.2).
Question 49 and 50 were highly correlated; they may form one dimension - the companionship dimension (Tables2.5.2.1.1 and 2.5.2.1.2). That is not to say that highly correlated questions do compose one dimension.Nevertheless, highly correlated questions which are obviously related to each other may be grouped in one dimension. The other questions were only slightly correlated if at all; therefore, they composed three separate dimensions - the communication dimension, the marriage satisfaction dimension and the children satisfaction dimension (Tables 2.5.2.1.1 and 2.5.2.1.2).
In conclusion, the results showed that the questions used may represent four different dimensions.
TABLE 2.5.2.1.1 - CORRELATION BETWEEN SELF-REPORTED ANSWERSTO FIVE MARITAL QUALITY QUESTIONS BY FATHERS.
Q. 36 Q. 49 Q. 50 Q. 51 Q. 54Q. 36 1.00Q. 49 0.27 1.00Q. 50 0.34 0.80 1.00Q. 51 0.22 0.21 0.25 1.00Q. 54 0.04 0.00 0.08 0.17 1.00
65
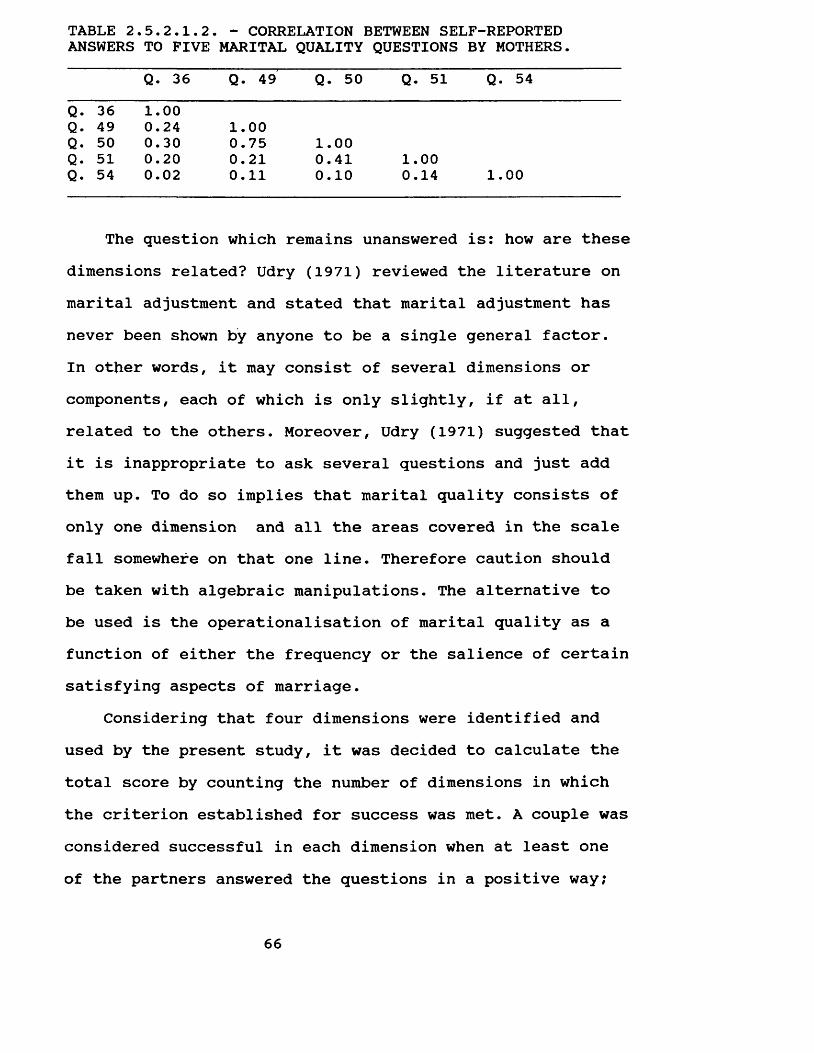
TABLE 2.5.2.1.2. - CORRELATION BETWEEN SELF-REPORTED ANSWERS TO FIVE MARITAL QUALITY QUESTIONS BY MOTHERS.
Q. 36 Q. 49 Q. 50 Q. 51 Q. 54Q. 36 1.00Q. 49 0.24 1.00Q. 50 0.30 0.75 1.00Q. 51 0.20 0.21 0.41 1.00Q. 54 0.02 0.11 0.10 0.14 1.00
The question which remains unanswered is: how are these dimensions related? Udry (1971) reviewed the literature on marital adjustment and stated that marital adjustment has never been shown by anyone to be a single general factor.In other words, it may consist of several dimensions or components, each of which is only slightly, if at all, related to the others. Moreover, Udry (1971) suggested that it is inappropriate to ask several questions and just add them up. To do so implies that marital quality consists of only one dimension and all the areas covered in the scale fall somewhere on that one line. Therefore caution should be taken with algebraic manipulations. The alternative to be used is the operationalisation of marital quality as a function of either the frequency or the salience of certain satisfying aspects of marriage.
Considering that four dimensions were identified and used by the present study, it was decided to calculate the total score by counting the number of dimensions in which the criterion established for success was met. A couple was considered successful in each dimension when at least one of the partners answered the questions in a positive way;
66
if at least one of them give the answers always or often to questions 36, 49, and 50? and very satisfied, moderately satisfied and little satisfied to questions 51 and 54. The result was a final score ranging from 0 to 4.
Finally, it is important to point out that this study constructed a measure taking into account couples and not individuals. The majority of scales have been designed for individuals and not for couples despite the fact that it takes two to have an adjusted or maladjusted marriage (Clayton, 1975, p. 375-6). As Spanier (1972) stated "if one considers marital quality a measure of success of group functioning, there is a need for being careful about making inferences and drawing conclusions about a sample of marriage couples when only one of the spouses is studied."
2.5.2.2. Work stress measurementContrary to the measurement of marital quality, there
is a consensus about work stress measurement. High mental demands, excessive work, and time pressure have traditionally been mentioned as psychological stressors (Johansson, 1989). More recently, researchers have brought into focus other work characteristics conceded as psychological stressors. These work characteristics are lack of autonomy, understimulation, underutilization of skills, and few opportunities to learn new things on the job (Johansson, 1989). In short, the literature has consistently shown that the main causes of stress imposed on an individual by work circumstances are: (1) demand (too
67
great or too small) (2) ambiguity (unclear direction) and (3) incompatible demands (Shilling, 1989).
Karasek (1979) formulated a model which elucidated, in part, how the work environment may result in a stress situation. He argues that psychological stress results neither from a single aspect of work environment nor from an aggregate list of stressors, but from the interaction of two types of work situations. The two work situations included in the Karasek's job strain model are job demand and job decision, which were defined, respectively, as the psychological stressor affecting work, and, as the working individual's potential control over his tasks and his conduct during the working day (Karasek, 1979). Karasek's hypothesis (1979) is that work stress results from the joint effects of the demands (job demands) and environmental moderators of stress on the work situation, in particular, the range of decision-making freedom available to the worker facing those demands (job decision). The stressors (job demand) represent the instigators of action and the control (job decision) the constraints on alternative resulting actions. The stressors place the individual in a motivated state of stress, and if no action can be taken, or if other desires of the individual must be foregone because of low control, the unreleased stress may have reverse psychological and physiological consequences. In short, Karasek (1979) postulated that the combination of high job demands with
68
little job decision is the most stressful work circumstance, and result in subsequent physiological illness.
The Karasek's job strain model is composed of two dimensions, the job demands and the job decision. The job demands dimension reflects the psychological stressors related to work load, unexpected tasks and personal conflict, but not physical job stressors. The job decision dimension includes two indicators, which have different goals: intellectual discretion, defined as the work possibility of development, reflecting the capacity to use judgement and assert control over use of skill; and personal schedule freedom, defined as control over time, reflecting the individual's control over his time schedule of participation in the work process (Karasek, 1979;Karasek et al, 1981). Finally, it is important to mention that Karasek (1979) measured intellectual discretion using a measure of the skill level required for the worker's job and his evaluation of the work as repetitive (lacking in variety). Karasek (1979) assumed that after constant rehearsal of repetitive work, workers tend to lose the capacity for intellectual challenge. In fact, he found that the great majority of repetitive job responses were from workers in jobs which require no formal training beyond elementary education (Karasek, 1979).
The measures used by Karasek (1979) and Karasek et al (1981) are similar to other measures that have already been adopted by other studies.
69
Karasek's job strain model (1979) has received consistent interest during the last decade and has been tested by several researchers (see Chapter 1, section1.2). The great advantage of Karasek's formulation of work stress is that it may avoid misinterpretation, since it disentangles the effect of two conflicting forces, job demands and job decision. For this reason, this study adopted Karasek's definition of work stress (Karasek,1979) .
Ten questions from the questionnaire (Parents Questionnaire - Part 1 (Appendix 9)) formed the 3 composite measures of work stress proposed by Karasek (1979), hereafter called "work related mental demand", "work control" (personal schedule freedom) and "work variety" (intellectual discretion).
70
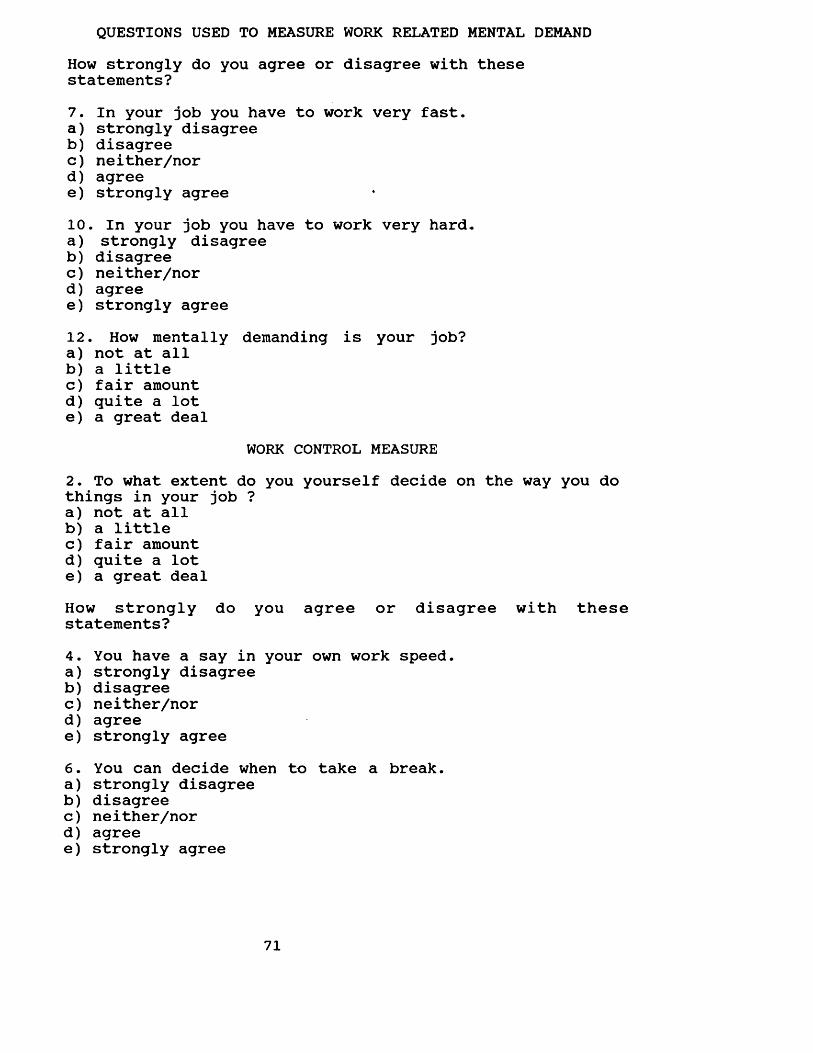
QUESTIONS USED TO MEASURE WORK RELATED MENTAL DEMANDHow strongly do you agree or disagree with these statements?7. In your job you have to work very fast.a) strongly disagreeb) disagreec) neither/nord) agreee) strongly agree10. In your job you have to work very hard.a) strongly disagreeb) disagreec) neither/nord) agreee) strongly agree12. How mentally demanding is your job?a) not at allb) a littlec) fair amountd) quite a lote) a great deal
WORK CONTROL MEASURE2. To what extent do you yourself decide on the way you do things in your job ?a) not at allb) a littlec) fair amountd) quite a lote) a great dealHow strongly do you agree or disagree with these statements?4. You have a say in your own work speed.a) strongly disagreeb) disagreec) neither/nord) agreee) strongly agree6. You can decide when to take a break.a) strongly disagreeb) disagreec) neither/nord) agreee) strongly agree
71
9. Others take decisions concerning your work.a) strongly agreeb) agreec) neither/nord) disagreee) strongly disagree
WORK VARIETY MEASUREHow strongly do you agree or disagree with these statements?3. In your job, you have to do the same thing over and over again.a) strongly agreeb) agreec) neither/nord) disagreee) strongly disagree5. your job provides you with a variety of interesting things.a) strongly disagreeb) disagreec) neither/nord) agreee) strongly agree8. Your job requires you to take the initiative.a) strongly disagreeb) disagreec) neither/nord) agreee) strongly agree
As well as the questions in the marital quality measurement, the questions used to measure work related mental demand, work control and work variety had already been used by other studies.
Questions 2, 3, 7, 8, 10, 12 were adapted from the measure used by Karasek (1979) and Karasek et al (1981). Questions 3, 7, 8 and 10 were also used by the Whitehall II study of British civil servents (Marmot, unpublished), and question 2 was also used by Coburn ( 1979 ). Finally,
72
question 4, 5, 6 and 9 were adapted from the Whitehall II study of British civil servents (Marmot, unpublished).
The method used to check the grouping of questions designed to measure work related mental demand, work control and work variety was to look directly at the correlation matrix and check inter-item correlation, as well as, the principal component analysis. Only the data related to the hypothesis were included in the principal components analyses.
Inspection of the correlation matrix (Table 2.5.2.2.1) showed a correlation among the questions which composed each of the three measures. Questions which composed the work related mental demand dimension were only slightly correlated with the ones that composed the work control and variety dimensions if at all. These results were similar to those obtained by Karasek (1979) and Karasek et al (1981). If the correlations between questions designed to compose a particular measure are small, it is unlikely that they share a common dimension (Norusis, 1986, p. B-43) and the grouping of questions may be incorrect.
73
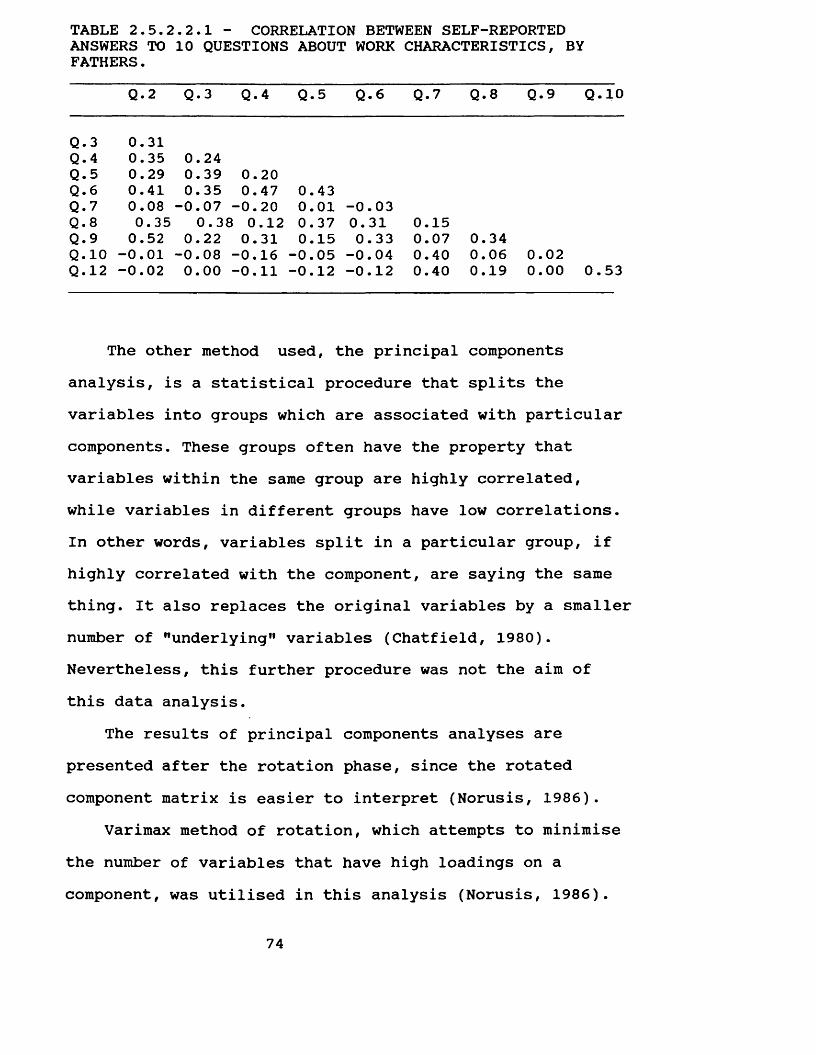
TABLE 2.5.2.2.1 - CORRELATION BETWEEN SELF-REPORTED ANSWERS TO 10 QUESTIONS ABOUT WORK CHARACTERISTICS, BY FATHERS.
Q. 2 Q.3 Q.4 Q. 5 Q.6 Q.7 Q.8 Q.9 Q. 10
Q.3 0.31Q.4 0.35 0.24Q. 5 0.29 0.39 0.20Q . 6 0.41 0.35 0.47 0.43Q.7 0.08 -0.07 -■0.20 0.01 -0.03Q. 8 0.35 0.38 0.12 0.37 0.31 0.15Q.9 0.52 0.22 0.31 0.15 0.33 0.07 0.34Q. 10 -0.01 -0.08 -■0.16 -0.05 -0.04 0.40 0.06 0.02Q . 12 -0.02 0.00 -■0.11 -0.12 -0.12 0.40 0.19 0.00 0.53
The other method used, the principal components analysis, is a statistical procedure that splits the variables into groups which are associated with particular components. These groups often have the property that variables within the same group are highly correlated, while variables in different groups have low correlations. In other words, variables split in a particular group, if highly correlated with the component, are saying the same thing. It also replaces the original variables by a smaller number of "underlying" variables (Chatfield, 1980). Nevertheless, this further procedure was not the aim of this data analysis.
The results of principal components analyses are presented after the rotation phase, since the rotated component matrix is easier to interpret (Norusis, 1986).
Varimax method of rotation, which attempts to minimise the number of variables that have high loadings on a component, was utilised in this analysis (Norusis, 1986).
74
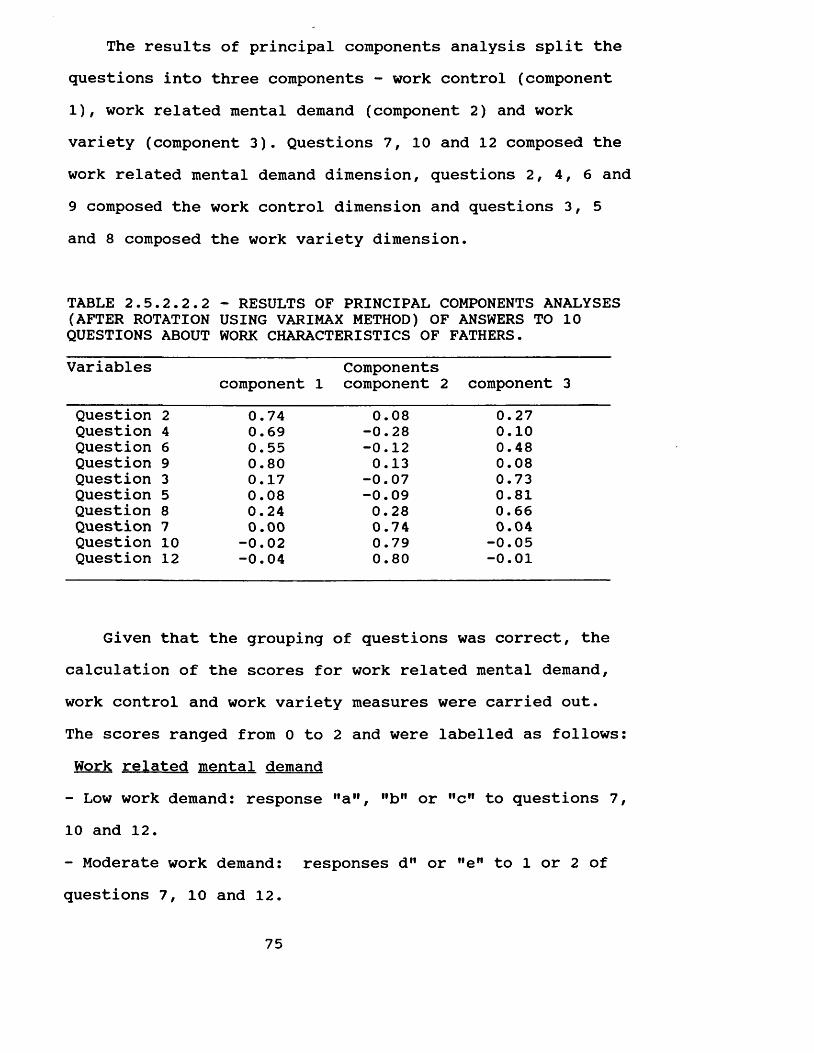
The results of principal components analysis split the questions into three components - work control (component 1), work related mental demand (component 2) and work variety (component 3). Questions 7, 10 and 12 composed the work related mental demand dimension, questions 2, 4, 6 and 9 composed the work control dimension and questions 3, 5 and 8 composed the work variety dimension.
TABLE 2.5.2.2.2 - RESULTS OF PRINCIPAL COMPONENTS ANALYSES (AFTER ROTATION USING VARIMAX METHOD) OF ANSWERS TO 10 QUESTIONS ABOUT WORK CHARACTERISTICS OF FATHERS.Variables
component 1Components component 2 component 3
Question 2 0.74 0.08 0.27Question 4 0.69 -0.28 0.10Question 6 0.55 -0.12 0.48Question 9 0.80 0.13 0.08Question 3 0.17 -0.07 0.73Question 5 0.08 -0.09 0.81Question 8 0.24 0.28 0.66Question 7 0.00 0.74 0.04Question 10 -0.02 0.79 -0.05Question 12 -0.04 0.80 -0.01
Given that the grouping of questions was correct, the calculation of the scores for work related mental demand, work control and work variety measures were carried out.The scores ranged from 0 to 2 and were labelled as follows: Work related mental demand- Low work demand: response "a”, "b" or "c" to questions 7, 10 and 12.- Moderate work demand: responses d" or "eM to 1 or 2 ofquestions 7, 10 and 12.
75
- High work demand: response "d" or "e” to questions 7, 10 and 12.Work control- Low work control: response "a", "b" or "c" to at least 3 of questions 2, 4, 6 and 9.- Moderate work control: response "d" or "e" to 2 of questions 2, 4, 6 and 9.- High work control: response "d" or "e" to at least 3 of questions 2 , 4, 6 and 9.
Work variety- Low work variety: response "a", "b" or "c" to questions 3 , 5 and 8.- Moderate work variety: responses "d" or "e" for 1 or 2 of questions 3, 5 and 8.- High work variety: response MdM or "e” to questions 3, 5 and 8.
2.5.3. Outcome variablesThe decision by which a measure of oral health status
is chosen depends on the purpose to which the measure will be applied. In the present study, the oral health status measures were to be used to check associations between oral health status and psychosocial and behavioural factors.
Considering that dental caries and periodontal disease have different origins, one might expect different behavioural and socio-psychological factors to be linked to
76
each. Therefore, it was decided to keep the measures of the two diseases separate.
The clinical examinations provided data for developing the measures used as the outcome in this research project.A description of the construction of these measures is presented below.
2.5.3.1. Dental caries status indicatorsFor dental caries status, the decayed, missing and
filled surfaces index (DMFS) and the number of sound surfaces (WHO, 1987), as well as the T-Health (Sheiham, Maizels and Maizels, 1987) were adopted.
The DMFS index expresses the amounts of successfully treated disease (filled and crowned surfaces), unsuccessfully treated disease (extracted teeth) and untreated disease (decayed surfaces). In contrast, the number of sound surfaces expresses the amounts of sound tissue.
The DMFS index was calculated summing the decayed, filled and missing surfaces, and the number of sound surfaces summing the sound tooth surfaces.
The T-Health indicator also intends to represent the total amount of sound tooth tissue. However, it differs from the number of sound surfaces indicator in the concept of sound tooth. The concept of sound tooth tissue implicit in the T-Health indicator includes filled and decayed teeth and only missing teeth are excluded from the calculation.
The calculation of the T-Health indicator is based on
77
an arbitrary set of weights of 4, 2 and 1 given to sound, filled and decayed teeth, respectively. The study adopted this concept. However tooth surfaces were used in place of teeth. The calculation was carried out summing up the weighted sound (4), filled (2) and decayed (1) surfaces.
The DMFS, number of sound tooth surfaces and T-Health calculation were based on 128 surfaces (excluding third molars). Surfaces recorded as missing for any other reason than caries, as unerupted or as crowned abutment which were sound prior to treatment were excluded from the calculation of all three indicators.
The indices adopted reflect mainly primary prevention, or lack of it. Nevertheless, it is important to stress that dental caries status in adults measures past dental occurrence, which may not reflect the impact of present dental health behaviour and the socio-economic and psychological environment.
2.5.3.2. Periodontal health status indicatorThe presence or absence of teeth either with gums
bleeding after probing or with pockets was the indicator used in the assessment of the periodontal health status.The indicator was labelled as complete absence of teeth with gums bleeding after probing and with pockets, and presence of any tooth with gums bleeding after probing or pockets.
Since the population studied presented a low
78
prevalence of periodontal disease the scores were calculated only for fathers and mothers.
2.5.4. Confounding variablesSeven generally accepted oral health risk-related
factors were selected as confounding variables to be included in this study. It is unlikely that all relevant variables were identified and measured. No doubt some relevant variables have been excluded. Others that were included may not be important determinants of oral health status.
Since dental caries status and periodontal health status are affected by different factors, different models were built and the specific confounding variables which affect each disease were included in each model (Table2.5.4.1 and 2.5.4.2). Age, socio-economic status, dental attendance and toothbrushing frequency were part of the two models. Sugar consumption and type of toothpaste were included only in the model for dental caries status, and last visit to the dentist was included only in the model for periodontal health status.
Finally, gender was included in the model designed for children. For parents, data was analysed separately for fathers and mothers.
The identification questionnaire (Appendix 7), the parents' questionnaire part 2 (Appendix 9), the 13-year-old cildren questionnaire (Appendix 10) and the clinical exam (Appendix 12) provided the data for developing measures of
79
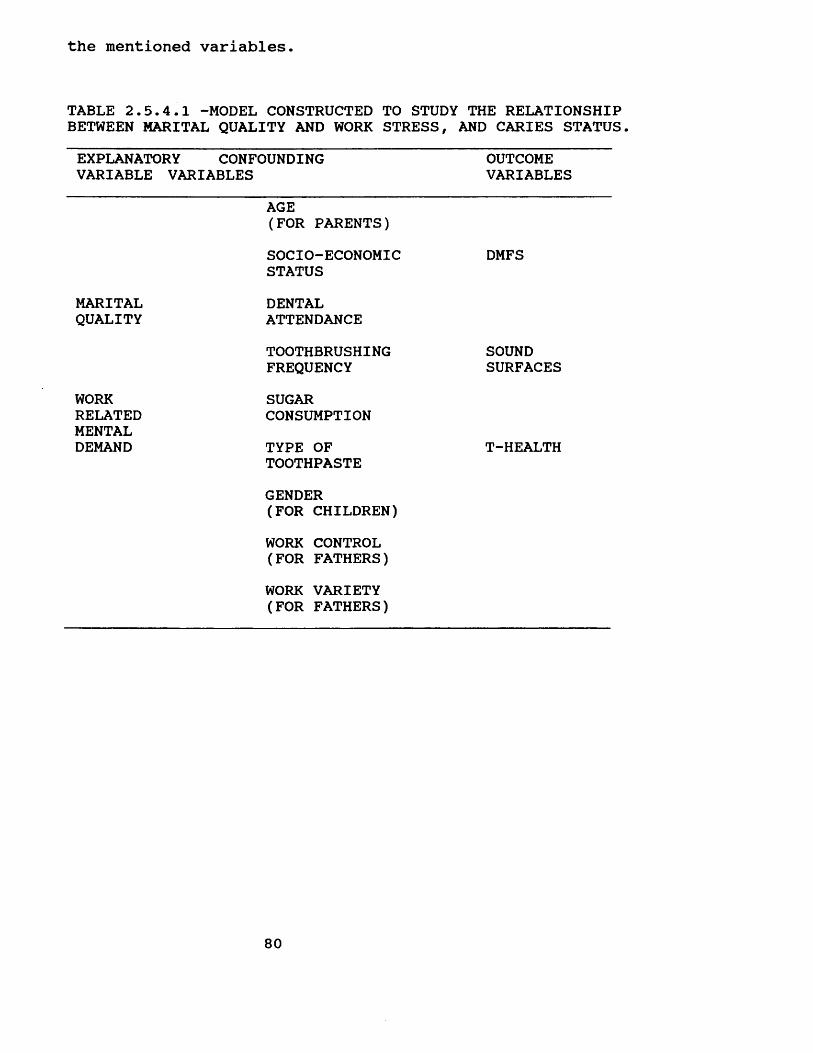
the mentioned variables.
TABLE 2.5.4.1 -MODEL CONSTRUCTED TO STUDY THE RELATIONSHIP BETWEEN MARITAL QUALITY AND WORK STRESS, AND CARIES STATUS.EXPLANATORY CONFOUNDING VARIABLE VARIABLES
OUTCOMEVARIABLES
AGE(FOR PARENTS)SOCIO-ECONOMICSTATUS
DMFS
MARITAL DENTALQUALITY ATTENDANCE
TOOTHBRUSHING SOUNDFREQUENCY SURFACES
WORK SUGARRELATEDMENTAL
CONSUMPTIONDEMAND TYPE OF
TOOTHPASTEGENDER(FOR CHILDREN)WORK CONTROL (FOR FATHERS)WORK VARIETY (FOR FATHERS)
T-HEALTH
80
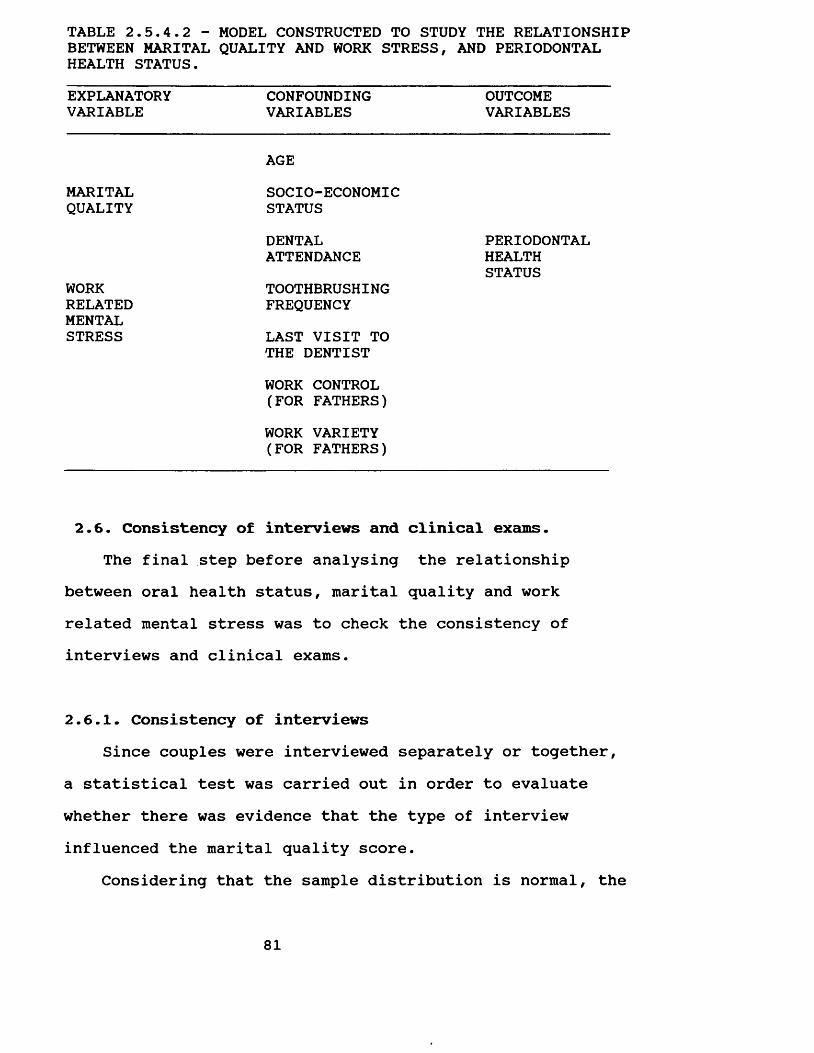
TABLE 2.5.4.2 - MODEL CONSTRUCTED TO STUDY THE RELATIONSHIP BETWEEN MARITAL QUALITY AND WORK STRESS, AND PERIODONTAL HEALTH STATUS.EXPLANATORYVARIABLE
CONFOUNDINGVARIABLES
OUTCOMEVARIABLES
MARITALAGESOCIO-ECONOMIC
QUALITY STATUSDENTAL PERIODONTALATTENDANCE HEALTH
WORK TOOTHBRUSHINGSTATUS
RELATED FREQUENCYMENTALSTRESS LAST VISIT TO
THE DENTISTWORK CONTROL (FOR FATHERS)WORK VARIETY (FOR FATHERS)
2.6. Consistency of interviews and clinical exams.The final step before analysing the relationship
between oral health status, marital quality and work related mental stress was to check the consistency of interviews and clinical exams.
2.6.1. Consistency of interviewsSince couples were interviewed separately or together,
a statistical test was carried out in order to evaluate whether there was evidence that the type of interview influenced the marital quality score.
Considering that the sample distribution is normal, the
81
appropriate statistical test to be adopted is the t test. This procedure was used to test the hypothesis that there is no difference between the marital quality scores for the two groups - those interviewed together and separately.
Firstly, the F value (ratio of the variance as between the larger and smaller samples) was calculated in order to check whether the pooled-variance t test for means or theseparate-variance t test for means should be used. If theobserved significance level for the F test is small (p < 0.05) the two population variances are not equal, and theseparate-variance t test for means should be used. On thecontrary, if the observed significance level for the F test is large (p > 0.05), the pooled-variance t test for means is appropriate. Since the F value was 1.05 (p = 0.817), the pooled-variance t test was chosen.
The pooled-variance t test value was 1.05 (p = 0.3), which means that population means were equal. Thus, there is no evidence that the type of interview influenced the marital quality scores.
2.6.2. Consistency of clinical examsIt is vitally important that a survey involving the
comparison of disease levels in two or more groups of people must provide satisfactory evidence of the diagnostic consistency.
Consistency of exams was assessed throughout the field work. Every tenth subject went through a duplicate examination, and a total of 81 individuals were reexamined.
82
Cohen's Unweighted Kappa Coefficient of Agreement was applied to test for consistency. Agreement between exams was very high (above 95%) for all variables under study.For both DMFS and periodontal pocket depth, the coefficient of agreement was 99%? for the presence or absence of bleeding gums, it was 98%; and for both ODI-S and the presence or absence of calculus, it was 96%. (For a detailed description, refer to appendix 5).
2.7. RESEARCH TEAM PERSONNEL:This was a collaborative study, carried out with
Isabela Almeida Pordeus (I.A.P.). Both researchers interviewed each family, Wagner Segura Marcenes (W.S.M.) on the first visit and I.A.P. on the second.
During the first visit to families, W.S.M. interviewed the parents and collected data about work circumstances, community participation, pattern of leisure, family interaction and general health behaviour (Appendix 8). Validation of the identification questionnaire (Appendix 7) was obtained, and oral examinations were conducted (Appendix 12).
The second visit to families was carried out by I.A.P., who interviewed the parents? the 13-year-old child? and all the brothers and sisters at the age of 10 and above. Data on oral health behaviour (diet, hygiene and pattern of dental attendance), oral health beliefs and family structure in relation to the three previously mentioned
83
oral health behaviour were gathered from the parents and the 13-year-old child (Appendices 9 and 10). Data on their oral health behaviour (diet, hygiene and pattern of dental attendance) were collected from the brothers and sisters at the age of 10 and above (Appendix 11).
84
CHAPTER 3
FINDINGS, DISCUSSION AND CONCLUSIONS
INTRODUCTION
The following five sections of this chapter present and discuss the findings of this study, as well as the conclusions. In Section 3.1 the summary of the data are presented, in Section 3.2 the effect of marital quality and work stress on dental caries status, in Section 3.3 the effect of marital quality and work stress on periodontal health status are analysed, in Section 3.4 the findings are discussed, in Section 3.5 the summary and conclusions are presented and in Section 3.6 the implications for further research.
3.1. DESCRIPTIVE DATABefore presenting the detailed analysis of the
relationship between the variables, the descriptive statistics of all variables studied were calculated.
The study included fifteen variables. Of those eleven were independent variables, namely marital quality, work related mental stress, work control, work variety, age, socio-economic status, toothbrushing frequency , sugar consumption, dental attendance, type of toothpaste, and last visit to the dentist; and four were outcome variables, namely DMFS, number of tooth sound surfaces, T-Health and
85
periodontal health status.Families were grouped according to four socio-economic
groups: A, B, C and D. Each group was composed of 41 families (Table 3.1.3). The age range of parents was from 35 to 44 years (Table 3.1.4 and 3.1.5). The mean age of the fathers was 41.2 (Table 3.1.4) and of the mothers, 38.4 years (Table 3.1.5).
A marital quality score was calculated for each family. The marital quality score ranged from 0 to 4 and presented an almost normal distribution, 12.8%, 25.6%, 31.7%, 23.2% and 6.7% (Table 3.1.1).
The three measures of work characteristics of the fathers - work related mental stress, work control and work variety - ranged from 0 to 2. 79.9% of fathers presentedlow or moderate work control, 90.9% presented low or moderate work variety and 21.3% presented high levels of work related mental demand.
Different patterns of dental attendance were found for children, mothers and fathers. The highest percentage of regular dental attendance was among 13-year-old children, 66.5%, whereas only 46.3% of mothers and 39% of fathers were regular attenders. 57.9% of the 13-year-old children, 58.6% of the mothers and 42.1% of the fathers had visited a dentist in the last 12 months (Table 3.1.3).
Toothbrushing frequency was very high among the families studied. The mean toothbrushing frequency was 2.7 per day for fathers, 3.1 for mothers and 2.7 for 13-year- old children (Tables 3.1.4; 3.1.5 and 3.1.6). Approximately
86
two-thirds of the families reported used a non-fluoride toothpaste (Table 3.1.3).
The mean sugar consumption was high, 6.6 units a day for fathers, 5.6 for mothers and 7.4 for 13 years-old- children (Tables 3.1.4; 3.1.5 and 3.1.6).
The sample population presented a high level of dental caries and a low level of periodontal disease. The mean DMFS of fathers, mothers and 13-year-old children was 64.8, 75.6 and 7.4, respectively. By contrast the level of periodontal disease was low: the mean proportion of teeth with gums bleeding on probing of fathers, mothers and 13- year-old children was 0.25, 0.22 and 0.13, respectively.The mean proportion of teeth with pockets was 0.11 for fathers and 0.07 for mothers. (Tables 3.1.4 and 3.1.5).The 13-year-old children did not present any pockets (Table 3.1.6). Furthermore, 28.4% of fathers, 38.3% of mothers and 58.5% of 13-year-old children did not present either any teeth with gums bleeding on probing or with pockets (Table 3.1.2).
87
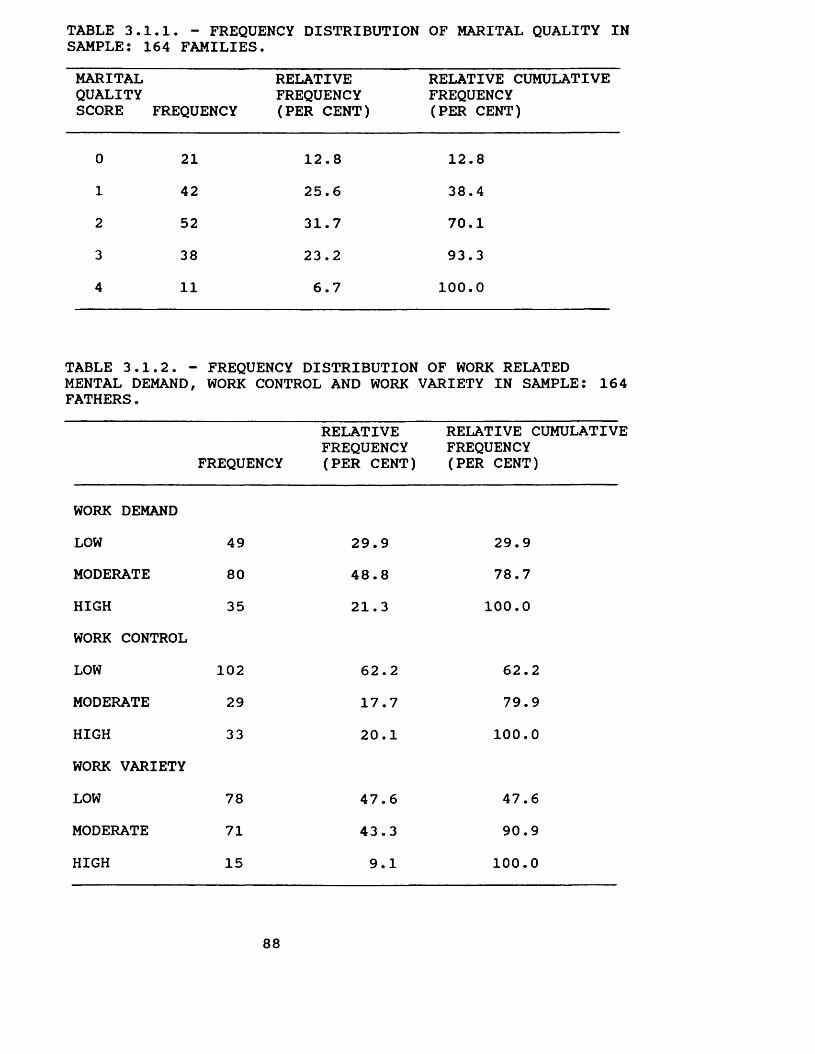
TABLE 3.1.1. - FREQUENCY DISTRIBUTION OF MARITAL QUALITY IN SAMPLE: 164 FAMILIES.MARITALQUALITYSCORE FREQUENCY
RELATIVE FREQUENCY (PER CENT)
RELATIVE CUMULATIVEFREQUENCY(PER CENT)
0 21 12.8 12.81 42 25.6 38.42 52 31.7 70.13 38 23.2 93.34 11 6.7 100.0
TABLE 3.1.2. - MENTAL DEMAND, FATHERS.
FREQUENCY DISTRIBUTION WORK CONTROL AND WORK
OF WORK RELATED VARIETY IN SAMPLE: 164
FREQUENCYRELATIVE FREQUENCY (PER CENT)
RELATIVE CUMULATIVEFREQUENCY(PER CENT)
WORK DEMANDLOW 49 29.9 29.9MODERATE 80 48.8 78.7HIGH 35 21.3 100.0WORK CONTROLLOW 102 62.2 62.2MODERATE 29 17.7 79.9HIGH 33 20.1 100.0WORK VARIETYLOW 78 47.6 47.6MODERATE 71 43.3 90.9HIGH 15 9.1 100.0
88
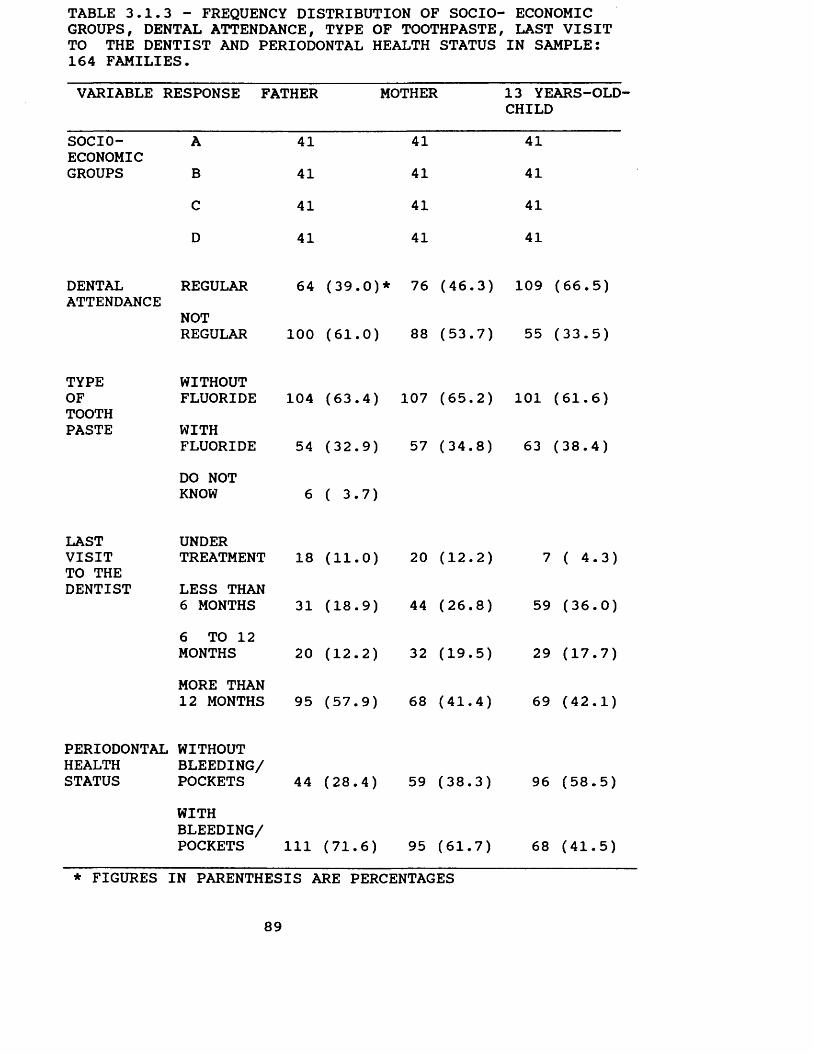
TABLE 3.1.3 - FREQUENCY DISTRIBUTION OF SOCIO- ECONOMIC GROUPS, DENTAL ATTENDANCE, TYPE OF TOOTHPASTE, LAST VISIT TO THE DENTIST AND PERIODONTAL HEALTH STATUS IN SAMPLE: 164 FAMILIES.VARIABLE RESPONSE FATHER MOTHER
SOCIOECONOMICGROUPS
DENTALATTENDANCE
TYPEOFTOOTHPASTE
LAST VISIT TO THE DENTIST
ABCD
REGULARNOTREGULAR
WITHOUTFLUORIDEWITHFLUORIDEDO NOT KNOW
UNDERTREATMENTLESS THAN 6 MONTHS6 TO 12 MONTHSMORE THAN 12 MONTHS
WITHBLEEDING/POCKETS
41414141
64 (39.0)*
100 (61.0)
104 (63.4)
54 (32.9)
6 ( 3.7)
18 (11.0)
31 (18.9)
20 (12.2)
95 (57.9)
44 (28.4)
111 (71.6)
41414141
76 (46.3)
88 (53.7)
107 (65.2)
57 (34.8)
20 (12.2)
44 (26.8)
32 (19.5)
68 (41.4)
59 (38.3)
95 (61.7)
13 YEARS-OLD- CHILD
41414141
109 (66.5)
55 (33.5)
101 (61.6)
63 (38.4)
7 ( 4.3)
59 (36.0)
29 (17.7)
69 (42.1)
96 (58.5)
68 (41.5)
PERIODONTAL WITHOUT HEALTH BLEEDING/STATUS POCKETS
* FIGURES IN PARENTHESIS ARE PERCENTAGES
89
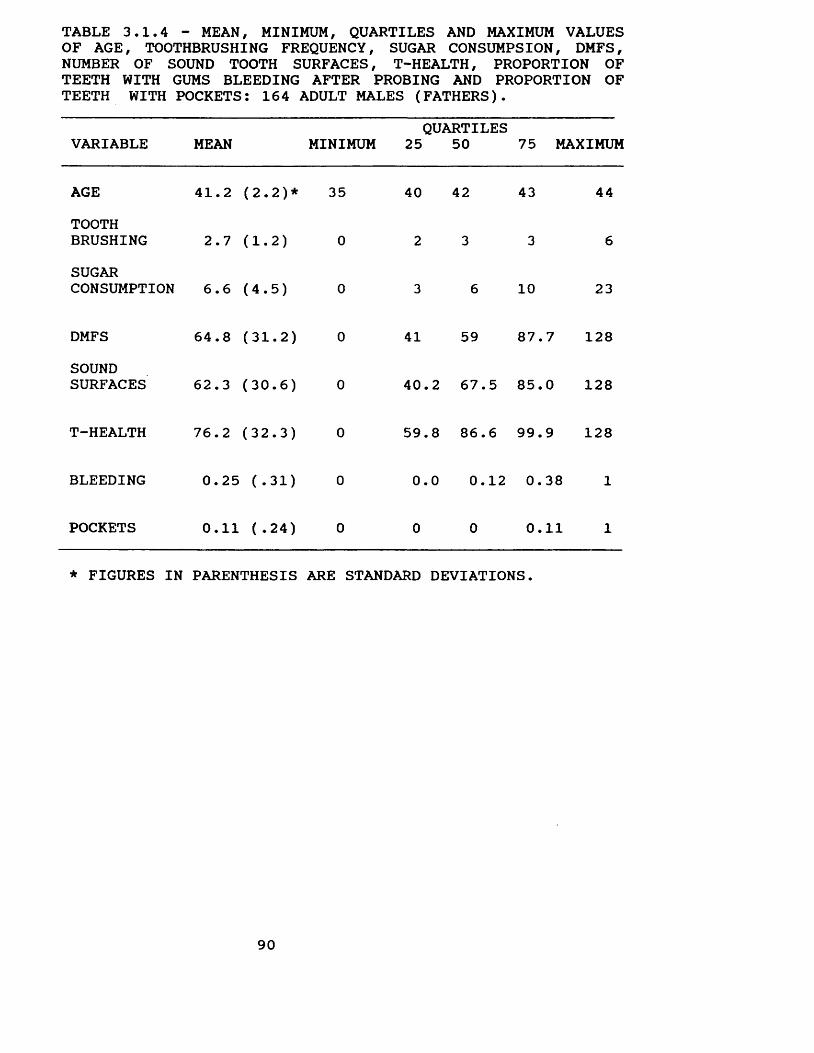
TABLE 3.1.4 - MEAN, MINIMUM, QUARTILES AND MAXIMUM VALUES OF AGE, TOOTHBRUSHING FREQUENCY, SUGAR CONSUMPSION, DMFS, NUMBER OF SOUND TOOTH SURFACES, T-HEALTH, PROPORTION OF TEETH WITH GUMS BLEEDING AFTER PROBING AND PROPORTION OF TEETH WITH POCKETS: 164 ADULT MALES (FATHERS).
VARIABLE MEAN MINIMUMQUARTILES
25 50 75 MAXIMUM
AGE 41.2 (2.2)* 35 40 42 43 44TOOTHBRUSHING 2.7 (1.2) 0 2 3 3 6SUGARCONSUMPTION 6.6 (4.5) 0 3 6 10 23
DMFS 64.8 (31.2) 0 41 59 87.7 128SOUNDSURFACES 62.3 (30.6) 0 40.2 67.5 85.0 128
T-HEALTH 76.2 (32.3) 0 59.8 86.6 99.9 128
BLEEDING 0.25 (.31) 0 0.0 0.12 0.38 1
POCKETS 0.11 ( .24) 0 0 0 0.11 1
* FIGURES IN PARENTHESIS ARE STANDARD DEVIATIONS.
90
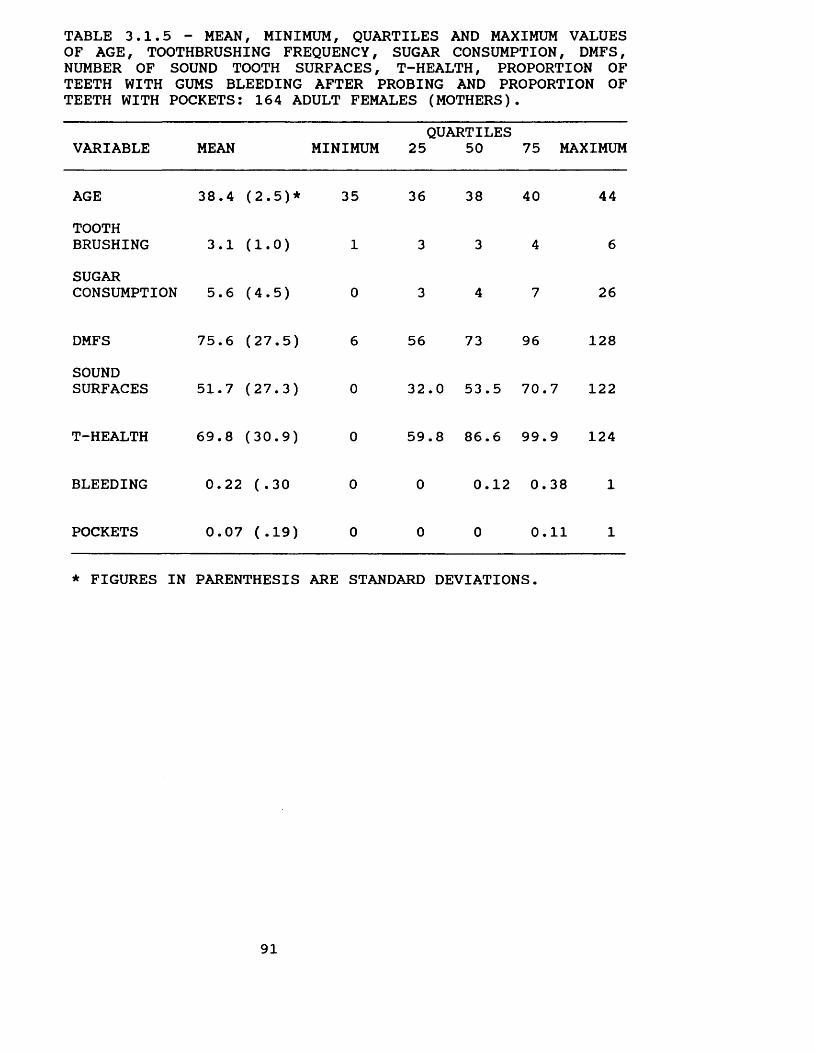
TABLE 3.1.5 - MEAN, MINIMUM, QUARTILES AND MAXIMUM VALUES OF AGE, TOOTHBRUSHING FREQUENCY, SUGAR CONSUMPTION, DMFS, NUMBER OF SOUND TOOTH SURFACES, T-HEALTH, PROPORTION OF TEETH WITH GUMS BLEEDING AFTER PROBING AND PROPORTION OF TEETH WITH POCKETS: 164 ADULT FEMALES (MOTHERS).
VARIABLE MEAN MINIMUMQUARTILES
25 50 75 MAXIMUM
AGE 38.4 (2.5)* 35 36 38 40 44TOOTHBRUSHING 3.1 (1.0) 1 3 3 4 6SUGARCONSUMPTION 5.6 (4.5) 0 3 4 7 26
DMFS 75.6 (27.5) 6 56 73 96 128SOUNDSURFACES 51.7 (27.3) 0 32.0 53.5 70.7 122
T-HEALTH 69.8 (30.9) 0 59.8 86.6 99.9 124
BLEEDING 0.22 ( .30 0 0 0.12 0.38 1
POCKETS 0.07 (.19) 0 0 0 0.11 1
* FIGURES IN PARENTHESIS ARE STANDARD DEVIATIONS.
91
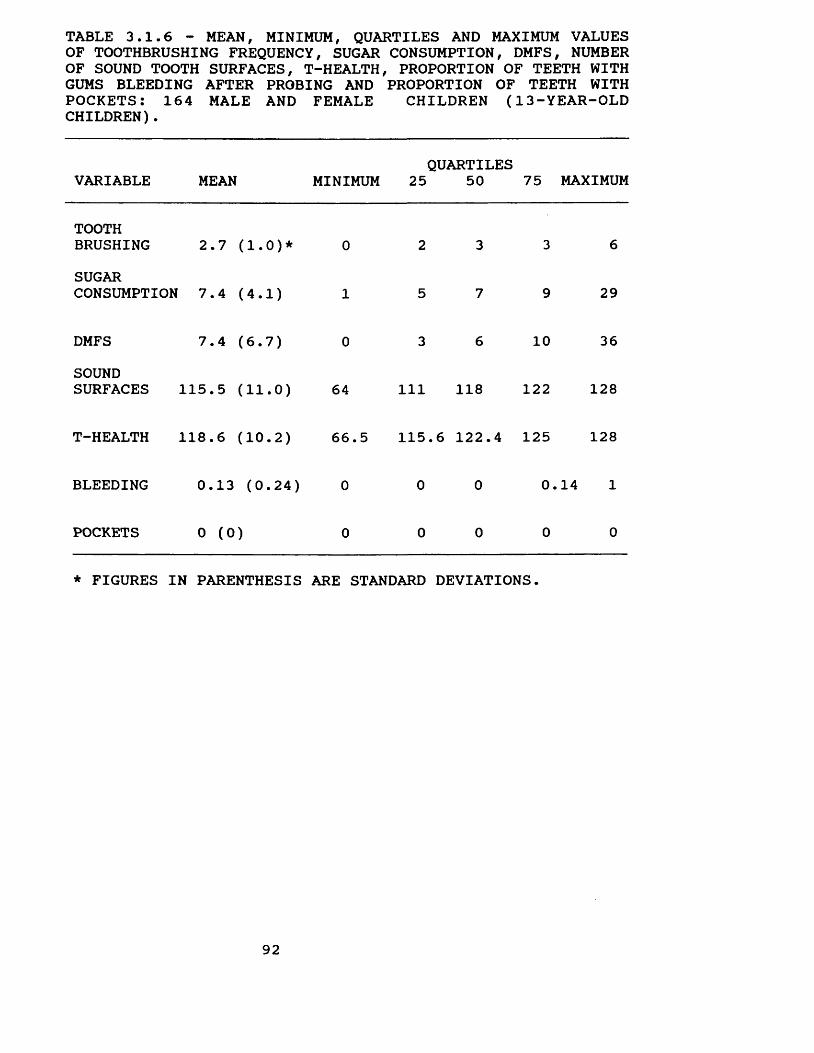
TABLE 3.1.6 - MEAN, MINIMUM, QUARTILES AND MAXIMUM VALUES OF TOOTHBRUSHING FREQUENCY, SUGAR CONSUMPTION, DMFS, NUMBER OF SOUND TOOTH SURFACES, T-HEALTH, PROPORTION OF TEETH WITH GUMS BLEEDING AFTER PROBING AND PROPORTION OF TEETH WITH POCKETS: 164 MALE AND FEMALE CHILDREN (13-YEAR-OLD CHILDREN).
VARIABLE MEAN MINIMUMi
25QUARTILES
50 75 MAXIMUM
TOOTHBRUSHING 2.7 (1.0)* 0 2 3 3 6SUGARCONSUMPTIONr 7.4 (4.1) 1 5 7 9 29
DMFS 7.4 (6.7) 0 3 6 10 36SOUNDSURFACES 115.5 (11.0) 64 111 118 122 128
T-HEALTH 118.6 (10.2) 66.5 115 .6 122.4 125 128
BLEEDING 0.13 (0.24) 0 0 0 0.14 1
POCKETS 0 (0) 0 0 0 0 0
* FIGURES IN PARENTHESIS ARE STANDARD DEVIATIONS.
92
3.2. Marital quality, work stress and dental caries statusIn order to assess the effect of marital quality and
work stress on dental caries status three indices were used: DMFS, number of sound tooth surfaces and the T-Health indicator.
The results are presented separately for fathers, mothers and the 13-year-old children. Work stress - work related mental demand, work control and work variety - was analysed only for fathers.
3.2.1. Marital quality, work stress and fathers' dental caries status.
The first step in analysing the relationship between the variables was to check the model designed for dental caries status, that is, to check if the variables selected are important determinants of dental caries status. To do this, the correlations between all variables were calculated. The model was composed of ten variables: marital quality, work related mental demand, work control, work variety, age, socio-economic status, dental attendance, toothbrushing frequency, sugar consumption and type of toothpaste.
The correlation coefficients and their significance levels should be viewed with caution. Some of the variables did not present a normal distribution, which may distort the calculations. Moreover, the calculations were not based on a single sample. Since six subjects did not know what type of toothpaste they used - fluoride and or non-fluoride
93
toothpaste - the calculations for this variable were based on 158 cases and the calculations for the other variables on 164 cases. Thus, these correlations were used only as an indicator of the importance of the variables in determining the fathers' dental caries status and as an indicator of any substantial correlation between the independent variables.
Despite controlling the ages of subjects by grouping them in an age range within which members are similarly affected by oral disease, it was decided to include age in the correlation matrix calculation in order to check if the range from 35 to 44 years old was sufficient to control this confounding variable.
The correlation coefficients of age and DMFS, number of sound tooth surfaces and T-Health were 0.27 (p < 0.001), -0.27 (p < 0.001) and -0.20 (p < 0.01), respectively, which means that fathers' age was not controlled and should be included in the analysis (Table 3.2.1.1).
Almost all variables studied were correlated with DMFS, number of sound tooth surfaces and T-Health. Except for psychological work demand, work control and work variety, which were only slightly correlated if at all, correlation coefficients were greater than 0.10 (Table 3.2.1.1).
The T-Health measure was more sensitive than the two other dental status indicators used. Except for work related mental demand, work control and work variety, all independent variables were significantly correlated with T-
94
Health. Marital quality, socio-economic status, sugar consumption and dental attendance were significantly correlated at the level of 0.1% (p < 0.001) and age, toothbrushing and type of toothpaste were significant at the level of 1% (p < 0.01). When DMFS and number of sound tooth surfaces were used, only marital quality (p < 0.001) and sugar consumption (p < 0.01) were significantly correlated with fathers' DMFS and number of sound tooth surfaces. Moreover, except for age, marital quality and work demand, the correlation coefficients of the independent variables with T-Health indicator were greater than the ones with DMFS and number of sound tooth surfaces. Taking socio-economic status as an example, the correlation coefficient with the T-Health indicator was 0.42, while the correlation coefficient with DMFS and number of sound tooth surfaces were -0.19 and 0.19, respectively. As expected, the correlation of the independent variables with fathers' T-Health and number of sound tooth surfaces was in the opposite direction to the ones with fathers' DMFS.
Correlations between some independent variables were also found. Nevertheless, it is important to note that no large correlation between the independent variables was found (Table 3.2.1.1). Such large correlation could substantially affect the results of multiple regression analysis. The largest correlation found was between socioeconomic status and dental attendance, a correlation coefficient of -0.45.
In summary, except for work related mental demand, work
95
control and work variety, which were only slightly correlated if at all with DMFS, number of sound tooth surfaces and T-Health, all independent variables studied were correlated with the three dental status indicators used. Moreover, some of the independent variables were correlated among themselves. For example, socio-economic status was correlated with toothbrushing frequency (R=0.38, p < 0.001), sugar consumption (R=-0.22, p < 0.01), dental attendance (R=-0.45, p < 0.001), type of toothpaste (R=0.26, p < 0.001), marital quality (R=0.20, p > 0.01), work control (R=-0.26, p < 0.001), and work variety (R= -0.35, p < 0.001). This calls for the identification of the unique contribution of each independent variable. In order to do this, a multiple regression analysis was carried out.
Before carrying out the multiple regression analysis, a scatter diagram of each variable in relation to the fathers' DMFS, number of sound tooth surfaces and T-health was plotted in order to have a general picture of their relationship. Inspections of these scatter diagrams suggested that the linear regression analysis was appropriate. A search focusing on the residuals was also carried out in order to check the validity of linear regression and is presented at the end of this section.
Since six subjects did not know whether the type of toothpaste they used contained fluoride or not, the unique importance of this variable was checked first excluding these subjects from the data analysis. If the results show
96
that the use of fluoride toothpaste is not an important determinant of dental caries status, the variable would be excluded from the model and the six subjects included in the data analysis.
The partial F test criterion using the level of significance of 5% (p < 0.05) was adopted to evaluate the contribution made by the type of toothpaste (Berenson, Levine and Goldstein, 1983, pp. 275). This involves determining the contribution to the regression sum of squares made by each independent variable after all other independent variables have been included in a model (Berenson, Levine and Goldstein, 1983, p. 275).
A multiple regression analysis was carried out and a significant linear relationship between the variables and the fathers' DMFS (p < 0.00005), fathers' number of sound tooth surfaces (p < 0.00005) and T-health (p < 0.00005) was found. Nevertheless, the type of toothpaste used did not significantly contribute to the variance of the father's DMFS (p > 0.05), fathers' number of sound tooth surfaces (p < 0.05) and fathers' T-health (p < 0.05).
The confounding variable, use of fluoride toothpaste, was excluded from the model, and the six subjects were included in the following steps of this data analysis.
The next step was to check the unique contribution of the other variables when all subjects had been included in the data analysis. To build the model which best fits the data, the backward elimination method was chosen. The removal criteria adopted was the maximum probability of F-
97
to-remove equal to 0.10. That is, variables with a probability of F greater than 0.10 would be removed.
Marital quality, age, sugar consumption and socioeconomic status were selected as significant determinants of the fathers' DMFS, number of sound tooth surfaces and T- health.
The variables known as work related mental demand, work control, work variety, dental attendance and toothbrushing frequency (p > 0.10) did not significantly contribute to the explanation of the father's DMFS, number of sound tooth surfaces and T-health variance, thus they were excluded from the model.
The partial F test criterion using the level of significance of 5% (p < 0.05) was carried out and confirmed that work related mental demand, work control, work variety, dental attendance and toothbrushing frequency did not significantly improve the model.
The next step in this data analysis was to check for interaction among the variables, which could distort these results. It was possible that an important variable could have been excluded or, alternatively, one of the variables in the resulting model might not be important.
The method used to check the interaction was to calculate a two way interaction for all variables, carry out a regression analysis adding the new variables to the model and check if they improved the model significantly.
The partial F test criterion using the level of
98
significance of 5% (p < 0.05) suggested that there was no interaction, since the new variables did not improve the model significantly (p > 0.05).
In conclusion, the model that best fits the data is composed of four independent variables: marital quality, sugar consumption, socio-economic status and age.
The results of the multiple regression analysis suggested several other findings. There is a highly significant linear relationship between marital quality, sugar consumption, age and socio-economic status, and the fathers' DMFS (p < 0.00005), number of sound tooth surfaces (p < 0.00005) and T-health (p < 0.00005). Moreover, the model explained 26% of the DMFS variance, 25% of the number of sound tooth surfaces variance and 35% of the T-health variance.
Marital quality contributed significantly to the relationship between the model and fathers' DMFS, number of sound tooth surfaces and T-health (p < 0.0001) (Table3.2.1.2, 3.2.1.3, 3.2.1.4).
Fathers from families who experienced a higher level of marital quality had lower DMFS and higher number of sound tooth surfaces and T-health than fathers from families with a lower level of marital quality. This was shown by the regression coefficients of marital quality and fathers' DMFS, number of sound tooth surfaces and T-health, being - 9.17, 8.87 and 7.68, respectively. (Table 3.2.1.2, 3.2.1.3, 3.2.1.4) .
Sugar consumption (p < 0.05) and age (p < 0.0005) also
99
contributed significantly to the relationship between the model and fathers' DMFS, number of sound tooth surfaces and T-health (Table 3.2.1.2, 3.2.1.3, 3.2.1.4). Socio-economic status contributed significantly to the relationship between the model and fathers' DMFS (p < 0.05) and T-health (p < 0.00005). However, socio-economic status did not contribute to the relationship with the fathers' number of sound tooth surfaces ( p > .05 ) ( Tables 3.2.1.2, 3.2.1.3,3.2.1.4 ).
Subjects with higher sugar consumption, from lower socio-economic groups and older presented a higher DMFS, lower number of sound tooth surfaces and T-health than subjects with lower sugar consumption, from upper socioeconomic groups and younger. The regression coefficients for sugar consumption, socio-economic status and age were 1.08, -0.26 and 4.03, respectively when DMFS was the outcome? as opposed to -7.07, 0.24 and -3.83, respectively when the number of sound tooth surfaces was the outcome? and -1.09, 0.73 and -3.69, respectively, when T-health was the outcome (Table 3.2.1.2, 3.2.1.3, 3.2.1.4).
Marital quality was the most important variable to explain the variance in the fathers' DMFS and number of sound tooth surfaces, while socio-economic status was the most important variable to explain the variance in their T- Health. The relative importance of each variable was assessed earring out the partial correlation test, which is the correlation between the variables and the outcome variable
100
when the linear effects of the other variables in the model have been removed.
The partial correlation coefficient between marital quality, age, sugar consumption, socio-economic status, and fathers' DMFS were -0.35 , 0.31, 0.17 and -0.15, respectively (Table 3.2.1.2); fathers' number of sound tooth surfaces were 0.34, -0.30, -0.17 and 0.14 respectively (Table 3.2.1.3), and fathers' T-Health were 0.31, -0.29, -0.18 and 0.40, respectively (Table 4.2.1.4).
Marital quality was of clinical as well as statistical significance. The clinical importance of marital quality was calculated by assessing the mean difference between the fathers' DMFS in those from families with both high and low levels of marital quality.
An arbitrary criterion was adopted for high, moderate and low level of marital quality. This criterion was based on the number of successful dimensions in each family (see Chapter 2, section 2.5.2.1). Four dimensions were used, namely communication, companionship, satisfaction with marriage and satisfaction with children. Success in three or four dimensions was considered as a high level of marital quality, two dimensions as moderate, and one dimension or none at all as low.
The difference between the lowest value of high level of marital quality (score 3) and the highest value of low level of marital quality (score 1) multiplied by the regression coefficient represents the difference in the DMFS between those with high and those with low level of
101
marital quality.A similar procedure was carried out to assess the
clinical importance of sugar consumption and socio-economic status.
The criteria adopted for low, moderate and high daily sugar consumption was less than three units, three to six and more than six units, respectively (Varveri and Bellagamba, 1986).
The difference between high (seven units) and low (three units) sugar consumption multiplied by the regression coefficient represents the difference in the DMFS between those with high and those with low sugar consumption.
The criterion adopted for socio-economic status was the ABA-ABIPEME (Appendix 3). The difference between upper (score 35) and lower (score 9) socio-economic groups multiplied by the regression coefficient represents the difference in the DMFS between those from upper and those from lower socio-economic groups.
A different procedure was adopted for age and the variation in the fathers' DMFS is represented by each year.
High levels of marital quality lead to a mean difference in the fathers' DMFS of 18.34, when compared to low levels of marital quality and adjusted to take sugar consumption, socio-economic status and age into account.
The mean difference in the fathers' DMFS as between those with high and low sugar consumption, from upper and
102
lower socio-economic groups and for each year of age was 4.32, 6.76 and 4.03, respectively (Table 3.2.1.5).
The next step in this data analysis was to conduct a search focused on residuals to look for evidence that the necessary assumptions were not violated. Assumptions of linearity, constant variance and normality were checked.
Firstly, the residuals were plotted against the predicted values of the fathers' DMFS, number of sound tooth surfaces and T-health in order to check for linearity and constant variance. The residuals were randomly distributed in a band about the horizontal straight line through zero, which means that the relationship was truly linear and the variance constant. Any observable pattern would suggest that the straight line did not fit the data. Also, if the spread of the residuals increases or decreases with predicted values, the assumption of constant variance may be questioned.
Secondly, the residuals were plotted against the independent variables. This procedure allowed checks of the assumption of constant variance for the variables in the equation and also allowed an assessment of whether those variables excluded from the equation explained some of the variability of the dental indicators used.
The results supported the assumption of the constant variance of the independent variables for all values of the fathers' DMFS, number of sound tooth surfaces and T-Health, since the residuals were randomly distributed.
The results also confirmed that work related mental
103
demand, work control, work variety, type of toothpaste, toothbrushing frequency and dental attendance did not contribute significantly to explaining the variability in the fathers' DMFS, number of sound tooth surfaces and T- health, since the residuals did not show any pattern.
Thirdly, a histogram of the residuals was constructed in order to investigate the assumption of normality. The sample residuals were approximately normal (Fig.3.2.1.1.8), which means that the assumption was correct. However, it is unreasonable to expect the observed residuals to be exactly normal, since some deviation is expected due to sampling variation (Norusis, 1986? Healy, Osborn and Hills, 1988-89).
In order to make sure that the relationship between marital quality and dental caries status was not due to an association between marital quality and socio-economic status, age and sugar consumption, both a cross tabulation of these variables and the chi-square test were carried out. The results showed that there was no significant association between marital quality, socio-economic status (p > 0.10), age (p > 0.10) and sugar consumption (p > 0.10). Moreover, a regression analysis was carried out to check whether marital quality is associated with sugar consumption and, thus, indirectly associated with dental caries status. Age and socio-economic status were taken into account in this regard. The results of multiple regression analysis showed no significant relationship
104

between marital quality and sugar consumption (p > 0.10).
105
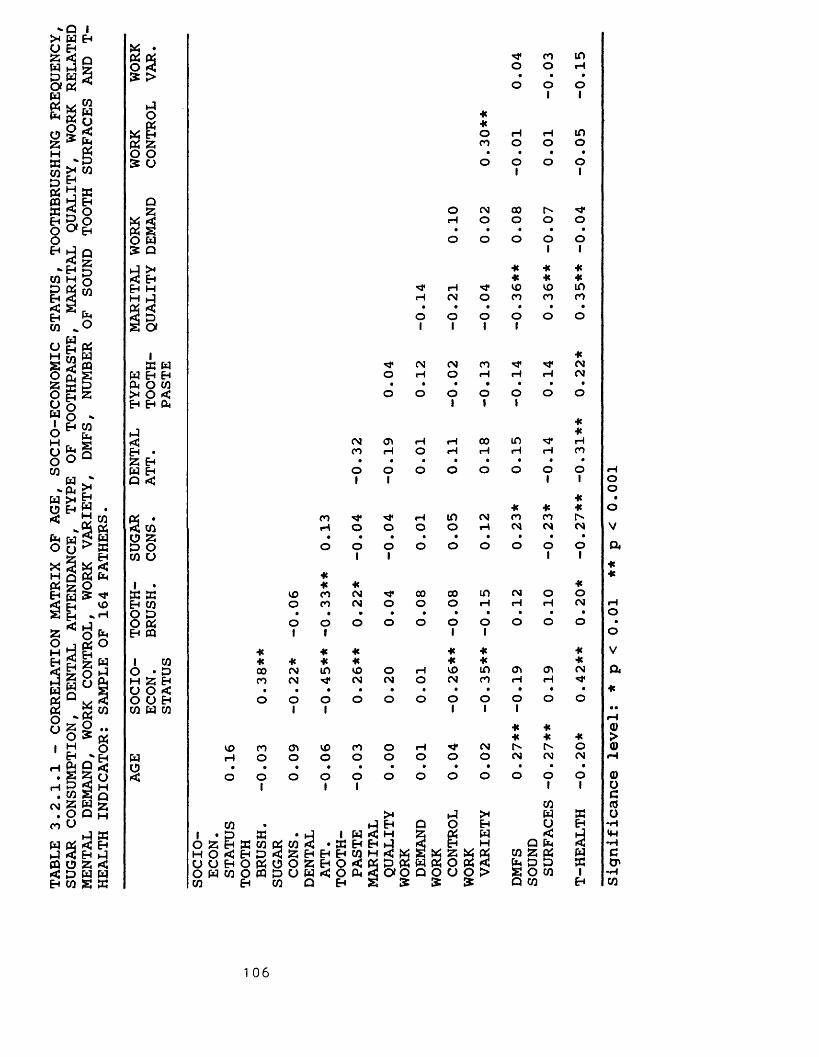
TABLE
3.2.1.1
- CORRELATION
MATRIX
OF AGE,
SOCIO-ECONOMIC
STATUS,
TOOTHBRUSHING
FREQUENCY,
SUGAR
CONSUMPTION, DENTAL
ATTENDANCE,
TYPE
OF TOOTHPASTE,
MARITAL
QUALITY,
WORK RELATED
MENTAL
DEMAND,
WORK
CONTROL, WORK
VARIETY,
DMFS,
NUMBER
OF SOUND
TOOTH
SURFACES
AND
T-HEALTH
INDICATOR: SAMPLE
OF 164 FATHERS.
« •X X 1* CO inO 3 O o rH5 > • • 9o 01 01I 1O *Oh «X Eh o H rH inS z CO O o oo o • • 9 •£ u o 01 o 01QZ o CM 00W rH O o o oCtJ S • • • • •O W o o o o o5 Q 1 1
* ■K He3 Eh * He *Eh H rH VO VO inH h3 rH CM O CO CO CO< • • • 0 • •2 tD o O o o o os o» 1 1 1 1i *S3 w ^ CM CM CO -3* CMW Eh Eh O H O rH rH rH CMa O CO • • • • 0 • •><o< o o o O o O OEh Eh A 1 1
**< CM O' «H rH 00 in "3* rHEh • CO H O rH rH rH rH COa Eh 0 • • • • • • .W Eh O o o o O O O OQ ■< 1 1 1 1** * *
Oh • CO *3* ^ H in CM CO CO3 CO rH O O O o rH CM CM CMo z • • • • • • 9 • •D O O o o o o O o o OCO o 1 1 1 1«1 • « * «S3 S3 VO co CM ^ 00 00 in CM o oEh CO O CO CM o o O rH rH H CMO X • • • • • • • • • •O « o o O o o o O O o oEh PQ 1 I 1 1
■K * * * ♦ He1 CO He -K He He * * HeO • P 00 <\J in VO O rH VO in O' O' CMH £ Eh co CM CM CM O CM co rH rHu o ■< • • • • • • • • • 0 •O O eh o O o o o o o o O O oCO W CO 1 i 1 i 1* *Ht * Hevo co o' VO CO O H ** CM Ow rH O o o o O O o O CM CM CMo • • • • • • • • • • • •■< o o 1 o 01 01 o o o O O O1 O1
CO>< .J >H X S3CO hJ Eh Q o EH o Eh1 • p £ 1 W < H Z X W < AO 25 E-* X CO & CO 3 •S3 Eh Eh EH H Q Oh 3H O rtJ Eh D 2 Z Eh Eh Eh CO H < x s X z X Oh CO Z WUCJEh0P300ZEh0<« p « w « o X 3 Pm D 5 Xo w c o o c q d o w c o c u 2 OOQOUO!> SOW 1CO Eh CO Q Eh S 5: £ Q CO Eh
oo•oVQ*«*rHO•oVa
a)oco-H<U-HCO'*HCO
1 0 6
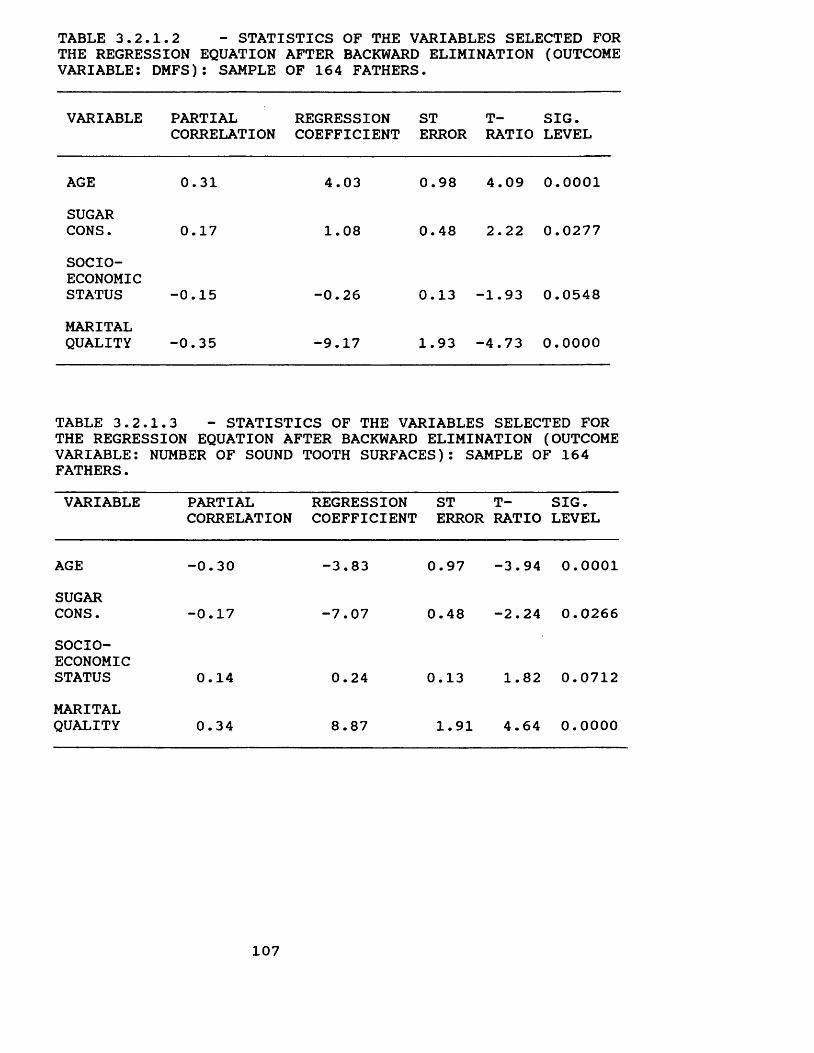
TABLE 3.2.1.2 - STATISTICS OF THE VARIABLES SELECTED FORTHE REGRESSION EQUATION AFTER BACKWARD ELIMINATION (OUTCOMEVARIABLE: DMFS): SAMPLE OF 164 FATHERS.
VARIABLE PARTIALCORRELATION
REGRESSIONCOEFFICIENT
STERROR
T- SIG. RATIO LEVEL
AGE 0.31 4.03 0.98 4.09 0.0001SUGARCONS. 0.17 1.08 0.48 2.22 0.0277SOCIOECONOMICSTATUS -0.15 -0.26 0.13 -1.93 0.0548MARITALQUALITY -0.35 -9.17 1.93 -4.73 0.0000
TABLE 3.2.1.3 - STATISTICS OF THE VARIABLES SELECTED FOR THE REGRESSION EQUATION AFTER BACKWARD ELIMINATION (OUTCOME VARIABLE: NUMBER OF SOUND TOOTH SURFACES): SAMPLE OF 164 FATHERS.VARIABLE PARTIAL
CORRELATIONREGRESSIONCOEFFICIENT
STERROR
T- SIG. RATIO LEVEL
AGE -0.30 -3.83 0.97 -3.94 0.0001SUGARCONS. -0.17 -7.07 0.48 -2.24 0.0266SOCIOECONOMICSTATUS 0.14 0.24 0.13 1.82 0.0712MARITALQUALITY 0.34 8.87 1.91 4.64 0.0000
107
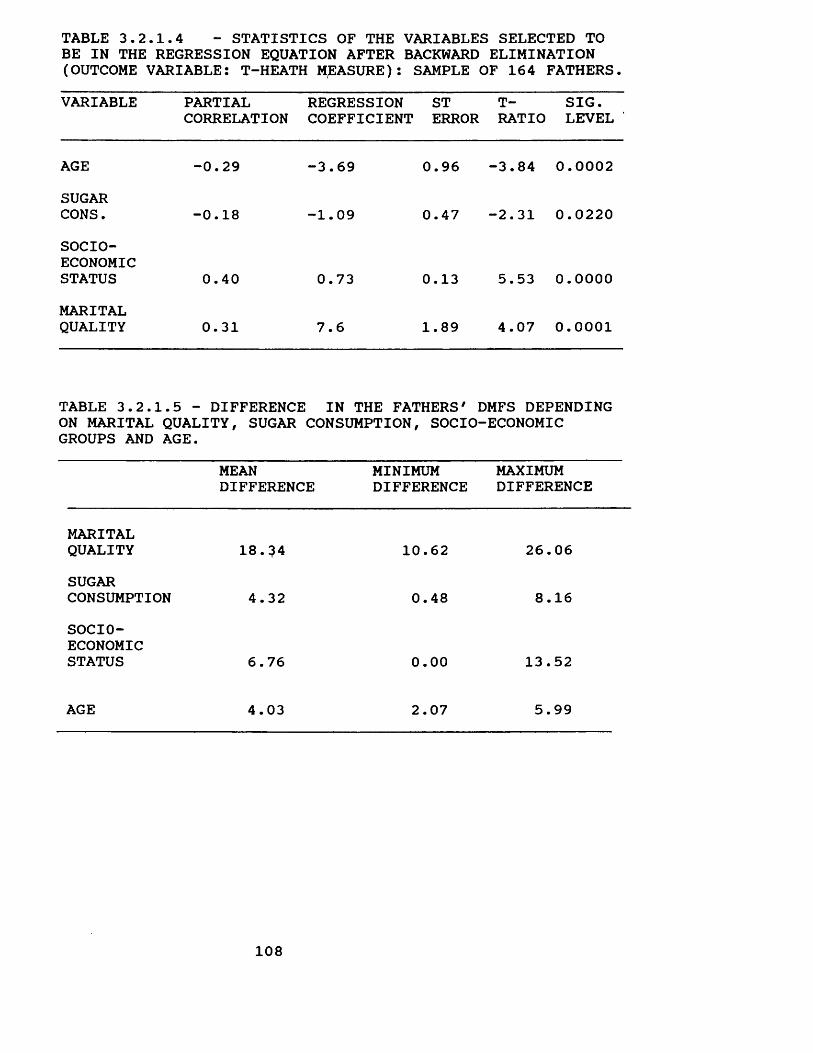
TABLE 3.2.1.4 - STATISTICS OF THE VARIABLES SELECTED TOBE IN THE REGRESSION EQUATION AFTER BACKWARD ELIMINATION(OUTCOME VARIABLE: T-HEATH MEASURE): SAMPLE OF 164 FATHERS.VARIABLE PARTIAL
CORRELATIONREGRESSION ST COEFFICIENT ERROR
T- SIG. RATIO LEVEL
AGE -0.29 -3.69 0.96 -3.84 0.0002SUGARCONS. -0.18 -1.09 0.47 -2.31 0.0220SOCIOECONOMICSTATUS 0.40 0.73 0.13 5.53 0.0000MARITALQUALITY 0.31 7.6 1.89 4.07 0.0001
TABLE 3.2. ON MARITAL GROUPS AND
1.5 - DIFFERENCE QUALITY, SUGAR AGE.
IN THE FATHERS' DMFS DEPENDING CONSUMPTION, SOCIO-ECONOMIC
MEAN MINIMUM DIFFERENCE DIFFERENCE
MAXIMUMDIFFERENCE
MARITALQUALITY 18.^4 10.62 26.06SUGARCONSUMPTION 4.32 0.48 8.16SOCIOECONOMICSTATUS 6.76 0.00 13.52
AGE 4.03 2.07 5.99
108
3.2.2. Marital quality and mothers' dental caries status.A similar procedure described for the fathers' data
analysis was adopted to analyse the relationship between marital quality and the mothers' DMFS, number of sound tooth surfaces and T-health measure.
The correlation between all variables was calculated and showed a different pattern from the one observed for the fathers (Table 3.2.2.1). Age was not correlated with the mothers' DMFS, number of sound tooth surfaces and T- Health indicator. This means that grouping subjects in a age range from 35 to 44 years old controlled this variable for the mothers.
Marital quality (p < 0.001), socio-economic status (p < 0.001), toothbrushing frequency (p < 0.01) and dental attendance (p < 0.01) were significantly correlated with mothers' DMFS and number of sound tooth surfaces. The other variables were not significant at the level of 1% ( p <0/01 ).
As with the fathers, the T-health indicator was more sensitive than the other two caries status indices. All independent variables were significantly correlated with T- Health and, except for marital quality, the correlation values were greatet*. Marital quality, socio-economic status, toothbrushing frequency and dental attendance were significant at the level of 0.1% (p < 0.001). Sugar consumption and type of toothpaste were significant at the level of 1% (p < 0.01).
Correlations between some independent variables were
109
also found. Nevertheless, no correlation large enough to affect the multiple regression test was found. The largest correlation was between socio-economic status and dental attendance (R=-0.60), which is acceptable for the regression analysis. Since there were no missing values in any of the mothers' variables, all subjects were included in the data analysis from the beginning.
Multiple regression analysis using the backward elimination method selected the following variables: 1) marital quality and socio-economic status asdeterminants of the mothers' DMFS? 2) marital quality and dental attendance as determinants of mothers' number of sound tooth surfaces? and 1) marital quality, socioeconomic status and dental attendance as determinants of mothers' T-Health.
The partial F-test criterion using the level of significance of 5% (p < 0.05) confirmed that the variables excluded using backward elimination method did not significantly improve the three models built.
Interaction was also checked using the same criteria adopted for fathers. The partial F-test criterion using the level of significance of 5% (p < 0.05) suggested that there was no interaction.
The results of the multiple regression analysis showed a highly significant linear relationship between marital quality and socio-economic status, and mothers' DMFS (p < 0.00005)? marital quality and dental attendance, and number
110
of sound tooth surfaces (p < 0.00005); and marital quality, socio-economic status and dental attendance, and T-health (p < 0.00005). The models explained 16% of the variance in DMFS, 16% of the variance in number of sound tooth surfaces, and 35% of the variance in T-health.
Marital quality (p < 0.0005) contributed significantly to the relationship between the independent variables that composed the model and the three dental caries indicators. Socio-economic status contributed significantly to that relationship when DMFS (p < 0.005) and T-health (p < 0.00005) were used as outcome variables, but not when the number of sound tooth surfaces (p > 0.05) was used. Dental attendance contributed to that relationship when the number of sound tooth surfaces (p < 0.005) and T-health (p < 0.05) were used but not when DMFS (p > 0.05) was used.
As with the fathers, mothers from families who experienced a higher level of marital quality had a lower DMFS, a higher number of sound tooth surfaces and T-health than that who experienced a lower level of marital quality. The regression coefficients between marital quality and DMFS, number of sound tooth surfaces and T-health were -7.01, 8.06 and 6.77, respectively (Tables 3.2.2.2, 3.2.2.3 and 3.2.2.4).
Mothers from upper socio-economic groups presented a lower DMFS and a higher T-health than mothers from the lower socio-economic groups. The regression coefficients between socio-economic groups and DMFS and T-Health were - 0.38 and 0.70, respectively (Tables 3.2.2.2 and 3.2.2.4).
Ill
Mothers who were regular dental attenders presented a higher number of sound tooth surfaces and T-health than mothers who were not regular attenders. The regression coefficients between dental attendance and number of sound tooth surfaces and T-health were -12.08 and -10.44, respectively (Tables 3.2.2.3 and 3.2.2.4).
As for fathers, marital quality was the most important variable to explain the variance in the DMFS and number of sound tooth surfaces in mothers, and socio-economic status was the most important variable to explain the variance in mothers' T-health. The partial correlation coefficients between marital quality and socio-economic status, and mothers' DMFS were -0.29 and -0.24, respectively (Table 3.2.2.2); the partial correlation between marital quality and dental attendance and mothers' number of sound tooth surfaces were 0.34 and -0.23 (Table 3.2.2.3); and the partial correlation between socio-economic status, marital quality and dental attendance were 0.34, 0.28 and -0.16, respectively (Table 3.2.2.4).
Marital quality was of clinical as well as statistical significance for the mothers. There was a mean difference in the DMFS of 14.02 between mothers from families with a high level of marital quality and mothers from families with a low level of marital quality as adjusted by socioeconomic status. The mean difference in those from upper and lower socio-economic groups was 9.88.
The search on residuals showed that the assumptions of
112
linearity, constant variance and normality were not violated.
The plot of the residuals against the toothbrushing frequency, sugar consumption and type of toothpaste confirmed that they did not contribute significantly to explain the variance in mothers' DMFS, number of sound tooth surfaces and T-health. The plot of residuals against socio-economic status confirmed that socio-economic status did not contribute significantly to explain the variance in mothers' number of sound tooth surfaces. The plot of residuals against dental attendance confirmed that dental attendance did not contribute significantly to explain the variance in mothers' DMFS.
Finally, the relationship between marital quality and the variables that composed each model was checked. The results of cross tabulation and the chi-square test showed that there was no association between marital quality and socio-economic status (p > 0.10), or marital quality and dental attendance (p < 0.10). The results of the regression analysis after adjusting to take account of socio-economic status also showed that there is no significant relationship between marital quality and dental attendance (p > 0.05).
113
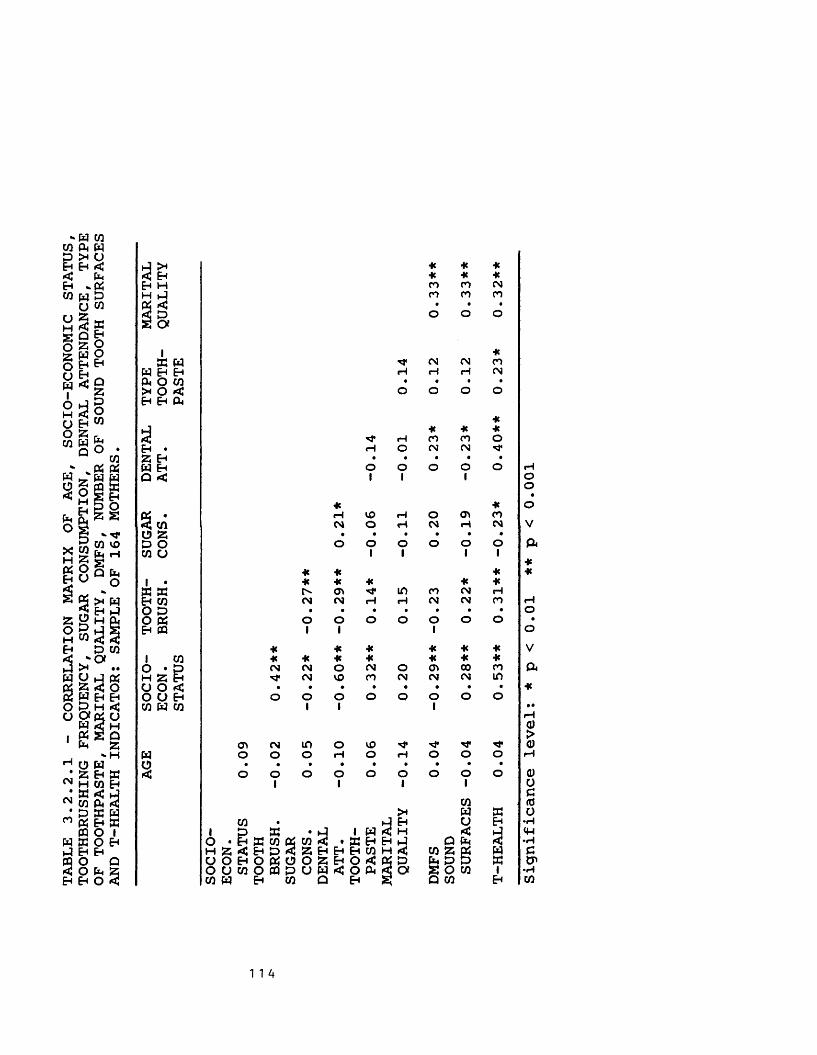
B *‘ Tr
H 2(HIOq ^B U q
<NCM
0 ft ^EnK H CO Eh ft < ft A 3
cocoD S N ft Eh ft ft O I W W O E ft Eh Eh ft O Q*: o ft 2Eh Eh O <
ft X He He He< Eh He He HeEh H CO CO CMH ft CO CO COft < • • •5 P o o OS CX1 Heft ft CM CM COW Eh Eh rH rH H CMft O CO • • •X O < o O O OEh Eh ft
Heft He He HeSj rH CO CO OEh • rH O CM CM "tf*2 Eh • • • • •ft Eh O o o o oQ «C 1 1 1* Heft * rH VO H o <p CO< CO CM o rH CM rH CMO 2 • • • • • •P O O o o o O oCO O 1 1 1 1
* He He1 • * * * He Heft ® X 0> in CO CM rHEh CO CM CM rH rH CM CM COO ED • • • • • • •O ft O O O O O O OEh ft 1 1 1He He HC He He He1 CO * * He He He He HeO • p CM CM O CM O Cft 00 COH 2 |h "3* CM VO co CM CM CM inO O < • • • • • • • •O U Eh O O o o o O o oCO ft CO 1 1 1
<y* cm in o VO ■«*ft o o o rH O rH o o oo • • • • • • • • •< o o 1 o O1 o 01 o 01 o
COX ft ftCO ft Eh o Eh1 D X • 1 ft•< h < ftO • Eh X CO ftCO < *X Eh Eh ft Q ft SiH 2 C E D < 2 Eh Eh Eh CO H < CO 2 ftU 0 E 0 f t 0 0 2 E n 0 < ft P ft P ft ftOUCOOCQDOW<Oft 3 S O W iCO ft Eh CO Q Eh 2 Q CO Eh
rHOO•o
V ft**rHO•oV ft■K
a)oc<do•H<W•HCtP•rHCO
1 1 4
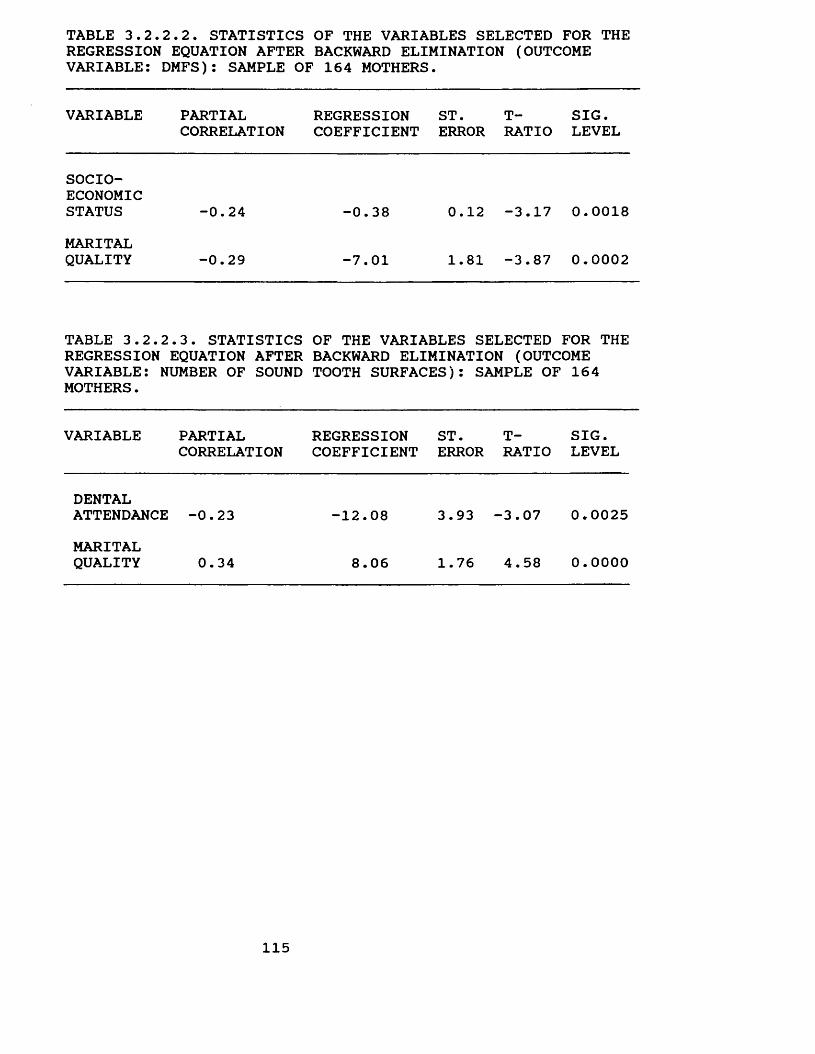
TABLE 3.2.2.2. STATISTICS OF THE VARIABLES SELECTED FOR THEREGRESSION EQUATION AFTER BACKWARD ELIMINATION (OUTCOMEVARIABLE: DMFS): SAMPLE OF 164 MOTHERS.
VARIABLE PARTIALCORRELATION
REGRESSIONCOEFFICIENT
ST.ERROR
T-RATIO
SIG.LEVEL
SOCIOECONOMICSTATUS -0.24 -0.38 0.12 -3.17 0.0018MARITALQUALITY -0.29 -7.01 1.81 -3.87 0.0002
TABLE 3. 2.2.3. STATISTICS REGRESSION EQUATION AFTER VARIABLE: NUMBER OF SOUND MOTHERS.
OF THE VARIABLES SELECTED FOR THE BACKWARD ELIMINATION (OUTCOME TOOTH SURFACES): SAMPLE OF 164
VARIABLE PARTIALCORRELATION
REGRESSIONCOEFFICIENT
ST.ERROR
T-RATIO
SIG.LEVEL
DENTALATTENDANCE -0.23 -12.08 3.93 -3.07 0.0025MARITALQUALITY 0.34 8.06 1.76 4.58 0.0000
115
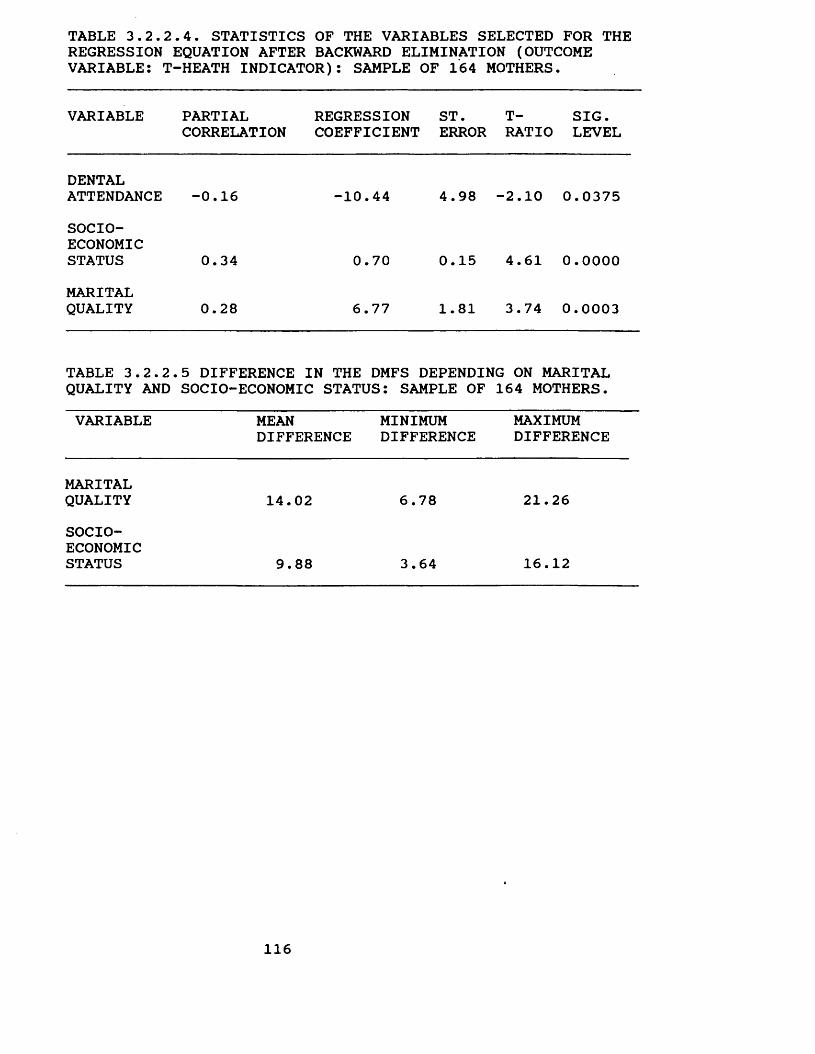
TABLE 3.2.2.4. STATISTICS OF THE VARIABLES SELECTED FOR THEREGRESSION EQUATION AFTER BACKWARD ELIMINATION (OUTCOMEVARIABLE: T-HEATH INDICATOR): SAMPLE OF 164 MOTHERS.
VARIABLE PARTIAL REGRESSION ST. CORRELATION COEFFICIENT ERROR
T- SIG. RATIO LEVEL
DENTALATTENDANCE -0.16 -10.44 4.98 -2.10 0.0375SOCIOECONOMICSTATUS 0.34 0.70 0.15 4.61 0.0000MARITALQUALITY 0.28 6.77 1.81 3.74 0.0003
TABLE 3.2.2. QUALITY AND
5 DIFFERENCE IN THE DMFS DEPENDING ON MARITAL SOCIO-ECONOMIC STATUS: SAMPLE OF 164 MOTHERS.
VARIABLE MEAN MINIMUM DIFFERENCE DIFFERENCE
MAXIMUMDIFFERENCE
MARITALQUALITY 14.02 6.78 21.26SOCIOECONOMICSTATUS 9.88 3.64 16.12
116
3.2.3. Marital quality and the 13-year-old children's caries status.
A similar procedure described for the fathers and the mothers data analysis was adopted to analyse the relationship between marital quality and the 13-year-old children's DMFS, number of sound tooth surfaces and T- health indicator.
The correlation between all variables showed a different pattern from those observed for the fathers and mothers (Table 3.2.3.1).
Few variables studied were correlated with DMFS, number of sound tooth surfaces and T-Health (Table 3.2.3.1). The DMFS index was more sensitive than the number of sound tooth surfaces and the T-Health. Marital quality (p < 0.01) and sugar consumption (p < 0.01) were significantly correlated with the 13-year-old children's DMFS. The other variables were not correlated. When the number of sound tooth surfaces and the T-Health were used, only marital quality was correlated with the two dental indicators, but not significantly at the level of 1% (Table 3.2.3.1).
Correlation between some independent variables was also found, but sufficient enough to affect the multiple regression test (Table 3.2.3.1).
Since there are no missing values in any of the 13- year-old children variables, all subjects were included in the data analysis from the beginning.
Multiple regression analysis using the backward elimination method selected the variables marital quality
117
(p < 0.005) and sugar consumption (p < 0.01) as determinants of the 13-year-old children's DMFS; and marital quality as a good predictor of the number of sound tooth surfaces in the 13-year-old children. None of the variables were determinants of T-health in the 13-year-old children.
The partial F-test criterion using the level of significance of 5% (p < 0.05) confirmed that the variables excluded did not significantly contribute to explain the variance in the DMFS, number of sound tooth surfaces and T- health.
The partial F-test criterion using the level of significance of 5% (p < 0.05) was also carried out to check for a two way interaction. The results suggested that there was no such interaction.
The results of the multiple regression analysis showed a highly significant linear relationship between marital quality and sugar consumption, and DMFS (p < 0.0005); and between marital quality and the number of sound tooth surfaces (p < 0.05) in the 13-year-old children. The models explained 10% of the DMFS variance, and 3% of the number of sound tooth surfaces variance in the 13-year-old children.
Marital quality (p < 0.005) and sugar consumption (p < 0.01) contributed significantly to the relationship with DMFS, while marital quality (p < 0.05) contributed significantly to the relationship with the number of sound tooth surfaces.
118
13-year-old children from families which experienced a higher level of marital quality had a lower DMFS and a higher number of sound tooth surfaces than that from families which experienced a lower level of marital quality. The regression coefficients between marital quality and DMFS and the number of sound tooth surfaces were -1.31 and 1.65, respectively.
13-year-old children who had a low sugar consumption showed a lower DMFS than those who had a high sugar consumption. The regression coefficient between sugar consumption and DMFS was 0.33.
Marital quality was slightly more important than sugar consumption to explain the variance in the DMFS in the 13- year-old children. The partial correlation coefficients for marital quality and sugar consumption were -0.22 and 0.21, respectively.
As with the fathers and mothers, marital quality was of clinical significance for caries status. A high level of marital quality lead to a mean difference in the 13-year- old children's DMFS of 2.62, when compared to low level of marital quality and adjusted by sugar consumption. The mean difference in those with high and low sugar consumption was 1.32.
The search on residuals showed that the assumptions of linearity, constant variance and normality were not violated. The plot of the residuals against the gender, socio-economic status, toothbrushing frequency, dental attendance and type of toothpaste confirmed that they did
119
not contribute to explain the variability in the 13-year- old children's DMFS and number of sound tooth surfaces. The plot of residuals against sugar consumption also confirmed that sugar consumption did not explain the variability in the number of sound tooth surfaces in the 13-year-old child.
Finally, the relationship between marital quality and the variables that composed each model was checked. The results of cross tabulation and the chi-square test showed that there was no association between marital quality and sugar consumption (p > 0.10). The results of regression analysis after adjusting for socio-economic status confirmed that there is no significant relationship between marital quality and sugar consumption.
120
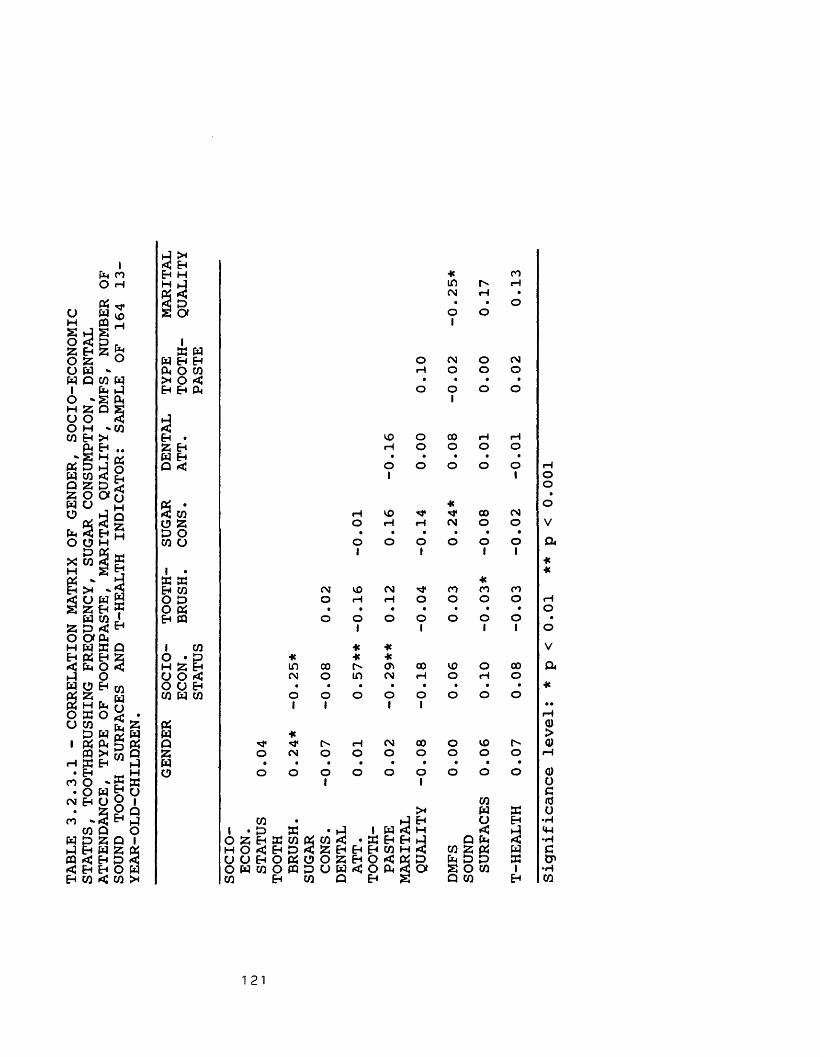
o wW Q
&c5
Pm
CO
co
CN Uro - 1
1-1 >H < EhEh H * mH iJ in rHPi <3 o
eg h • •
•O
s a 0 o1
iK w
W Eh Eh o eg o egp < o w rH o o o* O < • • • •Eh Eh Ph O 0 o
1o
Eh • i£> O CO H rH55 Eh H O O O OW Eh • • • • •a < 0 o
1o o O
1
3 « H V0 <3*«^ CO eg
O X O rH rH eg o oX o • • • • • •CO o 0 o o
1 1o o
101
1 •x wEh CO CN 0 CM \J*
«ro ro CO
O D O H rH O o o oO Pi • • • • • • •Eh CQ o o o o
1 1o o
101
1 CO O • p H S Eh
* *<fc * Hein co cn co ko o CO
U O < eg o in eg h O H oO U EH • • • • • • • •CO W CO o o o o o
I I I Io o o
PiwQ
■K^ H eg 00 O KD
X O CN O O O O O O ow • • • • • • • • •o o o o o o o
1 1o o o
>*COH £
CO • ►-? Eh u Eh1 . JD x • i J 1 W < H < >A
O^ E H f f i C O f ^ C O ^ ; • K Eh Eh tJ Q Pm <H O i < E H p I < a E H E H H C O H r t J CO X Pi PPU O E H O P i O O a E H O < P i D h D DO W t 0 O f f l P U W C O P < < O i S O co 1CO Eh CO a EH S Q co Eh
oo•oVa•K■KrHO•OVa
a)oc<du■H<4H•rHc•HCO
1 21
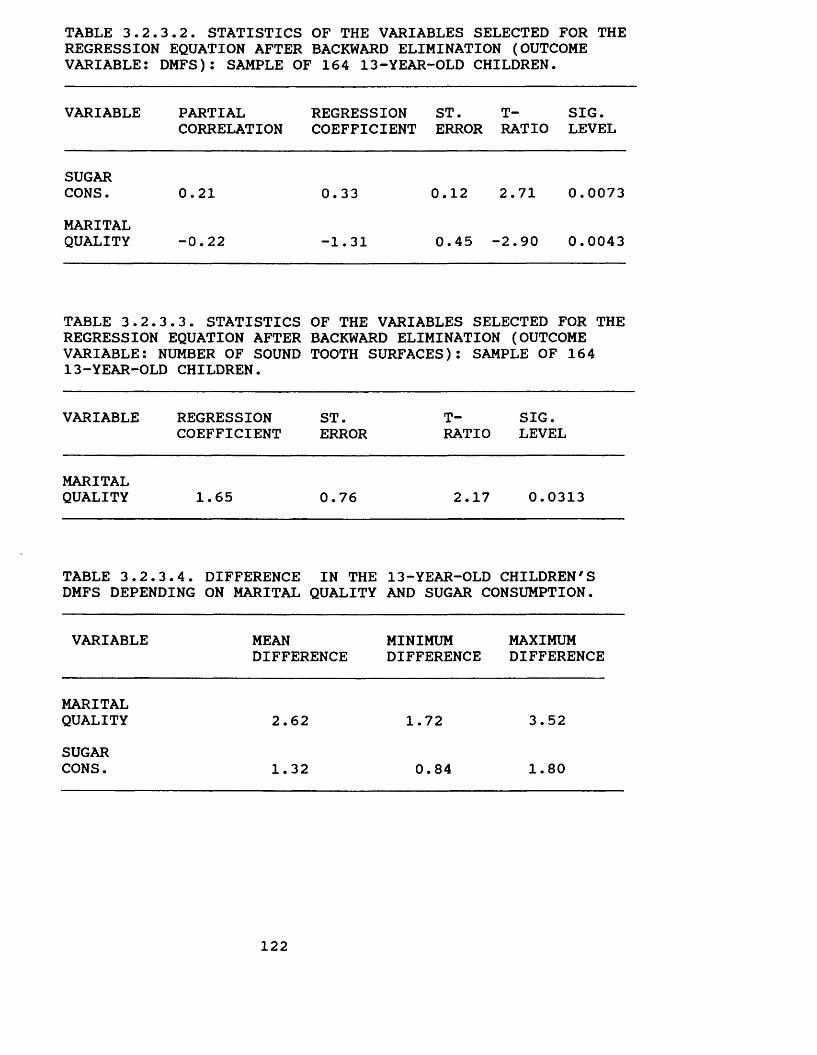
TABLE 3.2.3.2. STATISTICS OF THE VARIABLES SELECTED FOR THEREGRESSION EQUATION AFTER BACKWARD ELIMINATION (OUTCOMEVARIABLE: DMFS): SAMPLE OF 164 13-YEAR-OLD CHILDREN.
VARIABLE PARTIAL REGRESSION ST. T- SIG.CORRELATION COEFFICIENT ERROR RATIO LEVEL
SUGARCONS. 0.21 0.33 0.12 2.71 0.0073MARITALQUALITY -0.22 -1.31 0.45 -2.90 0.0043
TABLE 3.2.3.3. STATISTICS OF THE VARIABLES SELECTED FOR THE REGRESSION EQUATION AFTER BACKWARD ELIMINATION (OUTCOME VARIABLE: NUMBER OF SOUND TOOTH SURFACES): SAMPLE OF 164 13-YEAR-OLD CHILDREN.
VARIABLE REGRESSION ST. T- SIG.COEFFICIENT ERROR RATIO LEVEL
MARITALQUALITY 1.65 0.76 2.17 0.0313
TABLE 3.2.3.4. DIFFERENCE IN THE 13-YEAR-OLD CHILDREN'S DMFS DEPENDING ON MARITAL QUALITY AND SUGAR CONSUMPTION.
VARIABLE MEAN MINIMUM MAXIMUMDIFFERENCE DIFFERENCE DIFFERENCE
MARITALQUALITY 2.62 1.72 3.52SUGARCONS. 1.32 0.84 1.80
122
SummaryIn summary, there was a highly significant positive
relationship between marital quality and dental caries status of the fathers, mothers and 13-year-old children. Moreover, the association remained significant after taking into account socio-economic status, work related mental stress, work control, work variety, toothbrushing frequency, sugar consumption, dental attendance, type of toothpaste and gender. Marital quality was the most important variable to explain the variation in dental caries status. Furthermore, the effect of marital quality on dental caries status was also important in clinical terms. The mean difference in DMFS scores between high and low marital quality was 18.34 for fathers, 14.02 for mothers and 2.62 for children.
Work related mental demand, work control and work variety were not significantly related to the fathers' dental caries status. Type of toothpaste and toothbrushing frequency were not significantly related to dental caries status of the fathers, mothers and 13-year-old children.
Socio-economic status, sugar consumption, age and dental attendance were important, but not consistent, determinants of dental caries status.
Socio-economic status was significantly related to the fathers' and mothers' DMFS and T-health, but not to their number of sound tooth surfaces or to the 13-year-old children's DMFS, number of sound tooth surfaces and T- health.
123
Sugar consumption was significantly related to fathers' DMFS, number of sound tooth surfaces and T-health and to the 13-year-old children's DMFS.
Dental attendance was significantly related to the mother's number of sound tooth surfaces and the T-health.It is important to note that grouping adults in an age range of 35 to 44 years old did not control that variable for the fathers. Socio-economic status and dental attendance were positively related to dental caries status, while sugar consumption and age were negatively related to dental caries status.
124
3-3. Marital quality, work stress and periodontal health status
In order to assess the effect of marital quality and work stress - work related mental demand, work control and work variety - on periodontal health status, an indicator was used. The criterion adopted in developing the indicator was presence or absence of teeth either with gums bleeding after probing or teeth with pockets in the mouth. In other words, the complete absence of teeth with gums bleeding after probing and teeth with pockets would characterise one group, while the presence of any tooth with gums bleeding after probing and/or with pockets would characterise the other group. Age, socio-economic status, dental attendance, toothbrushing frequency, and last visit to the dentist were included in the data analysis as confounding variables.
In order to carry out a logistic regression, all independent variables were stratified. Marital quality was stratified into three categories: high, moderate and low levels of marital quality. Success in three or four dimensions were regarded as high, two dimensions as moderate and one or none dimension as low levels of marital quality, (see Chapter 2, Section 2.5.2.1 and Chapter 3, Section 3.2.1).
Work stress - work related mental demand, work control and work variety - were stratified into 3 categories: low, moderate and high. The criteria used have been described in Chapter 2, Section 2.5.2.2.
Socio-economic status and last visit to the dentist
125
were stratified into four categories. Socio-economic status was categorized into socio-economic groups A, B, C and D? and last visit to the dentist was categorized as follows: under treatment, more than 6 to 12 months, more than 12 months to 24 months and more than 24 months.
Age and dental attendance were stratified into two categories: 35 to 39 years old and 40 to 44 years old for age; and regular and non regular attenders for dental attendance.
Finally, toothbrushing frequency was stratified into 3 categories: more than once a day, once a day and less than once a day.
A logistic regression analysis was carried out separately for fathers and mothers. The 13 year-old children were excluded from this data analysis due to the low level of periodontal disease. Work stress variables were included only in the fathers' data analyses.
3.3.1 Marital quality, work stress and fathers' periodontal health status.
The first step in analysing the data was to select those variables which are important determinants of the fathers' periodontal health status.
In order to check which variables are important determinants of periodontal health status, a logistic regression for each independent variable as well as one logistic regression including all variables was carried
126
out. The criterion for considering any variable as a important determinant was a p-value lower than 0.10.
Marital quality (p < 0.001), work related mental demand (p < 0.005) and socio-economic status (p < 0.05) were selected as important predictors of periodontal health status. All other variables were not significant at the 10% level.
The next step was to carry out a logistic regression with the following selected variables in the model: marital quality, work related mental demand and socio-economic status in the model.
The results of the logistic regression analysis showed a highly significant relationship between marital quality, work related mental demand and socio-economic status, and the periodontal health status (p < 0.001) (Table 3.3.1.1).
The effects of marital quality (p < 0.005), as well as work related mental demand (p < 0.005) and socio-economic status (p < 0.05) on the periodontal health status remained significant after adjusting for all other variables studied.
The prevalence of teeth with gums bleeding after probing or with pockets decreased as marital quality and socio-economic status improved, and work related mental demand decreased. The prevalence of teeth with gums bleeding after probing or with pockets was estimated to increase 4.8 fold (95% Cl = 1.7-14), on average, for fathers who experienced a low level of marital quality when compared to fathers who experienced a high level of marital
127
quality (Table 3.3.1.1), after taking work related mental demand and socio-economic status into account.
Fathers who experienced high levels of work related mental stress were, on average, 6.2 times (95% Cl = 1.7- 22.3) more likely to have teeth with gums bleeding after probing or with pockets than fathers who experienced low levels of work related mental demand (Table 3.3.1.1), taking marital quality and socio-economic status into account.
Finally, fathers from socio-economic group C were found to be 3.4 times (95% Cl = 1.0-10.8) more at risk of having teeth with gums bleeding after probing or with pockets than fathers from socio-economic group A (Table 4.3.1.1), taking marital quality and work related mental demand into account. The effect on socio-economic groups B and D were not significant at the 5% level.
128
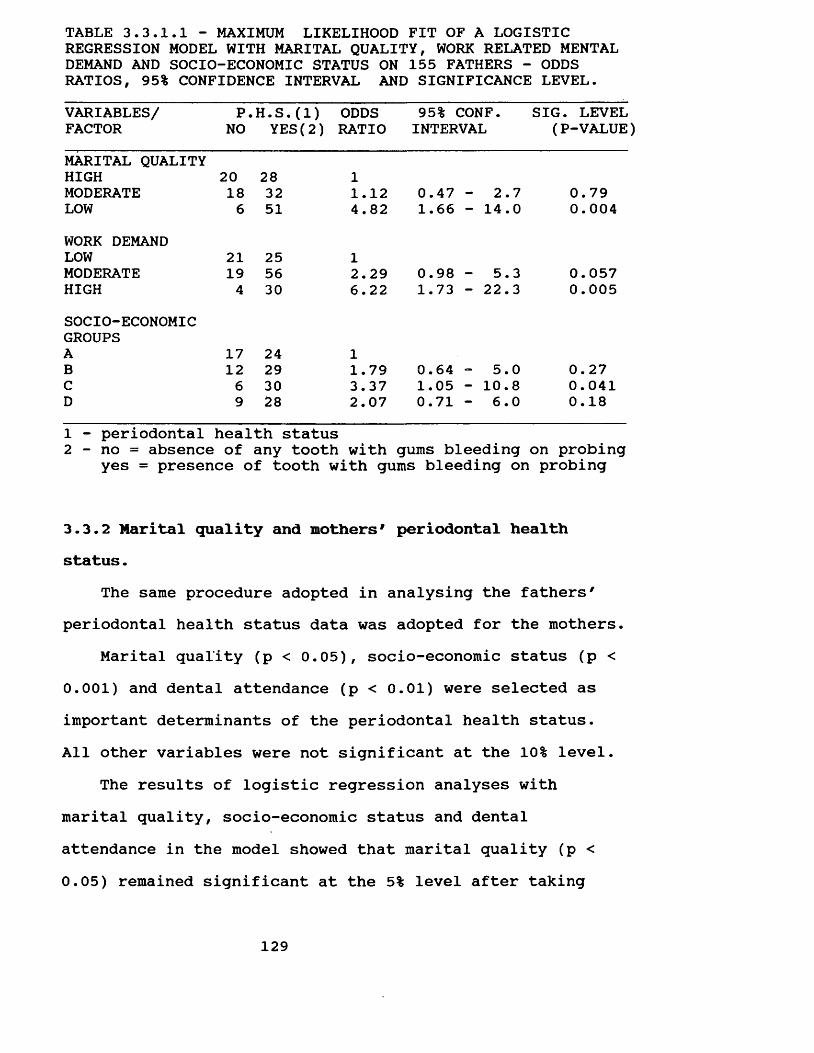
TABLE 3.3.1.1 - MAXIMUM LIKELIHOOD FIT OF A LOGISTIC REGRESSION MODEL WITH MARITAL QUALITY, WORK RELATED MENTAL DEMAND AND SOCIO-ECONOMIC STATUS ON 155 FATHERS - ODDS RATIOS, 95% CONFIDENCE INTERVAL AND SIGNIFICANCE LEVEL.VARIABLES/ P.H.S.(1) ODDS 95% CONF. SIG. LEVELFACTOR NO YES(2) RATIO INTERVAL (P-VALUE)MARITAL QUALITYHIGH 20 28 1MODERATE 18 32 1.12 0.47 - 2.7 0.79LOW 6 51 4.82 1.66 - 14.0 0.004WORK DEMANDLOW 21 25 1MODERATE 19 56 2.29 0.98 - 5.3 0.057HIGH 4 30 6.22 1.73 - 22.3 0.005SOCIO-ECONOMICGROUPSA 17 24 1B 12 29 1.79 0.64 - 5.0 0.27C 6 30 3.37 1.05 - 10.8 0.041D 9 28 2.07 0.71 - 6.0 0.181 - periodontal health status2 - no = absence of any tooth with gums bleeding on probing
yes = presence of tooth with gums bleeding on probing
3.3.2 Marital quality and mothers# periodontal health status.
The same procedure adopted in analysing the fathers' periodontal health status data was adopted for the mothers.
Marital quality (p < 0.05), socio-economic status (p < 0.001) and dental attendance (p < 0.01) were selected as important determinants of the periodontal health status.All other variables were not significant at the 10% level.
The results of logistic regression analyses with marital quality, socio-economic status and dental attendance in the model showed that marital quality (p <0.05) remained significant at the 5% level after taking
129
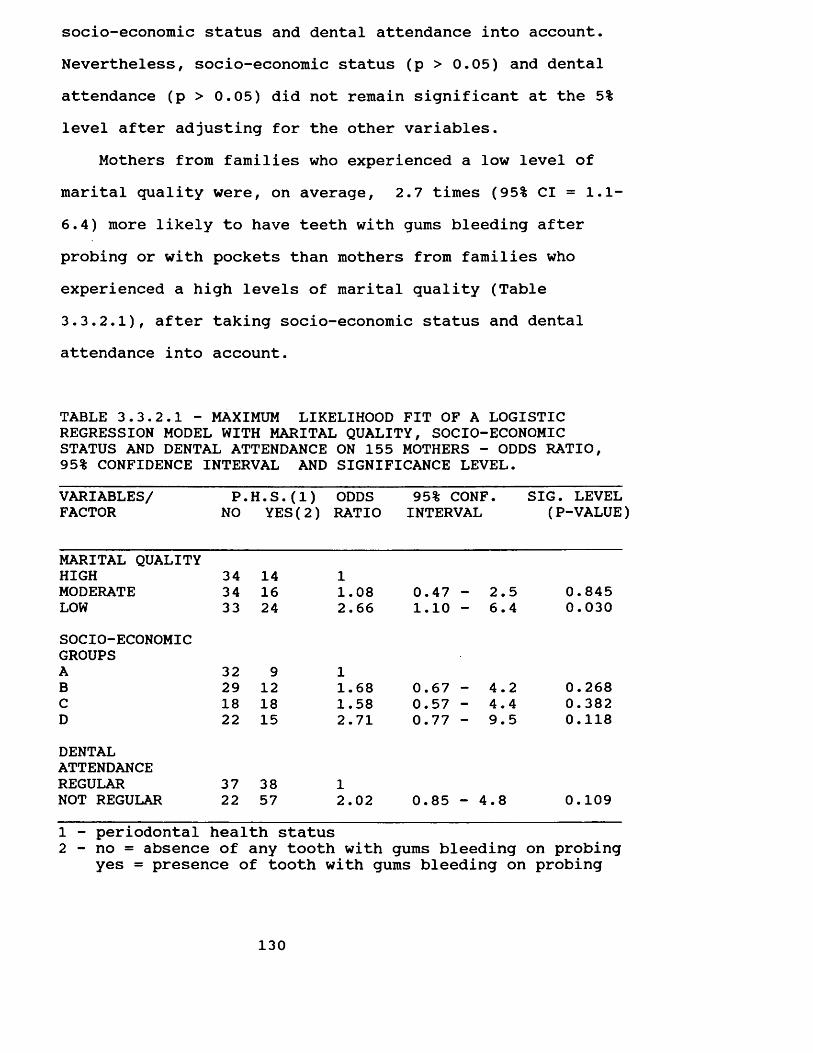
socio-economic status and dental attendance into account. Nevertheless, socio-economic status (p > 0.05) and dental attendance (p > 0.05) did not remain significant at the 5% level after adjusting for the other variables.
Mothers from families who experienced a low level of marital quality were, on average, 2.7 times (95% Cl = 1.1- 6.4) more likely to have teeth with gums bleeding after probing or with pockets than mothers from families who experienced a high levels of marital quality (Table 3.3.2.1), after taking socio-economic status and dental attendance into account.
TABLE 3.3.2.1 - MAXIMUM LIKELIHOOD FIT OF A LOGISTIC REGRESSION MODEL WITH MARITAL QUALITY, SOCIO-ECONOMIC STATUS AND DENTAL ATTENDANCE ON 155 MOTHERS - ODDS RATIO, 95% CONFIDENCE INTERVAL AND SIGNIFICANCE LEVEL.VARIABLES/ P.H.S.(1) ODDS 95% CONF. SIG. LEVELFACTOR NO YES(2) RATIO INTERVAL (P-VALUE
MARITAL QUALITYHIGH 34 14 1MODERATE 34 16 1.08 0.47 - 2.5 0.845LOW 33 24 2.66 1.10 - 6.4 0.030SOCIO-ECONOMICGROUPSA 32 9 1B 29 12 1.68 0.67 - 4.2 0.268C 18 18 1.58 0.57 - 4.4 0.382D 22 15 2.71 0.77 - 9.5 0.118DENTALATTENDANCEREGULAR 37 38 1NOT REGULAR 22 57 2.02 0.85 - 4.8 0.1091 - periodontal health status2 - no = absence of any tooth with gums bleeding on probing
yes = presence of tooth with gums bleeding on probing
130
SummaryIn summary, there was a highly significant positive
relationship between marital quality and the fathers' and mothers' periodontal health status.
The effect of marital quality on periodontal health status was of clinical importance. This was shown by the difference in the prevalence of teeth with gums bleeding after probing or with pockets between fathers and mothers from families whose marital quality was high as opposed to those whose marital quality was low. Fathers and mothers from families who experienced low levels of marital quality were 4.8 and 2.7 times, respectively, more likely to have teeth with gums which bled after probing or which had pockets than fathers and mothers from families who experienced a high level of marital quality.
The effect of work related mental demand was also of clinical and statistical significance. Fathers who experienced a high level of work related mental demand were6.2 times more likely to have teeth with gums which bled after probing or had pockets than fathers who experienced low levels of work related mental demand.
The effect of socio-economic status on periodontal disease was not consistent. Fathers from socio-economic group C were 3.4 times more likely to have teeth with gums which bled after probing than those in socio-economic groups A. Nevertheless, the effect of socio-economic status on the periodontal health status of mothers and, also, of fathers in socio-economic groups B and D was not
131
significant at the 5% level.All results presented above were obtained once age,
socio-economic status, toothbrushing frequency, dental attendance, last visit to the dentist, work control, work variety, work related mental demand and marital quality had been taken into account.
3.4. DISCUSSIONThree research questions were addressed in this thesis.
The first was whether members of families who experienced high levels of marital quality had better oral health than members of families who experienced low levels of marital quality.
The highly significant association found between marital quality and dental caries and periodontal disease suggested that marital quality is an important determinant of oral health status. The findings were consistent for fathers, mothers and 13-year-old children. This means that marital quality has an impact on the oral health, not only on the couple, but also on their children, suggesting that the effect of marital quality on oral health does not affect only one generation. One can speculate that marital quality may explain, in part, the aggregation of oral disease within families. There is a marked tendency for members of the same family to experience similar patterns of oral health. There are incomplete explanations for this aggregation (Klein and Palmer, 1940? Klein and Shimizu,
132
1945; Klein, 1946? Klein, 1947? Martinsson and Petersson, 1972? Ringelberg et al, 1974; Beck and Drake, 1975? Garn et al, 1976, 1977). Researchers have postulated that genetic, bacteriological, nutritional and immunological factors may explain the patterns. (Klein, 1946? Mansbridge, 1959? Ringelberg et al, 1974? Shaw and Murray; 1980). None have included the psychosocial environment shared by the family members. The findings of the present study suggests that psychosocial factors, here represented by marital quality, may contribute to the explanation of similarities in oral health status among members of the same family, since members of families who experienced high levels of marital quality had better oral health than members of families who experienced low levels of marital quality. Other findings also corroborate the hypothesis that marital quality is an important determinant of oral health status.
Marital quality was the most important variable to explain the variation in family members' dental caries status, when compared with the other established risk- related behaviour^ and social factors studied: socioeconomic status, dental attendance, toothbrushing frequency, type of toothpaste, and sugar consumption. The only exception was when the T-Health was used as an indicator of fathers' and mothers' dental caries status. In that situation, socio-economic status was more important than marital quality. The difference in results between T- Health and the two other dental caries indicators may be because of the weight of 2 given to filled tooth surfaces
133
in the T-Health indicator. This makes the T-Health more sensitive to dental care, thus, to socio-economic status. Moreover, the results of the present study have shown that marital quality was not correlated to dental attendance, while socio-economic status was strongly correlated to dental attendance. These findings also suggested that marital quality affects oral health status through a different pathway than socio-economic status. This hypothesis will be discussed later in this chapter.
Finally, marital quality was of clinical importance. Subjects who experienced high levels of marital quality were found to have less decayed, missing and filled tooth surfaces than subjects who experienced low levels of marital quality (18.34 for fathers, 14.02 for mothers and 2.62 for 13-year-old children). Moreover, fathers and mothers who experienced low levels of marital quality were, respectively, 4.8 and 2.7 times more likely to have a worse periodontal health status than those who experienced a high levels of marital quality. Considering that these figures were obtained after adjusting for the risk-related factors studied, the effect of marital quality on dental caries status was actually of clinical significance.
These findings confirmed the hypothesis and corroborated considerable epidemiological research that has linked health and marital quality. Related research has shown that people who are dissatisfied with their marriages had a poorer physical and mental health status than people
134
who are satisfied with their marriages (Renne, 1971, 1977; Aved, 1976; Weiss and Aved, 1978? Roy, 1978, 1981? Gove, Hughes and Style, 1983 and Hobbs et al, 1985). Further comparisons are difficult because of the lack of consensus on the conceptual definition of marital quality as well as on the most adequate way of measuring marital quality. Nevertheless, it is important to point out that despite having used different scales to measure marital quality, the findings were similar and have shown a significant association between marital quality and health. Consistent with these previous findings linking marital quality and health, these data provide further evidence for the nonspecific effects of marital quality on health. House (1974) suggested that psychosocial factors may be associated with a variety of diseases. The findings of the present study corroborated this hypothesis since dental caries and periodontal disease were also significantly associated with marital quality.
The present study has shown that marital quality affected oral health status of fathers, mothers and the 13- year-old child. These findings may be questioned for the following reasons:1. Oral health status may affect marital quality. The findings of the present study do not establish a causal sequence. It does not show whether poor oral health makes a marriage unhappy or an unhappy marriage damages oral health. However, that relationship is unlikely. On the other hand it is more plausible that marital quality
135
affects oral health. Marital quality affects body functions such as immunological responses (Kiecolt-Glaser, 1988) and is associated with poor health conditions (Renne, 1971, 1977; Aved, 1976? Weiss and Aved, 1978? Roy, 1978, 1981? Gove, Hughes and Stlyle, 1983? Hobbs et al, 1985). Kiecolt- Glaser (1988) showed that poorer marital quality was associated with greater stress and a poorer response on one functional immunological measure, antibodies to Epstein- Barr virus (EBV), as well as lower helper/suppressor ratios. Antibody titers to latent herpes viruses provide an indirect measure of cellular immune system competency. The relative percentages of helper and suppressor T-lymphocytes are also good indicators of the immune system competency. Helper T-cell stimulates a number of important immunological functions, for example, the production of antibody by B-lymphocytes, an important defence against infections. Suppressor T-lymphocytes down-regulate the activity of helper cells. Low helper/suppressor cell ratios are associated with immunodeficient conditions (Kiecolt- Glaser, 1988). Overall, as marital quality affects the immunologic system, an important defence against disease, and is associated with poor health status, it is more likely that marital quality affects health than the obverse. Thus, marital quality may also affect oral health rather than the reverse.2. The association between marital quality and oral health status may simply be by chance. Subjects who reported low
136
levels of marital quality may have had poor oral health status before marriage. That is unlikely. The probability of getting the result obtained by chance is very low. A significance level probability lower than p=0.05 was observed for all results. Taking the fathers as an example, the probability of the association between marital quality and fathers' DMFS occurring by chance is lower than0.00005.3. The association between oral health and marital quality may be spurious. Subjects from lower socio-economic groups may experience poorer oral health and there may be poorer marital quality in lower socio-economic groups. This explanation is not supported by the data, since marital quality was not significantly related to socio-economic status. Moreover, the association between oral health status and marital quality remained significant after controlling for socio-economic status.
In summary, the present study provided evidence that marital quality is associated with oral health status. Members of families who experienced high levels of marital quality had better oral health (dental caries and periodontal diseases) than members of families who experience low levels of marital quality.
The second research question addressed was whether fathers exposed to mentally adverse work conditions (high work stress) had worse oral health status than those not so exposed (low work stress).
As explained before, the present study tested the
137
concept of work stress formulated by Karasek (Karasek,1979? Karasek et al, 1981). Karasek (1979) postulated that stress results from the interaction of two types of job characteristics, job demand and job decision. Job demand (work related mental demand variable) represents mental rather than physical demand (for example: time pressure). Job decision represents lack of autonomy (work control variable), as well as monotony, understimulation and underutilization of skills (work variety variable).
In the present study, a significant association was found between work related mental demand and periodontal health status. A result that was consistent with a large body of epidemiological studies (Theorell and Floderus- Myrhed, 1977? Johansson, Aronsson and Lindstrom, 1978? Karasek,1979? Karasek et al, 1981? Alfredsson, Karasek and Theorell, 1982? Alfredsson, Spetz and Theorell, 1985? Karasek et al, 1988, Aronsson, 1989? Frankenhaeuser, 1989). However, the lack of association between periodontal health status, and work control and work variety, differs from an increasing body of literature which reported that work control and work variety can moderate the effect of work related mental demand on health. Data analysis has not shown an interaction between work related mental demand and work control and/or work variety. Moreover, work control and work variety were not significantly related to periodontal health status. This means that a combination of these dimensions in accordance with Karasek7s definition of
138
work stress did not better explain the relationship between work related mental demand and periodontal health status.
The most likely explanation for the lack of a significant association between periodontal health status and work control and work variety is the presence of uncontrolled extraneous variables, which may interact with work related mental demand, work control and work variety leading to a spurious interpretation. This study did not include several aspects of the work situation and disregarded one important variable that recent research has identified as being associated with health - the social support from co-workers (Johansson, 1989). Marmot and Theorell (1988) stated that control over work process and social support in the work setting have been identified as the two major psychosocial resources that can serve to modify the potentially stressful demands and pressures of modern production systems. This explanation has some support. Johnson (1989) considers that a combination of both high support and high control is necessary to ameliorate the impact of work related mental demands. He found that the presence or absence of social support determined whether or not work control operated to reduce work stress and cardiovascular disease risk (Johnson,1989). In fact, Johnson (1989) expanded Karasek's job strain model and added the social support dimension to the demand-control formulation developed by Karasek (1979). Future research in this area should include social support from co-workers and test Johnson's formulations (1989).
139
The lack of a significant association between work stress - work related mental demand, work control and work variety - and dental caries status may be because work stress was measured at only one point in time, and the subjects' reports may reflect a temporary or recent phenomenon. Subjects may change from one job to another. In addition, the work in their jobs may also change with time. The DMFS reflects present and past disease, while the present work situation may not reflect the subjects' past experience. These phenomena may explain the lack of a significant association between the work stress variables studied and dental caries status.
As with marital quality, work related mental demand was found to be a strong determinant of fathers' periodontal health status. The association was of clinical importance as well as being highly statistically significant. Fathers who experienced high levels of work related mental demand were, on average, 6.2 times more likely to have teeth with gums bleeding after probing or with pockets than fathers who experienced low levels of work related mental demand, once age, socio-economic status, dental attendance, toothbrushing frequency, and last visit to the dentist had been taken into account. Furthermore, the likelihood of subjects having a poorer periodontal health status was higher when subjects had high work related mental demand than when they experienced low levels of marital quality or were from the lower socio-economic groups. This means that
140
work related mental demand was the most important determinant of periodontal health status among the variables studied.
As mentioned in the discussion of the relationship between oral health status and marital quality, the effect of work related mental demand on periodontal health status may be questioned as follows:1. Periodontal health status may affect work related mental demand. This is unlikely. The literature review has shown that it is more likely that work related mental demand affects health than the obverse. Longitudinal research has shown that coronary heart disease was more common and there was an increasing risk of premature deaths in subjects who faced high mentally demanding work (Theorell and Floderus-Myrhed, 1977; Karasek et al, 1981? Alfredsson, Spetz and Theorell, 1985). Moreover, a physiological pathway to explain the association between work related mental stress and coronary heart disease was described by Johnson, Hall and Theorell (1989). They consider that work stress may induce excessive and long-lasting sympatho adrenal arousal, which leads to sustained blood pressure elevation. Adrenalin causes the heart muscle to beat faster to increase blood flow, and other hormones cause peripheral vasoconstriction to minimise blood flow. Due to these hormonal elevations and vasoconstriction, blood pressure rises. If these physiological reactions are prolonged over an extended period of time, the cardiovascular system may be damaged. Then, if work related mental demand cause heart
141
disease, it is more likely that it may also causes periodontal disease than the reverse relationship.2. The association may be simply due to the selection of subjects who already experienced poor oral health status into jobs with high mental demand. This explanation seems plausible. Socio-economic status tends to be associated with oral health status. Thus, subjects from low socioeconomic groups tend to experience poorer oral health (Sheiham, 1969? Todd and Walker, 1980? Demers et al, 1990). Assuming that subjects from low socio-economic groups tend to be selected for jobs with high mentally demand, the association may be spurious and related to socio-economic status. This hypothesis will be discussed next.3. The association between periodontal health status and work related mental demand may be spurious and related to socio-economic status. This explanation is not supported by the findings. Firstly, socio-economic status was not significantly correlated to work related mental demand. Secondly, the association between periodontal health status and work related mental demand remained after controlling for socio-economic status.
In summary, the findings suggest that marital quality and work related mental demand may affect oral health status. The question which remains unanswered is whether oral health status is associated with marital quality and work related mental demand throughout risk-related behaviours or whether they affect health status by pathways
142
other than the established risk factors.The present study tested the hypothesis that marital
quality and work related mental demand affect oral health via four well-established risk-related behaviours? dental attendance, toothbrushing frequency, type of toothpaste, and sugar consumption. Marital quality and work related mental demand appear to be associated with oral health status through other pathways than the four risk-related behaviours studied. Marital quality and work related mental demand were only slightly and not significantly correlated with dental attendance, toothbrushing frequency, type of toothpaste and sugar consumption. Thus, the possibility of marital quality and work related mental demand being associated with oral health status through these four risk- related behaviour was excluded. Moreover, data analysis included all these variables and the association remained significant after adjusting for them, which confirmed that the relationship between oral health status and marital quality and work related mental stress should be explained through other pathways than the four risk-related behaviours tested by this study.
The findings also suggested that oral health is associated with marital quality and work related mental demand, and socio-economic status, through different pathways. Contrary to the findings for marital quality and work related mental demand, socio-economic status was significantly correlated to all the risk-related behaviours studied. These results were consistent for fathers, mothers
143
and 13 year-old-children. The only exception was for the correlation between the 13 year-old-children's sugar consumption and socio-economic status. The lack of correlation between socio-economic status and the 13-year- old children's sugar consumption does not discredit the hypothesis that socio-edonomic status affects dental caries status through sugar consumption. On the contrary, it gives support to it, since socio-economic status was not a determinant of the 13-year-old children's dental caries status. Overall, the findings suggested that socio-economic status may affect oral health status through those risk- related behaviours. However, that pathway does not explain in total the relationship between socio-economic status ^nd oral health status. There was no significant relationship between oral health status and toothbrushing frequency or type of toothpaste. Moreover, the association between oral health status and socio-economic status remained significant, after controlling for dental attendance and sugar consumption. Thus, there may be some additional pathways to fully explain the relationship between socioeconomic status and oral health status.
Although the present study has no data to explain the pathway by which marital quality and work related mental demand affects oral health, the following route is feasible. Frankenhaeuser (1989) developed a biopsychosocial model to explain the relationship between psychological stress and disease. The biopsychosocial model can be
144
summarised as follows: "any situation that is perceived as a threat to something individuals value, or a challenge requiring effort, takes signals from the brain's cortex to the hypothalamus, and via the autonomic nervous system to the adrenal medulla. This gland responds by putting out adrenalin and noradrenalin. These two catecholamines, often referred to as stress hormones, mobilise subjects' bodily resources and make them fit for fight or flight. In the event that the situation induces feelings of stress and helplessness, the brain sends messages also to the adrenal cortex, which secrete*another stress hormone, cortisol, which plays an important part in the body's immune defence." Overall, the immune system, which is animportant defence against infectious disease, may be affected by the two psychosocial stressor factors studied - marital quality (Kiecolt-Glaser, 1988) and work related mental stress (Frankenhaeuser, 1989) - which may possibly explain the relationship between oral health and marital quality and work related mental demand. There is no reason why the host resistance mechanism should be different for oral disease than for other infectious diseases.
Current concepts of caries aetiology suggest that dental caries is a multifactorial disease in which there is an interplay of three principal factors - the host, the microflora, and the diet. For caries to occur it is necessary that a susceptible host, cariogenic oral flora, and suitable substracte be present for a sufficient length of time (Newbrun, 1983). Periodontal disease is caused by
145
pathological reaction to dental bacterial plaque (Shluger, Yvodelis and Page, 1977? Grant, Stern and Listgarten, 1988? Lindhe, 1989? Ramfjord and Ash, 1989? Glickman, 1990). Both dental caries and periodontal disease are influenced by the host resistance. It is known that the interplay between human beings and micro-organisms can result in disease or be compatible with the maintenance of health, depending upon the environmental circumstances under which the encounter between them takes place (Dubos, 1980, p. 193). The present study postulates that marital quality and work related mental demand may cause oral disease - dental caries and periodontal disease - by affecting the host resistance. Two host resistance mechanisms, which are associated with marital quality and work related mental demand, deserve mention: saliva and the immunologic system.
There is evidences that stress may affect salivary flow, which plays an extremely important role in reducing dental caries and periodontal disease occurrence (Newbrun, 1983? Scannapieco and Levine, 1990). Anxiety, psychological stress and depression have been reported to decrease salivary flow, which may increase dental caries occurrence and progression as well as periodontal disease (Newbrun, 1983, Scannapieco and Levine, 1990). In general, the non- immune and immune components of saliva provide an initial protective barrier against the invasion of foreign substances and pathogens in the oral cavity (Mandel, 1987). Moreover, a decrease in salivary flow causes alterations in
146
both the amount and bacteriological composition of the plaque. The most marked change is an increase on Streptococcus mutans, Lactobacillus species and Candida albicans in plaque. This change in the composition of the plaque may be because lower flow rates reduce the salivary buffer capacity and, thus, reduces the pH (Newbrun, 1983). Also, antibodies may inibit the adherence of microorganisms on the plaque (Genco, 1990). In fact, both increase in Streptococcus mutans and reduction of pH are associated with dental caries. Furthermore, a lower salivary flow is associated with a longer eating time and greater food retention, which are also associated with higher rates of dental caries (Newbrun, 1983). Periodontal disease is equally affected by a decrease in salivary flow (Genco, 1990; Scannapieco and Levine, 1990).
The other route by which marital quality and work related mental stress can affect oral health status is through the immunological system. Antibodies may exert their effect on oral disease in two stages? by inhibiting adherence of micro-organisms during the colon^isation and, later killing pathogenic micro-organisms. Firstly, in the colonisation stage, antibody-mediated inhibition of adherence may play a decisive role in determining which micro-organisms colonise the gingival margin. Later, in the presence of gingival inflammation, gingival fluid antibodies may further limit colonisation of the subgingival area by periodontopathic organisms (Genco, 1990). Similarly, antibodies may inibit the adherence of
147
micro-organisms to the dental plaque and later limit its colonisation (Killian and Bratthall, 1986). Contrary to the concept that immunological defence mechanisms would be unlikely to play a role in protection against oral disease, in particular dental caries, recent studies have shown that there are two routes by which either antibodies or immunologically active cell may reach the dental plaque.One route is through saliva and the other via the crevicular fluid (Silverstone et al, 1985? Killian and Bratthall? 1986). Moreover, antibodies against specific oral bacteria including Streptococcus mutans have been detected in human saliva (Murray, 1983? Silverstone et al, 1985). Furthermore, numerous studies in animals have shown that an increase in antibody levels to Streptococcus mutans can enhance the elimination of Streptococcus mutans from the oral cavity and interfere with its cariogenic activities (Killian and Bratthall, 1986). Overall, all the explanations presented appear to interact as explained below. Frankenhaeuser (1989) suggested that an individual facing psychological stress would produce more adrenalin, which through complex routes would result in a poor immunological response. It is known that adrenalin also reduces salivary flow. Saliva is one of the routes by which either antibodies or immunologically active cells may reach the dental plaque to inhibit adherence of micro-organisms to the tooth and gingival margin. The saliva then washes the bacteria into the gastrointestinal tract.
148
From the above-mentioned review it may be concluded that marital quality and work related mental stress may affect oral health status through alterations in saliva flow and changes in immunologic response. However, the process is not clear at present. Further investigations are required to assess whether marital quality and work related mental stress may affect oral health through the pathways suggested.
Besides marital quality and work related mental demand, other significant associations were found with oral health status. These findings corroborated previous researchers who have reported a significant relationship between dental caries status and socio-economic groups (Todd & Walker, 1980? Demers et al, 1990? Petersen, 1990), sugar consumption (Newbrun, 1983? Rugg-Gunn, 1989), and dental attendance (Todd and Walker, 1980? Todd, Walker and Dodd, 1982). However, the results were not consistent for fathers, mothers and 13 year-old-children. Another risk- related behavioural factor studied - toothbrushing frequency - was not significantly related to dental caries status. The lack of a significant relationship between dental caries status and toothbrushing frequency also supports some previous research (Sutcliffe, 1989). The evidence that good oral cleanliness reduces caries occurrence is equivocal (Sutcliffe, 1989). Moreover, the reported frequency of toothbrushing in the present study was very high. Fathers, mothers and 13-year-old children reported brushing their teeth, on average, 2.7, 3.1 and 2.7
149
times a day respectively. Furthermore, few subjects reported brushing their teeth less often than once a day. The other risk-related factor studied - type of toothpaste - was not significantly associated with dental caries, which differs from a great body of literature. Fluoride toothpaste may reduce dental caries occurrence (Newbrun, 1983; Naylor and Murray, 1989). This controversial finding may be explained because the majority of families did not use a fluoride toothpaste. Moreover, the families that reported using a fluoride toothpaste possibly had been using it for a short period, because fluoride toothpaste has only recently been widely available in Brasil.
The significant associations between periodontal health status and socio-economic status (Sheiham, 1969? Cushing and Sheiham, 1985? Helm and Petersen, 1989? Petersen, 1990) and dental attendance (Todd, Walker and Dodd, 1982) also corroborated previous findings. The association between socio-economic status and periodontal health status was consistent for fathers and mothers, but the association between dental attendance and periodontal health status was significant only for mothers. Toothbrushing frequency was not significantly associated with periodontal health status, a result that may be explained because a great majority of subjects reported brushing their teeth more than once a day.
The findings from the present study should be considered in relation to a number of methodological
150
strengths and weaknesses. The sample represents a wide range of socio-economic backgrounds in a metropolitan city of Brasil. The participation in the study was very high. There was a response rate of over 93%.
This study represents an improvement on the majority of previous studies linking psychosocial factors and health (Renne, 1971, 1977; Aved, 1976? Burke and Weir, 1977; Weiss and Aved, 1978; Coburn, 1979? LaRocco, House and French, 1980? Gove, Hughes and Style, 1983? Alfredsson, Spetz and Theorell, 1985? Lam et al, 1987? Schmoldt, Pope and Hibbard, 1989 ). This was because oral health status was measured by means of an actual clinical examination, not on interviews or self-administrated questionnaires, or the use of medical services. This represents an advantage because the clinical dental indicator is a more precise measure. Health indicators based on interviews or self-administered questionnaires present serious measurement problems since many subjects may not have the necessary overview of their own health. Because of this, there may be systematic over and underestimations of disease (Theorell, 1987).Moreover, self-reported health status may be influenced by subjects perception of their own health.
Another important aspect of this research is its agreement with other studies which have found that socioeconomic status, sugar consumption, dental attendance and toothbrushing frequency affect oral health. This gives greater validity to the findings in relation to marital quality and work related mental demand.
151
The most controversial methodological problem of this study was the measurement of the psychosocial variables. There have been numerous debates about whether psychosocial factors may be measured with questionnaires. On one hand, there is a group of epidemiologists which considers that psychosocial factors cannot be defined, measured adequately, and, thereby studied. Another view treats psychosocial variables like any other variable (Marmot, 1988). In fact, the measurement of psychosocial factors through questionnaires or interviews is limited by both the preconceived notions of the researcher embodied in the questionnaire itself and the perceptiveness and openness of the respondent. The present study recognises the limitations of the instruments available to measure psychosocial factors at present and recommends evaluating the results with caution.
3.5. SUMMARY AND CONCLUSIONThe aim of this study was to investigate whether oral
health status - dental caries and periodontal disease - was associated with marital quality and work related mental stress.
The hypothesis was that a given set of psychosocial factors, if favourable, would predispose family members to good oral health, or alternatively, if unfavourable, would predispose to more oral disease. It was hypothesised that families whose members experience high levels of
152
communication, companionship, satisfaction with the partner and children would be more likely to show better oral health status than families whose members experience low levels of communication, companionship and satisfaction with the partner and children. In addition, it was hypothesised that fathers who experienced low levels of stress at work would tend to have a better oral health status than fathers who experience high levels of stress at work. Three work situations were studied, work related mental demand, work control and work variety.
The conclusions are:1. Marital quality was highly significantly associated with fathers's, mothers', and 13-year-old children's oral health status - dental caries and periodontal disease. Fathers, mothers and 13-year-old children who experienced high levels of.marital quality, that is high levels of communication, companionship, satisfaction with the partner and children, were more likely to have a better oral health status than fathers, mothers and 13-year-old children who experienced low levels of communication, companionship and satisfaction with the partner and children.2. Work related mental demand was highly significantly related to fathers' periodontal health status. Fathers who experienced low levels of work related mental demand had a better periodontal health status than fathers who experienced high levels of work related mental demand.3. Work related mental demand was not significantly related
153
to dental caries status.4. Work control and work variety were not significantly related to oral health status - dental caries and periodontal disease.5. The association between oral health status and marital quality and work related mental demand was of clinical importance.6. The association between oral health status - dental caries and periodontal disease - and marital quality as well as the association between periodontal health status and work related mental demand, were independent of socioeconomic status, sugar consumption, dental attendance, toothbrushing frequency, type of toothpaste and gender.7. Marital quality was not significantly correlated to fathers', mothers' and the 13-year-old children's sugar consumption, dental attendance, toothbrushing frequency and type of toothpaste.8. Work related mental demand was not significantly correlated with fathers' sugar consumption, dental attendance, toothbrushing frequency, type of toothpaste.9. Socio-economic status was significantly associated with fathers' and mothers' DMFS and T-health, but not with fathers' and mothers' number of sound tooth surfaces. Subjects from upper socio-economic groups experienced fewer dental caries than subjects from lower socio-economic groups.10. Socio-economic status was not significantly associated with the 13-year-old children's dental caries status.
154
11. Socio-economic status was significantly associated with fathers' periodontal health status, but not with mothers' periodontal health status. Fathers from socio-economic group C had a worse periodontal health status than fathers from socio-economic groups A, B and D. A trend was not found.12. Socio-economic status was significantly correlated with fathers' and mothers' sugar consumption, dental attendance, toothbrushing frequency, type of toothpaste, as well as the 13-year-old children's dental attendance, toothbrushing frequency and type of toothpaste. Subjects from upper socio-economic groups had a lower sugar consumption, were more regular attenders, brushed their teeth more often, and used fluoride toothpaste more frequently.13. Toothbrushing frequency and type of toothpaste were not significantly associated with fathers', mothers' and 13- year-old children's oral health status - dental caries and periodontal disease.14. Sugar consumption was significantly associated with fathers' DMFS, number of sound tooth surfaces and T-health, and 13-year-old children's DMFS. Subjects who had a higher sugar consumption experienced more dental caries than subjects with lower sugar consumptions.15. Dental attendance was significantly associated with mothers' number of sound tooth surfaces and T-health. Mothers who were regular attenders had more sound surfaces
155
than mothers who were not regular attenders.
3.6. IMPLICATIONS FOR FURTHER RESEARCHThe present study is cross-sectional. It was
undertaken to explore whether psychosocial factors predispose people towards contracting oral disease and how these factors may affect oral health. Having found an association, the relationship will have to be elaborated to discover why and under what conditions it occurs. A highly significant association was found between marital quality and oral health status - dental caries and periodontal disease - as well as work related mental demand and periodontal disease. However, the data have not explained the relationship. Both marital quality and work related mental demand were not associated with oral health through the four risk-related behavioural factors studied. Thus, the first and most important implication for further research is to elucidate the association. A pathway was suggested. Investigations should be carried out to test this hypothesis. Overall, it was hypothesised that marital quality and work related mental stress may directly affect oral health status through alterations in two host resistance mechanisms; immnological response and salivary flow. Further research should test this hypothesis.
Considering that the present study was a cross- sectional study, a causal sequence could not be established. The literature strongly suggests that the explanatory variables - marital quality and work related
156
mental demand - increase oral disease occurrence, and not the reverse. Cohort studies should be carried out to test this. Moreover, a cohort study could assess the relationship between psychosocial factors and the change in oral health status over time. This would avoid the problem of measuring psychosocial factors at only one point in time, which may reflect a temporary phenomenon, and then, correlating them with indicators such as DMFS that reflect not only present but also past disease. Furthermore, a cohort study would also allow the testing of the long-term predictive power of marital quality and work related mental demand. The results of this study suggested that marital quality could be a good predictor of oral health status of adults and children. Marital quality was a strong determinant of oral health status and the findings were consistent for fathers, mothers and 13-year-old children, which means that marital quality may affect adults and children. Parents' marital quality may also be a good predictor of children's oral health status. Schou (1989) suggested that as dental decay is raultifactorial and dynamic its prediction demands co-ordinated efforts from fields such as microbiology, chemistry, dentistry and social and behavioural sciences. For example, a combination of marital quality, and other well-established social, behaviour and biological predictors of oral health status, such as socio-economic status, oral hygiene, dietary habits, Streptococcus mutans counter, and parents' dental
157
health status may represent an improvement on current predictors. The best combination of these factors as a predictor of oral health status should be investigated.
Another suggestion for further research is to test thevcombination of two work situations - work control and
support from co-workers - as a moderator of work related mental demand. This combination was proposed by Johnson (1989) and may elucidate controversial results found in relation to Karasek's job strain model (Karasek, 1979). Moreover, the association between oral health status and work related mental stress should be tested in women, and its predictive power tested for adults and their children.
Other studies could also test the hypothesis in different populations using larger samples. Also, the instruments used to measure marital quality and work stress should be improved. Marital quality and work stress are extremely complex phenomena, difficult to measure and even harder to conceptualise. Undoubtedly, a better understanding of these phenomenon would lead to clear findings.
In summary, cohort studies should be carried out in order to answer the questions brought up by the present research. Larger samples, including women actively involved in the work force, should be studied and the concept, as well as the measurement of marital quality and work stress, should be improved. Knowledge is lacking on the relationship between the psychological environment and oral health status. Dentistry cannot be a mechanistic matter
158
based purely on knowledge of clinical techniques. It also requires an understanding of how people are affected by their upbringing and their psychosocial environment.
159
ACKNOWLEDGEMENTSI wish to express my deep gratitude and appreciation to
Professor Aubrey Sheiham for his open and thoughtful supervision of my work, as well as for his invaluable encouragement, understanding, support and friendship throughout the last four years.
I am also grateful to all members of staff of the Department of Community Dental Health for sharing their knowledge and friendship, which have made these past years very memorable ones. In particular, I would like to thanks Ray Croucher.
My sincere gratitude to Isabela Almeida Pordeus, who was my long-term companion and co-research worker on this project.
Special thanks go to four of my friends who have helped me with language difficulties and whose help and support has been invaluable. Sarah Thomas and Geetesh Solanki for their kind and helpful support during the first months of this course and Richard Watt and Zoe Herington for making helpful suggestions.
I am indebted to the families who participated in this study, to my collegues from the Universidade Federal de Minas Gerais for giving me leave from my work in Brasil, and to the people of my country for financially supporting this project throughout CAPES.
Finally, I would like to give special thanks to Caroline Brothers for the times we have spent together and for helping me.
160
REFERENCES
Aba/Abipeme (1978). Crit^rio de classificagao sdcio- econOmica. Rio de Janeiro, ABA, 25 de julho de 1978.Ainamo, J., Barmes, D., Beagrie, G., Cutress, T., & Martin, J. (1982). Develolopment of the World Health Organization (WHO) Community Periodontal Index of Treatment Needs (CPITN), International Dental Journal 32: 281-291.Alfredson, L., Karasek, R. & Theorell, T. (1982).Myocardial infarction and psychosocial work environment: an analysis of the Swedish working force. Social Science and Medicine. 16: 463-467.Alfredsson, L., Spetz, C.L., Theorell, T. (1985). Type of occupation and near-future hospitalization for myocardial infarction and some other diagnoses. International Journal of Epidemiology. 14: 378-388.Aronsson, G. (1989). Dimensions of control as related to work organization stress, and health. International Journal of Health Services. 19: 459-468.Astrand, N.E., Hanson, B.S. & Isacsson, S.O. (1989). Job support, and social network factors as predictors of mortality in Swedish pulp and paper company. British Journal of Industrial Medicine. 46: 334-340.Aved, B.M. (1976). An analysis of the relationship between physical health, health status and marital satisfaction among married couples. Dissertation Abstracts International. 37 (6): A3436.Bagramian, R.A. (1969) An epidemiologic study of the relations between dental caries experience and eating patterns of white and black high-school students in Northern and Southern United States. PhD. Thesis.University of Michigan.Bateman, P.M. (1985). Understanding and predicting toothbrushing behaviour in adolescents. MSc. Thesis. University of London.Beck, J. & Drake, C. (1975). Some epidemiological evidence on the etiology of caries. Community Dentistry and Oral Epidemiology, 3: 223-227.
Beretison, M.L., Levine, D.M. & Goldstein, M. ( 1983).
I nt e r m e d i a t e st atistical methods and applicati ons. A
computer package approach. E n g l e w o o d Cliffs. P r e n t i c e — Hall
I n c .
Brannen, J. & Collard, J. (1982). Marriages in trouble: the process of seeking help. p. 51, London, Tavistock publications.Brodsky, R. (1989). Identifying stressors is necessary to combat potential health problems. Occupational Health and Safety, 58: 30-34.Bull, N. & Wheeler, E.F. (1986). A study of different dietary survey methods among 30 civil servants. Human Nutrition: Applied Nutrition. 40A: 60-66.Bulman, J.S. & Osborn, J.F. (1989). Statistics in Dentistry. London. British Dental Association.Burgess, E.W. & Cotrell, L.S.Jr. (1936) The prediction of adjustment in marriage. American Sociological Review. 1: 737-751.Burgess, E.W. & Cotrell, L.S.Jr. (1939). Predicting success or failure in marriage, p. 16-74, New York. Prentice-Hall.Ibid Burgess, E.W. and Cotrell, L.S.Jr. (1939). ch. 4.Burke, R.J. & Weir, T. (1977). Husband-wife helping- relationship: the "mental hygiene" function in marriage. Psychological Reports. 40: 911-925.Cassel, J. (1976). The contribution of the social environment to host resistence. American Jounal of Epidemiology. 104: 107-122.Cedine (1985). Centro de Documentagao e Informagees Educacionais da Secretaria Estadual de Educagao do Estado de Minas Gerais. Belo Horizonte, CEDINE/SEE.Chatfield, C. (1980). Pricipal component analysis. In: Chatfield, C. Introduction to multivariate analysis. Alexander J. Collins.Clayton, R.R. (1975). The family, marriage, and social change, p. 375-376. Lexington. Heath and company.Ibid, Clayton, R.R. (1975). p. 382.Coburn, D. (1979). Job Alienation and well-being. International Journal of Health Services, 9: 41-59.Copasa (1987). SumArio do levantamento epidemioldgico da cArie dental. Belo Horizonte, Copasa.Crago, M.A. (1972). Psychopathology in married couples. Psychological Bulletin. 77: 114-128.
162
Croucher, R.E. & Rodgers, A.I. (1985). Evaluation Report "Natural Nashers" Dissemination 1981-1984. University of Cambridge, Dental Health Study.Cushing, A. (1986). The development of socio-dental indicators of oral health status and needs. PhD. Thesis. University of London.Cushing, A.M. & Sheiham, A. (1985). Assessing periodontal treatment needs and periodontal status in a study of adults in north-west England. Community Dental Health. 2: 187-194.Demers, M., Brodeur, J., Simard, P.L., Mouton, C.,Veilleux, G. & Frechette, S. (1990). Caries predictors suitable for mass-screening in children: a literature review. Community Dental Health. 7: 11-21.Doherty, W.J. & Jacobson, N.S. (1982). Marriage and the family. In: Wolman, B.B., Handbook of developmental psychology. Englewood cliffs, N.S., Prentice-Hall.Dubos, R.L. (1980). Man adapting, 2nd ed. p. 193. New Haven, Yale University Press.Egret (1988). Epidemiological graphics, estimation, and testing package. Statistics and Epidemiology Research Corporation.Epstein, N., Baldwin, L. & Bishop, S. (1983). The McMaster family assessment device. Journal of Marital and Family Therapy.. 9: 171-180.Fishbein, M. & Ajzen, I. (1975). Belief, attitude, intention and behaviour. London. Addison-Wesley Publishing Co.Frankenhaeuser, M. (1989). A biopsychosocial approach to work life issues. International Journal of Health Services. 19: 747-758.Fredman, N. & Sherman, R. (1987). Handbook of measurement for marriage and family therapy, p. 43-214. New York. Brunner-Mazel.Freeman, R. (1984). Understanding and predicting sugar consumption in adolescents. Factors affecting choice intention. MSc. Thesis. University of London.Gardell, B. (1971). Alienation and mental health in the modern industrial environment. In: Levi, L. (ed.). Society stress and disease. 1: 148-180.
163
Garn, S.M., Rowe, N.H. & Clark, D.C. (1976). Parent-child similarities in dental caries rates. Journal of Dental Research. 55: 1129.Garn, S.M., Rowe, N.H. & Cole, P.E. (1977). Husband-wife similarities in dental caries experience. Journal of Dental Research. 56: 186.Genco, R.J. (1990). Pathogenesis and host responses in periodontal disease. In: Genco, R.J., Goldman, H.M. &Cohen, D.W. Contemporary periodontics. St. Louis. The C. V. Mosby Company.
Gove, W.R., Hughes, M. & Style, C.B. (1983). Does marriage have a positive effects on the psychological well-being of the individual? Journal of Health and Social Behaviour, 24: 122-131.Grant, D.A., Stern, I.B. & Listgarten, M.A. (1988). Periodontics. 6th ed. St. Louis. C. V. Mosby Company.Gray, P.G., Todd, J.E., Slack, G.L.; Bulman, J.S. (1970). Adult Dental Health Survey in England and Wales in 1968. London. Her Majesty's Stationery Office.Greene, J.C. and Vermillion, J.R. (1964). The Simplified Oral Hygiene Index. Journal of the American Dental Asso c iation 68: 7-13.Haavio-Mannila, E. (1971). Satisfaction with family, work, leisure and life among men and women. Human Relations. 24: 585-601.Hamilton, G.V. (1929). A research in marriage. New York. A and C Boni.Harenstam, A. Palln, U. & Theorell, T. (1988). Stress, health and the working environment of Swedish prison staff. Work and Stress. 2: 281-290.Healy, M.J.R., Osborn, J. & Hills, M. (1988-89). Manual of medical statistics. London. London School of Hygiene and Tropical Medicine - Division of Medical Statistics and Epidemiology.Helm, S. & Petersen, P.E. (1989). Causal relation between malocclusion and periodontal health. Acta Odontoloqica Scandinavian. 47: 223-228.Hendricks, S. (1986). Understanding and predicting preventive health behaviour in mothers of preschool children. MSc. Thesis. University College London.
164
Hicks, M.W. and Pratt, M. (1970). Marital happiness and stability: a review of the research in the sixties. Journal Of Marriage and the Family, 32: 553-J574.Hobbs, P.R. Ballinger, C.B., McClure, A., Martin, B. & Greenwood, C. (1985). Factors associated with psychiatric morbidity in men: a general practice survey. Acta Psychiatrica Scandinavica. 71: 281-286.Hodge, H. (1979). Factors associated with toothbrushing behaviour in adolescents. PhD. Thesis. University of Manchester.House, J.S. (1974). Occupational stress and coronary heart disease: a review and theoretical integration. Journal of Health and Social Behaviour. 15: 12-27.
Hunt, R.J. (1986) Percent agreement, Pearson's correlation, and Kappa as measures of inter-examiner reliability.Journal of Dental Research. 65: 128-130.Hunt, R.J., Beck, J.D., Lemke, J.H., Kohout, F.J. and Wallace, R.B. (1985). Edentulism and oral health problems among elderly rural Iowans: the Iowa 65 + rural health study. American Journal of Public Health. 75: 1177-1181.Ibge (1986). AnuArio 1985 Estatistico do Brasil. Rio de Janeiro, Instituto Brasileiro de Geografia e Estatistica.Johansson, G. (1989). Job demands and stress reactions in repetitive and uneventful monotony at work. International Journal of Health Services. 19: 365-377.Johansson, G., Aronsson, G., & Lindstrom, B.O. (1978). Social psychological and neuroendocrine stress reactions in highly mechanised work. Ergonomics. 21 583-599.Johnson, J.V. (1989). Collective control: strategies for survival in the workplace. International Journal of Health Services. 19: 469-480.Johnson, J.V. & Hall, E.M. (1988). Job strain, work place social support, and cardiovascular disease: a cross- sectional study of a random sample of the Swedish working population. American Journal of Public Health. 78: 1336- 1342.Johnson, J.V., Hall, E.M., & Theorell, T. (1989). Combined effects of job strain and social isolation on cardiovascular disease morbidity and mortality in a random sample of the Swedish male working population. Scandinavian Journal of Work Environment and Health. 15: 271-279.
165
Karasek, R.A. (1979). Job demands, job decision latitude and mental strain, implications for job redesign. Administrative Science Quarterlyf 24: 285-308.Karasek, R., Baker, D., Marxer, F., Ahlbom, A. and Therell, T. (1981). Job decision latitude, job demands, and cardiovascular disease: A prospective study of Swedish men. American Journal of Public Health. 71: 694-705.Karasek, R.A., Theorell, T., Schwartz, J.E., Schnall, P.L.& Pieper, C.F. (1988). Job characteristics in relation to the prevalence of myocardial infarction in the U.S. HES and HANES. American Journal of Public Health. 78: 910-918.Kiecolt-Glaser, J.K., Kennedy, S., Malkoff, S., Fisher, L., Speicher, C.E. & Glaser, R. (1988). Marital discord and immunity in males. Psychosomatic Medicine. 50: 213-229.Kilian, M. & Bratthal, D. (1986). Caries immunology. In: Thylstrup, A. & Fejerskov, O. Textbook of cariology. Copenhagen. Munksgaard.
King, J. (1976). Behaviour of mothers and babies which may influence dental health. MSc. Thesis. University of London.Klein, H. (1946). The family and dental disease: dental disease (DMF) experience in parents and offspring. Journal of the American Dental Association. 33: 735-743.Klein, H. (1947). The family and dental disease: caries experience among parents and offspring exposed to drinking water containing fluoride. Public Health Reports. 62: 1247- 1253.Klein, H. & Palmer, C.E. (1940). Dental caries in brothers and sisters of immune and susceptible children. The Milbank Memorial Fund Ouaterly. 18:67-82.Klein, H. & Shimizu, T. (1945). The family and dental disease: DMF experience among husbands and wives. Journal of the American Dental Association. 32: 945-955.Kolb, W.L. (1948). Sociologically established family norms and democratic values. Social Forces. 26: 451-456.Kolb, W.C. (1950). Family sociology, marriage education, and the romantic complex: a critique. Social Forces. 29:765-72.Lam, T.H., Lee, P.W., Ong, S.G., Wong, C.M., Chow, W.K. & Kleevens, J.W. (1987). Mental health and work stress: a comparison of response patterns in executives and clerical workers in Hong Kong. Journal of Occupational Medicine. 29: 892-897.
166
Landis, J.R. & Koch, G.G. (1977). The measurement of observer agreement for categorical data. Biometrics. 33: 159-174.LaRocco, J., House, J. & French, J. (1980). Social support, occupational stress and health. Journal of Health and Social Behaviour. 21: 202-218.Larzelere, R. & Huston, T. (1980). The dyadic trust scale: toward understanding interpersonal trust in close relationships. Journal of Marriage and the Family. 43: 595- 604.Leslie, G. R., Korman, S. K. (1985). The family in social context. 6th ed. p.12. New York, Oxford University Press.Ibid, Leslie, G.R. & Korman, S.K. (1985). p.423.Locke, H.J. (1947). Predicting marital adjustment by comparing a divorced and happily married group. American Sociological review. 12: 187-191.Locke, H.J. & Karlsson, G. (1952). Marital adjustment and prediction in Sweden and the U.S. American Sociological Review, 17: 10-17.Locke, H.J. & Wallace, K.M. (1959). Short marital adjustment and prediction tests. Their reliability and validity. Marriage and Family Living. 21: 252-254.Locke, H.J. & Williamson, R.C. (1955). Marital adjustment: a factor analysis study. American Sociological Review. 23: 562-569.Lindhe, J. (1989). Textbook of clinical periodontology. 2nd ed. Copenhangen. Muksgaard.Mandel, I.D. (1987). The functions of saliva. Journal of Dental Research. 66(special issue): 623-627.Mansbridge, J.N. (1959). Heredity and dental caries.Journal of Dental Research. 38: 337-347.Marmot, M. (1988). Psychosocial factors and cardiovascular disease: epidemiological approaches. European Heart Journal, 9: 690-697.Marmot, M. & Theorell, T. (1988). Social class and cardivascular disease: the contribution of work. International Journal of Health Services. 18: 659-673.Marmot, M.G., Smith, G.D., Stansfield, S., Patel, C.,North, F., Head, J., White, I. Brunner, E., & Feeney, M. (unpublished). Inequalities in health twenty years on: the Whitehall II study of British civil servants.
167
Martinsson, T. & Pettersson, A. (1972). Socio-odontologic investigation of school children with high and low caries frequency. Odontoloqica Revy. 23: 371-388.Ministerio da satide (1988). Levantamento epidemioldgico em sadde bucal: Brasil, zona urbana, 1986. Brasilia, Centro de documentagao do ministArio da sadde.Naylor, M.N. & Murray, J.J. (1989). Fluorides and dental caries. In: Murray, J.J. The prevention of dental disease. 2nd ed. Oxford. Oxford University press.Norusis, M.J. (1988). SPSS/PC+ V2.0. Base Manual. Chicago, SPSS Inc.Newbrun, E. (1983). Cariology. 2nd ed. p.42. Baltimore. Waverly Press.Nuttal, N.M. & Paul, J.W.McK. (1985). The analysis of inter-dentist agreement in caries prevalence studies. Community Dental Health, 2: 123-128.Olson, D.H. & Barnes, H.L. (1985). Quality of life. In: Olson, D.H., Mccubbin, H.L., Barnes, A.S., Larsen, M.M., Wilson, M. (eds.). Family inventories (revised edition).St. Paul, Mn. : Family social science, University of Minnesota.
Orden, S.R. & Bradburn, N.M. (1968). Dimensions of marriage happiness. American Journal of Sociology. 73: 715-731.Osterberg, T., Hedegard, B. & Sater, G. (1984). Variation in dental health in 70-year old men and women in Goteborg, Sweden. A cross-sectional epidemiological study including longitudinal and cohort effects. Swedish Dental Journal, 8:29-48.Pearlin, L. & Johnson, J. (1977). Marital status, life strain and depression. American Sociological Review. 42: 704-715.Pekkarinen, M. (1970). Methodology in the collection of food composition data. World Review of Nutrition and Dietetics. 12: 145-170.Pendleton, B.F., Poloma, M.M. & Garland, T.N. (1980).Scales for the investigation of the dual-career family, Journal of Marriage and the Family. 42: 269-275.Petersen, P.E. (1990). Social inequalities in dental health: towards a theoretical explanation. Community Dentistry and Oral Epidemiology. 18: 153-158.
168
Plambel (1984). Estrutura urbana: unidades espaciais. Resolugao TAcnica no. 01/84. Anexo I. Belo Horizonte, Plambel.Pratt, L. (1976). Family structure and effective health behavior: The energized family. Boston: Houghton Mifflin Co.Ramfjord, S.P. & Ash, M.M. (1989). Periodontology and periodontics: modern theory and practice. St. Louis. Ishiyaku EuroAmerica-Reed, D.M., LaCroix, A.Z., Karasek, R.A., Miller, D. & MacLean, C.A. (1989). Occupational strain and the incidence of coronary heart disease. American Journal of Epidemiology. 129: 495-502.Renne, K.S. (1971). Health and marital experience in an urban population. Journal of Marriage and the Family. 23: 338-350.Renne, K.S. (1977). Health and marital experience in an urban population. In: De Burger, J.E. (ed). Marriage today: problems issues and alternatives, p. 304-311. New York. Shenkman Publishing Company.Ringelberg, M.L., Matonski, G.M. & Kimball, A.W. (1974). Dental caries experience in three generations of families. Journal of Public Health Dentistry. 34: 174-180.Roach, A.J., Frazier, L.P., & Bowden, S.R. (1981). The marital satisfaction scale: development of a measure for intervention research. Journal of Marriage and Family. 41: 537-545.Roy, A. (1979). Vulnerability factors and depression in women. British Journal of Psychiatry. 133: 106-110 and correction 134: 552.Roy, A. (1981). Vulnerability factors and depression in men. British Journal of Psychiatry. 138: 75-77.Rugg-Gunn, A.J. (1989). Diet and dental caries. In: Murray, J.J. (ed.) The prevention of dental disease. 2nd ed.Oxford. Oxford University Press.Samuelson, G. (1970). An epidemiological study of child health and nutrition in a Northern Swedish County. II. Methodological study of recall technique. Nutrition and Metabolism. 12: 321-340.Scannapieco, F.A. & Levine, M.J. (1990). Saliva and dental pellicles. In: Genco, R.J., Goldman, H.M. & Cohen, D.W. (eds.) Contemporary periodontics. St. Louis. The C. V.Mosby Company.
169
Schilling, R.S. (1989). Health protection and promotion at work. British Journal of Industrial Medicine. 46: 683-688.Schluger, S., Yvodelis, R.A. & Page, R.C. (1977). Periodontal disease: basic phenomena, clinical management and occlusal and restorative interrelationship. Philadelphia. Lea & Febiger.Schmoldt, R.A., Pope, C.R. & Hibbard, J.H. (1989). Marital interaction and the health and well-being of sposes. Women- health. 15: 35-56.Schou, L. (1989). Markers of high and low risk groups and individuals for dental caries: social and behavioural aspects. Paper presented at the meeting: "International symposium on: markers of high and low risk groups and individuals for dental caries". The Royal Society of Medicine - Section of Odontology. London. March 9th.Schumm, W.R., Bollman, S.R. & Jurich, A.P. (1981). Dimensionality of an abbreviated version of the relationship inventory: an urban replication with married couples. Psychological reports. 48:51-56.Shaw, L. & Murray, J.J. (1980). A family history study of caries-resistence and caries-suceptibility. British Dental Journalf 148: 231-234.Sheiham, A. (1969). The prevalence and severity of periodontal disease in British populations. Dental survey schoolchildren. Dental Practice. 19: 232-238.Sheiham, A., Maizels, J. & Maizels, A. (1987). New composite indicators of dental health. Community Dental Health, 4: 407-414.Shorter, E. (1976). The making of the modern family, p.205. London. Collins.Shostrom, E.L. (1975). Manual caring relationship inventory. San Diego: Ed. Educational and Industrial Testing Service.Siegel, S. & Castellan, N.J.Jr. (1988). Nonparametric statistics for the behavioural science. 2ed. New York. McGraw-Hill.Silver, D.H. (1985). Trends in dental caries prevalence in English children. A socio-dental study. MPhil. Thesis. University of London.Silverstone, L.M., Johnson, N.W., Hardie, J.M., Willians, R.A.D. (1985). Dental caries aetiology, pathology and prevention. London. The MacMillen Press Lmd.
170
Spanier, G.B. (1972). Further evidence on methodological weaknesses in the Locke-Wallace marital adjustment scale and other measures of adjustment. Journal of Marriage and the Family. 34: 403-404.Spanier, G.B. (1976). Measuring dyadic adjustment new scales for assessing the quality of marriage and similar dyads. Journal of Marriage and the Family. 38: 15-28.Spanier, G.B. & Lewis, R.A. (1980). Marital quality: a review of the seventies. Journal of marriage and the Family, 42 825-839.SPSS (1988). SPSS/PC+ V2.0. United States of America. SPSS Inc.Sutcliffe, P. (1989). Oral cleanliness and dental caries. In: Murray, J.J. (ed.) The prevention of dental disease.2nd ed. Oxford. Oxford University Press.Takeuchi, M. (1961). Epidemiological study on dental caries in Japanese children before, during and after World War II. International Dental Journal, 11: 443-457.Terman, L.M. (1938). The index of marital happiness. In: Terman, L.M. Psychological factors in marital happiness p. 48-83. New York. McGraw-Hill Book Company, Inc.Theorell, T. (1987). Stress syndromes. Annals of Clinical Research, 19: 53-61.Theorell, T. & Floderus-Myrhed, B. (1977). Workload and myocardial infartion: a prospective psychosocial analysis. International Journal of Epidemiology. 6: 17-21.Todd,J.E. & Walker, A.M. (1980). Adult dental health.Vol. II. England and Wales 1968-1978. London. Her Majesty's Stationery Office.Todd,J.E., Walker, A.M. & Dodd, P. (1982). Adult dental health. Volume II. United Kingdom 1978. London. Her Majesty's Stationery Office.Townsend, P., Davidson, N. & Whitehead, M. (1988). Inequalities in health: The Black Report and The Health Divide. Harmondsworth. Penguin.Udry, J.R. (1971). The social context of marriage. 2nd ed. Philadelphia. J. B. Lippincott Company.Veja (1988). Veja - Revista semanal de informacao. Ano 21. Volume 44. Sao Paulo. Editora Abril.Veja (1989). Veja - Revista semanal de informacao. Ano 22. Volume 1. Sao Paulo. Editora Abril.
171
Verbrugge, L.M. (1979). Marital status and health. Journal Of Marriage and the Family. 41: 267-285.Weiss, R.L. & Aved, B.M. (1978). Marital satisfaction and depression as predictors of physical health status. Journal of Consulting and Clinical Psychology. 44: 1379-1384.WHO (1987). Oral health surveys. Basic methods. 3rd ed., Geneva, WHO.Winkleby, M.A., Ragland, D.R. & Syme, S.L. (1988). Self- reported stressors and hypertension: evidence of an inverse association. American Journal of Epidemiology. 127: 124- 134.Young, C.M. & Trulson, M.F. (1960). Methodology for dietary studies in epidemiological surveys. II. Strengths and weaknesses of existing methods. American Journal of the Public Health. 50: 803-814.Yudkin, J. & Roddy, J. (1966). Assessment of sugar intake: validity of the questionnaire method. British Journal of Nutrition. 20: 807-811.Zeldow, P.B. & Pavlov, M. (1984). Physical disability, life stress, and psychosocial adjustment in multiple sclerosis. Journal of Nervous and Mental Disease. 172: 80-84.
172
APPENDIX 1
DEVELOPMENT OF QUESTIONNAIRES
INTRODUCTIONDesigning a questionnaire is a complex and time
consuming task. Valid and reliable questionnaires that already exist may, thus, be considered at least as a starting point. However, it has to bear in mind that the information provided by questionnaires constructed elsewhere might not be applicable to all societies. Moreover, every language has its particular meanings regarding the phrasing of the questions, and an apparently identical question in a different language might lead to a completely different perception, by the interviewed, of what was asked. Such on approach was used in the construction of the questionnaires used in this current research.
DEVELOPMENT OF THE IDENTIFICATION QUESTIONNAIREA shorter questionnaire was designed to be completed by
parents themselves at home, and to collect information for selecting, contacting and allocating participants in the socio-economic groups (Appendix 7).
The questions designed to select participants were related to the three criteria for participating in the study: marital status (man and a woman living together), economic position of the father (father/man in paid job)
173
and age (parental age range from 35 - 44 and child age of 13 years old).
The home address and telephone number was required to allow later contact with selected families.
All questions used in the ABA-ABIPEME questionnaire for socio-economic classification (Appendix 3) were also included.
A question about fathers income was added to the questionnaire and asked during the interview, when the identification questionnaire was validated. This question was based in the criteria for socio-economic classification used by IBGE (1986).
DEVELOPMENT OF THE PARENTS QUESTIONNAIRE (PART 1)This questionnaire was developed to be used in a
personal interview with parents during the first part of the study. It aimed to collect data on work characteristics, community participation, leisure activities, family relationship and general health behaviour.
The development of this questionnaire extended over a period of one year. The process initially involved a review of literature and a selection of relevant material from other studies. Following this review, some questions were selected and a semi-structured questionnaire was developed.
The assessment of work characteristics was based on questions selected from the studies of Karasek, 1979?
174
Karasek et al, 1981? Whitehall II study of British civil servents (Marmot, unpublished) and Coburn (1979).Community participation and leisure activities were assessed through the questionnaire used by Pratt (1976). Finally, family interaction was assessed through the scales used by Shumm, Bollman and Jurich (1981); Epstein, Baldwin and Bishop (1983); Locke and Wallace (1959); Spanier (1976); Pratt (1976); Shostrom (1975>? Larzelere and Huston (1980); Roach, Frazier and Bowden (1981); Olson and Barnes (1985) and Pendleton, Poloma and Garland (1980).
After the selection of questions, they were translated into Portuguese and tested twice, the first on Brazilians living in London and the second in Brasil during the pilot study.
The first pilot test of the questionnaire aimed to assess question-wording, question-sequence, order of sections and duration of interviews. Since the questions used were translated from other questionnaire^ into Portuguese, the wording of questions was check to evaluate if they were clear and meaningful to all respondents. Question-sequence and the order of section^ was assessed in order to make the questionnaire attractive and interesting to the participants.
Changes were made in the question-wording to overcome translation problems, and also in the question-sequence and order of sections to make the questionnaire more attractive. The first pilot test lead to a structured questionnaire.
175
A second pilot test was conducted during the pilot study in Brasil. The first objective of it was to check the applicability of the questions to the Brazilian society as well as to different socio-economic groups.
The questions utilized were selected from studies carried out on sectors of the English, American and Scandinavian societies, which could not reflect the Brazilian cultural background, especially that of the low socio-economic groups.
The second objective was to check if the questions used were adequate for the measurement of the concepts to be evaluated by the questionnaire. Validity of the questions was assessed by a succession of sets of specific and broad questions, each set dealing with a different concept, and by the use of cross-check questions. Furthermore, to bring out any important specific question not included in each set of questions, an open-ended question was asked.
The third and final objective of this pilot test was to access the reaction of respondents to embarrassing questions related to the respondents private life as family members relationship.
The questionnaire was modified in the light of respondents' replies and reactions to the questions. Minor changes were made in the question-wording and no changes were made in the question-sequence and order of sections. The respondents were able to understand the wording of questions and all of them showed interest and co-operation
176
throughout the whole interview.The questions used were applicable to the Brazilian
population. Nevertheless, some questions only apply to a particular group of subjects, for example; upper socioeconomic groups or literate groups. These were excluded or modified.
In relation to the validation of the questionnaire the questions proved to be adequate in measuring the concepts under investigation. Cross-checking of the specific questions with the open-ended questions demonstrated that respondents gave very few information in the open-ended questions that was not covered by the combination of the specific questions.
Few questions were added to the questionnaire in order to measure the concepts under study and those open-ended questions designed as cross-checks were excluded.
The pilot study also showed that respondents talked frankly about their private life. Few questions were considered embarrassing. These questions were excluded from the questionnaire. Other personal questions were rephrased in order to develop a complete relaxing interview for the participants.
The major change in the questionnaire was related to the 13-year-old child. As mentioned previously, the pilot study showed that the 13-year-old child felt most embarrassed to talk frankly about family relationship in the presence of his/her parent/s. Therefore, it was decided to measure parent/child relationship according to the
177
parents' report. Thus, the questions addressed to the 13- year-old child were rephrased and included in this questionnaire.
In order to clarify the methodology used to develop this questionnaire some examples are presented below.
The study measured work stress based in the Karasek model (Karasek, 1979). Nevertheless, one of the two questions, used by Karasek (1979) in Sweden to measure work demand ("Is your job hectic"), proved to be difficult to undertand. Illiterate subjects were not able to understand the meaning of "hectic". This questionwas substituted in the questionnaire by a combination oftwo questions used by Karasek (1979) in the United States. The 2 questions were:"How strongly do you agree or disagree with these statements ?_ In your job you have to work hard._ In your job you have to work fast".
Another example is related with the concept of family cohesiveness. This concept was measured throughout the extent and variety of activities in which family members engage together.
The pilot study tested the following activities: attend meeting at any organisation, go to parties, attend church, visit relatives or friends, attend sports events, attend some type of performance (for example: theatre or movie), go for a pleasure drive a car. The following open-ended question to bring out any important activity not included in this set of questions was asked:
178
"Do you and your partner engage in any other outside interest together ?If yes, could you please tell me which one ?"
Cross-checking of activities mentioned and the open- ended question resulted in the inclusion of the items "go for a walk" and "go to pubs and restaurants". Other questions as "attend sports events", "attend some type of performance (for example: theatre, movie, etc)" and "attend church" were excluded due to the very low frequency. Activities such as "go for a pleasure drive in a car" were also excluded. Beside the low frequency, the low socioeconomic groups in Brasil do not have a car. Thus, this question only applies to the Brazilian upper socio-economic groups.
The resulting questions were applicable to all socioeconomic groups and covered the activities generally carried out by the Brazilian population. It was noted that families rarely engage in outside activities.
Another example is related with the embarrasing questions. The pilot study showed that respondents felt uncomfortable to answer a few very sensitive questions about their family relationship such as:"Most persons have disagreements in their relationships. Please indicate the approximate extent of agreement or disagreement between you and your partner for each of the following list._ who should take the children to the doctor or dentist _ household work _ punishment of the children _ how to spend holidays _ handling family finances _ demonstrations of affection _ sex relations".
179
The two more sensitive questions - demonstrations ofaffection and sexual relations - were excluded. Thequestion-wording was also rephrased as follows:"Most persons think differently. Then, it is possible that you have different opinions from your partner's about the following subjects. Please indicate the approximate extent of agreement or disagreement between you and your partner for each of the following list".
The resulting questionnaire, after the pilot study, was an attractive and comprehensible one, covering all concepts adopted by the study to test the hypothesis as well as others for further studies.
The questionnaire used, and its translation back into English, is presented in Appendix 8. Since each language has a particular meaning for its phrases, it was decided to use questions which have the same meaning in English as a translation in order to give the closest idea of the interview.
DEVELOPEMENT OF THE PARENTS QUESTIONNAIRE (PART 2)This questionnaire was developed to be used in the
second part of the personal interview with parents. It aimed to collect information on dietary habits, oral hygiene and pattern of dental attendance. There were two main areas of interest: the first gathered information on the parents' habits and beliefs, while the second focused the transmission of these habits an beliefs to their children.
The development of this questionnaire extended over a period of one year. The process initially involved a review
180
of literature and a selection of relevant material from other oral health studies. Following this review, some questions were selected and a semi-structured questionnaire was developed. The questions were then translated into Portuguese and tested on a Brazilian sample during the pilot study.
When piloting the questionnaire in Brasil, the first objective was to check the applicability of the questions to the Brazilian society as well as to different socioeconomic groups. The questions were selected from studies carried out on sectors of the English and American societies (Bagramian,1969? Gray et al,1970? King,1976; Hodge,1979? Bateman,1985? Croucher & Rodgers,1985?Silver,1985; Freeman,1984? Hendricks,1986), which would not reflect the Brazilian society, especially the low socioeconomic groups.
The second objective of the pilot test was to assess question-wording and question-sequence. Question-sequence was assessed in order to make the questionnaire attractive and interesting to the participants. Each question-sequence started with a series of factual questions on the respondents' own habits, followed by some attitudinal questions and, finally, by some questions on the home environment.
The third and last objective was to check if the questions used were adequate for the measurement of the variables this study set out to evaluate. Validity of the
181
questions was assessed by a succession of sets of questions, each set containing the variables under study, and by the use of cross-check questions.
The questionnaire was modified in the light of the respondents' replies and reactions to the questions. No changes were made in the sequencing or wording of questions.
The major change involved the elimination of the questions following the method for questionnaire design developed by Fishbein and Ajzen (1975). At first, it was planned to assess beliefs and attitudes using the framework of Fishbein's Theory of Reasoned Action (Fishbein and AjZen, 1975). However, it was noticed that the respondents', especially those from the lower socioeconomic groups, had difficulties in understanding the instructions and answering the questions. Moreover, when cross-checking these questions with the open-ended questions, it was noticed that the answers did not correspond since most of the participants tended to answer positively to all questions presented. It was decided to precode the open-ended questions, designed at first as cross-checks, and to use them in the assessment of beliefs.
From the pilot study, it was concluded that the questions used were applicable to the Brazilian population. The respondents were able to understand the wording of questions and all of them showed interest and co-operation throughout the whole interview. In relation to the validation of the questionnaire, the questions proved to be
182
adequate in measuring the variables under study.The following sections will describe the methodology
used for the assessment of the variables under study.1. Dietary habits:
The 24-hour recall method was used to evaluate dietary habits. A single 24-hour recall gives a fairly good estimation of the food intake in a group of individuals, provided the sample is large, even if the individual variation is wide (Young & Trulson,1960; Pekkarinen et al,1967? Samuelson,1970). Some studies (Bull &Wheeler,1986), however, showed that the 24-hour recall method tends to underestimate the dietary intake when compared to other methods - weighed record, food purchase record and food frequency interview.
In spite of the constraints concerning the 24-hour recall method, other methods were impractical due to the lack of resources for adequate supervision of diet patterns and home visits. In addition, most people have a quite regular pattern of consumption of sugar and the foods containing it (Yudkin & Roddy, 1966). Therefore, the 24- hour recall was the method selected for the assessment of sugar intake.
In an attempt to help participants remember the food consumed on the previous day, a list of items (adapted from Bagramian,1969) was used. As the interviewer read the items aloud, the respondents would specify if the item was eaten, when it was eaten and how many were eaten. During
183
the pilot test of the questionnaire, the 24-hour recall method was tested with this list of items and without this list. It was observed that the use of the item list helped respondents give a more accurate picture of what was eaten during the previous 24 hours.2. Oral Hygiene and Dental Attendance Habits:
The assessment of oral hygiene and dental attendance habits was based on commonly used questions.
The oral hygiene habits were brushing habits, use of dental floss and type of toothpaste. Questions on brushing habits focused on both brushing frequency and brushing times (Gray et al,1970; Silver,1985). Respondents were also questioned on their dental flossing habits (Cushing,1986) and type of toothpaste used (Silver,1985; Cushing,1986).
Type of dentist, last visit to the dentist and pattern of dental attendance were selected to assess dental attendance habits. The options to the type of dentist were: private, public sector - schools and NHS - covenant and military services.
When assessing the last visit to the dentist, respondents were asked how long ago they had visited a dentist and the reason for the visit. Finally, respondents were questioned on the frequency of going to the dentist (Gray et al,1970; Cushing,1986).3. Beliefs:
Beliefs regarding sugar consumption, oral hygiene habits and dental attendance were assessed in open-ended questions. These questions were precoded according to the
184
results of the pilot study. Field coding was the technique used for the recording of the answers.4. Transmission of Habits:
The purpose of this section was to evaluate the home environment in relation to the three dental behaviours. The main idea was not only to find out the person in charge of introducing and controlling the execution of these behaviours, but also to check if the person taking care of the performance of the habits would be the person who would most strongly influence the transmission of such habits to the offspring.
Habits were evaluated through a set of five questions, adapted from two authors (King,1976; Hodge,1979). Two questions focused on the introduction of the habit and at what age. Participants were asked about the child's age when the habit was introduced and about the person responsible for introducting the habit (King,1976). The first question was used as an introductory question, while the second was the question used in data analysis.
Two questions focused on finding out who was the person in charge of controlling or reminding the child to perform the habit (Hodge,1979). Two points in time were evaluated: the present time and in the past when the child was younger.
The fifth and last question assessed the person most concerned about the execution of the three dental habits.
185
DEVELOPMENT OF THE 13-YEAR-OLD CHILD QUESTIONNAIRE:The aim of this questionnaire was to gather information
on dietary habits, oral hygiene and pattern of dental attendance. There were two areas of interest: the first collected information on the index child's habits and beliefs? while the second focused on the acquisition of these habits and beliefs by the child.
Considering that one of the objectives of this study was to compare behaviours and beliefs of a child with those of his/her parents, to facilitate comparison an attempt was made to ask similar questions to both groups. Therefore, this questionnaire was based on the Parents' Questionnaire (Part II) and its development and testing followed the same steps described above. Here only the differences between these two questionnaires will be described.1. Dietary Habits:
The 24-hour recall method was used to assess dietary habits. A list of food items was then read to the child in an attempt to remind him/her of any food item consumed within the previous 24 hours.
In order to determine the origin of the sugary items consumed, the child was prompted if the sugary item mentioned was 'got at home', 'given to the child' or 'bought by the child' (Croucher & Rodgers,1985).2. Oral Hygiene and Dental Attendance Habits:
The evaluation of oral hygiene and dental attendance habits was based on commonly used questions in dental literature. The child was asked the same questions posed to
186
his/her parents.3. Beliefs:
Questions on the beliefs regarding sugar consumption, oral hygiene habits and dental attendance followed what was described previously for Parents' Questionnaire (Part II).4. Acquisition of Habits:
The objective of this section was to assess the home environment in relation to the three dental behaviours under study. As with the parents' questionnaire, the main idea was to find out who would be the person in charge of controlling the execution of these behaviours by the child at home and to assess if the person in charge of the performance of these behaviours would be the strongest determinant in the acquisition of these habits by the child.
Differently from the parents, and for obvious reasons, the child was not asked about the age of introduction and the person to introduce these habits in his/her life.
DEVELOPMENT OF THE SIBLINGS QUESTIONNAIRE:The aim of this questionnaire was to collect
information on the dietary habits, oral hygiene and pattern of dental attendance. The development and testing of this questionnaire followed the same steps described for Parents' Questionnaire (Part II) and 13-year-old Child's Questionnaire. This questionnaire used the same questions described for the 13-year-old child, the only difference
187

being the omission of the questions on beliefs and acquisition of habits.
188
APPENDIX 2
CLINICAL DATA
1. DENTAL EXAMINATIONS:Data on prosthetic, oral hygiene, periodontal and
caries status, and treatment needs were collected in the study.
Examinations took place at the participants' home, taking on average 10 minutes. Examinations were conducted using a head-lamp to provide standard illumination. Examinations were all carried out with the examiner positioned in front of the subject, who was seated in a chair, and using No.4 plain mouth mirrors, sickle-shaped explorer and World Health Organisation's recommended periodontal probe (CPITN probe, which was colour-coded with a black band starting at 3.5 mm and ending at 5.5 mm from the ball ended tip). The explorer was used only to remove debris, to check for interproximal caries and to check occlusal cavitation where doubt existed on visual inspection. All the instruments were sterilised in dry-heat oven at 160 C for 90 minutes.
The criteria for examination used in this study were adapted from WHO (1987), and will now be discussed in detail.
1.1. PROSTHETIC STATUS:Denture wearing and prosthetic treatment needs were
189
assessed separately for both upper and lower jaws, following the criteria established by WHO (1987).Therefore, wearing a prosthesis was coded as follows - not wearing a denture, wearing a partial denture and wearing a full denture? while prosthetic treatment needs were coded as - no denture needed, need for denture repair, need for partial denture, need for full denture.
1.2. ORAL HYGIENE STATUS:Two indicators were used to assess the oral hygiene
status: the tooth area covered by debris, and the presenceor absence of supra- or sub-gingival calculus.1.2.1. Debris:
Six surfaces were examined for debris, four posterior and two anterior. In the posterior portion of the dentition, the first fully erupted tooth distal to the second premolar, usually the first molar but sometimes the second or third molar, was examined on each side of each arch. The buccal surface of the selected upper molars and the lingual surfaces of the selected lower molars were inspected. In the anterior portion of the mouth, the labial surfaces of the upper right and the lower left central incisors were examined. In the absence of either of these anterior teeth, the central incisor on the opposite side of the midline was substituted (Greene and Vermillion, 1964).
Only fully erupted permanent teeth were recorded. A tooth was considered to be fully erupted when the occlusal
190
or incisal surface had reached the occlusal plane. Natural teeth with full crown restorations and surfaces reduced in height by caries or trauma were not recorded. Instead, an alternate tooth was examined (Greene and Vermillion, 1964).
Oral debris was considered as the soft foreign matter loosely attached to the teeth. The surface area covered by debris was estimated by running the side of a sickle-shaped explorer along the tooth surface being examined. The occlusal or incisal extent of the debris was noted as debris was removed. The scoring system, developed by Greene and Vermillion (1964), was used:
. no debris or stain present,
. soft debris covering not more than one-third of the tooth surface being examined or the presence of extrinsic stains without debris regardless of surface area covered,
. soft debris covering more than one-third, but not more than two-thirds of the exposed tooth surface,
. soft debris covering more than two-thirds of the exposed tooth surface.1.2.2. Calculus:
All teeth were examined for calculus. A plain mirror was used to assess supragingival calculus. If calculus was not obvious in any part of the tooth surface, the subgingival tooth surface was probed for calculus. Following the anatomic configuration of the root surface, the probe was gently inserted between the tooth and the gingiva until the resistance of the supra-alveolar fibres was felt. The total extent of the surface of the tooth root was examined.
191
Calculus, if supra or subgingival, was scored as present or absent (Ainamo et al, 1982).
1.3. PERIODONTAL STATUS:Gingival bleeding after probing and periodontal pockets
were used in the assessment of the periodontal status. Allthe teeth were assessed.1.3.1. Pocketing:
The presence or absence of pockets was recorded at thesame time as the assessment of calculus deposits for eachtooth. The following criteria (Ainamo et al, 1982) were used:
. clinical gingival sulcus of 3.5 mm or less (no pocket),
. pockets greater than 3.5 mm, but less than or equal to 5.5 mm (shallow pockets),
pockets greater than 5.5 mm (deep pockets).All pocket depths were measured from the gingival
margins, and the deepest pocket of each tooth was recorded.1.3.2. Bleeding:
The absence or presence of bleeding was also recorded at the same time as calculus and pocketing. When all teeth in one sextant had been probed for calculus and pockets, the same teeth were re-examined in the same sequence to ascertain whether the probing had resulted in obvious bleeding (Ainamo et al, 1982).
192
1.4. DENTAL STATUS:Dental status was assessed using a plain mouth mirror
and a sickle-shaped explorer. All surfaces of the teeth were examined and recorded. A tooth was considered present in the mouth when any part of it was visible or could be touched with the tip of the explorer without unduly displacing soft tissues. If a permanent and a primary tooth occupied the same tooth space, the status of the permanent tooth only was recorded.1.4.1. Sound surface:
A tooth surface was recorded as sound if it showed no evidence of treated or untreated clinical caries. The stages of caries that precede cavitation, as well as other conditions similar to the early stages of caries, were recorded as sound. Thus, tooth surfaces showing the following characteristics, in the absence of positive criteria, were recorded as sound:
. white or chalky spots,
. discoloured or rough spots,
. stained pits or fissures in the enamel that catch the explorer but do not have a detectable softened floor, undermined enamel, or softening of the walls,
. dark, shiny, hard, pitted areas of enamel in a tooth showing signs of moderate to severe fluorosis,
. a traumatised broken tooth surface.All questionable lesions were coded as sound.
1.4.2. Decayed surface:A surface was recorded as decayed when a lesion in a
193
pit or fissure, or on a smooth tooth surface, had a detectable softened floor, undermined enamel, or a softened wall. On approximal surfaces, caries was recorded as present when the explorer tip entered a lesion with certainty.
All surfaces with temporary filling were recorded as decayed.
Where any doubt existed, caries was not recorded as present.
1.4.3. Filled surface with decay:A tooth surface was recorded as filled with decay when
it contained one or more permanent restorations and one or more areas that were decayed.1.4.4. Filled surface with no decay:
A surface was considered filled without decay when one or more permanent restorations were present and there was no secondary caries or other area with primary caries. Crowns and bridge abutments were not recorded in this category.1.4.5. Tooth missing due to caries:
A missing tooth due to caries was recorded when a permanent or primary teeth had been extracted because of caries. For primary teeth, missing was recorded only if the subject was at an age when normal exfoliation would not have been a sufficient explanation for absence.1.4.6. Tooth missing for any other reason:
A permanent tooth was recorded as missing for any other
194
reason when it was judged to be absent congenitally, or extracted for orthodontic reasons or because of trauma.This information was obtained by asking the subject.
Deciduous teeth were not recorded in this category.1.4.7. Sealant:
A sealant was recorded when a fissure sealant had been placed on the occlusal surface. Teeth recorded in this category were included in the DMFS and DMFT calculation as sound. However, the number of surfaces recorded as sealed was not meaningful.
If a sealed surface had caries, it was recorded as decayed.1.4.8. Bridge abutment or special crown:
A permanent or deciduous tooth was recorded as crowned when a crown had been placed on a tooth due to previous caries or as a replacement of a filling. All crowned teeth which were bridge abutments and were previously decayed or filled were recorded in this category.
The teeth recorded in this category were included in the calculation of both DMFT and DMFS indices since the prevalence of dental caries in Brasil is very high and crowns are a common procedure in Brazilian dental practice.
A sound tooth which had been crowned for any other reason (for example: trauma or bridge abutment) wasrecorded as excluded. The reason for crowning as well as the previous tooth condition was obtained through
195
questioning the subject.A missing tooth replaced by a bridge was recorded as
missing due to caries or missing for any other reason.1.4.9. Unerupted tooth:
This criterion was restricted to permanent teeth, and was used only for a tooth space with an unerupted permanent tooth, but without a primary tooth.1.4.10. Excluded tooth:
A tooth was excluded when:. it could not be examined, and. a sound tooth had been crowned for reasons other
than decay or filling replacement.All third molars were included in this category.
1.4.11. DMFT and DMFS indices:All teeth scored as excluded, unerupted, and missing
due to any other reason than decay, were not included in the calculation of DMFT and DMFS indices.
Teeth recorded as decayed and as filled with decay composed the DT component of the DMFT index. Teeth recorded as missing due to caries composed the MT component, and the ones recorded as filled without decay and as crowned composed the FT component of the DMFT index.
The basis for calculation of the DMFS index followed the same criteria, but the number of surfaces was taken into account.
196
1.5. DENTAL TREATMENT REQUIREMENTS OF INDIVIDUAL TEETH:Assessment of the type of treatment required, if any,
was recorded based on the examiner's clinical judgement.The criteria established by WHO (1987) for treatment requirements of individual teeth was used.1.5.1. No treatment:
No treatment required was recorded if a permanent or deciduous tooth was sound, or if it was decided that a tooth could not or should not be extracted or receive any other treatment.1.5.2. Arrested caries and sealant care:
Arrested caries was rare and fissure sealants care would not be used at high caries rates. Then, it was decided to exclud this item.1.5.3. Filling:
Restorations were coded according to how many surfaces would be involved. One surface filling was recorded when the restoration required involved one surface only, and two or more surface filling was recorded when two or more surfaces should be involved by the restoration. Fillings were indicated when one or more of the following conditions were present:
. primary or secondary caries,
. repair damage due to trauma,
. replace unsatisfactory fillings.A filling was considered unsatisfactory if it
presented a fracture or a deficient margin that either caused it to be loose or permitted leakage into dentine.
197
Overhanging margins causing obvious local irritation to the gingiva and which could not be removed by recontouring of the restoration were also considered unsatisfactory. A lenient criteria was used when considering a restoration satisfactory.1.5.4. Crown and bridge abutment:
Crown was recorded when a crown was indicated to restore a destroyed tooth crown. Bridge abutments were recorded in this category.1.5.5. Bridge element:
Bridge pontic was recorded to indicate the portion of a bridge that would be replacing a missing tooth.1.5.6. Pulp care:
Pulp care was recorded to indicate that a tooth probably needed pulp care prior to restoration with a filling or crown because of deep and extensive caries or because of tooth mutilation or trauma.
1.5.7. Extraction:A tooth was recorded as 'indicated for extraction'
when:. caries had so destroyed the crown that it could not
be restored,. periodontal disease had progressed so far that the
tooth was loose or functionless and could not be restored to a firm and functional state by periodontal therapy,
. a tooth needed to be extracted to make space for a
198

prosthesis,. extraction was required for orthodontic or cosmetic
reasons, or because of impaction.
199
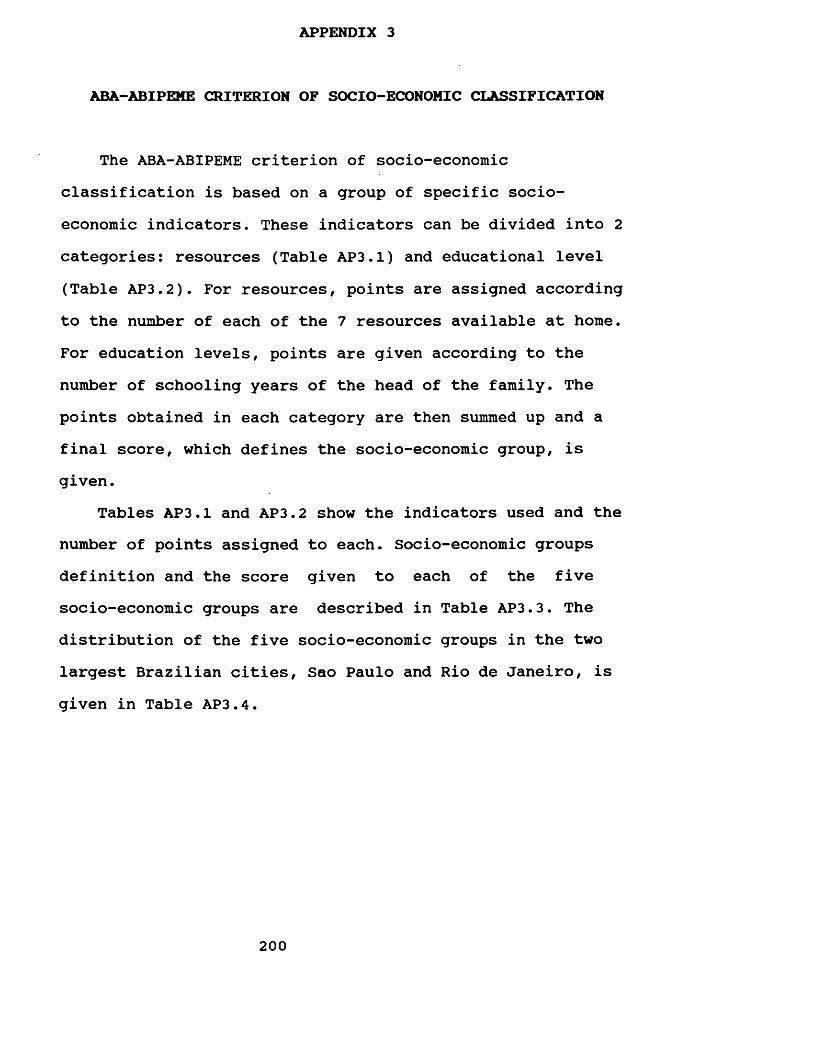
APPENDIX 3
ABA-ABIPEME CRITERION OF SOCIO-ECONOMIC CLASSIFICATION
The ABA-ABIPEME criterion of socio-economic classification is based on a group of specific socioeconomic indicators. These indicators can be divided into 2 categories: resources (Table AP3.1) and educational level (Table AP3.2). For resources, points are assigned according to the number of each of the 7 resources available at home. For education levels, points are given according to the number of schooling years of the head of the family. The points obtained in each category are then summed up and a final score, which defines the socio-economic group, is given.
Tables AP3.1 and AP3.2 show the indicators used and the number of points assigned to each. Socio-economic groups definition and the score given to each of the five socio-economic groups are described in Table AP3.3. The distribution of the five socio-economic groups in the two largest Brazilian cities, Sao Paulo and Rio de Janeiro, is given in Table AP3.4.
200
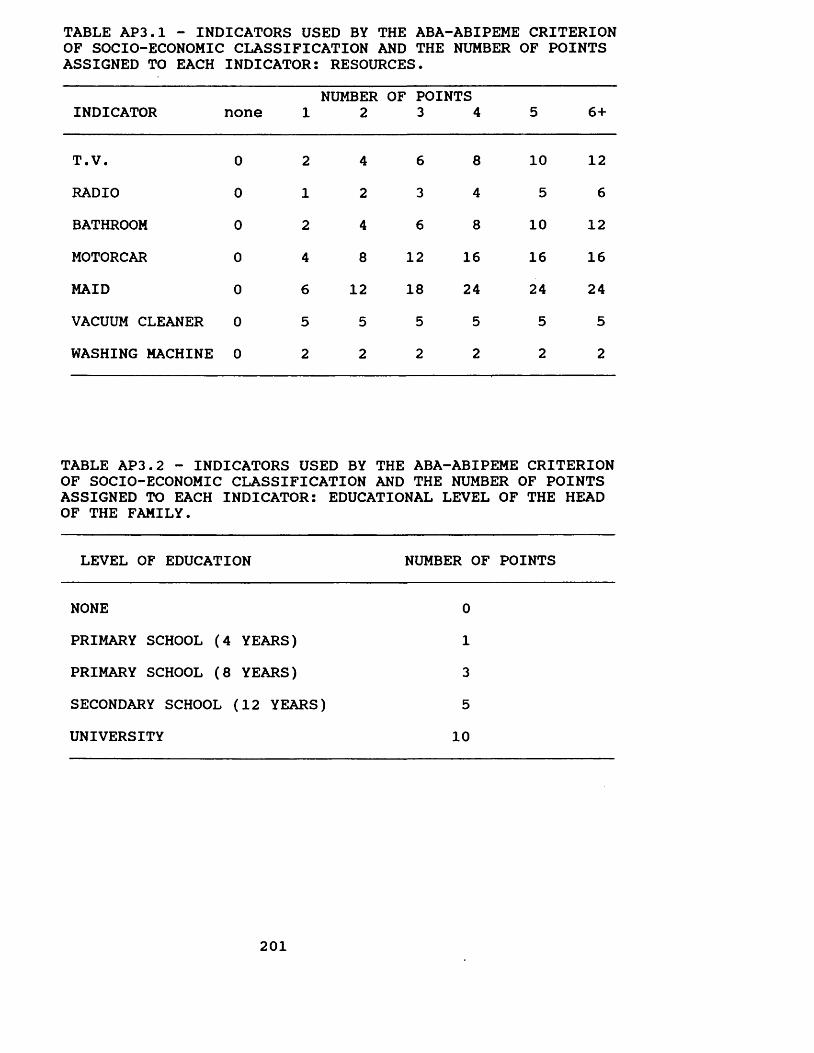
TABLE AP3.1 - INDICATORS USED BY THE ABA-ABIPEME CRITERION OF SOCIO-ECONOMIC CLASSIFICATION AND THE NUMBER OF POINTS ASSIGNED TO EACH INDICATOR: RESOURCES.
INDICATOR none 1NUMBER
2OF POINTS
3 4 5 6+
T.V. 0 2 4 6 8 10 12RADIO 0 1 2 3 4 5 6BATHROOM 0 2 4 6 8 10 12MOTORCAR 0 4 8 12 16 16 16MAID 0 6 12 18 24 24 24VACUUM CLEANER 0 5 5 5 5 5 5WASHING MACHINE 0 2 2 2 2 2 2
TABLE AP3.2 - INDICATORS USED BY THE ABA-ABIPEME CRITERION OF SOCIO-ECONOMIC CLASSIFICATION AND THE NUMBER OF POINTS ASSIGNED TO EACH INDICATOR: EDUCATIONAL LEVEL OF THE HEAD OF THE FAMILY.
LEVEL OF EDUCATION NUMBER OF POINTS
NONE 0PRIMARY SCHOOL (4 YEARS) 1PRIMARY SCHOOL (8 YEARS) 3SECONDARY SCHOOL (12 YEARS) 5UNIVERSITY 10
201
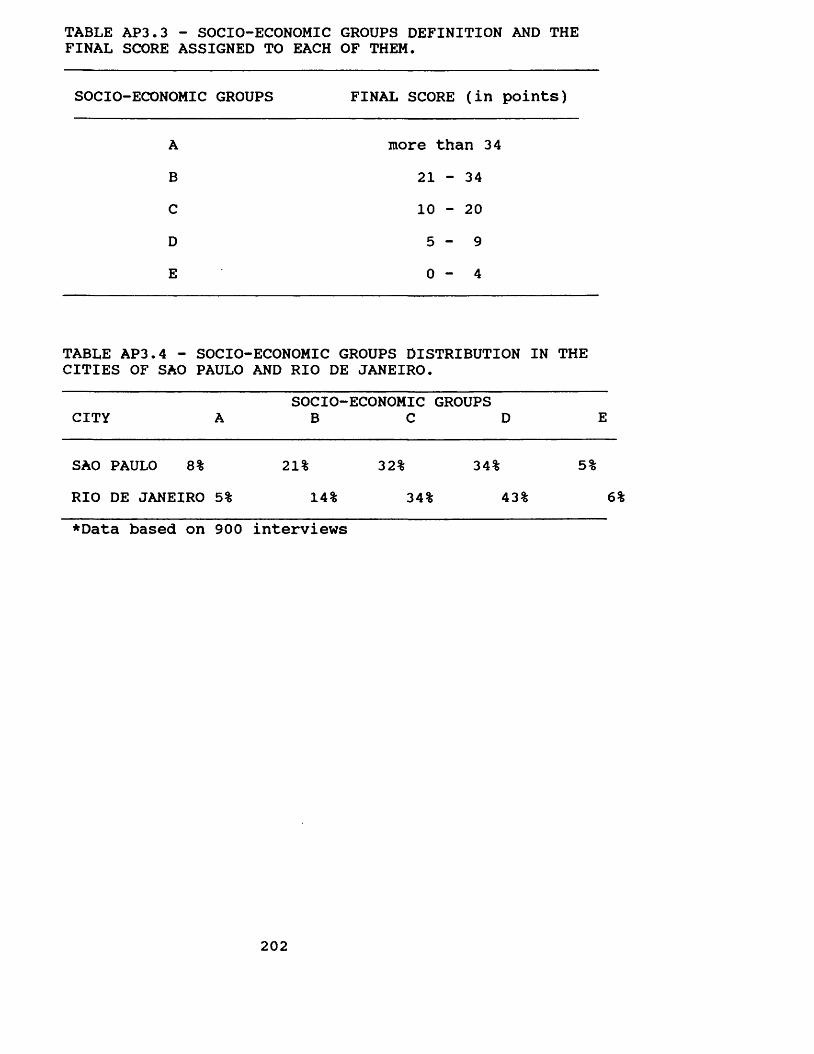
TABLE AP3.3 - SOCIO-ECONOMIC GROUPS DEFINITION AND THE FINAL SCORE ASSIGNED TO EACH OF THEM.
SOCIO-ECONOMIC GROUPS FINAL SCORE (in points)
ABCDE
more than 34 21 - 34 10 - 20 5 - 9 0 - 4
TABLE AP3.4 - SOCIO-ECONOMIC GROUPS DISTRIBUTION IN THE CITIES OF SAO PAULO AND RIO DE JANEIRO.
SOCIO-ECONOMIC GROUPS CITY A B C D E
SAO PAULO 8% 21% 32% 34% 5%RIO DE JANEIRO 5% 14% 34% 43% 6%♦Data based on 900 interviews
202

APPENDIX 4
LIST OF SCHOOLS SELECTED AND NUMBER OF STUDENTS
The following schools, with the total number ofstudents and the number of 13-year-olds (CEDINE, 1985),were randomly selected to participate in the study:1. Schools located in 'middle-class' areas:_ ColAgio Loyola ( private )
total number of students: 1,694 number of 13 year-old students: 252
_ Escola Santo TomAs de Aquino ( private )total number of students: 1,064 number of 13 year-old students: 105
_ ColAgio LogosAfico Gonzales Pecotche ( private )total number of students: 405 number of 13 year-old students: 37
_ Escola Albert Einstein ( private )total number of students:176 number of 13 year-old students: 16
_ ColAgio PitAgoras - Cidade Jardim ( private )total number of students: 2,219 number of 13 year-old students: 271
_ IEMG ( state )total number of students: 2,368 number of 13 year-old students: 254
_ ColAgio Dom Cabral ( private )total number of students: 346 number of 13 year-old students: 23
_ ColAgio Coragao de Jesus ( private )total number of students: 956 number of 13 year-old students: 107
203
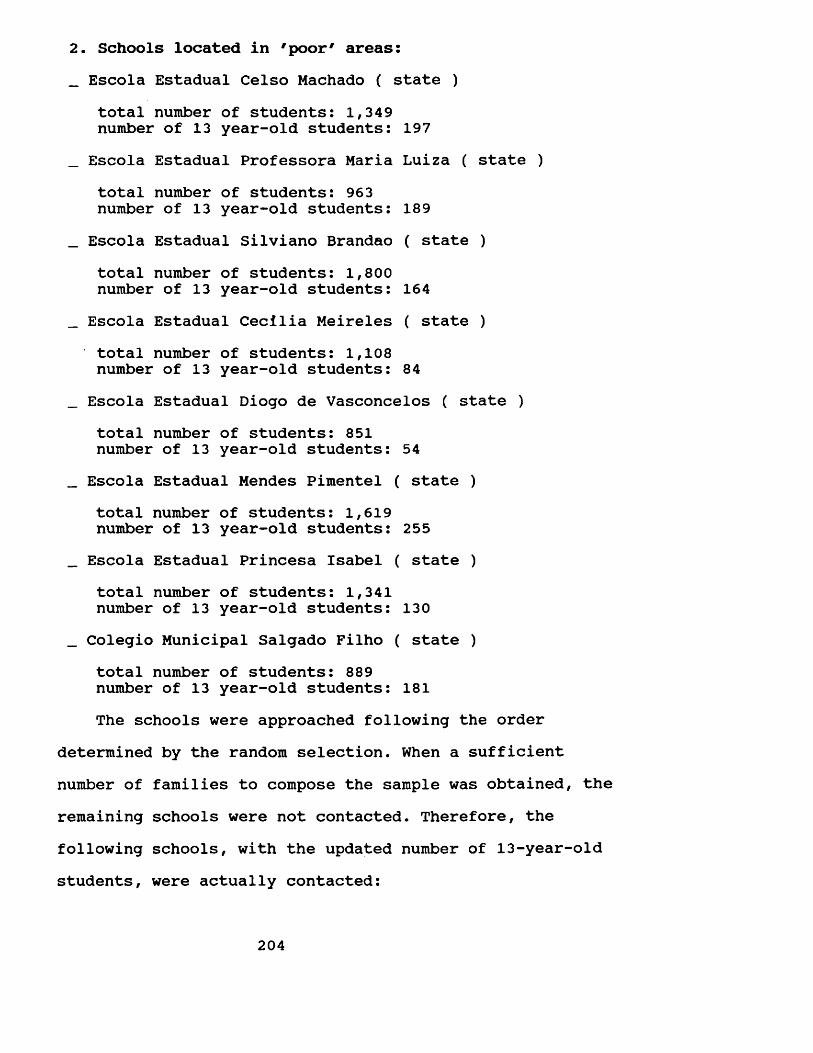
2. Schools located in 'poor' areas:_ Escola Estadual Celso Machado ( state )
total number of students: 1,349 number of 13 year-old students: 197
_ Escola Estadual Professora Maria Luiza ( state )total number of students: 963 number of 13 year-old students: 189
_ Escola Estadual Silviano Brandao ( state )total number of students: 1,800 number of 13 year-old students: 164
_ Escola Estadual Cecilia Meireles ( state )total number of students: 1,108 number of 13 year-old students: 84
_ Escola Estadual Diogo de Vasconcelos ( state )total number of students: 851 number of 13 year-old students: 54
_ Escola Estadual Mendes Pimentel ( state )total number of students: 1,619 number of 13 year-old students: 255
_ Escola Estadual Princesa Isabel ( state )total number of students: 1,341 number of 13 year-old students: 130
_ Colegio Municipal Salgado Filho ( state )total number of students: 889 number of 13 year-old students: 181The schools were approached following the order
determined by the random selection. When a sufficientnumber of families to compose the sample was obtained, theremaining schools were not contacted. Therefore, thefollowing schools, with the updated number of 13-year-oldstudents, were actually contacted:
204
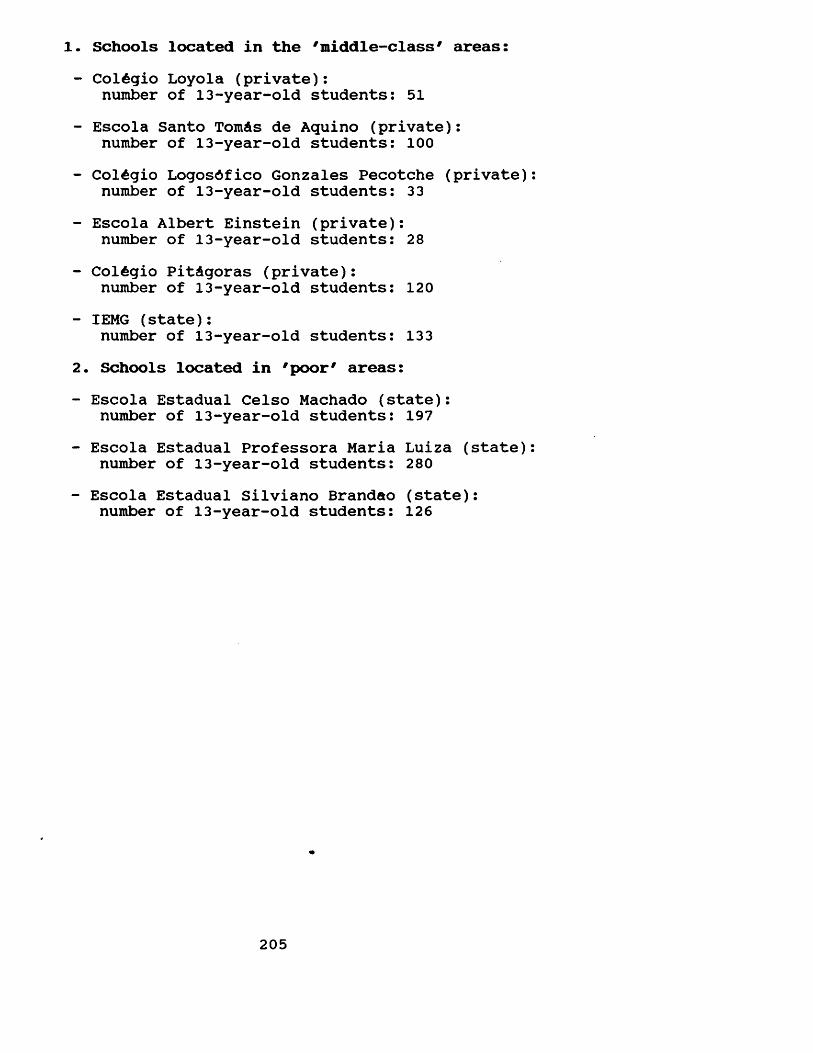
Schools located in the 'middle-class' areas:ColAgio Loyola (private): number of 13-year-old students: 51
Escola Santo TomAs de Aquino (private): number of 13-year-old students: 100ColAgio LogosAfico Gonzales Pecotche (private) number of 13-year-old students: 33Escola Albert Einstein (private): number of 13-year-old students: 28
ColAgio PitAgoras (private): number of 13-year-old students: 120IEMG (state): number of 13-year-old students: 133
. Schools located in 'poor' areas:Escola Estadual Celso Machado (state): number of 13-year-old students: 197Escola Estadual Professora Maria Luiza (state) number of 13-year-old students: 280Escola Estadual Silviano Brandao (state): number of 13-year-old students: 126
205
APPENDIX 5
CONSISTENCY OF CLINICAL EXAMINATIONS
The need for consistent, standardised diagnosis of oral health status of populations is recognised (WHO, 1987). Nevertheless, there appears to be no generally approved method of assessing examiner reproducibility (Bulman & Osborn, 1989). Therefore, techniques, such as Student's t- test, Pearson's correlation coefficient and percent agreement, are often applied in the assessment of intraexaminer reliability. These test statistics have some shortcomings when applied for that purpose (Hunt, 1986; Bulman & Osborn, 1989). These shortcomings will now be discussed.
Student's t-test and Pearson's correlation coefficient use the mean and the variance of the samples under study in the calculation of their statistical values, ignoring individual observations or differences (Bland, 1987). In doing so, systematic differences between examiners/exams cannot be properly detected (Hunt, 1986? Bulman & Osborn, 1989). Considering that in the assessment of intra-examiner reproducibility, the point of study is the differences between paired individual observations, these two test statistics, perfectly acceptable in other contexts, are misapplied when used as measurements of consistency.
Percent agreement is another test statistic which is used as a measure of examiner reliability. In spite of
206

taking into account agreement/disagreement in diagnostic criteria, it does not correct overall agreement for the chance agreement, for example agreement that could have been attained had the decisions been made at random (Hunt, 1976). Therefore, this test statistic overestimates the observed agreement between examiners, giving higher reproducibility results.
Cohen's Kappa Coefficient of Agreement is a measure of agreement proposed for variables which follow at least a nominal scale (Siegel & Castellan, 1988). Since it relates the actual measure of agreement with the degree of agreement that would have been obtained had the diagnoses been made at random, it can be interpreted as a measure of agreement beyond that due solely to chance. For this reason, this test statistic is probably the most reliable method of assessing intra-examiner reliability (Hunt, 1986? Nuttal & Paul, 1986? Bulman & Osborn, 1989).
For the interpretation of Kappa values, Landis & Koch (1977) proposed a six-point scale. Kappa values below zero were termed as poor agreement? 0.00-0.20 slight agreement?0.21-0.40 fair agreement? 0.41-0.60 moderate agreement?0.61-0.80 substantial agreement? and values above 0.81 indicate almost perfect agreement beyond chance.
In the present study, every tenth individual was reexamined, a total of 81 re-examinations. Original and duplicate exams were assessed for agreement using the Kappa Coefficient of Agreement. Each clinical index was
207
considered separately: DMFS, ODI-S, presence/absence of bleeding, presence/absence of calculus, and periodontal pocketing.
For all of them, the Kappa Coefficient was above 0.95 (95%), indicating almost perfect agreement beyond chance. For both DMFS and pocketing, Kappa Coefficient was 0.99 (99%)? for presence/absence of bleeding, 0.98 (98%)? for both ODI-S and presence/absence of calculus, 0.96 (96%). The highly consistent results show a high intra-examiner reliability.
208
APPENDIX 6
SOCIAL CHARACTERISTICS OF THE SAMPLE
Most of the characteristics examined differed by the socio-economic status of the families.
1. Area of residence:
According to the PLAMBEL criteria (PLAMBEL, 1984),Belo Horizonte can be divided into five major areas:"nAcleo central", "Area pericentral", "pampulha", "eixo industrial", and "periferias".
The families participating in this study were unevenly distributed throughout these five areas (Table 1). "NAcleo central" contained the largest number of families (34.8%) followed, in a descending order, by "pampulha" (24.4%), "eixo industrial" (22.6%), "Area pericentral" (15.9%) and "periferias" (2.4%).
Overall, a specific socio-economic group tended to cluster in each area (Table AP6.1). "Area central" had families only from the two wealthier socio-economic groups. However, families from socio-economic group A greatly outnumbered those from socio-economic B.
In contrast, "eixo industrial" was only inhabited by families coming from the two less privileged socio-economic groups. The majority of families living in this area were from socio-economic group D.
"Pampulha" was composed of three socio-economic groups:
209
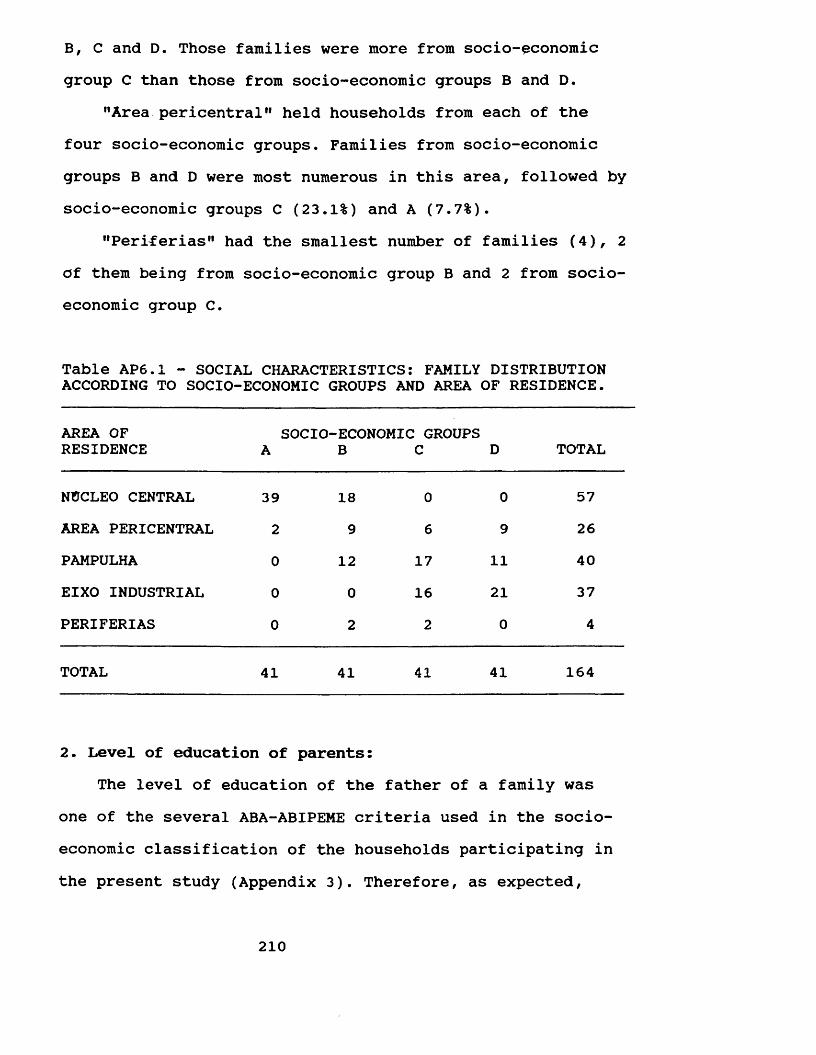
B, C and D. Those families were more from socio-economic group C than those from socio-economic groups B and D.
"Area pericentral” held households from each of the four socio-economic groups. Families from socio-economic groups B and D were most numerous in this area, followed by socio-economic groups C (23.1%) and A (7.7%).
"Periterias” had the smallest number of families (4), 2 of them being from socio-economic group B and 2 from socioeconomic group C.
Table AP6.1 - SOCIAL CHARACTERISTICS: FAMILY DISTRIBUTIONACCORDING TO SOCIOECONOMIC GROUPS AND AREA OF RESIDENCE.
AREA OF SOCIO-ECONOMIC GROUPSRESIDENCE A B C D TOTAL
NUCLEO CENTRAL 39 18 0 0 57AREA PERICENTRAL 2 9 6 9 26PAMPULHA 0 12 17 11 40EIXO INDUSTRIAL 0 0 16 21 37PERIFERIAS 0 2 2 0 4
TOTAL 41 41 41 41 164
2. Level of education of parents:The level of education of the father of a family was
one of the several ABA-ABIPEME criteria used in the socioeconomic classification of the households participating in the present study (Appendix 3). Therefore, as expected,
210
socio-economic status showed a close relationship to the educational level of parents. The higher the socio-economic status, the more years of schooling (Table AP6.2). In socio-economic group A all the parents had at least twelve years of formal education. Four out of five parents had attended University and 6% of them had taken a postgraduate course.
The pattern observed in socio-economic group B was virtually the same as socio-economic A, most of the parents having had at least twelve years of schooling. In relation to higher education parents from this socio-economic group tended to be half as likely to have extended their studies to University levels as those from socio-economic group A.
The parents from socio-economic group C tended to be in all educational levels. However, such a distribution was more likely to be skewed to the right than in the two socio-economic groups mentioned previously. The predominant pattern was for parents to have attended up to four years of education.
In the less privileged socio-economic groups, the parents had the lowest levels of education. None of them had attended University and only one had secondary education (12 years of schooling). The majority of the parents from this socio-economic group (one-half of them) had up to four years of schooling, while nearly two-in-five could just read and write.
Within the families, especially those from the higher socio-economic groups, the educational level of parents was
211
strongly influenced by gender (Table AP6.3). Overall, men had higher levels of education than women.
In socio-economic group A, in spite of the educational levels of both parents being very high, the fathers had proportionally more years of schooling than the mothers. Nine out of ten fathers from this socio-economic group had attended university and all those who had gone through a post-graduate course were males. Of the mothers, two-thirds of them had a university education.
The educational level of the parents from socioeconomic group B was high but the number of fathers attending at least twelve years of formal education emerged as being markedly higher than the number of women. The fathers were twice as likely as the mothers to have gone to university and fewer men stopped studying after finishing secondary education (12 years of schooling). The mothers were more likely to leave school after the completion of twelve years of schooling and comparatively more women attended only four years of formal education.
In socio-economic groups C and D, hardly any difference could be found between the educational level of fathers and mothers. Fathers, however, showed a slightly higher level of education than women.
212
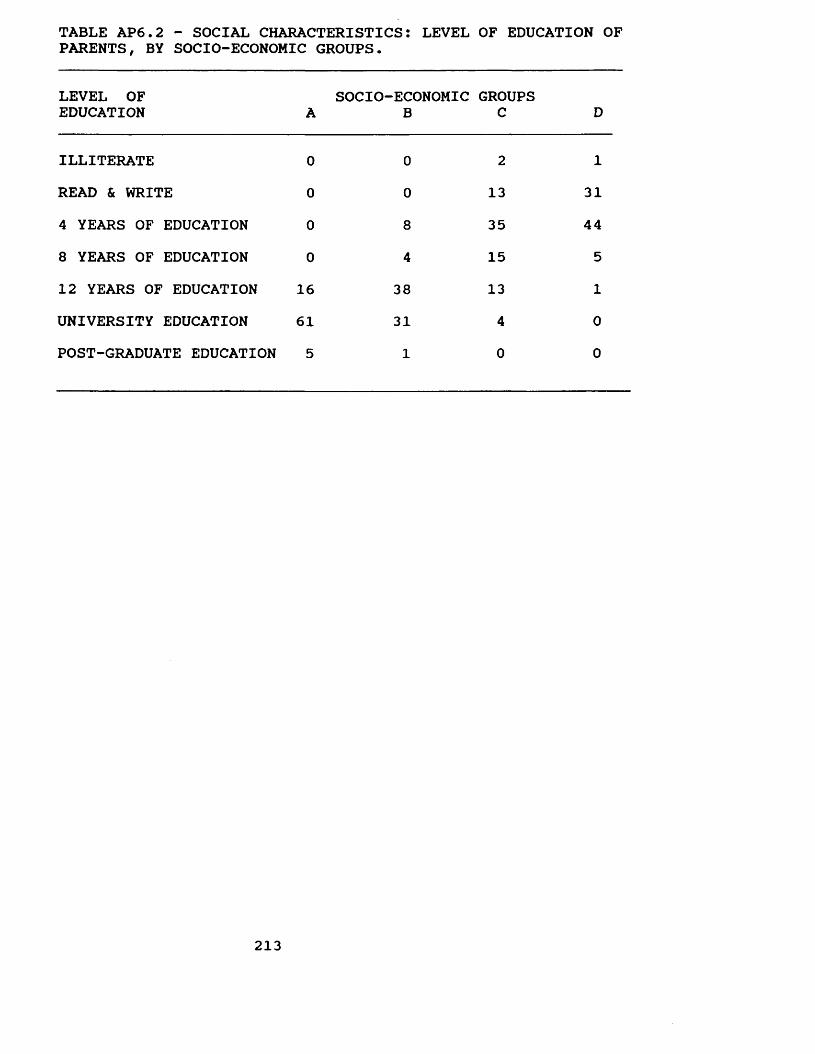
TABLE AP6.2 - SOCIAL CHARACTERISTICS: LEVEL OF EDUCATION OFPARENTS, BY SOCIO-ECONOMIC GROUPS.
LEVEL OF EDUCATION A
SOCIO-ECONOMICB
GROUPSC D
ILLITERATE 0 0 2 1READ & WRITE 0 0 13 314 YEARS OF EDUCATION 0 8 35 448 YEARS OF EDUCATION 0 4 15 512 YEARS OF EDUCATION 16 38 13 1UNIVERSITY EDUCATION 61 31 4 0POST-GRADUATE EDUCATION 5 1 0 0
213
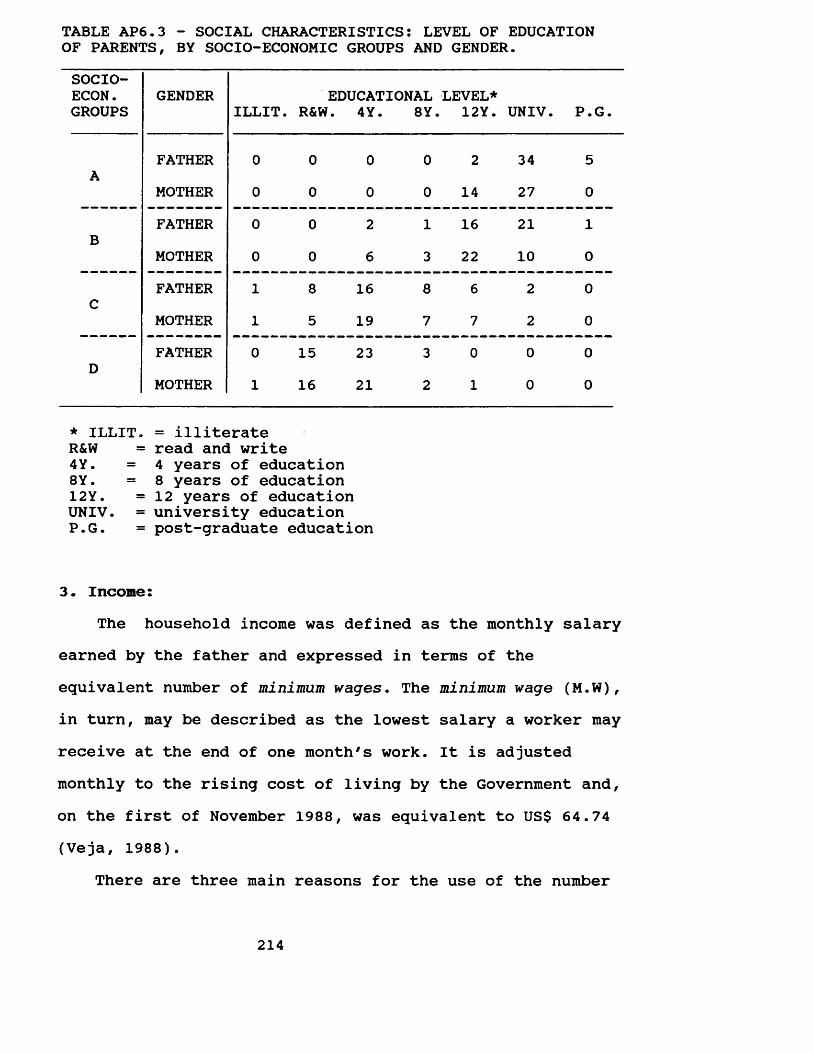
TABLE AP6.3 - SOCIAL CHARACTERISTICS: LEVEL OF EDUCATIONOF PARENTS, BY SOCIO-ECONOMIC GROUPS AND GENDER.SOCIO-ECON.GROUPS
GENDERILLIT. R&W
EDUCATIONAL . 4Y. 8Y.
LEVEL*12Y. UNIV. P.G.
FATHER 0 0 0 0 2 34 5A
MOTHER 0 0 0 0 14 27 0FATHER 0 0 2 1 16 21 1
BMOTHER 0 0 6 3 22 10 0FATHER 1 8 16 8 6 2 0
CMOTHER 1 5 19 7 7 2 0FATHER 0 15 23 3 0 0 0
DMOTHER 1 16 21 2 1 0 0
* ILLIT. = illiterate R&W = read and write 4Y. = 4 years of education8Y• = 8 years of education12Y. =12 years of educationUNIV. = university education P.G. = post-graduate education
3. Income:The household income was defined as the monthly salary
earned by the father and expressed in terms of the equivalent number of minimum wages. The minimum wage (M.W), in turn, may be described as the lowest salary a worker may receive at the end of one month's work. It is adjusted monthly to the rising cost of living by the Government and, on the first of November 1988, was equivalent to US$ 64.74 (Veja, 1988).
There are three main reasons for the use of the number
214
of minimum wages (M.W.) instead of the Brazilian currency - the 'cruzado'. Firstly, to gather comparative information on income in a study conducted in a specific year (1988) in a country where inflation rates are very high (in 1988, it was 934%/year (Veja, 1989), the use of a standardised measure is of utmost importance. Secondly, the minimum wage is the measure used in all governmental publications, such as those published by IBGE, a governmental institution dealing with all Brazilian statistical data. Thirdly, the use of the Brazilian currency would prove to be meaningless when read in different countries and even in Brasil.
Following the criteria established by IBGE (1986), the income for each household was divided into six groups: 1-2 M.W. , >2-3 M.W., >3-5 M.W., >5-10 M.W., >10-20 M.W. and >20 M.W. The families interviewed in this study were unevenly distributed in these six groups (Table AP6.4). Two of these groups comprised one-half of the families participating in the study: one-third of the households were in the group earning more than twenty minimum wages/month (>20 M.W.) while almost 20% of them were on the group earning more than three but less than five minimum wages/month (>3-5 M.W.). The other families were fairly evenly distributed in the four remaining income groups.
Income was strongly related with socio-economic status. The higher the socio-economic group, the higher the income would be (Table AP6.5). The families from socio-economic group A were, overall, the wealthiest ones. Almost nine out of ten of these families earned more than twenty minimum
215
wages/month (>20 M.W.) whilst the remaining families had an income of more than ten but less than twenty minimum wages/month (>10-20 M.W.).
In socio-economic group B, in spite of the family income being fairly high, it was significantly lower than those families from socio-economic group A. Approximately one-half of them were in the group earning more than ten but less than twenty minimum wages/month (>10-20 M.W.), and almost one-third of the families from socio-economic group B were included in the group with an income of more than twenty minimum wages/month (>20 M.W.). Twenty percent of these families were in the group earning more than five but less than ten minimum wages/month (>5-10 M.W.).
The households from socio-economic group C had an income varying from one to ten minimum wages/month.However, the income group of more than three but less than five minimum wages/month (>3-5 M.W.) comprised the largest number of families (46.3%), followed by the group with a salary of more than five but less than ten minimum wages/month (>5-10 M.W.), containing slightly over one- quarter of the families from this socio-economic group.
The majority of families from socio-economic group D lived on an income lpwer than five minimum wages/month. Two-in-five families earned up to two minimum wages/month (1-2 M.W.), while almost one-third of them lived on an income of more than three but less than five minimum wages/month (>3-5 M.W.).
216
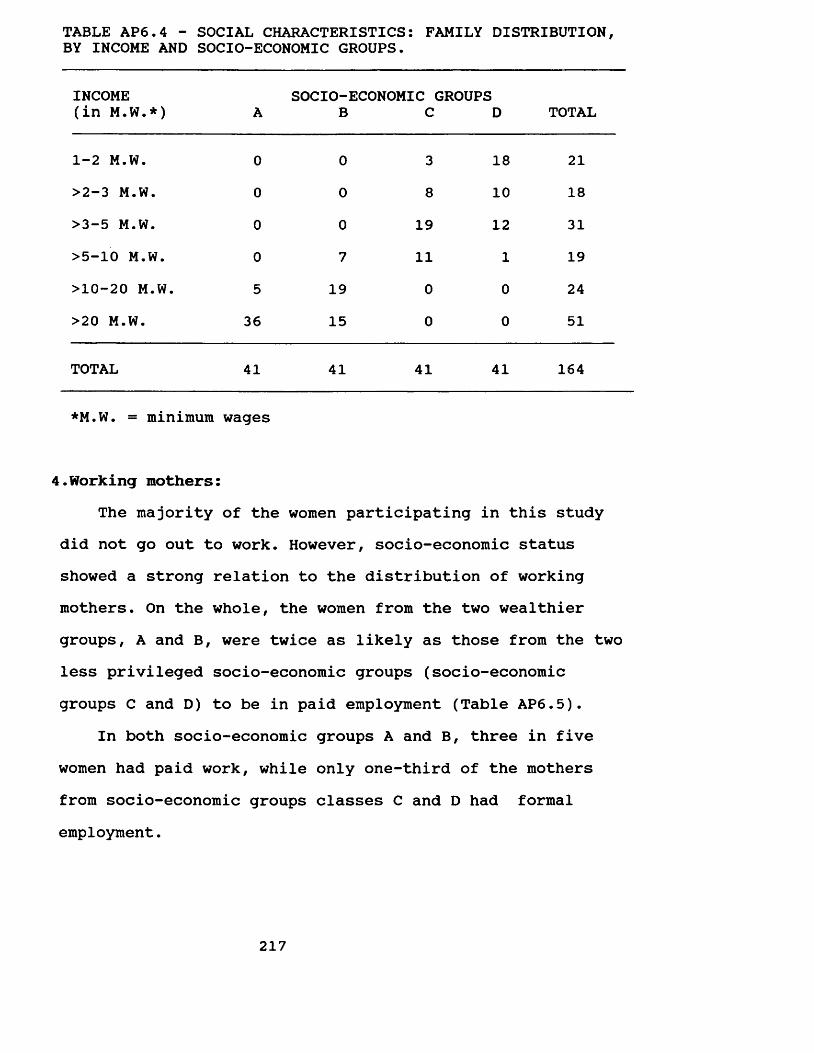
TABLE AP6.4 - SOCIAL CHARACTERISTICS: FAMILY DISTRIBUTION,BY INCOME AND SOCIO-ECONOMIC GROUPS.
INCOME (in M.W.*) A
socio-:BECONOMIC (
CGROUPS
D TOTAL
1-2 M.W. 0 0 3 18 21>2-3 M.W. 0 0 8 10 18>3-5 M.W. 0 0 19 12 31>5-10 M.W. 0 7 11 1 19>10-20 M.W. 5 19 0 0 24>20 M.W. 36 15 0 0 51
TOTAL 41 41 41 41 164
*M.W. = minimum wages
4.Working mothers:The majority of the women participating in this study
did not go out to work. However, socio-economic status showed a strong relation to the distribution of working mothers. On the whole, the women from the two wealthier groups, A and B, were twice as likely as those from the two less privileged socio-economic groups (socio-economic groups C and D) to be in paid employment (Table AP6.5).
In both socio-economic groups A and B, three in five women had paid work, while only one-third of the mothers from socio-economic groups classes C and D had formal employment.
217
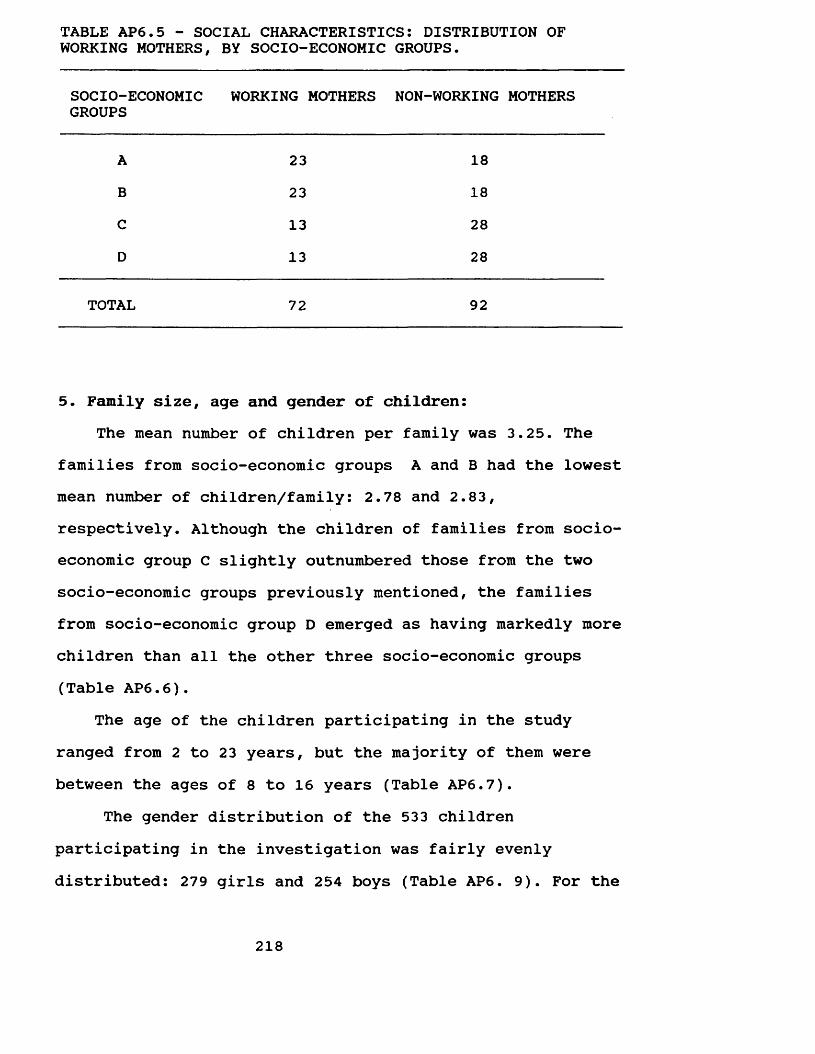
TABLE AP6.5 - SOCIAL CHARACTERISTICS: DISTRIBUTION OFWORKING MOTHERS, BY SOCIO-ECONOMIC GROUPS.
SOCIO-ECONOMICGROUPS
WORKING MOTHERS NON-WORKING MOTHERS
A 23 18B 23 18C 13 28D 13 28
TOTAL 72 92
5. Family size, age and gender of children:The mean number of children per family was 3.25. The
families from socio-economic groups A and B had the lowest mean number of children/family: 2.78 and 2.83, respectively. Although the children of families from socioeconomic group C slightly outnumbered those from the two socio-economic groups previously mentioned, the families from socio-economic group D emerged as having markedly more children than all the other three socio-economic groups (Table AP6.6).
The age of the children participating in the study ranged from 2 to 23 years, but the majority of them were between the ages of 8 to 16 years (Table AP6.7).
The gender distribution of the 533 children participating in the investigation was fairly evenly distributed: 279 girls and 254 boys (Table AP6. 9). For the
218

index child (the 13 year-old child), however, proportionately more girls were randomly selected than boys. And, when only the siblings were taken into account, the number of girls and boys was virtually equivalent.
TABLE AP6.6 - SOCIAL CHARACTERISTICS: NUMBER OF CHILDREN PER FAMILY, BY SOCIO-ECONOMIC GROUPS.SOCIO-ECONOMICGROUPS
TOTAL No.CHILDREN MEAN NO.CHILDREN
A 114 2.78B 116 2.83C 137 3.34D 166 4.05
TOTAL 533 3.25
219
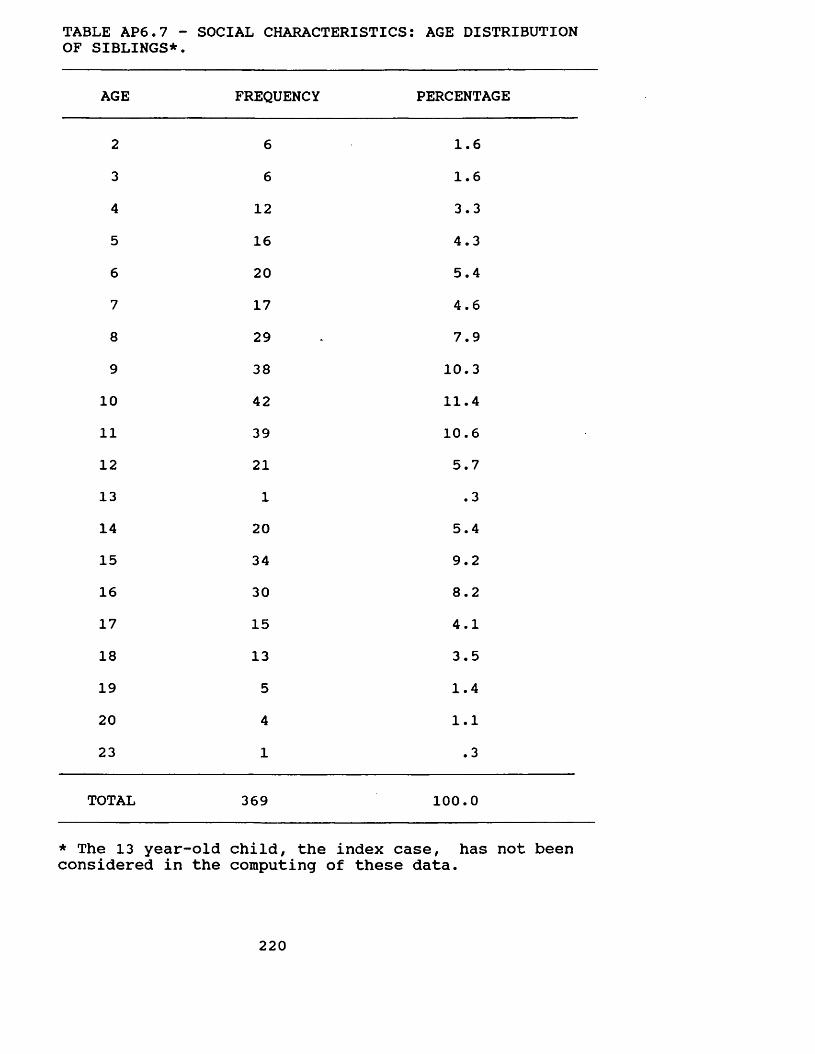
TABLE AP6.7 - SOCIAL CHARACTERISTICS: AGE DISTRIBUTION OF SIBLINGS*.
AGE FREQUENCY PERCENTAGE
2 6 1.63 6 1.64 12 3.35 16 4.36 20 5.47 17 4.68 29 7.99 38 10.3
10 42 11.411 39 10.612 21 5.713 1 .314 20 5.415 34 9.216 30 8.217 15 4.118 13 3.519 5 1.420 4 1.123 1 .3
TOTAL 369 100.0
* The 13 year-old child, the index case, has not been considered in the computing of these data.
220
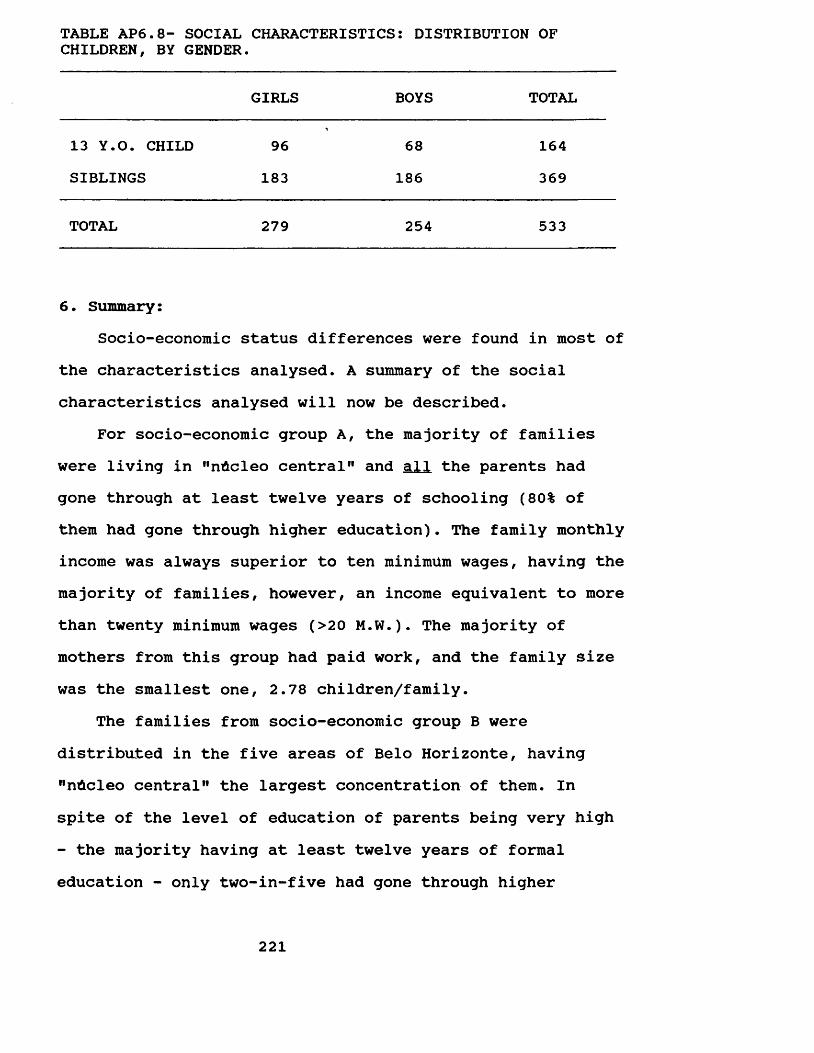
TABLE AP6.8- SOCIAL CHARACTERISTICS: DISTRIBUTION OFCHILDREN, BY GENDER.
GIRLS BOYS TOTAL
13 Y.O. CHILD SIBLINGS
96183
68186
164369
TOTAL 279 254 533
6. Summary:Socio-economic status differences were found in most of
the characteristics analysed. A summary of the social characteristics analysed will now be described.
For socio-economic group A, the majority of families were living in "nUcleo central" and all the parents had gone through at least twelve years of schooling (80% of them had gone through higher education). The family monthly income was always superior to ten minimum wages, having the majority of families, however, an income equivalent to more than twenty minimum wages (>20 M.W.). The majority of mothers from this group had paid work, and the family size was the smallest one, 2.78 children/family.
The families from socio-economic group B were distributed in the five areas of Belo Horizonte, having "nUcleo central" the largest concentration of them. In spite of the level of education of parents being very high - the majority having at least twelve years of formal education - only two-in-five had gone through higher
221
education. The income levels for this group were quite high since all the families lived on a month income superior to five minimum wages, the majority of them being concentrated in the income group of more than ten but less than twenty minimum wages (>10-20 M.W.). Most of the mothers had formal employment, and the mean number of children per family was 2.83.
In socio-economic group C, the greatest number of families was concentrated in "pampulha" and "eixo industrial". The educational level of parents was scattered in all groups; nevertheless, the predominant pattern was four years of schooling. The family income varied from one to ten minimum wages/month, but the majority of families lived on an income of more than three but less than five minimum wages (>3-5 M.W.). Few mothers from this socioeconomic group were in gainful employment, and the mean number of children per family was 3.34.
In socio-economic group D, the majority of families were living in "pampulha" and "eixo industrial", the latter concentrating the largest number of them. The parental level of education was very low since most of the parents had attended four years of schooling at most. The income level was also very low, varying from one to ten minimum wages/month, but the greatest concentration of families in the group earned more than one but less than two minimum wages (1-2 M.W.). Few mothers from this socio-economic group had paid work, and family size was the largest, 4.05 children/family.
222
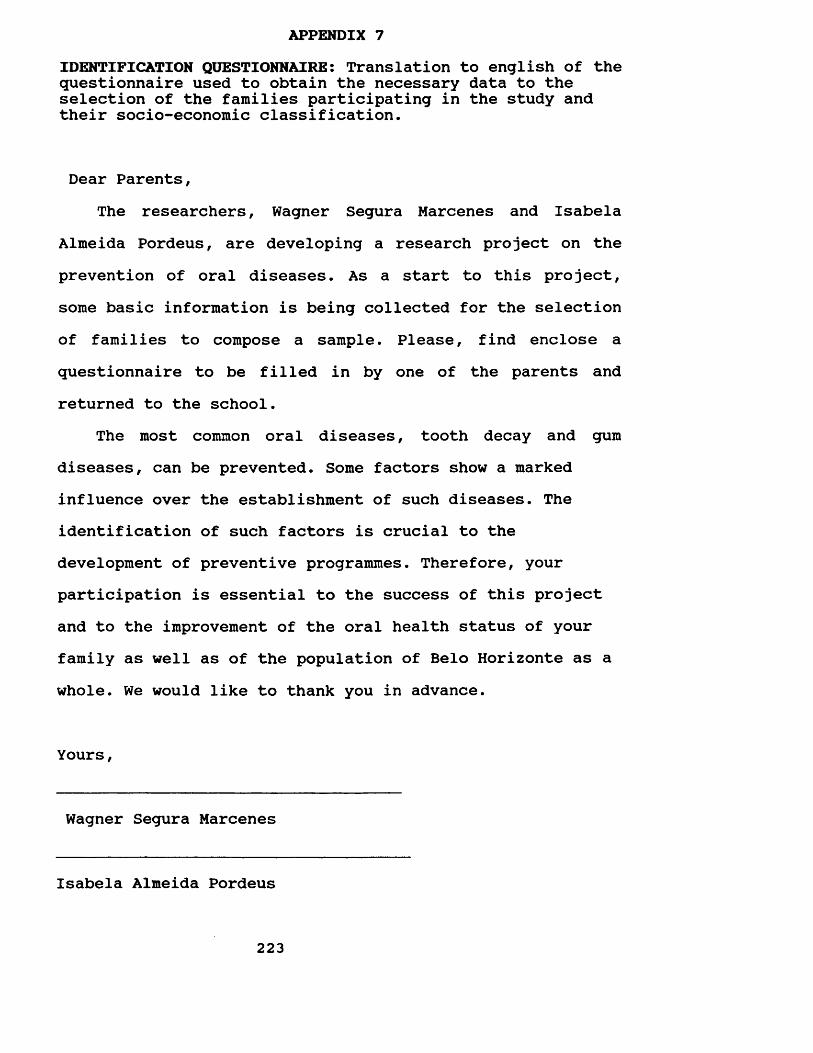
APPENDIX 7IDENTIFICATION QUESTIONNAIRE: Translation to english of the questionnaire used to obtain the necessary data to the selection of the families participating in the study and their socio-economic classification.
Dear Parents,The researchers, Wagner Segura Marcenes and Isabela
Almeida Pordeus, are developing a research project on the prevention of oral diseases. As a start to this project, some basic information is being collected for the selection of families to compose a sample. Please, find enclose a questionnaire to be filled in by one of the parents and returned to the school.
The most common oral diseases, tooth decay and gum diseases, can be prevented. Some factors show a marked influence over the establishment of such diseases. The identification of such factors is crucial to the development of preventive programmes. Therefore, your participation is essential to the success of this project and to the improvement of the oral health status of your family as well as of the population of Belo Horizonte as a whole. We would like to thank you in advance.
Yours,
Wagner Segura Marcenes
Isabela Almeida Pordeus
223
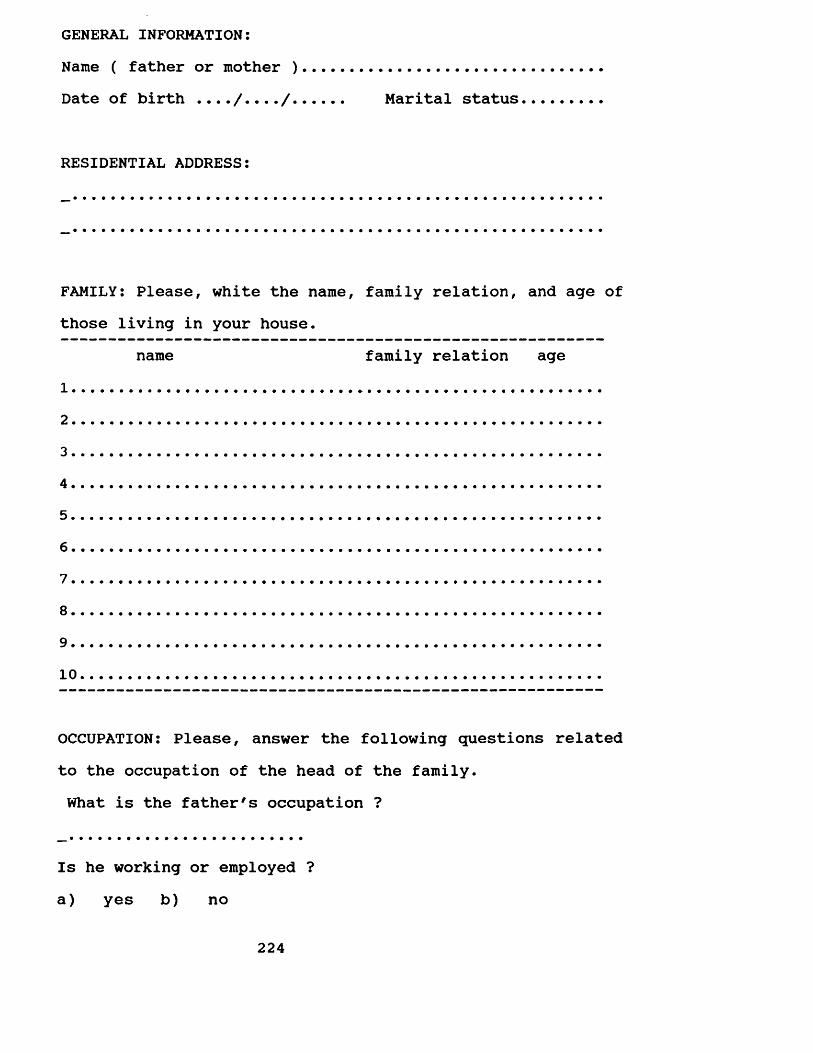
GENERAL INFORMATION:Name ( father or mother )......................Date of birth Marital status
RESIDENTIAL ADDRESS:
FAMILY: Please, white the name, family relation, and agethose living in your house.
name family relation age
7..............................
OCCUPATION: Please, answer the following questions related to the occupation of the head of the family.What is the father's occupation ?
Is he working or employed ?a) yes b) no
224
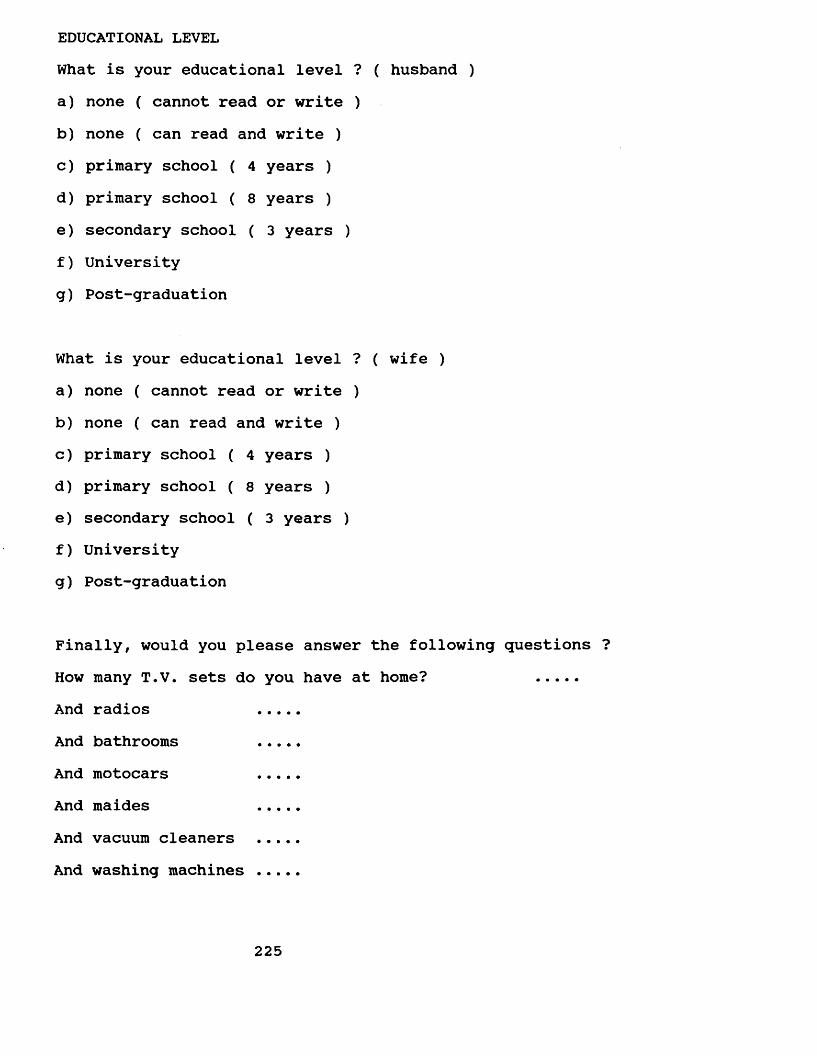
EDUCATIONAL LEVELWhat is your educational level ? ( husband )a) none ( cannot read or write )b) none ( can read and write )c) primary school ( 4 years )d) primary school ( 8 years )e) secondary school ( 3 years )f) Universityg) Post-graduation
What is your educational level ? ( wife )a) none ( cannot read or write )b) none ( can read and write )c) primary school ( 4 years )d) primary school ( 8 years )e) secondary school ( 3 years )f) Universityg) Post-graduation
Finally, would you please answer the following questions ?How many T.V. sets do you have at home? ....And radios ....And bathrooms ....And motocars ....And maides ....And vacuum cleaners ....And washing machines ....
225
SENHORES PAIS
Os Professores da Faculdade de Odontologia, Wagner Segura Marcenes e Isabela Almeida Pordeus, estko elaborando um projeto de pesquisa sobre prevenc&o das doencas da boca, cuja aplicac&o trarA grandes beneflcios A saOde bucal da populactto de Belo Horizonte. Como inicio deste trabalho, serSo colhidas algumas informacbes b&sicas para a selegfco de 500 fami lias, que representem a popularSo como um todo. Estamos lhes enviando um questionArio, pedindo que seje respondido por um dos pais e devolvido A escola de seu/sua filho/filha o mais breve possivel.
As doencas bucais mais comuns, cArie dentAria e doenqa periodontal ( gengiva ) podem ser evitadas. Alguns fatores exercem grande infludncia sobre o aparecimento destas doencas e, sua identificac&o A extremamente importante para elaboracSo de programas preventivos. Portanto, sua colaborac^o serA fundamental para o dxito desta pesquisa e melhoria das condicbes de saOde bucal de sua familia, assim como de toda a populacko de Belo Horizonte.
Desde jA, agradecemos sua colaboracdo.
f r - * t____Wagner Segura Marcenes Professor da Fac. Odontologia UFMG
JsJoML /^YMjida nmuii-__________Isabela Almeida Pordeus
Professora da Fac. de Odontologia UFMG
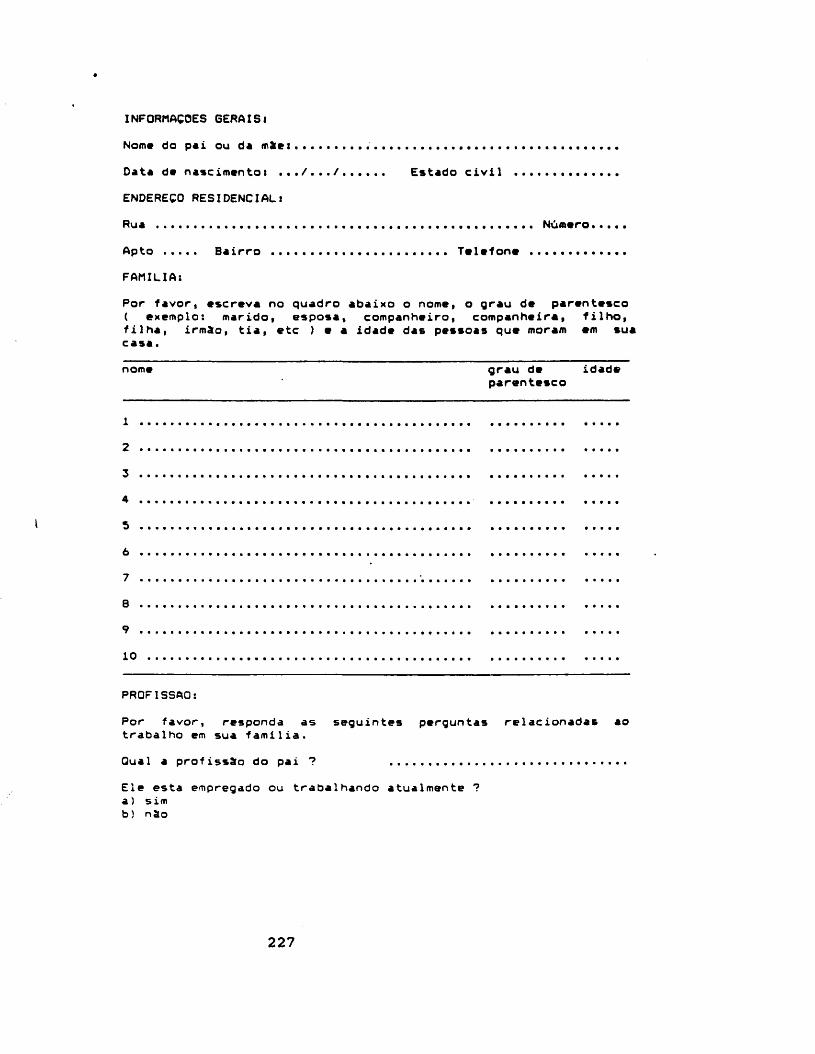
INFORMACOES GERAIS INome do pai ou de mkei . ................ ....... ........ .Oat* de nascimentot .../.../..... Estado civil..............ENDERECO RESIDENCIALiRua .............................................. Numero....Apto .... Bairro Telefone ............FAMILIA:Por favor, escreva no quadro abaixo o nome, o grau de parentesco ( exemplo: marido, esposa, companheiro, companheira, filho,filha, irmato, tia, etc ) e a idade das pessoas que moram em sua casa.nome grau de idade
parentesco
123 ,
4 ,
567
89
10
PROF 1SSAO:Por favor, responda as seguintes perguntas relacionadas ao trabalho em sua familia.Qual a profissSo do pai ?Ele esta empregado ou trabalhando atualmente ?a) simb ) nSo
227
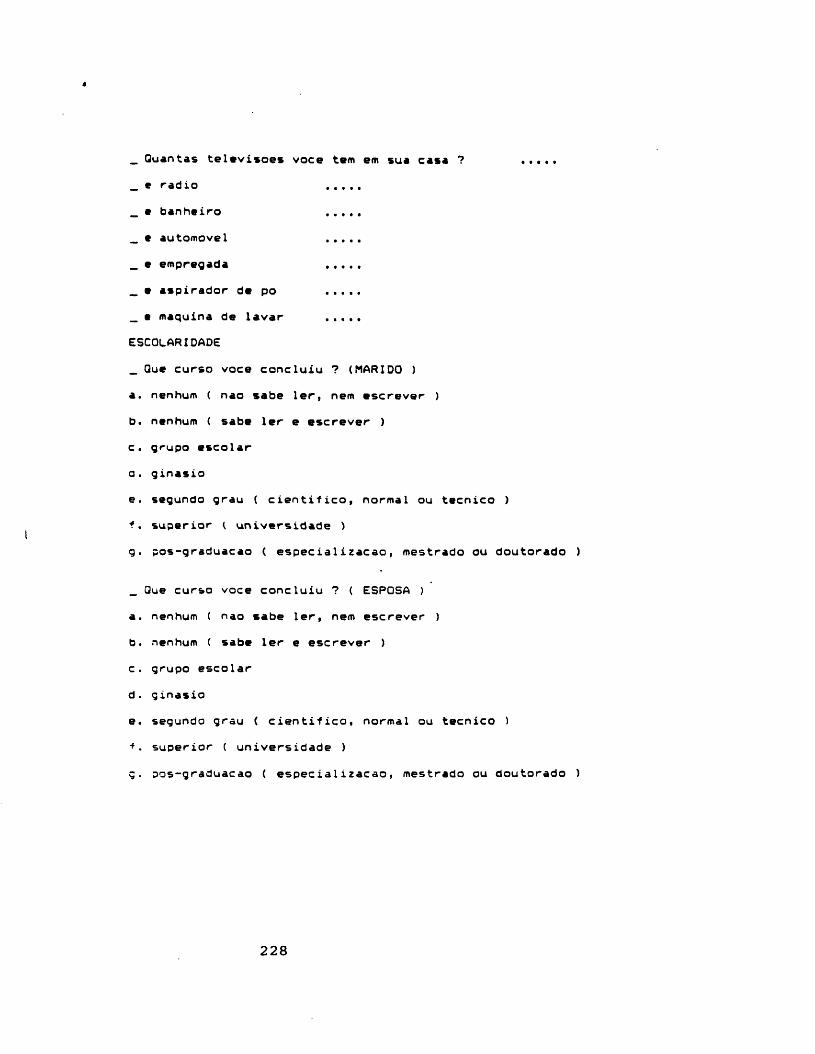
_ Quantas televisoes voce tem em sua casa ? ....._ e radio ...._ e banheiro ...._ e automovel ...._ e empregada ....__ e aspirador de po ...._e maquina de lavar .....ESCOLARIDADE_ Que curso voce concluiu ? (MARIDO )
a. nenhum ( nao sabe ler, nem escrever )b. nenhum ( sabe ler e escrever )c. grupo escolar a. ginasioe. segundo grau ( cientifico, normal ou tecnico )f. superior ( universidade )g. pos-graduacao ( especia1izacao, mestrado ou doutorado )
_ Que curso voce concluiu ? ( ESPOSA )a. nenhum ( nao sabe ler, nem escrever )b. nenhum ( sabe ler e escrever )c. grupo escolard. ginasioe. segundo grau ( cientifico, normal ou tecnico )+. superior ( universidade )g. oos-graduacao ( especia1izacao, mestrado ou doutorado )
228
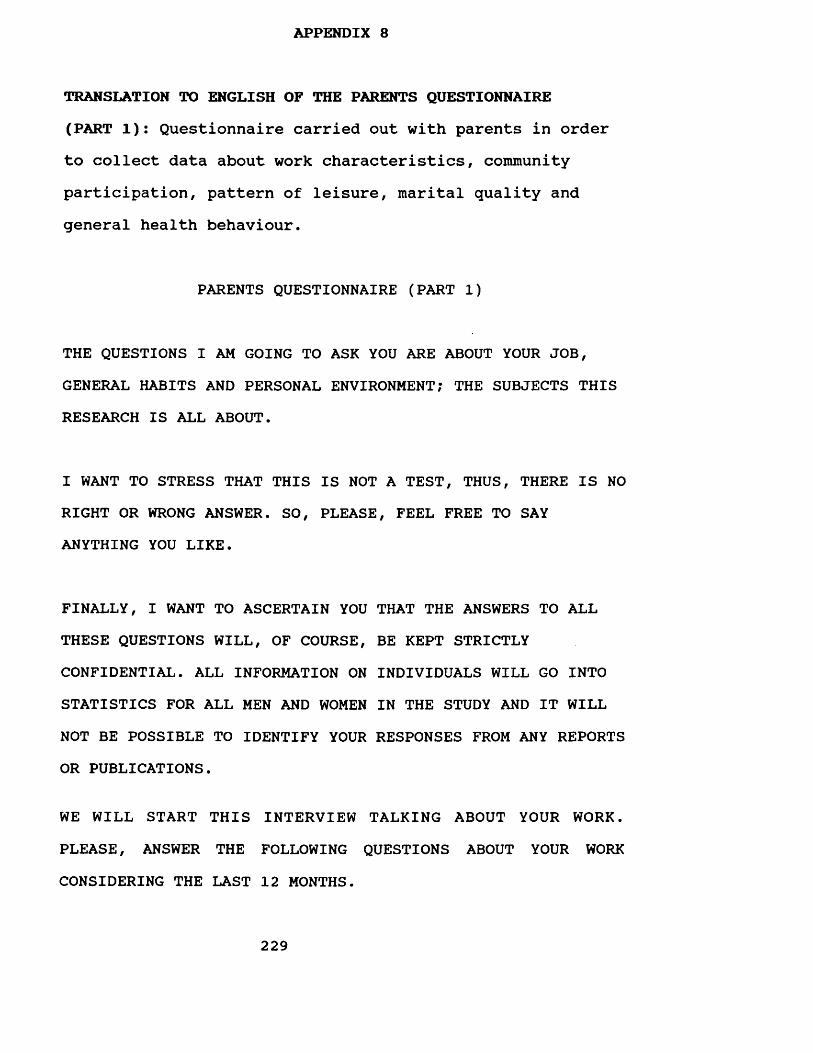
APPENDIX 8
TRANSLATION TO ENGLISH OF THE PARENTS QUESTIONNAIRE (PART 1): Questionnaire carried out with parents in order to collect data about work characteristics, community participation, pattern of leisure, marital quality and general health behaviour.
PARENTS QUESTIONNAIRE (PART 1)
THE QUESTIONS I AM GOING TO ASK YOU ARE ABOUT YOUR JOB, GENERAL HABITS AND PERSONAL ENVIRONMENT? THE SUBJECTS THIS RESEARCH IS ALL ABOUT.
I WANT TO STRESS THAT THIS IS NOT A TEST, THUS, THERE IS NO RIGHT OR WRONG ANSWER. SO, PLEASE, FEEL FREE TO SAY ANYTHING YOU LIKE.
FINALLY, I WANT TO ASCERTAIN YOU THAT THE ANSWERS TO ALL THESE QUESTIONS WILL, OF COURSE, BE KEPT STRICTLY CONFIDENTIAL. ALL INFORMATION ON INDIVIDUALS WILL GO INTO STATISTICS FOR ALL MEN AND WOMEN IN THE STUDY AND IT WILL NOT BE POSSIBLE TO IDENTIFY YOUR RESPONSES FROM ANY REPORTS OR PUBLICATIONS.
WE WILL START THIS INTERVIEW TALKING ABOUT YOUR WORK. PLEASE, ANSWER THE FOLLOWING QUESTIONS ABOUT YOUR WORK CONSIDERING THE LAST 12 MONTHS.
229
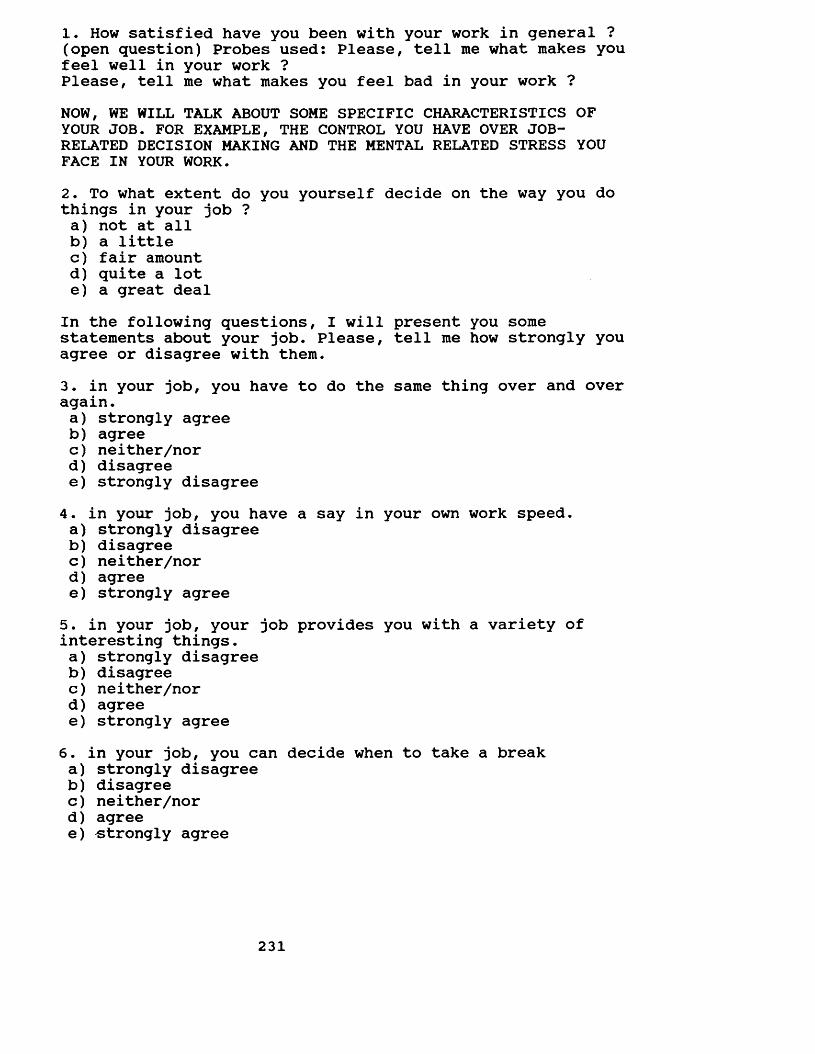
1. How satisfied have you been with your work in general ? (open question) Probes used: Please, tell me what makes you feel well in your work ?Please, tell me what makes you feel bad in your work ?NOW, WE WILL TALK ABOUT SOME SPECIFIC CHARACTERISTICS OF YOUR JOB. FOR EXAMPLE, THE CONTROL YOU HAVE OVER JOB- RELATED DECISION MAKING AND THE MENTAL RELATED STRESS YOU FACE IN YOUR WORK.2. To what extent do you yourself decide on the way you do things in your job ?a) not at allb) a littlec) fair amountd) quite a lote) a great deal
In the following questions, I will present you some statements about your job. Please, tell me how strongly you agree or disagree with them.3. in your job, you have to do the same thing over and over again.a) strongly agreeb) agreec) neither/nord) disagreee) strongly disagree4. in your job, you have a say in your own work speed.a) strongly disagreeb) disagreec) neither/nord) agreee) strongly agree5. in your job, your job provides you with a variety of interesting things.a) strongly disagreeb) disagreec) neither/nord) agreee) strongly agree
6. in your job, you can decide when to take a breaka) strongly disagreeb) disagreec) neither/nord) agreee) strongly agree
231
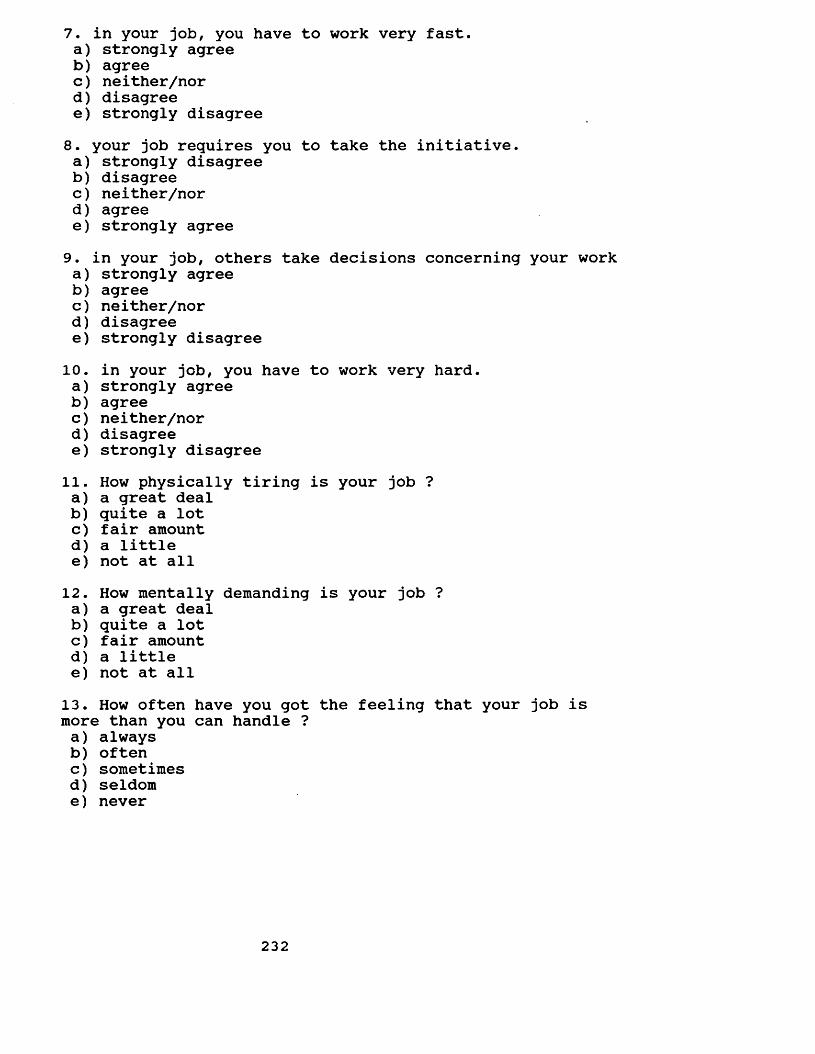
7. in your job, you have to work very fast.a) strongly agreeb) agreec) neither/nord) disagreee) strongly disagree8. your job requires you to take the initiative.a) strongly disagreeb) disagreec) neither/nord) agreee) strongly agree9. in your job, others take decisions concerning your worka) strongly agreeb) agreec) neither/nord) disagreee) strongly disagree
10. in your job, you have to work very hard.a) strongly agreeb) agreec) neither/nord) disagreee) strongly disagree
11. How physically tiring is your job ?a) a great dealb) quite a lotc) fair amountd) a littlee) not at all12. How mentally demanding is your job ?a) a great dealb) quite a lotc) fair amountd) a littlee) not at all13. How often have you got the feeling that your job is more than you can handle ?a) alwaysb) oftenc) sometimesd) seldome) never
232
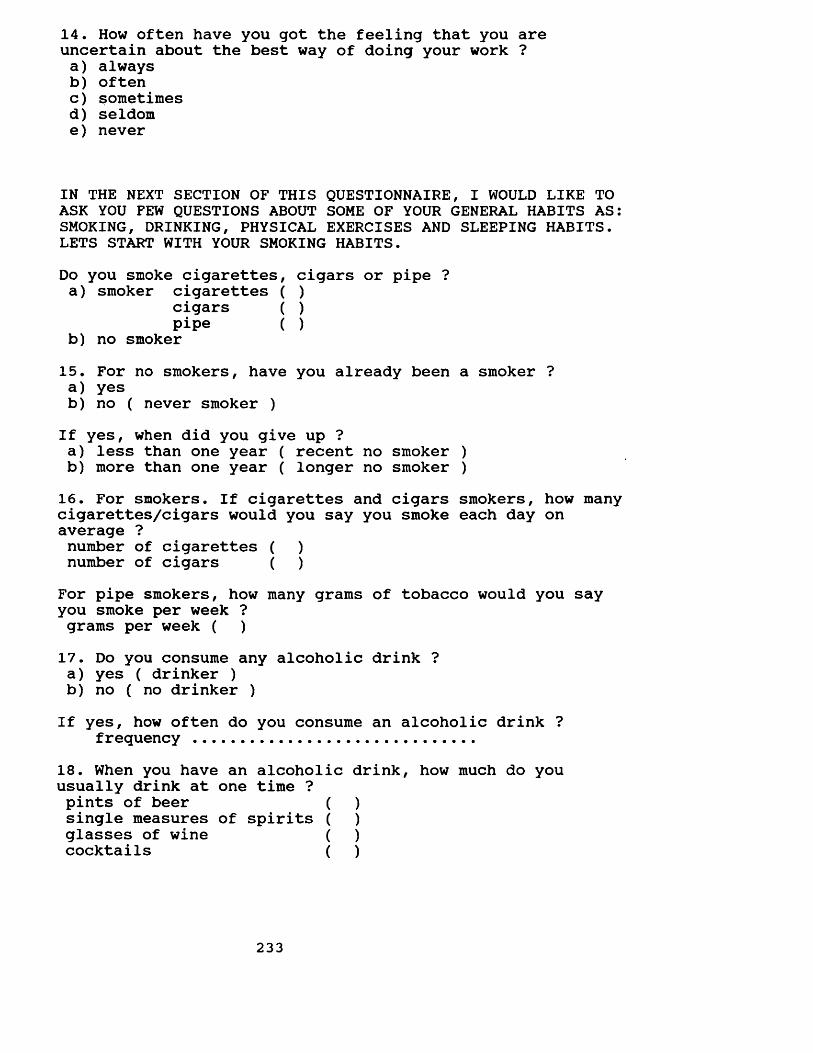
14. How often have you got the feeling that you are uncertain about the best way of doing your work ?a) alwaysb) oftenc) sometimesd) seldome) never
IN THE NEXT SECTION OF THIS QUESTIONNAIRE, I WOULD LIKE TO ASK YOU FEW QUESTIONS ABOUT SOME OF YOUR GENERAL HABITS AS: SMOKING, DRINKING, PHYSICAL EXERCISES AND SLEEPING HABITS. LETS START WITH YOUR SMOKING HABITS.Do you smoke cigarettes, cigars or pipe ?a) smoker cigarettes ( )
cigars ( )pipe ( )
b) no smoker15. For no smokers, have you already been a smoker ?a) yesb) no ( never smoker )If yes, when did you give up ?a) less than one year ( recent no smoker )b) more than one year ( longer no smoker )16. For smokers. If cigarettes and cigars smokers, how many cigarettes/cigars would you say you smoke each day on average ?number of cigarettes ( )number of cigars ( )For pipe smokers, how many grams of tobacco would you say you smoke per week ? grams per week ( )17. Do you consume any alcoholic drink ?a) yes ( drinker )b) no ( no drinker )If yes, how often do you consume an alcoholic drink ?
frequency .............................18. When you have an alcoholic drink, how much do you usually drink at one time ?pints of beer ( )single measures of spirits ( )glasses of wine ( )cocktails ( )
233
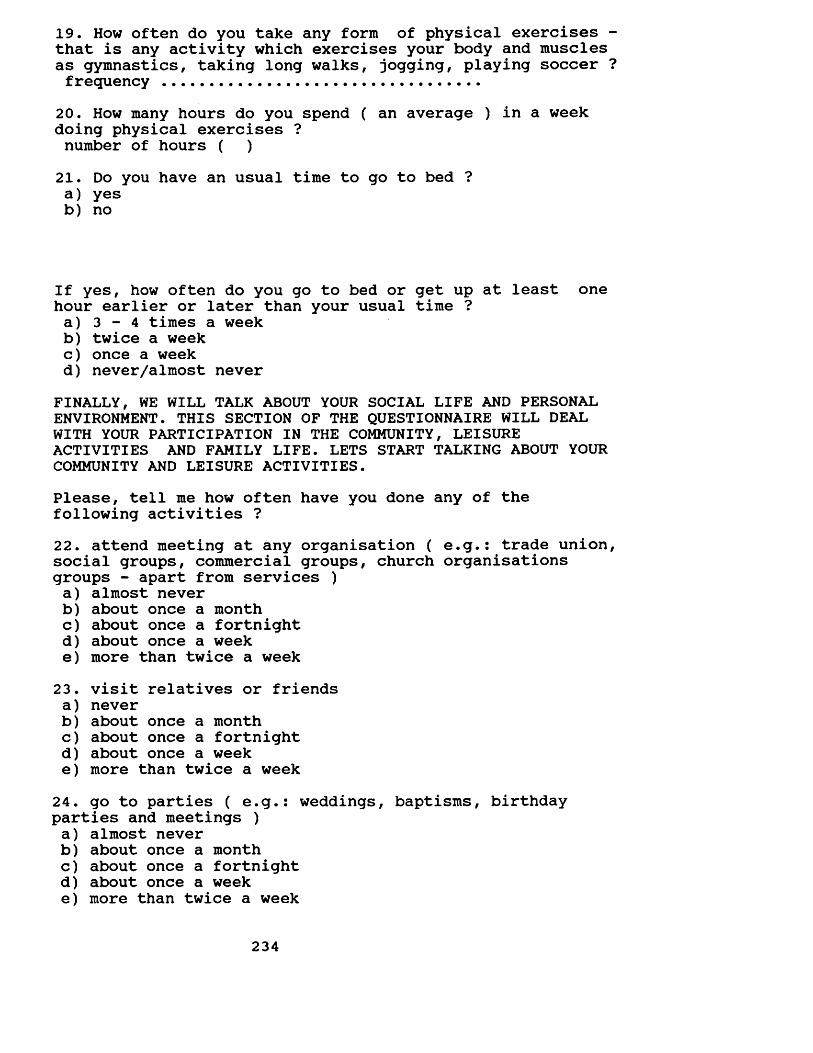
19. How often do you take any form of physical exercises - that is any activity which exercises your body and muscles as gymnastics, taking long walks, jogging, playing soccer ?frequency .................................
20. How many hours do you spend ( an average ) in a week doing physical exercises ?number of hours ( )21. Do you have an usual time to go to bed ?a) yesb) no
If yes, how often do you go to bed or get up at least one hour earlier or later than your usual time ?a) 3 - 4 times a weekb) twice a weekc) once a weekd) never/almost never
FINALLY, WE WILL TALK ABOUT YOUR SOCIAL LIFE AND PERSONAL ENVIRONMENT. THIS SECTION OF THE QUESTIONNAIRE WILL DEAL WITH YOUR PARTICIPATION IN THE COMMUNITY, LEISURE ACTIVITIES AND FAMILY LIFE. LETS START TALKING ABOUT YOUR COMMUNITY AND LEISURE ACTIVITIES.Please, tell me how often have you done any of the following activities ?22. attend meeting at any organisation ( e.g.: trade union, social groups, commercial groups, church organisations groups - apart from services )a) almost neverb) about once a monthc) about once a fortnightd) about once a weeke) more than twice a week23. visit relatives or friendsa) neverb) about once a monthc) about once a fortnightd) about once a weeke) more than twice a week24. go to parties ( e.g.: weddings, baptisms, birthday parties and meetings )a) almost neverb) about once a monthc) about once a fortnightd) about once a weeke) more than twice a week
234
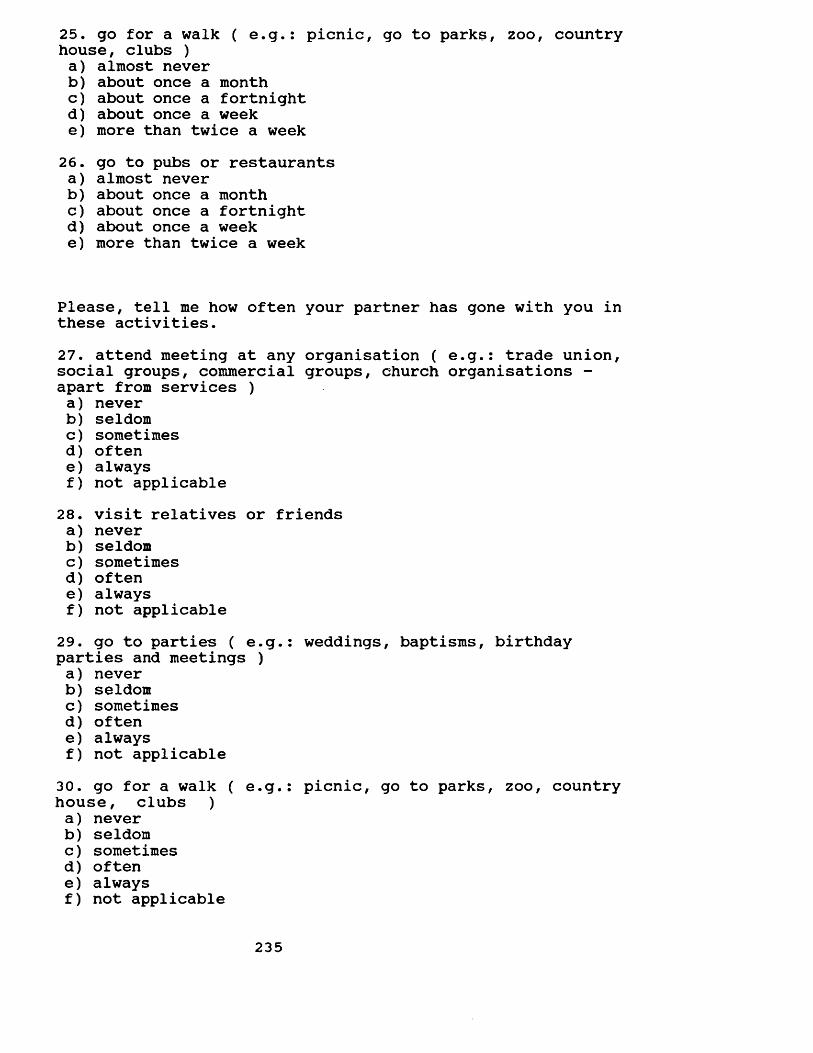
25. go for a walk ( e.g.: picnic, go to parks, zoo, country house, clubs )a) almost neverb) about once a monthc) about once a fortnightd) about once a weeke) more than twice a week26. go to pubs or restaurantsa) almost neverb) about once a monthc) about once a fortnightd) about once a weeke) more than twice a week
Please, tell me how often your partner has gone with you in these activities.27. attend meeting at any organisation ( e.g.: trade union, social groups, commercial groups, church organisations - apart from services )a) neverb) seldomc) sometimesd) oftene) alwaysf) not applicable
28. visit relatives or friendsa) neverb) seldomc) sometimesd) oftene) alwaysf) not applicable29. go to parties ( e.g.: weddings, baptisms, birthday parties and meetings )a) neverb) seldomc) sometimesd) oftene) alwaysf) not applicable30. go for a walk ( e.g.: picnic, go to parks, zoo, country house, clubs )a) neverb) seldomc) sometimesd) oftene) alwaysf) not applicable
235
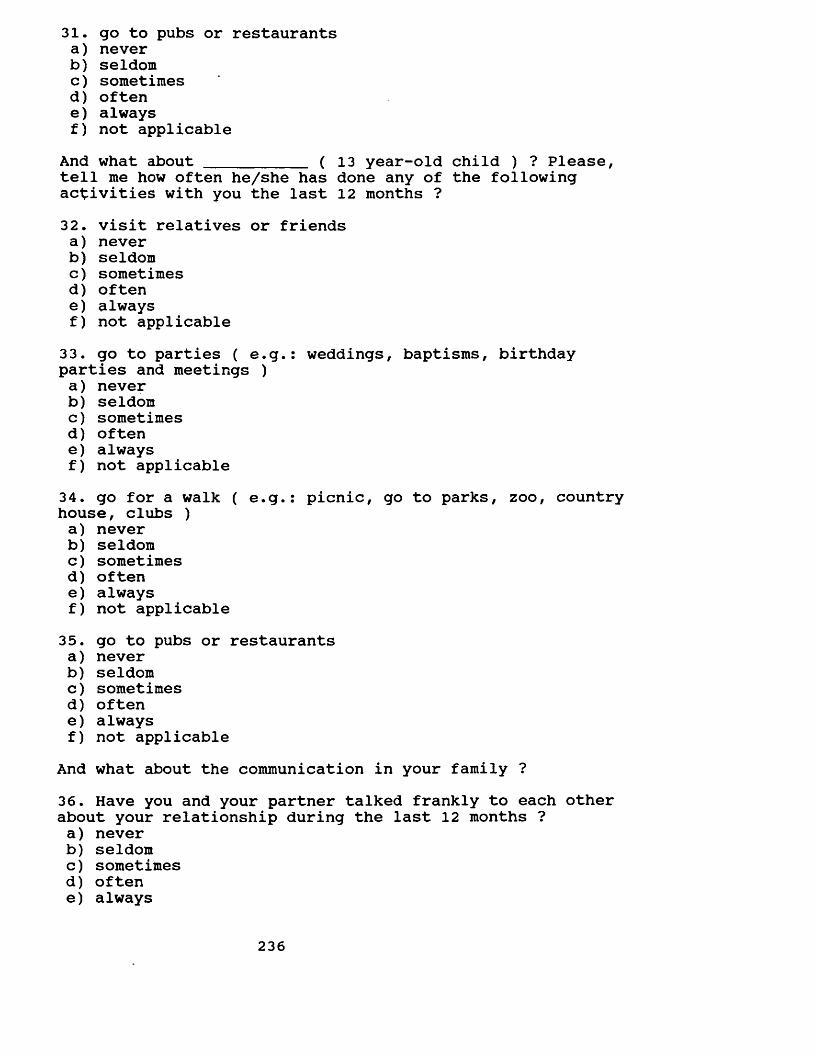
31. go to pubs or restaurantsa) neverb) seldomc) sometimesd) oftene) alwaysf) not applicable
And what about __________ ( 13 year-old child ) ? Please,tell me how often he/she has done any of the following activities with you the last 12 months ?32. visit relatives or friendsa) neverb) seldomc) sometimesd) oftene) alwaysf) not applicable
33. go to parties ( e.g.: weddings, baptisms, birthday parties and meetings )a) neverb) seldomc) sometimesd) oftene) alwaysf) not applicable34. go for a walk ( e.g.: picnic, go to parks, zoo, country house, clubs )a) neverb) seldomc) sometimesd) oftene) alwaysf) not applicable35. go to pubs or restaurantsa) neverb) seldomc) sometimesd) oftene) alwaysf) not applicable
And what about the communication in your family ?36. Have you and your partner talked frankly to each other about your relationship during the last 12 months ?a) neverb) seldomc) sometimesd) oftene) always
236
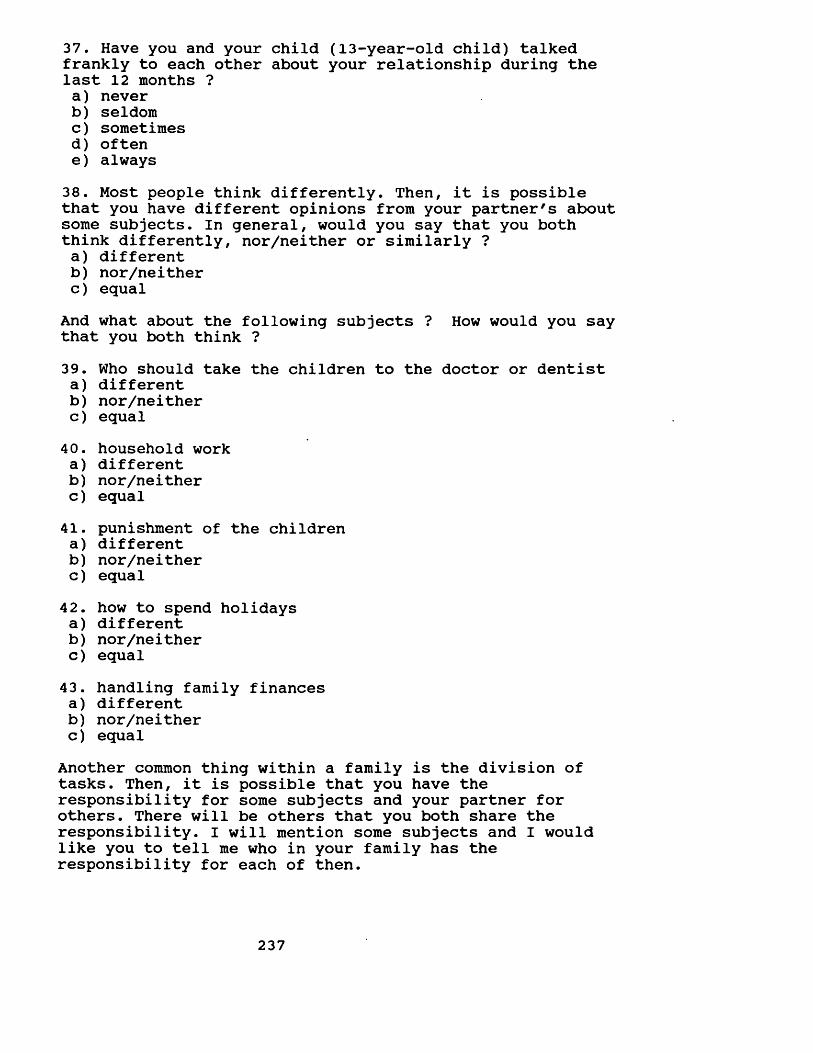
37. Have you and your child (13-year-old child) talked frankly to each other about your relationship during the last 12 months ?a) neverb) seldomc) sometimesd) oftene) always38. Most people think differently. Then, it is possible that you have different opinions from your partner's about some subjects. In general, would you say that you both think differently, nor/neither or similarly ?a) differentb) nor/neitherc) equal
And what about the following subjects ? How would you say that you both think ?39. Who should take the children to the doctor or dentista) differentb) nor/neitherc) equal40. household worka) differentb) nor/neitherc) equal41. punishment of the childrena) differentb) nor/neitherc) equal42. how to spend holidaysa) differentb) nor/neitherc) equal43. handling family financesa) differentb) nor/neitherc) equal
Another common thing within a family is the division of tasks. Then, it is possible that you have the responsibility for some subjects and your partner for others. There will be others that you both share the responsibility. I will mention some subjects and I would like you to tell me who in your family has the responsibility for each of then.
237
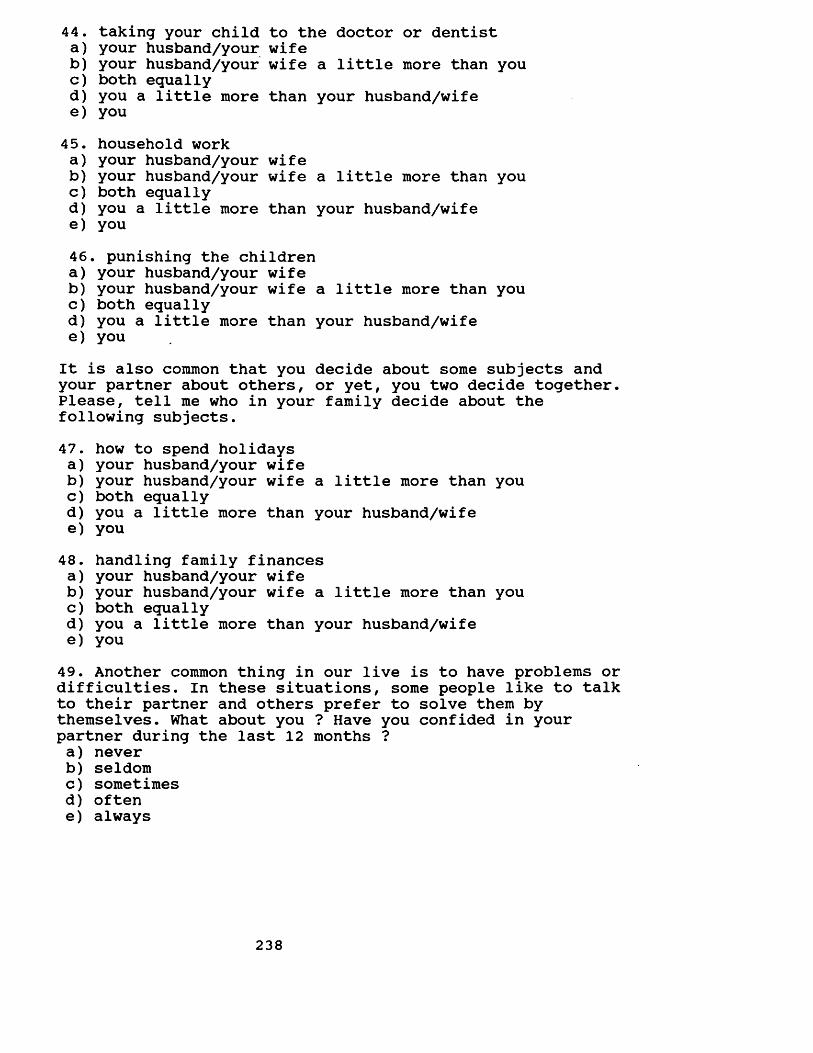
44. taking your child to the doctor or dentista) your husband/your wifeb) your husband/your wife a little more than youc) both equallyd) you a little more than your husband/wifee) you45. household worka) your husband/your wifeb) your husband/your wife a little more than youc) both equallyd) you a little more than your husband/wifee) you46. punishing the childrena) your husband/your wifeb) your husband/your wife a little more than youc) both equallyd) you a little more than your husband/wifee) youIt is also common that you decide about some subjects and your partner about others, or yet, you two decide together. Please, tell me who in your family decide about the following subjects.47. how to spend holidaysa) your husband/your wifeb) your husband/your wife a little more than youc) both equallyd) you a little more than your husband/wifee) you48. handling family financesa) your husband/your wifeb) your husband/your wife a little more than youc) both equallyd) you a little more than your husband/wifee) you49. Another common thing in our live is to have problems or difficulties. In these situations, some people like to talk to their partner and others prefer to solve them by themselves. What about you ? Have you confided in your partner during the last 12 months ?a) neverb) seldomc) sometimesd) oftene) always
238
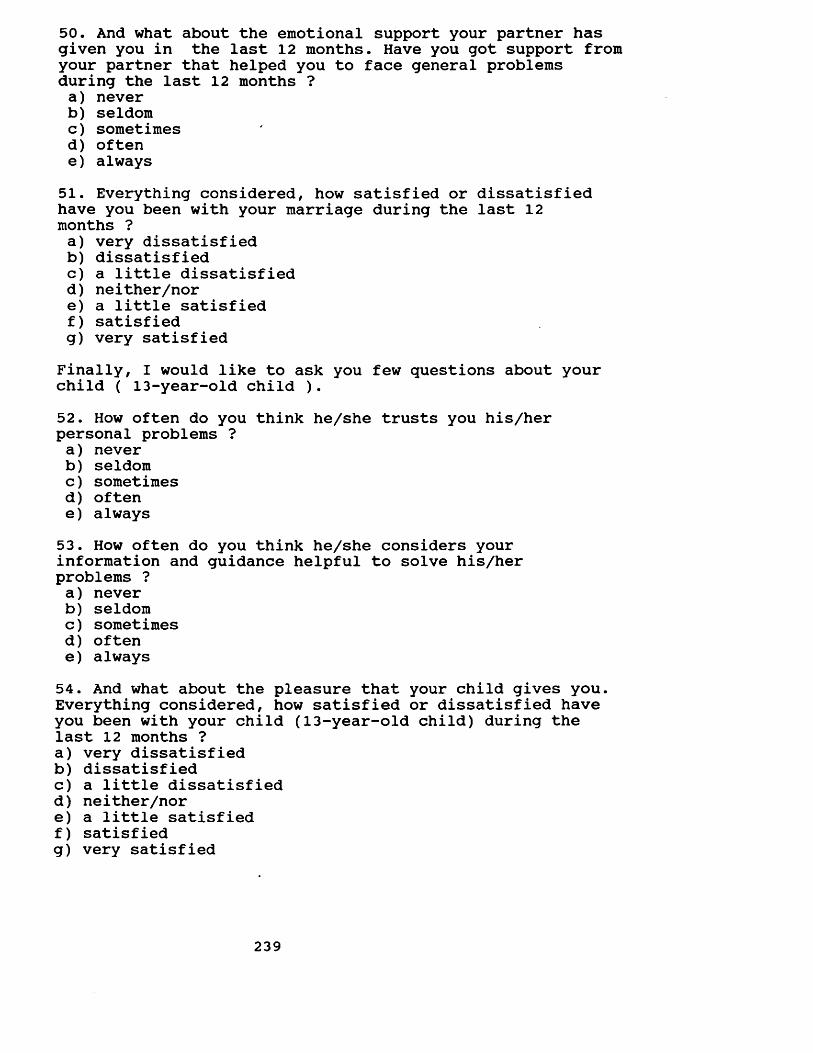
50. And what about the emotional support your partner has given you in the last 12 months. Have you got support from your partner that helped you to face general problems during the last 12 months ?a) neverb) seldomc) sometimesd) oftene) always
51. Everything considered, how satisfied or dissatisfied have you been with your marriage during the last 12 months ?a) very dissatisfiedb) dissatisfiedc) a little dissatisfiedd) neither/nore) a little satisfiedf) satisfiedg) very satisfiedFinally, I would like to ask you few questions about your child ( 13-year-old child ).52. How often do you think he/she trusts you his/her personal problems ?a) neverb) seldomc) sometimesd) oftene) always53. How often do you think he/she considers your information and guidance helpful to solve his/her problems ?a) neverb) seldomc) sometimesd) oftene) always54. And what about the pleasure that your child gives you. Everything considered, how satisfied or dissatisfied have you been with your child (13-year-old child) during the last 12 months ?a) very dissatisfiedb) dissatisfiedc) a little dissatisfiedd) neither/nore) a little satisfiedf) satisfiedg) very satisfied
239
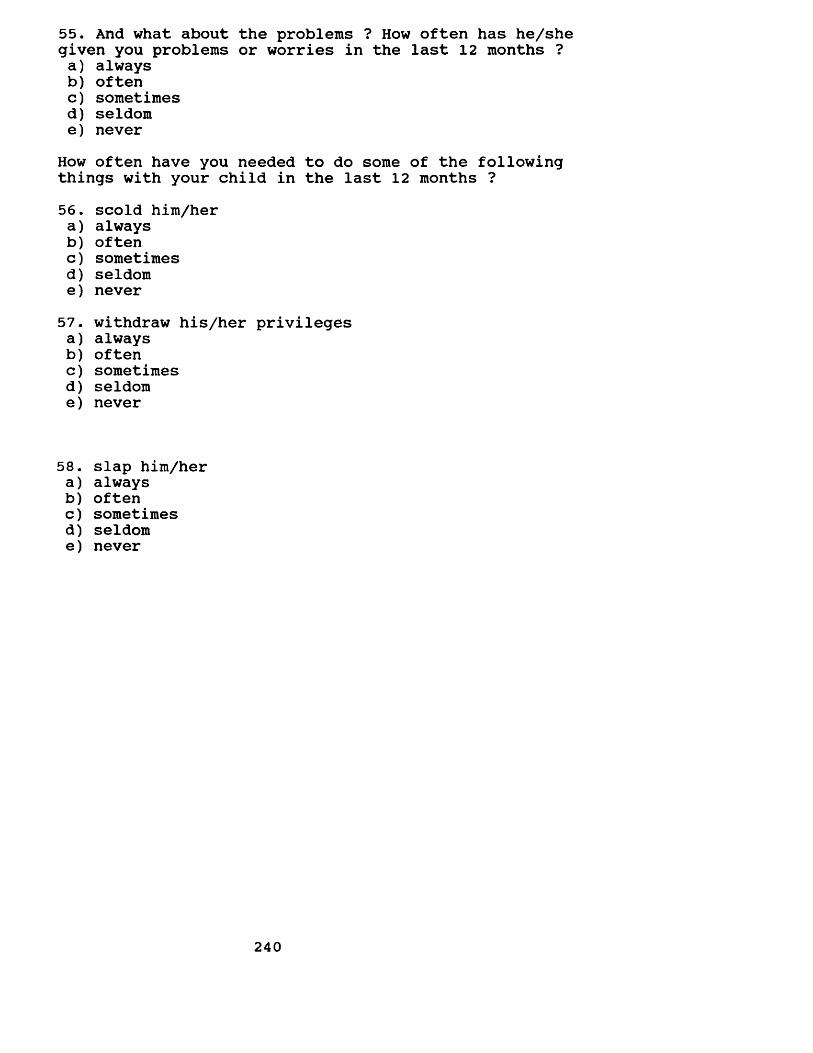
55. And what about the problems ? How often has he/she given you problems or worries in the last 12 months ?a) alwaysb) oftenc) sometimesd) seldome) never
How often have you needed to do some of the following things with your child in the last 12 months ?56. scold him/hera) alwaysb) oftenc) sometimesd) seldome) never57. withdraw his/her privilegesa) alwaysb) oftenc) sometimesd) seldome) never
58. slap him/hera) alwaysb) oftenc) sometimesd) seldome) never
240
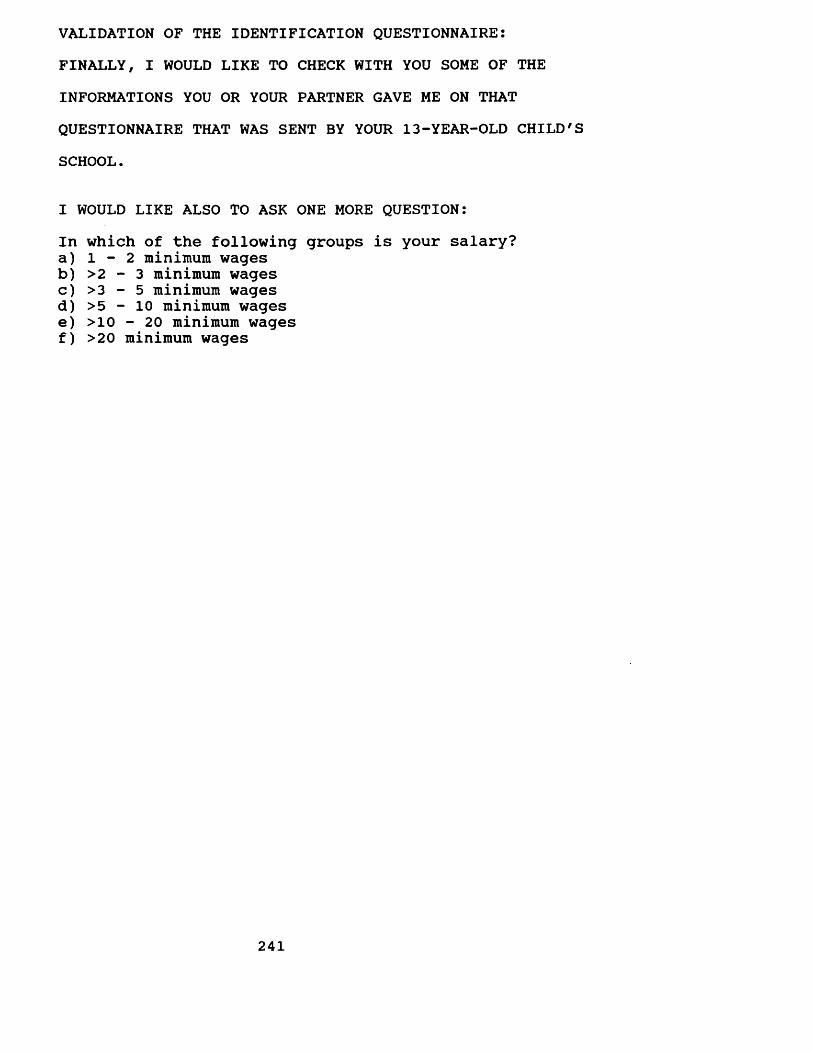
VALIDATION OF THE IDENTIFICATION QUESTIONNAIRE:FINALLY, I WOULD LIKE TO CHECK WITH YOU SOME OF THE INFORMATIONS YOU OR YOUR PARTNER GAVE ME ON THAT QUESTIONNAIRE THAT WAS SENT BY YOUR 13-YEAR-OLD CHILD'S SCHOOL.
I WOULD LIKE ALSO TO ASK ONE MORE QUESTION:In which of the following groups is your salary?a) 1 - 2 minimum wagesb) >2 - 3 minimum wagesc) >3 - 5 minimum wagesd) >5 - 10 minimum wagese) >10 - 20 minimum wagesf) >20 minimum wages
241
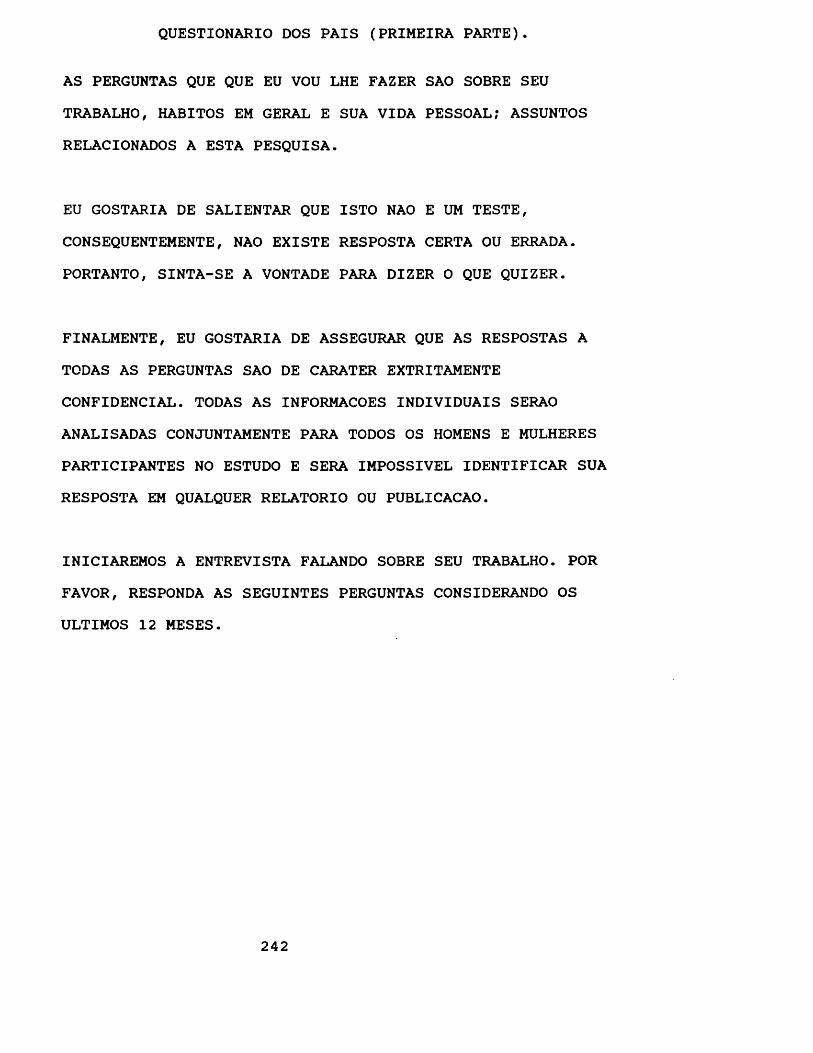
QUESTIONARIO DOS PAIS (PRIMEIRA PARTE).
AS PERGUNTAS QUE QUE EU VOU LHE FAZER SAO SOBRE SEU TRABALHO, HABITOS EM GERAL E SUA VIDA PESSOAL? ASSUNTOS RELACIONADOS A ESTA PESQUISA.
EU GOSTARIA DE SALIENTAR QUE ISTO NAO E UM TESTE, CONSEQUENTEMENTE, NAO EXISTE RESPOSTA CERTA OU ERRADA. PORTANTO, SINTA-SE A VONTADE PARA DIZER O QUE QUIZER.
FINALMENTE, EU GOSTARIA DE ASSEGURAR QUE AS RESPOSTAS A TODAS AS PERGUNTAS SAO DE CARATER EXTRITAMENTE CONFIDENCIAL. TODAS AS INFORMACOES INDIVIDUAIS SERAO ANALISADAS CONJUNTAMENTE PARA TODOS OS HOMENS E MULHERES PARTICIPANTES NO ESTUDO E SERA IMPOSSIVEL IDENTIFICAR SUA RESPOSTA EM QUALQUER RELATORIO OU PUBLICACAO.
INICIAREMOS A ENTREVISTA FALANDO SOBRE SEU TRABALHO. POR FAVOR, RESPONDA AS SEGUINTES PERGUNTAS CONSIDERANDO OS ULTIMOS 12 MESES.
242
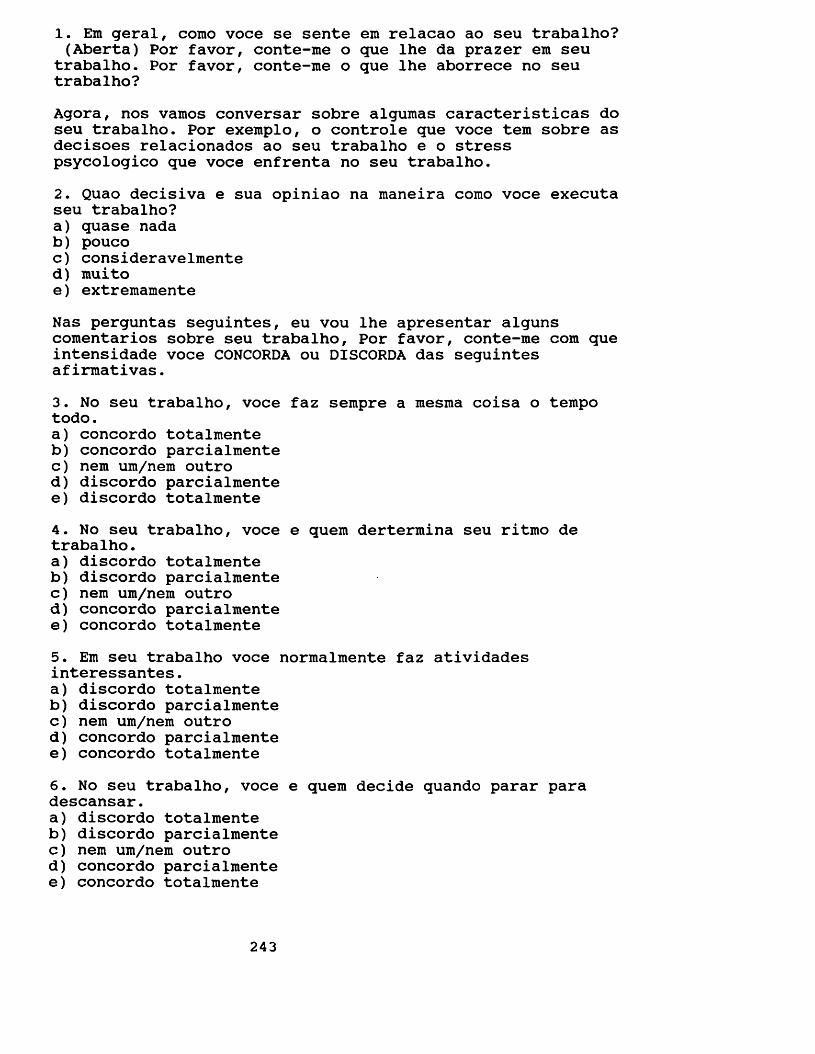
1. Em geral, como voce se sente em relacao ao seu trabalho? (Aberta) Por favor, conte-me o que lhe da prazer em seu
trabalho. Por favor, conte-me o que lhe aborrece no seu trabalho?Agora, nos vamos conversar sobre algumas caracteristicas do seu trabalho. Por exemplo, o controle que voce tem sobre as decisoes relacionados ao seu trabalho e o stress psycologico que voce enfrenta no seu trabalho.2. Quao decisiva e sua opiniao na maneira como voce executa seu trabalho?a) quase nadab) poucoc) consideravelmented) muitoe) extremamenteNas perguntas seguintes, eu vou lhe apresentar alguns comentarios sobre seu trabalho, Por favor, conte-me com que intensidade voce CONCORDA ou DISCORDA das seguintes afirmativas.3. No seu trabalho, voce faz sempre a mesma coisa o tempo todo.a) concordo totalmenteb) concordo parcialmentec) nem um/nem outrod) discordo parcialmentee) discordo totalmente4. No seu trabalho, voce e quem dertermina seu ritmo de trabalho.a) discordo totalmenteb) discordo parcialmentec) nem um/nem outrod) concordo parcialmentee) concordo totalmente5. Em seu trabalho voce normalmente faz atividades interessantes.a) discordo totalmenteb) discordo parcialmentec) nem um/nem outrod) concordo parcialmentee) concordo totalmente6. No seu trabalho, voce e quem decide quando parar para descansar.a) discordo totalmenteb) discordo parcialmentec) nem um/nem outrod) concordo parcialmentee) concordo totalmente
243
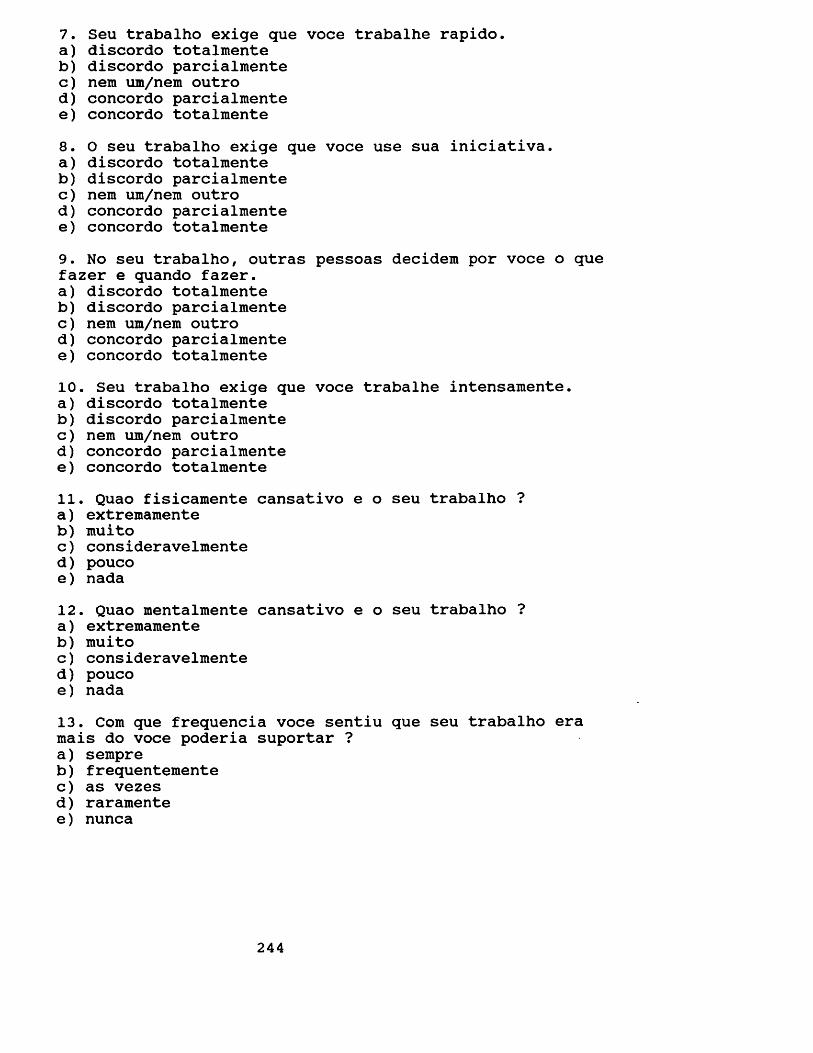
7. Seu trabalho exige que voce trabalhe rapido.a) discordo totalmenteb) discordo parcialmentec) nem um/nem outrod) concordo parcialmentee) concordo totalmente8. 0 seu trabalho exige que voce use sua iniciativa.a) discordo totalmenteb) discordo parcialmentec) nem um/nem outrod) concordo parcialmentee) concordo totalmente9. No seu trabalho, outras pessoas decidem por voce o que fazer e quando fazer.a) discordo totalmenteb) discordo parcialmentec) nem um/nem outrod) concordo parcialmentee) concordo totalmente10. Seu trabalho exige que voce trabalhe intensamente.a) discordo totalmenteb) discordo parcialmentec) nem um/nem outrod) concordo parcialmentee) concordo totalmente11. Quao fisicamente cansativo e o seu trabalho ?a) extremamenteb) muitoc) consideravelmented) poucoe) nada12. Quao mentalmente cansativo e o seu trabalho ?a) extremamenteb) muitoc) consideravelmented) poucoe) nada13. Com que frequencia voce sentiu que seu trabalho era mais do voce poderia suportar ?a) sempreb) frequentementec) as vezesd) raramentee) nunca
244
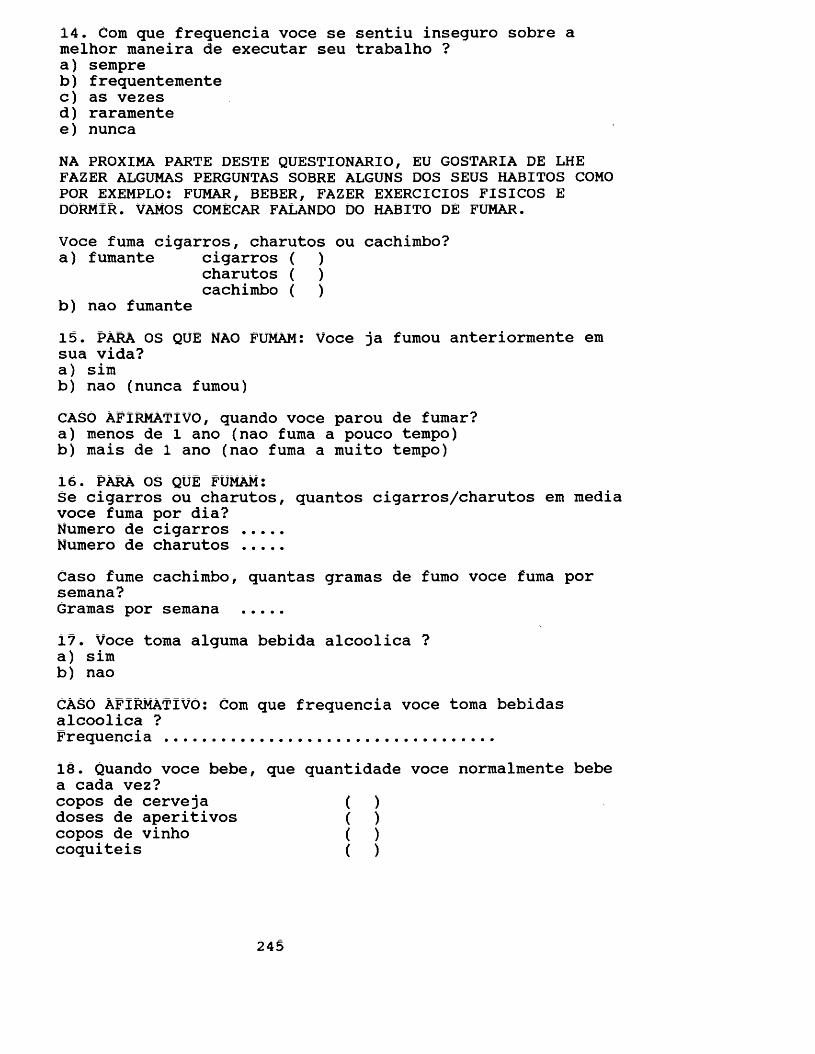
14. Com que frequencia voce se sentiu inseguro sobre a melhor maneira de executar seu trabalho ?a) sempreb) frequentementec) as vezesd) raramentee) nuncaNA PROXIMA PARTE DESTE QUESTIONARIO, EU GOSTARIA DE LHE FAZER ALGUMAS PERGUNTAS SOBRE ALGUNS DOS SEUS HABITOS COMO POR EXEMPLO: FUMAR, BEBER, FAZER EXERCICIOS FISICOS E DORMIR. VAMOS COMECAR FALANDO DO HABITO DE FUMAR.Voce fuma cigarros, charutos ou cachimbo?a) fumante cigarros ( )
charutos ( ) cachimbo ( )
b) nao fumante15. PARA OS QUE NAO FUMAM: Voce ja fumou anteriormente em sua vida?a) simb) nao (nunca fumou)CASO AFIRMATiVO, quando voce parou de fumar?a) menos de 1 ano (nao fuma a pouco tempo)b) mais de 1 ano (nao fuma a muito tempo)16. PARA OS QUE FUMAM:Se cigarros ou charutos, quantos cigarros/charutos em media voce fuma por dia?Numero de cigarros ....Numero de charutos ....Caso fume cachimbo, quantas gramas de fumo voce fuma por semana?Gramas por semana ....17. Voce toma alguma bebida alcoolica ?a) simb) naoCASO AFIRMATiVO: Com que frequencia voce toma bebidas alcoolica ?Frequencia ..................................18. Quando voce bebe, que quantidade voce normalmente bebe a cada vez?copos de cerveja ( )doses de aperitivos ( )copos de vinho ( )coquiteis ( )
245
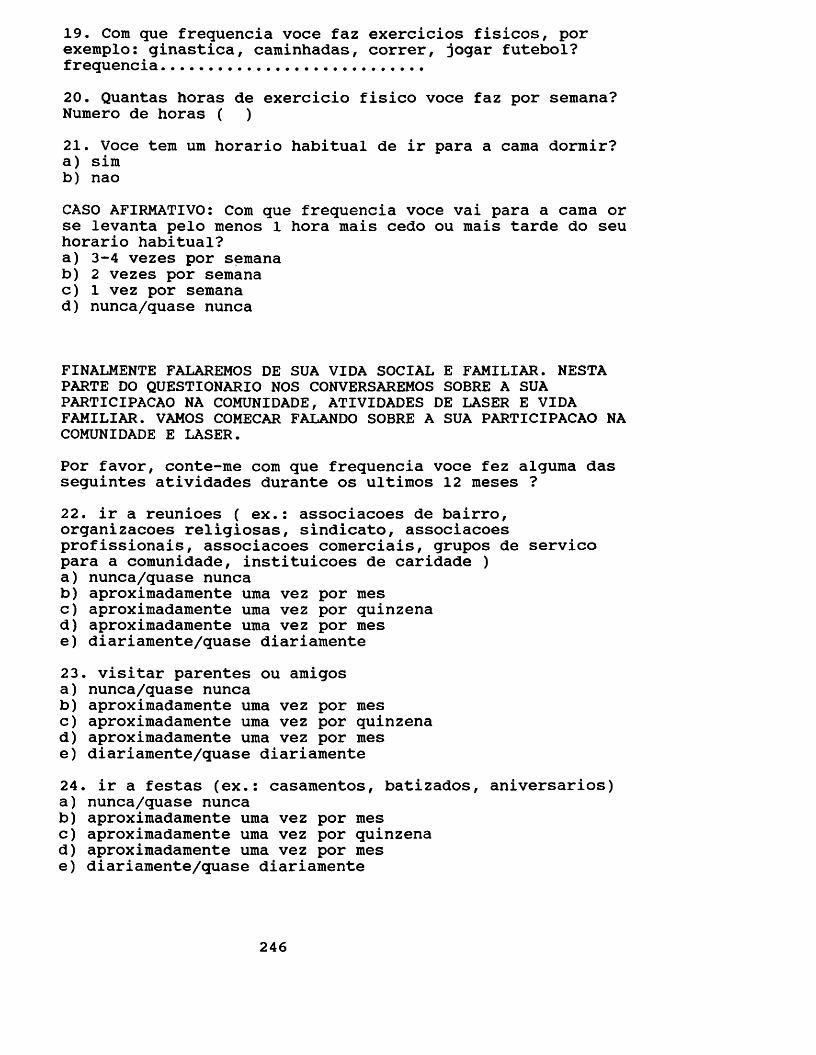
19. Com que frequencia voce faz exercicios fisicos, por exemplo: ginastica, caminhadas, correr, jogar futebol? frequencia...........................20. Quantas horas de exercicio fisico voce faz por semana? Numero de horas ( )21. Voce tern um horario habitual de ir para a cama dormir?a) simb) naoCASO AFIRMATIVO: Com que frequencia voce vai para a cama or se levanta pelo menos 1 hora mais cedo ou mais tarde do seu horario habitual?a) 3-4 vezes por semanab) 2 vezes por semanac) 1 vez por semanad) nunca/quase nunca
FINALMENTE FALAREMOS DE SUA VIDA SOCIAL E FAMILIAR. NESTA PARTE DO QUESTIONARIO NOS CONVERSAREMOS SOBRE A SUA PARTICIPACAO NA COMUNIDADE, ATIVIDADES DE LASER E VIDA FAMILIAR. VAMOS COMECAR FALANDO SOBRE A SUA PARTICIPACAO NA COMUNIDADE E LASER.Por favor, conte-me com que frequencia voce fez alguma das seguintes atividades durante os ultimos 12 raeses ?22. ir a reunioes ( ex.: associacoes de bairro, organizacoes religiosas, sindicato, associacoes profissionais, associacoes comerciais, grupos de servico para a comunidade, instituicoes de caridade )a) nunca/quase nuncab) aproximadamente uma vez por mesc) aproximadamente uma vez por quinzenad) aproximadamente uma vez por mese) diariamente/quase diariamente23. visitar parentes ou amigosa) nunca/quase nuncab) aproximadamente uma vez por mesc) aproximadamente uma vez por quinzenad) aproximadamente uma vez por mese) diariamente/quase diariamente24. ir a festas (ex.: casamentos, batizados, aniversarios)a) nunca/quase nuncab) aproximadamente uma vez por mesc) aproximadamente uma vez por quinzenad) aproximadamente uma vez por mese) diariamente/quase diariamente
246
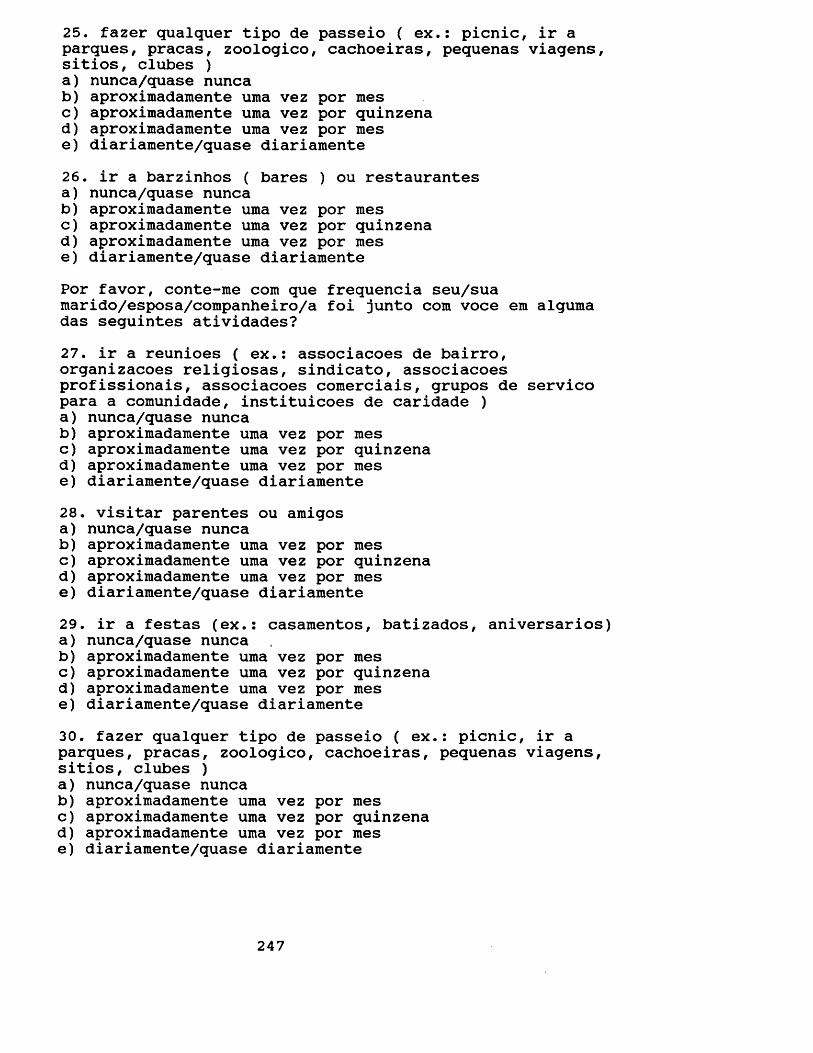
25. fazer qualquer tipo de passeio ( ex.: picnic, ir a parques, pracas, zoologico, cachoeiras, pequenas viagens, sitios, clubes )a) nunca/quase nuncab) aproximadamente uma vez por mesc) aproximadamente uma vez por quinzenad) aproximadamente uma vez por mese) diariamente/quase diariamente26. ir a barzinhos ( bares ) ou restaurantesa) nunca/quase nuncab) aproximadamente uma vez por mesc) aproximadamente uma vez por quinzenad) aproximadamente uma vez por mese) diariamente/quase diariamentePor favor, conte-me com que frequencia seu/sua marido/esposa/companheiro/a foi junto com voce em alguma das seguintes atividades?27. ir a reunioes ( ex.: associacoes de bairro, organizacoes religiosas, sindicato, associacoesprofissionais, associacoes comerciais, grupos de servico para a comunidade, instituicoes de caridade )a) nunca/quase nuncab) aproximadamente uma vez por mesc) aproximadamente uma vez por quinzenad) aproximadamente uma vez por mese) diariamente/quase diariamente28. visitar parentes ou amigosa) nunca/quase nuncab) aproximadamente uma vez por mesc) aproximadamente uma vez por quinzenad) aproximadamente uma vez por mese) diariamente/quase diariamente29. ir a festas (ex.: casamentos, batizados, aniversarios)a) nunca/quase nuncab) aproximadamente uma vez por mesc) aproximadamente uma vez por quinzenad) aproximadamente uma vez por mese) diariamente/quase diariamente30. fazer qualquer tipo de passeio ( ex.: picnic, ir a parques, pracas, zoologico, cachoeiras, pequenas viagens, sitios, clubes )a) nunca/quase nuncab) aproximadamente uma vez por mesc) aproximadamente uma vez por quinzenad) aproximadamente uma vez por mese) diariamente/quase diariamente
247
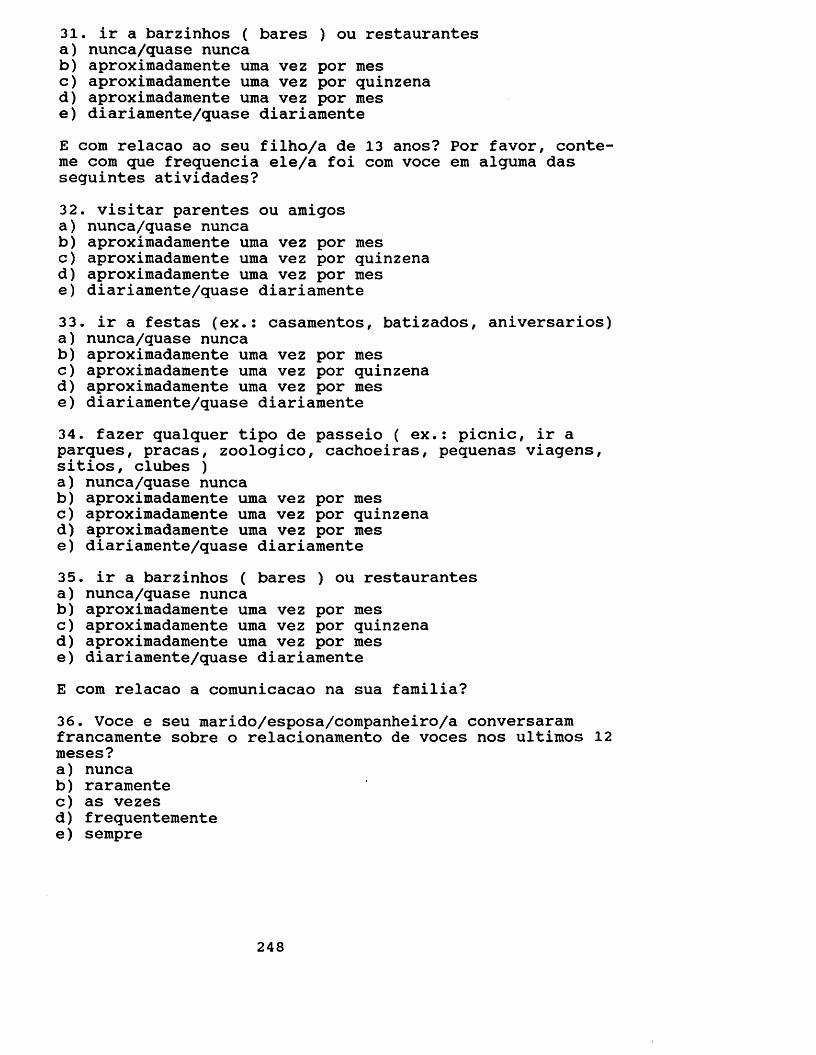
31. ir a barzinhos ( bares ) ou restaurantesa) nunca/quase nuncab) aproximadamente uma vez por mesc) aproximadamente uma vez por quinzenad) aproximadamente uma vez por mese) diariamente/quase diariamenteE com relacao ao seu filho/a de 13 anos? Por favor, conte- me com que frequencia ele/a foi com voce em alguma das seguintes atividades?32. visitar parentes ou amigosa) nunca/quase nuncab) aproximadamente uma vez por mesc) aproximadamente uma vez por quinzenad) aproximadamente uma vez por mese) diariamente/quase diariamente33. ir a festas (ex.: casamentos, batizados, aniversarios)a) nunca/quase nuncab) aproximadamente uma vez por mesc) aproximadamente uma vez por quinzenad) aproximadamente uma vez por mese) diariamente/quase diariamente34. fazer qualquer tipo de passeio ( ex.: picnic, ir a parques, pracas, zoologico, cachoeiras, pequenas viagens, sitios, clubes )a) nunca/quase nuncab) aproximadamente uma vez por mesc) aproximadamente uma vez por quinzenad) aproximadamente uma vez por mese) diariamente/quase diariamente35. ir a barzinhos ( bares ) ou restaurantesa) nunca/quase nuncab) aproximadamente uma vez por mesc) aproximadamente uma vez por quinzenad) aproximadamente uma vez por mese) diariamente/quase diariamenteE com relacao a comunicacao na sua farailia?36. Voce e seu marido/esposa/companheiro/a conversaram francamente sobre o relacionamento de voces nos ultimos 12 meses?a) nuncab) raramentec) as vezesd) frequentementee) sempre
248
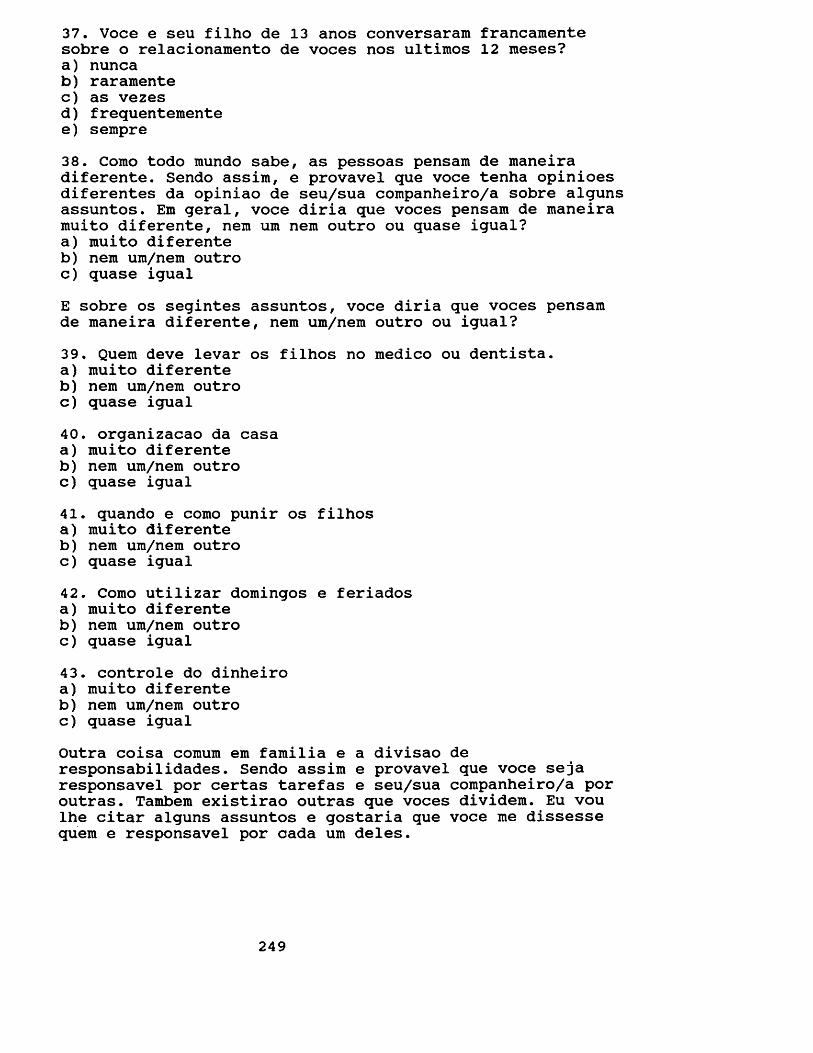
37. Voce e seu filho de 13 anos conversaram francamente sobre o relacionamento de voces nos ultimos 12 meses?a) nuncab) raramentec) as vezesd) frequentementee) sempre38. Como todo mundo sabe, as pessoas pensam de maneira diferente. Sendo assim, e provavel que voce tenha opinioes diferentes da opiniao de seu/sua companheiro/a sobre alguns assuntos. Em geral, voce diria que voces pensam de maneira muito diferente, nem um nem outro ou quase igual?a) muito diferenteb) nem um/nem outroc) quase igualE sobre os segintes assuntos, voce diria que voces pensam de maneira diferente, nem um/nem outro ou igual?39. Quem deve levar os filhos no medico ou dentista.a) muito diferenteb) nem um/nem outroc) quase igual40. organizacao da casaa) muito diferenteb) nem um/nem outroc) quase igual41. quando e como punir os filhosa) muito diferenteb) nem um/nem outroc) quase igual42. Como utilizar domingos e feriadosa) muito diferenteb) nem um/nem outroc) quase igual43. controle do dinheiroa) muito diferenteb) nem um/nem outroc) quase igualOutra coisa comum em familia e a divisao de responsabilidades. Sendo assim e provavel que voce seja responsavel por certas tarefas e seu/sua companheiro/a por outras. Tambem existirao outras que voces dividem. Eu vou lhe citar alguns assuntos e gostaria que voce me dissesse quem e responsavel por cada um deles.
249
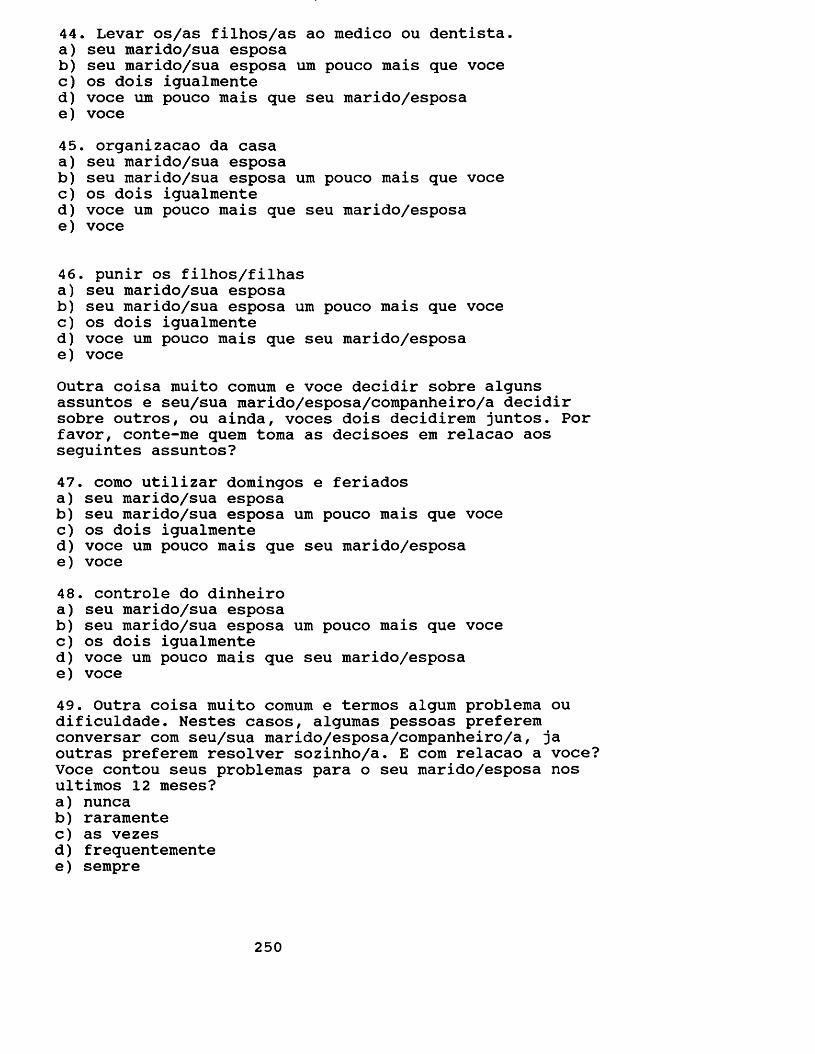
44. Levar os/as filhos/as ao medico ou dentista.a) seu marido/sua esposab) seu marido/sua esposa um pouco mais que vocec) os dois igualmented) voce um pouco mais que seu marido/esposae) voce45. organizacao da casaa) seu marido/sua esposab) seu marido/sua esposa um pouco mais que vocec) os dois igualmented) voce um pouco mais que seu marido/esposae) voce
46. punir os filhos/filhasa) seu marido/sua esposab) seu marido/sua esposa um pouco mais que vocec) os dois igualmented) voce um pouco mais que seu marido/esposae) voceOutra coisa muito comum e voce decidir sobre alguns assuntos e seu/sua marido/esposa/companheiro/a decidir sobre outros, ou ainda, voces dois decidirem juntos. Por favor, conte-me quem toma as decisoes em relacao aos seguintes assuntos?47. como utilizar domingos e feriadosa) seu marido/sua esposab) seu marido/sua esposa um pouco mais que vocec) os dois igualmented) voce um pouco mais que seu marido/esposae) voce48. controle do dinheiroa) seu marido/sua esposab) seu marido/sua esposa um pouco mais que vocec) os dois igualmented) voce um pouco mais que seu marido/esposae) voce49. Outra coisa muito comum e termos algum problema ou dificuldade. Nestes casos, algumas pessoas preferem conversar com seu/sua marido/esposa/companheiro/a, ja outras preferem resolver sozinho/a. E com relacao a voce? Voce contou seus problemas para o seu marido/esposa nos ultimos 12 meses?a) nuncab) raramentec) as vezesd) frequentementee) sempre
250
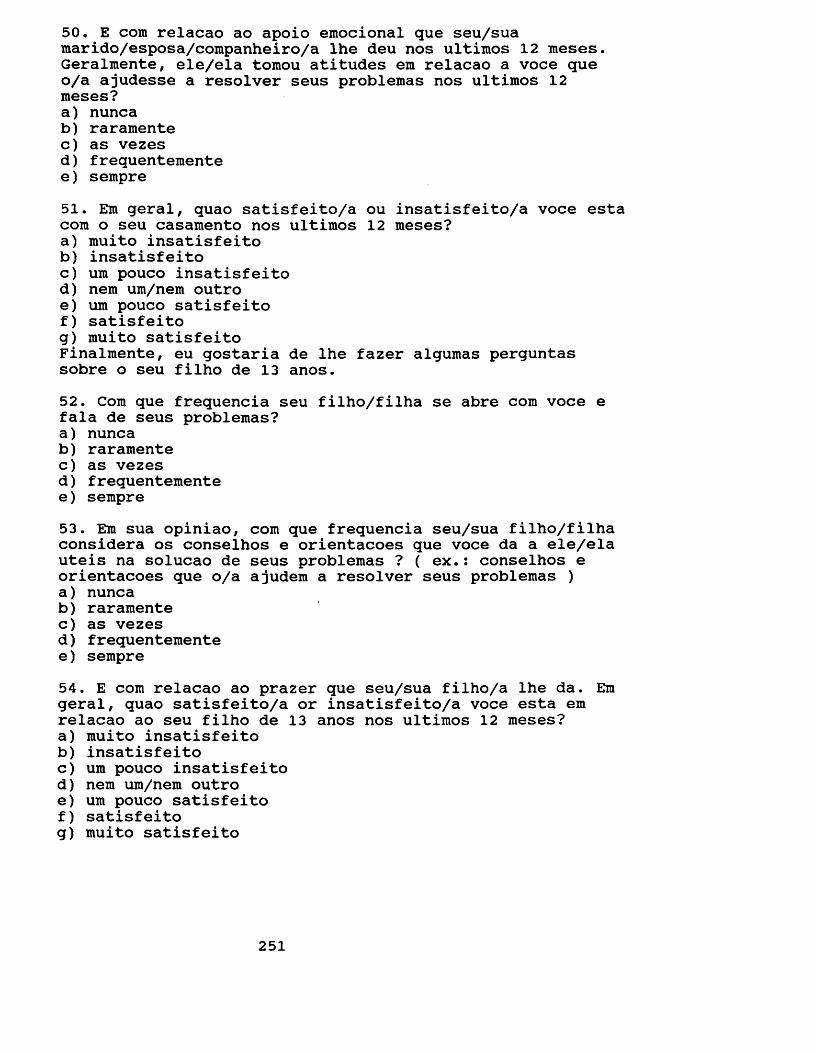
50. E com relacao ao apoio emocional que seu/sua marido/esposa/companheiro/a lhe deu nos ultimos 12 meses. Geralmente, ele/ela tomou atitudes em relacao a voce que o/a ajudesse a resolver seus problemas nos ultimos 12 meses?a) nuncab) raramentec) as vezesd) frequentementee) sempre51. Em geral, quao satisfeito/a ou insatisfeito/a voce esta com o seu casamento nos ultimos 12 meses?a) muito insatisfeitob) insatisfeitoc) um pouco insatisfeitod) nem um/nem outroe) um pouco satisfeitof) satisfeitog) muito satisfeitoFinalmente, eu gostaria de lhe fazer algumas perguntas sobre o seu filho de 13 anos.52. Com que frequencia seu filho/filha se abre com voce e fala de seus problemas?a) nuncab) raramentec) as vezesd) frequentementee) sempre53. Em sua opiniao, com que frequencia seu/sua filho/filha considera os conselhos e orientacoes que voce da a ele/ela uteis na solucao de seus problemas ? ( ex.: conselhos e orientacoes que o/a ajudem a resolver seus problemas )a) nuncab) raramentec) as vezesd) frequentementee) sempre54. E com relacao ao prazer que seu/sua filho/a lhe da. Era geral, quao satisfeito/a or insatisfeito/a voce esta em relacao ao seu filho de 13 anos nos ultimos 12 meses?a) muito insatisfeitob) insatisfeitoc) um pouco insatisfeitod) nem um/nem outroe) um pouco satisfeitof) satisfeitog) muito satisfeito
251
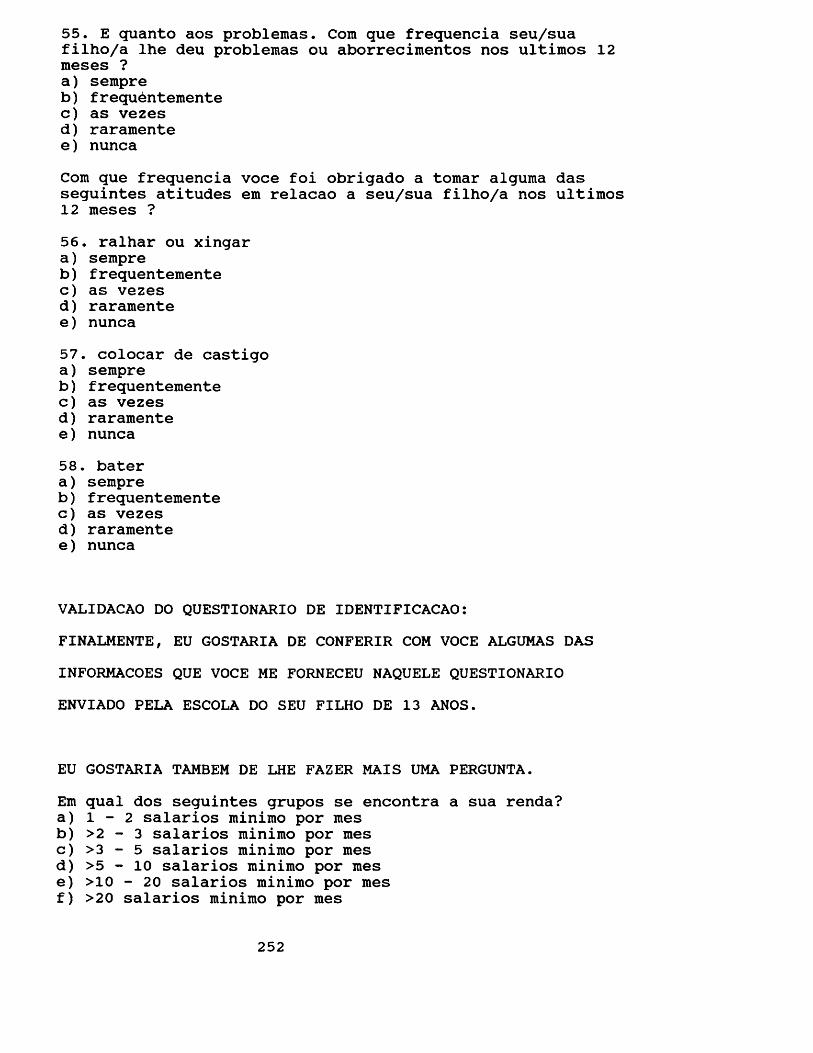
55. E quanto aos problemas. Com que frequencia seu/sua filho/a lhe deu problemas ou aborrecimentos nos ultimos 12 meses ?a) sempreb) frequentementec) as vezesd) raramentee) nuncaCom que frequencia voce foi obrigado a tomar alguma das seguintes atitudes em relacao a seu/sua filho/a nos ultimos 12 meses ?56. ralhar ou xingara) sempreb) frequentementec) as vezesd) raramentee) nunca57. colocar de castigoa) sempreb) frequentementec) as vezesd) raramentee) nunca58. batera) sempreb ) frequentementec) as vezesd) raramentee) nunca
VALIDACAO DO QUESTIONARIO DE IDENTIFICACAO:FINALMENTE, EU GOSTARIA DE CONFERIR COM VOCE ALGUMAS DAS INFORMACOES QUE VOCE ME FORNECEU NAQUELE QUESTIONARIO ENVIADO PELA ESCOLA DO SEU FILHO DE 13 ANOS.
EU GOSTARIA TAMBEM DE LHE FAZER MAIS UMA PERGUNTA.Em qual dos seguintes grupos se encontra a sua renda?a) 1 - 2 salarios minimo por mesb) >2 - 3 salarios minimo por mesc) >3 - 5 salarios minimo por mesd) > 5 - 1 0 salarios minimo por mese) >10 - 20 salarios minimo por mesf) >20 salarios minimo por mes
252
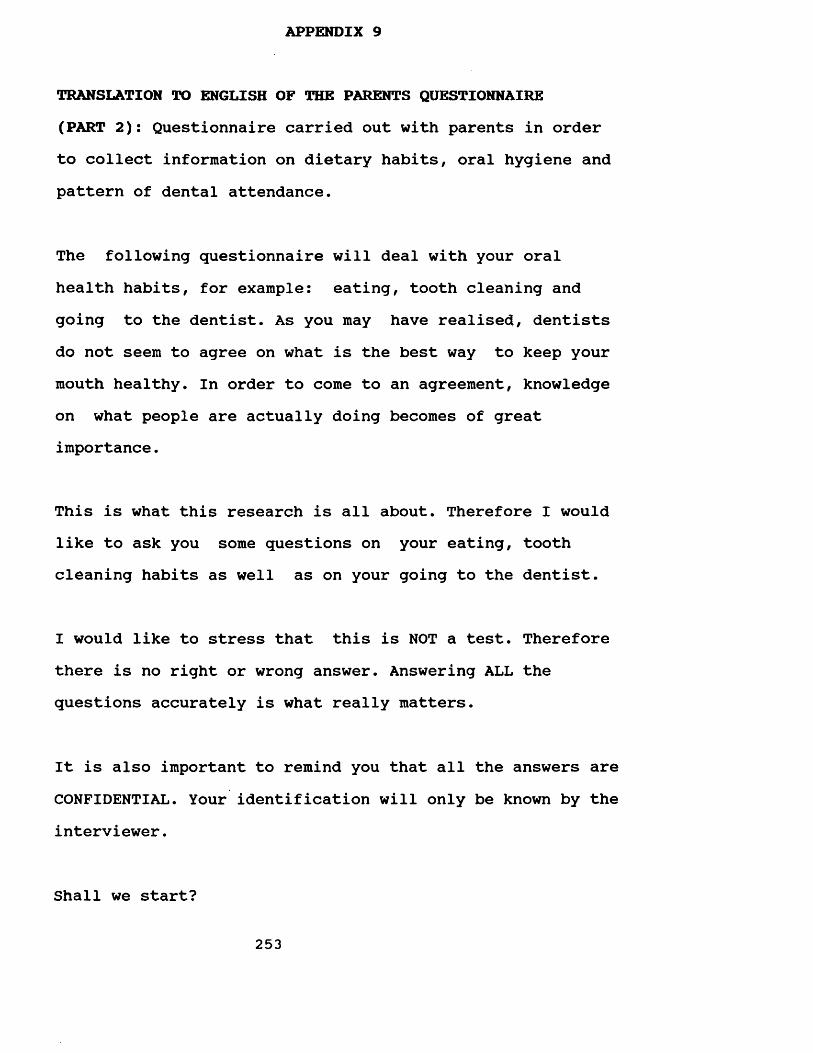
APPENDIX 9
TRANSLATION TO ENGLISH OF THE PARENTS QUESTIONNAIRE (PART 2): Questionnaire carried out with parents in order to collect information on dietary habits, oral hygiene and pattern of dental attendance.
The following questionnaire will deal with your oral health habits, for example: eating, tooth cleaning andgoing to the dentist. As you may have realised, dentists do not seem to agree on what is the best way to keep your mouth healthy. In order to come to an agreement, knowledge on what people are actually doing becomes of great importance.
This is what this research is all about. Therefore I would like to ask you some questions on your eating, tooth cleaning habits as well as on your going to the dentist.
I would like to stress that this is NOT a test. Therefore there is no right or wrong answer. Answering ALL the questions accurately is what really matters.
It is also important to remind you that all the answers are CONFIDENTIAL. Your identification will only be known by the interviewer.
Shall we start?
253
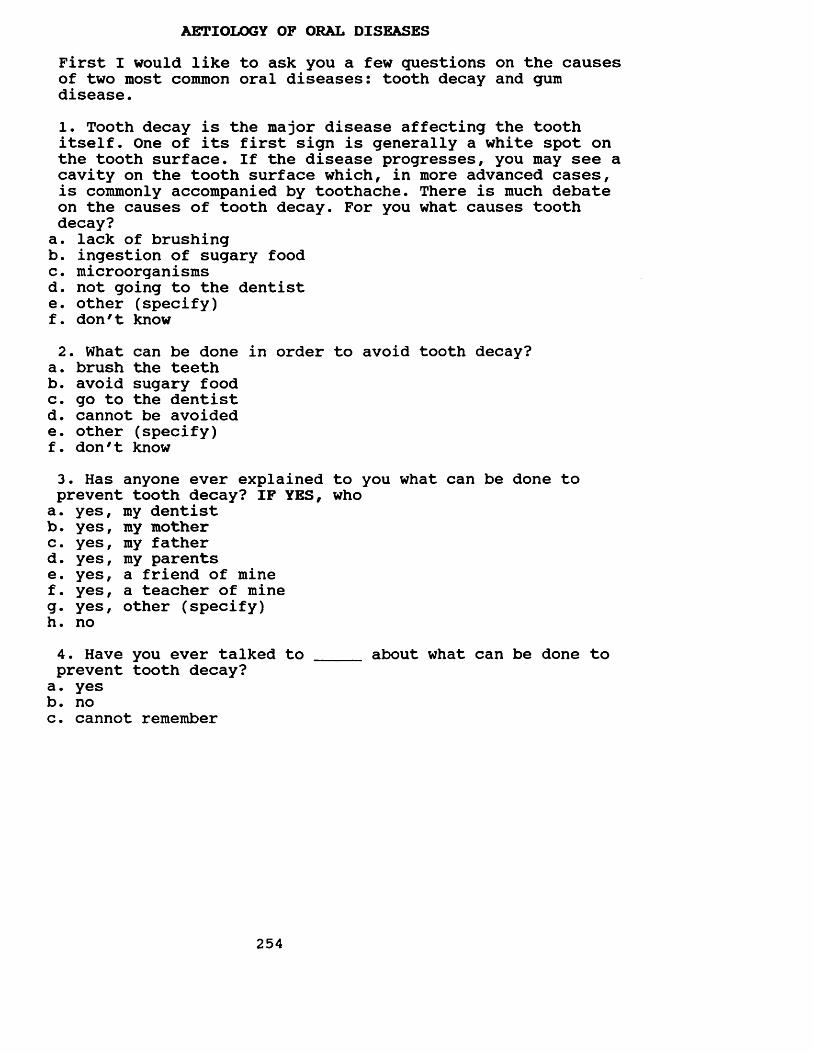
AETIOLOGY OF ORAL DISEASESFirst I would like to ask you a few questions on the causes of two most common oral diseases: tooth decay and gum disease.1. Tooth decay is the major disease affecting the tooth itself. One of its first sign is generally a white spot on the tooth surface. If the disease progresses, you may see a cavity on the tooth surface which, in more advanced cases, is commonly accompanied by toothache. There is much debate on the causes of tooth decay. For you what causes tooth decay?a. lack of brushingb. ingestion of sugary foodc. microorganismsd. not going to the dentiste. other (specify)f. don't know2. What can be done in order to avoid tooth decay?
a. brush the teethb. avoid sugary foodc. go to the dentistd. cannot be avoidede. other (specify)f. don't know3. Has anyone ever explained to you what can be done to prevent tooth decay? IF YES, whoa. yes, my dentistb. yes, my motherc. yes, my fatherd. yes, my parentse. yes, a friend of minef. yes, a teacher of mineg. yes, other (specify)h. no4. Have you ever talked to _____ about what can be done toprevent tooth decay?a. yesb. noc. cannot remember
254
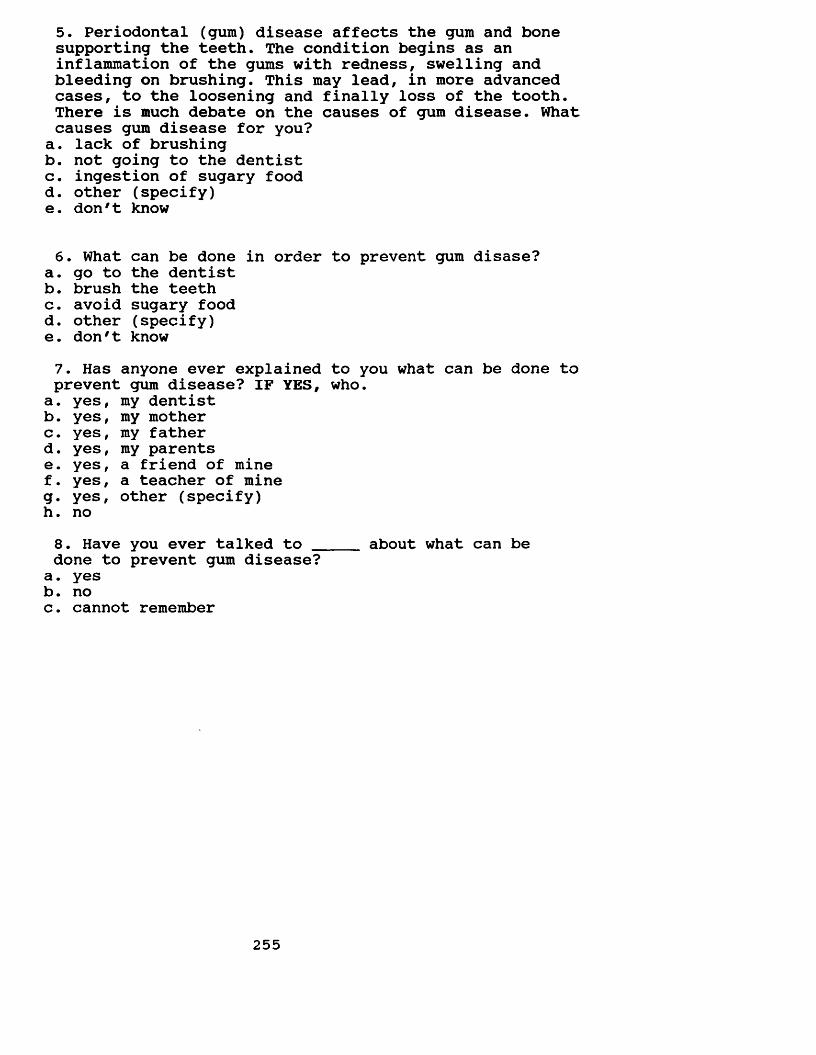
5. Periodontal (gum) disease affects the gum and bonesupporting the teeth. The condition begins as aninflammation of the gums with redness, swelling and bleeding on brushing. This may lead, in more advanced cases, to the loosening and finally loss of the tooth. There is much debate on the causes of gum disease. What causes gum disease for you?
a. lack of brushingb. not going to the dentistc. ingestion of sugary foodd. other (specify)e. don't know
6. What can be done in order to prevent gum disase?a. go to the dentistb. brush the teethc. avoid sugary foodd. other (specify)e. don't know7. Has anyone ever explained to you what can be done to prevent gum disease? IF YES, who.
a. yes, my dentistb. yes, my motherc. yes, my fatherd. yes, my parentse. yes, a friend of minef. yes, a teacher of mineg. yes, other (specify)h. no8. Have you ever talked to _____ about what can bedone to prevent gum disease?
a. yesb. noc . cannot remember
255
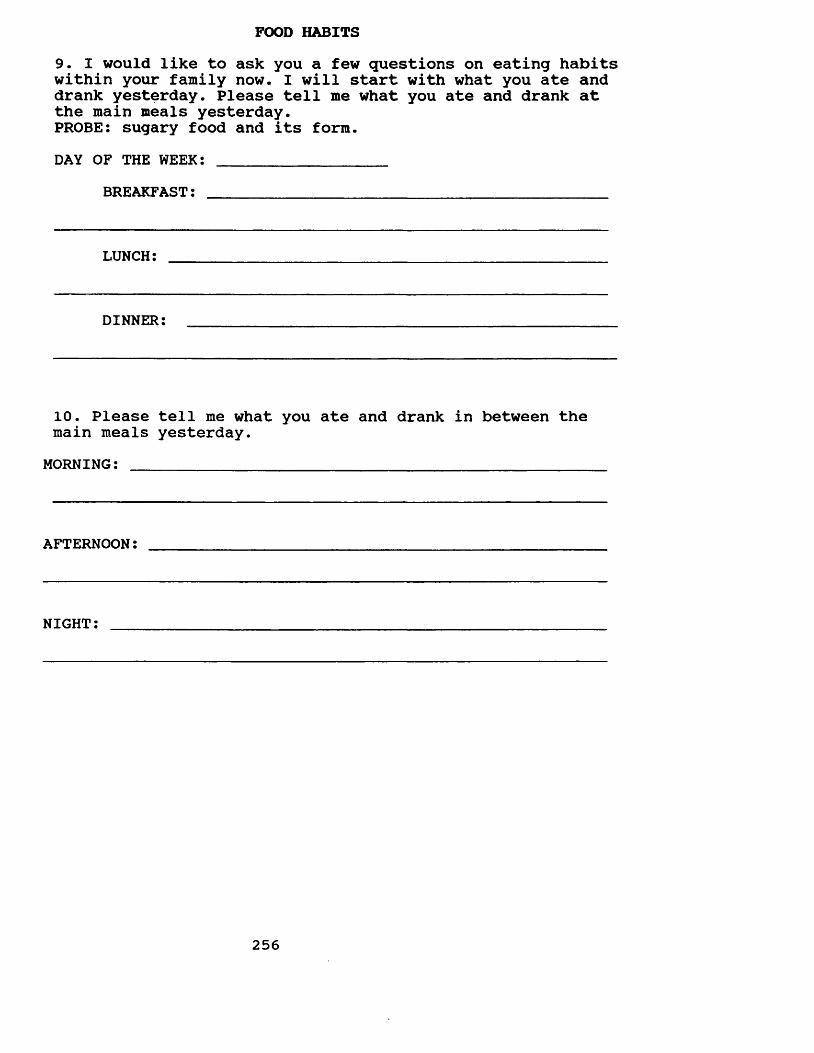
FOOD HABITS9. I would like to ask you a few questions on eating habits within your family now. I will start with what you ate and drank yesterday. Please tell me what you ate and drank at the main meals yesterday.PROBE: sugary food and its form.DAY OF THE WEEK: _________________
BREAKFAST: _________________________________________
LUNCH:
DINNER:
10. Please tell me what you ate and drank in between the main meals yesterday.
MORNING: _______________________________________________
AFTERNOON:
NIGHT:
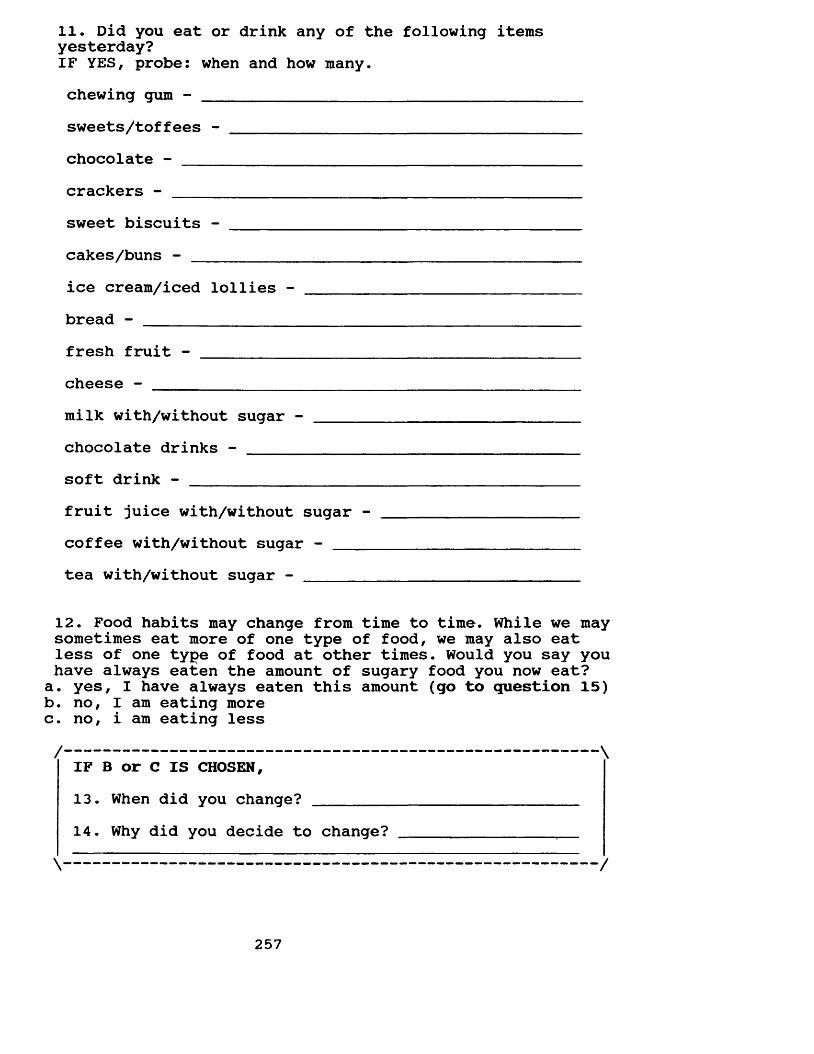
11. Did you eat or drink any of the following items yesterday?IF YES, probe: when and how many.chewing gum - _______________________________________sweets/toffees - ____________________________________chocolate - _________________________________________crackers - __________________________________________sweet biscuits - ____________________________________cakes/buns - ________________________________________ice cream/iced lollies - ________________________ _bread - _____________________________________________fresh fruit - _______________________________________cheese - ____________________________________________milk with/without sugar - ___________________________chocolate drinks - __________________________________soft drink - ________________________________________fruit juice with/without sugar - ____________________coffee with/without sugar - _________________________tea with/without sugar - ________________________ __
12. Food habits may change from time to time. While we may sometimes eat more of one type of food, we may also eat less of one type of food at other times. Would you say you have always eaten the amount of sugary food you now eat?a. yes, I have always eaten this amount (go to question 15)b. no, I am eating morec. no, i am eating less
/ \IF B or C IS CHOSEN,13. When did you change? ________14. Why did you decide to change?
\ /
257
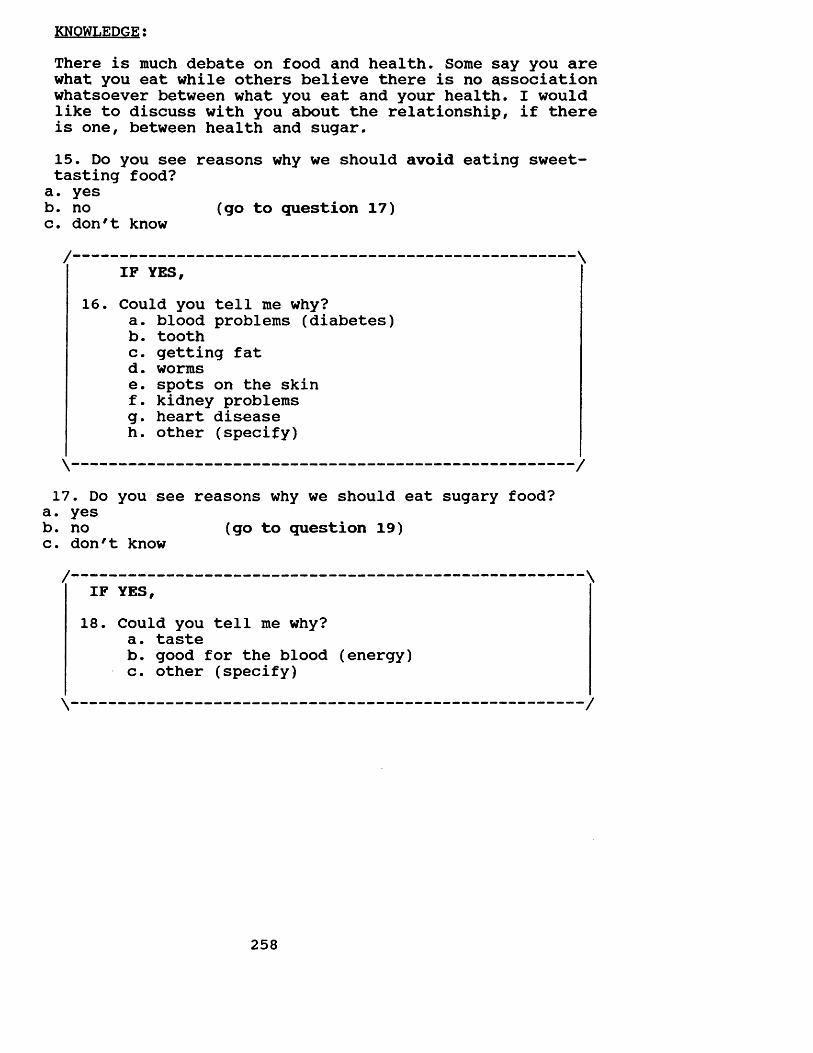
KNOWLEDGE:There is much debate on food and health. Some say you are what you eat while others believe there is no association whatsoever between what you eat and your health. I would like to discuss with you about the relationship, if there is one, between health and sugar.15. Do you see reasons why we should avoid eating sweet- tasting food?a. yesb. no (go to question 17)c. don't know/---------------------------------------------------- \
IF YES,16. Could you tell me why?
a. blood problems (diabetes)b. toothc. getting fatd. wormse. spots on the skinf. kidney problemsg. heart diseaseh. other (specify)
\------------------------------------------------ /17. Do you see reasons why we should eat sugary food?
a. yesb. no (go to question 19)c. don't know
/--------------------------------------------------------------IF YES,18. Could you tell me why?
a. tasteb. good for the blood (energy)c. other (specify)
258
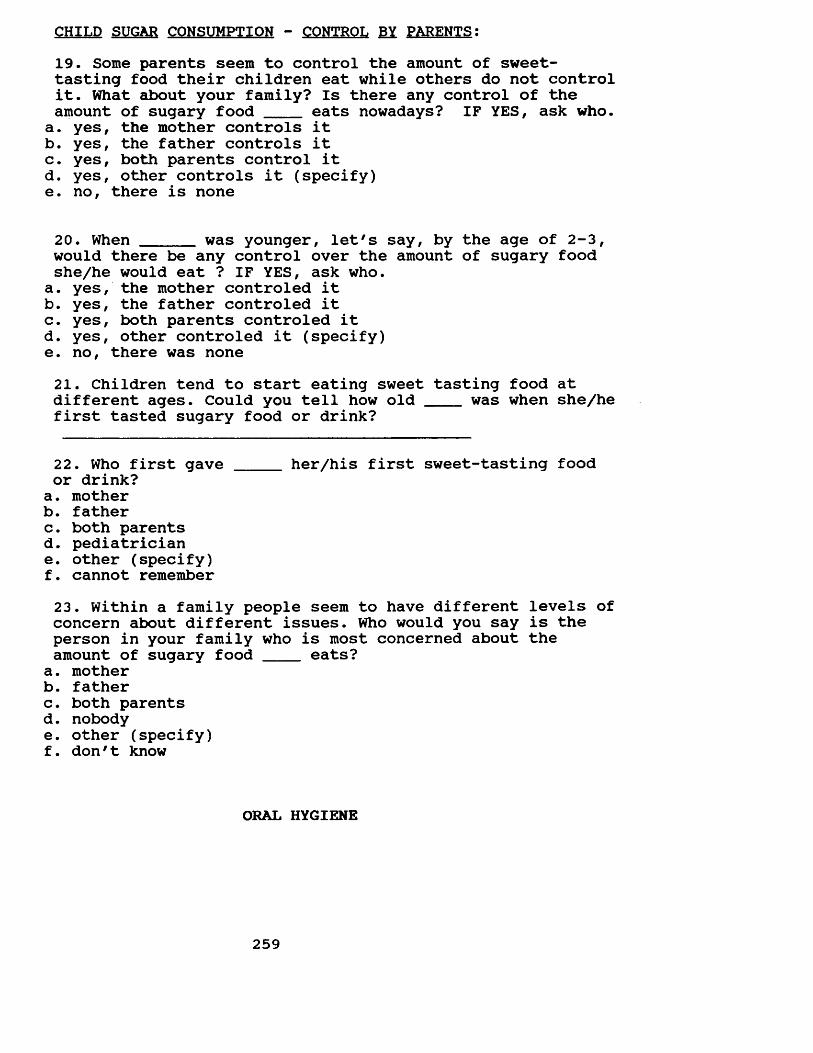
CHILD SUGAR CONSUMPTION - CONTROL BY PARENTS:19. Some parents seem to control the amount of sweet- tasting food their children eat while others do not control it. What about your family? Is there any control of the amount of sugary food eats nowadays? IF YES, ask who.
a. yes, the mother controls itb. yes, the father controls itc. yes, both parents control itd. yes, other controls it (specify)e. no, there is none
20. When _____ was younger, let's say, by the age of 2-3,would there be any control over the amount of sugary foodshe/he would eat ? IF YES, ask who.
a. yes, the mother controled itb. yes, the father controled itc. yes, both parents controled itd. yes, other controled it (specify)e. no, there was none21. Children tend to start eating sweet tasting food atdifferent ages. Could you tell how old ___ was when she/hefirst tasted sugary food or drink?
22. Who first gave _____ her/his first sweet-tasting foodor drink?a. motherb. fatherc. both parentsd. pediatriciane. other (specify)f. cannot remember23. Within a family people seem to have different levels of concern about different issues. Who would you say is the person in your family who is most concerned about the amount of sugary food ____ eats?
a. motherb. fatherc. both parentsd. nobodye. other (specify)f. don't know
ORAL HYGIENE
259
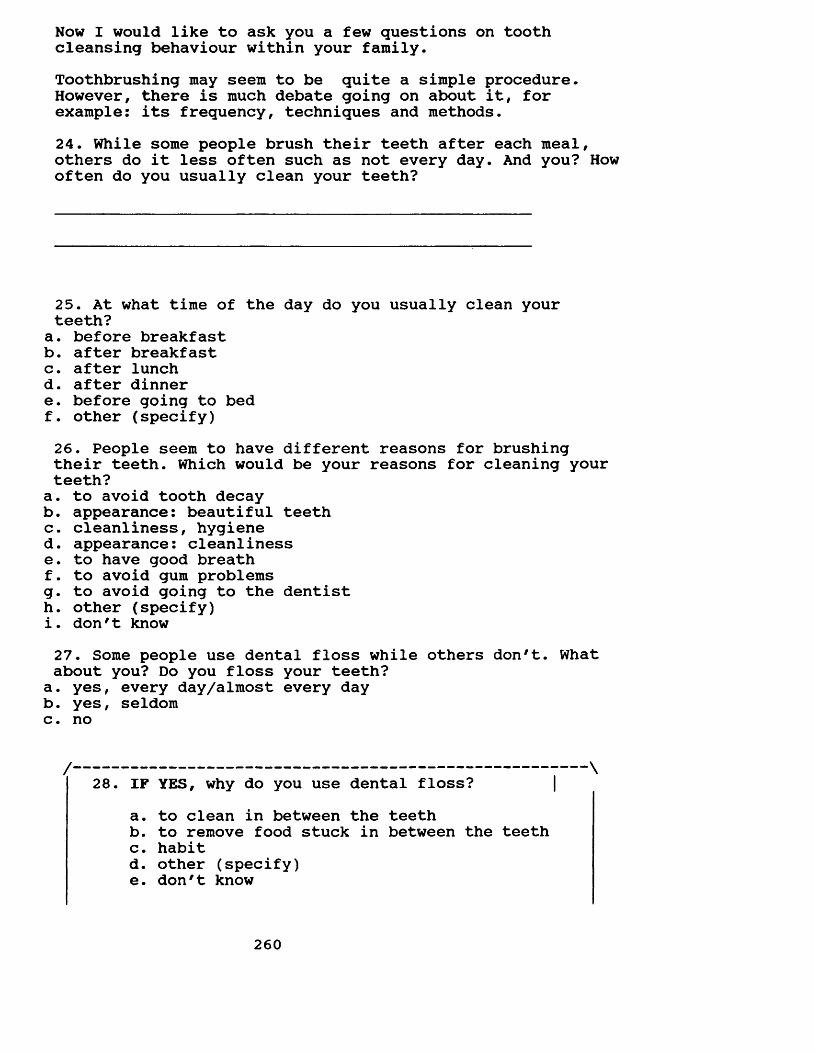
Now I would like to ask you a few questions on tooth cleansing behaviour within your family.Toothbrushing may seem to be quite a simple procedure. However, there is much debate going on about it, for example: its frequency, techniques and methods.24. While some people brush their teeth after each meal, others do it less often such as not every day. And you? How often do you usually clean your teeth?
25. At what time of the day do you usually clean your teeth?
a. before breakfastb. after breakfastc. after lunchd. after dinnere. before going to bedf. other (specify)26. People seem to have different reasons for brushing their teeth. Which would be your reasons for cleaning your teeth?
a. to avoid tooth decayb. appearance: beautiful teethc. cleanliness, hygiened. appearance: cleanlinesse. to have good breathf. to avoid gum problemsg. to avoid going to the dentisth. other (specify)i. don't know27. Some people use dental floss while others don't. What about you? Do you floss your teeth?
a. yes, every day/almost every dayb. yes, seldomc. no
28. IF YES, why do you use dental floss?a. to clean in between the teethb. to remove food stuck in between the teethc. habitd. other (specify)e. don't know
260
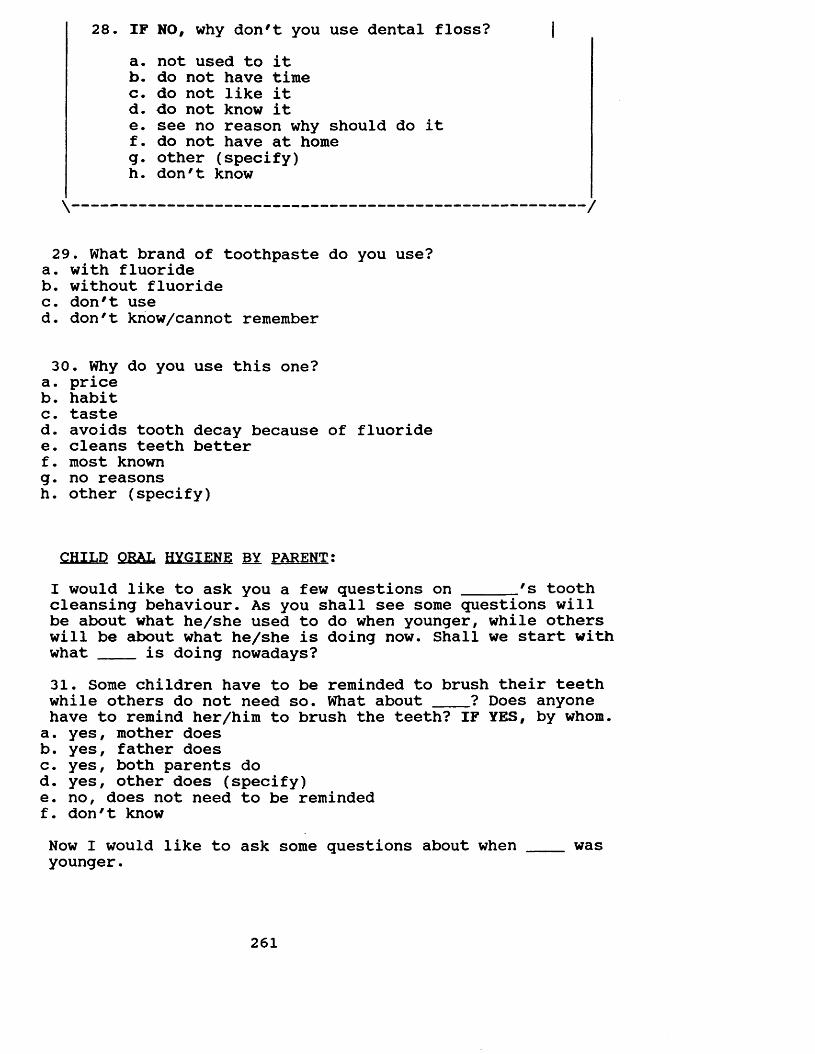
28. IF NO, why don't you use dental floss? |a. not used to itb. do not have timec. do not like itd. do not know ite. see no reason why should do itf. do not have at homeg. other (specify)h. don't know
\ /
29. What brand of toothpaste do you use?a. with fluorideb. without fluoridec. don't used. don't know/cannot remember
30. Why do you use this one?a. priceb. habitc. tasted. avoids tooth decay because of fluoridee. cleans teeth betterf. most knowng. no reasonsh. other (specify)
CHILD ORAL HYGIENE BY PARENT:I would like to ask you a few questions on ______'s toothcleansing behaviour. As you shall see some questions will be about what he/she used to do when younger, while others will be about what he/she is doing now. Shall we start with what ____ is doing nowadays?31. Some children have to be reminded to brush their teethwhile others do not need so. What about ____? Does anyonehave to remind her/him to brush the teeth? IF YES, by whom.a. yes, mother doesb. yes, father doesc. yes, both parents dod. yes, other does (specify)e. no, does not need to be remindedf. don't knowNow I would like to ask some questions about when ____ wasyounger.
261
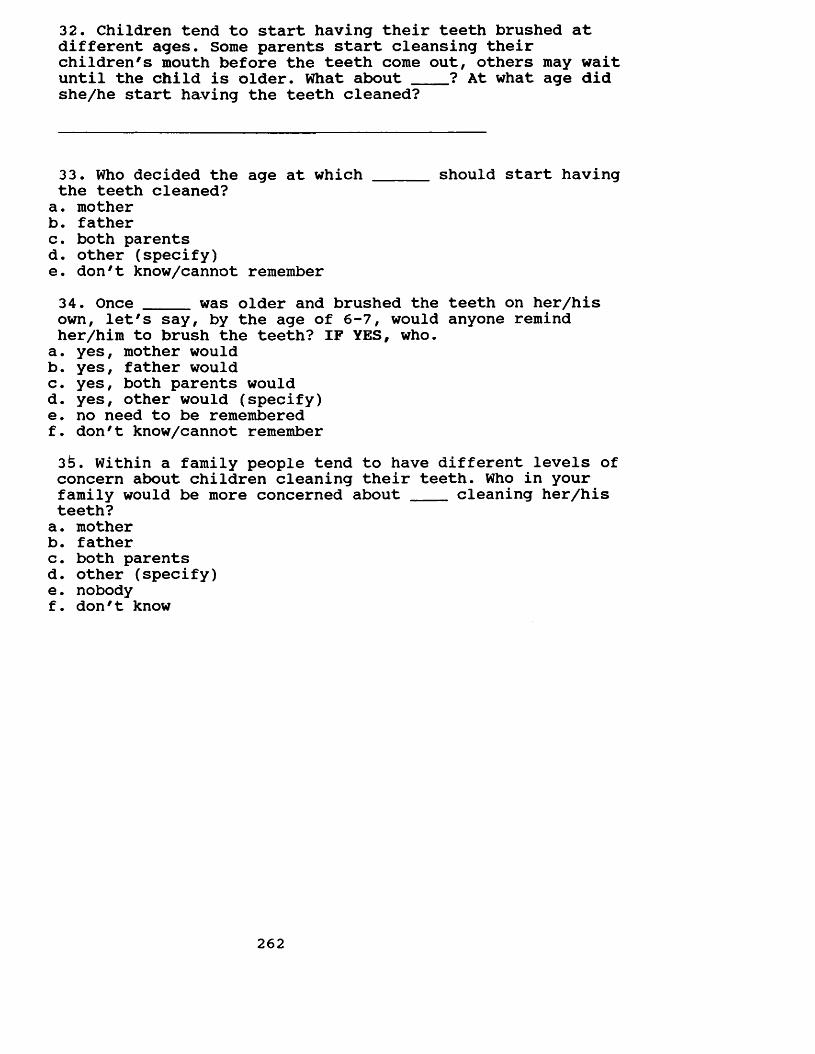
32. Children tend to start having their teeth brushed at different ages. Some parents start cleansing their children's mouth before the teeth come out, others may waituntil the child is older. What about ____? At what age didshe/he start having the teeth cleaned?
33. Who decided the age at which ______ should start havingthe teeth cleaned?a. motherb. fatherc. both parentsd. other (specify)e. don't know/cannot remember34. Once _____ was older and brushed the teeth on her/hisown, let's say, by the age of 6-7, would anyone remind her/him to brush the teeth? IF YES, who.a. yes, mother wouldb. yes, father wouldc. yes, both parents wouldd. yes, other would (specify)e. no need to be rememberedf. don't know/cannot remember3 . Within a family people tend to have different levels of concern about children cleaning their teeth. Who in yourfamily would be more concerned about cleaning her/histeeth?a. motherb. fatherc. both parentsd. other (specify)e. nobodyf. don't know
262
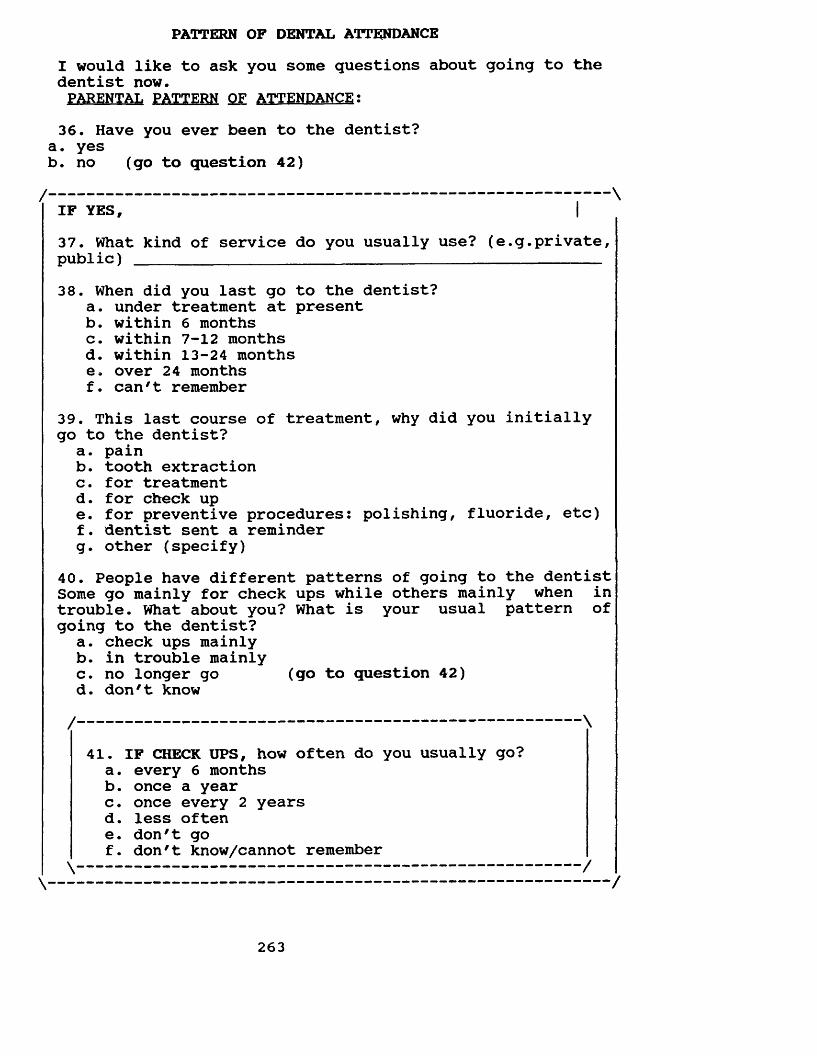
PATTERN OF DENTAL ATTENDANCEI would like to ask you some questions about going to the dentist now.PARENTAL PATTERN QF ATTENDANCE:36. Have you ever been to the dentist?
a. yesb. no (go to question 42)
37. What kind of service do you usually use? (e.g.private, public) ________________________________________________38. When did you last go to the dentist?
a. under treatment at presentb. within 6 monthsc. within 7-12 monthsd. within 13-24 monthse. over 24 monthsf. can't remember
39. This last course of treatment, why did you initially go to the dentist?
a. painb. tooth extractionc. for treatmentd. for check upe. for preventive procedures: polishing, fluoride, etc)f. dentist sent a reminderg. other (specify)
40. People have different patterns of going to the dentist Some go mainly for check ups while others mainly when in trouble. What about you? What is your usual pattern of going to the dentist?
a. check ups mainlyb. in trouble mainlyc. no longer go (go to question 42)d. don't know
41. IF CHECK UPS, how often do you usually go?a. every 6 monthsb. once a yearc. once every 2 yearsd. less oftene. don't gof. don't know/cannot remember
/ \IF YES,
/ \
\ /\ /
263
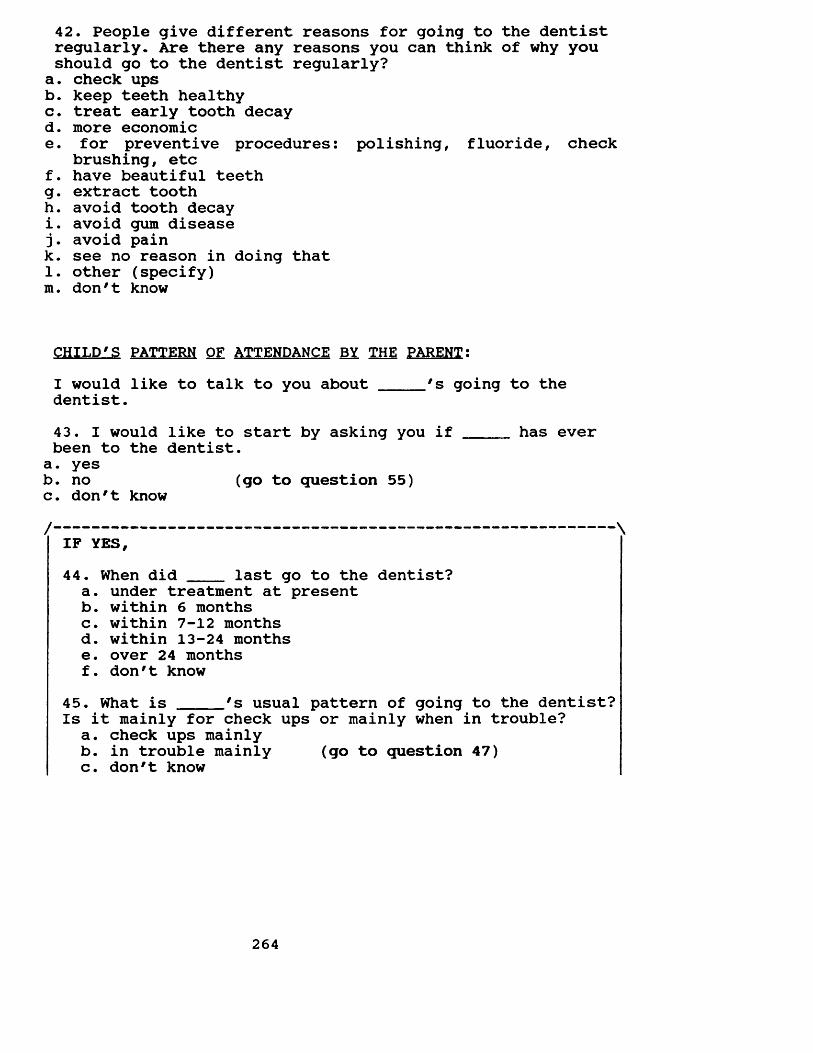
42. People give different reasons for going to the dentist regularly. Are there any reasons you can think of why you should go to the dentist regularly?
a. check upsb. keep teeth healthyc. treat early tooth decayd. more economice. for preventive procedures: polishing, fluoride, check
brushing, etcf. have beautiful teethg. extract toothh. avoid tooth decayi. avoid gum disease j. avoid paink. see no reason in doing that1. other (specify) m. don't know
CHILD'S PATTERN OF ATTENDANCE BY THE PARENT:I would like to talk to you about 's going to thedentist.43. I would like to start by asking you if has everbeen to the dentist.a. yesb. no (go to question 55)c. don't know
/ \IF YES,44. When did ___ last go to the dentist?a. under treatment at presentb. within 6 monthsc. within 7-12 monthsd. within 13-24 monthse. over 24 monthsf. don't know
45. What is 's usual pattern of going to the dentist?Is it mainly for check ups or mainly when in trouble?a. check ups mainlyb. in trouble mainly (go to question 47)c. don't know
264
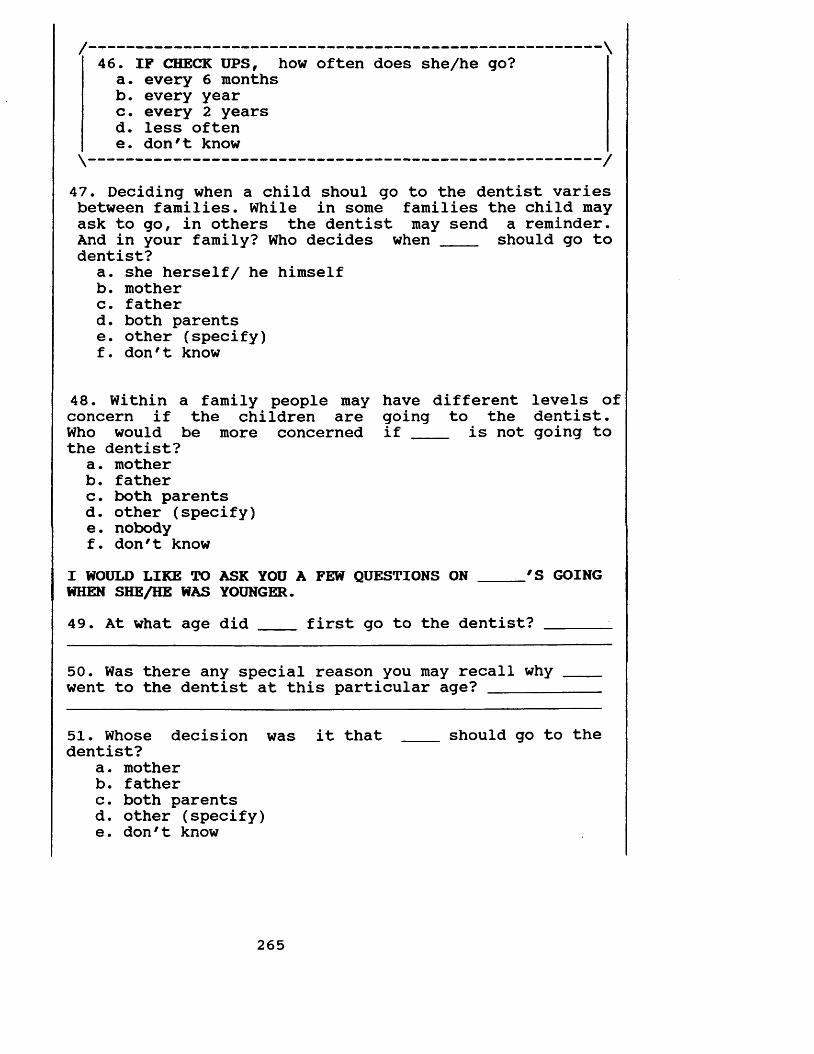
/------------------------------------------------- \46. IF CHECK UPS, how often does she/he go?a. every 6 monthsb. every yearc. every 2 yearsd. less oftene. don't know\------------------------------------------------- /
47. Deciding when a child shoul go to the dentist varies between families. While in some families the child may ask to go, in others the dentist may send a reminder.And in your family? Who decides when _____ should go todentist?
a. she herself/ he himselfb. motherc. fatherd. both parentse. other (specify)f. don't know
48. Within a family people may have different levels of concern if the children are going to the dentist.Who would be more concerned if ____ is not going tothe dentist?
a. motherb. fatherc. both parentsd. other (specify)e. nobodyf. don't know
I WOULD LIKE TO ASK YOU A FEW QUESTIONS ON _____'S GOINGWHEN SHE/HE WAS YOUNGER.49. At what age did ____ first go to the dentist? ______ _
50. Was there any special reason you may recall why went to the dentist at this particular age? _______
51. Whose decision was it that ___ should go to thedentist?
a. motherb. fatherc. both parentsd. other (specify)e. don't know
265
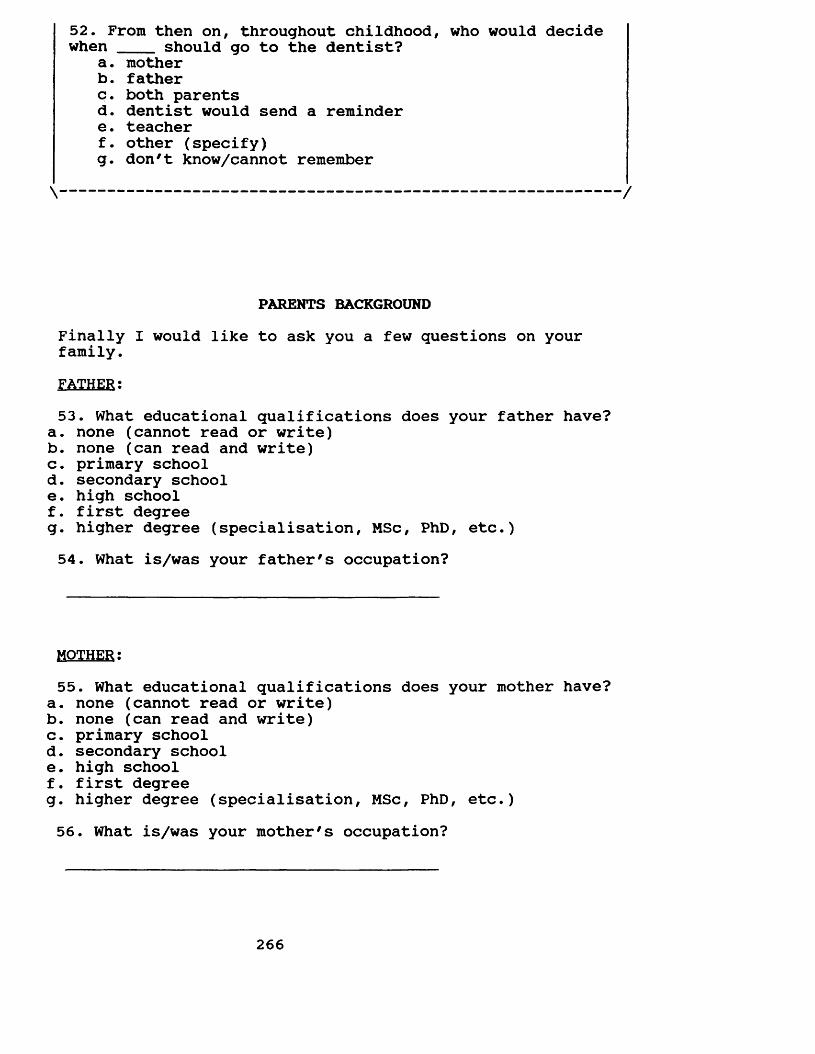
52. From then on, throughout childhood, who would decide when ____ should go to the dentist?
a. motherb. fatherc. both parentsd. dentist would send a remindere. teacherf. other (specify)g. don't know/cannot remember
\ /
PARENTS BACKGROUNDFinally I would like to ask you a few questions on your family.FATHER:53. What educational qualifications does your father have?
a. none (cannot read or write)b. none (can read and write)c. primary schoold. secondary schoole . high schoolf. first degreeg. higher degree (specialisation, MSc, PhD, etc.)54. What is/was your father's occupation?
MOTHER:55. What educational qualifications does your mother have?
a. none (cannot read or write)b. none (can read and write)c. primary schoold. secondary schoole. high schoolf. first degreeg. higher degree (specialisation, MSc, PhD, etc.)56. What is/was your mother's occupation?
266
57. How long have you lived in Belo Horizonte?
58. How long has ____ lived in Belo Horizonte?
THANK YOU VERY MUCH FOR YOUR COLLABORATION!
267
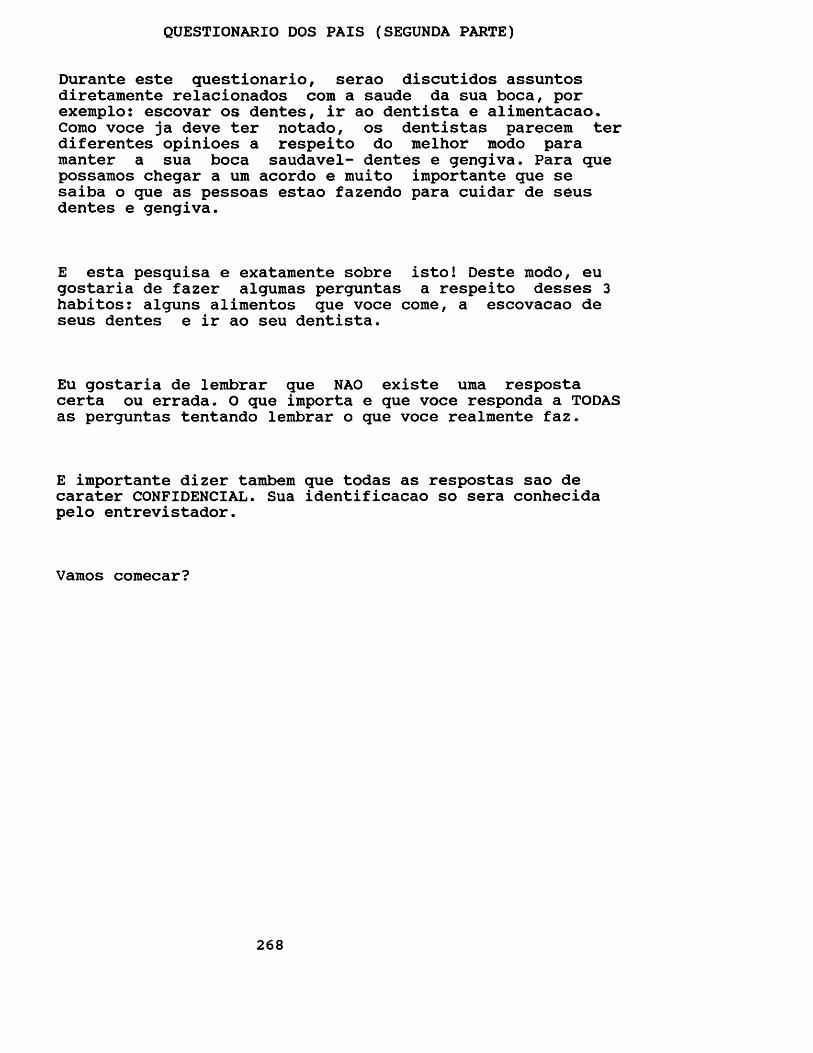
QUESTIONARIO DOS PAIS (SEGUNDA PARTE)
Durante este questionario, serao discutidos assuntos diretamente relacionados com a saude da sua boca, por exemplo: escovar os dentes, ir ao dentista e alimentacao. Como voce ja deve ter notado, os dentistas parecem ter diferentes opinioes a respeito do melhor modo para manter a sua boca saudavel- dentes e gengiva. Para que possamos chegar a um acordo e muito importante que se saiba o que as pessoas estao fazendo para cuidar de seus dentes e gengiva.
E esta pesquisa e exatamente sobre isto! Deste modo, eu gostaria de fazer algumas perguntas a respeito desses 3 habitos: alguns alimentos que voce come, a escovacao de seus dentes e ir ao seu dentista.
Eu gostaria de lembrar que NAO existe uma resposta certa ou errada. O que importa e que voce responda a TODAS as perguntas tentando lembrar o que voce realmente faz.
E importante dizer tambem que todas as respostas sao de carater CONFIDENCIAL. Sua identificacao so sera conhecida pelo entrevistador.
Vamos comecar?
268
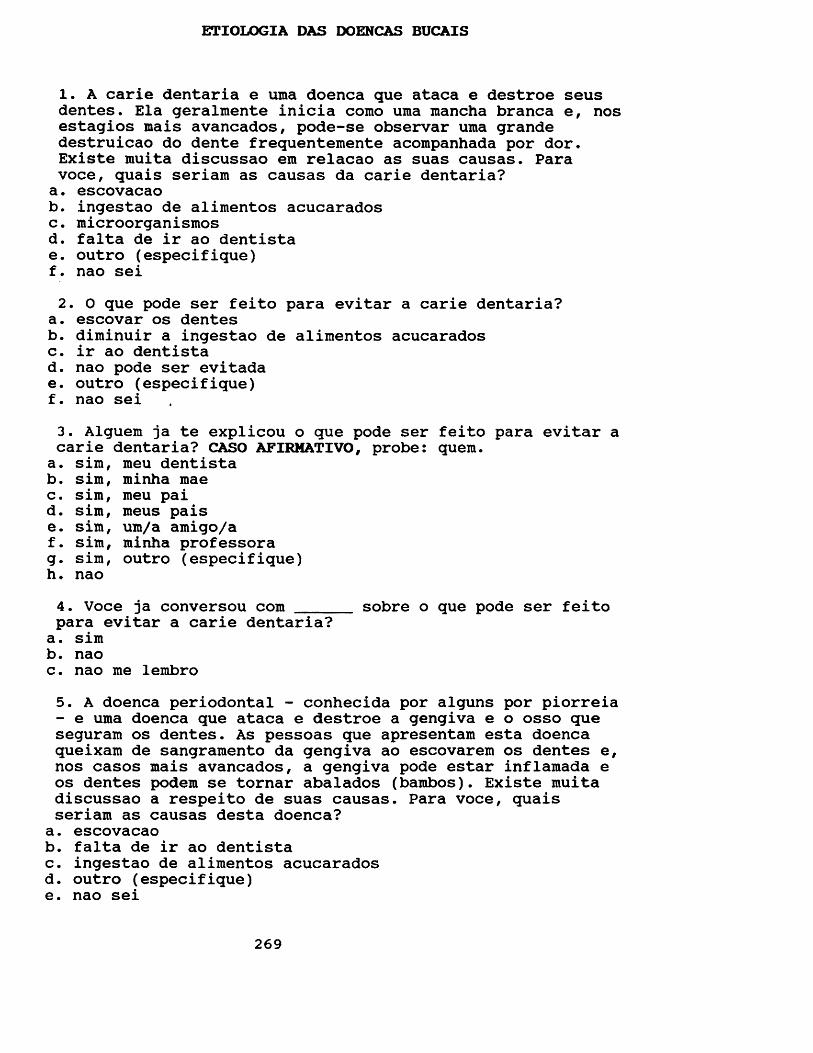
ETIOLOGIA DAS DOENCAS BUCAIS
1. A carie dentaria e uma doenca que ataca e destroe seus dentes. Ela geralmente inicia como uma mancha branca e, nos estagios mais avancados, pode-se observar uma grande destruicao do dente frequentemente acompanhada por dor. Existe muita discussao em relacao as suas causas. Para voce, quais seriam as causas da carie dentaria?a. escovacaob. ingestao de alimentos acucaradosc. microorganismosd. falta de ir ao dentistae. outro (especifique)f. nao sei2. 0 que pode ser feito para evitar a carie dentaria?
a. escovar os dentesb. diminuir a ingestao de alimentos acucaradosc. ir ao dentistad. nao pode ser evitadae. outro (especifique)f. nao sei3. Alguem ja te explicou o que pode ser feito para evitar a carie dentaria? CASO AFIRMATIVO, probe: quem.a. sim, meu dentistab. sim, roinha maec. sim, meu paid. sim, meus paise. sim, um/a amigo/af. sim, minha professorag- sim, outro (especifique)h. nao4. Voce ja conversou com ______ sobre o que pode ser feitopara evitar a carie dentaria?a. simb. naoc. nao me lembro5. A doenca periodontal - conhecida por alguns por piorreia - e uma doenca que ataca e destroe a gengiva e o osso que seguram os dentes. As pessoas que apresentam esta doencaqueixam de sangramento da gengiva ao escovarem os dentes e,nos casos mais avancados, a gengiva pode estar inflamada e os dentes podem se tornar abalados (bambos). Existe muita discussao a respeito de suas causas. Para voce, quais seriam as causas desta doenca?a. escovacaob. falta de ir ao dentistac. ingestao de alimentos acucaradosd. outro (especifique)e. nao sei
269
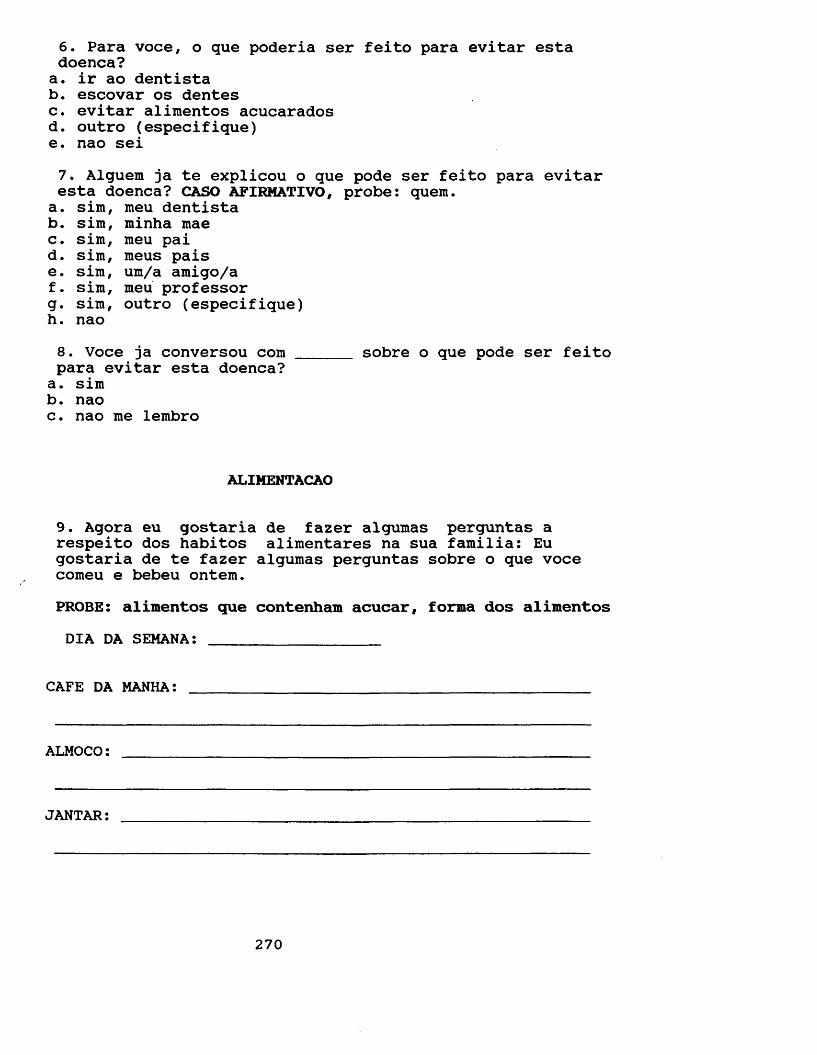
6. Para voce, o que poderia ser feito para evitar esta doenca?a. ir ao dentistab. escovar os dentesc. evitar alimentos acucaradosd. outro (especifique)e. nao sei7. Alguem ja te explicou o que pode ser feito para evitar esta doenca? GASO AFIRMATIVO, probe: quem.a. sim, meu dentistab. sim, minha maec. sim, meu paid. sim, meus paise. sim, um/a amigo/af. sim, meu professorg. sim, outro (especifique)h. nao8. Voce ja conversou com para evitar esta doenca?a. simb. naoc. nao me lembro
sobre o que pode ser feito
ALIMENTAGAO
9. Agora eu gostaria de fazer algumas perguntas a respeito dos habitos alimentares na sua familia: Eu gostaria de te fazer algumas perguntas sobre o que voce comeu e bebeu ontem.PROBE: alimentos que contenham acucar, forma dos alimentos DIA DA SEMANA: __________________
CAFE DA MANHA: ______________________________________
ALMOCO:
JANTAR:
270
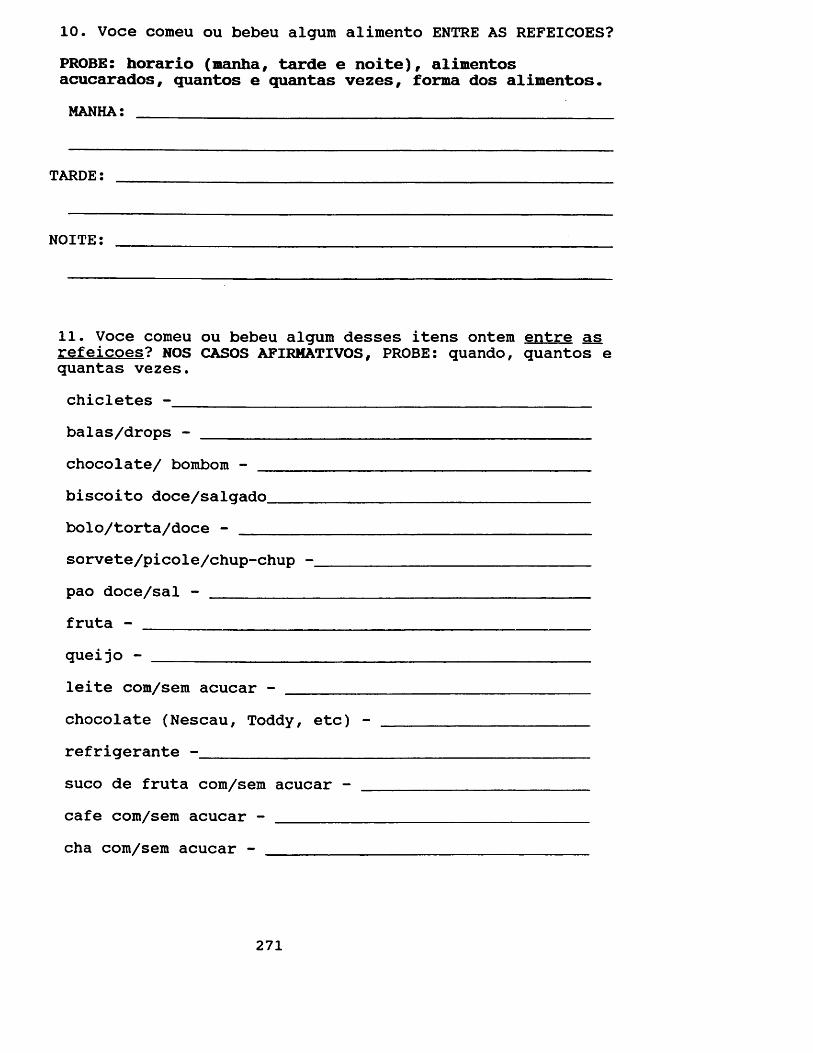
10. Voce comeu ou bebeu algum alimento ENTRE AS REFEICOES?PROBE: horario (manha, tarde e noite), alimentos acucarados, quantos e quantas vezes, forma dos alimentos.MANHA: ____ _____________________________________________
TARDE:
NOITE:
11. Voce comeu ou bebeu algum desses itens ontem entre as refeicoes? NOS CASOS AFIRMATIVOS, PROBE: quando, quantos e quantas vezes.chicletes -___________________________________________balas/drops - ________________________________________chocolate/ bombom - __________________________________biscoito doce/salgado_________________________________bolo/torta/doce - ____________________________________sorvete/picole/chup-chup -____________________________pao doce/sal - _______________________________________fruta - ______ ______________________________________queijo - _____________________________________________leite com/sem acucar - _______________________________chocolate (Nescau, Toddy, etc) - _____________________refrigerante -________________________________________suco de fruta com/sem acucar - _______________________cafe com/sem acucar - ________________________________cha com/sem acucar - _________________________________
271
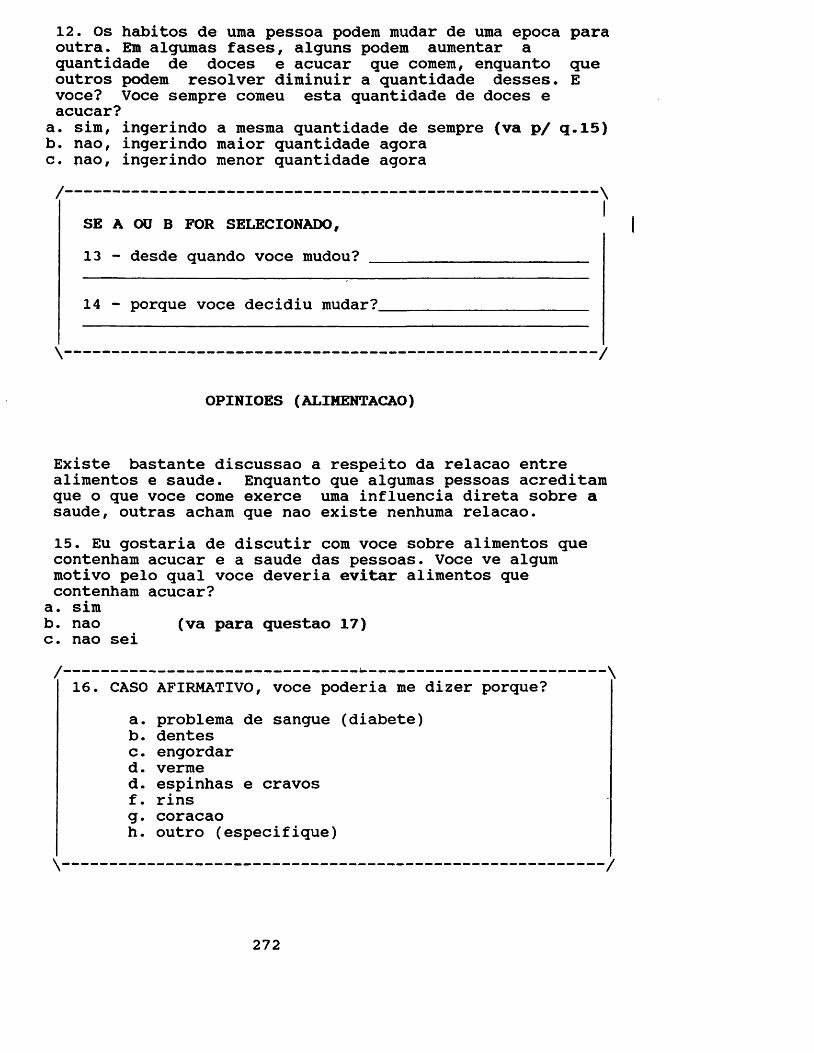
12. Os habitos de uma pessoa podem mudar de uma epoca paraoutra. Em algumas fases, alguns podem aumentar aquantidade de doces e acucar que comem, enquanto que outros podem resolver diminuir a quantidade desses. E voce? Voce sempre comeu esta quantidade de doces e acucar?
a. sim, ingerindo a roesma quantidade de sempre (va p/ q.15)b. nao, ingerindo maior quantidade agorac. nao, ingerindo menor quantidade agora
SE A OU B FOR SELECIONADO,13 - desde quando voce mudou?
14 - porque voce decidiu mudar?.
\ /
OPINIOES (ALIMENTACAO)
Existe bastante discussao a respeito da relacao entre alimentos e saude. Enquanto que algumas pessoas acreditam que o que voce come exerce uma influencia direta sobre a saude, outras acham que nao existe nenhuma relacao.15. Eu gostaria de discutir com voce sobre alimentos que contenham acucar e a saude das pessoas. Voce ve algum motivo pelo qual voce deveria evitar alimentos que contenham acucar?a. simb. nao (va para questao 17)c. nao sei
16. CASO AFIRMATIVO, voce poderia me dizer porque?a. problema de sangue (diabete)b. dentesc. engordard. vermed. espinhas e cravosf. rinsg- coracaoh. outro (especifique)
272
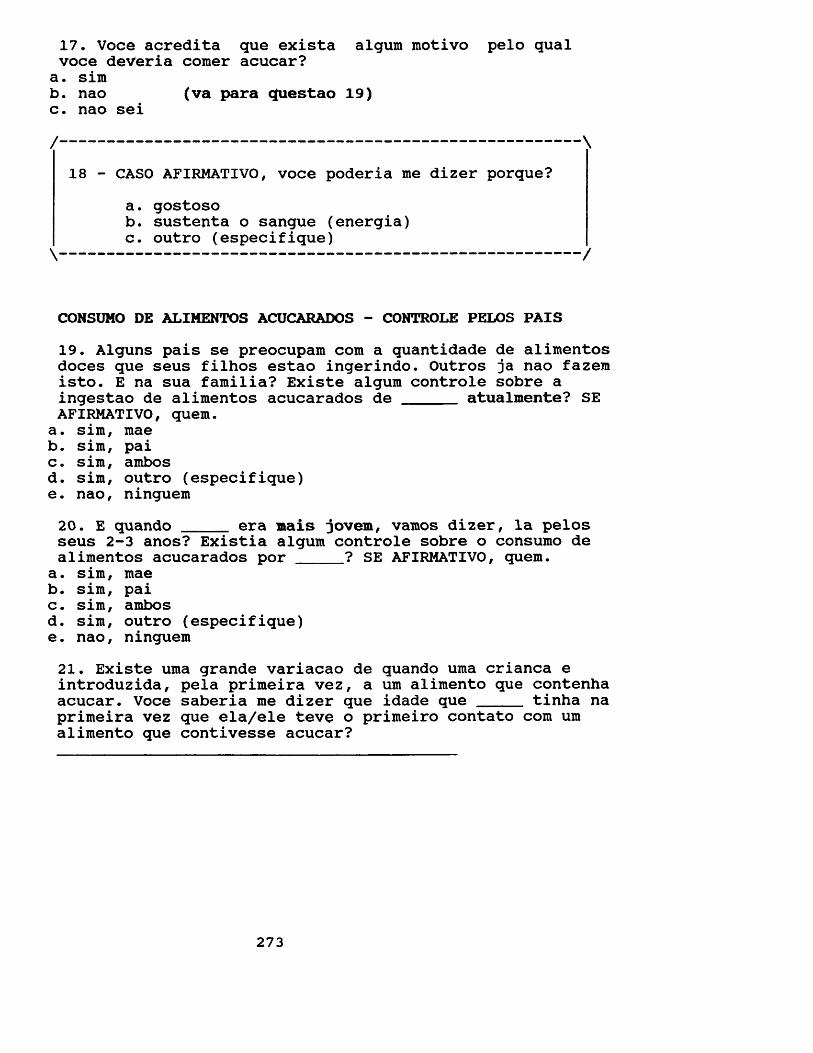
17. Voce acredita que exista algum motivo pelo qual voce deveria comer acucar?a. simb. nao (va para questao 19)c. nao sei/-----------------------------------------------------------------
18 - CASO AFIRMATIVO, voce poderia me dizer porque?a. gostosob. sustenta o sangue (energia)c. outro (especifique)
CONSUMO DE ALIMENTOS ACUCARADOS - CONTROLE PELOS PAIS19. Alguns pais se preocupam com a quantidade de alimentos doces que seus filhos estao ingerindo. Outros ja nao fazem isto. E na sua familia? Existe algum controle sobre aingestao de alimentos acucarados de _____ atualmente? SEAFIRMATIVO, quem.a. sim, maeb. sim, paic. sim, ambosd. sim, outro (especifique)e. nao, ninguem20. E quando ____ era mais jovem, vamos dizer, la pelosseus 2-3 anos? Existia algum controle sobre o consumo de alimentos acucarados por _____? SE AFIRMATIVO, quem.a. sim, maeb. sim, paic. sim, ambosd. sim, outro (especifique)e. nao, ninguem21. Existe uma grande variacao de quando uma crianca e introduzida, pela primeira vez, a um alimento que contenhaacucar. Voce saberia me dizer que idade que ____ tinha naprimeira vez que ela/ele teve o primeiro contato com um alimento que contivesse acucar?
273
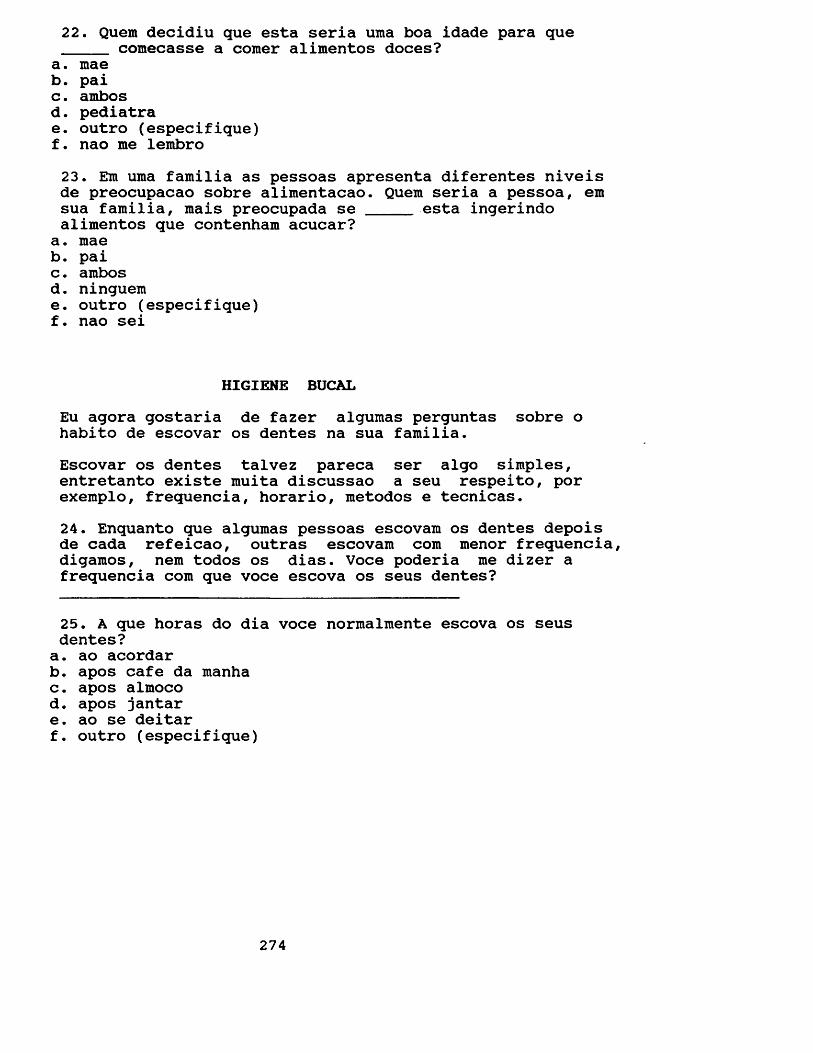
22. Quem decidiu que esta seria uma boa idade para que comecasse a comer alimentos doces?a. maeb. paic. ambosd. pediatrae. outro (especifique)f. nao me lembro23. Em uma familia as pessoas apresenta diferentes niveis de preocupacao sobre alimentacao. Quem seria a pessoa, emsua familia, mais preocupada se _____ esta ingerindoalimentos que contenham acucar?
a. maeb. paic. ambosd. ningueme. outro (especifique)f. nao sei
HIGIENE BUCALEu agora gostaria de fazer algumas perguntas sobre o habito de escovar os dentes na sua familia.Escovar os dentes talvez pareca ser algo simples, entretanto existe muita discussao a seu respeito, por exemplo, frequencia, horario, metodos e tecnicas.24. Enquanto que algumas pessoas escovam os dentes depois de cada refeicao, outras escovam com menor frequencia, digamos, nem todos os dias. Voce poderia me dizer a frequencia com que voce escova os seus dentes?
25. A que horas do dia voce normalmente escova os seus dentes?a. ao acordarb. apos cafe da manhac. apos almocod. apos jantare. ao se deitarf. outro (especifique)
274
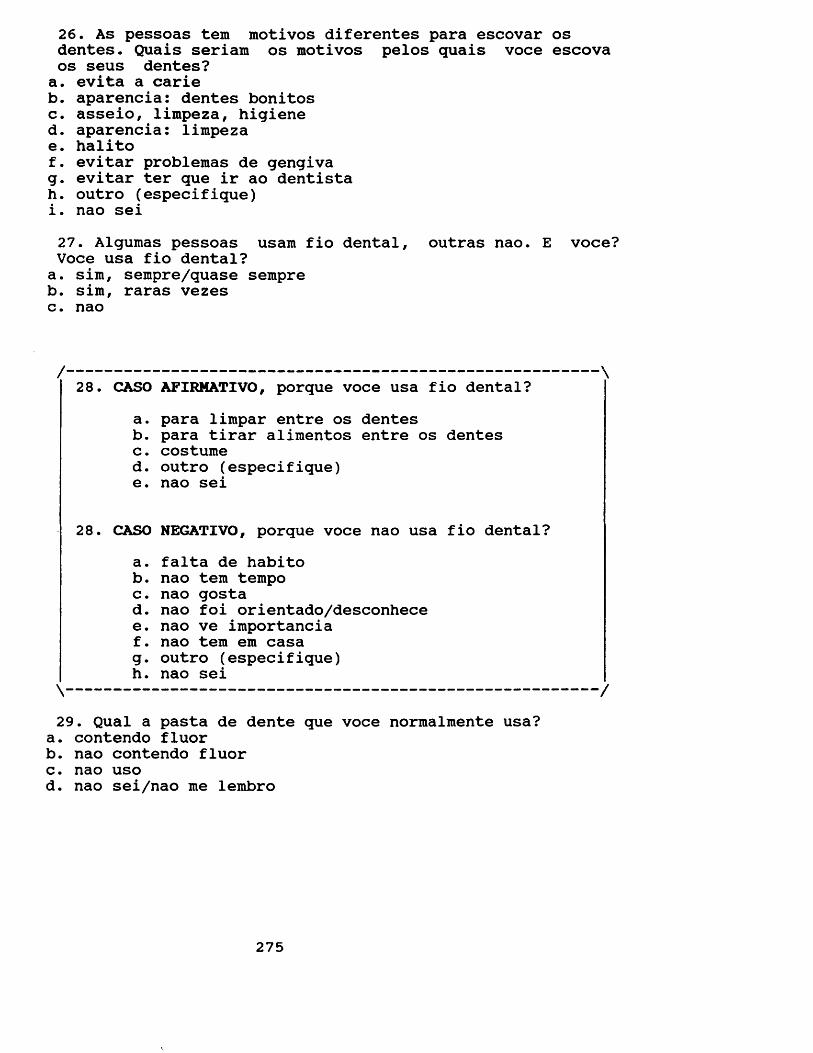
26. As pessoas tem motivos diferentes para escovar os dentes. Quais seriam os motivos pelos quais voce escova os seus dentes?a. evita a carieb. aparencia: dentes bonitosc. asseio, lirapeza, higiened. aparencia: limpezae. halitof. evitar problemas de gengivag. evitar ter que ir ao dentistah. outro (especifique)i. nao sei27. Algumas pessoas usam fio dental, outras nao. E voce? Voce usa fio dental?a. sim, sempre/quase sempreb. sim, raras vezesc. nao
/ \28. CASO AFIRMATIVO, porque voce usa fio dental?
a. para limpar entre os dentesb. para tirar alimentos entre os dentesc. costumed. outro (especifique)e. nao sei
28. CASO NEGATIVO, porque voce nao usa fio dental?a. falta de habitob. nao tem tempoc. nao gostad. nao foi orientado/desconhecee. nao ve importanciaf. nao tem em casag. outro (especifique)h. nao sei\ /
29. Qual a pasta de dente que voce normalmente usa?a. contendo fluorb. nao contendo fluorc. nao usod. nao sei/nao me lembro
275
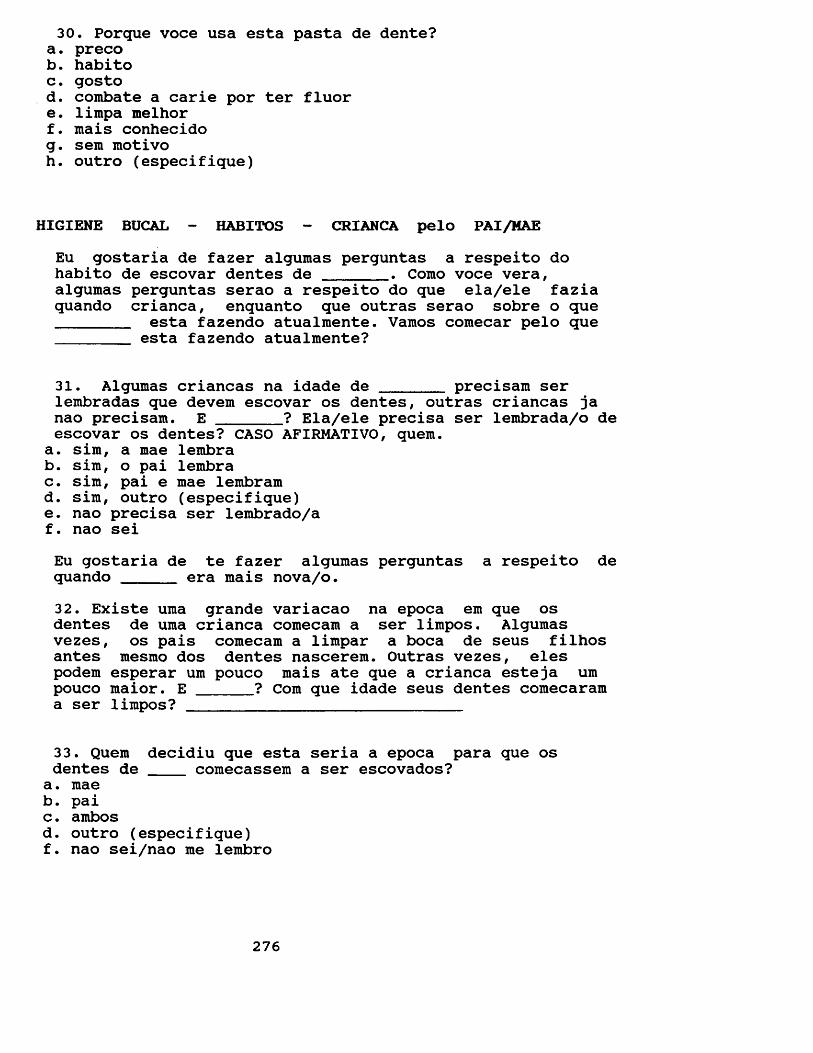
30. Porque voce usa esta pasta de dente?a. precob. habitoc. gostod. combate a carie por ter fluore. limpa melhorf. mais conhecidog. sem motivoh. outro (especifique)
HIGIENE BUCAL - HABITOS - CRIANCA pelo PAI/MAEEu gostaria de fazer algumas perguntas a respeito dohabito de escovar dentes de _______ . Como voce vera,algumas perguntas serao a respeito do que ela/ele faziaquando crianca, enquanto que outras serao sobre o que________ esta fazendo atualmente. Vamos comecar pelo que_______ esta fazendo atualmente?
31. Algumas criancas na idade de ______ precisam serlembradas que devem escovar os dentes, outras criancas janao precisam. E _______? Ela/ele precisa ser lembrada/o deescovar os dentes? CASO AFIRMATIVO, quern.
a. sira, a mae lembrab. sim, o pai lembrac. sim, pai e mae lembramd. sim, outro (especifique)e. nao precisa ser lembrado/af. nao seiEu gostaria de te fazer algumas perguntas a respeito de quando _____ era mais nova/o.32. Existe uma grande variacao na epoca em que os dentes de uma crianca comecam a ser limpos. Algumas vezes, os pais comecam a limpar a boca de seus filhos antes mesmo dos dentes nascerem. Outras vezes, eles podem esperar um pouco mais ate que a crianca esteja umpouco maior. E ______? Com que idade seus dentes comecarama ser limpos? ____________________________
33. Quem decidiu que esta seria a epoca para que os dentes de ____ comecassem a ser escovados?a. maeb. paic. ambosd. outro (especifique)f. nao sei/nao me lembro
276
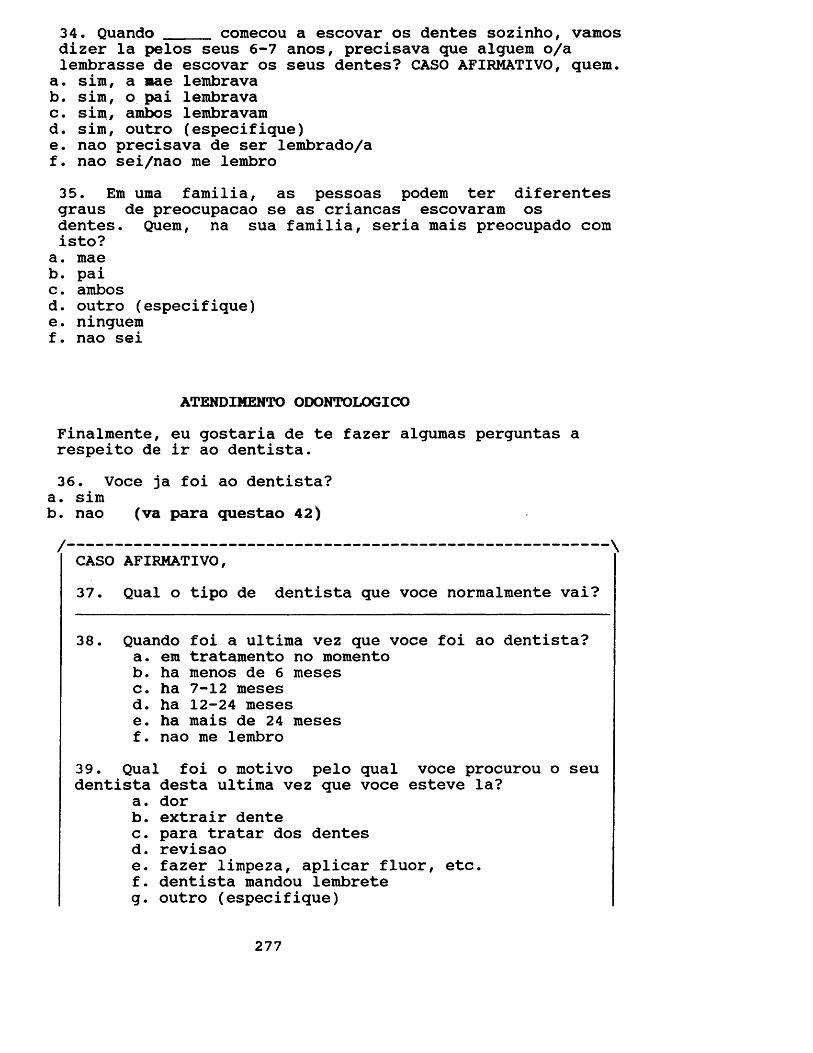
34. Quando _____ comecou a escovar os dentes sozinho, vamosdizer la pelos seus 6-7 anos, precisava que alguem o/a lembrasse de escovar os seus dentes? CASO AFIRMATIVO, quern.
a. sim, a mae lembravab. sim, o pai lembravac. sim, ambos lembravamd. sim, outro (especifique)e. nao precisava de ser lembrado/af. nao sei/nao me lembro35. Em uma familia, as pessoas podem ter diferentes graus de preocupacao se as criancas escovaram os dentes. Quem, na sua familia, seria mais preocupado com isto?
a. maeb. paic. ambosd. outro (especifique)e. ninguemf. nao sei
ATENDIMENTO ODONTOLOGICOFinalmente, eu gostaria de te fazer algumas perguntas a respeito de ir ao dentista.36. Voce ja foi ao dentista?
a. simb. nao (va para questao 42)/ \CASO AFIRMATIVO,37. Qual o tipo de dentista que voce normalmente vai?
38. Quando foi a ultima vez que voce foi ao dentista?a. em tratamento no momentob. ha menos de 6 mesesc. ha 7-12 mesesd. ha 12-24 mesese. ha mais de 24 mesesf. nao me lembro
39. Qual foi o motivo pelo qual voce procurou o seu dentista desta ultima vez que voce esteve la?
a. dorb. extrair dentec. para tratar dos dentesd. revisaoe. fazer limpeza, aplicar fluor, etc.f. dentista mandou lembreteg. outro (especifique)
277
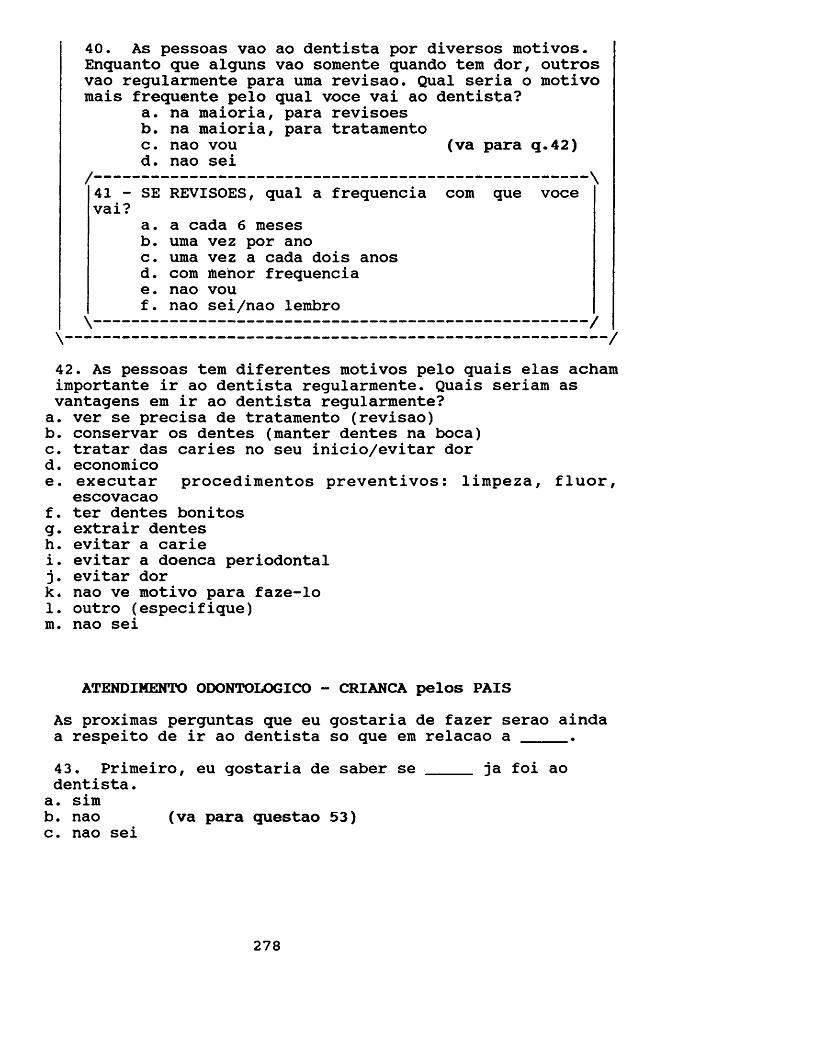
40. As pessoas vao ao dentista por diversos motivos. Enquanto que alguns vao somente quando tern dor, outros vao regularmente para uma revisao. Qual seria o motivo mais frequente pelo qual voce vai ao dentista?
a. na maioria, para revisoesb. na maioria, para tratamentoc. nao vou (va para q.42)d. nao sei
/ \41 - SE REVISOES, qual a frequencia com que vocevai
a. a cada 6 mesesb. uma vez por anoc. uma vez a cada dois anosd. com mehor frequenciae. nao vouf. nao sei/nao lembro \ /
\ /
42. As pessoas tern diferentes motivos pelo quais elas acham importante ir ao dentista regularmente. Quais seriam as vantagens em ir ao dentista regularmente?a. ver se precisa de tratamento (revisao)b. conservar os dentes (manter dentes na boca)c. tratar das caries no seu inicio/evitar dord. economicoe. executar procedimentos preventivos: limpeza, fluor,
escovacaof. ter dentes bonitosg. extrair dentesh. evitar a cariei. evitar a doenca periodontal j. evitar dork* nao ve motivo para faze-lo1. outro (especifique) m. nao sei
ATENDIMENTO ODONTOLOGICO - CRIANCA pelos PAISAs proximas perguntas que eu gostaria de fazer serao ainda a respeito de ir ao dentista so que em relacao a _____.43. Primeiro, eu gostaria de saber se _____ ja foi aodentista.a. simb. nao (va para questao 53)c. nao sei
278
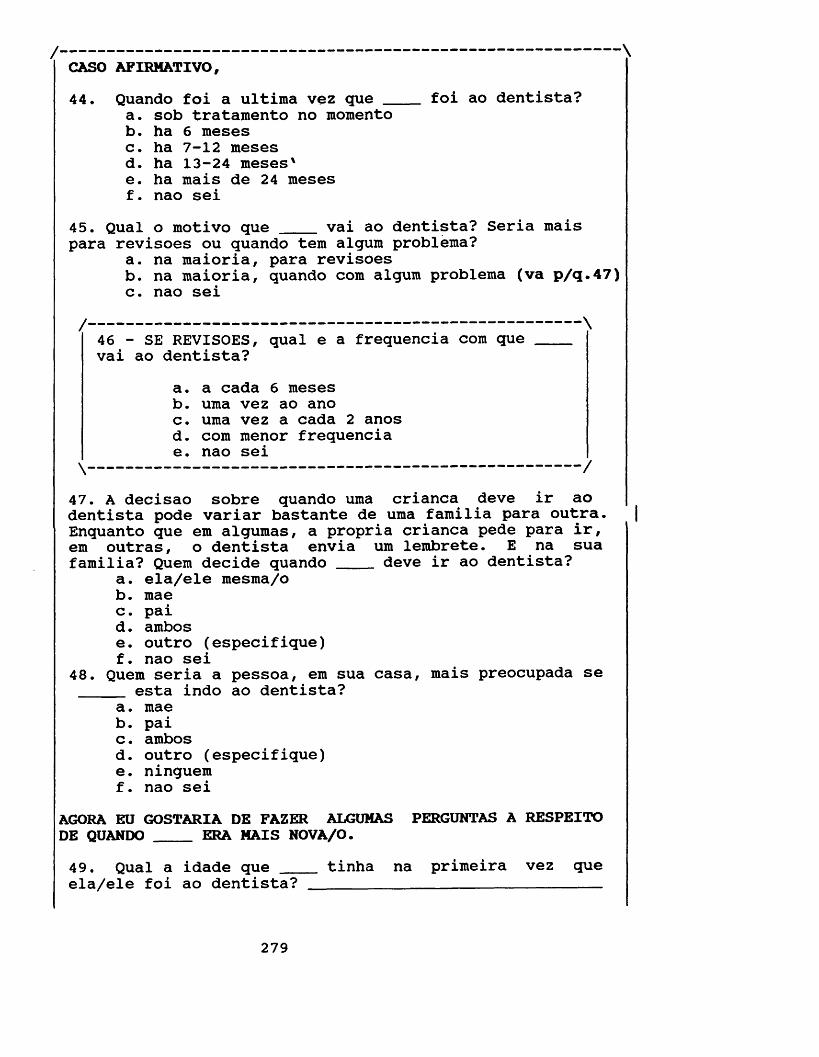
/ \CASO AFIRMATIVO,44. Quando foi a ultima vez que ____ foi ao dentista?
a. sob tratamento no momentob. ha 6 mesesc. ha 7-12 mesesd. ha 13-24 meses'e. ha mais de 24 mesesf. nao sei
45. Qual o motivo que ____ vai ao dentista? Seria maispara revisoes ou quando tem algum problema?
a. na maioria, para revisoesb. na maioria, quando com algum problema (va p/q.47)c. nao sei
/--------------------------------------------------- \46 - SE REVISOES, qual e a frequencia com que ____vai ao dentista?
a. a cada 6 mesesb. uma vez ao anoc. uma vez a cada 2 anosd. com menor frequenciae. nao sei
\----------------------------------------------- /47. A decisao sobre quando uma crianca deve ir ao dentista pode variar bastante de uma familia para outra. Enquanto que em algumas, a propria crianca pede para ir, em outras, o dentista envia um lembrete. E na sua familia? Quern decide quando ____ deve ir ao dentista?
a. ela/ele mesma/ob. maec. paid . ambose. outro (especifique)f. nao sei
48. Quern seria a pessoa, em sua casa, mais preocupada se esta indo ao dentista?
a. maeb. paic. ambosd. outro (especifique)e. ninguemf. nao sei
AGORA EU GOSTARIA DE FAZER ALGUMAS PERGUNTAS A RESPEITO DE QUANDO ____ ERA MAIS NOVA/O.49. Qual a idade que ____ tinha na primeira vez queela/ele foi ao dentista?____________________ __________
279
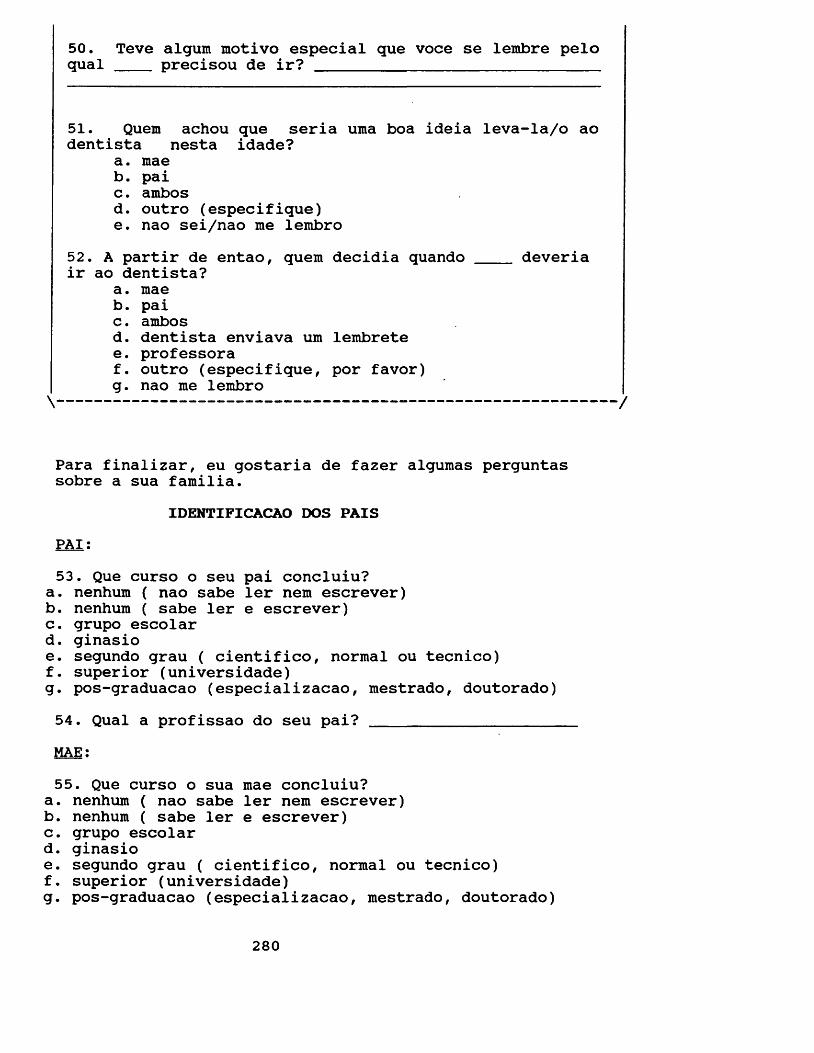
50. Teve algum motivo especial que voce se lembre pelo qual precisou de ir?______________________________
51. Quern achou que seria uma boa ideia leva-la/o ao dentista nesta idade?
a. maeb. paic. ambosd. outro (especifique)e. nao sei/nao me lembro
52. A partir de entao, quern decidia quando ____ deveriair ao dentista?
a. maeb. paic. ambosd. dentista enviava um lembretee. professoraf. outro (especifique, por favor)g. nao me lembro \ /
Para finalizar, eu gostaria de fazer algumas perguntas sobre a sua familia.
IDENTIFICACAO DOS PAISPAI:53. Que curso o seu pai concluiu?
a. nenhum ( nao sabe ler nem escrever)b. nenhum ( sabe ler e escrever)c. grupo escolard. ginasioe. segundo grau ( cientifico, normal ou tecnico)f. superior (universidade)g. pos-graduacao (especializacao, mestrado, doutorado)54. Qual a profissao do seu pai? ___________________MAE:55. Que curso o sua mae concluiu?
a. nenhum ( nao sabe ler nem escrever)b. nenhum ( sabe ler e escrever)c. grupo escolard. ginasioe. segundo grau ( cientifico, normal ou tecnico)f. superior (universidade)g. pos-graduacao (especializacao, mestrado, doutorado)
280
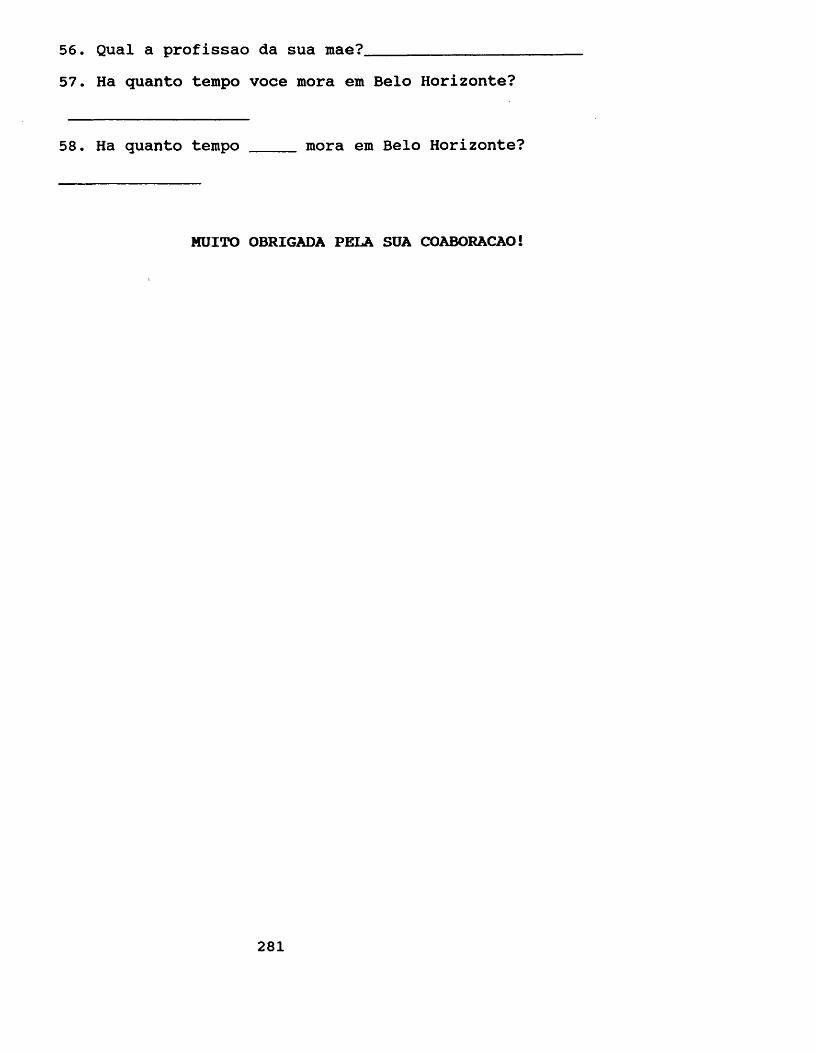
56. Qual a profissao da sua mae?_______________57. Ha quanto tempo voce mora em Belo Horizonte?
58. Ha quanto tempo ____ mora em Belo Horizonte?
MUITO OBRIGADA PELA SUA COABORACAO!
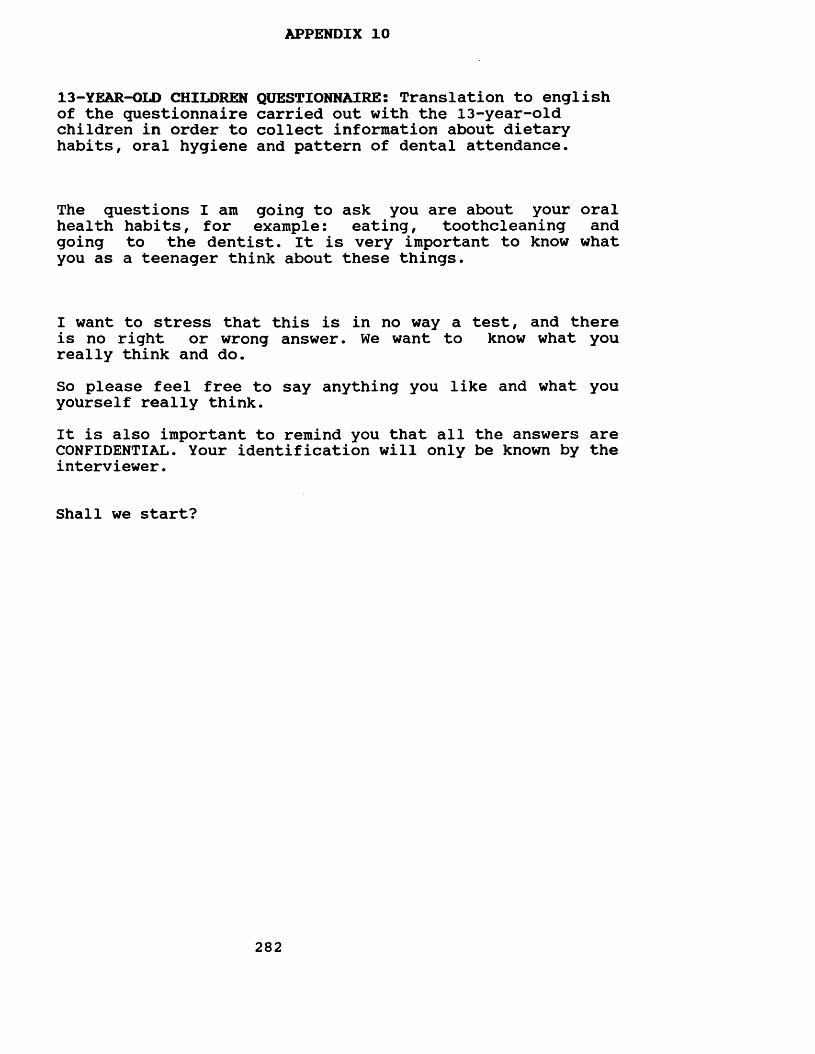
APPENDIX 10
13-YEAR-OLD CHILDREN QUESTIONNAIRES Translation to english of the questionnaire carried out with the 13-year-old children in order to collect information about dietary habits, oral hygiene and pattern of dental attendance.
The questions I am going to ask you are about your oral health habits, for example: eating, toothcleaning andgoing to the dentist. It is very important to know what you as a teenager think about these things.
I want to stress that this is in no way a test, and there is no right or wrong answer. We want to know what you really think and do.So please feel free to say anything you like and what you yoUrself really think.It is also important to remind you that all the answers are CONFIDENTIAL. Your identification will only be known by the interviewer.
Shall we start?
282
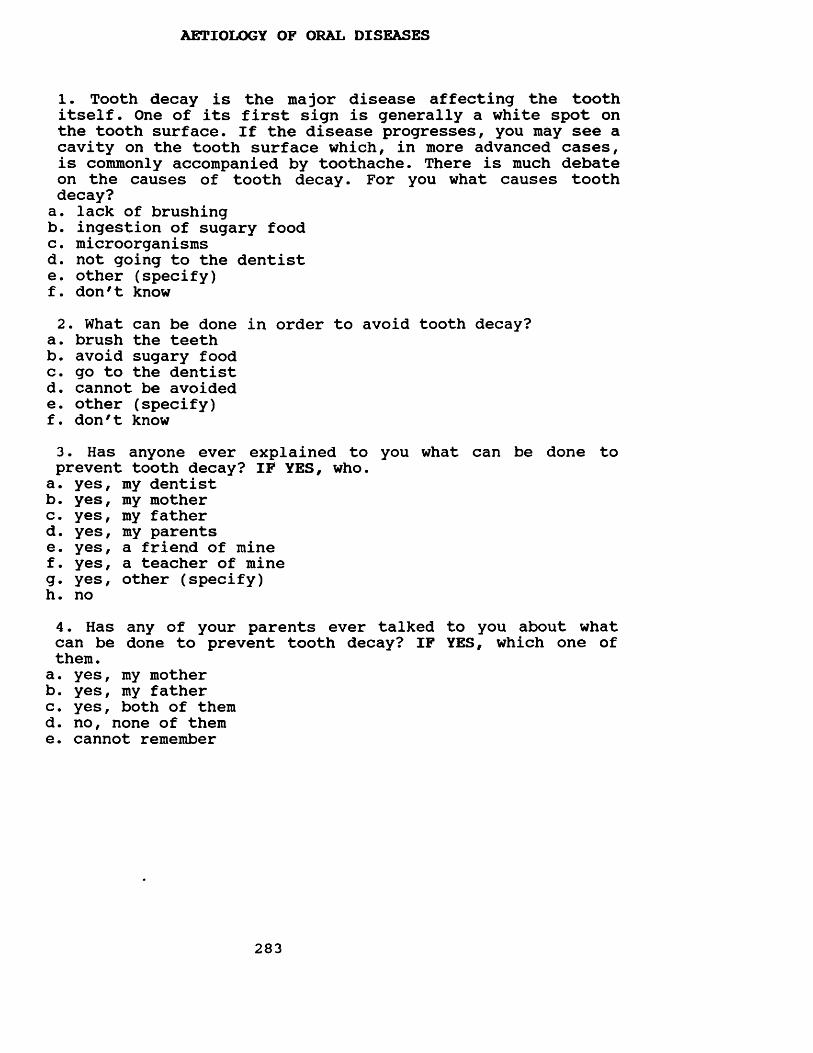
AETIOLOGY OF ORAL DISEASES
1. Tooth decay is the major disease affecting the tooth itself. One of its first sign is generally a white spot on the tooth surface. If the disease progresses, you may see a cavity on the tooth surface which, in more advanced cases, is commonly accompanied by toothache. There is much debate on the causes of tooth decay. For you what causes tooth decay?a. lack of brushingb. ingestion of sugary foodc. microorganismsd. not going to the dentiste. other (specify)f. don't know2. What can be done in order to avoid tooth decay?
a. brush the teethb. avoid sugary foodc. go to the dentistd. cannot be avoidede. other (specify)f. don't know3. Has anyone ever explained to you what can be done to prevent tooth decay? IF YES, who.a. yes, my dentistb. yes, my motherc. yes, my fatherd. yes, my parentse. yes, a friend of minef. yes, a teacher of mineg. yes, other (specify)h. no4. Has any of your parents ever talked to you about whatcan be done to prevent tooth decay? IF YES, which one ofthem.a. yes, my motherb. yes, my fatherc. yes, both of themd. no, none of theme. cannot remember
283
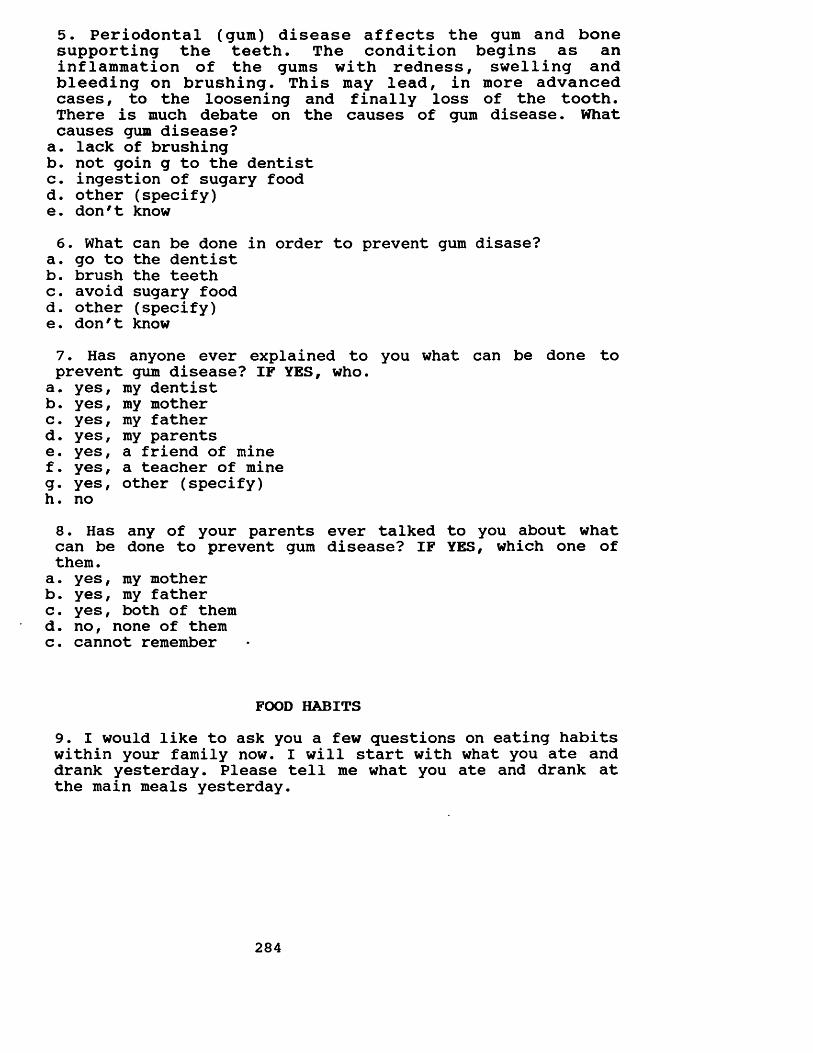
5. Periodontal (gum) disease affects the gum and bone supporting the teeth. The condition begins as an inflammation of the gums with redness, swelling and bleeding on brushing. This may lead, in more advanced cases, to the loosening and finally loss of the tooth. There is much debate on the causes of gum disease. What causes gum disease?a. lack of brushingb. not goin g to the dentistc. ingestion of sugary foodd. other (specify)e. don't know6. What can be done in order to prevent gum disase?
a. go to the dentistb. brush the teethc. avoid sugary foodd. other (specify)e. don't know7. Has anyone ever explained to you what can be done to prevent gum disease? IF YES, who.
a. yes, my dentistb. yes, my motherc. yes, my fatherd. yes, my parentse. yes, a friend of minef. yes, a teacher of mineg. yes, other (specify)h. no8. Has any of your parents ever talked to you about whatcan be done to prevent gum disease? IF YES, which one ofthem.
a. yes, my motherb. yes, my fatherc. yes, both of themd. no, none of themc. cannot remember
FOOD HABITS9. I would like to ask you a few questions on eating habits within your family now. I will start with what you ate and drank yesterday. Please tell me what you ate and drank at the main meals yesterday.
284
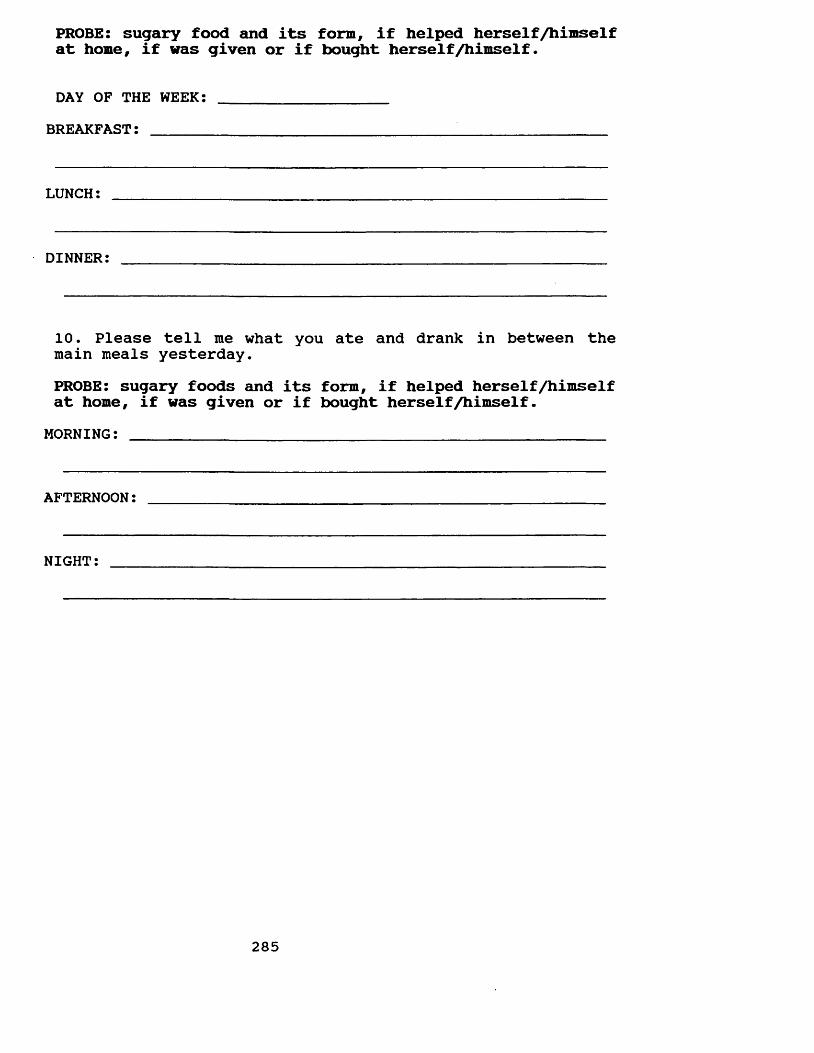
PROBE: sugary food and its form, if helped herself /himself at home, if was given or if bought herself/himself.
DAY OF THE WEEK: ___________________BREAKFAST: ________________________________'_______________
LUNCH:
DINNER:
10. Please tell me what you ate and drank in between the main meals yesterday.PROBE: sugary foods and its form, if helped herself/himself at home, if was given or if bought herself/himself.
MORNING: _________________________________________________
AFTERNOON:
NIGHT:
285
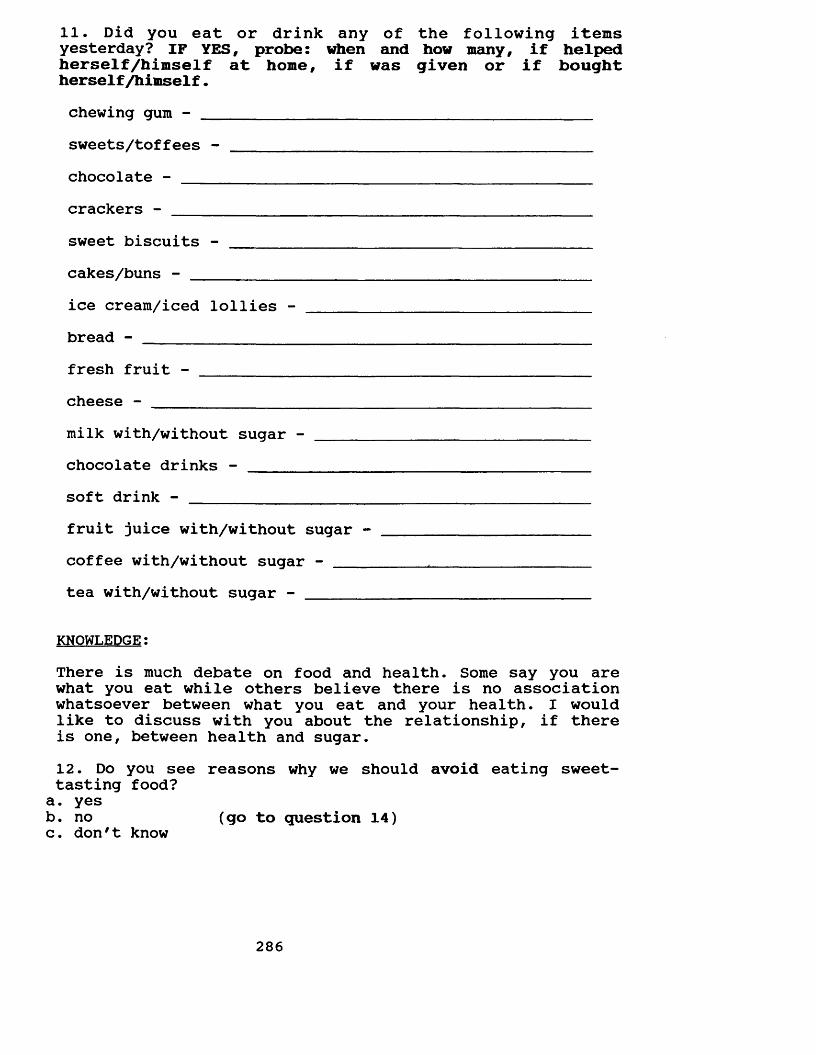
11. Did you eat or drink any of the following items yesterday? IF YES, probe: when and how many, if helped herself /himself at home, if was given or if bought herself/himself.chewing gum - ________________________________________sweets/toffees - _____________________________________chocolate - _______ _____________________________crackerssweet biscuits -cakes/buns - ___________ice cream/iced lollies - bread - ________________fresh fruit -cheese -milk with/without sugar - chocolate drinks - ______soft drink -fruit juice with/without sugar -coffee with/without sugar - ____tea with/without sugar - _______
KNOWLEDGE:There is much debate on food and health. Some say you are what you eat while others believe there is no association whatsoever between what you eat and your health. I would like to discuss with you about the relationship, if there is one, between health and sugar.12. Do you see reasons why we should avoid eating sweet- tasting food?a. yesb. no (go to question 14)c. don't know
286
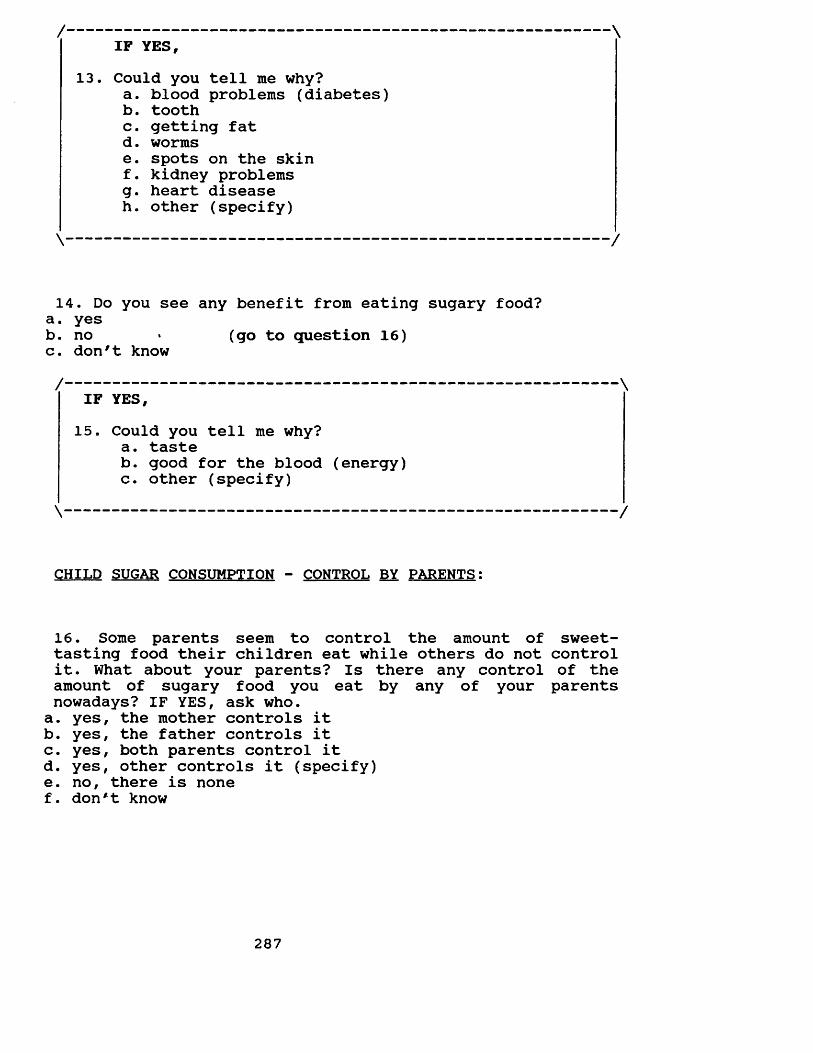
/-------------------------------------------------------- \IF YES,
13. Could you tell me why?a. blood problems (diabetes)b . toothc. getting fatd. wormse. spots on the skinf. kidney problemsg. heart diseaseh. other (specify)
\-------------------------------------------------------- /
14. Do you see any benefit from eating sugary food?a. yesb. no » (go to question 16)c. don't know/------------------------------------------------------------
IF YES,15. Could you tell me why?
a. tasteb. good for the blood (energy)c. other (specify)
CHILD SUGAR CONSUMPTION - CONTROL BY PARENTS:
16. Some parents seem to control the amount of sweet- tasting food their children eat while others do not control it. What about your parents? Is there any control of the amount of sugary food you eat by any of your parents nowadays? IF YES, ask who.a. yes, the mother controls itb. yes, the father controls itc. yes, both parents control itd. yes, other controls it (specify)e. no, there is nonef. don*t know
287
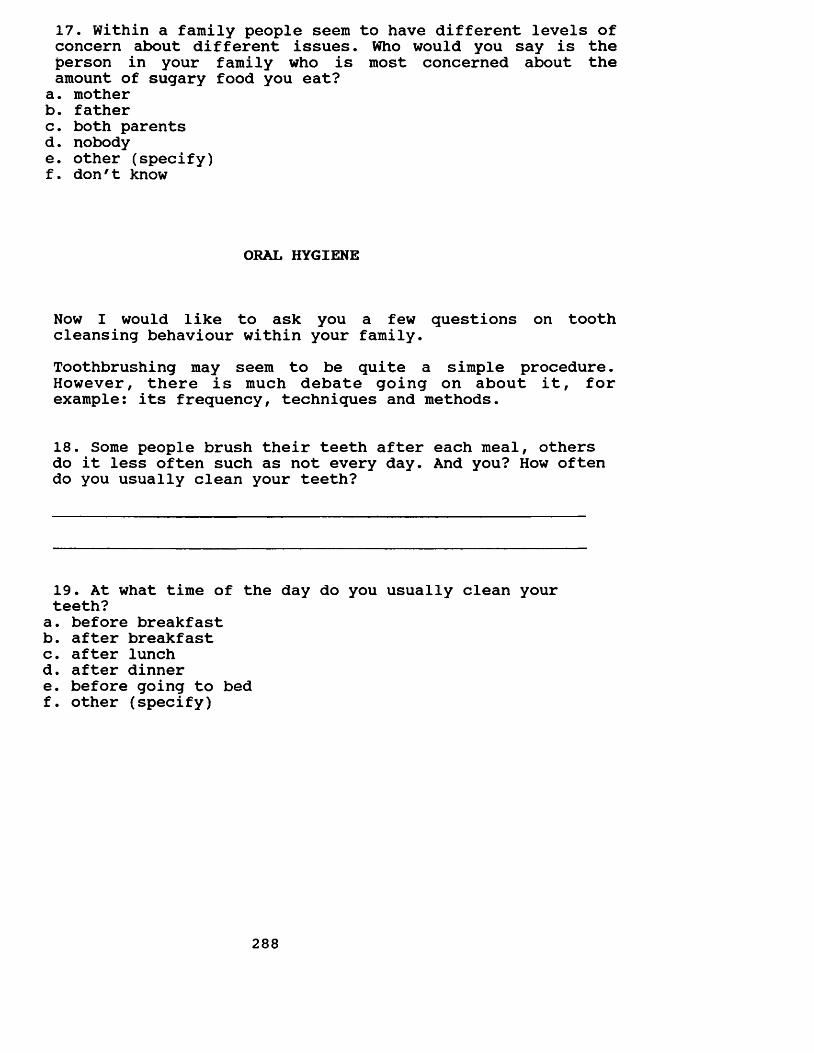
17. Within a family people seem to have different levels of concern about different issues. Who would you say is the person in your family who is most concerned about the amount of sugary food you eat?a. motherb. fatherc. both parentsd. nobodye. other (specify)f. don'1 know
ORAL HYGIENE
Now I would like to ask you a few questions on tooth cleansing behaviour within your family.Toothbrushing may seem to be quite a simple procedure. However, there is much debate going on about it, for example: its frequency, techniques and methods.
18. Some people brush their teeth after each meal, others do it less often such as not every day. And you? How often do you usually clean your teeth?
19. At what time of the day do you usually clean your teeth?a. before breakfastb. after breakfastc. after lunchd. after dinnere. before going to bedf. other (specify)
288
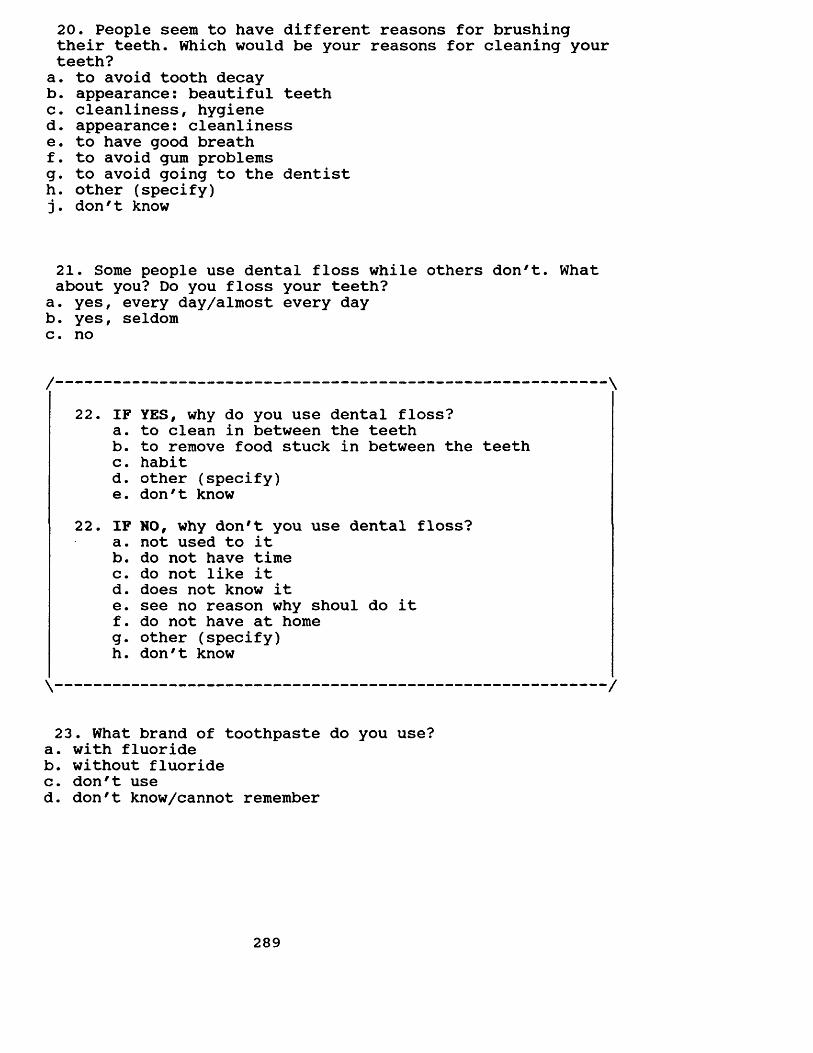
20. People seem to have different reasons for brushing their teeth. Which would be your reasons for cleaning your teeth?
a. to avoid tooth decayb. appearance: beautiful teethc. cleanliness, hygiened. appearance: cleanlinesse. to have good breathf. to avoid gum problemsg. to avoid going to the dentisth. other (specify) j. don't know
21. Some people use dental floss while others don't. What about you? Do you floss your teeth?
a. yes, every day/almost every dayb. yes, seldomc. no
ro • IF YES, why do you use dental floss?a. to clean in between the teethb. to remove food stuck in between the teethc. habitd. other (specify)e. don't know
to to • IF NO, why don't you use dental floss?a. not used to itb. do not have timec. do not like itd. does not know ite. see no reason why shoul do itf. do not have at homeg- other (specify)h. don't know
23. What brand of toothpaste do you use?a. with fluorideb. without fluoridec. don't used. don't know/cannot remember
289
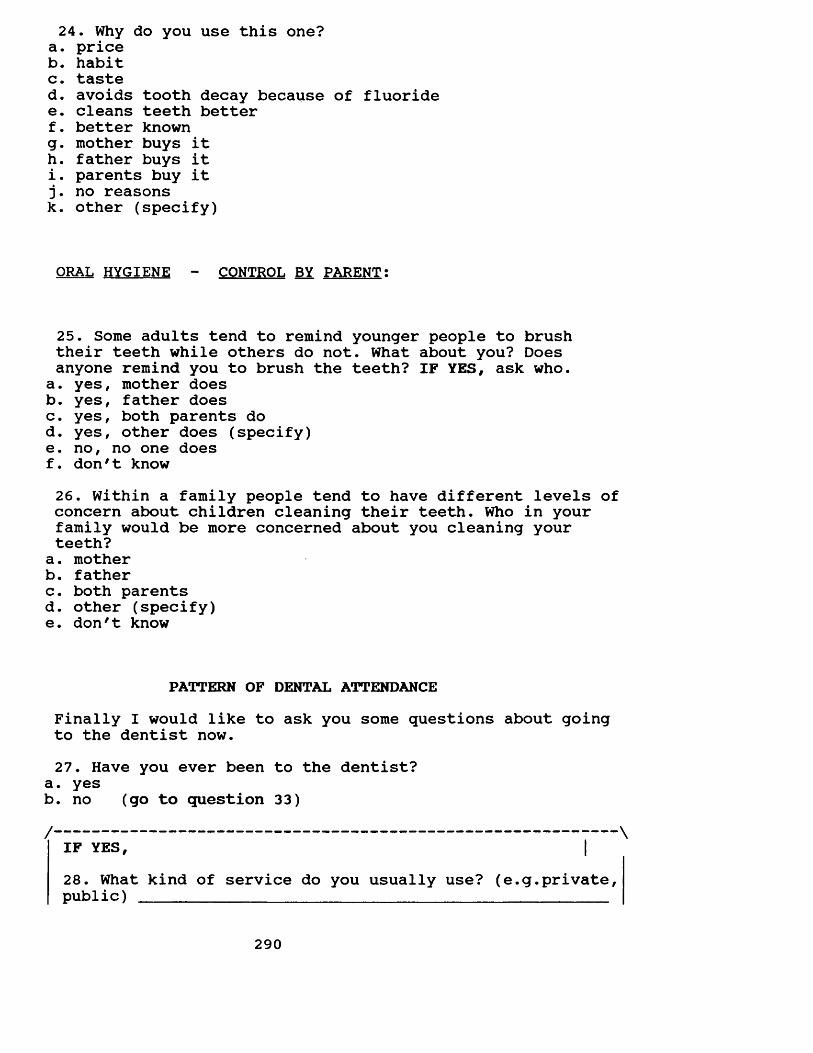
24. Why do you use this one?a. priceb. habitc. tasted. avoids tooth decay because of fluoridee. cleans teeth betterf. better knowng. mother buys ith. father buys iti. parents buy it j. no reasonsk. other (specify)
ORAL HYGIENE - CONTROL BY PARENT:
25. Some adults tend to remind younger people to brush their teeth while others do not. What about you? Doesanyone remind you to brush the teeth? IF YES, ask who.
a. yes, mother doesb. yes, father doesc. yes, both parents dod. yes, other does (specify)e. no, no one doesf. don't know26. Within a family people tend to have different levels of concern about children cleaning their teeth. Who in your family would be more concerned about you cleaning your teeth?a. motherb. fatherc. both parentsd. other (specify)e. don't know
PATTERN OF DENTAL ATTENDANCEFinally I would like to ask you some questions about going to the dentist now.27. Have you ever been to the dentist?
a. yesb. no (go to question 33)/ \
IF YES, |28. What kind of service do you usually use? (e.g.private, public) _________________________________________________
290
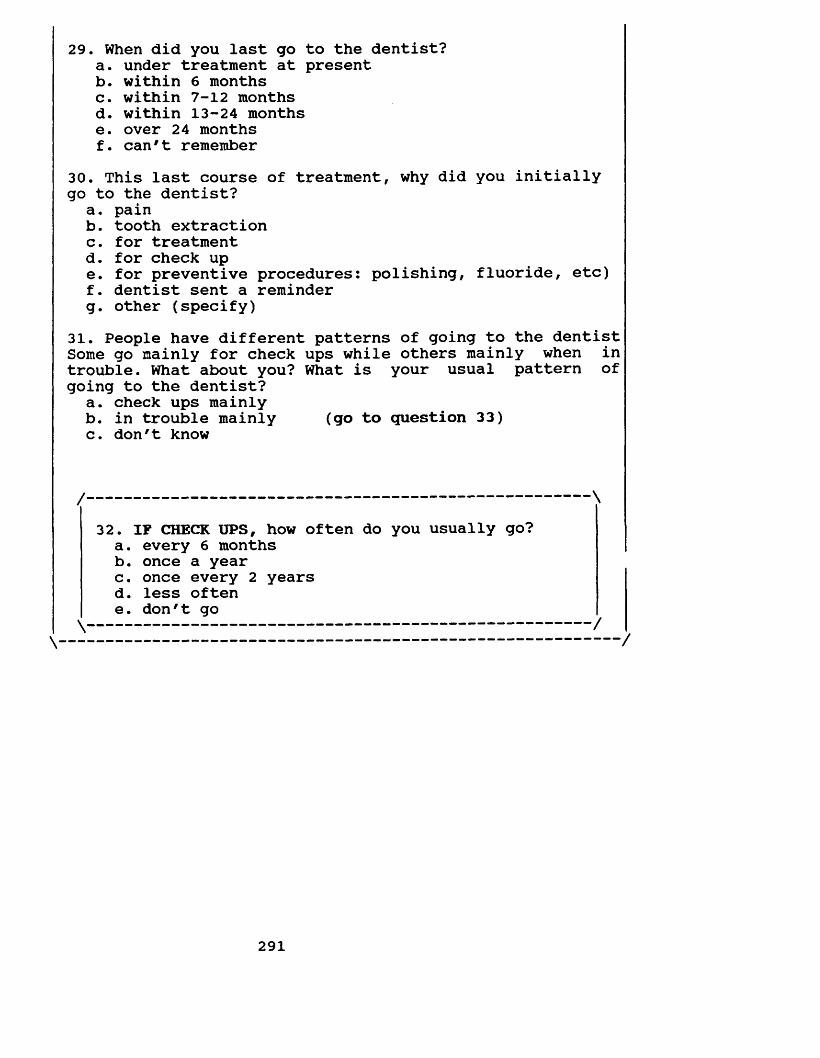
29. When did you last go to the dentist?a. under treatment at presentb. within 6 monthsc. within 7-12 monthsd. within 13-24 monthse. over 24 monthsf. can't remember
30. This last course of treatment, why did you initially go to the dentist?
a. painb. tooth extractionc. for treatmentd. for check upe. for preventive procedures: polishing, fluoride, etc)f. dentist sent a reminderg. other (specify)
31. People have different patterns of going to the dentist Some go mainly for check ups while others mainly when in trouble. What about you? What is your usual pattern of going to the dentist?
a. check ups mainlyb. in trouble mainly (go to question 33)c. don't know
/ \
32. IF CHECK UPS, how often do you usually go?a. every 6 monthsb. once a yearc. once every 2 yearsd. less oftene. don't go
291
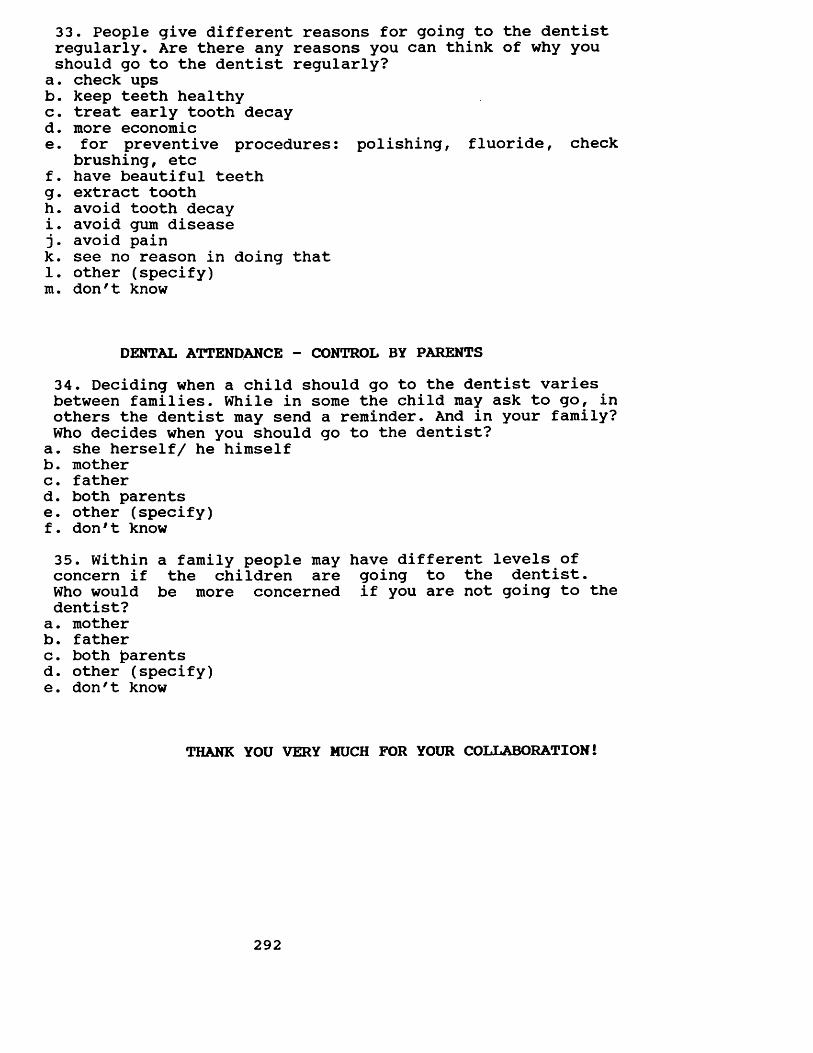
33. People give different reasons for going to the dentist regularly. Are there any reasons you can think of why you should go to the dentist regularly?
a. check upsb. keep teeth healthyc. treat early tooth decayd. more economice. for preventive procedures: polishing, fluoride, check
brushing, etcf. have beautiful teethg . extract toothh. avoid tooth decayi. avoid gum disease j. avoid paink. see no reason in doing that 1. other (specify) m . don9t know
DENTAL ATTENDANCE - CONTROL BY PARENTS34. Deciding when a child should go to the dentist varies between families. While in some the child may ask to go, in others the dentist may send a reminder. And in your family? Who decides when you should go to the dentist?a. she herself/ he himselfb. motherc. fatherd. both parentse. other (specify)f. don91 know35. Within a family people may have different levels of concern if the children are going to the dentist.Who would be more concerned if you are not going to the dentist?
a. motherb. fatherc. both parentsd. other (specify)e. don't know
THANK YOU VERY MUCH FOR YOUR COLLABORATION!
292
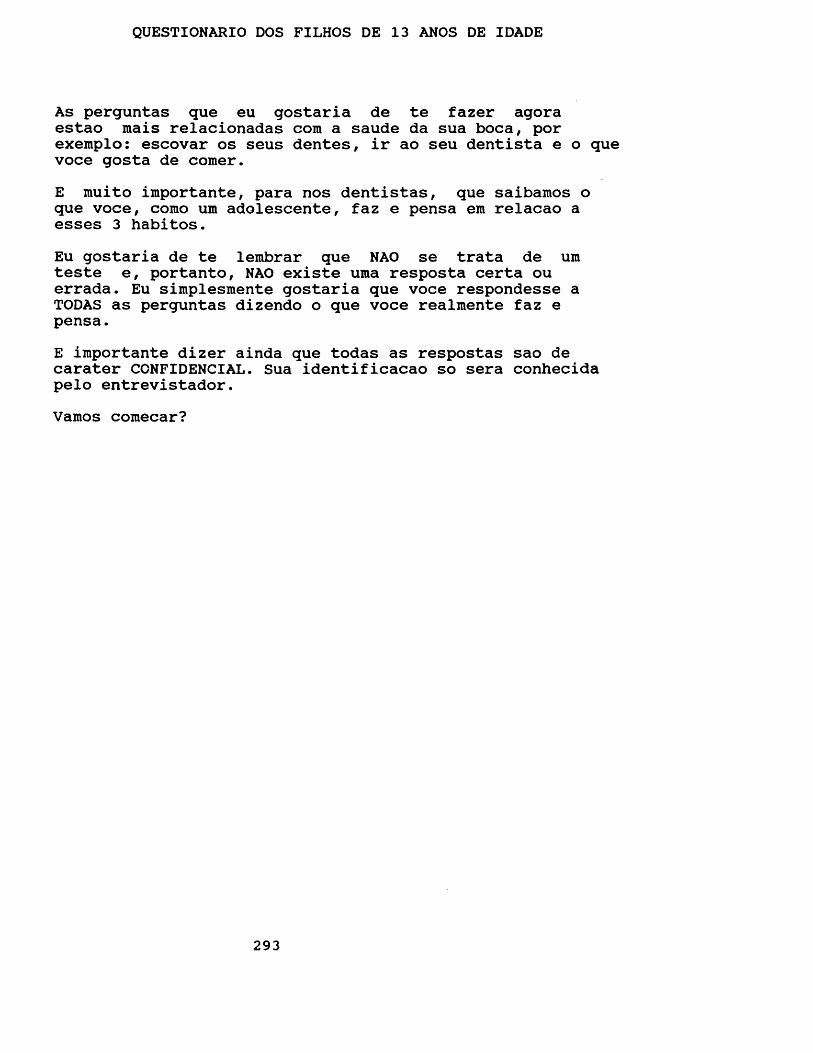
QUESTIONARIO DOS FILHOS DE 13 ANOS DE IDADE
As perguntas que eu gostaria de te fazer agoraestao mais relacionadas com a saude da sua boca, por exemplo: escovar os seus dentes, ir ao seu dentista e o que voce gosta de comer.E muito importante, para nos dentistas, que saibamos o que voce, como um adolescente, faz e pensa em relacao a esses 3 habitos.Eu gostaria de te lembrar que NAO se trata de umteste e, portanto, NAO existe uma resposta certa ou errada. Eu simplesmente gostaria que voce respondesse aTODAS as perguntas dizendo o que voce realmente faz epensa.E importante dizer ainda que todas as respostas sao de carater CCNFIDENCIAL. Sua identificacao so sera conhecida pelo entrevistador.Vamos comecar?
293
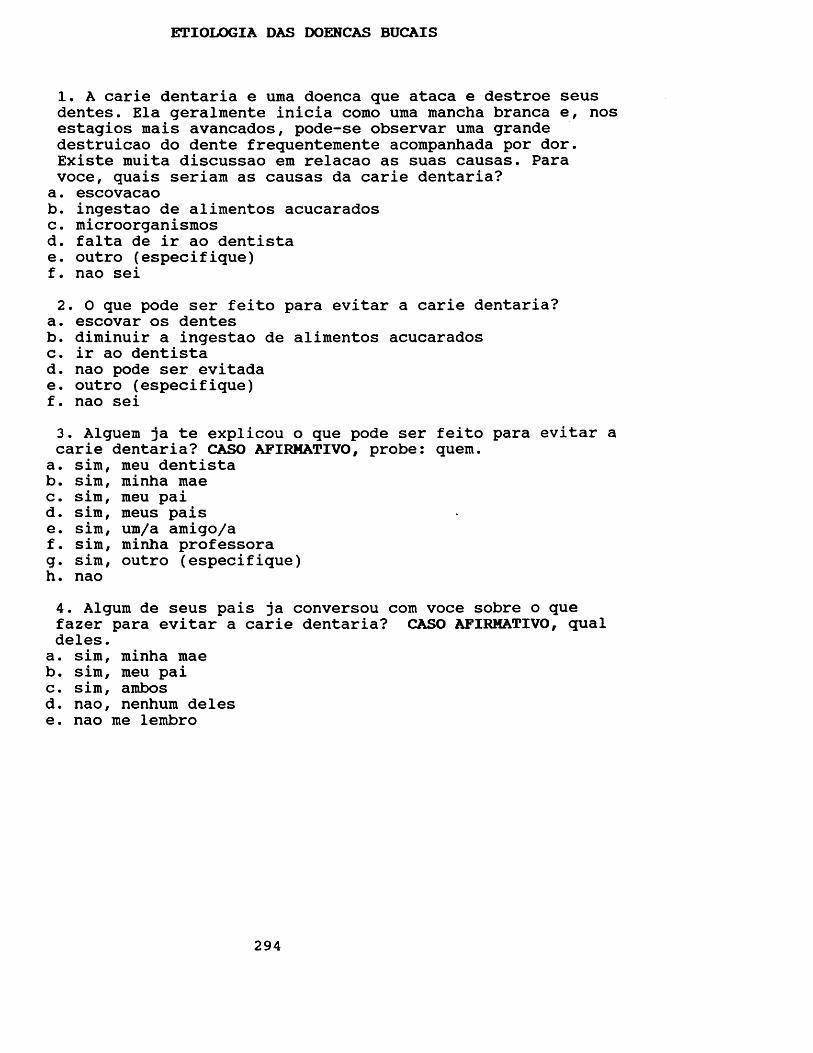
ETIOLOGIA DAS DOENCAS BUCAIS
1. A carie dentaria e uma doenca que ataca e destroe seus dentes. Ela geralmente inicia como uma mancha branca e, nos estagios mais avancados, pode-se observar uma grande destruicao do dente frequentemente acompanhada por dor. Existe muita discussao em relacao as suas causas. Para voce, quais seriam as causas da carie dentaria?a. escovacaob. ingestao de alimentos acucaradosc. microorganismosd. falta de ir ao dentistae. outro (especifique)f. nao sei2. 0 que pode ser feito para evitar a carie dentaria?
a. escovar os dentesb. diminuir a ingestao de alimentos acucaradosc. ir ao dentistad. nao pode ser evitadae. outro (especifique)f. nao sei3. Alguem ja te explicou o que pode ser feito para evitar a carie dentaria? CASO AFIRMATIVO, probe: quem.a. sim, meu dentistab. sim, minha maec. sim, meu paid. sim, meus paise. sim, um/a amigo/af. sim, minha professorag- sim, outro (especifique)h. nao4. Algum de seus pais ja conversou com voce sobre o que fazer para evitar a carie dentaria? CASO AFIRMATIVO, qual deles.a. sim, minha maeb. sim, meu paic. sim, ambosd. nao, nenhum delese. nao me lembro
294
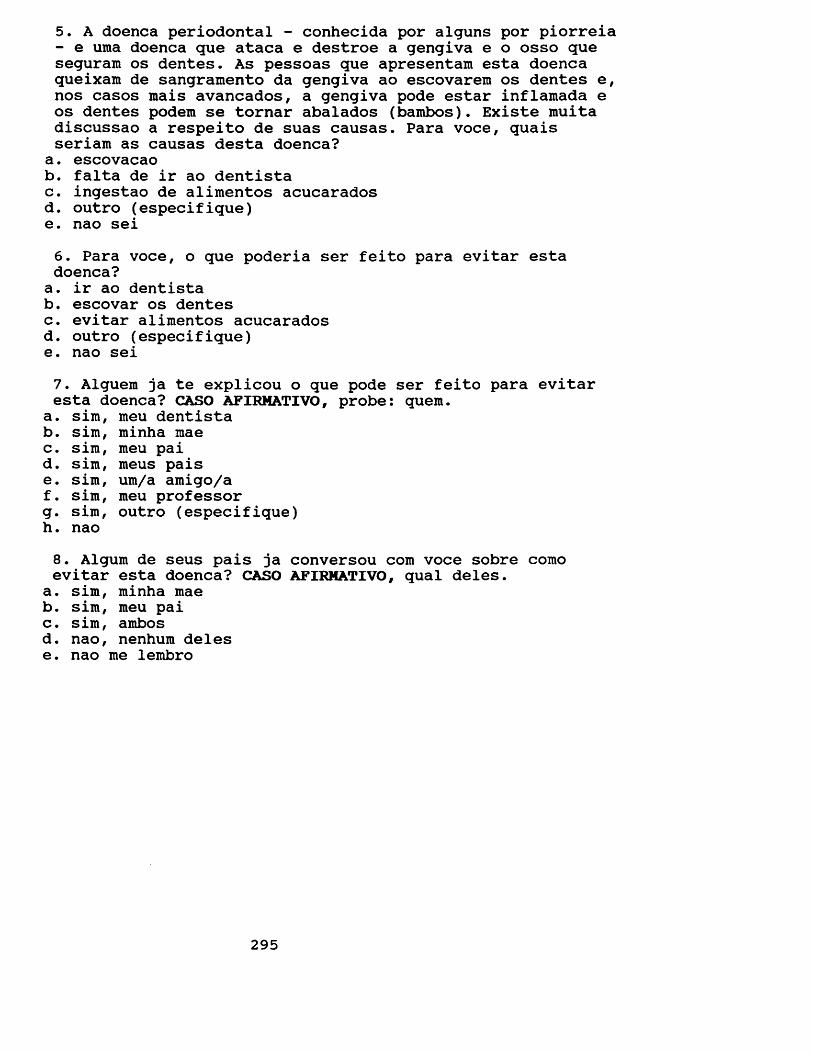
5. A doenca periodontal - conhecida por alguns por piorreia - e uma doenca que ataca e destroe a gengiva e o osso que seguram os dentes. As pessoas que apresentam esta doencaqueixam de sangramento da gengiva ao escovarem os dentes e,nos casos mais avancados, a gengiva pode estar inflamada e os dentes podem se tornar abalados (bambos). Existe muita discussao a respeito de suas causas. Para voce, quais seriam as causas desta doenca?
a. escovacaob. falta de ir ao dentistac. ingestao de alimentos acucaradosd. outro (especifique)e. nao sei6. Para voce, o que poderia ser feito para evitar esta doenca?a. ir ao dentistab. escovar os dentesc. evitar alimentos acucaradosd. outro (especifique)e. nao sei7. Alguem ja te explicou o que pode ser feito para evitar esta doenca? CASO AFIRMATIVO, probe: quem.
a. sim, meu dentistab. sim, minha maec. sim, meu paid. sim, meus paise. sim, um/a amigo/af. sim, meu professorg. sim, outro (especifique)h. nao8. Algum de seus pais ja conversou com voce sobre como evitar esta doenca? CASO AFIRMATIVO, qual deles.
a. sim, minha maeb. sim, meu paic. sim, ambosd. nao, nenhum delese. nao me lembro
295
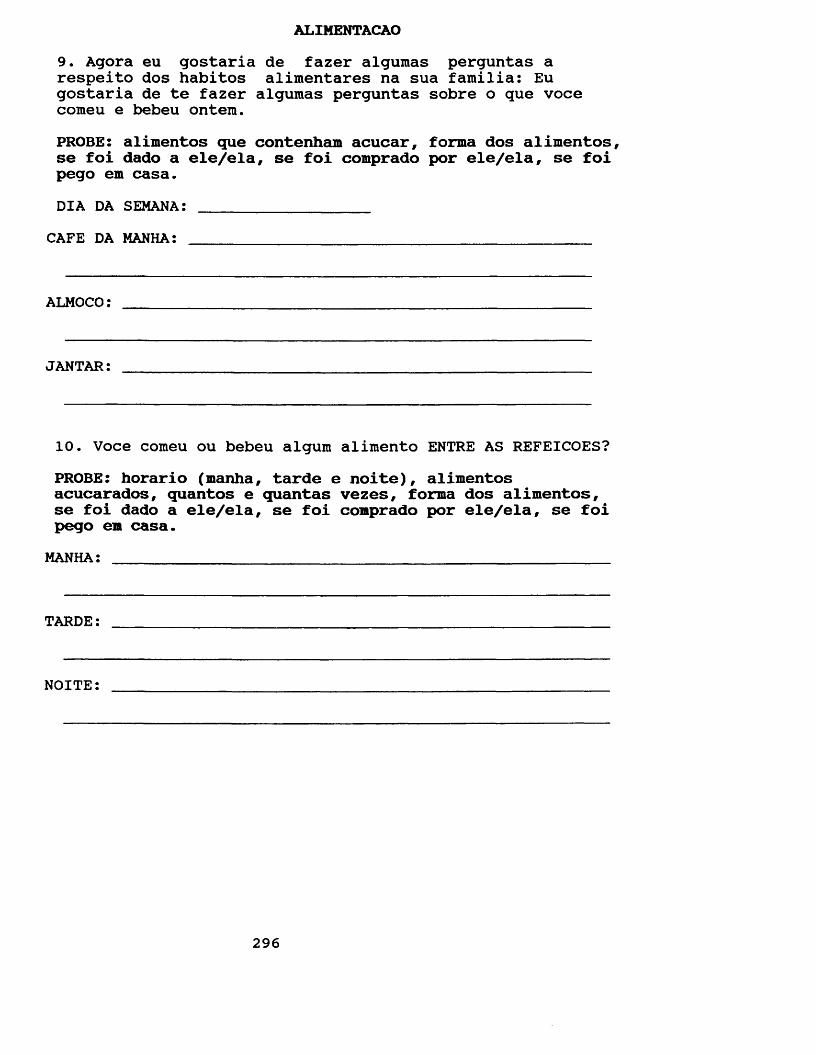
ALIMENTACAO9. Agora eu gostaria de fazer algumas perguntas a respeito dos habitos alimentares na sua familia: Eu gostaria de te fazer algumas perguntas sobre o que voce comeu e bebeu ontem.PROBE: alimentos que contenham acucar, forma dos alimentos, se foi dado a ele/ela, se foi comprado por ele/ela, se foi pego em casa.DIA DA SEMANA: __________________
CAFE DA MANHA:
ALMOCO:
JANTAR:
10. Voce comeu ou bebeu algum alimento ENTRE AS REFEICOES?PROBE: horario (manha, tarde e noite), alimentos acucarados, quantos e quantas vezes, forma dos alimentos, se foi dado a ele/ela, se foi comprado por ele/ela, se foi pego em casa.
MANHA: ____________________________________________________
TARDE:
NOITE:
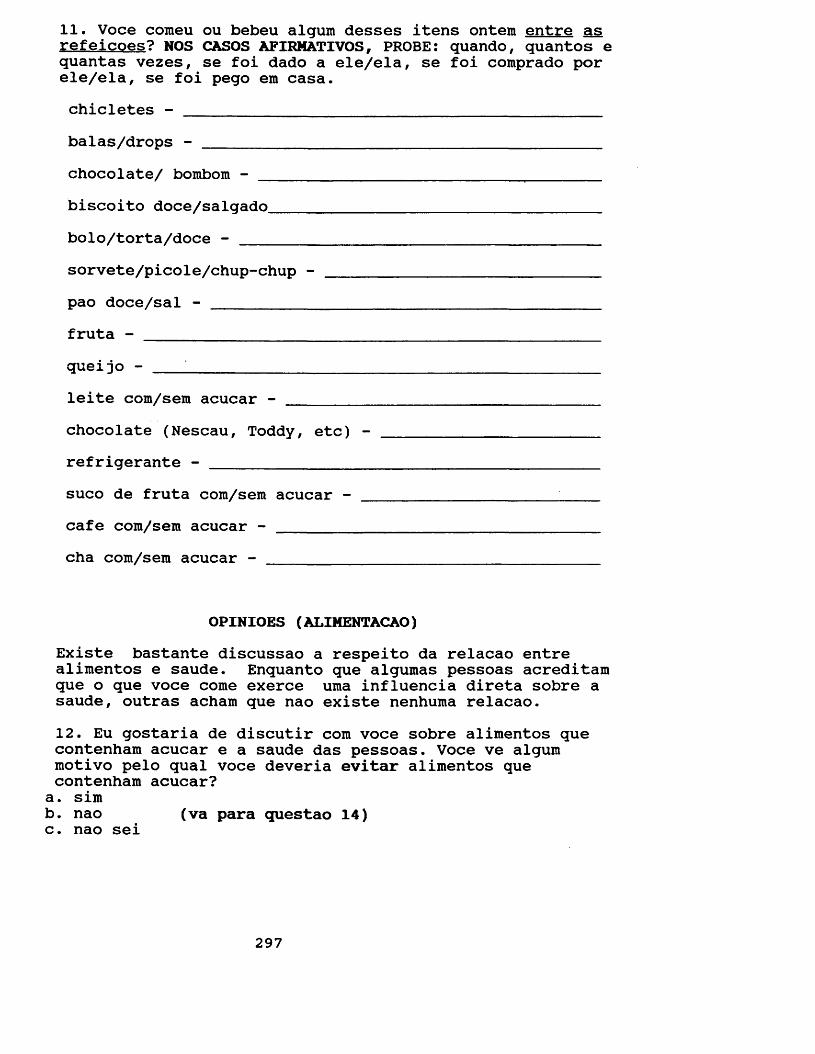
11. Voce comeu ou bebeu algum desses itens ontem entre as refeicoes? NOS CASOS AFIRMATIVOS, PROBE: quando, quantos e quantas vezes, se foi dado a ele/ela, se foi comprado por ele/ela, se foi pego em casa.chicletes - ___________________________________________balas/drops - ___________chocolate/ bombom - ______biscoito doce/salgado_____bolo/torta/doce - ________sorvete/picole/chup-chup -pao doce/sal - ___________fruta - _________________queijo - '___________________leite com/sem acucar - _________chocolate (Nescau, Toddy, etc) -refrigerante - _________________suco de fruta com/sem acucar - _cafe com/sem acucar - __________cha com/sem acucar - ___________
OPINIOES (ALIMENTACAO)Existe bastante discussao a respeito da relacao entre alimentos e saude. Enquanto que algumas pessoas acreditam que o que voce come exerce uma influencia direta sobre a saude, outras acham que nao existe nenhuma relacao.12. Eu gostaria de discutir com voce sobre alimentos que contenham acucar e a saude das pessoas. Voce ve algum motivo pelo qual voce deveria evitar alimentos que contenham acucar?a. simb. nao (va para questao 14)c. nao sei
297
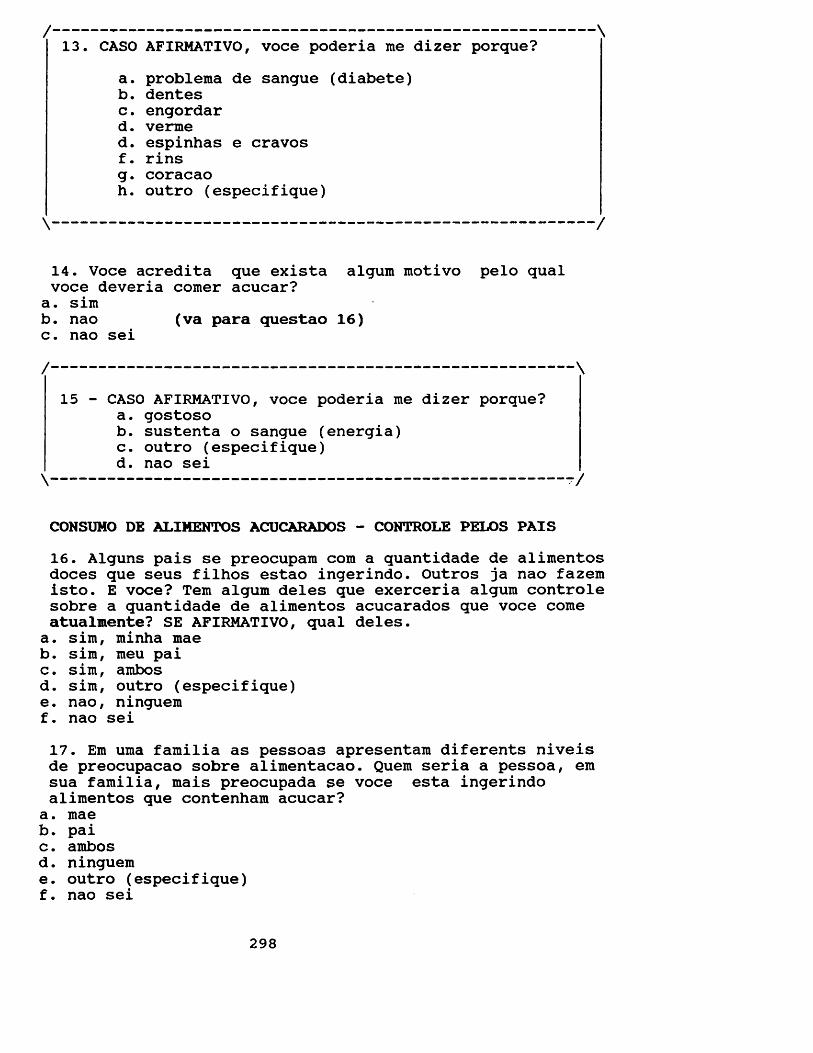
13. CASO AFIRMATIVO, voce poderia me dizer porque?a. problema de sangue (diabete)b. dentesc. engordard. vermed. espinhas e cravosf. rinsg- coracaoh. outro (especifique)
14. Voce acredita que exista algum motivo pelo qual voce deveria comer acucar?a. simb. nao (va para questao 16)c. nao sei/------------------------------------------------------ \
15 - CASO AFIRMATIVO, voce poderia me dizer porque?a. gostosob. sustenta o sangue (energia)c. outro (especifique)d. nao sei\----------------------------------------------------- -/
CONSUMO DE ALIMENTOS ACUCARADOS - CONTROLS PELOS PAIS16. Alguns pais se preocupam com a quantidade de alimentos doces que seus filhos estao ingerindo. Outros ja nao fazem isto. E voce? Tern algum deles que exerceria algum controle sobre a quantidade de alimentos acucarados que voce come atualmente? SE AFIRMATIVO, qual deles.a. sim, minha maeb. sim, meu paic. sim, ambosd. sim, outro (especifique)e. nao, ninguemf. nao sei17. Em uma familia as pessoas apresentam diferents niveis de preocupacao sobre alimentacao. Quem seria a pessoa, era sua familia, mais preocupada se voce esta ingerindo alimentos que contenham acucar?
a. maeb. paic. ambosd. ningueme. outro (especifique)f. nao sei
298
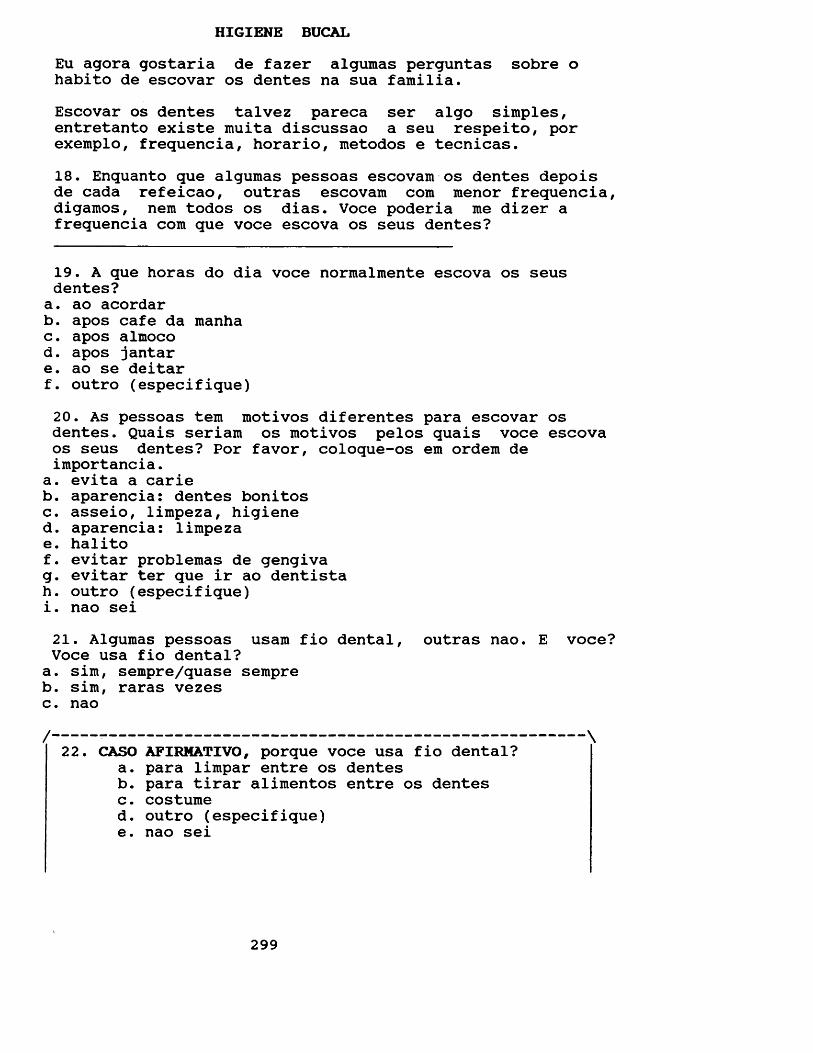
HIGIENE BUCALEu agora gostaria de fazer algumas perguntas sobre o habito de escovar os dentes na sua familia.Escovar os dentes talvez pareca ser algo simples, entretanto existe muita discussao a seu respeito, por exemplo, frequencia, horario, metodos e tecnicas.18. Enquanto que algumas pessoas escovam os dentes depois de cada refeicao, outras escovam com menor frequencia, digamos, nem todos os dias. Voce poderia me dizer a frequencia com que voce escova os seus dentes?
19. A que horas do dia voce normalmente escova os seus dentes?a. ao acordarb. apos cafe da manhac. apos almocod. apos jantare. ao se deitarf. outro (especifique)20. As pessoas tern motivos diferentes para escovar os dentes. Quais seriam os motivos pelos quais voce escova os seus dentes? Por favor, coloque-os em ordem de importancia.
a. evita a carieb. aparencia: dentes bonitosc. asseio, limpeza, higiened. aparencia: limpezae. halitof. evitar problemas de gengivag. evitar ter que ir ao dentistah. outro (especifique)i. nao sei21. Algumas pessoas usara fio dental, outras nao. E voce? Voce usa fio dental?a. sim, sempre/quase sempreb. sim, raras vezesc. nao/ \
22. CASO AFIRHATIVO, porque voce usa fio dental?a. para limpar entre os dentesb. para tirar alimentos entre os dentesc. costumed. outro (especifique)e. nao sei
299
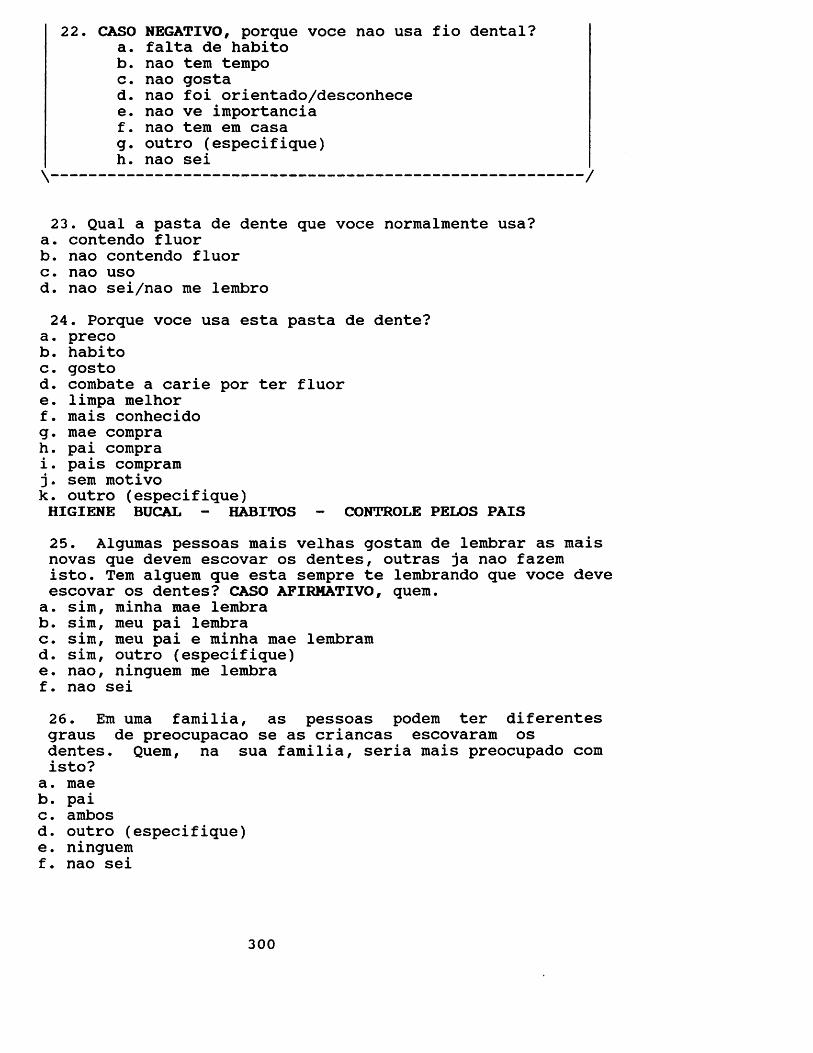
22. CASO NEGATIVO, porque voce nao usa fio dental?a. falta de habitob. nao tern tempoc. nao gostad. nao foi orientado/desconhecee. nao ve iraportanciaf. nao tem em casag. outro (especifique)h. nao sei\ /
23. Qual a pasta de dente que voce normalmente usa?a. contendo fluorb. nao contendo fluorc. nao usod. nao sei/nao me lembro24. Porque voce usa esta pasta de dente?
a. precob. habitoc. gostod. combate a carie por ter fluore. limpa melhorf. mais conhecidog. mae comprah. pai comprai. pais compram j. sem motivok. outro (especifique)HIGIENE BUCAL - HABITOS - CONTROLE PELOS PAIS25. Algumas pessoas mais velhas gostam de lembrar as mais novas que devem escovar os dentes, outras ja nao fazem isto. Tem alguem que esta sempre te lembrando que voce deve escovar os dentes? CASO AFIRMATIVO, quem.a. sim, minha mae lembrab. sim, meu pai lembrac. sim, meu pai e minha mae lembramd. sim, outro (especifique)e. nao, ninguem me lembraf. nao sei26. Em uma familia, as pessoas podem ter diferentes graus de preocupacao se as criancas escovaram os dentes. Quem, na sua familia, seria mais preocupado com isto?
a. maeb. paic. ambosd. outro (especifique)e. ninguemf. nao sei
300
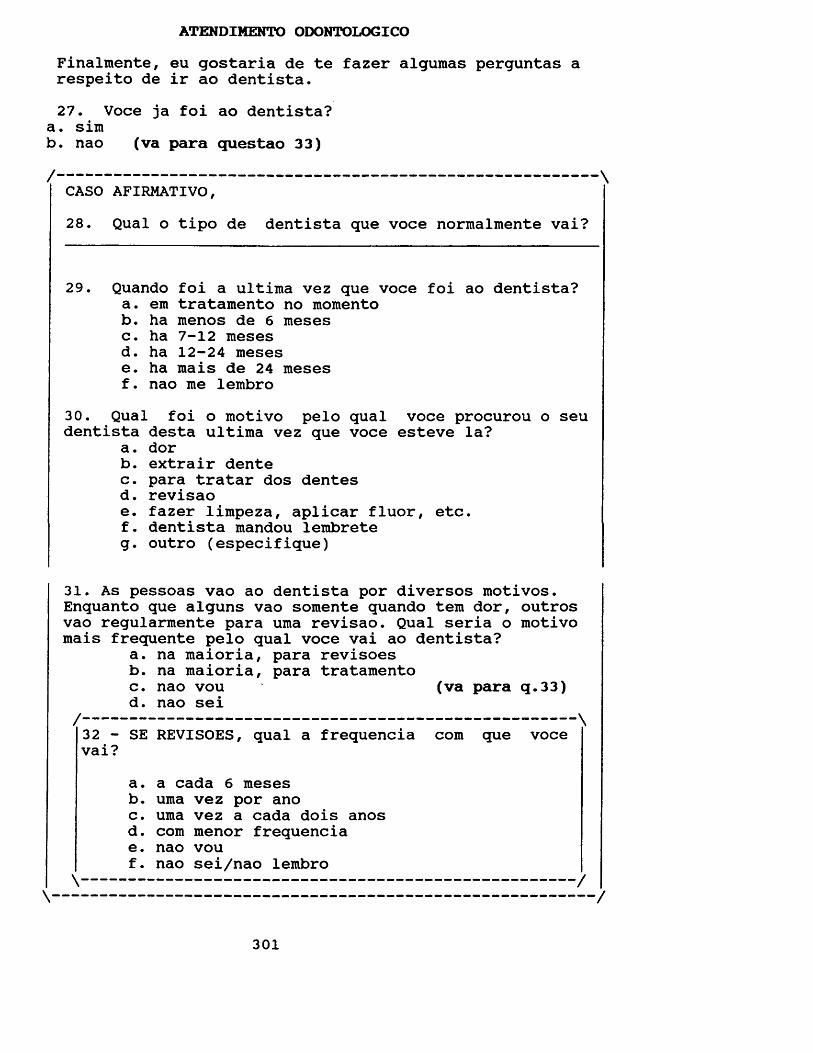
ATENDIMENTO ODONTOLOGICOFinalmente, eu gostaria de te fazer algumas perguntas a respeito de ir ao dentista.27. Voce ja foi ao dentista?
a. simb. nao (va para questao 33)/ \
CASO AFIRMATIVO,28. Qual o tipo de dentista que voce normalmente vai?
29. Quando foi a ultima vez que voce foi ao dentista?a. em tratamento no momentob. ha menos de 6 mesesc. ha 7-12 mesesd. ha 12-24 mesese. ha mais de 24 mesesf. nao me lembro
30. Qual foi o motivo pelo qual voce procurou o seu dentista desta ultima vez que voce esteve la?
a. dorb. extrair dentec. para tratar dos dentesd. revisaoe. fazer limpeza, aplicar fluor, etc.f. dentista mandou lembreteg. outro (especifique)
31. As pessoas vao ao dentista por diversos motivos. Enquanto que alguns vao somente quando tem dor, outros vao regularmente para uma revisao. Qual seria o motivo mais frequente pelo qual voce vai ao dentista?
a. na maioria, para revisoesb. na maioria, para tratamentoc. nao vou (va para q.33)d. nao sei/--------------------------------------------------- \
32 - SE REVISOES, qual a frequencia com que voce vai?
a. a cada 6 mesesb. uma vez por anoc. uma vez a cada dois anosd. com raenor frequenciae. nao vouf. nao sei/nao lembro \--------------------------------------------------- /
\ /
301
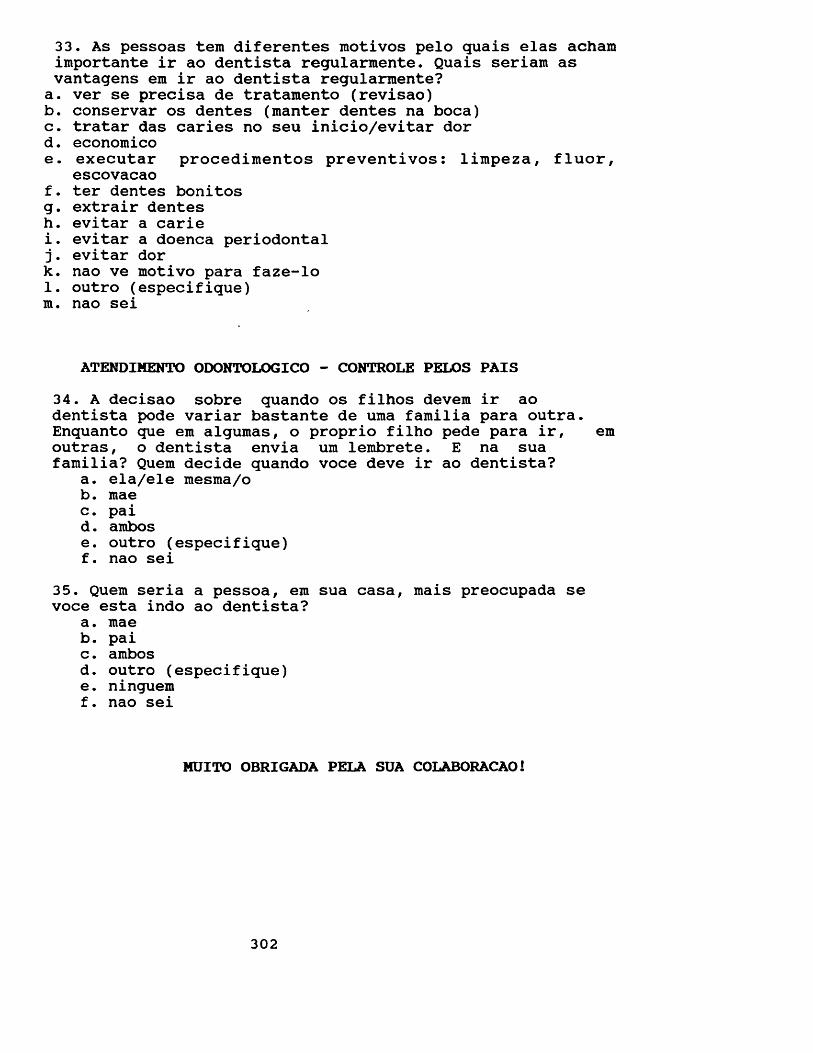
33. As pessoas tem diferentes motivos pelo quais elas acham importante ir ao dentista regularmente. Quais seriam as vantagens em ir ao dentista regularmente?a. ver se precisa de tratamento (revisao)b. conservar os dentes (manter dentes na boca)c. tratar das caries no seu inicio/evitar dord. economicoe. executar procedimentos preventivos: limpeza, fluor,
escovacaof. ter dentes bonitosg. extrair dentesh. evitar a cariei. evitar a doenca periodontal j. evitar dork. nao ve motivo para faze-lo 1. outro (especifique) m. nao sei
ATENDIMENTO ODONTOLOGICO - CONTROLS PELOS PAIS34. A decisao sobre quando os filhos devem ir ao dentista pode variar bastante de uma familia para outra. Enquanto que em algumas, o proprio filho pede para ir, em outras, o dentista envia um lembrete. E na suafamilia? Quem decide quando voce deve ir ao dentista?
a. ela/ele mesma/ob. maec. paid. ambose. outro (especifique)f. nao sei
35. Quem seria a pessoa, em sua casa, mais preocupada sevoce esta indo ao dentista?
a. maeb. paic. ambosd. outro (especifique)e. ninguemf. nao sei
MUITO OBRIGADA PELA SUA COLABORACAO!
302
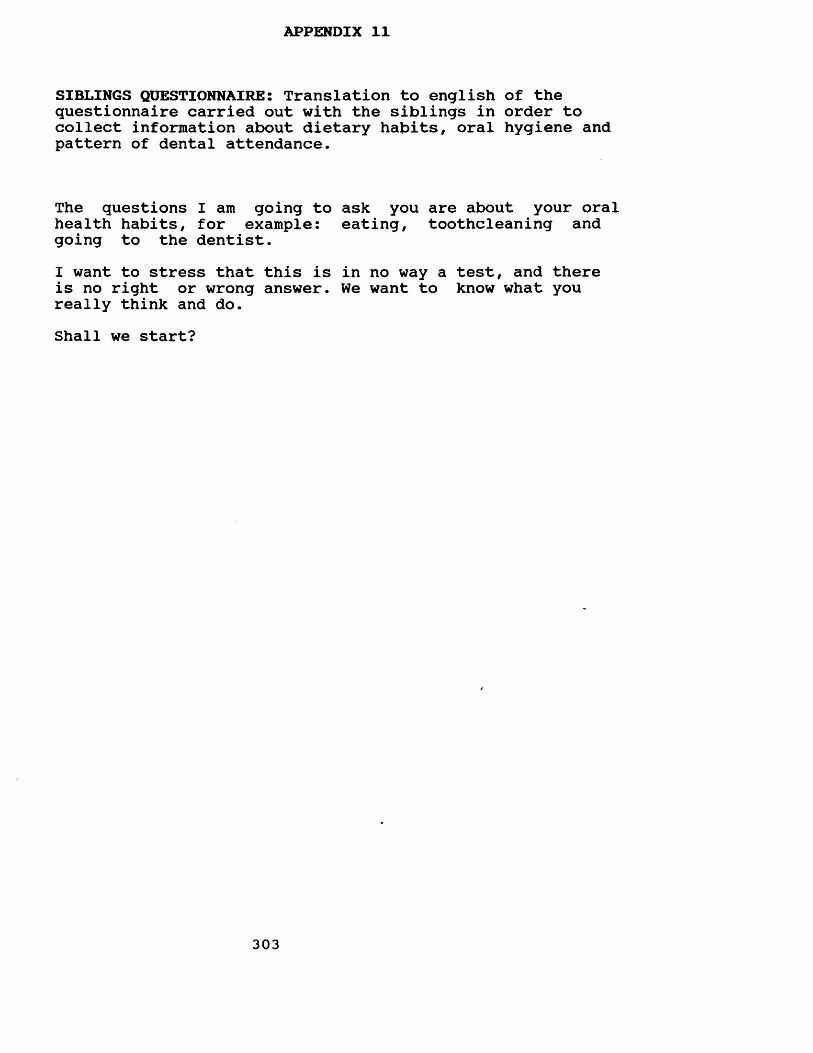
APPENDIX 11
SIBLINGS QUESTIONNAIRE: Translation to english of the questionnaire carried out with the siblings in order to collect information about dietary habits, oral hygiene and pattern of dental attendance.
The questions I am going to ask you are about your oral health habits, for example: eating, toothcleaning andgoing to the dentist.I want to stress that this is in no way a test, and there is no right or wrong answer. We want to know what you really think and do.Shall we start?
303
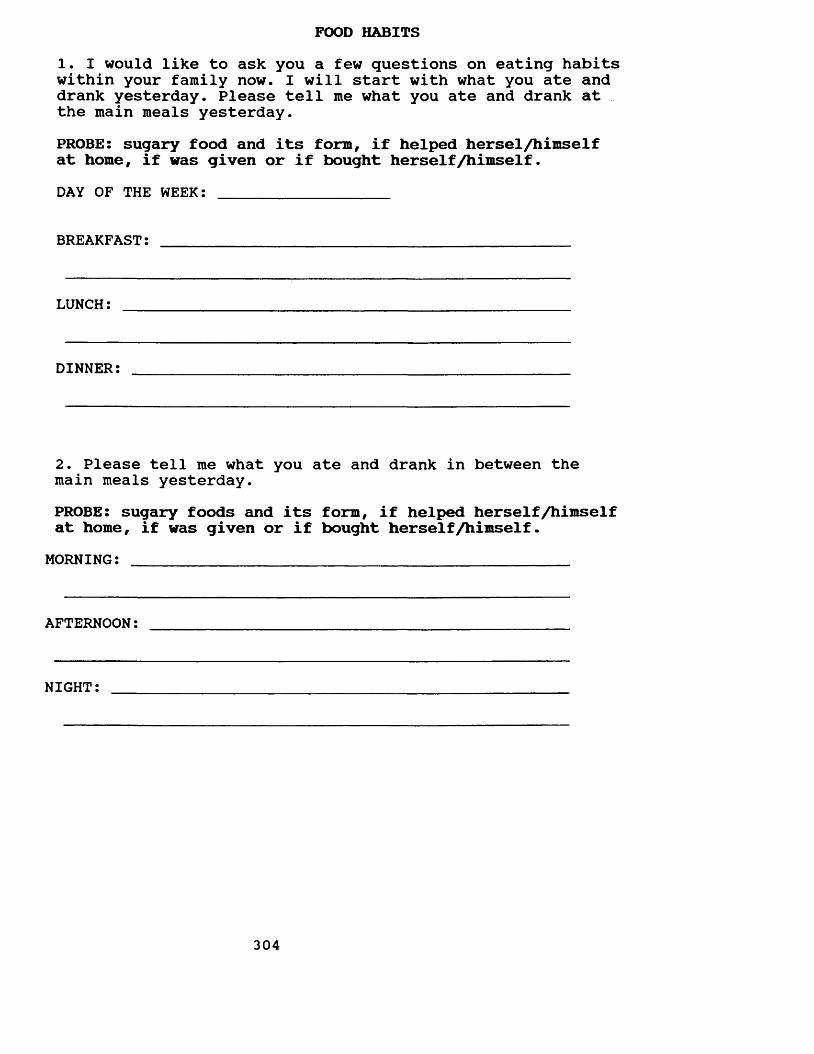
FOOD HABITS1. I would like to ask you a few questions on eating habits within your family now. I will start with what you ate and drank yesterday. Please tell me what you ate and drank at the main meals yesterday.PROBE: sugary food and its form, if helped hersel/himself at home, if was given or if bought herself /himself.DAY OF THE WEEK: __________________
BREAKFAST:
LUNCH:
DINNER:
2. Please tell me what you ate and drank in between the main meals yesterday.PROBE: sugary foods and its form, if helped herself/himself at home, if was given or if bought herself/himself.
MORNING: _____________________________________________
AFTERNOON:
NIGHT:
304
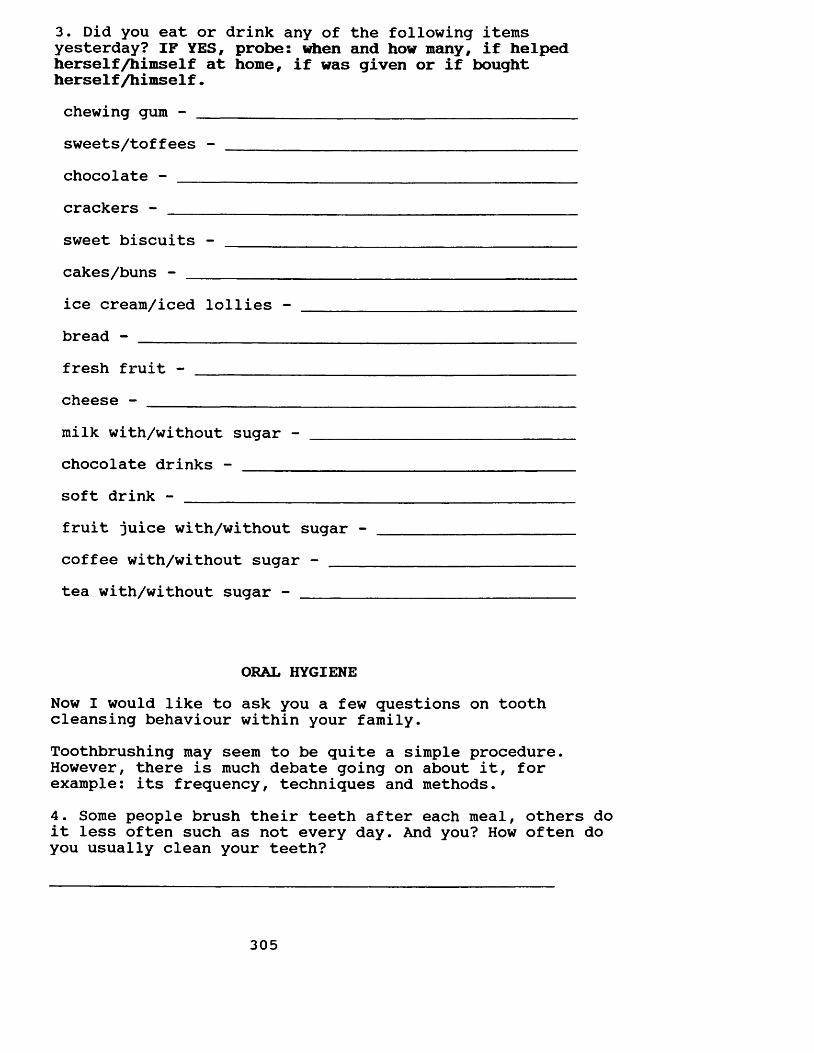
3. Did you eat or drink any of the following items yesterday? IF YES, probe: when and how many, if helped herself/himself at home, if was given or if bought herself/himself.chewing gum - ___________________________________sweets/toffees - ___________________________________chocolate -crackers -sweet biscuits -cakes/buns - ___________ice cream/iced lollies - bread - ________________fresh fruit -cheese - ________________milk with/without sugar -chocolate drinks - ______soft drink - ____________fruit juice with/without sugar -coffee with/without sugar - ____tea with/without sugar - _______
ORAL HYGIENENow I would like to ask you a few questions on tooth cleansing behaviour within your family.Toothbrushing may seem to be quite a simple procedure. However, there is much debate going on about it, for example: its frequency, techniques and methods.4. Some people brush their teeth after each meal, others do it less often such as not every day. And you? How often do you usually clean your teeth?
305
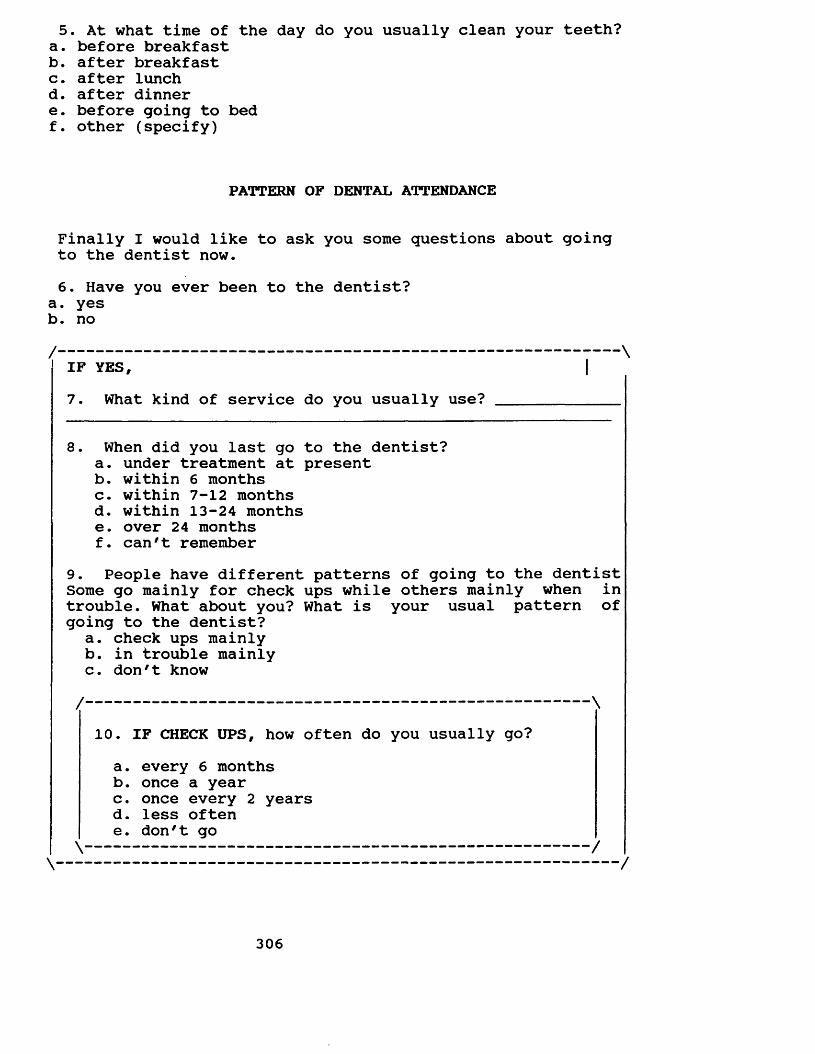
5. At what time of the day do you usually clean your teeth?a. before breakfastb. after breakfastc. after lunchd. after dinnere. before going to bedf. other (specify)
Finally I would like to ask you some questions about going to the dentist now.6. Have you ever been to the dentist?
a. yesb. no
IF YES,7. What kind of service do you usually use?
8. When did you last go to the dentist?a. under treatment at presentb. within 6 monthsc. within 7-12 monthsd. within 13-24 monthse. over 24 monthsf. can't remember
9. People have different patterns of going to the dentist Some go mainly for check ups while others mainly when introuble. What about you? What is your usual pattern ofgoing to the dentist?
a. check ups mainlyb. in trouble mainlyc. don't know
10. IF CHECK UPS, how often do you usually go?a. every 6 monthsb. once a yearc. once every 2 yearsd. less oftene. don't go
PATTERN OF DENTAL ATTENDANCE
/ \
/ \
\ /\ /
306

THANK YOU VERY MUCH FOR YOUR COLLABORATION!
307
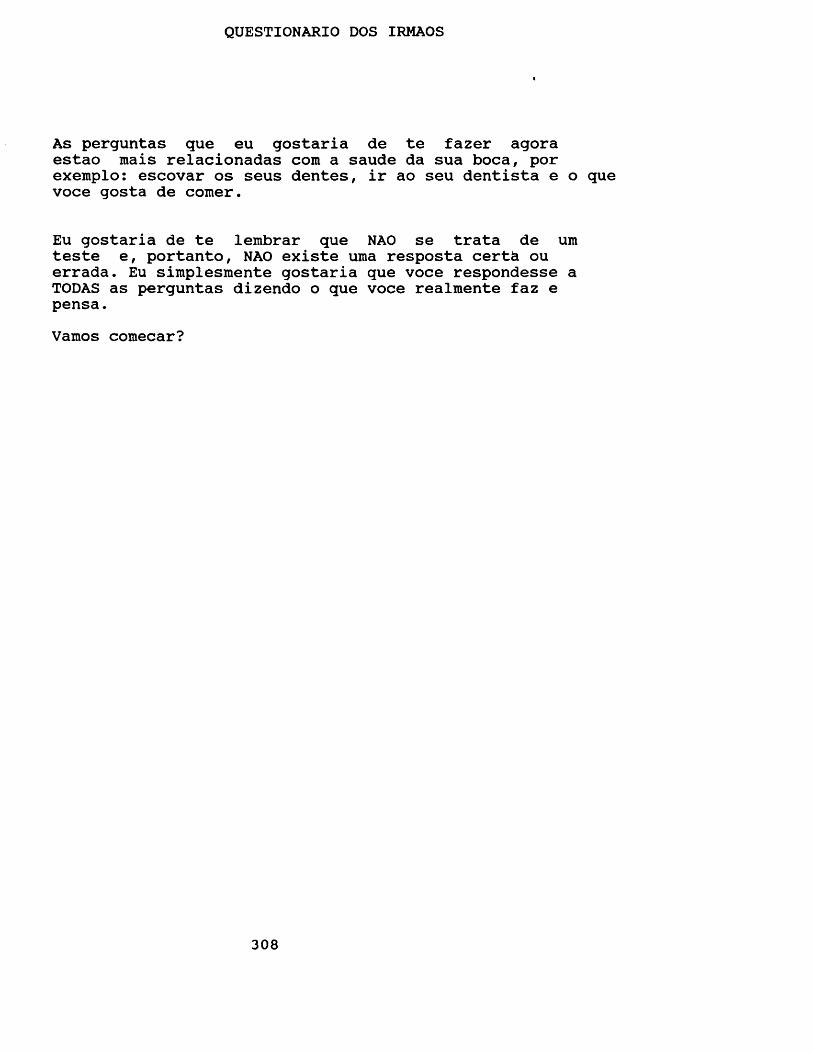
QUESTIONARIO DOS IRMAOS
As perguntas que eu gostaria de te fazer agora estao mais relacionadas com a saude da sua boca, por exemplo: escovar os seus dentes, ir ao seu dentista e o que voce gosta de comer.
Eu gostaria de te lembrar que NAO se trata de urn teste e, portanto, NAO existe uma resposta certh ou errada. Eu simplesmente gostaria que voce respondesse a TODAS as perguntas dizendo o que voce realmente faz e pensa.Vamos comecar?
308
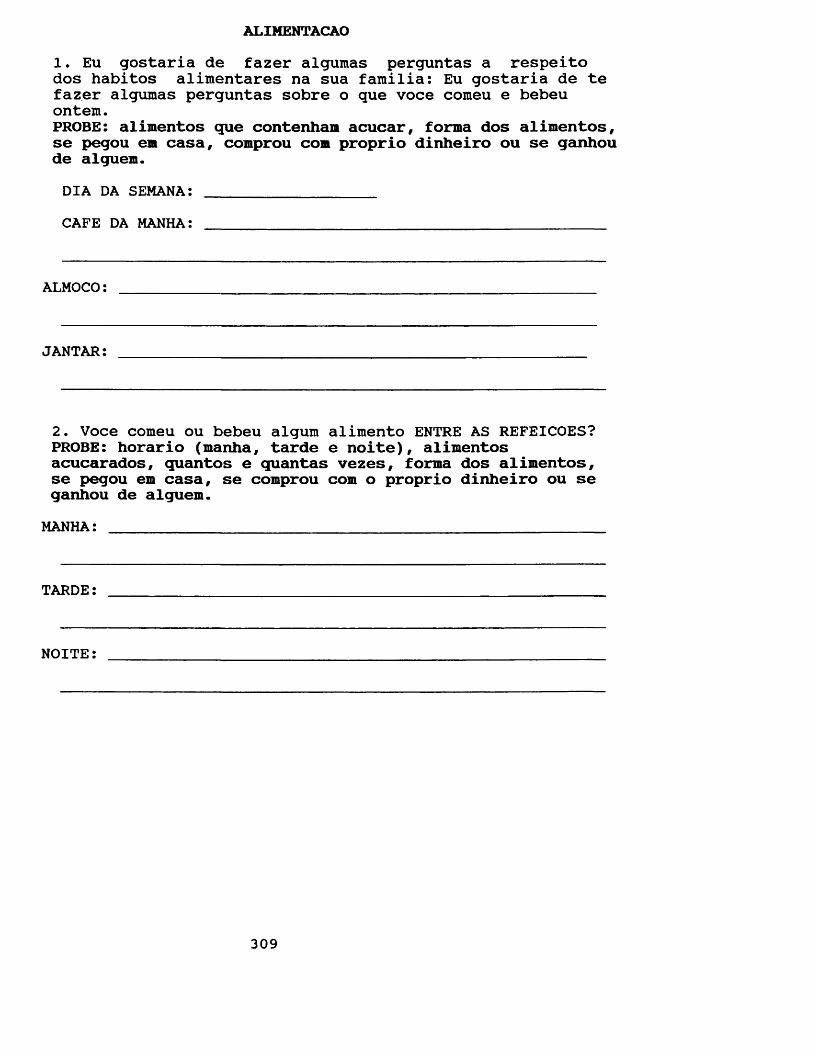
ALIMENTACAO1. Eu gostaria de fazer algumas perguntas a respeito dos habitos alimentares na sua familia: Eu gostaria de te fazer algumas perguntas sobre o que voce comeu e bebeu ontem.PROBE: alimentos que contenham acucar, forma dos alimentos, se pegou em casa, comprou com proprio dinheiro ou se ganhou de alguem.DIA DA SEMANA: __________________CAFE DA MANHA:
ALMOCO:
JANTAR:
2. Voce comeu ou bebeu algum alimento ENTRE AS REFEICOES? PROBE: horario (manha, tarde e noite), alimentos acucarados, quantos e quantas vezes, forma dos alimentos, se pegou em casa, se comprou com o proprio dinheiro ou se ganhou de alguem.
MANHA: ___________________________________________________
TARDE:
NOITE:
309
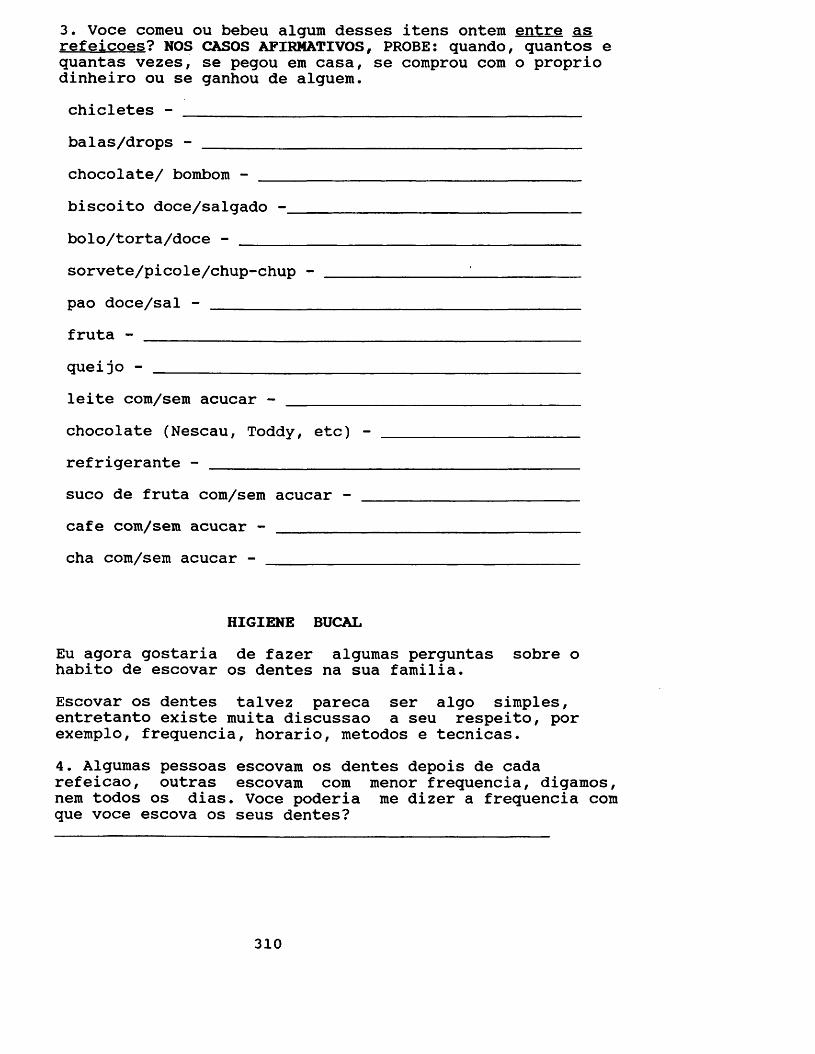
3. Voce comeu ou bebeu algum desses itens ontem entre as refeicoes? NOS CASOS AFIRMATIVOS, PROBE: quando, quantos e quantas vezes, se pegou em casa, se comprou com o proprio dinheiro ou se ganhou de alguem.chicletes - _________________________________________balas/drops - _______________________________________chocolate/ bombom - _________________________________biscoito doce/salgado -______________________________bolo/torta/doce - ___________________________________sorvete/picole/chup-chup -pao doce/sal - ______________________________________fruta - ____________________________________________queijo - ____________________________________________leite com/sem acucar - ______________________________chocolate (Nescau, Toddy, etc) - ____________________refrigerante - ______________________________________suco de fruta com/sem acucar - ______________________cafe com/sem acucar - _______________________________cha com/sem acucar - ________________________________
HIGIENE BUCALEu agora gostaria de fazer algumas perguntas sobre o habito de escovar os dentes na sua familia.Escovar os dentes talvez pareca ser algo simples, entretanto existe muita discussao a seu respeito, por exemplo, frequencia, horario, metodos e tecnicas.4. Algumas pessoas escovam os dentes depois de cada refeicao, outras escovam com menor frequencia, digamos, nem todos os dias. Voce poderia me dizer a frequencia com que voce escova os seus dentes?
310
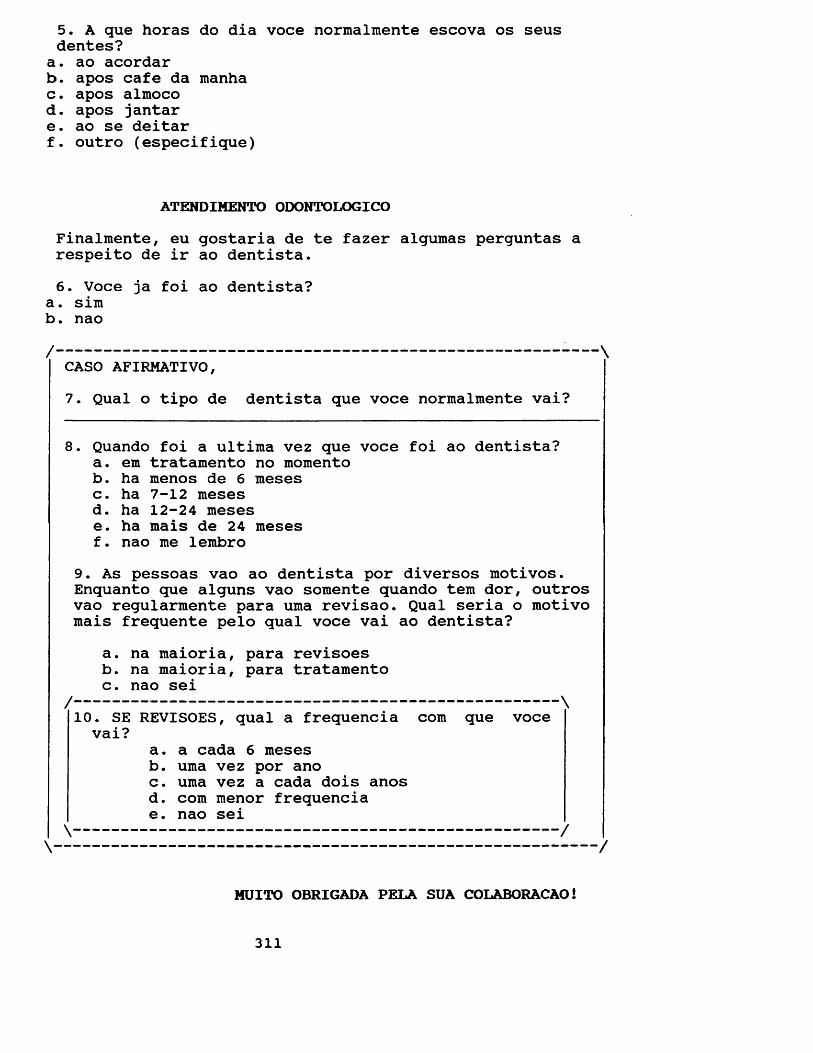
5. A que horas do dia voce normalmente escova os seus dentes?a. ao acordarb. apos cafe da manhac. apos almocod. apos jantare. ao se deitarf. outro (especifique)
Finalmente, eu gostaria de te fazer algumas perguntas a respeito de ir ao dentista.6. Voce ja foi ao dentista?
a . simb. nao
CASO AFIRMATIVO,7. Qual o tipo de dentista que voce normalmente vai?
8. Quando foi a ultima vez que voce foi ao dentista?a. em tratamento no momentob. ha menos de 6 mesesc. ha 7-12 mesesd. ha 12-24 mesese. ha mais de 24 mesesf. nao me lembro
9. As pessoas vao ao dentista por diversos motivos. Enquanto que alguns vao somente quando tern dor, outros vao regularmente para uma revisao. Qual seria o motivo mais frequente pelo qual voce vai ao dentista?
a. na maioria, para revisoesb. na maioria, para tratamentoc. nao sei
10. SE REVISOES, qual a frequencia com que voce vai?
a. a cada 6 mesesb. uma vez por anoc. uma vez a cada dois anosd. com menor frequenciae. nao sei
ATENDIMENTO ODONTOLOGICO
/ \
/ \
\ /\ /
MUITO OBRIGADA PELA SUA COLABORACAO!
311
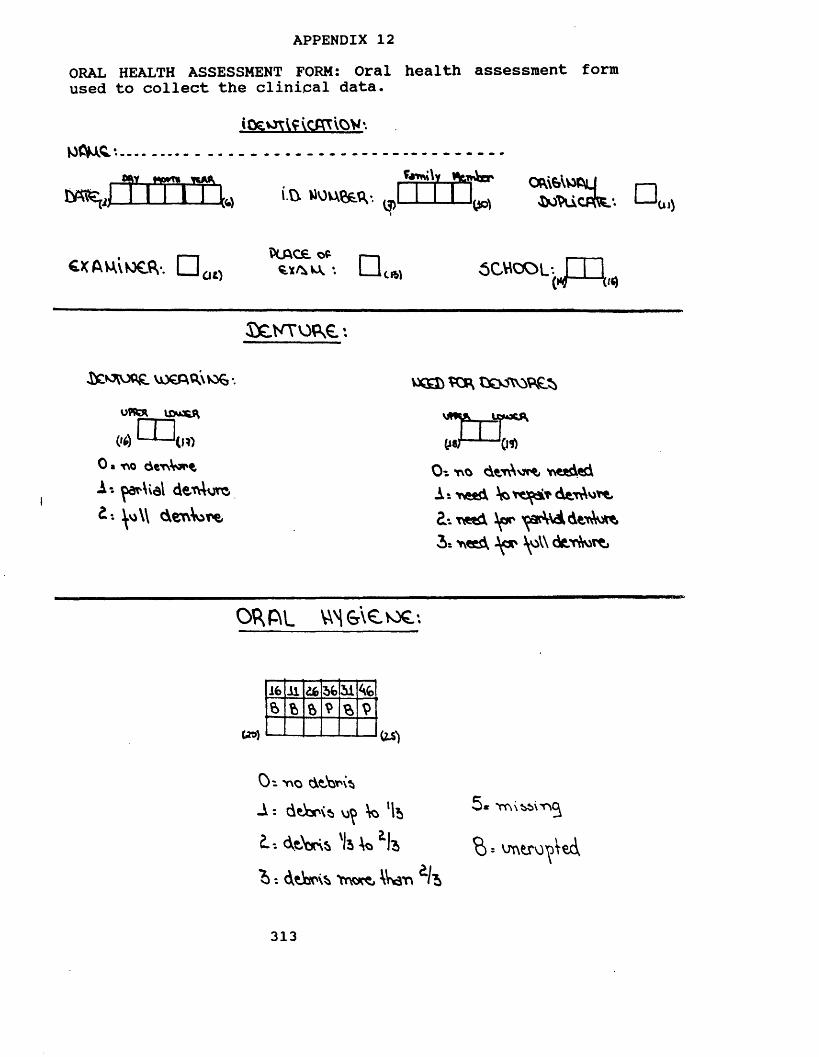
APPENDIX 12ORAL HEALTH ASSESSMENT FORM: Oral health assessment form used to collect the clinical data.
........
m ■v*) i.ft. WOUftfcd*. yol JMVuCPfoc. O 0l)
CXAU\tO€fV. D 00P(AC£i Ofc |
*. I I 5CMCOL-. JT1M — \
SeNTopse*.
VjOCA^xk ,-UflfcR IfiuKftm (»*) LJ— ‘(10
0 a t \0 d t T \ V o ^ ^
A-. ar\val demurs d*. \\ derAvire
vxsb tXKSX 9£j
(i fiOt. no dvr Njrt, needed At need V*derAv>*e, £-. need ipr ac\VddtT JWi 3* need \oW ck-T rt*
O^P\L WS&tevoe-.
16il do56 46ft ft ft ft
5* Trs\?>t>\rx% = vjtxero ed
313
O'- no dtbnxtiA : de oxs v)> \o ‘lb£.-. <XtW 'Is *la
^ : dtisox Ttwt Wvarv It
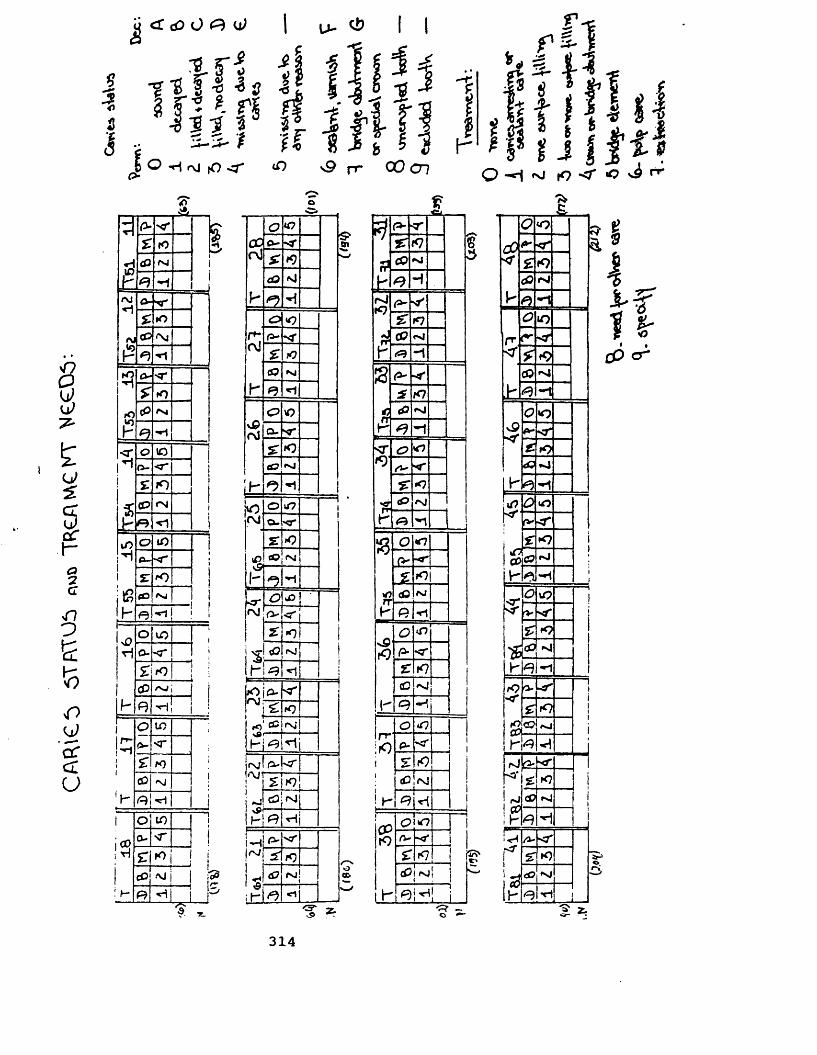
CA
FUC
t) 5T
ATO
i) TR
,£AW
yCKY
V
eCO
f-
- 5
s
i
o
<£ cO O O <d
r t f I
3 1 i i t| O rvi ,0 <r
l >
2
J0 -g 8 2
T” A*xTpU
5: rO
t
rvi9 -i
ro a-xr*1 £ »o<\J<p■Xl
"*1*? 0 -O'* 1£ *n
rO
P
cP Nj9
<r 0 IOI"10-*r i! £ /O 1j
<P rsi 1ib R <1 1
iO O iOa-0 " 1
i £ !£ CO njh R 1 i>o O vO 1
O-sT i£ f0 l ;
1 i<p 'nj j |
b e -*i 1i :i 0 1015 0-srii £ *)
cC •xi 1\~ I1
O to — 11
r0 0- >r 1r i £ K> I i1
cO I •h- R J -
C? 07CO 0-cd £ #9
a0 n J
b*0
r-rvi
P-* *<£ iOtf? NJ
h <1
vPcO
<P W7Q- <£ »o<s? NJ
b i1
1*° 0 07 -- 11f\J a. 'O'
£ *0
*£vSb
flO INI
*? ^1
<r 07 •«\J rv <r
£ •0
\%Ih
NJ
t eo - { ^
---
r £ »0fO cc rsi!
H ^ h i<Nf a-|<r•VJ £iK7l11 ^ <£}!fsj
S*M
fKl *)\d? rsj!
;h*t^♦
m
3 ^ f J If ^ - 1O -*1 ^ to «c ^ ^
A-Ci
' / £1f9£ CQ nJI- <9 H|nJK7 A- o'
£ K7rr <0 <nJ
b <R -1S -O'
£ K7<P *n!
\ r •1<T <P 07M <*
£ *<7cP <NI
K R 'I —a O 07
(> -<r
£ O
*0 c0 NJR •rlO 07r—
k} R < r
£ K7(O Nji
K <R11.. 0Ir-ri
p-5:01 «P <Nj
I..T- 9JCPrO
C>!*0ru ■*f i£ K7 I
j (PjfSj1, ju-i ^ L _ L
O ’*.5>
«o
< 1K>!I«n J
bigM
cOf9
09ho*
f'O'K
rO
C9
<d
a.
Sf
•o
*>
o
<7
\C
<)
tonJ
h"19
rJ!; h
i-HrO
ih
£iK?aD
d3K)
NJ
I 6 1 cP cr
** ■=. » Z.
314
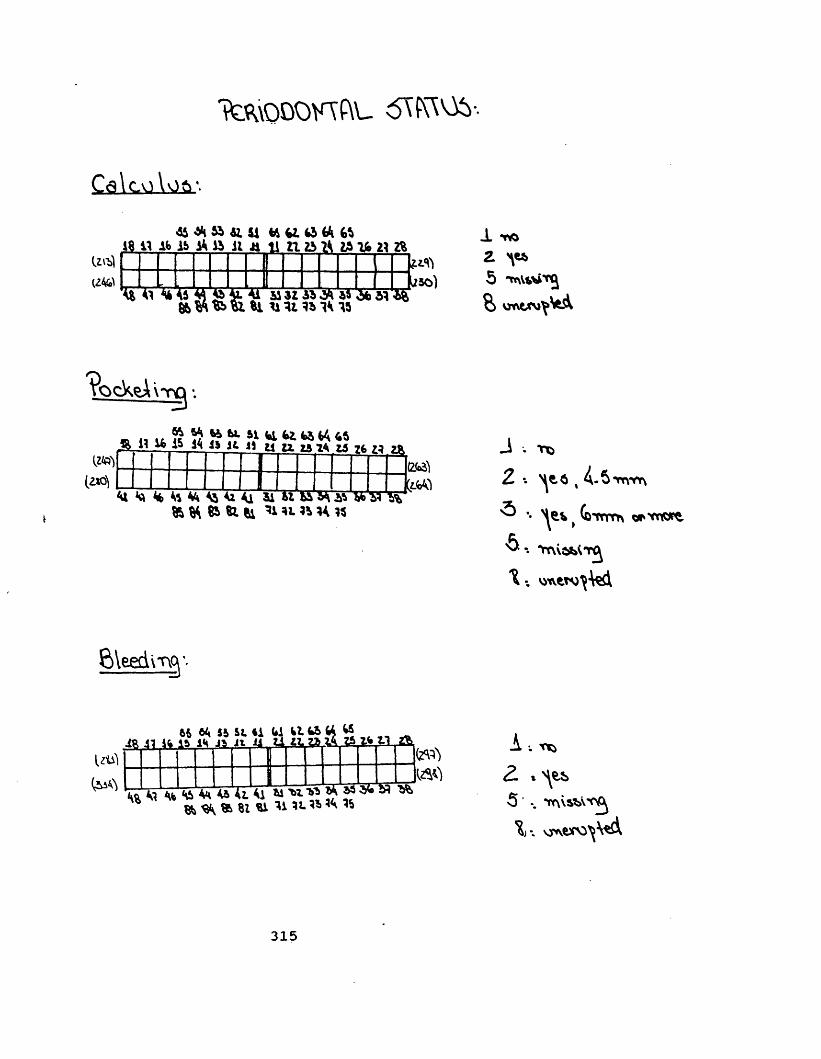
Ttauocmftu srcws-.
UtilU4GA
48 11 AS 1& a ft Jl Ji 11 11 25 15 16 21 2%
V * 1 41 AS M g g AA M 3I A5 45 d* 51 «% »Wfc>&8l Hit«1415l/so)
1 Tto2 ^5 tnutfitjS> vjnrvwv ftA
VocVeAi3 3 ••f §?>**** *16l*l«44 45
miiK)
4“49Jb H 11I
12.ZA2A 26 1*21I2*1
(2M&fcJM
J . Tfc2 •. H8.5 . -5 *rmfr\5 -.6,
A * iTttm trvtw^
wvew^tai
181165 64 5S S t S i 41 SI 45 44 45
Ifc IS id i t i i U t i a w S
J 41 J45M45U4185 ® 51 84 **• %
2*il
N USfiA •.2. % es>5 -. *tr\\S*AV. vJAWO^^A
315


