Embed Size (px)
Citation preview

David Glassettwww.pvmaps.com @pvmaps
David Glassettwww.pvmaps.com

David Glassettwww.pvmaps.com @pvmaps

David Glassettwww.pvmaps.com @pvmaps
DATAThe red
columns are the ones I
started with.

David Glassettwww.pvmaps.com @pvmaps
DATAand the total number of games played for the proportional circles.
But I needed an ID for the
opponent schedule

David Glassettwww.pvmaps.com @pvmaps
DATAThis is how
the data looked all collected.

David Glassettwww.pvmaps.com @pvmaps
PROJECTIONI wanted
an oblique perspective,
but this made it look
ridiculous.
David Glassettwww.pvmaps.com @pvmaps
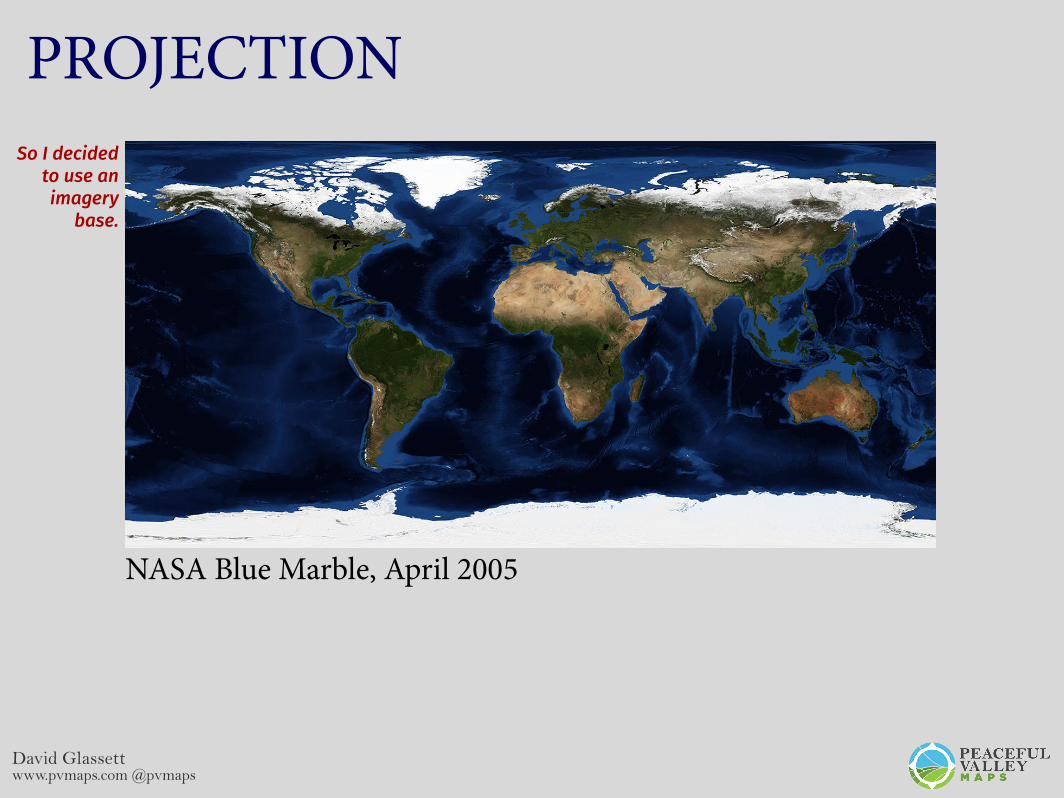
PROJECTION
NASA Blue Marble, April 2005
So I decided to use an imagery
base.

David Glassettwww.pvmaps.com @pvmaps
PROJECTIONI projected
it in QGIS into an
orthographic projection
centered at 10°S.

David Glassettwww.pvmaps.com @pvmaps
PROJECTIONPut within
my map frame, it gave the US a nice
oblique view.

David Glassettwww.pvmaps.com @pvmaps
DATA VISUALIZATIONHow do I tell
the story of UConn’s
dominance? I wanted to use college
pennants. A different
color for wins and
losses.
One pennant per game played was clearly getting out of hand fast.

David Glassettwww.pvmaps.com @pvmaps
DATA VISUALIZATIONSo I tried
using proportional
circles instead.
It was a good start, but I wanted more clarity on when these games were played across four seasons.

David Glassettwww.pvmaps.com @pvmaps
DATA VISUALIZATIONI decided to
use both the proportional
circles and pennants.
In addition, I added each season’s schedule. Every opponent was numbered and labeled.

David Glassettwww.pvmaps.com @pvmaps
FINAL VERSION

David Glassettwww.pvmaps.com @pvmaps
COPYRIGHTWhen I
tried to sell posters
online, I was informed
I was in violation of
copyright.
The UConn branding office told me that even the name of the university was copyrighted.

David Glassettwww.pvmaps.com @pvmaps
David Glassettwww.pvmaps.com