Embed Size (px)
Citation preview

Your Community by the NumbersAccessing the most current and relevant Census data
Alexandra Barker
Data Dissemination & Media Relations
U.S. Department of Commerce
U.S Census Bureau
617-519-1099 - [email protected]

AGENDAPART I:
Overview of Geographies, Programs and Datasets available
Introducing the American Fact Finder
PART II:
Online Activity 1: Accessing Data Profiles (DP tables) and Mapping
PART III:
Online Activity 2: Accessing Detailed Tables & “Geo-blurb” mapping


American FactFinder Components
Summary Levels
Geography
Program
Census or Survey
Data Sets
Data File
Topics/Variables
People,
Housing,
Business
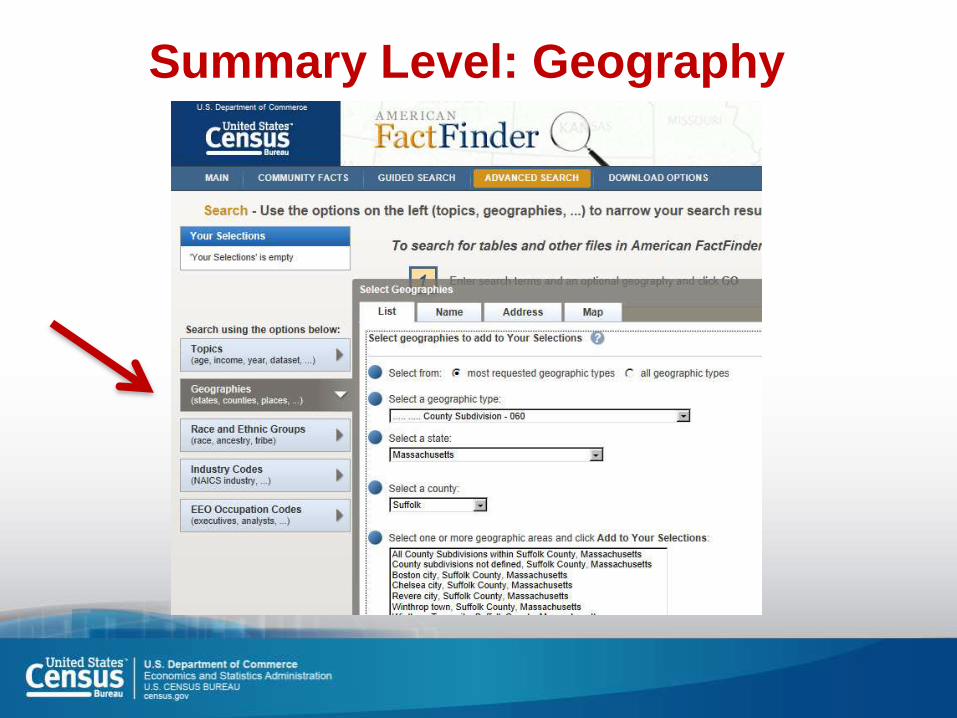
Summary Level: Geography

Summary Levels – Geography

Census Tract 909.01, Suffolk County, MA
Census Tracts generally have a population of 1,500 to 8,000 (optimum 4,000) and follow physical boundaries.

BG 2, Tract 909.01, Suffolk County, MA
Block Groups generally have a population of 300 to 4,000 (optimum 1,500) and follow physical boundaries.

Block 2005, BG 2, Tract 909.01, Suffolk County, MA
Blocks: the smallest geographic level for which census data is available. No population threshold. Size varies.

Programs

Program Decennial Census
Every 10 years, Counts Residents
American Community Survey (ACS)
Annual Social, Economic and Housing data
Other Surveys and
Censuses
Population Estimates
Economic Census

2010 Census vs. ACS
100 % Data
How many people live in the U.S.?
Count - People, Housing units,
Point in time April 1, 2010
2010 Census
Sample Data
How do people live in the U.S.?
Characteristics Income, Poverty, Education
Period in Time 1yr, 3yr, 5yr
American Community
Survey
2000 Long FormSF3 & SF4
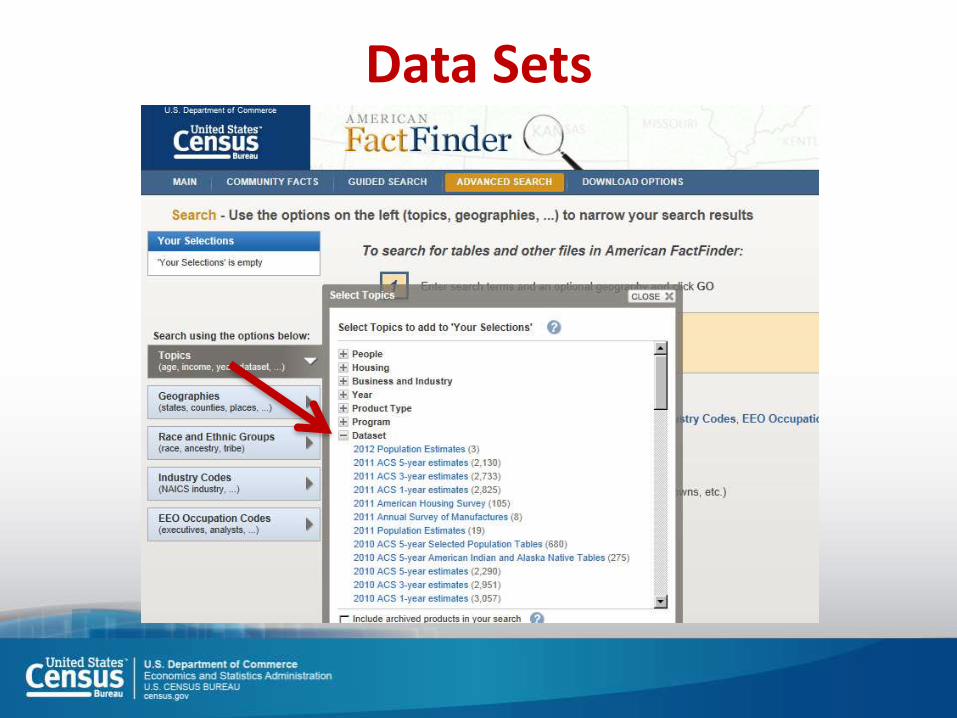
Data Sets

2010 Census-Data Sets*• State population counts for race and Hispanic or Latino categories
• State housing unit counts by occupancy status (occupied units, vacant units)
Redistricting
PL 94-171
• Age, sex, race, Hispanic Origin, relationship to householder, households by type (family & nonfamily), housing occupancy and vacancy rates, and housing tenure (owner-occupied and renter-occupied housing units.)
Demographic Profiles DP SF
• Population counts for 63 race categories and Hispanic or Latino.
• Population counts for many detailed race and Hispanic or Latino categories, and American Indian and Alaska Native tribes.
• Selected population and housing characteristics
Summary File 1
SF1 100% Data
• Population and housing characteristics iterated for over 330 race and Hispanic or Latino categories, and AIAN tribes
Summary File 2
SF2 100% Data
20102010 SF1 100% Data (656)2010 SF2 100% Data (140)2010 Redistricting Data SF (PL 94-171) (25)2010 Demographic Profile SF (2)
20002000 SF1 100% Data (600)2000 SF2 100% Data (185)2000 SF3 Sample Data (1,102)2000 SF4 Sample Data (564)2000 Redistricting Data SF (PL 94-171) (11)
100% Data!

American Community Survey
Social
• Household Type
• Marital Status
• Education
• Grandparent Caregivers
• Veterans
• Disability Status
• Poverty
• Citizenship
• Language
Demographic
• Age
• Sex
• Race
• Hispanic Origin
Economic
• Income
• Benefits
• Employment Status
• Occupation
• Industry
• Commuting to Work
• Place of Work
Housing
• Tenure
• Housing Value
• Occupancy
• Taxes & Insurance
• Household Size
• Utilities

ACS Data SetsCURRENT DATA AVAILABLE FOR 2013!
- Areas with a population 65,000+: 1 Year Estimates
(2005, 2006, 2007, 2008, 2009, 2010, 2011, 2012, 2013)
Areas with a population 20,000+: 3-Year Estimates
(2005-07, 2006-08, 2007-09, 2008-10, 2009-2011, 2010-2012, 2011-2013)
Areas below 20,000 (incl. census tracts & block groups): 5-year estimates
(2005-09, 2006-10, 2007-2011, 2008-2012, 2009-2013)