Embed Size (px)
Citation preview
TATA CONSULTANCY
SERVICES
ALEX PRAVEEN KUMAR (13AD02)
BOOPATHI.R (13AD07)
SIVAKUMAR.G (13AD35)
SUBBURAMAN.R (13AD37)
12 February 2015 1
Company Profile
• An Indian multinational information technology (IT) services,
business process and consulting company headquartered
in Mumbai, Maharashtra.
• Founded in 1968 by a division of Tata Sons Limited.
• CEO & Managing Director- Mr Natarajan Chandrasekaran
• Operates in 46 countries and has 199 branches across the
world.
12 February 2015 2

Porter’s Model:
12 February 2015 3
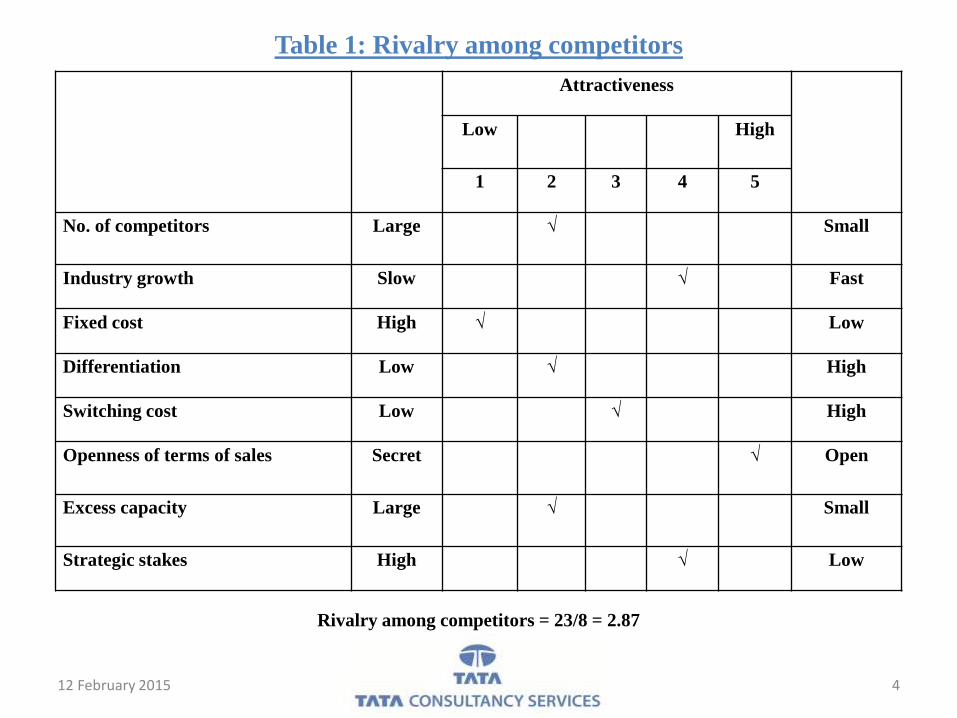
Attractiveness
Low High
1 2 3 4 5
No. of competitors Large √ Small
Industry growth Slow √ Fast
Fixed cost High √ Low
Differentiation Low √ High
Switching cost Low √ High
Openness of terms of sales Secret √ Open
Excess capacity Large √ Small
Strategic stakes High √ Low
Table 1: Rivalry among competitors
Rivalry among competitors = 23/8 = 2.87
12 February 2015 4

12 February 2015 5
Attractiveness
Low High
1 2 3 4 5
Asset specialization High √ Small
Cost of exit High √ Small
Government restrictions High √ Small
Table 2: Barriers to exit
Barriers to exit = 6/3 = 2
12 February 2015 6
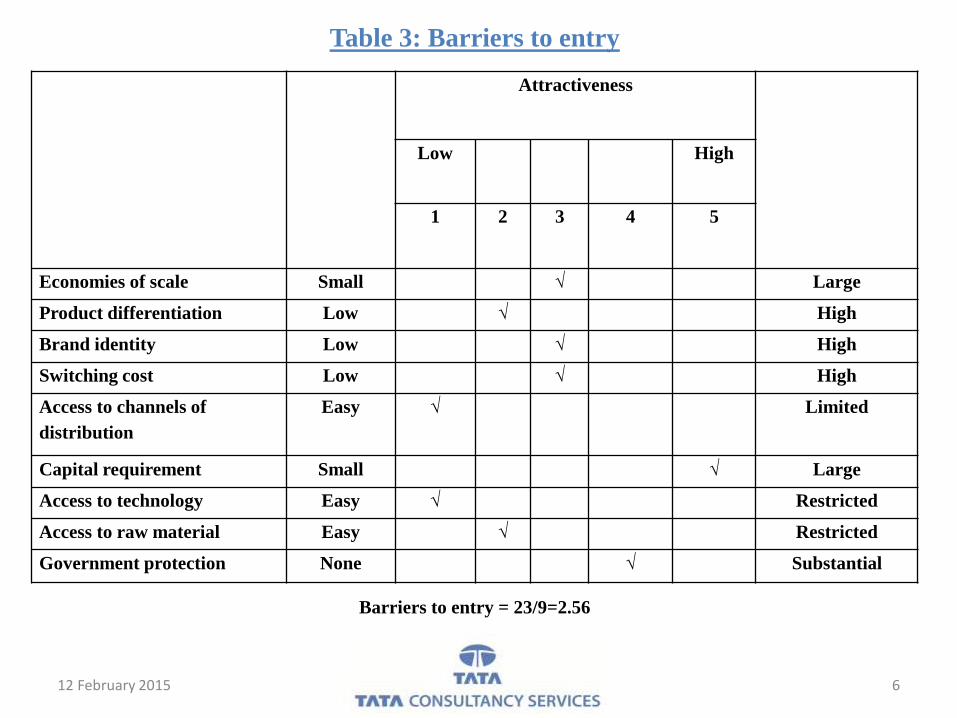
Attractiveness
Low High
1 2 3 4 5
Economies of scale Small √ Large
Product differentiation Low √ High
Brand identity Low √ High
Switching cost Low √ High
Access to channels of
distribution
Easy √ Limited
Capital requirement Small √ Large
Access to technology Easy √ Restricted
Access to raw material Easy √ Restricted
Government protection None √ Substantial
Table 3: Barriers to entry
Barriers to entry = 23/9=2.56

12 February 2015 7
Attractiveness
Low High
1 2 3 4 5
Availability of close
substitutes
High √ Low
Switching cost Low √ High
Substitute's price-value Better √ Worse
Profitability of the producers
of substitutes
High √ Low
Table 4: Threat from substitutes
Threat from substitutes = 14/4 = 3.5

12 February 2015 8
Attractiveness
Low High
1 2 3 4 5
Number of buyers Small √ Large
Availability of substitutes Many √ Few
Switching cost Low √ High
Buyers threat of backward
integration
High √ Low
Industry's threat of forward
integration
Low √ High
Contribution to quality Low √ High
Contribution to cost High √ Low
Buyer's profitability Low √ High
Table 5: Bargaining power of buyers
Bargaining power of buyers = 30/8 = 3.75

12 February 2015 9
Attractiveness
Low High
1 2 3 4 5
Number of suppliers Small √ Large
Availability of substitutes Few √ Many
Switching cost High √ Low
Supplier's threat of forward
integration
High √ Low
Industry's threat of backward
integration
Low √ High
Contribution to quality High √ Low
Contribution to cost High √ Low
Industry's importance to
supplier
Low √ High
Table 6: Bargaining power of suppliers
Bargaining power of suppliers = 26/8 = 3.25

12 February 2015 10
Attractiveness
Low High
1 2 3 4 5
Industry protection Low √ High
Industry regulation High √ Low
Customs and tariff
restrictions abroad
High √ Low
Table 7: Government actions
Government actions = 12/3 = 3
12 February 2015 11
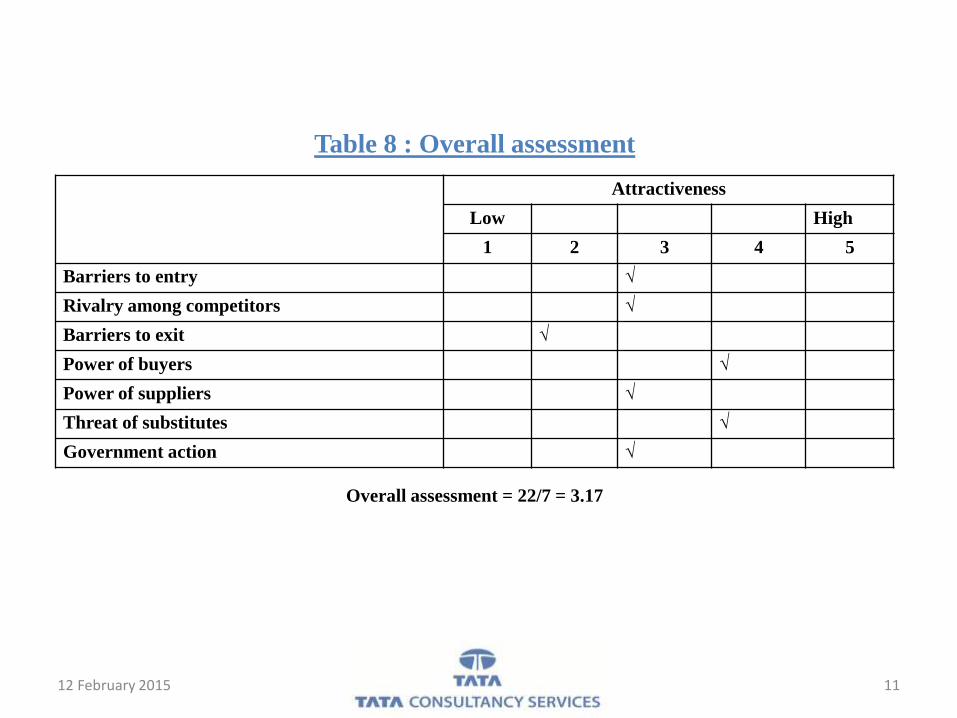
Attractiveness
Low High
1 2 3 4 5
Barriers to entry √
Rivalry among competitors √
Barriers to exit √
Power of buyers √
Power of suppliers √
Threat of substitutes √
Government action √
Table 8 : Overall assessment
Overall assessment = 22/7 = 3.17

CPM MatrixTCS INFOSYS WIPRO
Critical
Success
Factors
Weight Rating Score Rating Score Rating Score
Advertising 0.15 3 0.45 2 0.30 4 0.60
Market share 0.15 4 0.60 3 0.45 2 0.30
Product
quality
0.15 4 0.60 3 0.45 2 0.30
Price
competitivene
ss
0.10 3 0.30 4 0.40 2 0.20
Customer
loyalty
0.10 3 0.30 4 0.40 2 0.20
Global
expansion
0.15 4 0.60 3 0.45 2 0.30
Financial
position
0.20 4 0.80 3 0.60 2 0.40
Total 1.00 25 3.65 22 3.05 16 2.30
12 February 2015 12

BCG Matrix
STARS
BPO
Infrastructure services
QUESTION MARKS
KPO
Engineering and industrial services
Consulting
CASH COWS
Application development
Maintenance of software products
DOGS
None
12 February 2015 13

Percentage of total revenues in FY 2012-
13 by each service line
• Application development and maintenance (42.80%)
• Asset leverage solutions (2.70%)
• Assurance services (7.70%)
• Business process outsourcing (12.50%)
• Consulting (3.00%)
• Engineering and Industrial services (4.60%)
• Enterprise solutions (15.20%) and
• IT infrastructure services (11.50%)
12 February 2015 14

SWOT Matrix
12 February 2015 15
STRENGTHS
Extensive global reach
Strong financial performance
Employee management skills
Innovation labs
WEAKNESS
Significant exposure to financial services
market
Lags multinational high end consulting
offerings
Not strong in product segment
OPPORTUNITIES
Focus on SMB segment
Growth in worldwide IT services
Focus on high end business and IT
consulting
Expanding operations in countries like
China
SO Strategy
Market expansion in developing
countries(S1 & S2,O2)
Developing new products(S4,O3)
WO Strategy
Exposure to financial services
market(W1,O2)
Improving product SMB segment(W3,O1)
THREATS
Increasing employee costs
Intense competition from foreign firms
like Accenture, IBM, etc.
Economic uncertainty and currency
fluctuation
Increased competition from low-wage
countries like China, Indonesia etc.
ST Strategy
Tackle the market by innovative labs(S4,T2
& T4)
Acquisition of new companies related to
their business(S2,T2)
WT Strategy
Focus on high end consultancy
offerings(W2,T2)
Acquisition of small companies in
financial services marker(W1,T3)
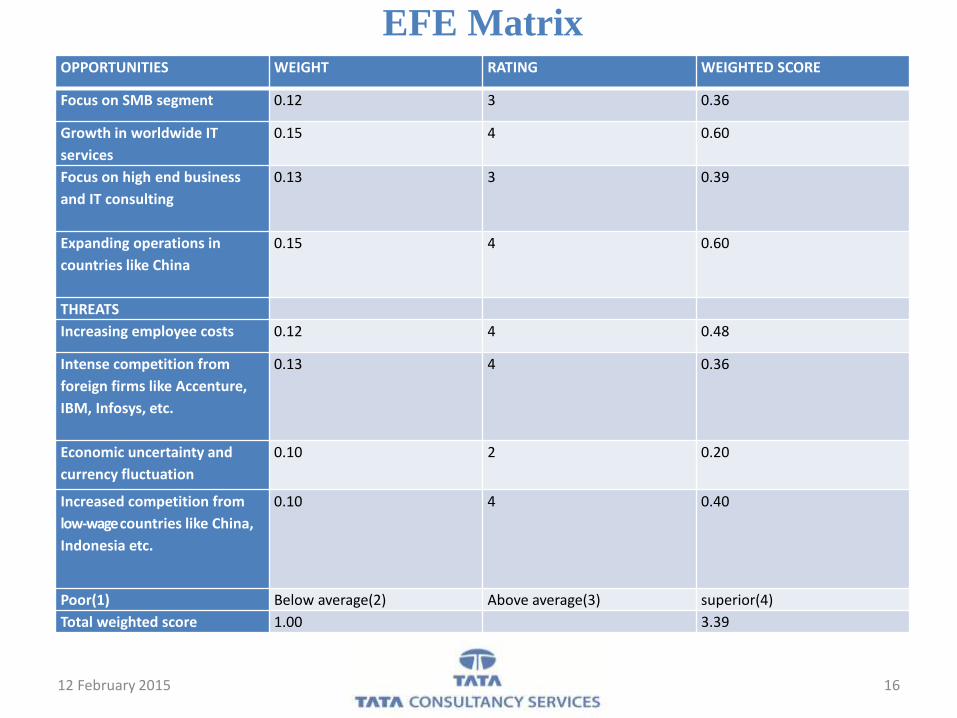
EFE Matrix
12 February 2015 16
OPPORTUNITIES WEIGHT RATING WEIGHTED SCORE
Focus on SMB segment 0.12 3 0.36
Growth in worldwide IT
services
0.15 4 0.60
Focus on high end business
and IT consulting
0.13 3 0.39
Expanding operations in
countries like China
0.15 4 0.60
THREATS
Increasing employee costs 0.12 4 0.48
Intense competition from
foreign firms like Accenture,
IBM, Infosys, etc.
0.13 4 0.36
Economic uncertainty and
currency fluctuation
0.10 2 0.20
Increased competition from
low-wage countries like China,
Indonesia etc.
0.10 4 0.40
Poor(1) Below average(2) Above average(3) superior(4)
Total weighted score 1.00 3.39

IFE Matrix
12 February 2015 17
INTERNAL STRENGTHS WEIGHT RATING WEIGHTED
SCORE
Extensive global reach 0.20 4 0.80
Strong financial performance 0.15 4 0.60
Employee management skills 0.15 3 0.45
Innovation labs 0.13 3 0.39
INTERNAL WEAKNESS
Significant exposure to financial services market 0.12 2 0.24
Lags multinational rivals in high end consulting offerings 0.15 2 0.30
Not strong in product segment 0.10 1 0.10
Major weakness(1) Minor
weakness(2)
Minor
strengths(3)
Major
strengths(4)
Total weighted score 1.00 2.88

IE Matrix
Strong
3.0 to 4.0
Average
2.0 to 2.99
Weak
1.0 to 1.99
EFE Total
Weighted
Scores
High 3.0 to 4.0
GROW AND BUILD
Medium
2.0 to 2.99
Low
1.0 to 1.99
12 February 2015 18
IFE Total
Weighted
Scores
EFE Total
Weighted
Scores

SPACE Matrix
12 February 2015 19
INTERNAL STRATEGIC POSITION EXTERNAL STRATEGIC POSITION
Financial Strength (FS): 1 to 6
ROI - 4
Liquidity - 4
Working Capital - 5
Cash flow - 5
Industry Strength (IS): 1 to 6
Growth Potential - 4
Profit Potential - 4
Financial Stability - 5
Technological Know-how - 5
Resource Utilization - 4
Competitive Advantage (CA): -1 to -6
Market Share - -1
Product quality - -2
Product life cycle - -3
Customer loyalty - -2
Know-how - -1
Environmental Stability (ES): -1 to -6
Technological Changes - -2
Inflation - -4
Demand variability - -3
Barriers to entry - -2
Competitive Pressure - -1

SPACE Matrix- Graph
12 February 2015 20

GRAND Strategy Matrix
Rapid market growth
Weak competitive position
Slow market growth
Strong competitive position
1. Market penetration2. Product development3. Forward integration4. Backward integration5. Horizontal integration6. Related diversification7. Market development
12 February 2015 21

QSPM Matrix
12 February 2015 22
MARKET PENETRATION PRODUCT DEVELOPMENT
KEY FACTORS WEIGHT ATTRACTIVE SCORE TOTAL ATTRACTIVE SCORE TOTAL
STRENGTHS
Extensive global reach 0.20 4 0.80 4 0.80
Strong financial performance 0.15 3 0.45 3 0.45
Employee management skills 0.15 3 0.45 2 0.30
Innovation labs 0.13 2 0.26 4 0.52
WEAKNESS
Significant exposure to
financial services market
0.12 3 0.36 3 0.36
Lags multinational rivals in
high end consulting offerings
0.15 3 0.45 4 0.60
Not strong in product
segment
0.10 2 0.20 3 0.30
Total Weights 2.97 3.33
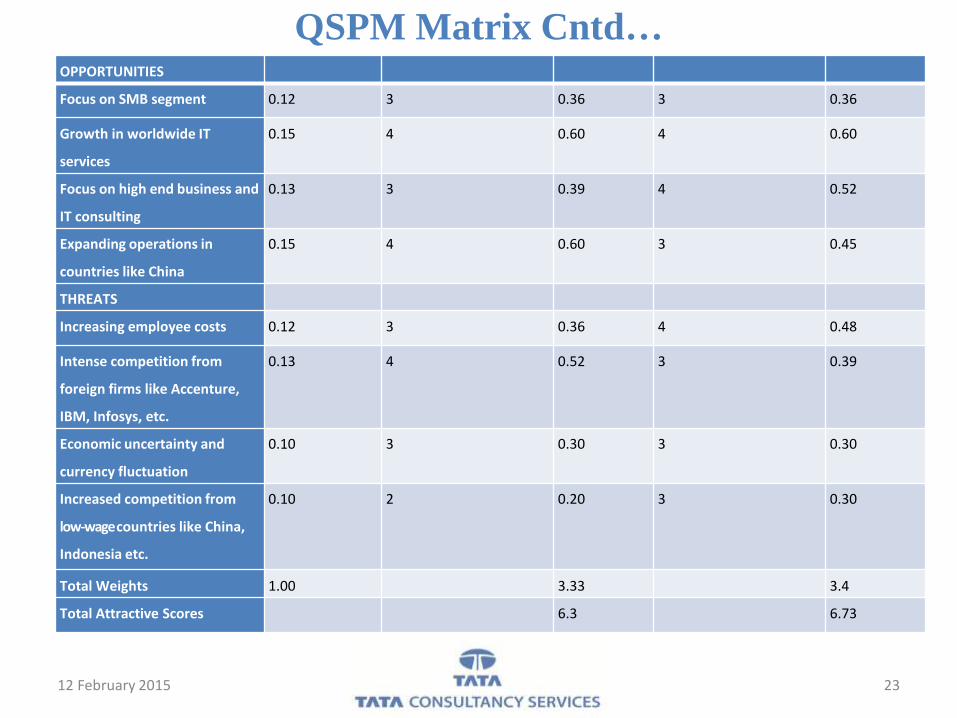
QSPM Matrix Cntd…
12 February 2015 23
OPPORTUNITIES
Focus on SMB segment 0.12 3 0.36 3 0.36
Growth in worldwide IT
services
0.15 4 0.60 4 0.60
Focus on high end business and
IT consulting
0.13 3 0.39 4 0.52
Expanding operations in
countries like China
0.15 4 0.60 3 0.45
THREATS
Increasing employee costs 0.12 3 0.36 4 0.48
Intense competition from
foreign firms like Accenture,
IBM, Infosys, etc.
0.13 4 0.52 3 0.39
Economic uncertainty and
currency fluctuation
0.10 3 0.30 3 0.30
Increased competition from
low-wage countries like China,
Indonesia etc.
0.10 2 0.20 3 0.30
Total Weights 1.00 3.33 3.4
Total Attractive Scores 6.3 6.73

THANK YOU
12 February 2015 24