Embed Size (px)
Citation preview

Quantify and Visualize Coding Commitment
Social Network Analysis
Nan(Miya) WangMay 25, 2016

Executive Summary
This project is, through applying techniques of graph theory and social
network analysis, to uncover coding commitment of each individual developer
in a certain organization and to detect collaboration communities among
those developers.
2
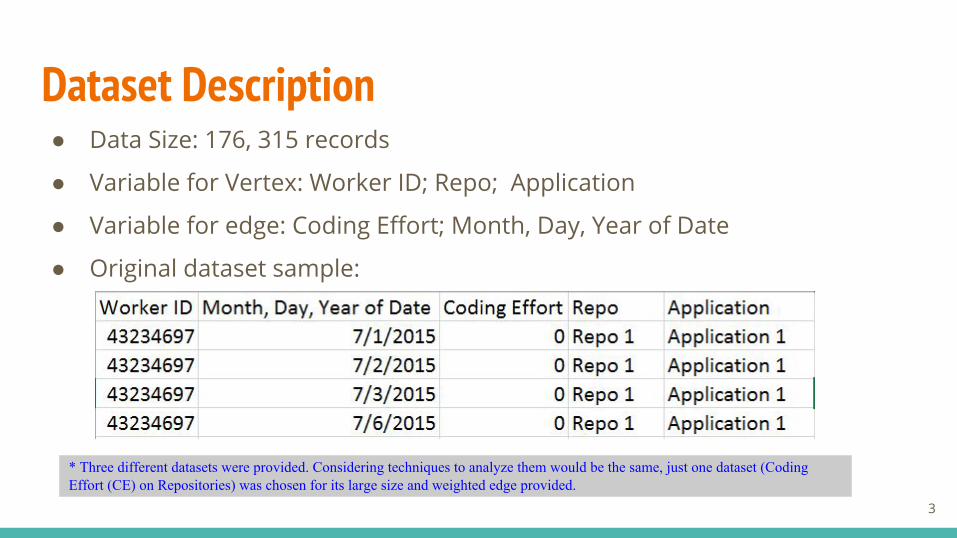
Dataset Description● Data Size: 176, 315 records
● Variable for Vertex: Worker ID; Repo; Application
● Variable for edge: Coding Effort; Month, Day, Year of Date
● Original dataset sample:
* Three different datasets were provided. Considering techniques to analyze them would be the same, just one dataset (Coding Effort (CE) on Repositories) was chosen for its large size and weighted edge provided.
3

Methodology
Data Preparation(Pandas)
● Delete missing values● Convert to adjacency
matrix
Network Analysis Techniques(igraph)
● Network Properties● Algorithms
(PageRank, fastgreedy, walktrap, Girvan-Newman, Modularity)
Visualization(igraph)
4

Tool Selection----igraph
5

AnalysisDeveloper - Repository
6

Underlying Structure between Repositories and Workers● Bipartite(Repo, Worker),
undirected, weighted;
● 4,326 vertex, 172,354 edges
● Weight of edge->width of links
● Degree of vertex->size of labels
● Type of vertex->color of labels
* pdf version of the graph can be downloaded here:https://drive.google.com/open?id=0BwKb7U5w2Eq-dDhQeUhfNGEzRFU 7
Samples of Interpreting Graph
8

● 139 is a large
repository where lots
of developers
contribute hard to it.
● Repos share
developers, e.g.
developer 43329022
works for repository
139 as well as Repo
588 and Repo 557.
9
Grey vertex: DeveloperBlack vertex: Repo

● Among all repos shown
here, Repo 248 has the
most developers
contributing to it.
● Developer 43419067
works hard on Repo 456,
Repo 33, repo 399 and
Repo 400.
● Developer 43287957
contributes more to
Repo 456 than
Developer 43419067.
10

● Repo 200 is an ‘isolated’
repository. Developers
contribute exclusively to it.
● Developer 43407981 plays an important role
in many repositories(1505, 1506, 799, 1507
and 1509) and tends to work independently.11

12
● Orange vertex with many
pink edges(e.g. 43400968)
represents productive
developer.
● Orange vertex with more
green edges (e.g. 43352366)
represents diligent but
maybe inefficient developer.
● Blue vertex with fewer
edges(e.g. 4309023) are
probably reviewers.
Orange vertex: higher degreePink link: higher weight
* pdf version of the graph can be downloaded here:https://drive.google.com/open?id=0BwKb7U5w2Eq-LTJiNjlTaWpfZDQ

AnalysisDeveloper - Developer
13

Underlying Structure of Developer Collaboration and Communities● one-mode, undirected, weighted;
● 2,621 vertex, 30,689 edges;
● Weight of edge->width of links;
● Community ---> vertex color;
* user-interactive version of the graph can be downloaded here:https://drive.google.com/open?id=0BwKb7U5w2Eq-d29tak14T0o4MW8
14

Statistical Properties of Network
15

● Independent Developers(work in isolation, not within a team)--> Vertex with degree of 0:
[1] 1 4 11 18 22 23 30 32 39 43 47 50 71 77 80 81 92 94[19] 97 101 107 110 132 137 151 152 163 172 175 177 179 186 214 216 221 229[37] 238 248 265 266 308 313 314 340 342 349 350 372 378 381 407 410 415 422[55] 435 443 444 466 469 473 476 505 538 550 569 591 606 608 612 618 627 635[73] 649 652 655 657 659 660 671 695 704 706 711 724 754 757 776 808 815 821[91] 824 848 857 877 879 885 906 914 920 947 967 971 990 1007 1010 1019 1021 1023[109] 1039 1051 1065 1085 1086 1090 1091 1111 1116 1125 1128 1133 1139 1148 1166 1174 1184 1193[127] 1217 1221 1240 1241 1259 1288 1296 1297 1324 1345 1350 1367 1384 1408 1422 1424 1438 1466[145] 1475 1480 1486 1503 1508 1518 1533 1543 1549 1558 1570 1585 1587 1589 1603 1623 1630 1633[163] 1654 1681 1691 1694 1713 1719 1735 1756 1759 1763 1765 1773 1784 1791 1806 1810 1822 1834[181] 1838 1880 1896 1913 1927 1934 2034 2047 2059 2060 2064 2096 2114 2127 2129 2134 2140 2158[199] 2160 2178 2183 2196 2199 2232 2243 2246 2257 2258 2261 2295 2302 2349 2355 2370 2453 2525[217] 2552 2571 2575 2577 2579 2586 2592 2595 2611 2613
● Most developers work in teams and one developer works with 23 coworkers on average.
16

● Developers who have quickest access to most Repositories --->high betweenness
"43410636" "43418822" "43400529" "43348316" "43290835" "43347759" "43277458" "43343250" "43294351" "43245980" "37006522" "196883" "43342988" "43423842" "43406714" "43194155" "43340158" "43368494" "43419048" "43326028"
● Principal developer or ‘developer manager’ ----> high betweenness, low degree e.g. 43408535 (degree: 2, betweenness:1596)
● Developers who have greatest resources ----> Eigenvector centrality
"43368220" "43365735" "43368221" "43368218" "43370348" "310073" "43392237" "43386237" "43360753" "43382815" "43391333""43397119" "43374637" "43362659" "43348643" "43390637" "43374630" "43316840" "43368927" "43368338"
● Top Developers (productive people work with productive people) ----> PageRank "43277458" "43401504" "43353031" "43373296" "43356224" "43308593" "43368220" "43365735" "43222112" "43410636"
● Average Coding contribution ---> average edge weight: 1.24
17

Community Detection
18

● Algorithm Comparison:
● 161 communities detected using Fastgreedy, among which the largest
Community contains 173 developers while the smallest has just one
developer.
Algorithm Modularity Weighted
Fastgreedy 0.923828 True
Walktrap 0.9156959 True
leading.eigenvector
0.9213067 False
label.propagation 0.9096524 False
19

● Three communities
detected here.
● Developer 43294351,
43277458, 43394432
work on multiple
teams(communities)
20

● Degree distribution
● Developer---> high degree"43327396" "43168106" "43352379" "43390513" "43400964" "74001005" "43312915" "43409136" "43393595" "43264650"
● Reviewer-----> low degree"43186619" "43212185" "43325447" "43382344" "43409030" "43345552" "43380623" "43398131" [9] "43415955" "43416991"
Largest Team
21

Limitation
● Graph Visualization:
❖ Explicitness
❖ Interactivity
❖ Aesthetic
● Community Detection:
❖ Synchronization
22

Interesting Analysis: Developers work in different patterns.
Some distribute their work evenly in a given time period.
23
Some like ‘centralized-processing’ tasks.

Reviews24
● SNA(social network analysis) is powerful at
rendering complicatied and intangible
things understandable.
● Visualization, the most challenging part of
SNA, is art rather than science.
● How to handle large datasets remains a big
problem. Memory limitation stinks.
Take a look at this hilarious
hairball I made at the
begining!

Thank You!25