Embed Size (px)
Citation preview
Dirty Data? Clean it up!Or, how to do data science in the real world.
Dan LynnCEO, AgilData
Patrick RussellIndependent Consultant (formerly Data Science @Craftsy) @[email protected]
© Phil Mislinksi - www.pmimage.com
Patrick Russell - BassData Scientist between things ;)
Dan Lynn - GuitarCEO, AgilData
© Phil Mislinksi - www.pmimage.com
EXPERT SOLUTIONS AND SERVICES FOR COMPLEX DATA PROBLEMS
At AgilData, we help you get the most out of your data. We provide Software and Services to help firms deliver on
the promise of Big Data and complex data infrastructures:
● AgilData Scalable Cluster for MySQL – Massively scalable and performant MySQL databases combined
with 24×7 remote managed services for DBA/DevOps
● Trusted Big Data experts to solve problems, set strategy and develop solutions for BI, data
pipeline orchestration, ETL, Data Engineering & DevOps, APIs and custom applications.
www.agildata.com

Hey, you’re a data scientist, right? Great!
We have millions of users. How we can use email to monetize our user base better?
— Marketing

1 / 1 + exp(-x)


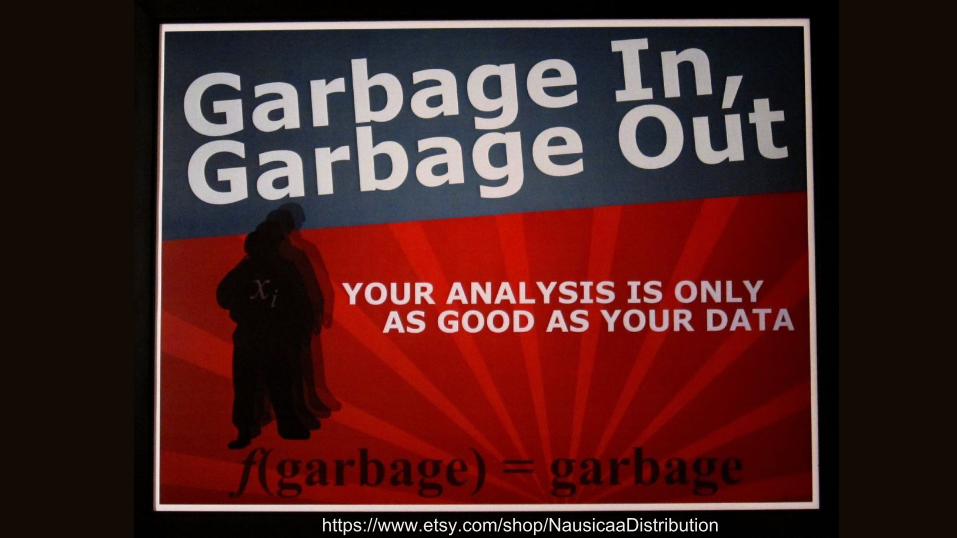
https://www.etsy.com/shop/NausicaaDistribution

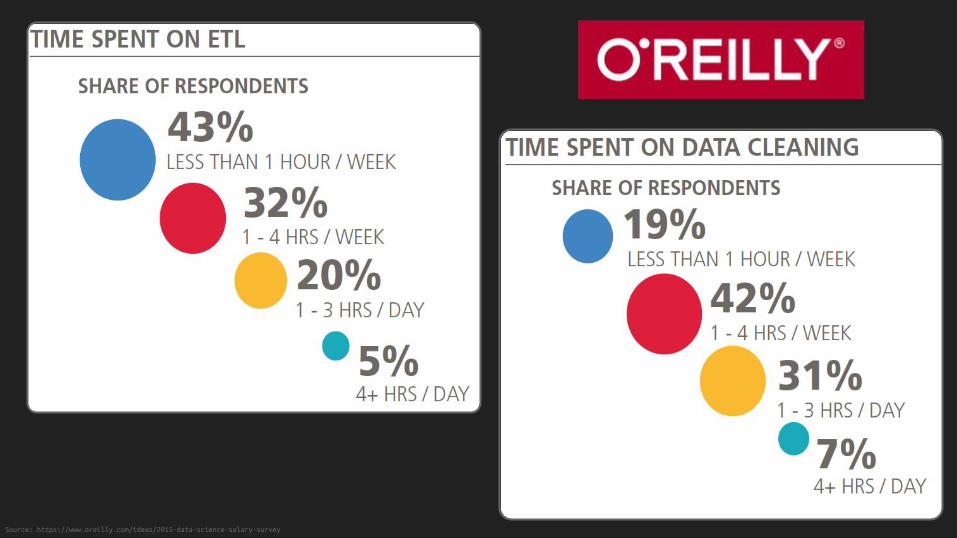
Source: https://www.oreilly.com/ideas/2015-data-science-salary-survey

http://www.lavante.com/the-hub/ap-industry/lavante-and-spend-matters-look-at-how-dirty-vendor-data-impacts-your-bottom-line/
Data Cleansing
Data Cleansing
● Dates & Times
● Numbers & Strings
● Addresses
● Clickstream Data
● Handling missing data
● Tidy Data
Dates & Times
● Timestamps can mean different things○ ingested_date, event_timestamp
● Clocks can’t be trusted○ Server time: which server? Is it synchronized?
○ Client time? Is there a synchronizing time scheme?
● Timezones○ What tz is your own data in?
○ Your email provider? Your adwords account? Your Google Analytics?
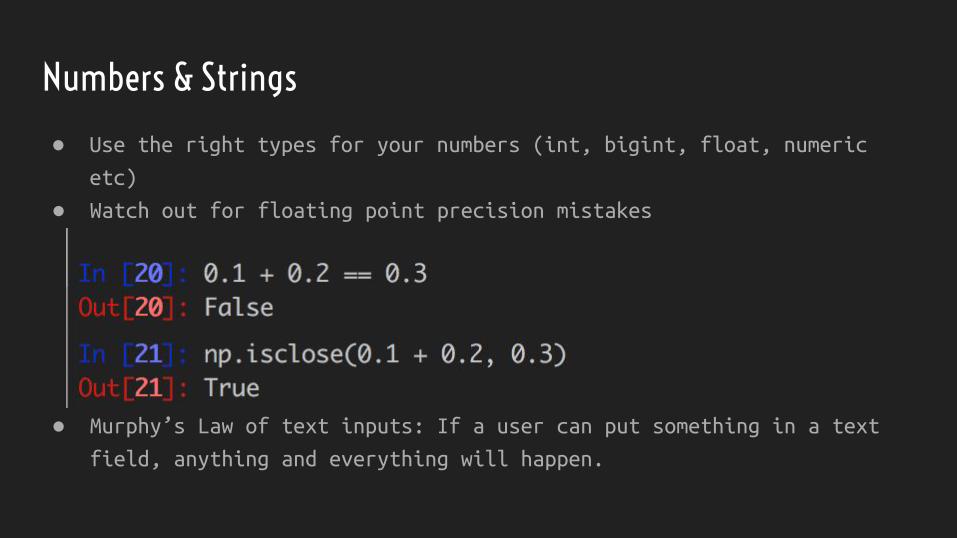
Numbers & Strings
● Use the right types for your numbers (int, bigint, float, numeric
etc)
● Murphy’s Law of text inputs: If a user can put something in a text
field, anything and everything will happen.
● Watch out for floating point precision mistakes
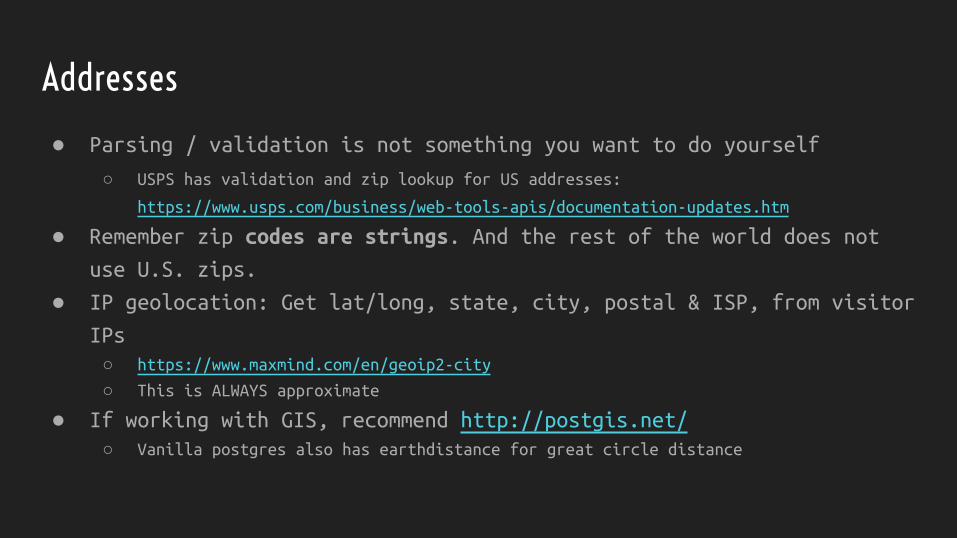
Addresses
● Parsing / validation is not something you want to do yourself
○ USPS has validation and zip lookup for US addresses:
https://www.usps.com/business/web-tools-apis/documentation-updates.htm
● Remember zip codes are strings. And the rest of the world does not
use U.S. zips.
● IP geolocation: Get lat/long, state, city, postal & ISP, from visitor
IPs○ https://www.maxmind.com/en/geoip2-city
○ This is ALWAYS approximate
● If working with GIS, recommend http://postgis.net/○ Vanilla postgres also has earthdistance for great circle distance

Clickstream Data
● User agent => Device: Don’t do this yourself (we use WURFL and Google
Analytics)
● Query strings follow the rules of text. Everything will show up○ They might be truncated
○ URL encoding might be missing characters (%2 instead of %20)
○ Use a library to parse params (ie Python ships with urlparse.parse_qs)
● If your system creates sessions (tomcat, Google Analytics), don’t be
afraid to create your own sessions on top of the pageview data○ You’ll get cross channel and cross device behavior this way
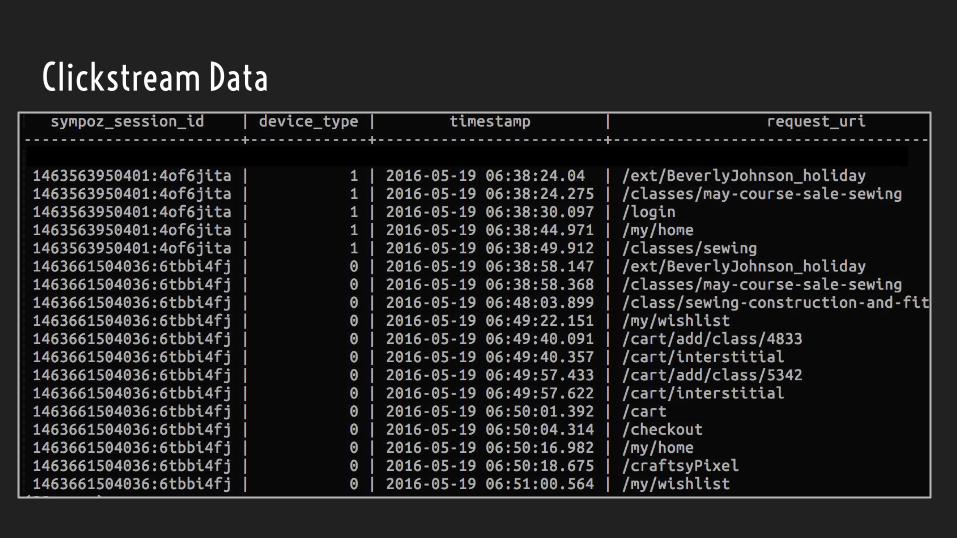
Clickstream Data
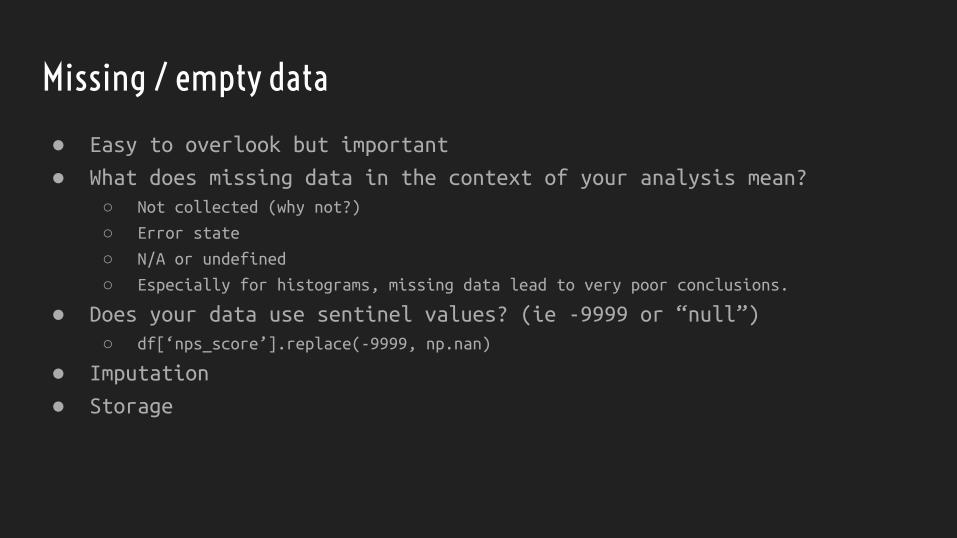
Missing / empty data
● Easy to overlook but important
● What does missing data in the context of your analysis mean?○ Not collected (why not?)
○ Error state
○ N/A or undefined
○ Especially for histograms, missing data lead to very poor conclusions.
● Does your data use sentinel values? (ie -9999 or “null”)○ df[‘nps_score’].replace(-9999, np.nan)
● Imputation
● Storage

Tidy Data
● Conceptual framework for structuring data for analysis and fitting○ Each variable forms a column
○ Each observation is a row
○ Each type of observational unit forms a table
● Pretty much normal form from relational databases for stats
● Tidy can be different depending on the question asked
● R (dplyr, tidyr) and Python (pandas) have functions for making your
long data wide & wide data long (stack, unstack, melt, pivot)
● Paper: http://vita.had.co.nz/papers/tidy-data.pdf
● Python tutorial: http://tomaugspurger.github.io/modern-5-tidy.html
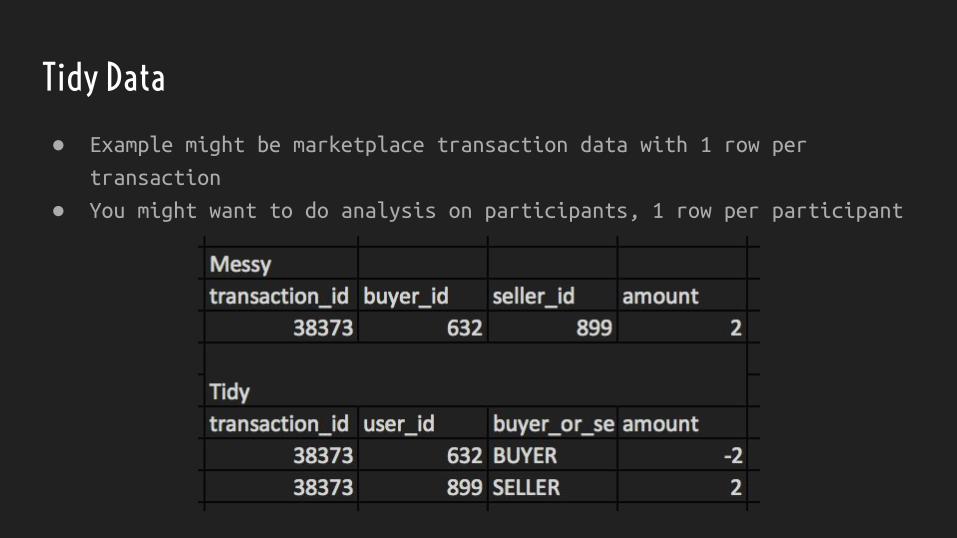
Tidy Data
● Example might be marketplace transaction data with 1 row per
transaction
● You might want to do analysis on participants, 1 row per participant
Hey, that’s a great model. How can we build it into our decision-making process?
— Marketing
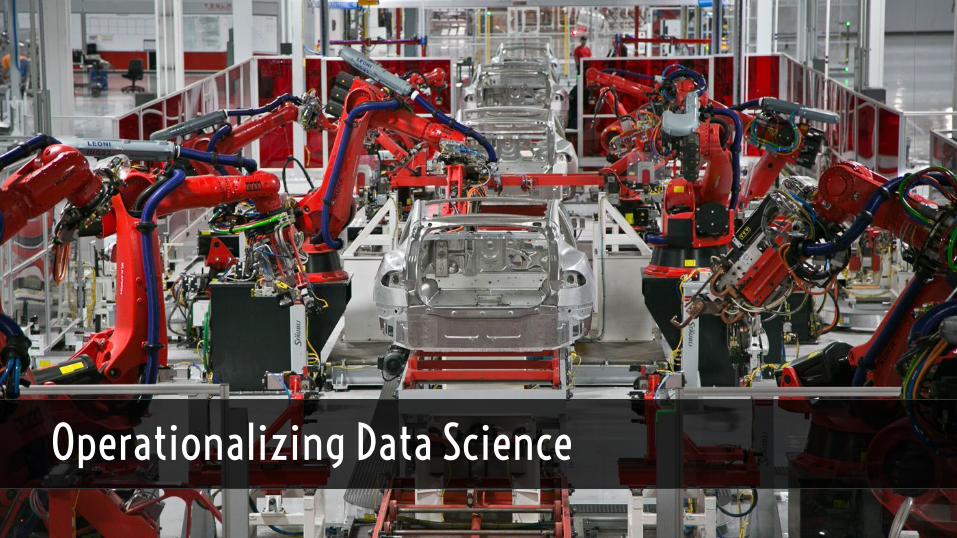
Operationalizing Data Science
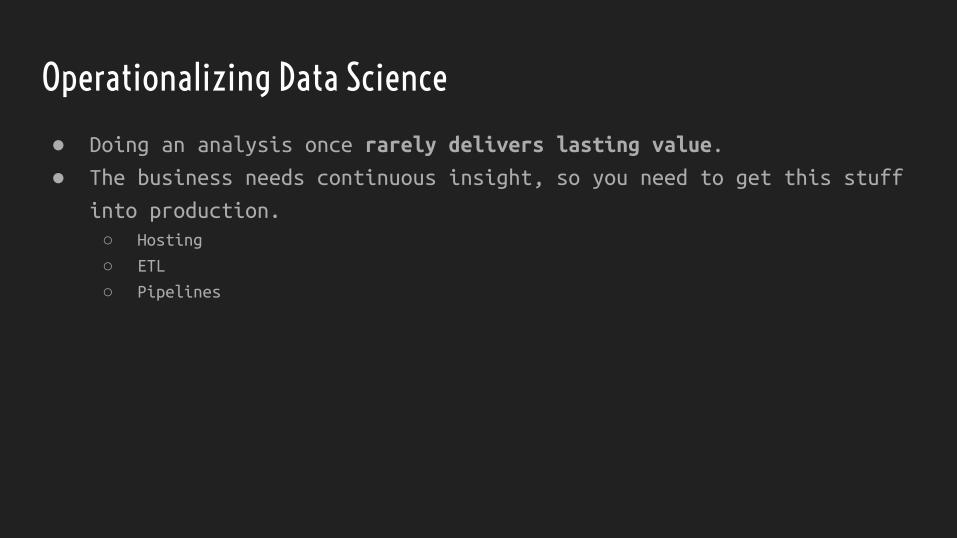
● Doing an analysis once rarely delivers lasting value.
● The business needs continuous insight, so you need to get this stuff
into production.○ Hosting
○ ETL
○ Pipelines
Operationalizing Data Science
Hosting
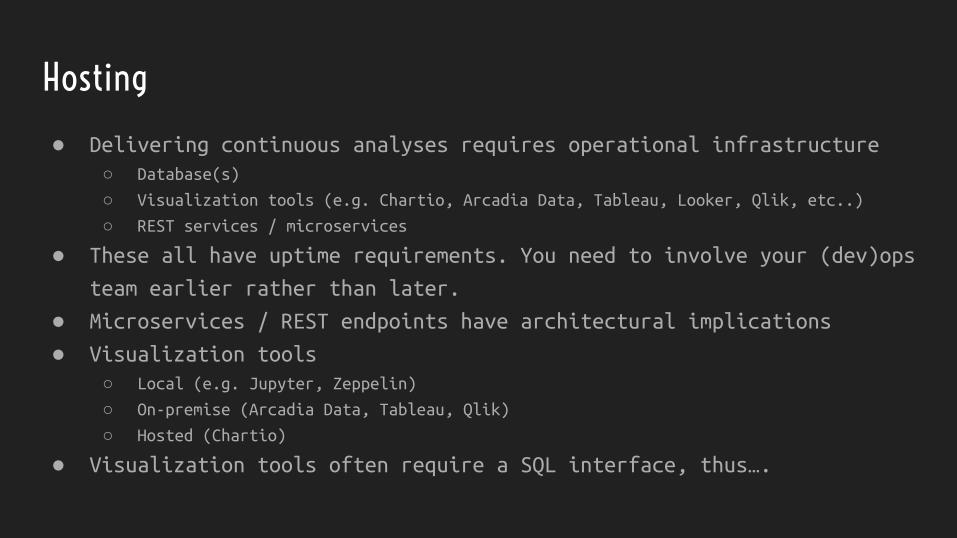
● Delivering continuous analyses requires operational infrastructure○ Database(s)
○ Visualization tools (e.g. Chartio, Arcadia Data, Tableau, Looker, Qlik, etc..)
○ REST services / microservices
● These all have uptime requirements. You need to involve your (dev)ops
team earlier rather than later.
● Microservices / REST endpoints have architectural implications
● Visualization tools○ Local (e.g. Jupyter, Zeppelin)
○ On-premise (Arcadia Data, Tableau, Qlik)
○ Hosted (Chartio)
● Visualization tools often require a SQL interface, thus….
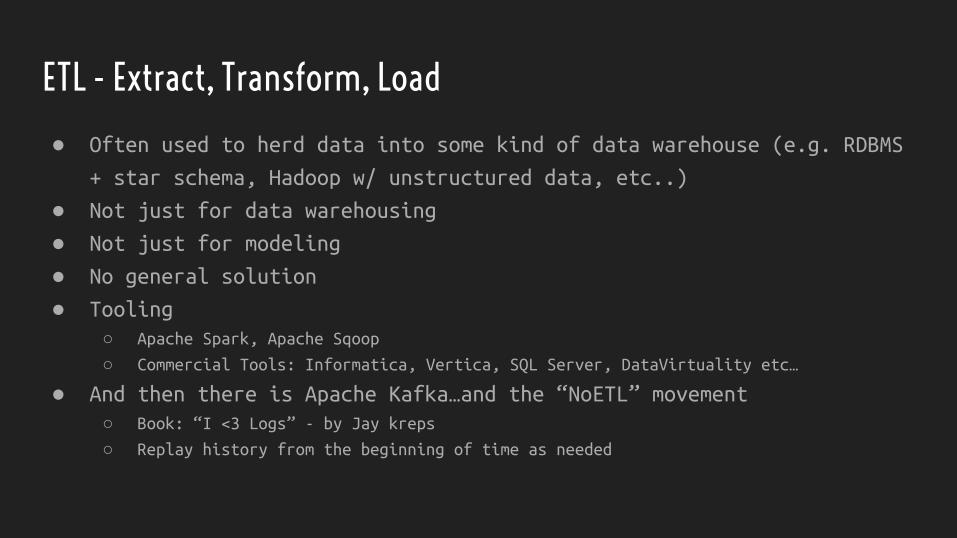
ETL - Extract, Transform, Load
● Often used to herd data into some kind of data warehouse (e.g. RDBMS
+ star schema, Hadoop w/ unstructured data, etc..)
● Not just for data warehousing
● Not just for modeling
● No general solution
● Tooling○ Apache Spark, Apache Sqoop
○ Commercial Tools: Informatica, Vertica, SQL Server, DataVirtuality etc…
● And then there is Apache Kafka…and the “NoETL” movement○ Book: “I <3 Logs” - by Jay kreps
○ Replay history from the beginning of time as needed
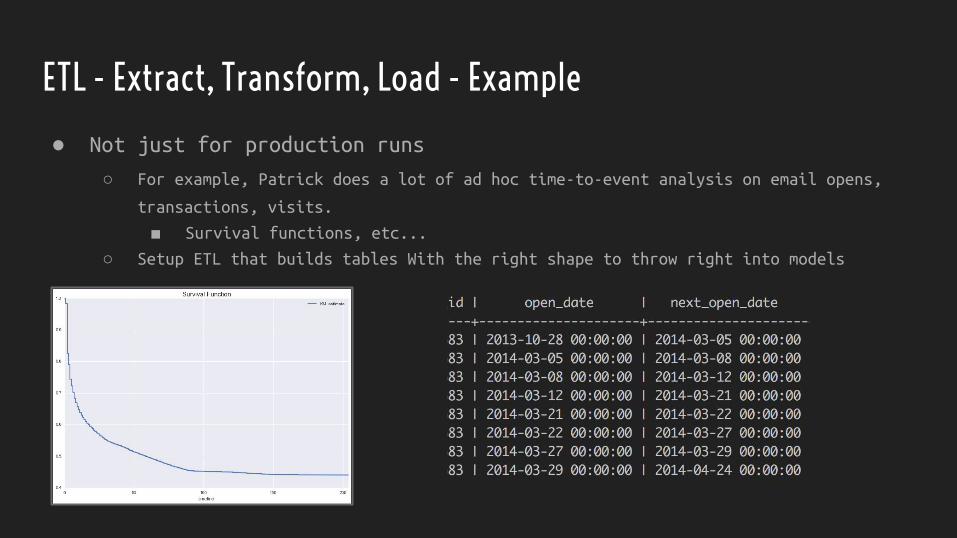
ETL - Extract, Transform, Load - Example
● Not just for production runs
○ For example, Patrick does a lot of ad hoc time-to-event analysis on email opens,
transactions, visits.
■ Survival functions, etc...
○ Setup ETL that builds tables With the right shape to throw right into models
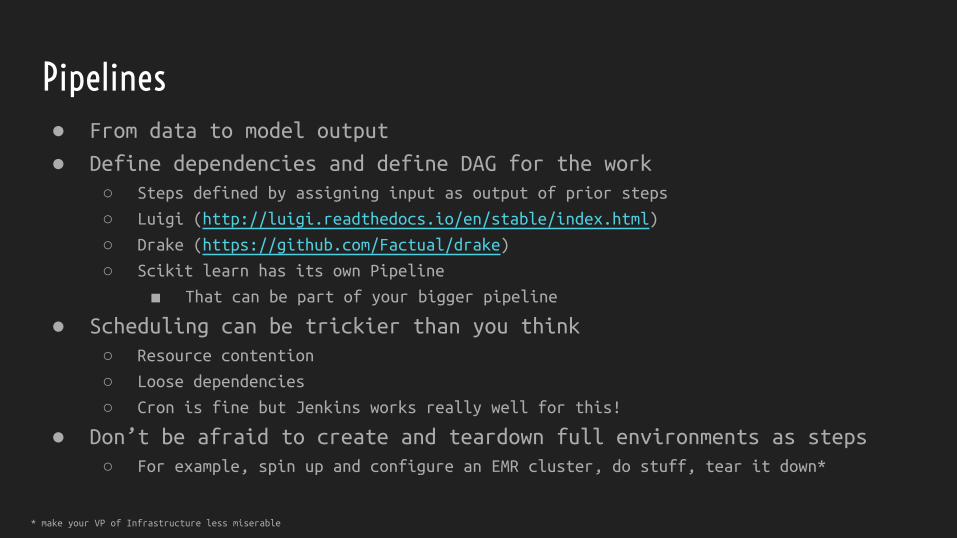
Pipelines● From data to model output
● Define dependencies and define DAG for the work○ Steps defined by assigning input as output of prior steps
○ Luigi (http://luigi.readthedocs.io/en/stable/index.html)
○ Drake (https://github.com/Factual/drake)
○ Scikit learn has its own Pipeline
■ That can be part of your bigger pipeline
● Scheduling can be trickier than you think○ Resource contention
○ Loose dependencies
○ Cron is fine but Jenkins works really well for this!
● Don’t be afraid to create and teardown full environments as steps○ For example, spin up and configure an EMR cluster, do stuff, tear it down*
* make your VP of Infrastructure less miserable
Pipelines - Luigi
● Written in Python. Steps implemented by subclassing Task
● Visualize your DAG
● Supports data in relational DBs, Redshift, HDFS, S3, file system
● Flexible and extensible
● Can parallelize jobs
● Workflow runs by executing last step which schedules all dependencies

Pipelines - Luigi
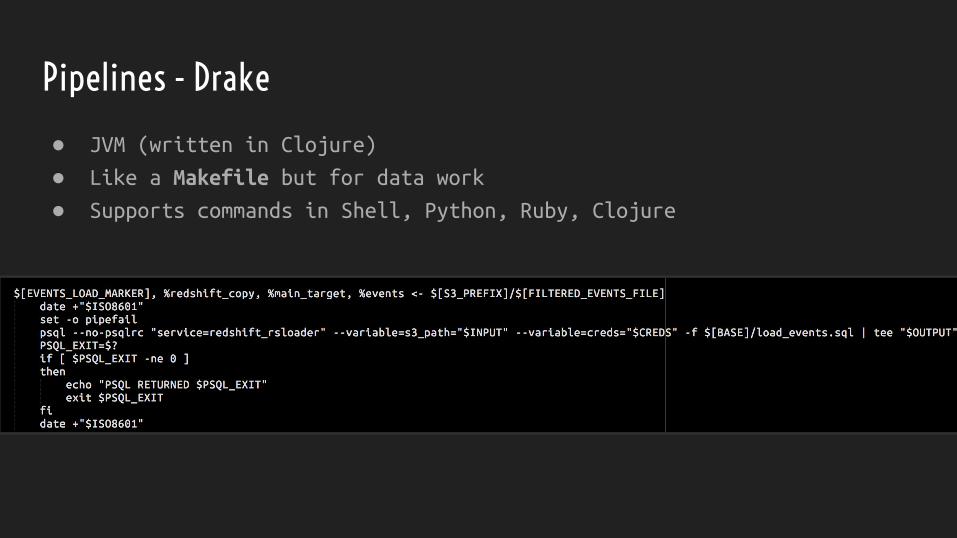
Pipelines - Drake
● JVM (written in Clojure)
● Like a Makefile but for data work
● Supports commands in Shell, Python, Ruby, Clojure
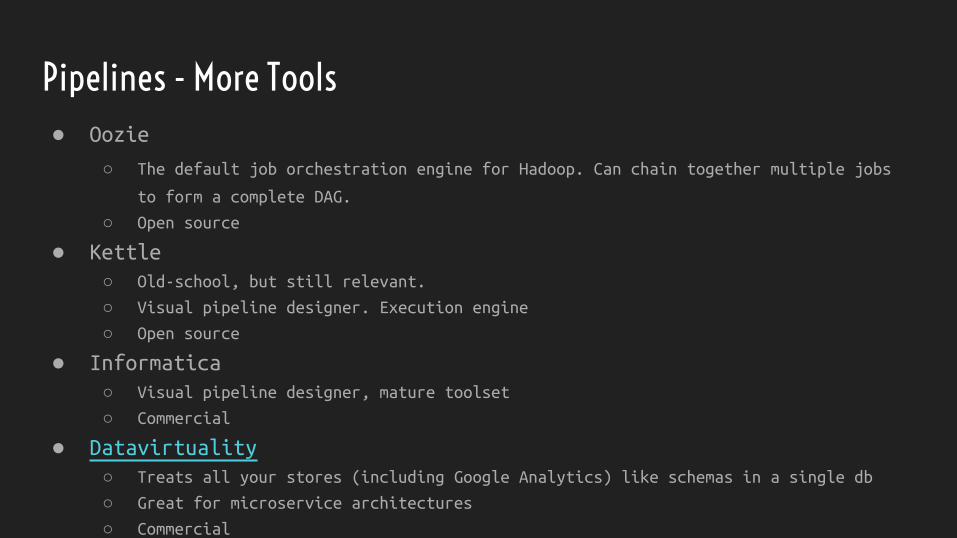
Pipelines - More Tools● Oozie
○ The default job orchestration engine for Hadoop. Can chain together multiple jobs
to form a complete DAG.
○ Open source
● Kettle○ Old-school, but still relevant.
○ Visual pipeline designer. Execution engine
○ Open source
● Informatica○ Visual pipeline designer, mature toolset
○ Commercial
● Datavirtuality ○ Treats all your stores (including Google Analytics) like schemas in a single db
○ Great for microservice architectures
○ Commercial
References
● I Heart Logs○ http://www.amazon.com/Heart-Logs-Stream-Processing-Integration/dp/1491909382
● Tidy Data○ http://vita.had.co.nz/papers/tidy-data.pdf
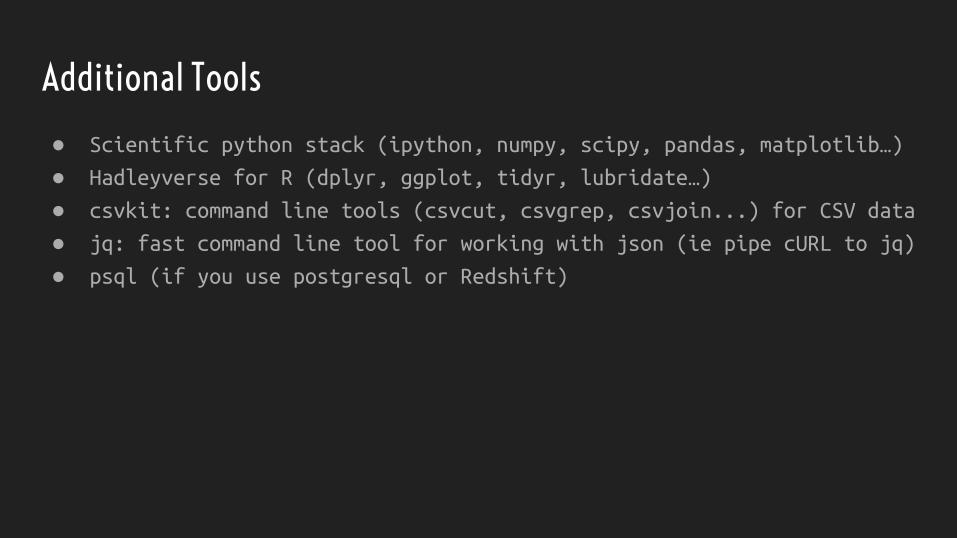
Additional Tools
● Scientific python stack (ipython, numpy, scipy, pandas, matplotlib…)
● Hadleyverse for R (dplyr, ggplot, tidyr, lubridate…)
● csvkit: command line tools (csvcut, csvgrep, csvjoin...) for CSV data
● jq: fast command line tool for working with json (ie pipe cURL to jq)
● psql (if you use postgresql or Redshift)