Embed Size (px)
Citation preview

A joint research study by
PAS and mediabank
Jan 2014 – Dec 2014

For query on DATA, please contact Mr. Chander Kant Media Bank at:
If you have any other questions, please contact PAS at:
DATA SOURCE: MEDIA BANK
DATA DEFINITIONS
– Commercial airtime: Prime time Vs non prime time, excluding channels own promos
– Spot advertising: Purchased ads e.g. 30”, 15”, etc.
– Sponsorship: Commercial sponsorship
– Channel’s own Promotion: Programming promos, songs, channel ID, etc.
– Advertising: All commercial formats including station promos, sponsorships, etc.
About the TV Clutter Report
ASSUMPTIONS
Total broadcast minutes has been derived from the assumption that all channels broadcast 24 hours a day every day
This document focuses on the various aspects of commercial airtime on TV for the period Jan 2014-Dec 2014. The report includes various form of analysis on clutter in terms of average minutes of advertising and number of spots. It shows a comparative study of channels own promotion vs. commercial airtime and advertising as a % of total broadcasting time. It also gives minutes of advertising on various channels against the legal limit as defined by PEMRA. In addition, here, are also sharing some facts established by international studies conducted by reputed research houses.

MILLWARD BROWN: Effect of Clutter
AD CLUTTER explains nearly three quarters of variation in ad impact
400 to 500 ads per week results in 8% decline in average ad impact. People in Pakistan are exposed to 627 to 1,097 ads per week.
Due to clutter:
- Optimal level of media exposure will be different in cluttered media
- More GRP’s required for the same ad impact. In Japan twice GRP’s are required to reach the same effect as required in UK.

MAIN STREAM CHANNELS AVERAGE AIRTIME vs PEMRA LIMIT (Top 20) Period: Jan 14 - Dec 14Ad Type: Based on Spot / TVCs.Time Slot: Prime Time: 19:00 – 22:59
2827
26 2524
2322
2120 19 19 18 18 18 18 18 18 17 17 17
0
5
10
15
20
25
30

AVERAGE MINUTES OF AIRTIME IN AN HOURPrime Time vs Non Prime TimeGenre: NewsPeriod: Jan 14 - Dec 14
25.9
23.922.9
18.518.2 17.7 17.7 17.5 17.1
16.015.3
13.7
11.0 11.0
7.910.0
11.2 12.1
8.9
13.2
11.38.7
9.112.4
10.0
12.8
4.7
2.53.3
6.9
0
5
10
15
20
25
30 AVG Prime Time AVG Non Prime Time
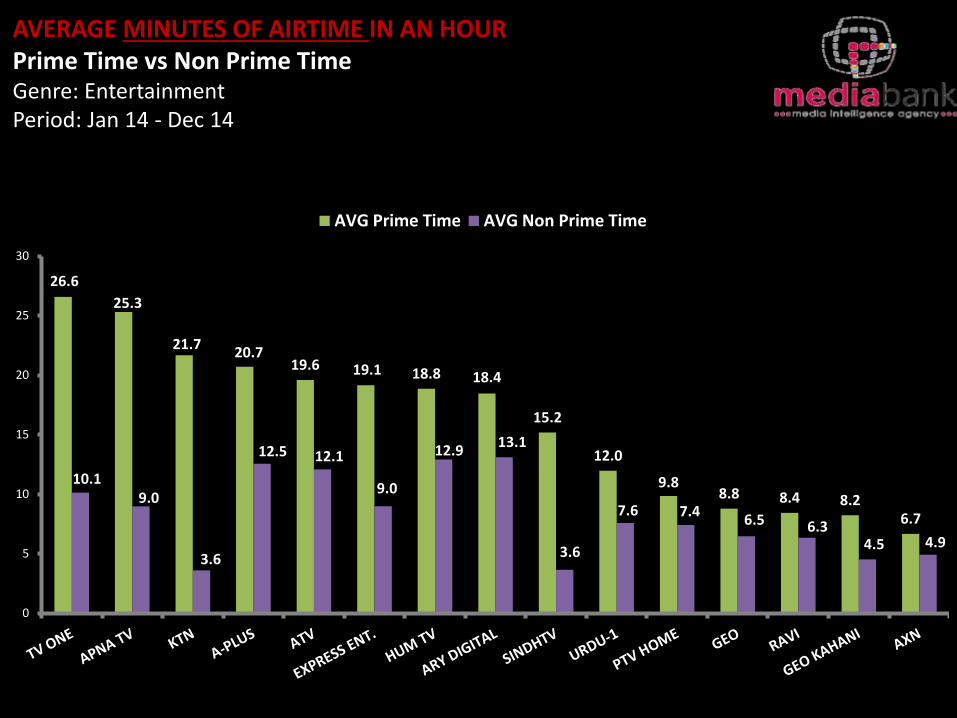
26.6
25.3
21.720.7
19.6 19.1 18.8 18.4
15.2
12.0
9.88.8 8.4 8.2
6.7
10.19.0
3.6
12.5 12.1
9.0
12.913.1
3.6
7.6 7.46.5 6.3
4.5 4.9
0
5
10
15
20
25
30
AVG Prime Time AVG Non Prime Time
AVERAGE MINUTES OF AIRTIME IN AN HOURPrime Time vs Non Prime TimeGenre: EntertainmentPeriod: Jan 14 - Dec 14

AVERAGE MINUTES OF AIRTIME IN AN HOURChannels Prime Time vs Non Prime TimeGenre: MusicPeriod: Jan 14 - Dec 14
27.9
18.4
8.3
3.5
0.5
13.2
7.8
2.41.4
0.20
5
10
15
20
25
30
8XM JALWA KASHISH OXYGENE PLAY
AVG Prime Time AVG Non Prime Time

AVERAGE MINUTES OF AIRTIME IN AN HOURChannels Prime Time vs Non Prime TimeGenre: OthersPeriod: Jan 14 - Dec 14
7.3 7.2 7.1
6.5
5.6
4.94.5
4.3 4.2
3.5
2.9
2.4
1.7
0.2
4.1
1.72.1 2.0
3.33.0
2.7
1.4
3.4
1.8
1.31.0
1.7
0.1
0
1
2
3
4
5
6
7
8
AVG Prime Time AVG Non Prime Time

AVERAGE NUMBER OF SPOTS IN AN HOURPrime Time vs Non Prime TimeGenre: NewsPeriod: Jan 14 - Dec 14
77.9
62.1
53.949.6
47.5 47.5 47.4 46.9 46.6 46.544.2 42.2
35.1
28.8
20.0
34.0 33.9
25.8
39.2
21.0
28.9
35.8
27.1 25.6
34.2
28.9
36.5
15.3
7.4
18.4
0
10
20
30
40
50
60
70
80
90AVG Prime Time AVG Non Prime Time

AVERAGE NUMBER OF SPOTS IN AN HOURChannels Prime Time vs Non Prime TimeGenre: EntertainmentPeriod: Jan 14 - Dec 14
95.9
85.0
61.0 60.0 58.4 56.752.3 50.1 49.9
46.3
35.1 32.726.5 25.6 24.6
38.433.8
41.838.5
9.5
33.0
10.2
29.423.8
10.9 11.5
20.3 20.3 17.8 12.8
0
20
40
60
80
100
120
AVG Prime Time AVG Non Prime Time

AVERAGE NUMBER OF SPOTS IN AN HOURChannels Prime Time vs Non Prime TimeGenre: MusicPeriod: Jan 14 - Dec 14
90.7
71.6
25.0
10.1
1.8
54.2
29.7
5.53.1 0.5
0
10
20
30
40
50
60
70
80
90
100
8XM JALWA KASHISH OXYGENE PLAY
AVG Prime Time AVG Non Prime Time

AVERAGE NUMBER OF SPOTS IN AN HOURChannels Prime Time vs Non Prime TimeGenre: OthersPeriod: Jan 14 - Dec 14
30.1
24.6 24.0
19.5 19.117.5
13.0 12.410.5
9.48.5
6.8 6.2
0.5
15.7
5.8
7.5
12.2 11.5
6.27.7
3.6
6.4
4.1
6.3
8.5
2.6 0.7
0
5
10
15
20
25
30
35
AVG Prime Time AVG Non Prime Time

CHANNEL PROMOS vs COMMERCIAL AIRTIMEAverage Minutes in an Hour – Prime Time OnlyGenre: NewsPeriod: Jan 14 - Dec 14
25.924.4
23.0
18.6 18.3 17.8 17.7 17.7 17.216.1 15.5
13.9
11.1 11.1
9.3
0.6 0.4 0.5 0.8 0.7 0.4 0.9 1.50.3 0.8
1.2
3.2
1.50.2
1.8
0
5
10
15
20
25
30
Spot/TVC Promo

26.6 26.0
21.820.7
19.619.3 19.0 18.5
16.915.8
14.9
12.2
10.5 10.0
4.43.2
4.2 3.6
1.7
3.1 2.64.1
1.9 2.7
7.0
2.44.0
7.4
4.4
10.1
0
5
10
15
20
25
30
Spot/TVC Promo
CHANNEL PROMOS vs COMMERCIAL AIRTIMEAverage Minutes in an Hour – Prime Time OnlyGenre: EntertainmentPeriod: Jan 14 - Dec 14

Percentage Minutes of AdvertisingPrime Time vs Non Prime TimePeriod: Period: Jan 14 - Dec 14
29%
71%
Prime Time Non Prime Time

Advertising Share As Time BandPeriod: Period: Jan 14 - Dec 14
Late Night11%
Morning Time17%
After Noon25%Evening Time
11%
Prime Time29%
Late Prime Time7%

For query on DATA, please contact Mr. Chander Kant, Media Bank
For other questions, please contact PAS at:
THE END