Embed Size (px)
Citation preview

BUILDING ASOCIAL DASHBOARDKathy Baughman, Brian Costea & Charlie Treadwell | ComBlu, Inc. & Cisco Systems | May 21, 2013
Charlie Treadwell@CharlieAtCisco
Kathy Baughman@ComBlu
Brian Costea@BrianCostea

AGENDA
What is a social dashboard? How do you build it?
DASHBOARD OVERVIEW
Hear from Cisco how they use multiple versions of the
dashboard to report to the C-Suite and give each business
unit the detail they need to make course corrections.
Case Study: CISCO
Walk through the six steps to building a dashboard.
INTERACTIVE ”Build a Dashboard”

DASHBOARD OVERVIEWWHAT IS A DASHBOARD?

DASHBOARD OVERVIEW
Metrics ROI≠

DASHBOARD OVERVIEWAd
voca
cySu
ppor
tFe
edba
ck
• ↑ downloads of product information• # product pages shared• # product reviews shared• # inquiries about product on review sites• # views product demos/video• # views product reviews• # participation levels in contests/promotions
KPI: Generate Product or Brand Consideration• ↑ brand/product consideration• ↑ NPS
KPI: Decrease Cost of Product Support• ↑ # creators/critics in support community
– Customers– FTEs
• # Qs asked in community• # Qs answered by customers• # Qs answered by FTEs in community• ↓cost per Q answered• ↓time to answer• ↓open Qs• ↑positive ratings of content/answers
• ↑ customer satisfaction• ↑ positive word-of-mouth• ↑ revenue• ↓ cost of support
KPI: Drive Product Innovation
• # ideas• # idea comments/refinements• High rating of ideas• # votes/ideas• # creators/critics• # actionable ideas
• Faster time to market• ↓ cost of innovation• ↑ product success
Metrics Business Results
DASHBOARD OVERVIEW
Con
necto
rs t
o S
ou
rces
Targ
et
Metr
icsBlackBox
Web
Transactional
External
SEO Ranking
25Reviews Dwell Time
.152Downloads
216
Community Participation
.867Downloads
.025Emulators, Wish Lists, etc.
36
Community
Admin Tools
Campaign Shares
.101Campaign Open Rate
345RSS Subscription Rate
496

CASE STUDY: CISCO
The CMO
“If we yell louder, we’ll increase our share of
voice in social.”
This is not my CMO.

How we used to measure social media…
50%
30%
10%
10%
May Share of Voice
CiscoCompetitorACompetitorBCompetitorC
40%
40%
5%15%
April Share of Voice+10%

Charlie’s Triforce of Measurement
Objective
Comparisons
Content Success
Marketing Insights
MeasurementTriforce

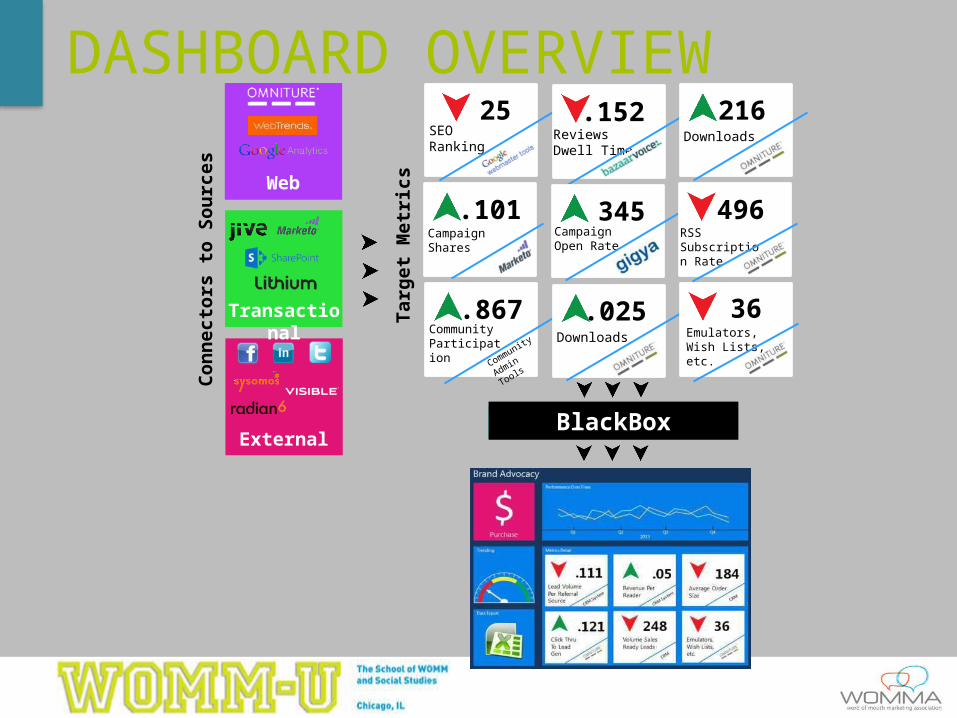
Content Success: Engagement
Inspiration
• Impressions / # of messages• % of impressions to NEW fans
(virality)• Content views, video plays, likes• Fans, followers, subscribers
Discovery
• Sign-ups• Downloads• Opt-Ins• Comments
Design• Click to chat• RFI Request• Vendor/Partner Inquiry
Advocacy
• Shares• @mentions• ReTweets• Embeds• Blog Post Mentions• Content creation
Content Success: Engagement
Average Reach Virality Engagement Total Reach
Sign-ups Downloads Opt-ins Comments
Click-to-Chat RFI/RFP Inquiries
Shares @Mentions Embeds Blog Mentions
0.234+15%
0.012-3%
0.032+35%
0.321+12%
0.013-2%
0.046-12%
.003+22%
0.125-10%
0.210+2%
0.030-12%
0.012+22%
0.124+22%
0.351+26%
0.546+55%
0.026+30%
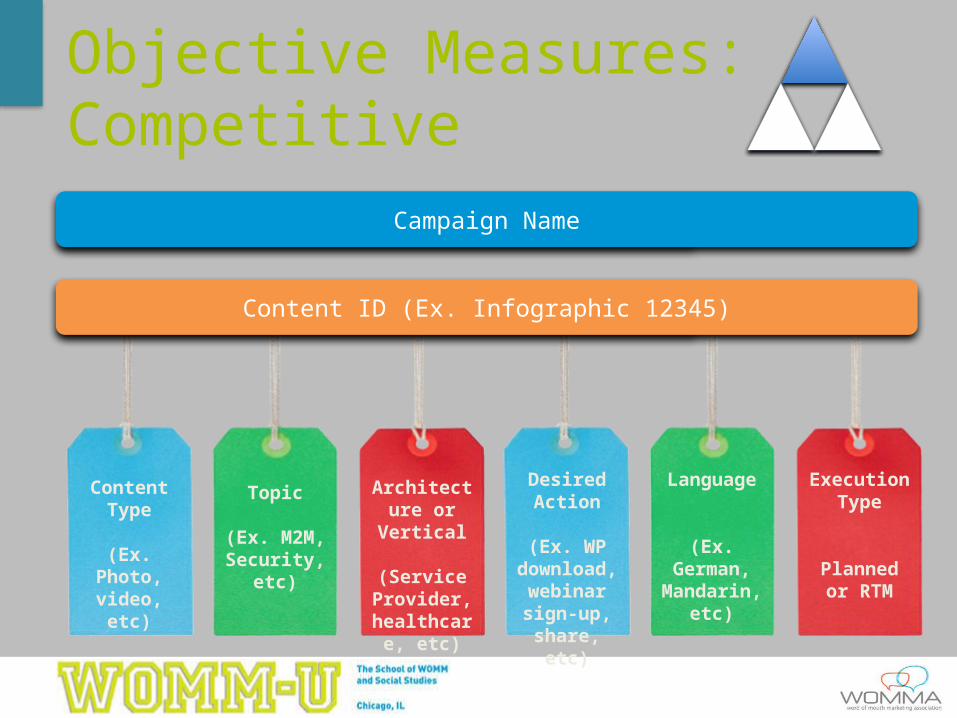
Objective Measures:Competitive
Campaign Name
Content ID (Ex. Infographic 12345)
Topic
(Ex. M2M, Security, etc)
Desired Action
(Ex. WP download,
webinar sign-up, share, etc)
Language
(Ex. German, Mandarin,
etc)
Content Type
(Ex. Photo, video, etc)
Architecture or Vertical
(Service Provider,
healthcare, etc)
Execution Type
Planned or RTM

Sample DashboardReferral Traffic from Social to Cisco.com
Notes:
• Overall Social Networks traffic is down 10% from Q3. This could be attributed to decrease in traffic from blogs and YouTube as LinkedIn, FB, Twitter have all increased in traffic for Q4
• Facebook referred a significant number of visits to Cisco (42% of overall traffic)
• Significant increase in traffic from Twitter this quarter (up 37% from Q3)
• Significant decrease in traffic from YouTube (down nearly 50% from Q3)
Notes:
• Overall conversation score remained steady at 2.61 with no change from Q3
• Majority of Twitter accounts increased in mentions for Q4, with a lift of 50% or more for many
• Significant increase in FB fans for Security and TelePresence, up 87% and 113% respectively
• FB User Posts for Support increased in Q4, up 54%
FY'12 Q1 FY'12 Q2 FY'12 Q3 FY'12 Q40
0.5
1
1.5
2
2.5
3
2.432.76 2.61 2.61
Overall Conversation Score
Conversation Score
Visits
FY'12 Q1 FY'12 Q2 FY'12 Q3 FY'12 Q4300,000
310,000
320,000
330,000
340,000
350,000
360,000
370,000
380,000
390,000
400,000
384,
942
383,
442
369,
997
331,
820
Data source: ComBlu SPI Data source: Omniture SiteCatalyst

Sample Dashboard

Sample Dashboard
• Cisco has a strong presence in all 5 of the top technology pillars
• For Q4 FY12 Cisco lead in competitor share of voice for 3 of 5 of the top technology areas (Data Center, Video, BN)
• Cisco has consistently increased in competitor share of voice for 4 of 5 areas (Data Center, Video, BN, Cloud), indicating strong momentum in social
• BN is where a large portion of our brand mentions come from (50% of total brand mentions)
0%5%
10%15%20%25%30%35%40%45%
Collaboration
0%5%
10%15%20%25%30%35%
Data Center
0%10%20%30%40%50%60%70%80%90%
100%Borderless Networks
0%
5%
10%
15%
20%
25%
30%Cloud
0%
10%
20%
30%
40%
50%Video
Q4 FY11Q4 FY12

CASE STUDY: CISCO
The CMO
Don’t you wish this was your CMO?
“I understand how we’re engaging on social and what content and activities
are moving customers through my purchase funnel. I want to give my
social team more money!”

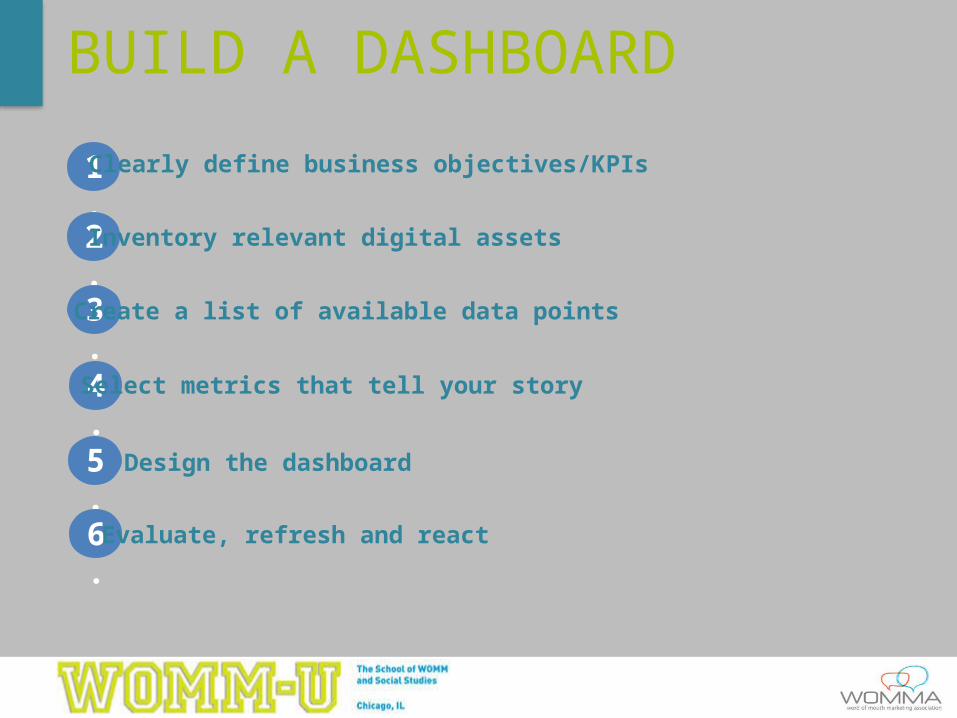
BUILD A DASHBOARD
1.
2.
3.
4.
5.
6.
Inventory relevant digital assets
Clearly define business objectives/KPIs
Create a list of available data points
Select metrics that tell your story
Design the dashboard
Evaluate, refresh and react

BUILD A DASHBOARDScenario: Track and evaluate content performance
Digital Hub(published content)
Article Score Views Shares Avg. Time
Comments
Article Name 10 15,000 150 3:30 25
Article Name 9 12,000 150 3:00 21
Article Name 8 11,000 100 2:32 18
Article Name 7 10,000 90 2:01 12
Article Name 6 9,000 75 1:59 9
Article Name 5 7,000 80 2:15 5
Article Name 5 7,200 65 1:30 5
Article Name 4 5,000 50 1:00 3
Article Name 3 2,000 20 :30 0
Article Name 2 1,000 1 :10 0
Dashboard

BUILD A DASHBOARD
1. Clearly define business objectives/KPIs
• Identify the best content to leverage on marketing sites and CRM outreach
• Track content by category, type and reach
• Identify the best channels to amplify content
BUILD A DASHBOARD
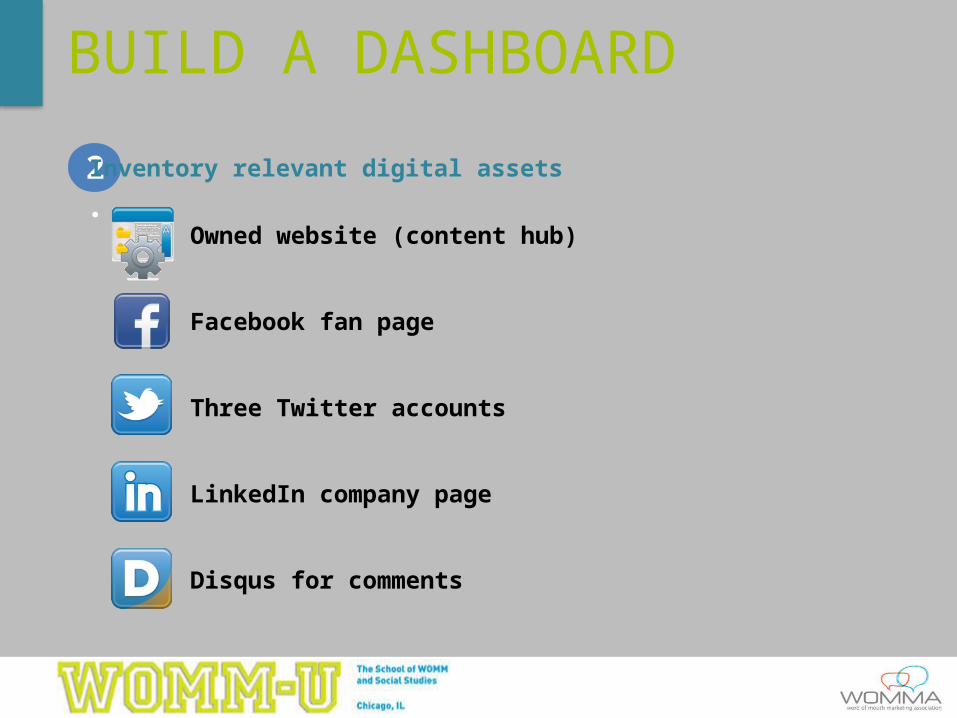
2. Inventory relevant digital assets
• Owned website (content hub)
• Facebook fan page
• Three Twitter accounts
• LinkedIn company page
• Disqus for comments

BUILD A DASHBOARD
• Page views• Bounce rate• Average time• Visits• Visitors• Conversions• Browser type• Language• Trackbacks• Site speed
• Shares• Comments• Mentions• Page posts• Likes
• Tweets• Retweets• Mentions
• Comments• Likes• Comments• Shares
3. Create a list of available data points

BUILD A DASHBOARD
• Page views• Bounce rate• Average time• Visits• Visitors• Conversions• Browser type• Language• Trackbacks• Site speed
• Shares• Comments• Mentions• Page posts• Likes
• Tweets• Retweets• Mentions
• Comments
4. Select metrics that tell your story
• Likes• Comments• Shares
BUILD A DASHBOARD
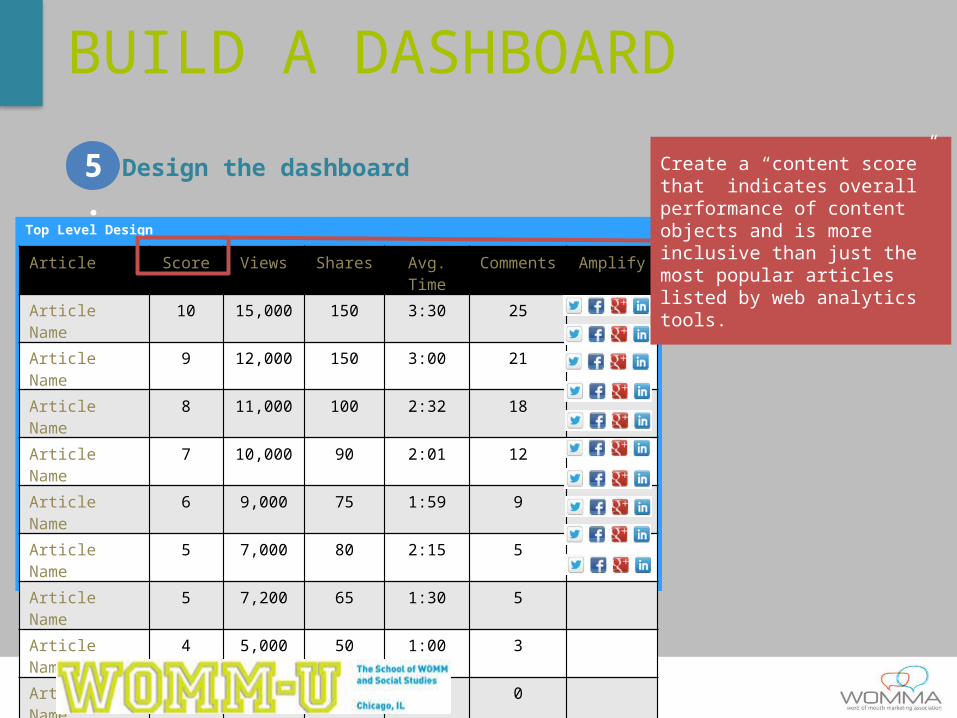
5. Design the dashboard
Top Level Design
Article Score Views Shares Avg. Time
Comments Amplify
Article Name 10 15,000 150 3:30 25
Article Name 9 12,000 150 3:00 21
Article Name 8 11,000 100 2:32 18
Article Name 7 10,000 90 2:01 12
Article Name 6 9,000 75 1:59 9
Article Name 5 7,000 80 2:15 5
Article Name 5 7,200 65 1:30 5
Article Name 4 5,000 50 1:00 3
Article Name 3 2,000 20 :30 0
Article Name 2 1,000 1 :10 0
Create a “content score” that indicates overall performance of content objects and is more inclusive than just the most popular articles listed by web analytics tools.
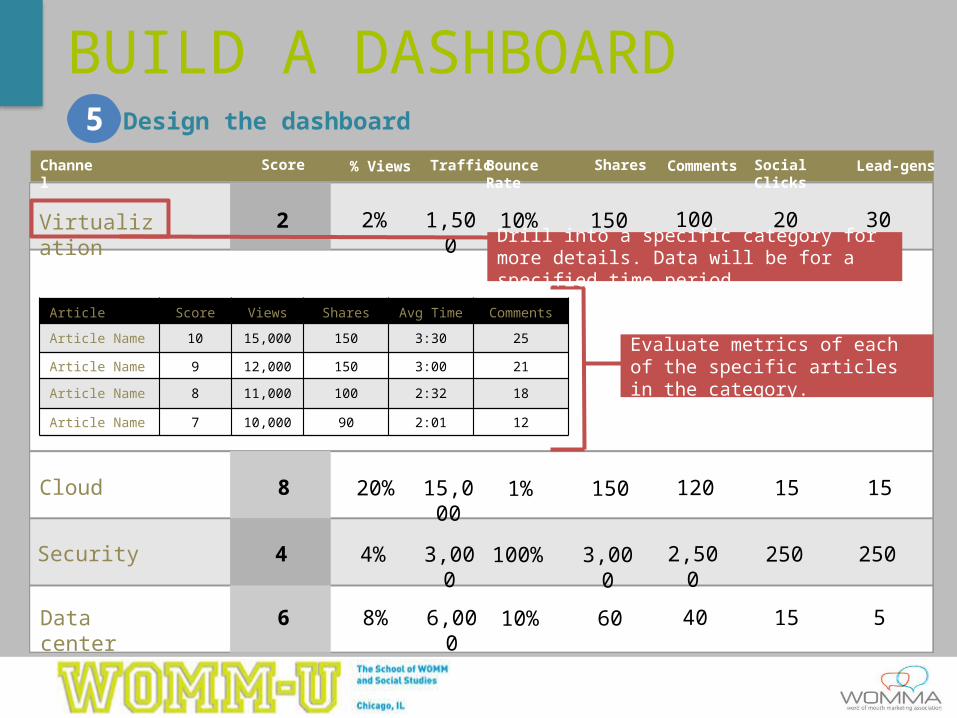
BUILD A DASHBOARD5. Design the dashboard
Channel
Virtualization
Cloud
Security
Data center
2
8
4
6
Score % Views Traffic Bounce Rate Shares Comments Social Clicks Lead-gens
2%
20%
4%
8%
1,500
15,000
3,000
6,000
10%
1%
100%
10%
150
150
3,000
60
100
120
2,500
40
20
15
250
15
30
15
250
5
Article Score Views Shares Avg Time Comments
Article Name 10 15,000 150 3:30 25
Article Name 9 12,000 150 3:00 21
Article Name 8 11,000 100 2:32 18
Article Name 7 10,000 90 2:01 12
Drill into a specific category for more details. Data will be for a specified time period.
Evaluate metrics of each of the specific articles in the category.

BUILD A DASHBOARD
6. Evaluate, refresh and react
• ID trending topics• Competitive analysis• Evaluate network performance• ID best authors and/or content types

BUILD A DASHBOARD
Awareness Consideration Preference Purchase Post-purchase
Scenario: Evaluate performance along the sales cycle
1. Clearly define business objectives/KPIs
• Driving preference• Facilitating VOC among brand fans

BUILD A DASHBOARD
2. Inventory relevant digital assets

BUILD A DASHBOARD3. Create a list of available data points
• Number of engaged advocates
• Number of advocates or ambassadors
• Number of new advocates
• Number of creators
• Forum discussions• Stories created• Questions
Asked/Answered• Content rated• Comments• Wikis• New users
• NPS score• Number of campaigns• Number of
responses / campaign• Number of
purchases / campaign• Revenue
generated / campaign• Number of new
customers acquired / campaign
• Number of customer referrals
• Number of retained customers
• Open rate• Close rate• Renewal rate
• Mentions• Conversations
• Blogs• Forums
• Retweets• Sentiment• Keywords• Geo
• Product reviews• Create brand or
product stories• Repeat purchases• Coupon
redemption• Visitors• PPC• Cart size• Amount of new
revenue• Amount of
recurring revenue• Margin• Sales stage
duration• Sales cycle duration
Community CRM Listening eCommerce Amplification
• Product review shares
• Product shares• Promotion shares• Image uploads• Video uploads• Social comments

BUILD A DASHBOARD4. Select metrics that tell your story
• Number of engaged advocates
• Number of advocates or ambassadors
• Number of new advocates
• Number of creators
• Forum discussions• Stories created• Questions
Asked/Answered• Content rated• Comments• Wikis• New users
• NPS score• Number of campaigns• Number of
responses / campaign• Number of
purchases / campaign• Revenue
generated / campaign• Number of new
customers acquired / campaign
• Number of customer referrals
• Number of retained customers
• Open rate• Close rate• Renewal rate
• Mentions• Conversations
• Blogs• Forums
• Retweets• Sentiment• Keywords• Geo
• Product reviews• Create brand or
product stories• Repeat purchases• Coupon
redemption• Visitors• PPC• Cart size• Amount of new
revenue• Amount of
recurring revenue• Margin• Sales stage
duration• Sales cycle duration
Community CRM Listening eCommerce Amplification
• Product review shares
• Product shares• Promotion shares• Image uploads• Video uploads• Social comments

BUILD A DASHBOARD
5. Design the dashboard

BUILD A DASHBOARD
6. Evaluate, refresh and react
• Recruit new advocates• Challenge advocates• Join relevant conversations• Refresh promotions
BUILD A DASHBOARD
1.
2.
3.
4.
5.
6.
Inventory relevant digital assets
Clearly define business objectives/KPIs
Create a list of available data points
Select metrics that tell your story
Design the dashboard
Evaluate, refresh and react
QUESTIONS?
Kathy [email protected]
Charlie TreadwellCisco Systems@CharlieAtCisco
Learn more and download our ebooks at ComBlu.com