Embed Size (px)
Citation preview

TrashboardTrash with Integrity
“You can’t manage what you don’t know.”

ChallengeUse technology to assess & manage QSR waste streams
Real World
NYC QSR restaurants will
have to manage their organic waste
beginning
7/1/2015
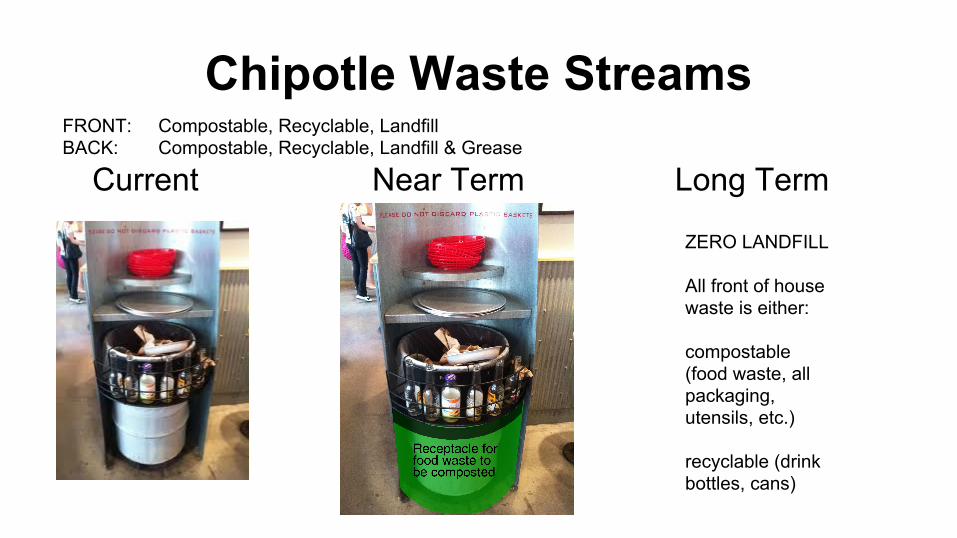
Chipotle Waste Streams
Current Near Term Long Term
FRONT: Compostable, Recyclable, LandfillBACK: Compostable, Recyclable, Landfill & Grease
ZERO LANDFILL
All front of house waste is either:
compostable (food waste, all packaging, utensils, etc.)
recyclable (drink bottles, cans)

Crew Member Input
TRASHBOARD
FOH Food/Compost
BOH Food/Compost
FOH Recycling
BOH Recycling
FOH Landfill
BOH Landfill
Eli
Tech Interface: POS &/or smartphone


Future Vision

Outcomes
Move QSRs into better biz decision makingCertified B Corporations are leading a global movement to redefine success in business.
By voluntarily meeting higher standards of transparency, accountability, and performance, Certified B
Corps are distinguishing themselves in a cluttered marketplace by offering a positive vision of a better
way to do business.

Near Term ProcessCrew: cross trained on front & back procedures for assessing and inputting separate waste streams into system w/in existing framework
Customer: simple sorting methodin store (3 options)
Rewards: have crew members reward customers randomly for correct sorting, use social media to promote

Dashboard- KPIs for waste streams
KPIs meaningful QSRs &/or customers:
Landfill Diversion %Landfill Waste per Square FootLandfill Waste per Dine in GuestFood Waste per Dine in Guest
Waste by WeightFOH Total FOH %
BOH Total BOH %
Total Weight % Total
Totals 174 100.00% 214 100.00% 388 100%
Food Waste 72 41.38% 109 50.93% 181 46.65%
Recycling 53 30.46% 32 14.95% 85 21.91%
Landfill 49 28.16% 48 22.43% 97 25.00%
Grease NA NA 25 11.68% 25 6.44%
Total Covers/Day 588
Dine In Customers 353
Space Size 2400 nsf
Total Waste/Cover Ratio 1.52
Food Waste/Dine In 0.20
Landfill Diversion % 68.56%
Landfill Waste/sf 0.04