Embed Size (px)
Citation preview
2011 Post-Holiday Recap January 2012
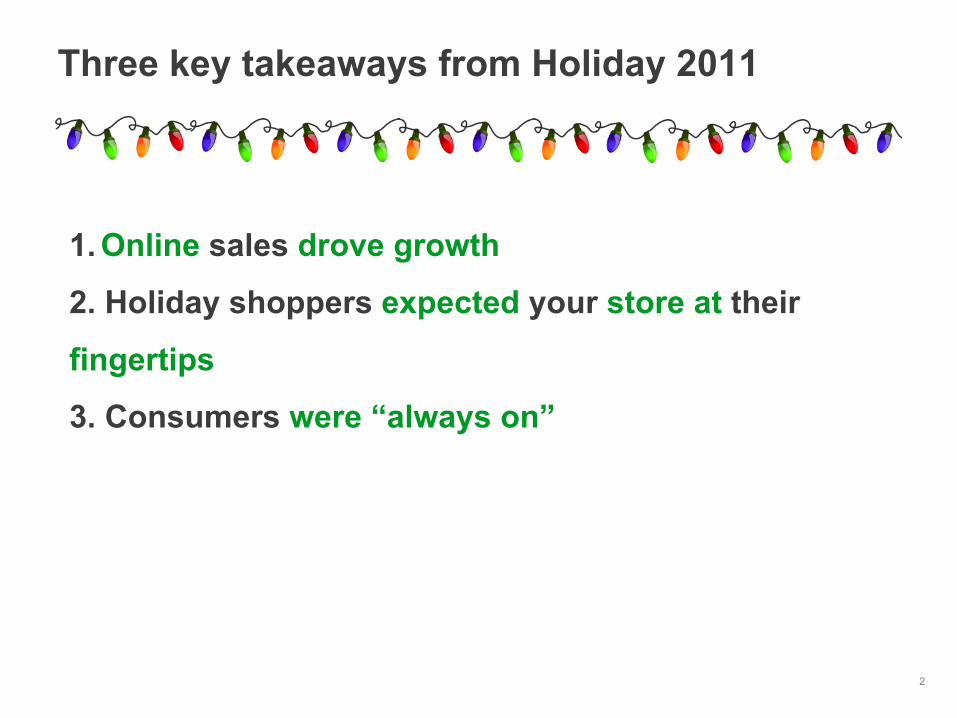
Three key takeaways from Holiday 2011
2
1. Online sales drove growth
2. Holiday shoppers expected your store at their
fingertips
3. Consumers were “always on”

Methodology Google commissioned Ipsos to gain a better understanding of shopping behavior during the 2011 Holiday Season. In order to do so, two online surveys were conducted: Google & Ipsos Post-Holiday Shopping Study • Sample: US Adult Population. A total of 615 Holiday Shoppers were interviewed. • Screening criteria: In order to qualify, respondents must have made a purchase in one
of 13 retail categories during the Holiday Season. • Field period: January 2012. Digital Connections Study: Life of the Mobile-PC User • Sample: Mobile and desktop consumers. A total of 615 Holiday Shoppers were
interviewed. • Screening criteria: Respondents must have made a purchase within a variety of
product and service categories during the Holiday Season (e.g., retail, auto, entertainment.)
• Field period: January 2012. • The data has been weighted to be reflective of the US Smartphone & PC user
population
3

Online sales drove growth
4
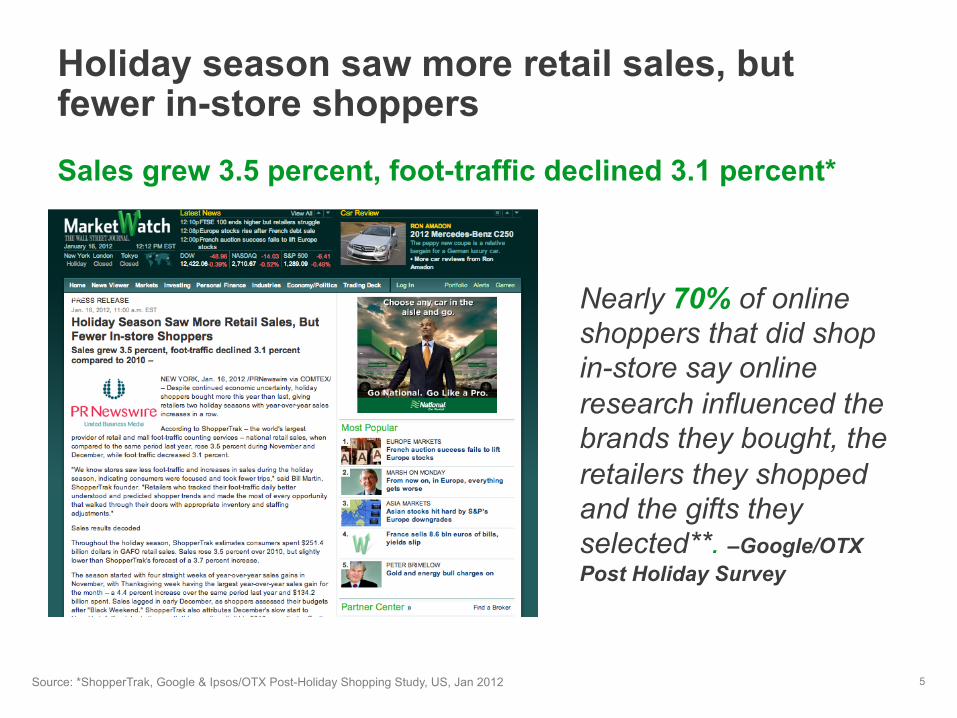
Holiday season saw more retail sales, but fewer in-store shoppers
5
Nearly 70% of online shoppers that did shop in-store say online research influenced the brands they bought, the retailers they shopped and the gifts they selected**. –Google/OTX Post Holiday Survey
Sales grew 3.5 percent, foot-traffic declined 3.1 percent*
Source: *ShopperTrak, Google & Ipsos/OTX Post-Holiday Shopping Study, US, Jan 2012
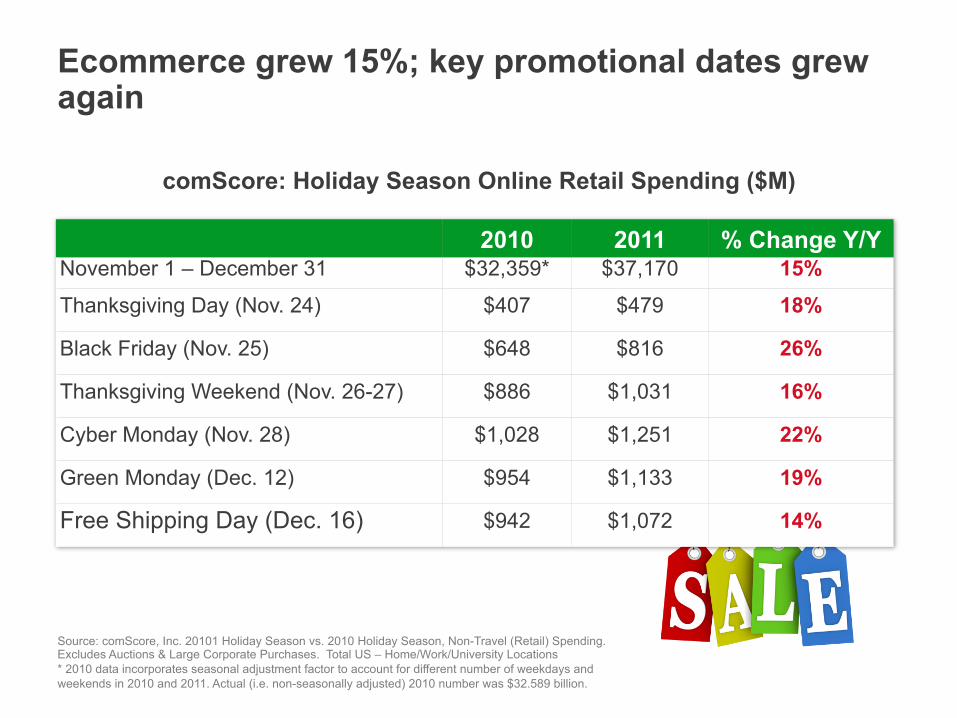
Ecommerce grew 15%; key promotional dates grew again
comScore: Holiday Season Online Retail Spending ($M)
Source: comScore, Inc. 20101 Holiday Season vs. 2010 Holiday Season, Non-Travel (Retail) Spending. Excludes Auctions & Large Corporate Purchases. Total US – Home/Work/University Locations * 2010 data incorporates seasonal adjustment factor to account for different number of weekdays and weekends in 2010 and 2011. Actual (i.e. non-seasonally adjusted) 2010 number was $32.589 billion.
2010 2011 % Change Y/Y November 1 – December 31 $32,359* $37,170 15% Thanksgiving Day (Nov. 24) $407 $479 18%
Black Friday (Nov. 25) $648 $816 26%
Thanksgiving Weekend (Nov. 26-27) $886 $1,031 16%
Cyber Monday (Nov. 28) $1,028 $1,251 22%
Green Monday (Dec. 12) $954 $1,133 19%
Free Shipping Day (Dec. 16) $942 $1,072 14%

Top Retail eCommerce Sales Dates Nov & Dec 2011 (in $M) Mon Tue Wed Thu Fri Sat Sun
Nov 21 22 23 24 25 26 27
28 29 30 Dec 1 2 3 4
5 6 7 8 9 10 11
12 13 14
15 16 17 18
19 20 21 22 23 24 25
26 27 28 29 30 31 Jan 1
Source: comScore retail e-commerce spending.
Thanksgiving
Cyber Mon
Green Mon Free Ship Day
#1 $1,251
Black Friday
#2 $1,178
#3 $1,133
#4 $1,116
#5 $1,107
#6 $1,072
#7 $1,064
#8 $1,025
#9 $1,024
#10 $1,018
Ten online shopping days this season surpassed $1 billion in spending
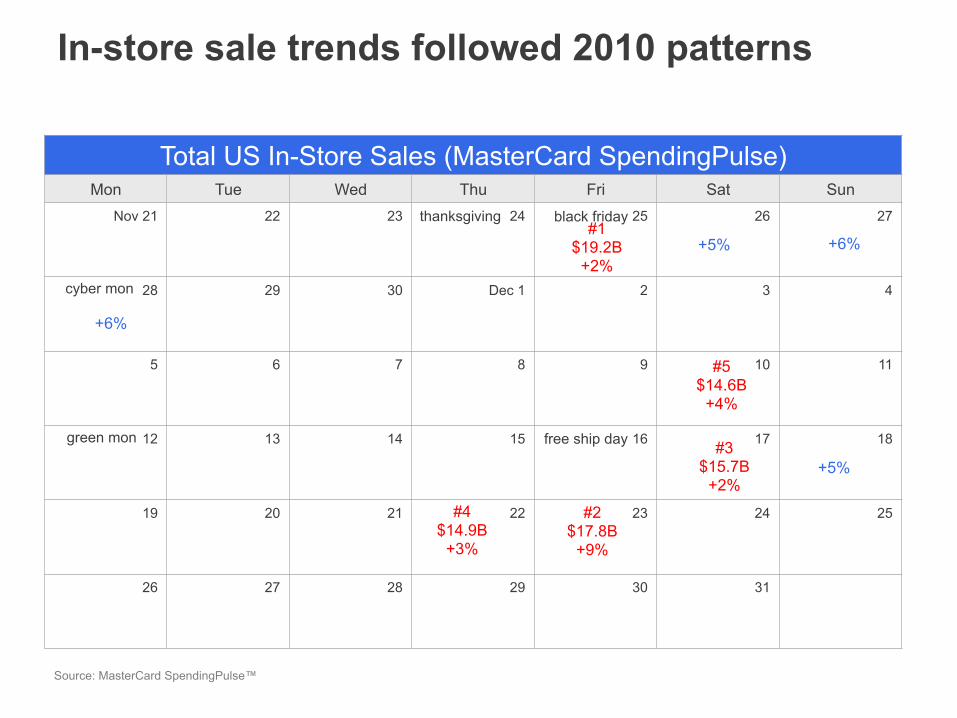
In-store sale trends followed 2010 patterns
Total US In-Store Sales (MasterCard SpendingPulse) Mon Tue Wed Thu Fri Sat Sun
Nov 21 22 23 24 25 26 27
28 29 30 Dec 1 2 3 4
5 6 7 8 9 10 11
12 13 14 15 16 17 18
19 20 21 22 23 24 25
26 27 28 29 30 31
thanksgiving black friday
cyber mon
Source: MasterCard SpendingPulse™
green mon free ship day
#1 $19.2B
+2%
#2 $17.8B
+9%
#3 $15.7B
+2% #4
$14.9B +3%
#5 $14.6B
+4%
+6%
+6% +5%
+5%

Online research was a critical part of the Holiday shopping process
Source: Google Internal Data
76% of consumers researched online prior to purchase
during the holiday season
Base: Holiday Shoppers (1500) Q. Which of the following sources of information, if any, did you use for your Holiday shopping this past season? Source: Google & Ipsos/OTX Post-Holiday Shopping Study, US, Jan 2012. Note: Online includes tablet, smartphone, PC
76%
36%
34%
34%
29%
21%
20%
13%
10%
8%
4%
Internet
Store circulars/flyers
In-store displays
Friends, relatives, colleagues
TV
Newspapers
Catalogs
Magazines
Sales associates
Radio
Billbords

While free shipping and other incentives influenced holiday purchasing
10
Last minute holiday sales 29%
Gift sets or complimentary items
16%
coupons 37%
Flexible payment plans/layaway
8%
Base: Holiday Shoppers (1500) Q. Which of the following types of promotions did you take advantage of while doing your Holiday shopping this Season? Source: Google & Ipsos/OTX Post-Holiday Shopping Study, US, Jan 2012
55% of consumers expected Free Shipping this holiday season*
51% shoppers took advantage of free shipping**
Transactions involved free shipping*
50%+
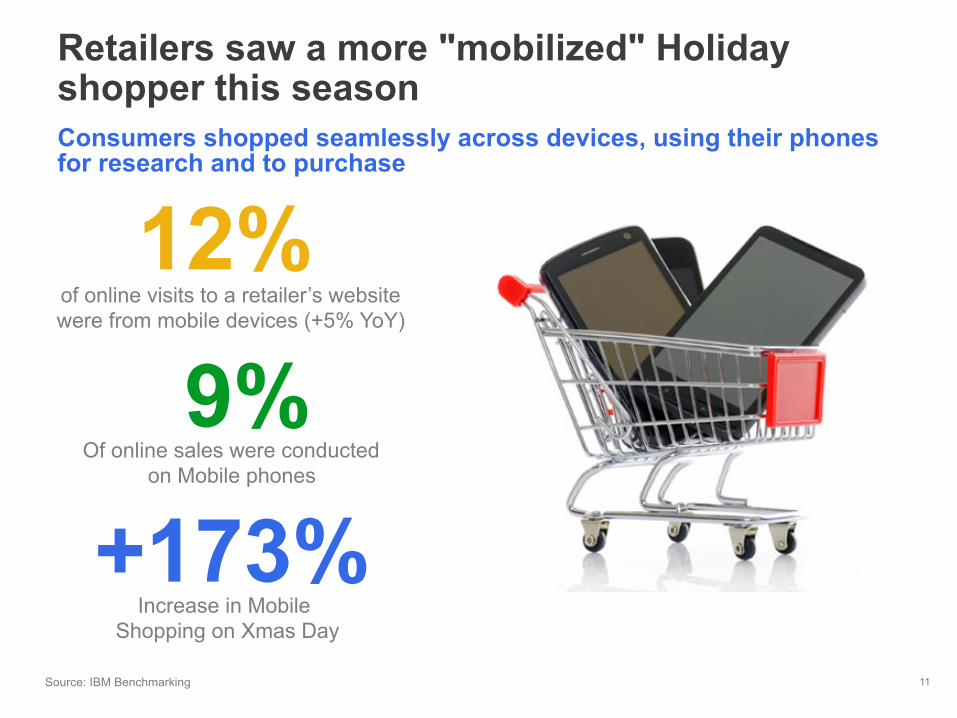
Consumers shopped seamlessly across devices, using their phones for research and to purchase
Retailers saw a more "mobilized" Holiday shopper this season
Source: IBM Benchmarking
+173% Increase in Mobile
Shopping on Xmas Day
9% Of online sales were conducted
on Mobile phones
12% of online visits to a retailer’s website were from mobile devices (+5% YoY)
11

Consumers
report relying on
mobile devices more
year over year
• 80% smartphone shoppers used
them more frequently this year • 35% spent more money on them
this season • 70%* tablet shoppers used them
more frequently this year • 38%* spent more money on them
this season
And mobile became an integral part of the Holiday shopping process
*Note: Directional data, small base size Base: Holiday Smartphone Shoppers Who Used Device Last Year (474); Holiday Tablet Shoppers Who Used Device Last Year (39). Q. Please think about the shopping/purchasing that you did for the Holiday Season this year versus last year. Did you use each of the following devices more frequently this year, less frequently or the same amount? Q. Now, thinking about the device(s) you used to do your Holiday Shopping this year, would you say you spent more, less or about the same amount of money shopping on each device as you did last Holiday Season (2010)? Source: Google & Ipsos Digital Connections Study: Life of the Mobile-PC User, US, Jan 2012
Particularly Among Those Who Used These Devices Last Year…
13
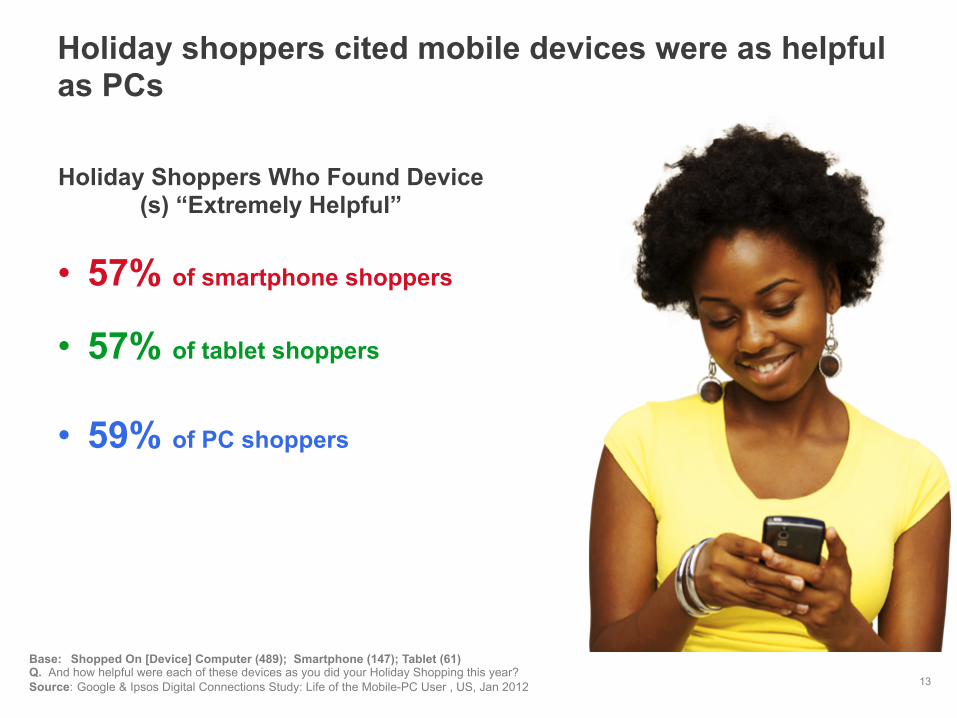
Holiday shoppers cited mobile devices were as helpful as PCs
Base: Shopped On [Device] Computer (489); Smartphone (147); Tablet (61) Q. And how helpful were each of these devices as you did your Holiday Shopping this year? Source: Google & Ipsos Digital Connections Study: Life of the Mobile-PC User , US, Jan 2012
Holiday Shoppers Who Found Device(s) “Extremely Helpful”
• 57% of smartphone shoppers
• 57% of tablet shoppers
• 59% of PC shoppers

Holiday shoppers expected your Store at their fingertips
14

Consumers are shopping & purchasing across devices
Base: Shopped during Holiday Season (615 - Aggregate of All Categories) Q. In which of the following ways did you shop for these products or services during the most recent Holiday Season? Q. And how did you actually make your purchases when Holiday shopping this year? Source: Google & Ipsos Digital Connections Study: Life of the Mobile-PC User, US, Jan 2012
91%
80%
24%
10%
Shopped across categories
At store
On PC
On Smartphone
On Tablet
Net mobile (smartphone or tablet):
14%
89%
75%
11%
6%
At store
On PC
On Smartphone
On Tablet
Purchased across categories
Net mobile (smartphone or tablet):
28%

16
42% used more than one device at the same time
68% started on one device and continued on another
Multiple device holiday shoppers used their devices simultaneously
25% used more than one device to shop this year... Among those…
Base: Total Holiday Shoppers (615) Q. In which of the following ways did you shop for these products or services during the most recent Holiday Seasons? Base: Holiday Shoppers Used More Than One Device to Shop (155)/25% Q. At any point during your Holiday Shopping this year, did you use more than one device to shop at the same time (i.e., used your computer to browse inventory and used your mobile to make a purchase)? Q. And at any point during your Holiday Shopping this year, did you start on one device and continue on another (i.e., started browsing on your tablet and made a purchase for the same product on your computer)? Source: Google & Ipsos Digital Connections Study: Life of the Mobile-PC User, US, Jan 2012

Consumers expected to be able to reach you at any moment
17
18%
7%
13%
89%
64%
75%
42%
82%
On-the-go (while walking, using
transportation, etc.)
In a store
At work
At home
Base: Holiday Smartphone Shoppers (147); Holiday Tablet Shoppers (61). Q. Where did you use a smartphone/ tablet/ smartphone and tablet to help you shop this Holiday Season? Source: Google & Ipsos Digital Connections Study: Life of the Mobile-PC User, US, January 2012
Whi
le
rese
arch
ing
On
the
Go

The path to purchase was varied for smartphone users
researched on smartphone, went to store to purchase 46% researched on smartphone, then purchased online on computer 37% researched on smartphone, purchased on smartphone 41%
researched on smartphone, visited store to check out products, then purchased on smartphone 18% Visited the store first, then purchased on smartphone 8%
researched on smartphone, visited store to check out products, then purchased online on computer 19%
Source: Google and Ipsos OTX Post Holiday Shopping Intentions Study, US, Jan 2012
Base: Used a Smartphone to do Holiday Shopping 2012 n= 208 (Q23) In which of the following ways did you approach shopping with your smartphone this Holiday Season? Please select all that apply. Note: 2012 Only 18

Smartphone and tablet shoppers used a combination of apps & websites
19
57% % of tablet shoppers used
apps & websites
69% % of smartphone shoppers
used apps & websites
Base: Holiday Smartphone Shoppers (147); Holiday Tablet Shoppers (61). Q. While shopping on [your] device(s) did you use apps or did you visit websites directly? Source: Google & Ipsos Digital Connections Study: Life of the Mobile-PC User, US, Jan 2012

Holiday shoppers consistently watched products videos across devices*
20
75%
49%
49%
36%
36%
Product reviews/ratings
Product demo
Informational (e.g., features, uses, etc.)
Videos from retailers
Videos from electronic manufacturers/brands
Base: Shopped Online Via Device (Desktop: 489; Smartphone: 147; Tablet: 61). Desktop: 18%; Mobile & Tablet: 16%. Q. In which of the following ways did you use each of these devices to do your shopping this Holiday Season? Source: Google & Ipsos Digital Connections Study: Life of the Mobile-PC User, US, Jan 2012 Base: Holiday Online Video Viewers ( 92) Q. You mentioned that you used online video websites (like YouTube, Yahoo! Video) during your Holiday Shopping this season. Which of the following types of online videos did you view? Source: Google & Ipsos Post-Holiday Shopping Study, US, Jan 2012

And “Showrooming” became prevalent
21
Shoppers used devices to compare prices and features in-
store
Source: WSJ.com

22
Consumers engaged across all devices but were more likely to look for discounts & coupons on PCs
Base: Shopped Online Via Device (Desktop: 489; Smartphone: 147; Tablet: 61). Q. In which of the following ways did you use each of these devices to do your shopping this Holiday Season? Source: Google & Ipsos Digital Connections Study: Life of the Mobile-PC User, US, Jan 2012
70%
61%
61%
53%
46%
42%
77%
63%
65%
31%
49%
34%
67%
79%
60%
53%
73%
36%
Read Reviews
Compare Prices
Compare product info
Search a store’s inventory
Look for discounts/promos
Contact a retailer

Consumers were “Always On”
23

25% 35%
20%
34% 40%
33%
80%
53%
36%
24
Majority of shopping & purchasing took place in early to mid December, but consumers shopped & purchased throughout the season
Base: Holiday Shoppers (1500) Q. When did you do the majority of your holiday purchasing? Q. Did you do any additional Holiday shopping during any of the following times? Source: Google & Ipsos/OTX Post-Holiday Shopping Study, US, January 2012

25%
35%
20%
34% 40%
33%
80%
53%
36% 33% 37% 38%
51% 56% 56%
77%
64%
47%
All 2012 Holiday Shoppers
Shopped Online Using Smartphone Or Tablet
25
Mobile & tablet holiday shoppers shopped earlier and more frequently
Base: Total Respondents 2012 n= 1500; Smartphone / Tablet Online Shoppers 2012 n= 288 (Q3) When did you do the majority of your holiday purchasing? (Select one) (Q4) Did you do any additional Holiday shopping during any of the following times? (Select one for each) Note: 2012 Only Source: Google & Ipsos Digital Connections Study: Life of the Mobile-PC User, US, Jan 2012

26
…And they continued shopping after christmas
Top 2 reasons for shopping post-holiday:
Base: Holiday Shoppers Who Shop After the Christmas/Holiday Season or Still Shopping (587) Q. You mentioned the last time you shopped during this Holiday Season was [timeframe]. Did you finish your shopping at this time? Q. For which of the following reasons did you shop after Christmas/Holiday Season (during post-holiday sales or markdowns)/ are you still doing your Holiday shopping? Source: Google & Ipsos/OTX Post-Holiday Shopping Study, US, Jan 2012
I made additional purchases for
myself. To: Me From: Me
I was waiting for post-holiday sales
39% Shopped after Christmas and
32%
Finished holiday
shopping-post Christmas

27
0.00%
0.10%
0.20%
0.30%
0.40%
0.50%
0.60%
0.70%
0.80%
10/2
2 10
/24
10/2
6 10
/28
10/3
0 11
/1
11/3
11
/5
11/7
11
/9
11/1
1 11
/13
11/1
5 11
/17
11/1
9 11
/21
11/2
3 11
/25
11/2
7 11
/29
12/1
12
/3
12/5
12
/7
12/9
12
/11
12/1
3 12
/15
12/1
7 12
/19
12/2
1 12
/23
12/2
5 12
/27
12/2
9 12
/31
1/2
1/4
1/6
Amazon Target Best Buy JCP Macys Walmart
Share of Weekly Visits, 2011
Amazon kept the lights on but many traditional retailers did not
Source: Hitwise

Source: Experian Hitwise 2011, Share of Visits to Retail 500 Table – YOY growth of share (not total visits)
Online Share of Visits to Retailers Grew 7%
0.00%
1.00%
2.00%
3.00%
4.00%
5.00%
6.00%
7.00%
8.00%
11/1
11/3
11/5
11/7
11/9
11/1
1
11/1
3
11/1
5
11/1
7
11/1
9
11/2
1
11/2
3
11/2
5
11/2
7
11/2
9
12/1
12/3
12/5
12/7
12/9
12/1
1
12/1
3
12/1
5
12/1
7
12/1
9
12/2
1
12/2
3
12/2
5
12/2
7
12/2
9
12/3
1
2011 2010 Retail 500 Client
Nov 1 – Dec 31 7%
Thanksgiving 9%
Black Friday 6%
Cyber Monday 13%
Christmas 8%
Day After Christmas 8%
YOY Visit Share Growth

Key Recommendations
29

Key Recommendations
30
1. Keep you brand top of mind: Engage with consumers expect more from brands than ever before and use digital as a key influencer and purchase device
2. Implement cross device campaigns: Reach consumers
across devices who expect your store to be at their fingertips throughout the holiday season
3. Invest consistently, not sporadically: Invest early and consistently to benefit from a cost efficient auction and increase your margins