Embed Size (px)
Citation preview

Segmenting MLB Fans to
Drive Strategic and Brand
Planning Decisions Case Study
March 9, 2013

Introduction to Copernicus
Copernicus is a marketing consulting organization that uses
front-line experience, consumer insights, and advanced data analytics
to develop, plan and implement transformational marketing strategies.
By ―transformational‖ we mean strategies that change brand trajectories,
career paths and sometimes entire companies and even industries.
2

Situation
Cleveland hit hard by economic downturn
At least four Fortune 500 companies were acquired or relocated
Cleveland had 2nd largest population
decline since 2000
Median Household income
declined 16% from 2007 – 2011

Situation
Ballpark Design (135 suites) not suited for current corporate climate
Season ticket product is becoming increasingly less relevant to our fan base
Fans have become increasingly accustomed to discounted tickets
Attendance not rebounding to prior levels in winning periods for the team
Need for a better understanding of fans to guide marketing and improve the fan experience
Stars of the ‗90‘s
Back to back
Cy Young‘s
traded
Harder for me to
justify spending
on games
No one goes
downtown
anymore
Isn‘t this all about winning?

What is Segmentation?
Dividing an audience – in this case fans – into distinct groups that share
a common set of characteristics.

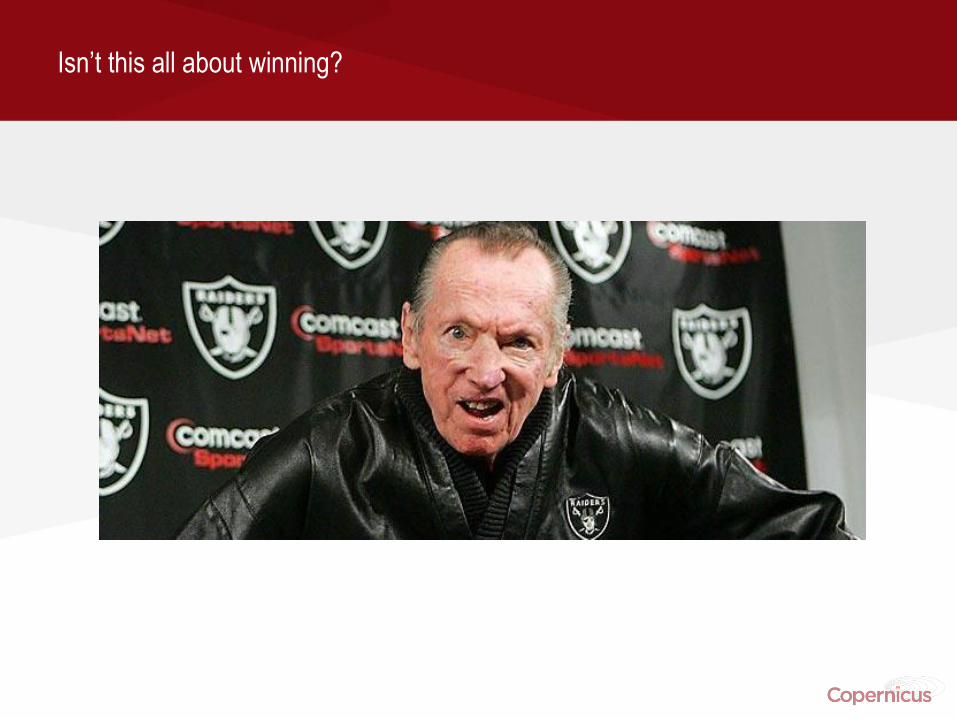
Why Segment?
Could these two possibly want exactly the same things when they attend a game?

Why Segment?
Different types of fans contribute significantly different amounts of revenues.
“The most important strategic decision is targeting—nail this and everything else falls into place.‖
- Phil Kotler
Why Segment?
―If you‘re on the wrong train, every stop is the wrong stop.‖
- David Verklin
―A great talent, sailing in the wrong direction will, like the lost pilot breaking the speed record, reach
the wrong destination all the more quickly.‖
- Bill Bernbach

Approach
Conducted 1,400+ online surveys with area fans
From geography that represents the best opportunity for incremental attendance
Indicating a fan level of 3-5 on a 5 point scale
Gathered from several sources
– General Population survey panels
– Single game ticket buyer databases
– Season ticket holder database
Executed in concert with MLBAM
Cleveland
Cuyahoga
Lorain Erie
Huron Medina
Sum
mit Portage
Geauga
Lake Ashtabula
Trumbull
Mahoning
Stark Wayne Ash
land
Ric
hlan
d
Holmes
Tus
cara
was
Carroll
Tier 1
Tier 2
Tier 3

Multi-Dimensional and ―Profit-Directed‖ Approach
CREATE Hundreds of
Variables
1. Category
Attitudes
2. Category
Behaviors
3. Needs in Team/
Experience
4. Lifestyle
5. Psychographics
6. Demographics
7. Media behaviors
EVALUATE
Hundreds of solutions using statistical and
managerial criteria
TEST Variables to see
which ones are
predictive of:
Ticket spending
Likelihood to buy
Season Tickets
Price Sensitivity/
Promotion Focus
Advocacy /
Influence
SELECT
the Optimal
Solution

Analytics
Factor Analyze
• Remove ―redundancies‖ in the data
Normalize
• Prevent survey scale issues
Test
• Identify the most useful segmentation variables
Segment
• Using k-means clustering to develop segments
• Evaluated statistically and managerially

Analytics
We use correlation analysis to identify the variables that are useful segmentation variables.
Games
Attended $ / Ticket
Likely to buy
Season Tix Advocacy
I am an expert on baseball .45 .30 .18 .38
I have been a fan since I was a child .35 .39 .21 .24
I pay careful attention to the game .38 .28 .23 .27
I only go to the big games -.25 -.42 -.19 -..33
X Owners owe it to their fans to spend money .02 .03 -.03 -.01
X I only want to follow a winner .01 -.02 .02 -.04

Five Fan Segments
Family Man Phil
Value Victor(ia)
Homebody Hank and Helen
Affluent Alan
17%
16%
17%
28% 23%
Event Emily

23%
5% 2% 2% 2%
28%
19%
9% 4% 5%
17%
25%
27%
13% 15%
16%
26%
23%
18% 21%
15%
22%
25%
29%
28%
2% 4%
15%
34% 29%
Indians Fans % Of Attenders (Attended 1+ games in 2011)
% of Attendance (2011)
% of Ticket Revenue (2011)
% of Total Revenue* (2011)
S10c, Q3, Q7, Q23, Q25 *Total Revenue = Tickets + Indians’ share of concessions + Merchandise sold at Progressive or Indians Retail Location
15
Homebody
Hank &
Helen
Event
Emily
Value
Victor(ia)
Family Man
Phil
Relative Value of Indians Fan Segments
Alan and Phil represent just 33% of fans but 81% of revenues.
Alan
(Non STH)
Affluent Alan
(STH)

Plenty of growth opportunity remains with Alan, Phil and Victor
Most Recent Game Attendance
13% 7% 17%
38%
63%
10% 12%
9%
27%
27%
77% 81% 74%
35%
11%
Affluent Alan Family Man Phil Value Victor Event Emily Homebody Hank & Helen
2011
2009-2010
Haven’t Been in the
Past 3 Years

17
Alan and especially Phil are less volatile spenders than Victor
$1,062
$749
$624
$219
$148
Affluent Alan
Family Man
Phil
Value
Victor(ia)
Event Emily
Homebody
Hank & Helen
Pre-Season
Favorites
.500 Season Post-Season
Contenders
Rebuilding
Season
$948
$657
$535
$175
$113
$601
$429
$318
$142
$74
$492
$370
$243
$115
$56
2.2
2.0
2.6
1.9
2.6
Volatility
Ratio
Intended Ticket Spend During

We can understand the purchase decisions for our key targets
Who Typically Purchases
Tickets to the Game
Who Comes Up With The
Idea to Go To a Game
Distribution of “Say” in the
Decision to Go to a Game
Base: Those who attended games as a family.
Q18, Q19, Q20 18
63%
37%
58% 42%
67%
33%
Affluent
Alan
Family
Phil
Value
Victor(ia)
Event
Emily
Home
Hank &
Helen
(353) (281) (252) (144) (74)
Male 68% 70% 60% 54% 56%
Female 32% 30% 40% 46% 44%
Male 61% 64% 59% 49% 54%
Female 39% 36% 41% 51% 46%
Male 76% 73% 63% 59% 59%
Female 24% 27% 37% 41% 41%
Total Respondents
Female Male
Male 60%
Female 40%
Percent of Game Attenders

We know when they buy tickets
Days in Advance Typically Purchase Tickets
Q6
12%
10%
14%
14%
18%
35%
22%
20%
20%
17%
15%
6%
26%
27%
20%
12%
9%
6%
28%
22%
18%
18%
12%
2%
32%
22%
18%
7%
12%
8% Before the season started
During the season, but
more than a month before
3-4 weeks in advance
1-2 weeks in advance
<1 week in advance
On game day
Affluent
Alan
Family Man
Phil
Value
Victor(ia)
Event
Emily
Homebody
Hank & Helen
Average # of days
in advance
24.6 13.7 11.8 13.4 14.3
19

Seat location preferences can enable us to better orchestrate the fan experience when
they arrive at the Field – and ticket product offers.
4% 3% 5% 4% 4% 9% 3% 8% 10% 18%
8%
22%
12%
22% 30% 19% 42%
23%
22%
26%
20% 29%
19% 27% 60%
41% 35% 30% 28%
19%
Field Box Lower Box Lower Reserved
Upper Box Upper Reserved
Bleachers
Fan Composition by Seating Area
Affluent Alan
Family Man Phil
Value Victor(ia) Event Emily
Homebody Hank & Helen
Note: Only seating sections with sufficient sample sizes were included in this analysis. 20

We know who the season ticket holders are, and presumably where to find more.
23%
28%
4%
17%
2% 4%
16%
7%
20%
17%
91%
72%
Overall Current STH Lapsed STH
Segment Distribution
Affluent Alan
Family Man Phil
Value Victor(ia)
Event Emily
Homebody Hank &
Helen
21

We can learn why they own and how they use their season tickets
76% 84%
19%
16% 5%
Current STH Lapsed STH
Business
Business and Pleasure
Pleasure
87% 90%
13% 10%
Current STH Lapsed STH
Reason for Buying Season Tickets Actual Use of Season Tickets
Q27, Q28 22

We know how different STH groups value different STH amenities.
Current STH Lapsed STH Prospects
Loaded value on ticket
Post Season ticket priority
Ticket exchange Dates
Complimentary suite Rental
Discounted pricing vs.
single game tickets
Access to Best Seat
Locations
Ticket Exchange Dates
Access to best seats
Post season ticket priority
Discounted season parking
pass
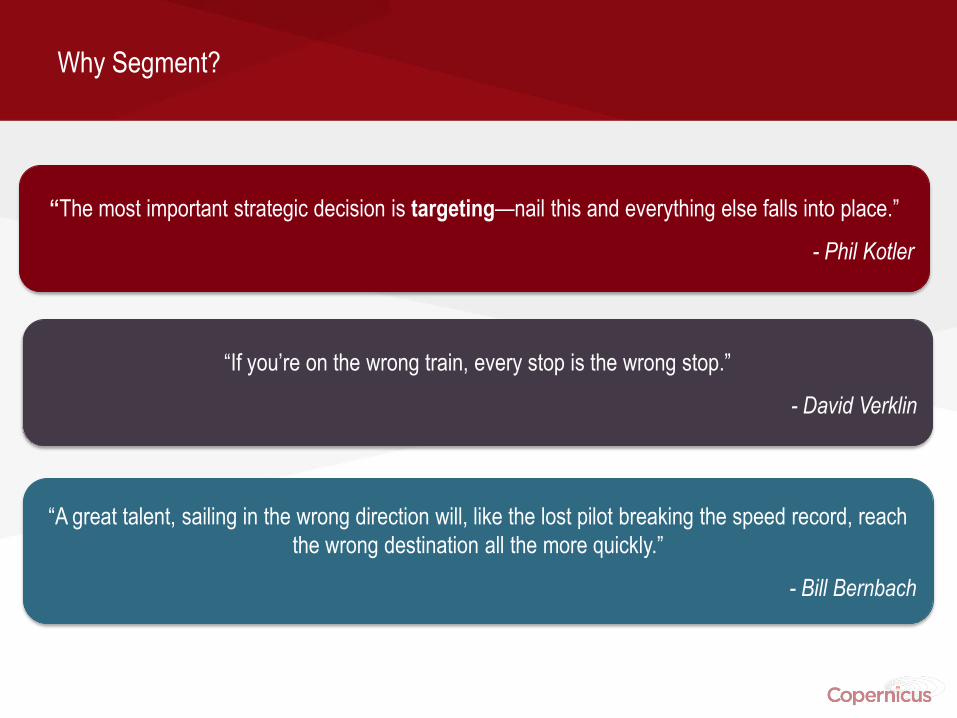
Link to Media / Databases to find them with offers
Directly Linked to
Scarborough for
Media Planning
Tools for Future
Research/ Monitoring
Ticket databases
Scored

How can it be stable when fan emotions are potentially so volatile?
Segments must be defined carefully
Use stable characteristics of people
Not unstable perceptions of the team

Segments have fundamentally altered the Strategic Planning Process
The targets are integrated as part of the strategic planning process
Strategies and tactics under consideration are evaluated against Alan and Phil
Of four 2013 strategic priorities, two specifically target Alan and Phil
―Give me the freedom of a clear strategy‖
- Bill Bernbach
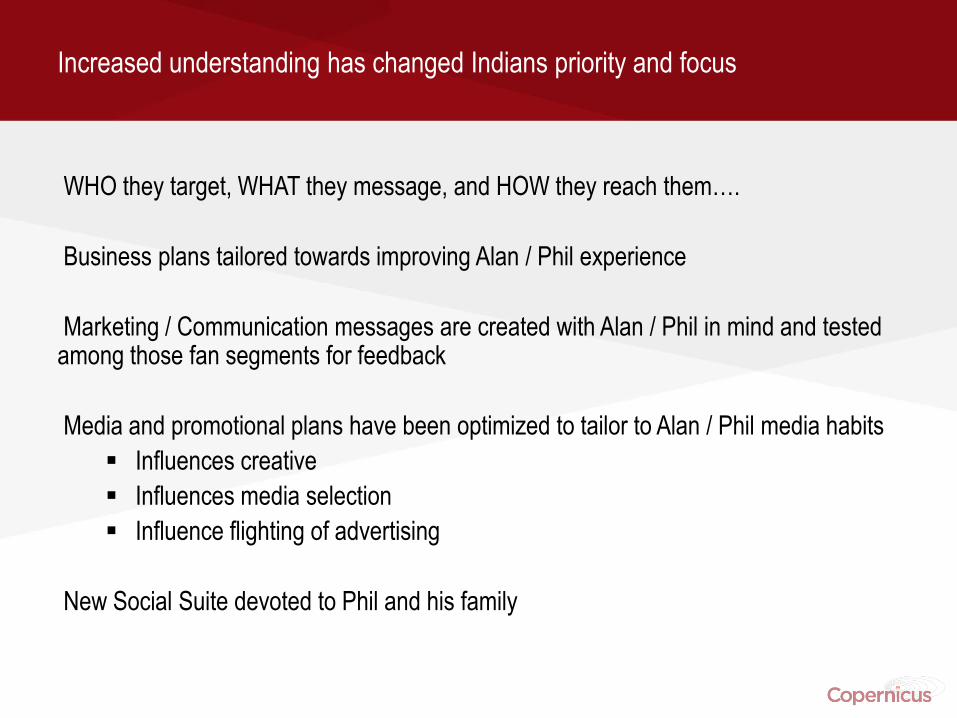
Increased understanding has changed Indians priority and focus
WHO they target, WHAT they message, and HOW they reach them….
Business plans tailored towards improving Alan / Phil experience
Marketing / Communication messages are created with Alan / Phil in mind and tested among those fan segments for feedback
Media and promotional plans have been optimized to tailor to Alan / Phil media habits
Influences creative
Influences media selection
Influence flighting of advertising
New Social Suite devoted to Phil and his family

In Park Experience is now being tailored and improved for Affluent Alan
New Premium Club (2013 Debut)
New construction of exclusive 100 seat premium game
viewing experience. Best seating for best customers.
New seating product in lower bowl
Where Alan sits with more of what he wants
More comfortable patio style seating with semi-circle table
Tailoring scoreboard entertainment, music, usher interaction towards Alan for certain sections or on certain games
Refreshed advertising to focus on tradition of baseball/Indians, the greatest attendance motivator for Alan

In Park Experience is also being tailored for Family Man Phil….
New Kids Clubhouse (2012 Debut)
Suite Renovation: Kids area for kids to play,
parents can still watch and enjoy game
97% satisfaction with area and 15% of attendees
would not have come to game without it
Programming area of the park to be completely family focused: Family friendly ushers, increased mascot appearances, tailoring F&B to families, and creating unique music/scoreboard entertainment for family heavy days
Increased promotional giveaways / activities that are trip drivers for Phil: Fireworks, Wearable giveaways, Dollar Dog nights
Preparing to launch a comprehensive youth marketing plan for Phil‘s family

Key barriers are being have been identified and are being lowered
Introducing new parking and concession value offers
Working with the city to provide easier and improved transportation
alternatives for fans

Insights have armed key sales forces
Corporate partnerships both have and can demonstrate a clear understanding of who
is in the ballpark
Increased credibility with prospects and renewals
Enhanced target identification for the sales force – companies that seek Alan
and Phil as their targets
Improved customization of partner opportunities for Alan and Phil
STH sales force have tailored scripts for STH renewals and prospecting
A good old fashioned trade….
Your Name Here SVP, Marketing & Brand
My New Favorite MLB Team
4 Park Drive
MLB City, SW 99999
Segmenting MLB Fans to
Drive Strategic and Brand
Planning DecisionsCase Study
March 9, 2013
Trade Analyzer

(617) 449-4189
http://goo.gl/7zfa7
Eric Paquette, Sr. Vice President