Embed Size (px)
Citation preview

© Copyright 2015 ystats.com GmbH & Co. KG, 22765 Hamburg, Germany 2

3

4
METHODOLOGY (1 OF 2)
The reports are compiled based on secondary market research. Secondary research is information gathered from previously published sources. Our reports are
solely based on information and data acquired from national and international statistical offices, industry and trade associations, business reports, business and
company databases, journals, company registries, news portals and many other reliable sources. By using various sources we ensure maximum objectivity for
all obtained data. As a result, companies gain a precise and unbiased impression of the market situation.
Cross referencing of data is conducted in order to ensure validity and reliability.
The source of information and its release date are provided on every chart. It is possible that the information contained in one chart is derived from several
sources. If this is the case, all sources are mentioned on the chart.
The reports take into account a broad definition of B2C E-Commerce, which might include mobile commerce. As definitions may vary among sources, exact
definition used by the source (if available) is included at the bottom of the chart.
Our reports include text charts, pie charts, bar charts, rankings, line graphs and tables. Every chart contains an Action Title, which summarizes the main
idea/finding of the chart and a Subtitle, which provides necessary information about the country, the topic, units or measures of currency, and the applicable time
period(s) to which the data refers. With respect to rankings, it is possible that the summation of all categories amounts to more than 100%. In this case, multiple
answers were possible, which is noted at the bottom of the chart.
Reports are comprised of the following elements, in the following order: Cover page, preface, legal notice, methodology, definitions, table of contents,
management summary (summarizing main information contained in each section of report) and report content (divided into sections and chapters). When
available, we also include forecasts in our report content. These forecasts are not our own; they are published by reliable sources. Within Global and Regional
reports, we include all major developed and emerging markets, ranked in order of importance by using evaluative criteria such as sales figures.
If available, additional information about the data collection, for example the time of survey and number of people surveyed, is provided in the form of a note. In
some cases, the note (also) contains additional information needed to fully understand the contents of the respective data.
When providing information about amounts of money, local currencies are most often used. When referencing currency values in the Action Title, the EUR
values are also provided in brackets. The conversions are always made using the average currency exchange rate for the respective time period. Should the
currency figure be in the future, the average exchange rate of the past 12 months is used.
The reports include mainly data from the last 12 months prior to the date of report publication. Exact publication dates are mentioned in every chart.
5
METHODOLOGY (2 OF 2)
This report covers the online payment market. It takes into account a wide definition of online payment, including payment methods used in online shopping and
mobile payment, such as remote and proximity payments.
All major countries in the region are covered, while data availability varied across the markets.
Countries are grouped by advanced and emerging B2C E-Commerce markets. Within each group, the countries are presented in the descending order of B2C
E-Commerce sales. Besides country and regional data, information about global developments is also included.
Depending on data availability, the following types of market information are included: the most used payment methods among online shoppers, payment
methods most offered by online merchants, mobile payment usage, information about online and mobile payment users, such as security perceptions, number
and value of online/mobile payment transactions. Not all the mentioned types of information are available for each of the covered countries. For the two leading
countries in the region, also online and mobile payment trends and news about major players, such as payment providers, banks and retailers are presented.
The report includes data mostly published within the first six months of 2016. The exact date of publication of the source is stated on each chart. The time period
which the data refers to differs by source.

6
DEFINITIONS
ONLINE PAYMENT Transfer of money made over the Internet following a consumer’s payment command, includes payments for product
and service purchased in (B2C) E-Commerce and M-Commerce.
MOBILE PAYMENT A wide definition of mobile payments includes remote payments made in M-Commerce and proximity payments made
in-store, such as via QR code scanning and NFC technology.
MOBILE PROXIMITY PAYMENT A mobile payment where the merchant and the consumer are present in the same location and the interaction between
the consumer’s device (card, mobile device) and the POS is conducted using a proximity technology (e.g. NFC).
NFC Near Field Communication, a set of standards for smartphones and similar devices to create radio communication by
bringing them close together or having them touch each other. In that way, contactless data exchange and transactions
can take place.
ALTERNATIVE PAYMENTS
Generally refers to payment methods other than credit card or bank card payments. Widely defined, alternative online
payment methods include bank transfers and direct debit, digital wallets, pre-paid cards and private label cards, invoice,
and digital currency. May also include cash on delivery and card schemes by local companies other than global card
brands.
DIGITAL WALLET Also known as E-Wallet. A prepaid digital account, allowing users to store money and use it in online or mobile
transactions.
E-MONEY Short for electronic money. Money which is exchanged electronically using digitally stored values.
INSTANT PAYMENTS Electronic payment solutions for retail which are available 24/7/365 and thus result in immediate or close-to-immediate
interbank clearing of transactions and crediting of the payees’ accounts and confirm the payment to the payer after
payment initiation.
B2C E-COMMERCE The sale of products (and services) through electronic transactions via the Internet from businesses to consumers.
M-COMMERCE M-Commerce, also called “Mobile Commerce”, means the sale of products (and services) through transactions via
mobile devices.
ONLINE SHOPPING Purchase of products or services by consumers via the Internet. Broadly defined, may include business to consumer
and consumer to consumer transactions.
The following expressions and definitions are used in this B2C E-Commerce market report*:
Note: *the definitions used by the original sources might differ from the ones stated on this chart; the exact definition used by each source, where available, is included on the respective
charts
7
TABLE OF CONTENTS (1 OF 4)
1. Management Summary
2. Global Developments
• Payment Methods Used in Online Shopping, in % of Online Shoppers, October 2015
• Payment Methods Used in Online Shopping, by Regions, in % of Online Shoppers, October 2015
• Share of High-Spending and High-Frequency Online Shoppers Who Would Abandon Online Shopping Cart If Unable to Pay by Preferred
Method, in %, March 2016
• Value of Online Payment Fraud, in USD billion, 2015 & 2020f
• Breakdown of Online Payment Fraud by Segments, in % and in USD billion, 2020f
• Breakdown of Innovations that are Expected to Have the Largest Impact on Payment Fraud Prevention in the Next 3-5 Years, in %,
October 2015
• Breakdown of the Means of Security Protection for Consumers Making Mobile Payment that are Expected to Become Dominant by 2030,
in %, October 2015
• Mobile Payment Usage In-Store and Online, in % of Respondents, by Generation, 2015
• Perception of Security of Mobile Payments, in % of Respondents, by Generations, 2015
• Top 10 Merchant Acquirers, by Volume, in USD billion, 2015
3. Asia-Pacific
3.1. Regional
• Share of Adults Using Digital Wallets, in %, by Selected Countries and Regional, 2013 - 2015
3.2. Advanced Markets
3.2.1. Japan
• Online and Mobile Payment Trends and News about Players, H1 2016
• Breakdown of Experience with Cases Where Preferred Payment Method Was Not Offered, in % of Online Shoppers, March 2016
• Breakdown of Payment Methods Most Used in Online Shopping, in % of Online Shoppers, March 2016

8
TABLE OF CONTENTS (2 OF 4)
3. Asia-Pacific (Cont.)
3.2. Advanced Markets (Cont.)
3.2.1. Japan (Cont.)
• Payment Methods Used in Online Shopping, in % of Online Shoppers, March 2016
• Reasons for Choosing a Particular E-Commerce Website, incl. Payment-Related, in % of Online Shoppers, March 2016
• Breakdown of Awareness of Virtual Currencies, in % of Internet Users, and Interest in Using Them, in % of Internet Users Who Know
Virtual Currencies, May 2016
• Locations for Current/Intended Use of Virtual Currencies, incl. “Online Shopping”, in % of Internet Users Who Are Aware of Virtual
Currencies and Are Interested in Using Them, May 2016
• Number and Value of Electronic Money Transactions, in millions and in JPY billions, and in % Year-on-Year Change, 2010-2015
3.2.2. South Korea
• Payment Methods Used in Online Shopping, in % of Online Shoppers, October 2015
• Payment Methods Used in Online Shopping, in % of Online Shoppers, by PC and Mobile Shoppers, October 2015
• Reasons for Shopping Online, incl. Payment-Related, in % of Online Shoppers, by PC and Mobile Shoppers, October 2015
• Reasons for Using Mobile Payment Services, in % of Mobile Payment Users, May 2016
• Purposes of Using Mobile Payments, in % of Mobile Payment Users, September 2015
• Payment Methods Used in Mobile Shopping, in % of Mobile Shoppers, 2014 & 2015
• Overview of Four Selected Mobile Payment Services, incl. Provider, Launch Date and Number of Users, June 2016
3.2.3. Australia
• Share of Online Shoppers Who Are More Inclined to Shop More Often from a Store Which Saves Their Payment Details for One-Click
Ordering, by Mobile Shoppers and Non-Mobile Shoppers, in %, April 2016
• Share of Internet Users Who Would Feel Confident that Their Money Is Secure If They Used Contactless Payments, April 2016
• Breakdown of Frequency of Using Contactless Payments In-Store, in % of Internet Users, 2015

9
TABLE OF CONTENTS (3 OF 4)
3. Asia-Pacific (Cont.)
3.3. Emerging Markets
3.3.1. China
• Online and Mobile Payment Trends and News about Players, H1 2016
• Payment Methods Used in Online Shopping, in % of Online Shoppers, October 2015
• Number of Online Payment Users, in millions, and Penetration, in % of Internet Users, 2012 - 2015
• Third-Party Online Payment GMV, in CNY trillion, and in % Year-on-Year Change, 2012 - 2019f
• Breakdown of Third-Party Online Payment GMV, in %, and Total, in CNY trillion, Q1 2015 – Q4 2015
• Breakdown of Third-Party Online Payment GMV, by Providers, in %, 2015
• Number of Mobile Payment Users, in millions, and Penetration, in % of Mobile Internet Users, 2014 & 2015
• Proximity Mobile Payment Users, in millions, and Penetration, in % of Smartphone Users, 2014 – 2020f
• Third-Party Mobile Payment GMV, in CNY trillion, and in % Year-on-Year Change, 2012 - 2019f
• Breakdown of Third-Party Mobile GMV by Provider, in %, 2015
• Breakdown of Third-Party Mobile Payment Transaction Volume by Providers, in %, Q4 2015
• Number of Active Users of Selected Mobile Payment Services, in millions, Q4 2015
3.3.2. Taiwan
• Share of Smartphone Users Who Use Mobile Payment Services, in %, 2014 & 2015
• Top 5 Verification Methods Acceptable to Consumers in Mobile Payments, in % of Mobile Payment Users, 2015
3.3.3. India
• Payment Methods Used in Online Shopping, in % of Online Shoppers, October 2015
• Share of Returns in All Online Purchases and Cash on Delivery Purchases, 2015
• Share of Urban Online Shoppers Aged 31-54 Who Prefer Online Payment Methods, in %, 2015
• Breakdown of Reasons for Not Shopping Online, in % of Internet Users Who Do Not Shop Online, 2015
• Top 3 Mobile Wallet Apps, by Penetration, in % of Mobile Payment App Users, and Average Time Spent Per User Per Month, in minutes,
December 2015 & April 2016

10
TABLE OF CONTENTS (4 OF 4)
3. Asia-Pacific (Cont.)
3.3. Emerging Markets (Cont.)
3.3.4. Indonesia
• Breakdown of E-Commerce Payments by Payment Method, by Approximate Share in %, 2015
• Number of E-Money Transactions, in millions, and Value, in IDR billion, 2010 - 2015
• Breakdown of Locations of Using Digital Wallets, in % of Internet Users Using Digital Wallets, by Gender, 2015
3.3.5. Thailand
• Payment Methods Used in Online Shopping, by Gender and Generation, May 2015
• Value Online Payment Transactions, in THB billion, and Number, in millions, by Bank, Non-Bank and Total, 2010 – 2015
• Value of Mobile Payment Transactions, in THB billion, and Volume, in millions, by Bank, Non-Bank and Total, 2010 – 2015
3.3.6. Vietnam
• Payment Methods Used in Online Shopping, in % of Online Shoppers, 2014 & 2015
• Payment Methods Offered, in % of E-Commerce Companies, 2015
• Top 5 Online Payment Service Providers, in % of E-Commerce Companies Accepting Online Payment, 2015

11
1. Management Summary 11 – 14
2. Global Developments 15 – 25
3.
3.1.
3.2.
Asia-Pacific
Regional
Advanced Markets
Japan
South Korea
Australia
26 – 46
26 – 27
28 – 46
29 – 36
37 – 43
44 – 46
3.3. Emerging Markets
China
Taiwan
India
Indonesia
Thailand
Vietnam
47 – 75
48 – 59
60 – 61
62 – 66
67 – 69
70 – 72
73 – 75
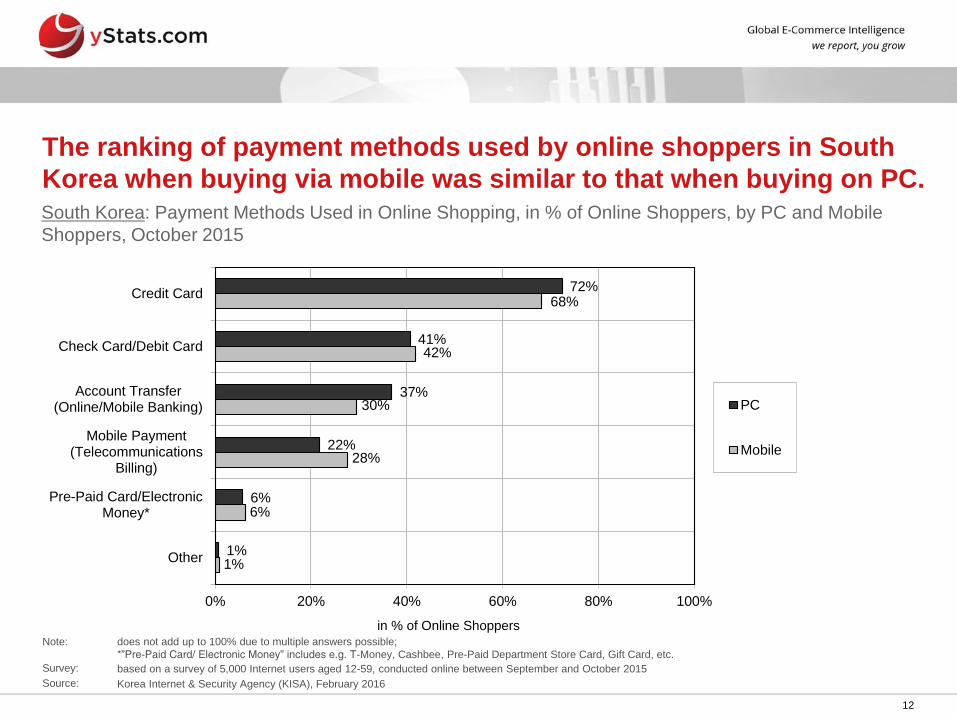
1%
6%
28%
30%
42%
68%
1%
6%
22%
37%
41%
72%
0% 20% 40% 60% 80% 100%
Other
Pre-Paid Card/ElectronicMoney*
Mobile Payment(Telecommunications
Billing)
Account Transfer(Online/Mobile Banking)
Check Card/Debit Card
Credit Card
PC
Mobile
12
The ranking of payment methods used by online shoppers in South
Korea when buying via mobile was similar to that when buying on PC. South Korea: Payment Methods Used in Online Shopping, in % of Online Shoppers, by PC and Mobile
Shoppers, October 2015
in % of Online Shoppers Note: does not add up to 100% due to multiple answers possible;
*”Pre-Paid Card/ Electronic Money” includes e.g. T-Money, Cashbee, Pre-Paid Department Store Card, Gift Card, etc.
Survey: based on a survey of 5,000 Internet users aged 12-59, conducted online between September and October 2015
Source: Korea Internet & Security Agency (KISA), February 2016

The number of online payment users in China reached 416.2 million
in 2015, representing 60.5% of Internet users. China: Number of Online Payment Users, in millions, and Penetration, in % of Internet Users, 2012 - 2015
220,7 260,2
304,3
416,2 39,1% 42,1%
46,9%
60,5%
0%
20%
40%
60%
80%
100%
0
200
400
600
800
1000
2012 2013 2014 2015
Number of Online Payment Users in % Share of Internet Users
in m
illio
ns
in %
Share
of In
tern
et U
sers
Note: as of the end of each year
Source: China Internet Network Information Center, January 2014, February 2015, April 2016
13

14