Embed Size (px)
Citation preview
The Ports Regulator
Regulation in the South African
Port System Coal Transportation Africa Summit
Mahesh Fakir
CEO
19 May 2015
National Ports Act Background
• Sea transport is an essential vehicle of international trade. • With approximately 80% of SA’s trade being by sea, efficient ports are catalysts for
trade growth • The Act was established with the purpose of ensuring affordable, internationally
competitive, efficient and safe port services based on a transparent and cost-effective nature that is economically and environmentally sustainable.
• The Act contains mandates and functions of Ports Regulator and National Ports Authority
• Sets out powers of Ministers of Transport and Public Enterprises • Sets overall governance framework for ports system • Enacted on the 26th November 2006 • Structure
– Act – Parliament – Regulations – Minister of Transport – Directives – Ports Regulator – Rules - NPA
www.portsregulator.org 2

Objectives of the National Ports Act
• Development of an effective and productive ports industry for economic growth and development
• Promote and improve efficiency and performance in the management and operations of ports
• Promote the development of an integrated regional production and distribution system in support of government policies
www.portsregulator.org 3
The role of the Ports Regulator (In terms of the Ports Act)
• Exercise economic regulation of the port system in line with government’s strategic objectives
• Promote equity of access to ports, facilities and services provided in ports
• Monitor the activities of the National Ports Authority to ensure compliance with the Act
• Adjudicate complaints and appeals against the Authority
• Approve or reject the Authority tariffs
• Promote regulated competition
• Regulate the provision of adequate, affordable and efficient port services and facilities
www.portsregulator.org 4

Who is the Ports Regulator?
• It consists of 9 Members (currently 6) that constitute the economic regulatory authority for the ports system in South Africa
• They are independent in the performance of their mandate from Government Departments
• They are one of the key institutions envisaged by the Ports Policy
• The Secretariat assists the Regulator in carrying out its mandate
www.portsregulator.org 5
What is the Regulator’s role in NPA tariffs?
• To ensure that NPA tariffs are utilised in ensuring that the port system is efficient
• To ensure that the tariffs are affordable to port users
• To ensure that the tariffs are predictable and non-discriminatory
• To prevent the utilisation of tariffs for cross-subsidisation unless in the public interest
www.portsregulator.org 6

Economic Impact of the Regulator • Since inception of the Regulator in 2009 to date:
– There has been a smoothing of the NPAs tariffs – Tariff decision has translated into a saving to users of more than
R5.2 b over the period
• Rationalised Tariffs – R1 bn rebate – Significantly lower approved tariffs – Continued sustainability of NPA
• Proactive and risk mitigating – Excessive Tariff Increase Margin Credit – R2.5 bn available to offset future increases
• Looking forward – Fair tariff incidence – More accurate investment signals through a multi-year tariff
methodology
www.portsregulator.org 7

Weighted Return on Asset Base
www.portsregulator.org 8
3.50%
4.50%
5.50%
6.50%
7.50%
8.50%
9.50%
10/11 11/12 12/13 13/14 14/15
NPA Application
Regulator Allowed
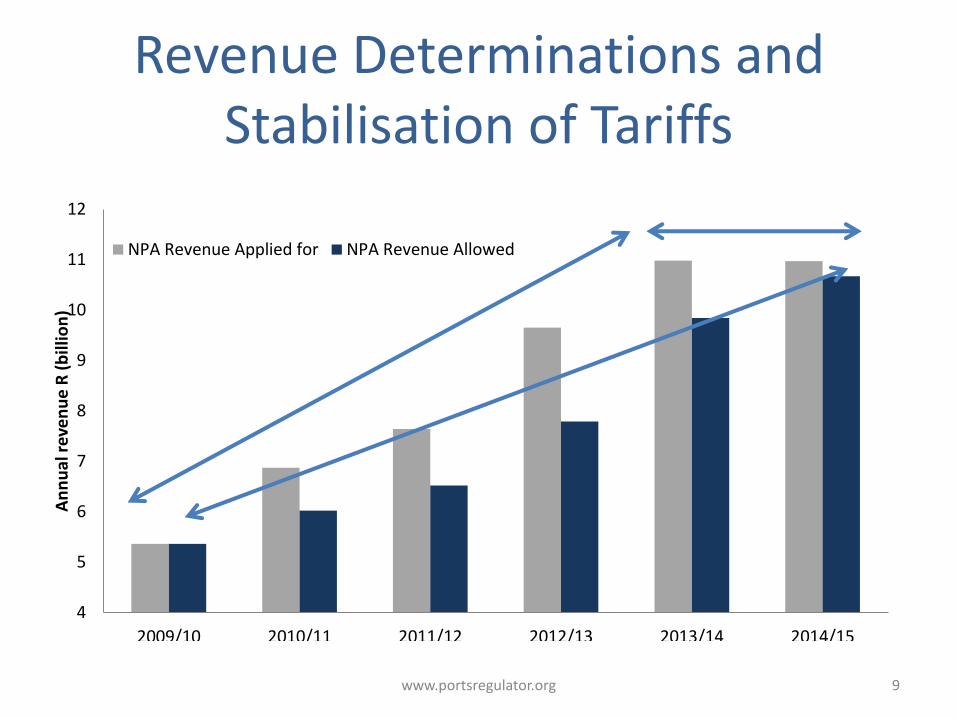
Revenue Determinations and Stabilisation of Tariffs
www.portsregulator.org 9
4
5
6
7
8
9
10
11
12
2009/10 2010/11 2011/12 2012/13 2013/14 2014/15
An
nu
al r
eve
nu
e R
(b
illio
n)
NPA Revenue Applied for NPA Revenue Allowed

Purpose of NPA tariffs
• To enable the NPA to-
– Recover its investment in owning, controlling and administering ports and its investment in port services and facilities
– Recover its costs in maintaining, operating, controlling and administering ports and its costs in providing port services and facilities
– Make a profit commensurate with the risk involved in ports services and facilities
www.portsregulator.org 10

The Regulatory Manual
• Outlines the mandate of the Ports Regulator of South Africa (the Regulator), the regulatory framework governing the National Ports Authority’s (the Authority/NPA) tariff setting process and matters relating to compliance of the NPA with the Regulatory Framework.
• 2nd version of the manual – 2014/15 Interim Tariff manual (one year)
– 2015/16-2017/18 Tariff manual (multi-year)
11 www.portsregulator.org

Multi-Year Methodology • Previously an interim 1 year methodology • Now fixed for 3 years with annual review and an annual
adjustment of tariffs • No fixing of tariffs for the 3 year period to protect users
from possible large step changes in the tariff. • Large variations in the users and usage of port
infrastructure and services over time • Annual review allows adjustments in prices to be more
efficiently and appropriately allocated to users • Lower regulatory uncertainty
– Will narrow the difference between what is requested by the NPA and subsequently granted by the Regulator.
– Assists stakeholders in formulating responses to the NPA tariff application in a manner that will assist the Regulator in its decision making.
12 www.portsregulator.org

Assessment of Authority’s Tariffs • In terms of the Act, NPA to submit proposed tariffs to Ports
Regulator • Tariffs cover all NPA activities as a Port Authority • Published for comments • Regulator to hold hearings and invite submissions on proposed
tariff increases • After consideration of submissions, Regulator shall approve or
reject some or all of the tariff increases • Elements of proposed tariff-
– Manner of calculation and model – All financial information and valuations – Reinvestment of profits and revenues – Impact on port activity cost structures – Impact on NPA financial position
www.portsregulator.org 13
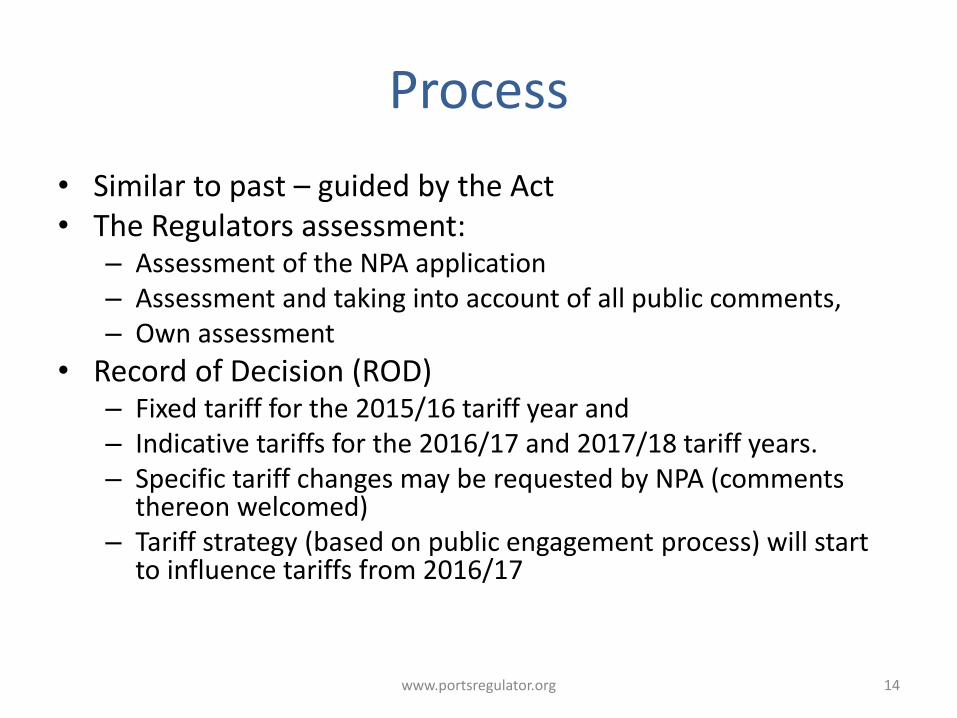
Process
• Similar to past – guided by the Act • The Regulators assessment:
– Assessment of the NPA application – Assessment and taking into account of all public comments, – Own assessment
• Record of Decision (ROD) – Fixed tariff for the 2015/16 tariff year and – Indicative tariffs for the 2016/17 and 2017/18 tariff years. – Specific tariff changes may be requested by NPA (comments
thereon welcomed) – Tariff strategy (based on public engagement process) will start
to influence tariffs from 2016/17
14 www.portsregulator.org
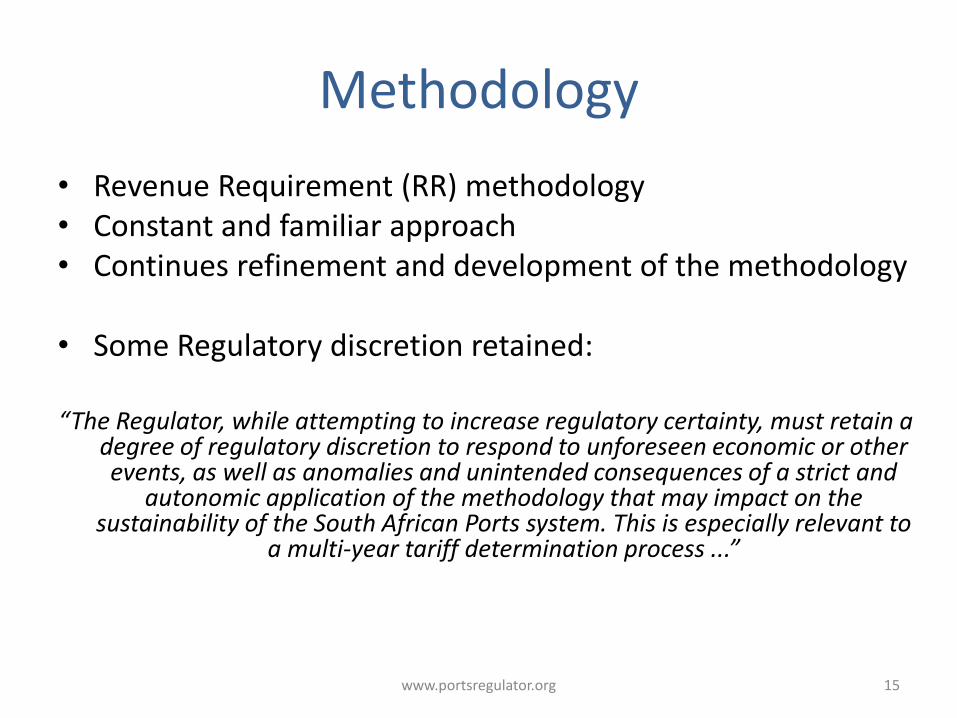
Methodology
• Revenue Requirement (RR) methodology • Constant and familiar approach • Continues refinement and development of the methodology
• Some Regulatory discretion retained:
“The Regulator, while attempting to increase regulatory certainty, must retain a
degree of regulatory discretion to respond to unforeseen economic or other events, as well as anomalies and unintended consequences of a strict and
autonomic application of the methodology that may impact on the sustainability of the South African Ports system. This is especially relevant to
a multi-year tariff determination process ...”
15 www.portsregulator.org
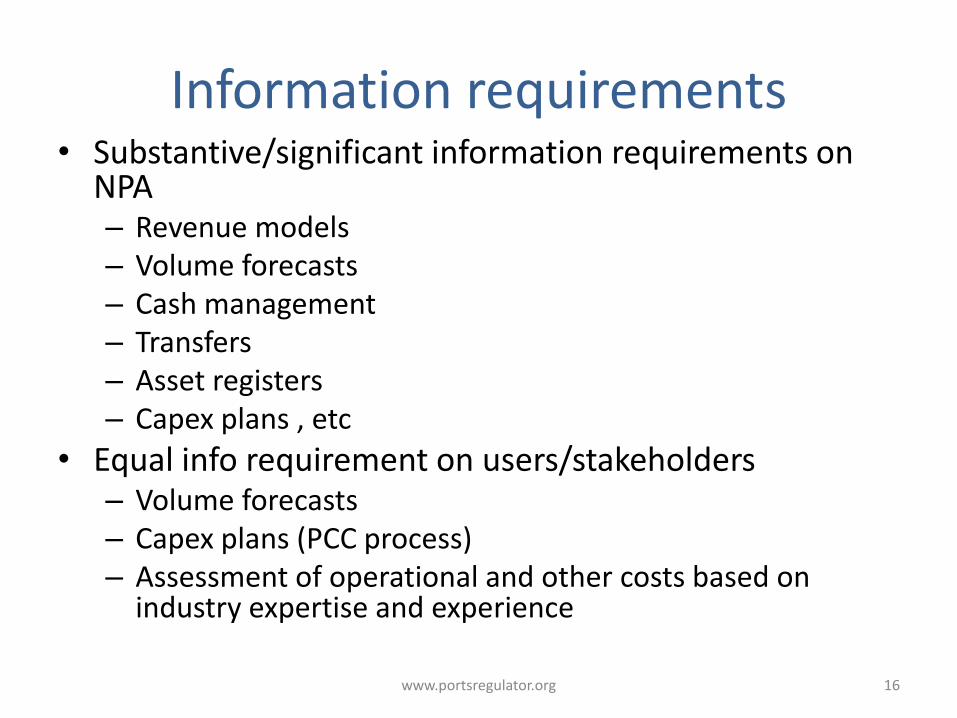
Information requirements • Substantive/significant information requirements on
NPA – Revenue models – Volume forecasts – Cash management – Transfers – Asset registers – Capex plans , etc
• Equal info requirement on users/stakeholders – Volume forecasts – Capex plans (PCC process) – Assessment of operational and other costs based on
industry expertise and experience
16 www.portsregulator.org

Components of the Revenue Required Tariff Methodology
• Regulatory Asset Base (RAB) – Depreciation – Working Capital – Asset Valuation
• Weighted Average Cost of Capital (WACC) (CAPM model) • Taxation • Operating Expense • Depreciation • Claw Back • Excessive Tariff Increase Margin Credit (ETIMC) • Volume forecast
17 www.portsregulator.org

Overview of Tariff Methodology
Revenue Requirement = Regulatory Asset Base (RAB) x Weighted Average Cost of Capital (WACC) + Depreciation + Operating Expenditure + Taxation Expense ±Claw Back ±Excessive tariff Increase Margin Credit (ETIMC) • It requires that the NPA estimate its operating costs, depreciation, tax expense
and return on capital (a product of the weighted average cost of capital and the value of assets in the Regulatory Asset Base for the period under review).
• In addition, there is a claw-back mechanism that corrects for over or under recoveries in previous tariff periods, as well as the excessive tariff increase margin credit (ETIMC).
18 www.portsregulator.org
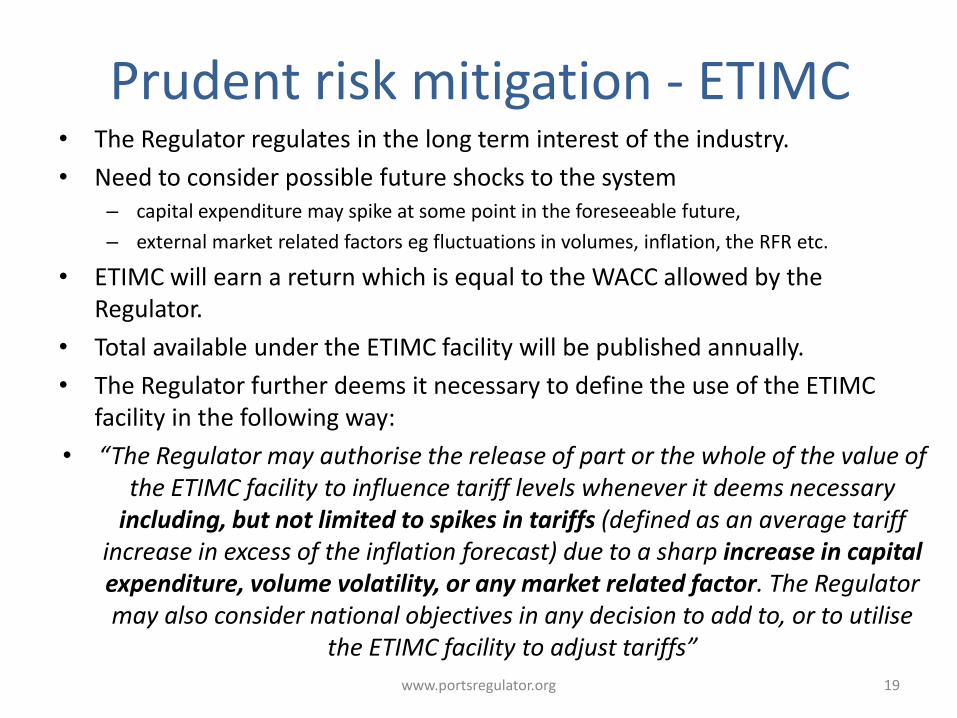
Prudent risk mitigation - ETIMC • The Regulator regulates in the long term interest of the industry.
• Need to consider possible future shocks to the system – capital expenditure may spike at some point in the foreseeable future,
– external market related factors eg fluctuations in volumes, inflation, the RFR etc.
• ETIMC will earn a return which is equal to the WACC allowed by the Regulator.
• Total available under the ETIMC facility will be published annually.
• The Regulator further deems it necessary to define the use of the ETIMC facility in the following way:
• “The Regulator may authorise the release of part or the whole of the value of the ETIMC facility to influence tariff levels whenever it deems necessary
including, but not limited to spikes in tariffs (defined as an average tariff increase in excess of the inflation forecast) due to a sharp increase in capital expenditure, volume volatility, or any market related factor. The Regulator may also consider national objectives in any decision to add to, or to utilise
the ETIMC facility to adjust tariffs”
19 www.portsregulator.org
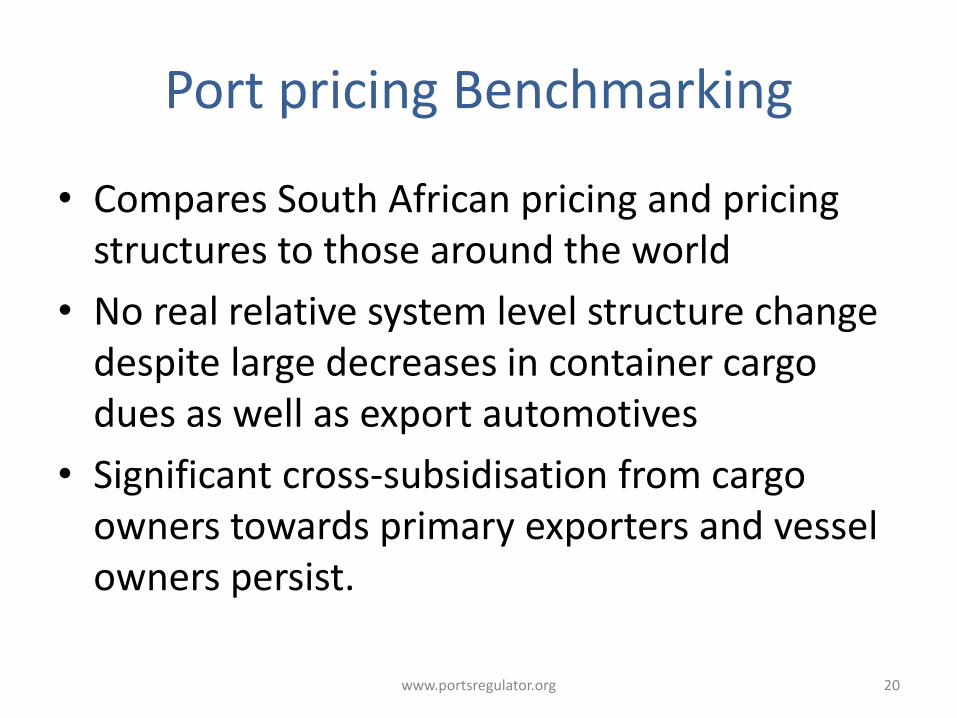
Port pricing Benchmarking
• Compares South African pricing and pricing structures to those around the world
• No real relative system level structure change despite large decreases in container cargo dues as well as export automotives
• Significant cross-subsidisation from cargo owners towards primary exporters and vessel owners persist.
20 www.portsregulator.org

Vessel costs remain relatively cheaper
• All vessels face much lower overall costs in RSA ports than the averages in the study, ranging from 32% below the global norm in the case of containers and 75% for iron ore
• real price decrease in the 2013/14 tariff year resulted in a relative increase of the discount to the global average.
• The depreciation of the South African Rand by 16.7% for the period also contributed to the decrease in the dollar price.
• The incidence of the tariff clearly indicates that foreign users of the ports are not contributing to the overall infrastructure costs in a similar manner than they do in the global average.
21 www.portsregulator.org
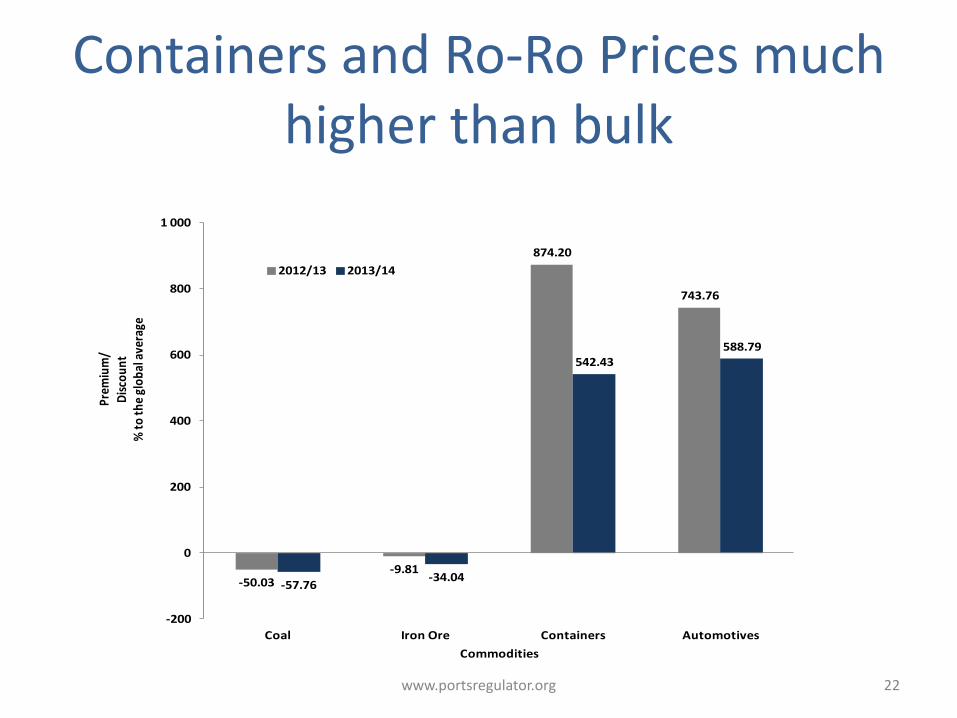
Containers and Ro-Ro Prices much higher than bulk
-50.03-9.81
874.20
743.76
-57.76-34.04
542.43588.79
-200
0
200
400
600
800
1 000
Coal Iron Ore Containers Automotives
Pre
miu
m/
Dis
cou
nt
% t
o t
he
glo
bal
ave
rage
Commodities
2012/13 2013/14
22 www.portsregulator.org
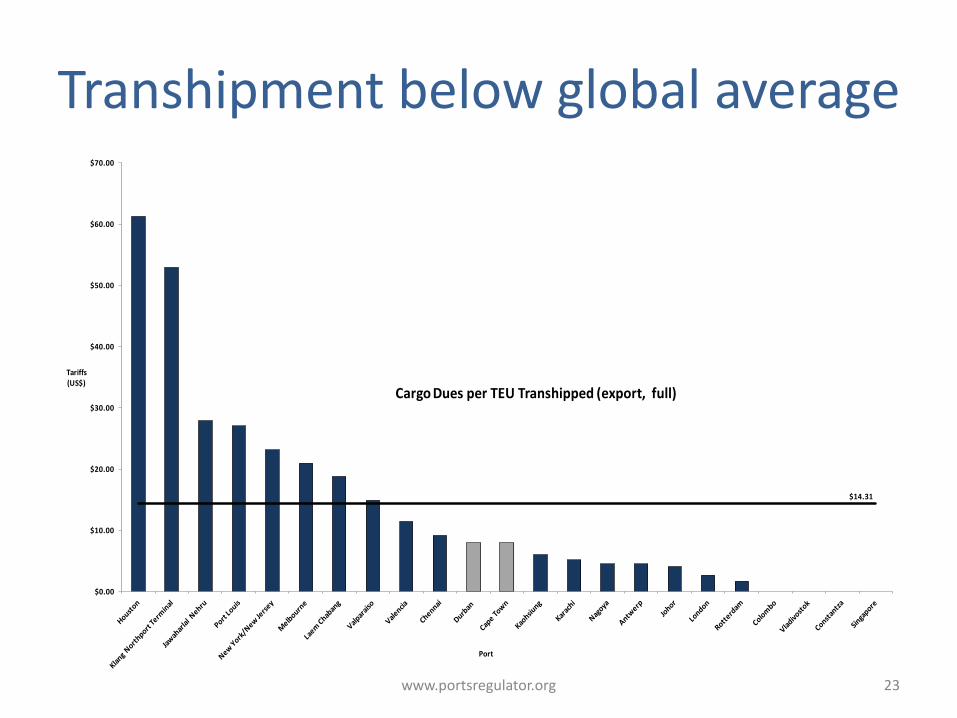
Transhipment below global average
$14.31
$0.00
$10.00
$20.00
$30.00
$40.00
$50.00
$60.00
$70.00
Tariffs(US$)
Port
Cargo Dues per TEU Transhipped (export, full)
23 www.portsregulator.org

TPT tariffs remain high
$140 707.02
0
50 000
100 000
150 000
200 000
250 000
300 000
Valencia Durban Cape Town Colombo Port Louis Valparaiso Kaohsiung Klang
Northport Terminal
Johor Houston Jawaharlal
NehruLaem
ChabangChennai Vladivostok
Tariffs
(US$)
Port
24 www.portsregulator.org

What can we conclude from this? • High levels of cross-subsidisation in the port system remain a
concern.
• The Regulator has started to adjust the tariff book within the parameters of the Revenue Required methodology applied in the tariff setting process.
• This has started to bring about some normalisation- much more is required and current Tariff Strategy process will take it further.
• South African “Free on Board” (FOB) export and “Cost, Insurance and Freight” (CIF) import predominance in concluding international trade contracts ensuring that the bulk of the port charges liability lies with the South African party, South African container cargo owners continue to carry the greatest burden of the transaction.
25 www.portsregulator.org

Tariff Strategy
• Must address the anomalies and imbalances in the tariff book.
• Establish a more equitable and fair allocation of costs
• Determines the slicing of the cake-not the size
• Close cooperation with the NPA
• Will include comprehensive public consultative process
• May start to take effect from 2016/17
www.portsregulator.org 26

Status Quo/Problem Statement
• Lack of a clear set of principles and rules to be applied in determining the individual tariffs for the various services and facilities, especially where deviating from a baseline tariff;
• Lack of clarity and transparency regarding all operating costs, expenses and revenues incurred or generated from a specific service, facility or land, as well as the value of the capital stock related to such services, facilities or land;
• Lack of explanation for differential tariffs for different commodities using the same handling classification;
• Lack of information detail with respect to services or facilities pricing and cost relationships, making it impossible to determine where and in which direction subsidisation takes place or if it does not;
• Lack of information on how the tariff structure promotes access to ports and efficient and effective management and operation of ports.
www.portsregulator.org 27

Status Quo/Problem Statement
• Very high tariff levels for cargo dues resulting from the migration from the old wharfage charge, which was calculated on an ad-valorem basis depending on the value of the cargo;
• Very high differentials in the levels of cargo dues for different cargo types and commodities with no clear motivation for the differences;
• Relatively low tariff levels for maritime services, which are based on an activity-based costing exercise conducted during the tariff reform of 2002 and that has since not been updated, resulting in the subsidisation of most services;
• Relatively low and unevenly distributed levels of revenue from the real estate business based on the asset value and benefits derived from being in the port system
www.portsregulator.org 28
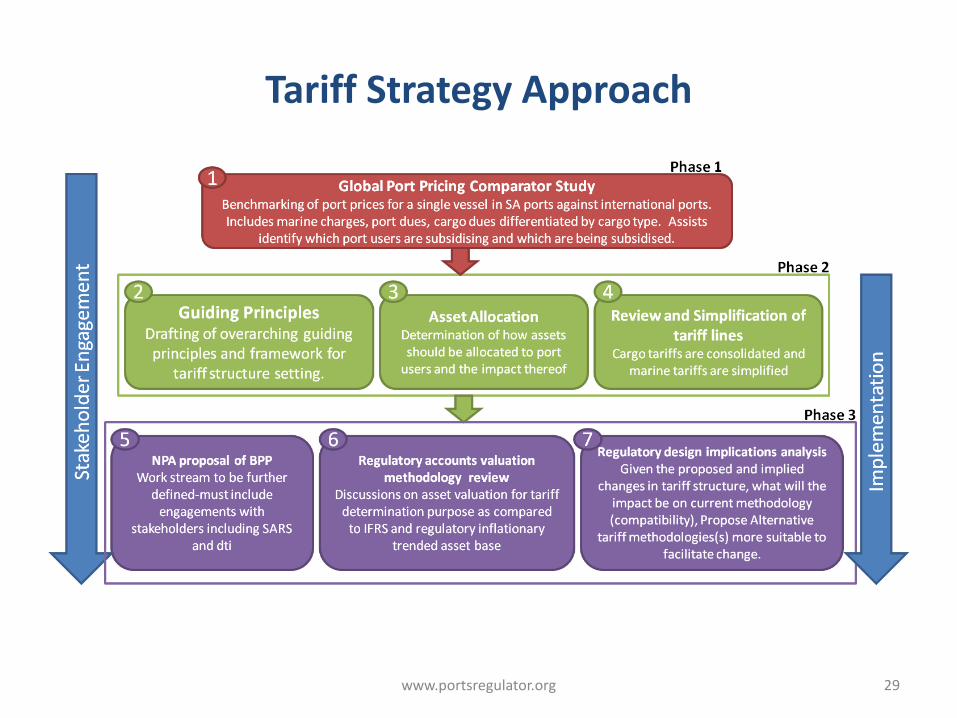
Tariff Strategy Approach
www.portsregulator.org 29

Asset allocation
www.portsregulator.org 30
Cargo owner,
60%
Shipping Lines, 18%
Tenants, 22% Cargo
Owner 35%
Shipping Lines 36%
Tenants 29%
The new asset allocation results in the following changes in required revenue per user group.
Current Proposed

Cargo Dues – Global Port Pricing Study
The GPPCS produced by the Ports Regulator for the past three years shows that cargo dues, collectively, are higher than global ports but, importantly, that container and automotive cargo dues are substantially higher than dry bulk cargo dues (which are slightly below the global average).
www.portsregulator.org 31
743.76
874.20
-50.03
-5.28
588.79
413.39
-57.76-34.04
541.00
388.23
-59.70 -45.63-90
110
310
510
710
910
Automotive Containers Coal iron ore
Dev
iati
on%
Commodities
2012/2013
2013/2014
2014/2015
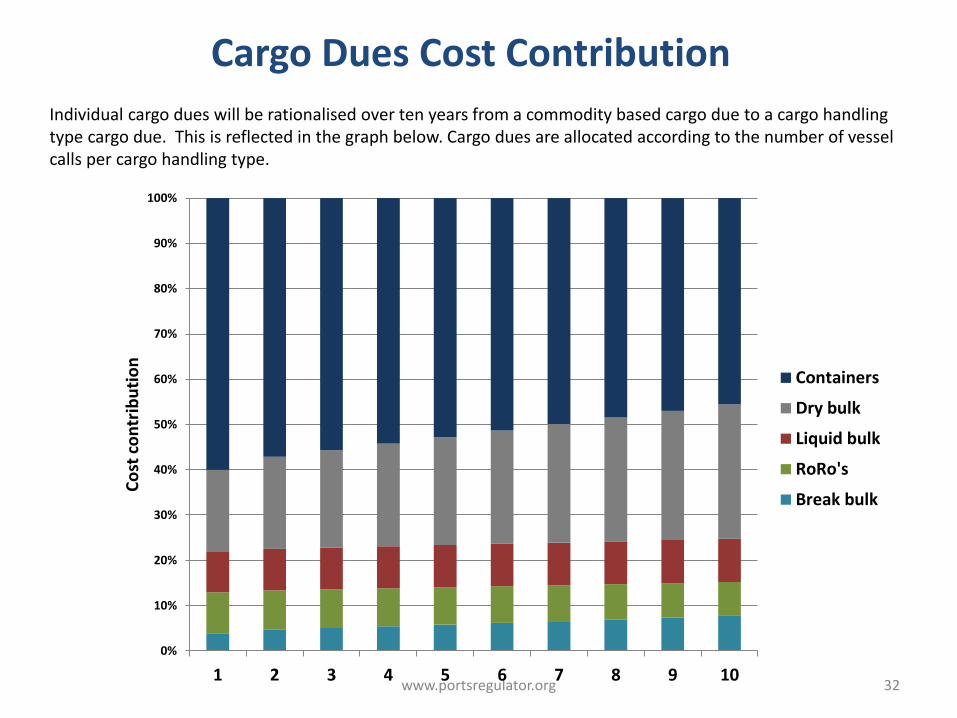
Cargo Dues Cost Contribution
www.portsregulator.org 32
0%
10%
20%
30%
40%
50%
60%
70%
80%
90%
100%
1 2 3 4 5 6 7 8 9 10
Co
st c
on
trib
uti
on
Containers
Dry bulk
Liquid bulk
RoRo's
Break bulk
Individual cargo dues will be rationalised over ten years from a commodity based cargo due to a cargo handling type cargo due. This is reflected in the graph below. Cargo dues are allocated according to the number of vessel calls per cargo handling type.

Cargo Dues change in Required Revenue
www.portsregulator.org 33
3.9%
9.0% 9.1%
18.0%
60.0%
7.7% 7.5% 9.5%
29.7%
45.5%
0%
10%
20%
30%
40%
50%
60%
70%
Break bulk RoRo's Liquid bulk Dry bulk Containers
Co
ntr
ibu
tio
n t
o R
eq
uir
ed
Rev
en
ue
fro
m C
argo
Current distribution
Target distribution

Marine Services Cost allocation
www.portsregulator.org 34
26%
31% 12%
6%
7%
4% 5%
0%
5%
2%
14%
32%
10% 4%
4%
8%
6%
1%
14%
6%
Port Dues
Tugs
Pilotage
VTS
Light Dues
Berthing
Ship Repair
Floating Crane
Networks
Facilities
The proportions of revenue recovered from various marine services will change under the tariff strategy in the following ways. Changes are a result of a more accurate reflection of the underlying cost of each service.

Strategic approach to cross-subsidies
www.portsregulator.org 35
Potential Cross-subsidies arising from historical
pricing
Tariff strategy approach
Cargo owners are subsidising other user groups
such as vessel owners, and tenants.
A new asset allocation that results in an infrastructure cost reflective tariff
proportional to the benefit each user group derives from the infrastructure or
service provision. See sections 2 and 3.
Container and automotive cargo owners pay
more than dry bulk cargo owners on a global
comparator basis
Similarly, infrastructure is costed according to benefit derived from each cargo
handling type – this is calculated by weighting total revenue required from cargo
owners according to the number of vessel calls per cargo type and is then
divided by total volume to get a per unit cost. See section 4.1.
It is still to be determined whether lessees are
being subsidised (i.e. paying less than market
value for their land) and whether some lessees are
subsidising others (i.e. paying unequal or unfair
tariffs).
The Regulator will start to actively monitor rental prices to ensure that two
pieces of land with similar characteristics are not being charged radically
different rentals. Furthermore, the Regulator will endeavour to determine the
market value of port land as part of its asset valuation exercise. See section 4.3.
Port users of a particular port subsidising users in
other ports, through a system wide tariff book
approach.
System-wide pricing will remain in order to reduce the risk placed on any single
port user; however, the tariff book is to be rebalanced and direct user charges in
certain instances may be introduced. See section 2.3.
Port users subsidise fledgling port-related
industries and other national policy
initiatives/government objectives.
Discounting certain infrastructure for identified port users in order to achieve
national objectives of economic growth and inclusion will remain. See section
5.
Use of port revenue/profits for non-port
purposes.
This is outside the scope of the tariff strategy
Port users of the same category or user group
paying lower tariffs than similar users through
differentiated tariffs or discount structures.
All discount structures are to be removed from the tariff book. Tariff
rationalisation will result in a gradual move towards consolidated tariffs that will
include the removal of any discount structure currently in place. Certain built-in
incentives and discounts will remain, mainly related to coastwise shipping and
transhipment etc. See section 5.2 for further information.

Port users’ role critical in considering and supporting the following...
• NPA Port Development Framework Plan (medium to long term planning)
• Annual Capex plan and expenditure trends (projects)
• Volume: Trade and vessel traffic
• Port productivity and performance (infrastructure and marine performance)
• Operators Performance Standards
www.portsregulator.org 36
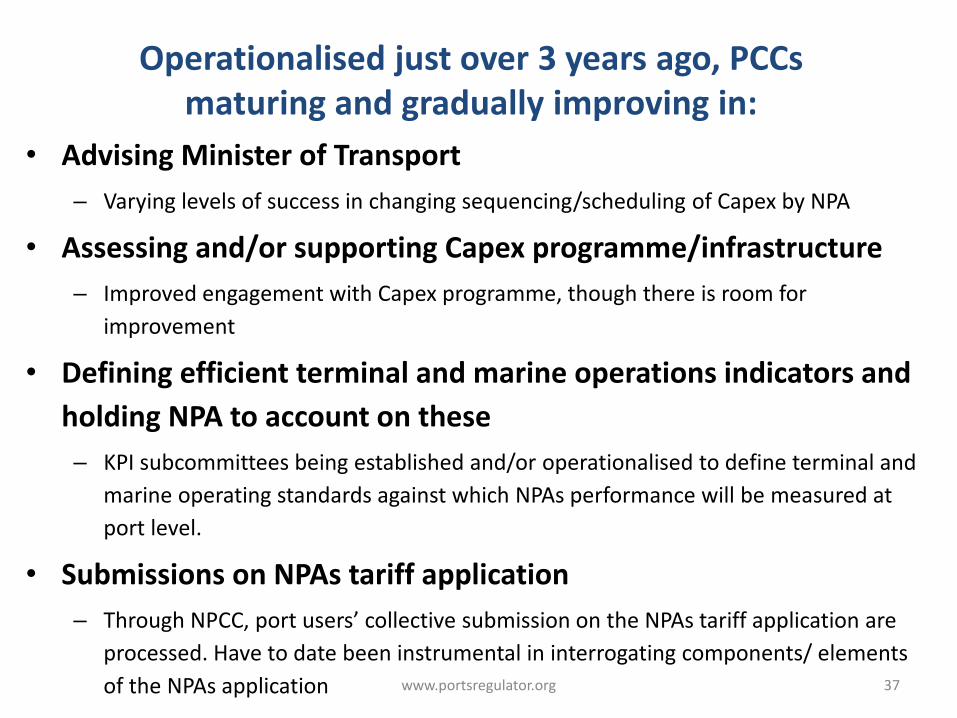
Operationalised just over 3 years ago, PCCs maturing and gradually improving in:
• Advising Minister of Transport
– Varying levels of success in changing sequencing/scheduling of Capex by NPA
• Assessing and/or supporting Capex programme/infrastructure
– Improved engagement with Capex programme, though there is room for
improvement
• Defining efficient terminal and marine operations indicators and
holding NPA to account on these
– KPI subcommittees being established and/or operationalised to define terminal and
marine operating standards against which NPAs performance will be measured at
port level.
• Submissions on NPAs tariff application
– Through NPCC, port users’ collective submission on the NPAs tariff application are
processed. Have to date been instrumental in interrogating components/ elements
of the NPAs application
www.portsregulator.org 37

38
Ke ya leboga Ke a leboha
Ke a leboga Ngiyabonga Ndiyabulela
Ngiyathokoza Ngiyabonga
Inkomu Ndi khou livhuha
Thank you Dankie
Go to http://www.portsregulator.org for documents
including Records of Decision, Regulatory Manual,
consultation submissions and reports, Draft Tariff Strategy
and other useful documents
www.portsregulator.org