Embed Size (px)
Citation preview

1.0 INTRODUCTION
A study of inventory management at SARK CABLES LTD is undertaken inorder to
know the inventory performance and position of the company and to know the strength and
weakness and to assess the profitability of the company. Inventories constitute most significant
part of assets of large majority of the companies in India. Inventory a double edged sword is
usually an asset of an organization, if not used properly it will become liability. It is therefore
absolutely important to manage inventories efficiently and effectively in order to overcome
unnecessary investment.
Improper inventory management affects long term profitability and may fail ultimately.
10 to 20% of inventory can be reduced without any adverse effect on production and sales by
using simple inventory planning and control techniques
The scope of inventory management concerns the fine lines between replenishment lead
time, carrying costs of inventory, asset management, inventory forecasting, inventory valuation,
inventory visibility, future inventory price forecasting, physical inventory, available physical
space for inventory, quality management, replenishment, returns and defective goods, and
demand forecasting. Balancing these competing requirements leads to optimal inventory levels,
which is an on-going process as the business needs shift and react to the wider environment.
Inventory management involves a retailer seeking to acquire and maintain a proper
merchandise assortment while ordering, shipping, handling, and related costs are kept in check.
It also involves systems and processes that identify inventory requirements, set targets, provide
replenishment techniques, report actual and projected inventory status and handle all functions
related to the tracking and management of material. This would include the monitoring of
material moved into and out of stockroom locations and the reconciling of the inventory
balances. It also may include ABC analysis, lot tracking, cycle counting support, etc.
Management of the inventories, with the primary objective of determining/controlling stock
1
levels within the physical distribution system, functions to balance the need for product
availability against the need for minimizing stock holding and handling costs.
1.1 COMPANY PROFILE
SARK CABLES PVT.LTD. the only one company of its kind in Kerala promoted over a
decade ago in manufacturing various cables as per Indian/International specifications. They
commenced its production in 1996, December at new industrial development area (NIDA),
Kanjikode , Palakkad District, Kerala as a small scale industrial unit with permanent SSI
registration number 090711939, they are also registered with NSIC vide registration number,
NSIC/KER/UP/RS/8-53/99. As well as SISI vide KSX registration number KSX/1357/G9 date
5/4/1999.c
The company is catering to the needs of public sector undertaking OEMS in INDIA and
also executed import substitute requirement as well as very stringent applications like cable for
the rocket launching purposes under water communications etc
The company is managed by a board of directors consisting of 6 persons out of whom
Mr. K Sajeev Kumar is the Managing Director and Mr. Sunil Joseph, Director (Technical
Services) take care of the day today management of the company. the company has a prestigious
ISI certificate it has got ISO 9001-2000 certification on 2004.
The company has started second unit in Coimbatore which went into production from 1st
October 2008. The company has another associate unit in Thodupuzha , namely COCHIN
POWER CABLES PVT.LTD, which also produces power cable
SARK CABLES is mainly producing the wires and cables for industrial purpose like
heavy duty power cables, control cables, telephone cables, switch board cables, co-axial cables
as per the requirement of the customers.
The company has won many laurels, best entrepreneur by the department of industries
and commerce (1998 and 1999) and best entrepreneur by the Management Association and
2
Business Deepika. The mission statement of the company is to provide beneficial and innovative
product in time to the customers at competitive prices that represent the high value for the money
in the industry. The company is holding BSI license for manufacturing heavy duty underground
cables as per IS 1554/1 under license number CM/L6180765 and also light duty cables as per IS
694/1990 license number CM/L6148062. The company was awarded the prestigious ISO 9001-
2000 certificate by Phoenix Certification Private Limited who are associated by RVA
SARK CABLES also holding approvals from PWD for using their cables for government
works, vide their approval letter number EL2050898 and M/s Kerala State Electricity board vide
letter number CE.SSTLC/REC/SKDA approval 2001-02/389 dated 09.05.2001 they are
approved vendor with M/s. Cochin Refineries Limited (code number 524135) M/s. Hindustan
news print Limited (code number 51023), M/s. BHEL (code number 29766P), M/s. Kerala
Minerals and Limited (code number 50025) etc.
It won’t be out of place to mention here that SARK CABLES have been satisfactorily
working at various sites inside and outside Kerala and they have received performance certificate
from M/s. Keltron, M/s. Malabar Cements Limited, M/s. Kerala State Electricity Board etc.
1.1.1MISSION OF THE COMPANY
The mission statement of the company is providing beneficial and innovative product in
time to the customers at competitive prices that represent the high value for money in the
industry.
1.1.2VISION OF THE COMPANY
The vision of the company is to make it a leading player in the field and to compete with
leading, in another two years time. It also aims to give more importance in keeping up the quality
of their products.
As it is, the company is in the SSI sector. Company is undergoing an expansion program
and a second unit of the company has already started functioning, augmenting the manufacturing
and supply efficiently.
3
1.1.3LOCATION OF THE COMPANY
The company is situated in New Industrial Development Area at Kanjikode in Palakkad
District. It is located near Kerala Tamilnadu boarder.
1.1.4CAPACITY OF THE PLANT
The plant has a capacity to manufacture 8600 core kilometers of various cables per
month.
1.1.5OBJECTIVE OF THE COMPANY
The company was incorporated with the intention of manufacturing and marketing
different kind of cables and wires. The main objective of the company is to supply different
types of cables and wires according to the requirement of the customers.
1.1.6WORK FORCE OF THE SARK CABLES
SARK CABLES has around 60 employees. They have 3 shifts in a day. The shifts start
from morning 8.30 am. First shift is the general shift. In this shift on an average 45 employees
are working it is from 8.30 am to 4.30 pm. Second shift is from 4.30 pm to 12.30 am. In this shift
around 10 employees are working. The final shift is the night shift and is from 12.30 am to 8.30
am in this shift 5 employees are working.
The company is stocking the final product in the factorial godown. The finished goods
are moved out of the company within 15 days. The raw materials are also kept the company. The
company has well experienced technicians for the different manufacturing process. There is a
manager for production and he controls all the production process.
1.1.7DEPARTMENTS OF SARK CABLE
Purchase department
Marketing department
Human resource department
Account department
Production department
4
1.1.8PRODUCT
Sark Cables Pvt Ltd was incorporated for manufacturing and marketing cables and wires.
The main products of Sark Cables are;
Power and control cables up to 1100 volts
Single core flexible cables
Multi core flexible cables
Submersible or water proof cables
Weather proof service wire
Single core flexible flame retardant (fr) PVC wires cables.
Telephone and switch board cables
Recommended cables size for motors with star-delta and dol started
1.2STATEMENT OF PROBLEM
In many organizations inventory forms the largest single expenditure item. Efficient
management of inventory is considered to be one of the challenging problems of any
manufacturing unit. Studies made by various researches indicate that the inventories account for
nearly 60 per cent of production cost. The company is trying to improve the overall efficiency
and effectiveness of its functions and now introduce a system in inventory management.
Inventory Management is the most challenging task for the management.
Emphasized the need to maintain inventories to smoothen production and sales
operations, which is for the day-to-day use. Holding of inventories is necessary to protect against
the risk of unpredictable changes in the market. There is a speculative element which influences
the decision to increase or decrease Inventory levels to take advantage of price change. It is
therefore absolutely very important to manage inventories efficiently and effectively in order to
overcome unnecessary investment. Major problems faced by Sark cables are
No proper inventory control techniques in use
Raw materials are not categorized
Production cost and holding cost are high
5
1.3OBJECTIVE OF THE STUDY
The main objectives of the study are:-
To determine the stock level of each raw materials at SARK CABLES PVT.LTD for
proper identification of inventory control techniques.
To identify problems related to inventory management and to find out suitable measures
to overcome them.
To study how ABC analysis need to be implement in inventory management at SARK
CABLES PVT.LTD
1.4RESEARCH METHODOLOGY
The basic concept of research methodology refers to the way in which companies
conduct their research and how they collect the data they need. Whenever a company or
organization needs to investigate a particular area of their business dealings, they need to adapt
the most suitable research methodology for the job. The method adopted for the study is
secondary data analysis which provided by the SARK CABLES Pvt. Ltd. Details regarding the
purchase procedures are provided from the materials department and sales details are obtained by
discussions made with the personnel who are involved in the sales department.
1.4.1 PERIOD OF STUDY:
The period of the study for the project is for 21 days.
1.4.2 METHODOLOGY OF DATA COLLECTION
a) Primary data
The primary data is collected by personal interviews with officials.
b) Secondary data
Data are those which have been collected by someone else and which already
have been passed through statistical process. Secondary data has been taken from internet,
newspaper, magazines and companies web sites.
6
c) Field work
This was under taken individually to collect various information regarding the study by
visiting following sections.
Stores department
Information regarding stocking of materials receipts and issues to workshops. Inventory
control procedures in various wards inside the department were obtained.
Accounts department
Remaining all the information was obtained from accounts department through personal
interviews with section officials
7
2.0 INVENTORY MANAGEMENT
Inventory management is the process of efficiently overseeing the constant flow of units
into and out of an existing inventory. This process usually involves controlling the transfer in of
units in order to prevent the inventory from becoming too high, or dwindling to levels that could
put the operation of the company into jeopardy. Competent inventory management also seeks to
control the costs associated with the inventory, both from the perspective of the total value of the
goods included and the tax burden generated by the cumulative value of the inventory. (N G
Nair1996)1
2.1 INVENTORY
Inventory is an idle stock of physical goods that contain economic value, and are held in
various forms by an organization in its custody awaiting packing, processing, transformation, use
or sale in a future point of time. (N G Nair1996)1
Any organization which is into production, trading, sale and service of a product will
necessarily hold stock of various physical resources to aid in future consumption and sale. While
inventory is a necessary evil of any such business, it may be noted that the organizations hold
inventories for various reasons, which include speculative purposes, functional purposes,
physical necessities etc. (N G Nair1996)1
Inventory of materials occurs at various stages and departments of an organization. A
manufacturing organization holds inventory of raw materials and consumables required for
production. It also holds inventory of semi-finished goods at various stages in the plant with
various departments. Finished goods inventory is held at plant, FG Stores, distribution centers
etc. Further both raw materials and finished goods those that are in transit at various locations
also form a part of inventory depending upon who owns the inventory at the particular juncture.
Finished goods inventory is held by the organization at various stocking points or with dealers
and stockiest until it reaches the market and end customers. (N G Nair1996)1
Besides Raw materials and finished goods, organizations also hold inventories of spare
parts to service the products. Defective products, defective parts and scrap also form a part of
8
inventory as long as these items are inventoried in the books of the company and have economic
value. (Bhattacharyaet al. 2001)6
2.2 OBJECTIVE OF INVENTORY CONTROL TECHNIQUES
To keep inventory at sufficiently high level to perform production and sales activities
smoothly.
To minimize investment in inventory at minimum level to maximize profitability.
To ensure that the supply of raw material & finished goods will remain continuous so that
production process is not halted and demands of customers are duly met.
To minimize carrying cost of inventory.
To keep investment in inventory at optimum level.
To reduce the losses of theft, obsolescence & wastage etc.
To makes arrangement for sale of slow moving items.
To minimize inventory ordering cost
9
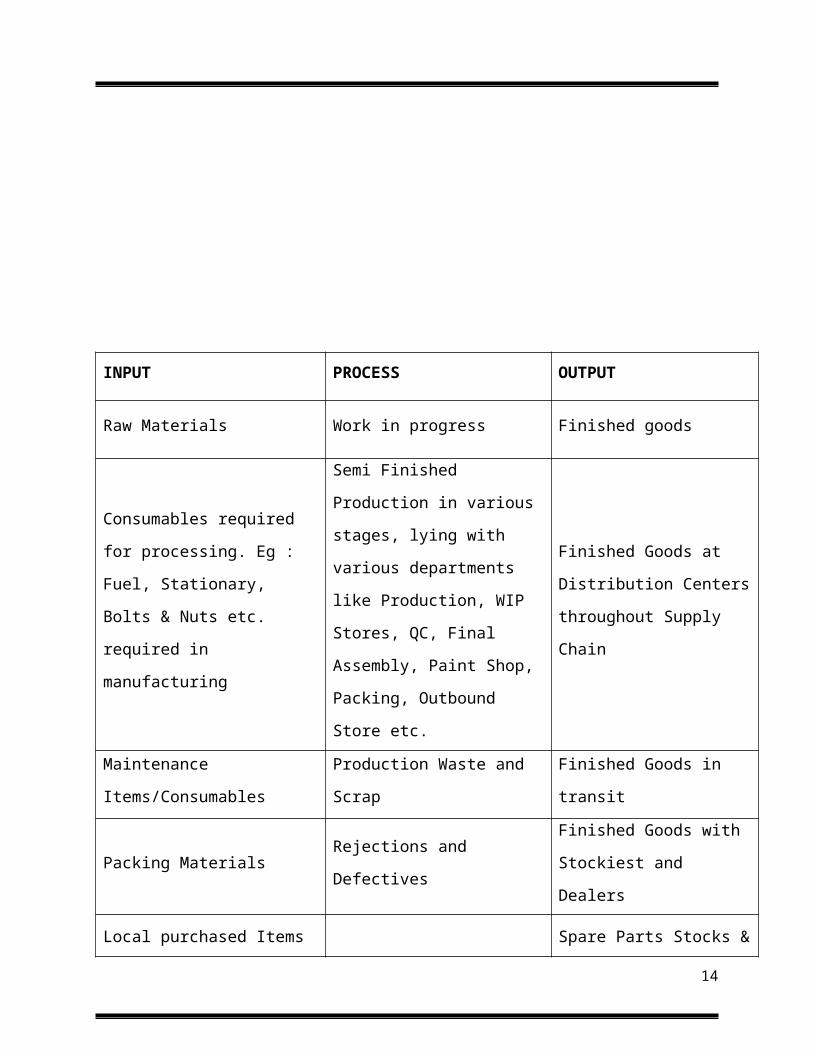
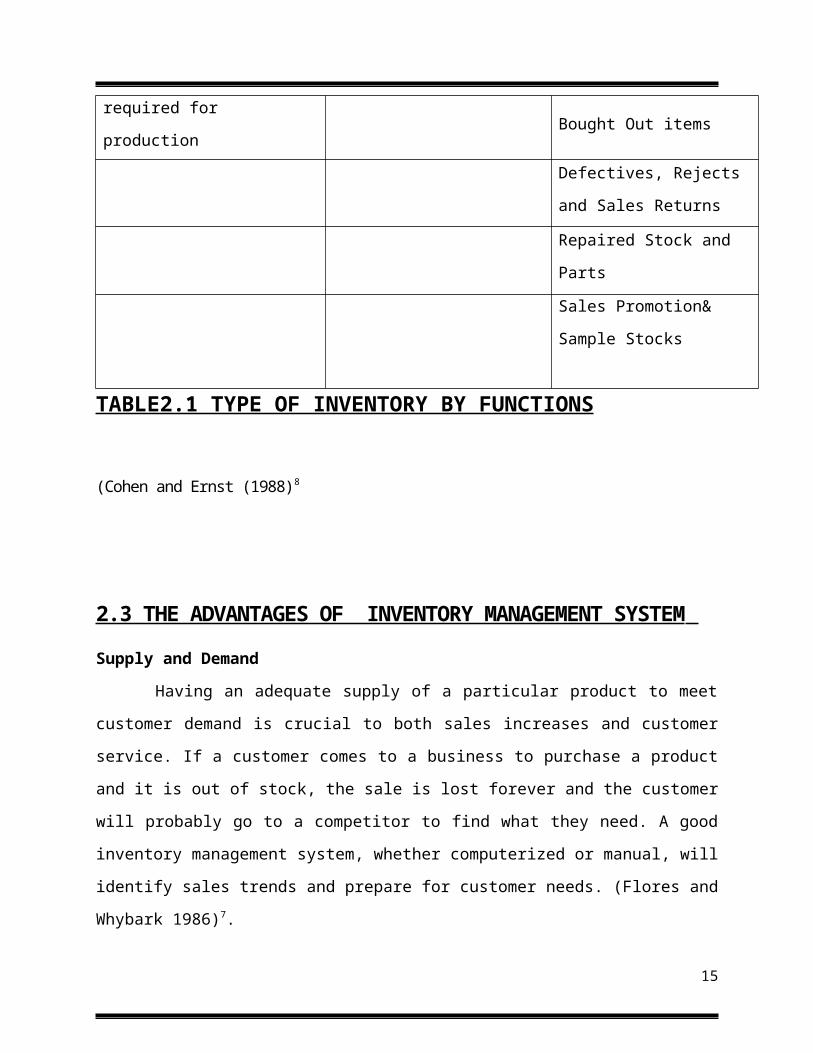
INPUT PROCESS OUTPUT
Raw Materials Work in progress Finished goods
Consumables required for
processing. Eg : Fuel, Stationary,
Bolts & Nuts etc. required in
manufacturing
Semi Finished Production in
various stages, lying with
various departments like
Production, WIP Stores, QC,
Final Assembly, Paint Shop,
Packing, Outbound Store etc.
Finished Goods at
Distribution Centers
throughout Supply Chain
Maintenance Items/Consumables Production Waste and Scrap Finished Goods in transit
Packing Materials Rejections and DefectivesFinished Goods with
Stockiest and Dealers
Local purchased Items required
for production
Spare Parts Stocks & Bought
Out items
Defectives, Rejects and Sales
Returns
Repaired Stock and Parts
Sales Promotion& Sample
Stocks
TABLE2.1 TYPE OF INVENTORY BY FUNCTIONS
(Cohen and Ernst (1988)8
10
2.3 THE ADVANTAGES OF INVENTORY MANAGEMENT SYSTEM
Supply and Demand
Having an adequate supply of a particular product to meet customer demand is crucial to
both sales increases and customer service. If a customer comes to a business to purchase a
product and it is out of stock, the sale is lost forever and the customer will probably go to a
competitor to find what they need. A good inventory management system, whether computerized
or manual, will identify sales trends and prepare for customer needs. (Flores and Whybark
1986)7.
Streamline Operations
Manufacturing facilities should always maintain proper inventory of the supplies
necessary to produce their products. If one component is missing from the inventory, the whole
production process is interrupted. Streamlined operations are an important benefit of an effective
inventory management system.(FloresandWhybark1986)7.
Lead Time Adjustments
Inventory management systems are important for determining when to order certain
items, especially for products with varying lead times. Some products take longer to receive from
the manufacturer than others, and it’s important to have an inventory management system that
accounts for lead time. If for example, a grocery store was going to have a sale on hotdogs, relish
and mustard, but the hotdogs took longer than three days to receive while the condiments took
five days; the inventory management system would need to ensure that all items were in stock in
time for the sale. (Flores and Whybark 1986)7.
Reduce Liabilities
Another significant advantage to an inventory management system is it reduces the
liabilities and loss created by overstock. Similar to monitoring supply and demand, a good
inventory management system will notice declines in sales or identify one-time occurrences to
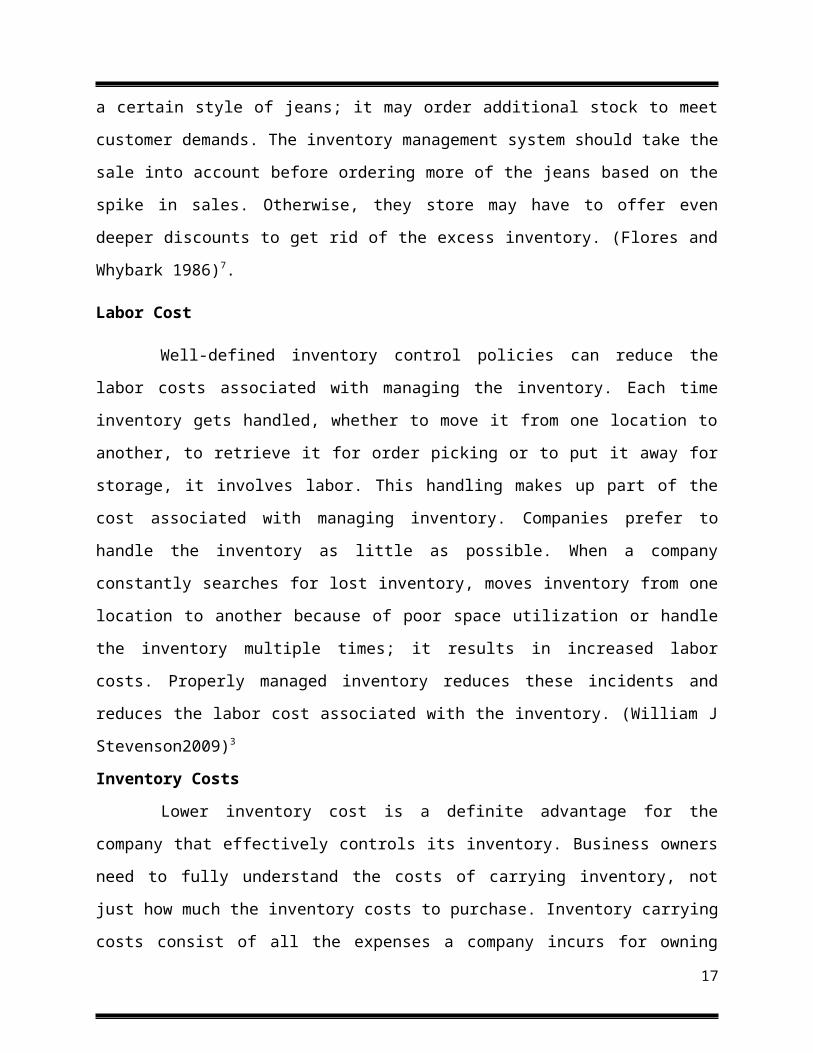
prevent over-ordering certain products. For instance, if a clothing store was having a sale on a
certain style of jeans; it may order additional stock to meet customer demands. The inventory
management system should take the sale into account before ordering more of the jeans based on
11
the spike in sales. Otherwise, they store may have to offer even deeper discounts to get rid of the
excess inventory. (Flores and Whybark 1986)7.
Labor Cost
Well-defined inventory control policies can reduce the labor costs associated with
managing the inventory. Each time inventory gets handled, whether to move it from one location
to another, to retrieve it for order picking or to put it away for storage, it involves labor. This
handling makes up part of the cost associated with managing inventory. Companies prefer to
handle the inventory as little as possible. When a company constantly searches for lost inventory,
moves inventory from one location to another because of poor space utilization or handle the
inventory multiple times; it results in increased labor costs. Properly managed inventory reduces
these incidents and reduces the labor cost associated with the inventory. (William J
Stevenson2009)3
Inventory Costs
Lower inventory cost is a definite advantage for the company that effectively controls its
inventory. Business owners need to fully understand the costs of carrying inventory, not just how
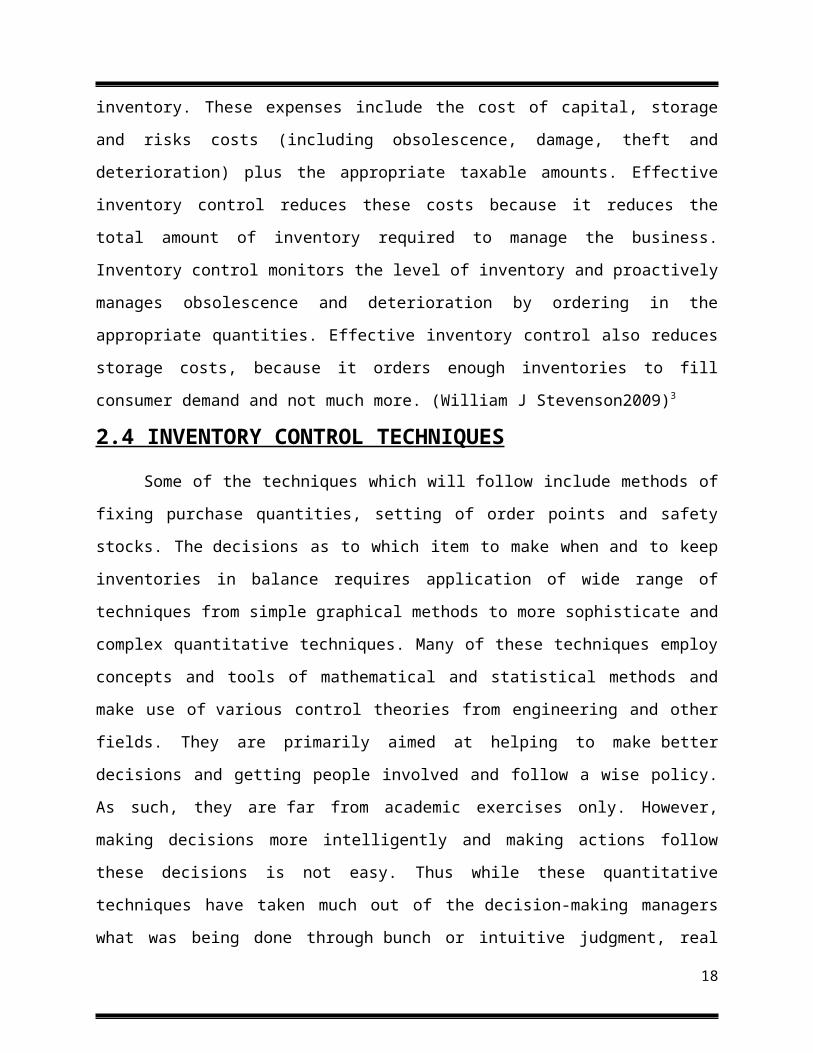
much the inventory costs to purchase. Inventory carrying costs consist of all the expenses a
company incurs for owning inventory. These expenses include the cost of capital, storage and
risks costs (including obsolescence, damage, theft and deterioration) plus the appropriate taxable
amounts. Effective inventory control reduces these costs because it reduces the total amount of
inventory required to manage the business. Inventory control monitors the level of inventory and
proactively manages obsolescence and deterioration by ordering in the appropriate quantities.
Effective inventory control also reduces storage costs, because it orders enough inventories to fill
consumer demand and not much more. (William J Stevenson2009)3
2.4 INVENTORY CONTROL TECHNIQUES
Some of the techniques which will follow include methods of fixing purchase quantities,
setting of order points and safety stocks. The decisions as to which item to make when and to
keep inventories in balance requires application of wide range of techniques from simple
graphical methods to more sophisticate and complex quantitative techniques. Many of these
techniques employ concepts and tools of mathematical and statistical methods and make use
of various control theories from engineering and other fields. They are primarily aimed at
12
helping to make better decisions and getting people involved and follow a wise policy. As such,
they are far from academic exercises only. However, making decisions more intelligently and
making actions follow these decisions is not easy. Thus while these quantitative techniques have
taken much out of the decision-making managers what was being done through bunch or
intuitive judgment, real business acumen demands that these must be blended with practical
business sense. It is an axiomatic truth that these techniques alone cannot turn bad judgment into
good ones simply because they are exact. However, before focusing our attention on
such techniques, let us first attempt to analyze different types of inventories.(N G Nair1996)1
1. Determination of various levels of materials
2. Economic Order Quantity
3. ABC Analysis
4. Two Bin System
5. Fsn/Ved Analysis
2.4.1. DETERMINATION OF VARIOUS LEVELS OF MATERIALS
The store-keeper plays an important role in deciding upon the various levels materials. In
order to ensure that the optimum quantity of materials is purchased stocked neither less nor
more, the store keeper applies scientific techniques of material management. Fixing of certain
levels for each item of materials in one of techniques.
(a) Re-order Level
(b) Maximum Level
(c) Minimum Level
(d) Average Level
(e) Danger Level
13
(a) Re-order Level:
This level is that level of material at which it is necessary to initiate purchase requisition for
fresh supplies. This is normally the point lying between the maximum and the minimum levels.
Fresh orders must be placed before the actual stocks touch the minimum level.
This level is fixed in such a manner that the quantity of materials represented by the
difference between the re-order level and the minimum level will be sufficient to meet the
requirement of production till such time as the order materializes and materials are delivered.
The following factors are taken into account for fixing the Re-order level:
(i) Rate of consumption of material
(ii) Lead time, i.e., time required to receive the delivery of fresh purchase.
(iii) Re-order quantity
(iv) Minimum level
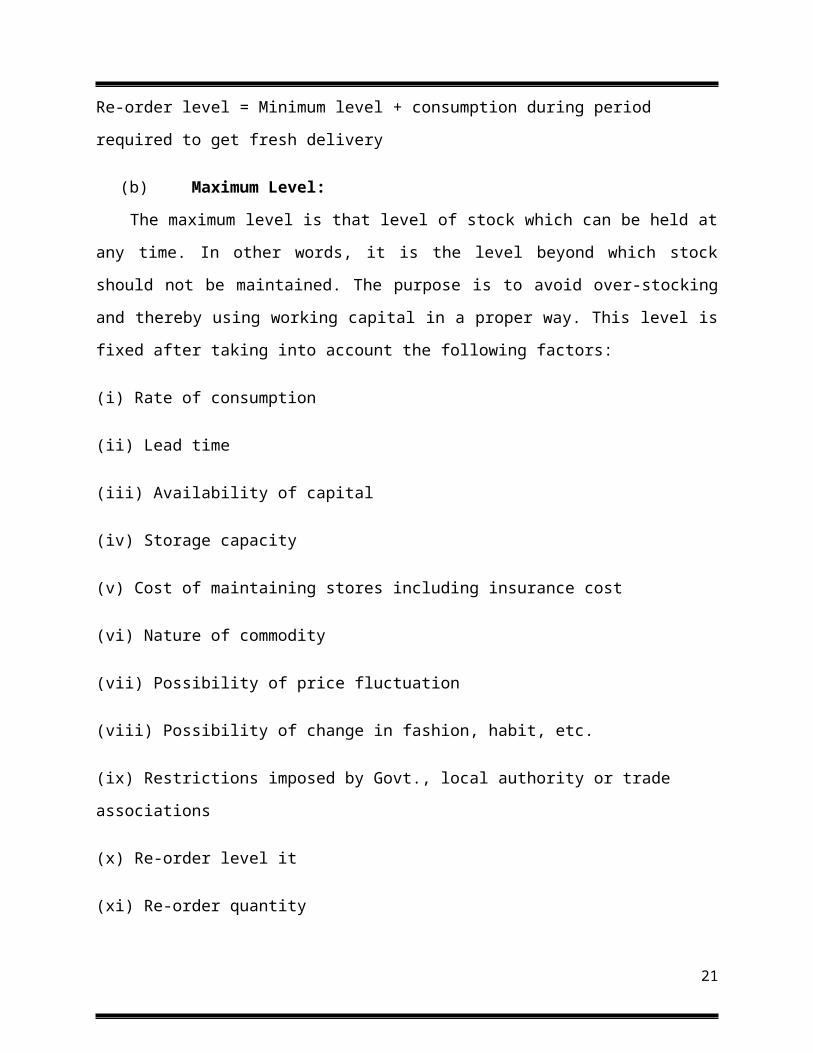
Re-order level can be calculated by applying the following formula:
Re-order level = Minimum level + consumption during period required to get fresh delivery
(b) Maximum Level:
The maximum level is that level of stock which can be held at any time. In other words, it is
the level beyond which stock should not be maintained. The purpose is to avoid over-stocking
and thereby using working capital in a proper way. This level is fixed after taking into account
the following factors:
(i) Rate of consumption
(ii) Lead time
(iii) Availability of capital
(iv) Storage capacity
(v) Cost of maintaining stores including insurance cost
14
(vi) Nature of commodity
(vii) Possibility of price fluctuation
(viii) Possibility of change in fashion, habit, etc.
(ix) Restrictions imposed by Govt., local authority or trade associations
(x) Re-order level it
(xi) Re-order quantity
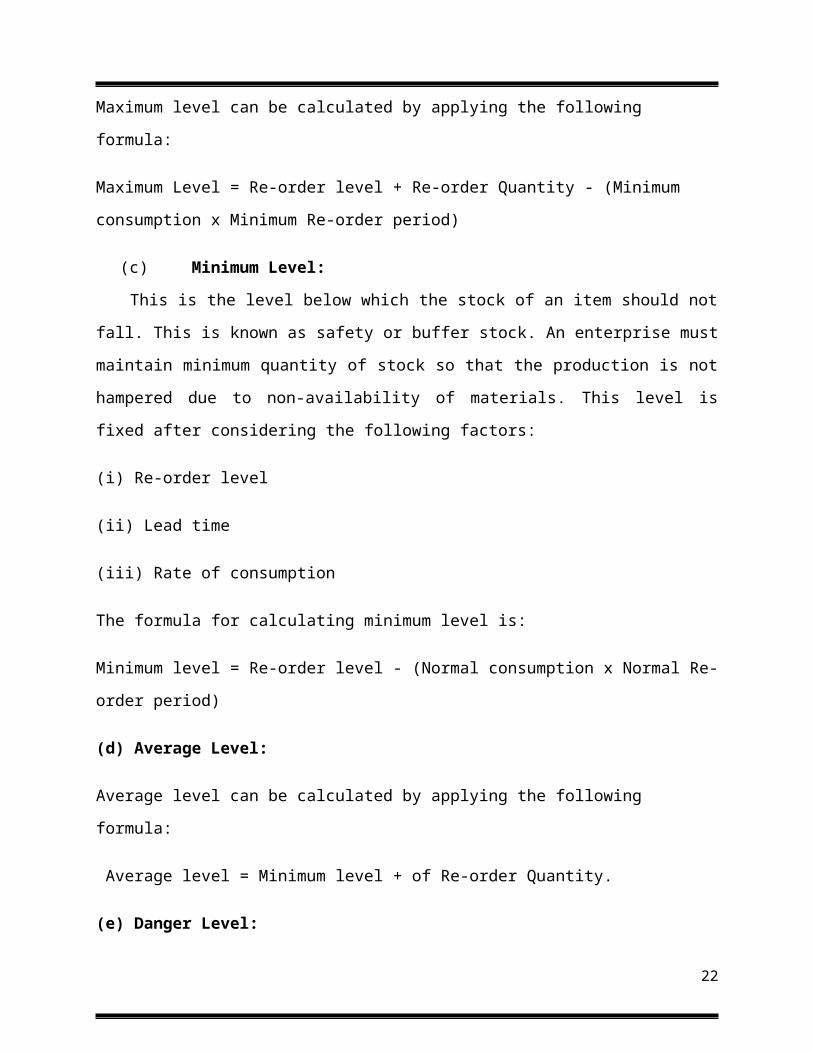
Maximum level can be calculated by applying the following formula:
Maximum Level = Re-order level + Re-order Quantity - (Minimum consumption x Minimum
Re-order period)
(c) Minimum Level:
This is the level below which the stock of an item should not fall. This is known as safety or
buffer stock. An enterprise must maintain minimum quantity of stock so that the production is
not hampered due to non-availability of materials. This level is fixed after considering the
following factors:
(i) Re-order level
(ii) Lead time
(iii) Rate of consumption
The formula for calculating minimum level is:
Minimum level = Re-order level - (Normal consumption x Normal Re-order period)
(d) Average Level:
Average level can be calculated by applying the following formula:
Average level = Minimum level + of Re-order Quantity.
15
(e) Danger Level:
Usually stock should not be lower than the minimum level. But if for any reason, stock
comes down below the minimum level, it is called danger level. When the stock reaches danger
level, it is necessary to take urgent action on the part of the management for immediate
replenishment of stock to prevent stock-out situation. The danger level can be calculated by
applying the following formula:
Danger Level = Average consumption x Maximum Re-order period for emergency purchases
(Ray wild jan 17 2002 )2
2.4.2. ECONOMIC ORDER QUANTITY (EOQ)
The economic order quantity, known as EOQ, represents the most favorable quantity to
be ordered each time fresh orders are placed.
The quantity to be ordered is called economic order quantity because the purchase of this
size of material is most economical. It is helpful to determine in advance as to how much should
one buy when the stock level reaches the re-order level. If large quantities arc purchased, the
carrying costs would be high the other hand, if small quantities are purchased at frequent
intervals the ordering costs would be high. The economic order quantity is fixed at such a level
as to minimize the cost of ordering and carrying the stock. It is the size of the order which
produces the lowest cost of material ordered. While determining the economic order quantity, the
following three cost factors are taken into consideration:
(i) The cost of the material
(ii) The inventory carrying cost
(iii) The ordering cost
Carrying costs are the costs of holding the inventory in the stores. These are:
(i) Rent for the storage space.
(ii) Salaries and wages of the employees engaged in store keeping department.
16
(iii) Loss due to pilferage and deterioration.
(iv) Insurance charges.
(v) Stationery used in the stores.
(vi) Loss of interest on the capital locked up in materials.
Ordering costs are the costs of placing orders for the purchase of materials. These are:
(i) Salaries and wages of the employees engaged in purchasing department.
(ii) Stationary, postage, telephone expenses, etc. of the purchasing department.
(iii) Depreciation on equipments and furniture used by the purchasing department.
(iv) Rent for the space used by the purchasing department.
While placing orders for purchasing materials, the total cost to be incurred is kept in
view. As discussed earlier, if an order is placed for a large quantity at a time, the ordering cost is
less but the carrying cost would be more.(Ray wild jan 17 2002 )2
2.4.3. ABC ANALYSIS
This technique of inventory control is also known as Always Better Control technique.
ABC analysis is an analytical method of control which aims at concentrating efforts on those
areas where attention is needed most.
This is a principle of selective control. The emphasis of ABC analysis technique is that
the management should concentrate its energy in controlling those items that mostly affect the
organizational objects. Manufacturing concerns find it useful to group the materials into three
classes on the basis of investment involved.
Materials having higher values but constitute small percentage of total items, are
grouped in 'A' category. On the other hand, a large percentage of items of materials which
represent a smaller percentage of the values, are grouped in 'C' category. Items of materials
17
having moderate value 'and moderate size are grouped in 'B' category. On the basis of physical
quantities and value of arterials used, the following table illustrates the above classification:
After the items of materials are classified into A, B and C category, control can be
exercised in a selective manner as follows:
(i) Greater care and strict control should be exercised on the items of category 'A' as any loss or
breakage or wastage of any item of this category many prove to be very costly. Economic order
quantity and re-order level should be carefully fixed for such category of items.
(ii) Moderate and relaxed control is required for the items of category 'B'.
(iii) There is not much need for exercising control over the items of category 'C' Periodic or
annual verification is required for this category of materials (William J Stevenson2009)3
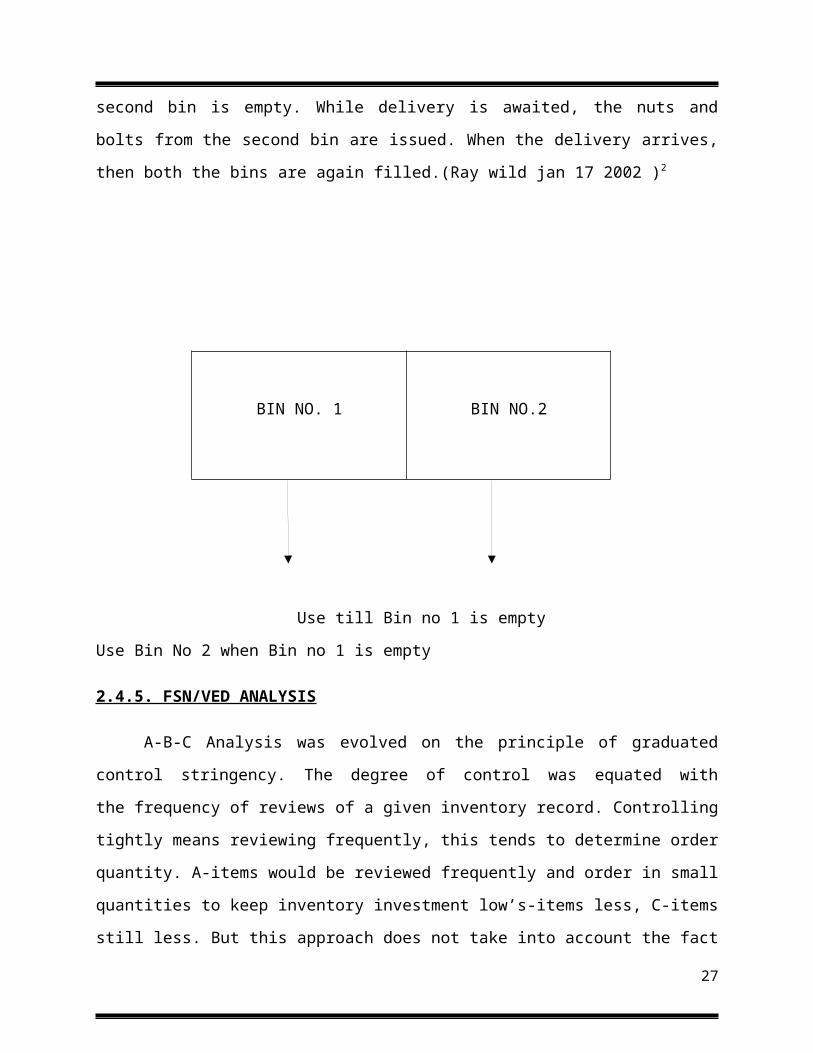
2.4.4. TWO BIN SYSTEM
One of the earliest systems of stock control is two-bin system, which is a simple method
of control exercised by two simple rules. One is when the order should be placed, and the other is
what quantity should be covered. The following diagram shows this simple method. The bins
contain, say, mild-steel bolts and nuts. The bolts and nuts are issued from the first bin as and
when required, and as soon as the first bin is empty, more bolts and nuts are ordered. The
replenishment arrives just when the second bin is empty. While delivery is awaited, the nuts and
bolts from the second bin are issued. When the delivery arrives, then both the bins are again
filled.(Ray wild jan 17 2002 )2
18

BIN NO. 1 BIN NO.2
Use till Bin no 1 is empty Use Bin No 2 when Bin no 1 is empty
2.4.5. FSN/VED ANALYSIS
A-B-C Analysis was evolved on the principle of graduated control stringency. The degree
of control was equated with the frequency of reviews of a given inventory record. Controlling
tightly means reviewing frequently, this tends to determine order quantity. A-items would be
reviewed frequently and order in small quantities to keep inventory investment low’s-items less,
C-items still less. But this approach does not take into account the fact that sometimes a low-
valued small item of critical nature needs as much attention as high-valued A-class item, so that
inventories also need to be classified according to Vital, Essential and Desirable (V -E-D), which
in essence means that stress is more on importance rather than on value.
Again, inventories may also be classified according to Fast-moving, Slow-moving and
Non-moving items in order to see the rapidity of their use and to weed out the unnecessary ones.
This is aimed at keeping the total inventory size down and reduces investment. Thus, selective
control may be exerted under different types of classification according to necessity. A single-
type approach may not prove fruitful under al circumstances. (William J Stevenson2009)3
2.4.6. ORDER CYCLING SYSTEM
This system is based upon a review timetable. According to this system, a review of the
entire inventory is done at regular intervals, such as 30 days, 60 days or 90 days. After the
review is done, the cost accountant views stock items with low quantities that will not last up to
the next review interval. The purchase order for such a stock item is placed immediately. The
19

order cycling system is not exactly foolproof and one requires a rather experienced cost
accountant to efficiently conduct it. (N G Nair1996)1
2.5 FUNCTIONAL DETAILS OF STORES AND PURCHASE
AT SARK CABLES
Production department receives the customer order vide through marketing department
and the same is recorded in the order register SARK/PDD/ORG/001. According to the orders
production department forwards raw material requisition slip to stores for issuing raw materials.
Purchase department purchase raw materials from different suppliers. Hindalco Industries
Ltd, Paras Wires Pvt Ltd, Grand Engineering Industries, Maddras Aluminum company Ltd,
Barath Aluminum company Ltd, Modern Engineering works, Tata SSL Ltd, Balaji wires Pvt Ltd,
Farcom cables system Pvt Ltd, SCJ plastic Ltd. Etc. all the suppliers are evaluated and selected
based on their ability to meet sub contract requirements including the requirement of quality
system and the company’s specific requirements. All the suppliers as on 1 March 2003 are
included in the list of approved suppliers.
HOD Stores and Purchase maintains a list of suppliers. The control exercised on the
suppliers is mainly based on the evidence of conformity furnished by the supplier and it varies
depending on the product, impact on the quality of the final product, and previously
demonstrated capability and performance of suppliers. Purchase orders released by the company
will indicate any specific requirements decided to be included to exercise control over the
suppliers. Purchases are made based on the purchase order released by the company.
The required detail such as type, class, or any other precise identification required is
included in the purchase order. Requirements of any specification, test certificates and inspection
are also included in the purchase order as necessary. All purchasing documents are reviewed and
approved by the designated personal before issue. If verification is proposed to be carried out at
the suppliers’ premises, the same will be indicated in the purchasing documents. In specific
circumstance, if the customer insists for verification of the supplier’s products either at supplier’s
20
premise or the companies the customer shall be provided the right to carry out the same. The
finished products are transferred to quality assurance department.
RECEIVING RAW MATERIALS
PHYSICAL CHECK
TESTING
RAW MATERIAL SHORTAGE
FINISHED PRODUCT
DESPATCH
21
MD
ACCEPT REJECT
RELEASE TO PRODUCTION
2.6 RAW MATERIALSAT SARK CABLES
2.6.1CABLES:-
Copper, aluminum, PVC etc are the main raw material of the firm. Purchase from
different customers. There are variety of papers are used in press for the needs of the users.
These all different quality papers and the rate also differ from one to other. From paper printing
we get variety of products for various purposes (company manual)
In case of PVC granules for insulation and sheath, received vide goods received note
SARK/SPD/GRN/001 are inspected by Quality Assurance Department as per the quality plan
and the observations are recorded in the raw material test register.(company manual)
After the inspection, the approval/rejection is indicated in the GRN/DN and sent back to
stores for further action.
The materials which meet the specified requirements are released to production for
further process. The materials which do not meet the specified requirements are put under
“HOLD” and recorded in non conformance register.
2.6.2 WORK IN PROGRESS AT SARK CABLES
In process inspection is carried out by the QA inspector supervisor as per the quality plan
and the observations are recorded in the route work order. The materials meeting the specified
requirements are released to next process. Such materials are identified by QA approved seal.
The materials which do not meet the specified requirements are put under hold.
2.6.3 FINISED PRODUCT AT SARK CABLES
The materials which meet the specified requirements are released for packaging.
Materials which do not meet the specified requirements are put under “hold” and recorded in non
conforming register.
22
2.7STORE DEPARTMENT PROCEDURE
Stores receives materials vide good received note (GRN) SARK/SPD/GRN/001 or
delivery note (DN), SARK/SPD/DN/002 and kept in raw material storage area. After verifying
the quantity and packaging of the materials, then GRN/DN are forward to QA department for
their information and approval. After QA approval the materials are identified by QA approved
tags. Materials put under Hold by QAD are segregated and kept in the NCR allocated area. The
materials are issued to production for further process by stores according to the raw material
requisition slip SARK/SPD/003, issued by production department. The minimum quantity of row
material is stored according to the minimum stock level SARK/SPD/004.Receipt and issues of
raw materials are recorded in raw material stock register SARK/SPD/RSR/005.Purchase indent,
SARK/SPD/PI/006, is forwarded to administration department for purchasing the required raw
materials. Finished products, received vide finished good transfer slip, SARK/PDD/FGT/004,
from QAD are duly packed and kept in the finished good storage area with proper identification.
Finished products are dispatched to the customers as per the invoice issued by the marketing
department. Receipt and issue of finished goods are recorded in finished product register
SARK/SPD/FPR/007. Inventory of raw material and finished goods are made once in a year. All
raw material suppliers are evaluated on the basis of the quality, quantity, delivery time and price
of the material (Company manual)
2.8 ABC INVENTORY CONTROLING TECHNIQUE AT SARK
CABLES
ABC analysis is meant for relative inventory control in which maximum attention can be
given to items which consume more money and a fair attention can be given to median value
items. The attention for low value can be reducing to routine procedure only. If all the store
items of an undertaking are analyzed in terms of annual consumption of each item in rupees, it
will be found that;
5-10 per cent of total annual consumption is only required and its value amount to 70 per
cent of the total inventory value. These items are stored in ‘A’ category in which
handling of these items should be in care and control.
23
15-20 per cent of total annual consumption is required in the total process and its value
also amount to 20 per cent of the total inventory value. These are controlled and card but
not as seen in ‘A’ category.
75-80 per cent of total annual consumption comes under this and its value pertains to 10
per cent of the total inventory value and less care is given to these types which are
classified as ‘C’ category.
Item classified according to the book value of the item stores is custodian every items.
Break up of ABC:
A-70%
B-20%
C-10%
TABLE 2.2: ABC CLASSIFICATION
CATEGORYPECENTAGE OF
TOTAL VALUE
PERCENTAGE OF
TOTAL QUALITY
A 70-80 5-10
B 20-25 20-30
C 5-10 60-70
24
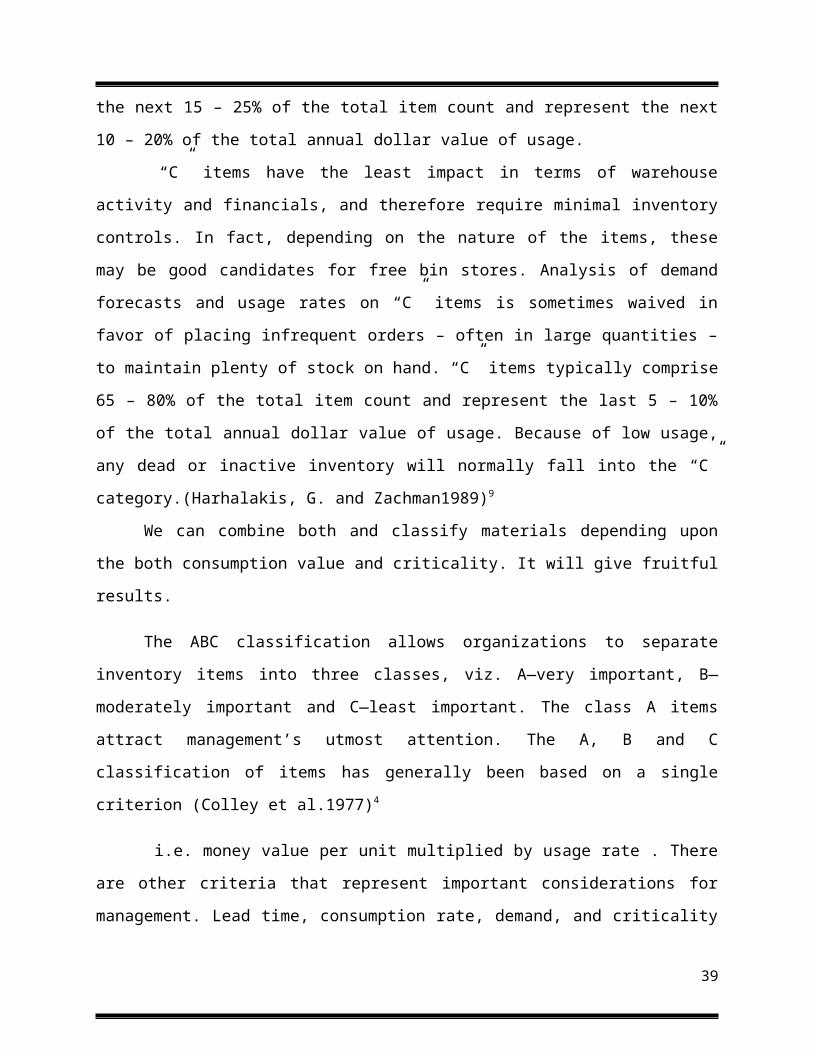
CHART2.1
71%
21%7%
PECENTAGE OF TOTAL VALUE
a b C
TABLE2.3 ABC classification and importance
A item B item C item
High consumption value Moderate value Low consumption value
High control Moderate control Low control
Minimization of waste
materialControl over waste Annual review of waste
No safety stock Low safety stock High safety stock
Frequent ordering Ordering 3 times in a monthBulk ordering once in a
month
Weakly control statement Monthly control Quality control report
25

“A” items are the most critical ones. These items require tight inventory controls;
frequent review of demand forecasts and usage rates; highly accurate part data; and frequent
cycle counts to verify perpetual inventory balance accuracy. Typically, these comprise 5 – 10%
of the total item count, and represent the top 70 – 85% of the total annual dollar value of usage.
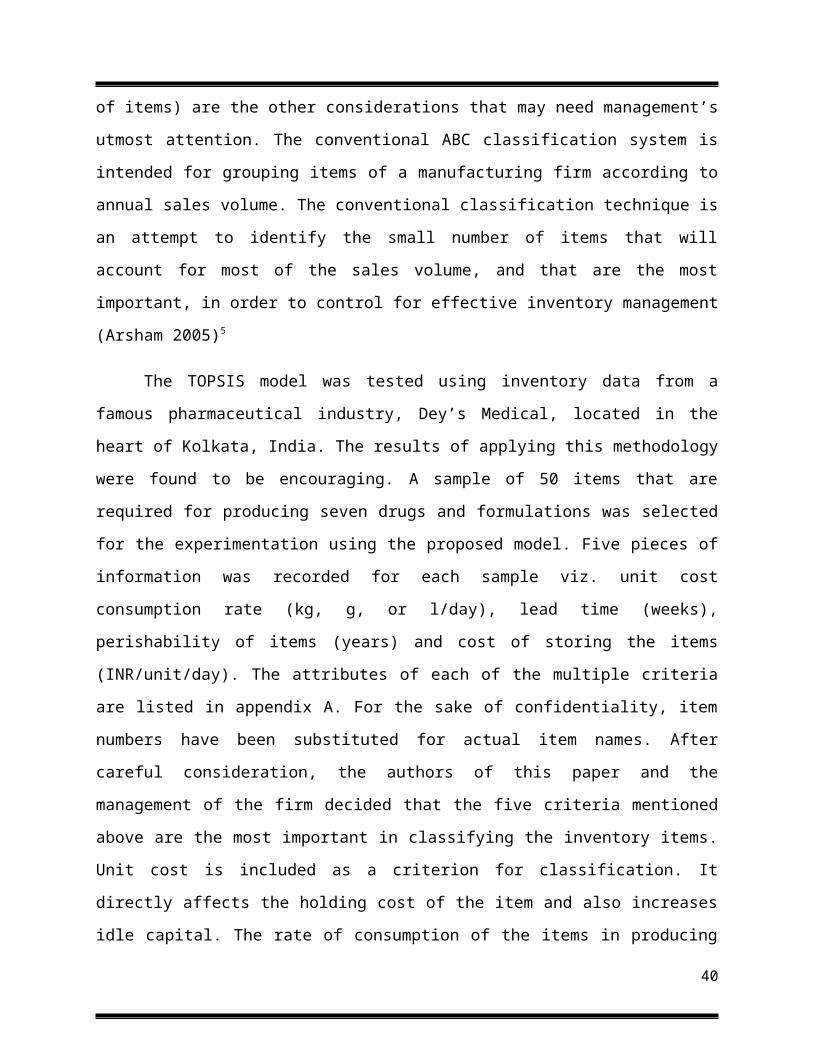
“B” items are of lesser criticality. These items require nominal inventory controls;
occasional reviews of demand forecasts and usage rates; reasonably accurate part data; and less
frequent but regular cycle counting. They typically comprise the next 15 – 25% of the total item
count and represent the next 10 – 20% of the total annual dollar value of usage.
“C” items have the least impact in terms of warehouse activity and financials, and
therefore require minimal inventory controls. In fact, depending on the nature of the items, these
may be good candidates for free bin stores. Analysis of demand forecasts and usage rates on “C”
items is sometimes waived in favor of placing infrequent orders – often in large quantities – to
maintain plenty of stock on hand. “C” items typically comprise 65 – 80% of the total item count
26
and represent the last 5 – 10% of the total annual dollar value of usage. Because of low usage,
any dead or inactive inventory will normally fall into the “C” category.(Harhalakis, G. and
Zachman1989)9
We can combine both and classify materials depending upon the both consumption value
and criticality. It will give fruitful results.
The ABC classification allows organizations to separate inventory items into three
classes, viz. A—very important, B—moderately important and C—least important. The class A
items attract management’s utmost attention. The A, B and C classification of items has
generally been based on a single criterion (Colley et al.1977)4
i.e. money value per unit multiplied by usage rate . There are other criteria that represent
important considerations for management. Lead time, consumption rate, demand, and criticality
of items) are the other considerations that may need management’s utmost attention. The
conventional ABC classification system is intended for grouping items of a manufacturing firm
according to annual sales volume. The conventional classification technique is an attempt to
identify the small number of items that will account for most of the sales volume, and that are the
most important, in order to control for effective inventory management (Arsham 2005)5
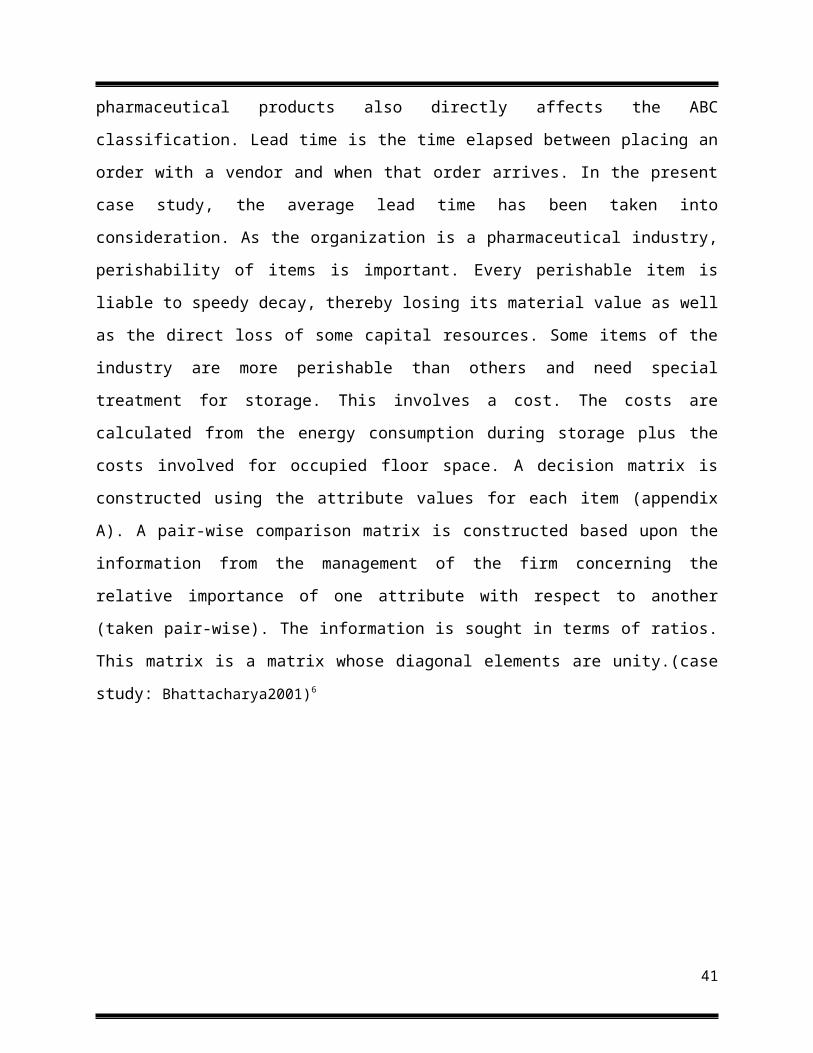
The TOPSIS model was tested using inventory data from a famous pharmaceutical
industry, Dey’s Medical, located in the heart of Kolkata, India. The results of applying this
methodology were found to be encouraging. A sample of 50 items that are required for
producing seven drugs and formulations was selected for the experimentation using the proposed
model. Five pieces of information was recorded for each sample viz. unit cost consumption rate
(kg, g, or l/day), lead time (weeks), perishability of items (years) and cost of storing the items
(INR/unit/day). The attributes of each of the multiple criteria are listed in appendix A. For the
sake of confidentiality, item numbers have been substituted for actual item names. After careful
consideration, the authors of this paper and the management of the firm decided that the five
criteria mentioned above are the most important in classifying the inventory items. Unit cost is
included as a criterion for classification. It directly affects the holding cost of the item and also
increases idle capital. The rate of consumption of the items in producing pharmaceutical products
also directly affects the ABC classification. Lead time is the time elapsed between placing an
order with a vendor and when that order arrives. In the present case study, the average lead time
27
has been taken into consideration. As the organization is a pharmaceutical industry, perishability
of items is important. Every perishable item is liable to speedy decay, thereby losing its material
value as well as the direct loss of some capital resources. Some items of the industry are more
perishable than others and need special treatment for storage. This involves a cost. The costs are
calculated from the energy consumption during storage plus the costs involved for occupied floor
space. A decision matrix is constructed using the attribute values for each item (appendix A). A
pair-wise comparison matrix is constructed based upon the information from the management of
the firm concerning the relative importance of one attribute with respect to another (taken pair-
wise). The information is sought in terms of ratios. This matrix is a matrix whose diagonal
elements are unity.(case study: Bhattacharya2001)6
28
Data collected through direct interview with 10 officials in Sark cables. The data can be
analyzed and interpreted, these data help to implement a new ABC inventory control techniques
at SARK CABLES.
TABLE3.1.HIGHEST INVENTORY OF SARK CABLE.
Variable Respondents
Raw Material4
Work In Progress2
Finished Products4
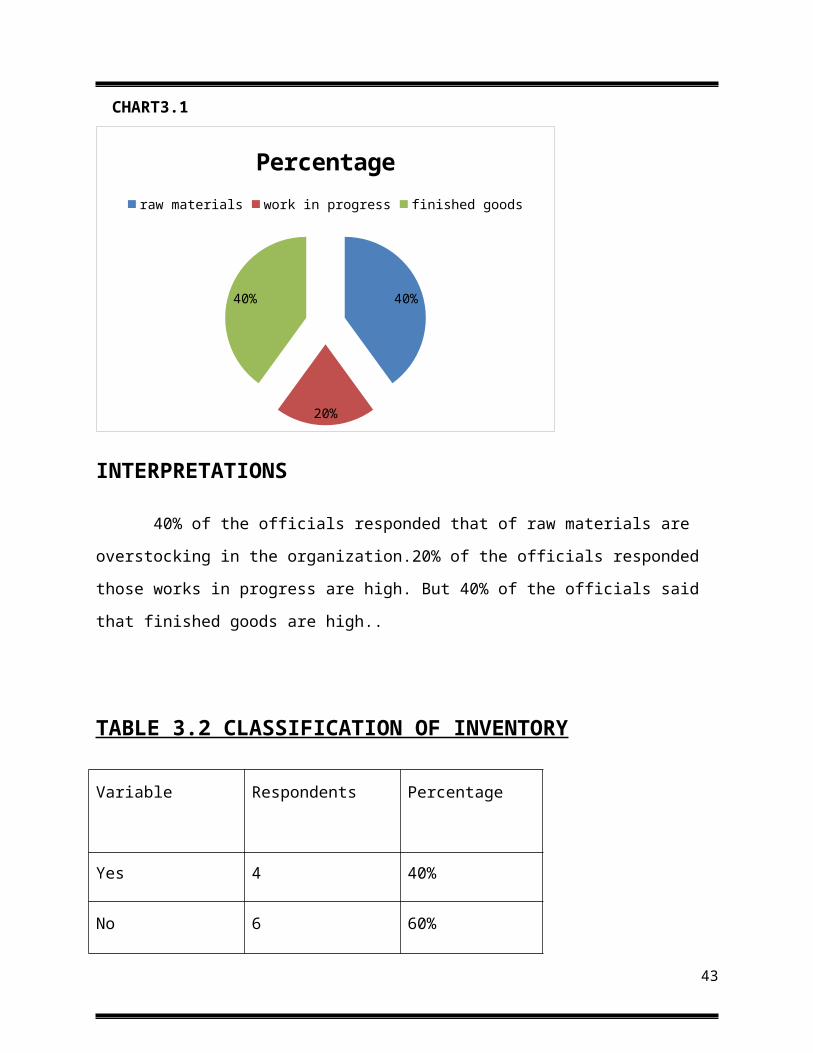
CHART3.1
40%
20%
40%
Percentage
raw materials work in progress finished goods
INTERPRETATIONS
40% of the officials responded that of raw materials are overstocking in the
organization.20% of the officials responded those works in progress are high. But 40% of the
officials said that finished goods are high..
29
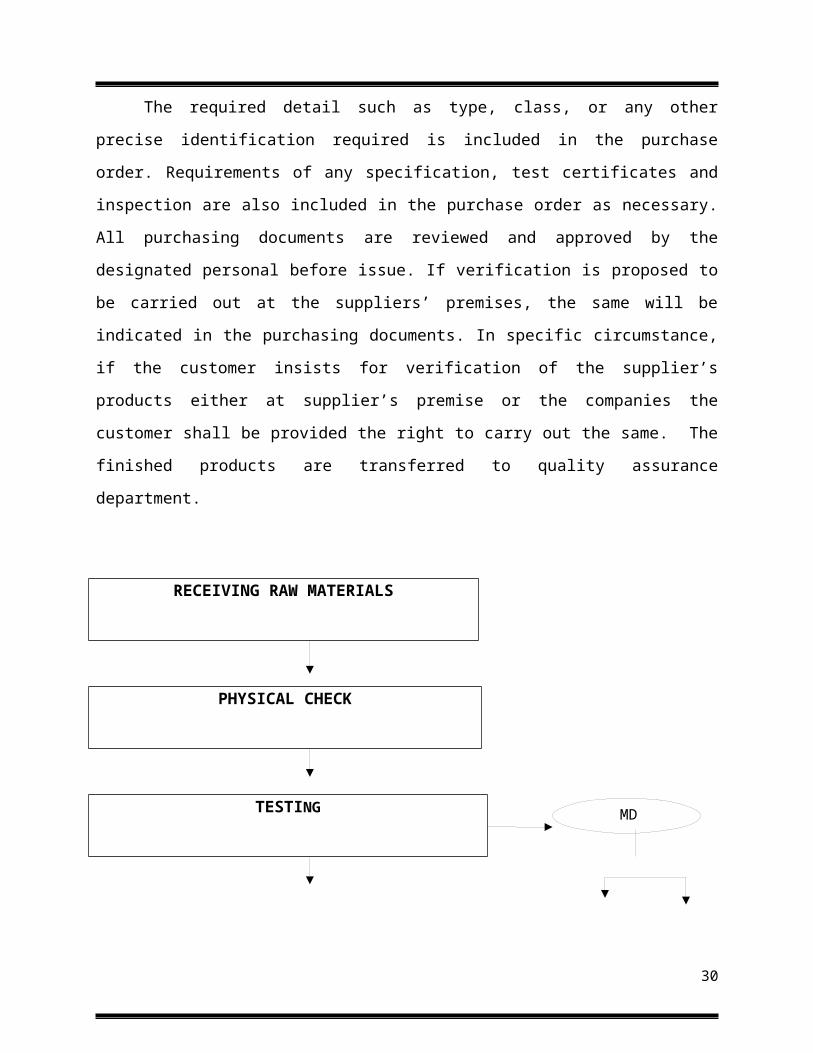
TABLE 3.2 CLASSIFICATION OF INVENTORY
Variable Respondents Percentage
Yes 4 40%
No 6 60%
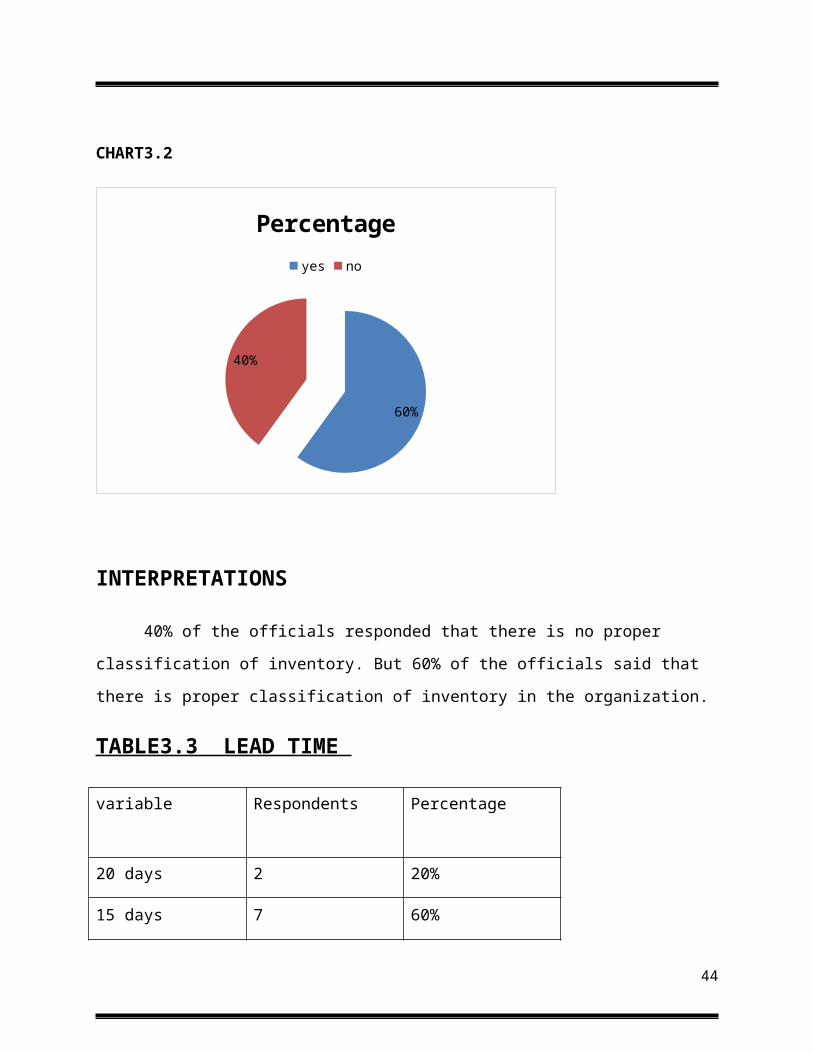
CHART3.2
60%
40%
Percentage
yes no
INTERPRETATIONS
40% of the officials responded that there is no proper classification of inventory. But
60% of the officials said that there is proper classification of inventory in the organization.
30
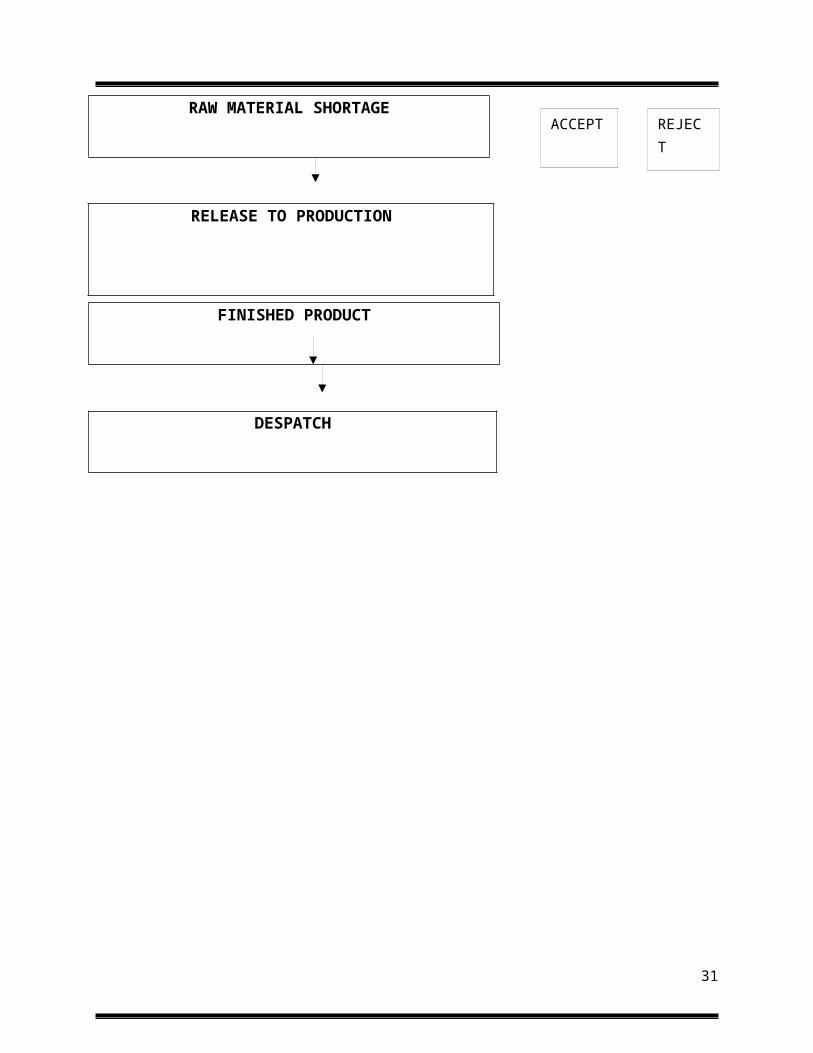
TABLE3.3 LEAD TIME
variable Respondents Percentage
20 days 2 20%
15 days 7 60%
10 days 1 20%
CHART3.3
60%20%
20%
Percentage
High Medium Low
INTERPRETATIONS
From the sample size 20% of them are responded that the lead time is 20 days but 60% of
then responded that 15 days are the normal lead time.
31
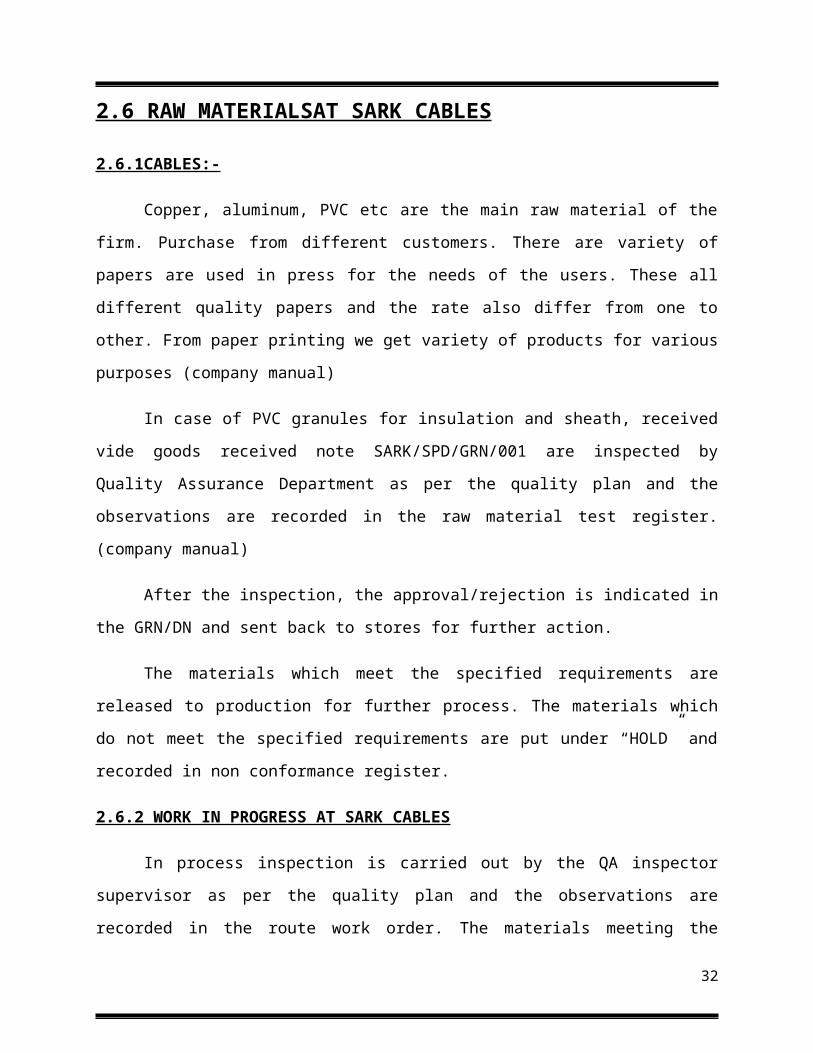
TABLE 3.4 DELAY OF INVENTORIES
Variable Respondents Percentage
Yes 6 60%
No 4 40%
CHART3.4
60%
40%
Percentage
yes no
INTERPRETATIONS
60% of the officials responded that the raw materials are not reaching the production department
on correct time. But 40% of them responded that raw materials are reaching on correct time.
32
TABLE 3.5 AVERAGE WASTAGE PER WEEK
Variable Respondents Percentage
High 6 60%
Medium 2 20%
Low 2 20%
CHART3.5
60%20%
20%
Percentage
High Medium Low
INTERPRETATIONS
60% of the officials responded that there is high level of wastages occurring. 20% of
them said that the average wastage per week is low.
33
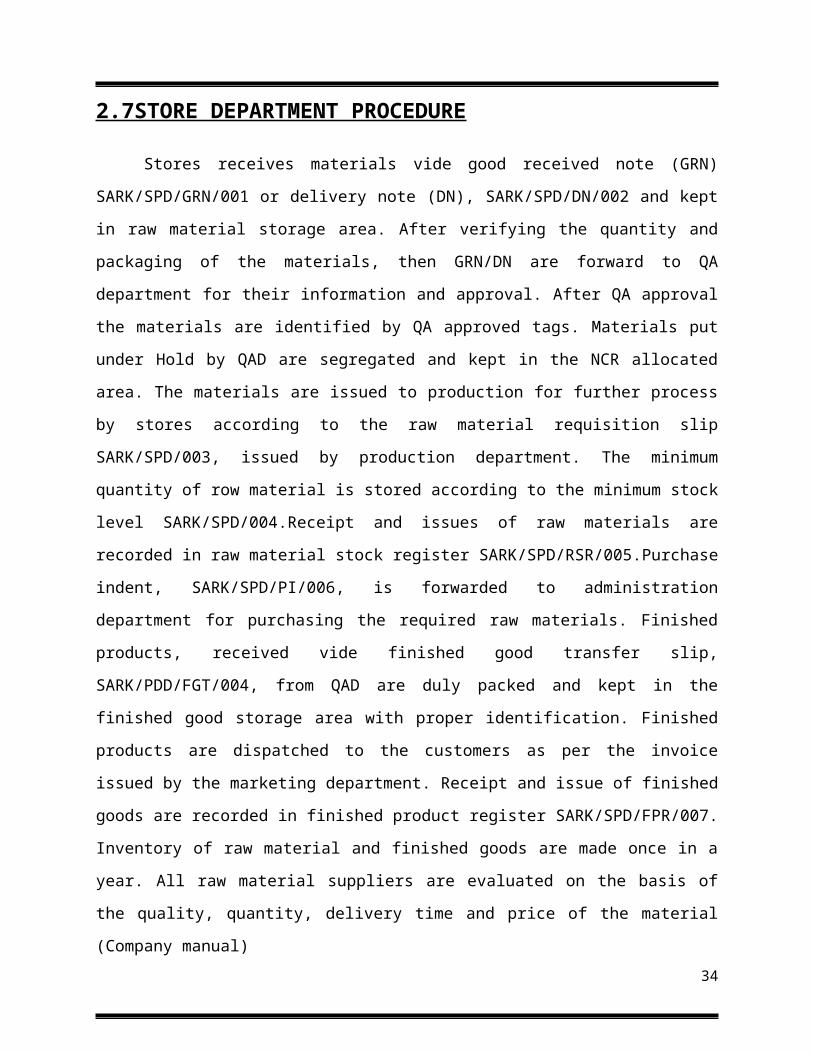
TABLE 3.6 CALCULATION OF TOTAL COST OF INVENTORY
ITEMSPRICE PER UNIT
(Rs.)NO. OF UNIT
TOTAL COST(Rs)per
year
Iron 4.3 68867 296128.1
Copper 140 832 116480
Coke 17.31 246 4258.26
Lubricant 20.81 284 5910.04
Zinc 312.5 830 259375
Aluminum 3.08 2435 7499.8
Lead 480.29 987 474046.2
Plastic 2.8 4283 11992.4
INTERPRETATION
From the above table we can identify Lead having high unit price but it require only
small quantity but its total cost is very high. In the case of Iron the unit price is less than Lead but
it require large quantity so that the total cost of Iron is higher than Lead. Plastic having very less
unit price but lubricant and coke having high unit price than Plastic but total cost of the Plastic is
higher than coke and lubricant.
34
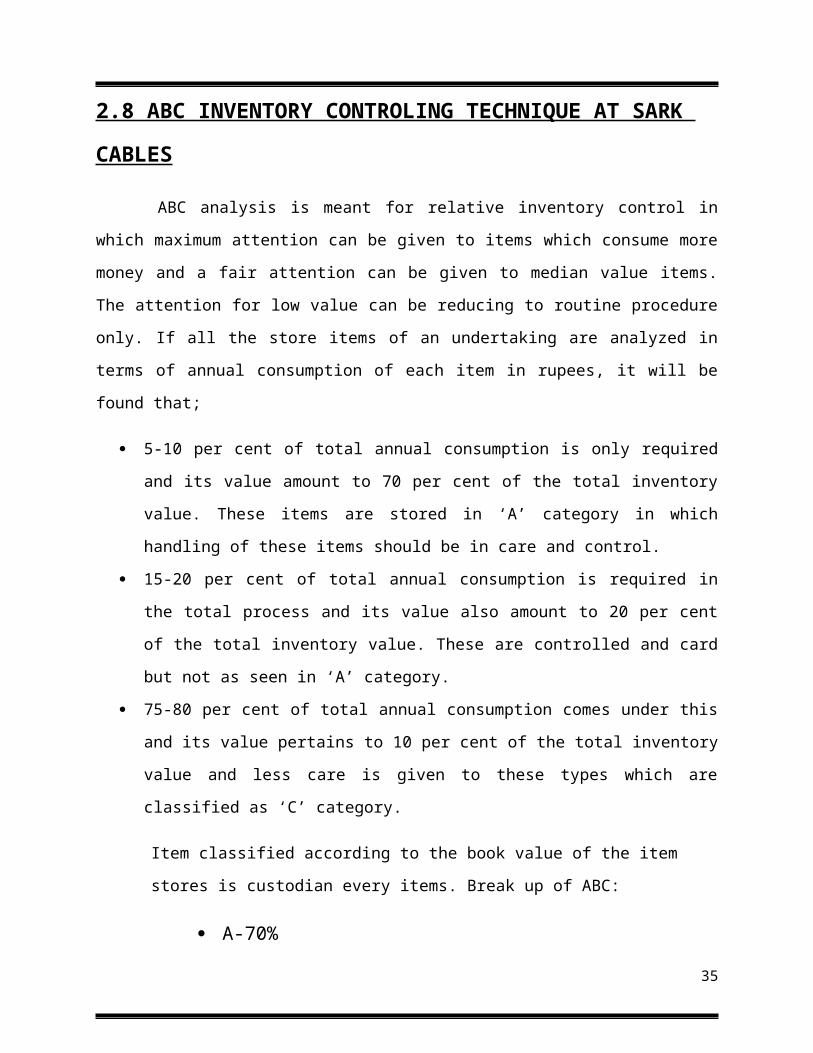
TABLE3.7 CALCULATION OF TOTAL COST IN DECLINING
ORDER
ITEMS PRICE PER UNIT
(Rs.)
NO. OF UNIT TOTAL COST(Rs)
Lead 480.29 987 474046.2
Iron 4.3 68867 296128.1
Zinc 312.5 830 259375
Copper 140 832 116480
Plastic 2.8 4283 11992.4
Aluminum 3.08 2435 7499.8
Lubricant 20.81 284 5910.04
Coke 17.31 246 4258.26
INTERPRETATION
This table is drawn on the basis of declining total cost of the inventory. Lead, Iron, zinc, copper
having high value. So we can say these inventories are very necessary for production. Lack of
these inventories affects the flow of production. Plastic have somewhat high value but Lubricant
and coke having less value of consumption.
35
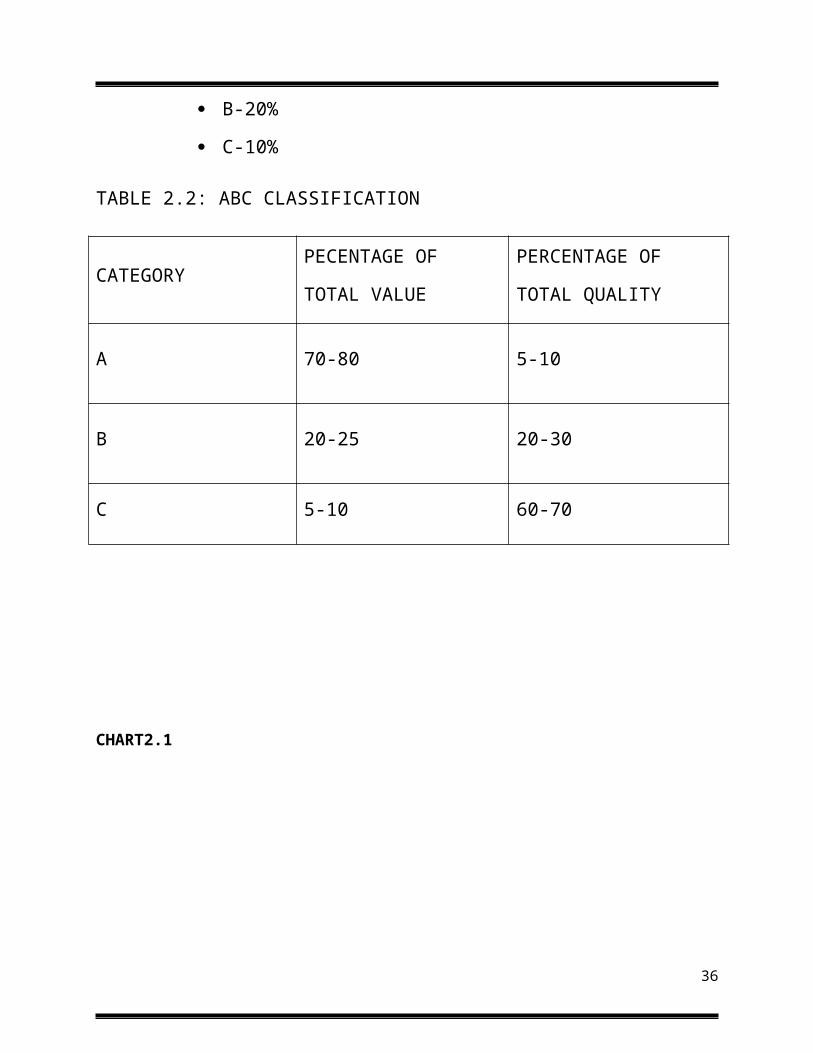
CHART3.7. TOTAL COST IN DECLINING ORDER
Lead
Iron
zinc
Coppe
r
Plas
tic
Alumin
um
lubr
icant
Coke
0
50000
100000
150000
200000
250000
300000
350000
400000
450000
500000
PRICE PER UNIT (Rs.)
NO. OF UNIT
TOTAL COST(Rs)
INTERPRETATION
In this graph show that Lead, Iron, Zinc and copper have high cost and high value of
consumption. These raw materials are comes under A category because of that frequent ordering
is necessary. We want to give special attention to these materials otherwise it will affect the
production. With the help of this graph we can say Plastic is comes under B category. 'B' items
are important, but of course less important, than ‘A’ items and more important than ‘C’ items.
36

TABLE 3.8 CALCULATION OF CUMILATIVES OF
INVENTORIES
ITEMSPRICE PER
UNIT (Rs.)NO. OF UNIT
TOTAL
COST(Rs)CUMULATIVE
Lead 480.29 987 474046.23 474046.23
Iron 4.3 68867 296128.1 770174.33
Zinc 312.5 830 259375 1029549.33
Copper 140 832 116480 1146029.33
Plastic 2.8 4283 11992.4 1158021.73
Aluminum 3.08 2435 7499.8 1165521.53
lubricant 20.81 284 5910.04 1171431.57
Coke 17.31 246 4258.26 1175689.83
INTERPRETATION
Cumulative cost is the total expenditure on a task or product. From this graph we can say
the total expenditure of inventories are very high. The price of the product is depending on the
expenditure of the inventory also. So there should be a proper control over the wastage of the
inventory.
37

CHART3.8 CUMILATIVE TOTAL COST
Lead
Iron
zinc
Coppe
r
Plas
tic
Alumin
um
lubr
icant
Coke
0
200000
400000
600000
800000
1000000
1200000
PRICE PER UNIT (Rs.)
NO. OF UNIT
TOTAL COST(Rs)
cumilatives
INTERPRETATION
In this graph we can say the cumulative price of Lead is less and it is equal to total cost.
But in the case of plastic, aluminum, lubricant and coke price is very high. So when we control
the total cost of the inventory we can reduce cumulative cost. The aggregate amount that an
investment has gained or lost over time, independent of the period of time involved. Company
more likely to see a compound return than a cumulative return, as the compound return figure
will be annualized. This helps purchase department to compare different investment choices.
38
Classifying the group as A, B, and C based on the total cost
A CATEGORY
A=70% of the total cost= .70
Cumulative total*.70
1175689.83*.70= 822982.88
B CATEGORY
B=20% of the total cost= .20
Cumulative total* .20
1175689.83* .20 = 235137.96
C CATEGORY
C=10% of the total cost = .10
Cumulative total* .10
1175689.83* .10 = 117568.98
INTERPRETATION
'A' items are very important for an organization. Because of the high value of these ‘A’
items, frequent value analysis is required. In addition to that, an organization needs to choose an
appropriate order pattern (e.g. ‘Just- in- time’) to avoid excess capacity. 'B' items are important,
but of course less important, than ‘A’ items and more important than ‘C’ items. Therefore ‘B’
items are intergroup items’ are marginally important.
39
3.1ABC ANALYSIS PRIMARY STEPS AT SARK CABLES
On the bases of the above graphs and tables we implement ABC techniques at Sark
Cables. The typical ABC process isn’t overly complex and consists of a small number of steps –
you’ll usually need record the information onto a spreadsheet to simplify the analysis.
1. Gather the data
Typically ABC Analysis is reviewed by gathering, as a minimum
a) A list of part numbers from the ERP system
b) Obtaining the cost data for each part
c) Obtaining it’s consumption volume over a specific period
d) Calculating the consumption value for each part
2. Calculating the consumption value
The consumption value is calculated by multiplying the item cost by the quantity used in
the period.
3. Grouping your parts
Parts are grouped by the consumption value and typically split into 3 bands (note the
percent used here are for indicative purposes and your own organization may benefit from
different bands).
a) Band A – Material where the consumption value represents approximately 80% of the total
consumption value –this will be typically your high cost items here Lead, Copper, Zink are
comes under this category.
b) Band B – Material where the consumption value represents approximately 15% of the overall
value Plastic is comes under this category
c) Band C – Material where the consumption value represents approximately 5% of the overall
value. Lubricant and Cokes are comes under this category.
40
3.2 ABC ANALYSIS SECONDARY STEPS:
Once classified parts (and in many ERP systems you are able to populate the
classification data against the part in the parts master record). Use this data to drive key materials
management activity. For example co-coordinating your perpetual inventory management
activity – you can routinely verify your Category A parts like copper, zinc, Iron and lead on a
monthly basis but only review your category C parts; Lubricant and coke twice a year.
You can use scheduled orders for your Category C parts but may require detailed purchase
orders and negotiation for your Category A parts.
Carrying out an ABC analysis on your inventory can provide the foundation for
streamlining your materials management processes – focusing your time and effort on the parts
that need it most – ensuring that your processes are appropriately configured for the various
materials that you manage.
The ABC analysis ensures the handling and management of inventory in an effective
manner. The procedures so carried out are sufficient enough to manage the inventory. But the
system can be more efficient and cost effective if we can incorporate some other method with
ABC analysis. It can be VED Analysis, SDE Analysis, HML Analysis, and FSN Analysis. The
company will be able to manage the inventory in a more cost effective manner if they can
incorporate any of the above technique with ABC Analysis.
But choosing such a technique to incorporate should be good enough to handle the
inventory management requirement of the organization or rather say it should overcome all the
difficulties and problems. So this study suggesting a new method of inventory controlling
technique in which the SARK CABLES PVT LTD can adopt to increase the efficiency
41
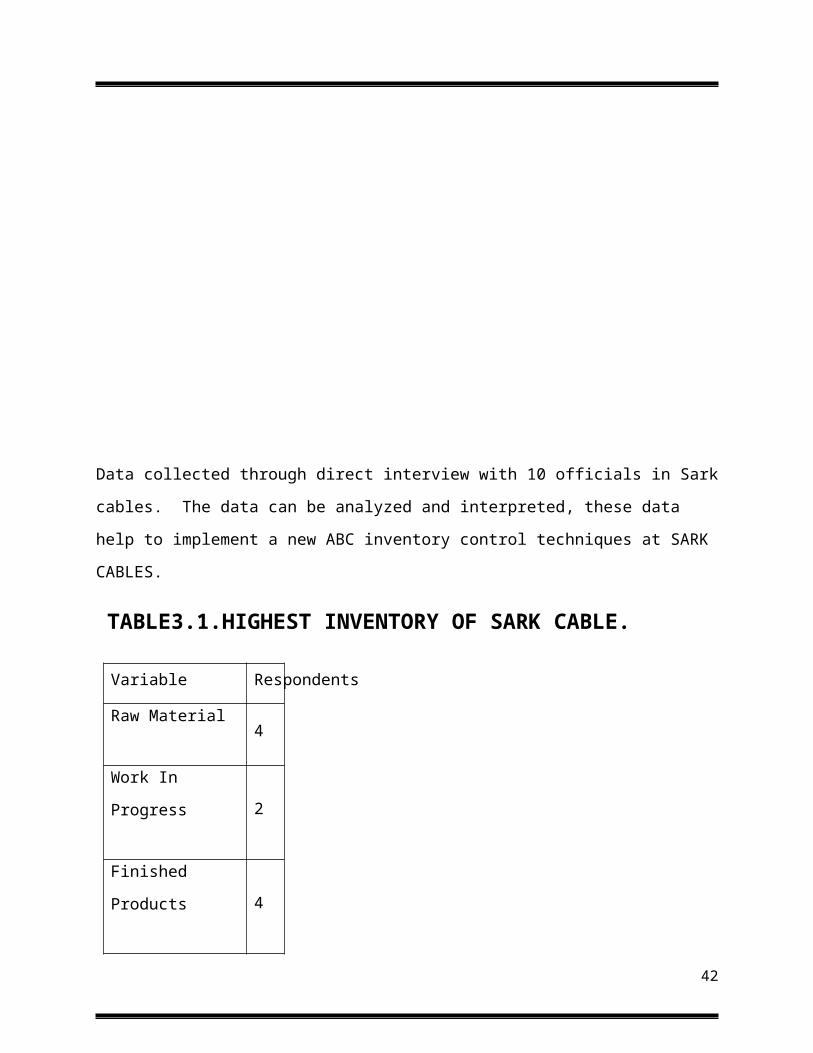
TABLE 3.9 CLASSIFICATION OF INVENTORIES AT SARK
CABLES ACCORDING TO ABC TECHNIQUES
A category items B category items C category items
LEAD, IRON, ZINC,
COPPERPLASTIC
ALUMINIUM,
LUBRICANT,COKE
High consumption value Moderate value Low consumption value
High control Moderate control Low control
Minimization of waste
materialControl over waste Annual review of waste
No safety stock Low safety stock High safety stock
Frequent ordering Ordering 3 times in a monthBulk ordering once in a
month
Weakly control statement Monthly control Quality control report
Sark cables inventories are categorized into three A B and C. Lead, Iron,Zinc and copper
are comes under A category. These items have high consumption value so frequent order is
necessary otherwise it will affect the production process. Aluminum and plastics are comes
under B category it require only moderate control because moderate consumption value.
Lubricant and coke are comes under C category these items have less consumption value so low
control is enough
42
4.1 SUMMARY
Inventory management is so critical for planning or forecasting for the future needs and
for developing strategic plans to handle the market situation. It needs to a top down approach to
structure on effective way of taking inventory managing problems.
If SARK CABLE is to achieve incremental growth and maximize its market
capitalization, it has to give more emphasis on effective inventory control and use available
resource optimally.
To make it more efficient and effective this study is suggesting the system of ABC
Analysis. The data collected for this study was through direct observation and field study
conducted in the company. The other information available for this study was the company’s
records and manuals. This study gives an insight to the company’s inventory management and
helps to design a new method for improving the present system of inventory controlling.
43
4.2FINDINGS
There is no proper inventory control techniques in SARK CABLES pvt ltd
40% of the officials responded that of raw materials are overstocking in the
organization.20% of the officials responded those works in progress are high. But
40% of the officials said that finished goods are high.. (with reference to Table 3.1)
40% of the officials responded that there is no proper classification of inventory. But
60% of the officials said that there is proper classification of inventory in the
organization. (with reference to Table 3.2)
15 days are the real lead time of the inventory. (with reference to Table 3.3)
60% of inventories are not reaching in the production department on correct time due
to the lack of inventory control. (with reference to Table 3.4)
60% of the officials responded that there is high level of wastages occurring. 20% of
them said that the average wastage per week is low. (with reference to Table 3.5)
Lead, Zinc and copper having high cost (with reference to Table 3.6)
Lead, Zinc and copper are 'A' items. Frequent value analysis is required.(with
reference to Table 3.7 & chart3.7)
Plastic and Aluminum are (‘B’ items) intergroup items. .(with reference to Table 3.7
& chart3.7)
Lubricant and cokes are C items marginally important. .(with reference to Table 3.7
& chart3.7)
Cumulative cost helps purchase department to compare different investment choices. .
(with reference to Table 3.8 & chart3.8)
44

4.3 RECOMMENDATIONS
In store department items can be placed in sequential manner.
There shall be a system of monitoring and controlling the inventory
There shall be proper record of wastage. And the entire process of inventory
management can be properly coordinated and defects must be eliminated.
Lead, Iron, Zinc and copper have high cost and high value of consumption. These raw
materials are coming under A category because of that frequent ordering is necessary
The company can make use of a combined method of ABC and VED Analysis for better
inventory controlling and management.
Routinely verify A Category items on a monthly basis but only review C category items
twice a year.
Use scheduled orders for Category C items but require detailed purchase orders and
negotiation for Category A items
QUESTIONNAIRE
45

Q.1) Name of the Company: __________________
Q.2) Date: ___________________
Q.3) which is the high Inventory Items in your company ?
a) raw material b) work in progress c) Finished goods
Q.4) do you have classifications of all kind of inventories?
a) Yes b) No
Q.5 Company having any standard inventory control system?
a) Yes b) No
Q.6) estimated capacity of warehouse?
a) capacity above 1000 tones b) capacity 1000 tones c)capacity below 1000 tones
Q.7) there is any separate warehouses for various types of inventories?
Yes No
Q.8) Normal lead time of inventories?
a)20 days b)15 days c)10 day
Q.9) there is any delay transferring inventory?
a) Yes b) No
Q.10) average inventory wastage per week?
a) High b) Medium c) low
Q.11) Do you think there is any relevance for inventory control technique? a) Yes b) No
BIBLIOGRAPHY
46

Text reference
1. N G Nair -Production and Operation Management(1996)Tata McGrew-Hill publishing company
Ltd.
2. Ray wild -- Operations management (Jan 17, 2002)
3. William J Stevenson-Operations Management(2009) Tata McGrew-Hill Education Pvt Ltd .
Journals
4. Colley Jr, J.L., Landel, R.D. and Fair, R.R., Production, Operations, Planning &Control—Text
and Cases, 1977 (Holden–Day: USA).
5. Arsham, H., Tools for decision analysis. Available online at: http://www.mirrorservice.
org/sites/home.ubalt.edu/ntsbarsh/Business-stat/opre/partIX.htm (accessed 13 May 2005)
6. Bhattacharya, A., Sarkar, B. and Mukherjee, S.K., ABC analysis in multi-criteria environment—
an application of TOPSIS, in 1st International Conference on Logistics
7. Flores and Whybark 1986).operations & Supply Chain Management, 2001, pp. 489–
494.Flores, B.E., Olson, D.L. and Dorai, V.K., Management of multicriteria inventory
8. Cohen and Ernst (1988) classification. Math. Comput. Model. 1992, 16, 71–82.Cohen, M.A. and
Ernst, R., Multi-item classification and generic inventory stock control policies. Prod. Invent.
Mgmt., 1988, 29, 6–8.
9. Harhalakis, G. and Zachman, W.S., A dynamic planning and control system for inventories of
raw materials. Prod. Invent. Mgmt. J., 1989, Second Quarter, 12–17.
WEBSITES
http://managementstudyguide.com/inventory-classification.htm
http://en.wikipedia.org/wiki/Inventory
http://www.sarkcables.com/contactsark.php
47