Embed Size (px)
Citation preview
NEXON Co., Ltd.
Investor PresentationQ4 2016
February 10, 2017
2
NEXON Co., Ltd.Q4 2016
INVESTOR PRESENTATION
© 2017 NEXON Co., Ltd. All Rights Reserved.
Owen MahoneyPresident and Chief Executive Officer
3
NEXON Co., Ltd.Q4 2016
INVESTOR PRESENTATION
© 2017 NEXON Co., Ltd. All Rights Reserved.
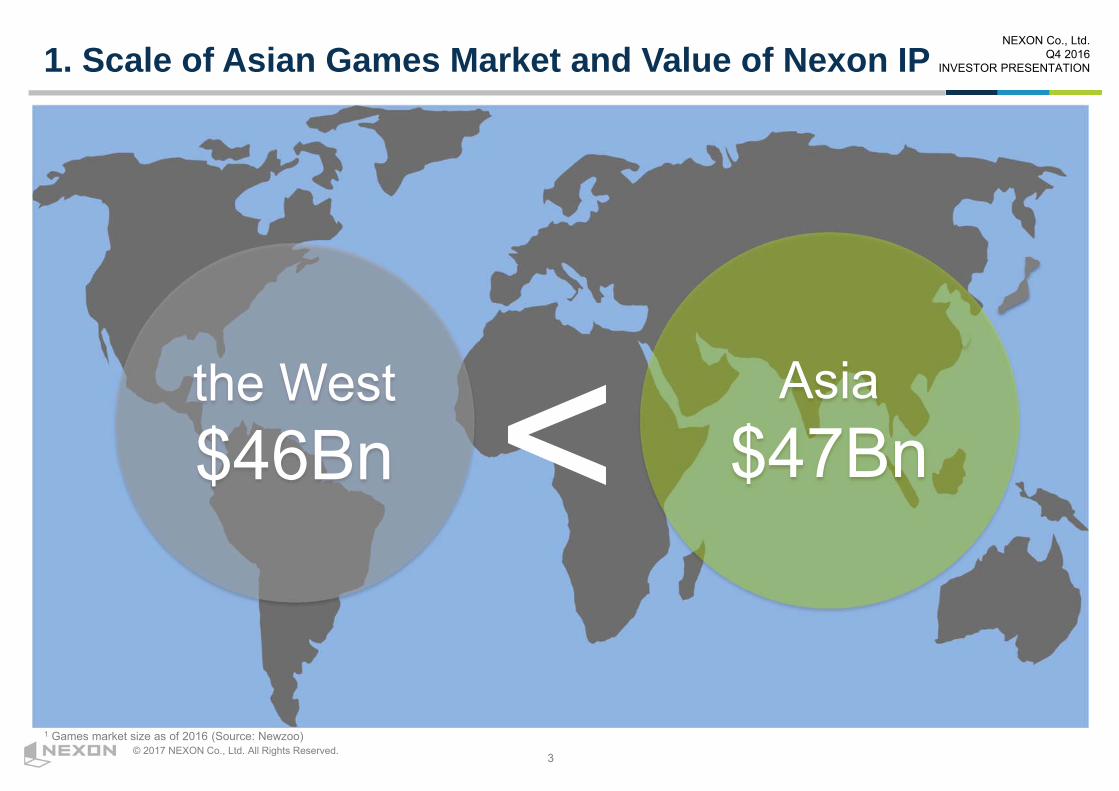
1. Scale of Asian Games Market and Value of Nexon IP
Asia$47Bn
1 Games market size as of 2016 (Source: Newzoo)
the West$46Bn
4
NEXON Co., Ltd.Q4 2016
INVESTOR PRESENTATION
© 2017 NEXON Co., Ltd. All Rights Reserved.
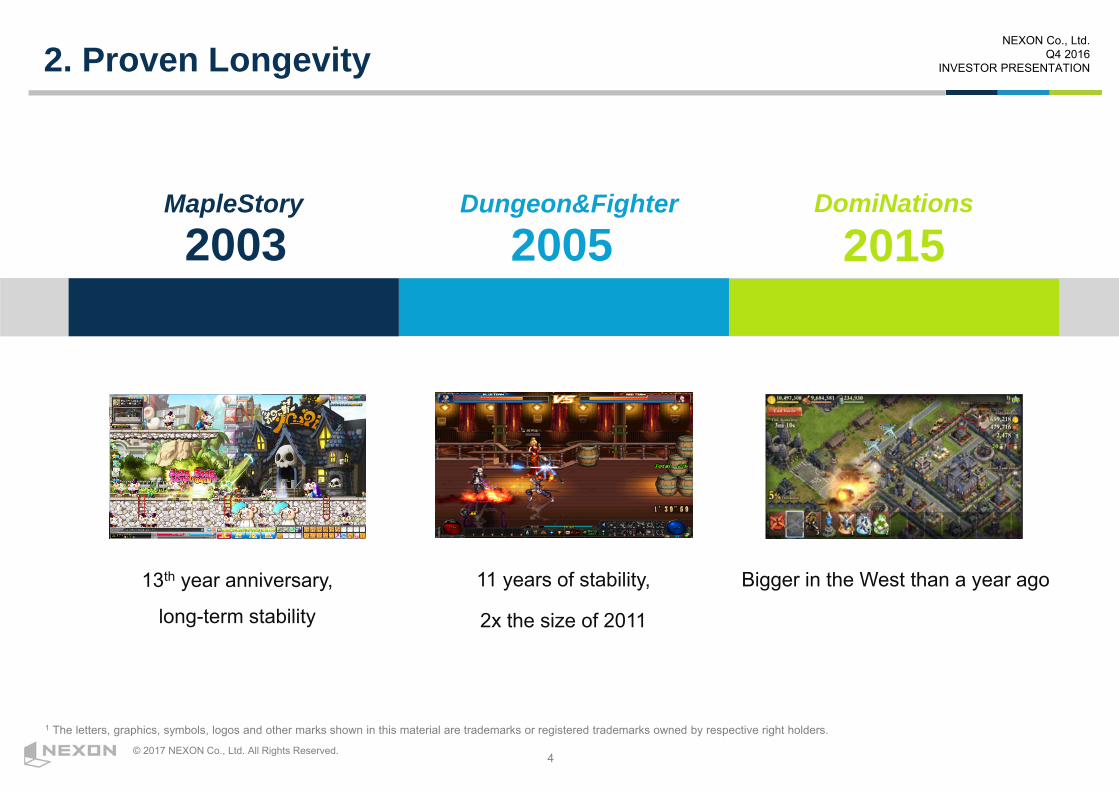
2. Proven Longevity
11 years of stability,
2x the size of 2011
DomiNationsDungeon&Fighter
2003 2005 2015
Bigger in the West than a year ago
MapleStory
13th year anniversary,
long-term stability
1 The letters, graphics, symbols, logos and other marks shown in this material are trademarks or registered trademarks owned by respective right holders.

5
NEXON Co., Ltd.Q4 2016
INVESTOR PRESENTATION
© 2017 NEXON Co., Ltd. All Rights Reserved.
3. Nexon’s Pipeline
Front edge of a wave of new games
Stable cash flow funds experiments in unique and engaging games
Deep capability – long history of experimentation with new games and new business models
LawBreakers
Durango Dungeon&Fighter 2D mobile2
Dark Avenger 3 TANGO 5 : The Last Dance
1 The letters, graphics, symbols, logos and other marks shown in this material are trademarks or registered trademarks owned by respective right holders.2 Mobile games based on the original IPs.
6
NEXON Co., Ltd.Q4 2016
INVESTOR PRESENTATION
© 2017 NEXON Co., Ltd. All Rights Reserved.
Three Powerful Advantages
Enormous opportunity in Asian markets
Powerful franchises that perform as annuities
Diversified and robust pipeline of new games

7
NEXON Co., Ltd.Q4 2016
INVESTOR PRESENTATION
© 2017 NEXON Co., Ltd. All Rights Reserved.
HIT: Trailer
1 The letters, graphics, symbols, logos and other marks shown in this material are trademarks or registered trademarks owned by respective right holders.
Mobile – Publishing
8
NEXON Co., Ltd.Q4 2016
INVESTOR PRESENTATION
© 2017 NEXON Co., Ltd. All Rights Reserved.
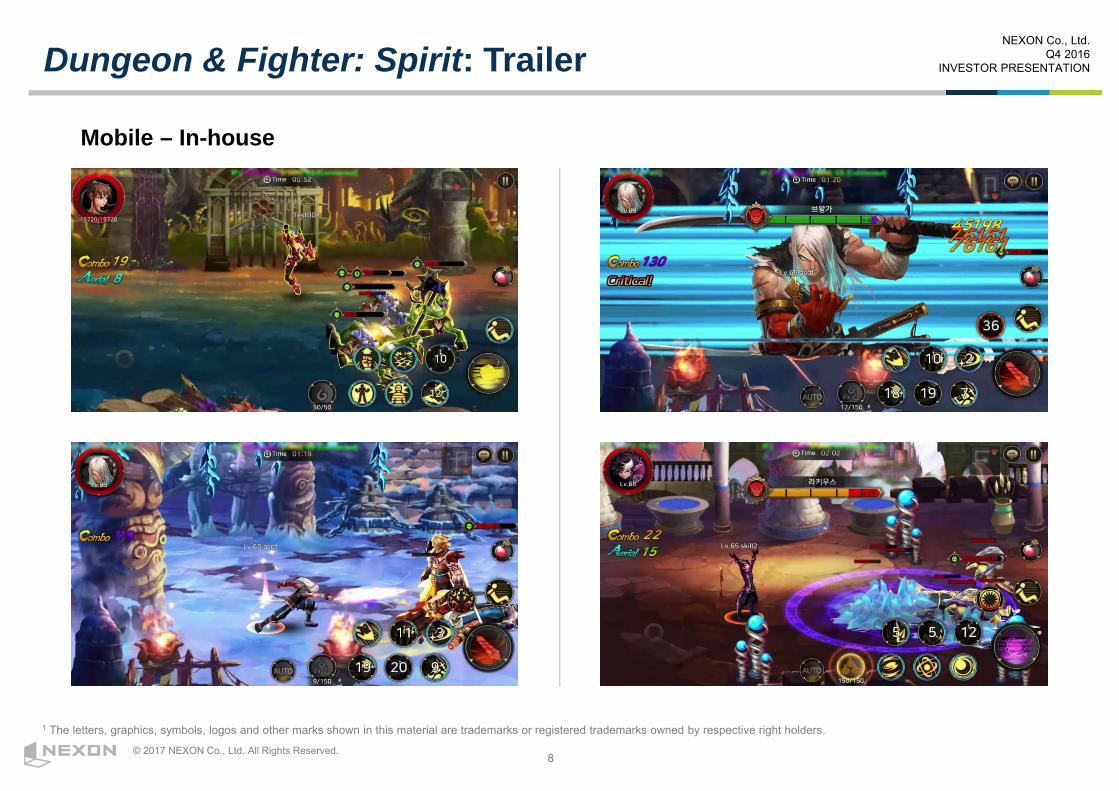
Dungeon & Fighter: Spirit: Trailer
1 The letters, graphics, symbols, logos and other marks shown in this material are trademarks or registered trademarks owned by respective right holders.
Mobile – In-house
9
NEXON Co., Ltd.Q4 2016
INVESTOR PRESENTATION
© 2017 NEXON Co., Ltd. All Rights Reserved.
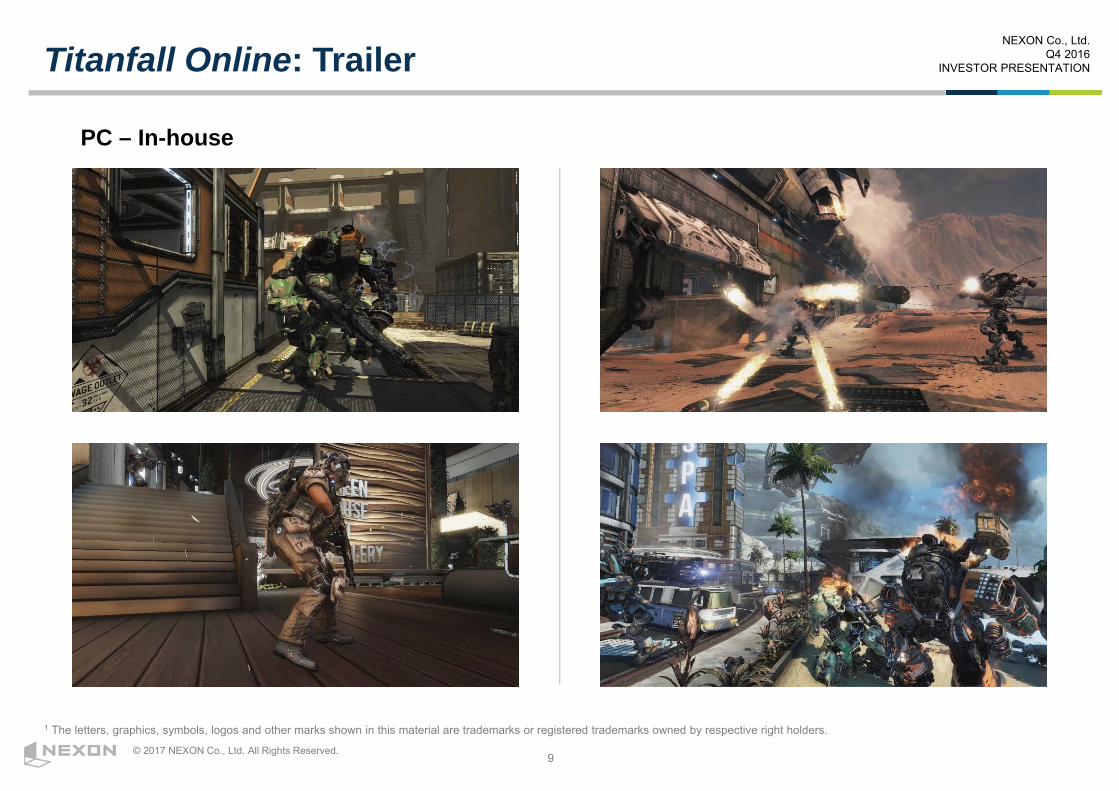
Titanfall Online: Trailer
1 The letters, graphics, symbols, logos and other marks shown in this material are trademarks or registered trademarks owned by respective right holders.
PC – In-house
10
NEXON Co., Ltd.Q4 2016
INVESTOR PRESENTATION
© 2017 NEXON Co., Ltd. All Rights Reserved.
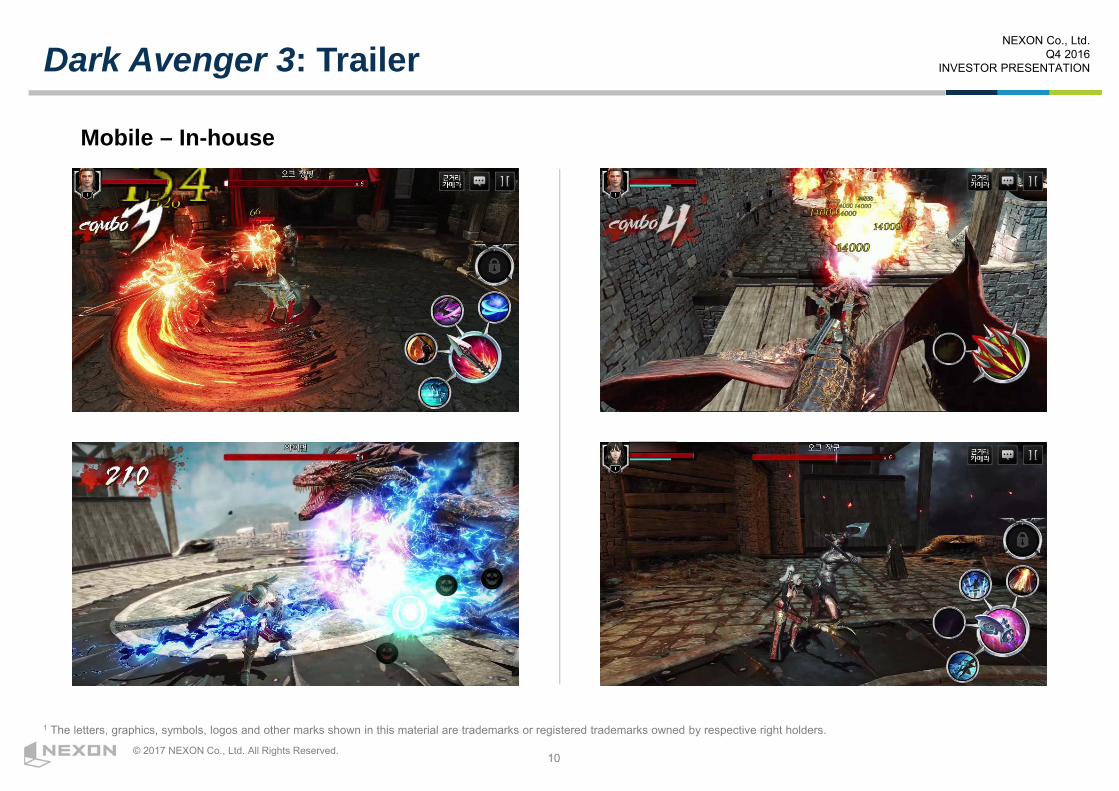
Dark Avenger 3: Trailer
1 The letters, graphics, symbols, logos and other marks shown in this material are trademarks or registered trademarks owned by respective right holders.
Mobile – In-house
11
NEXON Co., Ltd.Q4 2016
INVESTOR PRESENTATION
© 2017 NEXON Co., Ltd. All Rights Reserved.
Shiro UemuraChief Financial Officer

12
NEXON Co., Ltd.Q4 2016
INVESTOR PRESENTATION
© 2017 NEXON Co., Ltd. All Rights Reserved.
FY 2016 Results
13
NEXON Co., Ltd.Q4 2016
INVESTOR PRESENTATION
© 2017 NEXON Co., Ltd. All Rights Reserved.
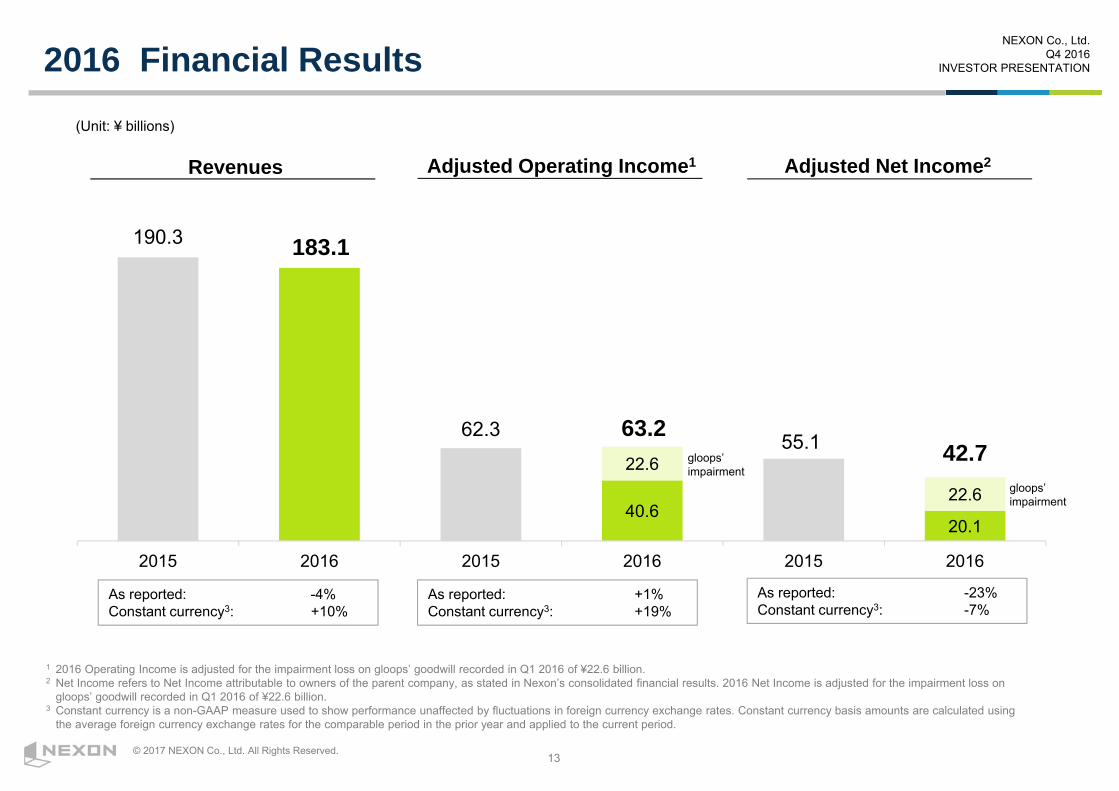
40.620.1
22.6
22.6
190.3 183.1
62.3 63.2 55.1 42.7
2015 2016 2015 2016 2015 2016
Revenues
2016 Financial Results
Adjusted Operating Income1 Adjusted Net Income2
(Unit: ¥ billions)
1 2016 Operating Income is adjusted for the impairment loss on gloops’ goodwill recorded in Q1 2016 of ¥22.6 billion.2 Net Income refers to Net Income attributable to owners of the parent company, as stated in Nexon’s consolidated financial results. 2016 Net Income is adjusted for the impairment loss on
gloops’ goodwill recorded in Q1 2016 of ¥22.6 billion.3 Constant currency is a non-GAAP measure used to show performance unaffected by fluctuations in foreign currency exchange rates. Constant currency basis amounts are calculated using
the average foreign currency exchange rates for the comparable period in the prior year and applied to the current period.
As reported: -4% Constant currency3: +10%
As reported: +1% Constant currency3: +19%
As reported: -23% Constant currency3: -7%
gloops’ impairment
gloops’ impairment

14
NEXON Co., Ltd.Q4 2016
INVESTOR PRESENTATION
© 2017 NEXON Co., Ltd. All Rights Reserved.
Q4 2016 Results

15
NEXON Co., Ltd.Q4 2016
INVESTOR PRESENTATION
© 2017 NEXON Co., Ltd. All Rights Reserved.
Q4 Highlights
Overview Stronger-than-expected results driven by robust performance of key titles primarily in China and Korea
As-reported results affected by depreciation of the Japanese yen
Financials Revenues ¥43.3 billion, down 6% year-over-year on as-reported basis, up 7% on constant currency1 basis –
exceeded our outlook driven by:
– Dungeon&Fighter China’s successful Winter update and in-game item sales – EA SPORTS™ FIFA Online 3 / EA SPORTS™ FIFA Online 3 M in Korea’s successful live game operations and promotions– HIT in Taiwan and Thailand
Operating income ¥7.3 billion – below our outlook primarily due to impairment loss of ¥3.7 billion on including prepaid royalties related to publishing titles
Net income2 ¥11.2 billion – exceeded our outlook primarily due to ¥20.6 billion FX gain on U.S. dollar-denominated cash deposits and accounts receivable partially offset by ¥14.6 billion deferred tax expense additionally recorded for undistributed profits of overseas subsidiaries
1 In 2016 Q3, we implemented a new calculation methodology to more accurately reflect "constant currency" for Dungeon&Fighter China revenues. For details, see footnote on page17, "Regional Revenues".
2 Net income refers to net income attributable to owners of the parent, as stated in Nexon’s consolidated financial results.

16
NEXON Co., Ltd.Q4 2016
INVESTOR PRESENTATION
© 2017 NEXON Co., Ltd. All Rights Reserved.
Q4 Financial Results
(Unit: ¥ millions, except per share data)
1 PC revenue includes revenues other than PC/mobile revenues.2 Net income refers to net income attributable to owners of the parent, as stated in Nexon’s consolidated financial results.
Q4 2015 Q4 2016 YoY %Low end High end
Revenues ¥45,816 ¥39,329 ~ ¥42,164 ¥43,253 (6%)PC1 32,677 28,013 ~ 29,714 31,352 (4%)Mobile 13,139 11,316 ~ 12,450 11,901 (9%)
Japan 3,572 3,277 (8%)ex-Japan 9,567 8,624 (10%)
Operating income 10,315 8,173 ~ 10,325 7,287 (29%)Net income2 4,399 7,697 ~ 9,504 11,206 155%
Earnings per share 10.14 17.73 ~ 21.89 25.78
Exchange rates 100 KRW/JPY 10.52 9.23 9.23 9.46 (10%) CNY/JPY 19.00 15.42 15.42 15.97 (16%) USD/JPY 121.50 103.81 103.81 109.30 (10%)
Q4 2016 Outlook
17
NEXON Co., Ltd.Q4 2016
INVESTOR PRESENTATION
© 2017 NEXON Co., Ltd. All Rights Reserved.
PC72%
Mobile28%
China35%
Korea 43%
Japan 11%
North America
5%
Europe and Others2
6%
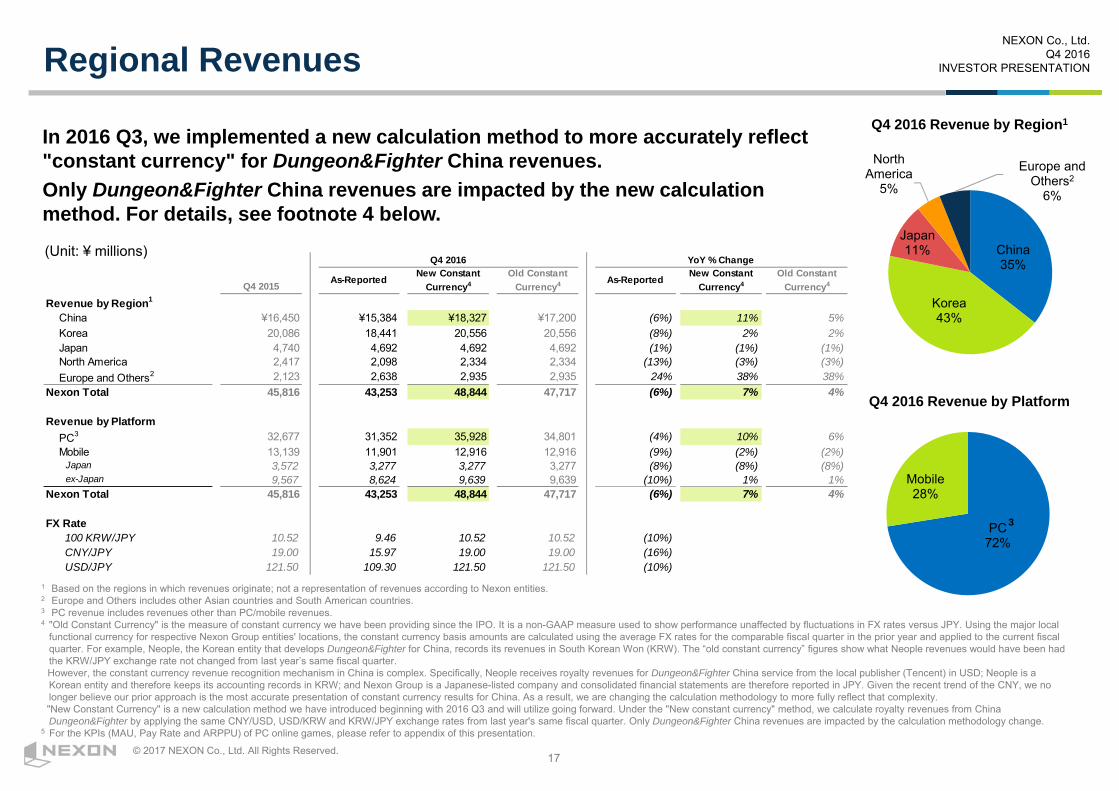
Regional Revenues
(Unit: ¥ millions)
Q4 2016 Revenue by Region1
Q4 2016 Revenue by Platform
3
In 2016 Q3, we implemented a new calculation method to more accurately reflect "constant currency" for Dungeon&Fighter China revenues.Only Dungeon&Fighter China revenues are impacted by the new calculation method. For details, see footnote 4 below.
1 Based on the regions in which revenues originate; not a representation of revenues according to Nexon entities.2 Europe and Others includes other Asian countries and South American countries.3 PC revenue includes revenues other than PC/mobile revenues.4 "Old Constant Currency" is the measure of constant currency we have been providing since the IPO. It is a non-GAAP measure used to show performance unaffected by fluctuations in FX rates versus JPY. Using the major local
functional currency for respective Nexon Group entities' locations, the constant currency basis amounts are calculated using the average FX rates for the comparable fiscal quarter in the prior year and applied to the current fiscal quarter. For example, Neople, the Korean entity that develops Dungeon&Fighter for China, records its revenues in South Korean Won (KRW). The “old constant currency” figures show what Neople revenues would have been had the KRW/JPY exchange rate not changed from last year’s same fiscal quarter.However, the constant currency revenue recognition mechanism in China is complex. Specifically, Neople receives royalty revenues for Dungeon&Fighter China service from the local publisher (Tencent) in USD; Neople is a Korean entity and therefore keeps its accounting records in KRW; and Nexon Group is a Japanese-listed company and consolidated financial statements are therefore reported in JPY. Given the recent trend of the CNY, we no longer believe our prior approach is the most accurate presentation of constant currency results for China. As a result, we are changing the calculation methodology to more fully reflect that complexity. "New Constant Currency" is a new calculation method we have introduced beginning with 2016 Q3 and will utilize going forward. Under the "New constant currency" method, we calculate royalty revenues from China Dungeon&Fighter by applying the same CNY/USD, USD/KRW and KRW/JPY exchange rates from last year's same fiscal quarter. Only Dungeon&Fighter China revenues are impacted by the calculation methodology change.
5 For the KPIs (MAU, Pay Rate and ARPPU) of PC online games, please refer to appendix of this presentation.
As-Reported New ConstantCurrency4
Old ConstantCurrency4 As-Reported New Constant
Currency4Old Constant
Currency4
Revenue by Region1
China ¥16,450 ¥15,384 ¥18,327 ¥17,200 (6%) 11% 5%Korea 20,086 18,441 20,556 20,556 (8%) 2% 2%Japan 4,740 4,692 4,692 4,692 (1%) (1%) (1%)North America 2,417 2,098 2,334 2,334 (13%) (3%) (3%)Europe and Others2 2,123 2,638 2,935 2,935 24% 38% 38%
Nexon Total 45,816 43,253 48,844 47,717 (6%) 7% 4%
Revenue by PlatformPC3 32,677 31,352 35,928 34,801 (4%) 10% 6%Mobile 13,139 11,901 12,916 12,916 (9%) (2%) (2%)
Japan 3,572 3,277 3,277 3,277 (8%) (8%) (8%)ex-Japan 9,567 8,624 9,639 9,639 (10%) 1% 1%
Nexon Total 45,816 43,253 48,844 47,717 (6%) 7% 4%
FX Rate 100 KRW/JPY 10.52 9.46 10.52 10.52 (10%) CNY/JPY 19.00 15.97 19.00 19.00 (16%) USD/JPY 121.50 109.30 121.50 121.50 (10%)
Q4 2015
YoY % ChangeQ4 2016

18
NEXON Co., Ltd.Q4 2016
INVESTOR PRESENTATION
© 2017 NEXON Co., Ltd. All Rights Reserved.
China – Highlights
1 Beginning with 2016 Q3, we have implemented a new calculation methodology to more accurately reflect "constant currency" for Dungeon&Fighter China revenues. For details, see footnote on page17, "Regional Revenues".
▪ Dungeon&Fighter
– Active users remained high throughout the quarter –led to stronger-than-expected sales of in-game items in December
– National Day update continued from Q3 (9/27-11/17) / Winter update (12/1) – both well-received
– MAUs / paying users increased both quarter-over-quarter and year-over-year
(Revenues in ¥ millions)
Dungeon&Fighter GameplayDungeon&Fighter National Day Update
YoY% change:
As Reported: -6%Constant Currency1: +11%
16,450
25,829
15,625
17,360
15,384
Q4 2015 Q1 2016 Q2 2016 Q3 2016 Q4 2016

19
NEXON Co., Ltd.Q4 2016
INVESTOR PRESENTATION
© 2017 NEXON Co., Ltd. All Rights Reserved.
7,687 6,842 4,398 4,482
5,829
12,399 15,713
10,556
13,816 12,612
20,086
22,555
14,954
18,298 18,441
Q4 2015 Q1 2016 Q2 2016 Q3 2016 Q4 2016
▪ Stronger-than-expected performance of EA SPORTS™ FIFA Online 3 / EA SPORTS™ FIFA Online 3 M particularly in November and December driven by:– Newly added player licenses in November – Successful live game operations and promotions
▪ Year-over-year growth from longstanding hits MapleStory and Dungeon&Fighter – MapleStorygrew significantly year-over-year
▪ Launched MapleStoryM (Oct) and SangokushiSousouden Online3 (Oct) – contributed to quarter-over-quarter mobile revenue growth
Korea – Highlights
MapleStoryM Sangokushi Sousouden Online3
(Revenues in ¥ millions) YoY% change:
As Reported: -8%Constant Currency1: +2%
1 Beginning with 2016 Q3, we have implemented a new calculation methodology to more accurately reflect "constant currency" for Dungeon&Fighter China revenues. For details, see footnote on page17, "Regional Revenues".
2 PC revenue includes revenues other than PC/mobile revenues.3 Title is tentative and may be subject to change.
PC2
Mobile
ⓒKOEI TECMO GAMES
20
NEXON Co., Ltd.Q4 2016
INVESTOR PRESENTATION
© 2017 NEXON Co., Ltd. All Rights Reserved.
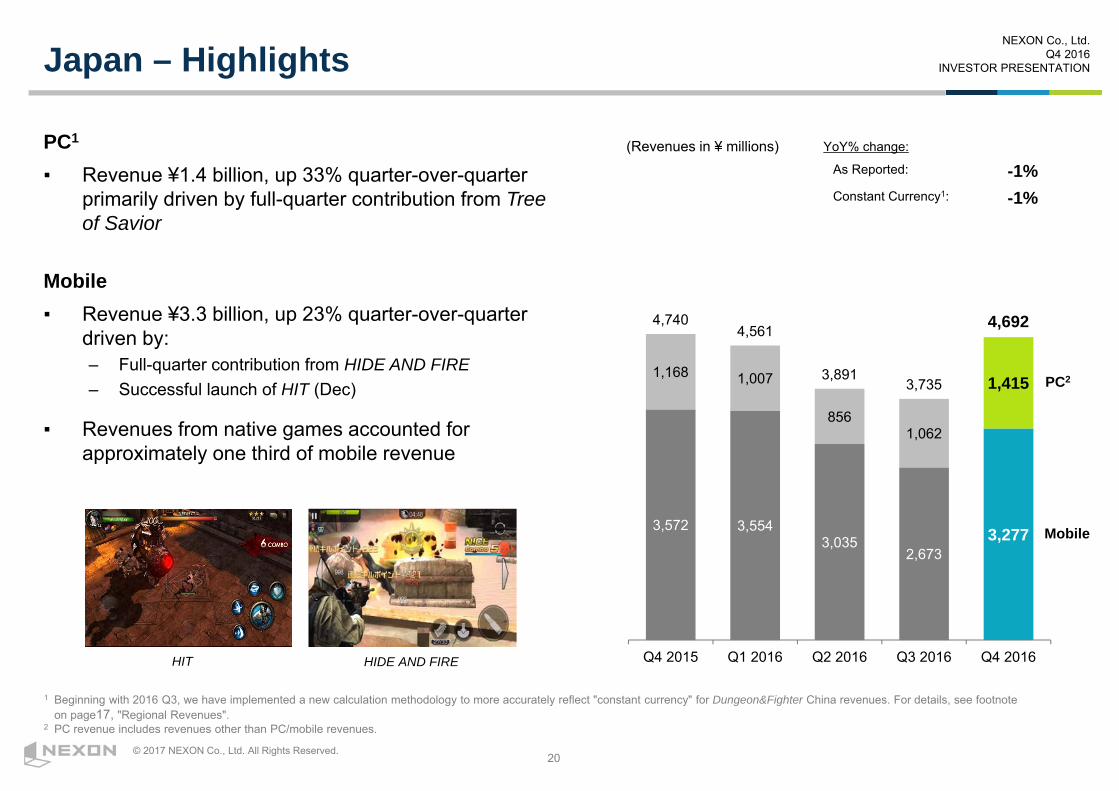
3,572 3,554 3,035
2,673 3,277
1,168 1,007
856 1,062
1,415
4,740 4,561
3,891 3,735
4,692
Q4 2015 Q1 2016 Q2 2016 Q3 2016 Q4 2016
Japan – Highlights
PC1
▪ Revenue ¥1.4 billion, up 33% quarter-over-quarter primarily driven by full-quarter contribution from Tree of Savior
Mobile▪ Revenue ¥3.3 billion, up 23% quarter-over-quarter
driven by:– Full-quarter contribution from HIDE AND FIRE – Successful launch of HIT (Dec)
▪ Revenues from native games accounted for approximately one third of mobile revenue
(Revenues in ¥ millions) YoY% change:
As Reported: -1%Constant Currency1: -1%
1 Beginning with 2016 Q3, we have implemented a new calculation methodology to more accurately reflect "constant currency" for Dungeon&Fighter China revenues. For details, see footnote on page17, "Regional Revenues".
2 PC revenue includes revenues other than PC/mobile revenues.
HIT
PC2
Mobile
HIDE AND FIRE
21
NEXON Co., Ltd.Q4 2016
INVESTOR PRESENTATION
© 2017 NEXON Co., Ltd. All Rights Reserved.
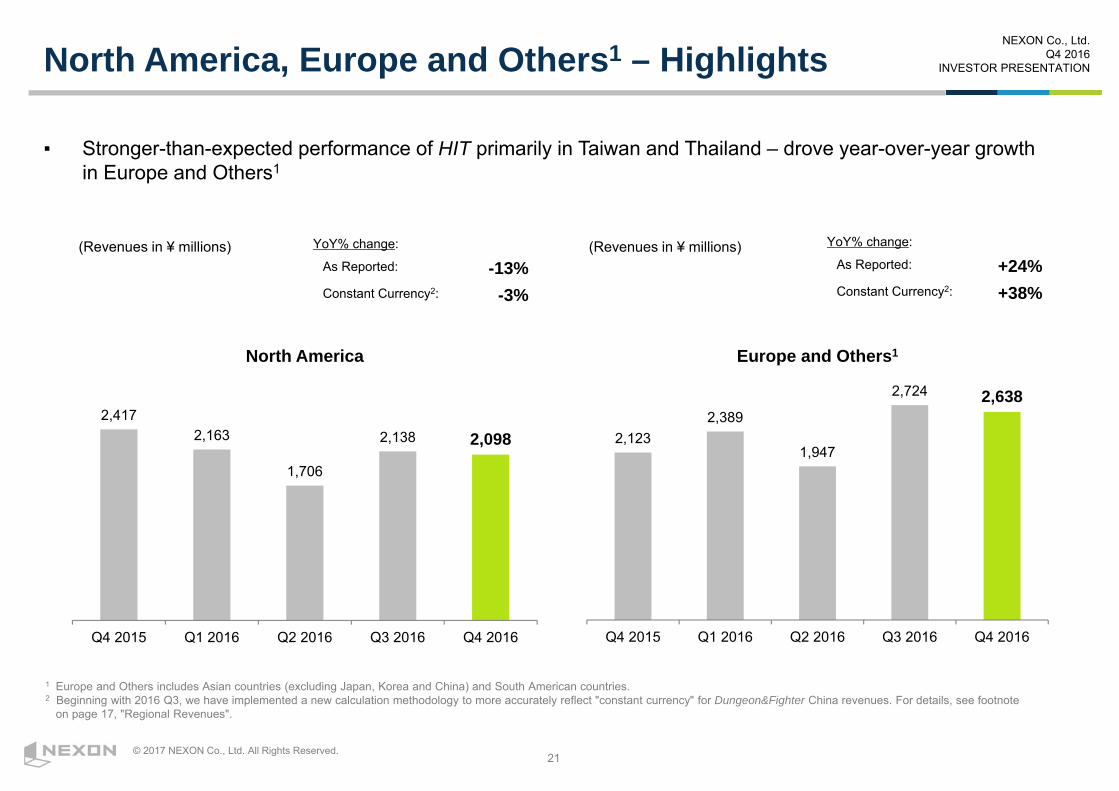
North America, Europe and Others1 – Highlights
▪ Stronger-than-expected performance of HIT primarily in Taiwan and Thailand – drove year-over-year growth in Europe and Others1
(Revenues in ¥ millions) (Revenues in ¥ millions)YoY% change:
As Reported: -13%Constant Currency2: -3%
YoY% change:
As Reported: +24%Constant Currency2: +38%
1 Europe and Others includes Asian countries (excluding Japan, Korea and China) and South American countries.2 Beginning with 2016 Q3, we have implemented a new calculation methodology to more accurately reflect "constant currency" for Dungeon&Fighter China revenues. For details, see footnote
on page 17, "Regional Revenues".
2,417 2,163
1,706
2,138 2,098
Q4 2015 Q1 2016 Q2 2016 Q3 2016 Q4 2016
North America
2,123 2,389
1,947
2,724 2,638
Q4 2015 Q1 2016 Q2 2016 Q3 2016 Q4 2016
Europe and Others1
22
NEXON Co., Ltd.Q4 2016
INVESTOR PRESENTATION
© 2017 NEXON Co., Ltd. All Rights Reserved.
Q1 2017 Outlook

23
NEXON Co., Ltd.Q4 2016
INVESTOR PRESENTATION
© 2017 NEXON Co., Ltd. All Rights Reserved.
Q1 2016
Revenues ¥57,497 ¥62,449 ~ ¥67,129 9% ~ 17%PC2 45,054 52,108 ~ 55,570 16% ~ 23%Mobile 12,443 10,341 ~ 11,559 (17%) ~ (7%)
Operating income 3,703 30,346 ~ 34,763 719% ~ 839%Net income3 (6,272) 27,075 ~ 30,776 n/a ~ n/a
Earnings per share (14.43) 62.26 ~ 70.77
FX Rate Assumptions 100 KRW/JPY 9.62 9.75 9.75 1% CNY/JPY 17.65 16.68 16.68 (5%) USD/JPY 115.48 114.77 114.77 (1%)
Q1 2017 Outlook YoY %
Q1 2017 Business Outlook
1 Beginning with 2016 Q3, we have implemented a new calculation methodology to more accurately reflect "constant currency" for Dungeon&Fighter China revenues. For details, see footnote on page17, "Regional Revenues".
2 PC revenues includes revenues other than PC/mobile revenues.3 Net income refers to net income attributable to owners of the parent, as stated in Nexon’s consolidated financial results.4 In most situations, the exchange rates of both the South Korean Won and the Chinese Yuan are linked to the U.S. dollar. For simplicity, forex sensitivity is calculated based on the
assumption that Korean Won and Chinese Yuan move similarly against Japanese yen when there is an exchange rate movement in U.S. dollar and Japanese yen.
(Unit: ¥ millions, except per share data)
▪ Expect revenues to be:– Up 9% to 17% year-over-year on as-reported basis– Up 8% to 16% year-over-year on constant currency1 basis
▪ Forex sensitivity: every one Japanese yen move against the U.S. dollar would have the following impact on our financials for the first quarter of 20174
Revenues 0.44 billion yenOperating Income 0.23 billion yen
24
NEXON Co., Ltd.Q4 2016
INVESTOR PRESENTATION
© 2017 NEXON Co., Ltd. All Rights Reserved.
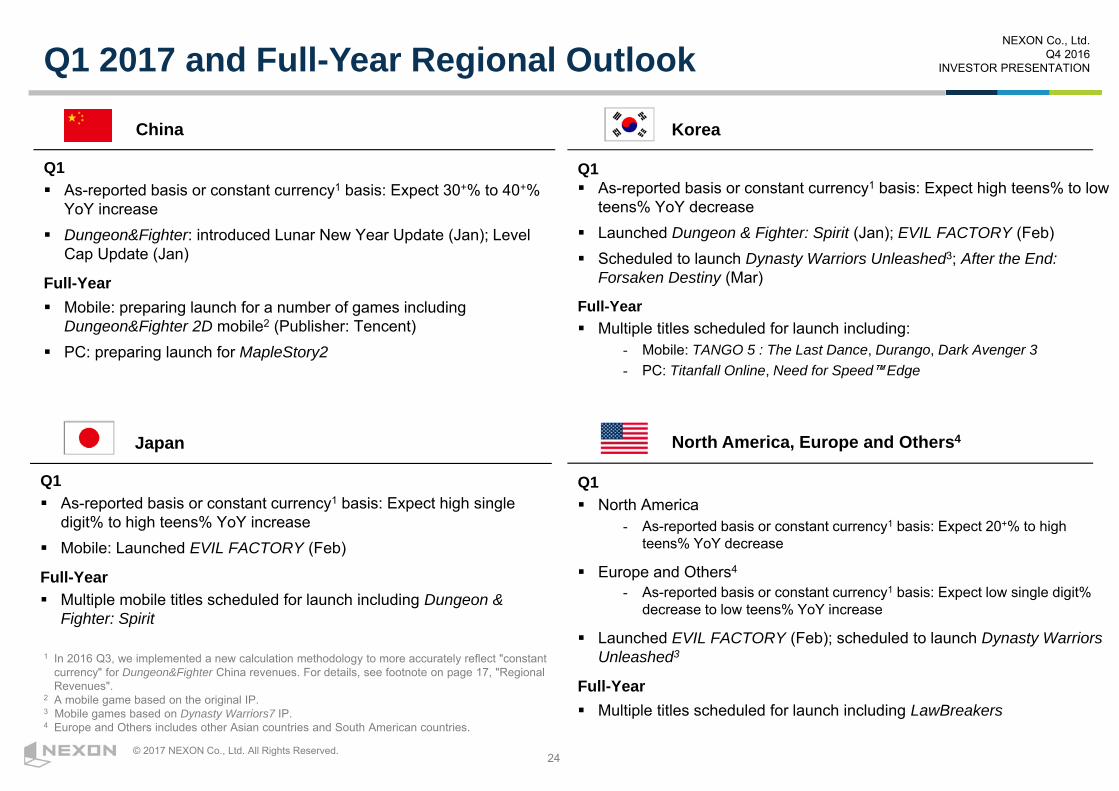
Q1 2017 and Full-Year Regional Outlook
1 In 2016 Q3, we implemented a new calculation methodology to more accurately reflect "constant currency" for Dungeon&Fighter China revenues. For details, see footnote on page 17, "Regional Revenues".
2 A mobile game based on the original IP.3 Mobile games based on Dynasty Warriors7 IP.4 Europe and Others includes other Asian countries and South American countries.
Q1 As-reported basis or constant currency1 basis: Expect high single
digit% to high teens% YoY increase Mobile: Launched EVIL FACTORY (Feb)
Full-Year Multiple mobile titles scheduled for launch including Dungeon &
Fighter: Spirit
China
Q1 North America
- As-reported basis or constant currency1 basis: Expect 20+% to high teens% YoY decrease
Europe and Others4
- As-reported basis or constant currency1 basis: Expect low single digit%decrease to low teens% YoY increase
Launched EVIL FACTORY (Feb); scheduled to launch Dynasty WarriorsUnleashed3
Full-Year Multiple titles scheduled for launch including LawBreakers
Korea
Japan North America, Europe and Others4
Q1 As-reported basis or constant currency1 basis: Expect 30+% to 40+%
YoY increase Dungeon&Fighter: introduced Lunar New Year Update (Jan); Level
Cap Update (Jan)
Full-Year Mobile: preparing launch for a number of games including
Dungeon&Fighter 2D mobile2 (Publisher: Tencent) PC: preparing launch for MapleStory2
Q1 As-reported basis or constant currency1 basis: Expect high teens% to low
teens% YoY decrease Launched Dungeon & Fighter: Spirit (Jan); EVIL FACTORY (Feb) Scheduled to launch Dynasty Warriors Unleashed3; After the End:
Forsaken Destiny (Mar)
Full-Year Multiple titles scheduled for launch including:
- Mobile: TANGO 5 : The Last Dance, Durango, Dark Avenger 3- PC: Titanfall Online, Need for Speed™ Edge
25
NEXON Co., Ltd.Q4 2016
INVESTOR PRESENTATION
© 2017 NEXON Co., Ltd. All Rights Reserved.
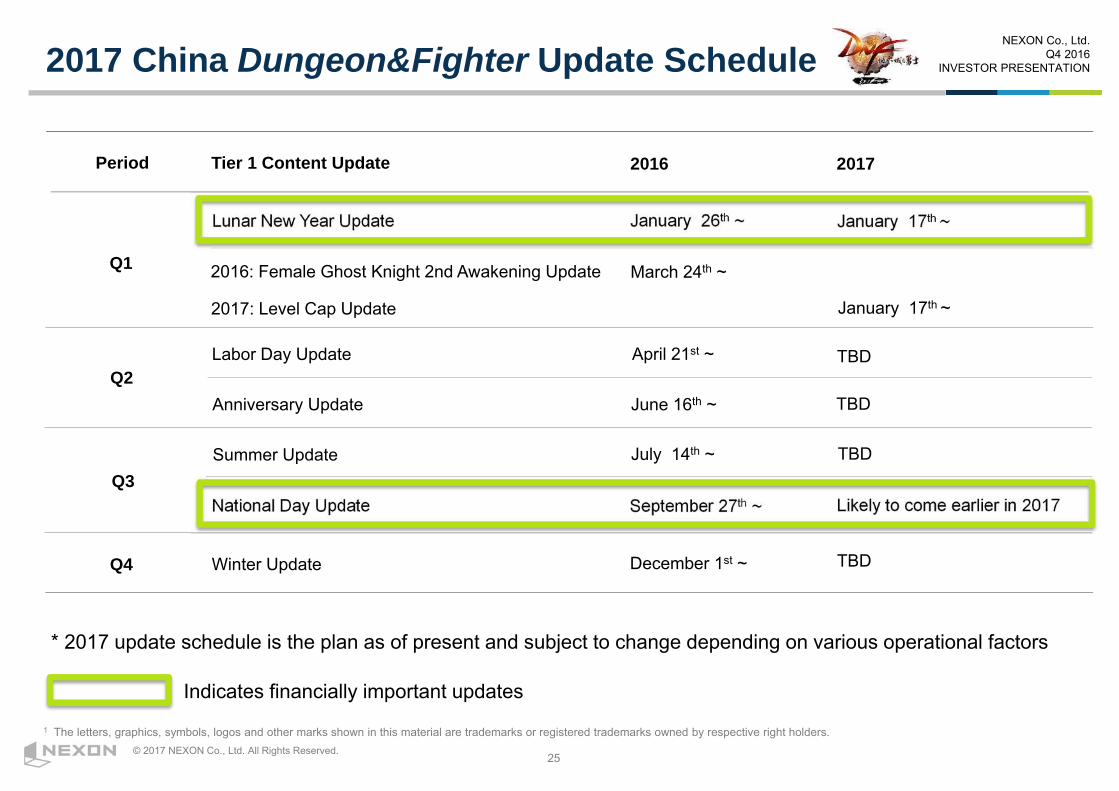
2017 China Dungeon&Fighter Update Schedule
Indicates financially important updates
Period Tier 1 Content Update 2016 2017
Q1
Q2
Q3
Q4
2016: Female Ghost Knight 2nd Awakening Update
Lunar New Year Update
Labor Day Update
Anniversary Update
Summer Update
National Day Update
Winter Update
January 26th ~ January 17th ~
April 21st ~
June 16th ~
July 14th ~
September 27th ~
December 1st ~
Likely to come earlier in 2017
* 2017 update schedule is the plan as of present and subject to change depending on various operational factors
March 24th ~
2017: Level Cap Update January 17th ~
1 The letters, graphics, symbols, logos and other marks shown in this material are trademarks or registered trademarks owned by respective right holders.
TBD
TBD
TBD
TBD
26
NEXON Co., Ltd.Q4 2016
INVESTOR PRESENTATION
© 2017 NEXON Co., Ltd. All Rights Reserved.
28.1
34.8
9.1
1.03.0
0.4
AdjustedOperating
Income 2016 Q1
Increasedrevenues
andOthers
Variable costs HR Costs Marketing OperatingIncome 2017Q1(High-end)
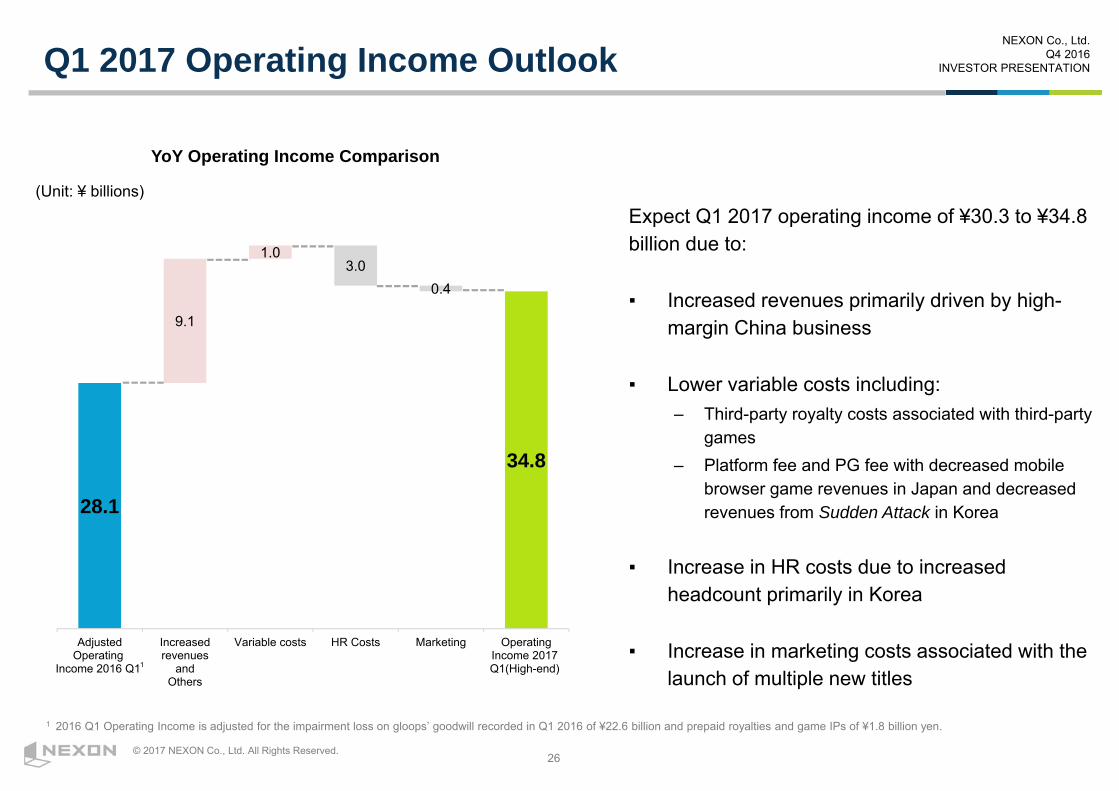
Q1 2017 Operating Income Outlook
Expect Q1 2017 operating income of ¥30.3 to ¥34.8 billion due to:
▪ Increased revenues primarily driven by high-margin China business
▪ Lower variable costs including:– Third-party royalty costs associated with third-party
games – Platform fee and PG fee with decreased mobile
browser game revenues in Japan and decreased revenues from Sudden Attack in Korea
▪ Increase in HR costs due to increased headcount primarily in Korea
▪ Increase in marketing costs associated with the launch of multiple new titles
YoY Operating Income Comparison
(Unit: ¥ billions)
1
1 2016 Q1 Operating Income is adjusted for the impairment loss on gloops’ goodwill recorded in Q1 2016 of ¥22.6 billion and prepaid royalties and game IPs of ¥1.8 billion yen.
27
NEXON Co., Ltd.Q4 2016
INVESTOR PRESENTATION
© 2017 NEXON Co., Ltd. All Rights Reserved.
Shareholder Return
▪ Nexon Japan corporate entity’s retained earnings did not support a year-end dividend for 2016
– Recorded net loss of ¥44.4 billion for 2016 in Nexon Japan corporate entity, primarily due to the ¥23.5 billion write-down on gloops’ stocks and ¥12.9 billion bad debt expense on loans to subsidiaries we recorded in the 1st quarter and 4th quarter respectively
– As a result, Nexon Japan corporate entity’s retained earnings – source for funding the dividend – turned negative at minus ¥41.3 billion
– Scheduled to resume the dividend for the mid-year in 2017
▪ The board of directors approved the policy to initiate a new share repurchase program of one-year period from February 13th, 2017– Total amount of ¥10 billion
– Terms and conditions of share repurchase program to be resolved by the board
28
NEXON Co., Ltd.Q4 2016
INVESTOR PRESENTATION
© 2017 NEXON Co., Ltd. All Rights Reserved.
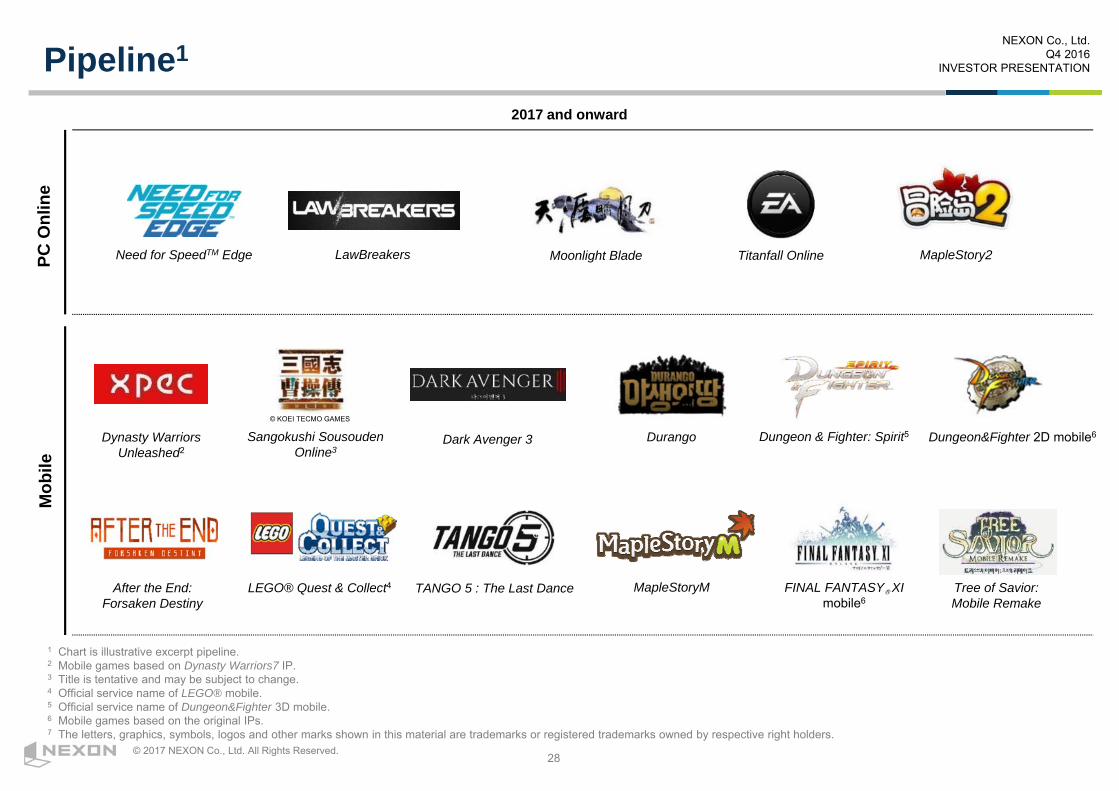
Pipeline1PC
Onl
ine
Mob
ile
2017 and onward
LawBreakers Titanfall Online Need for SpeedTM Edge MapleStory2 Moonlight Blade
LEGO® Quest & Collect4
Sangokushi SousoudenOnline3
Dungeon & Fighter: Spirit5Durango
FINAL FANTASY® XI mobile6
MapleStoryM
© KOEI TECMO GAMES
1 Chart is illustrative excerpt pipeline.2 Mobile games based on Dynasty Warriors7 IP.3 Title is tentative and may be subject to change.4 Official service name of LEGO® mobile. 5 Official service name of Dungeon&Fighter 3D mobile. 6 Mobile games based on the original IPs. 7 The letters, graphics, symbols, logos and other marks shown in this material are trademarks or registered trademarks owned by respective right holders.
Dungeon&Fighter 2D mobile6Dynasty Warriors Unleashed2
Dark Avenger 3
TANGO 5 : The Last Dance Tree of Savior:Mobile Remake
After the End: Forsaken Destiny

29
NEXON Co., Ltd.Q4 2016
INVESTOR PRESENTATION
© 2017 NEXON Co., Ltd. All Rights Reserved.
Q3: Summer Update11th Anniversary UpdateKorean Thanksgiving Update
Q4: Rare Avatar & Christmas Package
2H 2016 – 1H 2017 Tier 1 Content Update Schedule
1 The letters, graphics, symbols, logos and other marks shown in this material are trademarks or registered trademarks owned by respective right holders.
Chi
na
Game Title 2H 2016 Q1 2017 Q2 2017
Kor
ea
Dungeon&Fighter
Counter-Strike Online
EA SPORTSTM FIFA Online 3
MapleStory
Dungeon&Fighter
Sudden Attack
Lunar New Year UpdateLevel Cap Update
Q3: Summer UpdateNational Day Update
Q4: Winter Update
Q3: MapleStory V Update5th job Advancement
Q4: MapleStory Beyond Update
Q3: Europe League Legend Update Q4: FOM Update
Trade 3.0 Update
Q3 : Summer Event & UpdateQ4 : Winter Update
Labor Day Update, 9th Anniversary Update
New Dungeon Game Update
MapleStory Beyond Update(Continued from Q4 2016)Maple Union System UpdateNew Area : Arcana Update
New Character Update: Priestess, Lunar New Year avatar
3on3 New Mode Update
Q3: Summer UpdateNational Day
Q4: Winter Update
Lunar New Year Update
Roster Update
Winter Update (Masters Challenge) Spring Update
TBD
TBD
30
NEXON Co., Ltd.Q4 2016
INVESTOR PRESENTATION
© 2017 NEXON Co., Ltd. All Rights Reserved.
Appendix
31
NEXON Co., Ltd.Q4 2016
INVESTOR PRESENTATION
© 2017 NEXON Co., Ltd. All Rights Reserved.
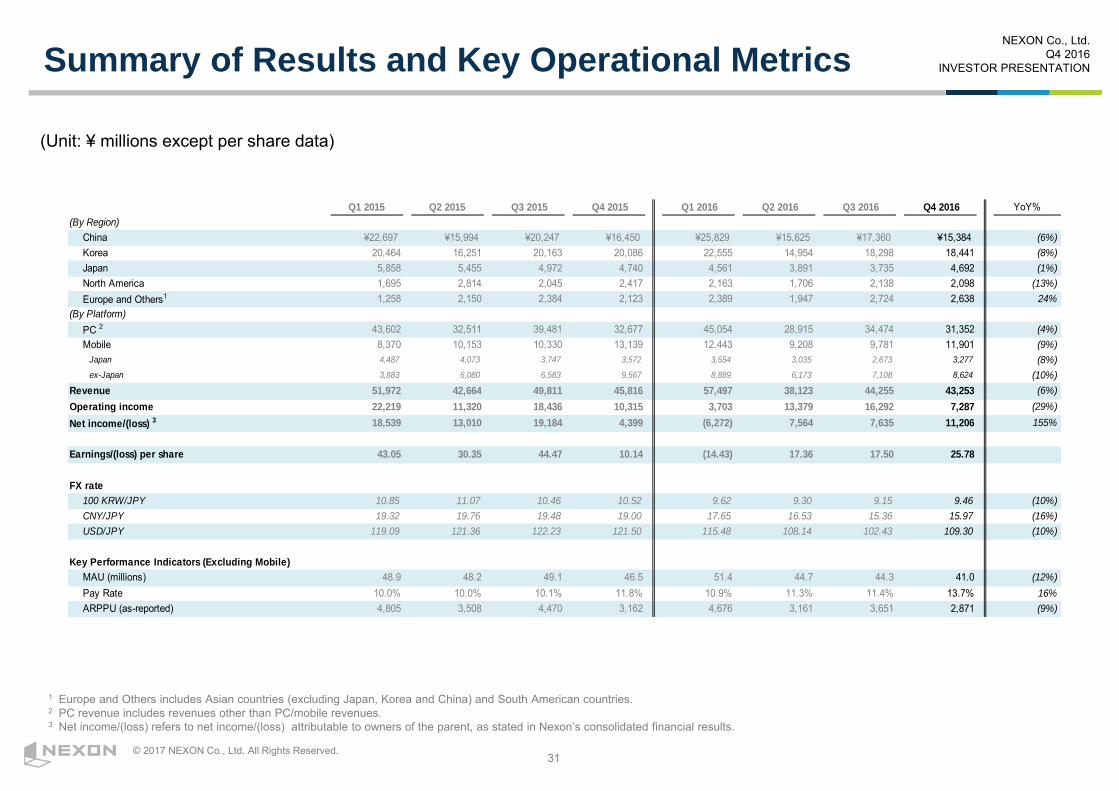
Q1 2015 Q2 2015 Q3 2015 Q4 2015 Q1 2016 Q2 2016 Q3 2016 Q4 2016 YoY%(By Region)
China ¥22,697 ¥15,994 ¥20,247 ¥16,450 ¥25,829 ¥15,625 ¥17,360 ¥15,384 (6%)Korea 20,464 16,251 20,163 20,086 22,555 14,954 18,298 18,441 (8%)Japan 5,858 5,455 4,972 4,740 4,561 3,891 3,735 4,692 (1%)North America 1,695 2,814 2,045 2,417 2,163 1,706 2,138 2,098 (13%)Europe and Others1 1,258 2,150 2,384 2,123 2,389 1,947 2,724 2,638 24%
(By Platform)PC 2 43,602 32,511 39,481 32,677 45,054 28,915 34,474 31,352 (4%)Mobile 8,370 10,153 10,330 13,139 12,443 9,208 9,781 11,901 (9%)
Japan 4,487 4,073 3,747 3,572 3,554 3,035 2,673 3,277 (8%)ex-Japan 3,883 6,080 6,583 9,567 8,889 6,173 7,108 8,624 (10%)
Revenue 51,972 42,664 49,811 45,816 57,497 38,123 44,255 43,253 (6%)Operating income 22,219 11,320 18,436 10,315 3,703 13,379 16,292 7,287 (29%)Net income/(loss) 3 18,539 13,010 19,184 4,399 (6,272) 7,564 7,635 11,206 155%
Earnings/(loss) per share 43.05 30.35 44.47 10.14 (14.43) 17.36 17.50 25.78
FX rate100 KRW/JPY 10.85 11.07 10.46 10.52 9.62 9.30 9.15 9.46 (10%)CNY/JPY 19.32 19.76 19.48 19.00 17.65 16.53 15.36 15.97 (16%)USD/JPY 119.09 121.36 122.23 121.50 115.48 108.14 102.43 109.30 (10%)
Key Performance Indicators (Excluding Mobile)MAU (millions) 48.9 48.2 49.1 46.5 51.4 44.7 44.3 41.0 (12%)Pay Rate 10.0% 10.0% 10.1% 11.8% 10.9% 11.3% 11.4% 13.7% 16%ARPPU (as-reported) 4,805 3,508 4,470 3,162 4,676 3,161 3,651 2,871 (9%)
Summary of Results and Key Operational Metrics
(Unit: ¥ millions except per share data)
1 Europe and Others includes Asian countries (excluding Japan, Korea and China) and South American countries.2 PC revenue includes revenues other than PC/mobile revenues.3 Net income/(loss) refers to net income/(loss) attributable to owners of the parent, as stated in Nexon’s consolidated financial results.
32
NEXON Co., Ltd.Q4 2016
INVESTOR PRESENTATION
© 2017 NEXON Co., Ltd. All Rights Reserved.
Q1 Q2 Q3 Q4 Q1 Q2 Q3 Q4Total Cost of Revenue 1 ¥12,602 ¥11,092 ¥12,552 ¥13,455 ¥13,075 ¥10,475 ¥11,242 ¥13,339
Royalty 2 5,621 4,263 5,355 5,745 5,935 3,274 3,988 4,736HR cost (COGS) 3 4,022 3,950 4,334 4,674 4,528 4,409 4,335 5,363Other (COGS) 4 2,959 2,879 2,863 3,036 2,612 2,792 2,919 3,240
Total SG&A 1 16,776 19,585 18,269 19,582 16,412 14,202 16,362 19,234HR cost 3,695 3,738 3,428 3,602 3,261 3,463 3,668 4,416PG fee 5 4,631 4,813 5,128 5,708 5,491 4,046 4,608 5,078R&D 1,963 1,971 1,729 1,569 1,649 1,939 1,886 1,877Marketing/advertising expenses 1,630 3,728 3,921 5,272 3,209 1,941 3,618 5,088Depreciation and amortization 3,026 3,176 2,275 950 797 859 896 1,010Other 1,831 2,159 1,788 2,481 2,005 1,954 1,686 1,765
Other Income 6 124 90 101 1,306 147 120 217 537Other Expense 7 499 757 655 3,770 24,454 187 576 3,930
FY2015 FY2016
COGS and SG&A
1 Breakdown of COGS and SG&As are unaudited.2 Royalty includes royalties paid to third-party developers in order for us to obtain the right to publish their games.3 HR cost includes salaries, bonuses and benefits for our live game developers, who support post launch servicing, updating and support for our games.4 Other (COGS) primarily consists of depreciation and amortization of assets related to existing games, connection fees (mainly comprised of co-location and datacenter fees,
internet bandwidth and access fees), and the costs of purchasing and maintaining our servers and computer equipment. 5 PG fee in SG&A includes commissions made to external payment gateway companies when users purchase in-game items in PC Online games that we service. It also includes
mobile carrier-related commissions we pay regarding our Japanese mobile browser games, commissions we pay to Apple/Google regarding our mobile native games globally, and platform commission fees related to mobile browser games.
6 Other Income includes other non-operating income, reversal of deferred revenue, gain on sale of properties, and gain on change in equity. 7 Other Expense includes other non-operating expenses, loss on sale/disposal of properties, loss on impairment of tangible fixed assets, loss on impairment of intangible assets,
loss on impairment of other fixed assets and loss on change in equity. It also includes impairment loss of game IPs and goodwill.
(Unit: ¥ millions)

33
NEXON Co., Ltd.Q4 2016
INVESTOR PRESENTATION
© 2017 NEXON Co., Ltd. All Rights Reserved.
Q1 Q2 Q3 Q4 Q1 Q2 Q3 Q4Operating Income ¥22,219 ¥11,320 ¥18,436 ¥10,315 ¥3,703 ¥13,379 ¥16,292 ¥7,287
Finance Income 1 2,576 2,331 4,277 841 823 808 819 21,790 Finance Costs 2 117 97 234 3,952 6,549 4,401 7,016 (87)
Equity income of affiliates,equity method companies 4 11 11 65 16 53 80 (48)
Income/(Loss) before Income Tax 24,682 13,565 22,490 7,269 (2,007) 9,839 10,175 29,116 Tax expense 3 5,835 452 3,239 2,879 4,072 2,262 2,357 17,911 Net income/(loss) 4 18,539 13,010 19,184 4,399 (6,272) 7,564 7,635 11,206
FY2015 FY2016
P&L Below Operating Income
(Unit: ¥ millions)
1 2015 Q1, Q2, Q3, 2016 Q4 Finance Income includes FX conversion gain related to foreign currency deposits & A/R. In addition, 2015 Q1 Finance Income includes dividend received from investee.
2 2015 Q4 and 2016 Q1, Q2, Q3, Finance Costs are primarily caused by FX conversion loss related to foreign currency deposits & A/R.3 2015 Q2 Tax Expense was small because of the partial reversal of income taxes payable due to the difference in opinion between the tax authorities being resolved during 2015 Q2
with regards to the estimate of income taxes payable recorded in FY2014 at a Korean subsidiary based on findings from tax inspection by the tax authorities. 2016 Q4 Tax Expense was big due to a 14.6 billion yen deferred tax expense in relation to re-examination of tax effect accounting on overseas subsidiary’s retained earnings.
4 Net income/(loss) refers to net income/(loss) attributable to owners of the parent, as stated in Nexon’s consolidated financial results.
34
NEXON Co., Ltd.Q4 2016
INVESTOR PRESENTATION
© 2017 NEXON Co., Ltd. All Rights Reserved.
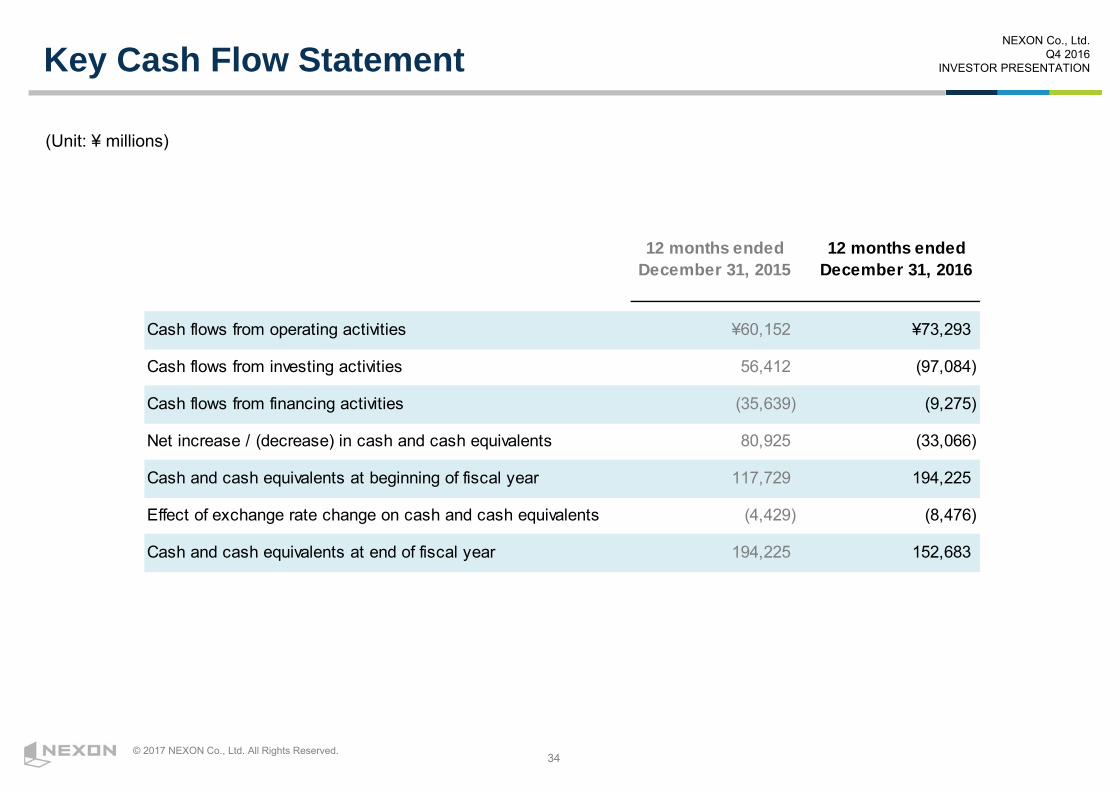
12 months endedDecember 31, 2015
12 months endedDecember 31, 2016
Cash flows from operating activities ¥60,152 ¥73,293
Cash flows from investing activities 56,412 (97,084)
Cash flows from financing activities (35,639) (9,275)
Net increase / (decrease) in cash and cash equivalents 80,925 (33,066)
Cash and cash equivalents at beginning of fiscal year 117,729 194,225
Effect of exchange rate change on cash and cash equivalents (4,429) (8,476)
Cash and cash equivalents at end of fiscal year 194,225 152,683
Key Cash Flow Statement
(Unit: ¥ millions)

35
NEXON Co., Ltd.Q4 2016
INVESTOR PRESENTATION
© 2017 NEXON Co., Ltd. All Rights Reserved.
Balance Sheet
(Unit: ¥ millions)December 31,
2015December 31,
2016
AssetCurrent Assets
Cash and cash equivalents ¥194,225 ¥152,683Other current assets 137,445 213,414 Total current assets 331,670 366,097
Noncurrent assetsTangible assets 22,027 20,394 Goodwill 35,387 17,523 Intangible assets 7,520 7,127 Others 28,982 30,691 Total noncurrent assets 93,916 75,735
Total assets 425,586 441,832
LiabilityCurrent liabilities
Current tax liabilities, current 7,135 5,511 Current borrowings 1,916 1,683 Others 27,833 27,810 Total current liabilities 36,884 35,004
Noncurrent liabilitiesNon-current borrowings 2,501 835 Others 6,520 28,299 Total noncurrent liabilities 9,021 29,134
Total liabilities 45,905 64,138
EquityCapital stock 56,441 3,519 Capital surplus 34,597 86,753 Treasury shares - (0)Other equity interest 73,308 56,254 Retained earnings 210,101 226,398 Non-controlling interests 5,234 4,770 Total equity 379,681 377,694
Total liabilities and total equity 425,586 441,832

36
NEXON Co., Ltd.Q4 2016
INVESTOR PRESENTATION
© 2017 NEXON Co., Ltd. All Rights Reserved.
Long-term Growth Vision
Long-term Growth Vision and Evolution1
1 Above graph is illustrative and not to scale.
2016
Rev
enue
Year
Existing New PC / mobile the West
M&A

37
NEXON Co., Ltd.Q4 2016
INVESTOR PRESENTATION
© 2017 NEXON Co., Ltd. All Rights Reserved.
Glossary of Terms
Term / Abbreviation Meaning
AOSAOS is a sub-genre of the real-time strategy genre, in which two teams of players compete with each other in discretegames, with each player controlling a single character through an RTS-style interface.
FPS(first person shooter) A game in which the player plays from the point of view of the game character in three-dimensional graphics
RTS(real-time strategy)
A game that is usually played from a third-person perspective, in which the player controls vast numbers of in-gamecharacters in a tactical scenario
MMORPG(massively multiplayer online role playing game)
An online role-playing game that has a “massive” number (usually several hundred or more) of players who playconcurrently
MAU(monthly active user) The total number of accounts of users who log in and play a particular game in a given month
ARPPU(average revenue per paying user)
Online game net revenues for any given period divided by the average number of paying players of such games during theperiod
Pay Rate The number of paying users divided by monthly active users for any given period of time
MCCU(maximum concurrent users)
The maximum number of users concurrently accessing a game at a particular moment. MCCU is generally used tomeasure the popularity of a game
Closed Beta Test(CBT)
A trial mode (beta version) of a game taken in a certain period with a limited number of users or groups; a Limited BetaTest is an even smaller-scale trial mode of a game with fewer numbers of users or groups
Open Beta Test(OBT)
A trial mode (beta version) of a game usually taken after CBT without restrictions on particiapation
Tier One Update Large scale updates to existing PC games typically launched in Q1 or Q3 around peak season
Tier Two Update Smaller updates to existing PC games released throughout the year
Immersive GamesGames that are designed to be played continuously for hours and enable thousands of concurrent users to interact witheach other in real time. Our games are architected to evolve over years, in contrast to packaged goods games, whichoften have finite story lines and comparatively less open-ended player engagement.
38
NEXON Co., Ltd.Q4 2016
INVESTOR PRESENTATION
© 2017 NEXON Co., Ltd. All Rights Reserved.
DisclaimerThis presentation is prepared to offer reference information about NEXON group to the investors and is intended to generally provide investors and analysts with financial and operational information about Nexon, but not to solicit or recommend any sale or purchase of stock or other securities of Nexon. NEXON Co., Ltd. (“Nexon”) has not verified and would assume no responsibility for the accuracy, appropriation, or completeness thereof. This presentation does not contain all relevant information relating to Nexon or the sale of its shares, including, without limitation, the information that would be stated under the captions “Risk Factors”, “Management’s Discussion and Analysis of Financial Condition and Results of Operations” and “Business” in an annual report. Any investment decision with respect to any shares of Nexon should be made solely upon the basis of the information contained in the disclosure documents and is qualified in its entirety by reference to the detailed information appearing in the disclosure documents.
This presentation includes non-GAAP and non-IFRS financial measures, including but not limited to key performance indicators, as well as ratios calculated on the basis thereof. These non-GAAP and non-IFRS financial measures should not be considered in isolation or as a substitute for the most directly comparable financial measures included in our consolidated financial statements and presented in accordance with IFRS.
This presentation includes forward-looking statements. In some cases, you can identify forward-looking statements by terms such as “anticipate”, “assume”, “believe”, “estimate”, “expect”, “forecast”, “may”, “plan”, “potential”, “predict”, “seek”, “should”, or “will”, or by other similar terminology. These statements discuss expectations, identify strategies, contain projections of Nexon’s financial condition or results of operations or state other forward-looking information. The forward-looking statements in this presentation are subject to various risks, uncertainties and assumptions about Nexon’s business and results of operations. The expectations expressed in these forward-looking statements may not be achieved, and actual results could differ materially from and be worse than expectations. Potential risks and uncertainties that could cause actual results to differ materially from expectations include, without limitation:
Continued growth and popularity of Nexon’s key titles; Nexon’s ability to maintain favorable relationships with key licensing partners; Nexon’s continued ability to offer games in China, through local partners or otherwise; Nexon’s ability to compete effectively in the online games industry; Nexon’s ability to address hacking, viruses, security breaches and other technical challenges; Fluctuations in currency exchange rates; Nexon’s ability to maintain and further develop its brand name; Effective acquisition of new companies, businesses, technologies and games from third parties and the possibility of recognizing impairment
losses; Continued growth of the online games market, including the underlying infrastructure, and free-to-play/item-based revenue generation model; Nexon’s ability to adapt to new technologies; Nexon’s ability to enter into licensing arrangements for third-party titles on terms favorable to it; Effective defense of Nexon’s intellectual property; and Legislative, regulatory, accounting and taxation changes in the countries in which Nexon operates.
Nexon does not intend, and disclaims any duty, to update or revise any forward-looking statements contained in this presentation to reflect newinformation, future events or otherwise. We caution you not to place undue reliance on the forward-looking statements contained in this presentation.
39
NEXON Co., Ltd.Q4 2016
INVESTOR PRESENTATION
© 2017 NEXON Co., Ltd. All Rights Reserved.
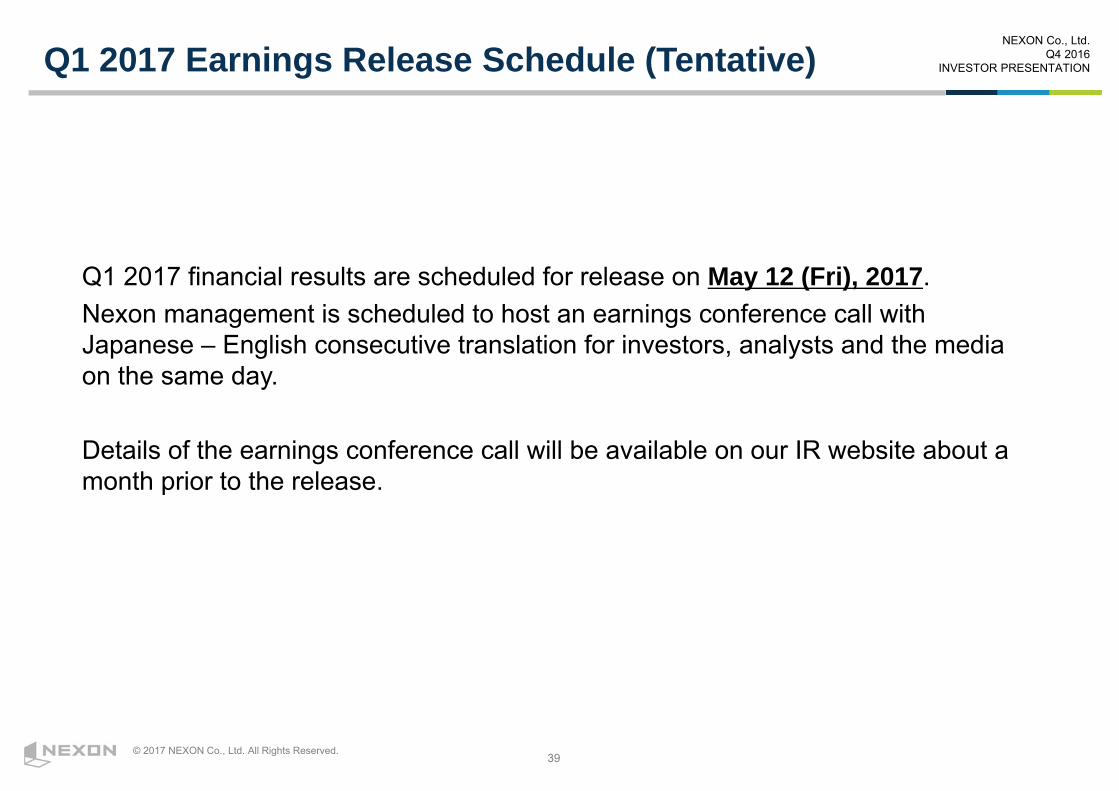
Q1 2017 Earnings Release Schedule (Tentative)
Q1 2017 financial results are scheduled for release on May 12 (Fri), 2017. Nexon management is scheduled to host an earnings conference call with Japanese – English consecutive translation for investors, analysts and the media on the same day.
Details of the earnings conference call will be available on our IR website about a month prior to the release.