Embed Size (px)
Citation preview

EUROPE ONLINE PAYMENT METHODS: SECOND HALF 2016
PUBLICATION DATE: FEBRUARY 2017
PAGE 2 GENERAL INFORMATION I PAGE 3 KEY FINDINGS I PAGE 4-7 TABLE OF CONTENTS I PAGE 8 REPORT-SPECIFIC SAMPLE
CHARTS I PAGE 9 METHODOLOGY I PAGE 10 RELATED REPORTS I PAGE 11 CLIENTS I PAGE 12-13 FREQUENTLY ASKED QUESTIONS
PAGE 14 ORDER FORM I PAGE 15 TERMS AND CONDITIONS

2
2
PRODUCT DETAILS Title:
Type of Product:
Category:
Covered Regions:
Covered Countries:
Language:
Formats:
Number of Charts:
Europe Online Payment Methods: Second Half 2016
Market Report
Online Payment
Europe
Belgium, Czech Republic, Denmark, France, Germany, Greece, Italy,
Kazakhstan, Netherlands, Poland, Russia, Spain, Sweden, Turkey, UK,
Ukraine
English
PDF & PowerPoint
104
PRICES* Single User License:
Site License:
Global Site License:
€ 950 (exc. VAT)
€ 1,425 (exc. VAT)
€ 1,900 (exc. VAT)
We occasionally offer a discount on selected reports as newer reports are published.
Please see the most up-to-date pricing on our website www.ystats.com.
QUESTIONS
ANSWERED
IN THIS REPORT
What are the top payment methods preferred by online shoppers in various European countries?
How many online shoppers in over 15 European markets pay by credit card?
What are the leading alternative online payment methods used by online shoppers in this region?
What key online and mobile payment trends prevail in Europe and worldwide?
Which mobile payment providers do consumers in selected European countries know and use?
SECONDARY MARKET
RESEARCH
Our reports are exclusively based on secondary market research. Our researchers derive
information and data from a variety of reliable published sources and compile the data into
understandable and easy-to-use formats.
ADVANTAGES Maximum Objectivity
Reliable Sources
Up-To-Date Analysis
Boardroom-Ready PowerPoint Presentations
Guidance For Strategic Company Decisions
EUROPE ONLINE PAYMENT METHODS: SECOND HALF 2016
VARYING PREFERENCES DICTATE WIDE RANGE OF PAYMENT METHODS
FOR ONLINE SHOPPERS IN EUROPE
Bank transfer, cash on delivery, credit card, debit card, direct debit, E-Wallet and
invoice: online shoppers in Europe demand a variety of payment methods from E-
Commerce sellers. According to the findings of the yStats.com report, the right mix of
payment options might be essential to succeed in the world’s second largest region by B2C
E-Commerce revenues. A survey cited in the report reveals that more than one-half of
online buyers in Germany and close to one quarter in the UK have abandoned online
shopping cart because their favorite payment method was not offered.
There is a wide range of consumer preferences to take into consideration. Credit or
debit card is the first choice of about half of online shoppers in countries such as the UK,
France, and Belgium. However, in Germany and Italy, a high double-digit share of E-
Commerce buyers prefers E-Wallet providers such as PayPal over traditional online
payments by credit or debit card. Different still, local banking method iDEAL accounts for
the largest share of online purchases in the Netherlands, while in Eastern Europe payment
on delivery is a much demanded option. Furthermore, yStats.com’s research shows that
online shoppers’ preferences also evolve over time. For example, in Spain debit card
outpaced PayPal in the ranking of favorite online payment methods and in Russia more
online shoppers now pay by bank card then by cash on delivery.
The mobile payment landscape in Europe is also diverse. On the regional level, only a
small one-digit share of all consumer payments was done via mobile devices in 2016,
according to data cited in the yStats.com report. Mobile wallet providers like Apple Pay are
used by only a one-digit fraction of consumers in countries like Germany, Italy, and the UK.
On the other hand, in Sweden local mobile payment solution Swish was known to nearly all
Internet users and used by more than half of them, as of mid-2016. Overall, mobile
payments were more likely to be used by Internet users in Scandinavian and selected
Eastern European countries than in other parts of Europe.
EUROPE ONLINE PAYMENT METHODS: SECOND HALF 2016
3
MANAGEMENT SUMMARY
GLOBAL DEVELOPMENTS
Online and Mobile Payment Trends, H2 2016
Breakdown of E-Commerce Sales by Payment Methods, in %, 2015 & 2020f
Breakdown of the Number of Online Payment Options Offered, in % of Online Merchants, January 2016
Top 3 Payment Methods Preferred in Cross-Border Online Shopping, in % of Cross-Border Online Shoppers, August
2016
Top 3 Considerations When Choosing a Payment Method in Cross-Border Online Shopping,
in % of Cross-Border Online Shoppers, August 2016
Reasons To Choose the Preferred Payment Method in Cross-Border Online Shopping, in % of Cross-Border Online
Shoppers, 2016
Security Authentication Features That Online Shoppers in the USA and the UK Would Consider Setting Up for Online
Purchases in the Next 12 Months, in %, November 2016
Mobile Payments Share of Total Consumer Card Payments, in %, 2016e & 2021f
Mobile and Wearable Contactless Payments, in USD billion, 2015 & 2018f
Breakdown of Mobile Payments by Usage Case, by Europe and North America, 2016e
Share of Internet Users Who Look Forward to Being Able to Pay for More Transactions from Mobile Device, in %, by
Asia-Pacific, Europe, Latin America, the USA, and Global Average, August 2016
Contactless Payment User Penetration, in % of Banked Population, July 2016
Payment Methods Used in Mobile Shopping, in % of Mobile Shoppers, by Selected Regions, August 2016
Products and Services Paid for via Mobile Wallet, in % of Mobile Shoppers Who Paid with Mobile Wallet, August 2016
Share of Mobile Shoppers Paying with Mobile Wallets, by Selected Countries, in %, August 2016
Probability of Using Mobile Wallets, in % of Smartphone Owners, by Selected Countries, July 2016
EUROPE
3.1. REGIONAL
Payment Methods Preferred in Online Shopping, in % of Online Shoppers, by Belgium, Germany, France, Italy, the
Netherlands, the Nordics, Poland, Spain and the UK, May 2016
Share of Online Shoppers Who Abandoned Shopping Cart Due to Lack of Favorite Payment Method, in %, by
Benelux, Germany, Nordics and the UK, June 2016
Three Factors Contributing to a Poor Online Shopping Experience, incl. Payment-Related, in % of Online Shoppers,
by Benelux, Germany, the Nordics and the UK, June 2016
Breakdown of Retail Payment Transactions by Methods, incl. Mobile, in %, 2016
Mobile Payment Readiness and Devices Preferred for Mobile Payment, in % of Internet Users with Bank Accounts, by
Sub-Region, Summer 2016
Top 10 Countries By Mobile Payment User Penetration, in % of Surveyed Internet Users, September 2016
Expectations Regarding the Provision of Technical Support for Mobile Payments, in % of Millennials, by Germany,
Italy, the Netherlands, and the UK, July 2016
Share of Millennials Who Use Mobile Payments and Who Tried Mobile Payments and Then Stopped Using Them, in
%, July 2016
Top 2 Providers Most Preferred by Millennials for Providing a Mobile Payment Service, in %, by Germany, Italy, the
Netherlands, and the UK, July 2016
3
2
EUROPE ONLINE PAYMENT METHODS: SECOND HALF 2016
TABLE OF CONTENTS
4
1
5
5
EUROPE (CONT.)
3.1. REGIONAL (CONT.)
Mobile Payment Platforms Most Known to Millennials, in %, by Germany, Italy, the Netherlands, and the UK, July
2016
Share of Millennials Using Mobile Payment Service from PayPal and Apple Pay, in %, by Germany, Italy, the
Netherlands, and the UK, July 2016
3.2. ADVANCED MARKETS
3.2.1. UK
Online and Mobile Payment Trends and News about Players, H2 2016
Breakdown of E-Commerce Payment Volume by Payment Methods, in %, 2015 & 2020f
Value of Payment Transactions by Selected Non-Cash Payment Methods, in INR billion, Volume, in millions, and
Change, in %, incl. Mobile Wallets, FY 2014-2015 & FY 2015-2016
Use of Mobile Payments, by Contactless, In-App and In-Store, in % of Smartphone Owners with a Credit/Debit Card,
2016
Share of Internet Users Using Contactless Payment Cards, in %, 2015 & 2016
Contactless Payment Statistics, incl. Number of Contactless Cards Issued, by Debit, Credit and Total, in millions,
Monthly Spending on Contactless Cards, in GBP million, Number of Monthly Contactless Transactions, in millions,
and Average Value of Contactless Transactions, in GBP, by Debit, Credit/Charge Cards and Total, Number of
Accepting Terminals/Outlets, August 2015 & August 2016
Brand Recognition and Usage Rate of Selected Mobile Wallet Services, in % of Millennials, May 2016
Brands Most Trusted by Consumers for Delivering a Smartphone Wallet App, in % of Smartphone Owners,
September 2015, February 2016, June 2016
3.2.2. GERMANY
Online and Mobile Payment Trends and News about Players, H2 2016
Payment Methods Used in Online Shopping, in % of Online Shoppers, July 2016
Breakdown of B2C E-Commerce Sales by Payment Methods, by incl. Amazon and excl. Amazon, in %, 2015
Breakdown of the Use of 3D Secure Authentication, in % of Online Retailers, 2015
Risk Management Tools Used, in % of Online Retailers, 2015
Perceived Advantages of Working with a Payment Service Provider, in % of Online Retailers Working with a Payment
Service Provider, July 2016
Selected Service Providers Used for Offering Payment by Invoice, Direct Debit and Financing/Invoicing, in % of Online
Retailers, July 2016
Costs of Accepting Selected Payment Methods in B2C E-Commerce, by Direct and Indirect Costs, in EUR and in % For
the Basis Case, August 2016
Breakdown of Retail Payment Transactions by Methods, incl. Mobile, in %, 2016
Awareness of Mobile Payment Providers, incl. Mobile Wallets, in % of Adults, January 2016
3.2.3. FRANCE
Share of Respondents Who Used 3D Secure, in %, 2015 & 2016
Share of Respondents Who Trust PayPal with Personal Data, by Total, Ages 18-34, and Compared to a Bank, in %,
June 2016
EUROPE ONLINE PAYMENT METHODS: SECOND HALF 2016
TABLE OF CONTENTS
3

6
6
EUROPE (CONT.)
3.2. ADVANCED MARKETS
3.2.3. FRANCE
Share of Respondents Who Used or Would Like to Use Contactless Payment, by Total Respondents and 18-34 Year-
Olds, in %, June 2016
Satisfaction with Various Aspects of Contactless Payment, in % of Contactless Payment Users, 2015 & 2016
Breakdown of Readiness to Pay via Mobile Phone, in % of Internet Users, June 2016
3.2.4. SPAIN
Payment Methods Used in Online Shopping, in % of Online Shoppers, 2015 & 2016
Mobile Payment Apps Installed, in % of Mobile Payment App Users, July 2016
3.2.5. ITALY
Breakdown of Payment Methods Used in Online Shopping, in % of Online Shoppers, October 2016
3.2.6. NETHERLANDS
Breakdown of Online Purchases by Payment Methods, in %, H1 2015 & H1 2016
Breakdown of Selected Online Payment Method Users by Gender, Age Group and Education Level, in %, Q2 2016
Share of “iDEAL” and “Credit Card” in Mobile Purchases, in %, H1 2015 & H1 2016
3.2.7. SWEDEN
Payment Methods Used and Preferred in Online and Mobile Shopping, in % of Online Shoppers, Q2 2016
Reasons to Choose a Particular Payment Method, in % of Online Shoppers, Q2 2016
Awareness and Usage of Mobile Wallet Solutions, in % of Internet Users, Q2 2016
3.2.8. DENMARK
Payment Methods Used and Preferred in Online and Mobile Shopping, in % of Online Shoppers, Q2 2016
Awareness and Usage of Mobile Wallet Solutions, in % of Internet Users, Q2 2016
3.2.9. BELGIUM
Top 5 Preferred Payment Service Providers and Top 3 Criteria for Choosing a Payment Service Provider, According to
Web Agencies, October 2016
Share of Online Shop Projects Where Mobile Payments Are Possible, in %, and Share of Online Shop Projects With
Mobile Payments Where In-App Payments Are Possible, in %, October 2016
Breakdown of Barriers to Mobile Purchases, incl. Payment-Related, in % of Online Shoppers, June 2016
3
EUROPE ONLINE PAYMENT METHODS: SECOND HALF 2016
TABLE OF CONTENTS
7
7
EUROPE (CONT.)
3.3. EMERGING MARKETS
3.3.1. RUSSIA
Share of Online Shoppers Paying by Bank Card and by Cash on Delivery, in %, October 2016
Payment Methods Used in Online Shopping, in % of Online Shoppers, October 2016
Online Payment Value, in RUB billion, and in % Year-on-Year Change, 2014 – 2017f
Share of Internet Acquiring, in % of Total Acquiring Volume, 2014 - 2016
Top 7 Payment Aggregators, Top 8 Payment Gateways and Top 5 Acquiring Banks and Top 6 E-Wallets Used by
Digital Agencies When Integrating Payment Instruments into Client Projects, April 2016
Overview of Pricing of Top 7 Payment Aggregators Used by Digital Agencies, April 2016
Overview of Pricing of Top 6 Payment Gateways Used by Digital Agencies, April 2016
Breakdown of Awareness and Usage of Contactless Payments, by Contactless Bank Cards and Contactless Payment
with Mobile Phone, in % of Adult Population, by Total, With and Without Higher Education, October 2016
3.3.2. POLAND
Payment Methods Used in Online Shopping, in % of Online Shoppers, 6 Months to December 2016
Types of Mobile Payment Used, in % of Mobile Payment Users, 6 Months to December 2016
Breakdown of Awareness of Apple Pay/Samsung Pay/Android Pay and Intention to Use These Services, in % of
Internet Users, December 2016
3.3.3. TURKEY
Number of Domestic E-Commerce Transactions with Bank Cards, in millions, and Value, in TRY million, Q1 2014 – Q3
2016
Number of Cross-Border E-Commerce Transactions with Domestic Bank Cards, in millions, and Value, in TRY million,
Q1 2014 – Q3 2016
3.3.4. GREECE
Payment Methods Used in Online Shopping, in % of Online Shoppers, 2016
3.3.5. CZECH REPUBLIC
Payment Methods Used in Online Shopping, in % of Online Shoppers, Q2 2016
Payment Methods Used in Online Shopping, in % of Online Shoppers, by Gender and Age Group, Q2 2016
3.3.6. UKRAINE
Breakdown of Non-Cash Payments, by Online, POS and ATM, in %, 2015
3.3.7. KAZAKHSTAN
Payment Methods Used in Online Shopping, in % of Online Shoppers, 2016
3
EUROPE ONLINE PAYMENT METHODS: SECOND HALF 2016
TABLE OF CONTENTS

8
8
EUROPE ONLINE PAYMENT METHODS: SECOND HALF 2016
REPORT-SPECIFIC SAMPLE CHARTS
9
9
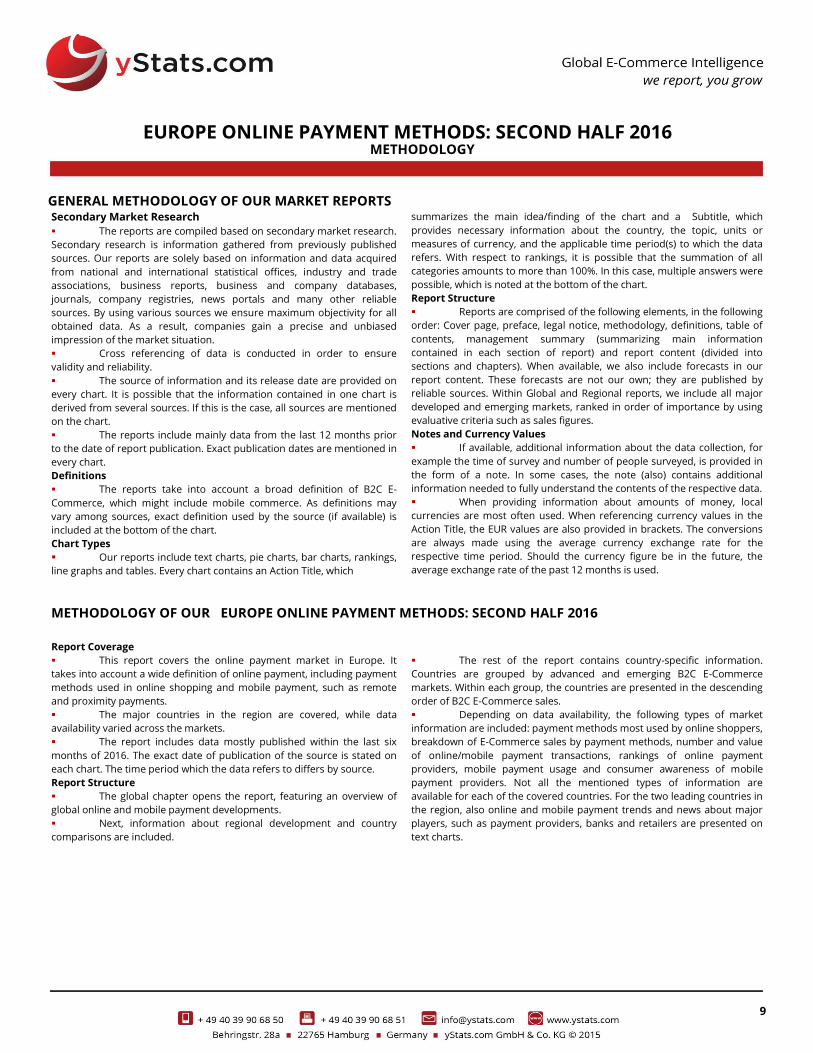
GENERAL METHODOLOGY OF OUR MARKET REPORTS Secondary Market Research
The reports are compiled based on secondary market research.
Secondary research is information gathered from previously published
sources. Our reports are solely based on information and data acquired
from national and international statistical offices, industry and trade
associations, business reports, business and company databases,
journals, company registries, news portals and many other reliable
sources. By using various sources we ensure maximum objectivity for all
obtained data. As a result, companies gain a precise and unbiased
impression of the market situation.
Cross referencing of data is conducted in order to ensure
validity and reliability.
The source of information and its release date are provided on
every chart. It is possible that the information contained in one chart is
derived from several sources. If this is the case, all sources are mentioned
on the chart.
The reports include mainly data from the last 12 months prior
to the date of report publication. Exact publication dates are mentioned in
every chart.
Definitions
The reports take into account a broad definition of B2C E-
Commerce, which might include mobile commerce. As definitions may
vary among sources, exact definition used by the source (if available) is
included at the bottom of the chart.
Chart Types
Our reports include text charts, pie charts, bar charts, rankings,
line graphs and tables. Every chart contains an Action Title, which
summarizes the main idea/finding of the chart and a Subtitle, which
provides necessary information about the country, the topic, units or
measures of currency, and the applicable time period(s) to which the data
refers. With respect to rankings, it is possible that the summation of all
categories amounts to more than 100%. In this case, multiple answers were
possible, which is noted at the bottom of the chart.
Report Structure
Reports are comprised of the following elements, in the following
order: Cover page, preface, legal notice, methodology, definitions, table of
contents, management summary (summarizing main information
contained in each section of report) and report content (divided into
sections and chapters). When available, we also include forecasts in our
report content. These forecasts are not our own; they are published by
reliable sources. Within Global and Regional reports, we include all major
developed and emerging markets, ranked in order of importance by using
evaluative criteria such as sales figures.
Notes and Currency Values
If available, additional information about the data collection, for
example the time of survey and number of people surveyed, is provided in
the form of a note. In some cases, the note (also) contains additional
information needed to fully understand the contents of the respective data.
When providing information about amounts of money, local
currencies are most often used. When referencing currency values in the
Action Title, the EUR values are also provided in brackets. The conversions
are always made using the average currency exchange rate for the
respective time period. Should the currency figure be in the future, the
average exchange rate of the past 12 months is used.
METHODOLOGY OF OUR EUROPE ONLINE PAYMENT METHODS: SECOND HALF 2016
Report Coverage
This report covers the online payment market in Europe. It
takes into account a wide definition of online payment, including payment
methods used in online shopping and mobile payment, such as remote
and proximity payments.
The major countries in the region are covered, while data
availability varied across the markets.
The report includes data mostly published within the last six
months of 2016. The exact date of publication of the source is stated on
each chart. The time period which the data refers to differs by source.
Report Structure
The global chapter opens the report, featuring an overview of
global online and mobile payment developments.
Next, information about regional development and country
comparisons are included.
The rest of the report contains country-specific information.
Countries are grouped by advanced and emerging B2C E-Commerce
markets. Within each group, the countries are presented in the descending
order of B2C E-Commerce sales.
Depending on data availability, the following types of market
information are included: payment methods most used by online shoppers,
breakdown of E-Commerce sales by payment methods, number and value
of online/mobile payment transactions, rankings of online payment
providers, mobile payment usage and consumer awareness of mobile
payment providers. Not all the mentioned types of information are
available for each of the covered countries. For the two leading countries in
the region, also online and mobile payment trends and news about major
players, such as payment providers, banks and retailers are presented on
text charts.
EUROPE ONLINE PAYMENT METHODS: SECOND HALF 2016
9
METHODOLOGY

Global Online Payment Methods: Second Half 2016
Global Mobile Wallets 2017: Competitors and Market Opportunities Methods
Apple Pay Profile 2017
Samsung Pay Profile 2017
Android Pay Profile 2017
January 2017
January 2017
January 2017
January 2017
January 2017
€ 1,950
€ 1,950
€ 450
€ 450
€ 450
Global Mobile Online Payment Methods: First Half 2016
Europe Online Payment Methods: First Half 2016
Global Alternative Online Payment Methods: First Half 2016
Global Online Payment Methods: First Half 2016
Asia-Pacific Online Payment Methods: First Half 2016
Fraud and Security in Global Online Payment 2016
Europe B2C E-Commerce Market 2016
Western Europe B2C E-Commerce Market 2016
Eastern Europe B2C E-Commerce Market 2015
Turkey B2C E-Commerce Market 2016
Russia B2C E-Commerce Market 2015
October 2016
October 2016
September 2016
September 2016
September 2016
October 2016
February 2016
February 2016
January 2016
April 2016
December 2015
€ 950
€ 950
€ 950
€ 1,950
€ 750
€ 950
€ 1,950
€ 1,950
€ 1,950
€ 950
€ 950
Global E-Commerce Marketplaces 2016
Trends in Worldwide Internet Retail 2016
Global B2C E-Commerce Market 2016
Top Players in Global E-Commerce Market 2016
November 2016
July 2016
June 2016
June 2016
€ 450
€ 1,450
€ 2,950
€ 950
UK B2C E-Commerce Sales Forecasts: 2016 to 2020
Germany B2C E-Commerce Sales Forecasts: 2016 to 2020
Top 5 Country B2C E-Commerce Sales Forecasts: 2016 to 2020
December 2016
December 2016
November 2016
€ 450
€ 450
€ 1,950
Middle East B2C E-Commerce Market 2016 May 2016 € 1,950
Africa B2C E-Commerce Market 2016 May 2016 € 1,950
Latin America B2C E-Commerce Market 2016
North America B2C E-Commerce Market 2015
Asia-Pacific B2C E-Commerce Market 2015
March 2016
November 2015
October 2015
€ 2,950
€ 950
€ 3,450
UPCOMING RELATED REPORTS
REPORT PUBLICATION
DATE
PRICE*
Asia-Pacific Online Payment Methods: Second Half 2016
Global Mobile Payment Methods: Second Half 2016
Europe Online Payment Methods: Full Year 2016
February 2017
February 2017
March 2017
€ 750
€ 950
€ 1,950
EUROPE ONLINE PAYMENT METHODS: SECOND HALF 2016
10
11
12
13
14

15