Embed Size (px)
Citation preview
Sidhiqul Akbar
ROLL NO 39
Contents Statistical package introduction
Statistical Packages
Introduction to SPSS
Features of SPSS
SPSS
EXCEL
Statistical package introduction It is a relatively easy package to learn.
Stata has an easy spreadsheet-style data representation
- Stata keeps good records of your actions.
- It is relatively cheap (both in cost and memory)
Stata license is perpetual – if you buy it, you own it forever.
Statistical packages There are many statistical packages (Stata, SPSS, SAS,
Splus, etc.)
Statistical packages can be used for:
Analysis
Data Manipulation
Data Management
Open source statistical package ADMB– a software suite for non-linear statistical
modeling based on C++ which uses automatic differentiation.
ELKI - a software framework for development of data mining algorithms in Java.
Fityk – nonlinear regression software (GUI and command line)
gretl – gnu regression, econometrics and time-series Library
Open source statistical package Contd. …
JHepWork – Java-based statistical analysis framework for scientists and engineers. It includes an advanced IDE and Jython shell.
Octave – programming language (very similar to Matlab) with statistical features
Mondrian (software) - data analysis tool using interactive statistical graphics with a link to
OpenEpi – A web-based, open source, operating-independent series of programs for use in epidemiology and statistics based on JavaScript and HTML
Public domain statistical packages
Demetra+
CSPro
Epi Info
X-12-ARIMA
BV4.1
GeoDA
MINUIT
Public domain statistical package Winpepi – package of statistical programs for
epidemiologists
ADAPA– batch and real-time scoring of statistical models
Analytica - visual analytics and statistics package
BMDP – general statistics package
CalEst – general statistics and probability package with didactic tutorials
DPS – comprehensive statistics package

Introduction to SPSS SPSS (Statistical Package for the Social Sciences) is
a statistical analysis and data management software package. SPSS can take data from almost any type of file and use them to generate tabulated reports, charts, and plots of distributions and trends, descriptive statistics, and conduct complex statistical analyses
This package of programs is available for both personal and mainframe computers

Features of SPSS
it is easy to learn and use
It includes full range of data management system and editing tools
it provides in depth statistical capabilities
It offers complete ploting reporting presentation features

SIX DIFFERENT WINDOWS of SPSS
The Data Editor
The Output Navigator
The Pivot Table Editor
The Chart Editor
The Text Output Editor
The Syntax Editor
The Data Editor :The Data Editor is a spreadsheet in which you define your
variables and enter data. Each row corresponds to a case while each column represents a variable.
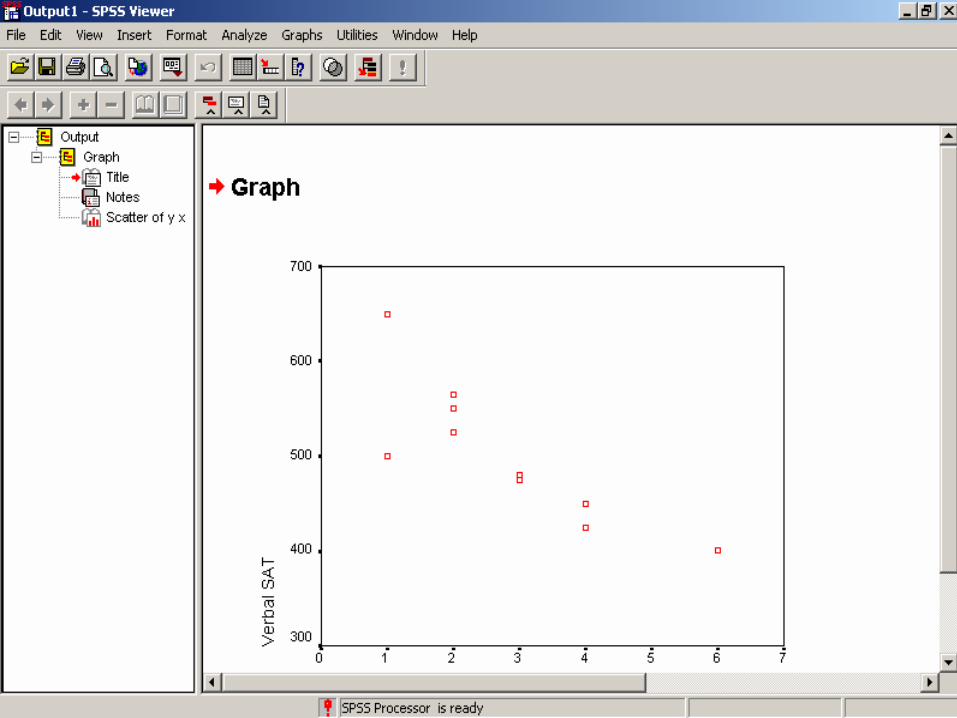
The Output Navigator :The Output Navigator window displays the statistical results,
tables, and charts from the analysis you performed. An Output Navigator window opens automatically when you run a procedure that generates output
. The Pivot Table Editor :
Output displayed in pivot tables can be modified in many ways with the Pivot Table Editor. You can edit text, swap data in rows and columns
The Chart Editor: You can modify and save high-resolution charts
and plots by invoking the Chart Editor
Text Output Editor: Text output not displayed in pivot tables can be
modified with the Text Output Editor. You can edit the output and change font characteristics (type, style, coluor, size).
The Syntax Editor :You can paste your dialog box selections into a
Syntax Editor window, where your selections appear in the form of command syntax.
AdvantagesSPSS offers a user friendliness that most packages are
only now catching up to
GUI based program
Quick descriptive statistics capability
Most popular package in the social sciences
Good for cluster analysis
Runs on Windows, Linux, and Macintosh operating systems
DisadvantagesRequires annual license
Limited statistical procedures vs R or SAS
Some procedures require purchase of add-on modules
WELCOME TO SPSS
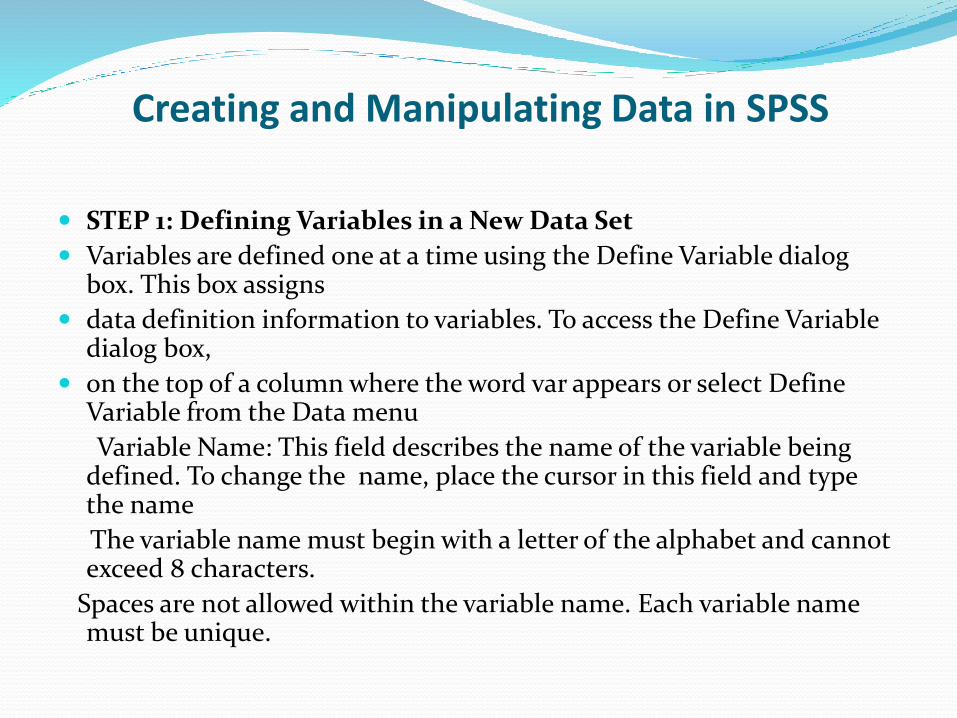
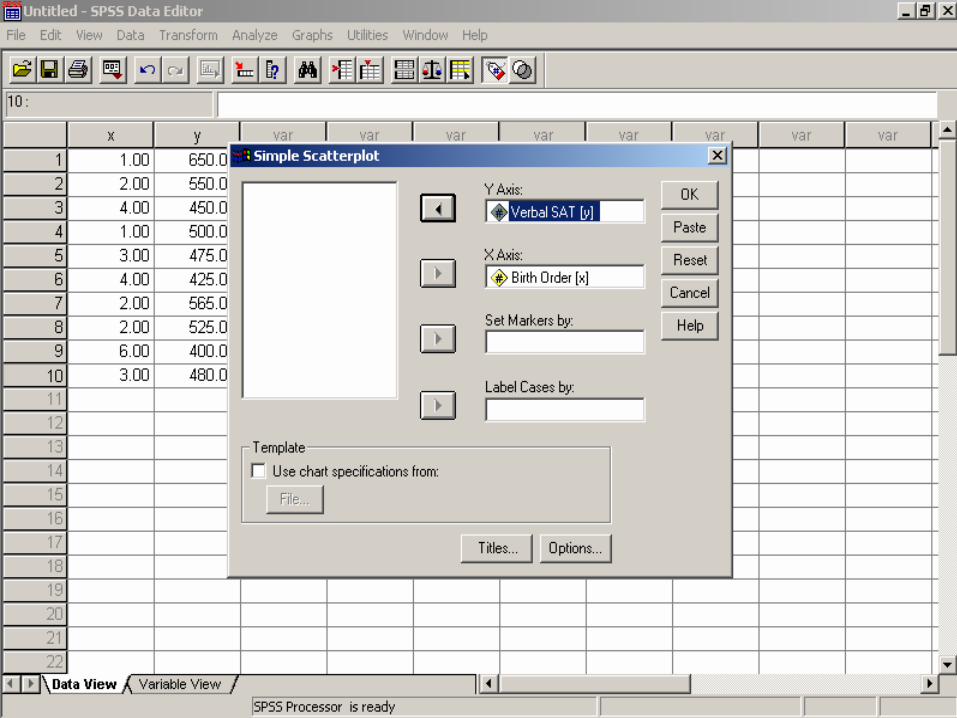
Creating and Manipulating Data in SPSS
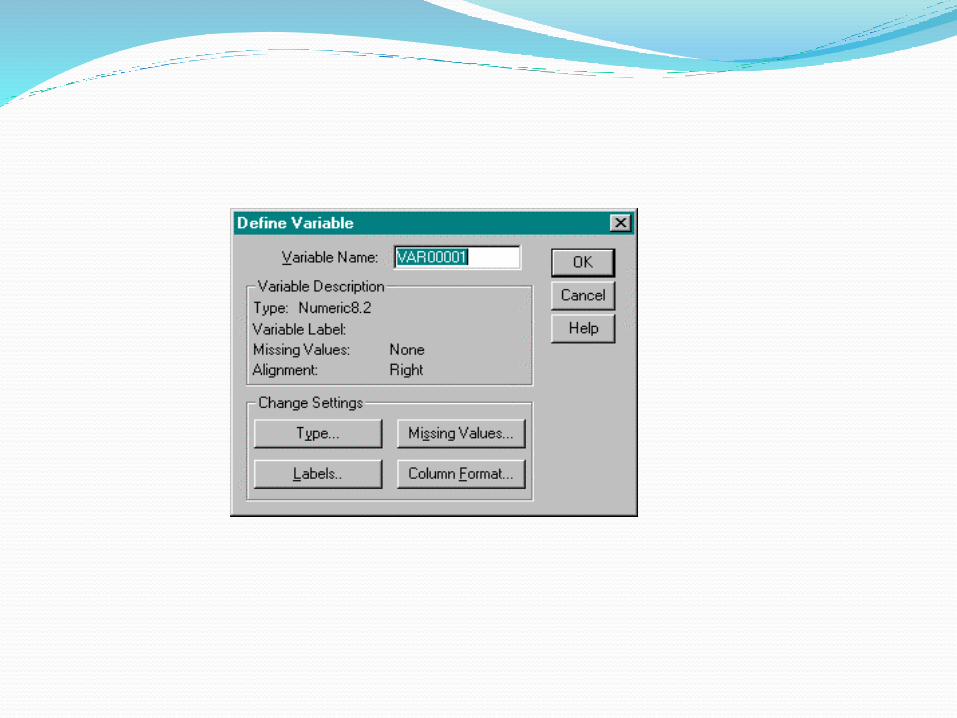
STEP 1: Defining Variables in a New Data Set
Variables are defined one at a time using the Define Variable dialog box. This box assigns
data definition information to variables. To access the Define Variable dialog box,
on the top of a column where the word var appears or select Define Variable from the Data menu
Variable Name: This field describes the name of the variable being defined. To change the name, place the cursor in this field and type the name
The variable name must begin with a letter of the alphabet and cannot exceed 8 characters.
Spaces are not allowed within the variable name. Each variable name must be unique.


Thank you