Embed Size (px)
Citation preview

March 12, 2015
Presenters: Jami Marler, Director of Product Management for Ecova and Dennis Calik, SVP and Corporate Properties Manager for National Bank of Arizona
National Bank Of Arizona Makes Their Utility Bill Data Work for Them and You Can Too!

Controlling Energy Spend is a Top Priority How do you Plan to use Utility Data?
58%
55%
43%
Tracking energy spend as a line item
Researching sites that exceeded prior trends
Preparing data-driven budgets and forecasts
Tracking energy spend as a line item
Researching sites that exceeded prior trends
Preparing data-driven budgets and forecasts

Agenda
The opportunity
The challenge
The value of good data
National Bank of Arizona case study
Summary
Upcoming webinars
Q&A

Common Savings Found on Invoices

Utilities Rank in Top 3 Operations Expenses Multi-site operators have tremendous challenges and tremendous opportunity

What Data is Driving Your Decisions?

Quality Data Leads to Effective Decisions
Up to 6% percent of invoices are reissued by utilities
Over 9% of utility accounts have missing or late invoices

Good Data Builds a Solid Foundation
Leverage across your organization Track, measure and report
Communicate and share
Gain visibility and drive strategic insights

Once You Have the Good Data - Where is Greatest Opportunity to Save? Understand how you are using energy so you can track and control the resource
Sample: Portfolio Cost Breakdown
Electric $16,372,783
Natural Gas $2,041,782
Water $1,147,506
Other Fuels $483,688
Sewer $75,729
Solid Waste $53,762
Other Services $45,139
Tax $87

Use Data to Identify Trends & Outliers
Across a Single Site Across a Portfolio of Sites
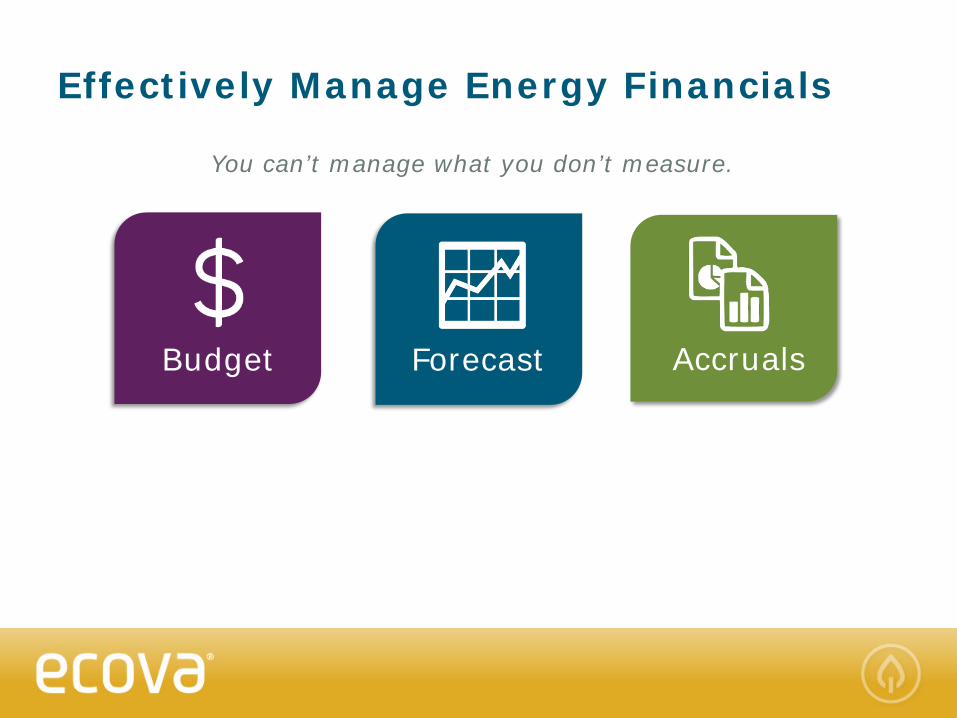
Effectively Manage Energy Financials
Accruals Budget Forecast
You can’t manage what you don’t measure.

National Bank of Arizona
1 of 8 Zion Bancorporation affiliates
Zion Bancorp is one of the 40 largest banking companies in US
Member of S&P 500 and NASDAQ 100 Financial Indices
National Bank of Arizona operates 74 regional branches

The Challenge
Difficulty in recognizing utility spend and consumption rates across the enterprise
Inability to control costs
No process for anomaly identification and laborious anomaly resolution
Budget forecasting was cumbersome
Administrative burden in handling all invoices

From ‘Unmeasured’ to Fully Managed
Gather usage and expenditure data
across portfolio A valuable tool to develop a baseline Month-over-month, year-over-year
trends analysis Visibility into consumption trends Foundation for comprehensive and
proactive energy management strategy
Summary billing Provides alerts for abnormal
consumption

Data Driven Decisions
Where would I start to make my improvements?
What changes would I make first?
Determine the ROI
How much could I afford each year?
How long would it take?

Improved Financial Management
~800 invoices per month plus cost to pay
Reduced demand on staff
Improve data to support annual budget planning
Inform capital expenditures

Taking Energy Savings to the Bank
$600k pure savings across 74 locations
– 2008 consumption rate vs. 2014 expense rate
97% of sites managed by Energy Management Systems (EMS)
EMS accelerate savings and standardize operations
– Make your buildings ‘go to sleep’ with lighting schedules
– Maintain comfort and control costs with temperature set points
0
2,000,000
4,000,000
6,000,000
8,000,000
10,000,000
12,000,000
14,000,000
2008 2010 2012 2013 2014
Annual Consumption kWh

Summary

THE ECOVA WASTE PLATFORM
Waste Solutions: Data Transparency and Cost Savings – Wednesday, March 25th at 11am PST
INSIDE ENERGY & SUSTAINABILITY SERIES
5 Best Practices for Utility Budgets – Thursday, April 9th at 11am PST
Upcoming Webinars
Questions, comments, suggestions? [email protected]

Q&A

Thank you!