Embed Size (px)
Citation preview

1
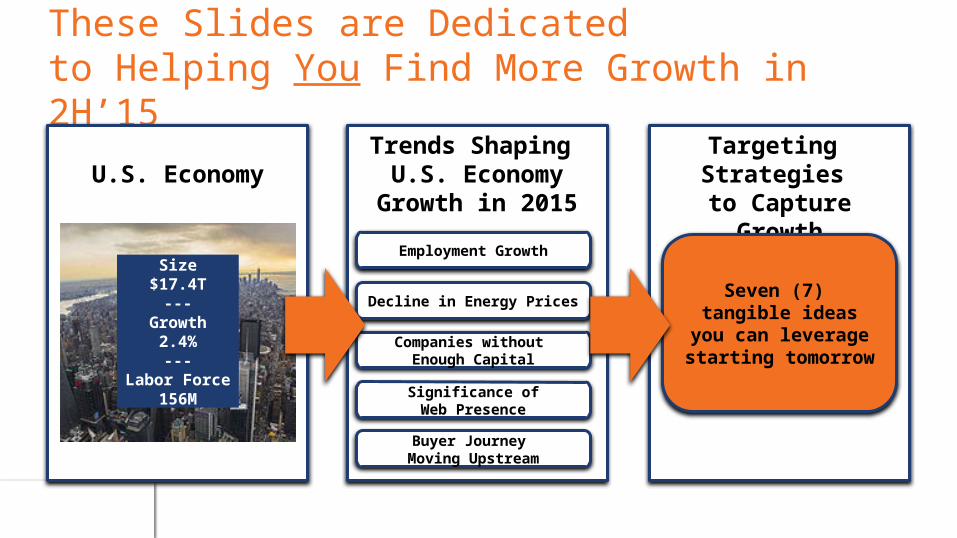
These Slides are Dedicatedto Helping You Find More Growth in 2H’15
U.S. EconomyTrends Shaping U.S. Economy
Growth in 2015
Targeting Strategies to Capture
GrowthSize
$17.4T---
Growth2.4%
---Labor Force
156M
Employment Growth
Decline in Energy Prices
Companies without Enough Capital
Significance ofWeb Presence
Buyer Journey Moving Upstream
Seven (7) tangible ideas
you can leveragestarting tomorrow

Growth Requires Understanding atNext Level of Detail▶ Our customers seek to grow faster than the market
• Forecasters estimate the U.S. economy will grow 300 basis points in 2015o 60 basis point rise from 2014 (actual) growth rateo 40 basis points below the forecast six months earlier
▶ To do this, they must “de-average” their views• U.S. economic growth is accomplished through divergent growth rates
among industries and regionso Most “growth industries” (e.g., high-tech, biotech) include sub-industries or segments that are
not growing at allo Moreover, the highest-growing “sub-industries” (e.g., P2P lending $2.2B @ 40,000 bps, tele-
health $2.6B @ 35,000 bps) fall under industries that are far lower-growth
• Executives seek to “de-average” their view of markets• An essential element of strategic and financial planning is taking closer
account of critical trends and risks – with sensitivity to key macroeconomic indicators, government policy responses, and firm-level signals

RecommendationsAre Based on “Trends” and “Spends”
We Look at TRENDS
that Impact Businesses
We Compare TREND
toACTUAL SPEND
for $20B+ Revenue from 30,000+
100-1,000 Employee
Companies
We Outline What “Factors” Suggest
a Business will CHANGE ITS
ACTUAL SPEND based on TRENDS
in the economy

Trend #1: Job GrowthBut few companies are doing all the hiring

U.S. Employment is Rising in Aggregate
1 4 7 10 13 16 19 22 25 28 31 34 37 40 43 46 49 52 55 58 61 64 67 70 73 76 79 82 85 88 91128000
130000
132000
134000
136000
138000
140000
Tota
l pay
rolls
(mill
ions
)
May 2014
May 2014 marked a turning point in the labor market – as all private non-farm jobs lost since the beginning of the ‘08 crisis were reclaimed
Source: U.S. Bureau of Labor Statistics

However, U.S. Employment Has Returnedin Different Ways
Smaller companies (<499 employees) employ more people than in 2008,
while larger companies (1,000+ employees) employ fewer people than 2008
Source: U.S. Bureau of Labor Statistics, ADP
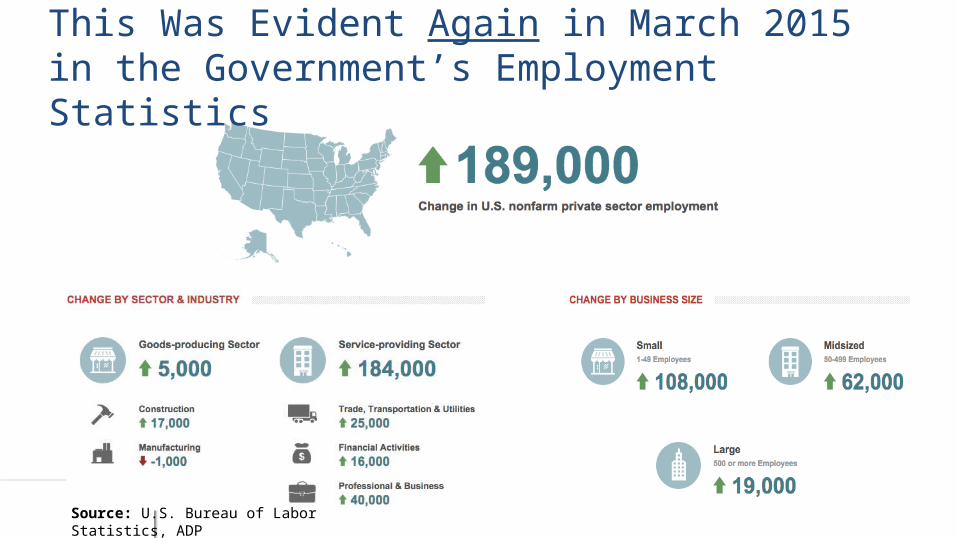
This Was Evident Again in March 2015in the Government’s Employment Statistics
Source: U.S. Bureau of Labor Statistics, ADP

This Was Evident Again in March 2015in the Government’s Employment Statistics
Source: U.S. Bureau of Labor Statistics, ADP
If It Is Not the F500, then Who Are the Companies Adding All of the Jobs?

Employment Growth Comes in Three (3) Forms
Mom & Pop…& Friend
Add Some Extra Help
Growth Stories
1
2
3

Real Employment Growth Comes from Very Few Companies
Among 100-1,000 person companies, less than 10% of companies expanded at >5%
Share of Companies
Share of Employment
Growth
-25
0
25
50
75
100
20%+ Employment Growth
5%-20% Employment Growth
<5% Employment Growth
No Employment Growth
Negative Employment Growth
Perc
en
t of
Tota
l
Source: U.S. Bureau of Labor Statistics
While the economy is
growing at ~3%, a small number of
companies are responsible
for the growth

Real Employment Growth Comes from Very Few Companies
These 10% of companies are responsiblefor 75% of the new jobs
Source: U.S. Bureau of Labor Statistics
Share of Companies
Share of Employment
Growth
-25
0
25
50
75
100
20%+ Employment Growth
5%-20% Employment Growth
<5% Employment Growth
No Employment Growth
Negative Employment Growth
Perc
en
t of
Tota
l
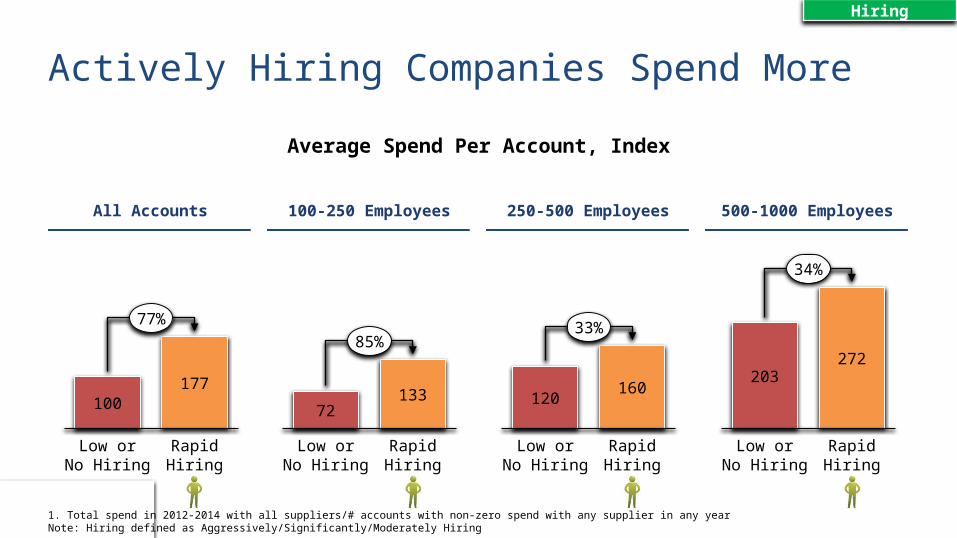
Actively Hiring Companies Spend More
Hiring
Average Spend Per Account, Index
1. Total spend in 2012-2014 with all suppliers/# accounts with non-zero spend with any supplier in any yearNote: Hiring defined as Aggressively/Significantly/Moderately Hiring
All AccountsAll Accounts 250-500 Employees250-500 Employees100-250 Employees100-250 Employees500-1000
Employees500-1000
Employees
Low orNo Hiring
RapidHiring
100
77%
177
Low orNo Hiring
RapidHiring
72
85%
133
Low orNo Hiring
RapidHiring
120
33%
160
Low orNo Hiring
RapidHiring
203
34%
272

Actively Hiring Companies Spend More
Hiring
Average Spend Per Account, Index
1. All accounts (100-1000 employees)
20132012 2014
100
219
106
213
113
205
Not Hiring Hiring
20132012 2014
100117
102 112102111
20132012 2014
100
142
102
194
108
160
Example AHigh-Tech Company
Example BBiz Services Company
Example CBiz Services Company

Implications for Targeting1. Apply Sales & Marketing Activity to “Growth
Companies”• Buy lists against “growth companies”• Acquire contacts from “growth companies”• Create acquisition plays against “growth companies”• Score leads highest when they come from “growth
companies”
2. When Engaging, Emphasize “Infrastructure” – as Growth Spend is Disproportionately Biased Towards These Categories• In high-tech, emphasize client system, server, and other fleet
buys• In business services, emphasize furniture, facilities and other
infrastructure areas

Trend #2: Decline in Energy PricesCapture growth driven by increased consumer spend

Energy Created 25% of New Jobs in 2014
The Energy Sector Has Been a Bright Spot
CleanTech Created Lots of High-Paying Jobs in
2014
Metro Area
New Clean Tech Jobs, 2011-2014
1. Albany-Schenectady-Troy, N.Y. 10,0922. Knoxville, Tenn. 8,1843. San Francisco-Oakland-Fremont, Calif. 13,9174. San Jose-Sunnyvale-Santa Clara, Calif. 6,1925. Greenville-Mauldin-Easley, S.C. 3,7236. Kansas City, Mo.-Kansas 3,9327. Toledo, Ohio 2,1758. Chicago-Joliet-Naperville, Ill.-Ind.-Wis. 7,6429. Charlotte-Gastonia-Rock Hill, N.C.-S.C. 2,30910.Cleveland-Elyria-Mentor, Ohio 2,396
Median Wage
Lots of Jobs
Clean Tech ($54K)
All Other ($38K)
Shale Exploration
Energy& Texas
Oil ExportsPort of Houston
becomes #1 export market (was NYC)
Source: Wall Street Journal, Bloomberg, Dallas Federal Reserve Bank

Most Lattice Customers Captured Significant ‘10-’14 Growth from This Segment
Manufacturing
Healthcare
Prof Services
Energy
0 20 40 60 80 100 120
Source: Lattice Customer Data
Growth Index

However, Energy Prices are Declining Globally
Crude Oil Prices 2002-2014, $ per Barrel
0
20
40
60
80
100
120
140
160
2002 20082004 2006 2010 20142012
Brent - Europe
West Texas Intermediate
Source: Bloomberg
Crude Oil Prices 2014 by Month, $ per Barrel

Job Cutsby Industry
Job Cutsby State
As a Contrast to 2014, In 2015 The Energy Industry Is Reducing Employment
Source: Bloomberg

In 2015, Companies Should ConsiderTargeting Strategies for Other Industries▶ Peer-to-Peer Lending Platforms
• 2014 industry revenue: $2.5B• Projected revenue growth (2014-15): >40
percent• Why: Small businesses and consumers are
expected to continue pursuing loans from non-traditional sources as prime interest rate increase.
▶ Medical Marijuana Stores• 2014 industry revenue: $2.6B• Projected revenue growth (2014-15): >40
percent• Why: Growth due to aging population and
growing acceptance of products as treatments for chronic illnesses.
▶ Tele-health Services• 2014 industry revenue: $1.8B• Projected revenue growth (2014-15): >50
percent• Why: Affordable Care Act and other legislation is
expected to raise federal support for tele-health services, helping industry revenue grow
▶ Motion Capture Software• 2014 industry revenue: $1.8 billion• Projected revenue growth (2014-15): >60
percent• Why: Desire for automation in manufacturing
and media industries drives demand for software and components to detect signals
▶ Manufacturing: Silicon• 2014 industry revenue: $4.8 billion• Projected revenue growth (2014-15): >30
percent• Why: Maximum capacity led to rise in prices in
2014; new capacity comes online in 2015 to address appetite from solar and health industries
▶ Manufacturing: Medical Devices• 2014 industry revenue: $15.8 billion• Projected revenue growth (2014-15): >15
percent• Why: Weakening dollar, combined with lower
excise taxes from EU countries, from UK, and from India create expanding market for U.S. production
Source: Economist

Implications for Targeting
3. Create Sector-Specific Target Campaigns• Determine likely needs by industry (e.g., MedDevice needs
high-performance client systems, P2P needs cloud-based IT solutions, tele-health needs access to high-performance servers)
• Create need-aligned plays
4. Expand Customer Database• These industries have thousands of new companies in the past
two years – leading many Lattice customers to find these companies systematically under-represented in database
• Expand database to add new entrants demonstrating high-growth characteristics

Trend #3: Growing Companies Need CapitalFinancing the right companies will drive further growth

Mid-Market and Small Businesses Incurred Most of Job Losses in ’08-’09 Recession
Source: U.S. Bureau of Labor Statistics

Federal Government Programs ‘09-’13 Pushed $300B of Capital to This Sector

However, Segment Sees Less Capital Due to Lending Standards + Reduced Loan Profitability
1995 2000 2005 2010 20120%
10%
20%
30%
40%
50%
60%
0
200
400
600
800
1000
1200
1400
Small Business Share of Commercial LoansCommerical Loan Balance
Small Business Share of Loans at Banks (%) vs. Total Outstanding Commercial Loans ($ Billions)
Mid-Sized and Small BusinessShare of Commercial Loans
Source: Federal Deposit Insurance Corporation
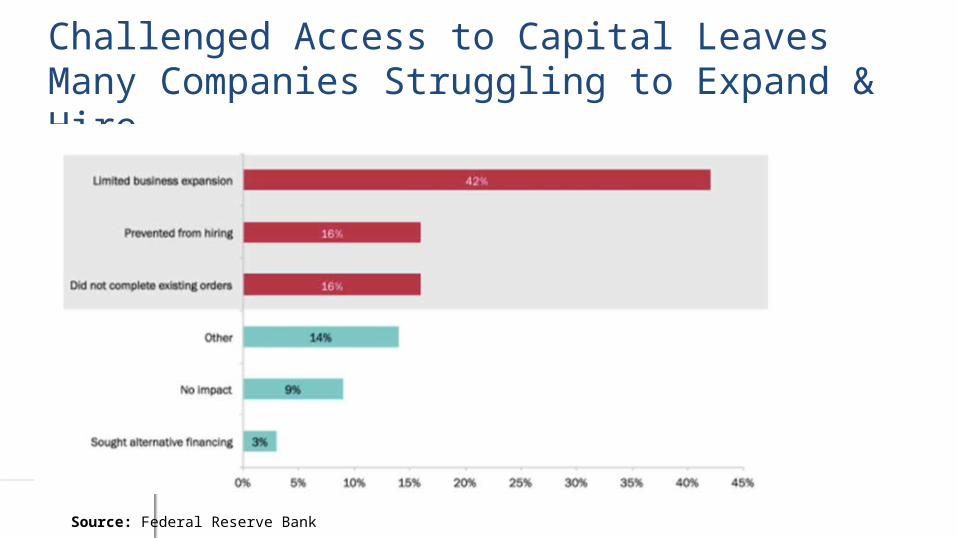
Challenged Access to Capital Leaves Many Companies Struggling to Expand & Hire
Source: Federal Reserve Bank

Companies With Access to Capital Spend More
Funding
Average Spend Per Account, Index
1. Total spend in 2012-2014 with all suppliers/# accounts with non-zero spend with any supplier in any year
All AccountsAll Accounts 250-500 Employees250-500 Employees100-250 Employees100-250 Employees500-1000
Employees500-1000
Employees
No Fundingin 2011-14
Fundingin 2011-14
100
514%
614
No Fundingin 2011-14
Fundingin 2011-14
70
735%
585
No Fundingin 2011-14
Fundingin 2011-14
109
620%
785
No Fundingin 2011-14
Fundingin 2011-14
198
141%
478

High-Quality Companies Promise Growth – But May Need Additional Capital
Source: Lattice Data Cloud; Lattice Customer Data
High-Quality CreditGrowth Signals
No Recent Capital Expansion
Average CreditNo Growth Signals
No Recent Capital Expansion
High-Quality CreditGrowth Signals
Recent Capital Expansion
Change in Spend ‘13 vs. ‘14Segment: 100-250 EmployeesIndustry: All
100
185
380
These companies may be natural candidates
for you to extend financing as part of
outreach

Implications for Targeting
5. Create “Finance + Product” Campaigns• Key criteria
o Growth signalso Strong credito No external capital
• Plays will involve selling product and credit• Best-practice is to complement with email campaign
6. Expand Customer Database• Expand database to add new companies that meet “fit” criteria
and have these characteristics

Drag picture to placeholder or click icon to add
Trend #4: Significance of Web

Shift Towards E-Commerce Creating Lift for Thousands of Mid-Sized Companies
+$40B in annual
revenues per year
Source: US Census Bureau

One Lattice Customer Places “Cold Calls” Based on This – and Has Great Results
Source: Lattice Analysis
$50M - $100M RetailersQ4’14
Other LeadsLattice-Scored
High-Growth Accounts
+40%

Companies With More Intensive Web Traffic Spend More
Average Spend Per Account, Index
1. Total spend in 2012-2014 with all suppliers/# accounts with non-zero spend with any supplier in any year
All AccountsAll Accounts 250-500 Employees250-500 Employees100-250 Employees100-250 Employees500-1000
Employees500-1000
Employees
Low Medium High
100
369
203
Low Medium High
78
277158
Low Medium High
134
371
227
Low Medium High
209
529
346
Web Traffic Web Traffic Web Traffic Web Traffic

“Web Traffic” Is At Least As Good of a Spend Predictor as “Emp Count”
High
100-250
Low
Medium
250-500 500-1000
Account Size(# Employees)
Web Traffic Intensity*
203
268
444
100
355
678476
291
173
Average Spend Per Account, Index
1. Total spend in 2012-2014 with all suppliers/# accounts with non-zero spend with any supplier in any year*Based on Alexa rank: High – 1 - 1 600 000, Medium – 1 600 000 - 7 000 000, Low – 7 000 000 +

Implications for Targeting
7. Web Traffic Growth is Indicator of Growth• Develop campaigns focused on companies with rapid growth in
web traffic – REGARDLESS of whether or not e-commerce

Trend #5: Buyer’s Journey Moving Upstream

B2B Buyers Consult Multiple Sources Prior to Purchase
Source: Accenture

Buyers Prefer to Do More & MoreResearch on Their Own
Source: Accenture

67% Of the buyer’s journey may happen online…before they reach you
Access to holistic intent data may indicate early buying signals before the buyer even knows they are in the market to purchase.
Kerry Cunningham
Much Decision-Making May Be CompleteBefore They Engage Your Reps
Source: SiriusDecisions

We Are Experimenting with “Intent Data” to Track Customers’ Web Activity
1Billion+ interactions per month
2000+ topics of interest
1000s of publishers

Five Use Cases Are Targeted with Intent Data
Find companies most likely to buy
Find your most sales-ready leads
ACCOUNT PRIORITIZATION
LEAD PRIORITIZATION
2
3
4
Find customers most likely to buy more
CROSS-SELL/ UP-SELL5
RETENTION Find customers most likely to churn
PROSPECT DISCOVERY1
Find net new prospects

Implications for Targeting
8. (Future) Leverage Customer Intent Data• Lattice has access to data that captures customer web searches
and content consumption for 2,000+ topics• The above can be used in a variety of ways
o Source new accountso Score leadso Find cross-sell opportunities
• Lattice can explain how to become a beta customer for this new offering