Embed Size (px)
Citation preview
Sponsored by: 1
Sponsored by:
Mobile app Use and Abandonment Global Survey of Mobile app Users
January 2015

2
Executive Summary
Users are reaching for mobile devices numerous times everyday
to use mobile apps. These users shared that peer reviews and
ratings significantly affect their app choices. App stability and
performance heavily define the user experience and overall
satisfaction. Yet this study finds that users are experiencing
severe app performance issues regularly. Importantly, apps that
exhibit these issues are quickly abandoned after just a few
occurrences.
For companies who create mobile apps, while good
performance can lead to app downloads and satisfied
users, poor performance will result in quick app
abandonment and brand tarnishment.
Sponsored by:

Sponsored by: 3 3
Key Findings
• 80% Use mobile apps up to 15 times a day
• 34% Choose apps based on peer feedback
• 96% State app performance is important
• 49% Expect apps to respond in 2 seconds or less
• 29% Experience app Issues weekly
• 80% Indicated they will attempt to use a problematic
app three times or less

Sponsored by: 4
METHODOLOGY AND PARTICIPANTS

Sponsored by: 5 5
Research Goal The primary research goal was to capture hard data
on the key factors that determine end user
satisfaction with mobile apps. In addition, research
sought to determine what users did when they were
unsatisfied with a mobile app.
Goals and Methodology
Methodology Mobile devices users in North America and Europe
were invited to participate in a survey on the topic of
mobile apps. The survey was administered
electronically and participants were offered a token
compensation for their participation.
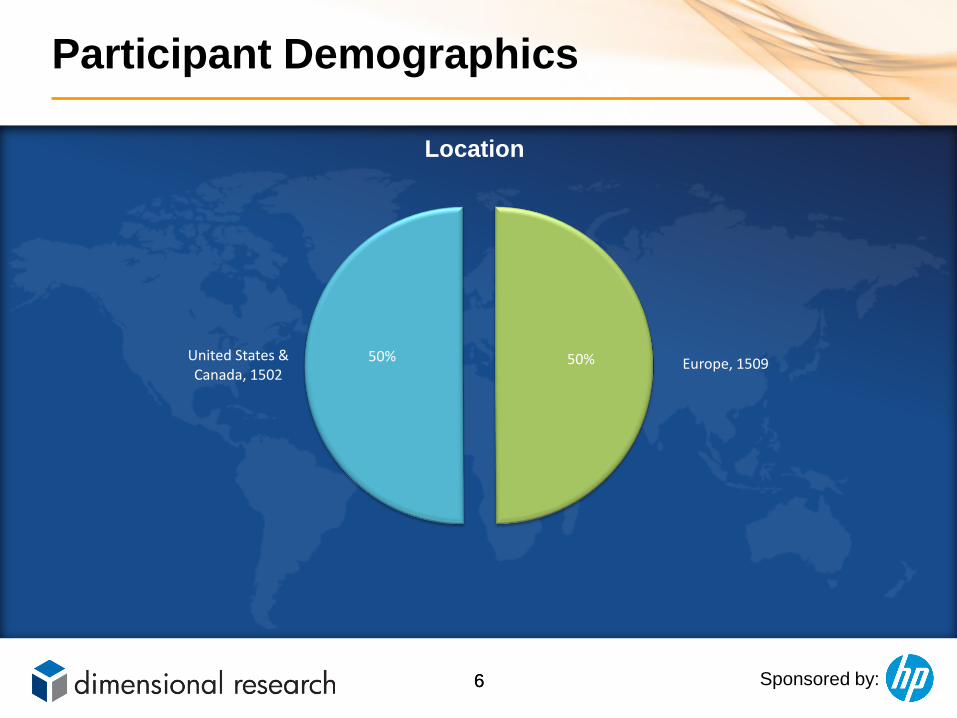
Participants A total of 3011 participants that use mobile apps completed the global survey including those in Belgium, Canada, France, Germany, Netherlands, United Kingdom, and United States.
Sponsored by: 6 6
Participant Demographics
Location
United States & Canada, 1502
Europe, 1509 50% 50%

Sponsored by: 7
DETAILED FINDINGS
Research Note
Detailed analysis was performed to compare findings from North
America with those from Europe. No statistically relevant difference
was found. Hence the mobile device users in EMEA provided the
same information as those in North America.

Sponsored by: 8
Approximately how many times each day do you use a mobile device
in order to use mobile apps?
80% Use Mobile Apps Up to 15 times a Day
80%
18%
2%
0%
10%
20%
30%
40%
50%
60%
70%
80%
90%
1 – 15 15 – 50 More than 50

Sponsored by: 9
When choosing a mobile app, which of the following most influences
the app you pick?
34% Choose Apps Based on Peer Feedback
Star rating and user reviews
34%
Promised functionality (what the app is supposed
to do) 34%
Price 29%
Number indicating how many times
an app has been downloaded
3%

Sponsored by: 10
How important is the speed and responsiveness of mobile apps?
96% State App Performance is Important
21% 55% 20% 3% 1%
0% 10% 20% 30% 40% 50% 60% 70% 80% 90% 100%
Critically important
Very important
Important
Somewhat important
Unimportant

Sponsored by: 11
In your opinion, how fast should an app respond?
49% Expect an App to Respond in Two Seconds or Less, Setting a New Benchmark
7%
14%
28%
23%
19%
9%
0%
5%
10%
15%
20%
25%
30%
Less than a second 1 second 2 seconds 3 seconds 4 seconds More than 4 seconds

Sponsored by: 12
On average how often do you experience issues with mobile apps?
29% Experience App Issues Weekly
Never 30%
Multiple times a year 22%
Multiple times a month 19%
Multiple times a week 17%
Multiple times a day 12%

Sponsored by: 13
Over the last six months, have you experienced a mobile app that
crashed, stopped responding or had errors?
53% of Users Experienced Severe App Issues Over the Last Six Months
Yes 53%
No 47%

Sponsored by: 14
When mobile app issues arise, what do you think is the cause? Select all that apply.
55% Hold the App Responsible for Performance Issues
29%
13%
18%
22%
55%
0% 10% 20% 30% 40% 50% 60%
I really don’t know
The phone or tablet
The phone or tablet operating system (i.e. iOS, Android,Windows)
The mobile network
The app itself

Sponsored by: 15
What have you done when you experienced a mobile app that
regularly ran slowly? Select all that apply.
Overwhelmingly, Users Abandon Slow Performing Apps
16%
4%
6%
7%
30%
32%
33%
37%
48%
0% 5% 10% 15% 20% 25% 30% 35% 40% 45% 50%
Nothing, I still use the app
Other
Wrote a bad review
Gave negative ‘star’ ratings
Used the app less frequently
Looked for an alternative app
Stopped using the app
Checked for an app update
Uninstalled or removed the app

Sponsored by: 16
What have you done when you experienced a mobile app that
regularly crashed, stopped responding or had errors? Select all that apply.
Severe App Issues Drive Users Away
14%
4%
7%
8%
21%
28%
34%
37%
53%
0% 10% 20% 30% 40% 50% 60%
Nothing, I still use the app
Other
Wrote a bad review
Gave negative ‘star’ ratings
Used the app less frequently
Looked for an alternative app
Checked for an app update
Stopped using the app
Uninstalled or removed the app
Sponsored by: 17
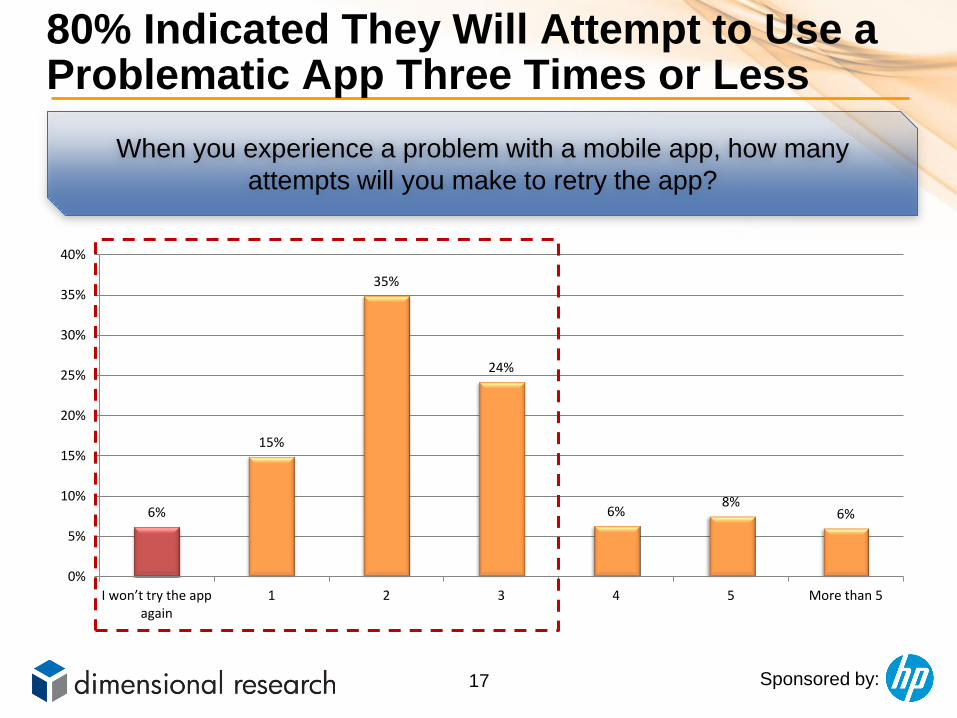
When you experience a problem with a mobile app, how many
attempts will you make to retry the app?
80% Indicated They Will Attempt to Use a Problematic App Three Times or Less
6%
15%
35%
24%
6% 8%
6%
0%
5%
10%
15%
20%
25%
30%
35%
40%
I won’t try the app again
1 2 3 4 5 More than 5

Sponsored by: 18
Have any of these issues ever caused you to stop using a mobile app? Select all that apply.
36% Stopped Using an App Because of Battery Consumption
54%
20%
36%
0% 10% 20% 30% 40% 50% 60%
None of these issues caused me to stop using an app
Heavy cellular data usage
Heavy battery usage

Sponsored by: 19
Have any of these issues caused you to have a lower opinion of the
company who created the mobile app? Choose all that apply.
App Performance and Stability Issues Erode Brands
31%
1%
15%
16%
17%
17%
25%
25%
28%
36%
37%
0% 5% 10% 15% 20% 25% 30% 35% 40%
No issues change my opinion of the company
Other
Heavy cellular data usage
Missing features
Consumes significant device storage
Low user reviews
Heavy battery usage
Price
Difficult to use app
Slow performance
Frequent crashes or freezes

Sponsored by: 20 20
For more information…
About Dimensional Research
Dimensional Research provides practical marketing research to help technology companies make smarter business decisions. Our researchers are experts in technology and understand how corporate IT organizations operate. Our qualitative research services deliver a clear understanding of customer and market dynamics.
For more information, visit www.dimensionalresearch.com.
About HP
- Placeholder -
For more information, visit www.hp.com.

Sponsored by: 21
APPENDIX

Sponsored by: 22
What mobile devices do
you frequently use?
Choose all that apply.
Over 90% Use Smart Phones with a Majority on Android Operation Systems
59%
92%
0% 20% 40% 60% 80% 100%
Tablet (i.e. iPad, AndroidTablet, Kindle Fire)
Smart phone (i.e. iPhone,Android Phone,
Blackberry)
What is the primary mobile
device operating system that
you use?
Android 57%
iOS (Apple) 30%
Windows (Microsoft)
10%
Blackberry 2%
Other 1%
Sponsored by: 23
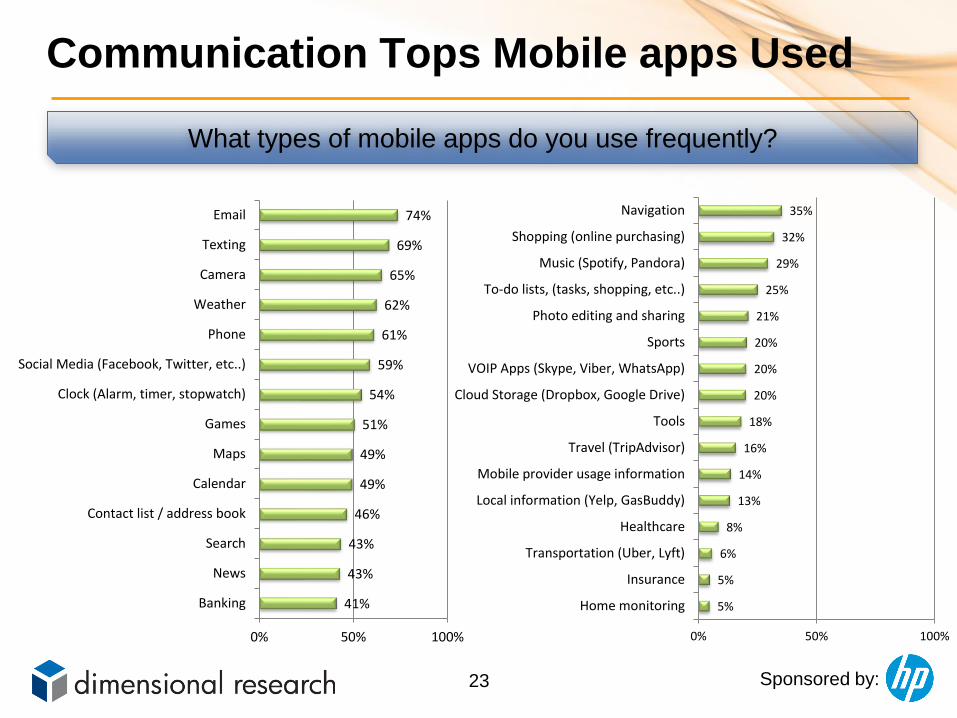
What types of mobile apps do you use frequently?
Communication Tops Mobile apps Used
5%
5%
6%
8%
13%
14%
16%
18%
20%
20%
20%
21%
25%
29%
32%
35%
0% 50% 100%
Home monitoring
Insurance
Transportation (Uber, Lyft)
Healthcare
Local information (Yelp, GasBuddy)
Mobile provider usage information
Travel (TripAdvisor)
Tools
Cloud Storage (Dropbox, Google Drive)
VOIP Apps (Skype, Viber, WhatsApp)
Sports
Photo editing and sharing
To-do lists, (tasks, shopping, etc..)
Music (Spotify, Pandora)
Shopping (online purchasing)
Navigation
41%
43%
43%
46%
49%
49%
51%
54%
59%
61%
62%
65%
69%
74%
0% 50% 100%
Banking
News
Search
Contact list / address book
Calendar
Maps
Games
Clock (Alarm, timer, stopwatch)
Social Media (Facebook, Twitter, etc..)
Phone
Weather
Camera
Texting

Sponsored by: 24
RECOMMEND LEAVING OUT OF PUBLIC REPORT

Sponsored by: 25
Approximately how many different mobile apps do you use in a typical
day?
88% Use Up to 15 Apps Each Day
88%
11%
1% 0%
10%
20%
30%
40%
50%
60%
70%
80%
90%
100%
1 – 15 15 – 30 More than 30

Sponsored by: 26
How long are you willing to wait for a mobile app to load and start?
61% Expect an App to load in Four Seconds or Less
3%
12%
24% 22%
39%
0%
5%
10%
15%
20%
25%
30%
35%
40%
45%
1 second 2 seconds 3 seconds 4 seconds More than 4 seconds
Sponsored by: 27
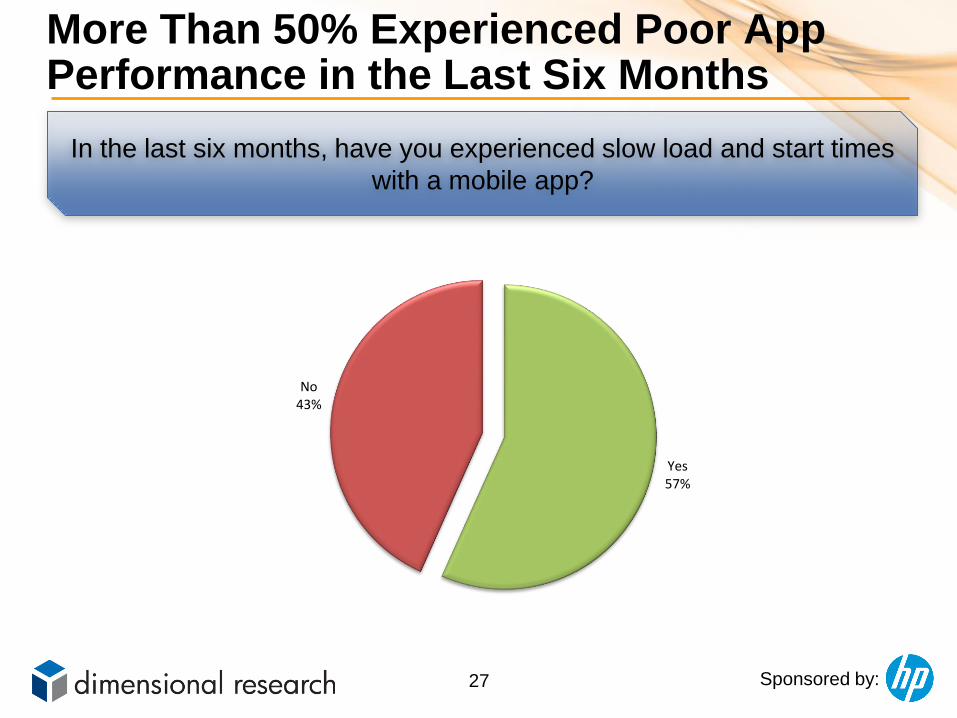
In the last six months, have you experienced slow load and start times
with a mobile app?
More Than 50% Experienced Poor App Performance in the Last Six Months
Yes 57%
No 43%

Sponsored by: 28
In the last six months, have you experienced an app that responded
slowly?
60% Experienced Sluggish Apps in the Last Six Months
Yes 60%
No 40%

Sponsored by: 29
Which of the following are reasons you have stopped using an app? Select all that apply.
Performance Issues Result in App Abandonment
33%
29%
31%
35%
46%
0% 5% 10% 15% 20% 25% 30% 35% 40% 45% 50%
None of these issues caused me to stop using an app
Takes too long to launch the app
The app is too slow to respond to clicks and desired actions
Errors occur when using the app
The app crashes or stops responding


![[Survey] Grab / Uber: Ride share app usage in Vietnam](https://img.dokumen.tips/doc/110x75/5a647bcc7f8b9a7c568b4801/survey-grab-uber-ride-share-app-usage-in-vietnam.jpg)


