Embed Size (px)
Citation preview

Clear direction, focused visionHow do private equity investors create value? A study of 2011–12 North American exits

Contents
Foreword 01
Executive summary 02
Key findings 04
Outlook 14
About the study 15
Contacts 16

01Clear direction, focused vision How do private equity investors create value? A study of 2011–12 North American exits
Foreword
EY is pleased to present its latest study on “How do private equity investors create value?” The North American study, now in its seventh year, builds upon our previous research to demonstrate that private equity (PE) investors continue to successfully create outperformance through strategic and operational improvements.
As optimism about the global economy continues to develop, driven by improved prospects for economic growth (albeit at low rates), corporate earnings and availability of credit, the years 2011 and 2012 have seen exits reach some of their highest levels since our studies began in 2006.
While this has been a great development for PE firms and would seem to set the stage for more exit activity, the results of our study indicate that many firms are using longer hold periods to turn their attention to operational focus and are keen to couple their value-creation techniques with the right timing of the market. PE firms have shifted from their initial focus on cost-cutting to having a more comprehensive tool kit that includes strategic alignment focused on revenue growth, operational improvements and a model of efficiency and standardization.
PE firms are using this tool kit to ensure that their efforts at the outset are disciplined, coordinated and efficient. Using this approach, PEs have been able to identify growth markets and areas for product development, make fundamental operational improvements and ensure all parties work toward a successful exit from the start, all while driving higher returns.
PE’s focus on value creation has solidified its role in generating good returns for the North American-based businesses it backs. As we move into the second half of 2013, we are seeing an improvement in exit markets. PE will make the most of the opportunity to sell high-quality portfolio companies as it swims forward through an uncertain, yet improving environment.
Jeff BunderGlobal Private Equity Leader

02
Executive summary
This is our seventh study examining how private equity (PE) investors create value. Covering the years 2006 through 2012, it charts how much progress PE investors in North American-based businesses have made in adjusting their core model of buying, owning and selling well in the post-financial-crisis period.
Our research points to a shift in focus among North American PE firms. While cost-cutting and value preservation were vital in the immediate aftermath of the financial crisis, PE has taken the last few years to standardize and systematize its approach to transforming the companies it backs to position them well for value-crystallizing exits.
North American PE firms have sharpened their focus on getting the thesis right at the outset of the deal, backing the right management teams and implementing sustainable value creation. Firms are increasingly using operating partners and portfolio management teams, and developing a clear understanding of what buyers will want from the business in the early stage of the deal. All this has required a standardization of PE’s value-creation techniques as enablers for growth, resulting in the expansion into growth markets and areas for product development. Fundamental operational improvements, and ensuring that all parties are aligned and work efficiently toward exit from the start, are key as well.
This process has further strengthened PE’s value-creating capability, enabling it to drive growth in companies through challenging economic conditions. This has, however, led to an increase in holding periods, with 2012 showing the longest hold period (5.1 years) since our studies began. An increased focus on value-creation strategies has created substantial value in PE’s current portfolio, and firms must now find ways of increasing the rate at which it realizes value through exits.
Consistent with prior years, PE continues to outperform comparable public market companies, with PE’s strategic and operational improvements delivering a large share of the returns over the entire study period through earnings before interest, taxes, depreciation and amortization (EBITDA) growth. The results also show that during the recovery era, from 2010 to 2012, EBITDA growth accounted for 70% of PE returns. Multiples, which compressed significantly during the post-crisis years and negatively impacted performance, have rebounded in the recovery period and accounted for 30% of overall PE return.
The results show that during the recovery era, from 2010 to 2012, EBITDA growth accounted for 70% of PE returns.

03Clear direction, focused vision How do private equity investors create value? A study of 2011–12 North American exits
Moreover, we drilled down further to analyze how PE improves the companies it backs. Our analysis of sources of EBITDA growth clearly shows that organic revenue growth has been a vital component but that this has increased markedly in the recovery period. Prior to the recession, organic revenue growth accounted for less than 40% of EBITDA growth in the portfolio. In the years since, however, organic revenue growth has grown to well over half.
We have observed the effort pay off in the last two years. Exits by entry enterprise value (EV) achieved some of their highest levels in 2011 and 2012 since our studies began in 2006, with 2011 the strongest year yet for realizations of large deals. This was driven by a rebound in IPO activity, particularly in 2011, when nearly 70% of the total entry EV of exits were via public listings.
PE secondary sales are increasingly used as an exit alternative. Interestingly, our study found that these deals produced some of the highest returns in the sample, with less variability of outcomes than other exit types. Sales to strategics, however, remain on the low side as corporates have largely been absent from the post-crisis M&A market. No relief in this sense was seen in 2011 or 2012. Creditor exits fell away sharply in 2011 and 2012, following on from the trend in 2010, with the value falling to just 12% of the 2009 peak.
As the signs of improved economic prospects in North America continue to become apparent, PE’s sharpened skills will serve the industry and its portfolio companies well. Fund-raising conditions are starting to improve, with PE providing one of the few sources of outperformance in a slow-growth, low-interest-rate environment. Improving macroeconomic conditions should provide a solid backdrop for deals over the next 12 to 24 months — our findings state that deals executed early in the economic cycle lead to substantially better returns than those acquired at the peak of the market. Deals entered in 2001 and 2002 returned approximately twice those entered in 2007–08. Overall, with strong macro tailwinds, we believe that PE is currently well-positioned to benefit from this positive momentum. In particular, those that have most successfully embedded their value-creation strategies within their organizations will be the ones that realize higher returns most effectively.
5.1 years is the average hold period for exits in 2012

04
Key findings
PE outperforms, driven increasingly by value-creation strategies
Our analysis shows that PE continues to outperform public markets. For exits in the 2006–12 period, PE has outperformed by a factor of 5.4, with PE’s strategic and operational improvement initiatives driving a large proportion of the overall return. Stock market return (a proxy for multiple arbitrage) was a small contributor to the overall returns we tabulated in North America. Overall, stock market returns (those from comparable public companies held over time periods matched to the companies in our sample) accounted for 17% of total PE returns. Additional leverage above and beyond what was typically held by public comparables accounted for 25% of return. The majority, however, was driven by PE strategic and operational improvements, which drove 50% of the total cash return for the companies in our sample.
These findings are in line with studies we have conducted in other regions of the world. In Europe, PE has outperformed public markets by a factor of 3.5 for exits over the eight-year period from 2005–12, with PE’s strategic and operational improvements accounting for the largest component of returns. The same holds true in newer PE markets, too. Our study of value creation in Africa, for example, found that PE value creation generated returns of almost double the Johannesburg Stock Exchange All-Share Index, and in Latin America, PE outperformed the iBovespa index by a factor of 2.4.
Figure 1. PE gross return versus public market, exits 2006–12
0.0
1.0
2.0
3.0
4.0
5.0
6.0
Stock market return Additional leverage PE strategic & operational
improvement
PE outperformance
1.0
1.5
2.9 2.9
1.5
1.0
+5.4

05Clear direction, focused vision How do private equity investors create value? A study of 2011–12 North American exits
Figure 2. Annual EBITDA growth of PE exits vs. public company benchmarks, by exit year range
0
2
4
6
8
10
12
14
16
18
20
2006–07 2010–12
PE exits Public benchmark
5.5%
11.8%10.5%
18.8%
Moreover, annual EBITDA growth in North American PE-backed companies exited between 2006 and 2007 was 18.8%, significantly above the 10.5% rate achieved by comparable public companies. In the years since the downturn, the sample for exits completed between 2010 and 2012 demonstrates the impact the crisis has had: EBITDA growth slowed markedly for both PE-backed companies and the broader population of public comparables. However, despite the more challenging environment, PE-backed companies still managed to outgrow their publicly traded peers by a considerable margin. PE exits over the period grew EBITDA at a rate of 11.8% per year, compared with 5.5% for public comparables.
Based on our research, the PE model of active ownership consistently outperforms on a returns basis through improving the companies it backs and growing EBITDA. The results bear testament to PE’s success in capitalizing on opportunities for growth in its portfolio companies and implementing fundamental operational and strategic improvements.

06
Organic revenue growth the main driver of EBITDA growth
The last few years have been challenging for all businesses as macroeconomic weakness has had an adverse impact on profits growth. Our analysis shows that PE-backed companies have not been immune: EBITDA growth has decreased in the sample, from 18.8% in the pre-crisis years to 11.8% between 2010 and 2012.
However, we have also found strong evidence that PE is increasingly focusing on organic revenue growth as the key means of creating value in the companies it backs. For the entire exit sample in our study, this accounted for nearly half (44%) of all EBITDA growth. But since the crisis, an increasing share of EBITDA growth has been derived from organic revenue growth. Organic revenue growth accounted for just over a third of the EBITDA growth observed in portfolio companies exited in 2006 and 2007; for exits in the years following the financial crisis, organic revenue growth increased proportionally to well over a half of EBITDA growth.
Figure 3. Sources of EBITDA growth (2006–12)
0%
20%
40%
60%
80%
100%
Pre-recession(2006–07)
Post-recession(2008–09)
Recovery(2010–12)
2006–12
Organic revenue growth Bolt-on acquisitions Cost reduction Other
39%
59%45% 44%
26%
26%
34%
20%
13%
23%
26%
30%
5% 5% 1% 4%
This is in contrast to the strategy of cost reduction in portfolio companies. In the pre-crisis years, cost reduction accounted for nearly a third of all EBITDA growth. The post-crisis years have seen this decrease in importance to around a quarter of EBITDA growth. This suggests that PE firms have shifted the emphasis from cost-cutting and efficiency gains implemented in the immediate aftermath of the crisis to more of a growth agenda. They are concentrating their efforts on investing in portfolio companies to support growth in new markets, product lines and business areas through organic growth, but also through add-on acquisitions, with trimming costs a secondary concern.
EBITDA growth has decreased in the sample, from 18.8% in the pre-crisis years to 11.8% between 2010 and 2012.

07Clear direction, focused vision How do private equity investors create value? A study of 2011–12 North American exits
Figure 4. Drivers of organic revenue growth
■ Geographical expansion ■ Price increases ■ Improved selling ■ Change of offering
■ New products ■ Growth in market demand
2007
2008–09 (Recession)
2010–12 (Recovery)
2007–12
12% 10% 32% 10% 8% 28%
22% 4% 13% 13% 14% 34%
41% 5% 12% 24% 17% 1%
26% 6% 18% 17% 13% 20%
In particular, geographic expansion has been a key driver of growth over the last several years, as PE firms push their companies into new markets, both domestic and international. Over the entire 2006–12 study period, geographic expansion has accounted for 26% of total organic revenue growth. In the three years since the recession, however, such expansion has accelerated and now accounts for 41% of total organic EBITDA growth.
While economic conditions have resulted in longer holding periods, PE has used this time wisely. PE’s greater focus on longer-term value-creating strategies will help place portfolio companies in the best position to take advantage of market and economic growth in the post-crisis economy. There is evidence to suggest that PE’s patience may be well-rewarded. Our latest PE Global Capital Confidence Barometer found that PE and corporates are more optimistic about the global economy than six months ago. In April 2013, 55% of PE firms said the global economy is improving, compared with just 23% in October 2012.
In April 2013, 55% of PE firms said the global economy is improving, compared with just 23% in October 2012.*
% of organic revenue growth from geographic expansion (2010–12)
Geographic expansion
26%
41%
% of organic revenue growth from geographic expansion (2006–12)
* Source: PE Global Capital Confidence Barometer, May 2013, EY

08
Value-creation levers are becoming more standardized
PE’s shift toward driving more organic revenue growth has been achieved through an increased standardization of the way in which it manages its portfolio. Value-creation levers have become more systematized as PE firms increasingly look to steer strategies into individual portfolio company situations.
However, there are further improvements to the systems and processes adopted by PE to ensure that all available levers are used for optimal company performance. Our research has shown that firms now use robust monitoring frameworks to ensure all stakeholders are aligned, building on the incentive model that PE’s unique form of active ownership brings. The key areas of strategy, value drivers, governance and risk management are under constant review by PE owners, with scorecard measurement metrics and performance measures now standard practice across the portfolio.
While PE firms have made great strides to standardize, those firms with multiple deal teams still struggle with unifying their best practices. This will remain an area of focus for firms in the future. It is clear that more standardization will lead to more effective leveraging of best practices and more consistent results.
100-day plans
Over the years we have been conducting these studies, we have found evidence of an increasing use of 100-day plans to drive through fundamental changes to companies from day one of an investment. Indeed, our latest PE Global Capital Confidence Barometer demonstrates that these plans are a vital tool in setting portfolio companies on a growth path. It found that the majority of respondents (56%) focused 100-day plans on revenue enhancement initiatives, with 32% saying they used them for cash-generation initiatives. Only 3% of respondents reported not using them.
Operating partners model
Previous studies have also found evidence of PE’s increasing use of operating partners to identify areas for improvement and to support companies through a period of transformation, as well as to strengthen portfolio management teams. These are trends that are set to continue — our most recent analysis shows that, overall, 40% of the deals that we analyzed involved operating partners in some capacity. Often this is to augment management capabilities throughout the holding period, but also to provide specific expertise in areas such as human resources, supply chain or IT infrastructure. Deals that employed operating partners exhibited a modest increase in their average equity multiples compared to those where they were not used. Qualitatively, however, there is a need for operating partners to be present during the entire life cycle of the business. By involving operating partners from the due diligence phase through to the exit phase, PE firms are providing an additional resource to complement their management teams and assist in effectively carrying out key initiatives.
Our recent PE Global Capital Confidence Barometer points to an even greater emphasis on the operating partner model going forward. It found that over three-quarters of PE firms viewed increasing their operating partner and portfolio management resources to boost their sector expertise as an important area of focus. Deploying operating partners and adding to portfolio management teams for functional and regional expertise were not far behind.
56%of respondents focused their 100-day plans on revenue enhancement initiatives
32%of respondents said they used 100-day plans for cash-generation initiativesSource: PE Global Capital Confidence Barometer, May 2013, EY

09Clear direction, focused vision How do private equity investors create value? A study of 2011–12 North American exits
Getting management right
Our findings show that getting the CEO and senior management team right at the outset, versus changing during the investment, translated into better outcomes. It is one of the most critical elements in successfully implementing growth strategies. Those companies achieved almost double the EBITDA growth of other PE-backed companies that had to change management for course correction and benefited from shorter hold periods and better-than-average equity multiple.
In the portfolio companies we studied, the highest EBITDA growth (23.4%) was achieved in companies where the CEO was replaced at the outset of the deal. When PE firms backed the existing CEO throughout the holding period (44%), these companies grew EBITDA by 17% — but, interestingly, with a higher proportion due to organic revenue growth.
Portfolio companies in which the CEO was replaced during PE ownership saw the slowest growth at 8.9%. It also took a significant amount of additional time to get the company back on the right track — hold periods for deals where the CEO changed midstream averaged 4.7 to 5.8 years, markedly longer than the 3.4 years where management was right from the outset.
Anecdotal evidence gathered during the course of our research corroborates these findings. In deals where PE houses misjudged the capability of a CEO or other key member of the management team, respondents repeatedly commented that replacing management swiftly and efficiently was essential to getting a company back on the right track.
As the ability of the management team is such a critical component of PE’s success in value creation, PE investors have become far more systematic in the way they assess management strengths and weaknesses before a deal is completed. They increasingly employ a more rigorous assessment of management and complete comprehensive reference checks as part of the process.

10
2011 and 2012 exits
Our analysis of 2011 and 2012 exits suggests a rebound in exit activity as PE houses have taken advantage of an active IPO market which has provided exits for large PE-backed deals.
In 2011, there were roughly the same number of exits by PE in our sample (95) as in 2010 once creditor exits are removed. The figure for 2012, at 70, was lower, reflecting the higher degree of caution among corporates in their M&A strategies over the year as the global macroeconomic picture became more uncertain. After a strong showing in 2011, with 53 exits to trade buyers, the figure dropped to 28 in 2012.
However, PE is showing good progress in North America in crystallizing value from some of the larger deals in its portfolio. Exits by entry EV soared to their highest in 2011 since our studies began, with 2012 following a similar pattern, albeit with some reduction in overall value.
Figure 5. PE exits by year by exit route
0
10,000
20,000
30,000
40,000
50,000
60,000
70,000
80,000
90,000
100,000
2006 2007 2008 2009 2010 2011 2012
Ent
ry E
V (
US
$m
)
Trade PE IPO Bankruptcy % of IPOs
43%
27%
5%
24%
33%
67%
49%
Creditor exits* fell away sharply in 2011 and 2012, following on from the trend in 2010, with the value falling to just 12% of the 2009 peak.
Creditor exits
2009
2010
2011
2012
* Creditor exits defined as restructurings which occurred during the study period and resulted in a change of ownership from equity holders to debt holders.

11Clear direction, focused vision How do private equity investors create value? A study of 2011–12 North American exits
IPOs dominate larger exits
Overall, exit activity was dominated by IPOs through 2011 and 2012, particularly at the larger end of the entry EV spectrum. IPOs accounted for 33% of the entry EV of exits in 2010, yet in 2011, this had more than doubled to nearly 70%, by far the highest seen in our study period by some margin. In 2012 — arguably a more challenging year for public markets — the percentage remained high at 49%, the second highest in our study period. The findings support the view that the PE model provides flexibility to wait for the right conditions to exit portfolio companies and generate maximum value for investors.
PE buyers were also a good source of exits in 2011 and 2012. Exits via secondary buyouts increased in number to 20 in 2011 and 19 in 2012, the highest numbers observed since 2007. PE buyers (aka secondaries) have become an active source of liquidity — albeit for smaller deals than in the past — with almost 25% of exits through secondaries in 2012, compared with 10% in 2010.
Hold periods continuing to lengthen
Yet even despite the relatively healthy levels of exit activity over 2011 and 2012, hold periods continue to rise. In 2012, companies that were exited had been in the portfolio for an average of 5.1 years, an increase from 2011 and a continuation of an upward trend seen over the last three years. At current run rates, it will take approximately seven years to exit the current PE portfolio. This compares with an estimated 11 years for the current European PE portfolio. Consequently, there exists a well-defined need for an uptick in the pace of PE exits over the next several years.
While longer hold periods will have an inevitable effect on returns, they also point to increased engagement by PE owners in the businesses they back. PE investors have enhanced their value-creation tool kit. This increasingly focused approach naturally takes more time to bear fruit as creating sustainable growth is a longer-term strategy.
Figure 6. Weighted-average hold periods
3
4
5
6
2006–12: 4.2
Exit year
Hol
ding
per
iod
in y
ears
2006 2007 2008 2009 2010 2011 2012
3.4
4.0
3.8
3.2
4.4
4.8
5.1
Overall, exit activity was dominated by IPOs through 2011 and 2012, particularly at the larger end of the entry EV spectrum.
33%2010
70%2011
49%2012
Percentage of annual exit value from IPOs
12
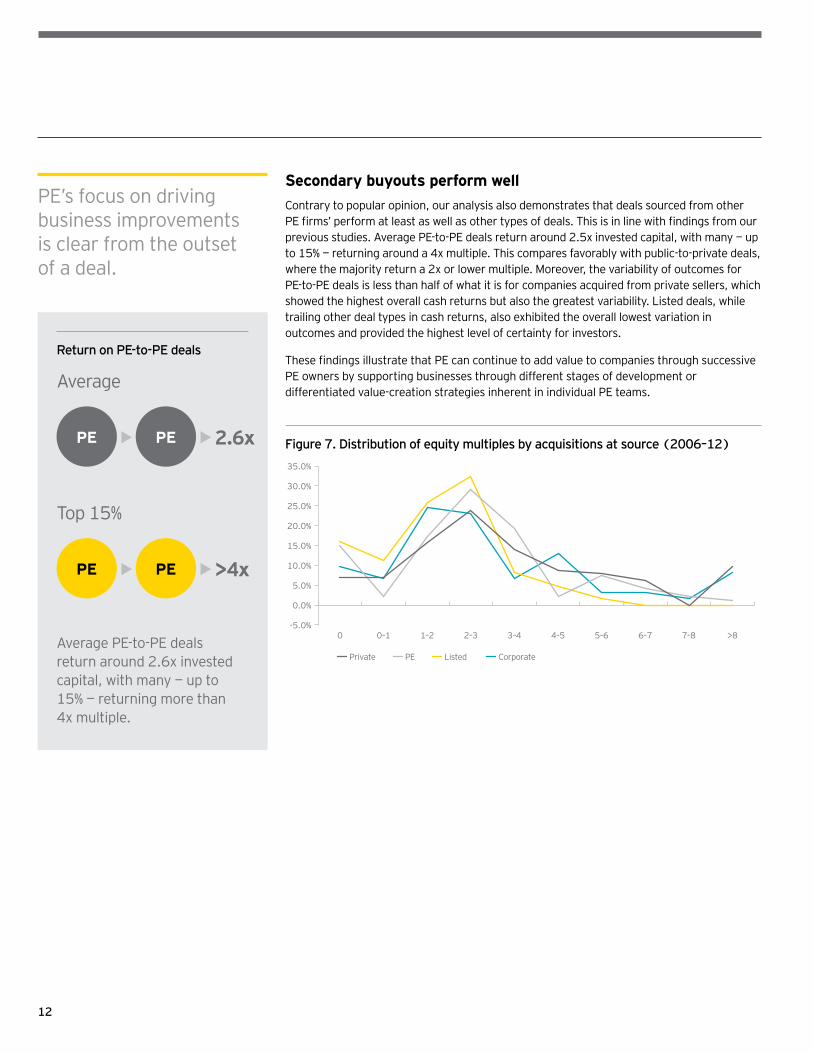
Secondary buyouts perform well
Contrary to popular opinion, our analysis also demonstrates that deals sourced from other PE firms’ perform at least as well as other types of deals. This is in line with findings from our previous studies. Average PE-to-PE deals return around 2.5x invested capital, with many — up to 15% — returning around a 4x multiple. This compares favorably with public-to-private deals, where the majority return a 2x or lower multiple. Moreover, the variability of outcomes for PE-to-PE deals is less than half of what it is for companies acquired from private sellers, which showed the highest overall cash returns but also the greatest variability. Listed deals, while trailing other deal types in cash returns, also exhibited the overall lowest variation in outcomes and provided the highest level of certainty for investors.
These findings illustrate that PE can continue to add value to companies through successive PE owners by supporting businesses through different stages of development or differentiated value-creation strategies inherent in individual PE teams.
Figure 7. Distribution of equity multiples by acquisitions at source (2006–12)
-5.0%
0.0%
5.0%
10.0%
15.0%
20.0%
25.0%
30.0%
35.0%
0 0–1 1–2 2–3 3–4 4–5 5–6 6–7 7–8 >8
Private PE Listed Corporate
Average PE-to-PE deals return around 2.6x invested capital, with many — up to 15% — returning more than 4x multiple.
2.6xPE PE• •
>4xPE PE• •
Average
Top 15%
Return on PE-to-PE deals
PE’s focus on driving business improvements is clear from the outset of a deal.

13Clear direction, focused vision How do private equity investors create value? A study of 2011–12 North American exits
All routes lead to the exit
PE’s increasing standardization of processes is also apparent in planning for exits. Leading practices now include initially focusing on the exit at the time of acquisition and designing long-term value-creation plans to make the business as attractive as possible to potential buyers, many of which will have been identified at the outset. PE is using operating partners as well as management to source and, importantly, to maintain an open dialogue with potential buyers so that acquirers understand the portfolio company well before a sales process is initiated.
PE is also preparing businesses for sale in what has become a more difficult exit market. Our recent PE Global Capital Confidence Barometer found that nearly 80% of firms spent at least six months preparing for exit, and a significant 40% spent up to two years. In addition to running dual-track processes to maintain competitive tension, they are also helping potential trade buyers understand clearly where the value lies for them in portfolio companies by engaging consultants to provide synergy estimates and organizing road shows to meet with possible acquirers.
Overall, our study paints a picture of an industry that, while far from immune to the challenges of a difficult macroeconomic backdrop, has taken time to regroup and develop its skills. Key tenants of success are: buying well with a strong business improvement plan in mind; executing well through the systematization of value-creation levers and building out portfolio management and operational expertise; and then selling well through the early identification of potential buyers and understanding how portfolio companies can best help them achieve their strategies. PE’s response to the crisis and the resulting downturn has been to strengthen its own processes and resources to ensure that its portfolio is in the best possible shape to take advantage of current and future growth opportunities.
PE is preparing businesses effectively for sale
80% Spent at least six months preparing for exit
40% Spent up to two years preparing for exit

14
Outlook
Economic growth has remained subdued over the last few years, and PE and its portfolio companies have not been immune to the challenges presented by a low-growth economy. However, the results of our latest value-creation study have demonstrated that PE remains more than a match for the difficult environment as it has strengthened its capabilities and sharpened its approach to driving growth in the businesses it backs.
Many of these initiatives take time to implement and filter through to the top line. This has had an inevitable effect on holding periods in the North American portfolio, which have continued to lengthen over the last few years in line with other regions. PE is already showing signs of intensifying its focus on exit planning and processes, yet it must find still more creative ways of exiting companies if it is to realize the value in its portfolio for its investors. Clearing the backlog of exits will certainly be one of PE’s top priorities over the coming years.
The M&A market looks set to remain subdued for some time yet as corporates appear reluctant to invest for growth at a time when global economic growth rates are expected to remain at low levels. As a result, PE must continue to demonstrate to potential buyers how its portfolio can benefit and improve their businesses and position them to take advantage of the growth opportunities that do exist.
The reopening of the IPO window should help offset the more difficult M&A market, enabling firms to exit some of the 539 companies with an aggregate entry EV of US$741 billion that remain in our study sample. In addition, sales via secondary buyouts should continue to provide a dependable exit route and should provide a large quantity of high-quality companies for PE buyers. The improved credit markets we are currently witnessing, plus some successful fund-raisings, confirm that the appetite for new deals among PE firms remains healthy.
PE’s more systematic approach to driving growth in portfolio companies should position the business to react to the slowdown seen in some emerging markets over the last year. As corporates become more circumspect about the prospects of some emerging markets, PE continues to expand its investment and has an opportunity to build portfolio companies through add-on acquisitions in what looks set to be a less competitive market.
The outlook for PE fund-raising looks more positive than it has been for some time. There are many indications that limited partners (LPs) are looking to maintain or increase their allocations to PE over the coming 12 months, and many LPs that shied away from PE in 2011 and 2012 appear ready to return. Yet despite their enthusiasm, LPs have become highly selective about the funds they choose to back. Those that can demonstrate that they have the right infrastructure and resources to create lasting value in their portfolio companies and can exit in good times and bad will have a distinct advantage in attracting capital.
Overall, the outlook is positive for the industry, which continues to provide outperformance for its investors through an increasingly standardized model of building and growing portfolio companies to create value. The next few years will likely raise further challenges. But, by remaining focused on building value in its portfolio companies in partnership with management, PE will successfully navigate through the sea of inevitable and constant change.

15Clear direction, focused vision How do private equity investors create value? A study of 2011–12 North American exits
About the study
The 2012 study provides insights into the performance and methods of PE, based on the analysis of the largest North American businesses that PE has owned and exited over the last seven years. To avoid performance bias, and to ensure a focus on the largest businesses owned by PE, exits were screened to capture only those that had an EV at entry of more than US$150m.
This criterion was also applied to our estimate of the current size of the PE portfolio. In total, we have identified 539 exits of businesses that met our criteria over the seven years from 2006 through 2012 — the “population.” Through detailed, confidential interviews and in-depth research using public sources, we obtained performance data for 330 of these businesses, which constitutes our sample. We analyzed business performance for the duration of PE ownership — i.e., from entry to exit — based on key performance measures, including change in EV, profit (defined throughout this report as earnings before interest, tax, depreciation and amortization, or EBITDA), employment, productivity (defined as EBITDA divided by number of employees) and valuation multiple. To better measure aggregate economic impact, we used weighted averages.
Looking across key performance dimensions (e.g., deal size, exit route, incidence of creditor exits), there is no discernible bias in the composition of the sample compared with the whole population. For some of the performance metrics, our sample size is smaller than 330.
EV growth for the different sub-samples in this study
Performance measureSample
sizeEV
growth
Relative returns and portfolio growth by sector, 2005–12 330 15.7%
PE returns compared with the market; Returns from PE relative to stock markets, by entry EV range 254 20.1%
Finally, in order to evaluate the performance of PE-backed businesses against comparable public companies, we have compiled data on public companies by country and sector over the same time period as the PE exits in our sample. The data was then aggregated to compare PE performance with that of public companies.
The ability to incorporate data obtained directly from interviews with top PE investors is an important feature of the study. Another is the scope and depth of our research, with a database of more than 539 North American PE exits. Our study is recognized by many commentators as the authoritative work in this field.
PE’s more systematic approach to driving growth in portfolio companies should stand it in good stead.
539 businesses met our criteria over the seven years from 2006 through 2012.

Contacts
Jeff Bunder
Global Private Equity Leader [email protected]
Michael Rogers
Global Deputy Private Equity Leader [email protected]
Tom Taylor
Principal and Senior Managing Director — Private Equity Value Creation Advisory [email protected]
Giri Varadarajan
Principal and Senior Managing Director — Private Equity Value Creation Advisory [email protected]
Special thanks to:
Philip Bass
Global Client Service Partner [email protected]
Jonathan Shames
Global Client Service Partner [email protected]
Peter Witte
Senior Private Equity Analyst [email protected]
Aman Kaushik
Private Equity Analyst [email protected]
16

Clear direction, focused vision How do private equity investors create value? A study of 2011–12 North American exits

EY | Assurance | Tax | Transactions | Advisory
About EYEY is a global leader in assurance, tax, transaction and advisory services. The insights and quality services we deliver help build trust and confidence in the capital markets and in economies the world over. We develop outstanding leaders who team to deliver on our promises to all of our stakeholders. In so doing, we play a critical role in building a better working world for our people, for our clients and for our communities.
EY refers to the global organization and may refer to one or more of the member firms of Ernst & Young Global Limited, each of which is a separate legal entity. Ernst & Young Global Limited, a UK company limited by guarantee, does not provide services to clients. For more information about our organization, please visit ey.com.
How EY’s Global Private Equity Center can help your business.Value creation goes beyond the private equity investment cycle to portfolio company and fund advice. EY’s Global Private Equity Center offers a tailored approach to the unique needs of private equity funds, their transaction processes, investment stewardship and portfolio companies’ performance. We focus on the market, industry and regulatory issues. If you lead a private equity business, we can help you meet your evolving requirements and those of your portfolio companies from acquisition to exit through a highly integrated global resource of 167,000 professionals across audit, tax, transaction and advisory services. Working together, we can help you meet your goals and compete more effectively.
ey.com/privateequity
© 2013 EYGM Limited. All Rights Reserved.
EYG No. FR0091
ED None
In line with EY’s commitment to minimize its impact on the environment, this document has been printed on paper with a high recycled content.
This material has been prepared for general informational purposes only and is not intended to be relied upon as accounting, tax, or other professional advice. Please refer to your advisors for specific advice.
ey.com