Embed Size (px)
Citation preview

Al Monaco President & CEO
BUSINESS UNIT HEADER IMAGE GOES HERE
2014 Third Quarter Financial & Strategic Update
John Whelen Executive Vice President & CFO
Legal Notice
2
This presentation includes certain forward looking information (FLI) to provide Enbridge shareholders and potential investors with information about Enbridge and management’s assessment of its future plans and operations, which may not be appropriate for other purposes. FLI is typically identified by words such as “anticipate”, “expect”, “project”, “estimate”, “forecast”, “plan”, “intend”, “target”, “believe” and similar words suggesting future outcomes or statements regarding an outlook. Although we believe that our FLI is reasonable based on the information available today and processes used to prepare it, such statements are not guarantees of future performance and you are cautioned against placing undue reliance on FLI. By its nature, FLI involves a variety of assumptions, risks, uncertainties and other factors which may cause actual results, levels of activity and achievements to differ materially from those expressed or implied in our FLI. Material assumptions include assumptions about: the expected supply and demand for crude oil, natural gas and natural gas liquids; prices of crude oil, natural gas and natural gas liquids; expected exchange rates; inflation; interest rates; the availability and price of labour and pipeline construction materials; operational reliability; anticipated in-service dates and weather.
Our FLI is subject to risks and uncertainties pertaining to operating performance, regulatory parameters, weather, economic conditions, exchange rates, interest rates and commodity prices, including but not limited to those discussed more extensively in our filings with Canadian and US securities regulators. The impact of any one risk, uncertainty or factor on any particular FLI is not determinable with certainty as these are interdependent and our future course of action depends on management’s assessment of all information available at the relevant time. Except to the extent required by law, we assume no obligation to publicly update or revise any FLI, whether as a result of new information, future events or otherwise. All FLI in this presentation is expressly qualified in its entirety by these cautionary statements.
This presentation will make reference to non-GAAP measures including adjusted earnings together with respective per share amounts. These measures are not measures that have a standardized meaning prescribed by U.S. GAAP and may not be comparable with similar measures presented by other issuers. Additional information on the Company’s use of non-GAAP measures can be found in Management’s Discussion and Analysis available on the Company’s website.
Agenda
• Third Quarter Highlights
• Capital Investment Plan (2014 – 2018)
• Major Projects Update
• Q3 Financial Review & Funding Status
• Outlook
3
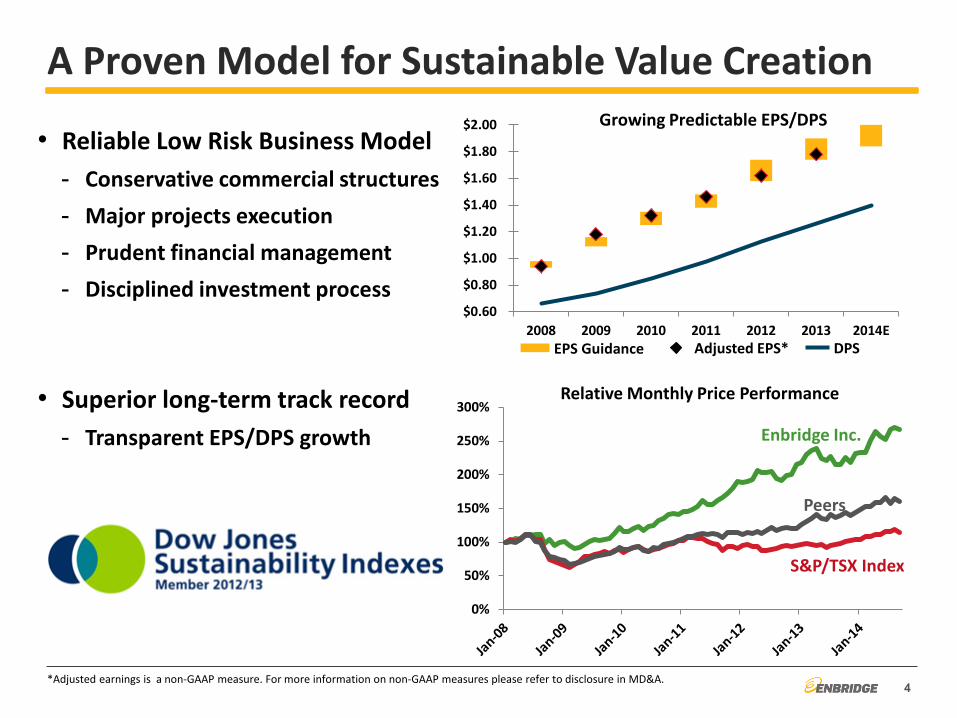
EPS Guidance
Relative Monthly Price Performance
• Reliable Low Risk Business Model - Conservative commercial structures - Major projects execution - Prudent financial management - Disciplined investment process
• Superior long-term track record - Transparent EPS/DPS growth
A Proven Model for Sustainable Value Creation
4
Adjusted EPS*
*Adjusted earnings is a non-GAAP measure. For more information on non-GAAP measures please refer to disclosure in MD&A.
Enbridge Inc.
Peers
S&P/TSX Index
$0.60
$0.80
$1.00
$1.20
$1.40
$1.60
$1.80
$2.00
2008 2009 2010 2011 2012 2013 2014E
DPS
Growing Predictable EPS/DPS
0%
50%
100%
150%
200%
250%
300%

Q3 and YTD 2014 – Adjusted Earnings ($ millions)
5
$488 $492
$306 $328
$278 $345
2013 2014
Q3 Q3
Q2
Q1
Q2
Q1
$1,072 $1,165
Year-To-Date Adjusted EPS: $1.33 $1.41
*Adjusted earnings is a non-GAAP measure. For more information on non-GAAP measures please refer to disclosure in MD&A.
Full Year 2014 EPS Guidance:
$1.84 $2.04
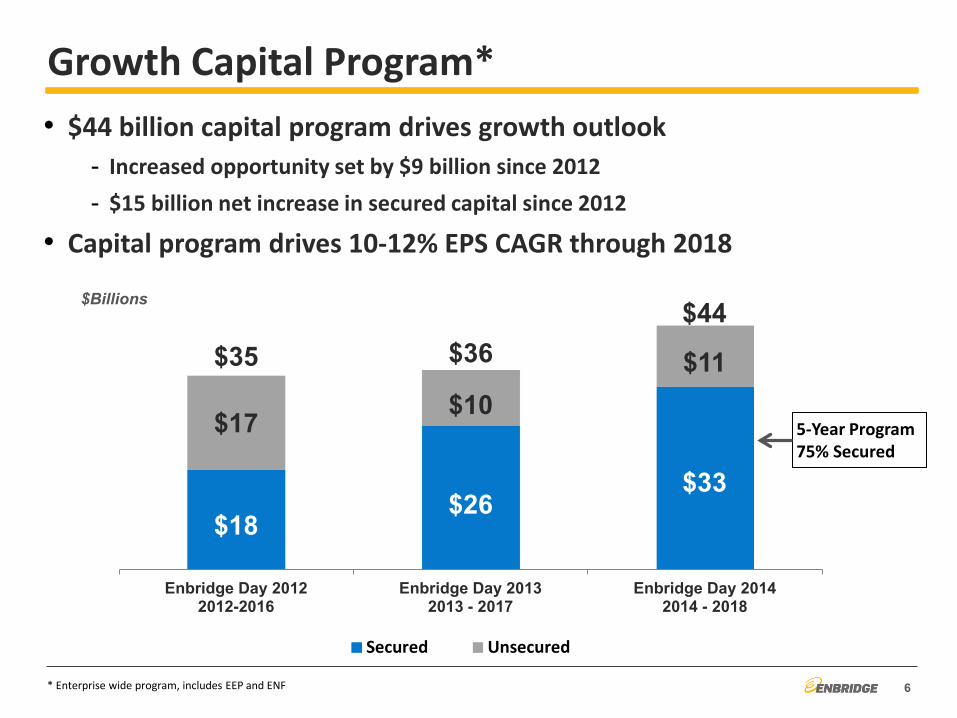
Growth Capital Program*
Enbridge Day 20122012-2016
Enbridge Day 20132013 - 2017
Enbridge Day 20142014 - 2018
Secured Unsecured
$18 $26
$33
$17 $10 $11 $35 $36 $44
• $44 billion capital program drives growth outlook - Increased opportunity set by $9 billion since 2012 - $15 billion net increase in secured capital since 2012
• Capital program drives 10-12% EPS CAGR through 2018
* Enterprise wide program, includes EEP and ENF 6
$Billions
5-Year Program 75% Secured

Project Execution Update – Completed Projects
Mainline Expansions
Southern Access Phase 1
Flanagan South
Line 6B Replacement
Lac Alfred & Massif-du-Sud
7
Seaway
Projects Estimated Cost ($ Billion)
Liquids Pipelines (Alberta Regional Infrastructure): Norealis Pipeline $0.5 Surmont Phase 2 Expansion (2014-2015 Phases) $0.3
Liquids Pipelines (Market Access Initiatives): Eastern Access
Line 6B Replacement Line 9 Reversal*
$2.1 $0.6
Western USGC Access $4.6 Light Oil Market Access (Line 9 Expansion*) $0.1 Eddystone Rail Project $0.1 Line 6B 75 Miles Replacement Program $0.4
Gas Pipelines: Pipestone and Sexsmith Project (2012-2014 Phases) $0.3
Gas Distribution: Other EGD Growth Capital $0.2
Green Power: Blackspring Ridge Wind Project $0.3 Lac Alfred/Massif du Sud $0.2
$9.7 Billion in-service in 2014
Norealis Pipeline
Blackspring Ridge
Eddystone Rail
*Unable to estimate the length of the delay.
Pipestone & Sexsmith
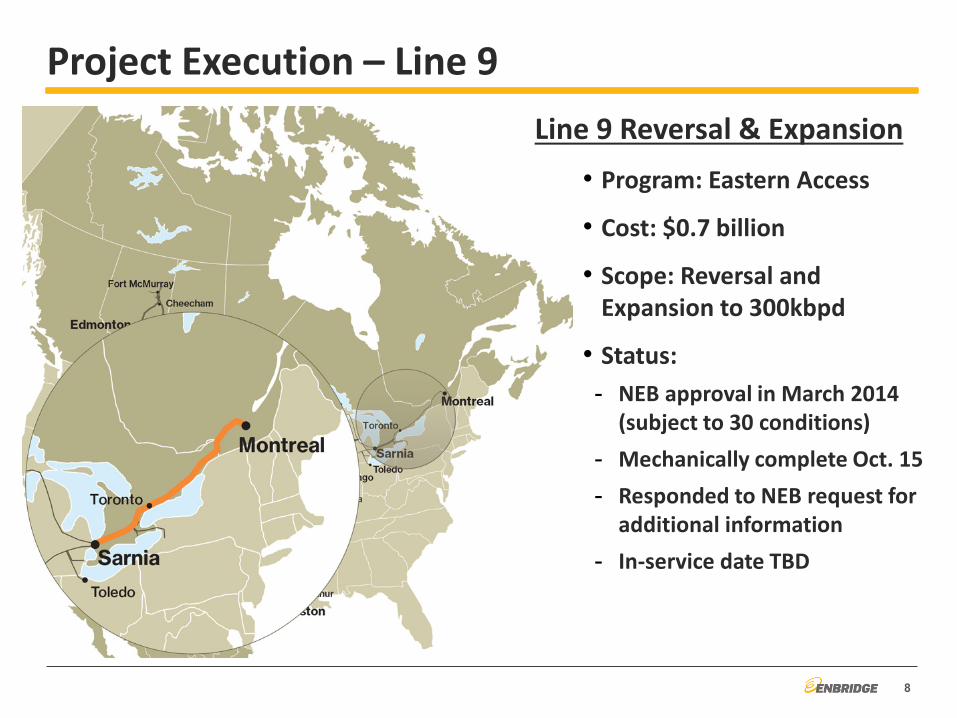
Project Execution – Line 9
8
Line 9 Reversal & Expansion • Program: Eastern Access
• Cost: $0.7 billion
• Scope: Reversal and Expansion to 300kbpd
• Status: - NEB approval in March 2014
(subject to 30 conditions) - Mechanically complete Oct. 15 - Responded to NEB request for
additional information - In-service date TBD
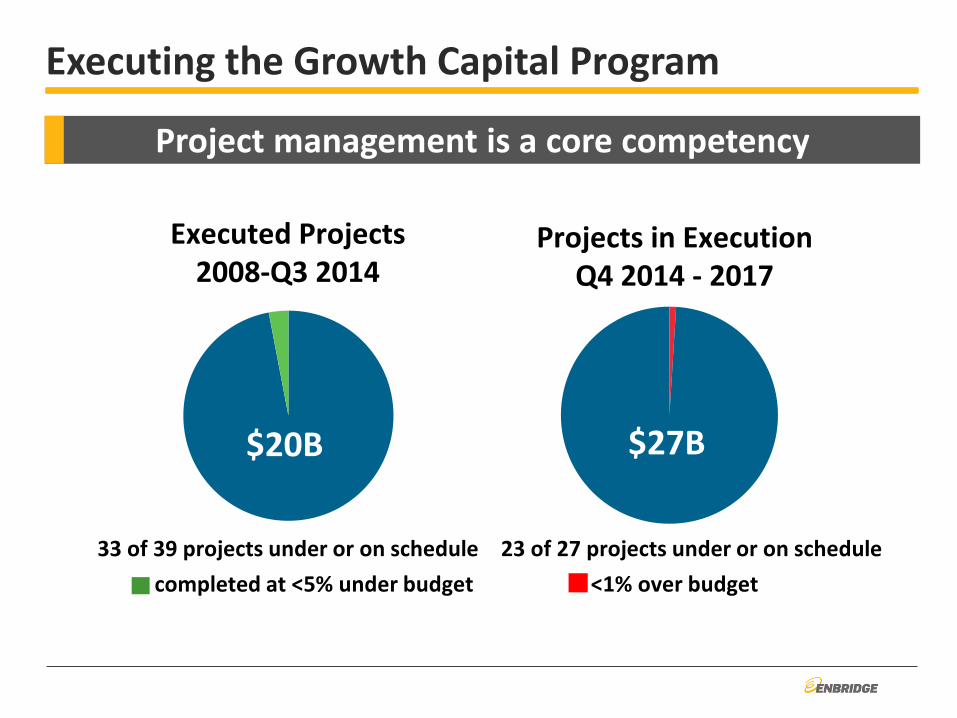
Executing the Growth Capital Program
Executed Projects 2008-Q3 2014
completed at <5% under budget
$20B
<1% over budget
$27B
Projects in Execution Q4 2014 - 2017
33 of 39 projects under or on schedule 23 of 27 projects under or on schedule
Project management is a core competency
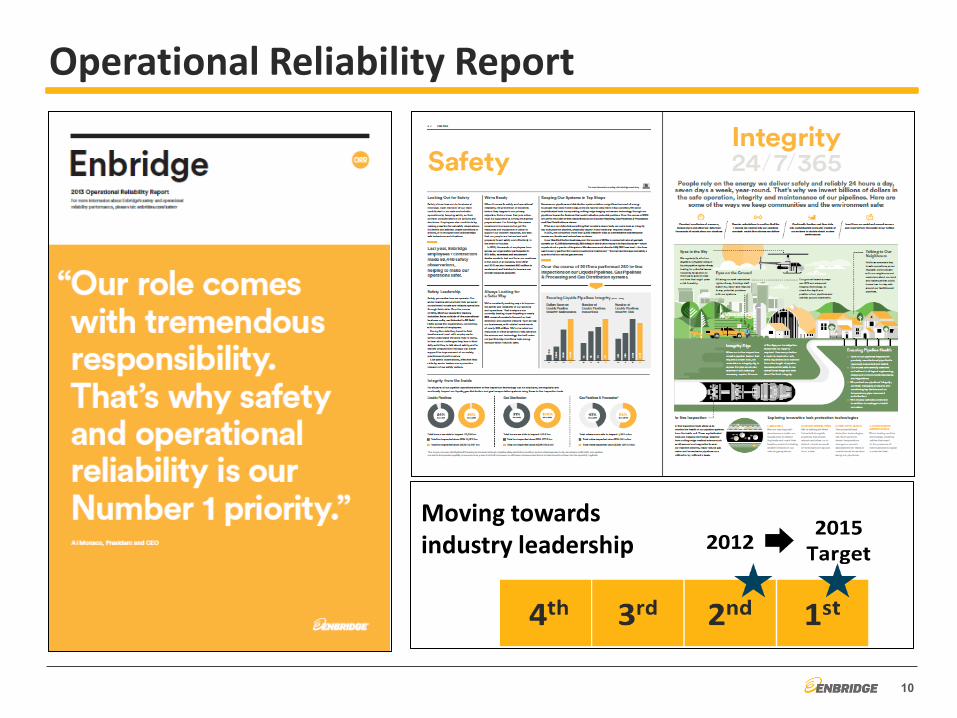
Operational Reliability Report
10
Moving towards industry leadership

80%
90%
100%
110%
120%
130%
140%
1/1/2013 7/1/2013 1/1/2014 7/1/2014
80%
90%
100%
110%
120%
130%
140%
150%
1/1/2013 7/1/2013 1/1/2014 7/1/2014
Sponsored Vehicles Strategy Update Positioned to provide low cost funding and enhance value
($24B Drop Down Inventory) ENF Relative Price Performance
Enbridge Income Fund (ENF) • $1.8B drop down expands historical pace • Releases capital, accretive to ENB and ENF • Solid foundation for future drop downs
Enbridge Energy Partners (EEP) • Reduced cost of funding • Proposed $900 mm drop down accelerated • No public equity requirement
EEP Relative Price Performance
11
Date Yield 1/1/2013 5.2% 10/31/2014 4.6%
Date Yield 1/1/2013 7.7% 10/31/2014 6.1%
ENF; +23% S&P/TSX: +18%
EEP: +30% MLP Alerian Index: +41%
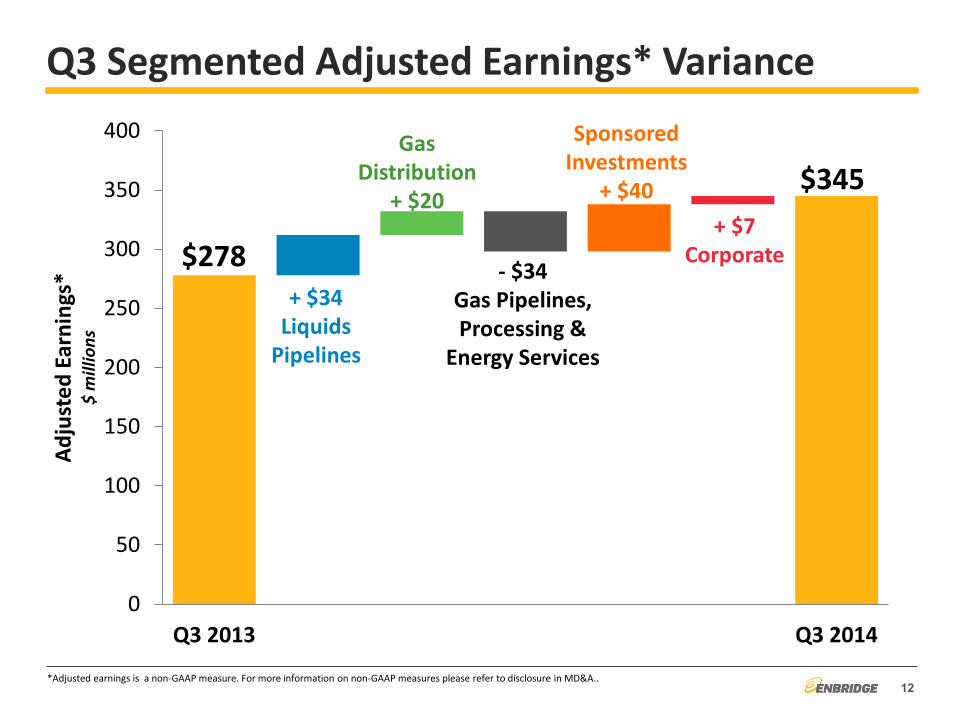
Q3 Segmented Adjusted Earnings* Variance
12
0
50
100
150
200
250
300
350
400
Q3 2013 Q3 2014
Adju
sted
Ear
ning
s*
$ m
illio
ns
$278
$345
- $34 Gas Pipelines, Processing &
Energy Services
Sponsored Investments
+ $40 + $7
Corporate
+ $34 Liquids
Pipelines
*Adjusted earnings is a non-GAAP measure. For more information on non-GAAP measures please refer to disclosure in MD&A..
Gas Distribution
+ $20
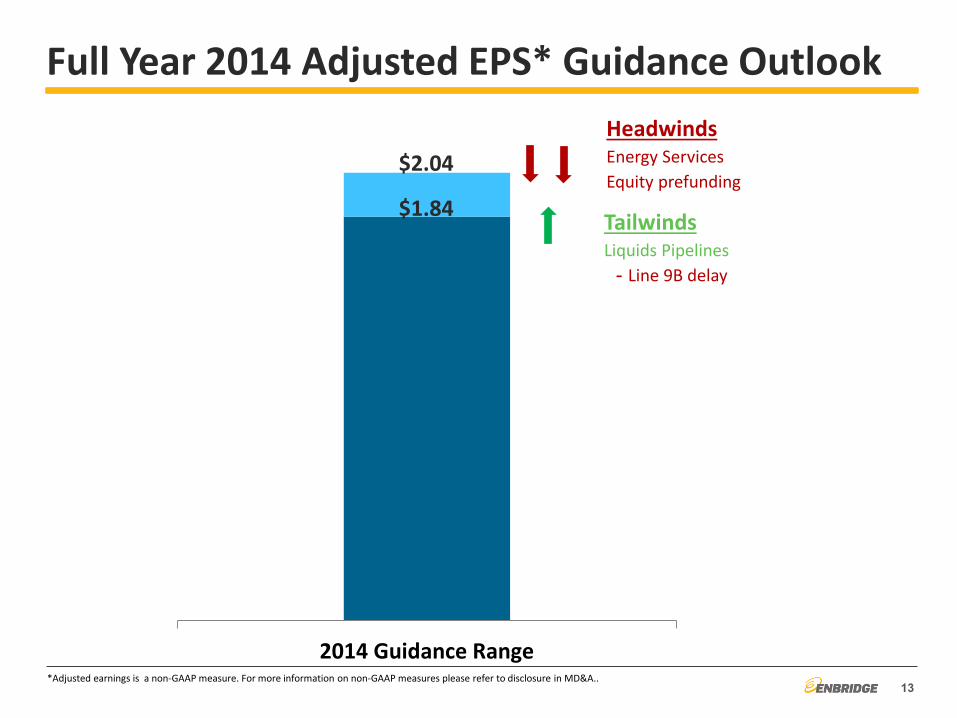
2014 Guidance Range
Full Year 2014 Adjusted EPS* Guidance Outlook
13
Headwinds Energy Services Equity prefunding
Tailwinds Liquids Pipelines
- Line 9B delay
*Adjusted earnings is a non-GAAP measure. For more information on non-GAAP measures please refer to disclosure in MD&A..
$1.84
$2.04
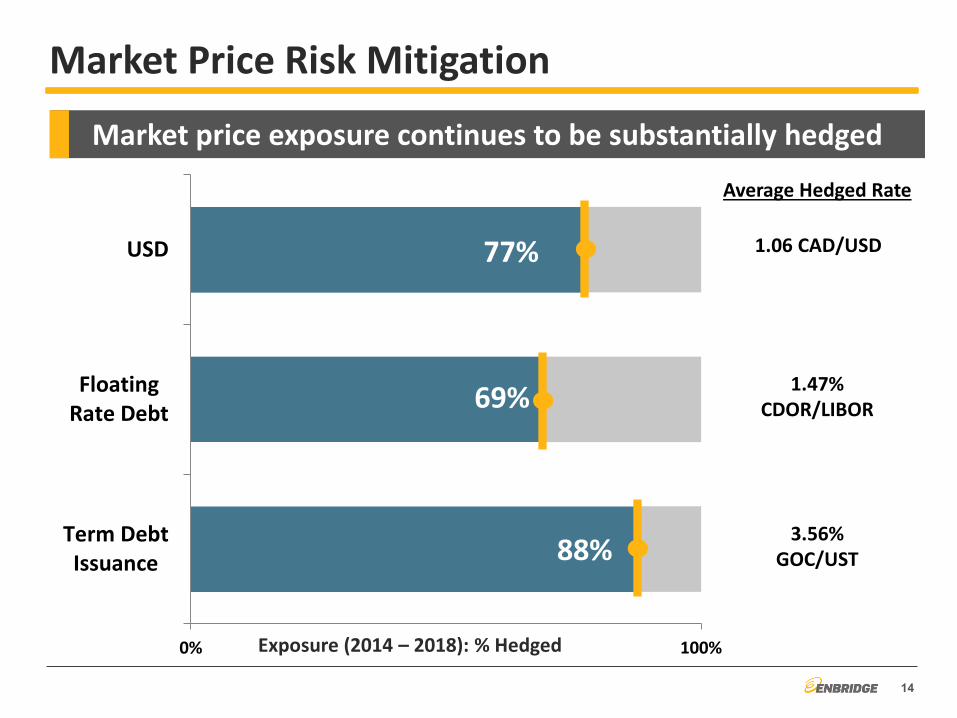
Market Price Risk Mitigation
88%
69%
77%
0% 100%
Term DebtIssuance
FloatingRate Debt
USD
Exposure (2014 – 2018): % Hedged
Average Hedged Rate
1.06 CAD/USD
1.47% CDOR/LIBOR
3.56% GOC/UST
Market price exposure continues to be substantially hedged
14
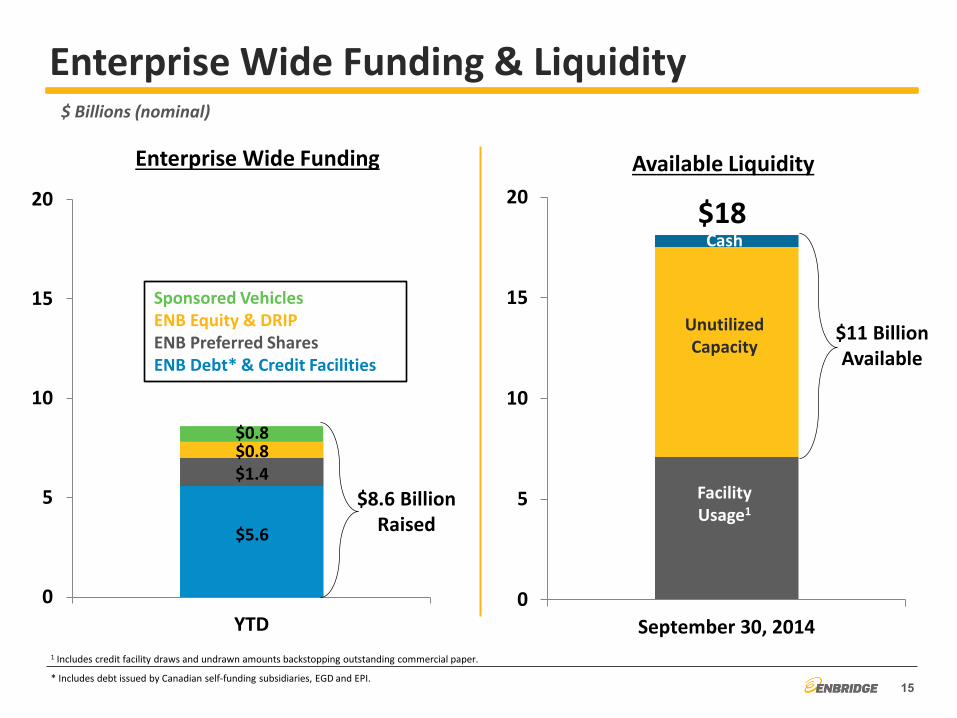
0
5
10
15
20
YTD
Enterprise Wide Funding & Liquidity
* Includes debt issued by Canadian self-funding subsidiaries, EGD and EPI. 15
$ Billions (nominal)
0
5
10
15
20
September 30, 2014
$11 Billion Available
$18
Facility Usage1
Unutilized Capacity
Cash
1 Includes credit facility draws and undrawn amounts backstopping outstanding commercial paper.
Enterprise Wide Funding Available Liquidity
Sponsored Vehicles ENB Equity & DRIP ENB Preferred Shares ENB Debt* & Credit Facilities
$5.6
$1.4 $0.8
$8.6 Billion Raised
$0.8
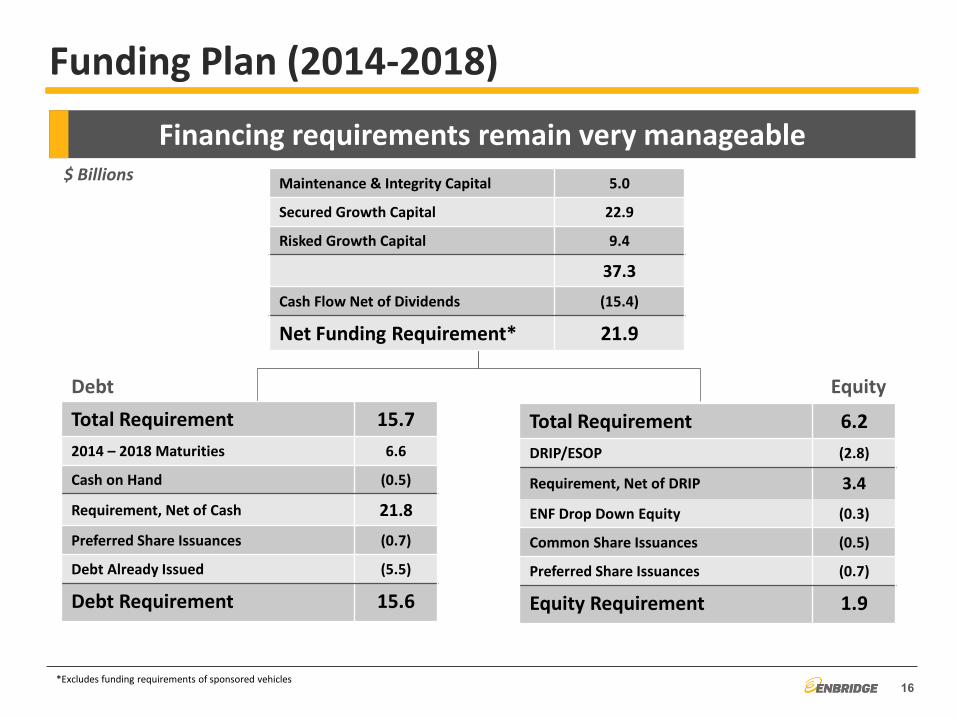
Maintenance & Integrity Capital 5.0
Secured Growth Capital 22.9
Risked Growth Capital 9.4
37.3
Cash Flow Net of Dividends (15.4)
Net Funding Requirement* 21.9
Total Requirement 15.7 2014 – 2018 Maturities 6.6
Cash on Hand (0.5)
Requirement, Net of Cash 21.8
Preferred Share Issuances (0.7)
Debt Already Issued (5.5)
Debt Requirement 15.6
Funding Plan (2014-2018)
Debt Equity
Total Requirement 6.2 DRIP/ESOP (2.8)
Requirement, Net of DRIP 3.4
ENF Drop Down Equity (0.3)
Common Share Issuances (0.5)
Preferred Share Issuances (0.7)
Equity Requirement 1.9
*Excludes funding requirements of sponsored vehicles
$ Billions
Financing requirements remain very manageable
16
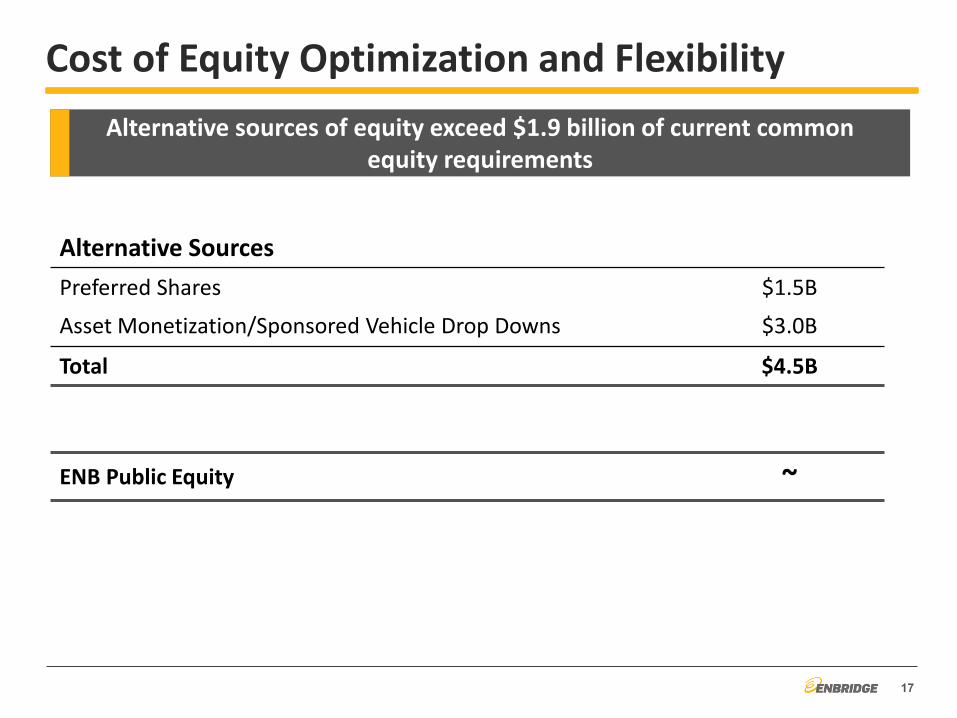
Cost of Equity Optimization and Flexibility
Alternative Sources Preferred Shares $1.5B
Asset Monetization/Sponsored Vehicle Drop Downs $3.0B
Total $4.5B
ENB Public Equity ~
Alternative sources of equity exceed $1.9 billion of current common equity requirements
17

18
Projects Estimated Cost ($ Billion)
Liquids Pipelines (Alberta Regional Infrastructure): AOC Hangingstone $0.2 Sunday Creek Terminal Expansion $0.2 Woodland Pipeline Expansion $0.6
Liquids Pipelines (Market Access Initiatives): Western USGC Access:
Associated Mainline Expansions
$0.7 Light Oil Market Access:
Southern Access Extension Chicago Connectivity Associated Mainline Expansions
$0.6 $0.5 $1.9
Edmonton to Hardisty Expansion $1.8 Gas Pipelines:
Beckville Cryogenic Processing Facility $0.1 Walker Ridge Gas Gathering $0.4 Big Foot Oil Pipeline $0.2
Gas Distribution: Greater Toronto Area Project $0.7 Other EGD Growth Capital $0.2
Green Power: Keechi Creek Wind Project $0.2
$8.3 Billion in-service in 2015
Continued Earnings Growth
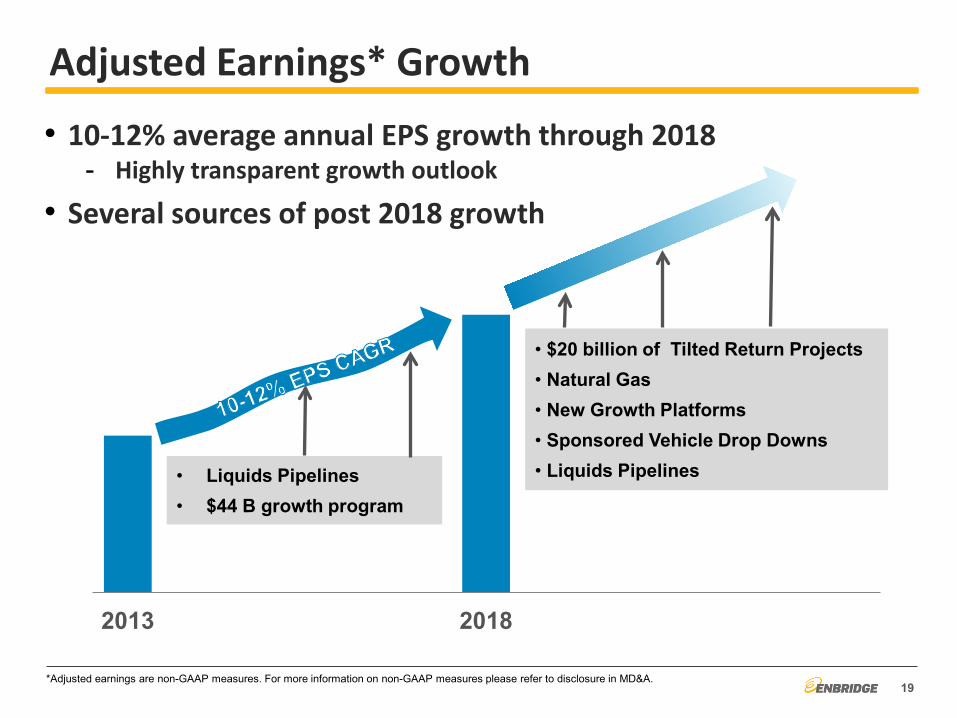
2013 2018
Adjusted Earnings* Growth
• $20 billion of Tilted Return Projects • Natural Gas • New Growth Platforms • Sponsored Vehicle Drop Downs • Liquids Pipelines
*Adjusted earnings are non-GAAP measures. For more information on non-GAAP measures please refer to disclosure in MD&A.
• Liquids Pipelines • $44 B growth program
• 10-12% average annual EPS growth through 2018 - Highly transparent growth outlook
• Several sources of post 2018 growth
19

Dividend Payout Considerations
• Progress on equity prefunding
20
• High organic growth capital program
• Robustness of equity funding options (sponsored vehicles)
• Rising internal free cash flow
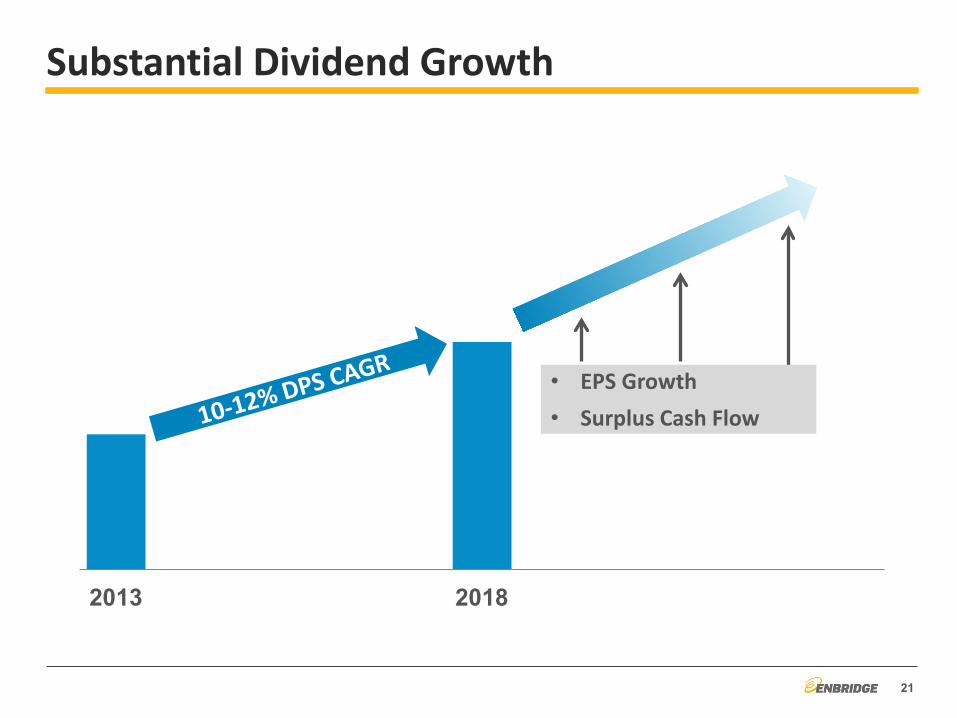
2013 2018
Substantial Dividend Growth
• EPS Growth • Surplus Cash Flow
21
Question & Answer Period
BUSINESS UNIT HEADER IMAGE GOES HERE
22