Embed Size (px)
Citation preview

DIGBY
STOCKHOLDER’S
REPORT
DEBRA PARROTT
ALLISON STRICKLAND
ENELI LUNGU

INTRODUCTION
Goals: increase stock price, stock rating, and profits.
Made decisions as a group instead of dividing up the sections.
Our strategy was to keep using methods that worked for us.
Tended to not take very many risks throughout the simulation.

DIGBY
One of six companies created from dismantling a monopoly.
Produce sensors in five different segments that are sold to other
manufacturers.
Product segments include traditional, low-end, high-end,
performance, and size.
Competition is from the other five companies created out of the
original monopoly.

INCOME STATEMENT
Sales increased.
Net profit and net margin fluctuated.
Total period costs and total variable costs increased.

BALANCE SHEET
Did not hold very much debt.
Retained earnings and total equity increased.
Debt and financial leverage.
CASH FLOWS
Inconsistent spending habits.
Operations cash outflow in year three.
Spent more money on financing than was brought in.
STOCK
Goal was to increase stock price.
Price increased throughout the simulation, except round three.
Started paying dividends
Saw positive results, significant increases in price in last few rounds.
Did not issue any new common stock.
Recommend buying or holding Digby stock
AAA stock rating- very low risk stock.
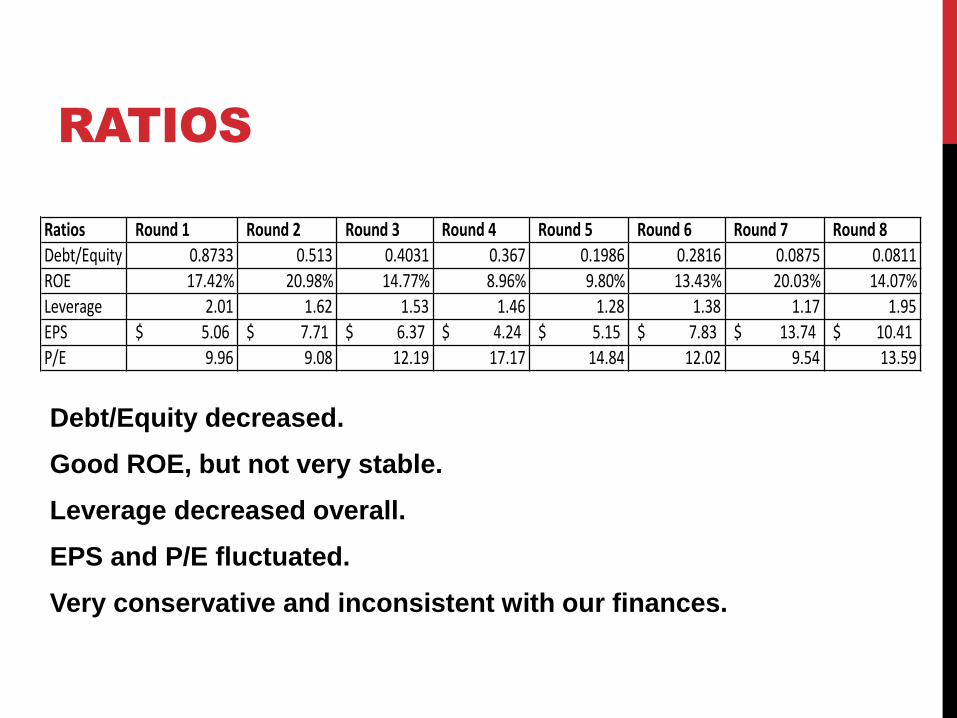
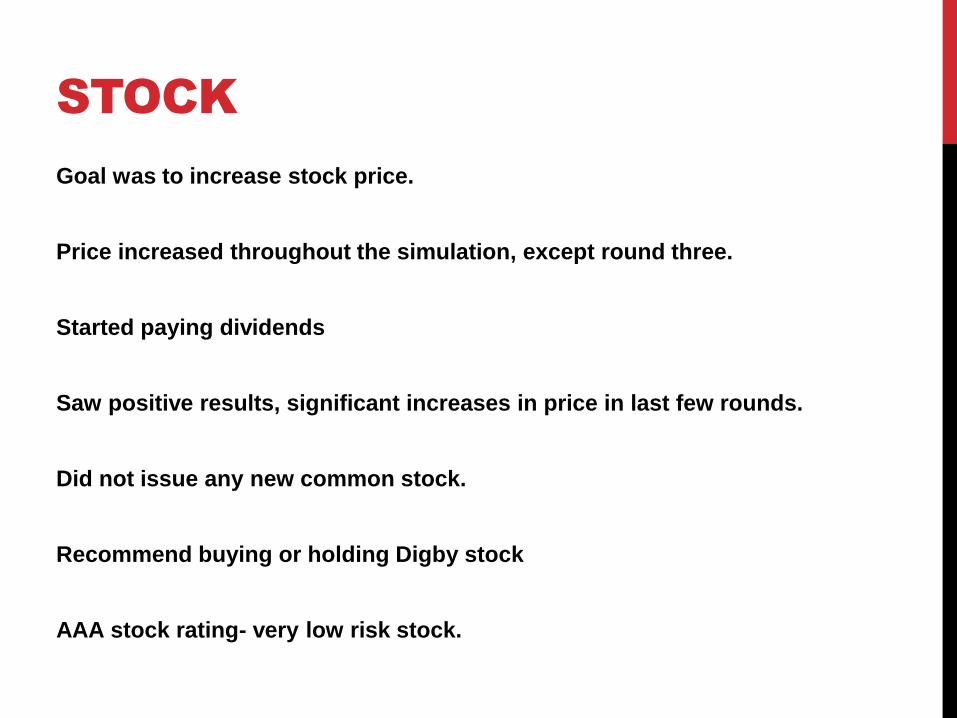
RATIOS
Debt/Equity decreased.
Good ROE, but not very stable.
Leverage decreased overall.
EPS and P/E fluctuated.
Very conservative and inconsistent with our finances.
Ratios Round1 Round2 Round3 Round4 Round5 Round6 Round7 Round8
Debt/Equity 0.8733 0.513 0.4031 0.367 0.1986 0.2816 0.0875 0.0811
ROE 17.42% 20.98% 14.77% 8.96% 9.80% 13.43% 20.03% 14.07%Leverage 2.01 1.62 1.53 1.46 1.28 1.38 1.17 1.95
EPS 5.06$ 7.71$ 6.37$ 4.24$ 5.15$ 7.83$ 13.74$ 10.41$P/E 9.96 9.08 12.19 17.17 14.84 12.02 9.54 13.59
CAPSIM DECISIONS

RESEARCH AND
DEVELOPMENT
Changes based on product sales, segment, and customer expectations.
Traditional/low-end: not changed often, changed size and performance in equal amounts, age was important.
High-end/performance: changed performance more than size, needed to improve every round.
Size: changed size more than performance.
Age and mean time before failure changes based on customer expectation.
Had issues getting Capsim points on customer satisfaction each round.
MARKETING
Started investing in promotion in round three.
Increased promotion and sales budgets in rounds five and six.
Maxed out promotion budgets in round eight.
Marketing increased customer accessibility and awareness of our products.
Did not take marketing budgets into accounting when coming up with forecast and production numbers.

PRODUCTION AND
FORECASTING
Consistent issue with selling out of products.
First round decisions based on tutorial rounds.
Forecasts based on how much was sold the previous round.
Production was around 200 higher than the forecast.
Used leftover inventory or sold out inventory amounts as part of the decision for production numbers.
Did not invest much into capacity or automation unless it was needed to produce the product.
If we took marketing into account when forecasting, we may not have sold out as often.
HUMAN RESOURCES
Changed human resources in an attempt to reduce days of working capital and employee turnover.
Labor negotiation strategy.
Increased training hours and recruiting spending.
Did decrease employee turnover and separation.
Did not decrease days of working capital.
Did not use human resources to benefit the company, we never completely figured out how to is it to our advantage.

FINANCES
Decisions made based on the need for working capital.
Decisions made after all other sections.
No emergency loans.
Reduced debt and increased retained earnings.
Issued debt to improve financial leverage, but no change.
Used sales income to run operations.
TQM
Started off investing all categories.
Invested for a few consecutive rounds, but then stopped to avoid
diminishing returns.
TQM helped by reducing costs and research and development turn
around time.

CONCLUSION
Goals: increase stock price, stock rating, and profit.
Profits increased.
Stock price increased overall.
Stock rating increased to AAA.
However, we did not take many risks.
If we had taken more risks, we may have had an even better outcome throughout the entire simulation.