Embed Size (px)
Citation preview
Building Trust 2013
Trends, Tools, and RESULTS

Need assistance? Call Member Services (866) 538-1909 or email
Today’s Featured Guests
Linda Stewart President & CEO
Interaction Associates
Andy Atkins Chief Innovation Officer Interaction Associates
@InteractionAsc

Need assistance? Call Member Services (866) 538-1909 or email
The Conference Board’s 2013 Top Ten CEO Challenges
“Trust”
4 © Interaction Associates Inc.

Today’s Presentation
1. Some quick definitions and context
2. Dive into the data
3. A tool to help you/your leaders build trust
5

Poll Question
It is extremely or very important to my effectiveness that I have a high degree of trust in my colleagues at work. 1. Agree 2. Disagree
6 © Interaction Associates Inc.
Need assistance? Call Member Services (866) 538-1909 or email
Survey Context 2009-2011
7 © Interaction Associates Inc.
Survey Snapshot 2013
8 © Interaction Associates Inc.

Building Trust 2013 surveyed nearly 400 leaders at more than 290 global organizations, polling them on behaviors and issues at the intersection of trust, leadership, and collaboration.

10 © Interaction Associates Inc.
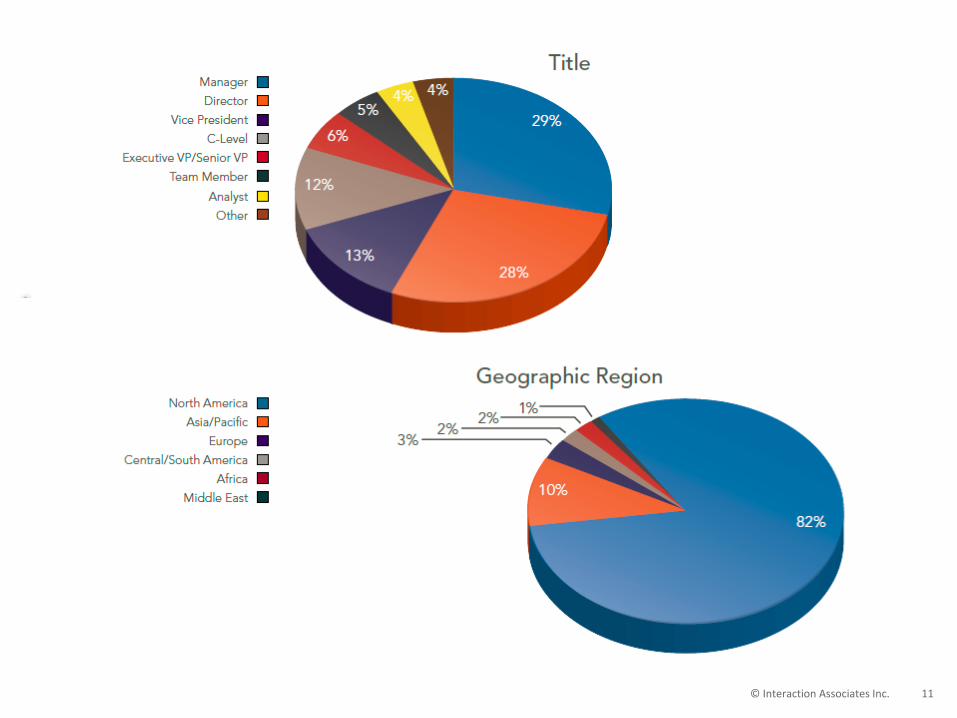
11 © Interaction Associates Inc.
12 © Interaction Associates Inc.
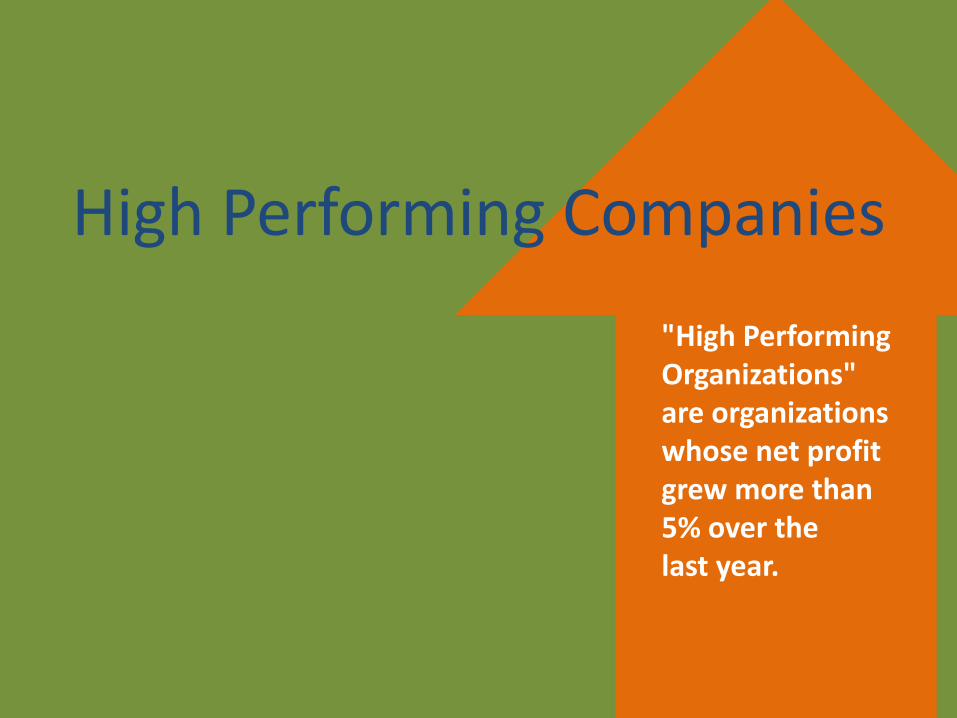
"High Performing Organizations" are organizations whose net profit grew more than 5% over the last year.
High Performing Companies

13 © Interaction Associates Inc.
“Low Performing Organizations" are organizations whose net profit shrank or grew less than 5% over the last year.
Low Performing Companies
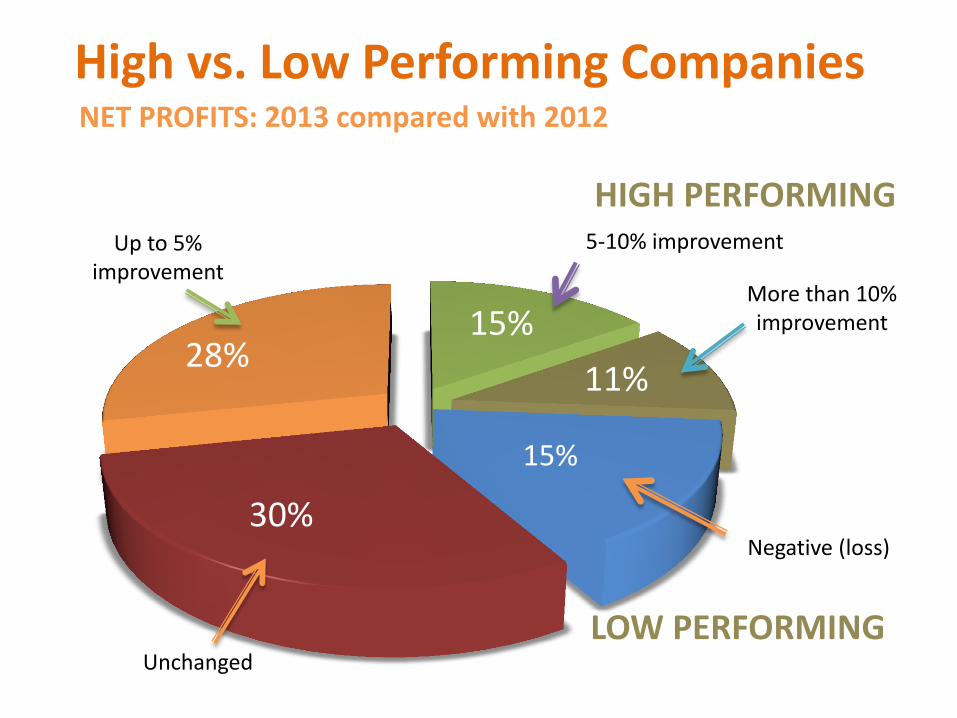
High vs. Low Performing Companies
28%
30%
15%
15%
11%
Up to 5% improvement
Unchanged
5-10% improvement
More than 10% improvement
NET PROFITS: 2013 compared with 2012
HIGH PERFORMING
LOW PERFORMING
Negative (loss)
15
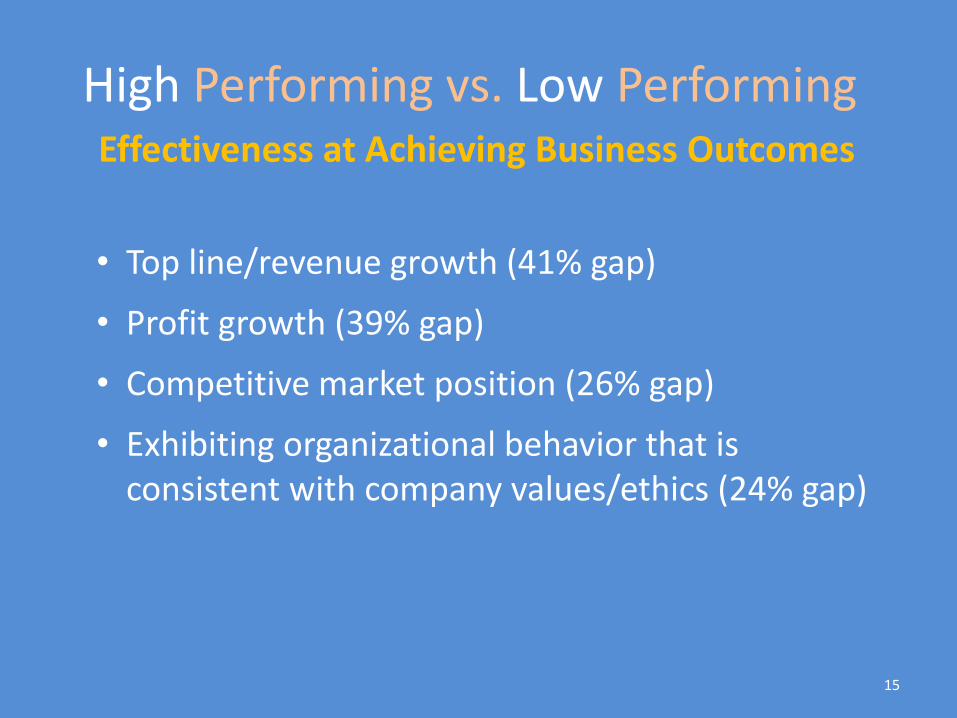
Effectiveness at Achieving Business Outcomes
• Top line/revenue growth (41% gap)
• Profit growth (39% gap)
• Competitive market position (26% gap)
• Exhibiting organizational behavior that is consistent with company values/ethics (24% gap)
High Performing vs. Low Performing

High Performing vs. Low Performing
HPOs . . . • Focus more on customer loyalty and
retention (10% gap)
• demonstrate higher levels of trust (30% gap)
• have more effective leadership (27% gap)
• and are more likely to have a collaborative environment (27% gap).
. . . than LPOs.
Trust in Business Survey 2013
17 © Interaction Associates Inc.
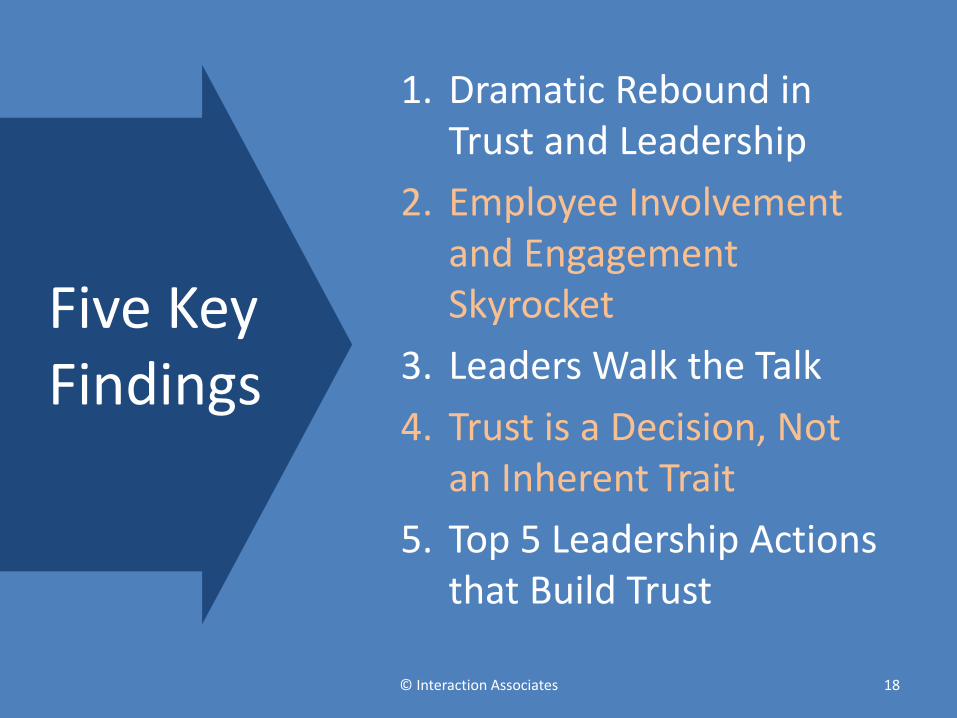
1. Dramatic Rebound in Trust and Leadership
2. Employee Involvement and Engagement Skyrocket
3. Leaders Walk the Talk
4. Trust is a Decision, Not an Inherent Trait
5. Top 5 Leadership Actions that Build Trust
Five Key Findings
© Interaction Associates 18
Rebound in Levels of Trust and Leadership
© Interaction Associates 19

20
To what degree do the following statements describe your organization?
All Respondents: Organizational Culture
Leadership and Trust = Significantly Higher than in 2012
38% 36% 34% 31% 32%
27%
My organization haseffective leadership
My organization is highlycollaborative.
Employees have a highlevel of trust in
management and theorganization.
2013 2012
21
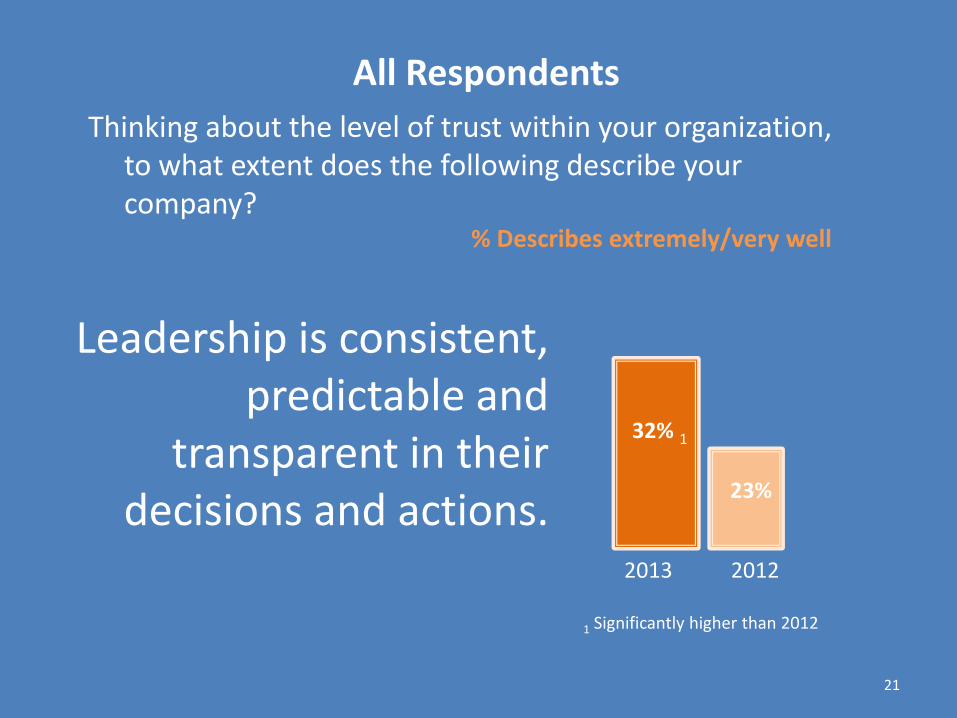
Thinking about the level of trust within your organization, to what extent does the following describe your company?
% Describes extremely/very well
All Respondents
1 Significantly higher than 2012
Leadership is consistent, predictable and
transparent in their decisions and actions.
2013 2012
32% 1
23%
22
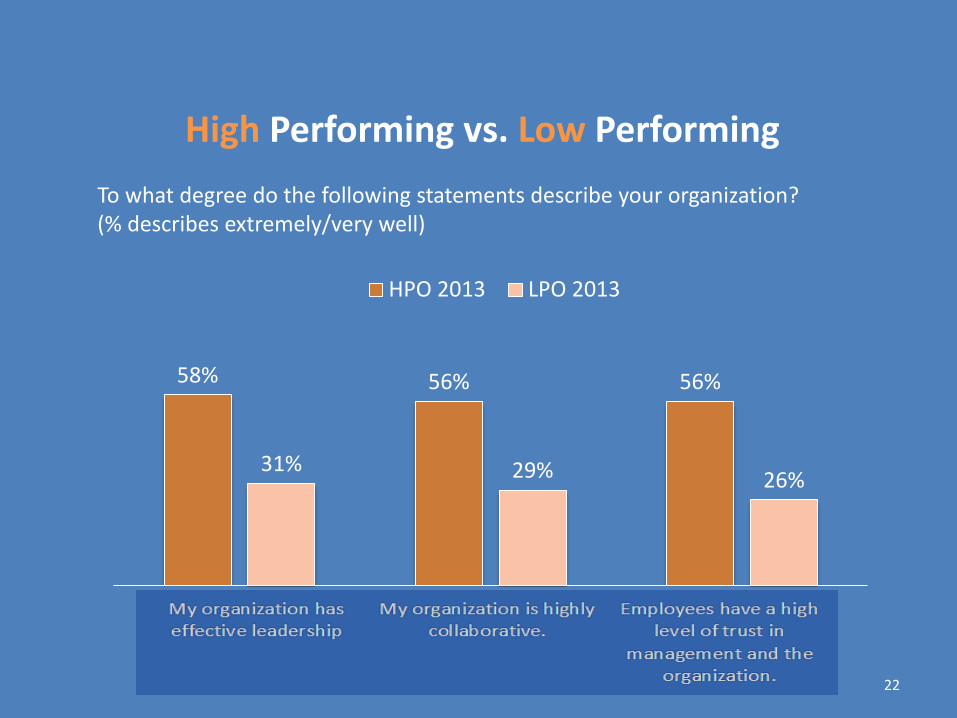
High Performing vs. Low Performing
To what degree do the following statements describe your organization? (% describes extremely/very well)
58% 56% 56%
31% 29% 26%
Leadership Collaborative Trust
HPO 2013 LPO 2013
Employee Involvement & Engagement Skyrocket
© Interaction Associates 23
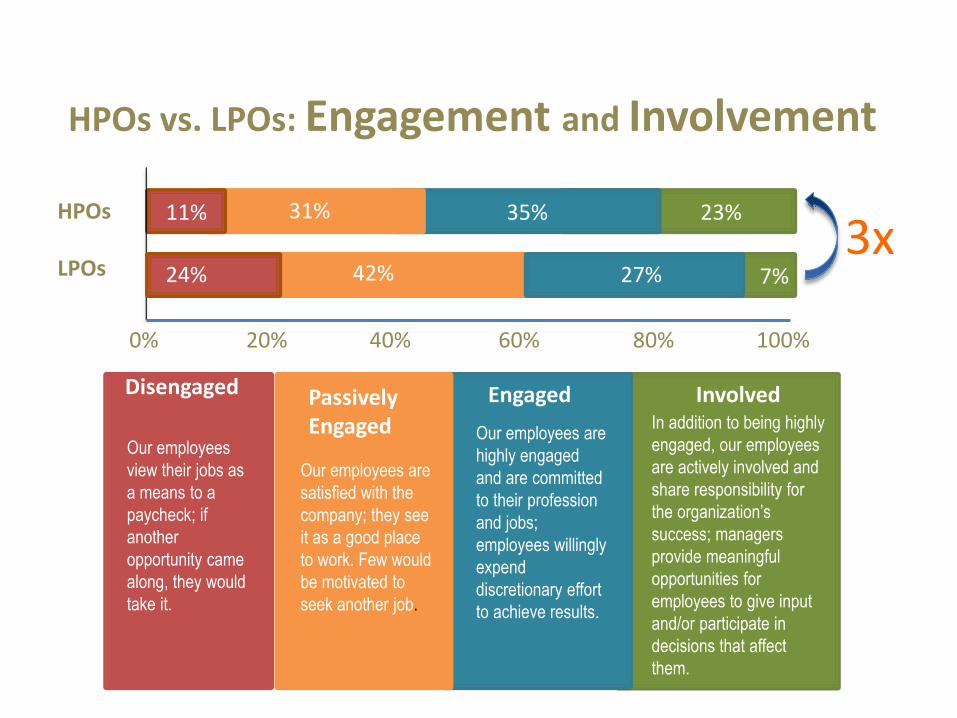
3x
Our employees
view their jobs as
a means to a
paycheck; if
another
opportunity came
along, they would
take it.
Our employees are
satisfied with the
company; they see
it as a good place
to work. Few would
be motivated to
seek another job.
Our employees are
highly engaged
and are committed
to their profession
and jobs;
employees willingly
expend
discretionary effort
to achieve results.
In addition to being highly
engaged, our employees
are actively involved and
share responsibility for
the organization’s
success; managers
provide meaningful
opportunities for
employees to give input
and/or participate in
decisions that affect
them.
Disengaged Passively Engaged
Engaged Involved
24% 7%
0% 20% 40% 60% 80% 100%
HPOs
LPOs
31% 35% 23% 11%
27% 42% 24% 7%
HPOs vs. LPOs: Engagement and Involvement

© Interaction Associates 25
Engagement/Involvement and Retention Gap: All Respondents – Net Effectiveness at
Retaining Key Employees
7%
40%
60% 60%
Leaders Walk the Talk
© Interaction Associates 26
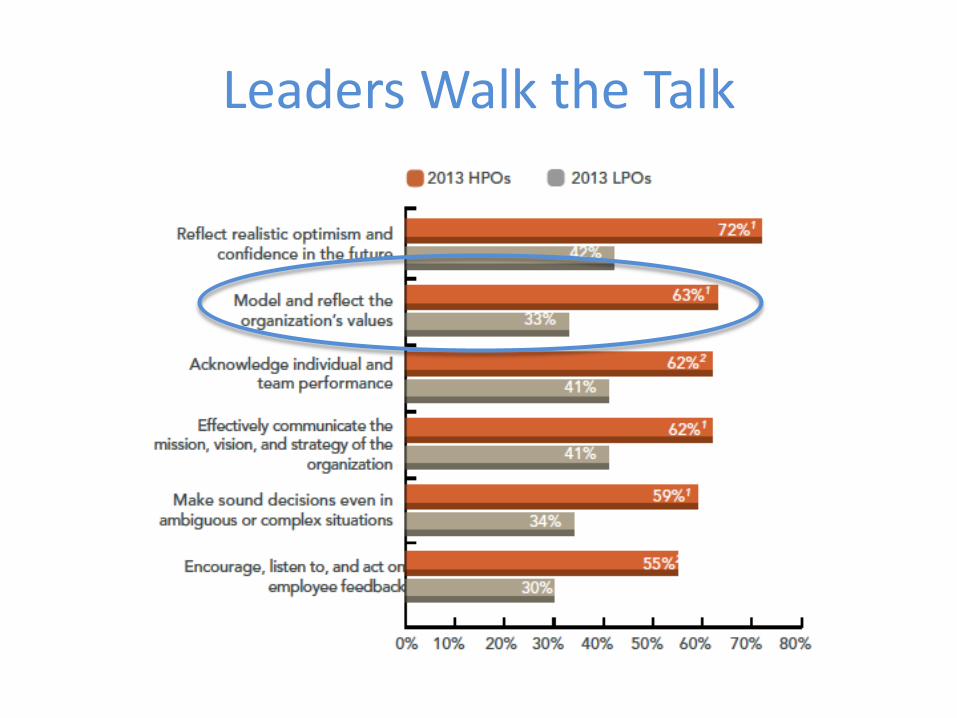
Leaders Walk the Talk
© Interaction Associates 27
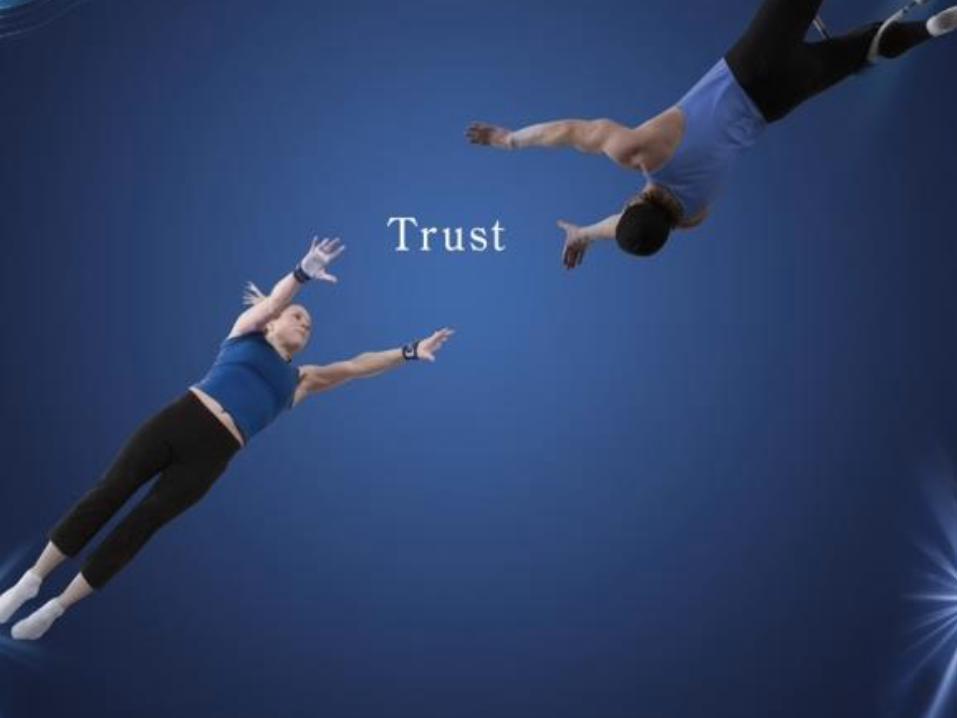
Trust is a Decision, not an Inherent Trait
© Interaction Associates 28

© Interaction Associates 29
(n.) a willingness to put yourself at
risk based on another person’s actions
Trust
Aligned Purpose
Expertise
Past Experience
Basis of Trust
Readiness to Trust
Willingness to Trust

Trust Matters
© Interaction Associates 30
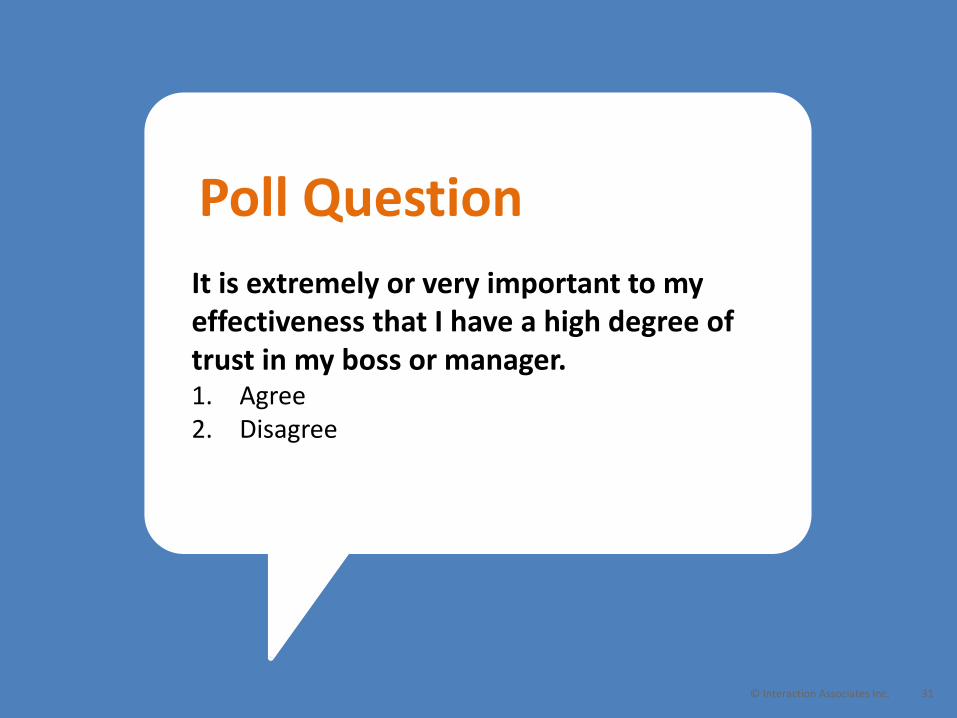
Poll Question
It is extremely or very important to my effectiveness that I have a high degree of trust in my boss or manager. 1. Agree 2. Disagree
31 © Interaction Associates Inc.
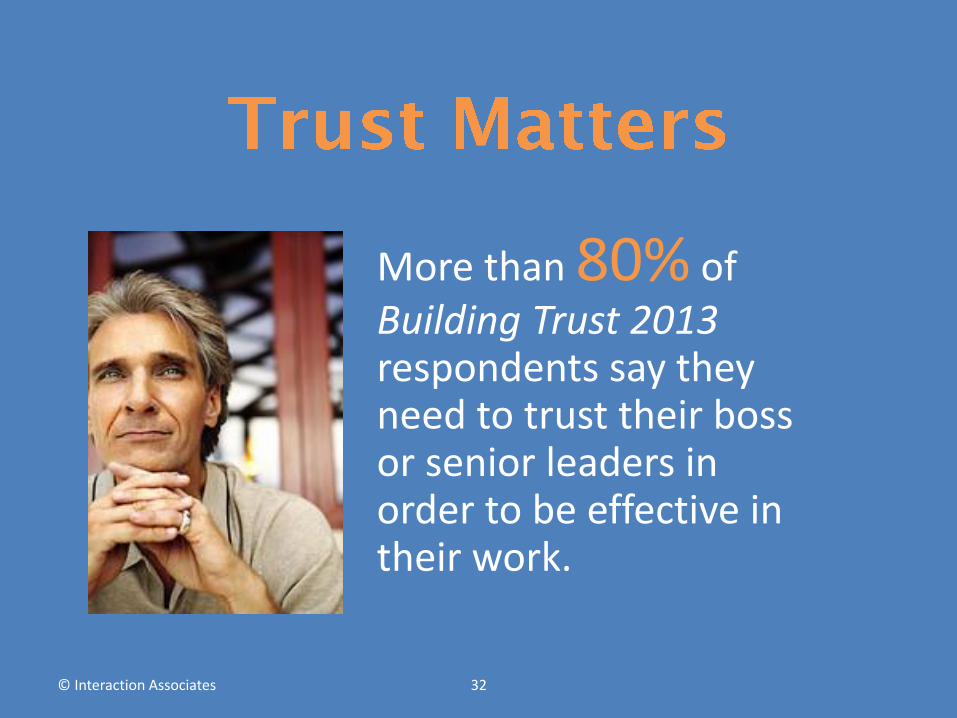
More than 80% of Building Trust 2013 respondents say they need to trust their boss or senior leaders in order to be effective in their work.
© Interaction Associates 32
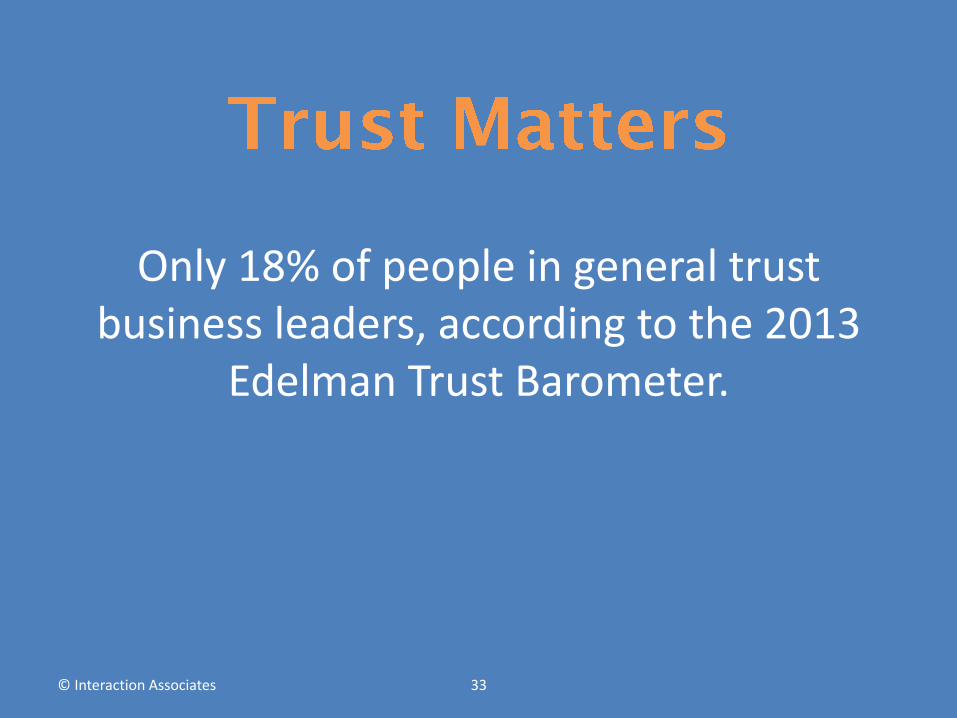
Only 18% of people in general trust business leaders, according to the 2013
Edelman Trust Barometer.
© Interaction Associates 33

Poll Question
It is extremely or very important to my effectiveness that I have a high degree of trust in my organization. 1. Agree 2. Disagree
34 © Interaction Associates Inc.
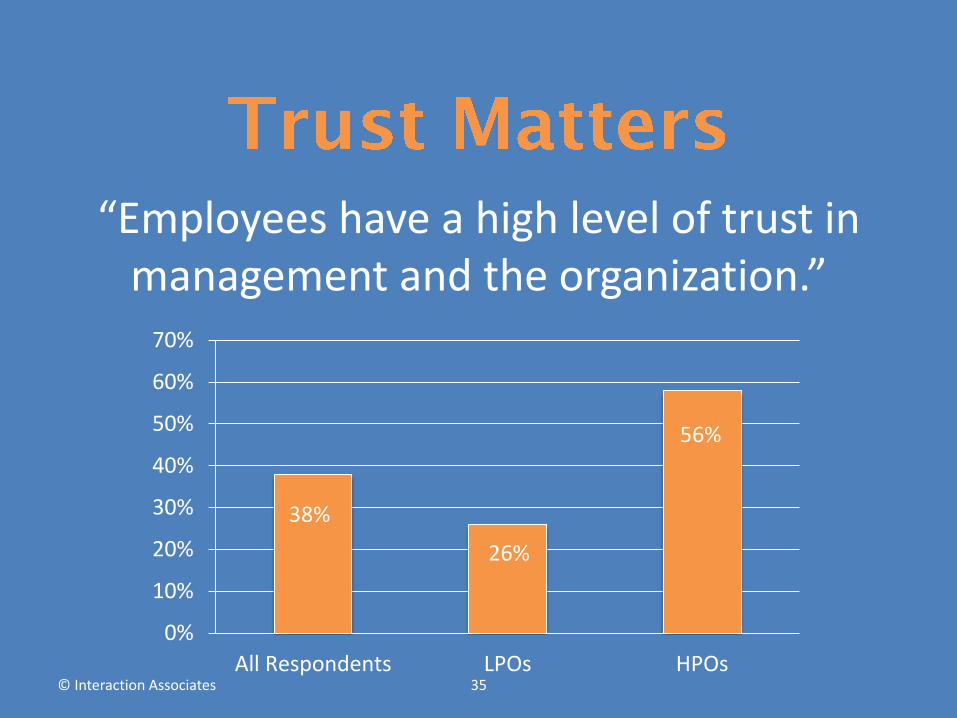
“Employees have a high level of trust in management and the organization.”
© Interaction Associates 35
0%
10%
20%
30%
40%
50%
60%
70%
All Respondents LPOs HPOs
38%
26%
56%

© Interaction Associates 37
Five top actions Leaders can take to Build Trust Now
© Interaction Associates 38

1. Set employees up for success by providing tools, resources and learning opportunities (41%)
2. Provide adequate information around decisions (41%)
3. Seek input prior to making decisions (40%)
4. Consistently act in alignment with company values (35%)
5. Give employees an inspiring, shared purpose to work toward (28%)
Top 5 Leadership Actions the Build Trust
© Interaction Associates 39
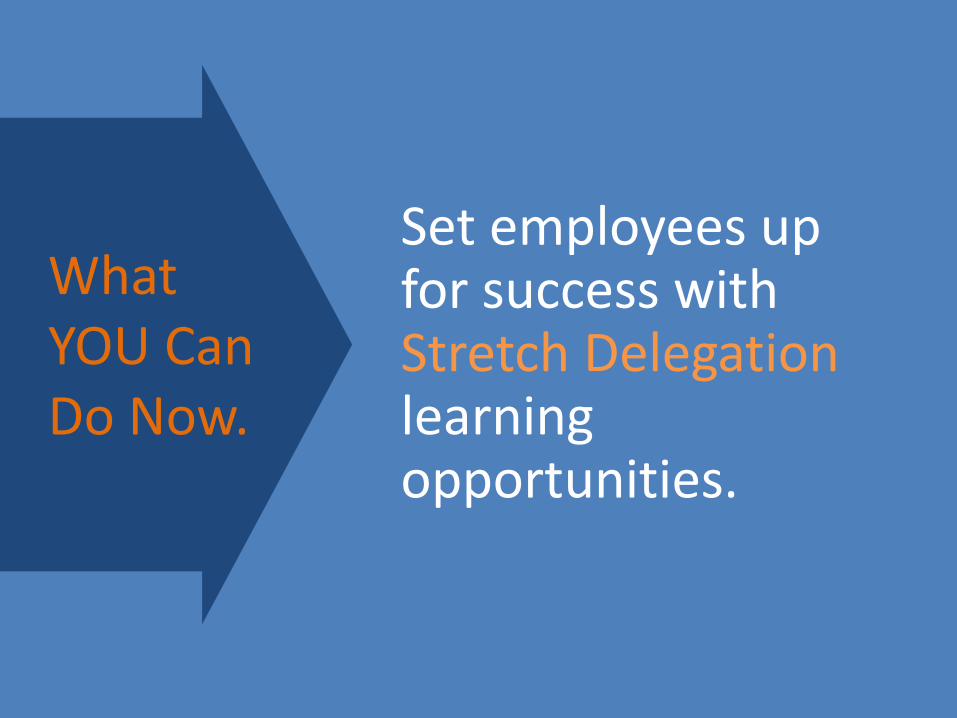
Set employees up for success with Stretch Delegation learning opportunities.
What YOU Can Do Now.

Time
Pe
rform
ance
New Job
Stretch Delegation
Opportunity
Performance
Surge
Stretch
Delegation
Opportunity
Performance
Dip
Without
Stretch
© Interaction Associates, Inc.
The Power of Stretch Delegation
Need assistance? Call Member Services (866) 538-1909 or email
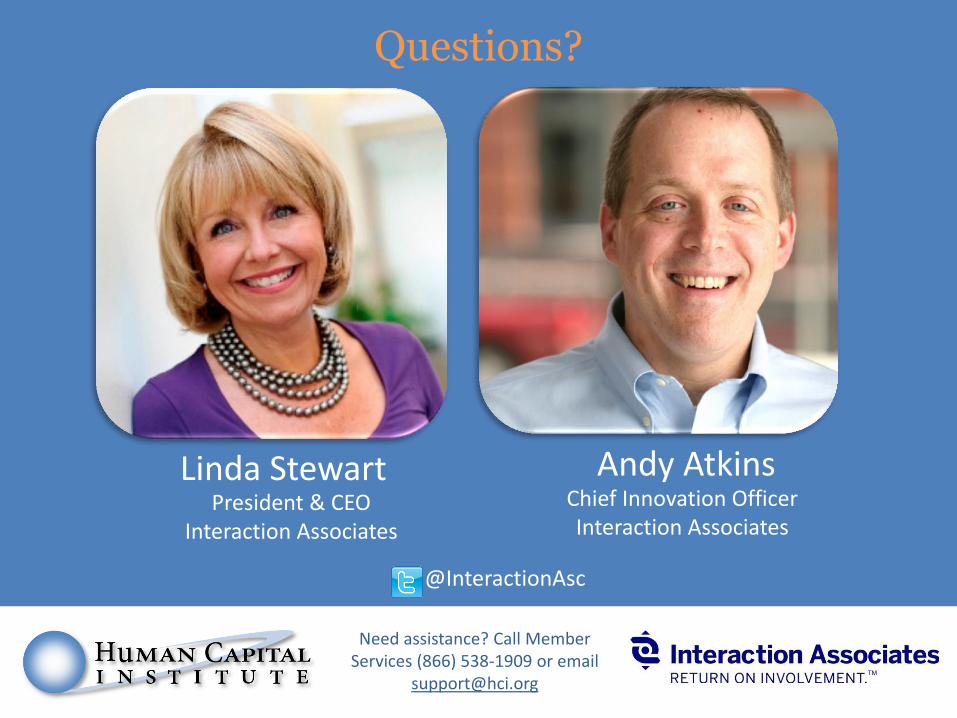
Questions?
Linda Stewart President & CEO
Interaction Associates
Andy Atkins Chief Innovation Officer Interaction Associates
@InteractionAsc
Full Report Now Available
43 © Interaction Associates Inc.
interactionassociates.com