Embed Size (px)
Citation preview

1
An Overview of Asia Pacific Unmanned Aircraft Systems Market
for
US Embassy
Julius Yeo
Consultant, Frost & Sullivan

2
HELP!
THE OBJECTIVE -CAPTURE THIS CUSTOMER
COMPETITIVE THREAT
RABBIT HOLES - VERY TEMPTING TO DIVE DOWN
RESTRICTED VISION
EXCELLENT VISION
Strategic Thinking – A Helicopter Vision

3
Industry Restraints & Challenges
Market Spending Overview
Industry Dynamics
Market Forecasts
Market Trends
An Overview of
Asia Pacific
Unmanned Aircraft Systems Market
Conclusions and Key Take Aways

4
Market Spending Overview

5
0
500
1000
1500
2000
2500
2008 2009 2010 2011 2012 2013 2014 2015 2016 2017
North America Europe Asia Pacific Middle East Rest of the world
US $ Million
Global Defense Budgets ( 2008 – 2017)
Global Defense Budget are increasing, more so for Asia Pacific in the future. Military budgets will continue to be under strain because of increasing costs of complex defense systems

6
Europe, 14%
Asia Pacific,
18%
ROW, 1%Middle East, 5%
USA , 62%
USA Europe Asia Pacific Middle East
Global Military UAV Market Share by Geography (2008)
0
0.5
1
1.5
2
2.5
3
USA APAC Europe Middle East ROW
US $ Billion
UAV Market Spending by Geography (2008)United States will continue to contribute the most in UAV spending. Asia Pacific currently 2nd
in UAV spending, is still in its infancy stage for UAV developments and it will continue to look to the west for procurement of UAV systems for the short and mid term outlook.

7
Industry Dynamics

8
Contributing Factors and Influences that drives the UAV Growth in Asia Pacific
Regional conflicts among neighbors
Unstable states with internal political tensions
Development of Network Centric Network concept
Strategic national technology position
Support from individual governments for UAVdevelopment programs
Strong regional economic growth
Expansive sea area and long coastlines
Source: Frost & Sullivan

9
Geographical Influences
Conflict locations due to political tensions, border stand-offs, land claims, and domestic insurgencies.
Security threats such as piracy, military stand-offs, and others requiring maritime operations.
Potential locations for occurrence of natural disasters.
Source: Frost & Sullivan

10
Industry Restraints & Challenges

11
MediumMediumMediumTimely development duration
Unmanned Aircraft Systems Market: Impact o Industry Restraints, 2008-2016
Industry Restraints Impact 1-2 Years Impact 3-4 Years Impact 5+ Years
Existing manned aircraft capabilities Medium Medium Medium
Procurement cost Medium Medium Medium
Technology handling capabilities Medium Medium Medium
HighHighHighIndustrial
HighHighHighOperational Capabilities
Unmanned Aircraft Systems Market: Impact to Industry Challenges, 2008-2016
Industry Challenges Impact 1-2 Years Impact 3-4 years Impact 5+ Years
Doctrines and Polices High High High
Economics High High High
Regional Factors High High High

12
Market Forecasts

13
Market Spending Forecasts
UAV Market: Spending Forecasts for Asia Pacific, 2007-2016
Note: All figures are rounded; the base year is 2007. Source: Frost & Sullivan
Frost & Sullivan forecasts that the CAGR for the revenue growth rate from 2007 to 2016 will be 4.4 percent.
0.0
200.0
400.0
600.0
800.0
1000.0
1200.0
2007
2008
2009
2010
2011
2012
2013
2014
2015
2016
Year
Spending ($ M
illion)
-30.0
-20.0
-10.0
0.0
10.0
20.0
30.0 Reve
nue G
rowth Rate (%
)
Revenue ($ Million)
Revenue Growth Rate (%)

14
UAV market: Total Unit EIS Forecasts (Asia Pacif ic), 2007-
2016
0
200
400
600
800
1000
1200
2007
2008
2009
2010
2011
2012
2013
2014
2015
2016
Years
Shipment Forecast ($ Million)
Total UAV EIS Trends
Note: All figures are rounded; the base year is 2007. Source: Frost & Sullivan
Total shipment forecast in the future will fluctuate in the reels of US$600 million on a sustainable basis.

15
UAV Market: Unit Shipment Forecasts and Trends by UAV Types
(Asia Pacific), 2007-2016
0
200
400
600
800
1000
1200
2007
2008
2009
2010
2011
2012
2013
2014
2015
2016
Years
Shipment Forecast ($ M
illion)
HALE
MALE
VTOL
TUAV
Forecasts and Trends by UAV Types
Note: All figures are rounded; the base year is 2007. Source: Frost & Sullivan
Tactical UAV will continue to dominate the UAV market in Asia Pacific.

16
Market Trend

17
Forecast of UAV Market: Percent of Market Share by UAV Types (Asia Pacific), 2007 - 2016
HALE
11%
TUAV
43%
VTOL
15%
MALE
31%
Source: Frost & Sullivan
•Tactical Unmanned Aerial Vehicles or TUAV, are expected to lead the UAV market in Asia Pacific from 2007 to 2016.
•The High Altitude Long Endurance (HALE) UAV market will be driven predominantly by more advanced countries in terms of military capabilities. Frost & Sullivan expects Singapore, Australia, South Korea, and Japan to be the leaders in the HALE UAV procurement.
• Frost & Sullivan projected the strongest growth for Medium Altitude Long Endurance (MALE) UAVs between 2011 to 2015. As a result, MALE will take away some market share from HALE
• VTOL was inducted for usage in Japan in the early days, however this system has not garnered sufficient support from theother countries in the Asia Pacific. However, Frost & Sullivan expects the market share of VTOLs to increase in the later stages of the forecast period due to enhanced technologies handling capabilities and new naval defense article procurement.
Market Share by UAV Type
With the adoption of network centric warfare by countries within the Asia Pacific region, TUAV will have a critical role.

18
Unmanned Aerial Systems Market Segmentation – market will move beyond the “ Dull, Dirty, Dangerous” tasks highlighted in the past – “Deep” and persistent operations are the key application now
Payload Capacity (kg)
400 - 2000
60 - 400
5 - 150
0 - 5
Altitude (ft)
Range (km)
40,000
20,000
50 500 5000
MUAV
TUAV VTOL
MALE
HALE

19
0
20
40
60
80
100
120
140
160
180
2007
2008
2009
2010
2011
2012
2013
2014
2015
2016
Year
Shipment Forecast ($ M
illion)
MALAYSIA
TAIWAN
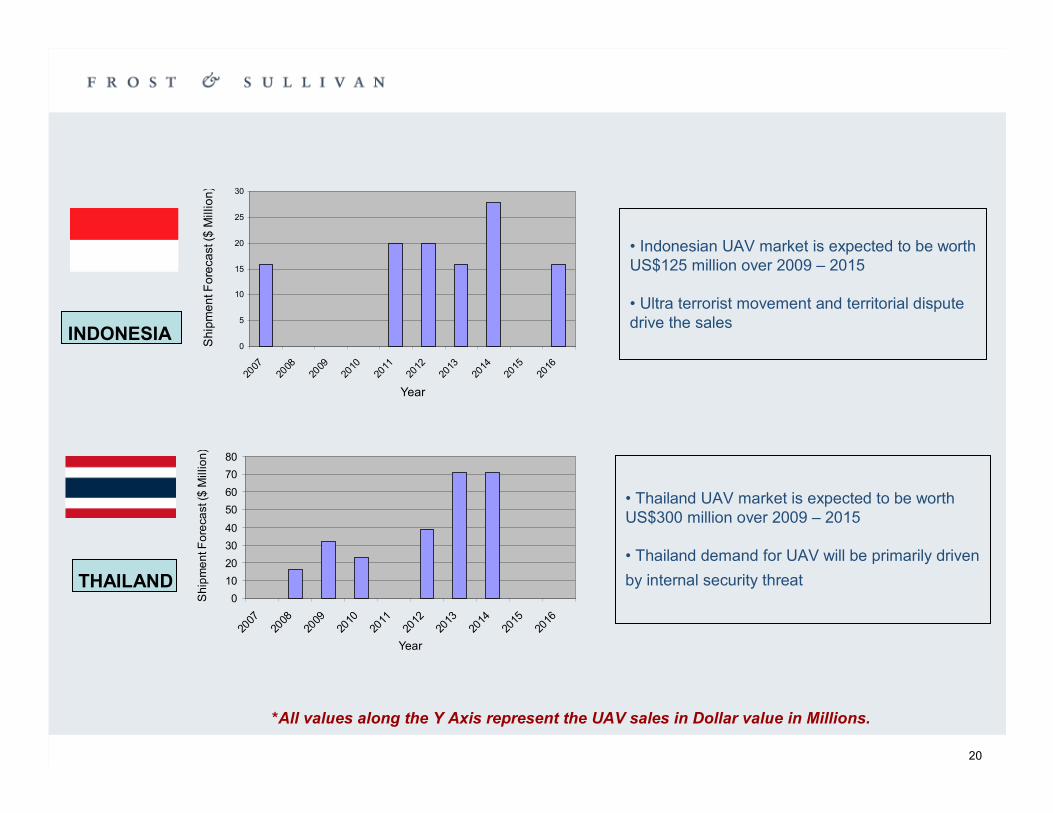
*All values along the Y Axis represent the UAV sales in Dollar value in Millions.
• Malaysia UAV market is estimated to worth
about US$90 million over 2009 -2015
• Maritime operations and coastguard continueto drive most of the UAV sales
• Taiwan UAV market is expected to be
worth US $600 million over 2009-2015
• Threat of mainland China and territorial dispute will drive the sales
0
5
10
15
20
25
30
35
40
2007
2008
2009
2010
2011
2012
2013
2014
2015
2016
Year
Shipment Forecast ($ M
illion)
20
*All values along the Y Axis represent the UAV sales in Dollar value in Millions.
• Indonesian UAV market is expected to be worth US$125 million over 2009 – 2015
• Ultra terrorist movement and territorial dispute drive the sales
• Thailand UAV market is expected to be worth US$300 million over 2009 – 2015
• Thailand demand for UAV will be primarily driven
by internal security threat
INDONESIA
THAILAND
0
5
10
15
20
25
30
2007
2008
2009
2010
2011
2012
2013
2014
2015
2016
Year
Shipment Forecast ($ M
illion)
0
10
20
30
40
50
60
70
80
2007
2008
2009
2010
2011
2012
2013
2014
2015
2016
Year
Shipment Foreca
st ($ M
illio
n)

21
Frost & Sullivan has identified various countries in Asia Pacific that it believes will the leaders in UAV technology and systems export. Although many countries have set up indigenous development programs, the lack of technical expertise and funding has hindered the progress, thus forcing these countries to procure off-the-shelf UAVs from non-domestic suppliers. The following chart segments the region to three tiers based on the UAV export capabilities of respective countries. It should be noted that although Japan should fall into Tier 1, international arms and weapons trade restrictions has significantly hampered its UAV development programs. In the event, these restrictions are lifted, Japan is expected to be one of the global leaders in UAV technology. China is working toward self-reliance due to various restrictions imposed on the country. However, if China is successful in its efforts, it will not be too long before Chinese-made UAVs are seen over Asia Pacific’s airspace.
TIER 1
South Korea, Australia, Singapore
TIER 2
China, India, Japan
TIER 3
Indonesia, Malaysia, Thailand
Source: Frost & Sullivan
Japan can be the global developer of UAV technology if international military restriction is lifted. China is seen as a “up and coming force” in the UAV market

22
Conclusion & Key Takeaways

23
Conclusion & Key Takeaways
• Frost & Sullivan believes that the Unmanned Aerial Vehicle (UAV) market in Asia Pacific will experience a sustained growth from now to 2016.
• UAV development program is still in its infancy stage as compare to Western counterparts, but spending is projected to increase on a sustainable basis.
• Most countries have set up UAV development programs, but are yet to obtain the necessary expertise to support advanced indigenous UAV designs. The urgent need to improve on military capabilities will drive almost all Asia Pacific countries to procure non-domestic UAV designs. .
• The UAV market in Asia Pacific will be led by Tactical UAVs (TUAVs), and followed closely by Medium Altitude Long Endurance (MALE) UAVs.

24
Key Contact
Asia Pacific
Julius YeoConsultantAerospace & Defense PracticeAsia PacificDID +65.68900.989FAX +65.68900.988HP +65.8133.9195EMAIL [email protected] www.aerospace.frost.com